Loss of audiovisual facilitation with age occurs for vergence ...
A Visual Test of Listing's Law During Vergence
by
RIZWAN A. B. SOMANI
Neuroscience Program
Submitted in partial fulnllment
of the requirernents for the degree of
Master of Science
Faculty of Graduate Studies
The University of Western Ontario
London, Ontario
July 1997

National Library (*m of Canada Bibliothèque nationale du Canada
Acquisitions and Acquisitions et Bibliographie Services services bibliographiques
395 Wellington Street 395, rue Wellington Ottawa ON K1A ON4 ûttawaON K1AON4 Canada Canada
The author has granted a non- exclusive licence allowing the National Library of Canada to reproduce, loan, distribute or sell copies of this thesis in microform, paper or electronic formats.
The author retains ownership of the copyright in this thesis. Neither the thesis nor substantial extracts fkom it may be printed or othemise reproduced without the author's permission.
L'auteur a accordé une licence non exclusive permettant à la Bibliothèque nationale du Canada de reproduire, prêter, distribuer ou vendre des copies de cette thèse sous la forme de microfiche/6lm, de reproduction sur papier ou sur format électronique.
L'auteur conserve la propriété du droit d'auteur qui protège cette thèse. Ni la thèse ni des extraits substantiels de celle-ci ne doivent être imprimés ou autrement reproduits sans son autorisation.
AB STRACT
Two simple visuai tests were developed to measure how much Listing's plane (LP) rotates
as a function of the vergence angle. The ratio of these two angles was defined as G. In
the first test subjects viewed redgreen lines displayed on a video screen through redlgreen
filters. The elevation-dependent torsionai dispanty of horizontal and vertical lines was
measured during three tasks: vergence on a near target, vergence through pnsms that
remained fixed, and through prisms that rotated with eye elevation.
In the second test the synoptophore was used to measure G in normals and in patients
suFering Eom horizontal strabismus. Consistent with previous search-coi1 experiments,
the results fiom Our two tests, suggest that, for normals, G is less than 1. In the patient
group the mean G was similar in magnitude but more variable. The variations in the G did
not appear to be related to the patient's measurernents of ocular deviation. This result
suggests that the vergence-related rotation of LP in these patients may be related to other
factors besides the effort required to fuse the lines of sight.
Keyworh: L s n s 2 , Vergence. Torsional disparity, YisuaI tesr, S'mptophore
iii
ACKNOWLEDGEMENTS
1 have often asked myself how I could have dedicated myselfwith such enthusiasm
to solving this problem. The answer lies in the people around me who have revealed to
me the true marvel of asking and solving questions.
1 would like to thank my fellow colleague and fiiend Joseph DeSouza for his
encouragement, his advice, and patience. He has tmly been an inspiration and a mentor.
My special thanks to Rosanna Rajsp and LeopoId Van Cleeff without them this project
would not be possible.
1 must also give special thanks to Dr. Cindy Hutnik for her dedication to research,
for her cornmitment, and most importantly her enthusiasm. She will always have my
highest regard. I would like to thank Dr. David Nicolle for his input in designing this
study and for his continued advice and support.
I would also like to recognize the following orthoptists Cathy Smith, Terry Kaban,
and Dawnise Carter for their continued efforts in research and their time and effort in my
project.
My appreciation goes out to Dr. Doug Tweed for developing the mathematical
relationships between the measured values of torsional disparity and the orientation of
Listing's plane.
1 would like to recognize Dr. Tutis Vilis for his advice, patience, and most of al1
for his faith in me. The one thing that 1 will take fiom Dr. Tutis Vilis is the realization that
as human beings we have much to l e m and as a result we should never forget to ask
questions. Thank you Dr. Tutis Vilis 1 will always cherish my time spent here.
TABLE OF CONTENTS
CERTKFICATE OF EXAMMATION
ABSTRACT
ACKNOWLEDGEMENTS
TABLE OF CONTENTS
LIST OF TABLES
LIST OF FIGURES
CEAPTER 1 - INTRODUCTION
1 . 1 Overview
1 -2 Vergence eye movements
1.3 Hîstorical Background
1.3.1 Listing's law
1.3.2 Listing's law applied to vergence eye movements
1.3 -3 Disruption of the vergence system
1.3.4 Listing's law applied to a dismpted vergence system
1.4 Objectives
Page . . 11
... 111
iv
v .-.
Vlll
ix
CHAPTER 2 - USING A VISUAL TXST TO MEASURE THE
ANGLE BETWEEN THE LISTING'S PLANES
2.1 Introduction 14
2.1 -2 Geometry of binocular vision 14
2.1.3 Studies of binocular coordination 2 1
2.1.4 Retinal images and ocular torsion 22
2.1.5 Determining the Gain (G) 23
2.2 Visual test method 25
2.3 Visual test tasks
2.3.1 Viewing horizontal lines through head-fixed prisms
2.3.2 Viewing horizontal lines while converging on a
near target (LED)
2.3 -3 Viewing horizontal lines while converging through
rotating prisms
2.4 Data Analysis
2.5 Results for the three tasks
2.5.1 Viewing horizontal lines through head-fixed prisms
2.5.2 Viewing horizontal lines while converging on a
near target (LED)
2.5 -3 Viewing horizontal lines while converging through
a set of rotating prisms
2.5.4 Viewing vertical lines
2.7 Discussion
2.7.1 Converging on a near LED
2.7.2 Rotating prism experiments
2.7.3 Head-fixed pnsm experiments
2.7.4 Why is G < l?
CHAPTER 3 - USING A SYNOPTOPHORE TO MEASURE TEE
ANGLE BETWEEN THE LISTING'S PLANES
3.1 Introduction
3.2 Orthoptic assessrnent
3.3 Synoptophore task
3.4 Data analysis
3.5 Results for normal and patient subjects
3.5.1 Horizontal lines task
3.5 -2 Vertical lines task
3.5.3 Patients: horizontal lines task
3 -6 Cross-correlating the k's
3.7 Strabisrnic ocular deviations
3.8 Relation between ocular deviation and the k' s
3.9 Discussion
3.9.1 How does the k's in eqn. 1 influence the rotation of
Listing' s plane?
3.9.2 Interactions between k, kv, kD, and kDv
3 -9.3 Does strabismus influence the rotation of Listing's plane?
SUMMARY
AFPENDIX
REFERENCES
VTTA
Table
1
II
rrI
LIST OF TABLES
Description
Correlations between the k's
Measures of near and far deviations and the k's
Interplay between ocular deviation and the k's
Page
57
6 1
64
viii
LIST OF FIGURES
Figure
1.
2,
3 .
4.
5.
6.
7.
8.
9.
10.
11.
12.
13.
14.
15.
16.
17.
18.
19.
20.
Description
Listing's law
Orientation of Listing's planes for near and far gaze
Target stimulus and task
The helmholtz coordinate system; orientation of
horizontal and vertical h e s
Orientation of horizontd lines during convergence
Torsional disparity at each position of elevation
Torsional disparity for the three screen elevations
Slopes across subjects without prisms, with prisms, and
change in dope
Average slope for al1 three tasks for horizontal and
vertical Iines
The computed gains for al1 three tasks
The target slide and the testing conditions
The torsionai disparity at each image elevation during
convergence
The slope for different levels of convergence
The k& for the nomal subjects
The ko/s for the patient subjects
The interplay between k and kv for normals and patients
The interplay between kDv and kv for normals and
patients
Measures of near and far deviation for dl subjects
The k term as it influences torsional disparity and
Listing's plane
Ocular torsion as a fiinction of H and V
Page
3
7
12
16
20
29
30
32
34
39
48
5 1
52
53
55
58
59
62
67
76
INTRODUCTION
1.1 Overview
Our eye movements serve four basic functions: pointing the fovea to something of
interest, maintaining the image of a particular moving object on the fovea as it moves
across the visual field, keeping images stable on the retina when the head moves, and
viewing an object as it moves in depth. Our eyes' ability to accomplish each of these
functions lies in the capacity to rotate in three dimensions: left or nght, up or dom, and
cloc&ise or counterclockwise. Vergence eye movements depend on the eyes' ability to
rotate in three dimensions. That is, in order for the eyes to converge or diverge they need
to be able to rotate up and down around a horizontal axes, left and right around a vertical
axes, and torsionally about the visual axes. This thesis introduces a simple visual test to
study the the-dimensional ability of the eyes to rotate torsionally and consequently the
relative orientations of Listing's plane in the two eyes. This visual test is then used with
a clinical instrument called the synoptophore as a follow-up study to determine the
location of Listing's plane in individuals suffering from disruptions in their vergence
system. This thesis will begin with a brief synopsis of vergence eye movements, and
their relation to Listing's law.
1.2 Vergeme eye movements
The purpose of vergence eye movements is to keep the foveae of both eyes on an
object as it moves in depth. To accomplish this, the vergence system rotates the eyes in
opposite directions. For this reason, vergence eye movements are referred to as
disconjugate. This means that the lefi eye rotates to the right around a vertical axis, and
the nght eye rotates to the left around a similar axis. Aside from causing the eyes to rotate
horizontally, convergence also requires a torsional rotation of the eyes. By convention
we will define torsion as a clockwise (CW) or counterclochwise (CCW) rotation about
the line of sight. A clockwise rotation would produce a temporal rotation of the upper
pole of the right eye and a nasal rotation of the upper pole of the lefi eye.
Horizontal vergence is under voluntary control and changes when one changes
fixation points at different depths. The vergence angle is the angle between the visual
axes. The visual axis is an imaginary line that connects the object we are interested in to
the fovea at the back of the eyes. When one views a target at infinity the visual axes are
parallel and the vergence angle is zero. When one changes fixation to a near target, the
eyes converge and hence the vergence angle increases.
1 .3 Historical Backgror otd
1.3 .1 Listittg'slcnv
To move between different visual targets, the eyes can rotate about a variety of
axes. Despite this redundancy, however, the eyes adopt a unique three-dimensional
orientation when looking in a specific direction. Listing's law dictates what this
orientation is (Figure 1). In the figure, the center eye is in a reference position, known as
primary position. Listing found that when one examines the axes used to rotate the eye
fiom primary position to eccentric positions, they are confined to a cornmon plane. This
plane is called Listing's plane and is orthogonal to the gaze direction in primary position.
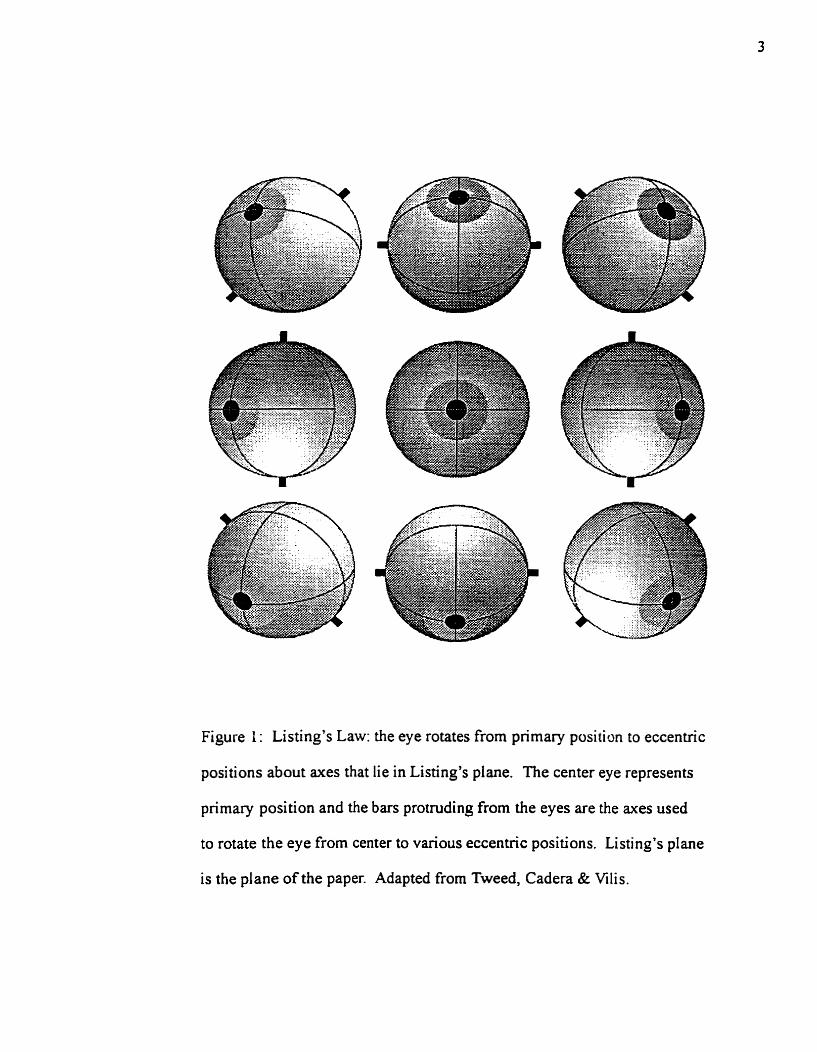
Figure 1 : Listing's Law: the eye rotates from primary position to eccentric
positions about axes that lie in Listing's plane. The center eye represents
primary position and the bars protruding from the eyes are the axes used
to rotate the eye from center to various eccentric positions. Listing's plane
is the plane of the paper. Adapted from Tweed, Cadera & Vilis.
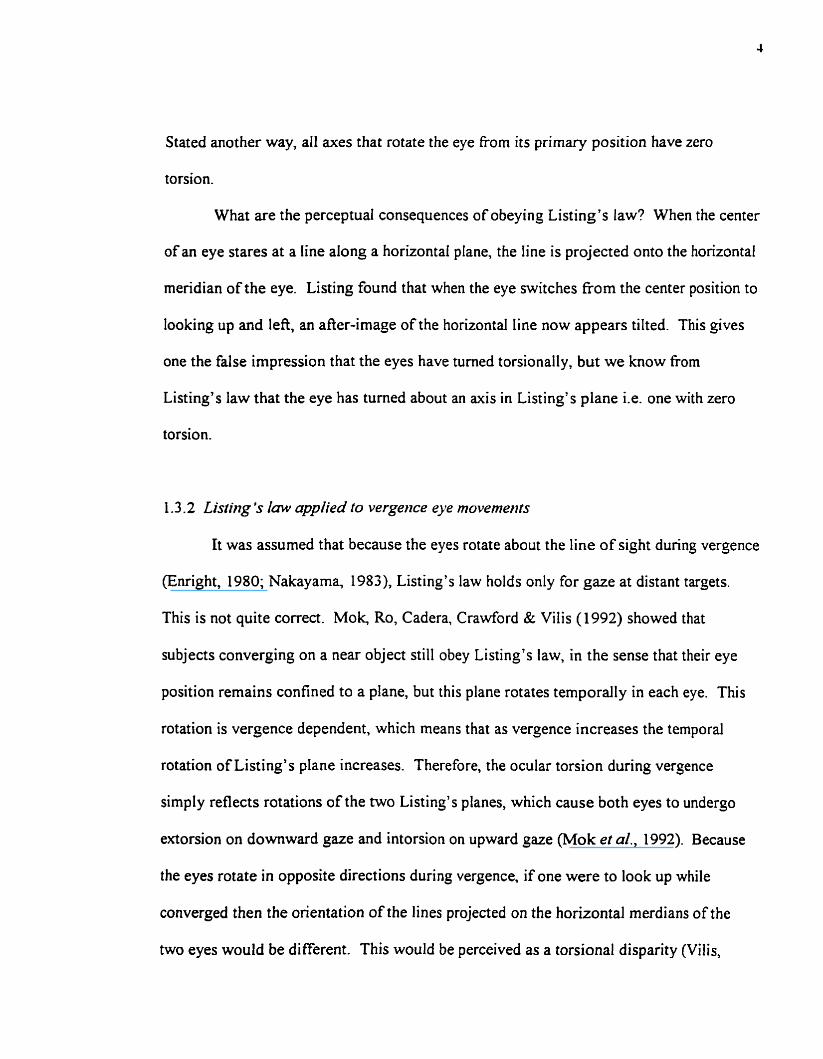
Stated another way, al1 axes that rotate the eye fi-orn its primary position have zero
torsion.
What are the perceptual consequences of obeying Listing's law? When the center
of an eye stares at a line along a horizontal plane, the line is projected orno the horizontal
meridian of the eye. Listing found that when the eye switches from the center position to
looking up and left, an afier-image of the horizontal line now appears tilted. This gives
one the false impression that the eyes have turned torsionally, but we know from
Listing's law that the eye has tumed about an axis in Listing's plane i.e. one with zero
torsion.
1 -3 -2 Listing 's Icnu applied to vergence eye rnoventerits
It was assumed that because the eyes rotate about the line of sight during vergence
(Enright, 1980; Nakayama, 1983), Listing's law holds only for gaze at distant targets.
This is not quite correct. Mok, Ro, Cadera, Crawford & Vilis (1 992) showed that
subjects converging on a near object still obey Listing's law, in the sense that their eye
position remains confined to a plane, but this plane rotates temporally in each eye. This
rotation is vergence dependent, which means that as vergence increases the temporal
rotation of Listing's plane increases. Therefore, the ocular torsion during vergence
simpl y reflects rotations of the two Listing's planes, which cause both eyes to undergo
extorsion on downward gaze and intorsion on upward gaze (Mok et al., 1992). Because
the eyes rotate in opposite directions during vergence, if one were to look up while
converged then the orientation of the lines projected on the horizontal merdians of the
two eyes would be different. This would be perceived as a torsional disparity (Vilis,
1994). When looking down one would perceive a torsional disparity but in the opposite
direction.
When one gazes at a distant target, Listing's plane is approximateiy parallel to the
frontal plane of the head. When one gazes at a near target the Listing's plane of each eye
is rotated temporally relative to that observed for distant targets, through an angle that
depends directly on the amount of vergence (Mikhael, Nicolle & Vilis, 1995). Thus, in
both far and near fixation Listing's law hoids, in the sense that in each case eye position
is confined to a plane (Figure 2).
The fact that the planes tum dunng vergence has created some controversy.
Several laboratories (Minken & Van Gisbergen, 1994; Mikhaei et al., 1995; Mok et al.,
1992; Van Rijn & Van den Berg, 1993) agree that convergence produces a temporal
rotation of the Listing's plane, but there is debate as to the amount of rotation. Mok et al.
(1992) and Mikhael et al. (1995) found that the angle between Listing's planes is about
0.7 times the angle of convergence, whereas Van Rijn & Van den Berg (1993) found that
the interplane angle is 1.7 times the vergence angle. The discrepancy may lie in defining
what zero is. When viewing distant targets, the Listing's planes of the two eyes are not
perfectly parallel (Mikhael et al., 1995). As a result, these planes rnay be rotated
temporally or nasally, even for distant fixation (Melis, Cruysberg & Van Gisbergen,
1997). Therefore, if convergence is required to fuse a target, the planes would exhibit a
consistent temporal rotation even when the target is distant (Van den Berg, Van Rijn &
De Faber, 1995).

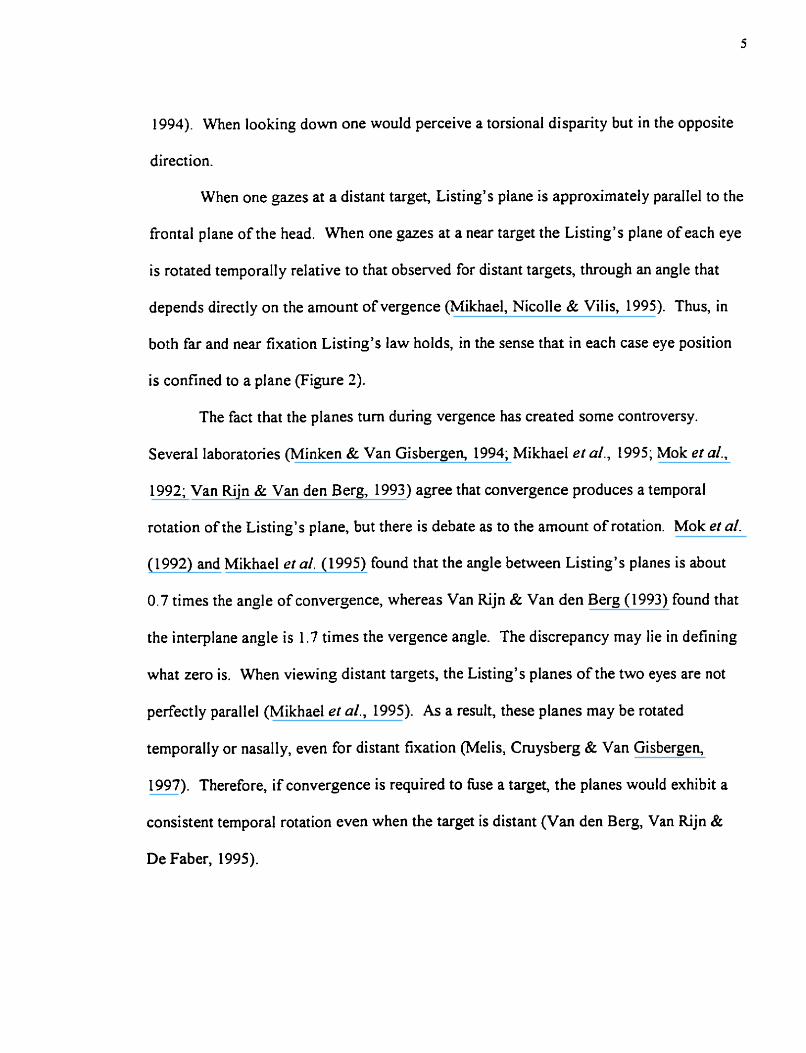
FIGURE 2: Orientation of the Listing's planes of both eyes as viewed from above for
gaze at distant targets (A) and near targets (B). Solid line indicates orientation of
Listing's plane (LP). CW represents a clockwise torsional rotation of the eye, CCW
counterclockwise, U upward and D downward. (A) For a distant target Listing's plane is
approximately parallel to the frontal plane of the head. (B) For a near target Listing's
plane rotates temporally. "ex" represents extorsion which occurs in both eyes during
downward gaze and "in" represents intorsion during upwakd gaze.

DISTANT TARGET
Left eye
top view
Right eye
CCW
NEAR TARGET
1
I I
CCW
CCW CCW

1.3.3 Dim~ptio~z of the vergence systern
On the time scale of evolution, vergence is a relatively new motor system, and it
is perhaps for this reason that strabisrnus and other disorders caused by the disruption of
the vergence system form the largest single group of oculornotor disturbances in clinical
practice (Carpenter, 1988). Orthophoria is the normaYoptima1 condition, where the visual
axes are properly aligned on the objea of interest. Strabismus is the condition in which
the visual axes of the two eyes are not simultaneously directed towards the object of
interest (Lyle & Wybar, 1970). This results when one eye is turned in (eso-deviation) or
out (exo-deviation) relative to the other. For the purposes of this thesis we will only
define a few basic types of strabismus. In exotropzu, one eye is turned out relative to the
other causing the visuaI axes to not intersect. In contrast, esotropia is the condition
where one eye is turned in relative to the other causing the visual axes to intersect in front
of the intended point.
Most conditions of strabismus are usually not obvious and do not manifest
themselves when both eyes are open and are provided with a fusible stimulus. Some
conditions of strabismus are termed intermittent, meaning that for the most part the eyes
appear orthophoric, but penodically display esotropic or exotropic tendencies. A phoria
is strabisrnus occumng only when the eyes are dissociated, that is, when there is no
fusible target. Several ways of dissociating the eyes exist, but clinicians rnost often use
what is called a cover-uncover test. This involves covering the eye suspected to be
strabismic. A horizontal deviation would be observed as a deviation of the covered eye
either inward (esophoria) or outward (exophoria) in relation to its uncovered position.
Phoria is usually measured by placing prisms of increasing magnitude in front of the
deviating eye until a change in position is no longer observed when going from a covered
state to an uncovered one. The prism method allows ciinicians to measure both the
magnitude and the direction of phoria.
Most people have some degree of phoria, usually Iess than 6 diopters in the
horizontal plane. The phoria is usually not noticed by individuals because the offset of
the visual axes is too insignificant to disrupt fusion of the images of the intended object.
Stated another way, the two retinal images of the object fa11 on nearly corresponding
positions on each retina. In contrast, a significant degree of phona often results in the
two retinal images falling on non-corresponding points on each retina, which intempts
normal tùsion.
1 -3 -4 Listing's law applied tu a dismpted vergence ystern
We have seen that the Listing's planes of the two eyes rotate out of alignment
when the eyes converge. For most individuals, Listing's plane is approximately parallel
to the interocular axis for distant targets, and rotates temporally for near targets. But
Mikhael et al. (1995) have shown that the Listing's planes of the two eyes are not
perfectly parallel even when the subject views distant targets. Based on this finding, Van
den Berg et al. (1995) have proposed a theory for the Listing's planes of individuals with
exo-deviations. His group has suggested that since the rotation of Listing's plane is
related to the amount of vergence, then subjects who have an exo-deviation would have
their Listing's planes turned temporally even when viewing a target in the distance. This
offset represents the additional convergence effort required to overcome the exodeviation
of the eyes (Van den Berg et al., 1995). Thus, when fixation changes to a near target, the

Listing's planes of the two eyes undergo an increased rotation because more vergence
effort is required.
1 -4 Objectives
The first goal of the present study was to deterrnine if the rotations of Listing's
plane during convergence could be measured without recording eye movements. In the
past, the three-dimensional angular position of the eye was measured using search coils
placed in each eye (Tweed, Cadera & Vilis, 1990; Tweed & Vilis, 1990). As this method
can be uncornfortable for some subjects, Our midy uses a much less intrusive technique.
The subject views a video screen containing two lines, one red and one green, separated
by a square white box to discourage the subject from fùsing the lines together (Figure
3A). Looking through colored filters, each eye sees only one of the lines. The subject is
required to rotate the green line until it appears parallel with the red. Since torsion
changes as a fiinction of elevation and vergence, this task is performed looking up and
down, with and without vergence. The actual misalignment of the Iines on the screen is
measured. Depending on how much a subject's Listing's planes rotate, the target images
(lines) will be oriented differently on the two retinas, and this torsional disparity will Vary
with elevation. From these angles we compute the rotation of Listing's planes in the two
eyes.
The second goal of this study was to determine if the rotation of Listing's plane
during vergence could be measured using a synoptophore. The synoptophore was chosen
for a number of reasons. First, it consists of two separate viewing tubes, one for each
eye, providing an easy rneans of dissociating the eyes and at presenting separate images
to each eye. Second, the horizontal angle between the tubes can be increased or

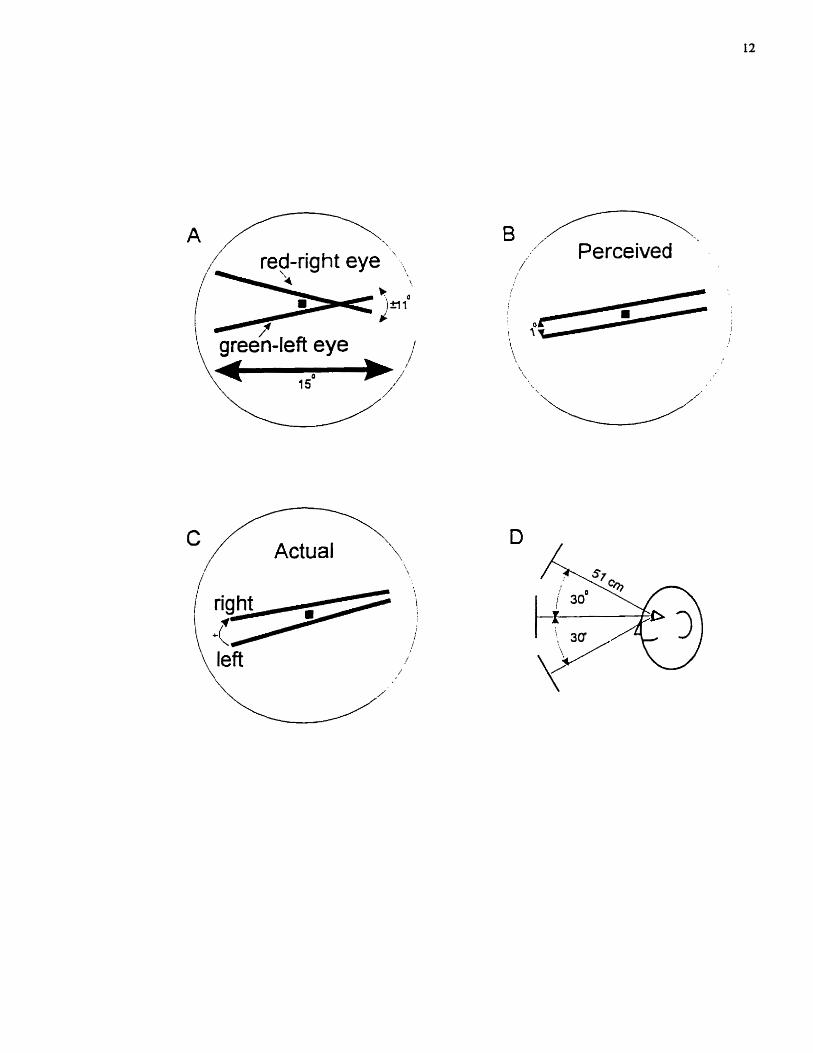
FIGURE 3: The test conditions. Two non-parallel Iines (green & red) were displayed on
a cornputer screen 5 1 cm fiom the subject. A) Lines 15" long were viewed through
Rosco Gel filters, a green filter over the left eye and a red filter over the right. The initial
angle between the lines was set randomly, ranging fiom 11" CW to 1 1" CCW. B)
Subjects rotated the green Iine until it was perceived to be parailel with the red. A 1"
distance separated the green line from the red. C) Misaiignment of the lines was
quantified by subtracting the angle of the green line fiom that of the red. Positive
numbers were assigned to CW angles. D) Torsional disparity was measured at three
elevations: 30' up, centered and 30" down.
greén-left eye h' /
1 s0 /'
Actual c c\,
B , -.,
/' ,,' Perceived
decreased, thus allowing the vergence angle to be manipulated. Third, the tubes can be
rotated about the center of rotation of the subject's eyes, allowing the experimenter to
change the elevation at which the images are viewed. As well, the image in each eye
could be rotated so that the subject could match the two images seen by each eye.
With a pair of slides, the subject was presented with two lines, one green and one
red, separated by a single colored circle and a larger gray circle. Looking through the
optical tubes, each eye saw only one of the lines. The subject was required to rotate the
red line until it appeared parallel with the green. This task was performed in primary
position, as well as looking up and down, at different degrees of convergence. The
amount the red line was rotated to match the green was recorded, and from these values
we computed the rotations of the Listing's planes of the two eyes. In this way we could
determine if the angle between the planes is smaller than the vergence angle.
The third goal of this study was to use the synoptophore to determine how much
the Listing's planes rotated in patients suffering 50m various forms of horizontal
strabisrnus. Van den Berg et al. (1995) have shown that subjects who have an exo-
deviation display an elevation-dependent cyclovergence even when viewing distant
targets. As a result, Listing's planes are not perfectly parallel but are rotated temporally
even at a vergence angle of zero. Van den Berg et al. (1 995) have suggested that this
occurs because convergence is used to align the diverging eyes of these subjects. If the
rotation of Listing's plane is in fact vergence-related, one would expect that in subjects
who are exo-deviated, that when fixation changes to a near target, the Listing's planes of
the two eyes would undergo an increased temporal rotation relative to distant targets. In
this thesis we used the synoptophore and our visual tests to examine this.
USING A VISUAL TEST TO MEASURE THE ANGLE BETWEEN THE LISTING'S PLANES
The visual test method was developed as an alternative to the invasive and
uncornfortable technique of search-coils to measure the angle between the Listing's
planes of the two eyes. The visual test method has an advantage over the search-coi1
technique in that the angles between the planes can be measured without having to record
eye movements. The search-coi1 technique requires that one measure the 3-dimensional
angular position of the eye. Only afler this, can the location of the Listing's plane in each
eye be determined. Therefore, the visual test method provides a fast, completely non-
intrusive technique of measuring Listing's plane and may also contnbute to our
understanding of binocular coordination.
2.1 .2 Geornehy of binomlar vision
What do the visual effects we measure here tell us about binocular coordination?
As is usual with oculomotor questions, we can clarify the issues and save a lot of effort
by using an appropriate coordinate system. In this case, the coordinates of choice are
Helmholtz angles, in which an eye position is decornposed into a series of three
subrotations, starting from primary position: first a torsional rotation through angle T
about the line of sight, then a horizontal rotation through angle H about a head-fixed
vertical axis, and finally a vertical rotation through angle V about the interaural axis
(Figure 4A). To agree with the usual convention for quaternions and rotation vectors, the
positive directions for the angles T, H and V are clockwise, left and down, respectively,
al1 from the subject's point of view.
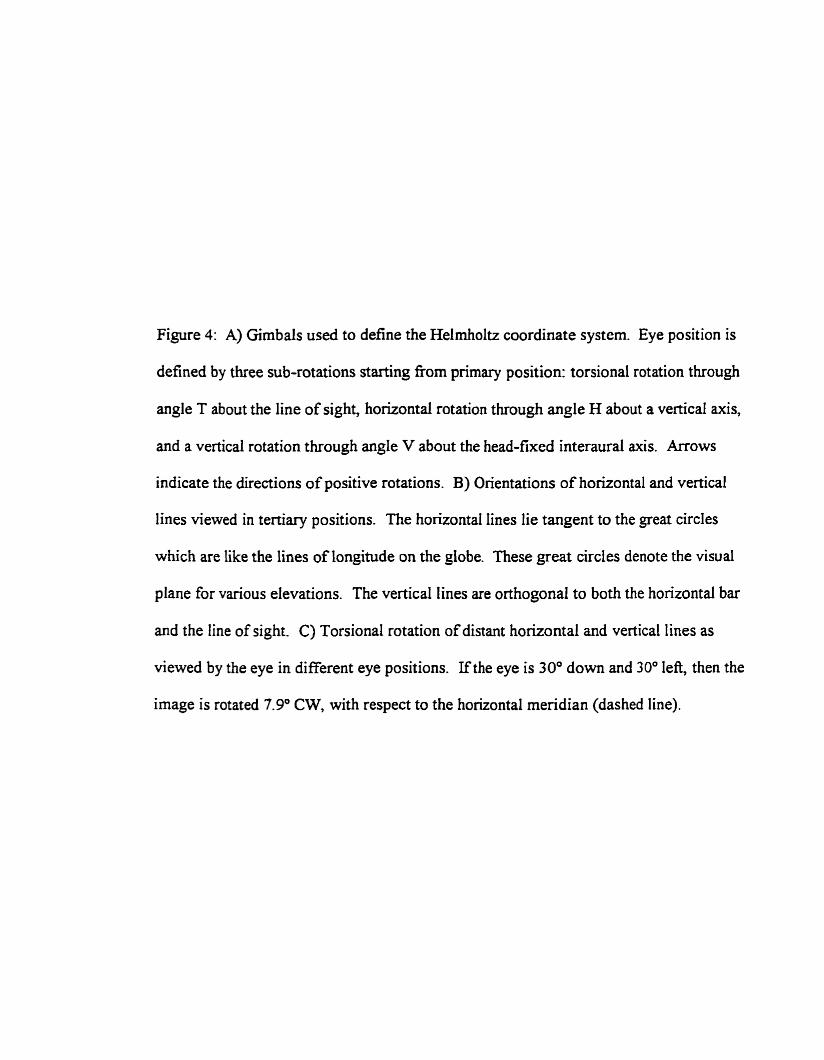
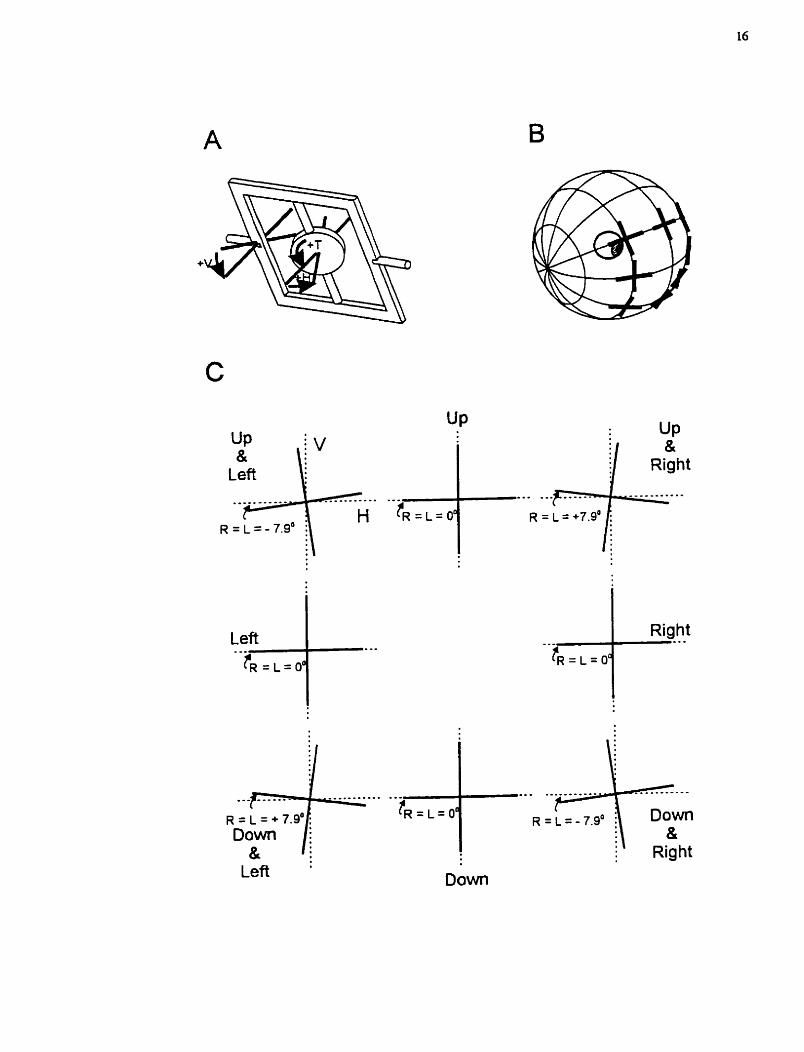
Figure 4: A) Girnbals used to define the Helmholtz coordinate system. Eye position is
defined by three sub-rotations starting fiom primary position: torsional rotation through
angle T about the line of sight, horizontal rotation through angle H about a vertical axis,
and a vertical rotation through angle V about the head-fixed interaural mis. Arrows
indicate the directions of positive rotations. B) Orientations of horizontal and vertical
lines viewed in tertiary positions. The horizontal lines lie tangent to the great circles
which are like the lines of longitude on the globe. These great circtes denote the visval
plane for various elevations. The vertical lines are orthogonal to both the horizontal bar
and the line of sight. C) Torsional rotation of distant horizontal and vertical lines as
viewed by the eye in different eye positions. If the eye is 30" down and 30" lefi, then the
image is rotated 7.9" CW, with respect to the horizontal mendian (dashed line).
Left .
With Helmholtz coordinates, the visuaf effects of eye movements are much easier
to compute than with other representations such as quaternions or rotation vectors. For
example, if a subject binocularly fixates the centre of a short line segment lying in the
visual plane (the plane containing the interocular avis and the gaze lines of both eyes -
see Helmholtz, 1867; Tweed, 1997), then the torsional disparity, Tdirp, between the
images in the two eyes will equal the difference between the Helmholtz torsion angles of
the right and lefl eyes (Van Rijn & Van den Berg, 1993):
T ~ u ~ = TR - TL
That is, if a subject in our experiment sets the red line on the cornputer screen xo
clockwise relative to the green line, then TR - Tt = x*. NO such simple relation exists
between Tdisp and the torsionai components of eye-position quaternions or rotation
vectors.
Expressed in Helmholtz coordinates, Listing's Iaw says that :
T = -w/2
where al1 angles are given in radians (not degrees). Actually, this equation is not
precisely equivalent to Listing's law, as defined by the quaternion formula q~ = O. An
exact expression for Listing's law in Helmholtz coordinates is somewhat complicated, but
the simple formula in Eq. 2 is a very close approximation to the law: within 30' of
primary position, the discrepancy never exceeds 0.1" (Tweed, 1997).
As Eq. 2 makes clear, Listing's law requires that the Helmholtz-torsional angle of
the eye Vary as a function of horizontal and vertical eye position, with the result that the
retinal image will rotate torsionally when the eye moves into tertiary positions. For
example, consider the cross-shaped visual targets in Figure 4B. In each target, the
horizontal crossbar lies in the visual plane and the vertical crossbar is orthogonal to both
the horizontal bar and the line of sight. Owing to ocular torsion, the retinal image of this
target will rotate torsionally as a fùnction of eye position. If the eye is 30" down and 30°
le&, or in others words if H = V = 0.52 radians, then the ocular torsion T fiom Eq. 2 will
amount to -(0.52)(0.52)/2 = 4.13 5 radians, or 7.9" counterclockwise, which means that
the retinal image will be rotated 7.9" clockwise relative to the eye, as s h o w in Figure
4C. But as long as the two eyes have the same eye position, the image rotation will be
the same on both retinas, Le. there will be no disparity.
What would happen if the eyes continued to obey Listing's law when they
converged? Because the horizontal angles of the nght and lefl eyes, HR and HL, differ
during vergence, the torsional angles would also dfier:
TR = -HRV/2 TL = -HLV/2 (3
(Here we assume that the vertical component of eye position, V, is the same in both eyes
because othenvise binocular fixation is impossible - Van Rijn & Van den Berg, 1993).
By Eq. 1, these unequal torsion angles would lead to nonzero torsional disparity:
Thp = TR - TL (4a) = -&v/2 3-
= -(HR - HL)V/2 (4b) (44
The term (HR - HL) in Eq. 4c is simply the vergence angle - the angle between the two
lines of sight - which we shall cal1 Dy for disconjugate:
D = H R - H ~ Substituting Eq. 5 in Eq. 4c yields
TdLp = -DVl2
In other words, if Our eyes obeyed Listing's law while converged, we would see
double when we looked up or down, experiencing torsional disparity proportional to the
product of the disconjugate angle, D, and the vertical coordinate of eye position, V. For
example, if the disconjugate angle were equal to 60° and the vertical eye position were
30° down, or in other words D = 1.04 and V = 0.52 radians, then the torsional disparity
from Eq. 6 would be -( 1 .O4)(0.52)/2 = -0.27 radians, or 15.8" counterclockwise. This
can be seen in figure 5 simply by combining the up and lefi image of the right eye in
figure 4 with the up and right image of the left eye.
We could avoid this disparity by breaking Listing's law, adding to each eye some
extra torsion that varies in the appropriate way with D and V. The symmetric solution is
to divide the extra torsion evenly between the two eyes, adding half of the disparity in Eq.
6 to the lefl eye and subtracting it fiom the right:
This extra torsion would eliminate the torsional disparity (Figure 5C):
What does this extra torsion mean in ternis of Listing's plane? Eq. 7 is saying that
the torsion of the right eye depends directly on the disconjugate angle and the vertical eye
position. At any fixed, nonzero D, the greater the V the greater the torsion. When the
eye looks down, ocular torsion is clockwise; when it looks up, torsion is
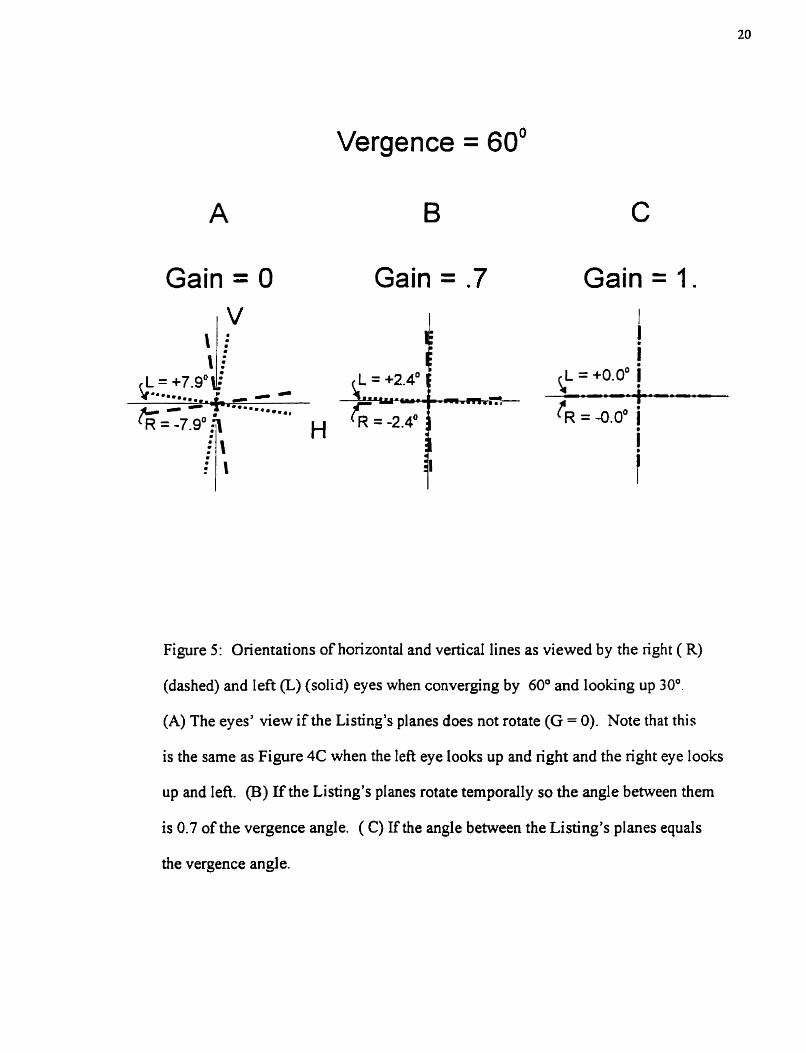
Vergence = 60'
Gain = O Gain = .7 Gain = 1.
Figure 5: Orientations of horizontal and vertical lines as viewed by the right ( R)
(dashed) and left (L) (solid) eyes when converging by 60' and looking up 30'.
(A) The eyes' view if the Listing's planes does not rotate (G = O). Note that this
is the same as Figure 4C when the left eye looks up and right and the right eye looks
up and Ieft. (B) If the Listing's planes rotate temporally so the angle between them
is 0.7 of the vergence angle. ( C) If the angle between the Listing's planes equals
the vergence angle.
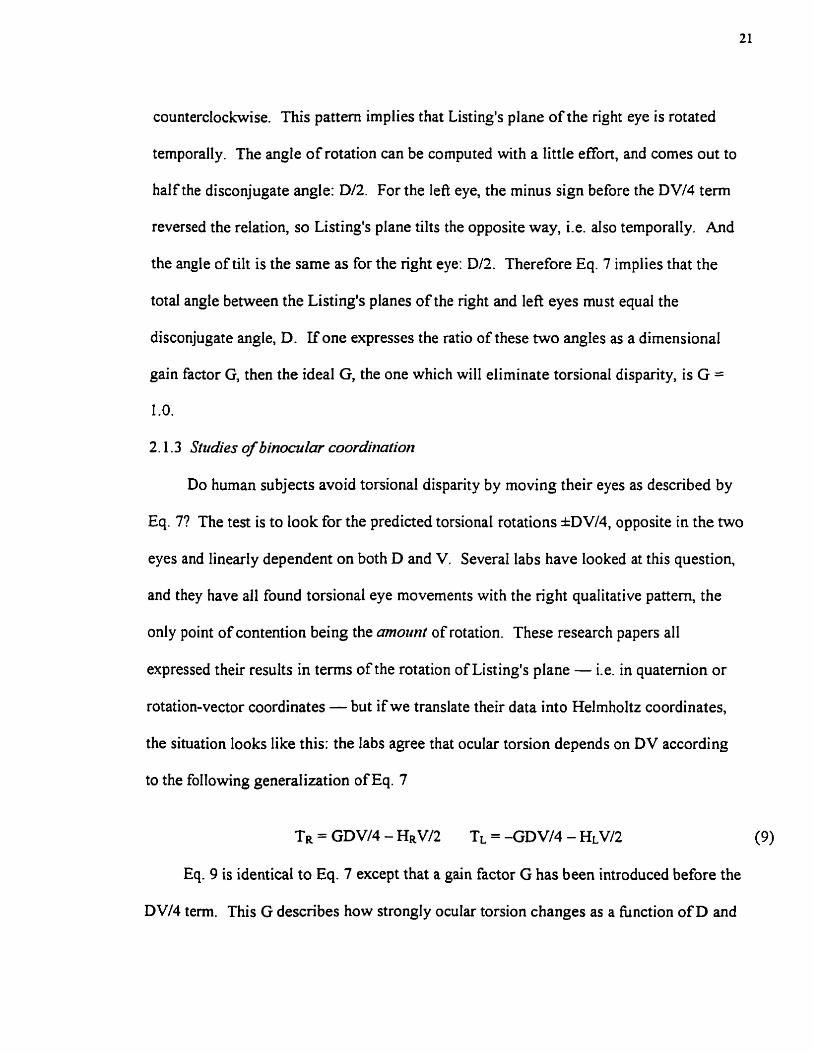
counterclockwise. This pattern implies that Listing's plane of the right eye is rotated
temporally. The angle of rotation can be computed with a little effon, and comes out to
half the disconjugate angle: D/2. For the lefi eye, the minus sign before the DV/4 term
reversed the relation, so Listing's plane tilts the opposite way, Le. also temporally. And
the angle of tilt is the same as for the right eye: Df2. Therefore Eq. 7 implies that the
total angle between the Listing's planes of the right and left eyes mut equai the
disconjugate angle, D. If one expresses the ratio of these two angles as a dimensional
gain factor G, then the ideal G, the one which will eliminate torsional disparity, is G =
1 .O.
2.1 -3 Studies of binocular coordirzatio~z
Do human subjects avoid torsional disparity by moving their eyes as described by
Eq. 7? The test is to look for the predicted torsional rotations kDV/4, opposite in the two
eyes and lineariy dependent on both D and V. Several labs have looked at this question,
and they have al1 found torsional eye movements with the right qualitative pattern, the
only point of contention being the amotirit of rotation. These research papers al1
expressed their results in terms of the rotation of Listing's plane - Le. in quaternion or
rotation-vector coordinates - but if we translate their data into Helmholtz coordinates,
the situation looks like this: the labs agree that ocular torsion depends on DV according
to the following generalization of Eq. 7
TR = GDVI4 - &V/2 TL = -GDVI4 - KLV/2 (9)
Eq. 9 is identical to Eq. 7 except that a gain factor G has been introduced before the
DVl4 tem. This G describes how strongly ocular torsion changes as a function of D and
V. As s h o w in Eqs. 7 and 8, the "ideal" value for G - the value that eliminates
torsional disparity of lines in the visual plane - is 1 (Figure 5). But the actual value of
this constant is controversial. Empirical estimates range fiom 0.64 (Mok et al., 1992)
through 1 .O8 (Minken & Van Gisbergen, 1994) up to 1-71 (Van Rijn & Van den Berg,
1993). The reason for this disagreement does not seem to be due to different visual
conditions (Minken & Van Gisbergen, 1994). As al1 these studies used the search-coi1
method of eye-movement recording, Our aim was to get an independent measure, using
retinal images to determine G.
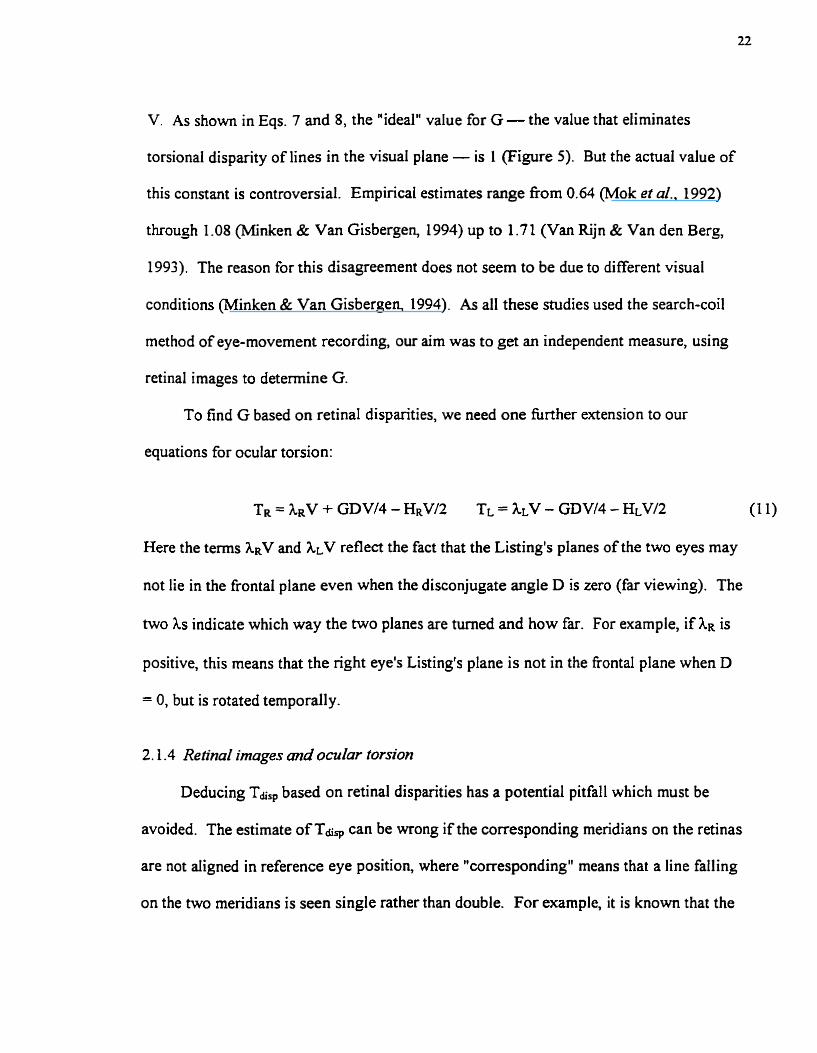
To find G based on retinal disparities, we need one further extension to Our
equations for ocular torsion:
TR = hRV + GDV/4 - HRV/2 TL = hLV - GDV/4 - HLV/2 (1 1)
Here the terms XRV and ALV reflect the fact that the Listing's planes of the two eyes may
not lie in the frontal plane even when the disconjugate angle D is zero (far viewing). The
two As indicate which way the two planes are tumed and how far. For example, if AR is
positive, this rneans that the right eye's Listing's plane is not in the Frontal plane when D
= 0, but is rotated temporally.
2.1.4 Retinai images and ocuZur torsion
Deducing Tdiq based on retinal disparities has a potential pitfall which must be
avoided. The estimate of Tdi, can be wrong if the corresponding meridians on the retinas
are not aiigned in reference eye position, where "corresponding" means that a line falling
on the two mendians is seen single rather than double. For example, it is known that the
corresponding, near-vertical meridians on the two retinas are not parailel in the two eyes,
but are tilted about 2" relative to one another. The rneridian in the right retina is tilted
about 1" clockwise away from pure vertical from the subject's point of view (Le. the top
end of the line tips to the right) whereas the corresponding mendian on the lefl retina is
tilted about L0 counterclockwise (Helmholtz, 1867; Ogle, 1950). So even when both eyes
are in their reference positions, with both their torsional angles equal to 0, Our method
will still report a torsional disparity: when near-vertical lines are presented on the
computer screen, the red line, seen by the right eye, will have to be rotated 1 " clockwise,
and the green line 1" counterclockwise, in order that the subject judge them parallel.
Therefore the method will falsely report a torsional disparity of 2' clockwise.
Fominately, though, this error does not affect any of our deductions because, as we shall
see below, we denve Our conclusions by measuring disparity at a number of different eye
positions and looking at how the disparity changes. Because we are concerned with
changes in disparity rather than absolute values, the constant bias introduced by
misaligned correspondhg meridians is canceled out.
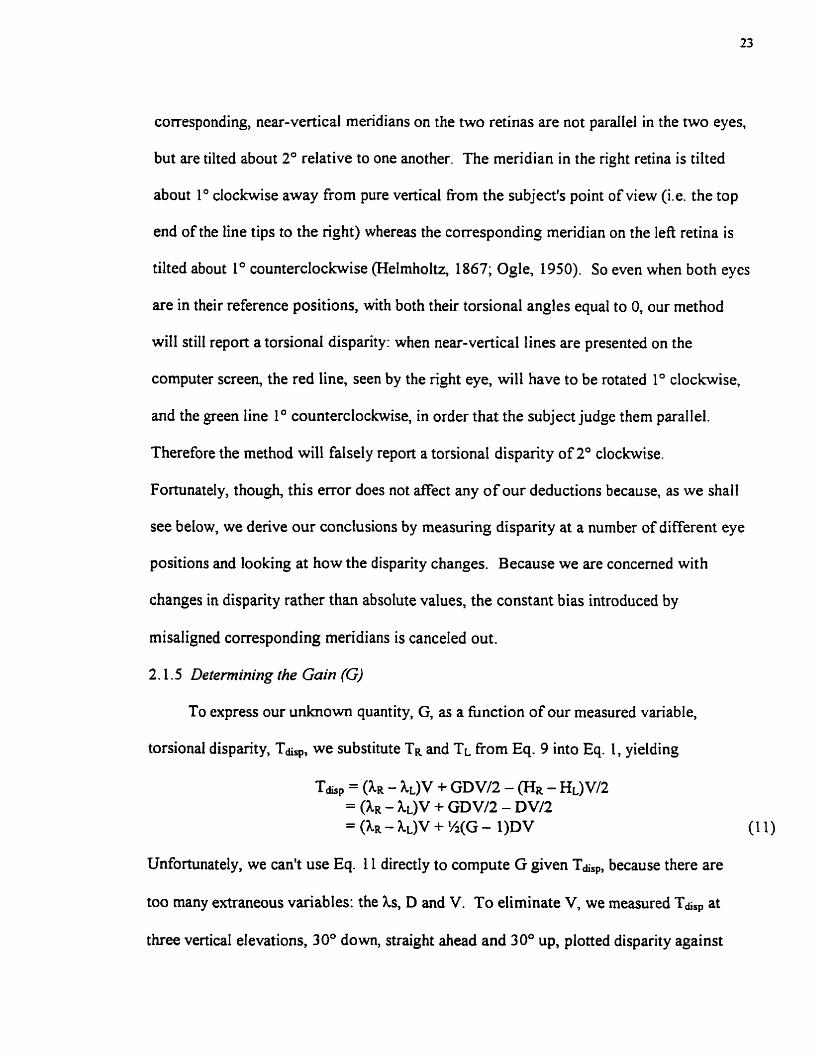
2.1.5 Detennining the Gain (G)
To express our unknown quantity, G, as a function of Our measured variable,
torsional disparity, Tdiq, we substitute TR and TL h m Eq. 9 into Eq. 1, yielding
Unfortunately, we can't use Eq. 11 directly to compute G given TdiSp, because there are
too many extraneous variables: the Xs, D and V. To eliminate V, we measured Tdrp at
three vertical elevations, 30' dom, straight ahead and 30" up, plotted disparity against
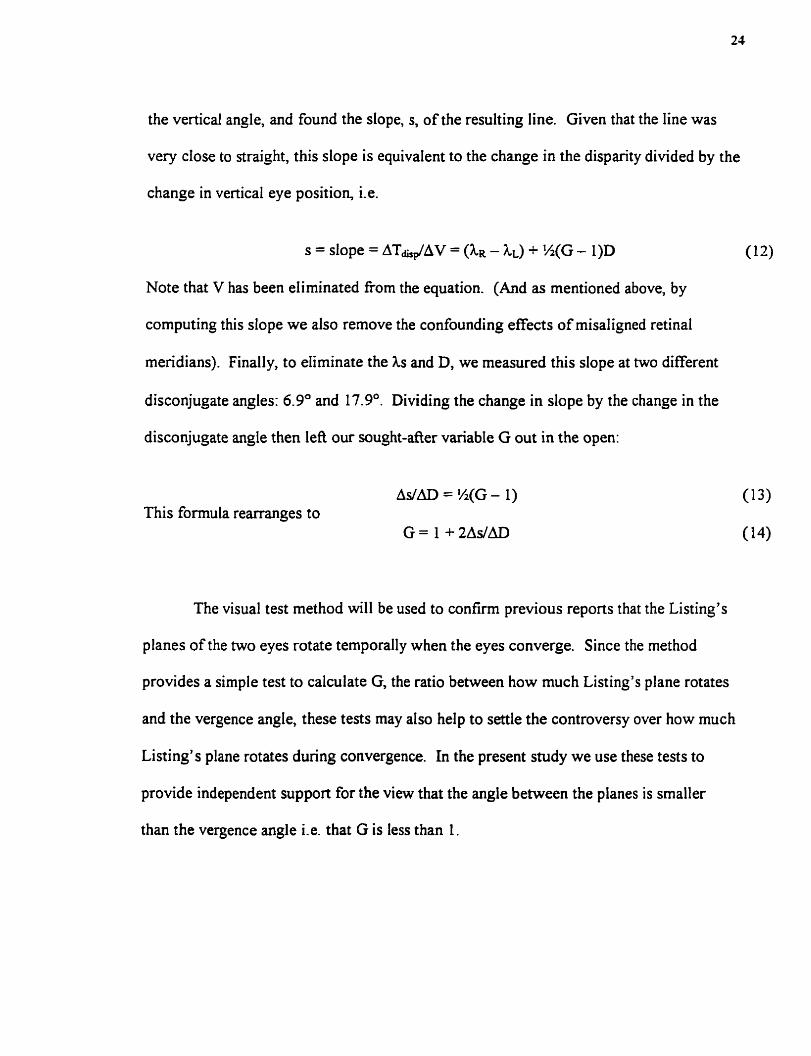
the vertical angle, and found the slope, s, of the resulting line. Given that the line was
very close to straight, this siope is equivalent to the change in the disparity divided by the
change in vertical eye position, i-e.
s = slope = ATdIdAV = (hR - h 3 + %(G - l)D
Note that V has been eliminated fiom the equation. (And as mentioned above, by
computing this slope we also remove the confounding effects of misaligned retinal
meridians). Finally, to eliminate the hs and D, we measured this slope at two different
disconjugate angles: 6 . g 0 and 17.9". Dividing the change in slope by the change in the
disconjugate angle then Ieft Our sought-fier variable G out in the open:
AdAD = %(G- 1) This formula rearranges to
G = 1 + 2AdAD
The visual test method will be used to confirm previous reports that the Listing's
planes of the two eyes rotate temporally when the eyes converge. Since the method
provides a simple test to calculate G, the ratio between how much Listing's plane rotates
and the vergence angle, these tests may ais0 help to settle the controversy over how much
Listing's plane rotates during convergence. In the present study we use these tests to
provide independent support for the view that the angle between the planes is smaller
than the vergence angle Le. that G is less than 1.
METHODS
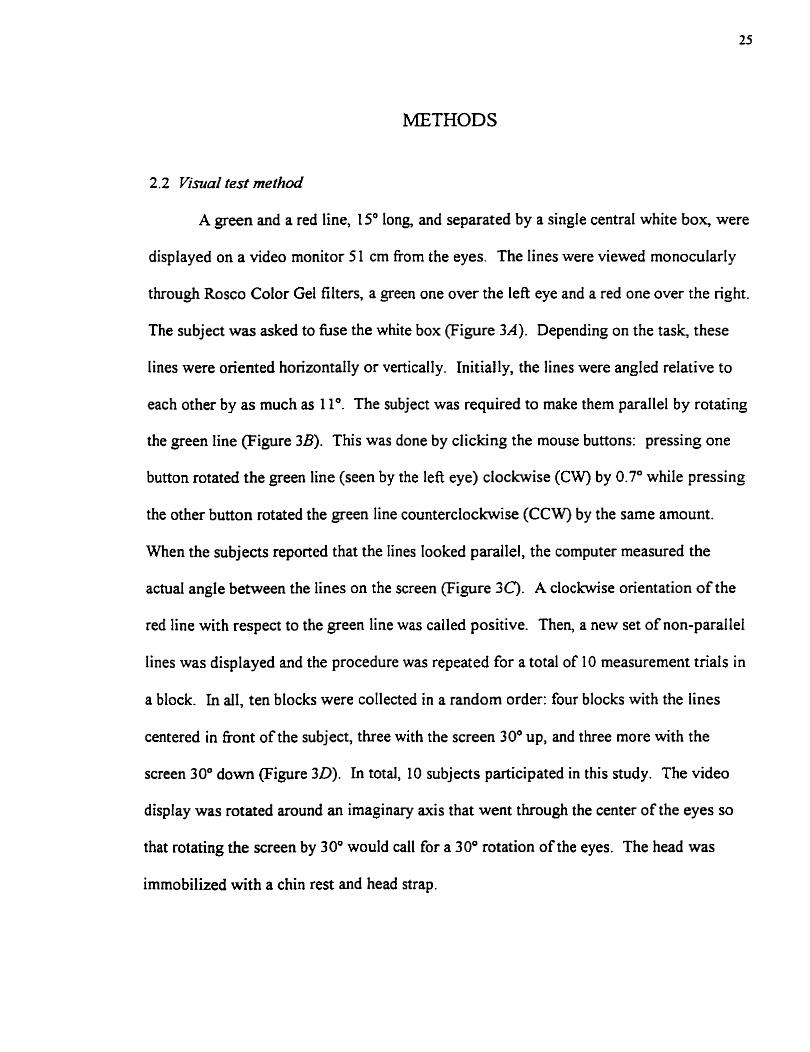
2.2 Visrral test m e t h i
A green and a red line, 15' long, and separated by a single central white box, were
dispiayed on a video monitor 5 1 cm from the eyes. The lines were viewed monocularly
through Rosco Color Gel filters, a green one over the left eye and a red one over the right.
The subject was asked to fuse the white box (Figure 3A). Depending on the task, these
lines were oriented horizontally or vertically. Initially, the lines were angled relative to
each other by as much as 11". The subject was required to make them parallel by rotating
the green line @igue 38). This was done by ciicking the mouse buttons: pressing one
bunon rotated the green line (seen by the lefi eye) clockwise (CW) by 0.7O while pressing
the other button rotated the green line counterclockwise (CCW) by the same amount.
When the subjeds reported that the lines looked parallel, the computer measured the
actual angle between the lines on the screen (Figure 3C). A clockwise orientation of the
red line with respect to the green line was called positive. Then, a new set of non-parallel
lines was displayed and the procedure was repeated for a total of 10 measurement trials in
a block. In dl, ten blocks were collected in a random order: four blocks with the lines
centered in front of the subject, three with the screen 30' up, and three more with the
screen 30" down (Figure 30). In total, 10 subjects participated in this study. The video
display was rotated around an imaginary axis that went through the center of the eyes so
that rotating the screen by 30" would cal1 for a 30" rotation of the eyes. The head was
immobilized with a chin rest and head strap.
2.3 Vinml test tash
For each of ten normal subjects we collected 10 blocks of data as described above
(control data set) and an additional 10 blocks with additional vergence was produced in
one of three ways.
2.3.1 Viewzng horizo~ital Zines through head-fixed prisms
Subjects were required to make the two lines parallel while fusing the central
white box through a set of 1 1-diopter base-out pnsms fixed on spectacle frames 0.25 cm
in front of the eyes.
2.3 -2 Viewing horizontal Zines while converging on o nem target (LD)
Here the subjects were asked to dign the same horizontal lines displayed on the
video monitor while they converged on a near LED. The subject was continuously
reminded to attend to the LED to avoid accommodation of the lines displayed on the
screen. The LED was positioned so that the increase in vergence, from the square on the
video monitor to the LED, was 1 1' ( i.e. the same change in vergence as with the head-
tixed prisms in Task 1). Thus vergence increased from 7.0" in the control condition to
18" in this task.
2.3 .3 Viewing horizontal Zines while convergiing ihrough rotating prims
In this task the prisms, rather than remaining fixed as in task 1, rotated with the
elevation of the video screen and with eye elevation. This set up ensured that the eyes
viewed the lines through the center of the pnsms for any particular direction of gaze.

Subjects were also required to perfonn tasks 1, 2 and 3, but with vertical lines
innead of horizontal lines. The spacing between the vertical lines was increased to 2' to
prevent the subjects from hsing the lines instead of the white square.
2.4 Data maZyszs
We plotted torsional disparity versus screen elevation and computed the slope of
the Iine of best fit.
n = number of trials in one block (10) 10 blocks = total of 100 points. x = elevation ( 0, +3 0°, or -3 0' ). y = actual torsional disparity.
The slope during vergence was compared against that of the control to determine
the change in slope produced by vergence.
2.5 Resulrs for the three tash
2.5.1 k i n g horizontal lines throzigh head-jied prisms
When converging through 1 1-diopter, head-fixed prisms, subjects reported
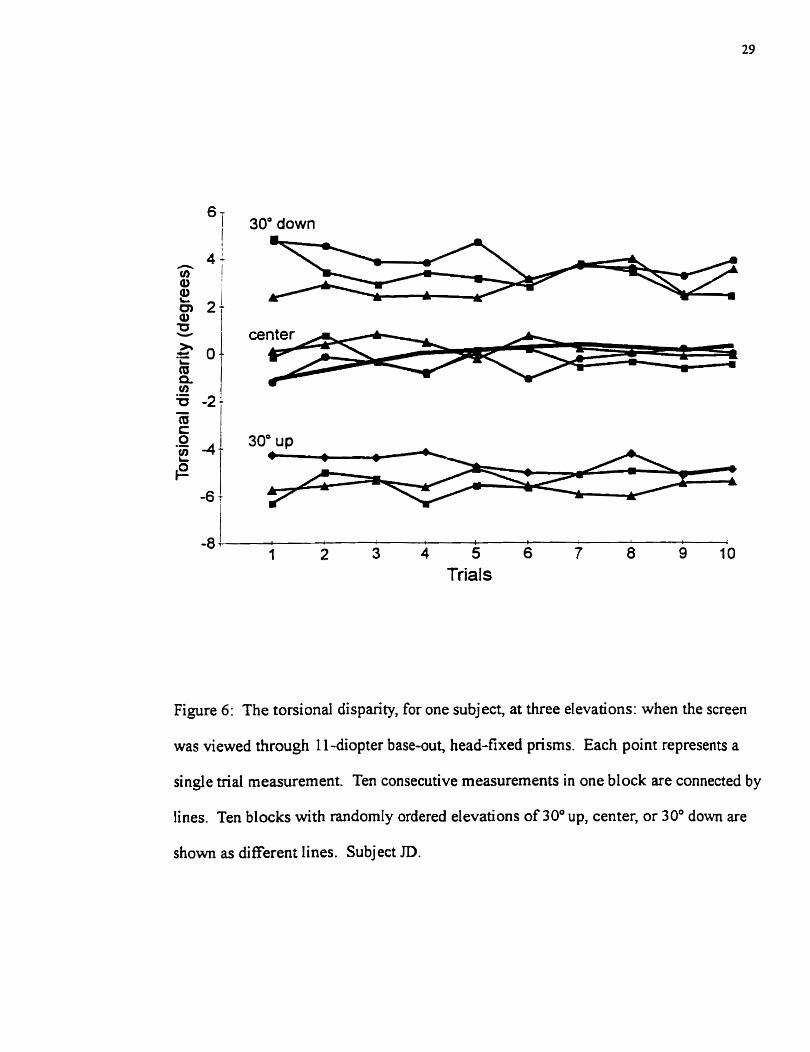
horizontal Iines as being parallel when they were not. Figure 6 shows successive
measures of the actual torsional disparity of these Iines for one subject (ID). A consistent
clockwise (CW) disparity was observed when the screen was lowered by 30° and a
countercIockwise (CCW) disparity when the screen was raised by 30". When the screen
was placed at the center position, disparity was small. As indicated by the lines with
different symbol types this pattern was consistent between trials in one block and
between blocks. Mean torsional disparity differed significantly between blocks with
different elevations but not between blocks with the same eIevation.
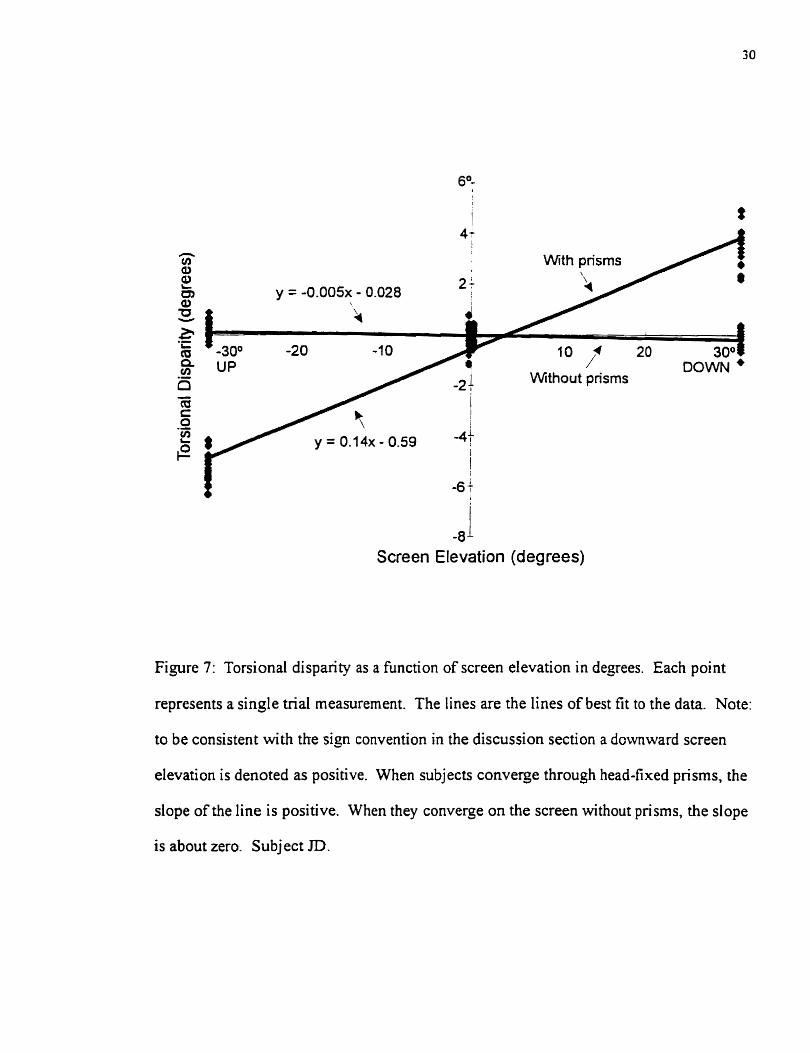
Figure 7 shows a plot of the 100 actual torsional dispuity measurements as a
function of screen elevation for the same subject JD. A line fitted to these data has a
positive dope of 0.14 k 0.01 (95% confidence). Note that the slope has a positive value
because we adopted a convention in which down is positive. When subjects view the - -
same horizontal lines without head-fixed prisms, the dope of torsional disparity against
screen elevation was much smaller. For subject JD the dope was -0.005 * 0.005 (Figure
7). Thus the change in slope between with and without head-fixed prisms conditions was
0.145 for this subject.
30" down
4 -8 * 1 2 3 4 5 6 7 8 9 10
Trials
Figure 6 : The torsional dispuity, for one subject, at three elevations: when the screen
was viewed through 1 1-diopter base-out, head-fixed prisms. Each point represents a
single triai measurement. Ten consecutive measurernents in one block are connected by
lines. Ten blocks with randomly ordered elevations of 30' up, center, or 30" down are
shown as diEerent lines. Subject ID.
-8'
Screen Elevation (degrees)
Figure 7: Tonional dispanty as a function of screen elevation in degrees. Each point
represents a single trial rneasurement. The lines are the lines of best fit to the data. Note:
to be consistent with the sign convention in the discussion section a downward screen
elevation is denoted as positive. When subjects converge through head-fixed prisms, the
slope of the line is positive. When they converge on the screen without prisms, the slope
is about zero. Subject ID.
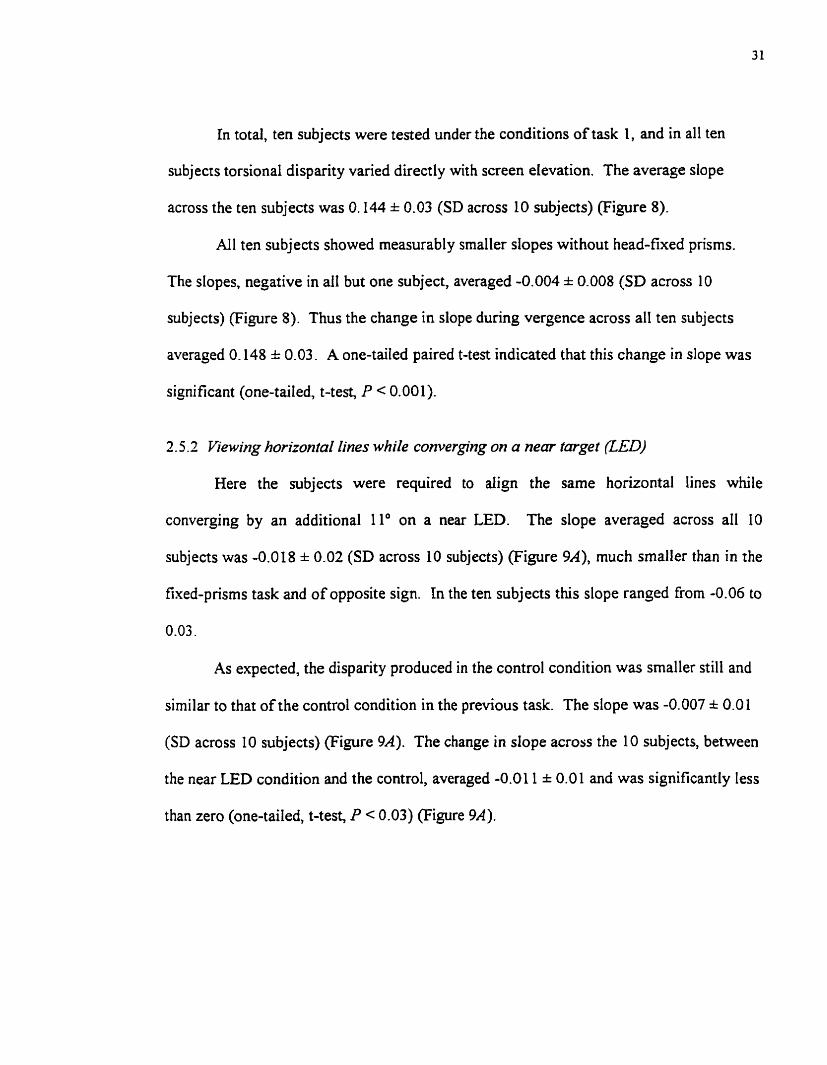
In total, ten subjects were tested under the conditions of task 1, and in al1 ten
subjects torsional disparity varied directly with screen elevation. The average dope
across the ten subjects was 0.144 * 0.03 (SD across 10 subjects) (Figure 8).
Al1 ten subjects showed measurably smaller slopes without head-fixed prisms.
The slopes, negative in ail but one subject, averaged -0.004 * 0.008 (SD across 10
subjects) (Figure 8). Thus the change in dope during vergence across al1 ten subjects
averaged 0.148 k 0.03. A one-tailed paired t-test indicated that this change in slope was
significant (one-tailed, t-test, P < 0.001).
2.5.2 Yiewing horizontal Zines while converging on a near target (ZED)
Here the subjects were required to aiign the same horizontal lines while
converging by a n additional 11" on a near LED. The slope averaged across a11 10
subjects was -0.018 & 0.02 (SD across 10 subjects) (Figure 9A), much smaller than in the
fixed-prisms task and of opposite sign. In the ten subjects this slope ranged from -0.06 to
0.03.
As expected, the disparity produced in the control condition was smaller still and
similar to that of the control condition in the previous task. The dope was -0.007 * 0.01
(SD across 10 subjects) (Figure 9A). The change in dope across the 10 subjects, between
the near LED condition and the control, averaged -0.01 1 * 0.0 1 and was significantly less
than zero (one-tailed, t-test, P < 0.03) (Figure 9A).
[3 without prisms T with prisms
El change
HM SS KS SU JD LC HS NA DT RS Average
Su bjects
Figure 8: Slopes for 10 subjects converging on the video screen without prisms, and
when converging through head-fixed prisms, together with the change in slope between
these two conditions. Error bars for each subject represent the 95% confidence interval.
Error bars for the average represent the variability across the 10 subjects, one SD.
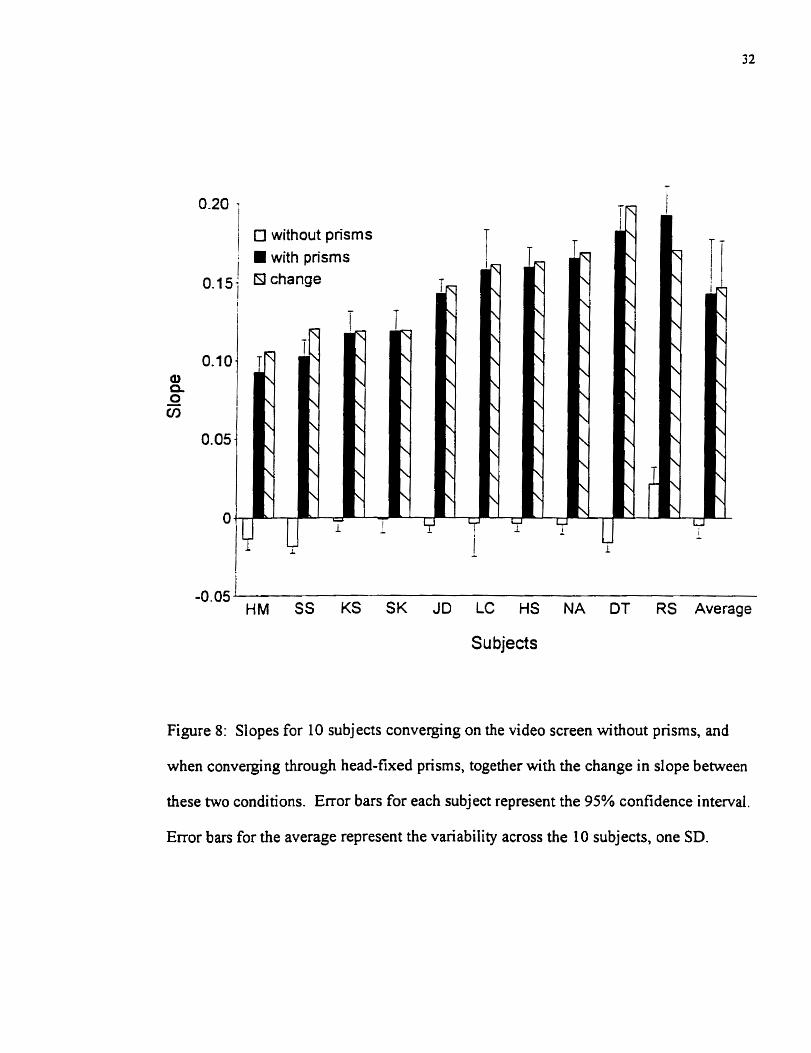
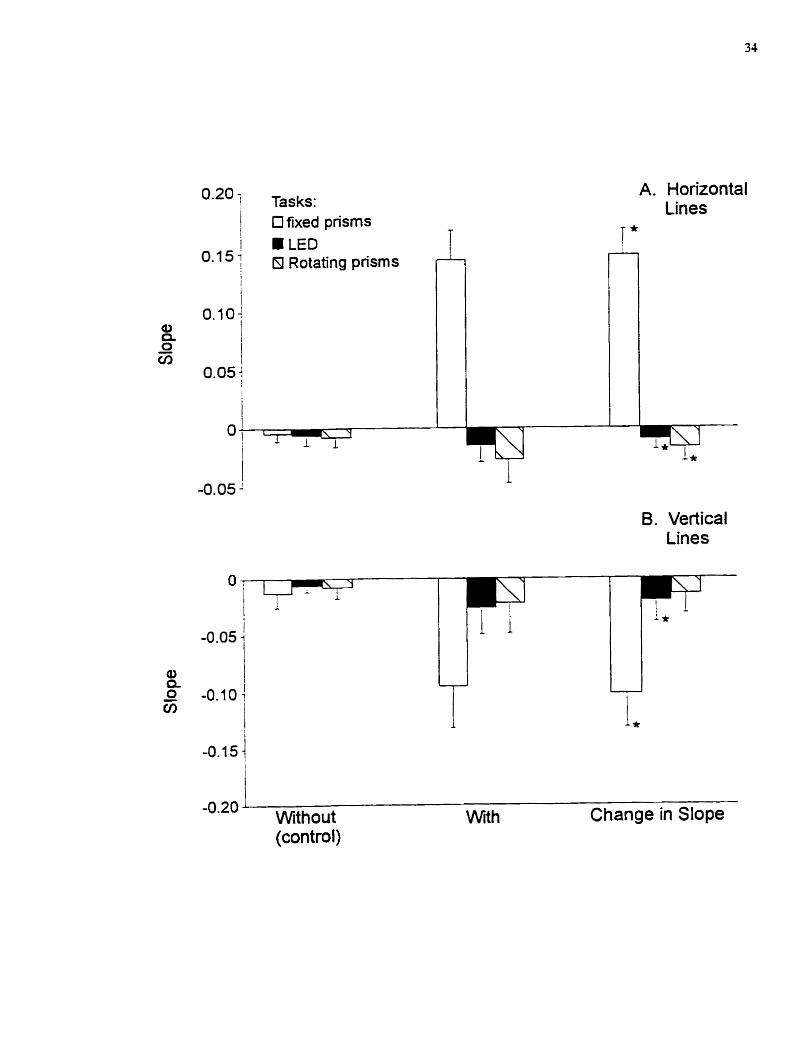
Figure 9: Average slopes for al1 tasks: head-fixed pnsms, LED, and rotating pnsms when
viewing horizontal lines (A) and vertical lines (B). The lefi set of 3 bars represents the
average dope in the control condition, without prisms or near LEDs. The center set
represents the average siopes when subjects view through fixed prisms, converged on a
near LED, and viewed through prisms that rotated with screen elevation. Error bars
represent one SD for the 10 subjects. * indicates that the change is significantiy less or
greater than as determined by a one-tailed t-test (95% level).
Tasks: Ofixed prisms
LED T
A. Horizontal Lines
T *
B. Vertical Lines
-0.20 ' Without VVit h Change in Slope (control)
2.5.3 Vieiuing horito~~tal lines throngh a set of ro fating prisms
In this task we measured the disparity of the sarne horizontal lines viewed on the
screen when the eyes converged through a set of prisms that rotated with the elevation of
the screen. As in the LED task srnaIl torsional disparity changes were observed as a
fiinction of screen eIevation.
The average siope across al1 ten subjects for rotating prisms was -0.033 I 0.02
(SD across 10 subjects) (Figure 9A). The average siope without rotating prisms was
-0.009 & 0.009. Thus the change in slope caused by the rotating prisms across al1 ten
subjects averaged -0.024 * 0.01 (SD across 10 subjects). This was significantly different
from the change in slope produced by the head-fixed prisms (0.148) but similar to that
when converging on a near LED (-0.01 1).
2.5.4 View ing vertical lines
Finally we measured the disparity of verticai lines when converging 1) through
head-fixed prisms, 2) on a near LED, or 3) through rotating prisms. In the head-fixed
prisms task, disparity was dependent on elevation, but of the opposite sign as compared
to when viewing horizontal Iines. The slope on average across al1 ten subjects was -0.12
0.04 (SD across 10 subjects) (Figure 9B). Aligning the same vertical lines, but without
the head-fixed prisms resulted in an average slope of -0.016 * 0.01 (Figure 9B). Thus the
change in dope produced by the head-fixed prisms averaged -0.104 * 0.03 (Figure 9B).
When viewing vertical lines while converging on a near LED, a similar elevation-
dependent disparity was observed as when viewing horizontal lines. The average slope
across ten subjects was -0.033 0.03 (SD across 10 subjects) (Figure 9B). The dispady
of vertical lines without the LED (control condition) resulted in an average slope of
-0.007 * 0.005 (Figure 94, a value that was not different from the other controls. Thus
the change in dope produced by the LED averaged -0.026 * 0.02, similar to when
viewing horizontal lines.
In our last condition, subjects were required to align vertical lines while
converging through rotating prisms. On average subjects showed an elevation-dependent
disparity, with a slope of -0.027 i 0.03 (SD across 10 subjects) (Figure 9B). The
disparity of vertical Iines in the control case was again small, with an average slope of -
0.009 * 0.01 (Figure 9B). The average change in slope, when viewing vertical lines
through rotating prisms was -0.018 & 0.02, and not significantly different from zero (t-
test, P e 0.10, one-tailed).
2.6 Summary
The change in slope was largest in magnitude when subjects viewed horizontal or
verticai lines through head-fixed prisms (Figures 9A & B). The sign of the change was
positive for horizontal lines and negative for vertical lines. In contrast, when subjects
viewed horizontal iines through rotating prisms or while converging on a near LED, the
change in slope was smaller and negative.
DISCUSSION
2.7 Discussion
2.7.1 Converging on a near LED
Of our three experimental tasks, the one that is optically the simpiest and therefore
the easiest to interpret is the LED test, in which subjects kept their eyes converged on a
near target, an LED placed so as to require 17.g0 of vergence, but they had to dign their
images of red and green lines presented on a cornputer screen in the background, 51 cm
away. Nonally, subjects would need a disconjugate angle of 6.g0 to view this screen, so
by forcing them to fixate the LED we introduced an extra 1 l0 of vergence. Looking
through their colored filters, Our subjects saw the red line on the computer screen only
with the right eye and the green line only with the lefl. They rotated the green line until it
looked to be parallel with the red, and when they were done we measured the actual angle
between the two Iines on the computer screen to find the torsional disparity Tdiqj. For
example, if the red line is 3" clockwise of the green, then the right eye's torsional angle
TB is 3' clockwise of the left's, TL, implying a Tdirp of 3' clockwise.
In our ng-prisrn experiments where near-horizontal lines were presented on the
computer screen, the average value for AD was 1 1°, or 0.19 radians, generating a slope of
2/0.19 or 10.42 Figure 10A). Therefore a As of -0.0 1 I 0.01 converts to a G of 1 - 0.1 1
= 0.89 I 0.10 by Eq. 14 (SD across 10 subjects). When near-vertical lines were
presented, As averaged -0.026 * 0.02, for a G of 0.73 k 0.23 (Figure 10A). These two
values agree with
Figure 10: The computed gains as a function of a change in dope for A) The LED and
rotating pnsm (W) tasks with horizontal 0 or vertical lines (V). B) The head-fixed
prism task (FP). Dashed Iines indicate the computed gain for the average measured
change in dope for each task.
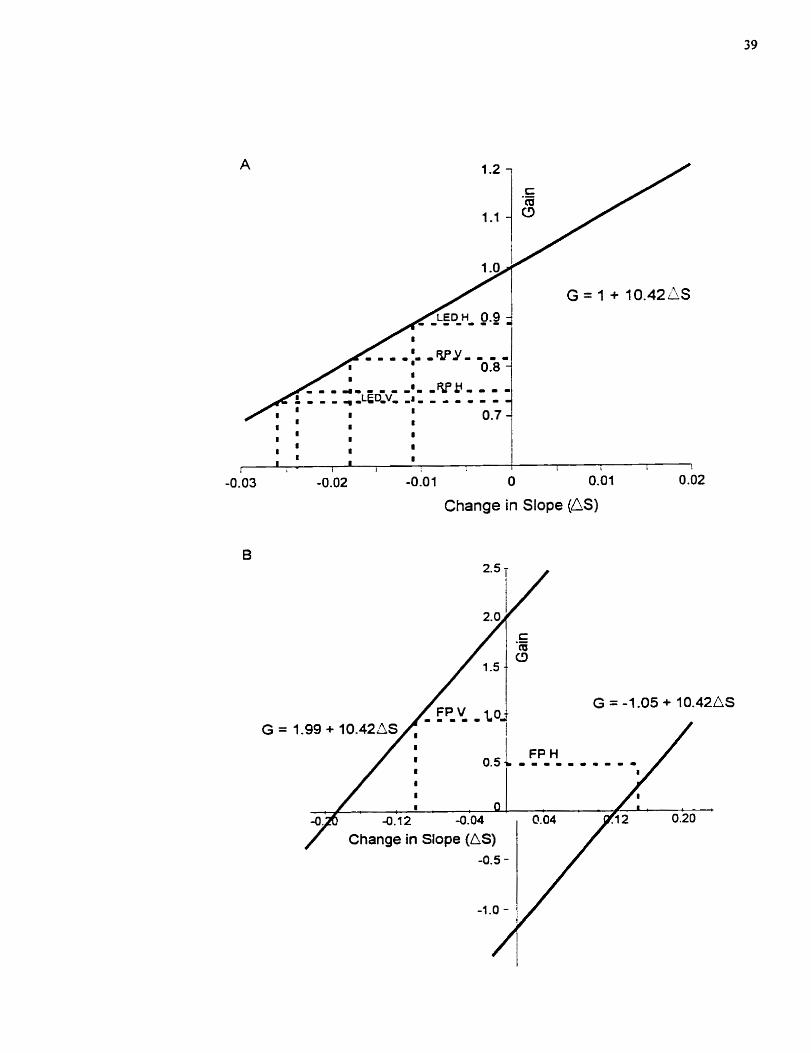
G = l + lO.42AS
t r i I 1 1 1
I 1 1
-0.03 -0.02 -0.0 1 O 0.01 0.02
Change in Slope (AS)
/ Change in Slope (AS) -0.5 -
one another and with previous measures by Mok et al., (1992) and Mikhael et al., (1994),
and they are not far fiom the values found by Minken & Van Gisbergen, (1994).
2.7.2 Rotating prism experiments
For the case where the prisms rotate up and down with the eye, the optics are very
simple. To a good approximation, the prisms merely rotate each eye's visual scene 5.Y
horizontally in the nasal direction, about an axis that is vertical relative to the eye. In
these experiments, as in the LED study, we measured disparities at different vertical and
disconjugate angles. A line of reasoning similar to the one given above then ieads to the
same equation as in the no-pnsm case: G is again given by Eq. 14. In Our moving-pnsm
data, when near-horizontal lines were presented the average value for As was = -0.024 &
0.01, which converts to a G of 0.75 * 0.14 (SD across 10 subjects). When near-vertical
lines were presented, As averaged 0.0 18 * 0.02, for a G of 0.8 1 0.2 1 (Figure 1 OA).
2.7.3 Head-Fred prism experirnents
In the expenments where the prkm is fixed relative to the head, the optics are more
complicated. Because the light rays entering the eye are no longer even roughly
perpendicular or constant relative to the long axis of the prism, as they were in the case of
the moving prisms, new optical distortions arise. Visual images are not only rotated but
also warped so that, for example, a cross formed by a horizontal and a vertical crossbar
will looked skewed. The two crossbars wiil not appear to intersect at right angles (Ogle,
1952). Indeed, the torsional disparities of horizontal and veriical lines that we measured
with this technique were of opposite sign, which shows that the Iines were rotated
differently. Quantitatively, these distorsions depend on a number of variables, such as
the slant of the prism relative to the line of sight and the distances Iiom the eye to the
prism and from the prism to the visual target. To quanti@ these effects, we simulated the
optics of the prism in the cornputer using Snell's law of refiaction, taking into account the
prism's geometry and its location and orientation relative to eye and target, and also the
fact that the index of refraction of the pnsm glass is slightly different for red and green
light, and will therefore have different eEects on the red and green lines seen by the right
and Ieft eyes.
From these simulations came the following two equations for G. Because of the
warping introduced by head-fixed prisms, separate equations are required for the tasks
where horizontal and vertical lines are presented on the computer screen:
For near-H lines G = 1 + 2(As - 0.197)lâ.D ( 1 6 4
Fornear-Vlines G=I+2(As+O.O95)/AD (w Here As is the difference between ~ 1 7 . 9 and ç6.9, where ~17.9 is the slope of Tdb versus
vertical eye position, measured when the subject looked through the head-fixed prisms,
which required a disconjugate angle D of 17.9"; g . 9 is dope of the same relation
measured when the subject looked at the computer screen without prisms, with a
disconjugate angle of 6.9". Note that Eqs. 16a and 16b are identical to Eq. 13 except for
the offset terms 4 . 1 9 7 and 0.095, which reflect the optical distortions caused by the
prisms. In Our head-fixed prism data, when near-horizontal lines were presented, the
average value for As was = 0.148 * 0.03, which gives a G of 0.49 * 0.32 (SD across 10
subjects) by Eq. 16a. With near-vertical lines, As averaged -0.104 k 0.03, for a G of 0.9 1
* 0.30 by Eq. 16b (Figure 10B).
2.7.4 Why is G < I?
Al1 six visual tests put the average value for G in the range 0.49 to 0.91, which is
somewhat less than the ideal value of 1. The average value for G across the LED, head-
fixed and rotating prisms tasks is 0.71. Tweed, (1997) has suggested that low G values
reflect a compromise strategy, weighing stereo vision against motor efficiency. From the
viewpoint of stereo vision, setting G = 1 is the optimal strategy. But fiom a motor
viewpoint, the optimal G is O, because a low G reduces eye eccentricity. The 3-D
rotational displacements of the eyes nom their center positions are smaller for smaller
Gs, essentially because a smaller G requires less rotation of the eye about its line of sight.
Reducing eye eccentricity in this way may in turn reduce the work of the eye muscles.
Or, by keeping the eye nearer the center of its range of motion, it rnay allow faster
reactions to new visual events, in the same way that staying near center-court allows a
tennis player to respond more quickly to incorning balls. The fact that the actual G value
clusters closer to 1 than to O, Le. closer to the optimal value for stereo vision than to the
optimal for muscle woriq may suggest that vision is winning this tug-of-war.

USNG A SYNOPTOPHORE TO MEASURE THE ANGLE BETWEEN
THE LISTING'S PLANES
3.1 I~r~od~tct ion
In the first study, we developed a simple visual test to measure the rotation of
Listing's plane as a fùnction of the vergence angle. The fact that the planes tum dunng
vergence has created some controversy. While several Iaboratories (Minken & Van
Gisbergen, 1994; Mikhael et al., 1995; Mok et al., 1992; Van Rijn & Van den Berg,
1993) agree that convergence produces a temporal rotation of the Listing's plane, there is
debate as to the amount of rotation. Mok et al., (1992) and Mikhael et al. (1995) found
that the angle between the Listing's planes of the two eyes is about 0.7 times the angle of
convergence, whereas Van Rijn & Van den Berg (1993) found that the interplane angle is
about 1.7 times the vergence angle. In our previous study, using non-invasive visual
teas, we also found that the interplane angle between the Listing's planes was 0.71 times
the vergence angle (Somani et al., 1997).
The relative orientation of images on the two eyes, the torsional disparity, is
dependent on the amount Listing's plane rotates. When the interplane angle equals the
vergence angle, the torsional disparity of horizontal lines parallel to the visual plane, the
plane containing the line of sight of the two eyes, is zero (Van Rijn & Van den Berg,
1993; Minken, Gielen, & Van Gisbergen, 1995; Tweed, 1997). One can thus indirectly
measure the temporal rotation of Listing's plane by measuring the elevation dependence
of the torsional disparity. Using red-green filters to separate the images of red and green
lines on a video monitor, we found that the interplane angle between the Listing's planes
was on average 0.71 times the vergence angle (Somani, DeSouza, Tweed, & Vilis, 1997)
consistent with Our previous direct measures of the rotation of Listing's plane (Mok et a/.,
1992; Mikhael et al., 1995). T hus it appears that Listing's plane turns less than that
required to zero the torsional disparity of horizontal lines.
The first goal of this study was to determine if this rotation of Listing's plane
dunng vergence could also be indiredy measured using an apparatus readily available in
the clinic; a synoptophore. A synoptophore presents separate images to each eye. These
images can be rotated precisely horizontally, inducing various degrees of vergence. The
elevation-dependent torsional disparity can be measured by asking the subject to rotate
the image torsionally until this disparity becomes zero.
The second goal of this study was to use the synoptophore to determine how
much the Listing's planes rotated in patients suffering nom various forms of intermittent
horizontal strabismus. When viewing monocularly, these patients displayed various
degrees of eso- or exo-deviation without any prominent vertical dispanty. In the
synoptophore they were however able to fuse a binocularIy viewed dot and circle. Van
den Berg, Van Rijn, & De Faber (1995) have shown that subjects who have an exo-
deviation display an elevation-dependent cyclovergence even when viewing distant
targets. As a result, their Listing's planes are not perfectly parallel but are rotated
temporally even at a vergence angle of zero. Van den Berg et al. (1 995) have suggested
that this occurs because convergence is used to align the diverging eyes of these subjects.
In this study we use the synoptophore and Our visual tests to reexamine this.
3 -2 Orthoptic assesment
In total, 10 normals and 10 patients participated in the following study. AI1
subjects were required to 1) fuse a binocularly viewed image and 2) to judge when
monocularly viewed lines were parallel. For this reason, the patients were selected if
they had an eso- or exo-deviation measurable in the distance or at near, a vertical ocular
deviation less than 2 diopters, Snellen visual acuity of ZO/X or better in the distance (6
meters), near visual acuity of JI+ (at 33 centimeters), motor fusional convergence
amplitudes of 10 prism diopters or better in the distance and 30 prisrn diopters or better at
near, binocular single vision both at near and distance, as well as near stereopsis of 100"
or better. Specifically, both intermittent eso- and exotropias, as well as eso- and
exophonas composed the group of deviations studied. Permission was obtained from the
refemng ophthalmologists to invite these candidates for a repeat, comprehensive
orthoptic examination to confirm eligibility for study participation. Al1 patients provided
informed consent. Stereoacuity was recorded with the Titmus systern. Sensory status
was reponed as a fusion response at both near and in the distance using the Worth four-
dot test. A cover-uncover test demonstrated the ocular deviation both at near and in the
distance, with and without refractive correction. Best-corrected visual acuity was
recorded. The altemate wver test with prism bars was used to quantiS. the ocular
deviation both at near (33 cm) and in the distance (6 m). The subjects in the control
group were identified by the above criteria with the exception of having an ocular
deviation limited to 2 diopters. Identical testing was performed with the 10 controls.
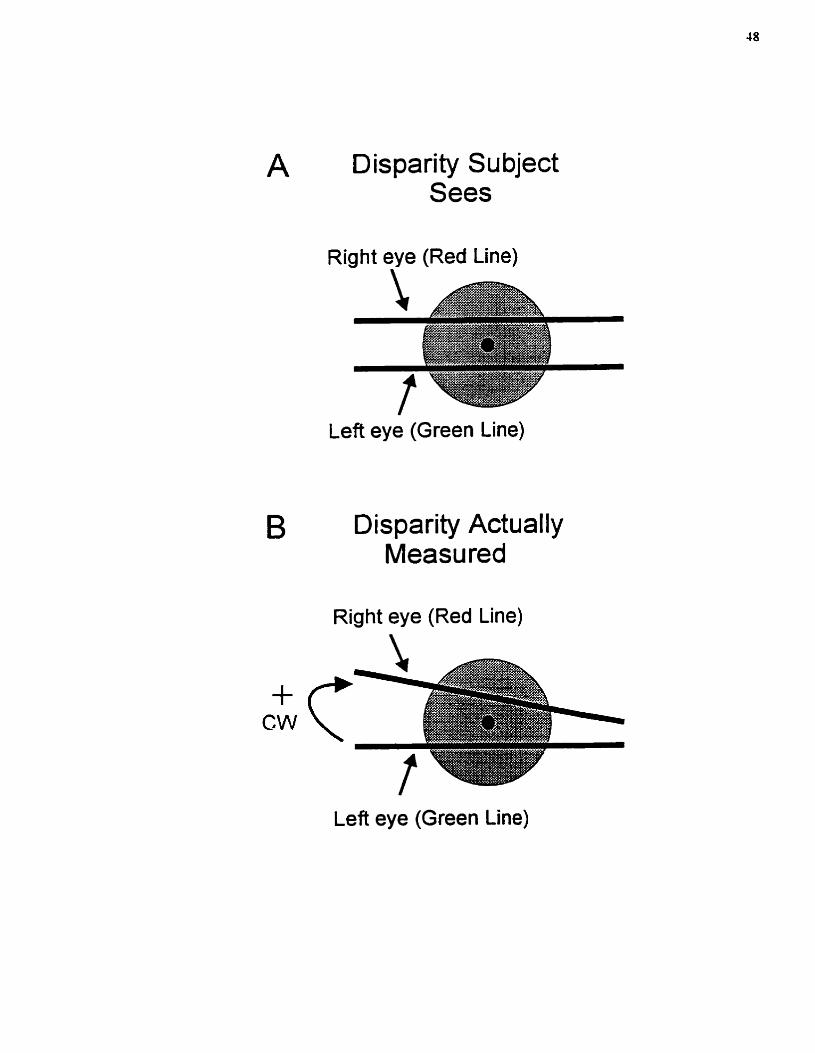
3 -3 Synopiophore tas&
We used a synoptophore to measure the elevation-dependent torsional disparity
during various degrees of convergence. The image viewed by the two eyes was designed
to induce vergence without cyclofusion (Figure 11). Vergence was induced by a black
centered dot surrounded by a gray circle seen by both eyes. A red line, 6.2 cm long, was
viewed by the nght eye and a green line by the other eye. To prevent cyclofusion one
line was displayed above the center dot and the other below it. The subject was required
to fuse the binocular black dot and the gray circle. Depending on the task the fines were
onented roughly horizontally or vertically. Initially, the lines were not parallel. While
keeping the target circles hsed, the subjects were required to make the two lines appear
parallel (Figure 11A) by rotating the torsional control knob of the right eyepiece. When
the subject indicated that the lines appeared parallel, the actual orientation of the lines
was recorded by taking the torsional value of the right eyepiece. A positive value was
assigned to the torsional disparity when the red line was oriented clockwise (extortion)
with respect to the green line (Figure 11B). A total of nine trials of data were collected in
random order, three with the image centered in front of the subject, three with the image
elevated at 20° up, and three triais with the image at 20' down. Throughout, the head was
immobilized with a chin and forehead rest.
For each normal subject we collected data as described above at various degrees
of horizontal convergence: 0°, 10°, 20°, and 30". The patients were tested under the same
conditions as normals, but only for those degrees of vergence at which the subject was
able to keep the target circles fùsed.
Figure 11: The test conditions. Each eye looked through an eyepiece lens at a green or a
red line, 6.2 cm long. Initially the lines appeared non-parallel. (A) Subjects made the
red line appear parallel with the red by rotating the torsional control knob of the right
eyepiece. (B) The actual rnisalignment of the lines was quantified by taking the torsional
value of the right eyepiece. Positive numbers were assigned to the torsional disparity
when the red line was oriented clockwise (CW) relative to the green line.
D isparity Su bject Sees
Right eye (Red Line) \
Left eye (Green Line)
Disparity Actually Measured
Right eye (Red Line)
Left eye (Green Line)
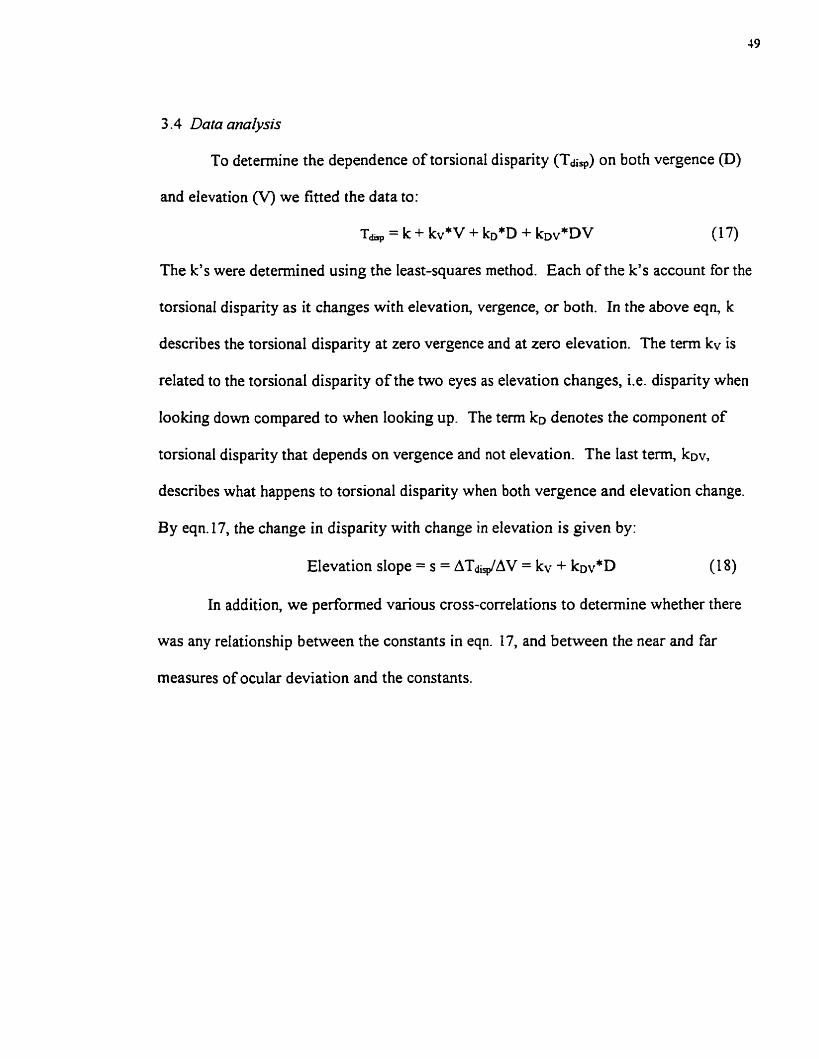
3.4 Data unalysis
To determine the dependence of torsional disparity (Tdiq) on both vergence @)
and elevation (V) we fitted the data to:
Tdq> = k + kv*V + kD*D + kDv*DV (17)
The k's were determined using the least-squares method. Each of the k's account for the
torsional disparity as it changes with elevation, vergence, or both. In the above eqn, k
descnbes the torsional disparity at zero vergence and at zero elevation. The term kv is
related to the torsional disparïty of the two eyes as elevation changes, Le. disparity when
looking down compared to when looking up. The term kD denotes the component of
torsional disparity that depends on vergence and not elevation. The Iast term, kDv,
describes what happens to torsional disparity when both vergence and elevation change.
By eqn. 17, the change in disparity with change in elevation is given by:
Elevation slope = s = ATddAV = kv + kov*D (18)
In addition, we performed various cross-correlations to determine whether there
was any relationship between the constants in eqn. 17, and between the near and far
measures of ocular deviation and the constants.
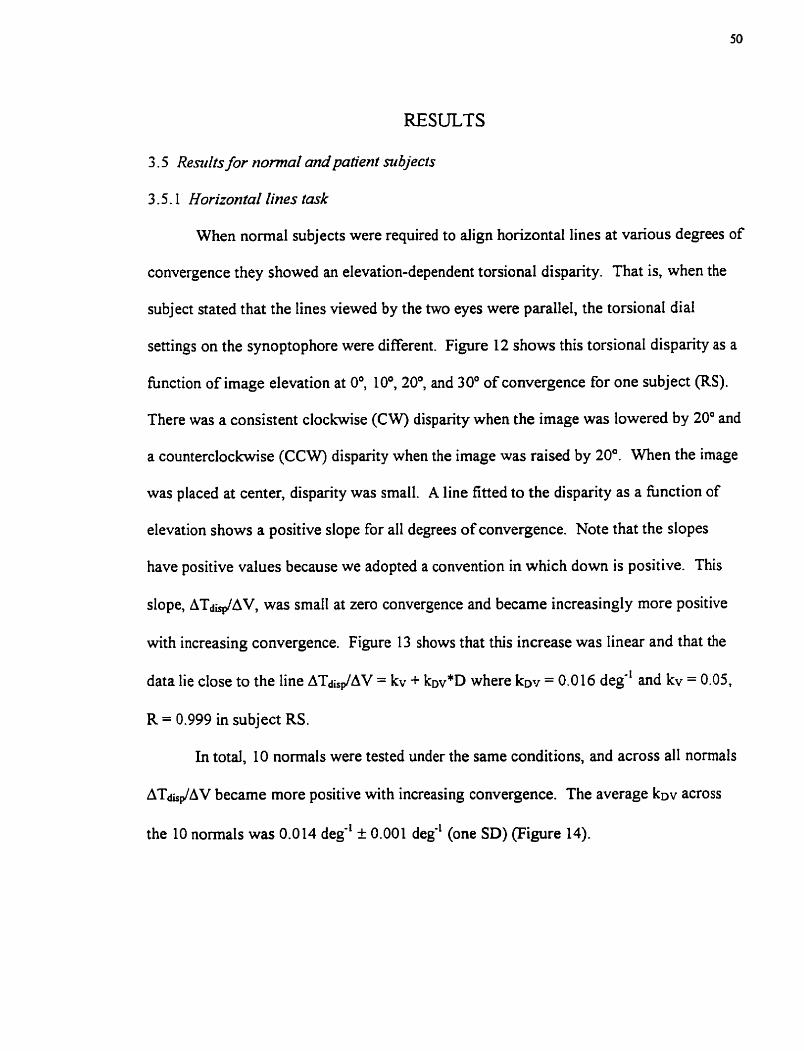
RESULTS
3.5 Reslrlts for normal and patient subjects
3.5.1 Horizontal lines task
When normal subjects were required to align horizontal lines at various degrees of
convergence they showed an elevation-dependent torsional disparity. That is, when the
subject stated that the lines viewed by the two eyes were parallel, the torsional dia1
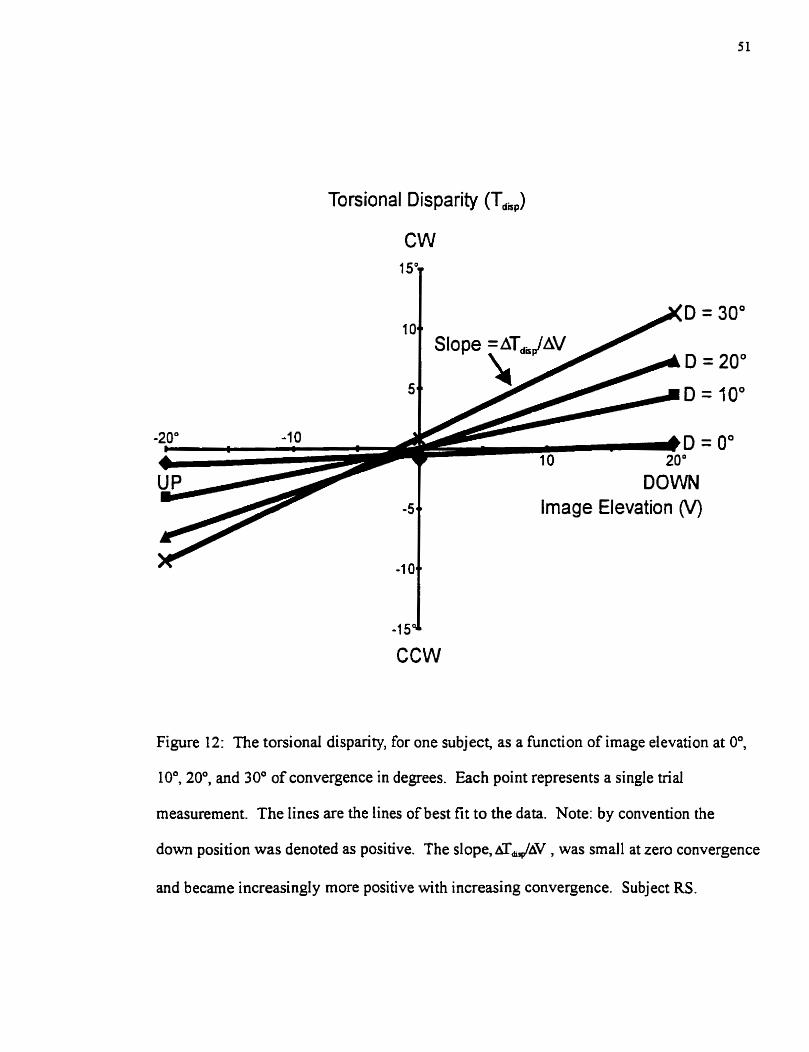
settings on the synoptophore were different. Figrire 12 shows this torsional disparity as a
function of image elevation at 0°, IO0, 20°, and 30" of convergence for one subject (RS).
There was a consistent clockwise (CW) disparity when the image was lowered by 20' and
a counterclockwise (CCW) disparity when the image was raised by 20". When the image
was placed at center, disparity was small. A line fitted to the disparity as a function of
elevation shows a positive slope for al1 degrees of convergence. Note that the slopes
have positive values because we adopted a convention in which down is positive. This
slope, ATd&AV, was small at zero convergence and became increasingly more positive
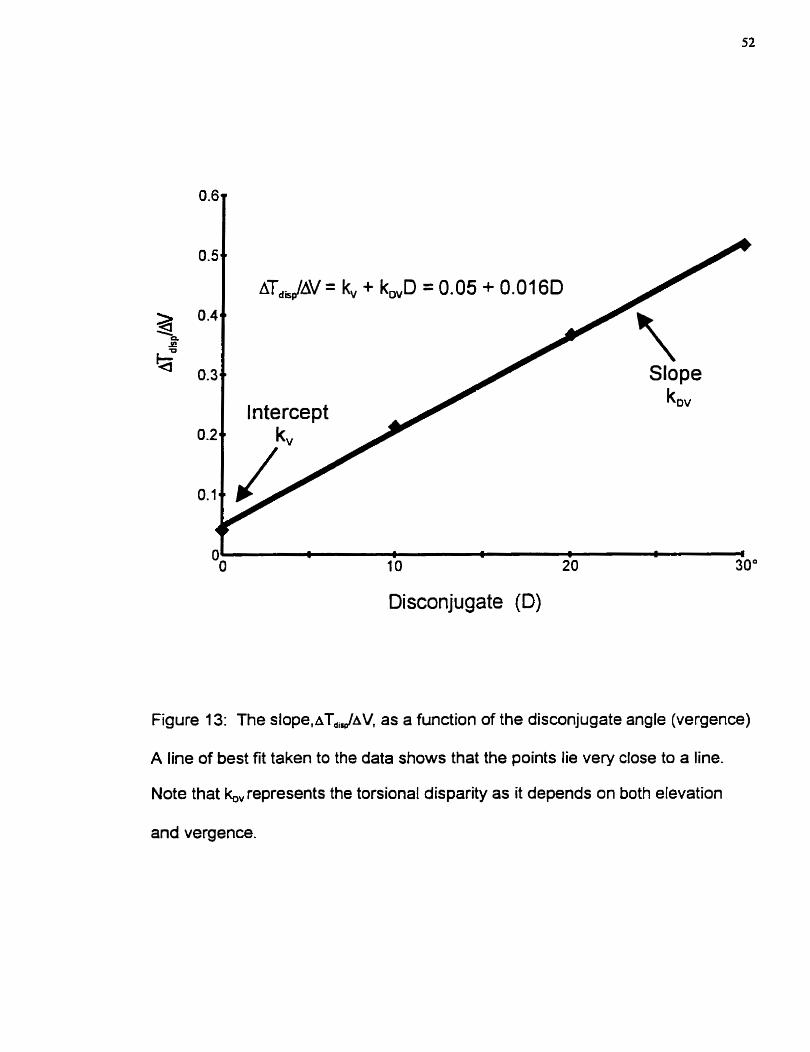
with increasing convergence. Figure 13 shows that this increase was linear and that the
data lie close to the line ATdisp'AV = kv + kov*D where kov = 0.016 deg-' and kv = 0.05,
R = 0.999 in subject RS.
In total, 10 normals were tested under the same conditions, and across al1 normals
AT&dAV becarne more positive with increasing convergence. The average kov across
the 10 normals was 0.0 14 deg-' f 0.001 deg'' (one SD) (Figure 14).
Torsional Disparity (T,,,)
CW
DOWN Image Elevation O/)
CCW
Figure 12: The torsional disparity, for one subject, as a function of image elevation at 0°,
IO0, 20°, and 30" of convergence in degrees. Each point represents a single trial
measurement. The lines are the lines of best fit to the data. Note: by convention the
down position was denoted as positive. The slope, ~ J A V , was srna11 at zero convergence
and becarne increasingl y more positive with increasing convergence. Subject RS.
1 O 20 30"
Disconjugate (D)
Figure 13: The ~bpe,~T,,$~daV, as a function of the disconjugate angle (vergence)
A line of best fit taken to the data shows that the points lie very close to a line.
Note that Lrepresents the torsional disparity as it depends on both elevation
and vergence.
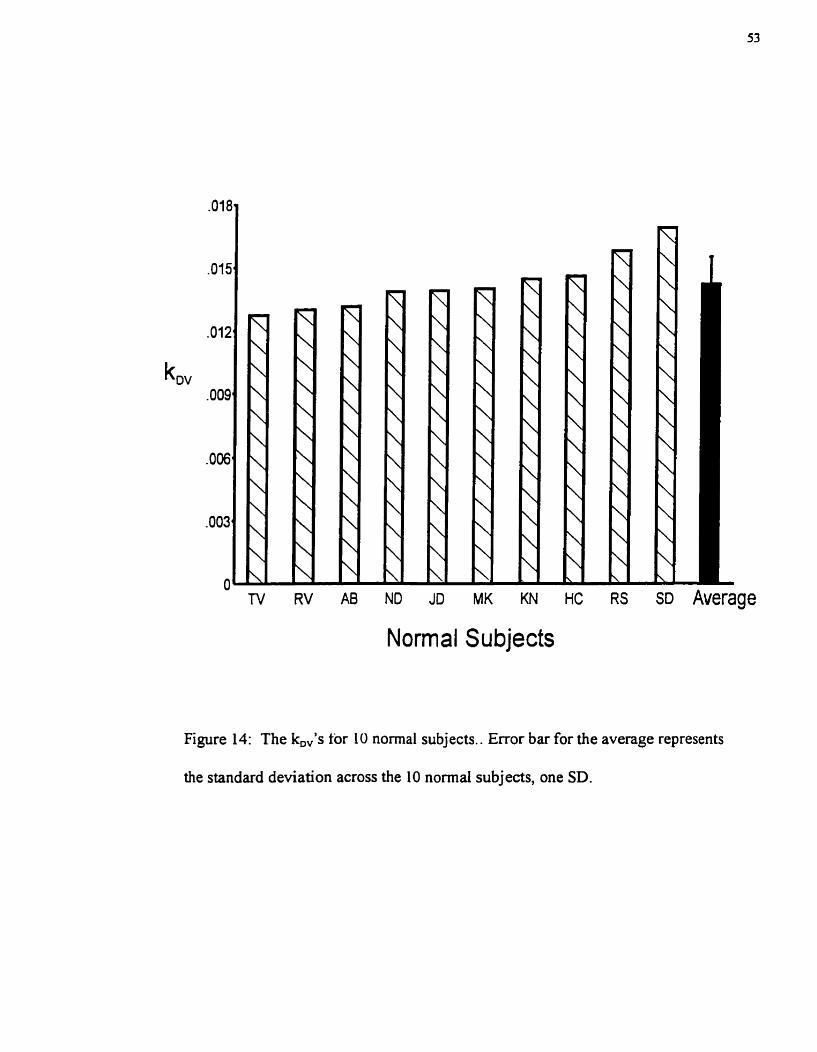
TV RV AB ND JD MK KN HC RS SD Average
Normal Subjects
Figure 14: The k,,'s for 10 normal subjects.. Error bar for the average represents
the standard deviation across the 10 normal subjects, one SD.
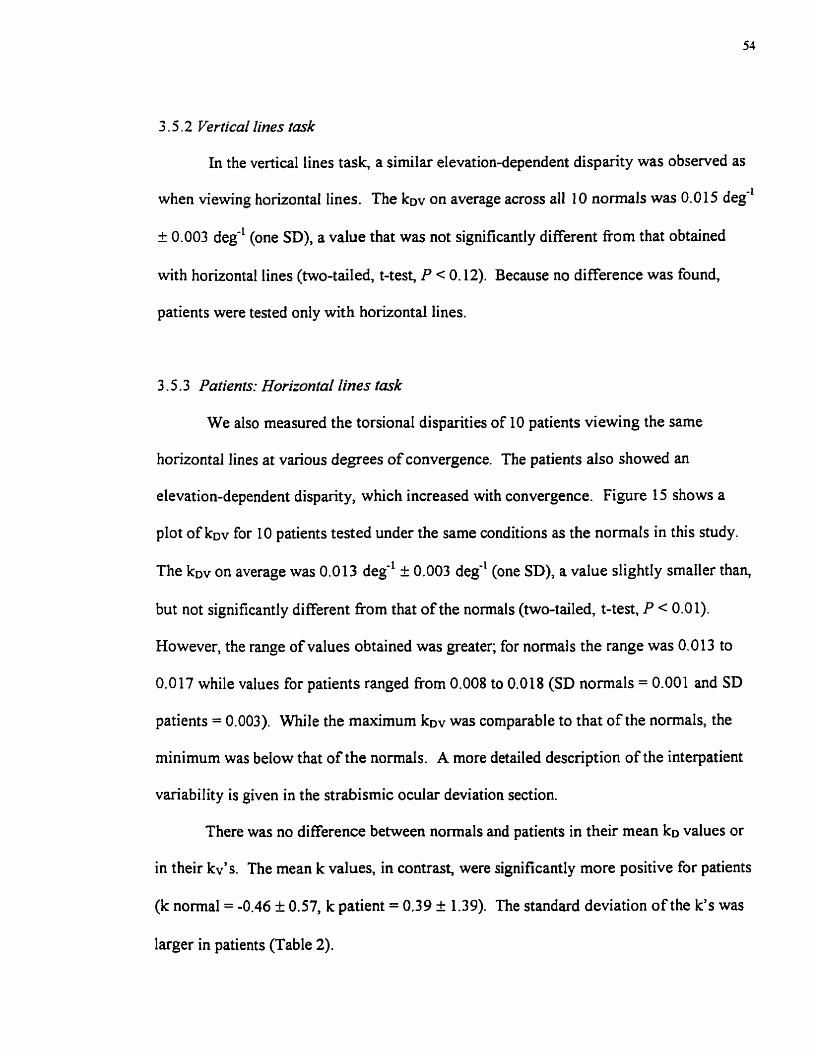
3.5.2 Vertical lines task
In the vertical lines task, a similar elevation-dependent disparity was observed as
when viewing horizontal lines. The kDv on average across al1 10 norrnals was 0.0 15 deg"
f 0.003 deg-' (one SD), a value that was not significantly different from that obtained
with horizontal lines (two-tailed, t-tes< P < 0.12). Because no difference was found,
patients were tested only with horizontal lines.
3.5.3 Patients: Horizontal lines rmk
We also measured the torsional disparities of 10 patients viewing the same
horizontal lines at various degrees of convergence. The patients also showed an
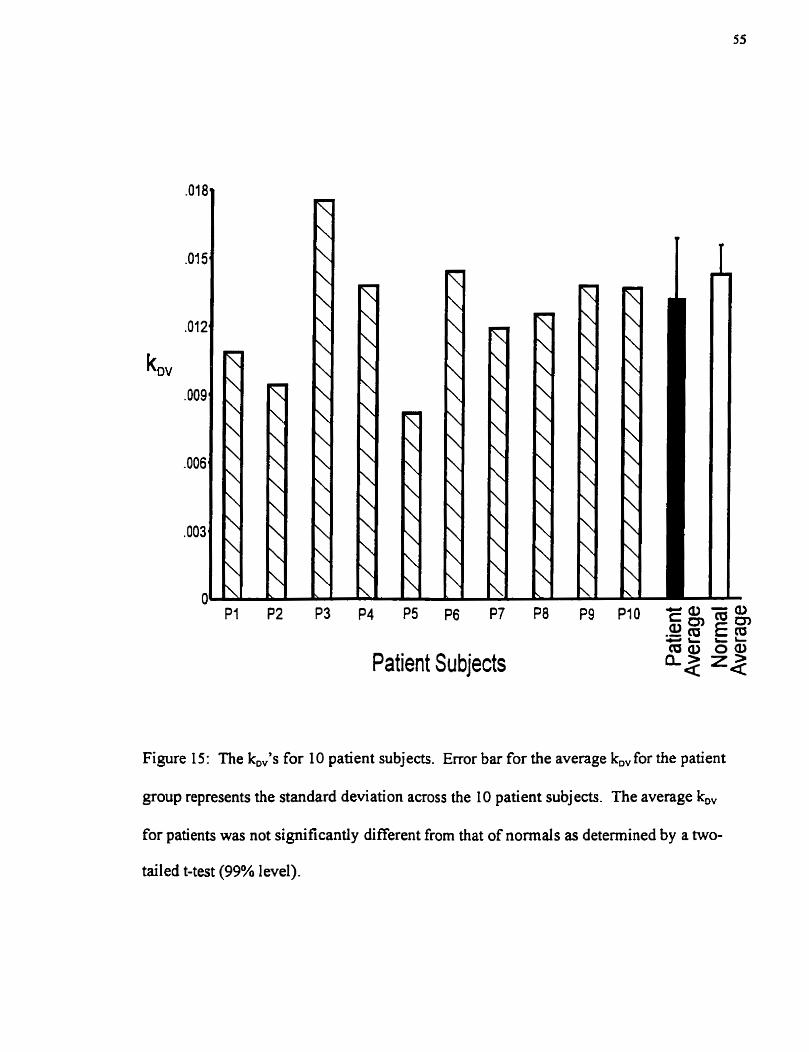
elevation-dependent disparity, which increased with convergence. Figure 15 shows a
plot of kDv for 10 patients tested under the same conditions as the normals in this study.
The kov on average was 0.013 deg-' f 0.003 deg" (one SD), a value slightly smaller than,
but not significantly different fiom that of the normals (two-tailed, t-test, P < 0.0 1).
However, the range of values obtained was greater; for norrnals the range was 0.013 to
0.0 17 while values for patients ranged from 0.008 to 0.018 (SD normals = 0.001 and SD
patients = 0.003). While the maximum kov was comparable to that of the normals, the
minimum was below that of the normals. A more detailed description of the interpatient
variability is given in the strabismic ocular deviation section.
There was no difference b e ~ e e n normals and patients in their mean k~ values or
in their kv's. The mean k values, in contras& were significantly more positive for patients
(k normal = -0.46 + 0.57, k patient = 0.39 + 1.39). The standard deviation of the k's was
larger in patients (Table 2).
P7
Patient Subjects
Figure 15: The kD/s for 10 patient subjects. Error bar for the average kDv for the patient
group represents the standard deviation across the 10 patient subjects. The average kDv
for patients was not significantly different from that of norrnals as determined by a two-
tailed t-test (99% level).
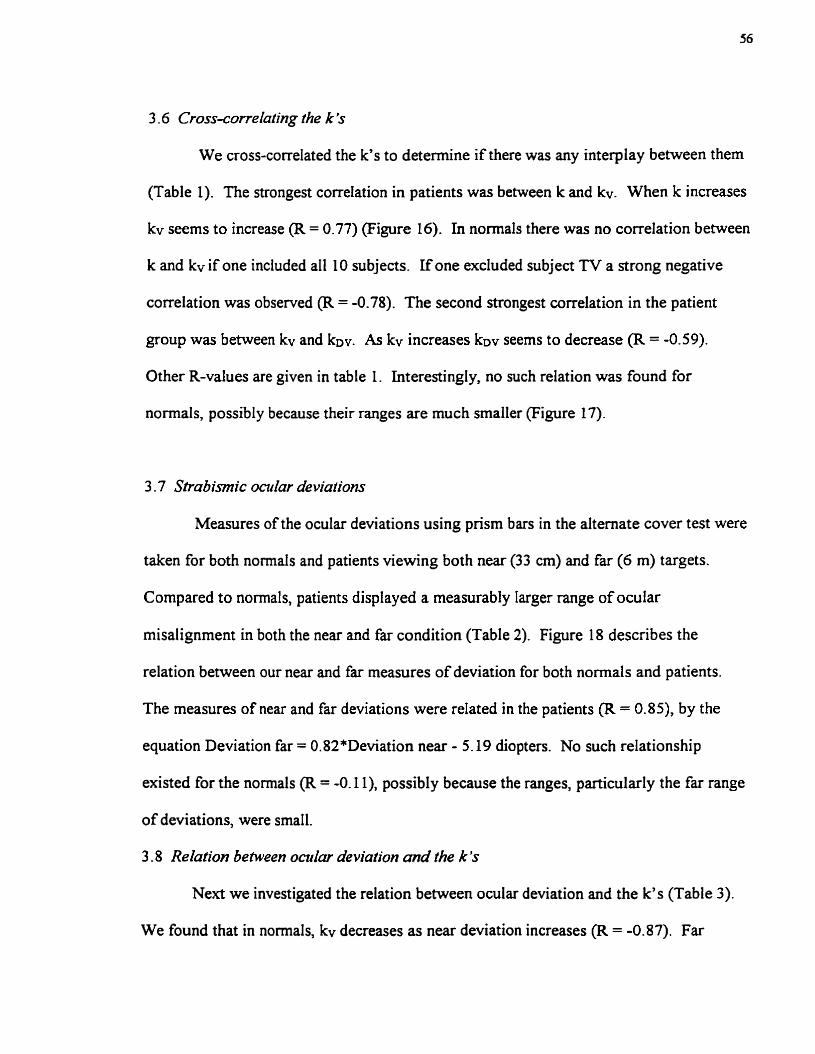
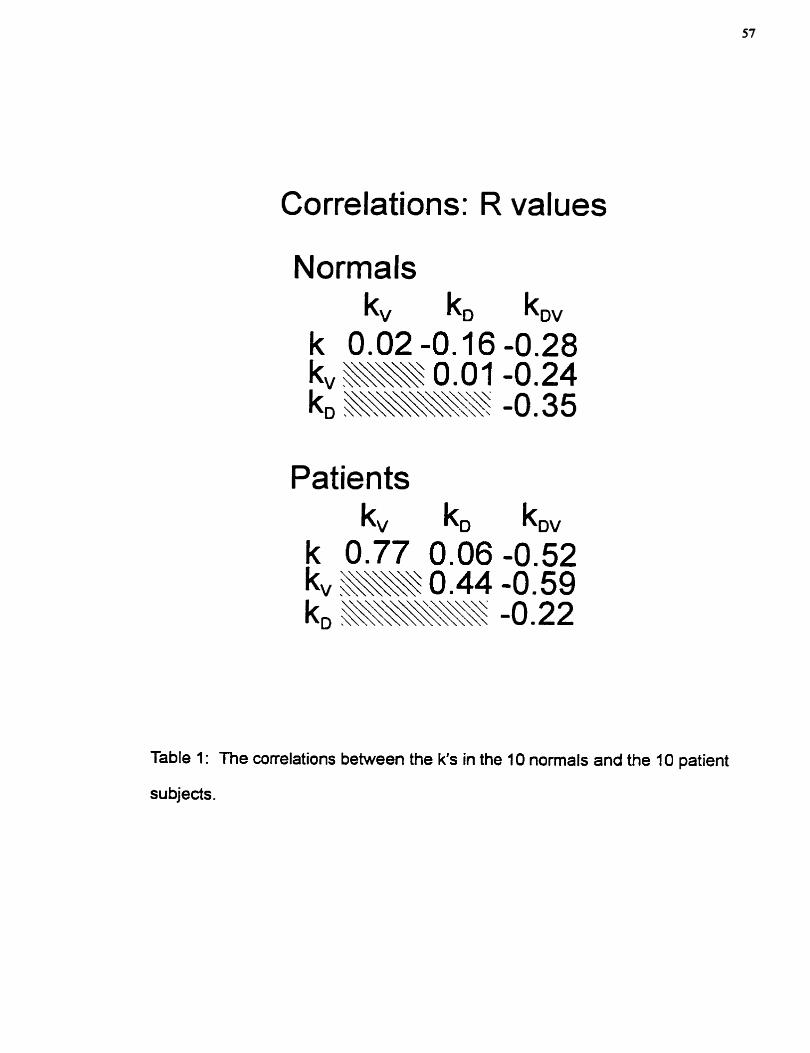
3 .6 Cross-correlalNg the k 's
We cross-correlated the k's to determine if there was any interplay between them
(Table 1). The strongest correlation in patients was between k and kv. When k increases
k~ seems to increase (Ft = 0.77) (Figure 16). In normals there was no correlation between
k and k~ if one included al1 10 subjects. If one excluded subject TV a strong negative
correlation was observed (R = -0.78). The second strongest correlation in the patient
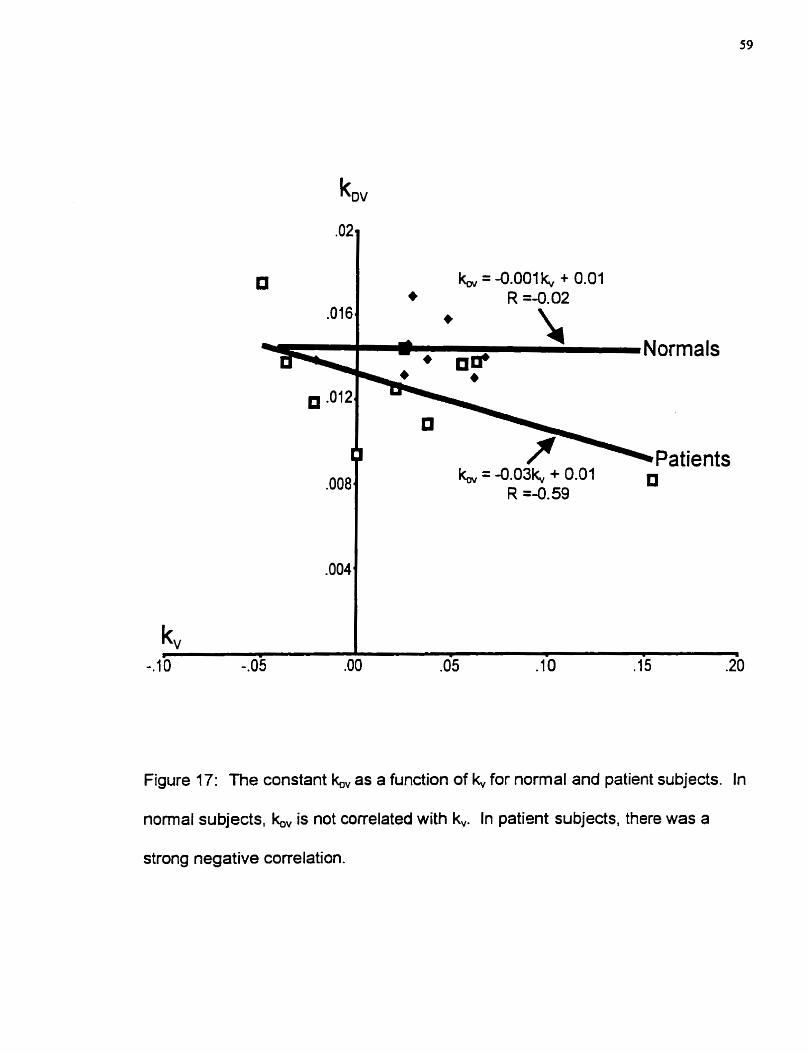
group was between kv and kDv. As kv increases k ~ v seems to decrease (R = -0.59).
Other R-values are given in table 1. Interestingly, no such relation was found for
normals, possibly because their ranges are much smaller (Figure 17).
3 .7 Strabismic ocular devialions
Measures of the ocular deviations using prism bars in the alternate cover test were
taken for both normals and patients viewing both near (33 cm) and far (6 m) targets.
Compared to normals, patients displayed a measurably larger range of ocular
misalignment in both the near and far condition (Table 2). Figure 18 describes the
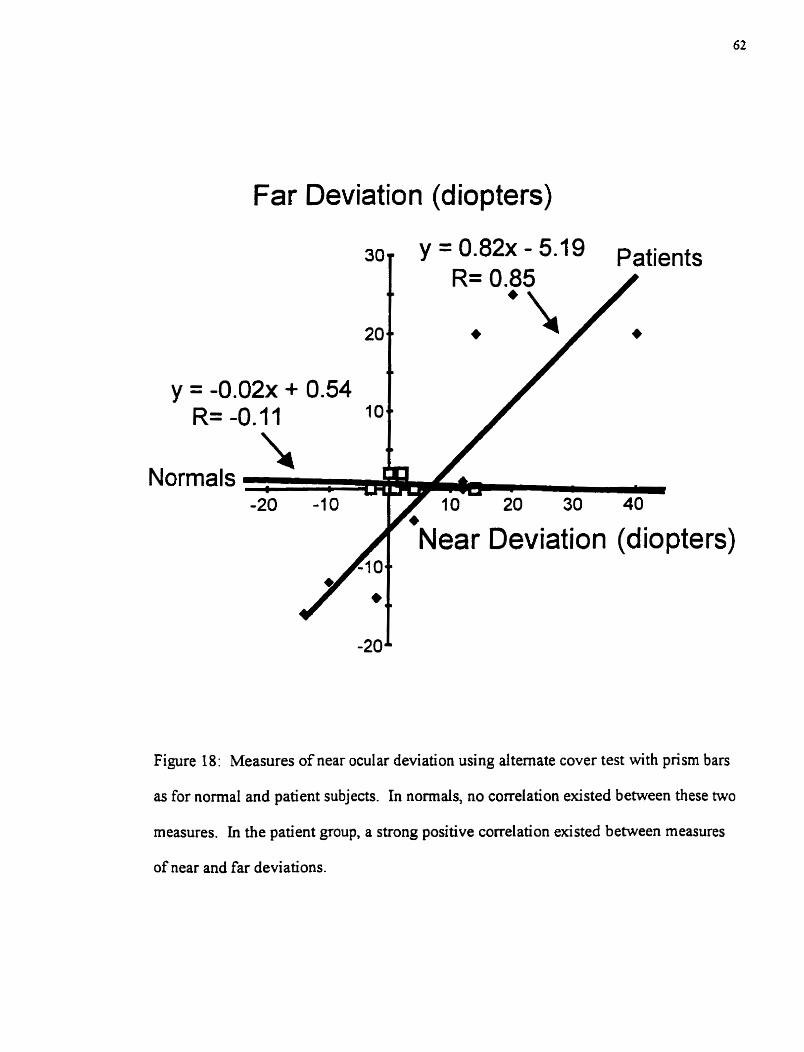
relation between Our near and far rneasures of deviation for both normals and patients.
The measures of near and far deviations were related in the patients (R = 0.85), by the
equation Deviation far = 0.82*Deviation near - 5.19 diopters. No such relationship
existed for the normals (JX = -0.1 1), possibly because the ranges, pmicularly the far range
of deviations, were small.
3.8 Relation between ocular deviation and the k 's
Next we investigated the relation between ocular deviation and the k's (Table 3).
We found that in normals, kv decreases as near deviation increases (R = -0.87). Far
Correlations: R values
Patients kv kD- k D V
k 0.77 0.06 -0.52 kv &\\\\A 0.44 -0.59 k, L\\\\\\F -0.22
Table 1 : The correlations between the k's in the 10 nonnals and the 10 patient
su bjects.
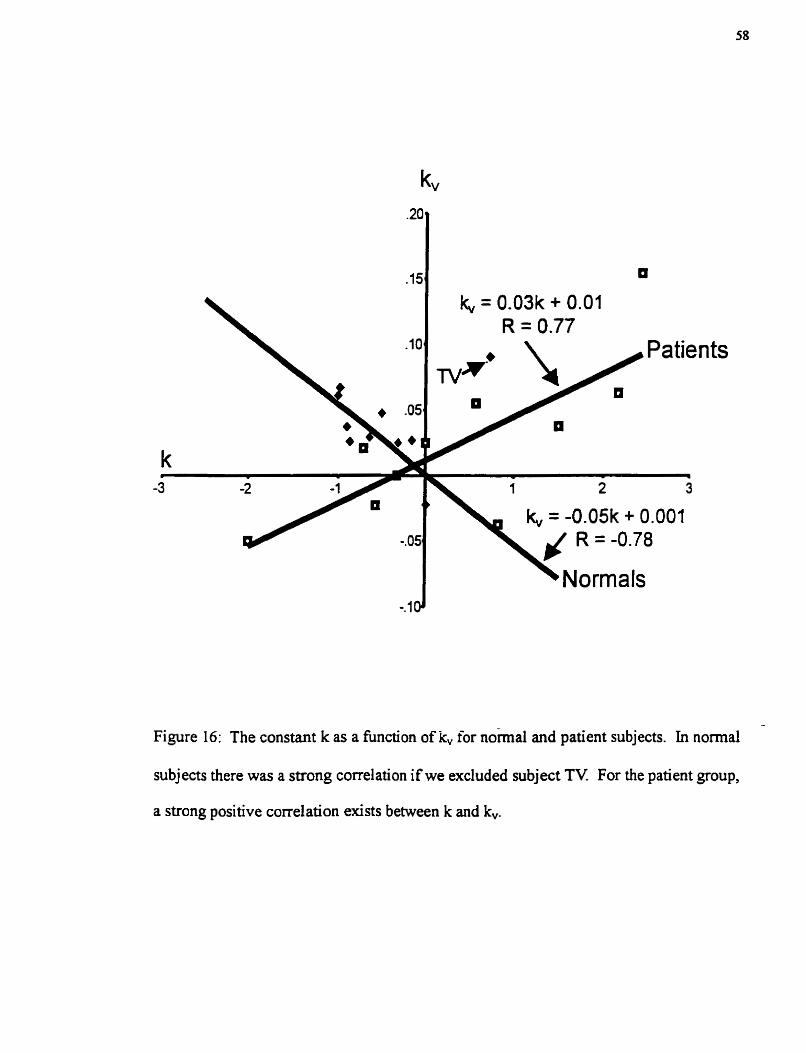
k,, = 0.03k + 0.01 R = 0.77
Patients
Figure 16: The constant k as a function of k, for no-mal and patient subjects. In normal
subjects there was a strong correlation if we excluded subject TV For the patient group,
a strong positive correlation exists between k and k,,.
4 Normals a d
Figure 17: The constant 16, as a function of k,, for normal and patient subjects. In
normal subjects, k, is not correlated with k,. In pationt subjects, there was a
strong negative correlation.
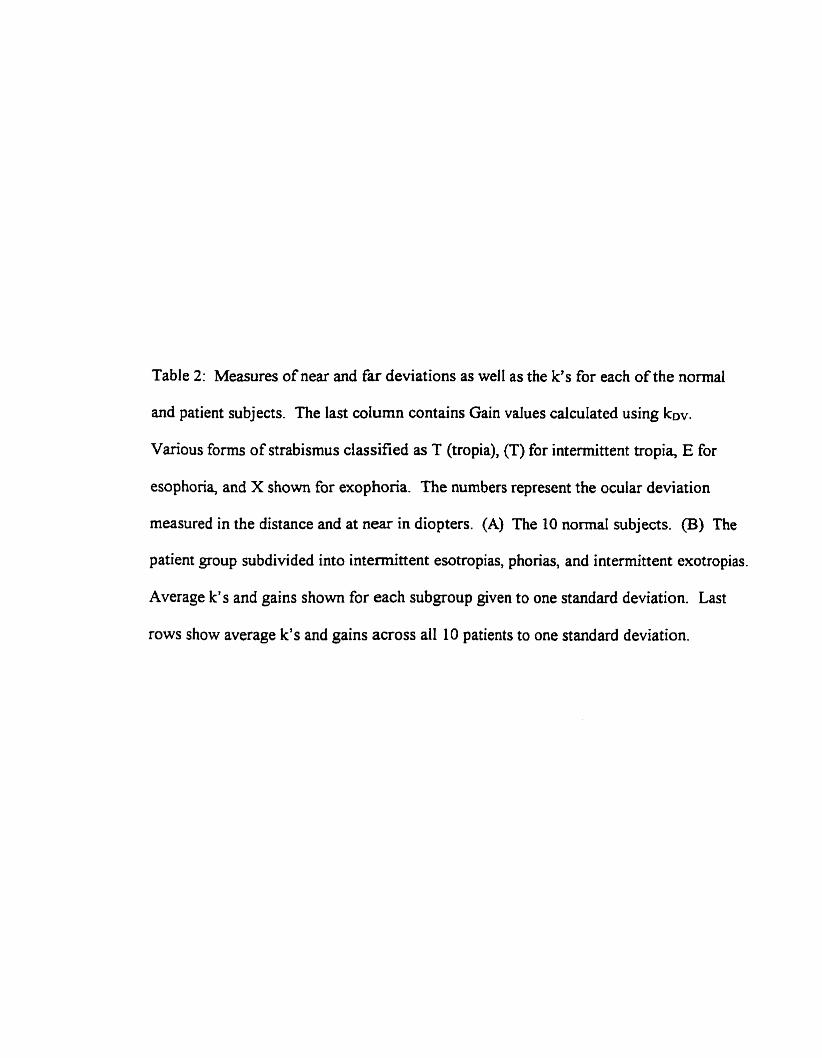
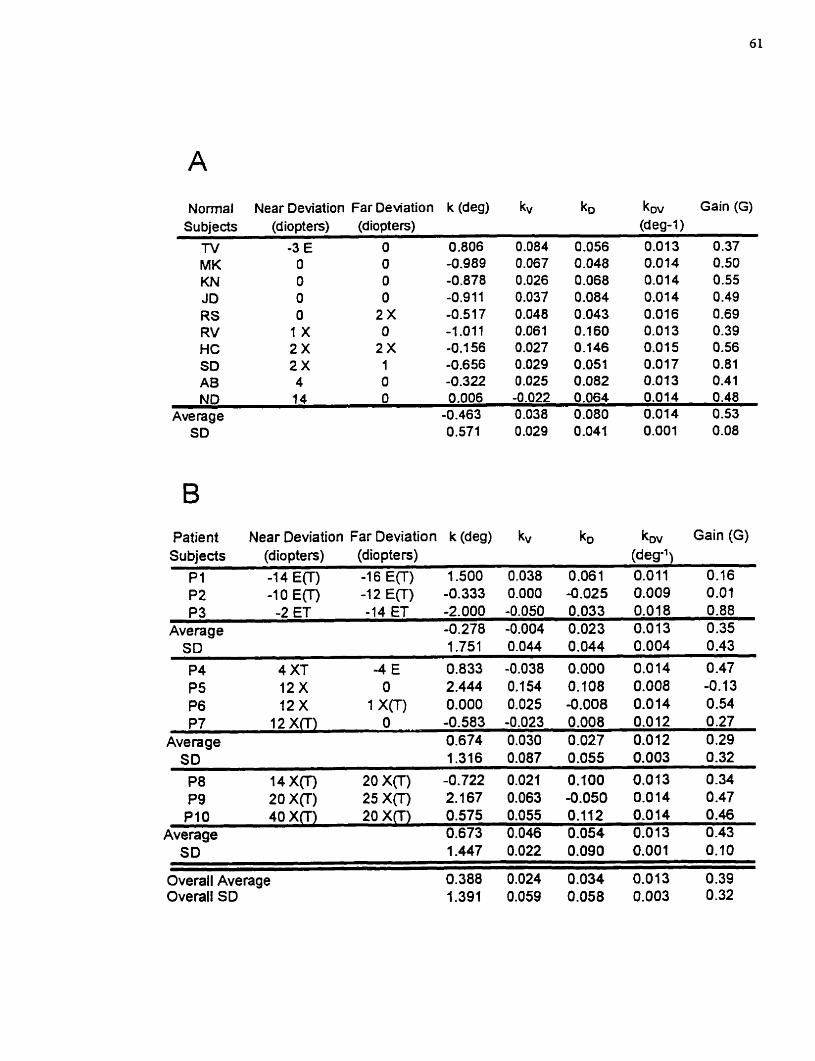
Table 2: Measures of near and far deviations as well as the k's for each of the normal
and patient subjects. The last column contains Gain values calculated using k~v.
Various forms of strabismus classified as T (tropia), (T) for intermittent tropia, E for
esophoria, and X shown for exophoria. The numbers represent the ocular deviation
measured in the distance and at near in diopters. (A) The 10 normal subjects. (B) The
patient group subdivided into intermittent esotropias, phonas, and intermittent exotropias.
Average k's and gains shown for each subgroup given to one standard deviation. Last
rows show average k's and gains across al1 10 patients to one standard deviation.
Normal Near Deviation Far Deviation k (deg) kv ko Su bjects (diopters) (dioptes)
TV -3 E O 0.806 0.084 0.056
Gain (G)
(deg-1) 0.01 3 0.37 0.014 0.50 0.014 0.55 0.01 4 0.49 0.016 0.69 0.01 3 0.39 0.01 5 0.56 0.01 7 0.81 0.013 0.41
ND 14 O 0.006 -0.022 0.064 0.014 0.48 Average -0.463 0.038 0.080 0.014 0.53
Patient Near Deviation Far Deviation k (deg) kv ko kW Gain (G) Su bjeçts (diopters) (diopters) (deg-')
P l - A 4 E(T) -16 E(T) 1.500 0.038 0.061 0.011 0.16 PZ -10 E(T) -12 E(T) -0.333 0.000 -0.025 0.009 0.01 P3 -2 ET - -14 ET- -2.000 -0.050 0.033 0.018 0.88
Average -0.278 -0.004 0.023 0.013 0.35
- -
P7 12 Xfl) O -0.583 -0.023 0.008 0.012 0.27 Average 0.674 0.030 0.027 0.012 0 -29
P l 0 40 X(T) 20 X(T) 0.575 0.055 0.112 0.014 O .46 Average 0.673 0.046 0.054 0.013 0.43
--
Overall Averaue 0.388 0.024 0.034 0.013 0.39 - Overall SD f .391 0.059 0.058 0.003 0.32
Normals
Far Deviation (diopters)
Figure 18: Measures of near ocular deviation using altemate cover test with prisrn ban
as for normal and patient subjects. In nonnals, no correlation existed between these two
measures. In the patient group, a strong positive correlation existed between measures
of near and far deviations.
deviation seems to increase when kov increases = 0.66). In contrast, our group of 10
patients showed no clear relation between the ocular deviations and the k's. As seen in
Table 3, ail R-values in the patient group were less than or equal to 0.36. If the two
patients with manifest tropias, P3 and P4, were excluded, a strong correlation between
deviation and kDv was observed. Excluding the same two patients we found that kDv
increases as near deviation increases (R = 0.56) and that kov also increases when far
deviation increases (R = 0.61). Also, if the patients are subdivided into 3 groups
intermittent esotropias, phorias, and intermittent exotropias there seems to be a tendency
of the intermittent exotropic patients to have a larger k and more positive kv than the
intermittent esotropic group (Table 2).
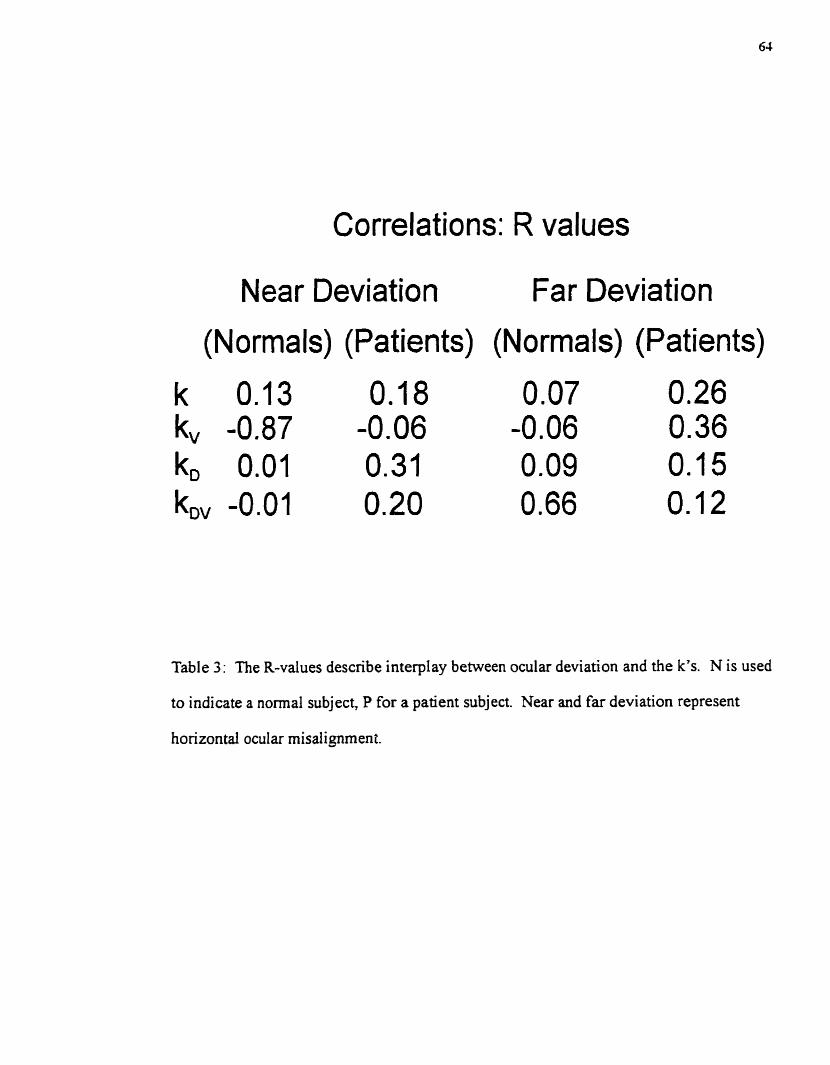
Correlations: R values
Near Deviation
(Normals) (Patients)
Far Deviation
(Normals) (Patients)
Table 3: The R-values descnbe interplay between ocular deviation and the k's. N is used
to indicate a normal subject, P for a patient subject. Near and far deviation represent
horizontal ocular rnisaiignment.
DISCUSSION
3 .9 Discussion
3.9.1 How do the k 's in eqn. 1 influence the rotation of Listing 's plane?
We fitted torsional disparity Tdirp as the sum of four components: a constant
component k, a cornponent kt. that depends only on elevation, one that depends only on
the degree of vergence kD, and one that depends on both elevation and vergence k ~ v .
Each of these components expresses some difference in the orientations of the Listing's
planes in the two eyes.
The first term in equation 17, k, is determined by the torsional disparity that exists
when elevation and vergence are both zero. From equation 17 it can be seen that when
V = O and D = O, TdisP= k. A zero k value means that the torsional disparity of the two
eyes is zero, i.e. the two eyes are aligned torsionally. A positive k means that the image
of the red line viewed by the nght eye was rotated CW relative to the lefi eye (Figure
19A). What does this mean in terms of Listing's plane? If the red line seen by the nght
eye had to be tumed CW in order to align it with the green line, then the nght eye must
have been rotated in the same CW direction (Figure 19B). Therefore, a positive k, means
that the Listing's plane of the nght eye is shifted fornard in the CW direction relative to
that of the left eye (Figure 19C).
The main difference between the normal subjects and the patients was the larger
variability in the k's and thus the relative shift of the Listing's planes in the two eyes.
The mean k for patients, 0.39 deg, was significantly more positive than that of the
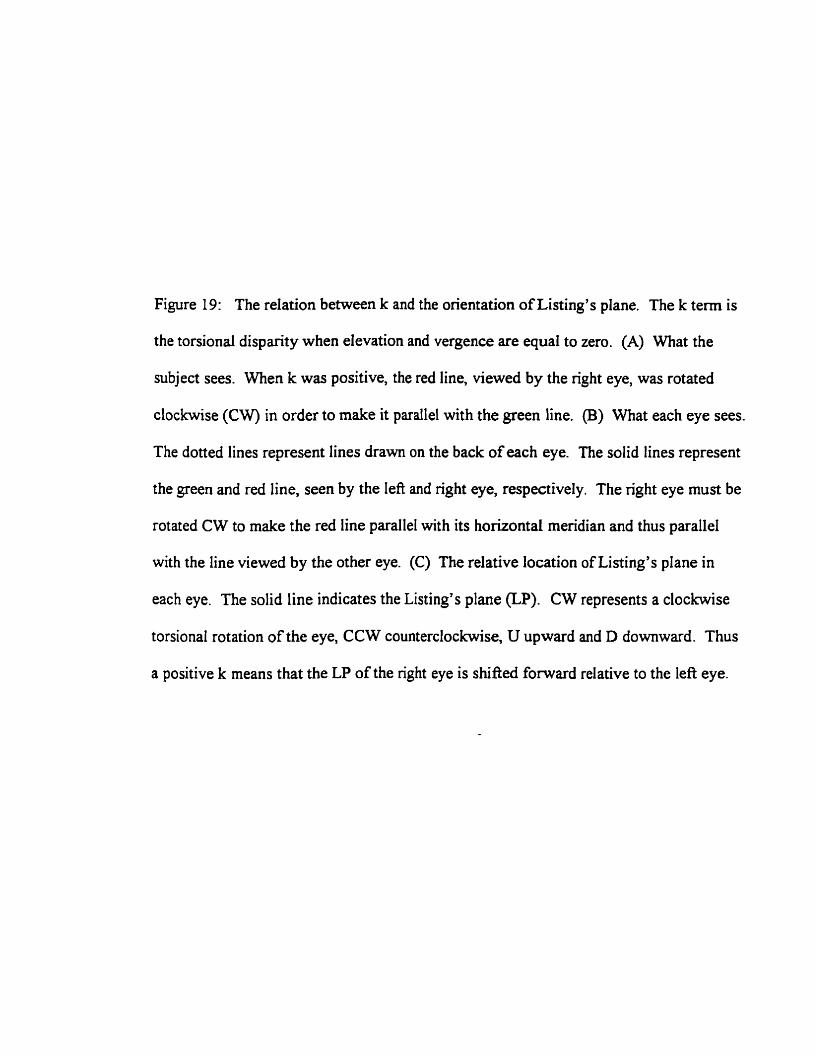
Figure 19: The relation between k and the orientation of listing's plane. The k term is
the torsional disparity when elevation and vergence are equal to zero. (A) What the
subject sees. When k was positive, the red line, viewed by the nght eye, was rotated
clockwise (CW) in order to make it parallel with the green line. (B) What each eye sees.
The dotted lines represent lines drawn on the back of each eye. The solid lines represent
the green and red line, seen by the Ieft and right eye, respectively. The nght eye must be
rotated CW to make the red line parallel with its horizontal meridian and thus paralle1
with the line viewed by the other eye. (C) The relative location of Listing's plane in
each eye. The solid line indicates the Listing's plane (LI?). CW represents a clockwise
torsional rotation of the eye, CCW counterclockwise, U upward and D downward. Thus
a positive k means that the LP of the nght eye is shifted forward relative to the lefl eye.
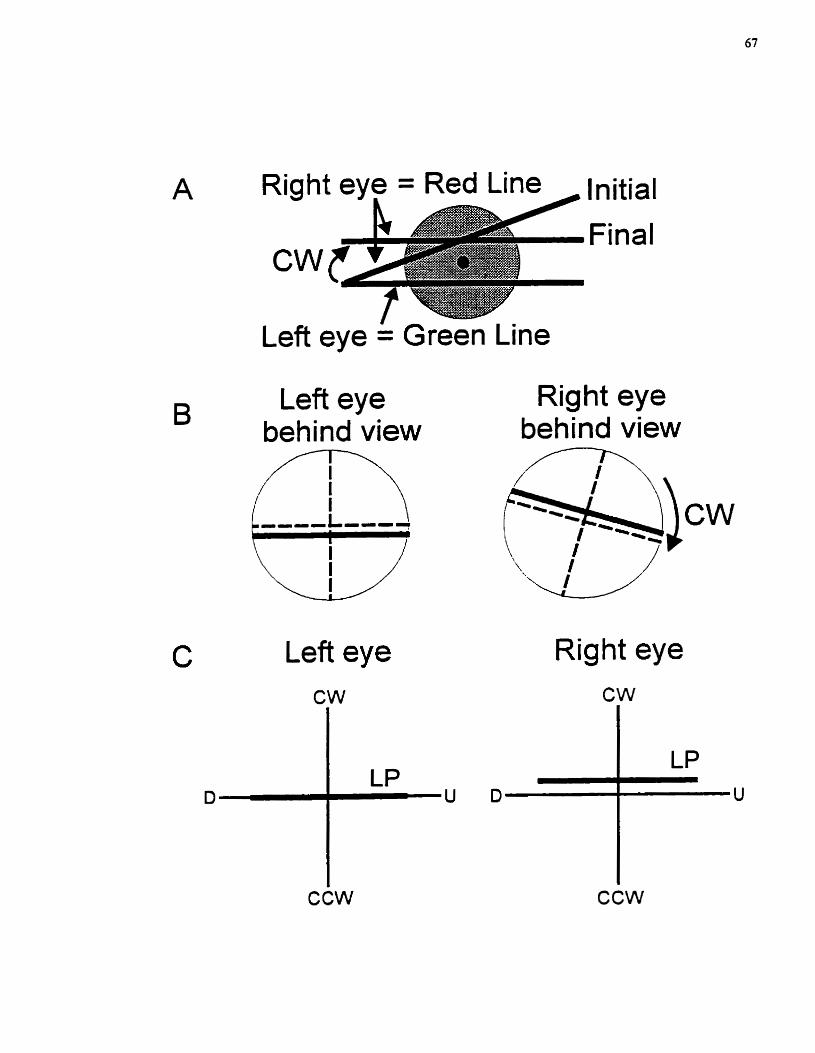
Left eye Green Line
Left eye behind view
Left eye
Right eye behind view
Right eye
ccw ccw
normals, -0.46 deg. There was no clear correlation between the measured ocular
deviations and k if al1 10 patients were included. However, 2 of the 3 patients in the
intermittent exotropic group had positive k's while 2 of the 3 patients in the intermitrent
esotropic group showed negative k's.
The next te- kv descnbes the elevation-dependent disparity at zero vergence.
This is related to the initial nasaVtempora1 orientation of the Listing's planes of the two
eyes when the target is viewed in the distance. A positive kv indicates a temporal
rotation of the planes, whereas a negative kv indicates a nasal rotation. One can prove
this to oneself by picturing what the eyes are doing. Let us consider what happens when
the planes are rotated temporally. In that case, when both eyes are looking up, the nght
eye is rotated CCW direction and the left eye is rotated CW, which means that torsional
disparity will be negative on up gaze. When the eyes look down, torsional disparity is
positive. Given that down is the positive direction for vertical eye position V, this means
that the disparity increases as V increases - Le. kv is positive when the planes rotate
temporally. The fact that Our normal subjects had positive kv's on average shows that
their Listing's planes were rotated temporally in the absence of any vergence. Similarly,
patients on average, and in the intermittent exotropic group in particular, showed an
initial temporal rotation of their Listing's planes.
The third term, ko, describes the change in torsional disparity that occurs when
vergence changes while the eyes are at zero elevation. This would occur if the Listing's
planes in the two eyes were pitched relative to each other. As described in the results
there did not appear to be any clear difference between the k ~ ' s of normals and patients.
The term kov represents how disparity changes as a function of the produa of
elevation and vergence. This corresponds to how much more the Listing's planes rotate
during convergence. As with the kv term, a positive k ~ v also represents a temporal
rotation of Listing's plane, but in this case rotation that increases with the vergence angie.
In both nomals and patients, the k ~ v values were positive, implying that their Listing's
planes rotated temporally during convergence. The mean kov values of patients and
normals were not different but the patients' values had a larger range.
3.9.2 Interactions between k, kK kD, and kDv
We found that patients with large k values tended to have large kv's (Figure 6).
This suggested that the amount the Listing's planes shifted were positively related to how
much they were turned temporally when viewing a target in the distance. That is,
subjects who showed a large shift CW in their Listing's planes at zero vergence,
demonstrated a larger rotation of their planes at zero vergence. This relationship was true
for patients, but not for normals, possibly because in the nonnals, k is less variable.
We also found that patients with large kv values tended to have small ko$s. This
rneant that a subject who showed a large initial temporal rotation of Listing's planes in
the distance exhibited a smaller increase in the rotation of the planes during convergence.
In normals, no such influences on the orientation of Listing's plane were discovered,
again possibly because their kv's and k&s were less variable.
In our previous studies (Somani et al., 1997; Mikhael er al., 1995; Mok et al.,
1992) the arnount of rotation of Listing's plane was quantified using a gain factor, G. To
determine G we used the equation G = 1 .87kvo * 1 8 O h - 1 (denved in Appendix). Table
2 shows the calculated gain values for each subject when horizontal lines were presented.
The average kDv for horizontal lines was 0.014 deg-' 0.001 deg-' and converts to a G of
(0.014*180/x) - 1 = 0.50 * 0.16 (SD across 10 nomals). Note that kDv is multiplied to
convert it from degeL to rad-': k ~ v * l80/x. Sirnilarly, when venical Iines were presented,
kDv averaged 0.0 15 0.003, giving a G of 0.6 1 * 0.3 2. These two values agree well with
Our previous measures of G, landing within the range of 0.49 to 0.9 1 (Somani et al.,
1997; Mikhael et al., 1995; Mok et al., 1992). This suggests that the synoptophore is a
suitable tool for measuring the relative orientation of the Listing's planes in two eyes.
For patients, the average kDv of 0.0 13 * 0.003 converted to a G of 0.39 * 0.32.
As discussed by Tweed (1997), the ideal G for rninimizing tonional disparity is 1.
The ideal G for minimizing the position-related effort of the muscles is zero. The
normals and the patients seem to compromise between the two by selecting an
intermediate value of G. In patients, kv and k ~ v were inversely correlated. A small kov
corresponds to a srnall G. Thus if a subject exhibited a large initial temporal rotation of
Listing's plane when viewing far targets, this would translate to a small G: a smaller
increase in the temporal rotation with increased vergence.
3.9.3 Dues sirabismus influence the rotation of Listing 's plane?
Van den Berg et ai. (1 995) reported that subjects who have an exo-deviation
exhibited an elevation-dependent cyclovergence even when fixating distant targets. This
suggests, that in these subjects, the Listing's planes of the two eyes are not paralle1 but
are rotated temporally, even at a vergence angle of zero. Van den Berg et al. (1995) have
suggested that this occurs because when convergence is used to align the diverging eyes
of these patients, the Listing's planes tum in the temporal direction. Thus the orientations
of the Listing's planes in these patients when viewing far targets is similar to those of
normals viewing near targets.
As in Van den Berg et al.3 snidy, two of the three patients in the exo-deviation
group showed a kv that indicated a larger temporal rotation of the Listing's planes than
that of normals at zero vergence. The average k~ for the intermittent exotropia group was
greater than that of the intermittent esotropia group. However there was a great deal of
variability, as is indicated by the lack of correlation between Our measures of ocular
deviation and the calculated kv's. This lack of correlation is somewhat surprising given
that this correlation is present in the nonnals. It suggests that other factors besides
vergence may be affecting the Listing's planes of these patients. White we excluded
patients who had vertical ocular deviations of more than 2 diopters we did not exclude
subjeas on the basis of a torsional misalignment. Thus it is possible that some of our
patients also mffered fiom an undetected paresis of the oblique muscles.
In contrast to the kv's, the patients showed a k ~ v that indicated a similar increase
in the temporal rotation of Listing's plane during vergence as that of normals. The
average kDv's were similar between the exo- and the eso-deviations if we included al1 10
patients. However, if we excluded, P3 and P4, the two patients who had manifest tropias,
the average kov for the intermittent exotropic group was greater than that of the
intermittent esotropic group and a strong correlation becomes evident between our
measures of ocuiar deviation and the calculated kov's.
This study suggests that the synoptophore is a useful tool to explore these possibilities.
An underlying assumption in the present study is that Listing's plane is indeed flat.
Recent studies suggest that Listing's plane in normals has a slight curvature (DeSouza,
Nicolle & Vilis, 1997). Perhaps in patients this curvature is more pronounced. The
synoptophore cm in theory be used to estimate the difference in the curvature o f the
Listing's planes in the two eyes. The synoptophore has an advantage over the search coi1
technique in that it is non-invasive and thus applicable to a broader category of patients.
Our visual tests of binocular coordination confirm previous reports that the
Listing's planes of the two eyes rotate temporally when the eyes converge (Minken &
Van Gisbergen, 1994; Mikhael et al., 1995; Mok et al., 1992; Van Rijn & Van den Berg,
1993). The arnount of rotation, currently a point of controversy, was quantified here
using the parameter G. Our six independent visual rneasures of G clustered together, al1
landing in the range fiom 0.49 to 0.91, which means that the Listing's planes of the two
eyes each rotate through an angle about 0.49 to 0.91 tirnes as large as the disconjugate, or
vergence, angle. These values for G agree very well with previous measures by Mok et
ai., (1992) and MikhaeI et al., (1995), and almost as well with the findings ofMinken &
Van Gisbergen, (1994), but they clash with the value of 1.71 reported by Van Xjn & Van
den Berg, (1993).
A recent shidy by Bmno and Van den Berg (1997) suggests a likely resolution to
this discrepancy. The study confirms that when viewing distant targets most subjects
exhibit a temporal or exorotation of Listing's plane. Thus if one computes G by simply
measurhg the orientation of Listing's plane for a given value of vergence, one wouid
overestimate G because this assumes zero exorotation when vergence is zero. If on the
other hand G is based on the actual change in orientation, as was done here, values
comparable to those reported in this study, were found.
You can check your own G value by performing a home version of our no-prism
experiment. Converge your eyes on a near target, such as your fingertip, while directing
your attention to a distant horizontal line, such as the top or bottom edge of a window.
Make sure this edge is parallel with your interaural axis. Then the relative orientation of
the images of the edge in your right and lefi eyes wiIl reveal your pattern of ocular
torsion. If your right eye's image is clockwise of your lefi's when the window's edge is
below eye level, and counterclockwise when the edge is above eye level, then your your
G is < 1. If these orientations are reversed, your G is > 1.
Visual tests may be a useful clinical tool for measunng the relative orientations of
the two eyes' Listing's planes in patients. The usual technique, using search coils in large
contact lenses, is more versatile because it allows one to find the absolute orientation of
the planes, not just their relative positioning, but the large contact lenses are not well
tolerated by some patients. Visual tests may therefore find a role as a fast and completely
noninvasive way to assess binocular coordination in three dimensions.
This second study suggests that the synoptophore is a useful tool to explore these
possibilities. An underlying assumption in the present study is that Listing's plane is
indeed flat. Recent studies suggest that Listing's plane in normals has a slight curvature
(DeSouza et al., 1995). Perhaps in patients this curvature is more pronounced. The
synoptophore c m in theory be used to estimate the difference in the curvature of the
Listing's planes in the two eyes. The synoptophore has an advantage over the search coi1
technique in that it is non-invasive and thus applicable to a broader category of patients.
How can we use the torsional disparities measured with the synoptophore to
cornpute the rotations of Listing's planes? To relate Our computations to those in earlier
papers, we shall express eye positions in Helmholtz coordinates, as did Van Rijn & Van
den Berg (1993) and Somani et al. (1997). In these coordinates, the torsional angles of
the right and left eyes, TR and TL, are given by the following equations, denved in
Somani et al. (1997):
These equations express the binocular extension of Listing's law (Mok et al. 1992), i.e.
the fact that ocular torsion depends on the other wmponents of eye position: horizontal,
vertical and vergence. HI( and HL are the horizontal angles of the right and lefi eyes, and
V is the vertical angle of both eyes (when eye positions are expressed in Helmholtz
coordinates, then the vertical coordinates of the two eyes must be equal if the gaze lines
are to intersect at al1 - see Van Rijn & Van den Berg 1993). D is the disconjugate, or
vergence, angle, which is the difference between the horizontal angles of the right and
Ieft eyes (Figure 20A):
And finally, the G in Eq. Al is the parameter we are interested in. It is the constant that
determines how far the Listing's planes of the two eyes rotate temporally when the eyes
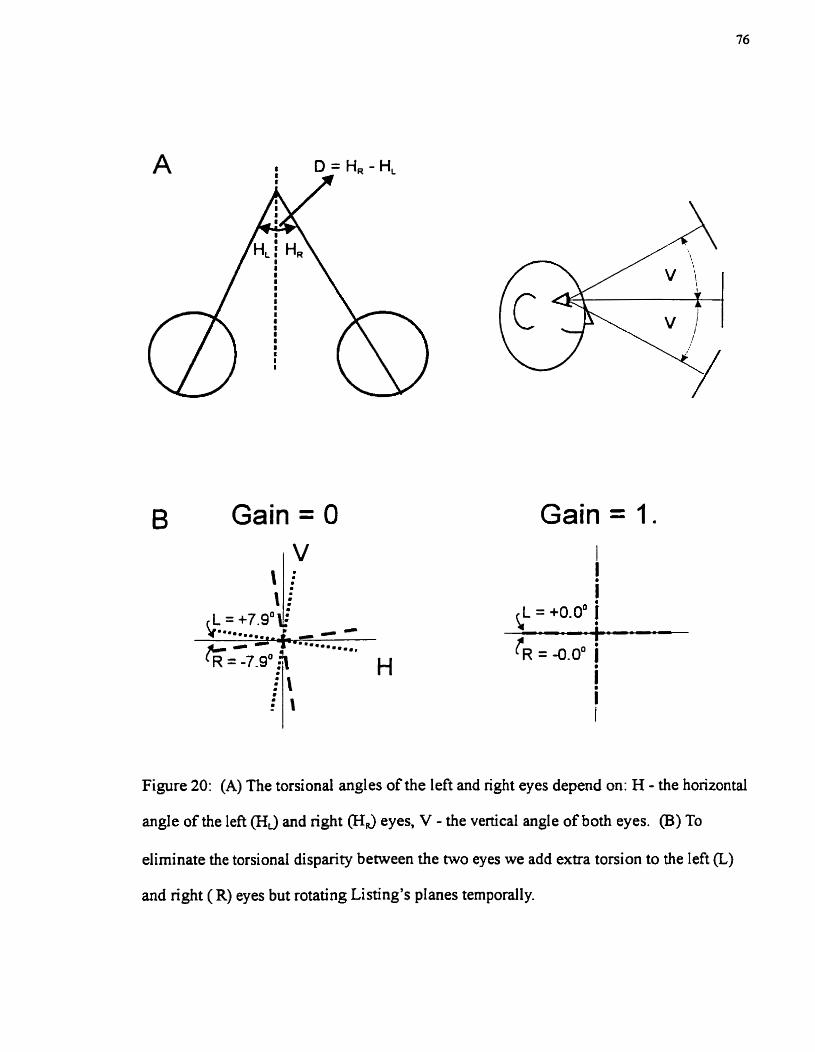
Gain = O Gain = 1.
Figure 20: (A) The torsional angles of the left and right eyes depend on: H - the horizontal
angle of the left (H3 and right (H3 eyes, V - the vertical angle of both eyes. (B) To
eliminate the torsional disparity between the two eyes we add extra torsion to the left (L)
and nght (R) eyes but rotating Listing's planes temporally.
converge (Figure 208): the larger G is, the farther the planes turn for any given angles D
and V. Our aim is to compute G given the torsional disparity seen through the
synoptop hore.
The Helmholtz angles used in Eqs. Al and A2 are likely the most efficient
coordinates for discussing binocular control in general, but unfortunately they are not the
best for describing the synoptophore. This device is built like two sets of Fick gimbals,
meaning that the targets seen by the two eyes are first rotated horizontally and then
vertically, whereas the Helmholtz coordinate system uses the reverse order: vertically
then horizontally. This means that with a synoptophore, the torsional disparity of the
images seen by the two eyes will equal the difference between the eyes' Fick-torsional
angles:
To get back to Helmholtz coordinates, we use the following conversion formula:
Le., the Fick-torsional angle of an eye is equal to its Helmholtz-torsional angle plus the
product of its Helmholtz-horizontal and Helmholtz-vertical angles, ail multiplied by 1.07.
This equation is only an approximation to the more complicated exact conversion
formula, but for the eye positions used in Our experiments it is accurate to within about
0.2', which is good enough for Our purposes.
Substituting Eq. A4 into A3 gives us a formula for the torsional disparity, Tdirp,
entirely in Helmholtz coordinat es:
Using Eq. A2, we c m simplify this to
To relate TdUp to G, the variable we want to cornpute, we substitute Eqs. Al into A6:
This can then be simplified, again using Eq. A.2, to give
For the next and final step, recall fiom Methods that we fitted the torsional
disparity, Thp, as a linear combination of four terms:
Now comparing Eqs. A8 and Ag, we see that the constants k, k~ and k~ in Eq. A9 should
al1 equal 0, and kDv should be given by
It follows that G can be obtained fiom kov by the equation:
There is a loose end to tidy up: we have seen in the Results that k, kv and kD are
not, in fact, always O, which means that Eq. A8 is not strictly correct. But this is not
really a problem for our analysis. In deriving Eq. A8 we started eom Eqs. Al, and these
earlier equations ignored the fact that ocular torsion can depend on factors besides DV,
the product of disconjugate and vertical position. For example, torsion can depend to
some extent on V or D done. Had we built these other dependencies into Eqs. Al, then
Eq. A8 would have had some more terms corresponding to k, kv and kD, but the
parameter G would not have appeared in any of those terms. So for Our purposes the extra
t e n s would merely have cluttered the derivation, and we would still have wound up with
Eq. Al l as our formula for G.
REFERENCES
Bruno, P. & Van den Berg, A. V. (1997). Relative orientation of primary positions of the
two eyes. Vision Research, 3 7, 93 5-947.
Carpenter, R. H. S. (1988). Movement of the eyes. Pion Limited, London, 102-107.
DeSowa, J. F. X, Nicolle, D. A. & Vilis, T. (1997). Task-dependent changes in the
shape and thickness of Listing's plane. Vision Research. 37, 2271-82.
Enright, J. T. (1980). Ocular translation and cyclotorsion due to changes in fixation
distance. Vision R e s e h , 20, 595-60 1.
Helmholy H. von (1 867) ffandbzich der Physiologischen Optik. ( ld edn, Vol. 3).
Hamburg: Voss. Third edition translated into English by I. P. C. Southall (1925) as
Treatise on physio2ogicaI optics. Rochester, New York: Optical Society of Amenca.
Lyle, T. K. & Wybar, K. C. (1 970). Pracfical orthoptics in the assessrnent of squint. H.
K. Lewis & Co. Limited, London, 621.
Melis, B. J. M., Cruysberg, J. R M. & Van Gisbergen, J. A M. (1997) Listing's piane
dependence on altemating fixation in strabismus patient. Vision Research, 37. 1355-
1366.
Mikhael, S., Nicolle, D. & Vilis, T. (1995). Rotation of Listing's plane by horizontal,
vertical and oblique prism-induced vergence. Vision Research, 35, 3243-3254.
Minken, A. W. H. & Van Gisbergen, J. A. M. (1994). A three-dimensional analysis of
vergence movements at various levels of elevation. Euperimental Braiii Research,
101, 33 1-345.
Minken, A. W. H., Gielen, C. C. & Van Gisbergen, J. A. M. (1995). An alternative three-
dimensional interpretation of Hering's law equal-innervation law for version and
vergence eye movements. Vision Research, 35, 93-1 02.
Mok, D., Ro, A., Cadera, W., Crawford, J. D. & Vilis, T. (1992). Rotation of Listing's
plane during vergence. Vision Research, 32, 205 5-2064.
Nakayama, K. (1983). Kinematics of normal and strabisrnic eyes. In Schor, C. M. &
Ciurneda, K. J. (Eds), Vergence eye movements: Basic and cZinicaZ aspects (p p. 543 -
564). Boston, Mass.: Buttemrths.
Ogle, K. N. (1952). Distortion of the image by ophthaimic prisms. Archives of
Ophlhalmology, 47, 12 1-13 1.
Ogle, K. N. (1950). BinomIar vision. Philadelphia: Saunders.
Somani, R. A. B., DeSoua, J. F. X., Tweed, D. & Vilis, T. (1997). Visual test of
Listing's Iaw dunng vergence. Vision Research, In press.
Tweed, D. (1997). Vxsual-motor optimization in binocular control. Vision Research, 37,
1939-51.
Tweed, D., Cadera, W. & Vilis, T. (1990). Computing three-dimensional eye position
quaternions and eye velocity from search coi1 signals. Vision Research, 30, 97- 1 10.
Tweed, D. & Vilis, T. (1990). Geornetrîc relations o f eye position and velocity vectors
during saccades. Vision Research, 3 0, 1 1 1- 127.
Van den Berg, A. V., Van Rijn, L. J. & De Faber, J. TJ. H. N. (1995). Excess
cyclovergence in patients with intermittent exotropia. Vision Research, 35, 3265-
32 78.
Van Rijn, L. J. & Van den Berg, A. V. (1993). Binocular eye orientation during fixations:
Listing's law extended to include eye vergence. Vision Research, 33, 69 1-708.
Vilis, T. (1994). Three-dimensional properties of saccadic eye movernents while reading.
In Ygge, I.& Lennerstrand, G. (Eds.), Eye rnovements in reading (pp. 189-203). New
York: Pergamon.
Copyright © 2022 FDOKUMEN