Exercise No. 1 Preparation of Saturated Paste and saturation ...
Upload
khangminh22Category
view
3download
0
THE EFFECTIVE APPROACH FOR PREDICTING VISCOSITY OF
SATURATED AND UNDERSATURATED RESERVOIR OIL
A Dissertation
by
SAWIN KULCHANYAVIVAT
Submitted to the Office of Graduate Studies of Texas A&M University
in partial fulfillment of the requirements for the degree of
DOCTOR OF PHILOSOPHY
December 2005
Major Subject: Petroleum Engineering
THE EFFECTIVE APPROACH FOR PREDICTING VISCOSITY OF
SATURATED AND UNDERSATURATED RESERVOIR OIL
A Dissertation
by
SAWIN KULCHANYAVIVAT
Submitted to the Office of Graduate Studies of Texas A&M University
in partial fulfillment of the requirements for the degree of
DOCTOR OF PHILOSOPHY
Approved by: Chair of Committee, William D. McCain , Jr. Committee Members, Peter P. Valkó Thomas A. Blasingame Charles J. Glover Head of Department, Steve A. Holditch
December 2005
Major Subject: Petroleum Engineering

iii
ABSTRACT
The Effective Approach for Predicting Viscosity of Saturated and Undersaturated
Reservoir Oil. (December 2005)
Sawin Kulchanyavivat, B.S., Mahidol University; M.S., Chulalongkorn University
Chair of Advisory Committee: Dr. William D. McCain, Jr.
Predicting reservoir oil viscosity with numerical correlation equations using
field-measured variables is widely used in the petroleum industry. Most published
correlation equations, however, have never profoundly realized the genuine relationship
between the reservoir oil viscosity and other field-measured parameters. Using the
proposed systematic strategy is an effective solution for achieving a high performance
correlation equation of reservoir oil viscosity.
The proposed strategy begins with creating a large database of pressure-volume-
temperature (PVT) reports and screening all possible erroneous data. The relationship
between the oil viscosity and other field-measured parameters is intensively analyzed by
using theoretical and empirical approaches to determine the influential parameters for
correlating reservoir oil viscosity equations. The alternating conditional expectation
(ACE) algorithm is applied for correlating saturated and undersaturated oil viscosity
equations. The precision of field-measured PVT data is inspected by a data
reconciliation technique in order to clarify the correctness of oil viscosity correlations.
Finally, the performance of the proposed oil viscosity correlation equations is
represented in terms of statistical error analysis functions.
The result of this study shows that reservoir oil density turns out to be the most
effective parameter for correlating both saturated and undersaturated reservoir oil
viscosity equations. Expected errors in laboratory-measured oil viscosity are the main
factors that degrade the efficiency of oil viscosity correlation equations. The proposed
correlation equations provide a reasonable estimate of reservoir oil viscosity; and their
superior performance is more reliable than that of published correlation equations at any
reservoir conditions.

iv
DEDICATION
All of my success in this research study is dedicated to my parents for their love
and support and to my family for their encouragement.

v
ACKNOWLEDGEMENTS
I would like to thank Dr. William D. McCain, Jr. for his advice and supervision
for the entire process.
I would like to thank Dr. Peter P. Valkó for introducing effective correlation
development and data reconciliation technique to this research study, and Dr. Thomas A.
Blasingame and Dr. Charles J. Glover for their interest in this research and suggestions
to improve the research quality.
Finally, I would like to thank Unocal Corporation for giving me a chance to learn
the tasks of reservoir engineer and to obtain practical experience in the petroleum
industry.

vi
TABLE OF CONTENTS
Page
ABSTRACT .............................................................................................................. iii
DEDICATION .......................................................................................................... iv
ACKNOWLEDGEMENTS ...................................................................................... v
TABLE OF CONTENTS .......................................................................................... vi
LIST OF FIGURES................................................................................................... viii
LIST OF TABLES .................................................................................................... xiii
CHAPTER
I INTRODUCTION.................................................................................... 1
II LITERATURE REVIEW ......................................................................... 5
The History of Reservoir Oil Viscosity Correlation Equations ........ 5 Reservoir Field Parameters Used in Viscosity Correlation Equations........................................................................................... 24 Summary ........................................................................................... 26
III OBJECTIVES .......................................................................................... 27
IV RESERVOIR FLUID PROPERTY DATABASE................................... 28
Preparing a PVT Database for Correlation Analysis ……….……. 28 Identifying Errors from a Typical Shape of Oil Viscosity ................ 29 Screening Data Sets for Multi-stage Separation ............................... 32 Checking Reliability of Solution Gas-Oil Ratio ............................... 33 Determining Reservoir Oil Density Information .............................. 33 Providing Tables of Fluid Properties Information ............................ 36
V DETERMINING EFFECTIVE PARAMETERS..................................... 37
Comparing Typical Shape of Oil Viscosity with Other Reservoir Parameters ...................................................... 38 Plotting Reservoir Oil Viscosity Against Field-measured Parameters ............................................................... 43 Summary ........................................................................................... 50
VI EVALUATING THE EFFICIENCY OF OIL VISCOSITY CORRELATION EQUATIONS FROM THE LITERATURE ............... 51
Statistical and Graphical Error Analysis Methods ............................ 51 Results of Performance Tests ............................................................ 52 Summary ........................................................................................... 55

vii
CHAPTER Page
VII CORRELATING VISCOSITY EQUATIONS FOR SATURATED RESERVOIR OIL ........................................................... 56
A Statistical Method for Correlating Oil Viscosity Equations.......... 56 An Alternating Conditional Expectations Technique ....................... 57 A Data Reconciliation Technique ..................................................... 59 A Forward Stepwise Procedure for Correlating Oil Viscosity Equations .......................................................................................... 60 Errors in Routine Laboratory Measurement of Oil Viscosity ........... 74
VIII CORRELATING VISCOSITY EQUATIONS FOR UNDERSATURATED RESERVOIR OIL ............................................. 78
The Effective Methodology for Correlating Undersaturated Oil Viscosity Equations........................................................................... 78 A Forward Stepwise Procedure for Correlating the Exponent.......... 79 Evaluation of Data Quality Using Data Reconciliation Technique .......................................................................................... 89
Testing the Proposed Undersaturated Oil Viscosity Correlation Equations........................................................................................... 91
IX TESTING THE PERFORMANCE OF THE RESERVOIR OIL VISCOSITY CORRELATION EQUATIONS........................................ 94
X CONCLUSIONS ...................................................................................... 107
NOMENCLATURE.................................................................................................. 109
REFERENCES.......................................................................................................... 112
APPENDIX A ........................................................................................................... 117
APPENDIX B ........................................................................................................... 136
APPENDIX C ........................................................................................................... 153
APPENDIX D ........................................................................................................... 156
APPENDIX E............................................................................................................ 170
VITA ……………………………………………………………………………….183
viii
LIST OF FIGURES
FIGURE Page
1 Typical shape of reservoir oil viscosity as a function of pressure at constant reservoir temperature. ................................................................. 30
2 Removed data sets due to inconsistent shape of oil viscosity. ...................... 31
3 Removed data points due to inconsistent shape of oil viscosity. .................. 31
4 Relationship between reservoir oil viscosity and reservoir temperature for saturated and undersaturated reservoir oil. .............................................. 38
5 Relationship between reservoir oil viscosity and stock-tank oil gravity for saturated and undersaturated reservoir oil. .............................................. 39
6 Relationship between reservoir oil viscosity and solution gas-oil ratio for saturated and undersaturated reservoir oil. .............................................. 40
7 Relationship between reservoir oil viscosity and reservoir pressure for saturated and undersaturated reservoir oil. .............................................. 41
8 Relationship between reservoir oil viscosity and reservoir oil density for saturated and undersaturated reservoir oil. .............................................. 42
9 Saturated oil viscosity data are plotted against reservoir temperature data. ............................................................................................................... 45
10 Saturated oil viscosity data are plotted against stock-tank oil gravity data. ............................................................................................................... 45
11 Saturated oil viscosity data are plotted against solution gas-oil ratio data. ............................................................................................................... 46
12 Saturated oil viscosity data are plotted against reservoir oil density data. ............................................................................................................... 46
13 Undersaturated oil viscosity data are plotted against reservoir pressure data. ............................................................................................................... 48
14 Undersaturated oil viscosity data are plotted against bubble point pressure data. ................................................................................................. 48
15 Undersaturated oil viscosity data are plotted against bubble point viscosity data. ................................................................................................ 49
16 Undersaturated oil viscosity data are plotted against reservoir oil density data.................................................................................................... 49

ix
FIGURE Page
17 Comparison of predicted oil viscosity as a function of reservoir oil density and laboratory-measured oil viscosity provides the SD value of 0.40. .......................................................................................... 64
18 Comparison of predicted oil viscosity as a function of stock-tank oil density and laboratory-measured oil viscosity provides the SD value of 0.57. .......................................................................................... 64
19 GRACE optimal transformation of reservoir oil density for saturated reservoir oil (bivariate case for µo and ρo). ................................................... 67
20 GRACE optimal transformation of reservoir oil viscosity for saturated reservoir oil (bivariate case for µo and ρo). ................................................... 67
21 Calculated and measured saturated oil viscosities are compared on Cartesian coordinates for bivariate case (µo and ρo)...................................... 69
22 Calculated and measured saturated oil viscosities are compared on logarithmic coordinates for bivariate case (µo and ρo). ................................ 69
23 GRACE optimal transformation of reservoir oil density for saturated reservoir oil (trivariate case for µo, ρo, and ρsto). .......................................... 70
24 GRACE optimal transformation of stock-tank oil density for saturated reservoir oil (trivariate case for µo, ρo, and ρsto). .......................................... 71
25 GRACE optimal transformation of reservoir oil viscosity for saturated reservoir oil (trivariate case for µo, ρo, and ρsto). .......................................... 71
26 Calculated and measured saturated oil viscosities are compared on Cartesian coordinates for trivariate case (µo, ρo, and ρsto). ........................... 73
27 Calculated and measured saturated oil viscosities are compared on logarithmic coordinates for trivariate case (µo, ρo, and ρsto). ........................ 73
28 Adjusted and laboratory-measured reservoir oil densities are compared for saturated reservoir oil. ............................................................................. 75
29 Adjusted and laboratory-measured reservoir oil viscosities are compared for saturated reservoir oil. ............................................................................. 76
30 GRACE optimal transformation of bubble point oil density for undersaturated reservoir oil (bivariate case for µo and ρo). ........................... 82
31 GRACE optimal transformation of the exponent for undersaturated reservoir oil (bivariate case for µo and ρo). .......................... 82
x
FIGURE Page
32 Calculated and measured undersaturated oil viscosity data are compared on Cartesian coordinates for bivariate case (µo and ρo)................................. 84
33 Calculated and measured undersaturated oil viscosity data are compared on logarithmic coordinates for bivariate case (µo and ρo). ........................... 84
34 GRACE optimal transformation of bubble point oil density for undersaturated reservoir oil (trivariate case for µo, ρo, and pb). .................... 85
35 GRACE optimal transformation of bubble point pressure for undersaturated reservoir oil (trivariate case for µo, ρo, and pb). .................... 86
36 GRACE optimal transformation of the exponent for undersaturated reservoir oil (trivariate case for µo, ρo, and pb). .................... 86
37 Calculated and measured undersaturated oil viscosity data are compared on Cartesian coordinates for trivariate case (µo, ρo, and pb). ........................ 88
38 Calculated and measured undersaturated oil viscosity data are compared on logarithmic coordinates for trivariate case (µo, ρo, and pb). ..................... 88
39 Adjusted and laboratory-measured bubble point oil density data are compared for undersaturated reservoir oil. ................................................... 90
40 Adjusted and original exponent data are compared for undersaturated reservoir oil. .................................................................................................. 90
41 Calculated undersaturated oil viscosity data using measured bubble point oil viscosity as an input are compared with measured values on Cartesian scales. ............................................................................................ 93
42 Calculated undersaturated oil viscosity data using measured bubble point oil viscosity as an input are compared with measured values on logarithmic scales. ........................................................................................ 93
43 The reliability of the saturated oil viscosity correlation (regarding ARE) across the range of stock-tank oil gravity. .................................................... 95
44 The reliability of the saturated oil viscosity correlation (regarding AARE) across the range of stock-tank oil gravity. .................................................... 95
45 The reliability of the saturated oil viscosity correlation (regarding ARE) across the range of reservoir temperature...................................................... 96
46 The reliability of the saturated oil viscosity correlation (regarding AARE) across the range of reservoir temperature...................................................... 96

xi
FIGURE Page
47 The reliability of the saturated oil viscosity correlation (regarding ARE) across the range of bubble point solution gas-oil ratio. ................................ 97
48 The reliability of the saturated oil viscosity correlation (regarding AARE) across the range of bubble point solution gas-oil ratio. ................................ 97
49 The reliability of the saturated oil viscosity correlation (regarding ARE) across the range of oil viscosity at the bubble point pressure (µb≤1cp). . ..... 98
50 The reliability of the saturated oil viscosity correlation (regarding AARE) across the range of oil viscosity at the bubble point pressure (µb≤1cp). ...... 98
51 The reliability of the saturated oil viscosity correlation (regarding ARE) across the range of oil viscosity at the bubble point pressure (1<µb≤10cp). 99
52 The reliability of the saturated oil viscosity correlation (regarding AARE) across the range of oil viscosity at the bubble point pressure (1<µb≤10cp). 99
53 The reliability of the saturated oil viscosity correlation (regarding ARE) across the range of oil viscosity at the bubble point pressure (µb>10cp). .... 100
54 The reliability of the saturated oil viscosity correlation (regarding AARE) across the range of oil viscosity at the bubble point pressure (µb>10cp). .... 100
55 The reliability of the undersaturated oil viscosity correlation (regarding ARE) across the range of stock-tank oil gravity. ........................ 101
56 The reliability of the undersaturated oil viscosity correlation (regarding AARE) across the range of stock-tank oil gravity. ..................... 101
57 The reliability of the undersaturated oil viscosity correlation (regarding ARE) across the range of reservoir temperature.......................... 102
58 The reliability of the undersaturated oil viscosity correlation (regarding AARE) across the range of reservoir temperature. ..................... 102
59 The reliability of the undersaturated oil viscosity correlation (regarding ARE) across the range of bubble point solution gas-oil ratio. .... 103
60 The reliability of the undersaturated oil viscosity correlation (regarding AARE) across the range of bubble point solution gas-oil ratio. . 103
61 The reliability of the undersaturated oil viscosity correlation (regarding ARE) across the range of oil viscosity at the bubble point pressure (µb≤1cp). ......................................................................................... 104
xii
FIGURE Page
62 The reliability of the undersaturated oil viscosity correlation (regarding AARE) across the range of oil viscosity at the bubble point pressure (µb≤1cp). ......................................................................................... 104
63 The reliability of the undersaturated oil viscosity correlation (regarding ARE) across the range of oil viscosity at the bubble point pressure (1<µb≤10cp). ................................................................................... 105
64 The reliability of the undersaturated oil viscosity correlation (regarding AARE) across the range of oil viscosity at the bubble point pressure (1<µb≤10cp). ................................................................................... 105
65 The reliability of the undersaturated oil viscosity correlation (regarding ARE) across the range of oil viscosity at the bubble point pressure (µb>10cp). ....................................................................................... 106
66 The reliability of the undersaturated oil viscosity correlation (regarding AARE) across the range of oil viscosity at the bubble point pressure (µb>10cp). ....................................................................................... 106

xiii
LIST OF TABLES
TABLE Page
1 Reservoir parameters in published dead oil viscosity correlation equations ........................................................................ 24
2 Reservoir parameters in published saturated oil viscosity correlation equations ......................................................................... 25
3 Reservoir parameters in published bubble point oil viscosity correlation equations ......................................................................... 25
4 Reservoir parameters in published undersaturated oil viscosity correlation equations ......................................................................... 26
5 Fluid properties information for saturated reservoir oil (183 PVT reports/1118 data points) .................................................. 36
6 Fluid properties information for undersaturated reservoir oil (183 PVT reports/1968 data points) .................................................. 36
7 A performance of published viscosity correlation equations for saturated reservoir oil using provided database........................... 53
8 A performance of published viscosity correlation equations for undersaturated reservoir oil using provided database.................. 53
9 Finding optimal correlation R2 of transformed variables for bivariate cases (saturated oil viscosity correlation) ..................... 62
10 Finding optimal correlation R2 of transformed variables for trivariate cases (saturated oil viscosity correlation)..................... 65
11 The quality of the data used for correlating the saturated oil viscosity equation is determined by using a data reconciliation technique............................................................. 74
12 Finding optimal correlation R2 of transformed variables for bivariate cases (undersaturated oil viscosity correlation)............ 80
13 Finding optimal correlation R2 of transformed variables for trivariate cases (undersaturated oil viscosity correlation) ........... 80
14 The quality of the data used for correlating an exponent, a, equation is determined by using a data reconciliation technique...... 89
15 A performance of undersaturated oil viscosity correlation using laboratory-measured bubble point oil viscosity (183 PVT reports/1968 data points) .................................................. 91

1
CHAPTER I
INTRODUCTION
Reservoir oil viscosity is one of the important reservoir fluid properties used for
many petroleum-engineering calculations such as evaluating hydrocarbon reserves,
planning enhanced oil recovery methods, calculating fluid flowrate through reservoir
rocks, etc. Therefore, achieving an accurate reservoir oil viscosity value is very crucial
for petroleum engineers. Nowadays, viscosity of reservoir oil can be obtained by a
laboratory PVT report and numerical correlation equations.
A PVT analysis report is the standard methodology for evaluating any fluid
properties, but time and cost of oil viscosity investigation are huge obstructions for this
method. Furthermore, the prior estimation of fluid properties is often required for
advanced equipment design and well exploration. Therefore, the concept of numerical
correlation equations has been proposed to the petroleum industry to alleviate all
difficulties in viscosity determination and to predict viscosity of reservoir oil when a
laboratory PVT report is not available. The advantages of this approach are not only to
expedite the whole calculation process, but also to provide the values of predicted oil
viscosity with high precision.
Several reservoir oil viscosity correlation equations have been widely used in the
petroleum industry during the past decades. Most of them can be seen in many
commercial types of software and can be used in reservoir simulation procedures.
Generally, these oil viscosity correlation equations can be classified into three main
categories based on reservoir conditions as follows:
____________ This dissertation follows the style of the JPT Journal.

2
• Undersaturated oil viscosity correlation equations,
• Saturated oil viscosity correlation equations, and
• Dead oil viscosity correlation equations.
Undersaturated oil viscosity is defined as the reservoir oil viscosity at a pressure
higher than the bubble point pressure at a given temperature. Saturated oil viscosity is
the reservoir oil viscosity at and below the bubble point pressure at a given temperature.
Dead oil viscosity is obtained when the pressure reaches the atmospheric pressure and no
dissolved gas is left in the reservoir oil at a given temperature.
Several numerical correlation equations for estimating reservoir oil viscosity
have been proposed in published literature since 1940. These published correlation
equations can be categorized into two types based on the information that is required in
computational methods. First, correlation equations based on material balance
calculation use compositional information. Second, correlation equations based on
empirical relationship require available field information to predict reservoir oil
viscosity. Compositional information of reservoir oil is available in any complete PVT
report, which always provides oil viscosity information. For this reason, viscosity
correlation equations that need compositional data are redundant and unprofitable.
Therefore, the purpose of this research is to concentrate on the correlation equations that
use all available field-measured information to estimate reservoir oil viscosity.
After reviewing these publications, several questions have come up– for
example, “What is the significance of reservoir parameters chosen for correlating
viscosity of reservoir oil?”, “Why do most publications propose the correlation equations
that can be used efficiently only at some specific reservoir conditions?”, and “Which of
these correlations provide the most reliability for oil viscosity evaluation?” These
questions are the motivation for this research, which aims to develop an effective
approach for predicting viscosity of saturated and undersaturated reservoir oil.
3
In order to clarify these obscure questions, this research involves selecting
influential parameters (to maximize the model accuracy) and developing simple
correlation equations for reservoir oil viscosity that can be used for any reservoir
conditions.
Chapter II reviews all available literature related to reservoir oil viscosity
correlation equations. All numerical correlation equations provided in these papers are
elaborately described in order to provide a background for this research.
Chapter III defines the objectives of this research and explains an effective
approach that can be used for correlating the viscosity equations of saturated and
undersaturated reservoir oil.
Chapter IV presents the overall information used to create a database that is used
in this research, including the systematic procedures for database creation, data quality
control processes, and tables of fluid properties for saturated and undersaturated
reservoir oil.
Chapter V describes the relationship between reservoir oil viscosity and other
parameters such as reservoir temperature, stock-tank oil gravity, solution gas-oil ratio,
reservoir pressure, and oil density. Parameters that show the strong relationship with
reservoir oil viscosity have a high potential to be used as influential parameters for
correlating oil viscosity equations.
Chapter VI indicates the performance of oil viscosity correlation equations from
various publications when they are applied to the database provided in this study. All
correlation equations provide the performance in terms of statistical error analysis
functions, average relative error (ARE) and absolute average relative error (AARE).
Then the discussion of the results will be provided at the end of this chapter.
Furthermore, graphical interpretations of calculated versus measured oil viscosities are
also available in the appendices.
Chapter VII and VIII explain assumptions and methodologies for correlating
saturated and undersaturated oil viscosity equations. A correlation analysis technique is
used to evaluate the optimal combination among influential parameters that predict the

4
most accurate reservoir oil viscosity. The quality of the data used to create oil viscosity
correlation equations is also detected by using a data reconciliation technique.
Chapter IX validates the overall performance of proposed correlation equations
at several reservoir conditions. The statistical error analysis results of the proposed and
published correlation equations for saturated and undersaturated reservoir oil viscosities
are compared and shown in graphical interpretations.
The conclusion of this study is summarized in Chapter X. Appendix A through
Appendix E provides more information related to the corresponding sections throughout
this dissertation.

5
CHAPTER II
LITERATURE REVIEW
The chronicle of oil viscosity correlation equations in the petroleum industry
started more than five decades ago. A large number of mathematical equations have
been introduced to predict viscosities of dead oil, saturated oil, and undersaturated oil by
using all available field measurement information, for example, stock-tank oil gravity,
solution gas-oil ratio, etc. Numerous published correlation equations are collected and
summarized in this chapter to describe a development history of reservoir oil viscosity
correlation equations and to represent the background of this research.
The History of Reservoir Oil Viscosity Correlation Equations
In 1946, Beal1 published a well-known paper containing graphical methods for
determining dead oil, saturated oil and undersaturated oil viscosities at high pressure and
temperature. The author built a database by collecting reservoir fluid information from
several oil fields in the United State. He mentioned that reservoir temperature, stock-
tank oil gravity, solution gas-oil ratio, and reservoir pressure are the important
parameters for correlating a viscosity of reservoir oil. Stock-tank oil gravity and
reservoir temperature are the most effective variables for correlating a dead oil viscosity.
No correlation equations are provided in this paper; but, later, the proposed graphical
interpretation is fitted to achieve a precise numerical equation for reservoir oil viscosity5.
In 1959, Chew and Connally2 proposed a correlation equation and a graphical
interpretation for saturated oil viscosity using 457 oil samples from the major producing
areas of the United State, the Canada, and the South America. The authors believed that
the relationship between saturated and dead oil viscosities, at constant solution gas-oil
ratio, can be represented as a straight line on logarithmic coordinates. The concept of
saturated oil viscosity correlation is described as follows:

6
Saturated oil viscosity correlation equation2
Bodo A µµ ⋅= ,…………..……...…………………………..……...………… (1)
Generally, coefficients A and B could be represented as a function of solution
gas-oil ratio. The adaptation of this concept has been widely used by several authors3, 4,
5, 11, 20, 23, 27, 29 to create their saturated oil viscosity correlation equations.
In 1972, Aziz, Govier, and Fogarasi3 modified the concept of Chew and
Connally2 to create a saturated oil viscosity correlation equation using 48 oil systems.
Saturated oil viscosity can be calculated as follows:
Saturated oil viscosity correlation equation3
)1057.0(43.0
)1080.0(20.000072.0
00081.0
S
S
R
R
Bodo
B
A
A
⋅−
⋅−
⋅+=
⋅+=
⋅= µµ
,……….………....………..……...…..……… (2)
In 1975, Beggs and Robinson4 used 600 oil systems, including 2,533 data points,
to correlate saturated and dead oil viscosity equations. The authors proposed a dead oil
viscosity correlation equation as a function of stock-tank oil gravity and reservoir
temperature and they applied the concept of Chew and Connally2 for correlating their
saturated oil viscosity equation. The Beggs and Robinson correlation equation for
saturated oil viscosity has become one of the most widely used correlation equations in
the petroleum industry because they predict reservoir oil viscosity with some accuracy
and cover a wide range of input information. Saturated and dead oil viscosities can be
calculated as follows:
Dead oil viscosity correlation equation4

7
163.102023.00324.310
110−⋅−=
−=
TC API
Codµ ,……………………………..…..………………. (3)
Saturated oil viscosity correlation equation4
338.0
515.0
)150(44.5
)100(715.10−
−
+⋅=
+⋅=
⋅=
S
S
Bodo
RB
RA
A µµ
,……………...……….……………...………... (4)
In 1977, Standing5 created correlation equations for predicting undersaturated
and dead oil viscosities by applying a curve fitting method to the Beal1 graphical
correlation. The author modified the concept of Chew and Connally2 correlation to
create a new saturated oil viscosity correlation equation. The Standing correlation
equations for predicting reservoir oil viscosities are interpreted as follows:
Dead oil viscosity correlation equation5
)33.843.0(
53.4
7
10
200360108.132.0
API
D
od
D
TAPI+
=
⎟⎠⎞
⎜⎝⎛
+⎟⎟⎠
⎞⎜⎜⎝
⎛ ⋅+=µ
,……..……..…..………….……….…… (5)
Saturated oil viscosity correlation equation5
( )
⎟⎠
⎞⎜⎝
⎛+⎟⎠
⎞⎜⎝
⎛+⎟⎠
⎞⎜⎝
⎛=
=
⋅=
⋅⋅⋅⋅⋅⋅
⋅⋅−⋅
−−−
−−
SSS
SS
RRR
RR
Bodo
B
A
A
335
47
1074.31010.11062.8
104.7102.2
10062.0
1025.0
1065.0
10
µµ
,……………………….….. (6)

8
Undersaturated oil viscosity correlation equation5
)038.0024.0)((001.0 56.06.1obobbobo pp µµµµ ⋅+⋅−+= ,……..……….……... (7)
In 1980, Vasquez and Beggs6 applied regression analysis techniques on more
than 600 laboratory PVT reports to create an undersaturated oil viscosity correlation
equation as a function of reservoir pressure, bubble point pressure, and bubble point oil
viscosity. The authors recommended the Beggs and Robinson saturated oil viscosity
correlation equation4 for calculating bubble point oil viscosity. Further the authors used
a large database to expand the range of input information in their correlation equation.
The Vasquez and Beggs correlation equation is shown as follows:
Undersaturated oil viscosity correlation equation6
( )ppE
pp
E
bobo
⋅⋅−−⋅=
⎟⎟⎠
⎞⎜⎜⎝
⎛=
−5187.1 1098.8513.11exp6.2
µµ,…...………………..……….. (8)
In 1980, Glaso7 used 26 oil samples from the North Sea to correlate a dead oil
viscosity equation. The author proposed the dead oil viscosity correlation equation in
terms of reservoir temperature and stock-tank oil gravity. The Glaso correlation
equation usually has the similar performance with the Beggs and Robinson correlation
equation4. The equation is indicated as follows:
Dead oil viscosity correlation equation7
447.36)log(313.10444.310 )(log10141.3 −⋅−
⋅⋅= Tod APITµ ,……..…...…….………... (9)

9
In 1983, Ng and Egbogah8 presented two correlation equations for predicting a
dead oil viscosity. For the first equation, the authors used nearly 400 laboratory PVT
reports to modify the Beggs and Robinson dead oil viscosity correlation equation4. For
the latter, the authors introduced a new parameter, which is a pour point temperature, in
their correlation equation; but this concept is not handy since a pour point temperature is
very difficult to measure and is not provided in a routine laboratory PVT report. The Ng
and Egbogah correlation equations are presented as follows:
(1) Dead oil viscosity correlation equation8
)log(5644.0025086.08653.1)1log(log TAPIod −⋅−=+⋅ µ ,…....………. (10)
(2) Dead oil viscosity correlation equation8
)T(TAPI).T..(API.T..)(µ
PP
Pod
−⋅+⋅+−+⋅+⋅−−=+⋅
log958195000332140294317523200879170709511loglog
,……..... (11)
In 1984, Sutton and Farshad9, 10 evaluated the performance of several published
oil viscosity correlation equations1, 2, 4, 6, 7 by testing with 31 different oil samples from
the Gulf of Mexico. The authors mentioned that the Glaso7, the Beggs and Robinson4,
and the Vasquez and Beggs6 correlation equations provide the best prediction for dead,
saturated, and undersaturated oil viscosities in the Gulf of Mexico. The test results are
provided in terms of statistical error analysis functions.
In 1987, Khan et al11, 12 created a set of oil viscosity correlation equations using
least square and regression analysis methods. Their equations were correlated using 75
oil samples from the Saudi Arabia. The authors tested the performance of their
correlation equations with that of published correlation equations1, 2, 4, 6, 7 in terms of
statistical functions. The results indicate that their correlation equations provide a good
estimation for the Saudi Arabia oil viscosity; but they require several input parameters
10
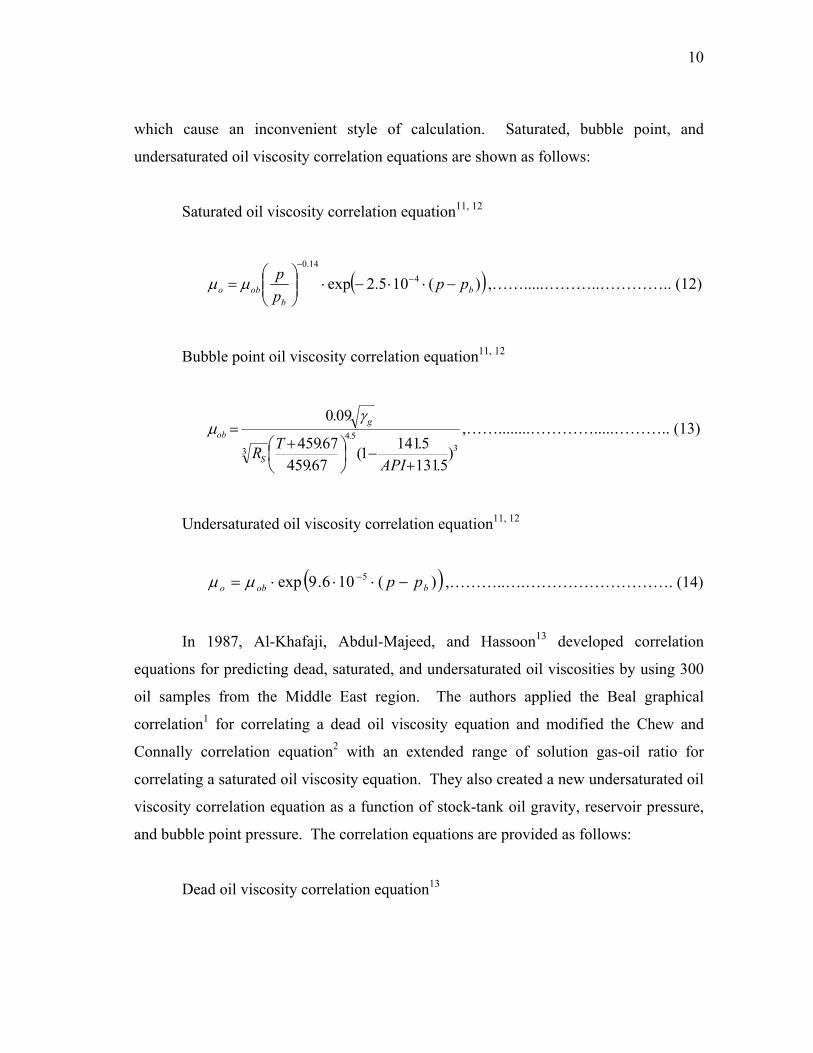
which cause an inconvenient style of calculation. Saturated, bubble point, and
undersaturated oil viscosity correlation equations are shown as follows:
Saturated oil viscosity correlation equation11, 12
( ))(105.2exp 414.0
bb
obo pppp
−⋅⋅−⋅⎟⎟⎠
⎞⎜⎜⎝
⎛= −
−
µµ ,…….....………..………….. (12)
Bubble point oil viscosity correlation equation11, 12
3
5.4
3 )5.131
5.1411(67.459
67.459
09.0
+−⎟
⎠⎞
⎜⎝⎛ +
=
APITRS
gob
γµ ,……........………….....……….. (13)
Undersaturated oil viscosity correlation equation11, 12
( ))(106.9exp 5bobo pp −⋅⋅⋅= −µµ ,………..….………………………. (14)
In 1987, Al-Khafaji, Abdul-Majeed, and Hassoon13 developed correlation
equations for predicting dead, saturated, and undersaturated oil viscosities by using 300
oil samples from the Middle East region. The authors applied the Beal graphical
correlation1 for correlating a dead oil viscosity equation and modified the Chew and
Connally correlation equation2 with an extended range of solution gas-oil ratio for
correlating a saturated oil viscosity equation. They also created a new undersaturated oil
viscosity correlation equation as a function of stock-tank oil gravity, reservoir pressure,
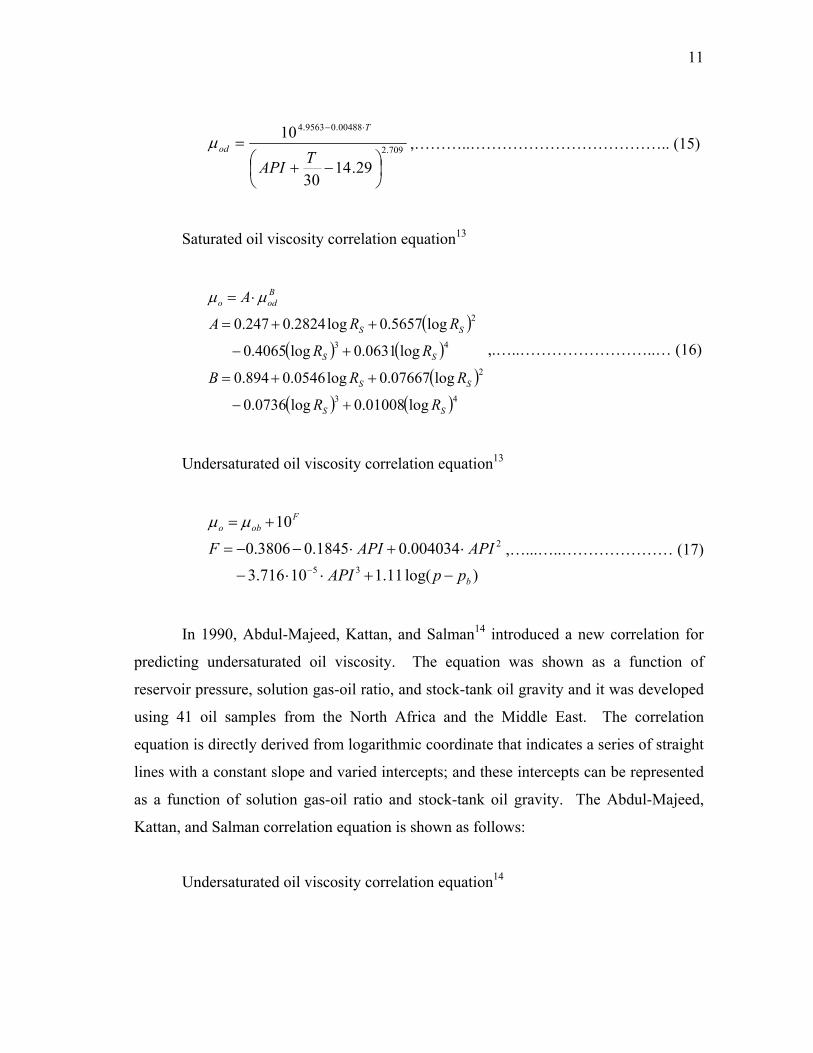
and bubble point pressure. The correlation equations are provided as follows:
Dead oil viscosity correlation equation13
11
709.2
00488.09563.4
29.1430
10
⎟⎠⎞
⎜⎝⎛ −+
=⋅−
TAPI
T
odµ ,………..……………………………….. (15)
Saturated oil viscosity correlation equation13
( )( ) ( )
( )( ) ( )43
2
43
2
log01008.0log0736.0
log07667.0log0546.0894.0
log0631.0log4065.0
log5657.0log2824.0247.0
SS
SS
SS
SS
Bodo
RR
RRB
RR
RRA
A
+−
++=
+−
++=
⋅= µµ
,.…..……………………..… (16)
Undersaturated oil viscosity correlation equation13
)log(11.110716.3004034.01845.03806.0
10
35
2
b
Fobo
ppAPIAPIAPIF
−+⋅⋅−
⋅+⋅−−=
+=
−
µµ
,…...…..………………… (17)
In 1990, Abdul-Majeed, Kattan, and Salman14 introduced a new correlation for
predicting undersaturated oil viscosity. The equation was shown as a function of
reservoir pressure, solution gas-oil ratio, and stock-tank oil gravity and it was developed
using 41 oil samples from the North Africa and the Middle East. The correlation
equation is directly derived from logarithmic coordinate that indicates a series of straight
lines with a constant slope and varied intercepts; and these intercepts can be represented
as a function of solution gas-oil ratio and stock-tank oil gravity. The Abdul-Majeed,
Kattan, and Salman correlation equation is shown as follows:
Undersaturated oil viscosity correlation equation14

12
( )( ) ( )bSb
Sb
Gobo
ppRAPI
APIRG
−+−⋅⋅⋅+
⋅−⋅−=
+=
− log11.12106.5614.5ln102545.9
001194.0614.5ln89941.09311.1
10
3
2
µµ
,............ (18)
In 1990, McCain15 proposed a combination of the dead oil viscosity correlation
equation of Ng and Egbogah8 with the Beggs and Robinson4 correlation equation for
saturated oil viscosity, and the Vasquez and Beggs6 correlation equation for
undersaturated oil viscosity. The author also developed an effective graphical technique
to determine oil viscosity information based on these published correlation equations.
In 1991, Kartoatmodjo and Schmidt16 used several PVT reports from different
geographical locations such as the Southeast Asia, the North America, the Middle East,
and the Latin America, to modify the Glaso7, the Chew and Connally2, and the Standing5
correlation equations for dead, saturated, and undersaturated oil viscosities, respectively.
The Kartoatmodjo and Schmidt correlation equations are provided as follows:
Dead oil viscosity correlation equation16
9718.26)log(7526.55177.28 )(log100.16 −−⋅⋅= T
od APITµ ,…..……....………….. (19)
Saturated oil viscosity correlation equation16
( ) ( )
S
S
R
Iod
Ro
I
H
HH
⋅−
⋅+⋅−
=
⋅+=
⋅+⋅+−=
00081.0
5165.043.0000845.0
2
10
108428.02001.0
0004034.09824.006821.0
µ
µ
,…………...………...….. (20)
Undersaturated oil viscosity correlation equation16
)038.0006517.0)((001127.000081.1 590.18148.1obobbobo pp µµµµ ⋅+⋅−−+⋅= ,…... (21)
13
Later, the authors compared the performance of their modified correlation
equations with that of published correlation equations in terms of average relative error,
average absolute relative error, standard deviation, and coefficient of determination. The
authors also used an unbiased database to test the quality of their correlation equations17.
The results show that their modified correlation equations provide the best prediction for
dead oil and saturated oil viscosities.
In 1991, Abu-Khamsin and Al-Marhoun18 proposed a new alternative strategy for
correlating a bubble point oil viscosity equation by using only a bubble point oil density
as an input parameter. The correlation equation was created by applying nonlinear
regression analysis on 62 oil samples from the Middle East and the Canada. The
authors, however, did not mention about the application of their correlation equation for
saturated and undersaturated reservoir oil. Theoretically, the typical shapes of oil
viscosity and oil density show a similar trend for any reservoir pressures. From this
reason, the Abu-Khamsin and Al-Marhoun correlation equation can be used to predict
saturated and undersaturated oil viscosities. The correlation equation is provided as
follows:
Bubble point oil viscosity correlation equation18
( )4484462.8652294.2exp obob ρµ ⋅+−= ,...……...…..…………......…….. (22)
In 1992, Labedi19 introduced a set of oil viscosity correlation equations for
predicting dead, saturated, undersaturated, and bubble point oil viscosities. The author
selected a multiple regression analysis technique to correlate their equations by using
about 100 oil samples from the Libya. Very interesting, a solution gas-oil ratio which is
an important reservoir parameter was not included in the correlation equations. The
author mentioned that the equations work very well with oil samples from the Libya and
other geographical areas such as the Middle East, the North Sea, and some parts of
America. The correlation equations should be used within a range of input data;
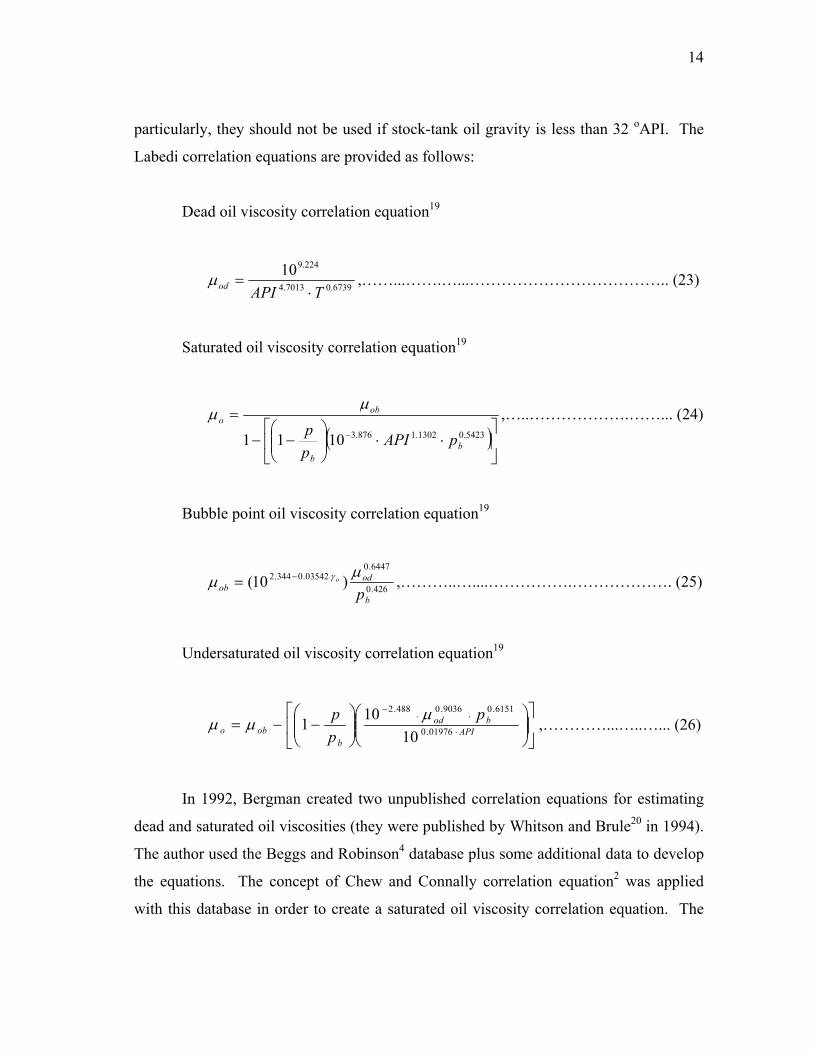
14
particularly, they should not be used if stock-tank oil gravity is less than 32 oAPI. The
Labedi correlation equations are provided as follows:
Dead oil viscosity correlation equation19
6739.07013.4
224.910TAPIod ⋅
=µ ,……...…….…...……………………………….. (23)
Saturated oil viscosity correlation equation19
( )⎥⎦
⎤⎢⎣
⎡⋅⋅⎟⎟
⎠
⎞⎜⎜⎝
⎛−−
=− 5423.01302.1876.31011 b
b
obo
pAPIpp
µµ ,…..……………….……... (24)
Bubble point oil viscosity correlation equation19
426.0
6447.003542.0344.2 )10(
b
odob p
oµµ γ−= ,………..…....…………….………………. (25)
Undersaturated oil viscosity correlation equation19
⎥⎦
⎤⎢⎣
⎡⎟⎟⎠
⎞⎜⎜⎝
⎛⎟⎟⎠
⎞⎜⎜⎝
⎛−−= ⋅
⋅⋅−
APIbod
bobo
ppp
01976.0
6151.09036.0488.2
10101 µµµ ,…………...…..…... (26)
In 1992, Bergman created two unpublished correlation equations for estimating
dead and saturated oil viscosities (they were published by Whitson and Brule20 in 1994).
The author used the Beggs and Robinson4 database plus some additional data to develop
the equations. The concept of Chew and Connally correlation equation2 was applied
with this database in order to create a saturated oil viscosity correlation equation. The

15
author claimed that the Beggs and Robinson dead oil viscosity correlation equation4
could not work effectively when the reservoir temperature is less than 70 oF. The
Bergman correlation equations are provided as follows:
Dead oil viscosity correlation equation20
( ) )310ln(0185.020.300033.0194.033.22)1ln(ln 2
+⋅−−⋅+⋅−=+⋅
TAPIAPIAPIodµ ,……………….……. (27)
Saturated oil viscosity correlation equation20
( )( )
3005.133555.0
300ln8359.0768.4exp
++=
+−=⋅=
S
S
Bodo
RB
RAA µµ
,……........………………………... (28)
In 1994, De Ghetto, Paone, and Villa21, 22 introduced a novel strategy for
correlating oil viscosity equations based on the different ranges of stock-tank oil gravity
as follows:
• Extra heavy oil viscosity correlation equations (API≤10 oAPI)
• Heavy oil viscosity correlation equations (10<API≤22.3 oAPI)
• Medium oil viscosity correlation equations (22.3<API≤31.1 oAPI)
• Light oil viscosity correlation equations (API >31.1 oAPI)
Furthermore, the authors tested the reliability of other published correlation
equations2, 4, 6, 7, 8, 15, 16, 19 using 195 oil samples collected from the Mediterranean Basin,
the Africa, the Persian Gulf, and the North Sea. The best correlation equations for each
oil gravity range and for the entire database were selected; and the numerical coefficients

16
of these selected equations were recalculated by using multiple, linear, and nonlinear
regressions. Noteworthy, the authors mentioned that the Non-Newtonian behavior of a
highly viscous fluid could affect the reliability of laboratory measurement and the
performance of viscosity correlation equations. The modified oil viscosity correlation
equations are provided as follows:
Dead oil viscosity correlation equation21, 22
Extra heavy oil: Modified Ng and Egbogah’s correlation equation8
)log(61748.0012619.090296.1)1log(log TAPIod −⋅−=+⋅ µ ,…….… (29)
Heavy oil: Modified Ng and Egbogah’s correlation equation8
)log(70226.00179.006492.2)1log(log TAPIod −⋅−=+⋅ µ ,………… (30)
Medium oil: Modified Kartoatmodjo’s correlation equation16
7874.45)log(5428.12556.39 )log(1015.220 −−
⋅⋅= Tod APITµ ,………..…………. (31)
Light oil: Modified Ng and Egbogah’s correlation equation8
)log(61304.0017628.067083.1)1log(log TAPIod −⋅−=+⋅ µ ,………. (32)
Entire oil samples: Modified Ng and Egbogah’s correlation equation8
)log(56238.0025548.08513.1)1log(log TAPIod −⋅−=+⋅ µ ,……..…. (33)

17
Saturated oil viscosity correlation equation21, 22
Extra heavy oil: Modified Kartoatmodjo’s correlation equation16
( )S
S
R
Iod
Ro
I
H
HH
⋅−
⋅+⋅−
=
⋅+−=
⋅+⋅+=
00081.0
)3432.05798.0(000845.0
2
10
100785.10335.0
001567.08927.03945.2
µ
µ
,……….…....…… (34)
Heavy oil: Modified Kartoatmodjo’s correlation equation16
( )S
S
R
Iod
Ro
I
H
HH
⋅−
⋅+⋅−
=
⋅+=
⋅−⋅+−=
00081.0
)5158.04731.0(000845.0
2
10
106114.02478.0
003653.0078.16311.0
µ
µ
,……….…...….…… (35)
Medium oil: Modified Kartoatmodjo’s correlation equation16
( )S
S
R
Iod
Ro
I
H
HH
⋅−
⋅+⋅−
=
⋅+=
⋅−⋅+=
00081.0
)5664.03855.0(000845.0
2
10
108591.02038.0
005215.09821.00132.0
µ
µ
,……….….……….. (36)
Light oil: Modified Beggs and Robinson’s correlation equation4
[ ] 2135.0)150(7516.26487.0)100(1921.25−+−+= SR
odSo R µµ ,……………..…...…… (37)
Entire oil samples: Modified Kartoatmodjo’s correlation equation16
( )S
S
R
Iod
Rb
I
H
HH
⋅−
⋅+⋅−
=
⋅+=
⋅−⋅+−=
000396.0
)7881.0172.0(000583.0
2
10
107024.01615.0
02865.09289.0032124.0
µ
µ
,………...…….….. (38)

18
Undersaturated oil viscosity correlation equation21, 22
Extra heavy oil: Modified Labedi’s correlation equation19
⎥⎦
⎤⎢⎣
⎡⎟⎟⎠
⎞⎜⎜⎝
⎛⎟⎟⎠
⎞⎜⎜⎝
⎛−−= ⋅
⋅⋅−
APIbod
bobo
ppp
0099.0
3132.0055.119.2
10101 µµµ ,……..………...……….. (39)
Heavy oil: Modified Kartoatmodjo’s correlation equation16
)0316.001153.0)((002763.0
9886.05939.17933.1
obobb
obo
pp µµ
µµ
⋅+⋅−−
+⋅=,………. (40)
Medium oil: Modified Labedi’s correlation equation19
⎥⎦
⎤⎢⎣
⎡⎟⎟⎠
⎞⎜⎜⎝
⎛⎟⎟⎠
⎞⎜⎜⎝
⎛−−= ⋅−
⋅⋅−
APIbod
bobo
ppp
00288.0
6957.04131.18055.3
10101 µµµ ,……............................ (41)
Entire oil samples: Modified Labedi’s correlation equation19
⎥⎦
⎤⎢⎣
⎡⎟⎟⎠
⎞⎜⎜⎝
⎛⎟⎟⎠
⎞⎜⎜⎝
⎛−−= ⋅
⋅⋅−
APIbod
bobo
ppp
0243.0
5026.07423.09.1
10101 µµµ ,…………....................... (42)
In 1995, Petrosky and Farshad23 proposed viscosity correlation equations for
dead, saturated, and undersaturated oil by using 126 laboratory PVT reports from the
Gulf of Mexico. The authors used a nonlinear multiple regression analysis to create their
correlation equations and used statistical error analysis functions to evaluate and
compare the performance of their equations with that of published correlation equations1,
2, 4, 6, 7, 8, 16. Their dead and undersaturated oil viscosity correlation equations provide
better results than the others. The authors claimed that their equations could be applied

19
with reservoir oil from other regions of the world, but should be used inside a range of
input data. Reservoir oil viscosities can be determined by using the following equations:
Dead oil viscosity correlation equation23
82792.22)log(59388.4
)log(103511.2 10255.27
−=⋅⋅= −
TJAPIT J
odµ,………...………….....…………… (43)
Saturated oil viscosity correlation equation23
S
S
R
R
Bodo
B
A
A
⋅⋅−
⋅−
−
⋅−
⋅+=
⋅+=
⋅=
3
4
101831.1
100866.6
105109.05131.0
106165.01651.0
µµ
,……..……...…...………………….. (44)
Undersaturated oil viscosity correlation equation23
32
3
)log(15036.1)log(4876.0)log(3322.10146.1
10)(103449.1
obobob
Kbobo
K
pp
µµµ
µµ
−−+−=
⋅−⋅+= −
,…...... (45)
In 1997, Almehaideb24 created two oil viscosity correlation equations using a
PVT database collected from 15 different reservoirs in the United Arab Emirates (UAE).
The author used regression analysis methods to create viscosity correlation equations for
saturated and undersaturated oil; and the performance of these correlation equations was
compared with that of other published correlation equations3, 4, 5, 6. The author, however,
never mentions about the application of these equations for other geographical regions;
therefore, there is no guarantee that these correlation equations can be applied with oil
samples outside the UAE. The saturated and undersaturated oil viscosity correlation
equations are presented as follows:

20
Saturated oil viscosity correlation equation24
487449.1555208.0941624.0597627.051059927.6 −−−− ⋅⋅⋅⋅⋅= APITR gSo γµ ,...…...……. (46)
Undersaturated oil viscosity correlation equation24
294 1093106.11094345.1134819.0 SbSb
L
bobo
RRL
pp
⋅⋅−⋅⋅+=
⎟⎟⎠
⎞⎜⎜⎝
⎛=
−−
µµ,.….…..........…... (47)
In 1997, Hanafy et al.25 introduced a simple bubble point oil viscosity correlation
equation based on 324 oil samples. The authors indicated that their correlation equation
can predict reservoir oil viscosity at any specific reservoir pressure by inserting the
corresponding value of oil density in the equation. The authors tested the performance
of their equation with other published correlation equations1, 2, 4, 6, 7, 11 and they inferred
that their correlation equation provides the best prediction for reservoir oil viscosity.
Very interesting, the concept of this work seems like the one proposed by Abu-Khamsin
and Al-Marhoun18 in 1991. The Hanafy et al. correlation equation is provided as
follows:
Bubble point oil viscosity correlation equation25
)095.3296.7exp( 3 −⋅= obob ρµ ,……………………..…..………………… (48)
In 1998, Bennison26 introduced a dead oil viscosity correlation equation for
heavy oil in the North Sea. Only 16 data points which is the lowest number from the
literature were used to develop a viscosity correlation equation in this paper. Because of
the limited available data in this work, the author stated that this correlation equation is

21
not practical to try and may not provide the high level of reliability for predicting dead
oil viscosity of heavy oil. The Bennison correlation equation is shown as follows:
Dead oil viscosity correlation equation26
( ) ( )18.1970405.104542.05037.469464.310231.0 22
10 −⋅+⋅−+⋅−⋅= APIAPIAPIAPIod Tµ ,……..…...….... (49)
In 1999, Elsharkawy and Alikhan27 published viscosity correlation equations for
dead, saturated, and undersaturated oil. Dead and saturated oil viscosity correlation
equations from Beggs and Robinson4 were modified with 254 oil samples from the
Middle East. The authors developed an undersaturated oil viscosity correlation equation
by using a multiple regression analysis and they introduced a new concept by using a
dead oil viscosity as an input parameter. For the Middle East oil, the accuracy of
calculated oil viscosity from this paper is better than that from other publications4, 5, 6, 7,
16, 19. The Elsharkawy and Alikhan viscosity correlation equations are as follows:
Dead oil viscosity correlation equation27
)log(68875.002525.016924.2)1log(log TAPIod −⋅−=+⋅ µ ,……..…….. (50)
Saturated oil viscosity correlation equation27
06622.1
12410.1
)335.1180(841.1768
)026.641(932.1241−
−
+=
+=
⋅=
S
S
Bodo
RB
RA
A µµ
,………..……….………..………… (51)
Undersaturated oil viscosity correlation equation27

22
))((10 7941.040712.019279.10771.2 −⋅
−⋅
− −+= bobodbobo ppp µµµµ ,……..……………... (52)
In 2001, Elsharkawy and Gharbi28 compared a classical regression technique
with a modern concept of regression analysis which is the neural regression technique.
The authors used both regression techniques to develop oil viscosity correlation
equations based on 59 oil systems from the Kuwait. The authors mentioned that the oil
viscosity correlation equation created by neural regression technique provides better
performance than the equation developed by another regression technique. But the
procedure of neural regression technique consists of several complicated steps and can
not be performed without using of computer software. Therefore, a classical regression
analysis technique is a preferable method for correlating oil viscosity equations. The oil
viscosity correlation equations in this paper are shown as follows:
Dead oil viscosity correlation equation28
( ) ( ) ( )TAPIod log9364.1log9145.37580.10log −−=µ ,……………..… (53)
Saturated oil viscosity correlation equation28
79903.038678.082604.010 odo p µµ ⋅⋅= − ,…………………...……...……………..… (54)
Undersaturated oil viscosity correlation equation28
( )( ) 832 1081145994815612 −⋅⋅+⋅−⋅+−=
−+=
ododod
bobo
M
ppM
µµµ
µµ,………….…….…. (55)
In 2001, Dindoruk and Christman29 used more than 90 PVT reports from the
Gulf of Mexico regions to correlate dead, saturated, and undersaturated oil viscosity
equations. Correlation equations in this paper were successfully developed by using the
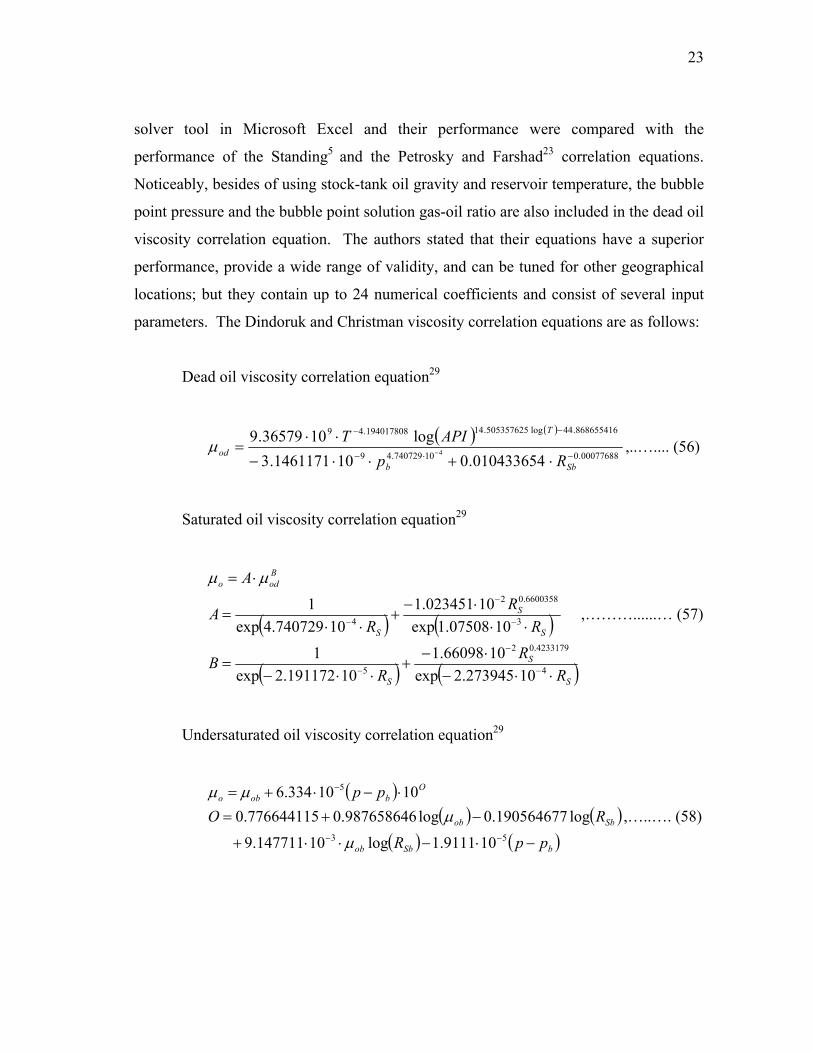
23
solver tool in Microsoft Excel and their performance were compared with the
performance of the Standing5 and the Petrosky and Farshad23 correlation equations.
Noticeably, besides of using stock-tank oil gravity and reservoir temperature, the bubble
point pressure and the bubble point solution gas-oil ratio are also included in the dead oil
viscosity correlation equation. The authors stated that their equations have a superior
performance, provide a wide range of validity, and can be tuned for other geographical
locations; but they contain up to 24 numerical coefficients and consist of several input
parameters. The Dindoruk and Christman viscosity correlation equations are as follows:
Dead oil viscosity correlation equation29
( ) ( )
00077688.010740729.49
868655416.44log505357625.14194017808.49
010433654.0101461171.3log1036579.9
4 −⋅−
−−
⋅+⋅⋅−
⋅⋅= −
Sbb
T
od RpAPITµ ,..….... (56)
Saturated oil viscosity correlation equation29
( ) ( )
( ) ( )S
S
S
S
S
S
Bodo
RR
RB
RR
RA
A
⋅⋅−⋅−
+⋅⋅−
=
⋅⋅⋅−
+⋅⋅
=
⋅=
−
−
−
−
−
−
4
4233179.02
5
3
6600358.02
4
10273945.2exp1066098.1
10191172.2exp1
1007508.1exp10023451.1
10740729.4exp1
µµ
,………......… (57)
Undersaturated oil viscosity correlation equation29
( )( ) ( )
( ) ( )bSbob
Sbob
Obobo
ppR
ROpp
−⋅−⋅⋅+
−+=⋅−⋅+=
−−
−
53
5
109111.1log10147711.9
log190564677.0log987658646.0776644115.01010334.6
µ
µµµ
,…..…. (58)

24
The alternate version of reservoir oil viscosity correlation equations was
proposed by Dexheimer, Jackson, and Barrufet30 and Barrufet and Dexheimer31. These
authors introduced a modification of two existing corresponding states compositional
models for predicting an oil viscosity when the compositional information is not
available. The modified correlation equations require reference fluid information,
several computational procedures, and field-measured variables such as formation
volume factor, solution gas-oil ratio and stock-tank oil gravity. The authors state that
their correlation equations can be easily tuned and applied for any simulation software
and they also provide better estimation than other correlation equations11, 23.
Reservoir Field Parameters Used in Viscosity Correlation Equations
Knowing general reservoir parameters used for developing oil viscosity
equations is very important for correlation developers; and they can use these parameters
to develop a new correlation equation. The following tables provide field parameters
that are used in all published oil viscosity correlation equations.
Table 1 shows reservoir parameters in published dead oil viscosity correlation
equations. All correlation equations consist of reservoir temperature and stock-tank oil
gravity, which correspond to the dead oil viscosity concept proposed by Beal1.
Table 1- Reservoir parameters in published dead oil viscosity correlation equations
Author T, oF
API, oAPI
pb, psia
RSb, scf/STB
Beggs and Robinson yes yes Standing yes yes Glaso yes yes Ng and Egbogah yes yes Al-Khafaji, Abdul-Majeed, and Hassoon yes yes Kartoatmodjo and Schmidt yes yes Labedi yes yes Bergman yes yes De Ghetto, Paone, and Villa yes yes Petrosky and Farshad yes yes Bennison yes yes Elsharkawy and Alikhan yes yes Elsharkawy and Gharbi yes yes Dindoruk and Christman yes yes yes yes

25
Table 2 shows all reservoir parameters in published saturated oil viscosity
correlation equations. The concept of Chew and Connally2 by correlating a saturated oil
viscosity equation as a function of dead oil viscosity and solution gas-oil ratio is used by
most published correlation equations except for the Khan et al11 and the Labedi19
correlation equations.
Table 2- Reservoir parameters in published saturated oil viscosity correlation equations
Author µod, cp
RS, scf/STB
T, oF
API, oAPI
γg p, psia
pb, psia
µob, cp
Aziz, Govier, and Fogarasi yes yes Beggs and Robinson yes yes Standing yes yes Khan et al yes yes yes Al-Khafaji, Abdul-Majeed, and Hassoon yes yes Kartoatmodjo and Schmidt yes yes Labedi yes yes yes yes Bergman yes yes De Ghetto, Paone, and Villa yes yes Petrosky and Farshad yes yes Almehaideb yes yes yes yes Elsharkawy and Alikhan yes yes Elsharkawy and Gharbi yes yes Dindoruk and Christman yes yes
Generally, saturated oil viscosity correlation equations can predict oil viscosity at
and below the bubble point pressure; but some publications provide the specific
correlation equations for predicting a bubble point oil viscosity. Very interesting, the
Abu-Khamsin and Al-Marhoun18 and the Hanafy et al25 correlation equations require
only a bubble point oil density to estimate a bubble point oil viscosity. Table 3 provides
reservoir parameters in all published bubble point oil viscosity correlation equations.
Table 3- Reservoir parameters in published bubble point oil viscosity correlation equations
Author µod, cp
RS, scf/STB
T, oF
API, oAPI
γg pb, psia
ρob, lb/ft3
Khan et al yes yes yes yes Abu-Khamsin and Al-Marhoun yes Labedi yes yes yes Hanafy et al yes
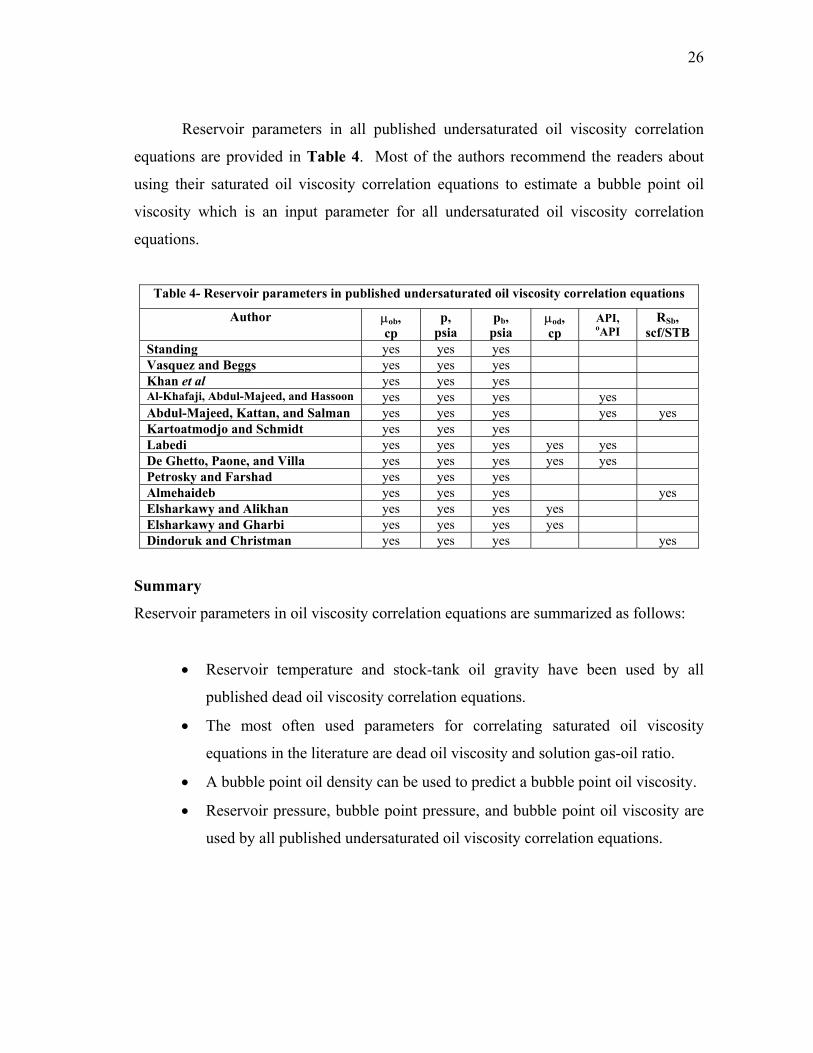
26
Reservoir parameters in all published undersaturated oil viscosity correlation
equations are provided in Table 4. Most of the authors recommend the readers about
using their saturated oil viscosity correlation equations to estimate a bubble point oil
viscosity which is an input parameter for all undersaturated oil viscosity correlation
equations.
Table 4- Reservoir parameters in published undersaturated oil viscosity correlation equations
Author µob, cp
p, psia
pb, psia
µod, cp
API, oAPI
RSb, scf/STB
Standing yes yes yes Vasquez and Beggs yes yes yes Khan et al yes yes yes Al-Khafaji, Abdul-Majeed, and Hassoon yes yes yes yes Abdul-Majeed, Kattan, and Salman yes yes yes yes yes Kartoatmodjo and Schmidt yes yes yes Labedi yes yes yes yes yes De Ghetto, Paone, and Villa yes yes yes yes yes Petrosky and Farshad yes yes yes Almehaideb yes yes yes yes Elsharkawy and Alikhan yes yes yes yes Elsharkawy and Gharbi yes yes yes yes Dindoruk and Christman yes yes yes yes
Summary
Reservoir parameters in oil viscosity correlation equations are summarized as follows:
• Reservoir temperature and stock-tank oil gravity have been used by all
published dead oil viscosity correlation equations.
• The most often used parameters for correlating saturated oil viscosity
equations in the literature are dead oil viscosity and solution gas-oil ratio.
• A bubble point oil density can be used to predict a bubble point oil viscosity.
• Reservoir pressure, bubble point pressure, and bubble point oil viscosity are
used by all published undersaturated oil viscosity correlation equations.

27
CHAPTER III
OBJECTIVES
The objectives of this research result in a strong motivation to create the
numerical correlation equations for estimating reservoir oil viscosity with high accuracy.
The effective strategies proposed in this research are as follows:
• Create a wide range of fluid property database collected from several
laboratory PVT reports for testing the performance of published correlation
equations and for correlating new oil viscosity equations.
• Determine the effective variables for correlating reservoir oil viscosity
equations based on the relationship between reservoir oil viscosity and
influential reservoir parameters.
• Evaluate the performance of published viscosity correlation equations for
saturated and undersaturated reservoir oil using a database provided in this
study.
• Develop viscosity correlation equations for saturated and undersaturated
reservoir oil using an effective correlation analysis technique.
• Validate the connection of oil viscosity at the bubble point pressure provided
by the proposed saturated and undersaturated oil viscosity correlation
equations.
• Achieve the optimal performance of the proposed oil viscosity correlation
equations as represented in terms of statistical error analysis functions, ARE
and AARE.
• Compare the performance of proposed oil viscosity correlation equations
with that of published correlation equations in terms of statistical error
analysis functions at several reservoir conditions.

28
CHAPTER IV
RESERVOIR FLUID PROPERTY DATABASE
More than three hundred PVT reports collected from worldwide geographical
locations were originally anticipated to be used for developing saturated and
undersaturated reservoir oil viscosity correlation equations in this research. Data quality
control for reservoir fluid properties from these PVT reports, however, is the first
mandatory step for correlation analysis and should be completed before correlating oil
viscosity equations. The higher the quality of database, the better the performance of oil
viscosity correlation will be achieved. Therefore, the most aspect of this chapter
concentrates on the systematic procedures for creating database in order to acquire
reliable and consistent PVT information. The quality control processes are provided as
follows:
• Preparing a PVT Database for Correlation Analysis
• Identifying Errors from Typical Shape of Oil Viscosity
• Screening Data Sets for Multi-Stage Separator
• Checking Reliability of Solution Gas-Oil Ratio
• Determining Reservoir Oil Density
• Providing Fluid Properties Information for Database
Preparing a PVT Database for Correlation Analysis
The original database provided in this study was completely separated for
saturated and undersaturated reservoir oil. For saturated reservoir oil, the database
includes 380 different PVT reports with almost 3000 data points. And more than 3500
data points obtained from 318 PVT reports belongs to an undersaturated oil database.
Assembling two databases together is required in order to achieve the completed
database that consists of saturated and undersaturated oil information. Each PVT report

29
from both databases is one-to-one matched using reservoir oil properties at the bubble
point pressure to determine the connection and to verify the completion of PVT report.
All unmatched PVT data sets are removed from an original database and kept separately.
After achieving the completed database, additional PVT reports are added into
the database to expand the range of reservoir oil viscosity. The new database consists of
218 completed PVT reports with 1,348 data points for saturated reservoir oil and 2,329
data points for undersaturated reservoir oil. Before correlating reservoir oil viscosity
equations, this database definitely requires more quality control processes to improve
their quality and to provide the best performance for correlating oil viscosity equations.
Identifying Errors from a Typical Shape of Oil Viscosity
Reservoir oil viscosity is used as the dependent variable in regression analysis for
saturated and undersaturated oil viscosity correlation equations. To minimize any
potential errors in viscosity data, all data sets must provide the following typical shape of
oil viscosity as provided in Fig. 1. Above the bubble point pressure, reservoir oil
viscosities decrease almost linearly as pressure decreases15 because the compression on
liquid molecules is reduced at lower pressure. The reduction of compressive force
causes a steady increase in the mobility of liquid molecules, which resulting the decrease
in oil viscosity. On the other hand, below the bubble point pressure, the change of liquid
composition causes a large increase in reservoir oil viscosity. On the basis of the
gravitational effect, the gas released from the solution takes the smaller molecules,
leaving large complex molecules in the remaining reservoir liquid15. The low mobility
of large liquid molecules causes the increase in the reservoir oil viscosity. This
phenomenon is always applied for all kinds of oil viscosity in the reservoir. Therefore,
saturated and undersaturated reservoir oil viscosities from the database should provide a
similar typical shape.

30
0.0000
0.5000
1.0000
1.5000
2.0000
2.5000
3.0000
0 1000 2000 3000 4000 5000
Reservoir pressure, psia
Oil
Visc
osity
, cp
pb
Fig. 1- Typical shape of reservoir oil viscosity as a function of pressure
at constant reservoir temperature.
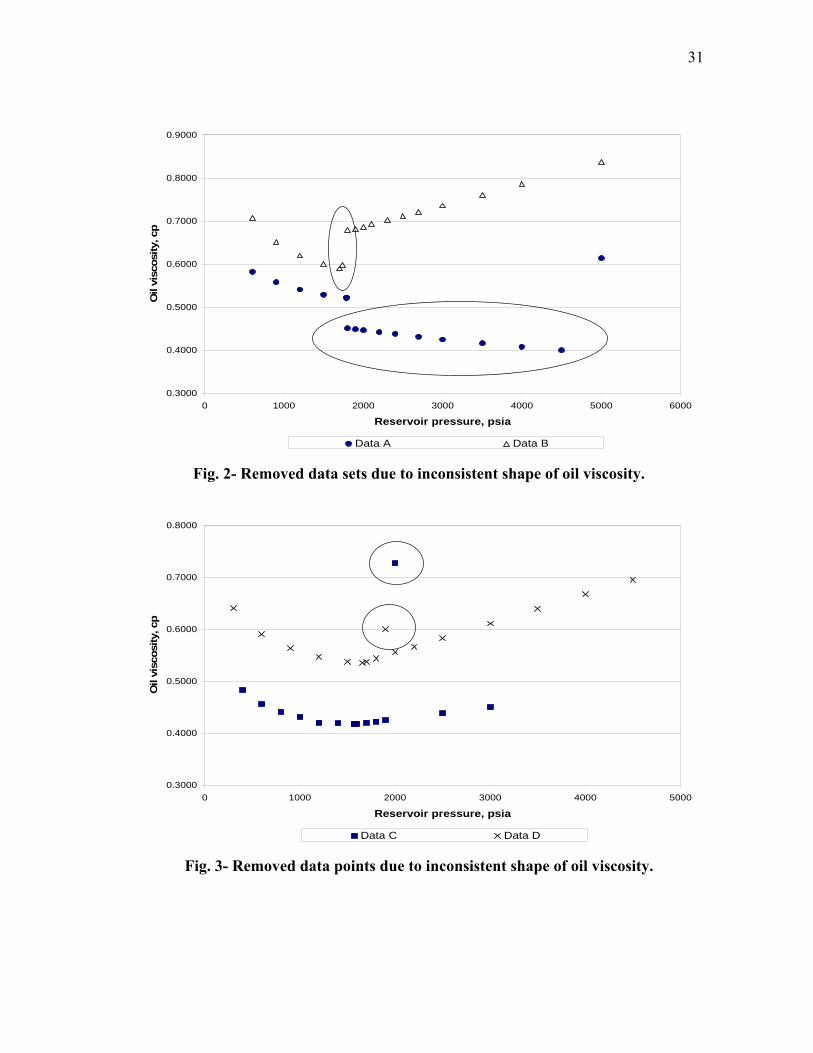
After screening all data set, five PVT reports show an inconsistent configuration
with a typical shape of oil viscosity and need to be removed from the database. Fig. 2
shows two examples of removed data sets. For data set A, the entire data set is removed
because all undersaturated oil viscosity values behave differently from a typical shape.
For data set B, the big shift near the bubble point pressure causes a large error in this
data set.
Outlying data points found from 8 PVT reports are considered as bad data points
and they are removed from the database to maintain the quality. Examples of outlying
data points, as shown in Fig. 3, clearly indicate two improper data points of
undersaturated oil viscosity in this plot.
After identifying errors from typical shape of oil viscosity, the database consists
of 213 completed PVT reports. All data sets that pass this error screening basis still need
to be tested with other quality control techniques. Checking data consistency and
reliability is the next important procedure before processing with a regression routine.
31
0.3000
0.4000
0.5000
0.6000
0.7000
0.8000
0.9000
0 1000 2000 3000 4000 5000 6000
Reservoir pressure, psia
Oil
visc
osity
, cp
Data A Data B Fig. 2- Removed data sets due to inconsistent shape of oil viscosity.
0.3000
0.4000
0.5000
0.6000
0.7000
0.8000
0 1000 2000 3000 4000 5000
Reservoir pressure, psia
Oil
visc
osity
, cp
Data C Data D Fig. 3- Removed data points due to inconsistent shape of oil viscosity.

32
Screening Data Sets for Multi-stage Separation
Two-stage separation, including one separator and one storage tank, is normally
used for black oil systems with optimum separator pressure of 100 to 120 psig at normal
temperature15. For some cases, three- or four-stage separation can be performed to
maximize the oil recovery when fluid has high solution gas-oil ratio or oil gravity32.
Fluid property information for multi-stage separation is identical for compositional
measurement, flash vaporization, differential liberation, and oil viscosity measurement;
but fluid property information for separator tests is provided individually based on the
number of separator used in the field. For example, three-stage separation provides two
different sets of solution gas-oil ratio, oil formation volume factor, and separator gas
specific gravity information. Certainly, data sets involving multi-stage separation
always provide the duplicate information of reservoir oil viscosity and other parameters.
Therefore, these imitated data must be carefully inspected and removed from the
database.
The screening results indicate 13 three-stage separations and 2 four-stage
separations. Fluid properties provided in these data sets, for example, oil viscosity,
reservoir pressure, reservoir temperature, etc, are identical except those from separator
tests. To verify which PVT information could be used in the database, each data set
must be tested with correlation equations for bubble point pressure and oil formation
volume factor; and data sets that provide the most comparable results between calculated
and laboratory-measured values would be kept in the database.
After screening PVT data sets of 15 multi-stage separations, only 11 PVT data
sets show the robust consistence between calculated and laboratory-measured fluid
properties. Unreliable PVT reports are removed from a database and kept in the separate
file. The database at this stage consists of 192 complete PVT reports. Before finalizing
the database, the last step of data preparation is checking the reliability of solution gas-
oil ratio that obtains from differential liberation and separator tests.

33
Checking Reliability of Solution Gas-oil Ratio
Empirically, the values of solution gas-oil ratio at the bubble point pressure from
differential vaporization are higher than those from separator tests. For some instances,
bubble point solution gas-oil ratio from separator tests can be larger if the values less
than 200 scf/STB are achieved. To ensure the database reliability, every single data set
requires a verification of solution gas-oil ratio profiles according to the proposed criteria.
After checking the entire database, 9 PVT data sets violate empirical criteria and
have to be removed from the database. The finalize database for correlating reservoir oil
viscosity equations consists of 183 completed PVT reports with 1,118 observations for
saturated reservoir oil and 1,968 observations for undersaturated reservoir oil.
Determining Reservoir Oil Density Information
Reservoir parameters listed in Table 1 to Table 4 are required for correlating
reservoir oil viscosity equations. Reservoir oil density data, however, are not available
in several PVT data sets and is one of important PVT parameters that need in this
research. To recover the missing information of saturated and undersaturated reservoir
oil densities, using the high performance oil density correlation equations provided in the
literature is totally necessary and definitely helpful.
In 1995, McCain and Hill33 created a set of correlation equations for predicting
oil density at and below the bubble point pressure by using a large database. Their
correlation equations provide very accurate results, which predicting reservoir oil
densities within ±4 percent. Because of the high level of performance and quality,
therefore, the McCain and Hill correlation equation is selected to determine all missing
reservoir oil density in this research. Several computational procedures are required to
receive the density of saturated reservoir oil; and the first step is to calculate a
pseudoliquid density, ρpo, at standard conditions by recombining the surface liquid and
surface gas as follows:
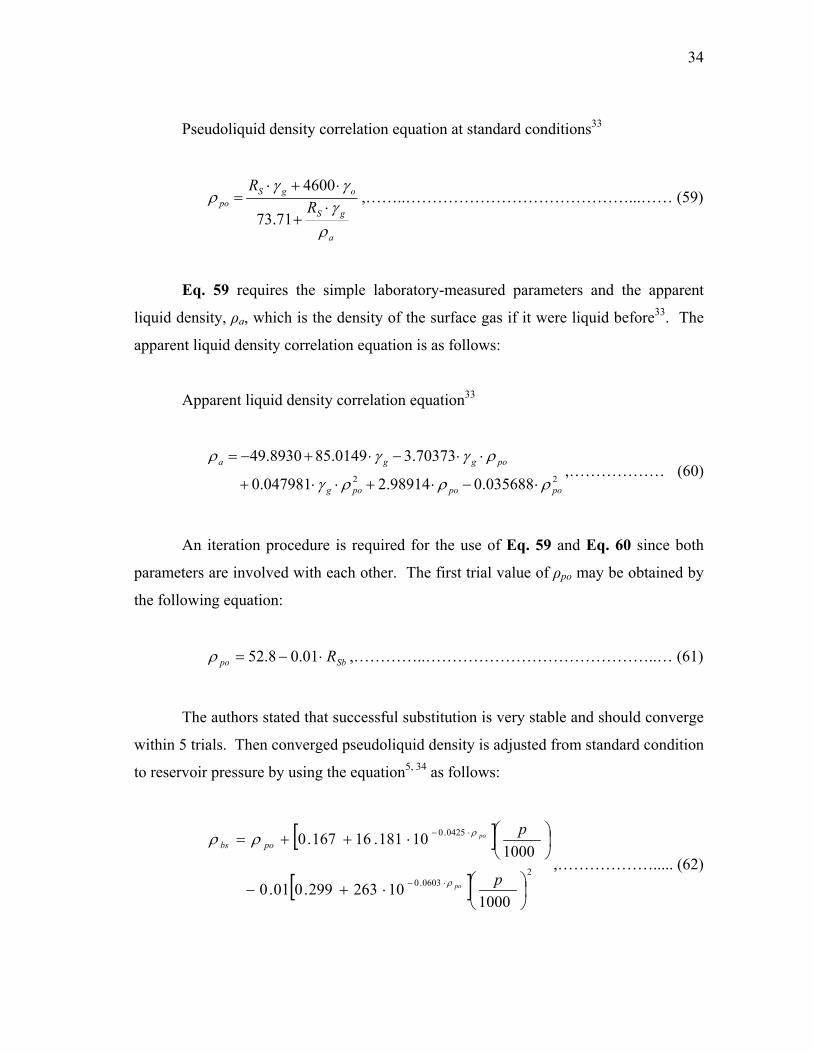
34
Pseudoliquid density correlation equation at standard conditions33
a
gS
ogSpo R
R
ργ
γγρ
⋅+
⋅+⋅=
71.73
4600,……..……………………………………...…… (59)
Eq. 59 requires the simple laboratory-measured parameters and the apparent
liquid density, ρa, which is the density of the surface gas if it were liquid before33. The
apparent liquid density correlation equation is as follows:
Apparent liquid density correlation equation33
22 035688.098914.2047981.0
70373.30149.858930.49
popopog
pogga
ρρργ
ργγρ
⋅−⋅+⋅⋅+
⋅⋅−⋅+−=,……………… (60)
An iteration procedure is required for the use of Eq. 59 and Eq. 60 since both
parameters are involved with each other. The first trial value of ρpo may be obtained by
the following equation:
Sbpo R⋅−= 01.08.52ρ ,…………..……………………………………..… (61)
The authors stated that successful substitution is very stable and should converge
within 5 trials. Then converged pseudoliquid density is adjusted from standard condition
to reservoir pressure by using the equation5, 34 as follows:
[ ]
[ ]2
0603.0
0425.0
100010263299.001.0
100010181.16167.0
⎟⎠⎞
⎜⎝⎛⋅+−
⎟⎠⎞
⎜⎝⎛⋅++=
⋅−
⋅−
p
p
po
popobs
ρ
ρρρ,………………..... (62)

35
The density of reservoir oil at reservoir condition, ρo, can be obtained after
adjusting the density to reservoir temperature by the following equation35:
Saturated reservoir oil density correlation equation33
[ ]( )[ ]( ) 475.00161.0
938.0951.0
60100233.0
60505.100302.0
−⋅+
−⋅+−=⋅−
−
T
Tbs
bsbso
ρ
ρρρ,…………..……………… (63)
The next step is to determine the density of undersaturated reservoir oil. As
pressure above the bubble point, the oil density can be calculated according to the
definition of the coefficient of isothermal compressibility, co, of a liquid above the
bubble point pressure15. The equation is as follows:
( ) ⎟⎟⎠
⎞⎜⎜⎝
⎛=−
ob
obo ppc
ρρ
ln ,…………………………………………………… (64)
The use of bubble point oil density is required and can be computed using the
McCain and Hill33 technique. Eq. 64 can be applied with the flash vaporization data,
which is the relative volume, (Vt/Vb)F. The equation for an average value of oil
compressibility between reservoir pressure and bubble point pressure as a function of
relative volume is as follows:
( )Fb
tbo V
Vppc ⎟⎠⎞⎜
⎝⎛=− ln ,………………………………………………… (65)
Substituting Eq. 65 into Eq. 64 and rearranging these equations are performed in
order to achieve an undersaturated oil density equation as a function of bubble point oil
density and relative volume. The undersaturated oil density equation is as follows:

36
Undersaturated reservoir oil density equation
Fb
t
obo
VV
⎟⎠⎞⎜
⎝⎛
=ρ
ρ ,…….……………………………………………………... (66)
After fulfilling saturated and undersaturated reservoir oil density information, the
database is ready to be used for correlating oil viscosity equations in this research.
Providing Tables of Fluid Properties Information
Table 5 shows a wide range database used in this research for saturated reservoir
oil. In addition, statistical information, symbols, and units of all fluid properties are
provided for more details. Table 6 gives all similar information for undersaturated
reservoir oil. The range of oil viscosity in this research, which is 0.167 to 279.83 cp,
covers from light oil to heavy oil.
Table 5- Fluid properties information for saturated reservoir oil
(183 PVT reports/1118 data points) Reservoir parameters Symbol Unit Min Median Mean Max
Reservoir pressure p psia 27 1100.5 1274.7 5297 Reservoir temperature T oF 107 198 199 320 Stock-tank oil gravity API
oAPI 15.8 35.6 35.5 57.7 Separator gas specific gravity γg 0.6506 0.8389 0.8775 1.9161 Solution gas-oil ratio RS scf/STB 4 288 351 1534 Bubble point solution gas-oil ratio RSb scf/STB 12 558 565 1534 Reservoir oil viscosity µo cp 0.1670 0.7225 4.19 157.60 Reservoir oil density ρo lb/cu ft 34.27 46.30 46.40 57.42
Table 6- Fluid properties information for undersaturated reservoir oil
(183 PVT reports/1968 data points) Reservoir parameters Symbol Unit Min Median Mean Max
Reservoir pressure p psia 106 2700 2734.8 7500 Reservoir temperature T oF 107 196 199 320 Stock-tank oil gravity API
oAPI 15.8 34.3 33.8 57.7 Separator gas specific gravity γg 0.6506 0.8635 0.8966 1.9161 Bubble point solution gas-oil ratio RSb scf/STB 12 350 435 1534 Oil formation volume factor Bo res bbl/STB 1.0005 1.2199 1.2617 2.0440 Relative volume (Vt/Vb)F 0.9079 0.9934 0.9894 1.0000 Reservoir oil viscosity µo cp 0.1670 0.8408 10.21 279.83 Reservoir oil density ρo lb/cu ft 34.27 46.46 46.89 58.30
37
CHAPTER V
DETERMINING EFFECTIVE PARAMETERS
This chapter focuses mainly on the relationship between the dependent variable
which is reservoir oil viscosity and several independent variables, for example, reservoir
temperature, stock-tank oil gravity, reservoir oil density, etc. The stronger bonding
among these reservoir variables causes the better performance of oil viscosity correlation
equations in this study. Most of laboratory-measured parameters provided in Table 1 to
Table 4 has been intensively studied and has been evaluated for the possibility of being
used as effective independent variables in correlation of oil viscosities.
Generally, reservoir temperature and pressure are the main factors that affect
reservoir oil viscosity. For the effect of reservoir temperature, the amount of heat
applied on reservoir fluid weakens an intermolecular force and agitates the mobility of
liquid molecule, which results a reduction of liquid viscosity in the reservoir. Therefore,
an increase in reservoir temperature will reduce the liquid viscosity. The effect of
reservoir pressure on reservoir oil viscosity has been described in the previous chapter.
The solution gas-oil ratio, which is a direct function of reservoir pressure, is also
considered as a third parameter that affects oil viscosity15. The origin of the relationship
between the reservoir oil viscosity and other reservoir parameters, however, has never
been appeared in any publications. Hence, the uses of reservoir parameters for
correlating oil viscosity equations in the literature are totally questionable and there is a
need to clarify the exact relationship of these reservoir parameters with reservoir oil
viscosity.
Unveiling the mystery of fluid property relationship is provided in this research.
To serve this purpose, the relationship between the dependent variable and each
independent variable is revealed in this chapter by using both theoretical and empirical
strategies. The details of these systematic analytical procedures are provided in the
following discussion.

38
Comparing Typical Shape of Oil Viscosity with Other Reservoir Parameters
Comparing the typical shape of reservoir oil viscosity, as shown in Fig. 1, with
typical shapes of reservoir temperature, stock-tank oil gravity, solution gas-oil ratio,
reservoir pressure, and reservoir oil density is an effective theoretical approach to
demonstrate the fundamental relationship between reservoir oil viscosity and other
reservoir parameters.
0.0
0.5
1.0
1.5
2.0
2.5
3.0
0 1000 2000 3000 4000 5000
Reservoir pressure, psia
Oil
Visc
osity
, cp
0
50
100
150
200
250
300
Res
ervo
ir te
mpe
ratu
re, o F
Viscosity Reservoir temperature
pb
Fig. 4- Relationship between reservoir oil viscosity and reservoir temperature for
saturated and undersaturated reservoir oil.
Generally, reservoir temperature is considered as a constant parameter; and,
therefore, a typical shape of reservoir temperature is drawn as a horizontal straight line
and does not show any relationship with a typical shape of reservoir oil viscosity, as
shown in Fig. 4. From this reason, reservoir temperature probably has a small effect on
saturated and undersaturated oil viscosities and it could be a low potential reservoir
parameter for correlating oil viscosity equations. The influence of reservoir temperature,
however, could apply on dead oil viscosity at the atmospheric pressure.

39
0.0
0.5
1.0
1.5
2.0
2.5
3.0
0 1000 2000 3000 4000 5000
Reservoir pressure, psia
Oil
Visc
osity
, cp
0
5
10
15
20
25
30
Stoc
k ta
nk o
il gr
avity
, o API
Viscosity Stock tank oil gravity
pb
Fig. 5- Relationship between reservoir oil viscosity and stock-tank oil gravity for
saturated and undersaturated reservoir oil.
Because of sampling at standard condition, stock-tank oil gravity does not
depend on reservoir pressure and is presented as a horizontal straight line on a typical
shape. Again, no relationship between reservoir oil viscosity and stock-tank oil gravity
is indicated in Fig. 5. Based on a graphical interpretation, stock-tank oil gravity is
probably not a potential parameter for correlating saturated and undersaturated oil
viscosity equations; but it may uses effectively for correlating a dead oil viscosity
equation.
By definition, dead oil viscosity is a viscosity of gas-free reservoir oil at the
atmospheric pressure and the reservoir temperature. Therefore, reservoir temperature is
not only a direct function of dead oil viscosity but also stock-tank oil gravity that shows
the relationship with dead oil viscosity because it is measured at the atmospheric
pressure. Both parameters are the effective parameters for correlating a dead oil
viscosity equation and they have been seen in all published correlation equations as
provided in Table 1.

40
0.0
0.5
1.0
1.5
2.0
2.5
3.0
0 1000 2000 3000 4000 5000
Reservoir pressure, psia
Oil
Visc
osity
, cp
0
35
70
105
140
175
210
Solu
tion
gas-
oil r
atio
, scf
/STB
Viscosity Solution gas/oil raito
pb
Fig. 6- Relationship between reservoir oil viscosity and solution gas-oil ratio for
saturated and undersaturated reservoir oil.
The typical shape of solution gas-oil ratio is completely separated for saturated
and undersaturated reservoir oil as shown in Fig. 6. For undersaturated reservoir oil,
there is no change in the amount of gas in solution from the initial reservoir pressure to
the bubble point pressure, which indicates a horizontal straight line on a typical shape.
Therefore, a solution gas-oil ratio has no relationship with an undersaturated oil viscosity
and is not a potential parameter for correlating an undersaturated oil viscosity equation.
For saturated reservoir oil, the decrement in solution gas-oil ratio is a function of
reservoir pressure; because a large amount of gas in solution is released from a liquid
when reservoir pressure drops below the bubble point. The remaining liquid is packed
with lot of large and complex molecules causing a substantial increase in saturated oil
viscosity. Therefore, a decrement in solution gas-oil ratio causes an increasing in oil
viscosity. This relationship logically supports the appearance of solution gas-oil ratio in
several published saturated oil viscosity correlation equations. Hence, solution gas-oil
ratio is considered as an effective parameter for correlating a saturated oil viscosity
equation.
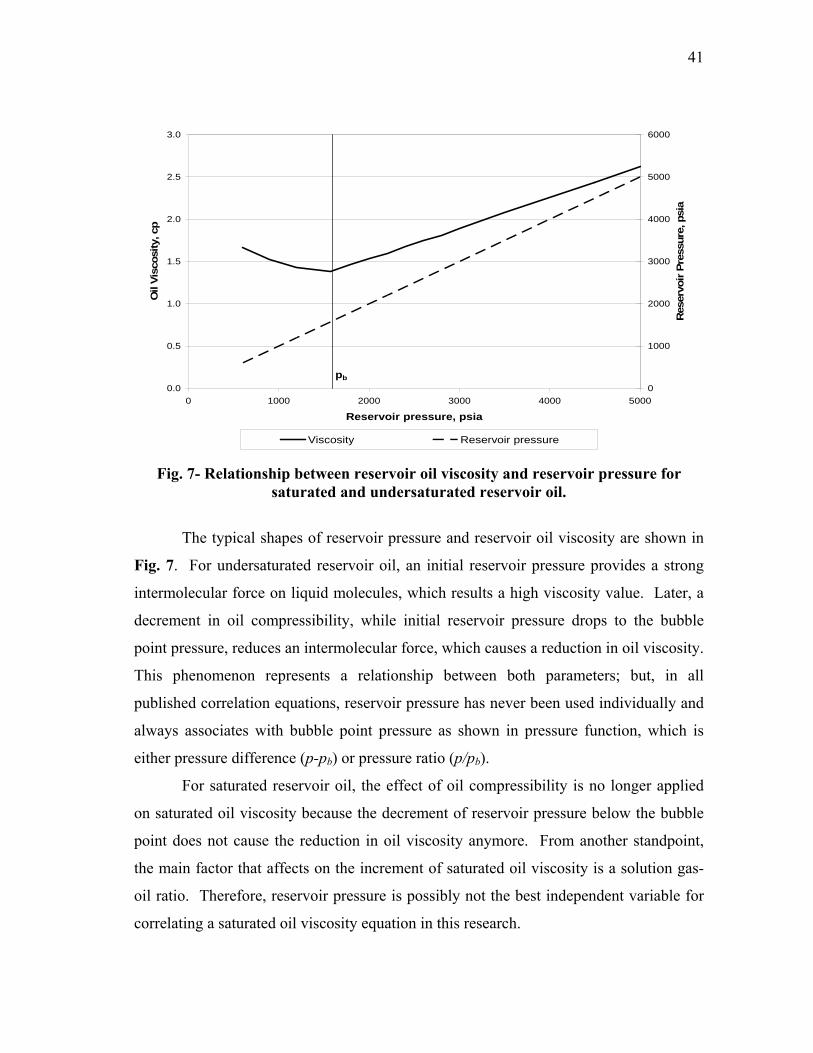
41
0.0
0.5
1.0
1.5
2.0
2.5
3.0
0 1000 2000 3000 4000 5000
Reservoir pressure, psia
Oil
Visc
osity
, cp
0
1000
2000
3000
4000
5000
6000
Res
ervo
ir Pr
essu
re, p
sia
Viscosity Reservoir pressure
pb
Fig. 7- Relationship between reservoir oil viscosity and reservoir pressure for
saturated and undersaturated reservoir oil.
The typical shapes of reservoir pressure and reservoir oil viscosity are shown in
Fig. 7. For undersaturated reservoir oil, an initial reservoir pressure provides a strong
intermolecular force on liquid molecules, which results a high viscosity value. Later, a
decrement in oil compressibility, while initial reservoir pressure drops to the bubble
point pressure, reduces an intermolecular force, which causes a reduction in oil viscosity.
This phenomenon represents a relationship between both parameters; but, in all
published correlation equations, reservoir pressure has never been used individually and
always associates with bubble point pressure as shown in pressure function, which is
either pressure difference (p-pb) or pressure ratio (p/pb).
For saturated reservoir oil, the effect of oil compressibility is no longer applied
on saturated oil viscosity because the decrement of reservoir pressure below the bubble
point does not cause the reduction in oil viscosity anymore. From another standpoint,
the main factor that affects on the increment of saturated oil viscosity is a solution gas-
oil ratio. Therefore, reservoir pressure is possibly not the best independent variable for
correlating a saturated oil viscosity equation in this research.
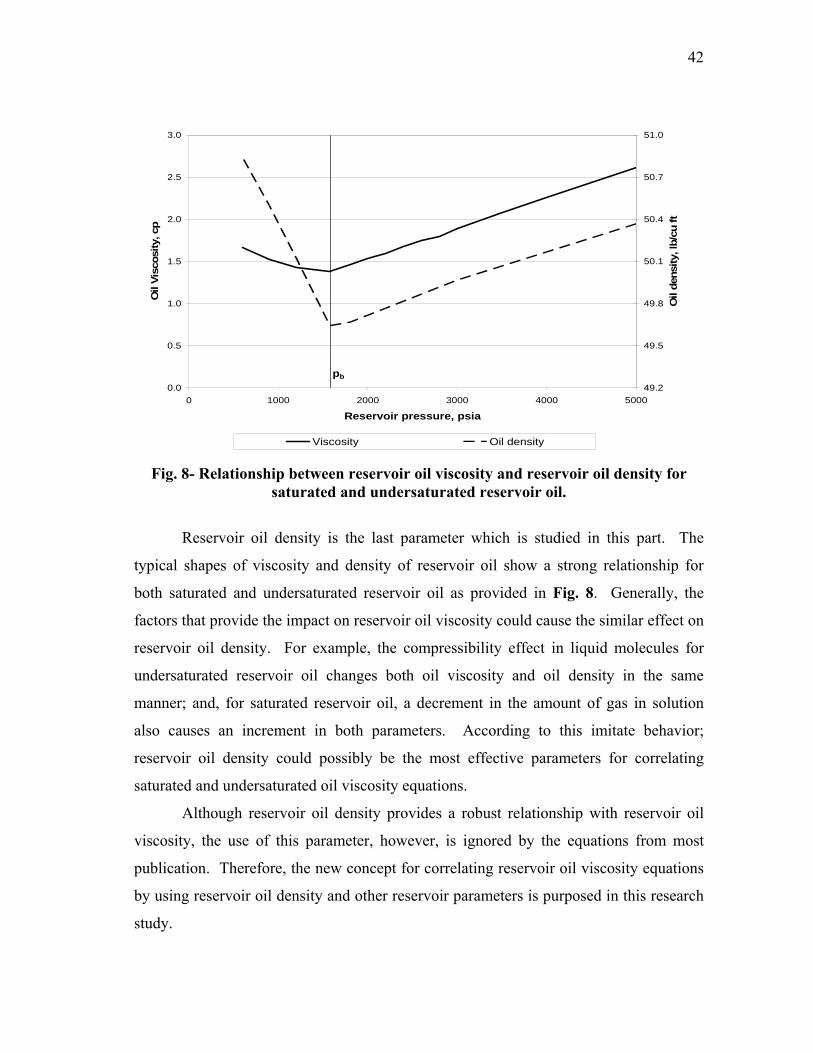
42
0.0
0.5
1.0
1.5
2.0
2.5
3.0
0 1000 2000 3000 4000 5000
Reservoir pressure, psia
Oil
Visc
osity
, cp
49.2
49.5
49.8
50.1
50.4
50.7
51.0
Oil
dens
ity, l
b/cu
ft
Viscosity Oil density
pb
Fig. 8- Relationship between reservoir oil viscosity and reservoir oil density for
saturated and undersaturated reservoir oil.
Reservoir oil density is the last parameter which is studied in this part. The
typical shapes of viscosity and density of reservoir oil show a strong relationship for
both saturated and undersaturated reservoir oil as provided in Fig. 8. Generally, the
factors that provide the impact on reservoir oil viscosity could cause the similar effect on
reservoir oil density. For example, the compressibility effect in liquid molecules for
undersaturated reservoir oil changes both oil viscosity and oil density in the same
manner; and, for saturated reservoir oil, a decrement in the amount of gas in solution
also causes an increment in both parameters. According to this imitate behavior;
reservoir oil density could possibly be the most effective parameters for correlating
saturated and undersaturated oil viscosity equations.
Although reservoir oil density provides a robust relationship with reservoir oil
viscosity, the use of this parameter, however, is ignored by the equations from most
publication. Therefore, the new concept for correlating reservoir oil viscosity equations
by using reservoir oil density and other reservoir parameters is purposed in this research
study.
43
Plotting Reservoir Oil Viscosity Against Field-measured Parameters
An empirical approach for evaluating the effective parameters for viscosity
correlation equations is provided to support the assumption that made in the previous
part. By plotting the reservoir oil viscosity against other reservoir parameters, the trend
of the plots could imply the interrelation between these parameters. The database,
including 183 completed PVT reports, is used to conduct this approach. The plots are
separated for saturated and undersaturated reservoir oil in order to clarify the trend of
reservoir parameters for each type of reservoir oil.
For saturated oil reservoir, oil viscosity is plotted against reservoir temperature,
stock-tank oil gravity, solution gas-oil ratio, and reservoir oil density as shown in Fig. 9
through Fig. 12. Reservoir temperature and stock-tank oil gravity are the best
parameters for correlating a dead oil viscosity equation. Testing both parameters,
however, is performed in this part to find out whether they possibly have an effect on
saturated oil viscosity. Solution gas-oil ratio and reservoir oil density are also tested to
support the assumption that they are the potential parameters for correlating a saturated
oil viscosity equation.
To present a reasonable interpretation of the plots, saturated oil viscosity is
plotted in a logarithmic coordinate while other parameters are plotted in a Cartesian
coordinate. The plot of saturated oil viscosity against reservoir temperature is shown in
Fig. 9. A tremendous scattering of the data indicates a weak relationship between these
parameters and confirms an unprofitable use of reservoir temperature for correlating a
saturated oil viscosity equation. From this reason, reservoir temperature is not the main
contributor for the accuracy of saturated oil viscosity correlation equations.
The plot of oil viscosity versus stock-tank oil gravity provides some relationships
as shown in Fig. 10. Theoretically, stock-tank oil gravity is a direct function of stock-
tank oil density; and reservoir oil density indicates a strong relationship with reservoir
oil viscosity. Therefore, one can imply that both stock-tank oil gravity and stock-tank
oil density could have some relationship with saturated oil viscosity. Although there is
some scattering in this plot, the trend of the plot indicates that an increment in stock-tank

44
oil gravity causes a reduction in saturated oil viscosity. Hence stock-tank oil gravity
could possibly be a potential independent variable for correlating not only dead oil
viscosity but also saturated oil viscosity equations.
A relationship between saturated oil viscosity and solution gas-oil ratio, as
presented in Fig. 11, indicates that a decrement in solution gas-oil ratio causes an
increment in saturated oil viscosity, which follows the theoretical explanation in the
previous section. A tremendous increment of oil viscosity at low solution gas-oil ratio,
for the values less than 150 scf/STB, causes by large and complex molecules, like
asphaltene, in high viscous reservoir oil or oil with Non-Newtonian behavior.
According to this phenomenon, using solution gas-oil ratio to correlate viscosity
equations for high viscous oil is definitely concerned in this work. From this reason,
solution gas-oil ratio may not be a perfect variable for correlating a saturated oil
viscosity equation.
Plotting reservoir oil viscosity against reservoir oil density, as shown in Fig. 12,
indicates a strong relationship. An increment in oil density corresponds to an increment
in oil viscosity. Noticeably, unlike solution gas-oil ratio, oil density function smoothly
applies with the high viscous oil. Based on this relationship, reservoir oil density has a
high potential to be the most powerful independent variable for correlating a saturated
oil viscosity equation.

45
0.1
1
10
100
1000
50 100 150 200 250 300 350
Reservoir temperature, oF
Oil
visc
osity
, cp
Fig. 9- Saturated oil viscosity data are plotted against reservoir temperature data.
0.1
1
10
100
1000
10 15 20 25 30 35 40 45 50 55 60
Stock tank oil gravity, oAPI
Oil
visc
osity
, cp
Fig. 10- Saturated oil viscosity data are plotted against stock-tank oil gravity data.

46
0.1
1
10
100
1000
0 100 200 300 400 500 600 700 800 900 1000 1100 1200 1300 1400 1500 1600
Solution gas-oil ratio, scf/STB
Oil
visc
osity
, cp
Fig. 11- Saturated oil viscosity data are plotted against solution gas-oil ratio data.
0.1
1
10
100
1000
30 35 40 45 50 55 60
Oil density, lb/ft3
Oil
visc
osity
, cp
Fig. 12- Saturated oil viscosity data are plotted against reservoir oil density data.

47
For undersaturated reservoir oil, viscosity data are plotted against reservoir
pressure, bubble point pressure, bubble point viscosity, and reservoir oil density, as
shown in Fig. 13 through Fig. 16. Based on the results of comparing typical shape
section, reservoir oil density has a huge effect on reservoir oil viscosity and qualifies as a
potential independent variable for correlating an undersaturated oil viscosity equation.
In addition, reservoir pressure, bubble point pressure, and bubble point oil viscosity are
also studied in this section because they are the most often used parameters in published
correlation equations. These selected reservoir parameters are examined their
relationship with viscosity of undersaturated reservoir oil by using the same procedure.
The oil viscosity data are plotted versus reservoir pressure data as shown in Fig.
13. The plot shows a tremendous distribution which conceals the confidence of using
reservoir pressure to correlate an undersaturated oil viscosity equation. A reservoir oil
viscosity indicates a better relationship with a bubble point pressure as shown in Fig. 14;
but the data distribution in this plot still shows a weak relationship between both
parameters. These plots indicate an uncertainty about using a pressure function, which is
often used in most publications, in undersaturated oil viscosity correlation equations. To
avoid this uncertainty, a pressure function should be replaced with other reservoir
functions that show better relationship with reservoir oil viscosity and validate the
connection of oil viscosity at the bubble point pressure.
Bubble point oil viscosity is definitely required in an undersaturated oil viscosity
correlation equation; because it represents the value of oil viscosity at the exact bubble
point pressure. The plot of reservoir oil viscosity versus bubble point viscosity, as
shown in Fig. 15, indicates the relationship between both parameters.
Plotting viscosity versus density of undersaturated reservoir oil, as shown in Fig.
16, indicates a robust relationship. The trend of this plot is quite obvious and
corresponds to the behavior of both parameters that provided in a comparing typical
shape section. Again, the effect of high viscous fluid is not applied on reservoir oil
density. Based on this information, reservoir oil density has a high potential to be used
as a powerful independent variable to correlate an undersaturated oil viscosity equation.

48
0.1
1
10
100
1000
0 1000 2000 3000 4000 5000 6000 7000 8000
Reservoir pressure, psig
Oil
visc
osity
, cp
Fig. 13- Undersaturated oil viscosity data are plotted against reservoir pressure
data.
0.1
1
10
100
1000
0 1000 2000 3000 4000 5000 6000 7000 8000
Bubble point pressure, psig
Oil
visc
osity
, cp
Fig. 14- Undersaturated oil viscosity data are plotted against bubble point pressure
data.

49
0.1
1
10
100
1000
0.1 1 10 100 1000
Bubble point viscosity, cp
Oil
visc
osity
, cp
Fig. 15- Undersaturated oil viscosity data are plotted against bubble point viscosity
data.
0.1
1
10
100
1000
30 35 40 45 50 55 60
Oil density, lb/ft3
Oil
visc
osity
, cp
Fig. 16- Undersaturated oil viscosity data are plotted against reservoir oil density
data.
50
Summary
The results of theoretical and empirical studies about the relationship between reservoir
oil viscosity and other reservoir parameters can be summarized as follows:
• Reservoir temperature and stock-tank oil gravity, which are considered
reservoir constants, have a relatively strong relationship with dead oil
viscosity. Reservoir temperature, however, is not a good parameter to
correlate saturated and undersaturated oil viscosities, while stock-tank oil
gravity can correlate to saturated oil viscosity.
• Solution gas-oil ratio has a relationship with saturated oil viscosity; but, at
low solution gas-oil ratio, the high viscous fluid with Non-Newtonian
behavior provides a big impact on their relationship.
• Reservoir and bubble point pressures show a weak relationship with
undersaturated oil viscosity and these parameters probably are not good for
correlating undersaturated oil viscosity equations.
• Bubble point oil viscosity definitely has a strong relationship with reservoir
oil viscosity and it is a requisite parameter for verifying the information at the
bubble point pressure.
• Reservoir oil density indicates a robust relationship with reservoir oil
viscosity and has the possibility of being the most effective parameter for
correlating viscosity equations of saturated and undersaturated reservoir oil.

51
CHAPTER VI
EVALUATING THE EFFICIENCY OF OIL VISCOSITY
CORRELATION EQUATIONS FROM THE LITERATURE
This chapter provides overall information about the performance of published oil
viscosity correlation equations when they are applied with a database that provides in
this study. Saturated and undersaturated oil viscosity correlation equations are tested in
terms of statistical error analysis functions. The graphical interpretations of calculated
versus laboratory-measured oil viscosities are available in Appendix A and B.
Statistical and Graphical Error Analysis Methods
Statistical and graphical error analyses are the popular method for evaluating the
efficiency of oil viscosity correlation equations. Statistical error analysis method
determines the overall accuracy of calculated oil viscosity by using various statistical
functions. Average relative error, ARE, and average absolute relative error, AARE, are
the statistical error analysis functions that use in this research and they are as follows:
Average Relative Error
∑=
−=
N
i meas
meascalc
NARE
1
100µ
µµ,…………………………......………….…… (67)
Average Absolute Relative Error
∑=
−=
N
i meas
meascalc
NAARE
1
100µ
µµ,…………………………..……………….. (68)
52
Where µcalc and µmeas are calculated and measured reservoir oil viscosities and N
is the total number of data points in the database. Generally, ARE represents the bias of
the calculated results; and the errors are more equally distributed in both positive and
negative sides if the lower value of ARE is obtained. AARE indicates the absolute
deviation of the calculated oil viscosity from the laboratory-measured oil viscosity. The
lower the value of AARE, the better the precision of calculated oil viscosity can be
achieved from correlation equations.
Graphical error analysis is plotting of calculated versus laboratory-measured oil
viscosities on either Cartesian or logarithmic coordinates. Then the perfect correlation
line, which is a 45o straight line, is drawn on the figure in order to represent the
equalization between calculated and measured oil viscosities. For the high performance
correlation equations, the position of plotted data would locate very close to this perfect
correlation line.
Results of Performance Tests
The published correlation equations are evaluated their performance in terms of
statistical error analysis functions as shown in Table 7 and Table 8 for saturated and
undersaturated reservoir oil. The order in this table is arranged by the increment of
AARE. The results of graphical error analysis for published viscosity correlation
equations of saturated and undersaturated reservoir oil are also available in Appendix A
and Appendix B, respectively.
For saturated reservoir oil, the top three published correlation equations are
provided by Beggs and Robinson4, De Ghetto, Paone, and Villa21, and Dindoruk and
Christman29. For undersaturated reservoir oil, the top three published equations are
provided by Dindoruk and Christman29, Petrosky and Farshad23, and Vasquez and
Beggs5. The best viscosity correlation equations for saturated and undersaturated
reservoir oil provide the AARE values of 27.05% and 33.59%, which is considered as
high percentage error. The causes of high erroneous results among these published

53
correlation equations probably come from an error in laboratory PVT information and
the unreliability in correlation equations.
Table 7- A performance of published viscosity correlation equations for saturated reservoir oil
using provided database Predicted saturated oil viscosity Published correlation equations
ARE, % AARE, % Beggs and Robinson (1975) -6.33 27.05
De Ghetto, Paone, and Villa (1994) 1.97 28.51 Dindoruk and Christman (2001) -10.06 29.24
McCain* (1990) 1.82 29.58 Almehaideb (1997) -5.56 29.61
Petrosky and Farshad (1995) 1.04 29.84 Standing (1977) -4.69 31.22
Elsharkawy and Gharbi (2001) -7.43 31.63 Al-Khafaji, Abdul-Majeed, and Hassoon (1987) -10.58 33.10
Kartoatmodjo and Schmidt (1991) -9.86 33.63 Bergman (1992) 10.74 33.82
Hanafy et al. (1997) 9.70 34.53 Abu-Khamsin and Al-Marhoun (1991) 17.77 38.92
Elsharkawy and Alikhan (1999) 19.86 38.94 Aziz, Govier, and Fogarasi (1972) 24.52 44.25
Khan et al. (1987) 40.94 61.69 Labedi (1992) 53.23 79.48
*Author used the combination of Ng and Egbogah8 correlation and Beggs and Robinson4 correlation
Table 8- A performance of published viscosity correlation equations for undersaturated reservoir oil
using provided database Predicted undersaturated oil viscosity Published correlation equations ARE, % AARE, %
Dindoruk and Christman (2001) -18.26 33.59 Petrosky and Farshad (1995) -9.83 33.99
Vasquez and Beggs (1980) -14.13 34.88 McCain* (1990) -5.29 35.26
De Ghetto, Paone, and Villa (1994) -11.52 35.87 Standing (1977) -17.31 35.87
Hanafy et al. (1997) -6.63 36.26 Elsharkawy and Alikhan (1999) 2.49 36.60
Almehaideb (1997) -10.45 36.79 Abu-Khamsin and Al-Marhoun (1991) 2.15 38.90
Kartoatmodjo and Schmidt (1991) -23.98 39.85 Elsharkwy and Gharbi (2001) -11.80 40.09
Khan et al. (1987) -3.22 40.77 Al-Khafaji, Abdul-Majeed, and Hassoon (1987) 43.39 74.39
Labedi (1992) 49.20 83.44 *Author used the combination of Ng and Egbogah8 correlation, Beggs and Robinson4 correlation, and Vasquez and Beggs5 correlation.
54
Very interesting, the results of graphical error analysis for both saturated and
undersaturated reservoir oil indicate that most published correlation equations can not
perform effectively at high viscosity ranges. These correlation equations were originally
developed by assuming that reservoir oil behaves like a Newtonian fluid, which is not
always true when high viscous oil is in the system. Generally reservoir fluid having oil
viscosity less than 10 cp is considered as a Newtonian fluid; otherwise they could be a
Non-Newtonian fluid21. This Non-Newtonian behavior affects the efficiency of oil
viscometer in laboratory and causes the deviation in laboratory-measured oil viscosity
data. Furthermore, even on the same fluid sample, differences up to 10% between two
measurements by two different equipments are normal at the high viscosity ranges21.
Most correlation developers, however, may not concern about this issue and develop
their oil viscosity correlation equations by using the erroneous information. Therefore,
some hidden errors can degrade the efficiency and the reliability of their correlation
equations.
High viscous reservoir oil and Non-Newtonian behavior are considered as hidden
factors that cause errors in routine laboratory measurement of oil viscosity. These errors
provide an effect on a deficiency for predicting reservoir oil viscosity in most published
correlation equations, which represents the high percentage values of AARE.

55
Summary
From the statistical analysis results the following can be summarized:
• Saturated and undersaturated oil viscosity correlation equations proposed by
Beggs and Robinson4 and Petrosky and Farshad23 give the best overall
statistical error analysis results. Advantages of these equations are requiring
basic input parameters, using a simple calculation method, and providing a
fair accuracy.
• Correlation equations proposed by Dindoruk and Christman29 and De Ghetto,
Paone, and Villa21 predict reservoir oil viscosity with some accuracy but they
are not simply to use and require several input parameters.
• The Abu-Khamsin and Al-Marhoun18 and the Hanafy et al.25 correlation
equations can not provide the precise outcomes; because they use only oil
density at the bubble point pressure, instead of oil density at reservoir
conditions, to correlate their reservoir oil viscosity equations.
• The Khan et al11 and the Labedi19 correlation equations predict reservoir oil
viscosity with the lowest accuracy. The results confirm the unprofitable use
of a bubble point oil viscosity correlation equation in their publications.
• Errors in routine laboratory measurement of oil viscosity provide a direct
effect on the quality of oil viscosity and cause an indirect effect on the
performance of published correlation equations.

56
CHAPTER VII
CORRELATING VISCOSITY EQUATIONS FOR
SATURATED RESERVOIR OIL
All assumptions and methodologies for correlating viscosity of saturated
reservoir oil are presented in this chapter. The main topics are as follows:
• A Statistical Method for Correlating Oil Viscosity Equations
• An Alternating Conditional Expectations Technique
• A Data Reconciliation Technique
• A Forward Stepwise Procedure for Correlating Oil Viscosity Equations
• Errors in Routine Laboratory Measurement of Oil Viscosity
A Statistical Method for Correlating Oil Viscosity Equations
In statistical methods, two main subdivisions of regression analysis are
parametric and nonparametric approach. Parametric approach is often used if the form
of functional relationship between the dependent and independent variables is priori
known or fully described by a finite set of parameters. A prescribed parametric model
might be too limited or too low-dimensional to fit unexpected features36; and,
sometimes, it does not really correspond to the actual data, which is the main problem of
parametric approach. Usually the ultimate goal of parametric regression is to estimate
the coefficients of the intrinsic models. On the other hand, nonparametric approach does
not force the data into a fixed parameterization and not require a priori knowledge about
the true functional form and the error distribution of the observed data. Therefore, the
primary purpose of nonparametric regression is to explore the underlying function of the
actual data between the dependent and independent variables and to offer a flexible tool
for analyzing an unknown relationship36.
57
According to the plots of reservoir oil viscosity against other laboratory-
measured parameters as shown in Chapter V, most relationships between the dependent
and independent variables are not applied with parametric regression. Therefore, an
effective nonparametric regression technique is the best solution for correlating reservoir
oil viscosity equations in this research.
An Alternating Conditional Expectations Technique
In 1985, Breiman and Friedman37 developed an iterative optimal transformation
technique called alternating conditional expectations, ACE. The method of ACE
corroborates the minimum error relationship and establishes the maximum correlation
between the transformed dependent variable and the sum of transformed independent
variables. ACE was applied successfully with petroleum engineering researches in the
past decade. Xue et al.38 (1997) used ACE technique to fit permeability versus porosity
data. McCain et al.39 (1998) correlated a bubble point pressure equation for reservoir
oil. Valkó and McCain40 (2003) developed three correlation equations for bubble point
pressure, solution gas-oil ratios, and surface gas specific gravities.
The first step of ACE algorithm is to find an optimal transformation of the
dependent and independent variables. An iterative procedure to minimize the regression
error between the transformed dependent variable and the sum of transformed
independent variables is performed in order to obtain the optimal transformations.
Individual transformations of the independent variables, x1, x2, ...xn, and the dependent
variable, y, are provided as follows:
( ) ( ) ( ) ( )yfzandxfzxfzxfz nnn 00222111 ...,, ==== ,…..……….… (69)
where z1, z2,…zn are transformed independent variables; f1(.), f2(.),…fn(.) are optimal
transformation functions for independent variables; z0 is a transformed dependent
variable; and f0(.) is an optimal transformation function for dependent variable.
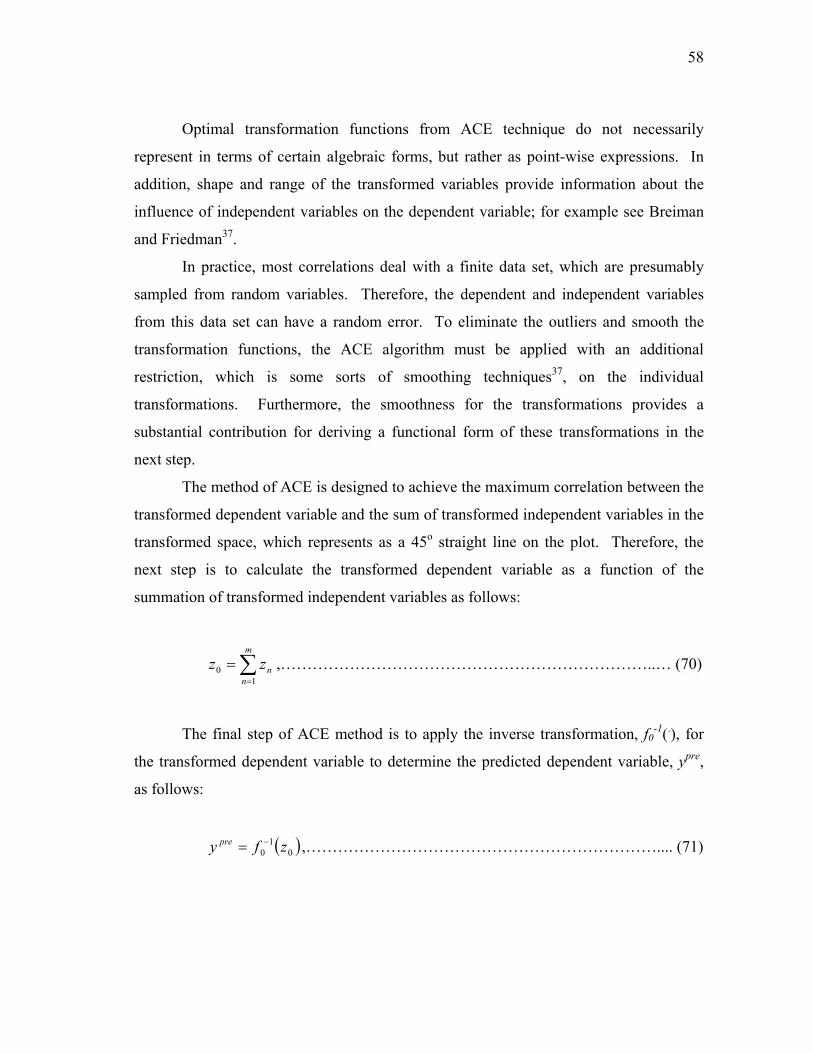
58
Optimal transformation functions from ACE technique do not necessarily
represent in terms of certain algebraic forms, but rather as point-wise expressions. In
addition, shape and range of the transformed variables provide information about the
influence of independent variables on the dependent variable; for example see Breiman
and Friedman37.
In practice, most correlations deal with a finite data set, which are presumably
sampled from random variables. Therefore, the dependent and independent variables
from this data set can have a random error. To eliminate the outliers and smooth the
transformation functions, the ACE algorithm must be applied with an additional
restriction, which is some sorts of smoothing techniques37, on the individual
transformations. Furthermore, the smoothness for the transformations provides a
substantial contribution for deriving a functional form of these transformations in the
next step.
The method of ACE is designed to achieve the maximum correlation between the
transformed dependent variable and the sum of transformed independent variables in the
transformed space, which represents as a 45o straight line on the plot. Therefore, the
next step is to calculate the transformed dependent variable as a function of the
summation of transformed independent variables as follows:
∑=
=m
nnzz
10 ,……………………………………………………………..… (70)
The final step of ACE method is to apply the inverse transformation, f0-1(.), for
the transformed dependent variable to determine the predicted dependent variable, ypre,
as follows:
( )01
0 zfy pre −= ,………………………………………………………….... (71)

59
The results of the ACE algorithm are generally given in form of the transformed
dependent and independent variables; and, sometimes, the results are shown on the plot
of transformed versus original variables. However, no functional forms for these
transformations are provided with the outcomes. Therefore, curve fitting methods are
required to generate functional forms of these transformed variables. The shape of the
individual transformation from ACE algorithm is relatively smooth and simple; and
quadratic polynomials are rather good enough to represent an algebraic form of the
individual transformation.
In this research, the graphical alternating conditional expectation, GRACE,
software38 is used to develop reservoir oil viscosity correlation equations. The program
consists of two sections. For the first section, the program performs ACE algorithm to
obtain the optimal transformations for the dependent and independent variables in the
format of point-by-point plot and table. For the second section, the EXCEL macro is
used to determine the functional form of the optimal transformations by generating the
plots and performing polynomial curve fitting method. Another interesting option in
GRACE software is data reconciliation technique, which describes the quality of the data
used to derive the proposed oil viscosity correlation equations.
A Data Reconciliation Technique
Data reconciliation is a statistical technique created for improving the accuracy
of process data by detecting random errors and adjusting the measured values to satisfy
the provided process constraints. During the past 35 years, this technique has been
developed and designed especially for chemical or petrochemical industries. Nowadays,
it is widely used in refineries, petrochemical plants, mineral processing industries, etc.,
to achieve more economization and better plant operations41. However, this technique is
rarely seen in petroleum engineering; and only few publications apply data reconciliation
technique for investigating the quality of measured observations; for example see Xue et
al.38and Valkó and McCain40.

60
To clarify the quality of all laboratory-measured parameters used for correlating
oil viscosity equations, data reconciliation technique is totally needed in this research.
Fortunately, GRACE software has an option to reconcile all laboratory-measured data in
order to analyze the random error in laboratory procedures. The reconciled values are
obtained by simultaneously adjusting the observed dependent and independent variables
to approach the constraint, which indicates that all reconciled data points must
thoroughly fit the 45o straight line in a transformed space, whereas minimizing the
overall change in each observed value38.
The relationship between reconciled and observed values is presented in terms of
statistical analysis functions, average relative adjustment, ARA, and average absolute
relative adjustment, AARA. The term ARA indicates a bias of the laboratory procedures
for measuring the observed parameters. For example, the extremely low value of ARA
indicates a random error distribution of laboratory-measured data or no bias. The term
AARA presents the quality and the average precision of individual variable in the
database. The lower value of AARA, the better precision of observed parameters is
obtained from the laboratory procedures.
A Forward Stepwise Procedure for Correlating Oil Viscosity Equations
A forward stepwise procedure is applied in this research to correlate saturated oil
viscosity model. The dependent variable, reservoir oil viscosity, is correlated with 8
independent variables, which are stock-tank oil gravity, reservoir temperature, solution
gas-oil ratio, separator gas specific gravity, reservoir pressure, bubble point pressure,
bubble point solution gas oil ratio, and reservoir oil density. For the first step, the 8
bivariate cases involving the dependent variable, y, with each of independent variables in
the first stage, xn,1 (1≤n≤8), are tested to find out which case maximizes a linear
correlation R2 of the transformed variables, z0 and zn,1. Then, an independent variable in
the first stage, xn,1, will be kept in the model. The next step (over the remaining 7
independent variables) includes 7 trivariate cases involving the dependent variable, y,
and an independent variable in the first stage, xn,1, with each of independent variables in

61
the second stage, xn,2 (1≤n≤7). Then independent variables in the second stage that
maximizes a linear correlation R2 between the transformed dependent variable, z0, and
the summation of transformed independent variables, Σ(zn,1, zn,2) will be kept in the
model. This forward selection process is continued until the best independent variable
of the next step improves a linear correlation R2 of the previous step by less than 1
percentage37. A linear correlation R2 is calculated as follows:
( )( )
( ) ( )
2
1 1
2*,
*,
2,0,0
1
*,
*,,0,0
2
⎟⎟⎟⎟⎟
⎠
⎞
⎜⎜⎜⎜⎜
⎝
⎛
−−
−−=
∑ ∑
∑
= =
=
N
i
N
iininii
N
iininii
zzzz
zzzzR ,………………..……………… (72)
where N is total number of data points from the database and *nz is summation of
transformed independent variables as follows:
∑=
=k
jjnn zz
1,
* ,…………………………………………………………….... (73)
where k is total number of independent variables used for correlating oil viscosity
equation.
By using an input option from GRACE, the user can select variables in either the
original form or the natural logarithmic form for positive data. In this research, both
input forms are tested to determine the best correlation equations for saturated oil
viscosity. For the first round of the forward stepwise procedure, the correlation R2
values of bivariate cases, which represents the relationship between the transformed
reservoir oil viscosity and each of transformed field-measured parameters, are provided
in Table 9.

62
Table 9- Finding optimal correlation R2 of transformed variables for bivariate cases (saturated oil viscosity correlation)
Dependent variable First stage independent variable Correlation R2 γg 0.14
ln γg 0.14 p 0.24
ln p 0.24 T 0.27
ln T 0.27 pb 0.37
ln pb 0.38 RS 0.59
ln RS 0.58 RSb 0.61
ln RSb 0.58 API 0.90
ln API 0.90 ρo 0.90
ln µo
ln ρo 0.90
Based on the results of correlation R2 in Table 9, reservoir oil viscosity indicates
a robust relationship with reservoir oil density and stock-tank oil gravity by representing
the correlation R2 values up to 0.90. Solution gas-oil ratio provides a fair relationship
with reservoir oil viscosity as shown by correlation R2 value of 0.58. The lower
correlation R2 values are found from bubble point pressure, reservoir temperature,
reservoir pressure, and separator gas specific gravity, respectively. Very interesting,
these results definitely correspond to the summary given in Chapter V.
The study in Chapter V confirms that oil density has a strong relationship with
oil viscosity; and, noticeably, stock-tank oil gravity can be converted to oil density at the
standard condition or stock-tank oil density. From this reason, using stock-tank oil
density instead of stock-tank oil gravity to correlate a saturated oil viscosity equation
reveals the actual relationship between viscosity and density functions and possibly
improves the performance of correlation equations in this research. This concept is
unique and has never been done by any published correlation equations in petroleum
industry. The equation that converts stock-tank oil gravity to stock-tank oil density is
provided as follows:

63
wsto APIρρ ⎟
⎠⎞
⎜⎝⎛
+=
5.1315.141 ,………………………………………………... (74)
where ρw is water density at standard condition and equals to 62.368 lb/ft3.
Reservoir oil and stock-tank oil densities have very close correlation R2 values
(within 0.005 decimal); but one of them will be chosen as an independent variable in the
first stage. The standard deviation, SD, is performed to determine the distribution of
predicted oil viscosity derived from reservoir oil density and stock-tank oil density.
Theoretically, the lower SD value corresponds to a better estimation of reservoir oil
viscosity. From this reason, the parameter that minimizes the SD value will be used as
an independent variable in the first stage in this work. The SD is calculated as follows:
( )( )1
1
2
−
∑ −= =
N
rrSD
N
ii
,……..……………......………………………………. (75)
where r is a residual, which is the difference between laboratory-measured and predicted
oil viscosity, and can be calculated as follows:
preyyr −= ,……………………………………………………………… (76)
The results show that the value of SD for predicted oil viscosity derived from
reservoir oil density is smaller than that for predicted oil viscosity derived from stock-
tank oil density. Furthermore, the graphical interpretations are also provided by GRACE
software to support these results. The plot of predicted oil viscosity as a function of oil
density versus laboratory-measured oil viscosity indicates a lower distribution around a
45o straight line, as shown in Fig. 17, which represents a better prediction of reservoir oil
viscosity. On the other hand, a huge dispersion on the plot of predicted oil viscosity as a
function of stock-tank oil density versus laboratory-measured oil viscosity, as shown in
Fig. 18, indicates a lower efficiency of this parameter.

64
0.1
1
10
100
1000
0.1 1 10 100 1000
Measured reservoir oil viscosity, cp
Pred
icte
d re
serv
oir o
il vi
scos
ity, c
p
Fig. 17- Comparison of predicted oil viscosity as a function of reservoir oil density
and laboratory-measured oil viscosity provides the SD value of 0.40.
0.1
1
10
100
1000
0.1 1 10 100 1000
Measured reservoir oil viscosity, cp
Pred
icte
d re
serv
oir o
il vi
scos
ity, c
p
Fig. 18- Comparison of predicted oil viscosity as a function of stock-tank oil density
and laboratory-measured oil viscosity provides the SD value of 0.57.

65
Based on these results, reservoir oil density is a primary contributor for
correlating the accurate saturated oil viscosity equation and is used as an independent
variable in the first stage for a bivariate case. However, stock-tank oil density provides a
high potential to be used as an independent variable in the second stage for improving
the correctness of a correlation equation in the next step.
The next step of forward stepwise procedure is searching for an independent
variable in the second stage that can increase a correlation R2 by more than 1%. The
current correlation equation includes the natural logarithmic form of reservoir oil
viscosity as the dependent variable and reservoir oil density as an independent variable
in the first stage. For trivariate cases, the correlation R2 results and the percentage of
improvement are provided in Table 10. The results show that adding stock-tank oil
density into the oil viscosity correlation equation can maximize the correlation R2 value
and can improve the value up to 1.52%. Therefore, an independent variable in the
second stage for correlating a saturated oil viscosity equation is a stock-tank oil density.
However, this miniscule improvement of the correlation R2 possibly indicates the small
influence of adding an independent variable in the second stage in the proposed saturated
oil viscosity correlation equation. Therefore, a careful inspection is very necessary to
avoid the use of redundant independent variables in the proposed equation.
Table 10- Finding optimal correlation R2 of transformed variables for trivariate cases
(saturated oil viscosity correlation) Dependent
variable First stage
independent variable Second stage
independent variable Correlation
R2 Improvement,
% γg 0.90 0.86
ln γg 0.90 0.83 p 0.90 0.14
ln p 0.90 0.17 T 0.91 1.04
ln T 0.91 1.05 pb 0.90 0.49
ln pb 0.90 0.66 RS 0.90 -0.02
ln RS 0.90 0.21 RSb 0.90 0.69
ln RSb 0.90 0.58 ρsto 0.91 1.51
ln µo
ρo
ln ρsto 0.91 1.44

66
For an independent variable in the third stage, the results in Table C-1 show that
the remaining independent variables can not improve correlation R2 values by more than
1%. Some independent variables even decrease a correlation R2 value, which indicates a
low degree of relationship between the dependent and independent variables. Therefore,
the forward stepwise procedure is terminated at the trivariate case; and the proposed
viscosity correlation equation for saturated reservoir oil is provided in terms of reservoir
oil density, as a main contributor, and stock-tank oil density, as a secondary contributor.
In this study, two saturated oil viscosity correlation equations are proposed to
compare the performance. The first oil viscosity equation is correlated as a function of
reservoir oil density only. Then a stock-tank oil density is added in the first equation to
examine the improvement. Either of these correlation equations that precisely predict
saturated oil viscosity will be selected as the proposed saturated oil viscosity correlation
equation in this research.
For the first proposed model (bivariate case), GRACE software provides
graphical interpretation for transformed reservoir oil density, ρo_tr, and the transformed
reservoir oil viscosity, ln µo_tr, as shown in Fig. 19 and Fig. 20. For oil density less than
50 lb/ft3, reservoir oil viscosity increases gradually with increasing oil density; whereas
the oil viscosity rapidly increases at the larger oil density as shown in Fig. 19. This
significant increment causes by the Non-Newtonian flow behavior of high viscous
reservoir oil. The almost linear shape of the transformed viscosity in Fig. 20 indicates
that the natural logarithmic transformation is appropriate for this variable.
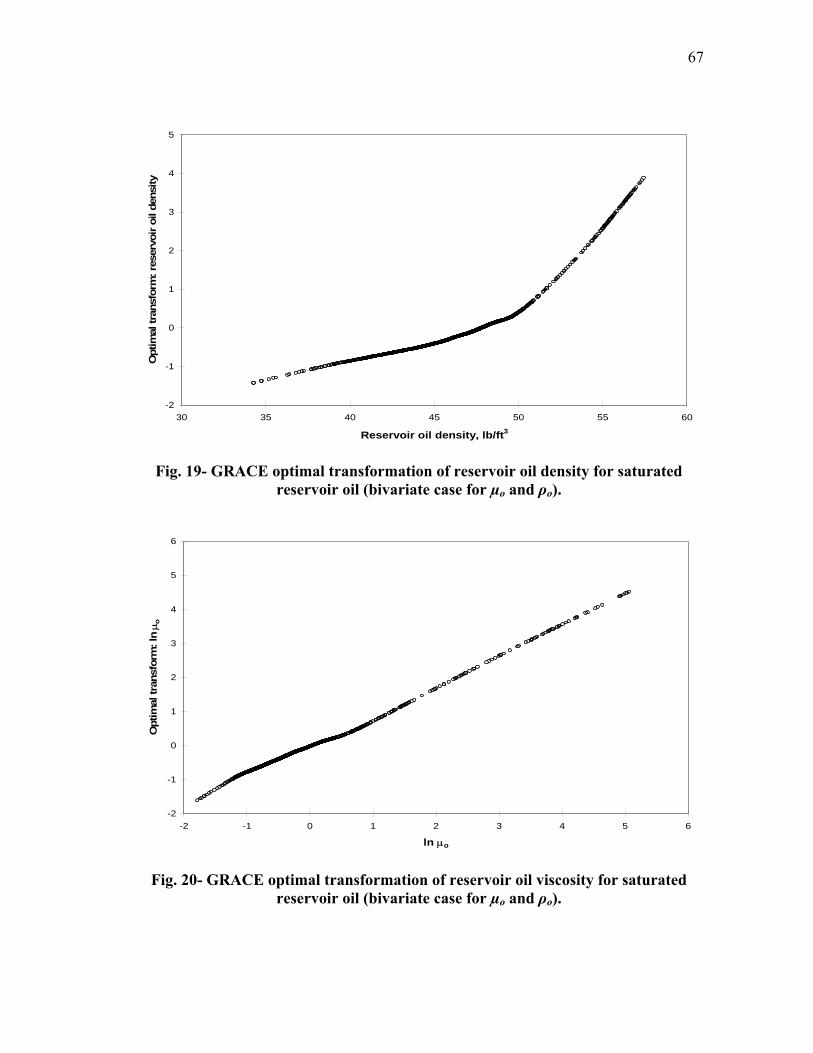
67
-2
-1
0
1
2
3
4
5
30 35 40 45 50 55 60
Reservoir oil density, lb/ft3
Opt
imal
tran
sfor
m: r
eser
voir
oil d
ensi
ty
Fig. 19- GRACE optimal transformation of reservoir oil density for saturated
reservoir oil (bivariate case for µo and ρo).
-2
-1
0
1
2
3
4
5
6
-2 -1 0 1 2 3 4 5 6
ln µo
Opt
imal
tran
sfor
m: l
n µ o
Fig. 20- GRACE optimal transformation of reservoir oil viscosity for saturated
reservoir oil (bivariate case for µo and ρo).

68
Then the curve fitting procedure using low order polynomials is performed on
the transformed reservoir oil density and the inverse transformation of the reservoir oil
viscosity to get their functional forms. The finalize equations represents the third order
polynomial models as follows:
Functional form of the transformed reservoir oil density
633219.410157.0100898.8 234_ −⋅+⋅−⋅⋅= −
oootro ρρρρ ,…………..….... (77)
Functional form of the inverse transformation of the reservoir oil viscosity
)02129.00463.10487.00508.0exp( _2_
3_ +⋅+⋅−⋅= trotrotroo ρρρµ ,…….… (78)
where ρo is reservoir oil density in lb/cu ft and µo is reservoir oil viscosity in cp.
The values of ARE and AARE calculated from the proposed equations are -
0.96% and 25.15%, respectively. Based on the result of ARE, a small bias is found from
the proposed correlation equations, which indicates an equal distribution around a 45o
straight line. The value of AARE from the proposed correlation equation is too high and
is not satisfactory; but it is relatively better than the results from other published
correlation equations that are provided in Chapter VI. The high AARE values from the
proposed and published saturated oil viscosity correlation equations can infer that the
procedure for creating oil viscosity correlation equations is not the main reason of these
high percentage errors; but the actual source of errors comes from the low quality of oil
viscosity in the database. The graphical interpretations of calculated and laboratory-
measured saturated oil viscosity are shown in Fig. 21 and Fig. 22 for Cartesian and
logarithmic coordinates, respectively.
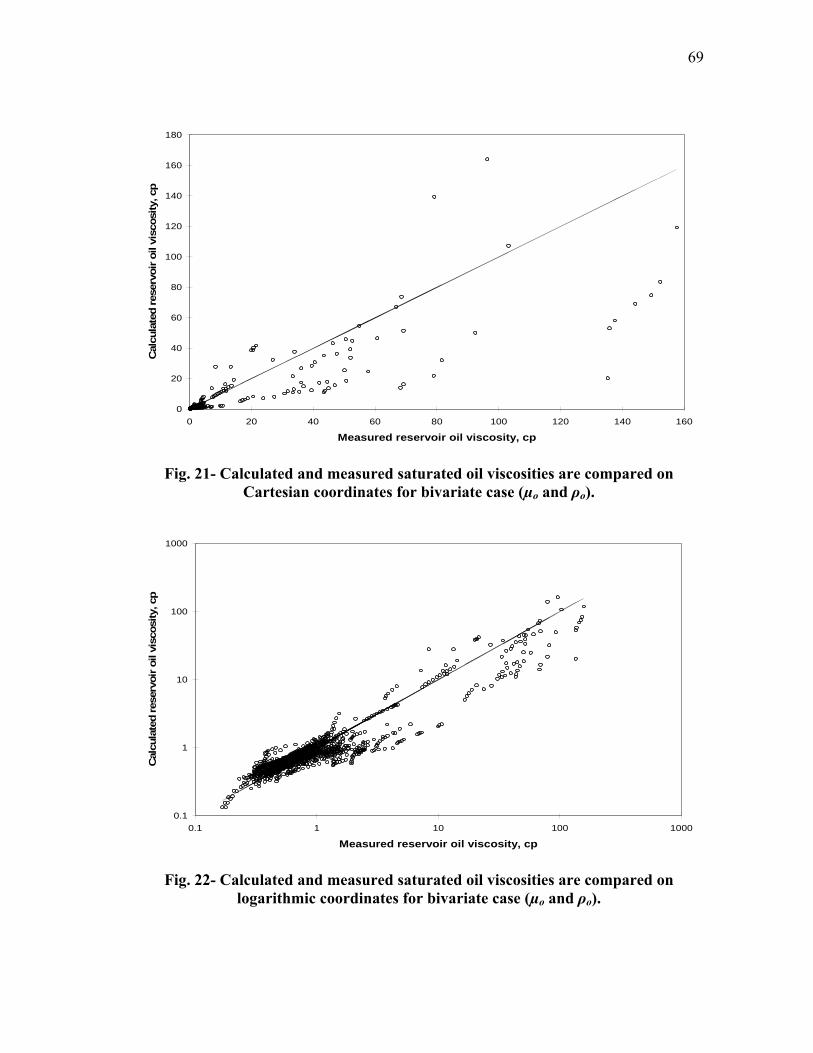
69
0
20
40
60
80
100
120
140
160
180
0 20 40 60 80 100 120 140 160
Measured reservoir oil viscosity, cp
Cal
cula
ted
rese
rvoi
r oil
visc
osity
, cp
Fig. 21- Calculated and measured saturated oil viscosities are compared on
Cartesian coordinates for bivariate case (µo and ρo).
0.1
1
10
100
1000
0.1 1 10 100 1000
Measured reservoir oil viscosity, cp
Cal
cula
ted
rese
rvoi
r oil
visc
osity
, cp
Fig. 22- Calculated and measured saturated oil viscosities are compared on
logarithmic coordinates for bivariate case (µo and ρo).

70
For the next proposed model (trivariate case), reservoir oil viscosity is correlated
with reservoir oil density and stock-tank oil density. The graphical interpretations of
optimal transformations of reservoir oil density, ρo_tr, stock-tank oil density, ρsto_tr, and
oil viscosity, ln µo_tr, provided by GRACE software are shown in Fig. 23, Fig. 24, and
Fig. 25, respectively. The shapes of transformed reservoir oil density and transformed
reservoir oil viscosity are similar to Fig. 19 and Fig. 20 for bivariate case, which indicate
the similar behavior. Based on Fig. 24, the majority of stock-tank oil densities, at the
values less than 55 lb/ft3, scarcely relate with reservoir oil viscosity as shown by a rough
horizontal line at the first section. Then the influence of high viscous reservoir fluid
substantially enhances reservoir oil viscosity at higher stock-tank oil density value as
shown by a sharp increment of a transformed stock-tank oil density. From this reason,
stock-tank oil density may not provide an outstanding improvement for a saturated oil
viscosity correlation equation.
-2
-1
0
1
2
3
4
30 35 40 45 50 55 60
Reservoir oil density, lb/ft3
Opt
imal
tran
sfor
m: r
eser
voir
oil d
ensi
ty
Fig. 23- GRACE optimal transformation of reservoir oil density for saturated
reservoir oil (trivariate case for µo, ρo, and ρsto).
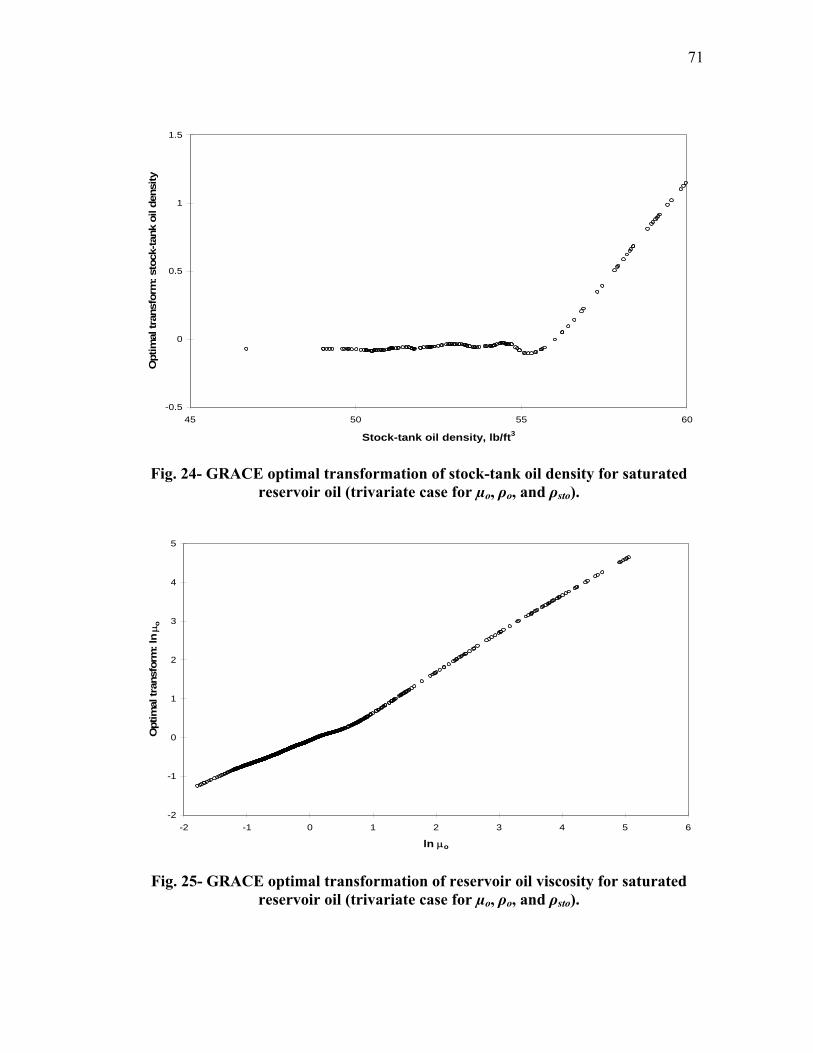
71
-0.5
0
0.5
1
1.5
45 50 55 60
Stock-tank oil density, lb/ft3
Opt
imal
tran
sfor
m: s
tock
-tank
oil
dens
ity
Fig. 24- GRACE optimal transformation of stock-tank oil density for saturated
reservoir oil (trivariate case for µo, ρo, and ρsto).
-2
-1
0
1
2
3
4
5
-2 -1 0 1 2 3 4 5 6
ln µo
Opt
imal
tran
sfor
m: l
n µ o
Fig. 25- GRACE optimal transformation of reservoir oil viscosity for saturated
reservoir oil (trivariate case for µo, ρo, and ρsto).

72
By curve fitting and tuning methods, the final functional form of transformed
dependent and independent variables are provided as follows:
Functional form of the transformed reservoir oil density
4924.366848.206551.0104855.5 234_ −⋅+⋅−⋅⋅= −
oootro ρρρρ ,….....…..... (79)
Functional form of the transformed stock-tank oil density
3629.394797.224394.010818.2 233_ −⋅+⋅−⋅⋅= −
stostostotrsto ρρρρ ,…......... (80)
The summation of transformed independent variables
trstotrotrz __ ρρ += ,……............................................................................. (81)
Functional form of the inverse transformation of the reservoir oil viscosity
)591.14409.12017.002695.0exp( 23 −⋅+⋅−⋅= trtrtro zzzµ ,……….....…..… (82)
where ρo is reservoir oil density in lb/cu ft, ρsto is stock-tank oil density in lb/cu ft, and µo
is reservoir oil viscosity in cp.
The values of ARE and AARE calculated from this case are -0.99% and 25.25%,
which are very similar to the previous case. These unimproved statistical error analysis
functions lead to the summary that stock-tank oil density should not be included in the
proposed saturated oil viscosity correlation equation to prevent the use of a redundant
parameter and to pursue the accuracy criteria. The plots of calculated and laboratory-
measured saturated oil viscosity are shown in Fig. 26 and Fig. 27 for Cartesian and
logarithmic coordinates.
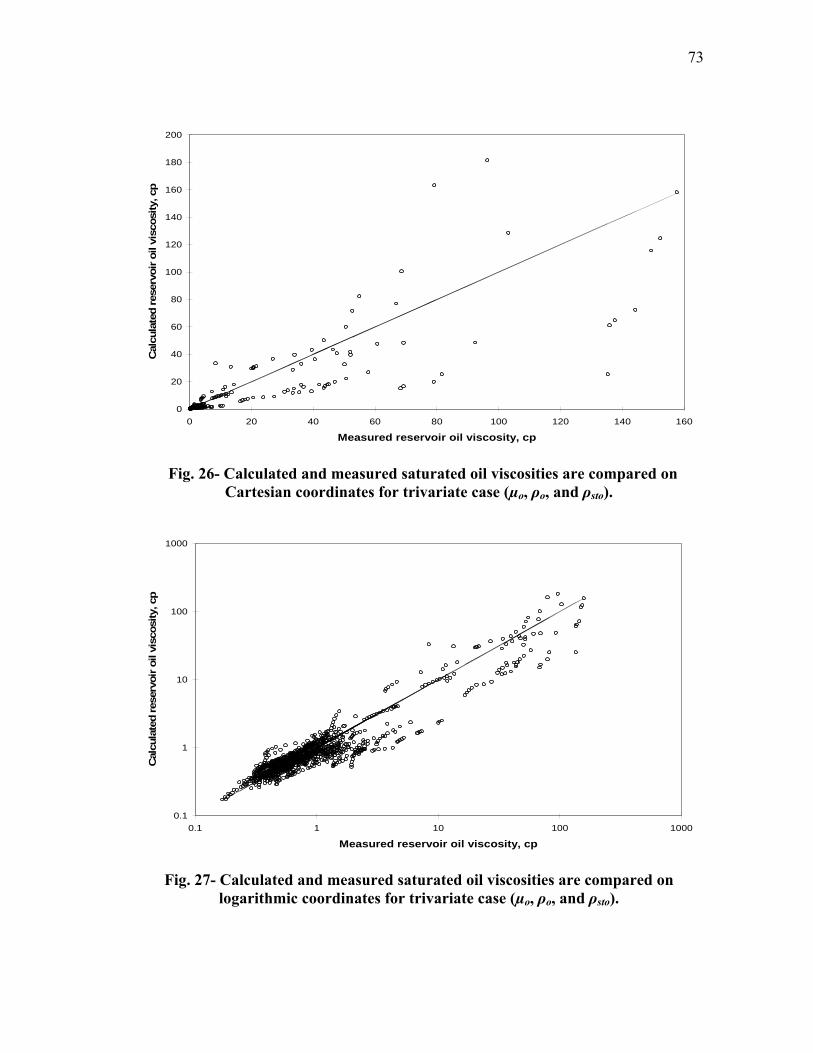
73
0
20
40
60
80
100
120
140
160
180
200
0 20 40 60 80 100 120 140 160
Measured reservoir oil viscosity, cp
Cal
cula
ted
rese
rvoi
r oil
visc
osity
, cp
Fig. 26- Calculated and measured saturated oil viscosities are compared on
Cartesian coordinates for trivariate case (µo, ρo, and ρsto).
0.1
1
10
100
1000
0.1 1 10 100 1000
Measured reservoir oil viscosity, cp
Cal
cula
ted
rese
rvoi
r oil
visc
osity
, cp
Fig. 27- Calculated and measured saturated oil viscosities are compared on
logarithmic coordinates for trivariate case (µo, ρo, and ρsto).
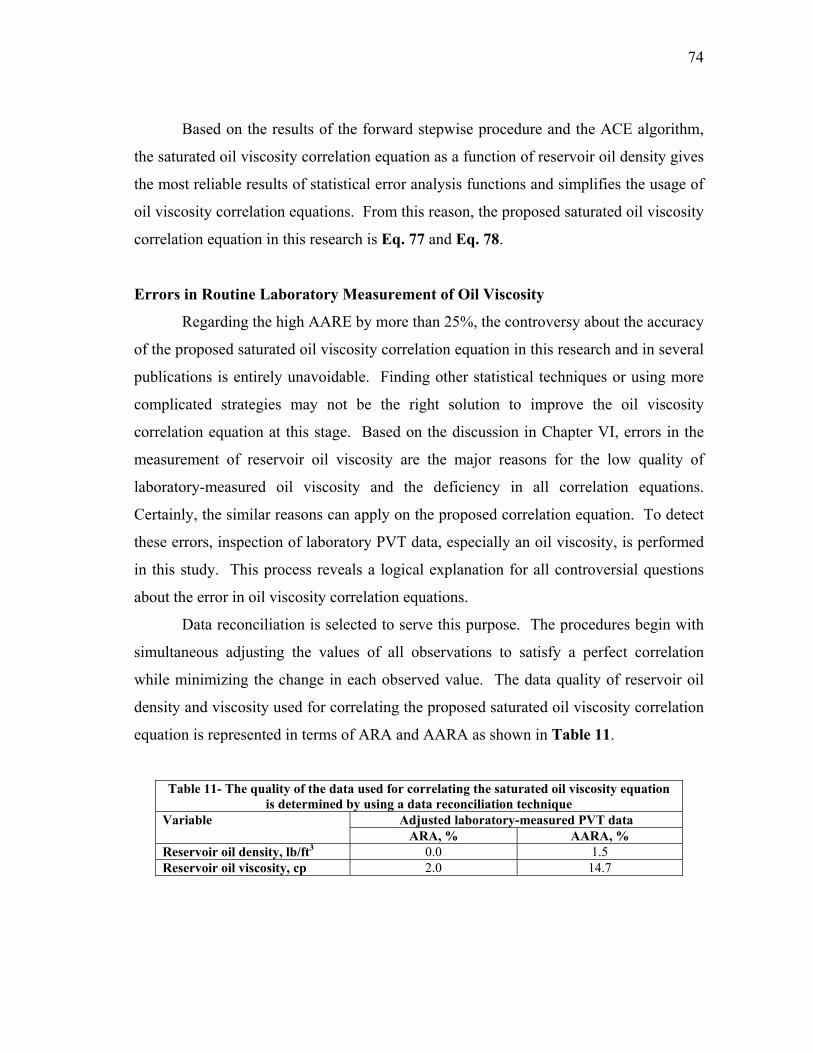
74
Based on the results of the forward stepwise procedure and the ACE algorithm,
the saturated oil viscosity correlation equation as a function of reservoir oil density gives
the most reliable results of statistical error analysis functions and simplifies the usage of
oil viscosity correlation equations. From this reason, the proposed saturated oil viscosity
correlation equation in this research is Eq. 77 and Eq. 78.
Errors in Routine Laboratory Measurement of Oil Viscosity
Regarding the high AARE by more than 25%, the controversy about the accuracy
of the proposed saturated oil viscosity correlation equation in this research and in several
publications is entirely unavoidable. Finding other statistical techniques or using more
complicated strategies may not be the right solution to improve the oil viscosity
correlation equation at this stage. Based on the discussion in Chapter VI, errors in the
measurement of reservoir oil viscosity are the major reasons for the low quality of
laboratory-measured oil viscosity and the deficiency in all correlation equations.
Certainly, the similar reasons can apply on the proposed correlation equation. To detect
these errors, inspection of laboratory PVT data, especially an oil viscosity, is performed
in this study. This process reveals a logical explanation for all controversial questions
about the error in oil viscosity correlation equations.
Data reconciliation is selected to serve this purpose. The procedures begin with
simultaneous adjusting the values of all observations to satisfy a perfect correlation
while minimizing the change in each observed value. The data quality of reservoir oil
density and viscosity used for correlating the proposed saturated oil viscosity correlation
equation is represented in terms of ARA and AARA as shown in Table 11.
Table 11- The quality of the data used for correlating the saturated oil viscosity equation
is determined by using a data reconciliation technique Adjusted laboratory-measured PVT data Variable
ARA, % AARA, % Reservoir oil density, lb/ft3 0.0 1.5 Reservoir oil viscosity, cp 2.0 14.7
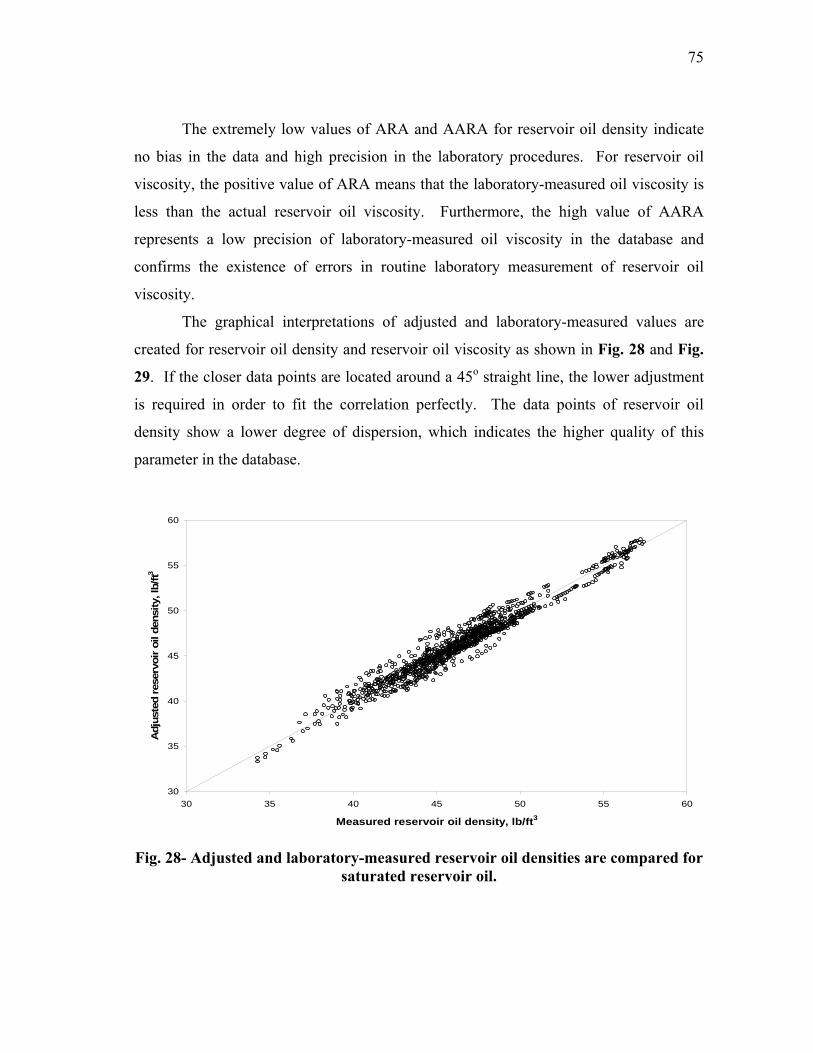
75
The extremely low values of ARA and AARA for reservoir oil density indicate
no bias in the data and high precision in the laboratory procedures. For reservoir oil
viscosity, the positive value of ARA means that the laboratory-measured oil viscosity is
less than the actual reservoir oil viscosity. Furthermore, the high value of AARA
represents a low precision of laboratory-measured oil viscosity in the database and
confirms the existence of errors in routine laboratory measurement of reservoir oil
viscosity.
The graphical interpretations of adjusted and laboratory-measured values are
created for reservoir oil density and reservoir oil viscosity as shown in Fig. 28 and Fig.
29. If the closer data points are located around a 45o straight line, the lower adjustment
is required in order to fit the correlation perfectly. The data points of reservoir oil
density show a lower degree of dispersion, which indicates the higher quality of this
parameter in the database.
30
35
40
45
50
55
60
30 35 40 45 50 55 60
Measured reservoir oil density, lb/ft3
Adj
uste
d re
serv
oir o
il de
nsity
, lb/
ft3
Fig. 28- Adjusted and laboratory-measured reservoir oil densities are compared for
saturated reservoir oil.

76
0.1
1
10
100
1000
0.1 1 10 100 1000
Measured reservoir oil viscosity, cp
Adj
uste
d re
serv
oir o
il vi
scos
ity, c
p
Fig. 29- Adjusted and laboratory-measured reservoir oil viscosities are compared
for saturated reservoir oil.
A number of empirical studies show that (1) the error in laboratory-measured oil
viscosity is a direct proportion of the type of oil viscosity no matter what type of
viscometer is used in the laboratory; (2) comparative measurements of oil viscosity by
different laboratories on the same sample can provide the deviation by up to 20%; and
(3) laboratory measurements of the viscosity of oil with gas in solution always consist of
several sources of error2. Based on these statements, there are several hidden factors that
cause errors in routine laboratory measurement of oil viscosity. In this research, two
major hidden factors, besides high viscous oil and Non-Newtonian behavior as discussed
in Chapter VI, are provided as follows:
First, reservoir oil viscosity could be either Newtonian or Non-Newtonian fluid
depending on the reservoir conditions. Sometimes, they are in the transient stage while
changing the reservoir pressure. This unpredictable transition of reservoir oil viscosity is
considered as a hidden factor because there are no effective viscometers that can
measure oil viscosity at this transient stage. Therefore, an additional error can be added
in laboratory-measured oil viscosity while changing the pressure of viscometers.

77
Second, another hidden factor is the amount of alphaltenes in petroleum fluid.
Asphaltenes are large molecules that do not dissolve in petroleum fluid but are dispersed
as collides15. The degree of dispersion of alphaltenes indicates whether the petroleum
fluid is a Newtonian or Non-Newtonian fluid. Non-Newtonian fluid, generally, has a
coarse dispersion of asphaltene particles42, which substantially escalate the values of
reservoir oil viscosity. These conglomerate asphaltenes are a problem that most oil
viscometers could not handle.
Other minor hidden factors that possibly affect the properties of oil viscosity,
especially Non-Newtonian fluid, and cause error in oil viscosity measurement are
temperature, shear rate, measuring conditions, time, pressure, previous history,
composition and additives, and special characteristics of dispersions and emulsions43.
Nowadays, most service companies use a rolling ball viscometer in a routine
laboratory measurement to measure oil viscosity. Although the laboratory-measured oil
viscosity from these service companies definitely contains the errors, but these errors
actually cause by an inefficiency of the viscometers. From this standpoint, the
procedures used by service companies for measuring reservoir oil viscosity should not
be discredited. The laboratory-measured oil viscosity from the service companies,
however, is widely acceptable in petroleum industries and is accurate enough to handle
most of engineering calculation.
As long as the erroneous laboratory-measured oil viscosity data have been used
for correlating the oil viscosity equations, none of existing statistical techniques or
mathematical strategies would create the correlation equations with high efficiency.
Therefore, all correlation developers should be concerned about these expected errors
from the experimental data and admit the quality of their oil viscosity correlation
equations if they have a low level of accuracy.

78
CHAPTER VIII
CORRELATING VISCOSITY EQUATIONS FOR
UNDERSATURATED RESERVOIR OIL
This chapter provides all information about correlating the undersaturated oil
viscosity model. The assumption and methodology are similar to the previous chapter.
The most concerning issue for developing the undersaturated oil viscosity model is the
continuity of bubble point oil viscosity, µob, provided by saturated and undersaturated oil
viscosity correlation equations. A set of correlation equations would be useless unless
the connection at the bubble point oil viscosity is validated. Some published correlation
equations13, 14, 16 are not aware of this important concept and release a set of oil viscosity
correlation equations that provides the inconsistent oil viscosities at the bubble point
pressure.
The Effective Methodology for Correlating Undersaturated Oil Viscosity Equations
Two familiar formats for undersaturated oil viscosity equations from literature
that verify the connection of the bubble point oil viscosity are as follows:
• a
bobo p
p⎟⎟⎠
⎞⎜⎜⎝
⎛= µµ
• ( )bobo ppa −+= µµ
At the bubble point pressure, the pressure functions are removed; and the
undersaturated oil viscosity is equal to the bubble point oil viscosity, which verify the
continuity of the correlation equation. The exponent, a, of an undersaturated oil
viscosity equation is derived from the plot of oil viscosity function against pressure
function and is usually correlated with bubble point pressure, stock-tank oil gravity,
bubble point solution gas-oil ratio, and bubble point oil viscosity.

79
Most published correlation equations use the pressure functions to validate this
connection. Oil density, however, has a strong relationship with oil viscosity as
discussed in Chapter V; and it should replace a pressure function in an undersaturated oil
viscosity correlation equation effectively. Therefore, a breakthrough concept of using
oil density function, instead of pressure function, for validation purpose is introduced in
this study and is provided as follows:
a
ob
oobo ⎟⎟
⎠
⎞⎜⎜⎝
⎛=
ρρ
µµ ,…………………………………………………………. (83)
The plot of viscosity function versus density function on the logarithmic
coordinates indicates the slope which nearly is a straight line and the interception at the
origin. In this research, slope or exponent, a, from 183 PVT reports are correlated with
reservoir temperature, separator gas specific gravity, bubble point pressure, bubble point
solution gas-oil ratio, bubble point oil density, and stock-tank oil density to determine
the most effective equation. Bubble point oil viscosity, however, is not considered as an
independent variable because of two reasons. First, laboratory-measured oil viscosity is
relatively inconsistent and always has an error. Using an erroneous value as an
independent variable would not improve the efficiency of the proposed correlation
equation. Second, bubble point oil viscosity calculated from saturated oil viscosity
correlation potentially increases an error in the undersaturated oil viscosity model. By
using a calculated input rather than a measured input in an equation, the error of the
equation would definitely combine with the error made on the calculated input even they
has been calculated with the best correlation21.
A Forward Stepwise Procedure for Correlating the Exponent
The next step is using the forward stepwise procedure to determine the effective
independent variable for correlating the exponent, a. The procedures begin with finding
an independent variable in the first stage that maximizes correlation R2 values. Table 12

80
provides correlation R2 values for the bivariate cases, which represent the relationship
between the transformed exponent and each of transformed laboratory-measured
variables.
Table 12- Finding optimal correlation R2 of transformed variables for bivariate cases
(undersaturated oil viscosity correlation) Dependent variable First stage independent variable Correlation R2
γg 0.15 ln γg 0.15
T 0.24 ln T 0.25 pb 0.27
ln pb 0.27 RSb 0.47
ln RSb 0.48 ρsto 0.62
ln ρsto 0.61 ρob 0.71
ln a
ln ρob 0.71
Based on the results, the maximal correlation R2 value is the results of correlating
the exponent, a, with the bubble point oil density function. Therefore, bubble point oil
density has a robust relationship with the exponent, a, and is used as an independent
variable in the first stage. For trivariate cases, the correlation R2 values and the
improvement percentage are provided in Table 13.
Table 13- Finding optimal correlation R2 of transformed variables for trivariate cases
(undersaturated oil viscosity correlation) Dependent
variable First stage
independent variable Second stage
independent variable Correlation
R2 Improvement,
% T 0.716 0.61
ln T 0.716 0.68 ρsto 0.721 1.26
ln ρsto 0.720 1.25 γg 0.724 1.71
ln γg 0.724 1.72 RSb 0.726 2.06
ln RSb 0.726 2.08 pb 0.746 4.84
ln a
ln ρob
ln pb 0.748 5.12
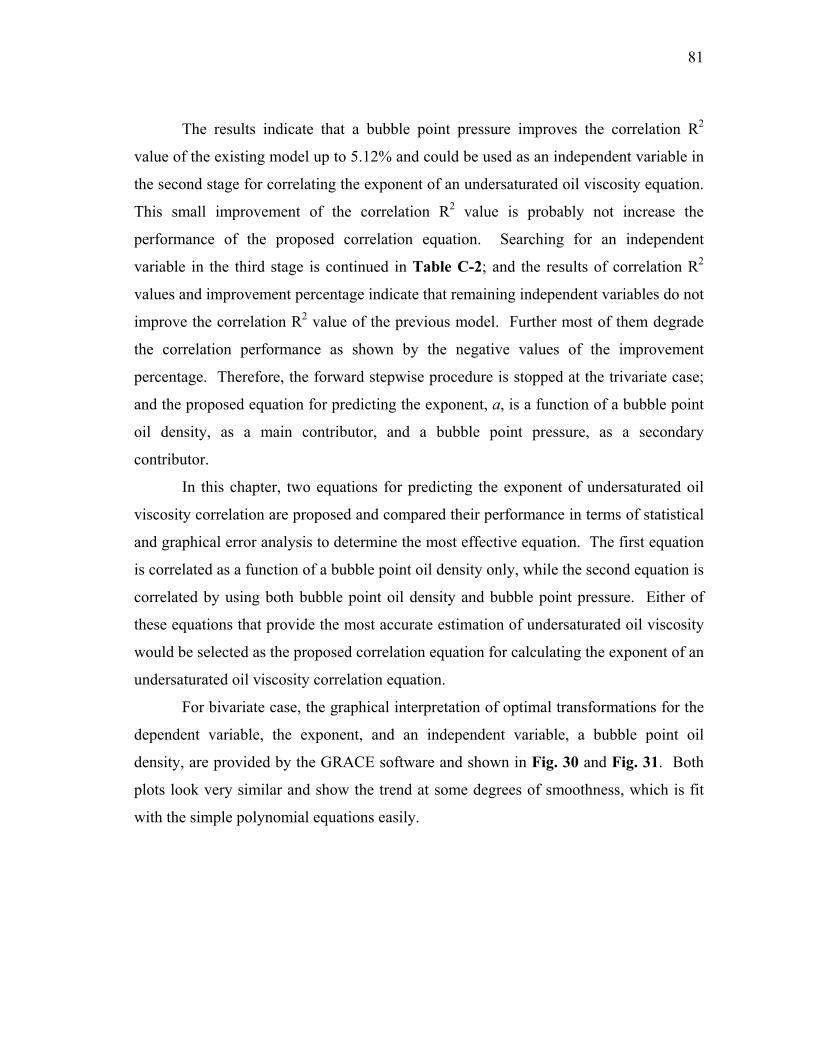
81
The results indicate that a bubble point pressure improves the correlation R2
value of the existing model up to 5.12% and could be used as an independent variable in
the second stage for correlating the exponent of an undersaturated oil viscosity equation.
This small improvement of the correlation R2 value is probably not increase the
performance of the proposed correlation equation. Searching for an independent
variable in the third stage is continued in Table C-2; and the results of correlation R2
values and improvement percentage indicate that remaining independent variables do not
improve the correlation R2 value of the previous model. Further most of them degrade
the correlation performance as shown by the negative values of the improvement
percentage. Therefore, the forward stepwise procedure is stopped at the trivariate case;
and the proposed equation for predicting the exponent, a, is a function of a bubble point
oil density, as a main contributor, and a bubble point pressure, as a secondary
contributor.
In this chapter, two equations for predicting the exponent of undersaturated oil
viscosity correlation are proposed and compared their performance in terms of statistical
and graphical error analysis to determine the most effective equation. The first equation
is correlated as a function of a bubble point oil density only, while the second equation is
correlated by using both bubble point oil density and bubble point pressure. Either of
these equations that provide the most accurate estimation of undersaturated oil viscosity
would be selected as the proposed correlation equation for calculating the exponent of an
undersaturated oil viscosity correlation equation.
For bivariate case, the graphical interpretation of optimal transformations for the
dependent variable, the exponent, and an independent variable, a bubble point oil
density, are provided by the GRACE software and shown in Fig. 30 and Fig. 31. Both
plots look very similar and show the trend at some degrees of smoothness, which is fit
with the simple polynomial equations easily.

82
-1.5
-1.0
-0.5
0.0
0.5
1.0
1.5
2.0
3.5 3.6 3.7 3.8 3.9 4.0 4.1
ln ρob
Opt
imal
tran
sfor
m: l
n ρ o
b
Fig. 30- GRACE optimal transformation of bubble point oil density for
undersaturated reservoir oil (bivariate case for µo and ρo).
-2.5
-1.5
-0.5
0.5
1.5
2.5
-0.5 0.5 1.5 2.5 3.5 4.5
ln a
Opt
imal
tran
sfor
m: l
n a
Fig. 31- GRACE optimal transformation of the exponent for undersaturated
reservoir oil (bivariate case for µo and ρo).
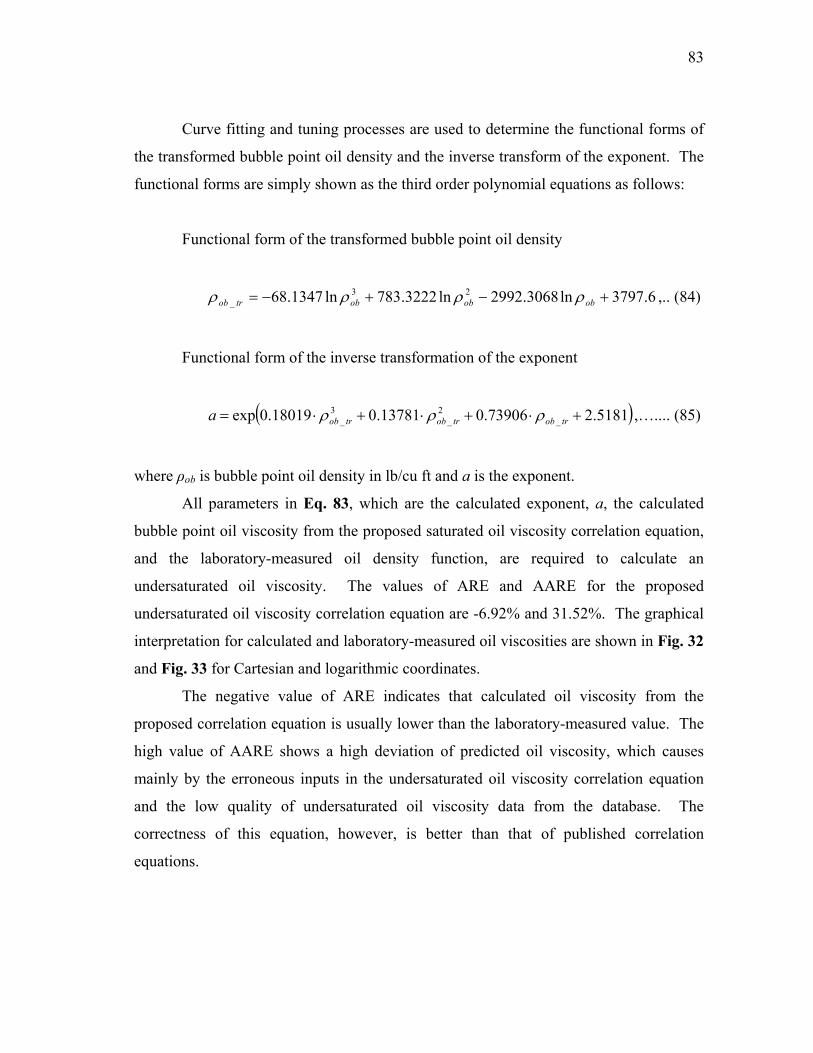
83
Curve fitting and tuning processes are used to determine the functional forms of
the transformed bubble point oil density and the inverse transform of the exponent. The
functional forms are simply shown as the third order polynomial equations as follows:
Functional form of the transformed bubble point oil density
6.3797ln3068.2992ln3222.783ln1347.68 23_ +−+−= obobobtrob ρρρρ ,.. (84)
Functional form of the inverse transformation of the exponent
( )5181.273906.013781.018019.0exp _2
_3
_ +⋅+⋅+⋅= trobtrobtroba ρρρ ,….... (85)
where ρob is bubble point oil density in lb/cu ft and a is the exponent.
All parameters in Eq. 83, which are the calculated exponent, a, the calculated
bubble point oil viscosity from the proposed saturated oil viscosity correlation equation,
and the laboratory-measured oil density function, are required to calculate an
undersaturated oil viscosity. The values of ARE and AARE for the proposed
undersaturated oil viscosity correlation equation are -6.92% and 31.52%. The graphical
interpretation for calculated and laboratory-measured oil viscosities are shown in Fig. 32
and Fig. 33 for Cartesian and logarithmic coordinates.
The negative value of ARE indicates that calculated oil viscosity from the
proposed correlation equation is usually lower than the laboratory-measured value. The
high value of AARE shows a high deviation of predicted oil viscosity, which causes
mainly by the erroneous inputs in the undersaturated oil viscosity correlation equation
and the low quality of undersaturated oil viscosity data from the database. The
correctness of this equation, however, is better than that of published correlation
equations.
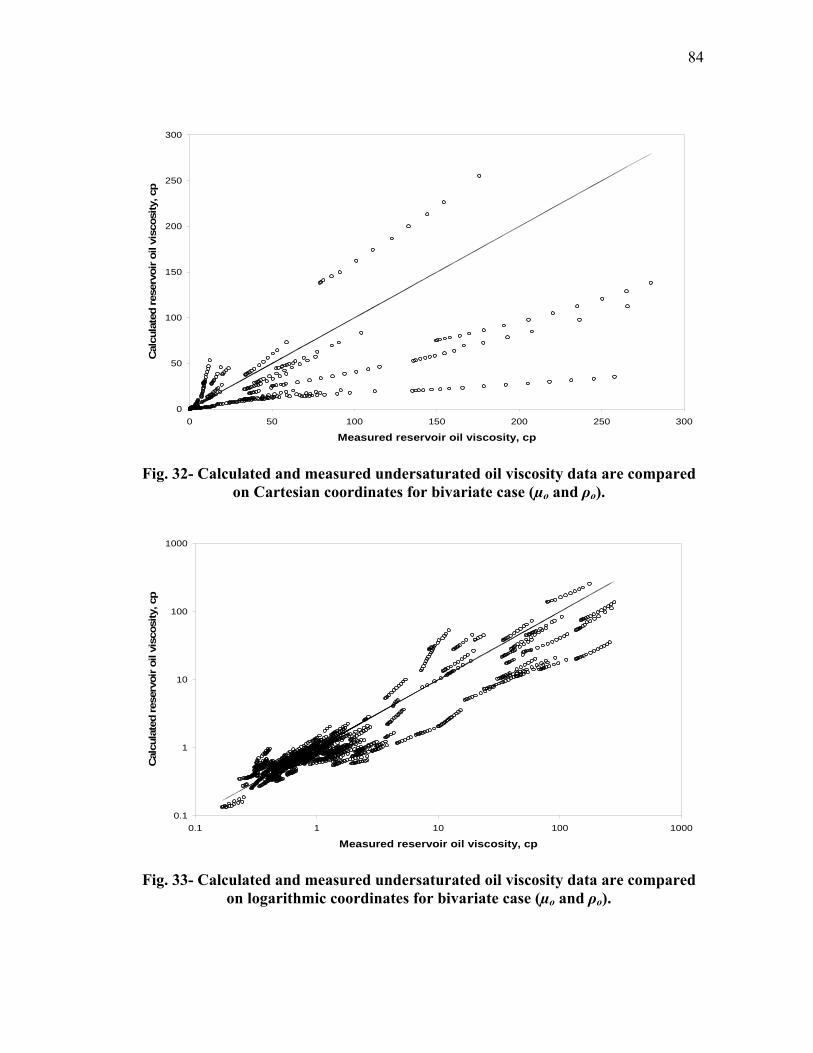
84
0
50
100
150
200
250
300
0 50 100 150 200 250 300
Measured reservoir oil viscosity, cp
Cal
cula
ted
rese
rvoi
r oil
visc
osity
, cp
Fig. 32- Calculated and measured undersaturated oil viscosity data are compared
on Cartesian coordinates for bivariate case (µo and ρo).
0.1
1
10
100
1000
0.1 1 10 100 1000
Measured reservoir oil viscosity, cp
Cal
cula
ted
rese
rvoi
r oil
visc
osity
, cp
Fig. 33- Calculated and measured undersaturated oil viscosity data are compared
on logarithmic coordinates for bivariate case (µo and ρo).

85
The data points are equally scattered and reasonably closed to a 45o straight line,
which indicates random distribution and consistency of the proposed undersaturated oil
viscosity correlation equation.
For the trivariate case, a bubble point pressure is used as an independent variable
in the second stage to determine the improvement of the proposed correlation equation.
The optimal transformations of a bubble point oil density, a bubble point pressure, and
the exponent, a, are shown in Fig. 34, Fig. 35, and Fig. 36, respectively. The shapes of
the transformed bubble point oil density and the transformed exponent are similar to the
previous case. Noticeably, the similar shape of transformed exponent indicates the low
influence of adding a bubble point pressure into the proposed correlation equation.
From this reason, a bubble point pressure does not significantly improve the
performance of the proposed correlation equation and is probably not an effective
parameter for correlating the exponent, a, in this research.
-2.0
-1.5
-1.0
-0.5
0.0
0.5
1.0
1.5
2.0
2.5
3.5 3.6 3.7 3.8 3.9 4.0 4.1
ln ρob
Opt
imal
tran
sfor
m: l
n ρ o
b
Fig. 34- GRACE optimal transformation of bubble point oil density for
undersaturated reservoir oil (trivariate case for µo, ρo, and pb).

86
-0.6
-0.4
-0.2
0.0
0.2
0.4
0.6
0.8
4 5 6 7 8 9
ln pb
Opt
imal
tran
sfor
m: l
n p b
Fig. 35- GRACE optimal transformation of bubble point pressure for
undersaturated reservoir oil (trivariate case for µo, ρo, and pb).
-2.5
-1.5
-0.5
0.5
1.5
2.5
-0.5 0.5 1.5 2.5 3.5 4.5
ln a
Opt
imal
tran
sfor
m: l
n a
Fig. 36- GRACE optimal transformation of the exponent for undersaturated
reservoir oil (trivariate case for µo, ρo, and pb).

87
The final functional forms of transformed dependent and independent variables
are provided as follows:
Functional form of the transformed bubble point oil density
599.3455ln621.2717ln6163.709ln5246.61 23_ +−+−= obobobtrob ρρρρ ,. (86)
Functional form of the transformed bubble point pressure
19966.0ln29579.0ln0365.0 2_ +−= bbtrb ppp ,……..…………...…....... (87)
The summation of transformed independent variables
trbtrobtr pz __ += ρ ,……............................................................................. (88)
Functional form of the inverse transformation of the exponent
( )3724.27801.004923.012572.0exp 23 +⋅+⋅+⋅= trtrtr zzza ,………...…..… (89)
where ρob is bubble point oil density in lb/cu ft and pb is bubble point pressure in psia.
The values of ARE and AARE, which are -6.79% and 31.45%, indicate a small
improvement. The plots of calculated versus laboratory-measured undersaturated oil
viscosity as shown in Fig. 37 and Fig. 38 for Cartesian and logarithmic coordinates are
also very similar to the plots of the previous case. These results indicate the low
improvement of the performance by adding bubble point pressure into the proposed
equation. From this reason, the proposed correlation equation for the exponent of an
undersaturated oil viscosity correlation equation is provided in terms of a bubble point
oil density only as shown in Eq. 84 and Eq. 85.

88
0
50
100
150
200
250
300
0 50 100 150 200 250 300
Measured reservoir oil viscosity, cp
Cal
cula
ted
rese
rvoi
r oil
visc
osity
, cp
Fig. 37- Calculated and measured undersaturated oil viscosity data are compared
on Cartesian coordinates for trivariate case (µo, ρo, and pb).
0.1
1
10
100
1000
0.1 1 10 100 1000
Measured reservoir oil viscosity, cp
Cal
cula
ted
rese
rvoi
r oil
visc
osity
, cp
Fig. 38- Calculated and measured undersaturated oil viscosity data are compared
on logarithmic coordinates for trivariate case (µo, ρo, and pb).

89
Evaluation of Data Quality Using Data Reconciliation Technique
Table 14 shows the results of data reconciliation technique for the dependent
variable and independent variables. The bubble point oil density shows the low values
of ARA and AARA which indicates a low bias and a high precision of this parameter.
For the exponent of an undersaturated oil viscosity correlation equation, the relatively
high value of AARA represents the consequent error from using of laboratory-measured
oil viscosity data to derive this parameter. This problem could provide a sequent effect
on the accuracy of the proposed undersaturated oil viscosity correlation equation in this
research.
Table 14- The quality of data used for correlating an exponent, a, equation is determined
by using a data reconciliation technique Adjusted laboratory-measured PVT data Variable
ARA, % AARA, % Bubble point oil density, lb/ft3 4.2 6.8 Exponent, a 7.6 23.9
The graphical interpretations for adjusted and measured values of a bubble point
oil density and the exponent are shown in Fig. 39 and Fig. 40. The low dispersion of
adjusted bubble point oil density around a 45o straight line indicates the least amount of
adjustment that requires for correlating the perfect equation. This result confirms the
usefulness and the precision of bubble point oil density used in the proposed correlation
equation. The relatively high deviation of reconciled values indicates the low quality of
the exponent data, which originally are derived from oil viscosity and oil density
functions. The oil density function has a high level of reliability supported by the results
of data reconciliation technique. Therefore, the sources of imprecision and deficiency of
the exponent definitely come from the oil viscosity function.

90
30
35
40
45
50
55
60
30 35 40 45 50 55 60
Measured bubble point oil density, lb/ft3
Adj
uste
d bu
bble
poi
nt o
il de
nsity
, lb/
ft3
Fig. 39- Adjusted and laboratory-measured bubble point oil density data are
compared for undersaturated reservoir oil.
0.1
1
10
100
0.1 1 10 100
Original correlation coefficient
Adj
uste
d co
rrel
atio
n co
effic
ient
Fig. 40- Adjusted and original exponent data are compared for undersaturated
reservoir oil.

91
Testing the Proposed Undersaturated Oil Viscosity Correlation Equations
The high percentage error in the proposed undersaturated oil viscosity correlation
equation causes by using the calculated bubble point oil viscosity in the model. The
proposed saturated oil viscosity correlation equation used for calculating the bubble
point oil viscosity contains the error up to 25%, which considers as a high deviation. A
bubble point oil viscosity, however, is a mandatory parameter and could not be removed
from the proposed undersaturated oil viscosity correlation equation. Therefore, the
actual performance of the proposed undersaturated oil viscosity correlation equation
without the effect of high erroneous input parameter might be questionable.
Laboratory-measured bubble point oil viscosity, which is considered as the
reliable information at this time, can replace the calculated bubble point oil viscosity
from the proposed saturated oil viscosity correlation equation to determine the true
efficiency of the proposed undersaturated oil viscosity correlation equation. Table 15
shows the results of statistical error analysis for the proposed and published
undersaturated oil viscosity correlation equations by using laboratory-measured bubble
point oil viscosity, instead of calculated bubble point oil viscosity, as an input parameter.
Table 15- A performance of undersaturated oil viscosity correlation using laboratory-measured
bubble point oil viscosity (183 PVT reports/1968 data points) Predicted undersaturated oil viscosity Undersaturated oil viscosity correlations
ARE, % AARE, % This work (2005) -0.81 3.72
Standing (1977) -2.47 4.54 Khan et al. (1987) -1.49 4.60
Almehaideb (1997) -1.15 5.60 Petrosky and Farshad (1995) -2.54 5.69
Kartoatmodjo and Schmidt (1991) -4.96 6.04 De Ghetto, Paone, and Villa (1994) -2.39 6.30
Elsharkawy and Alikhan (1999) -2.47 7.06 Vasquez and Beggs (1980) 3.62 7.45
Labedi (1992) 1.42 7.68 Elsharkwy and Gharbi (2001) 6.52 14.40
Al-Khafaji, Abdul-Majeed, and Hassoon (1987) 59.93 62.43 Dindoruk and Christman (2001) 88.53 91.05

92
The results of the statistical error analysis indicate that the proposed correlation
equation has the lowest values of ARE and AARE. Among the published correlation
equations, the Standing4 and the Khan et al11, 12 correlation equations provide an
outstanding result for predicting undersaturated oil viscosity. These results can imply
that using more accurate bubble point oil viscosity would tremendously improve the
performance of undersaturated oil viscosity correlation equations and would achieve the
most accurate prediction with the proposed correlation equation.
Very interesting, the Dindoruk and Christman correlation equation29, which
provides the best prediction as indicated in Chapter VI, has the incredibly low accuracy
when laboratory-measured bubble point oil density is used as an input parameter. This
correlation equation was developed by using a low range oil viscosity value of less than
10 cp; therefore, a huge deviation of the predicting values would definitely happen when
the equation is applied with the high value of oil viscosity at the bubble point pressure
from the database. The deficiency and the unreliability in the Dindoruk and Christman
correlation equation29 cause mainly by a low range oil viscosity in their database and
malfunction of their correlation equation.
The graphical interpretation for calculated undersaturated oil viscosity from the
proposed correlation equation using laboratory-measured bubble point oil viscosity and
laboratory-measured values, as shown in Fig. 41 and Fig. 42 for Cartesian and
logarithmic coordinates, show that most data points are very close to a 45o straight line,
which indicates the high accuracy of the proposed undersaturated oil viscosity
correlation equation. The dispersion of data is very steady for all oil viscosity values,
which indicates the consistence of the proposed equation; whereas most published
correlation equations has high inconsistent results, especially at high viscosity ranges.
Therefore, the proposed correlation equation provides the best overall efficiency when it
is applied with either calculated or experimental bubble point oil viscosities, has a wider
range of validity, and is superior to other published correlation equations for predicting
undersaturated oil viscosity. Additional information of the graphical interpretations
from all published correlation equations is available in Appendix D of this dissertation.

93
0
50
100
150
200
250
300
350
0 50 100 150 200 250 300
Laboratory-measured undersaturated oil viscosity, cp
Cal
cula
ted
unde
rsat
urat
ed o
il vi
scos
ity, c
p
Fig. 41- Calculated undersaturated oil viscosity data using measured bubble point oil viscosity as an input are compared with measured values on Cartesian scales.
0.1
1
10
100
1000
0.1 1 10 100 1000
Laboratory-measured undersaturated oil viscosity, cp
Cal
cula
ted
unde
rsat
urat
ed o
il vi
scos
ity, c
p
Fig. 42- Calculated undersaturated oil viscosity data using measured bubble point oil viscosity as an input are compared with measured values on logarithmic scales.

94
CHAPTER IX
TESTING THE PERFORMANCE OF THE RESERVOIR OIL
VISCOSITY CORRELATION EQUATIONS
This chapter provides all supplementary information about the testing results of
the proposed correlation equations when they are applied with any ranges of reservoir
parameters. Both saturated and undersaturated oil viscosity correlation equations are
tested at different ranges of stock-tank oil gravity, reservoir temperature, bubble point
solution gas-oil ratio, and bubble point oil viscosity. To verify the efficiency of the
proposed correlation equations at more specific ranges of oil viscosity, the bubble point
oil viscosity is divided into 3 domains, which are the values of less than 1 cp, between 1
to 10 cp, and of greater than 10 cp.
The procedures begin with sorting and dividing the database into subsets of equal
ranges. Then the graphical interpretation of these subsets and the statistical error
analysis functions, ARE and AARE, are provided in Fig. 43 through Fig. 54 for
saturated reservoir oil and in Fig. 55 through Fig. 66 for undersaturated reservoir oil.
Other correlation equations from literature are also tested with the similar subsets and
plotted in the same figure for comparing their performance with the performance of the
proposed equations. The selected published correlation equations are the Beggs and
Robinson4, the Vasquez and Beggs6, the Dindoruk and Christman29, the De Ghetto,
Paone, and Villa21, and the Petrosky and Farshad23 correlation equations. The numerical
results of ARE and AARE at any ranges of reservoir parameters are available in
Appendix E of this dissertation.
Based on these graphical interpretations, the proposed correlation equations
indicate the relatively better results for overall reservoir conditions than other published
correlation equations. This superiority indicates the high reliability and consistency of
the proposed correlation equations, which are the most aspects in this research.

95
-50
-40
-30
-20
-10
0
10
20
30
40
50
0 1 2 3 4 5 6 7 8 9
Stock tank oil gravity, 0API
Ave
rage
Rel
ativ
e Er
ror,
AR
E, in
cal
cula
ted
satu
rate
d oi
l vis
cosi
ty, %
This work Beggs and Robinson Dindoruk and ChristmanDe Ghetto, Paone, and Villa Petrosky and Farshad
<=20 20.1-25 25.1-30 30.1-35 35.1-40 40.1-45 45.1-50 >50
Fig. 43- The reliability of the saturated oil viscosity correlation (regarding ARE)
across the range of stock-tank oil gravity.
0
10
20
30
40
50
60
70
80
0 1 2 3 4 5 6 7 8 9
Stock tank oil gravity, 0API
Ave
rage
Abs
olut
e R
elat
ive
Erro
r, A
AR
E, in
calc
ulat
ed s
atur
ated
oil
visc
osity
, %
This work Beggs and Robinson Dindoruk and Christman
De Ghetto, Paone, and Villa Petrosky and Farshad
<=20 20.1-25 25.1-30 30.1-35 35.1-40 40.1-45 45.1-50 >50
Fig. 44- The reliability of the saturated oil viscosity correlation (regarding AARE)
across the range of stock-tank oil gravity.

96
-50
-40
-30
-20
-10
0
10
20
30
40
50
0 1 2 3 4 5 6 7 8 9 10
Reservoir temperature, 0F
Ave
rage
Rel
ativ
e Er
ror,
AR
E, in
cal
cula
ted
satu
rate
d oi
l vis
cosi
ty, %
This Work Beggs and Robinson Dindoruk and ChristmanDe Ghetto, Paone, and Villa Petrosky and Farshad
100-125 126-150 151-175 176-200 201-225 226-250 250-275 276-300 >300
Fig. 45- The reliability of the saturated oil viscosity correlation (regarding ARE)
across the range of reservoir temperature.
0
10
20
30
40
50
0 1 2 3 4 5 6 7 8 9 10
Reservoir temperature, 0F
Ave
rage
Abs
olut
e R
elat
ive
Erro
r, A
AR
E, in
calc
ulat
ed s
atur
ated
oil
visc
osity
, %
This Work Beggs and Robinson Dindoruk and ChristmanDe Ghetto, Paone, and Villa Petrosky and Farshad
100-125 126-150 151-175 176-200 201-225 226-250 250-275 276-300 >300
Fig. 46- The reliability of the saturated oil viscosity correlation (regarding AARE)
across the range of reservoir temperature.

97
-50
-40
-30
-20
-10
0
10
20
30
40
50
0 1 2 3 4 5 6 7 8 9
Bubble point solution gas-oil ratio, scf/STB
Ave
rage
Rel
ativ
e Er
ror,
AR
E, in
cal
cula
ted
satu
rate
d oi
l vis
cosi
ty, %
This work Beggs and Robinson Dindoruk and ChristmanDe Ghetto, Paone, and Villa Petrosky and Farshad
<=200 201-400 401-600 601-800 801-1000 1001-1200 1201-1400 >1400
Fig. 47- The reliability of the saturated oil viscosity correlation (regarding ARE)
across the range of bubble point solution gas-oil ratio.
0
10
20
30
40
50
0 1 2 3 4 5 6 7 8 9
Bubble point solution gas-oil ratio, scf/STB
Ave
rage
Abs
olut
e R
elat
ive
Erro
r, A
AR
E, in
calc
ulat
ed s
atur
ated
oil
visc
osity
, %
This work Beggs and Robinson Dindoruk and ChristmanDe Ghetto, Paone, and Villa Petrosky and Farshad
<=200 201-400 401-600 601-800 801-1000 1001-1200 1201-1400 >1400
Fig. 48- The reliability of the saturated oil viscosity correlation (regarding AARE)
across the range of bubble point solution gas-oil ratio.
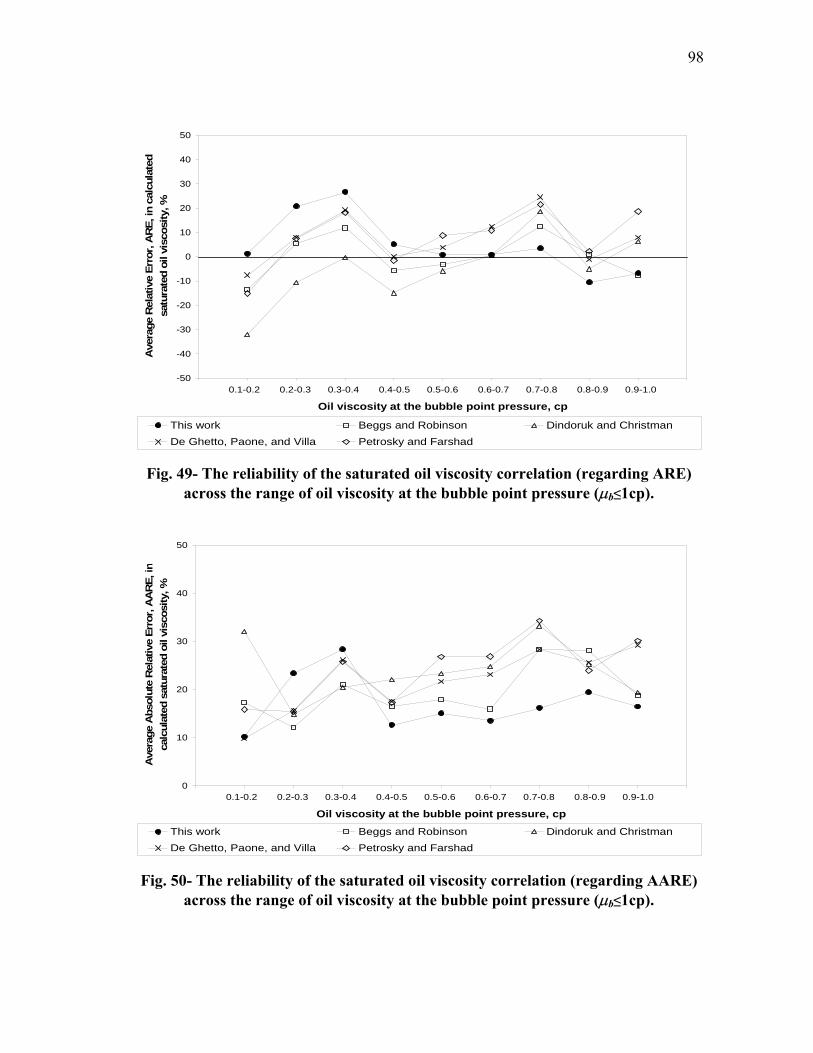
98
-50
-40
-30
-20
-10
0
10
20
30
40
50
0 1 2 3 4 5 6 7 8 9 10
Oil viscosity at the bubble point pressure, cp
Ave
rage
Rel
ativ
e Er
ror,
AR
E, in
cal
cula
ted
satu
rate
d oi
l vis
cosi
ty, %
This work Beggs and Robinson Dindoruk and ChristmanDe Ghetto, Paone, and Villa Petrosky and Farshad
0.1-0.2 0.2-0.3 0.3-0.4 0.4-0.5 0.5-0.6 0.6-0.7 0.7-0.8 0.8-0.9 0.9-1.0
Fig. 49- The reliability of the saturated oil viscosity correlation (regarding ARE)
across the range of oil viscosity at the bubble point pressure (µb≤1cp).
0
10
20
30
40
50
0 1 2 3 4 5 6 7 8 9 10
Oil viscosity at the bubble point pressure, cp
Ave
rage
Abs
olut
e R
elat
ive
Erro
r, A
AR
E, in
calc
ulat
ed s
atur
ated
oil
visc
osity
, %
This work Beggs and Robinson Dindoruk and ChristmanDe Ghetto, Paone, and Villa Petrosky and Farshad
0.1-0.2 0.2-0.3 0.3-0.4 0.4-0.5 0.5-0.6 0.6-0.7 0.7-0.8 0.8-0.9 0.9-1.0
Fig. 50- The reliability of the saturated oil viscosity correlation (regarding AARE)
across the range of oil viscosity at the bubble point pressure (µb≤1cp).
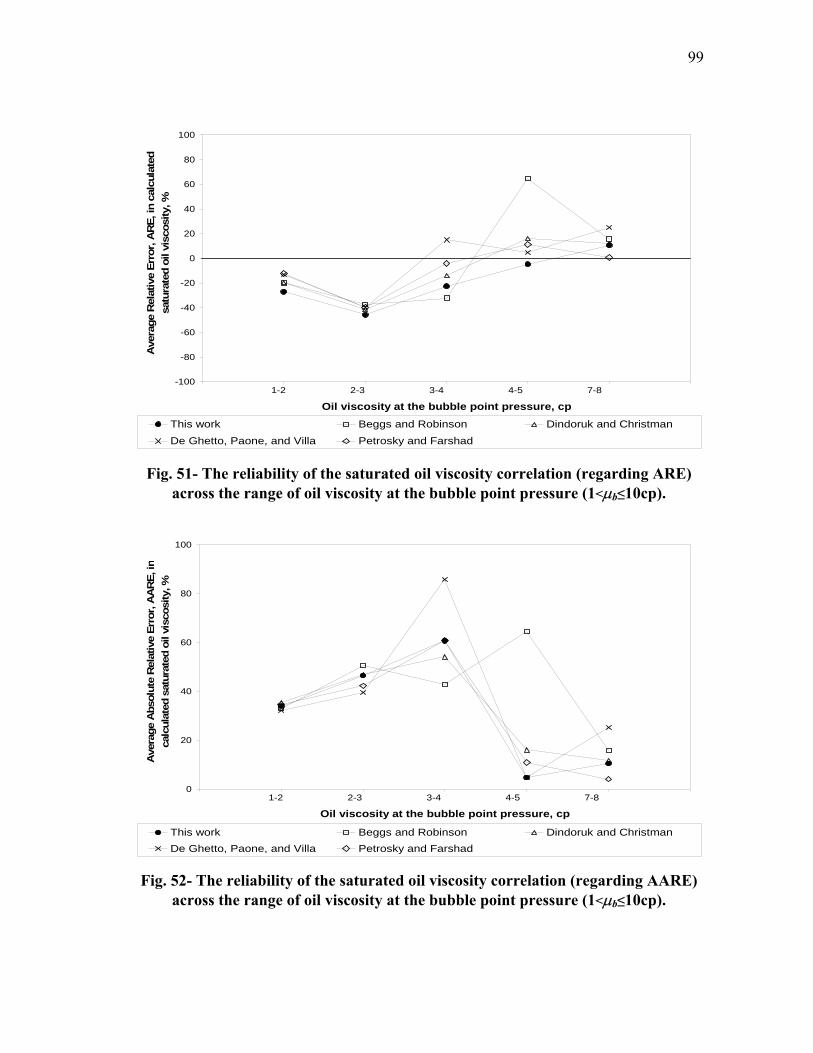
99
-100
-80
-60
-40
-20
0
20
40
60
80
100
0 1 2 3 4 5 6
Oil viscosity at the bubble point pressure, cp
Ave
rage
Rel
ativ
e Er
ror,
AR
E, in
cal
cula
ted
satu
rate
d oi
l vis
cosi
ty, %
This work Beggs and Robinson Dindoruk and ChristmanDe Ghetto, Paone, and Villa Petrosky and Farshad
1-2 2-3 3-4 4-5 7-8
Fig. 51- The reliability of the saturated oil viscosity correlation (regarding ARE)
across the range of oil viscosity at the bubble point pressure (1<µb≤10cp).
0
20
40
60
80
100
0 1 2 3 4 5 6
Oil viscosity at the bubble point pressure, cp
Ave
rage
Abs
olut
e R
elat
ive
Erro
r, A
AR
E, in
calc
ulat
ed s
atur
ated
oil
visc
osity
, %
This work Beggs and Robinson Dindoruk and ChristmanDe Ghetto, Paone, and Villa Petrosky and Farshad
1-2 2-3 3-4 4-5 7-8
Fig. 52- The reliability of the saturated oil viscosity correlation (regarding AARE)
across the range of oil viscosity at the bubble point pressure (1<µb≤10cp).

100
-100
-80
-60
-40
-20
0
20
40
60
80
100
0 1 2 3 4 5 6 7 8 9
Oil viscosity at the bubble point pressure, cp
Ave
rage
Rel
ativ
e Er
ror,
AR
E, in
cal
cula
ted
satu
rate
d oi
l vis
cosi
ty, %
This work Beggs and Robinson Dindoruk and ChristmanDe Ghetto, Paone, and Villa Petrosky and Farshad
10-20 21-30 31-40 41-50 51-60 61-70 130-140 141-150
Fig. 53- The reliability of the saturated oil viscosity correlation (regarding ARE)
across the range of oil viscosity at the bubble point pressure (µb>10cp).
0
20
40
60
80
100
0 1 2 3 4 5 6 7 8 9
Oil viscosity at the bubble point pressure, cp
Ave
rage
Abs
olut
e R
elat
ive
Erro
r, A
AR
E, in
calc
ulat
ed s
atur
ated
oil
visc
osity
, %
This work Beggs and Robinson Dindoruk and ChristmanDe Ghetto, Paone, and Villa Petrosky and Farshad
10-20 21-30 31-40 41-50 51-60 61-70 130-140 141-150
Fig. 54- The reliability of the saturated oil viscosity correlation (regarding AARE)
across the range of oil viscosity at the bubble point pressure (µb>10cp).

101
-50
-40
-30
-20
-10
0
10
20
30
40
50
0 1 2 3 4 5 6 7 8 9
Stock tank oil gravity, 0API
Ave
rage
Rel
ativ
e Er
ror,
AR
E, in
cal
cula
ted
unde
rsat
urat
ed o
il vi
scos
ity, %
This work Vasquez and Beggs Dindoruk and Christman
De Ghetto, Paone, and Villa Petrosky and Farshad
<=20 20.1-25 25.1-30 30.1-35 35.1-40 40.1-45 45.1-50 >50
Fig. 55- The reliability of the undersaturated oil viscosity correlation
(regarding ARE) across the range of stock-tank oil gravity.
0
10
20
30
40
50
60
70
80
0 1 2 3 4 5 6 7 8 9
Stock tank oil gravity, 0API
Ave
rage
Abs
olut
e R
elat
ive
Erro
r, A
AR
E, in
calc
ulat
ed u
nder
satu
rate
d oi
l vis
cosi
ty, %
This work Vasquez and Beggs Dindoruk and Christman
De Ghetto, Paone, and Villa Petrosky and Farshad
<=20 20.1-25 25.1-30 30.1-35 35.1-40 40.1-45 45.1-50 >50
Fig. 56- The reliability of the undersaturated oil viscosity correlation
(regarding AARE) across the range of stock-tank oil gravity.

102
-50
-40
-30
-20
-10
0
10
20
30
40
50
0 1 2 3 4 5 6 7 8 9 10
Reservoir temperature, 0F
Ave
rage
Rel
ativ
e Er
ror,
AR
E, in
cal
cula
ted
unde
rsat
urat
ed o
il vi
scos
ity, %
This work Vasquez and Beggs Dindoruk and ChristmanDe Ghetto, Paone, and Villa Petrosky and Farshad
100-125 126-150 151-175 176-200 201-225 226-250 250-275 276-300 >300
Fig. 57- The reliability of the undersaturated oil viscosity correlation
(regarding ARE) across the range of reservoir temperature.
0
10
20
30
40
50
60
70
0 1 2 3 4 5 6 7 8 9 10
Reservoir temperature, 0F
Ave
rage
Abs
olut
e R
elat
ive
Erro
r, A
AR
E, in
calc
ulat
ed u
nder
satu
rate
d oi
l vis
cosi
ty, %
This work Vasquez and Beggs Dindoruk and ChristmanDe Ghetto, Paone, and Villa Petrosky and Farshad
100-125 126-150 151-175 176-200 201-225 226-250 250-275 276-300 >300
Fig. 58- The reliability of the undersaturated oil viscosity correlation
(regarding AARE) across the range of reservoir temperature.

103
-40
-30
-20
-10
0
10
20
30
40
0 1 2 3 4 5 6 7 8 9
Bubble point solution gas-oil ratio, scf/STB
Ave
rage
Rel
ativ
e Er
ror,
AR
E, in
cal
cula
ted
unde
rsat
urat
ed o
il vi
scos
ity, %
This work Vasquez and Beggs Dindoruk and Christman
De Ghetto, Paone, and Villa Petrosky and Farshad
<=200 201-400 401-600 601-800 801-1000 1001-1200 1201-1400 >1400
Fig. 59- The reliability of the undersaturated oil viscosity correlation
(regarding ARE) across the range of bubble point solution gas-oil ratio.
0
10
20
30
40
50
60
0 1 2 3 4 5 6 7 8 9
Bubble point solution gas-oil ratio, scf/STB
Ave
rage
Abs
olut
e R
elat
ive
Erro
r, A
AR
E, in
calc
ulat
ed u
nder
satu
rate
d oi
l vis
cosi
ty, %
This work Vasquez and Beggs Dindoruk and Christman
De Ghetto, Paone, and Villa Petrosky and Farshad
<=200 201-400 401-600 601-800 801-1000 1001-1200 1201-1400 >1400
Fig. 60- The reliability of the undersaturated oil viscosity correlation
(regarding AARE) across the range of bubble point solution gas-oil ratio.

104
-50
-40
-30
-20
-10
0
10
20
30
40
50
0 1 2 3 4 5 6 7 8 9 10
Oil viscosity at the bubble point pressure, cp
Ave
rage
Rel
ativ
e Er
ror,
AR
E, in
cal
cula
ted
unde
rsat
urat
ed o
il vi
scos
ity, %
This work Vasquez and Beggs Dindoruk and ChristmanDe Ghetto, Paone, and Villa Petrosky and Farshad
0.1-0.2 0.2-0.3 0.3-0.4 0.4-0.5 0.5-0.6 0.6-0.7 0.7-0.8 0.8-0.9 0.9-1.0
Fig. 61- The reliability of the undersaturated oil viscosity correlation (regarding ARE)
across the range of oil viscosity at the bubble point pressure (µb≤1cp).
0
10
20
30
40
50
0 1 2 3 4 5 6 7 8 9 10
Oil viscosity at the bubble point pressure, cp
Ave
rage
Abs
olut
e R
elat
ive
Erro
r, A
AR
E, in
calc
ulat
ed u
nder
satu
rate
d oi
l vis
cosi
ty, %
This work Vasquez and Beggs Dindoruk and Christman
De Ghetto, Paone, and Villa Petrosky and Farshad
0.1-0.2 0.2-0.3 0.3-0.4 0.4-0.5 0.5-0.6 0.6-0.7 0.7-0.8 0.8-0.9 0.9-1.0
Fig. 62- The reliability of the undersaturated oil viscosity correlation (regarding
AARE) across the range of oil viscosity at the bubble point pressure (µb≤1cp).

105
-100
-80
-60
-40
-20
0
20
40
60
80
100
0 1 2 3 4 5 6
Oil viscosity at the bubble point pressure, cp
Ave
rage
Rel
ativ
e Er
ror,
AR
E, in
cal
cula
ted
unde
rsat
urat
ed o
il vi
scos
ity, %
This work Vasquez and Beggs Dindoruk and Christman
De Ghetto, Paone, and Villa Petrosky and Farshad
1-2 2-3 3-4 4-5 7-8
Fig. 63- The reliability of the undersaturated oil viscosity correlation (regarding ARE)
across the range of oil viscosity at the bubble point pressure (1<µb≤10cp).
0
10
20
30
40
50
60
70
0 1 2 3 4 5 6
Oil viscosity at the bubble point pressure, cp
Ave
rage
Abs
olut
e R
elat
ive
Erro
r, A
AR
E, in
calc
ulat
ed u
nder
satu
rate
d oi
l vis
cosi
ty, %
This work Vasquez and Beggs Dindoruk and Christman
De Ghetto, Paone, and Villa Petrosky and Farshad
1-2 2-3 3-4 4-5 7-8
Fig. 64- The reliability of the undersaturated oil viscosity correlation (regarding AARE) across the range of oil viscosity at the bubble point pressure (1<µb≤10cp).

106
-100
-80
-60
-40
-20
0
20
40
60
80
100
0 1 2 3 4 5 6 7 8 9
Oil viscosity at the bubble point pressure, cp
Ave
rage
Rel
ativ
e Er
ror,
AR
E, in
cal
cula
ted
unde
rsat
urat
ed o
il vi
scos
ity, %
This work Vasquez and Beggs Dindoruk and Christman
De Ghetto, Paone, and Villa Petrosky and Farshad
10-20 21-30 31-40 41-50 51-60 61-70 130-140 141-150
Fig. 65- The reliability of the undersaturated oil viscosity correlation (regarding ARE)
across the range of oil viscosity at the bubble point pressure (µb>10cp).
0
20
40
60
80
100
0 1 2 3 4 5 6 7 8 9
Oil viscosity at the bubble point pressure, cp
Ave
rage
Abs
olut
e R
elat
ive
Erro
r, A
AR
E, in
calc
ulat
ed u
nder
satu
rate
d oi
l vis
cosi
ty, %
This work Vasquez and Beggs Dindoruk and Christman
De Ghetto, Paone, and Villa Petrosky and Farshad
10-20 21-30 31-40 41-50 51-60 61-70 130-140 141-150
Fig. 66- The reliability of the undersaturated oil viscosity correlation (regarding AARE) across the range of oil viscosity at the bubble point pressure (µb>10cp).
107
CHAPTER X
CONCLUSIONS
The proposed correlation equations for saturated and undersaturated reservoir oil
viscosities are created by an effective methodology and achieve the satisfactory
performance and reliability. The following can be concluded:
• A large database used in this research study covers a wide range of fluid
properties for black oil and is carefully inspected the overall quality before
correlating the proposed oil viscosity equations.
• The Beggs and Robinson correlation equation4 for saturated oil viscosity and
the Petrosky and Farshad correlation equation23 for undersaturated oil
viscosity are the most reliable correlation equations among published
correlation equations.
• Using only an oil density at the bubble point pressure, as shown in the Abu-
Khamsin and Al-Marhoun18 and the Hanafy et al.25 correlation equations, is
not enough to correlate the high performance reservoir oil viscosity
equations.
• Based on the results of the effective methodology, reservoir oil density is the
most influential parameter for correlating both saturated and undersaturated
oil viscosity models.
• Using the combination of the reservoir oil density and other field-measured
parameters for correlating the oil viscosity equations does not quite improve
the performance of the proposed correlation equations.
• The proposed strategy for correlating oil viscosity equations is very effective
and is derived from the true relationship between the dependent and
independent variables.

108
• The proposed correlation equations for saturated oil viscosity, Eq. 77 and Eq.
78, and undersaturated oil viscosity, Eq. 83 through Eq. 85, provide a
reasonable prediction of reservoir oil viscosity.
• No matter how much error is in the calculated bubble point oil viscosity, the
proposed undersaturated oil viscosity correlation equation always provides
the best prediction of all published correlation equations.
• At any reservoir conditions, the proposed saturated and undersaturated oil
viscosity correlation equations have higher performance and validity than all
published correlation equations.
• The proposed correlation equations work very effective within the ranges of
fluid properties provided in the database.
• Errors in laboratory-measured oil viscosity cause the deficiency in the
proposed oil viscosity correlation equations, which results in the high value
of AARE. These expected errors cannot be corrected and are unavoidable
from routine laboratory measurement of oil viscosity.
109
NOMENCLATURE
a = exponent in the proposed undersaturated oil viscosity correlation
API = stock-tank oil gravity in oAPI
A, B = constants in various saturated oil viscosity correlations
Bo = oil formation volume factor in res bbl/STB
co = liquid coefficient of isothermal compressibility in psia-1
C = constant in the Beggs and Robinson correlation
D = constant in the Standing correlation
E = constant in the Vasquez and Beggs correlation
f0 = optimal transformations for dependent variable
f0-1 = inverse of optimal transformations for dependent variable
f1, f2, … = optimal transformations for independent variables
F = constant in the Al-Khafaji, Abdul-Majeed, and Hassoon correlation
G = constant in the Abdul-Majeed, Kattan, and Salman correlation
H, I = constants in the Kartoatmodjo and Schmidt correlation
J, K = constants in the Petrosky and Farshad correlation
L = constant in the Almehaideb correlation
M = constant in the Elsharkawy and Gharbi correlation
N = total number of data points
O = constant in the Dindoruk and Christman correlation
p = reservoir pressure in psia
pb = bubble point pressure in psia
pb_tr = transformed bubble point pressure
r = residual
RS = solution gas-oil ratio in scf/STB
RSb = solution gas-oil ratio at bubble point pressure in scf/STB
R2 = correlation R2 value
T = reservoir temperature in oF

110
Tp = pour point temperature in oF
Vb = volume of liquid at the bubble point in bbl
Vt = total volume in bbl
Fb
t
VV
⎟⎟⎠
⎞⎜⎜⎝
⎛ = relative total volume (oil and gas) by flash vaporization
x1, x2, … = independent variables
y = dependent variable
ypre = predicted dependent variable
z0 = transformed dependent variable
z1, z2, … = transformed independent variables *nz , ztr = summation of transformed independent variables
Greek
γo = oil specific gravity
γg = gas specific gravity
µcalc = calculated oil viscosity (dynamic) in cp
µmeas = measured oil viscosity (dynamic) in cp
µo = oil viscosity (dynamic) in cp
µob = oil viscosity (dynamic) at bubble point pressure in cp
µod = oil viscosity (dynamic) at atmospheric pressure (dead oil) in cp
µo_tr = transformed reservoir oil viscosity
ρa = apparent liquid density in lb/cu ft
ρbs = liquid density at reservoir pressure and 60oF in lb/cu ft
ρo = reservoir oil density in lb/cu ft
ρo_tr = transformed reservoir oil density
ρob = reservoir oil density at bubble point pressure in lb/cu ft
ρob_tr = transformed reservoir oil density at bubble point pressure
ρpo = density of pseudoliquid in lb/cu ft

111
ρsto = stock-tank oil density in lb/cu ft
ρsto_tr = transformed stock-tank oil density
ρw = density of water (brine) in lb/cu ft
Subscripts
calc = calculation
meas = measurement
g = gas
i = different value of data points
j = different stage independent variables
k = total stage independent variables
m = total number of independent variable
n = different independent variables
o = oil
ob = oil at the bubble point pressure
_tr = transformed value
Abbreviation
PVT = pressure-volume-temperature
ACE = alternating conditional expectation
GRACE = graphical alternating conditional expectation
ARE = average relative error
AARE = average absolute relative error
ARA = average relative adjustment
AARA = average absolute relative adjustment
SD = standard deviation
UAE = United Arab Emirates

112
REFERENCES
1. Beal, C.: “The Viscosity of Air, Water, Natural Gas, Crude Oil and Its
Associated Gases at Oil Field Temperature and Pressure,” Trans., AIME (1946)
165, 94-112.
2. Chew, J., and Connally, Jr., C.A.: “A Viscosity Correlation for Gas-Saturated
Crude Oil,” Trans., AIME (1959) 216, 23-25.
3. Aziz, K., Govier, G.W., and Fogarasi, M.: “Pressure Drop in Wells Producing
Oil and Gas,” J. Cdn. Pet. Tech. (July 1972) 11, 38-48.
4. Beggs, H.D. and Robinson J.R.: “Estimating the Viscosity of Crude Oil
Systems,” JPT (September 1975) 27, 1140-1141.
5. Standing, M.B.: Volumetric and Phase of Oil Field Hydrocarbon Systems, SPE,
Dallas (1977).
6. Vasquez, M. and Beggs, H.D.: “Correlation for Fluid Physical Property
Predictions,” JPT (June 1980) 32, 968-970.
7. Glaso, O.: “Generalized Pressure-Volume-Temperature Correlations,” JPT (May
1980) 32, 785-795.
8. Ng, J.T.H. and Egbogah, E.O.: “An Improved Temperature-Viscosity Correlation
for Crude Oil Systems,” paper 83-34-32 presented at the 34th Annual Technical
Meeting of the Petroleum Society of CIM, Banff, May 10-13, 1983
9. Sutton, R.P. and Farshad, F.: “Evaluation of Empirically Derived PVT Properties
for Gulf of Mexico Crude Oil,” paper SPE 13172 presented at the 1984 SPE
Annual Technical Conference and Exhibition, Houston, 16-19 September.
10. Sutton, R.P. and Farshad, F.: “Supplement to SPE 13172, Evaluation of
Empirically Derived PVT Properties for Gulf of Mexico Crude Oil,” paper SPE
20277 available from SPE Book Order Dept., Richardson, Texas (1989)

113
11. Khan, S.A., Al-Marhoun, M.A., Duffuaa, S.O., and Abu-Khamsin, S.A.:
“Viscosity Correlations for Saudi Arabian Crude Oil,” paper SPE 15720
presented at the 1987 SPE Middle East Oil Technical Conference and Exhibition,
Manama, Bahrain, 8-10 March.
12. Kahn S.A.: “Development of Viscosity Correlations for Crude Oil,” paper SPE
17132 available from SPE Publications Dept., Richardson, Texas (1987).
13. Al-Khafaji, A.H., Abdul-Majeed, G.H., and Hassoon, S.F.: “Viscosity
Correlation for Dead, Live, and Undersaturated Crude Oil,” J. Pet. Res. (1987) 6,
1-16.
14. Abdul-Majeed, G.H., Kattan, R.R. and Salman N.H.: “New Correlation for
Estimating the Viscosity of Undersaturated Crude Oil,” J. Cdn. Pet. Tech. (May-
June 1990) 29, 80-85.
15. McCain, W.D.: The Properties of Petroleum Fluids, 2nd ed., PennWell
Publishing, Tulsa, Oklahoma (1990).
16. Kartoatmodjo, R.S.T. and Schmidt, Z.: “New Correlations for Crude Oil Physical
Properties,” paper SPE 23556 available from SPE Book Order Dept.,
Richardson, Texas (1991).
17. Kartoatmodjo, R.S.T. and Schmidt, Z.: “Large Data Bank Improves Crude
Physical Property Correlations,” Oil & Gas J. (1994) 92, 51-55.
18. Abu-Khamsin, S.A. and Al-Marhoun, M.A.: “Development of a New Correlation
for Bubble-point Oil Viscosity,” Arabian J. of Science and Engineering (April
1991) 16, 99-106.
19. Labedi, R.: “Improved Correlations for Predicting the Viscosity of Light
Crudes,” J. of Petroleum Science and Engineering (1992) 8, 221-234.
20. Whitson, C.H., and Brule, M.R.: Phase Behavior, 1st ed., Monograph Vol. 20
SPE Henry L. Doherty Series, Richardson, Texas (2000).
21. De Ghetto, G., Paone, F. and Villa, M.: “Reliability Analysis on PVT
Correlations,” paper SPE 28904 presented at the 1994 European Petroleum
Conference, London, 25-27 October.

114
22. De Ghetto, G., Paone, F. and Villa, M.: “Pressure-Volume-Temperature
Correlations for Heavy and Extra Heavy Oil,” paper SPE 30316 presented at the
1995 International Heavy Oil Symposium, Calgary, Alberta, 19-21 June.
23. Petrosky, G.E., and Farshad, F.F.: “Viscosity Correlations for Gulf of Mexico
Crude Oil,” paper SPE 29468 presented at the 1995 Production Operations
Symposium, Oklahoma City, Oklahoma, 2-4 April.
24. Almehaideb, R.A.: “Improved PVT Correlations for UAE Crude Oil,” paper SPE
37691 presented at the 1997 Middle East Oil Conference and Exhibition,
Manama, Bahrain, 17-20 March.
25. Hanafy, H.H., Macary, S.M., ElNady, Y.M., Bayomi, A.A., and ElBatanony,
M.H.: “A New Approach for Predicting The Crude Oil Properties,” paper SPE
37439 presented at the 1997 SPE Production Operations Symposium, Oklahoma
City, Oklahoma, 9-11 March.
26. Bennison, T.: “Prediction of Heavy Oil Viscosity,” presented at the 1998 IBC
Heavy Oil Field Development Conference, London, 2-4 December.
27. Elsharkawy, A.M. and Alikhan, A.A.: “Models for Predicting the Viscosity of
Middle East Crude Oil,” Fuel (1999) 78, 891-903.
28. Elsharkawy, A.M. and Gharbi, R.B.C., “Comparing Classical and Neural
Regression Techniques in Modeling Crude Oil Viscosity,” Adv. Eng. Software
(2001) 32, 215-224.
29. Dindoruk, B. and Christman, P.G.: “PVT Properties and Viscosity Correlations
for Gulf of Mexico Oil,” paper SPE 71633 presented at the 2001 SPE Annual
Technical Conference and Exhibition, New Orleans, Louisiana, 30 September-3
October.
30. Dexheimer, D., Jackson, C.M., and Barrufet, M.A.: “A Modification of
Pedersen’s Model for Saturated Crude Oil Viscosities Using Standard Black Oil
PVT Data,” Fluid Phase Equilibria (2001) 183-184, 247-257.

115
31. Barrufet, M.A., and Dexheimer, D.: “Use of an Automatic Data Quality Control
Algorithm for Crude Oil Viscosity Data,” Fluid Phase Equilibria (2004) 219,
113-121
32. Bradley, H.B.: Petroleum Engineering Handbook, 8th ed., SPE, Richardson,
Texas (2003).
33. McCain, W.D., Jr., and Hill, N.: “Correlations for Liquid Densities and Evolved
Gas Specific Gravities for Black Oil During Pressure Depletion,” paper SPE
30773 presented at the 1995 SPE Annual Technical Conference and Exhibition,
Dallas, 22-25 October.
34. Hanson, G.H., Kuist, B.B., and Brown, G.G.: “Liquid Densities of Volatile
Hydrocarbon Mixtures,” Ind. Eng. Chem. (1994) 36, 1161-1165.
35. Witte, T.W., Jr.: The Development of a Correlation for Determining Oil Density
at High Temperature Reservoirs,” M.S. Thesis, Texas A&M U., December 1987
36. Härdle, W.: Applied Nonparametric Regression, Cambridge U. Press,
Cambridge, England (1990).
37. Breiman, L. and Friedman, J.H.: “Estimating Optimal Transformations for
Multiple Regression and Correlation,” J. of the American Statistical Association,
(September 1985) 80, 580-619.
38. Xue, G., Datta-Gupta, A., Valkó, P.P., and Blasingame, T.A.: “Optimal
Transformations for Multiple Regression: Application to Permeability Estimation
from Well Logs,” paper SPE 35412 presented at the 1996 Improved Oil
Recovery Symposium, Tulsa, Oklahoma, 21 April.
39. McCain, W.D., Jr., Soto, R.B., Valkó, P.P., and Blasingame, T.A.: “Correlation
of Bubblepoint Pressures for Reservoir Oil—A Comparative Study,” paper SPE
51086 presented at the 1998 SPE Eastern Regional Conference and Exhibition,
Pittsburgh, 9-11 November.
40. Valkó, P.P. and McCain, W.D., Jr.: “Reservoir Oil Bubblepoint Pressures
Revisited; Solution Gas-Oil Ratios and Surface Gas Specific Gravities,” J. of
Petroleum Science and Engineering (2003) 37, 153-169.

116
41. Narasimhan, S. and Jordache, C.: Data Reconciliation & Gross Error Detection:
An Intelligent Use of Process Data, Gulf Publishing, Houston (2000).
42. Barth, E.J.: Asphalt Science and Technology, 2nd ed., Gordon and Breach Science
Publishers, New York (1968).
43. More Solutions to Sticky Problems, User’s Manual, Brookfield Engineering
Labs, Middleboro, Massachusetts (1999).
117
APPENDIX A
PERFORMANCE OF VISCOSITY CORRELATION EQUATIONS
FOR SATURATED RESERVOIR OIL
(183 PVT REPORTS/ 1118 DATA POINTS)

118
The proposed correlation for saturated oil viscosity
0
20
40
60
80
100
120
140
160
180
0 20 40 60 80 100 120 140 160
Measured reservoir oil viscosity, cp
Cal
cula
ted
rese
rvoi
r oil
visc
osity
, cp
Fig. A.1- Graphical interpretation of the proposed correlation for saturated oil viscosity
on Cartesian coordinates.
0.1
1
10
100
1000
0.1 1 10 100 1000
Measured reservoir oil viscosity, cp
Cal
cula
ted
rese
rvoi
r oil
visc
osity
, cp
Fig. A.2- Graphical interpretation of the proposed correlation for saturated oil viscosity
on logarithmic coordinates.

119
The Beggs and Robinson correlation for saturated oil viscosity
0
20
40
60
80
100
120
140
160
0 20 40 60 80 100 120 140 160
Measured viscosity, cp
Cal
cula
ted
visc
osity
, cp
Fig. A.3- Graphical interpretation of the Beggs and Robinson correlation for saturated
oil viscosity on Cartesian coordinates.
0.1
1
10
100
1000
0.1 1 10 100 1000
Measured viscosity, cp
Cal
cula
ted
visc
osity
, cp
Fig. A.4- Graphical interpretation of the Beggs and Robinson correlation for saturated
oil viscosity on logarithmic coordinates.

120
The De Ghetto, Paone, and Villa correlation for saturated oil viscosity
0
20
40
60
80
100
120
140
160
0 20 40 60 80 100 120 140 160
Measured viscosity, cp
Cal
cula
ted
visc
osity
, cp
Fig. A.5- Graphical interpretation of the De Ghetto, Paone, and Villa correlation for
saturated oil viscosity on Cartesian coordinates.
0.1
1
10
100
1000
0.1 1 10 100 1000
Measured viscosity, cp
Cal
cula
ted
visc
osity
, cp
Fig. A.6- Graphical interpretation of the De Ghetto, Paone, and Villa correlation for
saturated oil viscosity on logarithmic coordinates.

121
The Dindoruk and Christman correlation for saturated oil viscosity
0
20
40
60
80
100
120
140
160
0 20 40 60 80 100 120 140 160
Measured viscosity, cp
Cal
cula
ted
visc
osity
, cp
Fig. A.7- Graphical interpretation of the Dindoruk and Christman correlation for
saturated oil viscosity on Cartesian coordinates.
0.1
1
10
100
1000
0.1 1 10 100 1000
Measured viscosity, cp
Cal
cula
ted
visc
osity
, cp
Fig. A.8- Graphical interpretation of the Dindoruk and Christman correlation for
saturated oil viscosity on logarithmic coordinates.
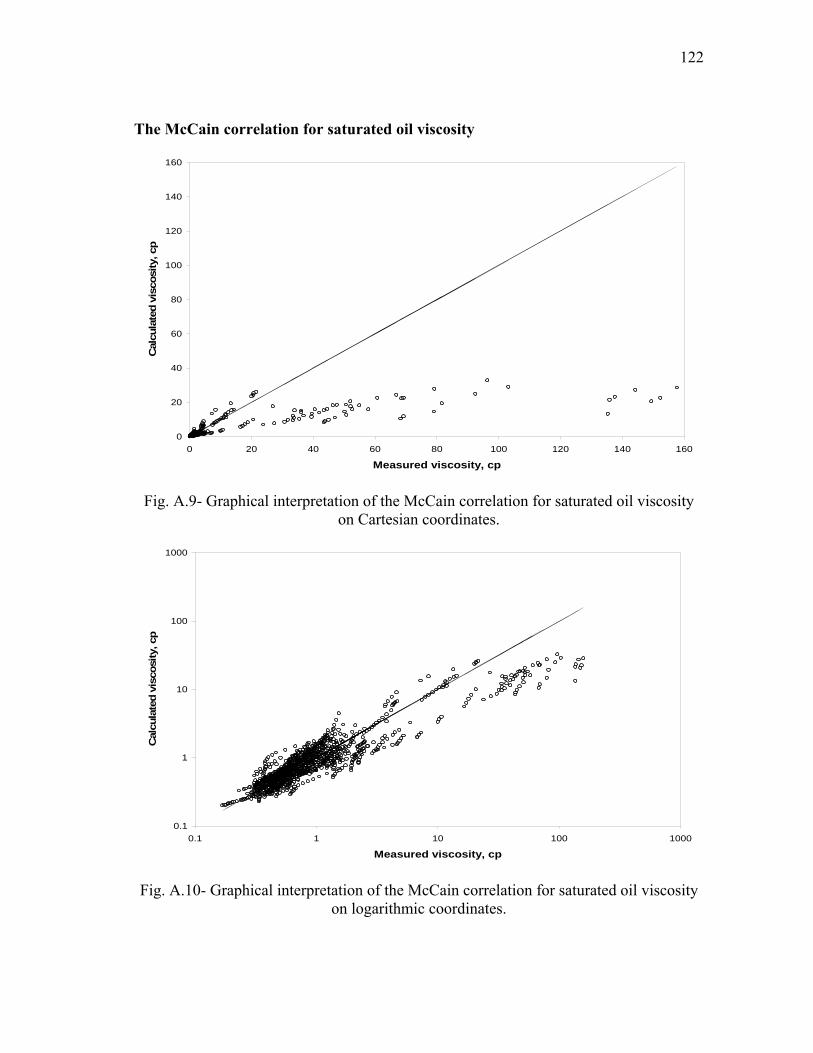
122
The McCain correlation for saturated oil viscosity
0
20
40
60
80
100
120
140
160
0 20 40 60 80 100 120 140 160
Measured viscosity, cp
Cal
cula
ted
visc
osity
, cp
Fig. A.9- Graphical interpretation of the McCain correlation for saturated oil viscosity
on Cartesian coordinates.
0.1
1
10
100
1000
0.1 1 10 100 1000
Measured viscosity, cp
Cal
cula
ted
visc
osity
, cp
Fig. A.10- Graphical interpretation of the McCain correlation for saturated oil viscosity
on logarithmic coordinates.

123
The Almehaideb correlation for saturated oil viscosity
0
20
40
60
80
100
120
140
160
0 20 40 60 80 100 120 140 160
Measured viscosity, cp
Cal
cula
ted
visc
osity
, cp
Fig. A.11- Graphical interpretation of the Almehaideb correlation for saturated oil
viscosity on Cartesian coordinates.
0.1
1
10
100
1000
0.1 1 10 100 1000
Measured viscosity, cp
Cal
cula
ted
visc
osity
, cp
Fig. A.12- Graphical interpretation of the Almehaideb correlation for saturated oil
viscosity on logarithmic coordinates.

124
The Petrosky and Farshad correlation for saturated oil viscosity
0
20
40
60
80
100
120
140
160
0 20 40 60 80 100 120 140 160
Measured viscosity, cp
Cal
cula
ted
visc
osity
, cp
Fig. A.13- Graphical interpretation of the Petrosky and Farshad correlation for saturated
oil viscosity on Cartesian coordinates.
0.1
1
10
100
1000
0.1 1 10 100 1000
Measured viscosity, cp
Cal
cula
ted
visc
osity
, cp
Fig. A.14- Graphical interpretation of the Petrosky and Farshad correlation for saturated
oil viscosity on logarithmic coordinates.

125
The Standing correlation for saturated oil viscosity
0
20
40
60
80
100
120
140
160
0 20 40 60 80 100 120 140 160
Measured viscosity, cp
Cal
cula
ted
visc
osity
, cp
Fig. A.15- Graphical interpretation of the Standing correlation for saturated oil viscosity
on Cartesian coordinates.
0.1
1
10
100
1000
0.1 1 10 100 1000
Measured viscosity, cp
Cal
cula
ted
visc
osity
, cp
Fig. A.16- Graphical interpretation of the Standing correlation for saturated oil viscosity
on logarithmic coordinates.

126
The Elsharkawy and Gharbi correlation for saturated oil viscosity
0
20
40
60
80
100
120
140
160
0 20 40 60 80 100 120 140 160
Measured viscosity, cp
Cal
cula
ted
visc
osity
, cp
Fig. A.17- Graphical interpretation of the Elsharkawy and Gharbi correlation for
saturated oil viscosity on Cartesian coordinates.
0.1
1
10
100
1000
0.1 1 10 100 1000
Measured viscosity, cp
Cal
cula
ted
visc
osity
, cp
Fig. A.18- Graphical interpretation of the Elsharkawy and Gharbi correlation for
saturated oil viscosity on logarithmic coordinates.
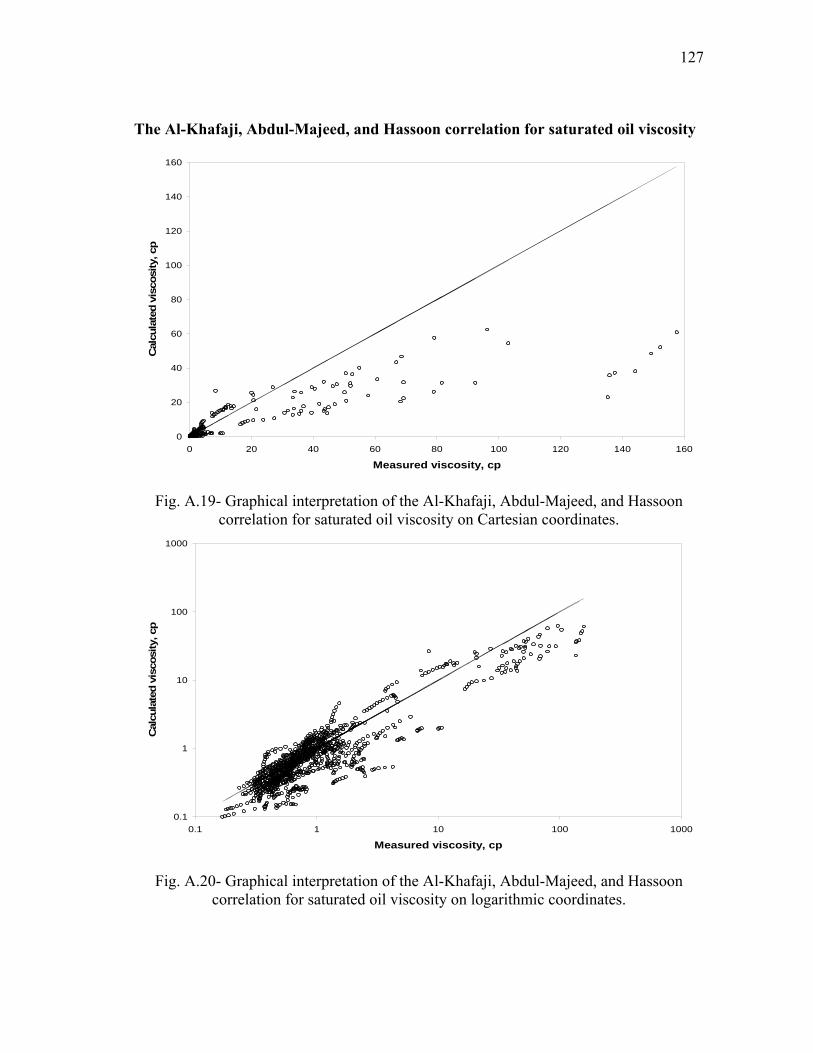
127
The Al-Khafaji, Abdul-Majeed, and Hassoon correlation for saturated oil viscosity
0
20
40
60
80
100
120
140
160
0 20 40 60 80 100 120 140 160
Measured viscosity, cp
Cal
cula
ted
visc
osity
, cp
Fig. A.19- Graphical interpretation of the Al-Khafaji, Abdul-Majeed, and Hassoon
correlation for saturated oil viscosity on Cartesian coordinates.
0.1
1
10
100
1000
0.1 1 10 100 1000
Measured viscosity, cp
Cal
cula
ted
visc
osity
, cp
Fig. A.20- Graphical interpretation of the Al-Khafaji, Abdul-Majeed, and Hassoon
correlation for saturated oil viscosity on logarithmic coordinates.

128
The Kartoatmodjo and Schmidt correlation for saturated oil viscosity
0
20
40
60
80
100
120
140
160
0 20 40 60 80 100 120 140 160
Measured viscosity, cp
Cal
cula
ted
visc
osity
, cp
Fig. A.21- Graphical interpretation of the Kartoatmodjo and Schmidt correlation for
saturated oil viscosity on Cartesian coordinates.
0.1
1
10
100
1000
0.1 1 10 100 1000
Measured viscosity, cp
Cal
cula
ted
visc
osity
, cp
Fig. A.22- Graphical interpretation of the Kartoatmodjo and Schmidt correlation for
saturated oil viscosity on logarithmic coordinates.
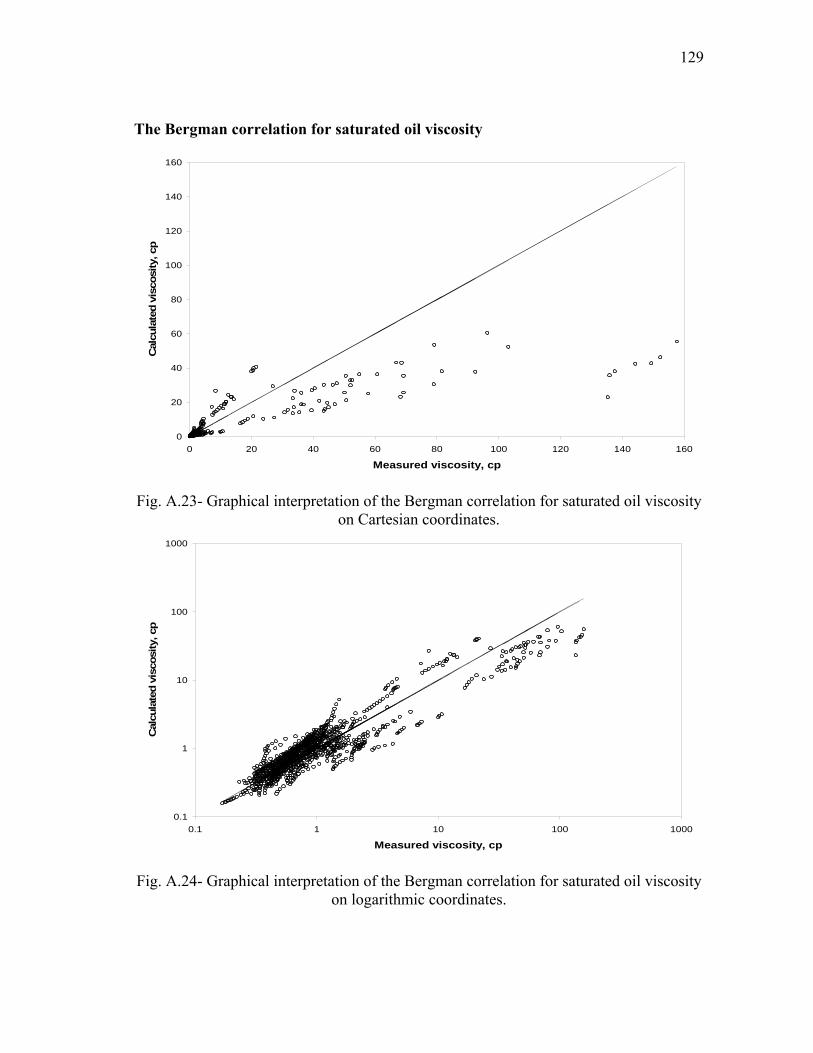
129
The Bergman correlation for saturated oil viscosity
0
20
40
60
80
100
120
140
160
0 20 40 60 80 100 120 140 160
Measured viscosity, cp
Cal
cula
ted
visc
osity
, cp
Fig. A.23- Graphical interpretation of the Bergman correlation for saturated oil viscosity
on Cartesian coordinates.
0.1
1
10
100
1000
0.1 1 10 100 1000
Measured viscosity, cp
Cal
cula
ted
visc
osity
, cp
Fig. A.24- Graphical interpretation of the Bergman correlation for saturated oil viscosity
on logarithmic coordinates.

130
The Hanafy et al correlation for saturated oil viscosity
0
20
40
60
80
100
120
140
160
0 20 40 60 80 100 120 140 160
Measured viscosity, cp
Cal
cula
ted
visc
osity
, cp
Fig. A.25- Graphical interpretation of the Hanafy et al correlation for saturated oil
viscosity on Cartesian coordinates.
0.1
1
10
100
1000
0.1 1 10 100 1000
Measured viscosity, cp
Cal
cula
ted
visc
osity
, cp
Fig. A.26- Graphical interpretation of the Hanafy et al correlation for saturated oil
viscosity on logarithmic coordinates.

131
The Abu-Khamsin and Al-Marhoun correlation for saturated oil viscosity
0
20
40
60
80
100
120
140
160
0 20 40 60 80 100 120 140 160
Measured viscosity, cp
Cal
cula
ted
visc
osity
, cp
Fig. A.27- Graphical interpretation of the Abu-Khamsin and Al-Marhoun correlation
for saturated oil viscosity on Cartesian coordinates.
0.1
1
10
100
1000
0.1 1 10 100 1000
Measured viscosity, cp
Cal
cula
ted
visc
osity
, cp
Fig. A.28- Graphical interpretation of the Abu-Khamsin and Al-Marhoun correlation
for saturated oil viscosity on logarithmic coordinates.

132
The Elsharkawy and Alikhan correlation for saturated oil viscosity
0
20
40
60
80
100
120
140
160
0 20 40 60 80 100 120 140 160
Measured viscosity, cp
Cal
cula
ted
visc
osity
, cp
Fig. A.29- Graphical interpretation of the Elsharkawy and Alikhan correlation for
saturated oil viscosity on Cartesian coordinates.
0.1
1
10
100
1000
0.1 1 10 100 1000
Measured viscosity, cp
Cal
cula
ted
visc
osity
, cp
Fig. A.30- Graphical interpretation of the Elsharkawy and Alikhan correlation for
saturated oil viscosity on logarithmic coordinates.

133
The Aziz, Govier, and Fogarasi correlation for saturated oil viscosity
0
20
40
60
80
100
120
140
160
0 20 40 60 80 100 120 140 160
Measured viscosity, cp
Cal
cula
ted
visc
osity
, cp
Fig. A.31- Graphical interpretation of the Aziz, Govier, and Fogarasi correlation for
saturated oil viscosity on Cartesian coordinates.
0.1
1
10
100
1000
0.1 1 10 100 1000
Measured viscosity, cp
Cal
cula
ted
visc
osity
, cp
Fig. A.32- Graphical interpretation of the Aziz, Govier, and Fogarasi correlation for
saturated oil viscosity on logarithmic coordinates.

134
The Khan et al correlation for saturated oil viscosity
0
20
40
60
80
100
120
140
160
0 20 40 60 80 100 120 140 160
Measured viscosity, cp
Cal
cula
ted
visc
osity
, cp
Fig. A.33- Graphical interpretation of the Khan et al correlation for saturated oil
viscosity on Cartesian coordinates.
0.1
1
10
100
1000
0.1 1 10 100 1000
Measured viscosity, cp
Cal
cula
ted
visc
osity
, cp
Fig. A.34- Graphical interpretation of the Khan et al correlation for saturated oil
viscosity on logarithmic coordinates.
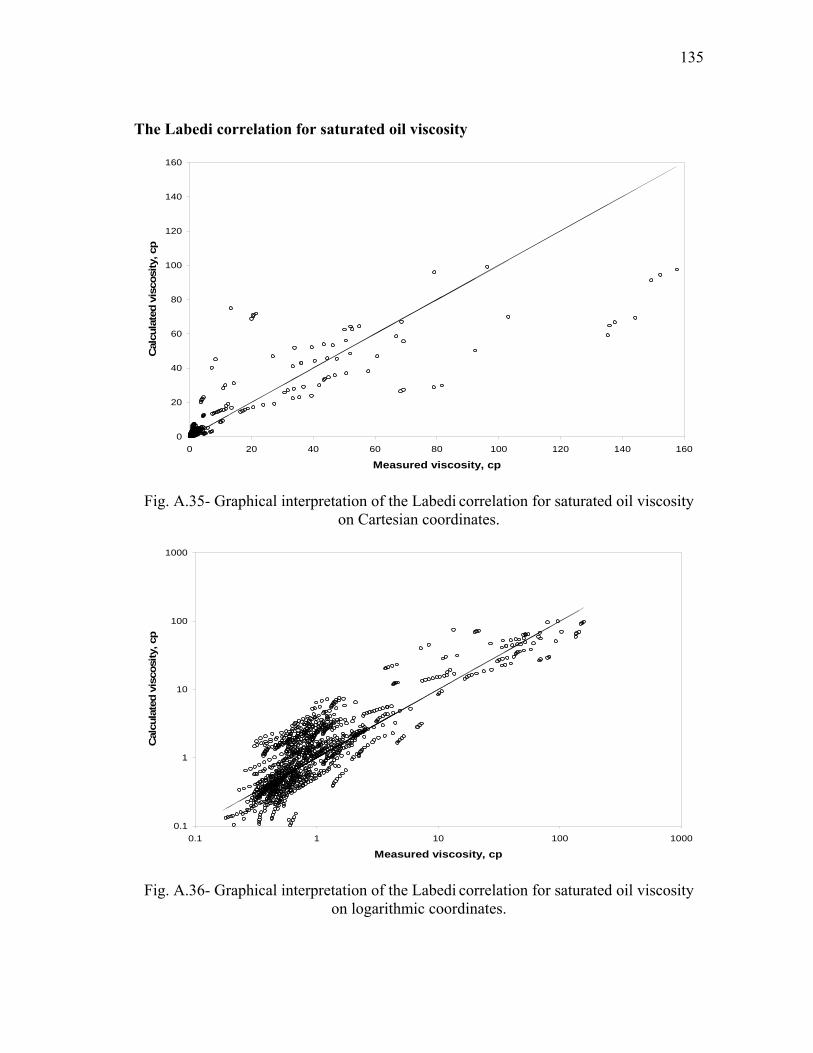
135
The Labedi correlation for saturated oil viscosity
0
20
40
60
80
100
120
140
160
0 20 40 60 80 100 120 140 160
Measured viscosity, cp
Cal
cula
ted
visc
osity
, cp
Fig. A.35- Graphical interpretation of the Labedi correlation for saturated oil viscosity
on Cartesian coordinates.
0.1
1
10
100
1000
0.1 1 10 100 1000
Measured viscosity, cp
Cal
cula
ted
visc
osity
, cp
Fig. A.36- Graphical interpretation of the Labedi correlation for saturated oil viscosity
on logarithmic coordinates.

136
APPENDIX B
PERFORMANCE OF VISCOSITY CORRELATIONS FOR
UMDERSATURATED RESERVOIR OIL
(183 PVT REPORTS/ 1968 DATA POINTS)

137
The proposed correlation for undersaturated oil viscosity
0
50
100
150
200
250
300
0 50 100 150 200 250 300
Measured reservoir oil viscosity, cp
Cal
cula
ted
rese
rvoi
r oil
visc
osity
, cp
Fig. B.1- Graphical interpretation of the proposed correlation for undersaturated oil
viscosity on Cartesian coordinates.
0.1
1
10
100
1000
0.1 1 10 100 1000
Measured reservoir oil viscosity, cp
Cal
cula
ted
rese
rvoi
r oil
visc
osity
, cp
Fig. B.2- Graphical interpretation of the proposed correlation for undersaturated oil
viscosity on logarithmic coordinates.
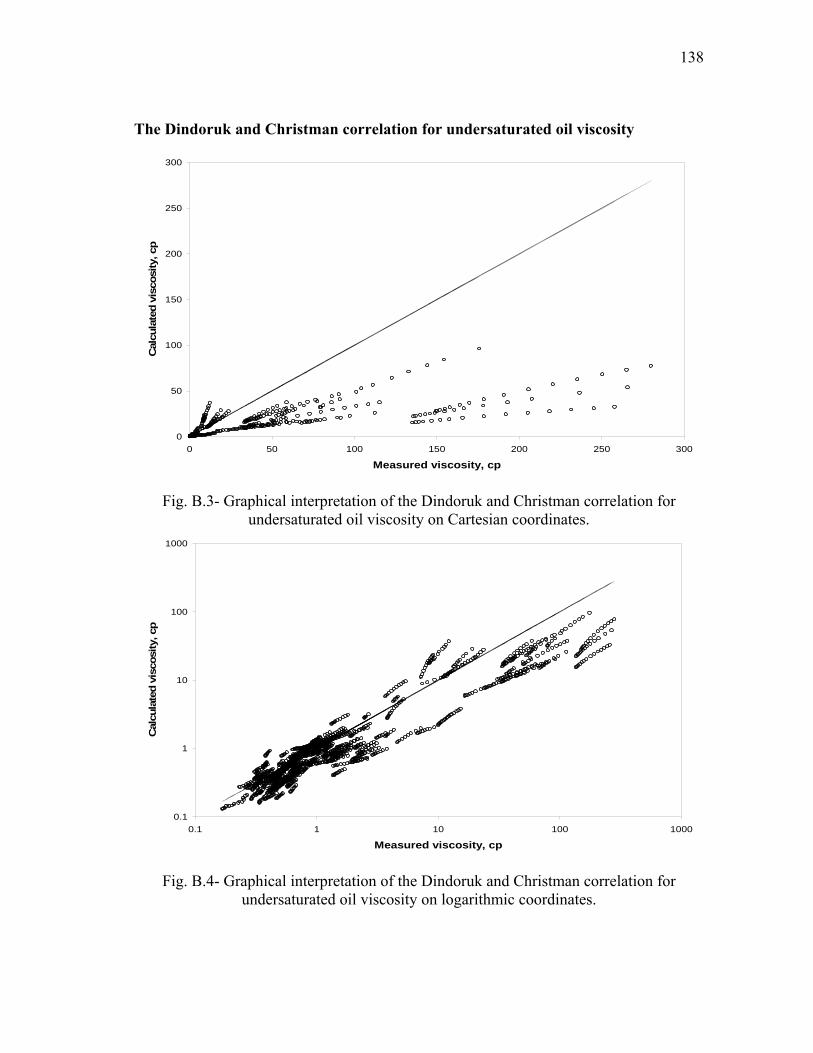
138
The Dindoruk and Christman correlation for undersaturated oil viscosity
0
50
100
150
200
250
300
0 50 100 150 200 250 300
Measured viscosity, cp
Cal
cula
ted
visc
osity
, cp
Fig. B.3- Graphical interpretation of the Dindoruk and Christman correlation for
undersaturated oil viscosity on Cartesian coordinates.
0.1
1
10
100
1000
0.1 1 10 100 1000
Measured viscosity, cp
Cal
cula
ted
visc
osity
, cp
Fig. B.4- Graphical interpretation of the Dindoruk and Christman correlation for
undersaturated oil viscosity on logarithmic coordinates.

139
The Petrosky and Farshad correlation for undersaturated oil viscosity
0
50
100
150
200
250
300
0 50 100 150 200 250 300
Measured viscosity, cp
Cal
cula
ted
visc
osity
, cp
Fig. B.5- Graphical interpretation of the Petrosky and Farshad correlation for
undersaturated oil viscosity on Cartesian coordinates.
0.1
1
10
100
1000
0.1 1 10 100 1000
Measured viscosity, cp
Cal
cula
ted
visc
osity
, cp
Fig. B.6- Graphical interpretation of the Petrosky and Farshad correlation for
undersaturated oil viscosity on logarithmic coordinates.

140
The Vasquez and Beggs correlation for undersaturated oil viscosity
0
50
100
150
200
250
300
0 50 100 150 200 250 300
Measured viscosity, cp
Cal
cula
ted
visc
osity
, cp
Fig. B.7- Graphical interpretation of the Vasquez and Beggs correlation for
undersaturated oil viscosity on Cartesian coordinates.
0.1
1
10
100
1000
0.1 1 10 100 1000
Measured viscosity, cp
Cal
cula
ted
visc
osity
, cp
Fig. B.8- Graphical interpretation of the Vasquez and Beggs correlation for
undersaturated oil viscosity on logarithmic coordinates.

141
The McCain correlation for undersaturated oil viscosity
0
50
100
150
200
250
300
0 50 100 150 200 250 300
Measured viscosity, cp
Cal
cula
ted
visc
osity
, cp
Fig. B.9- Graphical interpretation of the McCain correlation for undersaturated oil
viscosity on Cartesian coordinates.
0.1
1
10
100
1000
0.1 1 10 100 1000
Measured viscosity, cp
Cal
cula
ted
visc
osity
, cp
Fig. B.10- Graphical interpretation of the McCain correlation for undersaturated oil
viscosity on logarithmic coordinates.

142
The De Ghetto, Paone, and Villa correlation for undersaturated oil viscosity
0
50
100
150
200
250
300
0 50 100 150 200 250 300
Measured viscosity, cp
Cal
cula
ted
visc
osity
, cp
Fig. B.11- Graphical interpretation of the De Ghetto, Paone, and Villa correlation
for undersaturated oil viscosity on Cartesian coordinates.
0.1
1
10
100
1000
0.1 1 10 100 1000
Measured viscosity, cp
Cal
cula
ted
visc
osity
, cp
Fig. B.12- Graphical interpretation of the De Ghetto, Paone, and Villa correlation
for undersaturated oil viscosity on logarithmic coordinates.

143
The Standing correlation for undersaturated oil viscosity
0
50
100
150
200
250
300
0 50 100 150 200 250 300
Measured viscosity, cp
Cal
cula
ted
visc
osity
, cp
Fig. B.13- Graphical interpretation of the Standing correlation for undersaturated oil
viscosity on Cartesian coordinates.
0.1
1
10
100
1000
0.1 1 10 100 1000
Measured viscosity, cp
Cal
cula
ted
visc
osity
, cp
Fig. B.14- Graphical interpretation of the Standing correlation for undersaturated oil
viscosity on logarithmic coordinates.

144
The Hanafy et al. correlation for undersaturated oil viscosity
0
50
100
150
200
250
300
0 50 100 150 200 250 300
Measured viscosity, cp
Cal
cula
ted
visc
osity
, cp
Fig. B.15- Graphical interpretation of the Hanafy et al. correlation for undersaturated oil
viscosity on Cartesian coordinates.
0.1
1
10
100
1000
0.1 1 10 100 1000
Measured viscosity, cp
Cal
cula
ted
visc
osity
, cp
Fig. B.16- Graphical interpretation of the Hanafy et al. correlation for undersaturated oil
viscosity on logarithmic coordinates.

145
The Elsharkawy and Alikhan correlation for undersaturated oil viscosity
0
50
100
150
200
250
300
0 50 100 150 200 250 300
Measured viscosity, cp
Cal
cula
ted
visc
osity
, cp
Fig. B.17- Graphical interpretation of the Elsharkawy and Alikhan correlation
for undersaturated oil viscosity on Cartesian coordinates.
0.1
1
10
100
1000
0.1 1 10 100 1000
Measured viscosity, cp
Cal
cula
ted
visc
osity
, cp
Fig. B.18- Graphical interpretation of the Elsharkawy and Alikhan correlation
for undersaturated oil viscosity on logarithmic coordinates.

146
The Abu-Khamsin and Al-Marhoun correlation for undersaturated oil viscosity
0
50
100
150
200
250
300
0 50 100 150 200 250 300
Measured viscosity, cp
Cal
cula
ted
visc
osity
, cp
Fig. B.19- Graphical interpretation of the Abu-Khamsin and Al-Marhoun correlation
for undersaturated oil viscosity on Cartesian coordinates.
0.1
1
10
100
1000
0.1 1 10 100 1000
Measured viscosity, cp
Cal
cula
ted
visc
osity
, cp
Fig. B.20- Graphical interpretation of the Abu-Khamsin and Al-Marhoun correlation
for undersaturated oil viscosity on logarithmic coordinates.

147
The Almehaideb correlation for undersaturated oil viscosity
0
50
100
150
200
250
300
0 50 100 150 200 250 300
Measured viscosity, cp
Cal
cula
ted
visc
osity
, cp
Fig. B.21- Graphical interpretation of the Almehaideb correlation for undersaturated oil
viscosity on Cartesian coordinates.
0.1
1
10
100
1000
0.1 1 10 100 1000
Measured viscosity, cp
Cal
cula
ted
visc
osity
, cp
Fig. B.22- Graphical interpretation of the Almehaideb correlation for undersaturated oil
viscosity on logarithmic coordinates.

148
The Kartoatmodjo and Schmidt correlation for undersaturated oil viscosity
0
50
100
150
200
250
300
0 50 100 150 200 250 300
Measured viscosity, cp
Cal
cula
ted
visc
osity
, cp
Fig. B.23- Graphical interpretation of the Kartoatmodjo and Schmidt correlation
for undersaturated oil viscosity on Cartesian coordinates.
0.1
1
10
100
1000
0.1 1 10 100 1000
Measured viscosity, cp
Cal
cula
ted
visc
osity
, cp
Fig. B.24- Graphical interpretation of the Kartoatmodjo and Schmidt correlation
for undersaturated oil viscosity on logarithmic coordinates.
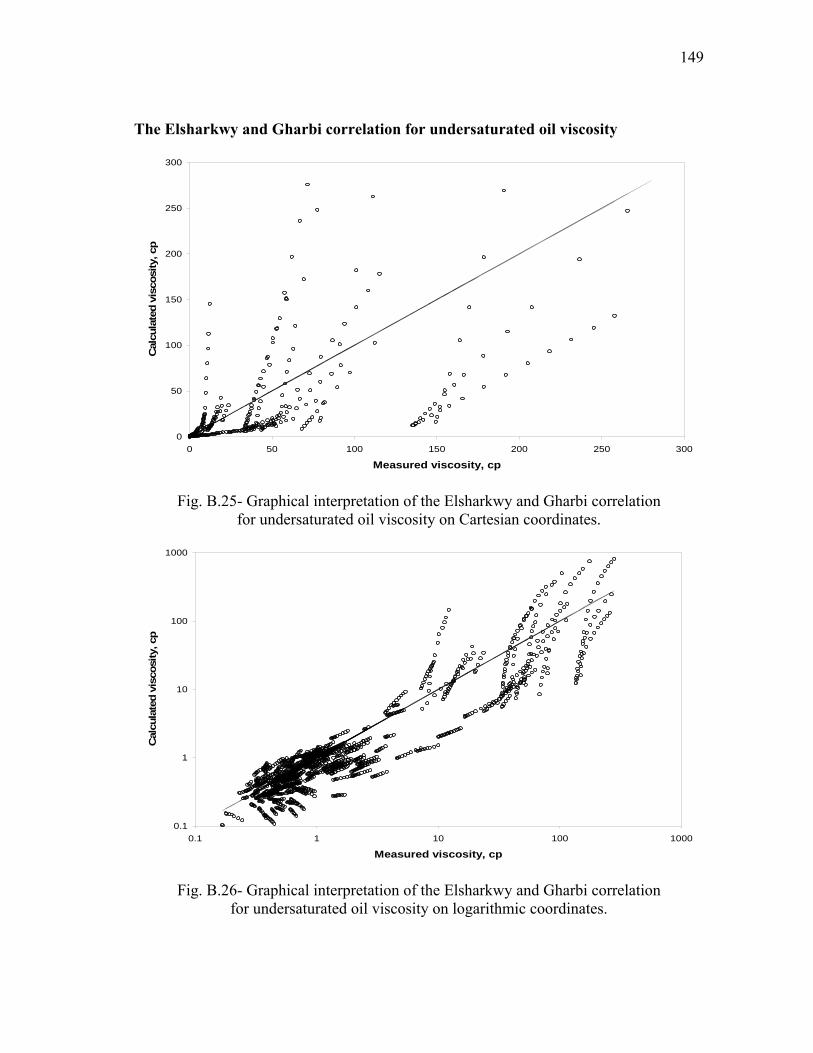
149
The Elsharkwy and Gharbi correlation for undersaturated oil viscosity
0
50
100
150
200
250
300
0 50 100 150 200 250 300
Measured viscosity, cp
Cal
cula
ted
visc
osity
, cp
Fig. B.25- Graphical interpretation of the Elsharkwy and Gharbi correlation
for undersaturated oil viscosity on Cartesian coordinates.
0.1
1
10
100
1000
0.1 1 10 100 1000
Measured viscosity, cp
Cal
cula
ted
visc
osity
, cp
Fig. B.26- Graphical interpretation of the Elsharkwy and Gharbi correlation
for undersaturated oil viscosity on logarithmic coordinates.

150
The Khan et al. correlation for undersaturated oil viscosity
0
50
100
150
200
250
300
0 50 100 150 200 250 300
Measured viscosity, cp
Cal
cula
ted
visc
osity
, cp
Fig. B.27- Graphical interpretation of the Khan et al. correlation for undersaturated oil
viscosity on Cartesian coordinates.
0.1
1
10
100
1000
0.1 1 10 100 1000
Measured viscosity, cp
Cal
cula
ted
visc
osity
, cp
Fig. B.28- Graphical interpretation of the Khan et al. correlation for undersaturated oil
viscosity on logarithmic coordinates.
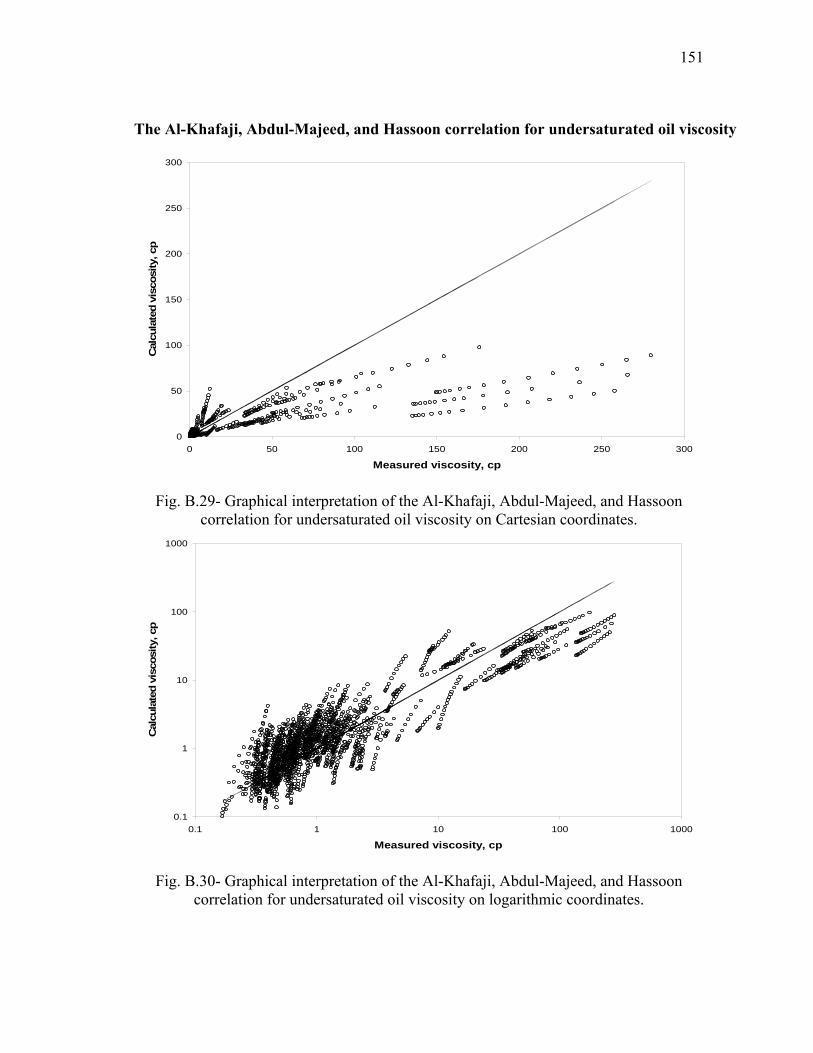
151
The Al-Khafaji, Abdul-Majeed, and Hassoon correlation for undersaturated oil viscosity
0
50
100
150
200
250
300
0 50 100 150 200 250 300
Measured viscosity, cp
Cal
cula
ted
visc
osity
, cp
Fig. B.29- Graphical interpretation of the Al-Khafaji, Abdul-Majeed, and Hassoon
correlation for undersaturated oil viscosity on Cartesian coordinates.
0.1
1
10
100
1000
0.1 1 10 100 1000
Measured viscosity, cp
Cal
cula
ted
visc
osity
, cp
Fig. B.30- Graphical interpretation of the Al-Khafaji, Abdul-Majeed, and Hassoon
correlation for undersaturated oil viscosity on logarithmic coordinates.

152
The Labedi correlation for undersaturated oil viscosity
0
50
100
150
200
250
300
0 50 100 150 200 250 300
Measured viscosity, cp
Cal
cula
ted
visc
osity
, cp
Fig. B.31- Graphical interpretation of the Labedi correlation for undersaturated oil
viscosity on Cartesian coordinates.
0.1
1
10
100
1000
0.1 1 10 100 1000
Measured viscosity, cp
Cal
cula
ted
visc
osity
, cp
Fig. B.32- Graphical interpretation of the Labedi correlation for undersaturated oil
viscosity on logarithmic coordinates.

153
APPENDIX C
CORRELATIONS R2 FOR RESERVOIR OIL VISCOSITY MODEL

154
Saturated Oil Viscosity Correlation
Table C-1- Finding optimal correlation R2 of transformed variables for tetravariate cases
(saturated oil viscosity correlation)
Dependent
variable
First & second stage
independent variable
Third stage
independent variable
Correlation
R2
Improvement,
%
γg 0.92 0.84
ln γg 0.92 0.82
p 0.91 0.33
ln p 0.91 0.21
T 0.92 0.67
ln T 0.92 0.73
pb 0.91 0.40
ln pb 0.91 -0.06
RS 0.91 -0.37
ln RS 0.91 0.30
RSb 0.91 0.25
ln µo
ρo & ρsto
ln RSb 0.91 0.06

155
Exponent, a
Table C-2- Finding optimal correlation R2 of transformed variables for tetravariate cases
(undersaturated oil viscosity correlation)
Dependent
variable
First & second stage
independent variable
Third stage
independent variable
Correlation
R2
Improvement,
%
T 0.747 -0.01
ln T 0.747 -0.04
ρsto 0.747 -0.09
ln ρsto 0.747 -0.05
γg 0.750 0.39
ln γg 0.750 0.33
RSb 0.747 -0.10
ln a
ln ρob & ln ρsto
ln RSb 0.745 -0.38
156
APPENDIX D
PERFORMANCE OF VISCOSITY CORRELATIONS
FOR UNDERSATURATED RESERVOIR OIL USING
LABORATORY-MEASURED BUBBLE POINT OIL VISCOSITY
(183 PVT REPORTS/ 1968 DATA POINTS)

157
The proposed correlation for undersaturated oil viscosity
0
50
100
150
200
250
300
350
0 50 100 150 200 250 300
Laboratory-measured undersaturated oil viscosity, cp
Cal
cula
ted
unde
rsat
urat
ed o
il vi
scos
ity, c
p
Fig. D.1- Results of the proposed correlation for undersaturated oil viscosity on
Cartesian scales using laboratory-measured bubble point oil viscosity.
0.1
1
10
100
1000
0.1 1 10 100 1000
Laboratory-measured undersaturated oil viscosity, cp
Cal
cula
ted
unde
rsat
urat
ed o
il vi
scos
ity, c
p
Fig. D.2- Results of the proposed correlation for undersaturated oil viscosity on
logarithmic scales using laboratory-measured bubble point oil viscosity.

158
The Standing correlation for undersaturated oil viscosity
0
100
200
300
400
500
0 50 100 150 200 250 300
Measured reservoir oil viscosity, cp
Cal
cula
ted
rese
rvoi
r oil
visc
osity
, cp
Fig. D.3- Results of the Standing correlation for undersaturated oil viscosity on
Cartesian scales using laboratory-measured bubble point oil viscosity.
0.1
1
10
100
1000
0.1 1 10 100 1000
Measured reservoir oil viscosity, cp
Cal
cula
ted
rese
rvoi
r oil
visc
osity
, cp
Fig. D.4- Results of the Standing correlation for undersaturated oil viscosity on
logarithmic scales using laboratory-measured bubble point oil viscosity.

159
The Khan et al. correlation for undersaturated oil viscosity
0
50
100
150
200
250
300
0 50 100 150 200 250 300
Measured reservoir oil viscosity, cp
Cal
cula
ted
rese
rvoi
r oil
visc
osity
, cp
Fig. D.5- Results of the Khan et al. correlation for undersaturated oil viscosity on
Cartesian scales using laboratory-measured bubble point oil viscosity.
0.1
1
10
100
1000
0.1 1 10 100 1000
Measured reservoir oil viscosity, cp
Cal
cula
ted
rese
rvoi
r oil
visc
osity
, cp
Fig. D.6- Results of the Khan et al. correlation for undersaturated oil viscosity on
logarithmic scales using laboratory-measured bubble point oil viscosity.

160
The Almehaideb correlation for undersaturated oil viscosity
0
50
100
150
200
250
300
0 50 100 150 200 250 300
Measured reservoir oil viscosity, cp
Cal
cula
ted
rese
rvoi
r oil
visc
osity
, cp
Fig. D.7- Results of the Almehaideb correlation for undersaturated oil viscosity on
Cartesian scales using laboratory-measured bubble point oil viscosity.
0.1
1
10
100
1000
0.1 1 10 100 1000
Measured reservoir oil viscosity, cp
Cal
cula
ted
rese
rvoi
r oil
visc
osity
, cp
Fig. D.8- Results of the Almehaideb correlation for undersaturated oil viscosity on
logarithmic scales using laboratory-measured bubble point oil viscosity.
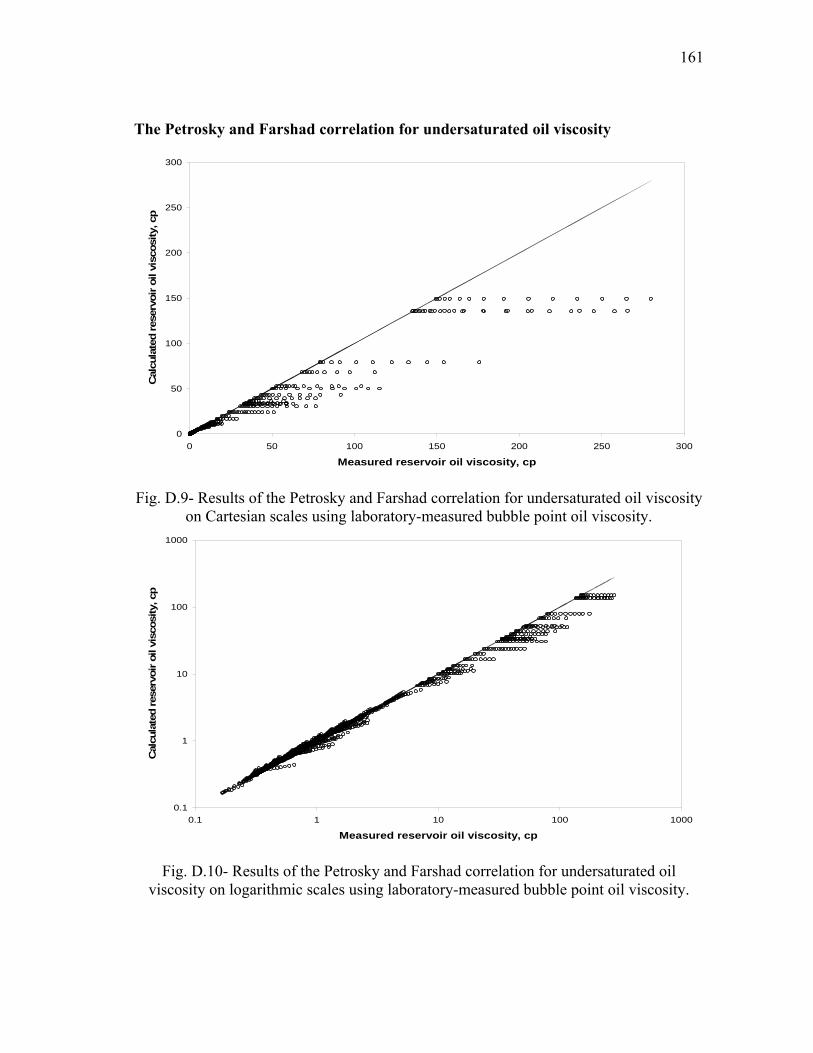
161
The Petrosky and Farshad correlation for undersaturated oil viscosity
0
50
100
150
200
250
300
0 50 100 150 200 250 300
Measured reservoir oil viscosity, cp
Cal
cula
ted
rese
rvoi
r oil
visc
osity
, cp
Fig. D.9- Results of the Petrosky and Farshad correlation for undersaturated oil viscosity
on Cartesian scales using laboratory-measured bubble point oil viscosity.
0.1
1
10
100
1000
0.1 1 10 100 1000
Measured reservoir oil viscosity, cp
Cal
cula
ted
rese
rvoi
r oil
visc
osity
, cp
Fig. D.10- Results of the Petrosky and Farshad correlation for undersaturated oil
viscosity on logarithmic scales using laboratory-measured bubble point oil viscosity.

162
The Kartoatmodjo and Schmidt correlation for undersaturated oil viscosity
0
50
100
150
200
250
300
350
400
0 50 100 150 200 250 300
Measured reservoir oil viscosity, cp
Cal
cula
ted
rese
rvoi
r oil
visc
osity
, cp
Fig. D.11- Results of the Kartoatmodjo and Schmidt correlation for undersaturated oil
viscosity on Cartesian scales using laboratory-measured bubble point oil viscosity.
0.1
1
10
100
1000
0.1 1 10 100 1000
Measured reservoir oil viscosity, cp
Cal
cula
ted
rese
rvoi
r oil
visc
osity
, cp
Fig. D.12- Results of the Kartoatmodjo and Schmidt correlation for undersaturated oil viscosity on logarithmic scales using laboratory-measured bubble point oil viscosity.
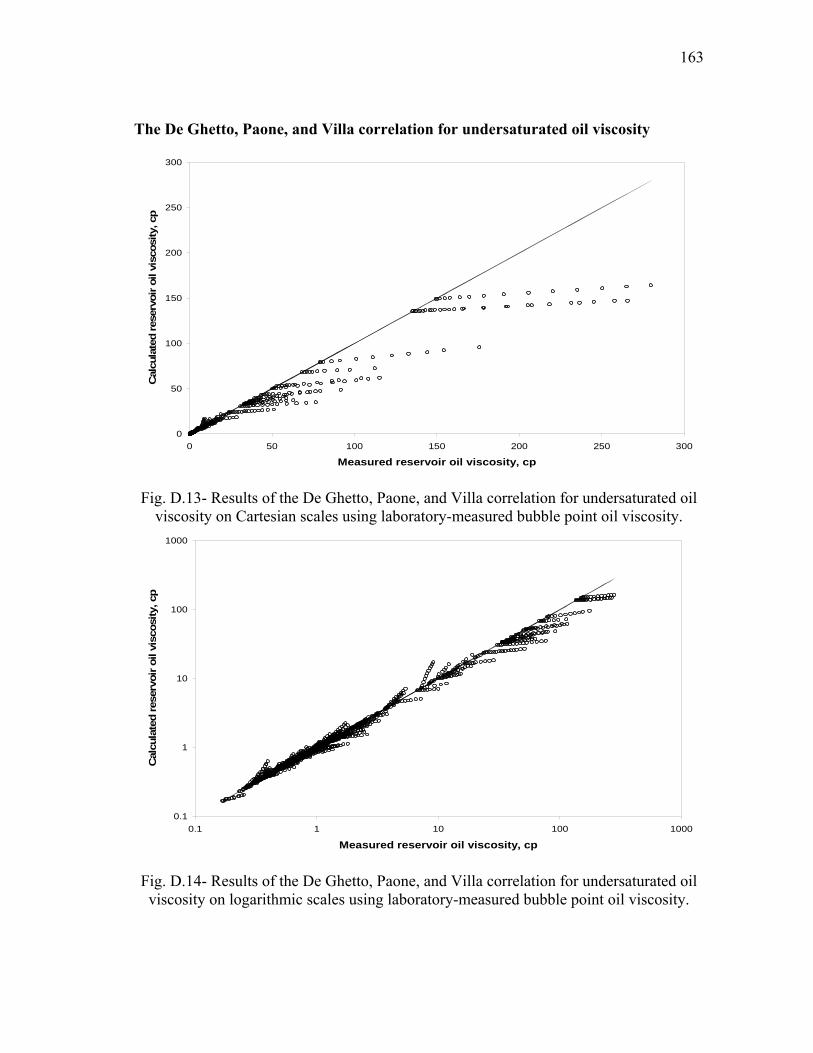
163
The De Ghetto, Paone, and Villa correlation for undersaturated oil viscosity
0
50
100
150
200
250
300
0 50 100 150 200 250 300
Measured reservoir oil viscosity, cp
Cal
cula
ted
rese
rvoi
r oil
visc
osity
, cp
Fig. D.13- Results of the De Ghetto, Paone, and Villa correlation for undersaturated oil
viscosity on Cartesian scales using laboratory-measured bubble point oil viscosity.
0.1
1
10
100
1000
0.1 1 10 100 1000
Measured reservoir oil viscosity, cp
Cal
cula
ted
rese
rvoi
r oil
visc
osity
, cp
Fig. D.14- Results of the De Ghetto, Paone, and Villa correlation for undersaturated oil viscosity on logarithmic scales using laboratory-measured bubble point oil viscosity.

164
The Elsharkawy and Alikhan correlation for undersaturated oil viscosity
0
50
100
150
200
250
300
0 50 100 150 200 250 300
Measured reservoir oil viscosity, cp
Cal
cula
ted
rese
rvoi
r oil
visc
osity
, cp
Fig. D.15- Results of the Elsharkawy and Alikhan correlation for undersaturated oil viscosity on Cartesian scales using laboratory-measured bubble point oil viscosity.
0.1
1
10
100
1000
0.1 1 10 100 1000
Measured reservoir oil viscosity, cp
Cal
cula
ted
rese
rvoi
r oil
visc
osity
, cp
Fig. D.16- Results of the Elsharkawy and Alikhan correlation for undersaturated oil viscosity on logarithmic scales using laboratory-measured bubble point oil viscosity.

165
The Vasquez and Beggs correlation for undersaturated oil viscosity
0
50
100
150
200
250
300
0 50 100 150 200 250 300
Measured reservoir oil viscosity, cp
Cal
cula
ted
rese
rvoi
r oil
visc
osity
, cp
Fig. D.17- Results of the Vasquez and Beggs correlation for undersaturated oil viscosity
on Cartesian scales using laboratory-measured bubble point oil viscosity.
0.1
1
10
100
1000
0.1 1 10 100 1000
Measured reservoir oil viscosity, cp
Cal
cula
ted
rese
rvoi
r oil
visc
osity
, cp
Fig. D.18- Results of the Vasquez and Beggs correlation for undersaturated oil viscosity
on logarithmic scales using laboratory-measured bubble point oil viscosity.

166
The Labedi correlation for undersaturated oil viscosity
0
50
100
150
200
250
300
0 50 100 150 200 250 300
Measured reservoir oil viscosity, cp
Cal
cula
ted
rese
rvoi
r oil
visc
osity
, cp
Fig. D.19- Results of the Labedi correlation for undersaturated oil viscosity on Cartesian
scales using laboratory-measured bubble point oil viscosity.
0.1
1
10
100
1000
0.1 1 10 100 1000
Measured reservoir oil viscosity, cp
Cal
cula
ted
rese
rvoi
r oil
visc
osity
, cp
Fig. D.20- Results of the Labedi correlation for undersaturated oil viscosity on
logarithmic scales using laboratory-measured bubble point oil viscosity.
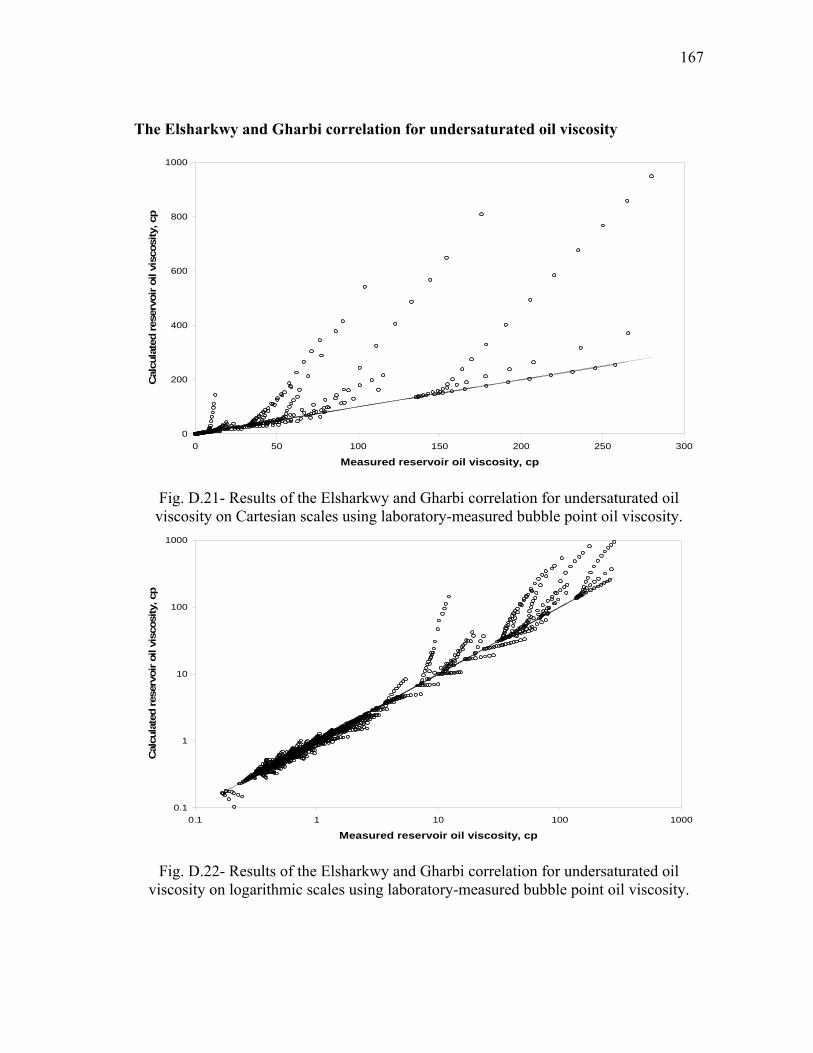
167
The Elsharkwy and Gharbi correlation for undersaturated oil viscosity
0
200
400
600
800
1000
0 50 100 150 200 250 300
Measured reservoir oil viscosity, cp
Cal
cula
ted
rese
rvoi
r oil
visc
osity
, cp
Fig. D.21- Results of the Elsharkwy and Gharbi correlation for undersaturated oil viscosity on Cartesian scales using laboratory-measured bubble point oil viscosity.
0.1
1
10
100
1000
0.1 1 10 100 1000
Measured reservoir oil viscosity, cp
Cal
cula
ted
rese
rvoi
r oil
visc
osity
, cp
Fig. D.22- Results of the Elsharkwy and Gharbi correlation for undersaturated oil
viscosity on logarithmic scales using laboratory-measured bubble point oil viscosity.
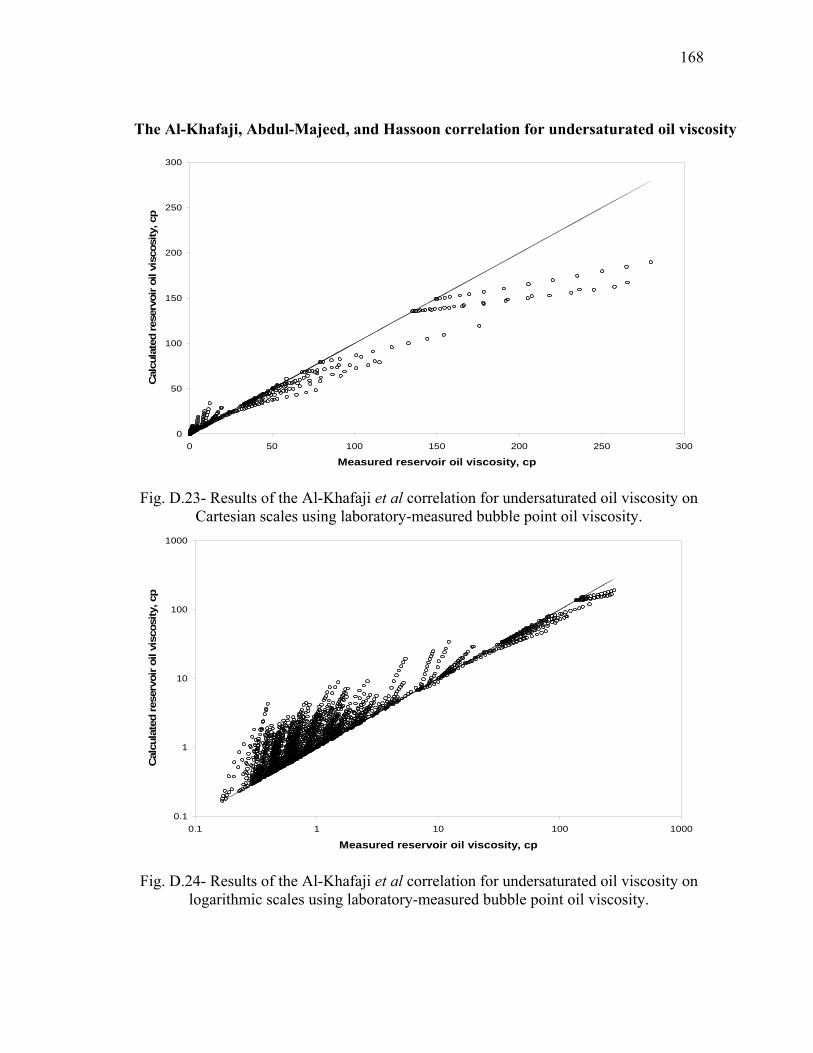
168
The Al-Khafaji, Abdul-Majeed, and Hassoon correlation for undersaturated oil viscosity
0
50
100
150
200
250
300
0 50 100 150 200 250 300
Measured reservoir oil viscosity, cp
Cal
cula
ted
rese
rvoi
r oil
visc
osity
, cp
Fig. D.23- Results of the Al-Khafaji et al correlation for undersaturated oil viscosity on
Cartesian scales using laboratory-measured bubble point oil viscosity.
0.1
1
10
100
1000
0.1 1 10 100 1000
Measured reservoir oil viscosity, cp
Cal
cula
ted
rese
rvoi
r oil
visc
osity
, cp
Fig. D.24- Results of the Al-Khafaji et al correlation for undersaturated oil viscosity on
logarithmic scales using laboratory-measured bubble point oil viscosity.

169
The Dindoruk and Christman correlation for undersaturated oil viscosity
0
5000
10000
15000
20000
25000
30000
35000
40000
0 50 100 150 200 250 300
Measured viscosity, cp
Cal
cula
ted
visc
osity
, cp
Fig. D.25- Results of the Dindoruk and Christman correlation for undersaturated oil viscosity on Cartesian scales using laboratory-measured bubble point oil viscosity.
0.1
1
10
100
1000
10000
100000
0.1 1 10 100 1000
Measured reservoir oil viscosity, cp
Cal
cula
ted
rese
rvoi
r oil
visc
osity
, cp
Fig. D.26- Results of the Dindoruk and Christman correlation for undersaturated oil viscosity on logarithmic scales using laboratory-measured bubble point oil viscosity.
170
APPENDIX E
STATISTICAL ERROR ANALYSIS RESULTS OF THE PROPOSED
OIL VISCOSITY CORRELATIONS AT ANY RESERVOIR
CONDITIONS

171
Table E-1- A comparison of ARE in percentage obtained from saturated oil
viscosity correlation equations regarding stock-tank oil gravity Stock-tank oil gravity, oAPI
Published correlations <=20 20-25 25-30 30-35 35-40 40-45 45-50 >50
This work -19.3 -8.8 0.3 -7.3 -3.4 9.0 3.3 5.8
Beggs and Robinson -71.0 -20.3 2.4 -7.4 -2.0 0.2 -10.0 10.4
De Ghetto, Paone, and Villa -46.6 25.0 17.8 -3.6 4.3 3.4 -6.7 5.7
Dindoruk and Christman -57.7 -10.1 22.8 -4.0 -12.8 -17.8 -30.5 -40.6
Petrosky and Farshad -56.5 -1.3 28.9 7.6 -2.0 -3.3 -15.3 -30.3
Table E-2- A comparison of AARE in percentage obtained from saturated oil
viscosity correlation equations regarding stock-tank oil gravity Stock-tank oil gravity, oAPI
Published correlations <=20 20-25 25-30 30-35 35-40 40-45 45-50 >50
This work 48.1 38.5 22.5 31.3 23.4 19.5 12.1 5.8
Beggs and Robinson 72.1 39.5 26.1 29.1 27.1 18.2 19.1 10.4
De Ghetto, Paone, and Villa 57.3 60.1 34.0 30.6 26.7 18.2 17.8 5.7
Dindoruk and Christman 60.0 37.6 36.7 30.5 23.6 21.5 31.4 40.6
Petrosky and Farshad 58.4 47.2 40.6 36.6 25.0 17.1 18.4 30.3
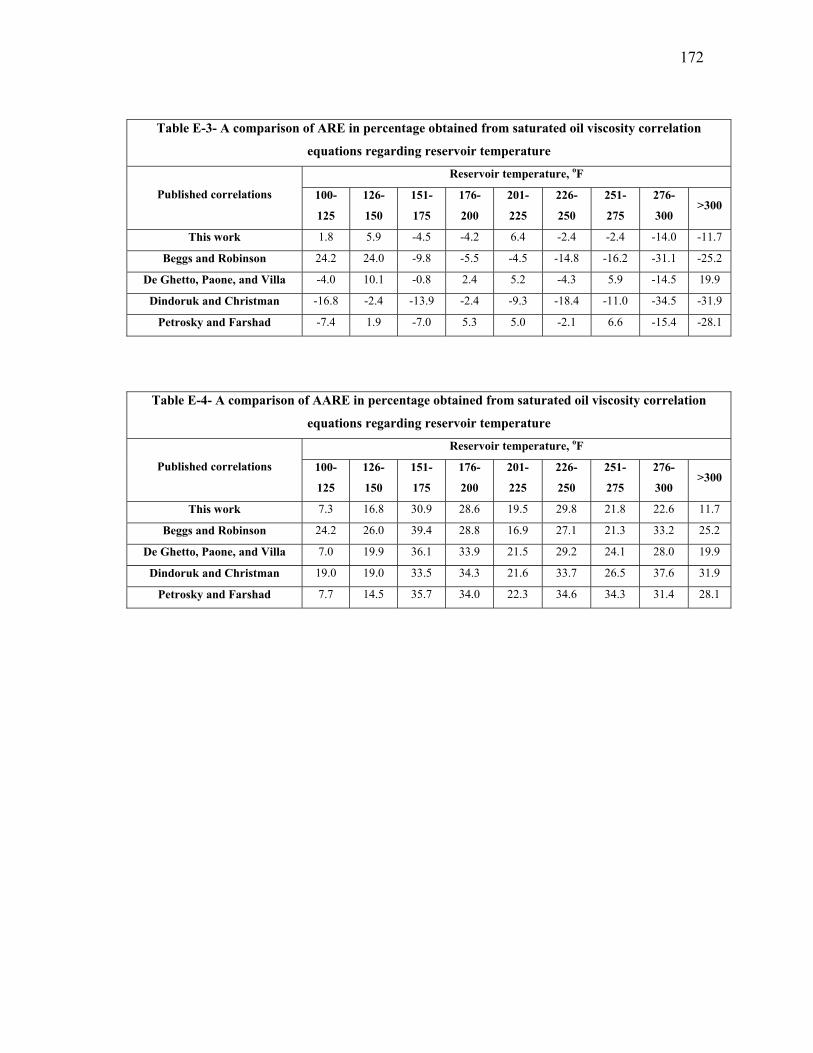
172
Table E-3- A comparison of ARE in percentage obtained from saturated oil viscosity correlation
equations regarding reservoir temperature
Reservoir temperature, oF
Published correlations 100-
125
126-
150
151-
175
176-
200
201-
225
226-
250
251-
275
276-
300 >300
This work 1.8 5.9 -4.5 -4.2 6.4 -2.4 -2.4 -14.0 -11.7
Beggs and Robinson 24.2 24.0 -9.8 -5.5 -4.5 -14.8 -16.2 -31.1 -25.2
De Ghetto, Paone, and Villa -4.0 10.1 -0.8 2.4 5.2 -4.3 5.9 -14.5 19.9
Dindoruk and Christman -16.8 -2.4 -13.9 -2.4 -9.3 -18.4 -11.0 -34.5 -31.9
Petrosky and Farshad -7.4 1.9 -7.0 5.3 5.0 -2.1 6.6 -15.4 -28.1
Table E-4- A comparison of AARE in percentage obtained from saturated oil viscosity correlation
equations regarding reservoir temperature
Reservoir temperature, oF
Published correlations 100-
125
126-
150
151-
175
176-
200
201-
225
226-
250
251-
275
276-
300 >300
This work 7.3 16.8 30.9 28.6 19.5 29.8 21.8 22.6 11.7
Beggs and Robinson 24.2 26.0 39.4 28.8 16.9 27.1 21.3 33.2 25.2
De Ghetto, Paone, and Villa 7.0 19.9 36.1 33.9 21.5 29.2 24.1 28.0 19.9
Dindoruk and Christman 19.0 19.0 33.5 34.3 21.6 33.7 26.5 37.6 31.9
Petrosky and Farshad 7.7 14.5 35.7 34.0 22.3 34.6 34.3 31.4 28.1

173
Table E-5- A comparison of ARE in percentage obtained from saturated oil viscosity correlation
equations regarding bubble point solution gas-oil ratio
Bubble point solution gas-oil ratio, scf/STB
Published correlations <=200
201-
400
401-
600
601-
800
801-
1000
1001-
1200
1201-
1400 >1400
This work -21.1 -4.3 1.7 10.2 2.1 6.7 10.0 -2.8
Beggs and Robinson -33.7 3.1 -3.8 5.0 -9.3 -6.9 -9.2 -12.5
De Ghetto, Paone, and Villa -14.7 10.1 3.4 12.6 -6.6 0.3 -6.4 -11.3
Dindoruk and Christman -33.8 -3.5 -9.0 9.8 -21.0 -8.7 -28.7 -24.7
Petrosky and Farshad -29.5 6.6 5.3 20.6 -6.6 4.7 -10.2 -12.6
Table E-6- A comparison of AARE in percentage obtained from saturated oil viscosity correlation
equations regarding bubble point solution gas-oil ratio
Bubble point solution gas-oil ratio, scf/STB
Published correlations <=200
201-
400
401-
600
601-
800
801-
1000
1001-
1200
1201-
1400 >1400
This work 41.3 26.5 23.7 22.8 18.4 16.8 14.1 9.7 Beggs and Robinson 49.8 30.7 22.8 21.4 19.1 15.5 11.7 16.3
De Ghetto, Paone, and Villa 45.6 31.8 26.7 26.6 19.7 18.3 9.1 13.1 Dindoruk and Christman 45.6 28.5 27.5 26.8 22.7 21.1 28.7 26.6
Petrosky and Farshad 46.6 31.1 29.6 31.5 16.0 20.6 10.8 16.6

174
Table E-7- A comparison of ARE in percentage obtained from saturated oil viscosity correlation
equations regarding bubble point oil viscosity less than 1 cp
Bubble point oil viscosity, cp
Published correlations 0.1-
0.2
0.2-
0.3
0.3-
0.4
0.4-
0.5
0.5-
0.6
0.6-
0.7
0.7-
0.8
0.8-
0.9
0.9-
1.0
This work 1.3 20.8 26.7 5.2 0.8 0.9 3.5 -10.5 -6.7 Beggs and Robinson -13.4 5.5 11.9 -5.8 -3.1 0.5 12.6 0.8 -7.8
De Ghetto, Paone, and Villa -7.5 8.0 19.2 0.2 3.8 12.4 24.6 -1.2 7.9 Dindoruk and Christman -32.0 -10.6 -0.2 -14.9 -5.8 0.7 18.7 -5.0 6.1
Petrosky and Farshad -15.1 7.4 18.3 -1.7 8.9 10.9 21.4 2.3 18.8
Table E-8- A comparison of AARE in percentage obtained from saturated oil viscosity correlation
equations regarding bubble point oil viscosity less than 1 cp
Bubble point oil viscosity, cp
Published correlations 0.1-
0.2
0.2-
0.3
0.3-
0.4
0.4-
0.5
0.5-
0.6
0.6-
0.7
0.7-
0.8
0.8-
0.9
0.9-
1.0
This work 10.2 23.4 28.4 12.6 15.0 13.5 16.2 19.5 16.5 Beggs and Robinson 17.3 12.2 21.1 16.5 18.0 15.9 28.3 28.2 18.8
De Ghetto, Paone, and Villa 9.8 15.6 26.1 17.5 21.6 23.1 28.4 25.6 29.2 Dindoruk and Christman 32.0 14.9 20.4 22.1 23.3 24.8 33.2 25.3 19.4
Petrosky and Farshad 15.8 15.4 25.8 17.3 26.8 26.9 34.3 24.0 30.1

175
Table E-9- A comparison of ARE in percentage obtained from saturated oil viscosity correlation
equations regarding bubble point oil viscosity between 1 to 10 cp Bubble point oil viscosity, cp
Published correlations 1-2 2-3 3-4 4-5 7-8
This work -27.1 -45.8 -22.6 -4.7 10.5 Beggs and Robinson -19.6 -37.7 -32.2 64.4 15.6
De Ghetto, Paone, and Villa -13.3 -39.5 15.0 4.7 25.2 Dindoruk and Christman -19.9 -41.7 -14.1 16.0 11.8
Petrosky and Farshad -12.1 -39.6 -4.4 11.0 0.8
Table E-10- A comparison of AARE in percentage obtained from saturated oil viscosity correlation
equations regarding bubble point oil viscosity between 1 to 10 cp Bubble point oil viscosity, cp
Published correlations 1-2 2-3 3-4 4-5 7-8
This work 34.0 46.5 60.7 4.7 10.5 Beggs and Robinson 33.1 50.6 43.0 64.4 15.6
De Ghetto, Paone, and Villa 32.0 39.5 85.9 4.7 25.2 Dindoruk and Christman 35.4 47.0 54.1 16.0 11.8
Petrosky and Farshad 34.5 42.3 60.8 11.0 4.2
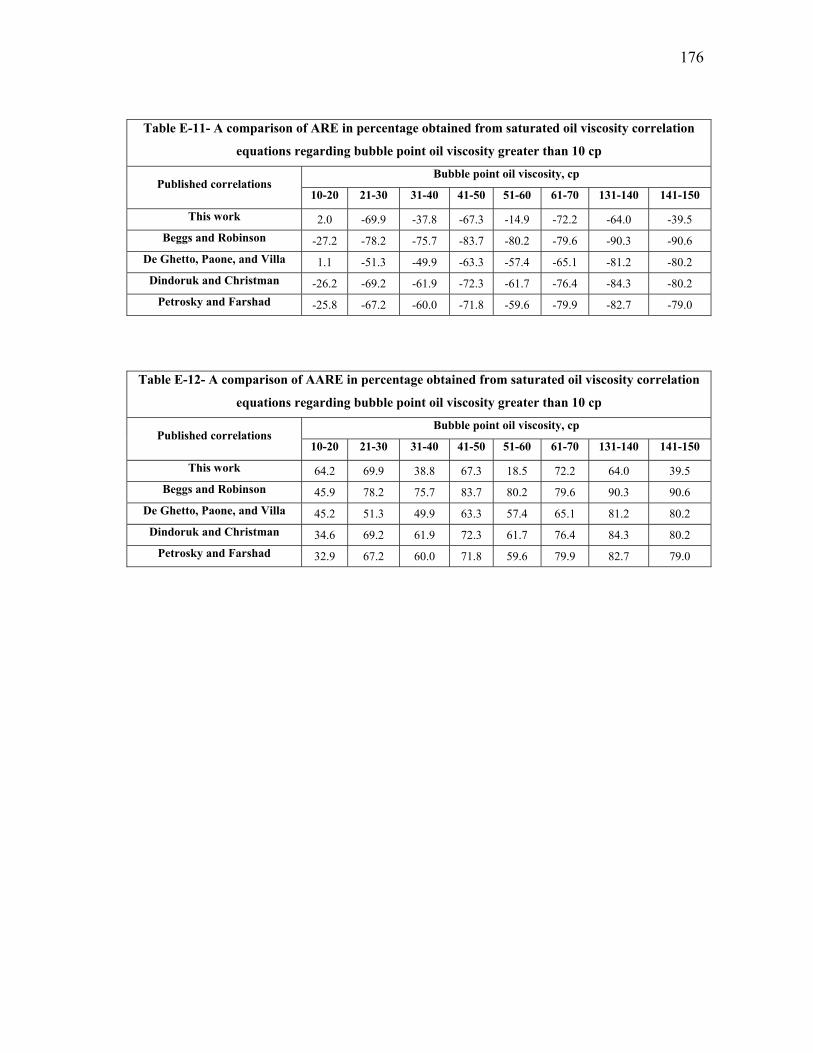
176
Table E-11- A comparison of ARE in percentage obtained from saturated oil viscosity correlation
equations regarding bubble point oil viscosity greater than 10 cp Bubble point oil viscosity, cp
Published correlations 10-20 21-30 31-40 41-50 51-60 61-70 131-140 141-150
This work 2.0 -69.9 -37.8 -67.3 -14.9 -72.2 -64.0 -39.5 Beggs and Robinson -27.2 -78.2 -75.7 -83.7 -80.2 -79.6 -90.3 -90.6
De Ghetto, Paone, and Villa 1.1 -51.3 -49.9 -63.3 -57.4 -65.1 -81.2 -80.2 Dindoruk and Christman -26.2 -69.2 -61.9 -72.3 -61.7 -76.4 -84.3 -80.2
Petrosky and Farshad -25.8 -67.2 -60.0 -71.8 -59.6 -79.9 -82.7 -79.0
Table E-12- A comparison of AARE in percentage obtained from saturated oil viscosity correlation
equations regarding bubble point oil viscosity greater than 10 cp Bubble point oil viscosity, cp
Published correlations 10-20 21-30 31-40 41-50 51-60 61-70 131-140 141-150
This work 64.2 69.9 38.8 67.3 18.5 72.2 64.0 39.5 Beggs and Robinson 45.9 78.2 75.7 83.7 80.2 79.6 90.3 90.6
De Ghetto, Paone, and Villa 45.2 51.3 49.9 63.3 57.4 65.1 81.2 80.2 Dindoruk and Christman 34.6 69.2 61.9 72.3 61.7 76.4 84.3 80.2
Petrosky and Farshad 32.9 67.2 60.0 71.8 59.6 79.9 82.7 79.0

177
Table E-13- A comparison of ARE in percentage obtained from undersaturated oil viscosity
correlation equations regarding stock-tank oil gravity
Stock-tank oil gravity, oAPI Published correlations
<=20 20-25 25-30 30-35 35-40 40-45 45-50 >50
This work -28.1 -8.6 -14.6 -11.1 -8.5 4.4 -5.1 5.8 Dindoruk and Christman -57.4 -10.5 1.3 -11.2 -18.6 -23.7 -32.1 -38.1
Petrosky and Farshad -65.7 -14.9 7.1 0.2 -7.6 -8.7 -16.0 -30.0 Vasquez and Beggs -75.9 -21.0 -18.7 -9.2 -6.9 -1.4 -2.6 26.5
De Ghetto, Paone, and Villa -82.1 -24.1 8.9 4.9 -6.0 -10.3 -22.3 -46.4
Table E-14- A comparison of AARE in percentage obtained from undersaturated oil viscosity
correlations regarding stock-tank oil gravity
Stock-tank oil gravity, oAPI Published correlations
<=20 20-25 25-30 30-35 35-40 40-45 45-50 >50
This work 55.4 52.5 25.2 33.4 26.5 17.0 18.4 5.8 Dindoruk and Christman 61.3 47.9 29.5 30.9 26.7 25.5 35.1 38.1
Petrosky and Farshad 68.3 52.0 32.0 36.3 27.6 19.4 21.3 30.0 Vasquez and Beggs 76.4 58.2 27.7 34.4 29.0 22.0 26.9 26.5
De Ghetto, Paone, and Villa 82.1 57.2 33.8 39.3 26.7 18.6 24.9 46.4
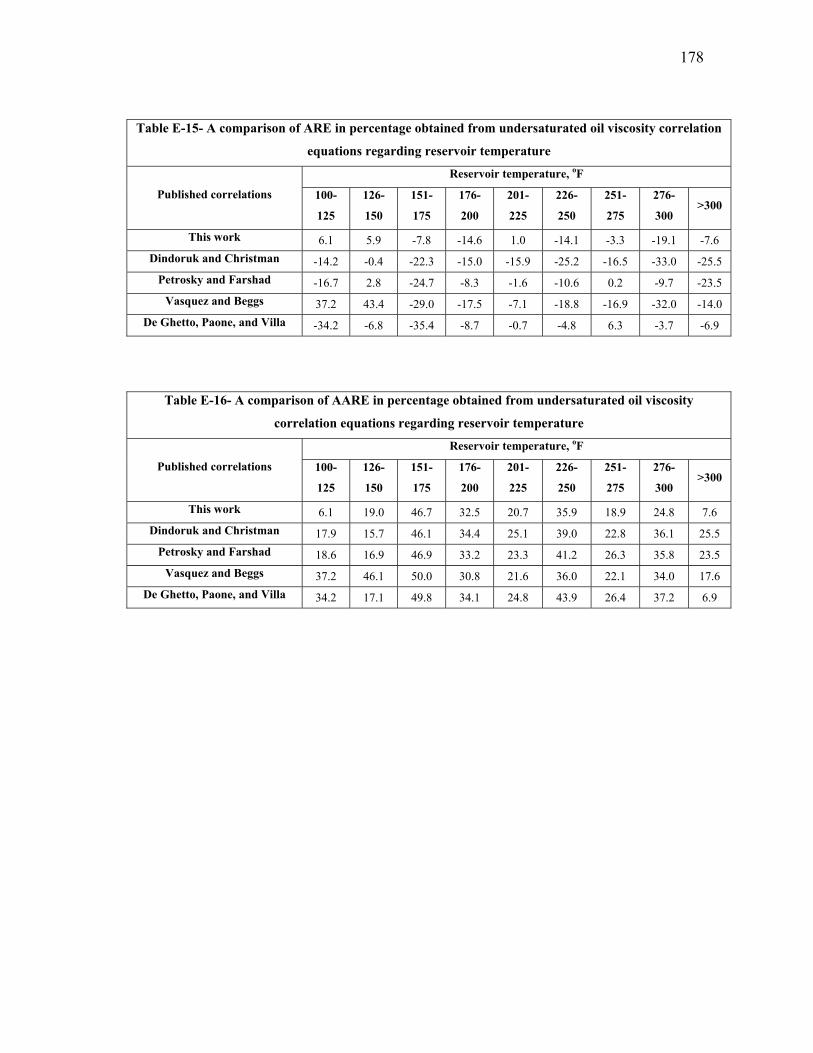
178
Table E-15- A comparison of ARE in percentage obtained from undersaturated oil viscosity correlation
equations regarding reservoir temperature
Reservoir temperature, oF
Published correlations 100-
125
126-
150
151-
175
176-
200
201-
225
226-
250
251-
275
276-
300 >300
This work 6.1 5.9 -7.8 -14.6 1.0 -14.1 -3.3 -19.1 -7.6 Dindoruk and Christman -14.2 -0.4 -22.3 -15.0 -15.9 -25.2 -16.5 -33.0 -25.5
Petrosky and Farshad -16.7 2.8 -24.7 -8.3 -1.6 -10.6 0.2 -9.7 -23.5 Vasquez and Beggs 37.2 43.4 -29.0 -17.5 -7.1 -18.8 -16.9 -32.0 -14.0
De Ghetto, Paone, and Villa -34.2 -6.8 -35.4 -8.7 -0.7 -4.8 6.3 -3.7 -6.9
Table E-16- A comparison of AARE in percentage obtained from undersaturated oil viscosity
correlation equations regarding reservoir temperature
Reservoir temperature, oF
Published correlations 100-
125
126-
150
151-
175
176-
200
201-
225
226-
250
251-
275
276-
300 >300
This work 6.1 19.0 46.7 32.5 20.7 35.9 18.9 24.8 7.6 Dindoruk and Christman 17.9 15.7 46.1 34.4 25.1 39.0 22.8 36.1 25.5
Petrosky and Farshad 18.6 16.9 46.9 33.2 23.3 41.2 26.3 35.8 23.5 Vasquez and Beggs 37.2 46.1 50.0 30.8 21.6 36.0 22.1 34.0 17.6
De Ghetto, Paone, and Villa 34.2 17.1 49.8 34.1 24.8 43.9 26.4 37.2 6.9

179
Table E-17- A comparison of ARE in percentage obtained from undersaturated oil viscosity
correlation equations regarding bubble point solution gas-oil ratio
Bubble point solution gas-oil ratio, scf/STB
Published correlations <=200
201-
400
401-
600
601-
800
801-
1000
1001-
1200
1201-
1400 >1400
This work -16.3 -6.8 4.9 0.4 -2.7 -5.9 -4.6 -25.6 Dindoruk and Christman -29.1 -8.8 -12.6 -5.3 -28.8 -22.3 -30.8 -25.4
Petrosky and Farshad -31.9 4.9 4.4 4.6 -13.7 -11.1 -14.1 -28.1 Vasquez and Beggs -25.7 -7.1 -6.7 -7.7 -14.5 -14.9 -6.9 -26.8
De Ghetto, Paone, and Villa -39.4 7.7 7.6 5.0 -15.7 -14.6 -19.7 -36.9
Table E-18- A comparison of AARE in percentage obtained from undersaturated oil viscosity
correlation equations regarding bubble point solution gas-oil ratio
Bubble point solution gas-oil ratio, scf/STB
Published correlations <=200
201-
400
401-
600
601-
800
801-
1000
1001-
1200
1201-
1400 >1400
This work 48.2 26.4 25.3 25.5 14.8 19.4 10.7 25.6 Dindoruk and Christman 47.2 28.3 25.8 26.2 28.8 26.5 30.8 25.4
Petrosky and Farshad 49.0 32.6 27.6 27.4 17.0 21.1 14.1 28.1 Vasquez and Beggs 56.6 27.2 24.3 25.4 20.8 24.3 10.8 26.8
De Ghetto, Paone, and Villa 50.9 33.8 30.3 29.2 18.0 23.1 19.7 36.9

180
Table E-19- A comparison of ARE in percentage obtained from undersaturated oil viscosity correlation
equations regarding bubble point oil viscosity less than 1 cp
Bubble point oil viscosity, cp
Published correlations 0.1-
0.2
0.2-
0.3
0.3-
0.4
0.4-
0.5
0.5-
0.6
0.6-
0.7
0.7-
0.8
0.8-
0.9
0.9-
1.0
This work -24.9 23.1 22.2 0.4 1.4 0.5 -5.9 -3.9 -13.1 Dindoruk and Christman -24.9 -8.8 -9.7 -23.5 -13.5 -5.7 -0.9 -0.3 -8.1
Petrosky and Farshad -1.6 10.1 10.7 -9.5 1.5 4.5 3.0 8.9 9.5 Vasquez and Beggs 6.4 13.0 6.5 -11.1 -1.8 -2.8 1.2 8.3 -15.8
De Ghetto, Paone, and Villa -8.1 5.5 10.4 -10.6 2.2 9.0 4.7 9.0 12.1
Table E-20- A comparison of AARE in percentage obtained from undersaturated oil viscosity
correlation equations regarding bubble point oil viscosity less than 1 cp
Bubble point oil viscosity, cp
Published correlations 0.1-
0.2
0.2-
0.3
0.3-
0.4
0.4-
0.5
0.5-
0.6
0.6-
0.7
0.7-
0.8
0.8-
0.9
0.9-
1.0
This work 24.9 27.4 30.2 14.6 13.1 10.7 15.0 16.9 24.9 Dindoruk and Christman 24.9 14.9 27.0 25.0 20.8 22.1 19.6 21.7 21.3
Petrosky and Farshad 5.3 18.1 28.5 16.9 21.4 24.2 22.5 23.4 34.8 Vasquez and Beggs 7.1 18.0 24.9 19.1 22.4 15.8 22.8 30.8 28.6
De Ghetto, Paone, and Villa 9.6 17.4 29.9 19.9 25.2 24.6 21.1 22.5 37.2

181
Table E-21- A comparison of ARE in percentage obtained from undersaturated oil viscosity
correlation equations regarding bubble point oil viscosity between 1 to 10 cp Bubble point oil viscosity, cp
Published correlations 1-2 2-3 3-4 4-5 7-8
This work -29.9 -55.9 -19.8 2.1 1.3
Dindoruk and Christman -25.5 -54.3 -5.5 18.6 9.6
Petrosky and Farshad -17.3 -50.0 -11.3 9.3 -13.6
Vasquez and Beggs -23.9 -54.4 19.5 61.1 -8.0
De Ghetto, Paone, and Villa -14.8 -46.3 -16.0 -7.5 -31.9
Table E-22- A comparison of AARE in percentage obtained from undersaturated oil viscosity
correlation equations regarding bubble point oil viscosity between 1 to 10 cp Bubble point oil viscosity, cp
Published correlations 1-2 2-3 3-4 4-5 7-8
This work 32.8 56.7 53.3 4.2 2.1 Dindoruk and Christman 35.0 57.6 44.1 18.6 10.1
Petrosky and Farshad 33.7 51.5 44.6 9.3 15.9 Vasquez and Beggs 34.9 57.1 59.8 61.1 10.4
De Ghetto, Paone, and Villa 32.7 47.0 39.8 7.5 31.9

182
Table E-23- A comparison of ARE in percentage obtained from undersaturated oil viscosity
correlation equations regarding bubble point oil viscosity greater than 10 cp Bubble point oil viscosity, cp
Published correlations 10-20 21-30 31-40 41-50 51-60 61-70 131-140 141-150
This work -2.6 -72.3 -40.6 -76.0 -36.4 -80.5 -73.3 -51.1 Dindoruk and Christman -23.2 -71.1 -58.0 -75.0 -59.4 -77.2 -84.8 -76.8
Petrosky and Farshad -32.3 -74.8 -66.3 -80.0 -69.0 -84.4 -87.9 -84.3 Vasquez and Beggs -30.0 -80.5 -76.2 -87.3 -81.3 -84.0 -91.3 -91.3
De Ghetto, Paone, and Villa -54.7 -79.7 -79.6 -85.5 -84.9 -89.5 -93.8 -94.4
Table E-24- A comparison of AARE in percentage obtained from undersaturated oil viscosity
correlation equations regarding bubble point oil viscosity greater than 10 cp Bubble point oil viscosity, cp
Published correlations 10-20 21-30 31-40 41-50 51-60 61-70 131-140 141-150
This work 61.0 72.3 45.5 76.0 36.4 80.5 73.3 51.1 Dindoruk and Christman 37.6 71.1 58.0 75.0 59.4 77.2 84.8 76.8
Petrosky and Farshad 40.1 74.8 66.3 80.0 69.0 84.4 87.9 84.3 Vasquez and Beggs 47.3 80.5 76.2 87.3 81.3 84.0 91.3 91.3
De Ghetto, Paone, and Villa 54.7 79.7 79.6 85.5 84.9 89.5 93.8 94.4
183
VITA
Sawin Kulchanyavivat
134/2 Soi Mithanan, Nakornchaisri Rd.,
Dusit, Bangkok 10300
Thailand
Education
Ph.D. Petroleum Engineering Texas A&M University 2005
M.S. Petrochemical Technology Chulalongkorn University 2000
B.S. Chemical Engineering Mahidol University 1997
Experience
Teaching Assistant (Fall 2005), Texas A&M University (College Station)
Summer Intern (Summer 2005), Unocal Thailand
Teaching Assistant (Spring 2005), Texas A&M University (College Station)
Teaching Assistant (Fall 2004), Texas A&M University (College Station)
Summer Intern (Summer 2004), Unocal Corporation (Sugarland)
Teaching Assistant (Fall 2003), Texas A&M University (College Station)
Research Assistant (Spring 2002), Texas A&M University (College Station)
Research Assistant (Summer 2000), Chulalongkorn University (Thailand)
Summer Intern (Summer 1996), Siam Cement (Thailand)
Copyright © 2022 FDOKUMEN