The Effect of Boron Nitride on the Thermal and Mechanical ...
20
nanomaterials Article The Effect of Boron Nitride on the Thermal and Mechanical Properties of Poly(3-hydroxybutyrate- co-3-hydroxyvalerate) Mualla Öner 1, *, Gülnur Kızıl 1 , Gül¸ sah Keskin 1 , Celine Pochat-Bohatier 2 and Mikhael Bechelany 2, * 1 Chemical Engineering Department, Chemical-Metallurgical Faculty, Yildiz Technical University, Istanbul 34210, Turkey; [email protected] (G.K.); [email protected] (G.K.) 2 Institut Européen des Membranes, IEM UMR-5635, ENCSM, CNRS, Université de Montpellier, ENSCM, CNRS, Place Eugéne Bataillon, 34000 Montpellier, France; [email protected] * Correspondence: [email protected] or [email protected] (M.Ö.); [email protected] (M.B.); Tel.: +90-212-383-2740 (M.Ö.); +33-4-6714-9167 (M.B.) Received: 17 October 2018; Accepted: 13 November 2018; Published: 15 November 2018 Abstract: The thermal and mechanical properties of poly(3-hydroxybutyrate-co-3-hydroxyvalerate, PHBV) composites filled with boron nitride (BN) particles with two different sizes and shapes were studied by scanning electron microscopy (SEM), differential scanning calorimetry (DSC), X-ray diffraction (XRD), Fourier Transform Infrared Spectroscopy (FTIR), thermal gravimetric analysis (TGA) and mechanical testing. The biocomposites were produced by melt extrusion of PHBV with untreated BN and surface-treated BN particles. Thermogravimetric analysis (TGA) showed that the thermal stability of the composites was higher than that of neat PHBV while the effect of the different shapes and sizes of the particles on the thermal stability was insignificant. DSC analysis showed that the crystallinity of the PHBV was not affected significantly by the change in filler concentration and the type of the BN nanoparticle but decreasing of the crystallinity of PHBV/BN composites was observed at higher loadings. BN particles treated with silane coupling agent yielded nanocomposites characterized by good mechanical performance. The results demonstrate that mechanical properties of the composites were found to increase more for the silanized flake type BN (OSFBN) compared to silanized hexagonal disk type BN (OSBN). The highest Young’s modulus was obtained for the nanocomposite sample containing 1 wt.% OSFBN, for which increase of Young’s modulus up to 19% was observed in comparison to the neat PHBV. The Halpin–Tsai and Hui–Shia models were used to evaluate the effect of reinforcement by BN particles on the elastic modulus of the composites. Micromechanical models for initial composite stiffness showed good correlation with experimental values. Keywords: biopolymer; bionanocomposite; poly(3-hydroxybutyrate-co-3-hydroxyvalerate); boron nitride; mechanical properties; thermal properties 1. Introduction Plastics are the preferred materials in many areas of daily life since they are easily processed, low-cost, light, and durable. Approximately 7% of the world’s oil and natural gas is used for the production of plastics. Beside limited fossil resources, widespread usage of these nondegradable materials leads to very serious environmental problems [1,2]. The development of commercially viable bioplastics is an attractive alternative to nondegradable polymers with their renewable resources and biodegradability [3]. Polyhydroxyalkanoates (PHAs) came into prominence among biodegradable Nanomaterials 2018, 8, 940; doi:10.3390/nano8110940 www.mdpi.com/journal/nanomaterials
-
Upload
khangminh22 -
Category
Documents
-
view
1 -
download
0
Transcript of The Effect of Boron Nitride on the Thermal and Mechanical ...

nanomaterials
Article
The Effect of Boron Nitride on the Thermal andMechanical Properties of Poly(3-hydroxybutyrate-co-3-hydroxyvalerate)
Mualla Öner 1,*, Gülnur Kızıl 1, Gülsah Keskin 1, Celine Pochat-Bohatier 2
and Mikhael Bechelany 2,*1 Chemical Engineering Department, Chemical-Metallurgical Faculty, Yildiz Technical University,
Istanbul 34210, Turkey; [email protected] (G.K.); [email protected] (G.K.)2 Institut Européen des Membranes, IEM UMR-5635, ENCSM, CNRS, Université de Montpellier, ENSCM,
CNRS, Place Eugéne Bataillon, 34000 Montpellier, France; [email protected]* Correspondence: [email protected] or [email protected] (M.Ö.);
[email protected] (M.B.); Tel.: +90-212-383-2740 (M.Ö.); +33-4-6714-9167 (M.B.)
Received: 17 October 2018; Accepted: 13 November 2018; Published: 15 November 2018 �����������������
Abstract: The thermal and mechanical properties of poly(3-hydroxybutyrate-co-3-hydroxyvalerate,PHBV) composites filled with boron nitride (BN) particles with two different sizes and shapes werestudied by scanning electron microscopy (SEM), differential scanning calorimetry (DSC), X-raydiffraction (XRD), Fourier Transform Infrared Spectroscopy (FTIR), thermal gravimetric analysis(TGA) and mechanical testing. The biocomposites were produced by melt extrusion of PHBV withuntreated BN and surface-treated BN particles. Thermogravimetric analysis (TGA) showed thatthe thermal stability of the composites was higher than that of neat PHBV while the effect of thedifferent shapes and sizes of the particles on the thermal stability was insignificant. DSC analysisshowed that the crystallinity of the PHBV was not affected significantly by the change in fillerconcentration and the type of the BN nanoparticle but decreasing of the crystallinity of PHBV/BNcomposites was observed at higher loadings. BN particles treated with silane coupling agent yieldednanocomposites characterized by good mechanical performance. The results demonstrate thatmechanical properties of the composites were found to increase more for the silanized flake type BN(OSFBN) compared to silanized hexagonal disk type BN (OSBN). The highest Young’s modulus wasobtained for the nanocomposite sample containing 1 wt.% OSFBN, for which increase of Young’smodulus up to 19% was observed in comparison to the neat PHBV. The Halpin–Tsai and Hui–Shiamodels were used to evaluate the effect of reinforcement by BN particles on the elastic modulus ofthe composites. Micromechanical models for initial composite stiffness showed good correlation withexperimental values.
Keywords: biopolymer; bionanocomposite; poly(3-hydroxybutyrate-co-3-hydroxyvalerate); boronnitride; mechanical properties; thermal properties
1. Introduction
Plastics are the preferred materials in many areas of daily life since they are easily processed,low-cost, light, and durable. Approximately 7% of the world’s oil and natural gas is used for theproduction of plastics. Beside limited fossil resources, widespread usage of these nondegradablematerials leads to very serious environmental problems [1,2]. The development of commercially viablebioplastics is an attractive alternative to nondegradable polymers with their renewable resources andbiodegradability [3]. Polyhydroxyalkanoates (PHAs) came into prominence among biodegradable
Nanomaterials 2018, 8, 940; doi:10.3390/nano8110940 www.mdpi.com/journal/nanomaterials

Nanomaterials 2018, 8, 940 2 of 20
polymers synthesized by many bacteria as intracellular carbon and energy storage granules. They havevery good properties such as versatility, high biodegradability in proper environmental conditions,and similar mechanical performance with petroleum-based polymers such as polypropylene (PP) [4].
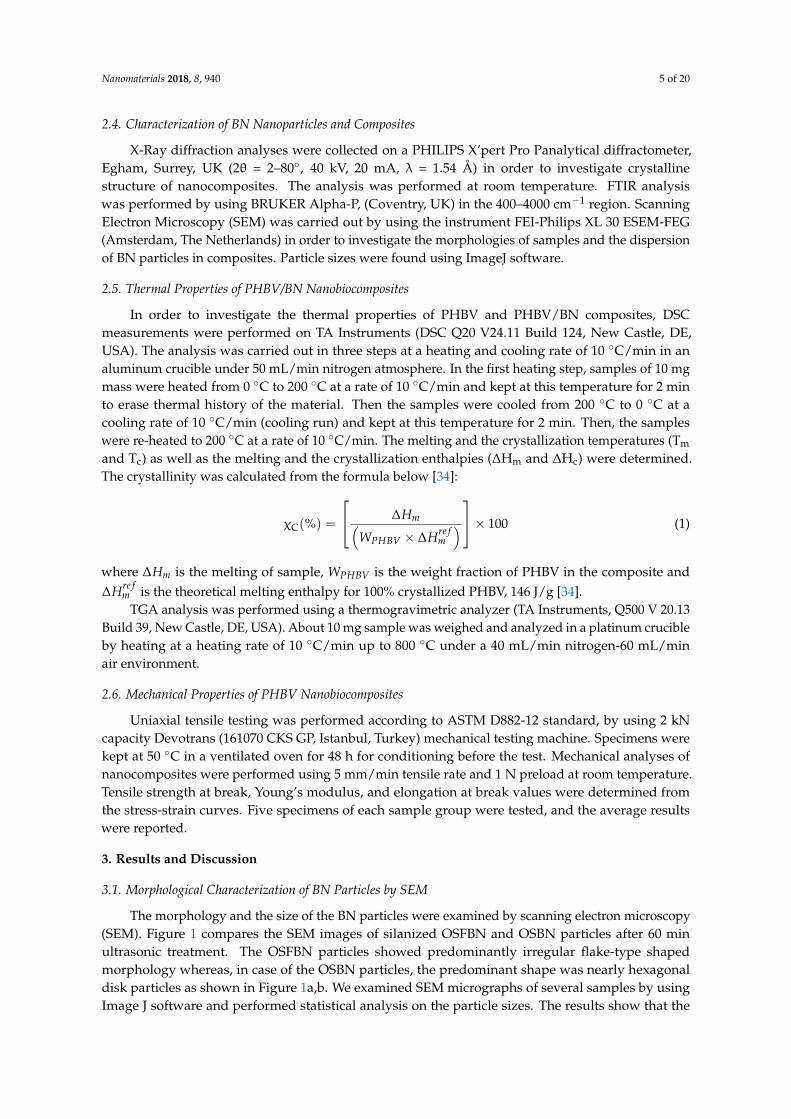
Poly(3-hydroxybutyrate) (PHB) is a linear bacterial polyester. It is among the most known andthe best characterized member of PHA family [5]. It is a highly crystalline polyester, is very brittleand has a very low biodegradation rate because of its high crystallinity (>90%). One solution to thisproblem is to copolymerize PHB with 3-hydroxyvalerate (HV) monomers in the bacterial fermentationprocess to form poly(3-hydroxybutyrate-co-3-hydroxyvalerate) (PHBV). The addition of HV unitsimproves the mechanical properties, increases the thermal stability and prevents the degradationduring processing. PHBVs can be obtained with different properties depending on the percentage ofHB and HV units. The excess of HV units leads to the polymer being in a softer and ductile form andhaving a lower crystallinity value [6,7]. PHBV has a high potential application in many areas suchas medical and agriculture fields and as packaging material. However, widespread applications ofPHBV are still hindered by several material drawbacks such as high material costs, slow crystallizationrate, poor thermal stability, brittleness and relative difficulty in processing. Recently, the additionof nanofillers and fibers as reinforcing agents into polymer matrixes to form nanocomposites hasprovided a promising method because they can act as nucleating agents, not only improving thepolymer crystallization rates but also increasing the mechanical, thermal and/or barrier performancesof the composites. Nanofillers are found to be preferable in many applications due to their high surfacearea-to-volume ratios and low concentrations needed to achieve reinforcing effects [8–10].
PHBV is a highly crystalline polyester with low degree of heterogeneous nucleation density. It isnot thermally stable around the melting point. Molecular weight reduction can be observed duringthe melting process. In order to enhance the performance of PHBV the effect of various nanofillerson crystallization and mechanical behaviors has been investigated [11]. Chen et al. worked onstructural and mechanical properties of PHBV/OMMT (organo-montmorillonite) nanocomposites [12].The tensile stress of nanocomposites improved up to 32% for 3% (wt) OMMT content comparedwith the neat polymer. Optimum mechanical properties were obtained for 3% (wt) OMMT content.Further increasing of filler addition leads to agglomeration of OMMT causing the decrease ofmechanical properties of composites [12]. Ten et al. studied the thermal and mechanical propertiesof PHBV/cellulose nanowhiskers biocomposites [13]. The tensile strengths of the composites haveincreased due to the strong interface linkages between the nanoparticles and the polymer. The tensilestrength of 5 wt.% cellulose nanocomposite improved by 35.5% compared to pure PHBV, while thetoughness value increased by 41% [13]. Choi et al. produced cloisite 30B organic clay-filled PHBVnanocomposites by the solution intercalation method [14]. Compared to neat PHBV, improvements inmechanical properties were observed in nanocomposites with 1, 2% and 3 wt.% cloisite 30B content [14].Öner et al. worked on PHBV/hydroxyapatite (HAP) composites [15]. The mechanical propertiesof PHBV were improved using HAP particles. Xiang et al. studied the mechanical properties ofPHBV/green tea polyphenol (TP) composites [16]. The results showed that the elongation at break,toughness, strain and tensile stress of composite increased with TP addition when compared topure PHBV [16]. Luo and Netravali obtained green composites by using PHBV and pineapplefibers [17]. The flexural strength and modulus of the obtained composites, in the longitudinal direction,increased with fiber loading [17]. Nanocellulose-reinforced PHBV was prepared by Jun et al. [18].They investigated the effect of nanocellulose types such as cellulose nanocrystals (CNC) and cellulosenanofibrils (CNFs) on mechanical properties of PHBV. The maximum tensile modulus values wereobtained for 7 wt.% CNC and CNF composites but the tensile stresses of composites are lower than thetensile stress of neat PHBV [18]. The ternary cellulose/PHBV/polylactic acid (PLA) composite wasdeveloped to compromise the 100% degradability of materials [19]. Filling PHBV/PLA blends with theball-milled celluloses increased the stiffness when using different particle sizes and filling contents [19].The tensile strength, flexural strength and compressive strength of the composite were improved bymixing PLA fiber with PHBV [19]. Ternary nanocomposites including cellulose nanocrystals/silver
Nanomaterials 2018, 8, 940 3 of 20
nanohybrids (CNC-Ag) and biodegradable poly(3-hydroxybutyrate-co-3-hydroxyvalerate) (PHBV)were prepared by using solution casting [20]. Compared to binary PHBV/CNC nanocomposite, theternary nanocomposites with the highest AgNPs content, showed the largest improvement in thethermal stability, mechanical, barrier, overall migration and antibacterial properties [20].
2D nanomaterials have recently been a very active research area due to their small thicknesses,wide lateral surfaces, and weak Van der Waals interactions between layers. Wang et al. produced(PHBV)/graphene nanosheet (GNS) composites via a solution-casting method and investigated theirmechanical properties. The results showed that the storage modulus of PHBV/GNS composites highlyimproved with GNS addition [21]. Recently, research activity has increased in the area of boron nitride (h-BN)nanomaterials. Boron nitride has a layered structure, where Van der Waal’s forces hold sheets of covalentlybonded boron and nitrogen atoms together. The hexagonal form of BN (h-BN) is similar to graphene whichaccounts for their high thermal conductivity. The hexagonal boron nitride nanosheets are of great interestdue to their potential use in various real-life applications. They are popular fillers for polymers due to uniquematerial properties [22–24]. Zhi et al. studied the fabrication of boron nitride nanosheets and productionof polymeric composites with improved thermal and mechanical properties [25]. BN was exfoliated viaultrasonication and used as filler for PMMA/BN nanocomposites. The thermal expansion coefficient andglass transition temperature were reduced in composites compared with the neat polymer. These resultsindicated that polymer chain mobility reduced due to BN nanosheet-matrix interactions. Young’s modulusof PMMA was improved by 22% and strength was increased by 11% with the addition of 0.3% (wt) BN [25].Wattanakul et al. investigated the effect of sonication and dissipation of BN on the mechanical properties ofepoxy/BN nanocomposites. Impact strength of composites improved up to 33% (v) BN content and startedto decrease at 37% (v) BN content. Filler particles tend to stay as agglomerates in high filler contents. Thus,the decrease of mechanical properties could be observed in high filler contents [26]. Pradhan et al. studiedthe effect of BN particles on mechanical properties of starch. The tensile stress of nanocomposites improvedup to 3 times for 10% BN content compared to neat starch [27]. Cheewawuttipong et al. studied on thepolypropylene (PP)/BN composites. The mechanical analysis results showed that the storage modulus andloss modulus increased with BN content [28]. Sun et al. combined fused silica (FS) with BN to improvemechanical properties. The flexural strength and toughness values increased significantly with 0.5 wt.% BNaddition [29]. Chitosan/Boron nitride (BN) composites were prepared by solution method with variablepercentage of boron nitride loading. It was found that, the thermal stability of the chitosan/BN compositeswas increased in comparison to virgin chitosan [30]. Zhou et al. investigated the effect of BN nanoparticleson mechanical properties of epoxy matrices. Tensile modulus increased from 2.68 ± 0.21 GPa to 3.14 ± 0.31GPa for 50 wt.% BN loading. However, the mechanical strength, toughness, and elongation at break (%)values decreased with increasing BN content [31]. Polyamide 6 (PA6) and BN and exfoliated BN(BNNS)composites were produced by Li et al. [32]. The tensile stress of PA6/BN composites was higher than neatPA6 but for BNNS composites, the greater enhancement was obtained due to the higher aspect ratio BNNSand interaction between the polymer and BNNS [32]. The reinforcement effect of graphene-like BN on thegelatin was investigated by Biscarat et al. [33]. The barrier properties of gelatin/BN nanocomposites havebeen enhanced by a factor of 500 compared to a neat gelatin.
In this study, we investigated the effect of BN on mechanical and thermal properties of PHBV.This research is in the continuity of our study on the improvement of the properties of PHBV byincorporating boron nitride particles with a twin-screw extruder so that it could be transferred toindustry for large-scale production. In our previous work, h-BN were studied as the potentiallyinteresting material for the enhancement of barrier properties of PHBV [34,35]. Based on ourpreliminary results, the aim of this work was to investigate the mechanical and thermal propertiesof PHBV composites by taking into consideration the effect of different BN nanoparticles. In orderto develop this understanding, polymer nanocomposites containing boron nitride nanoparticles oftwo different shapes, hexagonal disk (OSBN) and nanoflakes (OSFBN) were prepared through meltprocessing route with different concentrations. Various techniques analyzing mechanical and thermalproperties were employed to characterize the PHBV/BN nanocomposites. The best mechanical

Nanomaterials 2018, 8, 940 4 of 20
properties are obtained for the nanocomposite sample containing 1 wt.% of the silanized flake typeBN (OSFBN) for which an increase in Young’s modulus up to 19% was observed in comparison to theneat PHBV. The resulting biobased and biodegradable PHBV/BN nanocomposites may find potentialapplications in the fields of packaging and biomedical devices.
2. Materials and Methods
2.1. Materials
PHBV, the biopolymer with 8 mol% hydroxyvalerate (HV) content was purchased from ADmajorisCompany, Cublize, France under the trade name MAJ’ECO FN000HA. Two different types of hexagonalnano-sized BN were used. One of the BN’s was purchased from Bortek, Eskisehir, Turkey (2.27 g/cm3,surface area 20 m2/g); the other BN (FBN), commercial grade (PHPP325B) (2.2 g/cm3, surface area60 m2/g), from Saint-Gobain Ceramics, France. Octyltriethoxysilane (OTES) was purchased fromSigma-Aldrich, Steinheim, Germany.
2.2. Surface Modification of Boron Nitride
The surface modification of boron nitride was performed by using the silanizing agent to producean appropriate interface between matrix and filler. BN (1.5% w/v) particles were added to the 90:10(v/v) ethanol-water mixture and treated with an ultrasonic probe system (Sonic vibra cell VCX 750,Newtown, CT, USA) for 30 min with an amplitude of 40%. The mixture was then centrifuged (Sigma3-16P) at 4000 rpm for 35 min. Octyltriethoxysilane (OTES) with a concentration of 2.5% (w/v) wasdissolved in a 90:10 (v/v) ethanol-water mixture and the pH of the solution was adjusted to 5.0 usingdilute HCl solution. The solution was stirred by an ultrasonic mixer for 2 h at room temperature forsilane hydrolysis. BN particles were added to the solution and sonicated with an ultrasonic probe for30 min with an amplitude of 40%. The solution was centrifuged at 4000 rpm for 10 min. Finally, theobtained silanized BN was dried at 110 ◦C in an oven for 2 h and then at 65 ◦C in a vacuum drier.
2.3. Preparation of Nanobiocomposites
Nanobiocomposites were prepared by melt-mixing method. Double screw extruder (D: 10 mm,L/D: 20, Rondol, UK) was used to obtain PHBV/BN nanocomposites. Before extrusion, both of thepolymer and boron nitride were dried at 50 ◦C for an hour in a vacuum dryer to remove the moisture.Extruder temperatures from the feed zone to the endpoint have been applied 90-135-160-160-150 ◦C,respectively. The rotation speed of the screws is 80 rpm. Polymer nanocomposite films prepared usinga hot-cold press machine (Gülnar Makine, Istanbul, Turkey). The mechanical analysis specimens werecut to 2 mm thickness and dumbbell shape in accordance with ISO 527-1BA standard. The preparednanocomposites were given in Table 1. OS code shows the silanized samples.
Table 1. The prepared nanobiocomposites for mechanical analysis.
Sample Boron Nitride Content (wt.%)
PHBV -
BORTEK
PHBV/0.5OSBN 0.5PHBV/1BN 1
PHBV/1OSBN 1PHBV/2OSBN 2PHBV/3OSBN 3
SAINT GOBAIN (PHPP325B)
PHBV/0.5OSFBN 0.5PHBV/1FBN 1
PHBV/1OSFBN 1PHBV/2OSFBN 2PHBV/3OSFBN 3
Nanomaterials 2018, 8, 940 5 of 20
2.4. Characterization of BN Nanoparticles and Composites
X-Ray diffraction analyses were collected on a PHILIPS X’pert Pro Panalytical diffractometer,Egham, Surrey, UK (2θ = 2–80◦, 40 kV, 20 mA, λ = 1.54 Å) in order to investigate crystallinestructure of nanocomposites. The analysis was performed at room temperature. FTIR analysiswas performed by using BRUKER Alpha-P, (Coventry, UK) in the 400–4000 cm−1 region. ScanningElectron Microscopy (SEM) was carried out by using the instrument FEI-Philips XL 30 ESEM-FEG(Amsterdam, The Netherlands) in order to investigate the morphologies of samples and the dispersionof BN particles in composites. Particle sizes were found using ImageJ software.
2.5. Thermal Properties of PHBV/BN Nanobiocomposites
In order to investigate the thermal properties of PHBV and PHBV/BN composites, DSCmeasurements were performed on TA Instruments (DSC Q20 V24.11 Build 124, New Castle, DE,USA). The analysis was carried out in three steps at a heating and cooling rate of 10 ◦C/min in analuminum crucible under 50 mL/min nitrogen atmosphere. In the first heating step, samples of 10 mgmass were heated from 0 ◦C to 200 ◦C at a rate of 10 ◦C/min and kept at this temperature for 2 minto erase thermal history of the material. Then the samples were cooled from 200 ◦C to 0 ◦C at acooling rate of 10 ◦C/min (cooling run) and kept at this temperature for 2 min. Then, the sampleswere re-heated to 200 ◦C at a rate of 10 ◦C/min. The melting and the crystallization temperatures (Tm
and Tc) as well as the melting and the crystallization enthalpies (∆Hm and ∆Hc) were determined.The crystallinity was calculated from the formula below [34]:
χC(%) =
∆Hm(WPHBV × ∆Hre f
m
)× 100 (1)
where ∆Hm is the melting of sample, WPHBV is the weight fraction of PHBV in the composite and∆Hre f
m is the theoretical melting enthalpy for 100% crystallized PHBV, 146 J/g [34].TGA analysis was performed using a thermogravimetric analyzer (TA Instruments, Q500 V 20.13
Build 39, New Castle, DE, USA). About 10 mg sample was weighed and analyzed in a platinum crucibleby heating at a heating rate of 10 ◦C/min up to 800 ◦C under a 40 mL/min nitrogen-60 mL/minair environment.
2.6. Mechanical Properties of PHBV Nanobiocomposites
Uniaxial tensile testing was performed according to ASTM D882-12 standard, by using 2 kNcapacity Devotrans (161070 CKS GP, Istanbul, Turkey) mechanical testing machine. Specimens werekept at 50 ◦C in a ventilated oven for 48 h for conditioning before the test. Mechanical analyses ofnanocomposites were performed using 5 mm/min tensile rate and 1 N preload at room temperature.Tensile strength at break, Young’s modulus, and elongation at break values were determined fromthe stress-strain curves. Five specimens of each sample group were tested, and the average resultswere reported.
3. Results and Discussion
3.1. Morphological Characterization of BN Particles by SEM
The morphology and the size of the BN particles were examined by scanning electron microscopy(SEM). Figure 1 compares the SEM images of silanized OSFBN and OSBN particles after 60 minultrasonic treatment. The OSFBN particles showed predominantly irregular flake-type shapedmorphology whereas, in case of the OSBN particles, the predominant shape was nearly hexagonaldisk particles as shown in Figure 1a,b. We examined SEM micrographs of several samples by usingImage J software and performed statistical analysis on the particle sizes. The results show that the

Nanomaterials 2018, 8, 940 6 of 20
size of the particles was reduced after ultrasonic treatment. The mean length (L), the mean width (w)and thickness (t) of the OSFBN particles were reduced from 2445.9 ± 1507.6 nm to 765.4 ± 376.8 nm;from 1483.7 ± 853.8 nm to 360.49 ± 177.8 nm and from 249.7 ± 137.4 nm to 19.0 ± 5.1 nm, respectively.The mean diameter (d) and thickness (t) of OSBN particles, reduced from 225.0 ± 108.0 nm to163.3 ± 72.9 nm and from 61.6 ± 25.8 nm to 39.7 ± 10.7 nm, respectively after ultrasonication.The standard deviations given here describe the variation in the mean value calculated from separateSEM images. The range of values was on the order of hundreds of nanometers, indicating thepolydispersity of each particle system.
Nanomaterials 2018, 8, x FOR PEER REVIEW 6 of 20
The mean diameter (d) and thickness (t) of OSBN particles, reduced from 225.0 ± 108.0 nm to 163.3 ± 72.9 nm and from 61.6 ± 25.8 nm to 39.7 ± 10.7 nm, respectively after ultrasonication. The standard deviations given here describe the variation in the mean value calculated from separate SEM images. The range of values was on the order of hundreds of nanometers, indicating the polydispersity of each particle system.
Figure 1. Scanning Electron Microscopy (SEM) micrograph of particles after 60 min ultrasonication (a) silanized BN (b) silanized FBN.
3.2. SEM of Nanocomposites
The structure of the PHBV/BN nanocomposites was investigated using SEM to get a qualitative understanding of the dispersion of BNs through direct visualization. Figure 2 shows the cross-section SEM images of the cryo-fractured surfaces of 1 wt.% PHBV/OSBN and PHBV/OSFBN composite samples. The dispersion of boron nitride in composites can be seen in the SEM figures. A good dispersion of the BN particles in the matrix was observed at 1 wt% loading.
Figure 2. SEM images of composites (a) PHBV/1OSBN (b) PHBV/1OSFBN.
3.3. Characterization by XRD and FTIR
XRD analyses were carried out to investigate the crystalline structure of prepared nanocomposites (Figure 3). The XRD patterns of PHBV exhibited characteristic 2θ peaks at 13.6° (020), 17.1° (110), 19.9° (021), 21.7° (101), 22.3° (111), 25.5° (121), 27.1° (040) and 30.3° (002) [36,37]. Boron nitride exhibited characteristic 2θ peaks at 26.80° (002). Nanocomposites show same reflections as neat PHBV indicating that boron nitride incorporation did not change the unit cell and crystalline structure of PHBV. However, the intensity of (020) and (110) peaks of PHBV changes with BN content as shown in Figure 4. While the intensity of (020) peak of PHBV increases, the intensity of (110) peak of PHBV becomes lower with boron nitride addition. The increase of (020) peak of PHBV could be related to the crystallite lamella size of polymer and indicated that crystallization is promoted by boron nitride addition [38]. The decrease of (110) peak of PHBV indicates the restricted crystal growth
Figure 1. Scanning Electron Microscopy (SEM) micrograph of particles after 60 min ultrasonication (a)silanized BN (b) silanized FBN.
3.2. SEM of Nanocomposites
The structure of the PHBV/BN nanocomposites was investigated using SEM to get a qualitativeunderstanding of the dispersion of BNs through direct visualization. Figure 2 shows the cross-sectionSEM images of the cryo-fractured surfaces of 1 wt.% PHBV/OSBN and PHBV/OSFBN compositesamples. The dispersion of boron nitride in composites can be seen in the SEM figures. A gooddispersion of the BN particles in the matrix was observed at 1 wt% loading.
Nanomaterials 2018, 8, x FOR PEER REVIEW 6 of 20
The mean diameter (d) and thickness (t) of OSBN particles, reduced from 225.0 ± 108.0 nm to 163.3 ± 72.9 nm and from 61.6 ± 25.8 nm to 39.7 ± 10.7 nm, respectively after ultrasonication. The standard deviations given here describe the variation in the mean value calculated from separate SEM images. The range of values was on the order of hundreds of nanometers, indicating the polydispersity of each particle system.
Figure 1. Scanning Electron Microscopy (SEM) micrograph of particles after 60 min ultrasonication (a) silanized BN (b) silanized FBN.
3.2. SEM of Nanocomposites
The structure of the PHBV/BN nanocomposites was investigated using SEM to get a qualitative understanding of the dispersion of BNs through direct visualization. Figure 2 shows the cross-section SEM images of the cryo-fractured surfaces of 1 wt.% PHBV/OSBN and PHBV/OSFBN composite samples. The dispersion of boron nitride in composites can be seen in the SEM figures. A good dispersion of the BN particles in the matrix was observed at 1 wt% loading.
Figure 2. SEM images of composites (a) PHBV/1OSBN (b) PHBV/1OSFBN.
3.3. Characterization by XRD and FTIR
XRD analyses were carried out to investigate the crystalline structure of prepared nanocomposites (Figure 3). The XRD patterns of PHBV exhibited characteristic 2θ peaks at 13.6° (020), 17.1° (110), 19.9° (021), 21.7° (101), 22.3° (111), 25.5° (121), 27.1° (040) and 30.3° (002) [36,37]. Boron nitride exhibited characteristic 2θ peaks at 26.80° (002). Nanocomposites show same reflections as neat PHBV indicating that boron nitride incorporation did not change the unit cell and crystalline structure of PHBV. However, the intensity of (020) and (110) peaks of PHBV changes with BN content as shown in Figure 4. While the intensity of (020) peak of PHBV increases, the intensity of (110) peak of PHBV becomes lower with boron nitride addition. The increase of (020) peak of PHBV could be related to the crystallite lamella size of polymer and indicated that crystallization is promoted by boron nitride addition [38]. The decrease of (110) peak of PHBV indicates the restricted crystal growth
Figure 2. SEM images of composites (a) PHBV/1OSBN (b) PHBV/1OSFBN.
3.3. Characterization by XRD and FTIR
XRD analyses were carried out to investigate the crystalline structure of prepared nanocomposites(Figure 3). The XRD patterns of PHBV exhibited characteristic 2θ peaks at 13.6◦ (020), 17.1◦ (110),19.9◦ (021), 21.7◦ (101), 22.3◦ (111), 25.5◦ (121), 27.1◦ (040) and 30.3◦ (002) [36,37]. Boron nitrideexhibited characteristic 2θ peaks at 26.80◦ (002). Nanocomposites show same reflections as neat PHBVindicating that boron nitride incorporation did not change the unit cell and crystalline structure ofPHBV. However, the intensity of (020) and (110) peaks of PHBV changes with BN content as shown

Nanomaterials 2018, 8, 940 7 of 20
in Figure 4. While the intensity of (020) peak of PHBV increases, the intensity of (110) peak of PHBVbecomes lower with boron nitride addition. The increase of (020) peak of PHBV could be related tothe crystallite lamella size of polymer and indicated that crystallization is promoted by boron nitrideaddition [38]. The decrease of (110) peak of PHBV indicates the restricted crystal growth in (110) plane.(020)/(110) relative intensity ratios for PHBV and nanocomposites were given in Table 2. While therelative intensity ratio of the neat PHBV matrix was 1.42, this value increased up to 4.58 for the OSBNnanocomposites and 6.72 for OSFBN nanocomposites. The increase in the relative ratio implies thatcrystal growing was promoted in (020) crystal plane as reported [38,39].
Nanomaterials 2018, 8, x FOR PEER REVIEW 7 of 20
in (110) plane. (020)/(110) relative intensity ratios for PHBV and nanocomposites were given in Table 2. While the relative intensity ratio of the neat PHBV matrix was 1.42, this value increased up to 4.58 for the OSBN nanocomposites and 6.72 for OSFBN nanocomposites. The increase in the relative ratio implies that crystal growing was promoted in (020) crystal plane as reported [38,39].
Figure 3. XRD patterns of neat PHBV, BN, FBN and nanocomposites.
Figure 4. (020) and (110) relative intensity variation with BN content.
Table 2. (020)/(110) relative intensity ratios of nanocomposites.
(020)/(110) PHBV 1.42
PHBV/0.5OSBN 3.17 PHBV/1OSBN 3.40 PHBV/2OSBN 4.58 PHBV/3OSBN 2.56
PHBV/0.5OSFBN 4.98 PHBV/1OSFBN 6.72 PHBV/2OSFBN 4.70 PHBV/3OSFBN 3.76
Figure 5 shows the FTIR spectra of neat PHBV and the prepared nanocomposites. PHBV exhibited some characteristic peaks as CH3 asymmetrical stretching at 3015–2960 cm−1, CH2 asymmetrical stretching at 2945–2925 cm−1, CH3 symmetrical stretching at 2885–2865 cm−1, C=O stretching at 1723–1740 cm−1, CH2 wagging at 1320–1159 cm−1 [40], asymmetrical –C–O–C– stretching, symmetrical –C–O–C– stretching at 800–975 cm−1 [41], CH2 scissoring at 1453–1459 cm−1, C–O stretching at 1065–1030 cm−1 and C–C stretching at 979–980 cm−1 [42]. BN exhibited characteristic peaks as B–N at 1300–1400 cm−1 and B–N–B at 775–820 cm−1 [43,44]. OTES exhibited Si–O stretching at 1053–1114 cm−1 and CHn (C–H) stretching at 2850–3000 cm−1 [45,46]. The silane peaks were not observed in FTIR spectrum of composites because of overlapping of silane peaks with PHBV peaks in the same region. Figure 6 shows a comparison between the infrared spectrum of silanized and nonsilanized BN
Figure 3. XRD patterns of neat PHBV, BN, FBN and nanocomposites.
Nanomaterials 2018, 8, x FOR PEER REVIEW 7 of 20
in (110) plane. (020)/(110) relative intensity ratios for PHBV and nanocomposites were given in Table 2. While the relative intensity ratio of the neat PHBV matrix was 1.42, this value increased up to 4.58 for the OSBN nanocomposites and 6.72 for OSFBN nanocomposites. The increase in the relative ratio implies that crystal growing was promoted in (020) crystal plane as reported [38,39].
Figure 3. XRD patterns of neat PHBV, BN, FBN and nanocomposites.
Figure 4. (020) and (110) relative intensity variation with BN content.
Table 2. (020)/(110) relative intensity ratios of nanocomposites.
(020)/(110) PHBV 1.42
PHBV/0.5OSBN 3.17 PHBV/1OSBN 3.40 PHBV/2OSBN 4.58 PHBV/3OSBN 2.56
PHBV/0.5OSFBN 4.98 PHBV/1OSFBN 6.72 PHBV/2OSFBN 4.70 PHBV/3OSFBN 3.76
Figure 5 shows the FTIR spectra of neat PHBV and the prepared nanocomposites. PHBV exhibited some characteristic peaks as CH3 asymmetrical stretching at 3015–2960 cm−1, CH2 asymmetrical stretching at 2945–2925 cm−1, CH3 symmetrical stretching at 2885–2865 cm−1, C=O stretching at 1723–1740 cm−1, CH2 wagging at 1320–1159 cm−1 [40], asymmetrical –C–O–C– stretching, symmetrical –C–O–C– stretching at 800–975 cm−1 [41], CH2 scissoring at 1453–1459 cm−1, C–O stretching at 1065–1030 cm−1 and C–C stretching at 979–980 cm−1 [42]. BN exhibited characteristic peaks as B–N at 1300–1400 cm−1 and B–N–B at 775–820 cm−1 [43,44]. OTES exhibited Si–O stretching at 1053–1114 cm−1 and CHn (C–H) stretching at 2850–3000 cm−1 [45,46]. The silane peaks were not observed in FTIR spectrum of composites because of overlapping of silane peaks with PHBV peaks in the same region. Figure 6 shows a comparison between the infrared spectrum of silanized and nonsilanized BN
Figure 4. (020) and (110) relative intensity variation with BN content.
Table 2. (020)/(110) relative intensity ratios of nanocomposites.
(020)/(110)
PHBV 1.42PHBV/0.5OSBN 3.17PHBV/1OSBN 3.40PHBV/2OSBN 4.58PHBV/3OSBN 2.56
PHBV/0.5OSFBN 4.98PHBV/1OSFBN 6.72PHBV/2OSFBN 4.70PHBV/3OSFBN 3.76
Figure 5 shows the FTIR spectra of neat PHBV and the prepared nanocomposites. PHBV exhibitedsome characteristic peaks as CH3 asymmetrical stretching at 3015–2960 cm−1, CH2 asymmetricalstretching at 2945–2925 cm−1, CH3 symmetrical stretching at 2885–2865 cm−1, C=O stretching at1723–1740 cm−1, CH2 wagging at 1320–1159 cm−1 [40], asymmetrical –C–O–C– stretching, symmetrical–C–O–C– stretching at 800–975 cm−1 [41], CH2 scissoring at 1453–1459 cm−1, C–O stretching at1065–1030 cm−1 and C–C stretching at 979–980 cm−1 [42]. BN exhibited characteristic peaks asB–N at 1300–1400 cm−1 and B–N–B at 775–820 cm−1 [43,44]. OTES exhibited Si–O stretching at

Nanomaterials 2018, 8, 940 8 of 20
1053–1114 cm−1 and CHn (C–H) stretching at 2850–3000 cm−1 [45,46]. The silane peaks were notobserved in FTIR spectrum of composites because of overlapping of silane peaks with PHBV peaksin the same region. Figure 6 shows a comparison between the infrared spectrum of silanized andnonsilanized BN particles. After both BN particles were treated with silane, the spectrum showed newbands in addition to the characteristic peaks of BN. In the spectrum of OSBN and OSFBN, the bands at2850–3000 cm−1 regions were attributed to the CH2 asymmetric and symmetric stretching vibration,respectively, which originated from the silane-containing molecule. The band at 1053 cm−1 is assignedto the in-plane Si–O stretching and that at 1114 cm−1 is assigned to the perpendicular Si–O stretching.
Nanomaterials 2018, 8, x FOR PEER REVIEW 8 of 20
particles. After both BN particles were treated with silane, the spectrum showed new bands in addition to the characteristic peaks of BN. In the spectrum of OSBN and OSFBN, the bands at 2850–3000 cm−1 regions were attributed to the CH2 asymmetric and symmetric stretching vibration, respectively, which originated from the silane-containing molecule. The band at 1053 cm−1 is assigned to the in-plane Si–O stretching and that at 1114 cm−1 is assigned to the perpendicular Si–O stretching.
Figure 5. FTIR spectrum of nanocomposites (a) PHBV/BN (b) PHBV/FBN.
Figure 6. FTIR peaks of silanized (a) BN and (b) FBN.
3.4. Thermal Stability of Nanocomposites
The thermal stability of the PHBV and PHBV/BN composites were studied using Thermo Gravimetric Analysis (TGA) to measure the degradation temperature of different samples. The TGA thermograms for neat PHBV was compared with that of the PHBV/BN nanocomposites. TGA curves of PHBV and composite samples are represented in Figure 7. It is noted that weight loss of PHBV and its composites occurs in a one-step process between 230 °C and 300 °C. No significant weight loss was recorded before 200 °C for all samples. After 200 °C, weight loss proceeds very rapidly and the polymer completely degrades by 300 °C. It has been established that the thermal degradation of PHBV was due to the rupture of ester bonds during chain scission [47]. This could be attributed to PHBV copolymer separating out into individual PHV and PHB units. The temperatures of at 10% weight loss (T10), at 50% weight loss (T50), the initial decomposition temperature (Ti), and the maximum rate of degradation temperature (Tmax) are presented in Table 3. As shown in Table 3, Ti, T10, T50 and Tmax values increased in the composites. When the initial weight loss is taken as a point of comparison, the onset degradation temperature (Ti) for neat PHBV is 234.45 °C and increases to 252.70 °C and 251.10 °C for PHBV/1OSBN and PHBV/1OSFBN composites. The surface treatment by silane results in improved initial thermal stability in comparison to untreated BN. Another important thermal property is the temperature corresponding to the maximum rate of weight loss (Tmax). Tmax shifted to higher temperatures as the BN content increased, from 275.08 °C to 295.50 °C. This result
Figure 5. FTIR spectrum of nanocomposites (a) PHBV/BN (b) PHBV/FBN.
Nanomaterials 2018, 8, x FOR PEER REVIEW 8 of 20
particles. After both BN particles were treated with silane, the spectrum showed new bands in addition to the characteristic peaks of BN. In the spectrum of OSBN and OSFBN, the bands at 2850–3000 cm−1 regions were attributed to the CH2 asymmetric and symmetric stretching vibration, respectively, which originated from the silane-containing molecule. The band at 1053 cm−1 is assigned to the in-plane Si–O stretching and that at 1114 cm−1 is assigned to the perpendicular Si–O stretching.
Figure 5. FTIR spectrum of nanocomposites (a) PHBV/BN (b) PHBV/FBN.
Figure 6. FTIR peaks of silanized (a) BN and (b) FBN.
3.4. Thermal Stability of Nanocomposites
The thermal stability of the PHBV and PHBV/BN composites were studied using Thermo Gravimetric Analysis (TGA) to measure the degradation temperature of different samples. The TGA thermograms for neat PHBV was compared with that of the PHBV/BN nanocomposites. TGA curves of PHBV and composite samples are represented in Figure 7. It is noted that weight loss of PHBV and its composites occurs in a one-step process between 230 °C and 300 °C. No significant weight loss was recorded before 200 °C for all samples. After 200 °C, weight loss proceeds very rapidly and the polymer completely degrades by 300 °C. It has been established that the thermal degradation of PHBV was due to the rupture of ester bonds during chain scission [47]. This could be attributed to PHBV copolymer separating out into individual PHV and PHB units. The temperatures of at 10% weight loss (T10), at 50% weight loss (T50), the initial decomposition temperature (Ti), and the maximum rate of degradation temperature (Tmax) are presented in Table 3. As shown in Table 3, Ti, T10, T50 and Tmax values increased in the composites. When the initial weight loss is taken as a point of comparison, the onset degradation temperature (Ti) for neat PHBV is 234.45 °C and increases to 252.70 °C and 251.10 °C for PHBV/1OSBN and PHBV/1OSFBN composites. The surface treatment by silane results in improved initial thermal stability in comparison to untreated BN. Another important thermal property is the temperature corresponding to the maximum rate of weight loss (Tmax). Tmax shifted to higher temperatures as the BN content increased, from 275.08 °C to 295.50 °C. This result
Figure 6. FTIR peaks of silanized (a) BN and (b) FBN.
3.4. Thermal Stability of Nanocomposites
The thermal stability of the PHBV and PHBV/BN composites were studied using ThermoGravimetric Analysis (TGA) to measure the degradation temperature of different samples. The TGAthermograms for neat PHBV was compared with that of the PHBV/BN nanocomposites. TGA curvesof PHBV and composite samples are represented in Figure 7. It is noted that weight loss of PHBVand its composites occurs in a one-step process between 230 ◦C and 300 ◦C. No significant weightloss was recorded before 200 ◦C for all samples. After 200 ◦C, weight loss proceeds very rapidly andthe polymer completely degrades by 300 ◦C. It has been established that the thermal degradationof PHBV was due to the rupture of ester bonds during chain scission [47]. This could be attributedto PHBV copolymer separating out into individual PHV and PHB units. The temperatures of at10% weight loss (T10), at 50% weight loss (T50), the initial decomposition temperature (Ti), and themaximum rate of degradation temperature (Tmax) are presented in Table 3. As shown in Table 3, Ti,T10, T50 and Tmax values increased in the composites. When the initial weight loss is taken as a pointof comparison, the onset degradation temperature (Ti) for neat PHBV is 234.45 ◦C and increases to

Nanomaterials 2018, 8, 940 9 of 20
252.70 ◦C and 251.10 ◦C for PHBV/1OSBN and PHBV/1OSFBN composites. The surface treatment bysilane results in improved initial thermal stability in comparison to untreated BN. Another importantthermal property is the temperature corresponding to the maximum rate of weight loss (Tmax). Tmax
shifted to higher temperatures as the BN content increased, from 275.08 ◦C to 295.50 ◦C. This resultshowed that the thermal stability of the composites improved with the addition of the BN to thepolymer matrix. One of the most important property of boron nitride is its high-temperature resistance.As a result of this property, inclusion of the BN within a polymeric matrix results in increasing of thethermal stability of the composite. The fabrication of gelatin-BN nanocomposites was investigatedby Biscarat et al. [33]. An increase of gelatin degradation temperature was observed by using DSC.It was concluded that gelatin chains that intercalate into BN are restricted by the nanosheets, and themovement of segments is restrained. An electrostatic interaction or a hydrogen bond between thecharged groups of gelatin chains and BN acts as physical crosslinking and reduces the activity of thegelatin [33].
Nanomaterials 2018, 8, x FOR PEER REVIEW 9 of 20
showed that the thermal stability of the composites improved with the addition of the BN to the polymer matrix. One of the most important property of boron nitride is its high-temperature resistance. As a result of this property, inclusion of the BN within a polymeric matrix results in increasing of the thermal stability of the composite. The fabrication of gelatin-BN nanocomposites was investigated by Biscarat et al. [33]. An increase of gelatin degradation temperature was observed by using DSC. It was concluded that gelatin chains that intercalate into BN are restricted by the nanosheets, and the movement of segments is restrained. An electrostatic interaction or a hydrogen bond between the charged groups of gelatin chains and BN acts as physical crosslinking and reduces the activity of the gelatin [33].
Figure 7. TG thermograms of (a) PHBV/OSBN and (b) PHBV/OSFBN nanocomposites.
Table 3. TG results of nanocomposites.
Sample Ti (°C) T10 (°C) T50 (°C) Tmax (°C) Char (%) PHBV 234.45 243.50 256.04 275.08 1.81
PHBV/0.5OSBN 251.90 271.35 283.39 293.90 1.82 PHBV/1BN 250.30 271.97 282.97 292.30 2.03
PHBV/1OSBN 252.70 270.67 282.10 294.70 2.23 PHBV/2OSBN 253.50 271.53 282.73 295.50 2.88 PHBV/3OSBN 254.30 271.06 282.30 295.50 3.97
PHBV/0.5OSFBN 248.92 269.00 279.45 289.44 2.17 PHBV/1FBN 247.09 268.18 278.92 289.54 2.53
PHBV/1OSFBN 251.10 267.82 278.37 289.90 2.62 PHBV/2OSFBN 251.90 269.40 279.50 291.06 3.06 PHBV/3OSFBN 253.45 270.17 280.11 294.17 3.75
Camargo et al. investigated thermal behavior of PHBV/Lignin composites by thermogravimetric analysis and found that the thermal decomposition of pure PHBV and composites took place in a single degradation step [48]. In another study, Bhardwaj et al. worked on the thermogravimetric analysis of PHBV/cellulose fibers [49]. Cellulose fibers did not affect the existing degradation step of PHBV. Lai et al. studied the thermal properties of multilayered carbon nanotube/PHBV composites [50]. It was observed that the degradation temperature rise was up to 16 °C for the PHBV nanocomposite. It was concluded that nanodispersion of carbon nanotubes increased thermal stability of composites [50].
3.5. Thermal Properties of Composites
Differential scanning calorimetry (DSC) was used to study the change in enthalpy values associated with chemical phase transitions in composite samples, as a function of temperature. Two heating and one cooling cycles were performed in order to make useful comparisons for PHBV/OSFBN and PHBV/OSBN composites. Figure 8 and Table 4 present the thermograms obtained from the
Figure 7. TG thermograms of (a) PHBV/OSBN and (b) PHBV/OSFBN nanocomposites.
Table 3. TG results of nanocomposites.
Sample Ti (◦C) T10 (◦C) T50 (◦C) Tmax (◦C) Char (%)
PHBV 234.45 243.50 256.04 275.08 1.81PHBV/0.5OSBN 251.90 271.35 283.39 293.90 1.82
PHBV/1BN 250.30 271.97 282.97 292.30 2.03PHBV/1OSBN 252.70 270.67 282.10 294.70 2.23PHBV/2OSBN 253.50 271.53 282.73 295.50 2.88PHBV/3OSBN 254.30 271.06 282.30 295.50 3.97
PHBV/0.5OSFBN 248.92 269.00 279.45 289.44 2.17PHBV/1FBN 247.09 268.18 278.92 289.54 2.53
PHBV/1OSFBN 251.10 267.82 278.37 289.90 2.62PHBV/2OSFBN 251.90 269.40 279.50 291.06 3.06PHBV/3OSFBN 253.45 270.17 280.11 294.17 3.75
Camargo et al. investigated thermal behavior of PHBV/Lignin composites by thermogravimetricanalysis and found that the thermal decomposition of pure PHBV and composites took place in asingle degradation step [48]. In another study, Bhardwaj et al. worked on the thermogravimetricanalysis of PHBV/cellulose fibers [49]. Cellulose fibers did not affect the existing degradationstep of PHBV. Lai et al. studied the thermal properties of multilayered carbon nanotube/PHBVcomposites [50]. It was observed that the degradation temperature rise was up to 16 ◦C for the PHBVnanocomposite. It was concluded that nanodispersion of carbon nanotubes increased thermal stabilityof composites [50].

Nanomaterials 2018, 8, 940 10 of 20
3.5. Thermal Properties of Composites
Differential scanning calorimetry (DSC) was used to study the change in enthalpy valuesassociated with chemical phase transitions in composite samples, as a function of temperature.Two heating and one cooling cycles were performed in order to make useful comparisons forPHBV/OSFBN and PHBV/OSBN composites. Figure 8 and Table 4 present the thermogramsobtained from the cooling, first and second heating cycle at 10 ◦C/min for PHBV and PHBV/BNcomposites. The various thermal property results calculated from the DSC heating and cooling curvesare summarized in Table 4. As can be observed from Figure 8, neat PHBV and PHBV/BN compositesshowed two melting peaks during the first heating. The peak maximum temperatures of first andthe second melting peaks are given in Table 4 as Tm1 and Tm2. The double melting endotherms havebeen reported by several groups [51–53]. The double melting peak in polymers may be due to severalreasons. The origin for the double melting behavior of PHBV is still being researched. It was generallyaccepted that the double melting peaks were caused by melting–recrystallization–melting behaviorduring heating scans [52]. The first melting peak values are in the range of 166–171 ◦C for compositesas opposite to 170 ◦C for neat PHBV. The degree of crystallinity (Xc) from the first heating scan wascomputed and presented in Table 4. The BN addition does not influence crystallinity of the matrix forsilanized samples up to 3 wt% loadings. The addition of the surface treated BN to the polymer matrix(PHBV/1OSBN) slightly increased the crystallinity of PHBV from 57% to 60%.
Nanomaterials 2018, 8, x FOR PEER REVIEW 10 of 20
cooling, first and second heating cycle at 10 °C/min for PHBV and PHBV/BN composites. The various thermal property results calculated from the DSC heating and cooling curves are summarized in Table 4. As can be observed from Figure 8, neat PHBV and PHBV/BN composites showed two melting peaks during the first heating. The peak maximum temperatures of first and the second melting peaks are given in Table 4 as Tm1 and Tm2. The double melting endotherms have been reported by several groups [51–53]. The double melting peak in polymers may be due to several reasons. The origin for the double melting behavior of PHBV is still being researched. It was generally accepted that the double melting peaks were caused by melting–recrystallization–melting behavior during heating scans [52]. The first melting peak values are in the range of 166–171 °C for composites as opposite to 170 °C for neat PHBV. The degree of crystallinity (Xc) from the first heating scan was computed and presented in Table 4. The BN addition does not influence crystallinity of the matrix for silanized samples up to 3 wt% loadings. The addition of the surface treated BN to the polymer matrix (PHBV/1OSBN) slightly increased the crystallinity of PHBV from 57% to 60%.
Figure 8. DSC thermograms of PHBV/BN and PHBV/FBN nanocomposites.
Table 4. DSC results of nanocomposites.
Sample First Heating Cooling Second Heating
Tm1 (°C)
Tm2 (°C)
ΔHm1 (j/g)
Xc (%)
Tc1 (°C)
ΔHc (j/g)
Tm1 (°C)
ΔHm2 (j/g)
Xc (%)
PHBV 170 173 88 60 122 86 171 100 68 PHBV/0.5OSBN 169 174 87 60 122 88 170 98 67
PHBV/1BN 171 - 81 57 124 84 172 95 65 PHBV/1OSBN 166 173 86 60 121 91 168 100 69 PHBV/2OSBN 171 - 86 60 122 87 170 100 70 PHBV/3OSBN 168 175 83 56 123 81 164 90 64
PHBV/0.5OSFBN 170 175 87 60 123 89 171 99 68 PHBV/1FBN 171 - 87 60 125 89 171 100 69
PHBV/1OSFBN 169 173 89 61 122 90 169 102 71 PHBV/2OSFBN 170 - 85 59 124 84 172 95 67 PHBV/3OSFBN 171 - 82 58 124 81 172 91 65
Figure 8. DSC thermograms of PHBV/BN and PHBV/FBN nanocomposites.
Table 4. DSC results of nanocomposites.
SampleFirst Heating Cooling Second Heating
Tm1(◦C)
Tm2(◦C)
∆Hm1(j/g)
Xc(%)
Tc1(◦C)
∆Hc(j/g)
Tm1(◦C)
∆Hm2(j/g)
Xc(%)
PHBV 170 173 88 60 122 86 171 100 68PHBV/0.5OSBN 169 174 87 60 122 88 170 98 67
PHBV/1BN 171 - 81 57 124 84 172 95 65PHBV/1OSBN 166 173 86 60 121 91 168 100 69PHBV/2OSBN 171 - 86 60 122 87 170 100 70PHBV/3OSBN 168 175 83 56 123 81 164 90 64
PHBV/0.5OSFBN 170 175 87 60 123 89 171 99 68PHBV/1FBN 171 - 87 60 125 89 171 100 69
PHBV/1OSFBN 169 173 89 61 122 90 169 102 71PHBV/2OSFBN 170 - 85 59 124 84 172 95 67PHBV/3OSFBN 171 - 82 58 124 81 172 91 65
Nanomaterials 2018, 8, 940 11 of 20
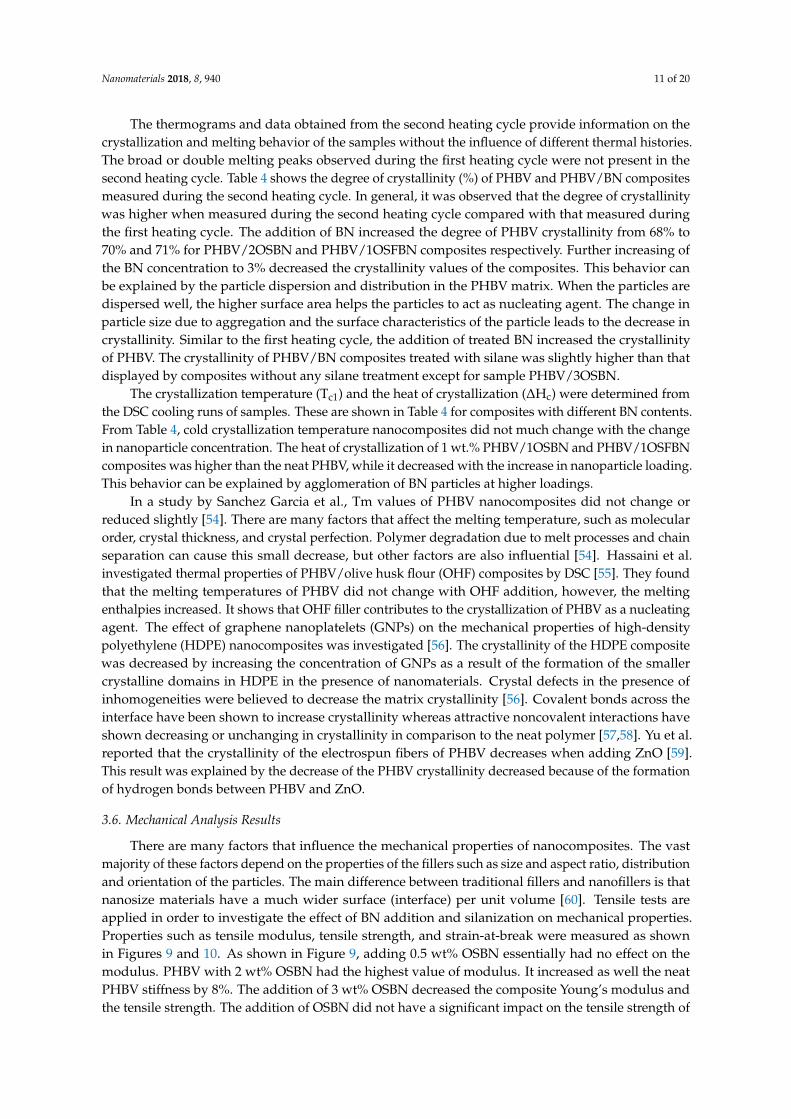
The thermograms and data obtained from the second heating cycle provide information on thecrystallization and melting behavior of the samples without the influence of different thermal histories.The broad or double melting peaks observed during the first heating cycle were not present in thesecond heating cycle. Table 4 shows the degree of crystallinity (%) of PHBV and PHBV/BN compositesmeasured during the second heating cycle. In general, it was observed that the degree of crystallinitywas higher when measured during the second heating cycle compared with that measured duringthe first heating cycle. The addition of BN increased the degree of PHBV crystallinity from 68% to70% and 71% for PHBV/2OSBN and PHBV/1OSFBN composites respectively. Further increasing ofthe BN concentration to 3% decreased the crystallinity values of the composites. This behavior canbe explained by the particle dispersion and distribution in the PHBV matrix. When the particles aredispersed well, the higher surface area helps the particles to act as nucleating agent. The change inparticle size due to aggregation and the surface characteristics of the particle leads to the decrease incrystallinity. Similar to the first heating cycle, the addition of treated BN increased the crystallinityof PHBV. The crystallinity of PHBV/BN composites treated with silane was slightly higher than thatdisplayed by composites without any silane treatment except for sample PHBV/3OSBN.
The crystallization temperature (Tc1) and the heat of crystallization (∆Hc) were determined fromthe DSC cooling runs of samples. These are shown in Table 4 for composites with different BN contents.From Table 4, cold crystallization temperature nanocomposites did not much change with the changein nanoparticle concentration. The heat of crystallization of 1 wt.% PHBV/1OSBN and PHBV/1OSFBNcomposites was higher than the neat PHBV, while it decreased with the increase in nanoparticle loading.This behavior can be explained by agglomeration of BN particles at higher loadings.
In a study by Sanchez Garcia et al., Tm values of PHBV nanocomposites did not change orreduced slightly [54]. There are many factors that affect the melting temperature, such as molecularorder, crystal thickness, and crystal perfection. Polymer degradation due to melt processes and chainseparation can cause this small decrease, but other factors are also influential [54]. Hassaini et al.investigated thermal properties of PHBV/olive husk flour (OHF) composites by DSC [55]. They foundthat the melting temperatures of PHBV did not change with OHF addition, however, the meltingenthalpies increased. It shows that OHF filler contributes to the crystallization of PHBV as a nucleatingagent. The effect of graphene nanoplatelets (GNPs) on the mechanical properties of high-densitypolyethylene (HDPE) nanocomposites was investigated [56]. The crystallinity of the HDPE compositewas decreased by increasing the concentration of GNPs as a result of the formation of the smallercrystalline domains in HDPE in the presence of nanomaterials. Crystal defects in the presence ofinhomogeneities were believed to decrease the matrix crystallinity [56]. Covalent bonds across theinterface have been shown to increase crystallinity whereas attractive noncovalent interactions haveshown decreasing or unchanging in crystallinity in comparison to the neat polymer [57,58]. Yu et al.reported that the crystallinity of the electrospun fibers of PHBV decreases when adding ZnO [59].This result was explained by the decrease of the PHBV crystallinity decreased because of the formationof hydrogen bonds between PHBV and ZnO.
3.6. Mechanical Analysis Results
There are many factors that influence the mechanical properties of nanocomposites. The vastmajority of these factors depend on the properties of the fillers such as size and aspect ratio, distributionand orientation of the particles. The main difference between traditional fillers and nanofillers is thatnanosize materials have a much wider surface (interface) per unit volume [60]. Tensile tests areapplied in order to investigate the effect of BN addition and silanization on mechanical properties.Properties such as tensile modulus, tensile strength, and strain-at-break were measured as shownin Figures 9 and 10. As shown in Figure 9, adding 0.5 wt% OSBN essentially had no effect on themodulus. PHBV with 2 wt% OSBN had the highest value of modulus. It increased as well the neatPHBV stiffness by 8%. The addition of 3 wt% OSBN decreased the composite Young’s modulus andthe tensile strength. The addition of OSBN did not have a significant impact on the tensile strength of

Nanomaterials 2018, 8, 940 12 of 20
the composites. Furthermore, the elongation at break of neat PHBV decreased with increased OSBNloading. Maximum elongation decreased, from 2.1% for neat PHBV to 1.9% with the addition of3 wt% OSBN. The slight increase in strength and the decrease in elongation in the composites might beattributed to an embrittlement caused by BN agglomeration.
Nanomaterials 2018, 8, x FOR PEER REVIEW 12 of 20
tensile strength of the composites. Furthermore, the elongation at break of neat PHBV decreased with increased OSBN loading. Maximum elongation decreased, from 2.1% for neat PHBV to 1.9% with the addition of 3 wt% OSBN. The slight increase in strength and the decrease in elongation in the composites might be attributed to an embrittlement caused by BN agglomeration.
Both the Young’s modulus and tensile strength of PHBV/OSFBN composites were increased for films containing 1 wt% OSFBN content. The addition of nanocrystals caused enhancement of the Youngs modulus and the tensile strength up to 1 wt% but led to a decrease at higher loadings. Young’s modulus for the PHBV/1OSFBN composite was found to be around 3469.7 MPa which accounts for a maximum 19% increase. The maximum increase of the tensile strength of PHBV/1OSFBN composite is 10.6%. The elongation at break of PHBV decreased with the addition of OSFBN. This result shows that BN filler particles were well dispersed at low filler loadings but nonhomogenously distributed at higher concentrations.
Figure 9. Young’s modulus values of (a) PHBV/BN and (b) PHBV/FBN nanocomposites.
Figure 10. Tensile stress and elongation at break values of (a) PHBV/BN and (b) PHBV/FBN nanocomposites.
Figure 9. Young’s modulus values of (a) PHBV/BN and (b) PHBV/FBN nanocomposites.
Nanomaterials 2018, 8, x FOR PEER REVIEW 12 of 20
tensile strength of the composites. Furthermore, the elongation at break of neat PHBV decreased with increased OSBN loading. Maximum elongation decreased, from 2.1% for neat PHBV to 1.9% with the addition of 3 wt% OSBN. The slight increase in strength and the decrease in elongation in the composites might be attributed to an embrittlement caused by BN agglomeration.
Both the Young’s modulus and tensile strength of PHBV/OSFBN composites were increased for films containing 1 wt% OSFBN content. The addition of nanocrystals caused enhancement of the Youngs modulus and the tensile strength up to 1 wt% but led to a decrease at higher loadings. Young’s modulus for the PHBV/1OSFBN composite was found to be around 3469.7 MPa which accounts for a maximum 19% increase. The maximum increase of the tensile strength of PHBV/1OSFBN composite is 10.6%. The elongation at break of PHBV decreased with the addition of OSFBN. This result shows that BN filler particles were well dispersed at low filler loadings but nonhomogenously distributed at higher concentrations.
Figure 9. Young’s modulus values of (a) PHBV/BN and (b) PHBV/FBN nanocomposites.
Figure 10. Tensile stress and elongation at break values of (a) PHBV/BN and (b) PHBV/FBN nanocomposites. Figure 10. Tensile stress and elongation at break values of (a) PHBV/BN and (b)
PHBV/FBN nanocomposites.
Both the Young’s modulus and tensile strength of PHBV/OSFBN composites were increasedfor films containing 1 wt% OSFBN content. The addition of nanocrystals caused enhancement of theYoungs modulus and the tensile strength up to 1 wt% but led to a decrease at higher loadings. Young’smodulus for the PHBV/1OSFBN composite was found to be around 3469.7 MPa which accounts for a

Nanomaterials 2018, 8, 940 13 of 20
maximum 19% increase. The maximum increase of the tensile strength of PHBV/1OSFBN compositeis 10.6%. The elongation at break of PHBV decreased with the addition of OSFBN. This result showsthat BN filler particles were well dispersed at low filler loadings but nonhomogenously distributed athigher concentrations.
These findings are in agreement with the XRD results. Figure 11 shows the Young’s modulus ofthe composites as a function of (020)/(110) relative intensity ratio for neat PHBV and PHBV/OSBNand PHBV/OSFBN nanocomposites. As seen from the Figure 11, all composites had higher (020)/(110)ratio than the neat PHBV. 1 wt.% PHBV/OSFBN composite samples showed the highest (020)/(110)ratio and the highest Young’s modulus compared to other composites as well as neat PHBV. This wasconsistent with the decrease in the (020)/(110) ratio of 3 wt.% PHBV/BN samples. Young’s modulusof 3 wt.% PHBV/BN composite samples showed the lowest (020)/(110) ratio. This result associated toXRD analyses shows that BN filler particles at low filler loadings directly influence the morphologicalorganization of PHBV polymer matrix and increase the stiffness of the polymer. However, the effectof nanoparticles addition is not linear and above a certain limit there is a reduction of stiffnessenhancement. Maximizing the properties of the polymer at low nanoscale in loadings of a nanoscalefiller requires that it is thoroughly distributed throughout the polymer matrix and that completeexfoliation of the filler’s layers has occurred.
Nanomaterials 2018, 8, x FOR PEER REVIEW 13 of 20
These findings are in agreement with the XRD results. Figure 11 shows the Young’s modulus of the composites as a function of (020)/(110) relative intensity ratio for neat PHBV and PHBV/OSBN and PHBV/OSFBN nanocomposites. As seen from the Figure 11, all composites had higher (020)/(110) ratio than the neat PHBV. 1 wt.% PHBV/OSFBN composite samples showed the highest (020)/(110) ratio and the highest Young’s modulus compared to other composites as well as neat PHBV. This was consistent with the decrease in the (020)/(110) ratio of 3 wt.% PHBV/BN samples. Young’s modulus of 3 wt.% PHBV/BN composite samples showed the lowest (020)/(110) ratio. This result associated to XRD analyses shows that BN filler particles at low filler loadings directly influence the morphological organization of PHBV polymer matrix and increase the stiffness of the polymer. However, the effect of nanoparticles addition is not linear and above a certain limit there is a reduction of stiffness enhancement. Maximizing the properties of the polymer at low nanoscale in loadings of a nanoscale filler requires that it is thoroughly distributed throughout the polymer matrix and that complete exfoliation of the filler’s layers has occurred.
Figure 11. Young’s modulus variation with (020)/(110) relative intensity ratio of (a) PHBV/OSBN and (b) PHBV/OSFBN composites
For the same BN content, the OSFBN composites had higher tensile strength and modulus than OSBN composites. These results showed that the mechanical properties of the composites were found to increase more for the PHBV/OSFBN compared with PHBV/OSBN samples. The higher values in strength and modulus observed in the PHBV/OSFBN specimen compared with the PHBV/OSBN can be attributed to different factors: (1) OSFBN was dispersed more uniformly in the composite specimens than the OSBN; (2) this may be related to the higher surface area displayed by OSFBN (71.90 m2/g), which can promote a better intercalation of BN nanosheets between PHBV chains in comparison to OSBN (26.89 m2/g) and can influence the polymer chain organization. Studies concerning surface area have shown that reinforcement is related to nanoparticle surface area [61]. The larger surface area of OSFBN leading to the stronger interactions between the BN and PHBV. In this work, the partial exfoliation of the OSFBN allows for maximum surface area exposure between the filler and PHBV; (3) the flake-like nanoparticles showed higher tensile strength than disk type particles.
It is well known that the homogeneous dispersion of nanoparticles in the polymer matrix is necessary to improve properties of composite. The good dispersion of the both BN particles in the matrix was observed in SEM figures (Figure 1a,b). Apart from the distribution of the filler, understanding the effect of the shape and aspect ratio of the filler on the composite’s properties impacts its design. As we have observed in SEM images, the aspect ratio for OSFBN flakes are around 19 and OSBN disks be around 4. The property improvement of the OSFBN may be attributed the higher surface area and aspect ratio of the platelets.
To obtain a strong interface, the filler should have an attractive interaction with the matrix. The interaction may be achieved through surface chemistry in the form of functionalization with chemical moieties. In order to see surface functionalization on mechanical properties, the composite samples
Figure 11. Young’s modulus variation with (020)/(110) relative intensity ratio of (a) PHBV/OSBN and(b) PHBV/OSFBN composites
For the same BN content, the OSFBN composites had higher tensile strength and modulus thanOSBN composites. These results showed that the mechanical properties of the composites were foundto increase more for the PHBV/OSFBN compared with PHBV/OSBN samples. The higher values instrength and modulus observed in the PHBV/OSFBN specimen compared with the PHBV/OSBN canbe attributed to different factors: (1) OSFBN was dispersed more uniformly in the composite specimensthan the OSBN; (2) this may be related to the higher surface area displayed by OSFBN (71.90 m2/g),which can promote a better intercalation of BN nanosheets between PHBV chains in comparison toOSBN (26.89 m2/g) and can influence the polymer chain organization. Studies concerning surfacearea have shown that reinforcement is related to nanoparticle surface area [61]. The larger surface areaof OSFBN leading to the stronger interactions between the BN and PHBV. In this work, the partialexfoliation of the OSFBN allows for maximum surface area exposure between the filler and PHBV;(3) the flake-like nanoparticles showed higher tensile strength than disk type particles.
It is well known that the homogeneous dispersion of nanoparticles in the polymer matrix isnecessary to improve properties of composite. The good dispersion of the both BN particles inthe matrix was observed in SEM figures (Figure 1a,b). Apart from the distribution of the filler,understanding the effect of the shape and aspect ratio of the filler on the composite’s propertiesimpacts its design. As we have observed in SEM images, the aspect ratio for OSFBN flakes are around

Nanomaterials 2018, 8, 940 14 of 20
19 and OSBN disks be around 4. The property improvement of the OSFBN may be attributed thehigher surface area and aspect ratio of the platelets.
To obtain a strong interface, the filler should have an attractive interaction with the matrix.The interaction may be achieved through surface chemistry in the form of functionalization withchemical moieties. In order to see surface functionalization on mechanical properties, the compositesamples were prepared without using coupling agent. Young’ modulus values of nonsilanizednanocomposites with 1 wt.% BN and 1 wt.% FBN content are 2929 MPa and 3187 MPa respectively.After silanization, the modulus values increased to 3080 MPa and 3469 MPa, for OSBN and OSFBNnanocomposites respectively. This shows that good interfacial adhesion was achieved between PHBVand BN, which might be due to the silane coupling agent used in this study.
Carotenuto et al. prepared LDPE/GNP (low-density polyethylene/graphite nanoplatelets)nanocomposites and tested the mechanical performance. It was found that both tensile elongationat break and compressive extension were reduced in films containing GNP [62]. It was claimed thatthis is due to the obstruction in polymer chain mobility, where the polymer chains are not allowedto unfold and rotate when stress is applied due to the uniform presence of GNP throughout theLDPE matrix. Yu et al. prepared PHBV/cellulose nanocrystal-silver (CNC-Ag) nanocompositesand tested the mechanical performance of nanocomposites [36]. They obtained the highest Young’smodulus and the lowest elongation at break for 10% CNC-Ag content. These improvements have beenshown to be a consequence of the homogeneous distribution of the CNC-Ag additive, the increasedinterfacial adhesion between two phases by means of interaction of hydrogen bonds, and the increasedcrystallization of PHBV. However, with further increase of CNC-Ag filler content to 15 wt.% or more letto the decrease in mechanical properties was observed. This result was explained by the agglomerationof the filler. Xiang et al. prepared PHBV/tannic acid nanocomposites and examined the mechanicalperformance. Mechanical properties such as tensile stress and fracture toughness were improvedcomparing to neat PHBV matrix. However, no improvement was observed above a certain level offiller content [63].
3.7. Mechanical Modelling
Multiple analytical, mechanics-based theories were developed to model particles-filled compositestructures. These theories are reliant on filler volume fraction and elastic properties of each constituent.As a result, these models offer a good indication of the resultant properties but are unable to account forthe effect of factors, such as particles interaction and distribution, on the properties of the composites.All models used for the calculation of relative modulus assumed perfect interfacial adhesion betweenparticles and matrix. In this work, the experimental data obtained were compared with two of thesimplest and most common theoretical models to predict Young’s modulus of the composite materials;Halpin–Tsai and Hui–Shia models. The Halpin–Tsai model accounts the modulus of reinforcementand matrix materials as well as shape and volume fraction of filler. The mechanical modeling ofa variety of reinforcement of fillers such as platelet-like or flake-like fillers can be done by usingthis model [64]. The Halpin–Tsai equation for randomly oriented discontinuous fillers is given inTable 5 [65]. The Hui–Shia model is employed to the mechanical modeling of composites with theassumption of perfect interfacial bonding between the polymer matrix and fillers. The Hui–Shiaequation for platelet fillers is given in Table 5. In the Hui–Shia model, α represents the aspect ratioof the filler, which is the width of the platelet divided by the thickness of particles. In this work,SEM images were used for calculation of aspect ratio. As observed by SEM, the shape of the OSBNnanoparticles was a nearly hexagonal disk with an aspect ratio of approximately 4.1. The OSFBNnanoparticles showed irregular flake-like shapes with the mean aspect ratio of 18.9. Ec, Em and Efsymbolize the Young’s modulus of nanocomposite, matrix and filler respectively. Em value was takenfrom directly Admajoris as 2.95 GPa. Ef, the Young’s modulus of hexagonal boron nitride was takenfrom literature as 40 GPa [24]. The factors ηL and ηT are given by equations in Table 5 as a function of
Nanomaterials 2018, 8, 940 15 of 20
Ef (the modulus of the filler) and Em (modulus of the matrix). Φf symbolizes the volume fraction ofnanoparticle in composite, it is defined as:
φ f =VBN
VBN + VPHBV(2)
Table 5. Mechanical models [64,65].
Model Array Type Formula
Halpin–Tsai Model Random array
EcEm
= 38
(1+ξηLφ f1−ηLφ f
)+ 5
8
(1+2ηT φ f1−ηT φ f
)ηL =
(E fEm
)−1(
E fEm
)+ξ
ηT =
(E fEm
)−1(
E fEm
)+2
Hui–Shia Model Regular array
EcEm
= 11−
φ f4
(1ξ +
3ξ+Λ
)ξ = φ f +
EmE f −Em
+ 3(−φ f
)((1−g)α2− g
2α2−1 )
g = π2 α
Λ =(
1 − φ f
)(
3(α2+0,25)g−2α2
α2−1 )
The volume fraction for composites with 0.5 wt.%, 1 wt.%, 2 wt.% and 3 wt.% BN content wascalculated using this formula. In the Halpin–Tsai model, ξ which depends on the width (w) andthickness (t) of nanoparticles and symbolizes the shape factor is defined as:
ξ = 2(w
t
)(3)
In the Hui–Shia model, g is the geometrical parameter which depends on the aspect ratio of thefiller. The parameters ξ and Λ are defined in equations given in Table 5.
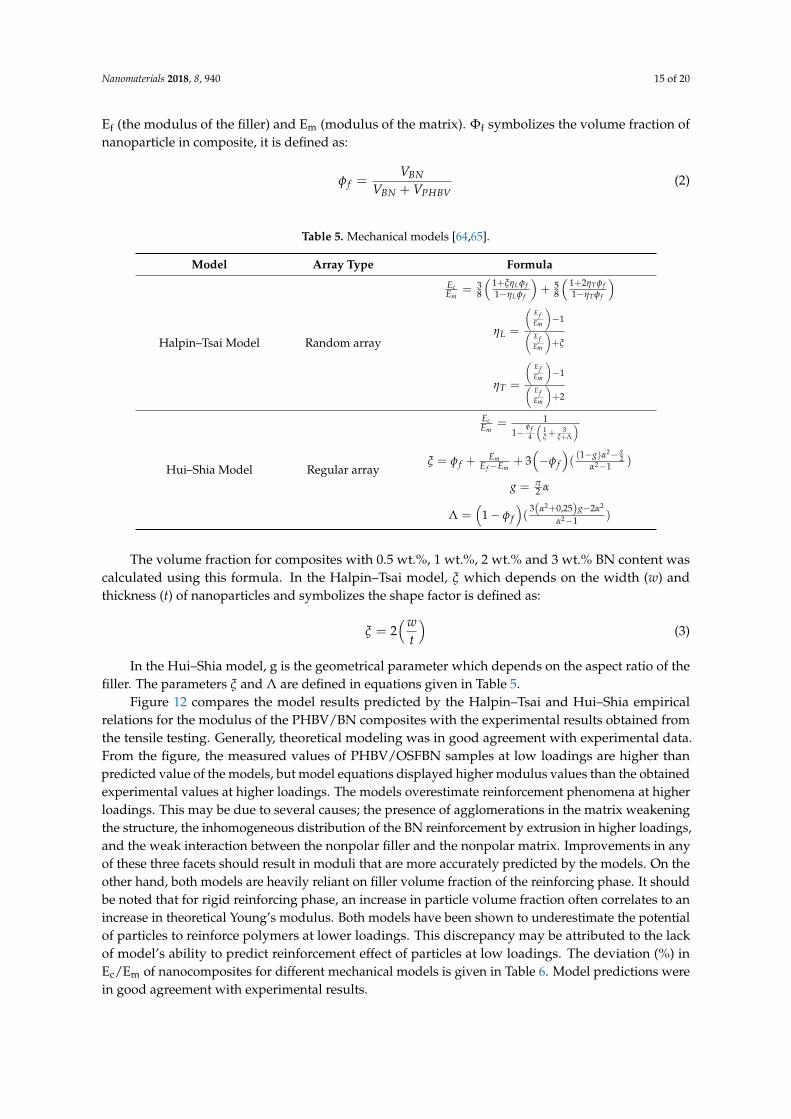
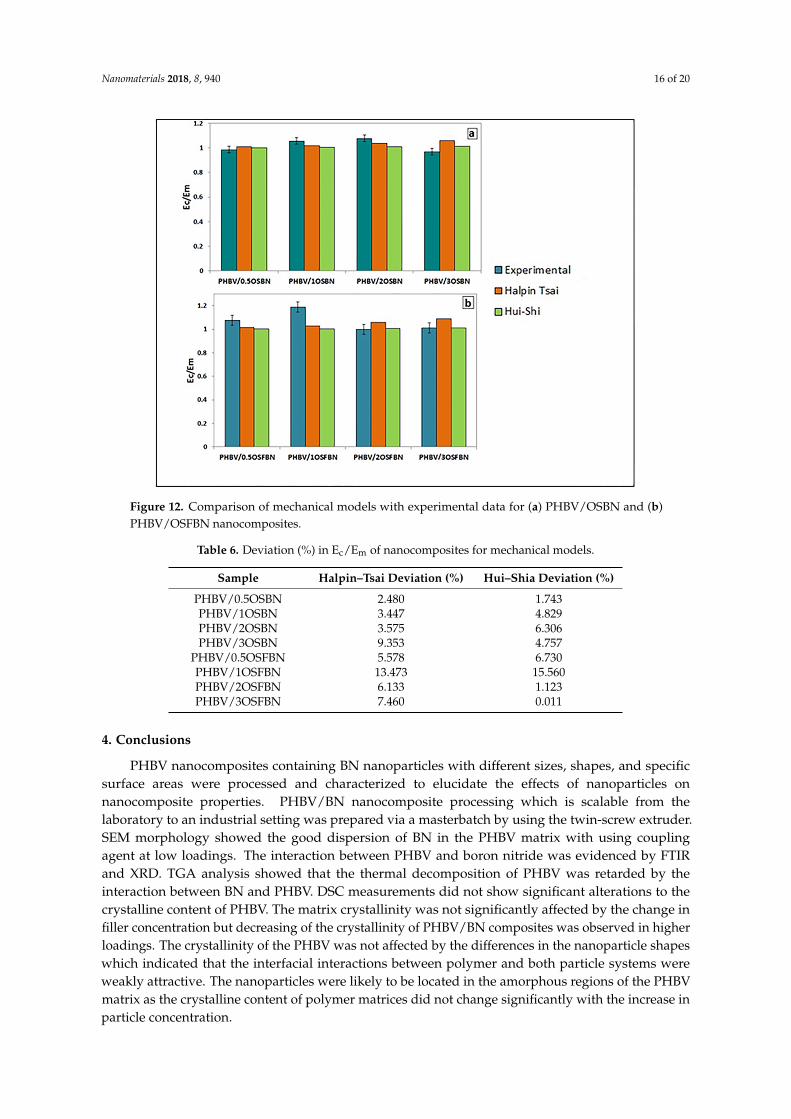
Figure 12 compares the model results predicted by the Halpin–Tsai and Hui–Shia empiricalrelations for the modulus of the PHBV/BN composites with the experimental results obtained fromthe tensile testing. Generally, theoretical modeling was in good agreement with experimental data.From the figure, the measured values of PHBV/OSFBN samples at low loadings are higher thanpredicted value of the models, but model equations displayed higher modulus values than the obtainedexperimental values at higher loadings. The models overestimate reinforcement phenomena at higherloadings. This may be due to several causes; the presence of agglomerations in the matrix weakeningthe structure, the inhomogeneous distribution of the BN reinforcement by extrusion in higher loadings,and the weak interaction between the nonpolar filler and the nonpolar matrix. Improvements in anyof these three facets should result in moduli that are more accurately predicted by the models. On theother hand, both models are heavily reliant on filler volume fraction of the reinforcing phase. It shouldbe noted that for rigid reinforcing phase, an increase in particle volume fraction often correlates to anincrease in theoretical Young’s modulus. Both models have been shown to underestimate the potentialof particles to reinforce polymers at lower loadings. This discrepancy may be attributed to the lackof model’s ability to predict reinforcement effect of particles at low loadings. The deviation (%) inEc/Em of nanocomposites for different mechanical models is given in Table 6. Model predictions werein good agreement with experimental results.
Nanomaterials 2018, 8, 940 16 of 20
Nanomaterials 2018, 8, x FOR PEER REVIEW 16 of 20
Figure 12. Comparison of mechanical models with experimental data for (a) PHBV/OSBN and (b) PHBV/OSFBN nanocomposites.
Table 6. Deviation (%) in Ec/Em of nanocomposites for mechanical models.
Sample Halpin–Tsai Deviation (%) Hui–Shia Deviation (%) PHBV/0.5OSBN 2.480 1.743 PHBV/1OSBN 3.447 4.829 PHBV/2OSBN 3.575 6.306 PHBV/3OSBN 9.353 4.757
PHBV/0.5OSFBN 5.578 6.730 PHBV/1OSFBN 13.473 15.560 PHBV/2OSFBN 6.133 1.123 PHBV/3OSFBN 7.460 0.011
4. Conclusions
PHBV nanocomposites containing BN nanoparticles with different sizes, shapes, and specific surface areas were processed and characterized to elucidate the effects of nanoparticles on nanocomposite properties. PHBV/BN nanocomposite processing which is scalable from the laboratory to an industrial setting was prepared via a masterbatch by using the twin-screw extruder. SEM morphology showed the good dispersion of BN in the PHBV matrix with using coupling agent at low loadings. The interaction between PHBV and boron nitride was evidenced by FTIR and XRD. TGA analysis showed that the thermal decomposition of PHBV was retarded by the interaction between BN and PHBV. DSC measurements did not show significant alterations to the crystalline content of PHBV. The matrix crystallinity was not significantly affected by the change in filler concentration but decreasing of the crystallinity of PHBV/BN composites was observed in higher loadings. The crystallinity of the PHBV was not affected by the differences in the nanoparticle shapes which indicated that the interfacial interactions between polymer and both particle systems were weakly attractive. The nanoparticles were likely to be located in the amorphous regions of the PHBV matrix as the crystalline content of polymer matrices did not change significantly with the increase in particle concentration.
Figure 12. Comparison of mechanical models with experimental data for (a) PHBV/OSBN and (b)PHBV/OSFBN nanocomposites.
Table 6. Deviation (%) in Ec/Em of nanocomposites for mechanical models.
Sample Halpin–Tsai Deviation (%) Hui–Shia Deviation (%)
PHBV/0.5OSBN 2.480 1.743PHBV/1OSBN 3.447 4.829PHBV/2OSBN 3.575 6.306PHBV/3OSBN 9.353 4.757
PHBV/0.5OSFBN 5.578 6.730PHBV/1OSFBN 13.473 15.560PHBV/2OSFBN 6.133 1.123PHBV/3OSFBN 7.460 0.011
4. Conclusions
PHBV nanocomposites containing BN nanoparticles with different sizes, shapes, and specificsurface areas were processed and characterized to elucidate the effects of nanoparticles onnanocomposite properties. PHBV/BN nanocomposite processing which is scalable from thelaboratory to an industrial setting was prepared via a masterbatch by using the twin-screw extruder.SEM morphology showed the good dispersion of BN in the PHBV matrix with using couplingagent at low loadings. The interaction between PHBV and boron nitride was evidenced by FTIRand XRD. TGA analysis showed that the thermal decomposition of PHBV was retarded by theinteraction between BN and PHBV. DSC measurements did not show significant alterations to thecrystalline content of PHBV. The matrix crystallinity was not significantly affected by the change infiller concentration but decreasing of the crystallinity of PHBV/BN composites was observed in higherloadings. The crystallinity of the PHBV was not affected by the differences in the nanoparticle shapeswhich indicated that the interfacial interactions between polymer and both particle systems wereweakly attractive. The nanoparticles were likely to be located in the amorphous regions of the PHBVmatrix as the crystalline content of polymer matrices did not change significantly with the increase inparticle concentration.

Nanomaterials 2018, 8, 940 17 of 20
BN increased the modulus of PHBV, as observed via tensile tests. However, elongation at breakdecreased as the amount of BN increased. The Young’s modulus of the composite was increasedby 19% in PHBV/1OSFBN composite. At higher loading, BN agglomeration takes place within thePHBV matrix and the lack of proper adhesion between the matrix and the BN results in insufficientstress transfer. Moreover, modified BN has been shown to contribute to an enhancement of Young’smodulus than unmodified BN. The differences in the mechanical behavior of the two BN particleswere attributed to the different surface area and aspect ratio characteristics. The higher surface area(71.9 m2/g) and aspect ratio (18.9) displayed by OSFBN can promote a better intercalation of BNnanosheets between PHBV chains and influence the mechanical properties. Theoretical modelingcan be used to predict the potential modulus improvements of adding a filler to a matrix. In ourresearch, The Halpin–Tsai and Hui–Shia models were used to evaluate the effect of reinforcement byBN particles on the elastic modulus of the resulting composites. Both model equations predict valuesclose to the experimental results.
Author Contributions: M.Ö., M.B. and C.P.-B. conceived and designed the experiments; G.K. (Gülnur Kızıl) andG.K. (Gülsah Keskin) performed the experiments; M.Ö., M.B., C.P., G.K. (Gülnur Kızıl) and G.K. (Gülsah Keskin)analyzed the data; M.Ö. wrote the paper.
Funding: This research was funded by Scientific and Technological Research Council of Turkey (TÜBITAK, ProjectNo: 215M355), and the Campus France (PHC Bosphore No: 35211) under a Bilateral Cooperation Programbetween Turkey and France. G.K. (Gülsah Keskin) and G.K. (Gülnur Kızıl) gratefully acknowledge TÜBITAK forthe scholarship.
Conflicts of Interest: The authors declare no conflicts of interest.
References
1. Malmir, S.; Montero, B.; Rico, M.; Barral, L.; Bouza, R.; Farrag, Y. Effects of poly(3-hydroxybutyrate-co-hydroxyvalerate) microparticles on morphological, mechanical, thermal, and barrier properties inthermoplastic potato starch films. Carbohydr. Polym. 2018, 194, 357–364. [CrossRef] [PubMed]
2. Williams, C.K.; Hillmyer, M.A. Polymers from renewable resources: A perspective for a special issue ofpolymer reviews. Polym. Rev. 2008, 48, 1–10. [CrossRef]
3. Bordes, P.; Pollet, E.; Avérous, L. Nano-biocomposites: Biodegradable polyester/nanoclay systems.Prog. Polym. Sci. 2009, 34, 125–155. [CrossRef]
4. Kushwah, B.S.; Kushwah, A.V.S.; Singh, V. Towards understanding polyhydroxyalkanoates and their use.J. Polym. Res. 2016, 23, 1–14. [CrossRef]
5. Poirier, Y.; Nawrath, C.; Somerville, C. Production of polyhydroxyalkanoates, a family of biodegradableplastics and elastomers, in bacteria and plants. Nat. Biotechnol. 1995, 13, 142–150. [CrossRef]
6. Silverman, T.; Naffakh, M.; Marco, C.; Ellis, G. Morphology and thermal properties of biodegradablepoly (hydroxybutyrate-co-hydroxyvalerate)/tungsten disulphide inorganic nanotube nanocomposites.Mater. Chem. Phys. 2016, 170, 145–153. [CrossRef]
7. Avella, M.; Martuscelli, E.; Raimo, M. Review Properties of blends and composites based on poly(3-hydroxy)butyrate (PHB) and poly (3-hydroxybutyrate-hydroxyvalerate)(PHBV) copolymers. J. Mater. Sci. 2000,35, 523–545. [CrossRef]
8. Lagaron, J.M. Multifunctional and Nanoreinforced Polymers for Food Packaging, 1st ed.; Woodhead PublishingElsevier Science: New York, NY, USA, 2011.
9. Muller, K.; Bugnicourt, E.; Latorre, M.; Jorda, M.; Sanz, Y.E.; Lagaron, J.M.; Miesbauer, O.; Bianchin, A.;Hankin, S.; Bolz, U.; et al. Review on the Processing and Properties of Polymer Nanocomposites andNanocoatings and Their Applications in the Packaging, Automotive and Solar Energy Fields. Nanomaterials2017, 7, 74. [CrossRef] [PubMed]
10. Fawaz, J.; Mittal, V. Synthesis of Polymer Nanocomposites: Review of Various Techniques, 1st ed.; John Wiley &Sons: Weinheim, Germany, 2014; pp. 1–26.
11. Carli, L.N.; Crespo, J.S.; Mauler, R.S. PHBV nanocomposites based on organomodified montmorillonite andhalloysite: The effect of clay type on the morphology and thermal and mechanical properties. Compos. PartA-Appl. Sci. Manuf. 2011, 42, 1601–1608. [CrossRef]

Nanomaterials 2018, 8, 940 18 of 20
12. Chen, G.X.; Hao, G.J.; Guo, T.Y.; Song, M.D.; Zhang, B.H. Structure and mechanical properties ofpoly(3-hydroxybutyrate-co-3-hydroxyvalerate) (PHBV)/clay nanocomposites. J. Mater. Sci. Lett. 2002,21, 1587–1589. [CrossRef]
13. Ten, E.; Turtle, J.; Bahr, D.; Jiang, L.; Wolcott, M. Thermal and mechanical properties ofpoly(3-hydroxybutyrate-co-3-hydroxyvalerate)/cellulose nanowhiskers composites. Polymer 2010,51, 2652–2660. [CrossRef]
14. Mook, C.W.; Wan, K.T.; Ok, P.O.; Keun, C.Y.; Woo, L.J. Preparation and characterization ofpoly(hydroxybutyrate-co-hydroxyvalerate)–organoclay nanocomposites. J. Appl. Polym. Sci. 2003,90, 525–529. [CrossRef]
15. Öner, M.; Ilhan, B. Fabrication of poly(3-hydroxybutyrate-co-3-hydroxyvalerate) biocomposites withreinforcement by hydroxyapatite using extrusion processing. Mater. Sci. Eng. C 2016, 65, 19–26. [CrossRef][PubMed]
16. Xiang, H.X.; Chen, S.H.; Cheng, Y.H.; Zhou, Z.; Zhu, M.F. Structural characteristics and enhanced mechanicaland thermal properties of full biodegradable tea polyphenol/poly(3-hydroxybutyrate-co-3-hydroxyvalerate)composite films. eXPRESS Polym. Lett. 2013, 7, 778–786. [CrossRef]
17. Luo, S.; Netravali, A.N. Mechanical and thermal properties of environment-friendly “green” compositesmade from pineapple leaf fibers and poly(hydroxybutyrate-co-valerate) resin. Poly. Compos. 1999, 20, 367–378.[CrossRef]
18. Du, J.; Zhao, G.; Pan; Zhuang, L.; Li, D.; Zhang, R. Crystallization and mechanical properties of reinforcedPHBV composites using melt compounding: Effect of CNCs and CNFs. Carbohydr. Polym. 2017, 168, 255–262.
19. Qiang, T.; Wang, J.; Wolcott, M.P. Facile Fabrication of 100% Bio-Based and Degradable TernaryCellulose/PHBV/PLA Composites. Materials 2018, 11, 330. [CrossRef] [PubMed]
20. Zhang, H.; Yu, H.Y.; Wang, C.; Yao, J. Effect of silver contents in cellulose nanocrystal/silver nanohybrids onPHBV crystallization and property improvements. Carbohydr. Polym. 2017, 173, 7–16. [CrossRef] [PubMed]
21. Wang, B.J.; Zhang, Y.J.; Zhang, J.Q.; Gou, Q.T.; Wang, Z.B.; Chen, P.; Gu, Q. Crystallization behavior, thermaland mechanical properties of PHBV/graphene nanosheet composites. Chin. J. Polym. Sci. 2013, 31, 670–678.[CrossRef]
22. Wang, D.; Chen, G.; Li, C.; Cheng, M.; Yang, W.; Wu, S.; Chen, P. Thermally induced graphene rotation onhexagonal boron nitride. Phys. Rev. Lett. 2016, 116, 126101–126105. [CrossRef] [PubMed]
23. Li, X.; Hao, X.; Zhao, M.; Wu, Y.; Yang, J.; Tian, Y.; Qian, G. Exfoliation of hexagonal boron nitride by moltenhydroxides. Adv. Mater. 2013, 25, 2200–2204. [CrossRef] [PubMed]
24. Raman, C.; Meneghetti, P. Boron nitride finds new applications in thermoplastic compounds. Plast. Addit.Comp. 2008, 10, 26–31. [CrossRef]
25. Zhi, C.; Bando, Y.; Tang, C.; Kuwahara, H.; Golberg, D. Large-scale fabrication of boron nitride nanosheetsand their utilization in polymeric composites with improved thermal and mechanical properties. Adv. Mater.2009, 21, 2889–2893. [CrossRef]
26. Wattanakul, K.; Manuspiya, H.; Yanumet, N. Thermal conductivity and mechanical properties of BN-filledepoxy composite: Effects of filler content, mixing conditions and BN agglomerate size. J. Compos. Mater.2011, 45, 1967–1980. [CrossRef]
27. Pradhan, G.C.; Behera, L.; Swain, S.K. Effects of boron nitride nanopowder on thermal, chemical and gasbarrier properties of starch. Chin. J. Polym. Sci. 2014, 32, 1311–1318. [CrossRef]
28. Cheewawuttipong, W.; Fuoka, D.; Tanoue, S.; Uematsu, H.; Iemoto, Y. Thermal and mechanical properties ofpolypropylene/boron nitride composites. Energy Procedia 2013, 34, 808–817. [CrossRef]
29. Sun, G.; Bi, J.; Wang, W.; Zhang, J. Microstructure and mechanical properties of boron nitridenanosheets-reinforced fused silica composites. J. Eur. Ceram. Soc. 2017, 37, 3195–3202. [CrossRef]
30. Kisku, S.K.; Swain, S.K. Synthesis and characterization of chitosan/boron nitride composites. J. Am.Ceram. Soc. 2012, 95, 2753–2757. [CrossRef]
31. Zhou, W.; Zuo, J.; Zhang, X.; Zhou, A. Thermal, electrical and mechanical properties of hexagonal boronnitride-reinforced epoxy composites. J. Compos. Mater. 2014, 48, 2517–2526. [CrossRef]
32. Li, S.; Yang, T.; Zou, H.; Liang, M.; Chen, Y. Enhancement in thermal conductivity and mechanical propertiesvia large-scale fabrication of boron nitride nanosheet. High Perform. Polym. 2016, 29, 315–327. [CrossRef]
33. Biscarat, J.; Bechelany, M.; Pochat-Bohatier, C.; Miele, P. Graphene-like BN/gelatin nanobiocomposites forgasbarrier applications. Nanoscale 2015, 7, 613–618. [CrossRef] [PubMed]

Nanomaterials 2018, 8, 940 19 of 20
34. Öner, M.; Çöl, A.A.; Pochat-Bohatier, C.; Bechelany, M. Effect of incorporation of boron nitride nanoparticleson the oxygen barrier and thermalproperties of poly(3-hydroxybutyrate-cohydroxyvalerate). RSC Adv. 2016,6, 90973–90981. [CrossRef]
35. Öner, M.; Keskin, G.; Kızıl, G.; Pochat-Bohatier, C.; Bechelany, M. Development ofpoly(3-hydroxybutyrate-co-3-hydroxyvalerate)/boron nitride bionanocomposites with enhancedbarrier properties. Polym. Compos. in press. [CrossRef]
36. Yu, H.; Sun, B.; Zhang, D.; Chen, G.; Yang, X.; Yao, J. Reinforcement of biodegradablepoly(3-hydroxybutyrate-co-3-hydroxyvalerate) with cellulose nanocrystal/silver nanohybrids as bifunctionalnanofillers. J. Mater. Chem. B 2014, 2, 8479–8489. [CrossRef]
37. Huang, W.; Wang, Y.; Ren, L.; Du, C.; Shi, X. A novel PHBV/HA microsphere releasing system loaded withalendronate. Mater. Sci. Eng. C 2009, 29, 2221–2225. [CrossRef]
38. Ambrosio-Martín, J.; Gorrasi, G.; Lopez-Rubio, A.; Fabra, M.J.; Mas, L.C.; López-Manchado, M.A.;Lagaron, J.M. On the use of ball milling to develop poly(3-hydroxybutyrate-co-3-hydroxyvalerate)-graphenenanocomposites (II)—Mechanical, barrier, and electrical properties. J. Appl. Polym. Sci. 2015,132, 42217–42225. [CrossRef]
39. Yu, H.; Yan, C.; Yao, J. Fully biodegradable food packaging materials based on functionalizedcellulose nanocrystals/poly(3-hydroxybutyrate-co-3-hydroxyvalerate) nanocomposites. RSC Adv. 2014,4, 59792–59802. [CrossRef]
40. Sato, H.; Murakami, R.; Padermshoke, A.; Hirose, F.; Senda, K.; Noda, I.; Ozaki, Y. Infrared SpectroscopyStudies of CH–O Hydrogen Bondings and Thermal Behavior of Biodegradable Poly(hydroxyalkanoate).Macromolecules 2004, 37, 7203–7213. [CrossRef]
41. Suthar, V.; Pratap, A.; Raval, H. Studies on poly(hydroxy alkanoates)/(ethylcellulose) blends. Bull. Mater. Sci.2000, 23, 215–219. [CrossRef]
42. Singh, S.; Mohanty, A.K.; Sugie, T.; Takai, Y.; Hamada, H. Renewable resource based biocomposites fromnatural fiber and polyhydroxybutyrate-co-valerate (PHBV) bioplastic. Compos. Part A-Appl. Sci. Manuf. 2008,39, 875–888. [CrossRef]
43. Yu, L.; Gao, B.; Chen, Z.; Sun, C.; Cui, D.; Wang, C.; Wang, Q.; Jiang, M. In Situ FTIR Investigation on PhaseTransformations in BN Nanoparticles. Chin. Sci. Bull. 2005, 50, 2827–2831.
44. Shi, L.; Gu, Y.; Chen, L.; Qian, Y.; Yang, Z.; Ma, J. Synthesis and Morphology Control of NanocrystallineBoron Nitride. J. Solid State Chem. 2004, 177, 721–724. [CrossRef]
45. Soliveri, G.; Pifferi, V.; Annunziata, R.; Rimoldi, L.; Aina, V.; Cerrato, G.; Meroni, D. Alkylsilane–SiO2
Hybrids. A Concerted Picture of Temperature Effects in Vapor Phase Functionalization. J. Phys. Chem. C2015, 119, 15390–15400. [CrossRef]
46. Paul, B.; Martens, W.N.; Frost, R.L. Organosilane grafted acid-activated beidellite clay for the removal ofnon-ionic alachlor and anionic imazaquin. Appl. Surf. Sci. 2011, 257, 5552–5558. [CrossRef]
47. Li, J.; Lai, M.F.; Liu, J.J. Effect of poly (propylene carbonate) on the crystallization and melting behavior ofpoly(hydroxybutyrate-co-hydroxyvalerate). J. Appl. Polym. Sci. 2004, 92, 2514–2521. [CrossRef]
48. Camargo, F.A.; Innocentini-Mei, L.H.; Lemes, A.P.; Moraes, S.G.; Durán, N. Processing and characterizationof composites of poly (3-hydroxybutyrate-co-hydroxyvalerate) and lignin from sugar cane bagasse.J. Compos. Mater. 2012, 46, 417–425. [CrossRef]
49. Bhardwaj, R.; Mohanty, A.K.; Drzal, L.T.; Pourboghrat, F.; Misra, M. Renewable resource-based greencomposites from recycled cellulose fiber and poly(3-hydroxybutyrate-co-3-hydroxyvalerate) bioplastic.Biomacromolecules 2006, 7, 2044–2051. [CrossRef] [PubMed]
50. Lai, M.; Li, J.; Yang, J.; Liu, J.; Tong, X.; Cheng, H. The morphology and thermal properties of multi-walledcarbon nanotube and poly(hydroxybutyrate-co hydroxyvalerate) composite. Polym. Int. 2004, 53, 1479–1484.[CrossRef]
51. Avella, M.; La, R.G.; Martuscelli, E.; Raimo, M. Poly(3-hydroxybutyrate-co-3-hydroxyvalerate) and wheatstraw fibre composites: Thermal, mechanical properties and biodegradation behavior. J. Mater. Sci. 2000,35, 829–836. [CrossRef]
52. Hsu, S.F.; Wu, T.M.; Liao, C.S. Nonisothermal crystallization behavior and crystalline structure ofpoly(3-hydroxybutyrate)/layered double hydroxide nanocomposites. J. Polym. Sci. Part B: Polym. Phys. 2007,45, 995–1002. [CrossRef]

Nanomaterials 2018, 8, 940 20 of 20
53. Cretois, R.; Follain, N.; Dargent, E.; Soulestin, J.; Bourbigot, S.; Marais, S.; Lebrun, L. Microstructure andbarrier properties of PHBV/organoclays bionanocomposites. J. Membr. Sci. 2014, 467, 56–66. [CrossRef]
54. Sanchez-Garcia, M.D.; Gimenez, E.; Lagaron, J.M. Novel PET nanocomposites of interest in food packagingapplications and comparative barrier performance with biopolyester nanocomposites. J. Plast. Film Sheet.2007, 23, 133–148. [CrossRef]
55. Hassaini, L.; Kaci, M.; Touati, N.; Pillin, I.; Kervoelen, A.; Bruzaud, S. Valorization of olive husk flour as afiller for biocomposites based on poly (3-hydroxybutyrate-co-3-hydroxyvalerate): Effects of silane treatment.Polym. Test. 2017, 59, 430–440. [CrossRef]
56. Pokharel, P.; Bae, H.; Lim, J.; Yong, L.K.; Choi, S. Effects of titanate treatment on morphology and mechanicalproperties of graphene nanoplatelets/high density polyethylene nanocomposites. J. Appl. Polym. Sci. 2015,132, 42073–42085. [CrossRef]
57. Lu, Y.L.; Zhang, G.B.; Feng, M.; Zhang, Y.; Yang, M.S.; Shen, D.T. Hydrogen bonding in polyamide 66/claynanocomposite. J. Polym. Sci. Part B-Polym. Phys. 2003, 41, 2313–2321. [CrossRef]
58. Evans, J.R.G.; Chen, B. Poly(epsilon-caprolactone)-clay nanocomposites: Structure and mechanical properties.Macromolecules 2006, 39, 747–754.
59. Yu, W.; Lan, C.H.; Wang, S.J.; Fang, P.F.; Sun, Y.M. Influence of zinc oxide nanoparticles on thecrystallization behavior of electrospun poly(3-hydroxybutyrate-co-3-hydroxyvalerate) nanofibers. Polymer2010, 51, 2403–2409. [CrossRef]
60. Bhattacharya, M. Polymer Nanocomposites—A comparison between Carbon Nanotubes, Graphene andClay as Nanofillers. Materials 2016, 9, 262. [CrossRef] [PubMed]
61. Cadek, M.; Coleman, J.N.; Ryan, K.P.; Nicolosi, V.; Bister, G.; Fonseca, A.; Nagy, J.B.; Szostak, K.; Beguin, F.;Blau, W.J. Reinforcement of polymers with carbon nanotubes: The role of surface area. Nano Lett. 2004,4, 353–356. [CrossRef]
62. Carotenuto, G.; De Nicola, S.; Palomba, M.; Pullini, D.; Horsewell, A.; Hansen, T.W.; Nicolais, L. Mechanicalproperties of low-density polyethylene filled by graphite nanoplatelets. Nanotechnology 2012, 23, 48570–48713.[CrossRef] [PubMed]
63. Xiang, H.; Li, L.; Wang, S.; Wang, R.; Cheng, Y.; Zhou, Z.; Zhu, M. Natural polyphenol tannic acid reinforcedpoly(3-hydroxybutyrate-co-3-hydroxyvalerate) composite films with enhanced tensile strength and fracturetoughness. Polym. Compos. 2015, 36, 2303–2308. [CrossRef]
64. Dong, Y.; Bhattacharyya, D. A simple micromechanical approach to predict mechanical behaviourof polypropylene/organoclay nanocomposites based on representative volume element (RVE).Comput. Mater. Sci. 2010, 49, 1–8. [CrossRef]
65. Colemn, J.N.; Khan, U.; Blau, W.J.; Gun’ko, Y.K. Small but strong: A review of the mechanical properties ofcarbon nanotube–polymer composites. Carbon 2006, 44, 1624–1652. [CrossRef]
© 2018 by the authors. Licensee MDPI, Basel, Switzerland. This article is an open accessarticle distributed under the terms and conditions of the Creative Commons Attribution(CC BY) license (http://creativecommons.org/licenses/by/4.0/).