The distribution of chondrichthyans along the northern coast of Norway
14
The distribution of chondrichthyans along the northern coast of Norway Tom Williams, Kristin Helle, and Michaela Aschan Williams, T., Helle, K., and Aschan, M. 2008. The distribution of chondrichthyans along the northern coast of Norway. – ICES Journal of Marine Science, 65: 1161 – 1174. The relationship between temperature, latitude, and depth and the distribution and relative abundance of chondrichthyans along the northern coast of Norway was examined based on catches made in scientific trawls north of 628N from 1992 to 2005. It appears that Chimaera monstrosa, Etmopterus spinax, Squalus acanthias, and Galeus melastomus were more abundant in the south, and Amblyraja radiata more common in the north. Between 1992 and 2005, the distribution and relative abundance did not appear to change sig- nificantly, although average water temperatures rose during the period. Current fishing levels do not appear to be impacting the popu- lations of the more common species, but the status of species rarely found in the survey catches is unclear. Keywords: abundance, bottom trawl survey, Chondrichthyes, distribution, elasmobranchs, Norway, shark, skate. Received 4 February 2008; accepted 16 May 2008; advance access publication 27 June 2008. T. Williams and M. Aschan: Norwegian College of Fishery Science, University of Tromsø, Breivika, N-9037 Tromsø, Norway. K. Helle: Institute of Marine Research, N-5817 Bergen, Norway. Correspondence to M. Aschan: tel: þ47 776 46953; fax: þ47 776 46020; e-mail: michaela.aschan@ nfh.uit.no. Introduction There is increased awareness that stocks of chondrichthyans are particularly susceptible to overexploitation as either target or bycatch species. As large-bodied species with few natural predators when fully mature, they have not evolved strategies to withstand rapid changes in mortality (Stevens et al., 2000). To varying degrees, all these species are slow-growing, have a long lifespan and low fecundity, and attain sexual maturity at a late age (Holden, 1977; Walker and Heessen, 1996). Population growth is influenced by juvenile survivorship and age at maturity (Sosebee, 2005). Although theoretical mechanisms of density- dependence have been looked at, empirical evidence of chon- drichthyans (elasmobranchs) is limited and often confounded by methodological issues (Ellis et al., 2008). Their limited ability to compensate for being depleted has often been exemplified by the poor record of sustainability by fisheries that have targeted them (Stevens et al., 2000) and by elasmobranch stocks that have declined either unnoticed or unchecked. The reasons for these stock declines have been described by a number of authors (Bonfil, 1994; Dulvy et al., 2000; Stevens et al., 2000; ICES, 2006). Fisheries research has traditionally focused on the more com- mercially important teleost and shellfish species, and little research has been undertaken on chondrichthyans. Catch and landings data from commercial fisheries are often poor because of a general lack of species-specific recording (Johnston et al., 2005), and bycatch data only became more available recently. As a result, even the most basic data are unavailable for quantitative studies of the stock status of most chondrichthyans, including those in the Northeast Atlantic (ICES, 2006). The uncertainties in historical total landings and bycatch data attributable to the common prac- tice of recording catches generically, e.g. as “dogfish and hounds”, rather than by species, make fishery-independent data from surveys an important source for studying the distribution and rela- tive abundance of chondrichthyans. To varying degrees, research has been undertaken throughout much of the ICES Area (Walker and Hislop, 1998; Daan et al., 2005; Ellis et al., 2005a), and studies have been conducted along the coast of southwestern Norway (Skjæraasen and Bergstad, 2000, 2001), and northwards into the Barents Sea (Dolgov, 1997, 2006; Dolgov et al., 2004, 2005a). However, the chondrichthyan species along the northern coast of Norway have received little attention and are poorly understood. Norwegian fisheries targeted Greenland shark (Somniosus microcephalus) until 1960 and basking shark (Cetorhinus maximus) until 2006 (ICES, 2006). Other chondrichthyans have not been and are not currently targeted by commercial fisheries operating along the northern coast of Norway, but are taken as bycatch in the coastal fishery. The coastal fleet consists of vessels using a variety of gears, including gillnet, longline, trawl, Danish seine, handline, and pots. Gillnet and longline fisheries targeting demersal fish (e.g. cod, Gadus morhua, and haddock, Melanogrammus aeglefinus) generate the bulk of the chondrichth- yan bycatch (Table 1), and management strategies are in place to minimize the bycatch of undersized commercial species, though not relating directly to chondrichthyans (Nakken, 2003). The introduction of sorting grids (Nordmøre grid) in the shrimp fishery in 1992 reduced the bycatch significantly, and only juvenile chondrichthyans (generally ,25 cm) have been caught since (Reithe and Aschan, 2004). Climate may also play a part in determining the biogeographi- cal distribution of the group. Therefore, studies on the distribution and movement of elasmobranchs should examine environmental # 2008 International Council for the Exploration of the Sea. Published by Oxford Journals. All rights reserved. For Permissions, please email: [email protected] 1161 by guest on September 14, 2015 http://icesjms.oxfordjournals.org/ Downloaded from
Transcript of The distribution of chondrichthyans along the northern coast of Norway

The distribution of chondrichthyans along the northerncoast of Norway
Tom Williams, Kristin Helle, and Michaela Aschan
Williams, T., Helle, K., and Aschan, M. 2008. The distribution of chondrichthyans along the northern coast of Norway. – ICES Journal of MarineScience, 65: 1161–1174.
The relationship between temperature, latitude, and depth and the distribution and relative abundance of chondrichthyans along thenorthern coast of Norway was examined based on catches made in scientific trawls north of 628N from 1992 to 2005. It appears thatChimaera monstrosa, Etmopterus spinax, Squalus acanthias, and Galeus melastomus were more abundant in the south, and Amblyrajaradiata more common in the north. Between 1992 and 2005, the distribution and relative abundance did not appear to change sig-nificantly, although average water temperatures rose during the period. Current fishing levels do not appear to be impacting the popu-lations of the more common species, but the status of species rarely found in the survey catches is unclear.
Keywords: abundance, bottom trawl survey, Chondrichthyes, distribution, elasmobranchs, Norway, shark, skate.
Received 4 February 2008; accepted 16 May 2008; advance access publication 27 June 2008.
T. Williams and M. Aschan: Norwegian College of Fishery Science, University of Tromsø, Breivika, N-9037 Tromsø, Norway. K. Helle: Institute ofMarine Research, N-5817 Bergen, Norway. Correspondence to M. Aschan: tel: þ47 776 46953; fax: þ47 776 46020; e-mail: [email protected].
IntroductionThere is increased awareness that stocks of chondrichthyans areparticularly susceptible to overexploitation as either target orbycatch species. As large-bodied species with few natural predatorswhen fully mature, they have not evolved strategies to withstandrapid changes in mortality (Stevens et al., 2000). To varyingdegrees, all these species are slow-growing, have a long lifespanand low fecundity, and attain sexual maturity at a late age(Holden, 1977; Walker and Heessen, 1996). Population growthis influenced by juvenile survivorship and age at maturity(Sosebee, 2005). Although theoretical mechanisms of density-dependence have been looked at, empirical evidence of chon-drichthyans (elasmobranchs) is limited and often confounded bymethodological issues (Ellis et al., 2008). Their limited ability tocompensate for being depleted has often been exemplified by thepoor record of sustainability by fisheries that have targeted them(Stevens et al., 2000) and by elasmobranch stocks that havedeclined either unnoticed or unchecked. The reasons for thesestock declines have been described by a number of authors(Bonfil, 1994; Dulvy et al., 2000; Stevens et al., 2000; ICES, 2006).
Fisheries research has traditionally focused on the more com-mercially important teleost and shellfish species, and little researchhas been undertaken on chondrichthyans. Catch and landings datafrom commercial fisheries are often poor because of a general lackof species-specific recording (Johnston et al., 2005), and bycatchdata only became more available recently. As a result, even themost basic data are unavailable for quantitative studies ofthe stock status of most chondrichthyans, including those in theNortheast Atlantic (ICES, 2006). The uncertainties in historicaltotal landings and bycatch data attributable to the common prac-tice of recording catches generically, e.g. as “dogfish and hounds”,
rather than by species, make fishery-independent data fromsurveys an important source for studying the distribution and rela-tive abundance of chondrichthyans. To varying degrees, researchhas been undertaken throughout much of the ICES Area(Walker and Hislop, 1998; Daan et al., 2005; Ellis et al., 2005a),and studies have been conducted along the coast of southwesternNorway (Skjæraasen and Bergstad, 2000, 2001), and northwardsinto the Barents Sea (Dolgov, 1997, 2006; Dolgov et al., 2004,2005a). However, the chondrichthyan species along the northerncoast of Norway have received little attention and are poorlyunderstood.
Norwegian fisheries targeted Greenland shark (Somniosusmicrocephalus) until 1960 and basking shark (Cetorhinusmaximus) until 2006 (ICES, 2006). Other chondrichthyans havenot been and are not currently targeted by commercial fisheriesoperating along the northern coast of Norway, but are taken asbycatch in the coastal fishery. The coastal fleet consists of vesselsusing a variety of gears, including gillnet, longline, trawl, Danishseine, handline, and pots. Gillnet and longline fisheries targetingdemersal fish (e.g. cod, Gadus morhua, and haddock,Melanogrammus aeglefinus) generate the bulk of the chondrichth-yan bycatch (Table 1), and management strategies are in place tominimize the bycatch of undersized commercial species, thoughnot relating directly to chondrichthyans (Nakken, 2003). Theintroduction of sorting grids (Nordmøre grid) in the shrimpfishery in 1992 reduced the bycatch significantly, and only juvenilechondrichthyans (generally ,25 cm) have been caught since(Reithe and Aschan, 2004).
Climate may also play a part in determining the biogeographi-cal distribution of the group. Therefore, studies on the distributionand movement of elasmobranchs should examine environmental
# 2008 International Council for the Exploration of the Sea. Published by Oxford Journals. All rights reserved.For Permissions, please email: [email protected]
1161
by guest on September 14, 2015
http://icesjms.oxfordjournals.org/
Dow
nloaded from

parameters associated with the distribution of the various species(Pawson and Ellis, 2005). Dolgov et al. (2005a) suggested that thedistribution of various skate species in the Barents Sea appeared tobe related to sea temperature. Since the 1990s, there has been amarked increase in sea temperature, particularly in the southernpart of the coast of northern Norway (Pawson and Ellis, 2005).Many chondrichthyans found along this coast are close to theirgeographical limits, so changes in environmental conditions maybe expected to affect their local abundance.
The aim of this study is (i) to identify species present along thenorthern coast of Norway between 1992 and 2005, (ii) to describetheir distribution and abundance, (iii) to identify significantspatial or temporal differences between species, and (iv) to evalu-ate whether changes observed in distribution and abundance overtime are affected by sea temperature. Such information will, webelieve, help to resolve the issue of identifying appropriate stockunits for management.
Material and methodsThe study area consists of fjords and offshore banks along thenorthern coast of Norway from south of Alesund (628000N48500E) to the Russian border near Kirkenes (698500N 308500E;Figure 1). Fjords north of 688N are mainly shallower than300 m, though those to the south are generally deeper. Thecoastal banks outside the fjords range in depth from 50 to
400 m (Berg and Albert, 2003). Despite the high latitude, seatemperatures are generally warmer than in other northerncoastal areas because of the influence of the Norwegian Current,a branch of the Gulf Stream that flows northeast along the coast.As the current passes through higher latitudes, there is an overallreduction in sea temperature. Temperatures are not constant andfluctuate in short- and long-term intervals (Gyory et al., 2005),and average sea temperatures have increased over the pastcentury (Berstad et al., 2003).
Temperature dataDuring the period 1935–1947, several permanent hydrographicalsampling stations were established along the Norwegian coast bythe Institute of Marine Research (IMR, 2007). Temperature datafrom four stations, Bud (628560N 68470E), Eggum (688220N138380E), Ingøy (718080N 248010E), and Vardø (708450N318030E), were used in this study (Figure 1). Water temperatureand salinity were measured using CTD sensors deployed fromresearch vessels. Approximate bottom temperatures weremeasured as close to the seabed as the equipment would allow(generally within 10 m) and registered to an accuracy of 0.018C.Annual temperatures at each station were calculated as the meanof quarter-year values.
Survey dataThe survey data were from the annual combined trawl and acousticsurveys conducted each autumn by the Norwegian Institute ofFisheries and Aquaculture Research (Fiskeriforskning) from 1992to 2001 and by IMR during the period 2002–2005 (Table 2).The main aim of these coastal surveys was to investigate commer-cial species such as coastal cod, haddock, saithe (Pollachius virens),and juvenile herring (Clupea harengus).
At the start of the survey in 1992, the intended survey area wasdivided into three sections to determine the feasibility of thesurvey and to facilitate the development of a practical design.One section was intensely sampled each year, the northernsection in 1992, the central section in 1993, and the southernsection in 1994 (Table 2). Since 1995, the entire area has beensampled annually. The surveys then began at the northeasternlimit of the area, covered the Norwegian coast to 628N, andlasted �30 d (Figure 1). Sampling was evenly distributed alongthe coast, and included fjords and offshore areas near the coast(Figure 1). Sampling stations were not selected randomly,
Figure 1. Survey area and strata along the northern coast of Norway.Positions of permanent hydrographic stations are marked withcircles.
. . . . . . . . . . . . . . . . . . . . . . . . . . . . . . . . . . . . . . . . . . . . . . . . .. . . . . . . . . . . . . . . . . . . . . . . . . . . .. . . . . . . . . . . . . . . . . . . . . . . . .. . . . . . . . . . . . . . . . . . . . . . . . . . . .. . . . . . . . . . . . . . . . . . . . . . .. . . . . . . . . . . . . . . . . . . . . . . . . . . .. . . . . . . . . . . . . . . . . . . .. . . . . . . . . . . . . . . . . . . . . . . . . . . .. . . . . . . . . . . . . . . . . . . . . . .. . . . . . . . . .
. . . . . . . . . . . . . . . . . . . . . . . . . . . . . . . . . . . . . . . . . . . . . . . . .. . . . . . . . . . . . . . . . . . . . . . . . . . . .. . . . . . . . . . . . . . . . . . . . . . . . .. . . . . . . . . . . . . . . . . . . . . . . . . . . .. . . . . . . . . . . . . . . . . . . . . . .. . . . . . . . . . . . . . . . . . . . . . . . . . . .. . . . . . . . . . . . . . . . . . . .. . . . . . . . . . . . . . . . . . . . . . . . . . . .. . . . . . . . . . . . . . . . . . . . . . .. . . . . . . . . .
. . . . . . . . . . . . . . . . . . . . . . . . . . . . . . . . . . . . . . . . . . . . . . . . .. . . . . . . . . . . . . . . . . . . . . . . . . . . .. . . . . . . . . . . . . . . . . . . . . . . . .. . . . . . . . . . . . . . . . . . . . . . . . . . . .. . . . . . . . . . . . . . . . . . . . . . .. . . . . . . . . . . . . . . . . . . . . . . . . . . .. . . . . . . . . . . . . . . . . . . .. . . . . . . . . . . . . . . . . . . . . . . . . . . .. . . . . . . . . . . . . . . . . . . . . . .. . . . . . . . . .
. . . . . . . . . . . . . . . . . . . . . . . . . . . . . . . . . . . . . . . . . . . . . . . . .. . . . . . . . . . . . . . . . . . . . . . . . . . . .. . . . . . . . . . . . . . . . . . . . . . . . .. . . . . . . . . . . . . . . . . . . . . . . . . . . .. . . . . . . . . . . . . . . . . . . . . . .. . . . . . . . . . . . . . . . . . . . . . . . . . . .. . . . . . . . . . . . . . . . . . . .. . . . . . . . . . . . . . . . . . . . . . . . . . . .. . . . . . . . . . . . . . . . . . . . . . .. . . . . . . . . .
. . . . . . . . . . . . . . . . . . . . . . . . . . . . . . . . . . . . . . . . . . . . . . . . .. . . . . . . . . . . . . . . . . . . . . . . . . . . .. . . . . . . . . . . . . . . . . . . . . . . . .. . . . . . . . . . . . . . . . . . . . . . . . . . . .. . . . . . . . . . . . . . . . . . . . . . .. . . . . . . . . . . . . . . . . . . . . . . . . . . .. . . . . . . . . . . . . . . . . . . .. . . . . . . . . . . . . . . . . . . . . . . . . . . .. . . . . . . . . . . . . . . . . . . . . . .. . . . . . . . . .
. . . . . . . . . . . . . . . . . . . . . . . . . . . . . . . . . . . . . . . . . . . . . . . . .. . . . . . . . . . . . . . . . . . . . . . . . . . . .. . . . . . . . . . . . . . . . . . . . . . . . .. . . . . . . . . . . . . . . . . . . . . . . . . . . .. . . . . . . . . . . . . . . . . . . . . . .. . . . . . . . . . . . . . . . . . . . . . . . . . . .. . . . . . . . . . . . . . . . . . . .. . . . . . . . . . . . . . . . . . . . . . . . . . . .. . . . . . . . . . . . . . . . . . . . . . .. . . . . . . . . .
Table 1. Average bycatch (kg) and standard deviation (s.d.) by gear type, and the number of reported landings (n) of chondrichthyanspecies along the northern coast of Norway during the period 2000–2005, based on official landings data provided by the NorwegianDirectorate of Fisheries.
Taxon Gillnet Longline Other Total n
Average s.d. Average s.d. Average s.d. Average s.d.
Chimaera monstrosa 7 6 3 501 7 305 0 – 3 239 7 080 40
Lamna nasus 190 454 79 99 68 64 177 431 339
Squalus acanthias 6 020 15 626 1 383 3 751 1 845 452 2 735 9 998 1 188
Dogfish and hounds 20 12 952 2 001 13 9 485 1 444 14
Dipturus batis 212 337 73 97 19 22 143 273 121
Rajidae 656 946 468 1 181 272 461 465 946 1 441
Total 2 357 9 548 926 2 937 225 449 1 315 6 338 3 143
Some of the landings are reported in aggregated categories: “Dogfish and hounds” and “Rajidae”. Such records may contain landings of the main species andother species not identified when caught or delivered.
1162 T. Williams et al.
by guest on September 14, 2015
http://icesjms.oxfordjournals.org/
Dow
nloaded from

because the seabed in fjords and over the shelf is often too rough topermit trawling (Berg and Albert, 2003). The same stations wereapproximately fixed for each survey from 1995 to 2005, althoughpoor weather conditions or technical difficulties resulted insome stations occasionally being omitted. Catches were consideredreasonably representative of substrata suitable for trawling at30–700 m. The deepest average depth trawled was around 658N(Figure 2).
The sampling trawl was a Campelen 1800 shrimp trawl with a30-m headline, 19-m groundrope, 80–42-mm knot-to-knotstretched mesh in the body, and 20-mm standard mesh size inthe inner net (Table 2; Aschan and Sunnana, 1997). The gearhad 40-m bridles and rock-hopper groundgear, with eight steelspacers between 14 rubber discs. Sensors monitored trawl geo-metry, and strapping constrained the distance between doorsto �47 m while trawling (Aschan and Sunnana, 1997). At thisdoor spread, the silt plume was directed towards the trawlwings and considered to maximize the herding effect betweendoors and net.
Species identificationAll species were identified, counted, and weighed. In 14 of thetrawl samples taken between 1997 and 2004, all the skate species(Rajidae) were grouped and recorded generically, so these obser-vations were excluded from this study. Originally, the nameswere in Norwegian, according to the species list in the IMRquality control system (Mjanger et al., 2004), but the species listof 2004 included Latin names. These names have been monitoredand, where appropriate, updated to valid scientific names accord-ing to the Integrated Taxonomic Information System (ITIS, 2008).
The reliability of the results from this study depends on the speciesidentifications being accurate and consistent. Unfortunately, novoucher specimens were collected because the main target of thesurvey was the commercially important teleosts. Therefore, uncer-tainties in species identification were analysed during the 2006survey. Participating scientists were observed sorting and identifyingfish, then interviewed to understand better the limitations of theidentification procedures, especially for skates, which are a proble-matic taxonomic group (e.g. Raja montagui is sometimes confusedwith Raja brachyura, according to J. R. Ellis, pers. comm., andRaja clavata and Amblyraja radiata are often confused—Daan,2001). Because of the uncertainties involved in modifying theraw data, changes in identification (described by Williams, 2007)were limited to clear inconsistencies that were demonstratedbetween personnel shifts during some surveys. IndividualA. radiata may have been misidentified as R. clavata during the1990s, but R. clavata has rarely been taken, then mainly south of688N (W. Richardsen, pers. comm.). However, we cannot confirmthese recordings, so have excluded R. clavata from our analyses.
Abundance and distribution mappingThe estimated spatial distribution for a species was based on datafrom the entire survey period (1992–2005). Abundance wasexpressed as number of individuals km22 at each station.Abundance was estimated based on the area trawled at each
Figure 2. Average bottom depth with standard deviation of trawlstations taken in each area along the northern coast of Norwayduring the coastal surveys of 1992–2005.
. . . . . . . . . . . . . . . . . . . . . . . . . . . . . . . . . . . . . . . . . . . . . . . . . . . . . . . . . . . . . . . . . . . . . .. . . . . . . . . . . . . . . . . . . . . . . . . . . . . . . . . . . . . . .. . . . . . . . . . . . . . . . . . . . . . . . . . . . . . . . . . . . . . . . . . . . . . . . . . . . . . . . . . . . . . . . . . . .. . . . . . . . . . . . . . . . . . . . . . . . . . . . . . . . . . . . . .. . . . . . . . . . . . . . . . . . . . . . . . . . .. . . . . . . . . . . . . . . . . . .
. . . . . . . . . . . . . . . . . . . . . . . . . . . . . . . . . . . . . . . . . . . . . . . . . . . . . . . . . . . . . . . . . . . . . .. . . . . . . . . . . . . . . . . . . . . . . . . . . . . . . . . . . . . . .. . . . . . . . . . . . . . . . . . . . . . . . . . . . . . . . . . . . . . . . . . . . . . . . . . . . . . . . . . . . . . . . . . . .. . . . . . . . . . . . . . . . . . . . . . . . . . . . . . . . . . . . . .. . . . . . . . . . . . . . . . . . . . . . . . . . .. . . . . . . . . . . . . . . . . . .
. . . . . . . . . . . . . . . . . . . . . . . . . . . . . . . . . . . . . . . . . . . . . . . . . . . . . . . . . . . . . . . . . . . . . .. . . . . . . . . . . . . . . . . . . . . . . . . . . . . . . . . . . . . . .. . . . . . . . . . . . . . . . . . . . . . . . . . . . . . . . . . . . . . . . . . . . . . . . . . . . . . . . . . . . . . . . . . . .. . . . . . . . . . . . . . . . . . . . . . . . . . . . . . . . . . . . . .. . . . . . . . . . . . . . . . . . . . . . . . . . .. . . . . . . . . . . . . . . . . . .
. . . . . . . . . . . . . . . . . . . . . . . . . . . . . . . . . . . . . . . . . . . . . . . . . . . . . . . . . . . . . . . . . . . . . .. . . . . . . . . . . . . . . . . . . . . . . . . . . . . . . . . . . . . . .. . . . . . . . . . . . . . . . . . . . . . . . . . . . . . . . . . . . . . . . . . . . . . . . . . . . . . . . . . . . . . . . . . . .. . . . . . . . . . . . . . . . . . . . . . . . . . . . . . . . . . . . . .. . . . . . . . . . . . . . . . . . . . . . . . . . .. . . . . . . . . . . . . . . . . . .
. . . . . . . . . . . . . . . . . . . . . . . . . . . . . . . . . . . . . . . . . . . . . . . . . . . . . . . . . . . . . . . . . . . . . .. . . . . . . . . . . . . . . . . . . . . . . . . . . . . . . . . . . . . . .. . . . . . . . . . . . . . . . . . . . . . . . . . . . . . . . . . . . . . . . . . . . . . . . . . . . . . . . . . . . . . . . . . . .. . . . . . . . . . . . . . . . . . . . . . . . . . . . . . . . . . . . . .. . . . . . . . . . . . . . . . . . . . . . . . . . .. . . . . . . . . . . . . . . . . . .
. . . . . . . . . . . . . . . . . . . . . . . . . . . . . . . . . . . . . . . . . . . . . . . . . . . . . . . . . . . . . . . . . . . . . .. . . . . . . . . . . . . . . . . . . . . . . . . . . . . . . . . . . . . . .. . . . . . . . . . . . . . . . . . . . . . . . . . . . . . . . . . . . . . . . . . . . . . . . . . . . . . . . . . . . . . . . . . . .. . . . . . . . . . . . . . . . . . . . . . . . . . . . . . . . . . . . . .. . . . . . . . . . . . . . . . . . . . . . . . . . .. . . . . . . . . . . . . . . . . . .
. . . . . . . . . . . . . . . . . . . . . . . . . . . . . . . . . . . . . . . . . . . . . . . . . . . . . . . . . . . . . . . . . . . . . .. . . . . . . . . . . . . . . . . . . . . . . . . . . . . . . . . . . . . . .. . . . . . . . . . . . . . . . . . . . . . . . . . . . . . . . . . . . . . . . . . . . . . . . . . . . . . . . . . . . . . . . . . . .. . . . . . . . . . . . . . . . . . . . . . . . . . . . . . . . . . . . . .. . . . . . . . . . . . . . . . . . . . . . . . . . .. . . . . . . . . . . . . . . . . . .
. . . . . . . . . . . . . . . . . . . . . . . . . . . . . . . . . . . . . . . . . . . . . . . . . . . . . . . . . . . . . . . . . . . . . .. . . . . . . . . . . . . . . . . . . . . . . . . . . . . . . . . . . . . . .. . . . . . . . . . . . . . . . . . . . . . . . . . . . . . . . . . . . . . . . . . . . . . . . . . . . . . . . . . . . . . . . . . . .. . . . . . . . . . . . . . . . . . . . . . . . . . . . . . . . . . . . . .. . . . . . . . . . . . . . . . . . . . . . . . . . .. . . . . . . . . . . . . . . . . . .
. . . . . . . . . . . . . . . . . . . . . . . . . . . . . . . . . . . . . . . . . . . . . . . . . . . . . . . . . . . . . . . . . . . . . .. . . . . . . . . . . . . . . . . . . . . . . . . . . . . . . . . . . . . . .. . . . . . . . . . . . . . . . . . . . . . . . . . . . . . . . . . . . . . . . . . . . . . . . . . . . . . . . . . . . . . . . . . . .. . . . . . . . . . . . . . . . . . . . . . . . . . . . . . . . . . . . . .. . . . . . . . . . . . . . . . . . . . . . . . . . .. . . . . . . . . . . . . . . . . . .
. . . . . . . . . . . . . . . . . . . . . . . . . . . . . . . . . . . . . . . . . . . . . . . . . . . . . . . . . . . . . . . . . . . . . .. . . . . . . . . . . . . . . . . . . . . . . . . . . . . . . . . . . . . . .. . . . . . . . . . . . . . . . . . . . . . . . . . . . . . . . . . . . . . . . . . . . . . . . . . . . . . . . . . . . . . . . . . . .. . . . . . . . . . . . . . . . . . . . . . . . . . . . . . . . . . . . . .. . . . . . . . . . . . . . . . . . . . . . . . . . .. . . . . . . . . . . . . . . . . . .
. . . . . . . . . . . . . . . . . . . . . . . . . . . . . . . . . . . . . . . . . . . . . . . . . . . . . . . . . . . . . . . . . . . . . .. . . . . . . . . . . . . . . . . . . . . . . . . . . . . . . . . . . . . . .. . . . . . . . . . . . . . . . . . . . . . . . . . . . . . . . . . . . . . . . . . . . . . . . . . . . . . . . . . . . . . . . . . . .. . . . . . . . . . . . . . . . . . . . . . . . . . . . . . . . . . . . . .. . . . . . . . . . . . . . . . . . . . . . . . . . .. . . . . . . . . . . . . . . . . . .
. . . . . . . . . . . . . . . . . . . . . . . . . . . . . . . . . . . . . . . . . . . . . . . . . . . . . . . . . . . . . . . . . . . . . .. . . . . . . . . . . . . . . . . . . . . . . . . . . . . . . . . . . . . . .. . . . . . . . . . . . . . . . . . . . . . . . . . . . . . . . . . . . . . . . . . . . . . . . . . . . . . . . . . . . . . . . . . . .. . . . . . . . . . . . . . . . . . . . . . . . . . . . . . . . . . . . . .. . . . . . . . . . . . . . . . . . . . . . . . . . .. . . . . . . . . . . . . . . . . . .
. . . . . . . . . . . . . . . . . . . . . . . . . . . . . . . . . . . . . . . . . . . . . . . . . . . . . . . . . . . . . . . . . . . . . .. . . . . . . . . . . . . . . . . . . . . . . . . . . . . . . . . . . . . . .. . . . . . . . . . . . . . . . . . . . . . . . . . . . . . . . . . . . . . . . . . . . . . . . . . . . . . . . . . . . . . . . . . . .. . . . . . . . . . . . . . . . . . . . . . . . . . . . . . . . . . . . . .. . . . . . . . . . . . . . . . . . . . . . . . . . .. . . . . . . . . . . . . . . . . . .
. . . . . . . . . . . . . . . . . . . . . . . . . . . . . . . . . . . . . . . . . . . . . . . . . . . . . . . . . . . . . . . . . . . . . .. . . . . . . . . . . . . . . . . . . . . . . . . . . . . . . . . . . . . . .. . . . . . . . . . . . . . . . . . . . . . . . . . . . . . . . . . . . . . . . . . . . . . . . . . . . . . . . . . . . . . . . . . . .. . . . . . . . . . . . . . . . . . . . . . . . . . . . . . . . . . . . . .. . . . . . . . . . . . . . . . . . . . . . . . . . .. . . . . . . . . . . . . . . . . . .
. . . . . . . . . . . . . . . . . . . . . . . . . . . . . . . . . . . . . . . . . . . . . . . . . . . . . . . . . . . . . . . . . . . . . .. . . . . . . . . . . . . . . . . . . . . . . . . . . . . . . . . . . . . . .. . . . . . . . . . . . . . . . . . . . . . . . . . . . . . . . . . . . . . . . . . . . . . . . . . . . . . . . . . . . . . . . . . . .. . . . . . . . . . . . . . . . . . . . . . . . . . . . . . . . . . . . . .. . . . . . . . . . . . . . . . . . . . . . . . . . .. . . . . . . . . . . . . . . . . . .
. . . . . . . . . . . . . . . . . . . . . . . . . . . . . . . . . . . . . . . . . . . . . . . . . . . . . . . . . . . . . . . . . . . . . .. . . . . . . . . . . . . . . . . . . . . . . . . . . . . . . . . . . . . . .. . . . . . . . . . . . . . . . . . . . . . . . . . . . . . . . . . . . . . . . . . . . . . . . . . . . . . . . . . . . . . . . . . . .. . . . . . . . . . . . . . . . . . . . . . . . . . . . . . . . . . . . . .. . . . . . . . . . . . . . . . . . . . . . . . . . .. . . . . . . . . . . . . . . . . . .
Table 2. Survey period, vessel, statistical areas (Directorate of Fisheries), trawl gear specifications, and number of stations for each coastalsurvey conducted along the Norwegian coast from 62 to 708N during the period 1992–2005.
Survey period Vessel Statisticalareas
Inner net meshsize (mm)
Strapping Numberof stations
25 August to 3 October 1992 RV “Johan Ruud” 03, 04, and northern sector of 05 20 Yes 127
1 August to 8 September 1993 RV “Mikael Sars” 05 and eastern limit of 37 20 Yes 163
22 September to 19 October 1994 RV “Mikael Sars” 06, 07, and eastern limit of 37 35 No 106
13 September to 11 October 1995 RV “Mikael Sars” 00, 03, 04, 05, 06, and 07 35 No 129
11 September to 6 October 1996 RV “Mikael Sars” As above 35 No 130
20 August to 23 September 1997 RV “Mikael Sars” As above 20 For most 159
26 October to 19 November 1998 RV “Jan Mayen” As above 20 Yes 132
22 October to 19 November 1999 RV “Jan Mayen” As above 20 Yes 154
23 October to 16 November 2000 RV “Jan Mayen” As above 20 Yes 154
23 October to 17 November 2001 RV “Jan Mayen” As above 20 Yes 125
29 October to 26 November 2002 RV “Jan Mayen” As above 20 Yes 168
11 October to 14 November 2003 RV “Jan Mayen” As above 20 For most 133
RV “Johan Hjort”
13 October to 9 November 2004 RV “Jan Mayen” As above 20 For most 128
RV “Johan Hjort”
11 October to 8 November 2005 RV “Jan Mayen” As above 20 For most 124
RV “Johan Hjort”
Distribution of chondrichthyans along the northern coast of Norway 1163
by guest on September 14, 2015
http://icesjms.oxfordjournals.org/
Dow
nloaded from

station using the method of Jakobsen et al. (1997):
rs ¼fs
as; ð1Þ
where rs denotes the abundance in number of fish km22 at samplestation s, fs the number captured (frequency) at sample station s,and as the area swept (km2) at sample station s (nautical milestrawled � 1.852 � 0.047 km).
The door spread of 47 m was assumed to be the upper limit ofthe mean effective catching width of the gear. A more precise esti-mate of catch efficiency was beyond the scope of this study.
The annual mean catch (number km22) was used to comparespecies abundance. Species with an annual mean catch .5animals km22 were grouped as common species, and includedfor further statistical analysis. Species with lower catch rates wereeither grouped as infrequent, if previously recorded in thesurvey area, or rare if not recorded previously.
Pethon (2005) and FishBase (Froese and Pauly, 2007) give pre-viously estimated distributions. The two sources were generallyconsistent, although they differed for Dipturus batis, Leucorajafullonica, Dipturus linteus, Bathyraja spinicauda, and Galeusmelastomus. All five of these species are described by Pethon(2005) as having a more northerly distribution than given inFishBase (Froese and Pauly, 2007). In our opinion, the species dis-tributions of Pethon (2005), which are updated based on recentdata, were more accurate than those in FishBase, so were takenas the standard distributions for the present study.
Statistical analysisFor seven common species, the relative abundance (number km22)in each trawl sample was used to assess the statistical significance oftemporal and spatial variation in abundance. Year, depth, and areawere the independent variables. The survey area was divided intoseven subareas by degree latitude from 62 to 698N, and a northernregion (from 69 to 718N) was divided into two subareas east andwest of 258E (Figure 1). Samples were identified by 50-m depthinterval, encompassing the depth range covered by the survey.Average abundance for each species was calculated, and differencesin abundance were tested against the three variables, depth, latitude,and year, using one-way single factor ANOVA. The significance levelwas set at p = 0.05.
A constrained (canonical) correspondence analysis (CCA) wasrun in R 2.5.0 (R Development Core Team, 2007) using thevegan package (Oksanen, 2007). As the species data containedmany zeros, they were analysed using unimodal methods (terBraak and Verdonschot, 1995). The ten most common specieswere included in the analysis, and their abundance estimateswere log(x + 1) transformed. Potential explanatory variables werelongitude, latitude, depth, and year of sampling. Shifts in abun-dance of each species were shown as percentages of deviationfrom the average abundance within the total survey area andpresented with respect to the strongest explanatory variable.
Correlations were tested for all species with distributionssignificantly correlated with latitude. The locations of the fourtemperature stations determined the areas 638N, 688N, West(69–718N), and East (69–718N; Figure 1) used for assessing cor-relations between abundance and temperature. Spearman’srank-order correlation (r) was used to test whether latitudinalor annual differences in temperature significantly influenced thedistribution of nine common species.
ResultsAbundance and distributionDuring the survey period 1992–2005, 18 species of Chondrichthyeswere recorded at 1932 stations (Table 3). The most diverse ordersobserved were skates (Rajiformes, 13 species) and dogfish sharks(Squaliformes, 3 species). In contrast, only one species of catshark(Scyliorhinidae) and rabbitfish (Holocephali) was identified in thesamples. Six species were observed across the entire latitudinalrange (62–718N), and many species seemed to have a boundary inthe north (Figures 3 and 4). Mean annual catch rates and frequencyof occurrence for each species reveal that Chimaera monstrosa,
. . . . . . . . . . . . . . . . . . . . . . . . . . . . . . . . . . . . . . . . .. . . . . . . . . . . . . . . . . . . . . . . . . . . . .. . . . . . . . . . . . . . . . . . . . . . . . . . . .. . . . . . . . . . . . . . . . . . . . . . . . . . . . .
. . . . . . . . . . . . . . . . . . . . . . . . . . . . . . . . . . . . . . . . .. . . . . . . . . . . . . . . . . . . . . . . . . . . . .. . . . . . . . . . . . . . . . . . . . . . . . . . . .. . . . . . . . . . . . . . . . . . . . . . . . . . . . .
. . . . . . . . . . . . . . . . . . . . . . . . . . . . . . . . . . . . . . . . .. . . . . . . . . . . . . . . . . . . . . . . . . . . . .. . . . . . . . . . . . . . . . . . . . . . . . . . . .. . . . . . . . . . . . . . . . . . . . . . . . . . . . .
. . . . . . . . . . . . . . . . . . . . . . . . . . . . . . . . . . . . . . . . .. . . . . . . . . . . . . . . . . . . . . . . . . . . . .. . . . . . . . . . . . . . . . . . . . . . . . . . . .. . . . . . . . . . . . . . . . . . . . . . . . . . . . .
. . . . . . . . . . . . . . . . . . . . . . . . . . . . . . . . . . . . . . . . .. . . . . . . . . . . . . . . . . . . . . . . . . . . . .. . . . . . . . . . . . . . . . . . . . . . . . . . . .. . . . . . . . . . . . . . . . . . . . . . . . . . . . .
. . . . . . . . . . . . . . . . . . . . . . . . . . . . . . . . . . . . . . . . .. . . . . . . . . . . . . . . . . . . . . . . . . . . . .. . . . . . . . . . . . . . . . . . . . . . . . . . . .. . . . . . . . . . . . . . . . . . . . . . . . . . . . .
. . . . . . . . . . . . . . . . . . . . . . . . . . . . . . . . . . . . . . . . .. . . . . . . . . . . . . . . . . . . . . . . . . . . . .. . . . . . . . . . . . . . . . . . . . . . . . . . . .. . . . . . . . . . . . . . . . . . . . . . . . . . . . .
. . . . . . . . . . . . . . . . . . . . . . . . . . . . . . . . . . . . . . . . .. . . . . . . . . . . . . . . . . . . . . . . . . . . . .. . . . . . . . . . . . . . . . . . . . . . . . . . . .. . . . . . . . . . . . . . . . . . . . . . . . . . . . .
. . . . . . . . . . . . . . . . . . . . . . . . . . . . . . . . . . . . . . . . .. . . . . . . . . . . . . . . . . . . . . . . . . . . . .. . . . . . . . . . . . . . . . . . . . . . . . . . . .. . . . . . . . . . . . . . . . . . . . . . . . . . . . .
. . . . . . . . . . . . . . . . . . . . . . . . . . . . . . . . . . . . . . . . .. . . . . . . . . . . . . . . . . . . . . . . . . . . . .. . . . . . . . . . . . . . . . . . . . . . . . . . . .. . . . . . . . . . . . . . . . . . . . . . . . . . . . .
. . . . . . . . . . . . . . . . . . . . . . . . . . . . . . . . . . . . . . . . .. . . . . . . . . . . . . . . . . . . . . . . . . . . . .. . . . . . . . . . . . . . . . . . . . . . . . . . . .. . . . . . . . . . . . . . . . . . . . . . . . . . . . .
. . . . . . . . . . . . . . . . . . . . . . . . . . . . . . . . . . . . . . . . .. . . . . . . . . . . . . . . . . . . . . . . . . . . . .. . . . . . . . . . . . . . . . . . . . . . . . . . . .. . . . . . . . . . . . . . . . . . . . . . . . . . . . .
. . . . . . . . . . . . . . . . . . . . . . . . . . . . . . . . . . . . . . . . .. . . . . . . . . . . . . . . . . . . . . . . . . . . . .. . . . . . . . . . . . . . . . . . . . . . . . . . . .. . . . . . . . . . . . . . . . . . . . . . . . . . . . .
. . . . . . . . . . . . . . . . . . . . . . . . . . . . . . . . . . . . . . . . .. . . . . . . . . . . . . . . . . . . . . . . . . . . . .. . . . . . . . . . . . . . . . . . . . . . . . . . . .. . . . . . . . . . . . . . . . . . . . . . . . . . . . .
. . . . . . . . . . . . . . . . . . . . . . . . . . . . . . . . . . . . . . . . .. . . . . . . . . . . . . . . . . . . . . . . . . . . . .. . . . . . . . . . . . . . . . . . . . . . . . . . . .. . . . . . . . . . . . . . . . . . . . . . . . . . . . .
. . . . . . . . . . . . . . . . . . . . . . . . . . . . . . . . . . . . . . . . .. . . . . . . . . . . . . . . . . . . . . . . . . . . . .. . . . . . . . . . . . . . . . . . . . . . . . . . . .. . . . . . . . . . . . . . . . . . . . . . . . . . . . .
. . . . . . . . . . . . . . . . . . . . . . . . . . . . . . . . . . . . . . . . .. . . . . . . . . . . . . . . . . . . . . . . . . . . . .. . . . . . . . . . . . . . . . . . . . . . . . . . . .. . . . . . . . . . . . . . . . . . . . . . . . . . . . .
Table 3. Chondrichthyan species identified along the northernNorwegian coast during the coastal surveys of 1992–2005.
Scientific name Family Commonname
Norwegian RedList*
Chimaera monstrosaLinnaeus, 1758
Chimaeridae Rabbitfish No
Etmopterus spinax(Linnaeus, 1758)
Dalatiidae Velvet belly No
Somniosusmicrocephalus(Bloch andSchneider, 1801)
Dalatiidae Greenlandshark
Near-threatened
Galeus melastomusRafinesque, 1810
Scyliorhinidae Blackmouthcatshark
No
Squalus acanthiasLinnaeus, 1758
Squalidae Spurdog Criticallyendangered
Amblyrajahyperborea(Collett, 1879)
Rajidae Arctic skate Data-deficient
Amblyraja radiata(Donovan, 1808)
Rajidae Thorny skate No
Bathyrajaspinicauda (Jensen,1914)
Rajidae Spinetail ray Data-deficient
Dipturus batis(Linnaeus, 1758)
Rajidae Blue skate Data-deficient
Dipturus linteus(Fries,1838)
Rajidae Sailray Data-deficient
Dipturusnidarosiensis(Storm, 1881)
Rajidae Norwegianskate
Data-deficient
Dipturus oxyrinchus(Linnaeus, 1758)
Rajidae Longnosedskate
Data-deficient
Leucoraja circularis(Couch, 1838)
Rajidae Sandy ray No
Leucoraja fullonica(Linnaeus, 1758)
Rajidae Shagreen ray Data-deficient
Raja brachyuraLafont, 1873
Rajidae Blonde ray No
Raja clavataLinnaeus, 1758
Rajidae Thornbackray
No
Raja montaguiFowler, 1910
Rajidae Spotted ray Data-deficient
Rajella fyllae(Lutken, 1887)
Rajidae Round skate No
*Species entry in the 2006 Norwegian Red List—Artsdatabanken NorwegianBiodiversity Information Centre.
1164 T. Williams et al.
by guest on September 14, 2015
http://icesjms.oxfordjournals.org/
Dow
nloaded from

Etmopterus spinax, G. melastomus, A. radiata, Squalus acanthias, andDipturus oxyrinchus were the main species (Table 4). For manyspecies, abundance sometimes varied greatly between years, butthere were no obvious negative or positive trends, indicating norecent changes in abundance of the more common species(Figure 5). One exception was Rajella fyllae, which exhibited anincreasing trend in the data. Annual changes in abundance were
only significant (p , 0.05) for A. radiata (Table 5), which increasedsignificantly between 2002 and 2003, decreased by the same extentbetween 2004 and 2005, but had no apparent long-term trend(Figure 5). Latitude was a significant factor (ANOVA, p , 0.05)affecting the abundance of all common species (Table 6).
Chimaera monstrosa and E. spinax (Figures 3a and b) wereobserved in all areas except in the far northeast (East 69–708N).
Figure 3. Distribution and abundance of (a) Chimaera monstrosa, (b) Etmopterus spinax, (c) Galeus melastomus, (d) Amblyraja radiata, (e)Squalus acanthias, (f) Dipturus oxyrinchus, (g) Rajella fyllae, and (h) Dipturus batis along the northern coast of Norway from the coastal surveysof 1992–2005. Note that the abundance scales differ between panels. The shaded area is the distribution according to Pethon (2005).
Distribution of chondrichthyans along the northern coast of Norway 1165
by guest on September 14, 2015
http://icesjms.oxfordjournals.org/
Dow
nloaded from
Abundance was greatest in the south, where catch rates wereoccasionally .2000 fish per haul, suggesting an aggregating beha-viour by the two species. Distributions of G. melastomus,S. acanthias, and D. oxyrinchus (Figures 3c, e, and f) appeared tobe constrained to areas south of 688N, with most catches south of658N. Catches of G. melastomus of .200 animals in each of10 hauls highlights the aggregating nature of this species.Amblyraja radiata was the dominant skate species and was caughtthroughout the survey area, but in greater abundance in thenorth. The distribution of R. fyllae was similar (Figures 3d and g).
Abundance appeared to be greatest for C. monstrosa at 450–550 m, for G. melastomus deeper than 150 m, for A. radiata at600–650 m, and for R. fyllae and D. batis shallower than 500 m(Table 4; Figure 6). However, differences in depth-dependentabundance were only statistically significant for G. melastomus(Table 7), with greatest abundance in the 500-m interval.The three other common species were more evenly distributedwith respect to depth (Figure 6).
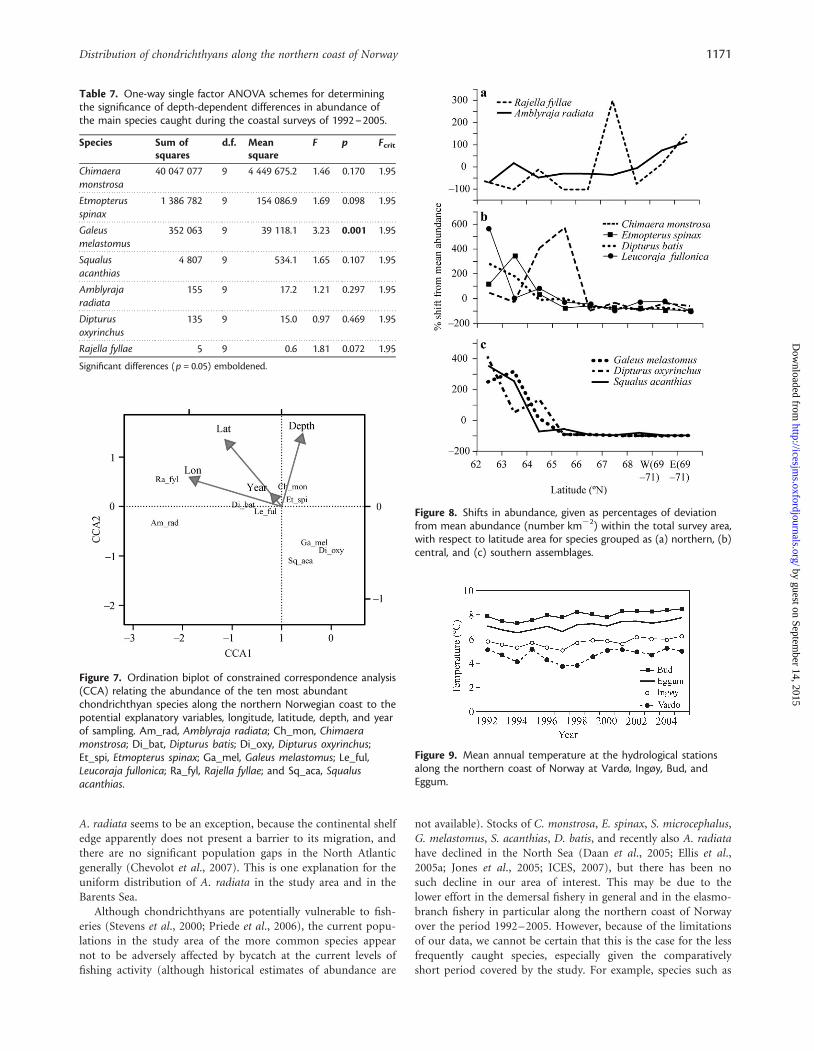
The constrained correspondence biplot shows the speciesscores that may be taken as the optimal location for nine speciesin the environment field spanned by the site scores (Figure 7).The constrained axis CCA1 (eigenvalue 0.457, 88%) has a muchlarger explanatory value than CCA2 (eigenvalue 0.049, 9%).Latitude seemed to structure the chondrichthyan assemblageinto three groups (Figure 7), a northern component consistingof A. radiata and R. fyllae, a central component with C. monstrosa,D. batis, E. spinax, and L. fullonica, and a southern componentconsisting of D. oxyrinchus, G. melastomus, and S. acanthias.Relative abundance along the latitude shows the same patternfor species of each group (Figure 8). Depth and year were oflittle importance in defining species distribution (Figure 7).
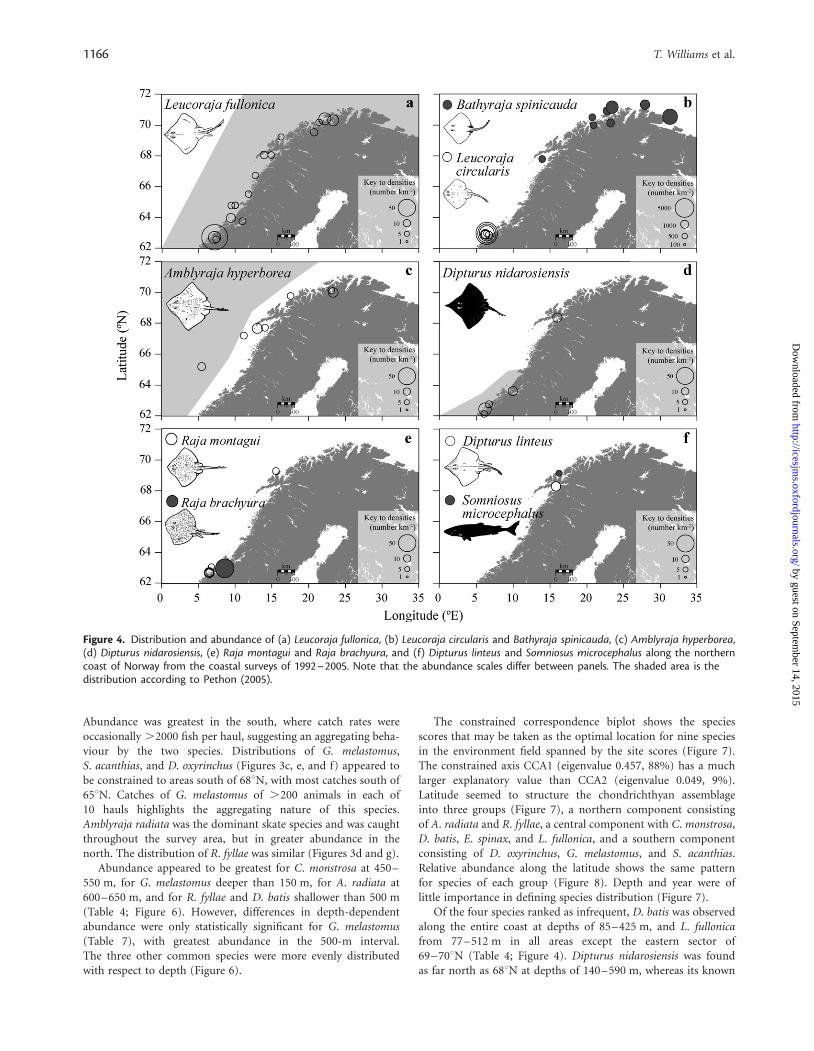
Of the four species ranked as infrequent, D. batis was observedalong the entire coast at depths of 85–425 m, and L. fullonicafrom 77–512 m in all areas except the eastern sector of69–708N (Table 4; Figure 4). Dipturus nidarosiensis was foundas far north as 688N at depths of 140–590 m, whereas its known
Figure 4. Distribution and abundance of (a) Leucoraja fullonica, (b) Leucoraja circularis and Bathyraja spinicauda, (c) Amblyraja hyperborea,(d) Dipturus nidarosiensis, (e) Raja montagui and Raja brachyura, and (f) Dipturus linteus and Somniosus microcephalus along the northerncoast of Norway from the coastal surveys of 1992–2005. Note that the abundance scales differ between panels. The shaded area is thedistribution according to Pethon (2005).
1166 T. Williams et al.
by guest on September 14, 2015
http://icesjms.oxfordjournals.org/
Dow
nloaded from

distribution was primarily south of 658N (Pethon, 2005). A singleS. microcephalus was caught 480 m deep at 698100N 168190E in1993.
From 1992 to 2005, six rare species were reported, extendingthe distributions given by Pethon (2005). Raja brachyura, R. mon-tagui, and Leucoraja circularis were all caught south of 648N, but athigher latitudes than previously documented (Pethon, 2005). Ofthese three, L. circularis was caught most frequently and in greatestnumber, 23 animals in six trawls. The depths of capture forL. circularis were 88–244 m, and for R. montagui 63–120 m, andfour R. brachyura were caught at 99 m. Totals of 11 B. spinicaudaand nine Amblyraja hyperborea were caught in trawls north of678N at depth ranges of 48–410 m and 125–620 m, respectively,and one D. linteus was caught at 588 m off Lofoten at 688N.
Abundance and temperatureExcept the eastern sector at 69–718N, all areas appeared to showan overall increase in sea temperature between 1992 and 2005(Figure 9). Except R. fyllae, the abundance of chondrichthyansshowed no obvious trend during the study period (Figure 5).Therefore, the Spearman rank analysis showed no significant cor-relations between annual sea temperature and abundance for eachspecies in the areas 638N, 688N, 69–718N (West), and 69–718N(East). Bottom temperature decreased in a northward directionalong the coast. Latitudinal shifts in abundance for C. monstrosa,E. spinax, G. melastomus, and S. acanthias showed positivecorrelations (r . 0.9) with bottom temperature, whereasA. radiata abundance showed a negative correlation (r . 20.9)with temperature.
DiscussionSurvey data uncertaintyThe surveys were designed primarily to assess the commerciallyimportant teleosts, so chondrichthyans were not taken intoaccount in the design. Consequently, it is uncertain how accuratelythe catch rates reflect the relative abundance of the various species
(Kotwicki and Weinberg, 2005). As trawl catchability varies withbottom type and species, there is little information available forestimating absolute stock size (Bonfil, 1994; Abella and Serena,2005; Daan et al., 2005; Dolgov et al., 2005a). Moreover, speciesthat favour hard rocky substrata (e.g. D. batis) are likely to beunderrepresented because most trawling was conducted onseabed that could be trawled, i.e. was fairly smooth.
Species identification issues are important, although this wascorrected where possible (Williams, 2007). Misidentification ofskates is common (Daan, 2001), and except the more visuallydistinct species such as D. nidarosiensis, there is still concernregarding the validity of the skate identifications. The main uncer-tainty in our results is the soundness of the estimated distributionof the infrequent and rare species such as R. clavata (which wasexcluded from the analyses). For the common species, the dataare considered to be valid for describing their relative abundanceand distribution.
An update on chondrichthyan distributionsThe porbeagle (Lamna nasus), which is recorded as a bycatchin the area (Table 1), was not caught at all during the coastalsurveys, because the species is rarely taken by trawl (Daan et al.,2005). Basking sharks (C. maximus) are caught as a bycatch ingillnet fisheries, but were not in our survey data.
From 1992 to 2005, the distribution and abundance ofthe common species appeared to remain stable (Figure 5).Latitudinal trends in distribution correlated well with previousdistributions given by Pethon (2005). Shark species and C. mon-strosa were clearly more abundant south of 658N. Chimaeramonstrosa and E. spinax appeared to be the most abundantspecies, including north of 708N (Figure 3). Chimaera monstrosahas recently also been observed in the southern Barents Sea(Dolgov, 2006; Byrkjedal and Høines, 2007). Amblyraja radiatais uniformly and widely distributed, and was the dominantskate, followed by R. fyllae. The dominance of these twospecies agrees with studies undertaken in the neighbouring
. . . . . . . . . . . . . . . . . . . . . . . . . . . . . . . . . . . . . . . . . . . . . . . . . . . . . . .. . . . . . . . . . . . . . . . . . . . . . . . . . . . . . . . . . . . . . . . .. . . . . . . . . . . . . . . . . . . . . . . .. . . . . . . . . . . . . . . . . . . . . . . . . . . . . . . . . . . . . . . . . . . . . . . . . . . . . .. . . . . . . . . . . . . . . . . . . . . . . . . . . . . . . . .. . . . . . . . . . . . . . . . . . . . . . . . . . . . . . . . . . . .. . . . . . . . . . . . . . . . . . . .
. . . . . . . . . . . . . . . . . . . . . . . . . . . . . . . . . . . . . . . . . . . . . . . . . . . . . . .. . . . . . . . . . . . . . . . . . . . . . . . . . . . . . . . . . . . . . . . .. . . . . . . . . . . . . . . . . . . . . . . .. . . . . . . . . . . . . . . . . . . . . . . . . . . . . . . . . . . . . . . . . . . . . . . . . . . . . .. . . . . . . . . . . . . . . . . . . . . . . . . . . . . . . . .. . . . . . . . . . . . . . . . . . . . . . . . . . . . . . . . . . . .. . . . . . . . . . . . . . . . . . . .
. . . . . . . . . . . . . . . . . . . . . . . . . . . . . . . . . . . . . . . . . . . . . . . . . . . . . . .. . . . . . . . . . . . . . . . . . . . . . . . . . . . . . . . . . . . . . . . .. . . . . . . . . . . . . . . . . . . . . . . .. . . . . . . . . . . . . . . . . . . . . . . . . . . . . . . . . . . . . . . . . . . . . . . . . . . . . .. . . . . . . . . . . . . . . . . . . . . . . . . . . . . . . . .. . . . . . . . . . . . . . . . . . . . . . . . . . . . . . . . . . . .. . . . . . . . . . . . . . . . . . . .
. . . . . . . . . . . . . . . . . . . . . . . . . . . . . . . . . . . . . . . . . . . . . . . . . . . . . . .. . . . . . . . . . . . . . . . . . . . . . . . . . . . . . . . . . . . . . . . .. . . . . . . . . . . . . . . . . . . . . . . .. . . . . . . . . . . . . . . . . . . . . . . . . . . . . . . . . . . . . . . . . . . . . . . . . . . . . .. . . . . . . . . . . . . . . . . . . . . . . . . . . . . . . . .. . . . . . . . . . . . . . . . . . . . . . . . . . . . . . . . . . . .. . . . . . . . . . . . . . . . . . . .
. . . . . . . . . . . . . . . . . . . . . . . . . . . . . . . . . . . . . . . . . . . . . . . . . . . . . . .. . . . . . . . . . . . . . . . . . . . . . . . . . . . . . . . . . . . . . . . .. . . . . . . . . . . . . . . . . . . . . . . .. . . . . . . . . . . . . . . . . . . . . . . . . . . . . . . . . . . . . . . . . . . . . . . . . . . . . .. . . . . . . . . . . . . . . . . . . . . . . . . . . . . . . . .. . . . . . . . . . . . . . . . . . . . . . . . . . . . . . . . . . . .. . . . . . . . . . . . . . . . . . . .
. . . . . . . . . . . . . . . . . . . . . . . . . . . . . . . . . . . . . . . . . . . . . . . . . . . . . . .. . . . . . . . . . . . . . . . . . . . . . . . . . . . . . . . . . . . . . . . .. . . . . . . . . . . . . . . . . . . . . . . .. . . . . . . . . . . . . . . . . . . . . . . . . . . . . . . . . . . . . . . . . . . . . . . . . . . . . .. . . . . . . . . . . . . . . . . . . . . . . . . . . . . . . . .. . . . . . . . . . . . . . . . . . . . . . . . . . . . . . . . . . . .. . . . . . . . . . . . . . . . . . . .
. . . . . . . . . . . . . . . . . . . . . . . . . . . . . . . . . . . . . . . . . . . . . . . . . . . . . . .. . . . . . . . . . . . . . . . . . . . . . . . . . . . . . . . . . . . . . . . .. . . . . . . . . . . . . . . . . . . . . . . .. . . . . . . . . . . . . . . . . . . . . . . . . . . . . . . . . . . . . . . . . . . . . . . . . . . . . .. . . . . . . . . . . . . . . . . . . . . . . . . . . . . . . . .. . . . . . . . . . . . . . . . . . . . . . . . . . . . . . . . . . . .. . . . . . . . . . . . . . . . . . . .
. . . . . . . . . . . . . . . . . . . . . . . . . . . . . . . . . . . . . . . . . . . . . . . . . . . . . . .. . . . . . . . . . . . . . . . . . . . . . . . . . . . . . . . . . . . . . . . .. . . . . . . . . . . . . . . . . . . . . . . .. . . . . . . . . . . . . . . . . . . . . . . . . . . . . . . . . . . . . . . . . . . . . . . . . . . . . .. . . . . . . . . . . . . . . . . . . . . . . . . . . . . . . . .. . . . . . . . . . . . . . . . . . . . . . . . . . . . . . . . . . . .. . . . . . . . . . . . . . . . . . . .
. . . . . . . . . . . . . . . . . . . . . . . . . . . . . . . . . . . . . . . . . . . . . . . . . . . . . . .. . . . . . . . . . . . . . . . . . . . . . . . . . . . . . . . . . . . . . . . .. . . . . . . . . . . . . . . . . . . . . . . .. . . . . . . . . . . . . . . . . . . . . . . . . . . . . . . . . . . . . . . . . . . . . . . . . . . . . .. . . . . . . . . . . . . . . . . . . . . . . . . . . . . . . . .. . . . . . . . . . . . . . . . . . . . . . . . . . . . . . . . . . . .. . . . . . . . . . . . . . . . . . . .
. . . . . . . . . . . . . . . . . . . . . . . . . . . . . . . . . . . . . . . . . . . . . . . . . . . . . . .. . . . . . . . . . . . . . . . . . . . . . . . . . . . . . . . . . . . . . . . .. . . . . . . . . . . . . . . . . . . . . . . .. . . . . . . . . . . . . . . . . . . . . . . . . . . . . . . . . . . . . . . . . . . . . . . . . . . . . .. . . . . . . . . . . . . . . . . . . . . . . . . . . . . . . . .. . . . . . . . . . . . . . . . . . . . . . . . . . . . . . . . . . . .. . . . . . . . . . . . . . . . . . . .
. . . . . . . . . . . . . . . . . . . . . . . . . . . . . . . . . . . . . . . . . . . . . . . . . . . . . . .. . . . . . . . . . . . . . . . . . . . . . . . . . . . . . . . . . . . . . . . .. . . . . . . . . . . . . . . . . . . . . . . .. . . . . . . . . . . . . . . . . . . . . . . . . . . . . . . . . . . . . . . . . . . . . . . . . . . . . .. . . . . . . . . . . . . . . . . . . . . . . . . . . . . . . . .. . . . . . . . . . . . . . . . . . . . . . . . . . . . . . . . . . . .. . . . . . . . . . . . . . . . . . . .
. . . . . . . . . . . . . . . . . . . . . . . . . . . . . . . . . . . . . . . . . . . . . . . . . . . . . . .. . . . . . . . . . . . . . . . . . . . . . . . . . . . . . . . . . . . . . . . .. . . . . . . . . . . . . . . . . . . . . . . .. . . . . . . . . . . . . . . . . . . . . . . . . . . . . . . . . . . . . . . . . . . . . . . . . . . . . .. . . . . . . . . . . . . . . . . . . . . . . . . . . . . . . . .. . . . . . . . . . . . . . . . . . . . . . . . . . . . . . . . . . . .. . . . . . . . . . . . . . . . . . . .
. . . . . . . . . . . . . . . . . . . . . . . . . . . . . . . . . . . . . . . . . . . . . . . . . . . . . . .. . . . . . . . . . . . . . . . . . . . . . . . . . . . . . . . . . . . . . . . .. . . . . . . . . . . . . . . . . . . . . . . .. . . . . . . . . . . . . . . . . . . . . . . . . . . . . . . . . . . . . . . . . . . . . . . . . . . . . .. . . . . . . . . . . . . . . . . . . . . . . . . . . . . . . . .. . . . . . . . . . . . . . . . . . . . . . . . . . . . . . . . . . . .. . . . . . . . . . . . . . . . . . . .
. . . . . . . . . . . . . . . . . . . . . . . . . . . . . . . . . . . . . . . . . . . . . . . . . . . . . . .. . . . . . . . . . . . . . . . . . . . . . . . . . . . . . . . . . . . . . . . .. . . . . . . . . . . . . . . . . . . . . . . .. . . . . . . . . . . . . . . . . . . . . . . . . . . . . . . . . . . . . . . . . . . . . . . . . . . . . .. . . . . . . . . . . . . . . . . . . . . . . . . . . . . . . . .. . . . . . . . . . . . . . . . . . . . . . . . . . . . . . . . . . . .. . . . . . . . . . . . . . . . . . . .
. . . . . . . . . . . . . . . . . . . . . . . . . . . . . . . . . . . . . . . . . . . . . . . . . . . . . . .. . . . . . . . . . . . . . . . . . . . . . . . . . . . . . . . . . . . . . . . .. . . . . . . . . . . . . . . . . . . . . . . .. . . . . . . . . . . . . . . . . . . . . . . . . . . . . . . . . . . . . . . . . . . . . . . . . . . . . .. . . . . . . . . . . . . . . . . . . . . . . . . . . . . . . . .. . . . . . . . . . . . . . . . . . . . . . . . . . . . . . . . . . . .. . . . . . . . . . . . . . . . . . . .
. . . . . . . . . . . . . . . . . . . . . . . . . . . . . . . . . . . . . . . . . . . . . . . . . . . . . . .. . . . . . . . . . . . . . . . . . . . . . . . . . . . . . . . . . . . . . . . .. . . . . . . . . . . . . . . . . . . . . . . .. . . . . . . . . . . . . . . . . . . . . . . . . . . . . . . . . . . . . . . . . . . . . . . . . . . . . .. . . . . . . . . . . . . . . . . . . . . . . . . . . . . . . . .. . . . . . . . . . . . . . . . . . . . . . . . . . . . . . . . . . . .. . . . . . . . . . . . . . . . . . . .
Table 4. Average annual catch rates and standard deviations, proportion of trawl stations where the species was observed in the coastalsurveys of 1992–2005, qualitative abundance category, and latitude and depth ranges.
Species Mean catch(number km22)
s.d. Proportion of stationsat which observed (%)
Abundance Latitude (88888N) Depth (m)
Chimaera monstrosa 2 586.2 3 250.7 29.5 Common 62–71 42– 665
Etmopterus spinax 2 078.4 2 234.0 17.7 Common 62–71 47– 730
Galeus melastomus 605.7 598.0 13.2 Common 62–68 51– 665
Amblyraja radiata 55.2 20.7 19.6 Common 62–72 30– 635
Squalus acanthias 49.3 49.3 4.5 Common 62–69 42– 515
Dipturus oxyrinchus 7.7 15.6 2.0 Common 62–68 45– 665
Rajella fyllae 5.5 8.3 2.2 Common 62–72 83– 415
Dipturus batis 2.2 2.2 1.0 Infrequent 62–71 85– 425
Leucoraja fullonica 1.8 2.7 1.0 Infrequent 62–71 77– 512
Leucoraja circularis 1.7 3.2 0.4 Rare 62 88– 244
Bathyraja spinicauda 1.1 1.4 0.5 Rare 67–72 48– 410
Amblyraja hyperborea 0.6 1.9 0.3 Rare 67–71 125– 620
Dipturus nidarosiensis 0.5 0.9 0.3 Infrequent 62–69 132– 588
Raja montagui 0.4 0.6 0.3 Rare 62 63– 120
Raja brachyura 0.3 1.1 0.02 Rare 62–63 99
Dipturus linteus 0.1 0.3 0.1 Rare 68 588
Somniosus microcephalus 0.1 0.3 0.02 Infrequent 69 480
Distribution of chondrichthyans along the northern coast of Norway 1167
by guest on September 14, 2015
http://icesjms.oxfordjournals.org/
Dow
nloaded from
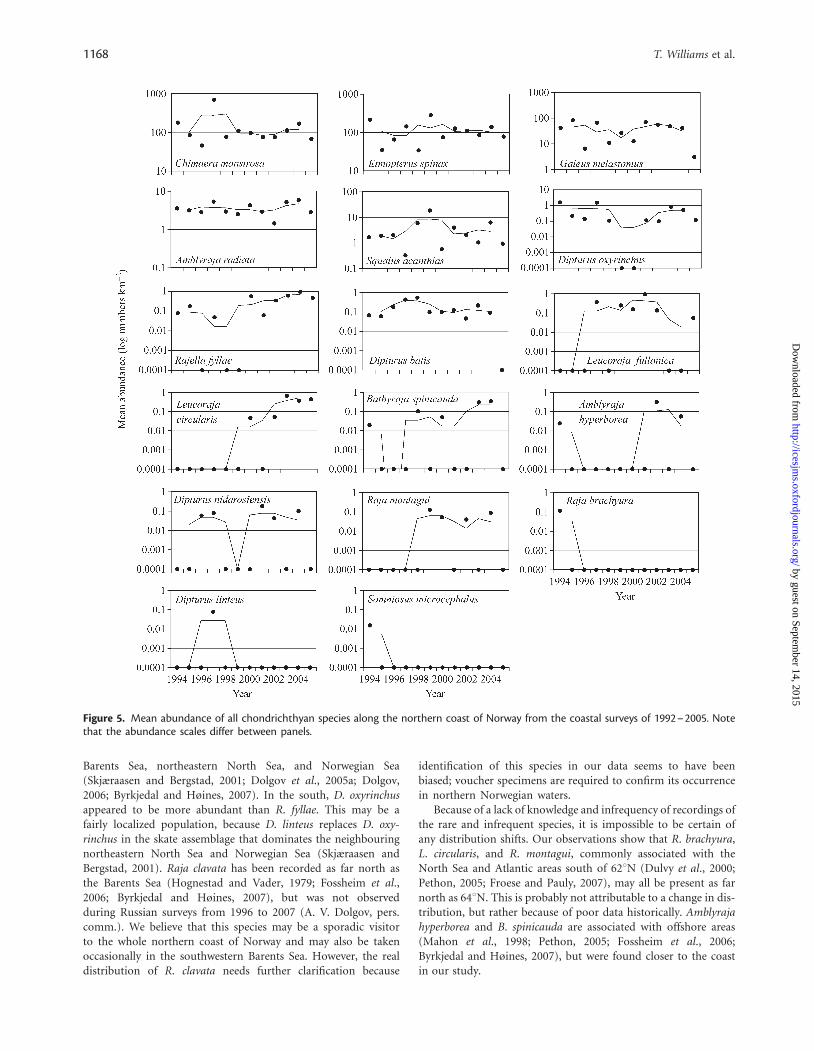
Barents Sea, northeastern North Sea, and Norwegian Sea(Skjæraasen and Bergstad, 2001; Dolgov et al., 2005a; Dolgov,2006; Byrkjedal and Høines, 2007). In the south, D. oxyrinchusappeared to be more abundant than R. fyllae. This may be afairly localized population, because D. linteus replaces D. oxy-rinchus in the skate assemblage that dominates the neighbouringnortheastern North Sea and Norwegian Sea (Skjæraasen andBergstad, 2001). Raja clavata has been recorded as far north asthe Barents Sea (Hognestad and Vader, 1979; Fossheim et al.,2006; Byrkjedal and Høines, 2007), but was not observedduring Russian surveys from 1996 to 2007 (A. V. Dolgov, pers.comm.). We believe that this species may be a sporadic visitorto the whole northern coast of Norway and may also be takenoccasionally in the southwestern Barents Sea. However, the realdistribution of R. clavata needs further clarification because
identification of this species in our data seems to have beenbiased; voucher specimens are required to confirm its occurrencein northern Norwegian waters.
Because of a lack of knowledge and infrequency of recordings ofthe rare and infrequent species, it is impossible to be certain ofany distribution shifts. Our observations show that R. brachyura,L. circularis, and R. montagui, commonly associated with theNorth Sea and Atlantic areas south of 628N (Dulvy et al., 2000;Pethon, 2005; Froese and Pauly, 2007), may all be present as farnorth as 648N. This is probably not attributable to a change in dis-tribution, but rather because of poor data historically. Amblyrajahyperborea and B. spinicauda are associated with offshore areas(Mahon et al., 1998; Pethon, 2005; Fossheim et al., 2006;Byrkjedal and Høines, 2007), but were found closer to the coastin our study.
Figure 5. Mean abundance of all chondrichthyan species along the northern coast of Norway from the coastal surveys of 1992–2005. Notethat the abundance scales differ between panels.
1168 T. Williams et al.
by guest on September 14, 2015
http://icesjms.oxfordjournals.org/
Dow
nloaded from

Spatial distributionAmblyraja radiata has a wide and uniform distribution throughoutthe study area, with biomass increasing to the north, and is foundalso in the Barents Sea (Dolgov et al., 2005a; Byrkjedal and Høines,2007). Annual distribution maps show that the distributions ofC. monstrosa, E. spinax, G. melastomus, and S. acanthias arepatchy (Williams, 2007). The large catches (.500 animals in asingle haul) underscore the aggregating behaviour of thesespecies. Squalus acanthias occurs often in shoals of the same sexand/or size (Ellis et al., 2005b; Stenberg, 2005), similar toG. melastomus, for which there are also bathymetric patterns(Massuti and Moranta, 2003; Calis et al., 2005; Coelho et al.,2005). These uneven distributions can be linked to the availabilityof suitable bottom substrata or food availability, as has beensuggested to explain similar distribution patterns in the neigh-bouring North Sea and Skagerrak (Skjæraasen and Bergstad,2000). Tagging studies indicate little mixing of S. acanthiasbetween northern and southern areas of the North Sea (Aasen,
1962; Holden, 1967), and Holden (1968) claimed that theNorwegian–Scottish and Channel populations are separate stocks.Despite assertions of transatlantic migration (Holden, 1967;Templeman, 1984), recent analysis of tag returns indicates thatNortheast and Northwest Atlantic stocks should be managed inde-pendently. No decline over time was observed for S. acanthias in ourstudy area, but declines have been documented for the North Sea,Celtic Sea, and off Northwest Scotland (Daan et al., 2005; Dobbyet al., 2005; Ellis et al., 2005a; ICES, 2007). Those studies,however, were based on surveys that started in the 1970s and1980s. The few large catches (7–19 fish) indicate that, althoughD. oxyrinchus is relatively scarce, local aggregations may occur.
The abundance of some species appeared to be depth-dependent. Dipturus batis and R. fyllae were confined to watershallower than 500 m (Table 4). However, R. fyllae probablyexists over a wider depth range (Dolgov et al., 2005a; Jørgensenet al., 2005; Pethon, 2005) and probably prefers deeper waters inthe south (Skjæraasen and Bergstad, 2001). As observed in otherareas, G. melastomus preferred depths deeper than 150 m(Magnussen, 2002; Massuti and Moranta, 2003; Rey et al., 2004;Costa et al., 2005; Serena et al., 2006). Chimaera monstrosa wasfound mainly in deeper water (.400 m), but may migrate toshallower water in spring and summer to deposit egg capsules(Bristow, 1992; Pethon, 2005). Etmopterus spinax was found inboth deep and shallow water in the north and the south of thesurvey area, and the depth range was not clearly dependent on lati-tude in the survey area, as suggested by Pethon (2005). Amblyrajaradiata and D. oxyrinchus were present at all depths.
Species assemblagesThe northern, central, and southern species assemblages shown bythe constrained correspondence biplot revealed that factors linkedto latitude play an important role in determining species distri-bution and abundance. The sharp decline in abundance north of658N for species in the southern and central group was particularlynoteworthy because it suggests a latitudinal change in conditions,resulting in a shift in biodiversity. The 658N region is, on average,deeper than the other areas surveyed, and the deep trench mayfunction as a biogeographical barrier (Figure 2). However, depthalone does not appear to explain this trend, and the LofotenPeninsula may function as a physical barrier.
Temporal and spatial shifts with regard to seatemperatureBecause of the small number of stations with temperaturemeasurements, sea temperature had limited ability to explainshifts in abundance in our data. Skate distribution in theBarents Sea has been linked to changes in bottom temperature(Dolgov et al., 2005a). In some areas of the Northeast Atlantic,the increase in sea temperature in recent years has coincidedwith a gradual northward shift in the distribution of somespecies (Perry et al., 2005; Dolgov, 2006). So far, though, thereappear to have been no such shifts along the northern coast ofNorway. Demersal fish species such as cod seem to be able toadapt to moderate changes in their ambient temperature and donot necessarily respond to it with a change in distribution(Ottersen et al., 1998), at least to the same extent as do pelagicfish, such as blue whiting (Micromesistius poutassou), capelin(Mallotus villosus), and herring (Bergstad et al., 1999; Toresenand Østvedt, 2000; Fossheim et al., 2006). Depth and temperatureare unlikely to be the only factors involved in determining the
. . . . . . . . . . . . . . . . . . . . . . . . . . . . . . .. . . . . . . . . . . . . . . . . . . . . . . . . . . .. . . . . . . . . . .. . . . . . . . . . . . . . . . . . . . . . . .. . . . . . . . . . . .. . . . . . . . . . . . . . .. . . . . . .
. . . . . . . . . . . . . . . . . . . . . . . . . . . . . . .. . . . . . . . . . . . . . . . . . . . . . . . . . . .. . . . . . . . . . .. . . . . . . . . . . . . . . . . . . . . . . .. . . . . . . . . . . .. . . . . . . . . . . . . . .. . . . . . .
. . . . . . . . . . . . . . . . . . . . . . . . . . . . . . .. . . . . . . . . . . . . . . . . . . . . . . . . . . .. . . . . . . . . . .. . . . . . . . . . . . . . . . . . . . . . . .. . . . . . . . . . . .. . . . . . . . . . . . . . .. . . . . . .
. . . . . . . . . . . . . . . . . . . . . . . . . . . . . . .. . . . . . . . . . . . . . . . . . . . . . . . . . . .. . . . . . . . . . .. . . . . . . . . . . . . . . . . . . . . . . .. . . . . . . . . . . .. . . . . . . . . . . . . . .. . . . . . .
. . . . . . . . . . . . . . . . . . . . . . . . . . . . . . .. . . . . . . . . . . . . . . . . . . . . . . . . . . .. . . . . . . . . . .. . . . . . . . . . . . . . . . . . . . . . . .. . . . . . . . . . . .. . . . . . . . . . . . . . .. . . . . . .
. . . . . . . . . . . . . . . . . . . . . . . . . . . . . . .. . . . . . . . . . . . . . . . . . . . . . . . . . . .. . . . . . . . . . .. . . . . . . . . . . . . . . . . . . . . . . .. . . . . . . . . . . .. . . . . . . . . . . . . . .. . . . . . .
Table 5. One-way single factor ANOVA schemes for determiningthe significance of temporal differences in abundance of the mainspecies caught during the coastal surveys of 1992–2005.
Species Sum ofsquares
d.f. Meansquare
F p Fcrit
Chimaeramonstrosa
3 717 741.6 11 337 976.5 0.98 0.473 1.88
Etmopterusspinax
893 976.4 11 81 270.6 0.58 0.840 1.88
Galeusmelastomus
231 510.3 11 21 046.4 0.68 0.751 1.88
Squalusacanthias
5 282.6 11 480.2 0.76 0.675 1.88
Amblyrajaradiata
184.2 11 16.7 1.92 0.044 1.88
Dipturusoxyrinchus
52.4 11 4.8 1.00 0.449 1.88
Rajella fyllae 14.0 11 1.3 1.61 0.107 1.88
Significant differences (p = 0.05) emboldened.
. . . . . . . . . . . . . . . . . . . . . . . . . . . . . . .. . . . . . . . . . . . . . . . . . . . . . . . . . . .. . . . . . . . . . .. . . . . . . . . . . . . . . . . . . . . . . .. . . . . . . . . .. . . . . . . . . . . . . . . . . .. . . . . . .
. . . . . . . . . . . . . . . . . . . . . . . . . . . . . . .. . . . . . . . . . . . . . . . . . . . . . . . . . . .. . . . . . . . . . .. . . . . . . . . . . . . . . . . . . . . . . .. . . . . . . . . .. . . . . . . . . . . . . . . . . .. . . . . . .
. . . . . . . . . . . . . . . . . . . . . . . . . . . . . . .. . . . . . . . . . . . . . . . . . . . . . . . . . . .. . . . . . . . . . .. . . . . . . . . . . . . . . . . . . . . . . .. . . . . . . . . .. . . . . . . . . . . . . . . . . .. . . . . . .
. . . . . . . . . . . . . . . . . . . . . . . . . . . . . . .. . . . . . . . . . . . . . . . . . . . . . . . . . . .. . . . . . . . . . .. . . . . . . . . . . . . . . . . . . . . . . .. . . . . . . . . .. . . . . . . . . . . . . . . . . .. . . . . . .
. . . . . . . . . . . . . . . . . . . . . . . . . . . . . . .. . . . . . . . . . . . . . . . . . . . . . . . . . . .. . . . . . . . . . .. . . . . . . . . . . . . . . . . . . . . . . .. . . . . . . . . .. . . . . . . . . . . . . . . . . .. . . . . . .
. . . . . . . . . . . . . . . . . . . . . . . . . . . . . . .. . . . . . . . . . . . . . . . . . . . . . . . . . . .. . . . . . . . . . .. . . . . . . . . . . . . . . . . . . . . . . .. . . . . . . . . .. . . . . . . . . . . . . . . . . .. . . . . . .
Table 6. One-way single factor ANOVA schemes for determiningthe significance of latitudinal differences in abundance of the mainspecies caught during the coastal surveys of 1992–2005.
Species Sum ofsquares
d.f. Meansquare
F p Fcrit
Chimaeramonstrosa
7 537 614.7 8 942 201.8 2.8 0.007 2.03
Etmopterusspinax
5 141 623.0 8 642 702.9 6.0 <0.001 2.03
Galeusmelastomus
1 078 162.9 8 134 770.4 5.5 <0.001 2.03
Squalusacanthias
13 594.7 8 1 699.3 2.8 0.007 2.03
Amblyrajaradiata
294.3 8 36.8 5.3 <0.001 2.03
Dipturusoxyrinchus
162.5 8 20.3 5.0 <0.001 2.03
Rajella fyllae 10.3 8 1.3 2.8 0.008 2.03
Significant differences (p = 0.05) emboldened.
Distribution of chondrichthyans along the northern coast of Norway 1169
by guest on September 14, 2015
http://icesjms.oxfordjournals.org/
Dow
nloaded from

apparent trends in distribution and general stability in abundanceof each chondrichthyan listed here. As the distributions of thesouthern and central species assemblages have not expandednorth in response to ocean warming, other factors may beplaying a role in determining abundance and distribution.
Little is known about how fisheries have impacted chondrichth-yan populations along the northern coast of Norway. However, weknow that they provide a significant and probably underestimatedbycatch in gillnet and longline fisheries (Table 1). It is thereforereasonable to assume that the demersal fisheries in particularhave a negative impact on chondrichthyan stocks (Bonfil, 1994;Stevens et al., 2000; Dolgov et al., 2005b; Drevetnyak et al., 2005).Any major changes in population structure in response to fishingprobably took place in the survey area before 1992, when themost significant development in the fisheries there took place. Asmentioned, the introduction of sorting grids in the shrimpfishery reduced bycatch to include only juveniles. This has not
resulted in an obvious increase in chondrichthyan abundance,but may be one reason the stocks are not decreasing. The popu-lations of A. radiata and R. fyllae in the neighbouring Barents Seaappear to be stable at current fishing levels (Drevetnyak et al.,2005), so both species are probably similarly tolerant to currentfishing pressure within our study area.
The processes influencing the population dynamics of thechondrichthyans described here are undoubtedly complex.Geographical barriers, particularly the deep trenches in theregion of 678N (Vestfjord) and the Lofoten Peninsula, couldrestrict passage and inhibit an expansion in the distribution of aspecies. Also, chondrichthyans are generally long-lived, and theirdistribution may to some degree be the consequence of territorialbehaviour and a slow rate of migration. For example, some skatesdo not migrate great distances (Hunter et al., 2005) and may showclear gaps between areas of high concentration, perhaps indicatingthat they may form local stock units (Daan et al., 2005). However,
Figure 6. Mean abundance and standard error for the common species in each depth zone along the northern coast of Norway from thecoastal surveys of 1992–2005. Note that the abundance scales differ between panels.
1170 T. Williams et al.
by guest on September 14, 2015
http://icesjms.oxfordjournals.org/
Dow
nloaded from
A. radiata seems to be an exception, because the continental shelfedge apparently does not present a barrier to its migration, andthere are no significant population gaps in the North Atlanticgenerally (Chevolot et al., 2007). This is one explanation for theuniform distribution of A. radiata in the study area and in theBarents Sea.
Although chondrichthyans are potentially vulnerable to fish-eries (Stevens et al., 2000; Priede et al., 2006), the current popu-lations in the study area of the more common species appearnot to be adversely affected by bycatch at the current levels offishing activity (although historical estimates of abundance are
not available). Stocks of C. monstrosa, E. spinax, S. microcephalus,G. melastomus, S. acanthias, D. batis, and recently also A. radiatahave declined in the North Sea (Daan et al., 2005; Ellis et al.,2005a; Jones et al., 2005; ICES, 2007), but there has been nosuch decline in our area of interest. This may be due to thelower effort in the demersal fishery in general and in the elasmo-branch fishery in particular along the northern coast of Norwayover the period 1992–2005. However, because of the limitationsof our data, we cannot be certain that this is the case for the lessfrequently caught species, especially given the comparativelyshort period covered by the study. For example, species such as
Figure 8. Shifts in abundance, given as percentages of deviationfrom mean abundance (number km22) within the total survey area,with respect to latitude area for species grouped as (a) northern, (b)central, and (c) southern assemblages.
Figure 7. Ordination biplot of constrained correspondence analysis(CCA) relating the abundance of the ten most abundantchondrichthyan species along the northern Norwegian coast to thepotential explanatory variables, longitude, latitude, depth, and yearof sampling. Am_rad, Amblyraja radiata; Ch_mon, Chimaeramonstrosa; Di_bat, Dipturus batis; Di_oxy, Dipturus oxyrinchus;Et_spi, Etmopterus spinax; Ga_mel, Galeus melastomus; Le_ful,Leucoraja fullonica; Ra_fyl, Rajella fyllae; and Sq_aca, Squalusacanthias.
Figure 9. Mean annual temperature at the hydrological stationsalong the northern coast of Norway at Vardø, Ingøy, Bud, andEggum.
. . . . . . . . . . . . . . . . . . . . . . . . . . . . . . .. . . . . . . . . . . . . . . . . . . . . . . . . . .. . . . . . . . . . .. . . . . . . . . . . . . . . . . . . . . . . . . .. . . . . . . . . . . .. . . . . . . . . . . . . . .. . . . . . .
. . . . . . . . . . . . . . . . . . . . . . . . . . . . . . .. . . . . . . . . . . . . . . . . . . . . . . . . . .. . . . . . . . . . .. . . . . . . . . . . . . . . . . . . . . . . . . .. . . . . . . . . . . .. . . . . . . . . . . . . . .. . . . . . .
. . . . . . . . . . . . . . . . . . . . . . . . . . . . . . .. . . . . . . . . . . . . . . . . . . . . . . . . . .. . . . . . . . . . .. . . . . . . . . . . . . . . . . . . . . . . . . .. . . . . . . . . . . .. . . . . . . . . . . . . . .. . . . . . .
. . . . . . . . . . . . . . . . . . . . . . . . . . . . . . .. . . . . . . . . . . . . . . . . . . . . . . . . . .. . . . . . . . . . .. . . . . . . . . . . . . . . . . . . . . . . . . .. . . . . . . . . . . .. . . . . . . . . . . . . . .. . . . . . .
. . . . . . . . . . . . . . . . . . . . . . . . . . . . . . .. . . . . . . . . . . . . . . . . . . . . . . . . . .. . . . . . . . . . .. . . . . . . . . . . . . . . . . . . . . . . . . .. . . . . . . . . . . .. . . . . . . . . . . . . . .. . . . . . .
. . . . . . . . . . . . . . . . . . . . . . . . . . . . . . .. . . . . . . . . . . . . . . . . . . . . . . . . . .. . . . . . . . . . .. . . . . . . . . . . . . . . . . . . . . . . . . .. . . . . . . . . . . .. . . . . . . . . . . . . . .. . . . . . .
Table 7. One-way single factor ANOVA schemes for determiningthe significance of depth-dependent differences in abundance ofthe main species caught during the coastal surveys of 1992–2005.
Species Sum ofsquares
d.f. Meansquare
F p Fcrit
Chimaeramonstrosa
40 047 077 9 4 449 675.2 1.46 0.170 1.95
Etmopterusspinax
1 386 782 9 154 086.9 1.69 0.098 1.95
Galeusmelastomus
352 063 9 39 118.1 3.23 0.001 1.95
Squalusacanthias
4 807 9 534.1 1.65 0.107 1.95
Amblyrajaradiata
155 9 17.2 1.21 0.297 1.95
Dipturusoxyrinchus
135 9 15.0 0.97 0.469 1.95
Rajella fyllae 5 9 0.6 1.81 0.072 1.95
Significant differences (p = 0.05) emboldened.
Distribution of chondrichthyans along the northern coast of Norway 1171
by guest on September 14, 2015
http://icesjms.oxfordjournals.org/
Dow
nloaded from

S. microcephalus are reported to have had longer term declines inNorwegian waters (Ruud, 1968).
As species identification is currently difficult and potentiallyinaccurate, effort should be put into quality controlling availabletaxonomic keys for northern areas, especially for skates, whichare known to have high morphological interspecific variability(Serena et al., 2005). To address the distribution of skate speciesin Norwegian waters, future surveys should place more emphasison species identification, including the collection of voucher speci-mens, and the development of appropriate field identificationguides should be given high priority. Knowledge of chondrichth-yan species along the coast of Norway remains limited comparedwith that for the neighbouring North Sea (ICES, 2007) andfurther work is required.
AcknowledgementsAn anonymous referee and Jim Ellis provided valuable advice andrecommendations for improving the manuscript, and FrøydisStrand kindly helped us finalize the figures. We thank Erik Bergand Ivan Ahlquist (IMR) for making the fish abundance dataavailable, and Øyvin Strand (IMR) and all others who wereinvolved in helping to find suitable temperature data. AndreyDolgov supported us through interesting discussions. Finally, wethank the crew of RV “Jan Mayen” for their support.
ReferencesAasen, O. 1962. Norwegian dogfish tagging. Annals of Applied
Biology, 17: 106–107.
Abella, A. J., and Serena, F. 2005. Comparison of elasmobranch catchesfrom research trawl surveys and commercial landings at port ofViareggio, Italy, in the last decade. Journal of Northwest AtlanticFishery Science, 35: 345–356.
Aschan, M., and Sunnana, K. 1997. Evaluation of the Norwegianshrimp surveys conducted in the Barents Sea and Svalbard area1980–1997. ICES Document CM 1997/Y: 07. 24 pp.
Berg, E., and Albert, O. T. 2003. Cod in fjords and coastal waters ofNorth Norway: distribution and variation in length and maturityat age. ICES Journal of Marine Science, 60: 787–797.
Bergstad, O. A., Bjelland, O., and Gordon, J. D. M. 1999. Fish commu-nities on the slope of the eastern Norwegian Sea. Sarsia, 84: 67–78.
Berstad, I. M., Sejrup, H. P., Klitgaard-Kristensen, D., and Haflidason,H. 2003. Variability in temperature and geometry of the NorwegianCurrent over the past 600 years; stable isotope and grain size evi-dence from the Norwegian margin. Journal of QuaternaryScience, 18: 591–602.
Bonfil, R. 1994. Overview of world elasmobranch fisheries. FAOFisheries Technical Paper, 341. 119 pp.
Bristow, G. A. 1992. On the distribution, ecology and evolution ofGyrocotyle urna, G. confusa and G. nybelini (Cercomeromorpha,Gyrocotylidae) and their host Chimera monostrosa(Holocephalidae) in Norwegian waters, with a review of thespecies question. Sarsia, 77: 119–124.
Byrkjedal, I., and Høines, A. 2007. Distribution of demersal fish in thesouth-western Barents Sea. Polar Research, 26: 135–151.
Calis, E., Jackson, E. H., Nolan, C. P., and Jeal, F. 2005. Preliminary ageand growth estimates of the rabbitfish, Chimaera monstrosa, withimplications for future resource management. Journal ofNorthwest Atlantic Fishery Science, 35: 15–26.
Chevolot, M., Wolfs, P. H. J., Palsson, J., Rijnsdorp, A. D., Stam, W. T.,and Olsen, J. L. 2007. Population structure and historical demogra-phy of the thorny skate (Amblyraja radiata, Rajidae) in the NorthAtlantic. Marine Biology, 151: 1275–1286.
Coelho, R., Figueiredo, I., Machado, P. B., and Erzini, K. 2005. Depthdistribution of the velvet belly lantern shark, Etmopterus spinax, insouthern Portugal. ICES Document CM 2005/N: 30.
Costa, M. E., Erzini, K., and Borges, T. C. 2005. Reproductive biologyof the blackmouth catshark, Galeus melastomus (Chondrichthyes:Scyliorhinidae) off the south coast of Portugal. Journal of theMarine Biological Association of the UK, 85: 1173–1183.
Daan, N. 2001. The IBTS database: a plea for quality control. ICESDocument CM 2001/T: 03. 5 pp.
Daan, N., Heessen, H., and ter Hofstede, R. 2005. North Seaelasmobranchs: distribution, abundance and biodiversity. ICESDocument CM 2005/N: 06. 15 pp.
Dobby, H., Beare, D., Jones, E., and MacKenzie, K. 2005. Comparisonof trends in long term survey data from Squalus acanthias with apreliminary stock assessment for this species. ICES DocumentCM 2005/N: 01. 19 pp.
Dolgov, A. V. 1997. Distribution, abundance, biomass and feeding ofthorny skate, Raja radiata, in the Barents Sea. ICES Document1997/G: 04. 21 pp.
Dolgov, A. V. 2006. New data on the distribution of rare and new fishspecies in Russian waters of the Barents Sea. Journal of Ichthyology,46: 139–147.
Dolgov, A. V., Drevetnyak, K. V., and Gusev, E. V. 2005a. The status ofskate stocks in the Barents Sea. Journal of Northwest AtlanticFishery Science, 35: 1–13.
Dolgov, A. V., Drevetnyak, K. V., Sokolov, K. M., and Gusev, E. V.2004. Skates. In Investigations of PINRO in the Area offSpitsbergen Archipelago, pp. 265–274. PINRO Press, Murmansk.550 pp. (in Russian).
Dolgov, A. V., Grekov, A. A., Shestopal, I. P., and Sokolov, K. M.2005b. By-catch of skates in trawl and long-line fisheries in theBarents Sea. Journal of Northwest Atlantic Fishery Science, 35:357–366.
Drevetnyak, K. V., Dolgov, A. V., Sokolv, K. M., Gusev, E. V., andGrekov, A. A. 2005. Skates in the Barents Sea: stock status andcatch by fishing fleet. ICES Document CM 2005/N: 11. 7 pp.
Dulvy, N. K., Metcalfe, J. D., Glanville, J., Pawson, M. G., andReynolds, J. D. 2000. Fishery stability, local extinctions, and shiftsin community structure in skates. Conservation Biology, 14:283–293.
Ellis, J., Dulvy, N. K., Jennings, S., Parker-Humphreys, M., and Rogers,S. I. 2005a. Assessing the status of demersal elasmobranchs in UKwaters: a review. Journal of the Marine Biological Association ofthe UK, 85: 1025–1047.
Ellis, J., Clarke, M., Cortes, E., Heessen, H. J. L., Apostolaki, P.,Carlson, J. K., and Kulka, D. W. 2008. Management of elasmo-branch fisheries in the North Atlantic. In Advances in FisheriesScience. 50 years on from Beverton and Holt, pp. 184–228. Ed.by A. Payne, J. Cotter, and T. Potter. Blackwell Publishing,Oxford. 547 pp.
Ellis, J. R., Cruz-Martinez, A., Rackham, B. D., and Rogers, S. I. 2005b.The distribution of chondrichthyan fishes around the British Islesand implications for conservation. Journal of Northwest AtlanticFishery Science, 35: 195–213.
Fossheim, M., Nilssen, E. M., and Aschan, M. 2006. Fish assemblagesin the Barents Sea. Marine Biology Research, 2: 260–269.
Froese, R., and Pauly, D. (Eds.) 2007. FishBase. World Wide WebElectronic Publication. www.fishbase.org
Gyory, J., Mariano, A. J., and Ryan, E. H. 2005. The Norwegian andNorth Cape Currents. The Cooperative Institute for Marine andAtmospheric Studies.
Hognestad, P. T., and Vader, W. 1979. Saltvannsfiskene i Nord-Norge(The marine fish in North Norway). Tromura, 6: 1–74.
Holden, M. J. 1967. Transatlantic movement of a tagged spurdogfish.Nature, 214: 1140–1141.
1172 T. Williams et al.
by guest on September 14, 2015
http://icesjms.oxfordjournals.org/
Dow
nloaded from

Holden, M. J. 1968. The rational exploitation of Scottish–Norwegianstocks of spurdogs (Squalus acanthias L.). Fishery Investigations,Series II, 25. 27 pp.
Holden, M. J. 1977. Elasmobranchs. In Fish Population Dynamics, pp.187–214. Ed. by J. A. Gulland. John Wiley, New York. 384 pp.
Hunter, E., Blickley, A. A., Stewart, C., and Metcalf, J. D. 2005.Repeated seasonal migration by a thornback ray in the southernNorth Sea. Journal of the Marine Biological Association of theUK, 85: 1199–1200.
ICES. 2006. Report of the Working Group on Elasmobranch Fishes(WGEF). ICES Document CM 2006/ACFM: 31. 291 pp.
ICES. 2007. Report of the Working Group on Elasmobranch Fishes(WGEF). ICES Document CM 2006/ACFM: 27. 318 pp.
IMR. 2007. Faste hydrografiske stasjoner langs norskekysten(Permanent Hydrographical Stations along the NorwegianCoast). Institute for Marine Research, Bergen. http://atlas.nodc.no/stasjoner/.
ITIS. 2008. Accessed 12/04/2008, from the Integrated TaxonomicInformation System On-line Database. http://www.itis.gov
Jakobsen, T., Korsbrekke, K., Mehl, S., and Nakken, O. 1997.Norwegian combined acoustic and bottom trawl surveys fordemersal fish in the Barents Sea during winter. ICES DocumentCM 1997/Y: 17. 26 pp.
Johnston, G., Figueuredo, I., Machado, P., Clarke, M., Bladsdale, T.,Ellis, J., and Hareide, R. 2005. Separation of species data fromnational landing figures. ICES Document CM 2005/N: 22. 16 pp.
Jones, E., Bare, D., Dobby, H., Trinkler, N., Burns, F., Peach, K., andBlasdale, T. 2005. The potential impact of commercial fishingactivity on the ecology of deepwater chondrichthyans from thewest of Scotland. ICES Document CM 2005/N: 16. 19 pp.
Jørgensen, O. A., Hvingel, C., Møller, P. R., and Treble, M. A. 2005.Identification and mapping of bottom fish assemblages in DavisStrait and southern Baffin Bay. Canadian Journal of Fisheries andAquatic Sciences, 62: 1833–1852.
Kotwicki, S., and Weinberg, K. L. 2005. Estimating capture probabilityof a survey bottom trawl for Bering Sea skates (Bathyraja spp.) andother fish. Alaska Fishery Research Bulletin, 11: 135–145.
Magnussen, E. 2002. Demersal fish assemblages of Faroe Bank: speciescomposition, distribution, biomass spectrum and diversity. MarineEcology Progress Series, 238: 211–225.
Mahon, R., Brown, S. K., Zwanenburg, K. C. T., Atkinson, D. B., Buja,K. R., Claflin, L., Howell, G. D., et al. 1998. Assemblages andbiogeography of demersal fishes of the east coast of NorthAmerica. Canadian Journal of Fisheries and Aquatic Sciences, 55:1704–1738.
Massuti, E., and Moranta, J. 2003. Demersal assemblages and depthdistribution of elasmobranchs from the continental shelf andslope off the Balearic Islands (western Mediterranean). ICESJournal of Marine Science, 60: 753–766.
Mjanger, H., Alvsvag, J., Hetsenes, K., Svendsen, B. V., and Wenneck,T. L. 2004. Handbok for prøvetaking av fisk og krepsdyr (Manualfor Sampling Fish and Crustaceans), version 3.15. 169 pp.
Nakken, O. 2003. Hva betyr utkast for bestandene? (What influencedoes discards have on the fish stocks). In Report from aWorkshop on Discarding in Nordic Fisheries, pp. 39–43. Ed. byJ. W. Valdemarsen. Nordic Council of Ministers, Copenhagen,Tema Nord 2003. 537 pp.
Oksanen, J. 2007. Multivariate Analysis of Ecological Communitiesin R: vegan tutorial, 39. University of Oulu. 580 pp. Available athttp://cc.oulu.fi/�jarioksa/opetus/metodi/vegantutor.pdf
Ottersen, G., Michalsen, K., and Nakken, O. 1998. Ambient tempera-ture and distribution of North-east Arctic cod. ICES Journal ofMarine Science, 55: 67–85.
Pawson, M. G., and Ellis, J. 2005. Stock identity of elasmobranchs inthe Northeast Atlantic in relation to assessment and management.Journal of Northwest Atlantic Fishery Science, 35: 173–193.
Perry, A. L., Low, P. J., Ellis, J. R., and Reynolds, J. D. 2005. Climatechange and distribution shifts in marine fishes. Science, 308:1912–1915.
Pethon, P. 2005. Aschehaugs Store Fiskebok. H. Aschehaug & Co.,Oslo. 468 pp.
Priede, I. G., Froese, R., Bailey, D. M., Bergstad, O. A., Collins, M. A.,Dyb, J. E., Henriques, C., et al. 2006. The absence of sharks fromabyssal regions of the world’s oceans. Proceedings of the RoyalSociety Series B, 273: 1435–1441.
R Development Core Team. 2007. R: a Language and Environment forStatistical Computing, version R 2.50. R Foundation for StatisticalComputing, Vienna, Austria. http://www.R-project.org
Reithe, S., and Aschan, M. 2004. Bioeconomic analysis of by-catch ofjuvenile fish in the shrimp fisheries—an evaluation of managementprocedures in the Barents Sea. Environmental and ResourceEconomics, 28: 55–72.
Rey, J., de Sola, L. G., and Massutı, E. 2004. Distribution and biologyof the blackmouth catshark Galeus melastomus in the Alboran Sea(Southwestern Mediterranean). Journal of Northwest AtlanticFishery Science, 35: 215–223.
Ruud, J. T. 1968. Changes since the turn of the century in the fishfauna and the fisheries of the Oslofjord. HelgolanderWissenschaftliche Meeresuntersuchungen, 17: 510–517.
Serena, F., Baino, R., Rey, J., Papacostantinou, C., and Relini, G. 2006.Catch composition and abundance of deep-sea elasmobranchsbased on the MEDITS1 trawl surveys. In Deep Sea 2003:Conference on the Governance and Management of Deep-seaFisheries. Part 2: Conference Poster Papers and WorkshopPapers, Queenstown, New Zealand, 1–5 December 2003;Dunedin, New Zealand, 27–29 November 2003, pp. 395–408.Ed. by R. Shotton. FAO Fisheries Proceedings, 3/2. 500 pp.
Serena, F., Mancousi, C., Barone, M., and Abella, A. J. 2005.Abundance and distribution of rays in the South Ligurian andNorth Tyrrhenian Sea. ICES Document CM 2005/N: 20. 16 pp.
Skjæraasen, J. E., and Bergstad, O. A. 2000. Distribution and feedingecology of Raja radiata in the northeastern North Sea andSkagerrak (Norwegian Deep). ICES Journal of Marine Science,57: 1249–1260.
Skjæraasen, J. E., and Bergstad, O. A. 2001. Notes on the distributionand length composition of Raja lintea, R. fyllae, R. hyperborea andBathyraja spinicauda (Pisces: Rajidae) in the deep northeasternNorth Sea and on the slope of the eastern Norwegian Sea. ICESJournal of Marine Science, 58: 21–28.
Sosebee, K. A. 2005. Are density-dependent effects on elasmobranchmaturity possible? Journal of Northwest Atlantic Fishery Science,35: 115–124.
Stenberg, C. 2005. Life history of the piked dogfish (Squalus acanthiasL.) in Swedish waters. Journal of Northwest Atlantic FisheryScience, 35: 155–164.
Stevens, J. D., Bonfil, R., Dulvy, N. K., and Walker, P. A. 2000. Theeffects of fishing on sharks, rays, and chimaeras (chondrichthyans),and the implications for marine ecosystems. ICES Journal ofMarine Science, 57: 476–494.
Templeman, W. 1984. Migrations of spiny dogfish, Squalus acanthias,and recapture success from tagging in the Newfoundland area,1963–65. Journal of Northwest Atlantic Fisheries Science, 5:47–53.
ter Braak, C. J. F., and Verdonschot, P. F. M. 1995. Canonicalcorrespondence-analysis and related multivariate methods inaquatic ecology. Aquatic Sciences, 57: 255–289.
Toresen, R., and Østvedt, O. J. 2000. Variations in the abundanceof Norwegian spring-spawning herring (Clupea harengus L.,Clupeidae) throughout the 20th century and the influence ofclimatic variations. Fish and Fisheries, 1: 231–256.
Walker, P. A., and Heessen, H. J. L. 1996. Long-term changes in raypopulations in the North Sea. ICES Journal of Marine Science,53: 1085–1093.
Distribution of chondrichthyans along the northern coast of Norway 1173
by guest on September 14, 2015
http://icesjms.oxfordjournals.org/
Dow
nloaded from
Walker, P. A., and Hislop, J. R. G. 1998. Sensitive skates or resilient rays?Spatial and temporal shifts in ray species composition in the centraland north-western North Sea between 1930 and the present day.ICES Journal of Marine Science, 55: 392–402.
Williams, T. 2007. Cartilaginous fishes along the North Norwegiancoast. Distributions and densities with regard to fishing
and sea temperature. Masters thesis in International FisheriesManagement, Norwegian College of Fishery Science, Universityof Tromsø. 62 pp.
doi:10.1093/icesjms/fsn103
1174 T. Williams et al.
by guest on September 14, 2015
http://icesjms.oxfordjournals.org/
Dow
nloaded from