Sediment transport along the Goa-north Karnataka coast, western India
10
ELSEVIER Marine Geology 118 (1994) 207 216 MARINE GEOLOGY ;NTERNATIONAL JOURNAL OF MARINE aEoLoa~ GEOCHEMISTRY 4NO GEO~'SlCS Sediment transport along the Goa-north Karnataka coast, western India Pravin D. Kunte National Institute of Oceanography Dona Paula, Goa 403004, India (Received July 26, 1993; revision accepted January 24, 1994) Abstract Landsat images, aerial photographs, and topographic maps of the coast of Goa and of north Karnataka were interpreted to delineate sediment-transport sectors. Thirty six sediment-transport sectors were identified from landform indicators and patterns of sediment transport. Although sediment-transport direction is bi-directional, net major sediment transport is southward. The geomorphic study identified possible sediment sources and sinks. Contributions of sources and losses due to sinks are assessed qualitatively as significant, moderate, marginal or unknown. The sediment balance is positive overall, and is reflected in large spits in the southern part of the study area. 1. Introduction Littoral (beach) and longshore (nearshore) sedi- ment transport have net vectors parallel to the coast. The overall direction of these transport mechanisms determines the areas of coastal erosion and accumulation, and influences the shapes and orientations of coastal landforms of an evolving coast. A coastal budget permits correlation between changes in landforms and supply of materials by different processes in space and time (Shuisky and Schwartz, 1983). Information on sediment- transport patterns is useful for regional and local coastal planning; management of the coastal zone for fish resources; engineering and growth manage- ment for sensitive marine-shoreline areas. A growing literature (Finkelstein, 1982; Schwartz et al., 1985; Schwartz and Anderson, 1986; Wallace, 1988; Taggart, 1989) outlines the advantages of geomorphic drift indicators, com- pared to short-term tracer studies or sediment traps 0025-3227/94/$7.00 © 1994 Elsevier Science B.V. All rights reserved SSDI 0025-3227(94)00008-9 or computed wave orthogonals, in determination of net alongshore direction of sediment transport. Earlier studies (Kunte and Wagle, 1993a,b; Kunte, in press) have demonstrated the capability of satel- lite remote sensing which provides periodic, integ- rated, and synoptic views, for determination of net direction of alongshore sediment-transport cor- rectly, economically, and quickly. The present study attempts to understand sedi- ment-transport patterns on the coasts of Goa and the northern sector of Karnataka (north Karn- ataka), along the west coast of India (Fig. 1), from remotely sensed landform drift indicators. Possible sediment sources and sinks are identified, and the sediment balance along these coasts is assessed. 2. Materials and methods Landsat 5 images and Multi-spectral Scanner (MSS) digital data, in four spectral bands, cover-
-
Upload
independent -
Category
Documents
-
view
6 -
download
0
Transcript of Sediment transport along the Goa-north Karnataka coast, western India

ELSEVIER Marine Geology 118 (1994) 207 216
MARINE GEOLOGY
;NTERNATIONAL JOURNAL OF MARINE aEoLoa~ GEOCHEMISTRY 4NO G E O ~ ' S l C S
Sediment transport along the Goa-north Karnataka coast, western India
Pravin D. Kunte
National Institute of Oceanography Dona Paula, Goa 403004, India
(Received July 26, 1993; revision accepted January 24, 1994)
Abstract
Landsat images, aerial photographs, and topographic maps of the coast of Goa and of north Karnataka were interpreted to delineate sediment-transport sectors. Thirty six sediment-transport sectors were identified from landform indicators and patterns of sediment transport. Although sediment-transport direction is bi-directional, net major sediment transport is southward. The geomorphic study identified possible sediment sources and sinks. Contributions of sources and losses due to sinks are assessed qualitatively as significant, moderate, marginal or unknown. The sediment balance is positive overall, and is reflected in large spits in the southern part of the study area.
1. Introduction
Littoral (beach) and longshore (nearshore) sedi- ment transport have net vectors parallel to the coast. The overall direction of these transport mechanisms determines the areas of coastal erosion and accumulation, and influences the shapes and orientations of coastal landforms of an evolving coast. A coastal budget permits correlation between changes in landforms and supply of materials by different processes in space and time (Shuisky and Schwartz, 1983). Information on sediment- transport patterns is useful for regional and local coastal planning; management of the coastal zone for fish resources; engineering and growth manage- ment for sensitive marine-shoreline areas.
A growing literature (Finkelstein, 1982; Schwartz et al., 1985; Schwartz and Anderson, 1986; Wallace, 1988; Taggart, 1989) outlines the advantages of geomorphic drift indicators, com- pared to short-term tracer studies or sediment traps
0025-3227/94/$7.00 © 1994 Elsevier Science B.V. All rights reserved SSDI 0025-3227(94)00008-9
or computed wave orthogonals, in determination of net alongshore direction of sediment transport. Earlier studies (Kunte and Wagle, 1993a,b; Kunte, in press) have demonstrated the capability of satel- lite remote sensing which provides periodic, integ- rated, and synoptic views, for determination of net direction of alongshore sediment-transport cor- rectly, economically, and quickly.
The present study attempts to understand sedi- ment-transport patterns on the coasts of Goa and the northern sector of Karnataka (north Karn- ataka), along the west coast of India (Fig. 1), from remotely sensed landform drift indicators. Possible sediment sources and sinks are identified, and the sediment balance along these coasts is assessed.
2. Materials and methods
Landsat 5 images and Multi-spectral Scanner (MSS) digital data, in four spectral bands, cover-

208 P.D. Kunte/Marine Geology 118 (1994) 207 216
O
N 0
r,~o6 fso I
~i 45 '
t N
G O A i O
, R
. .r,, H .p
f-.-- [ K • p ~ RAMA ! A
¢' i 15 ° ; L.. : oo,
o ,o \ t
74 "10 0 ' O0 '
Fig. 1. Map showing location of the study area.
oo'
14"
Fig. 2. Section of Landsat 5 image covering the Goa and north Karnataka coast.
tone) and islands, spits and beaches (bright tone) and other coastal landforms including shore line (gray tone) were located. Stereopairs of vertical aerial photographs of the Goa coast (1960, 1:15,000 approximate scale and 1973, 1:25,000 approximate scale) were studied to understand location, orientation, and the association of geo- morphic landforms with other landforms and to prepare a map (Fig. 3). For convenience of discus- sion, the study area is divided into two sectors (Fig. 1 ).
ing the Goa and north Karnataka coasts (Path 50, Row 146, dated 26/10/1986) (Fig. 2) were studied. Though these data provided adquate information on coastal features, little details were available for the nearshore region. Consequently, principal-component transformation was per- formed by digital processing of spectral bands, from which new principal-component images were generated. The first principal-component image (PC1) enhances coastal features, whereas the second principal-component image (PC2) is most suitable for studying patterns of nearshore turbidity.
From enlarged Landsat images, major geomor- phic features like rivers, creeks, estuaries (dark
2.1. Physiographic setting of the study area
The area under study is a coastal strip of 275 km long, in the Goa state and the northern sector of Karnataka state. It lies between 14°N and 15°45'N. Overall, the shoreline trends NNW-SSE. From north to south, it shows a series of dextral shifts to the east. The shoreline is crenulated and segmented, with alternating headlands, estuaries, beaches, cliffs, bays, creeks, and spits.
The Goa coast is underlain by rocks of the Goa Group, belonging to the Dharwar Supergroup of Archaean Proterozoic age, mainly metavolcanics, metagraywacke, and metabasalt (Gokul et al., 1981 ). The northern Karnataka coast is dominated by younger parts of the Precambrian Dharwar
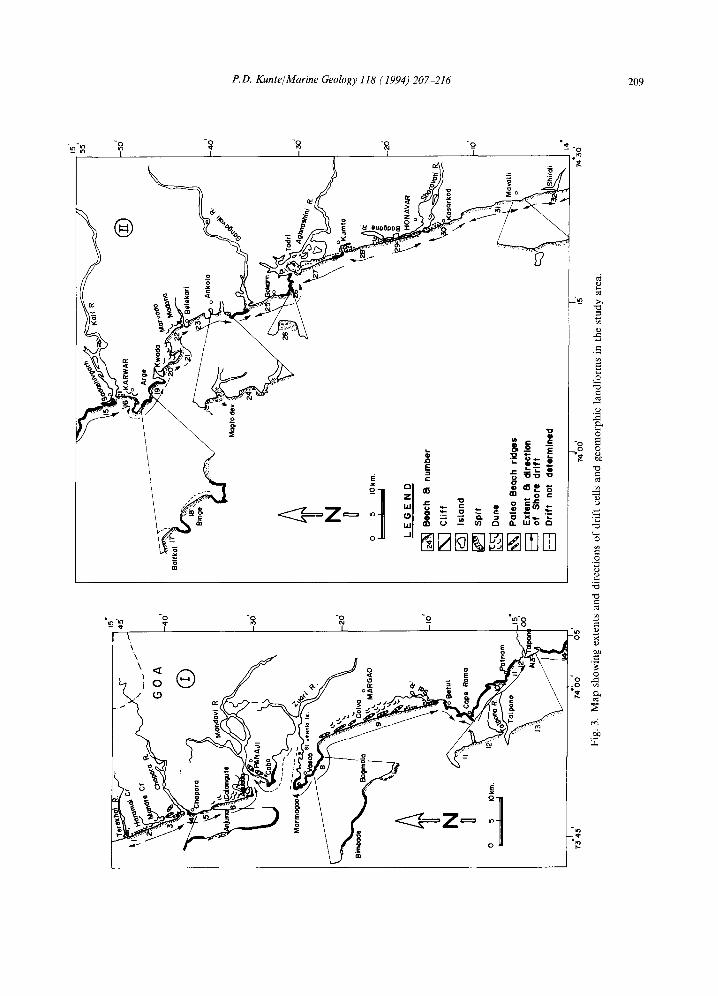
P.D. Kunte/Marine Geology 118 (1994) 207-216 209
-~ o -~ -oo s -o_ I I i l
., ~ !o( 0 '
.=
~ o
--o
~ / I "~
o
o g
I i
g
~=~ ~ I ° ~-~Z= : ~ o ~ =
- - ~ >-.
.o
3
i - -o -o -o o ~-c~
-~. , 7 , ~ -|i ~
\ o o ~-
. ~ ~ .,,J o o c
o _" .s)a 0
. ~ ~ ...... _
~ - - ' . ~ ~ / ~ : - - , 7 ~ ~-I
~/"~-- . . . . . . ' ~i ~ - o~"~ ' . - - - ' -
c~
©
210 P.D. Kunte/Marine Geology 118 (1994) 207-216
Group, mainly dolerites and granitic gneisses. Alluvium and coastal sands with laterites form a superficial cover concealing these varied base- ment rocks.
The region lies in the tropics, and has a warm, equable, humid climate. The area receives rainfall of about 350 cm/year, mostly during the southwest monsoon season (June to September). The mean wind speed varies from 5 to 10 knots with the maximum during the southwest monsoon period (Gune, 1979). The region experiences mixed semi- diurnal tides (range, 2.3 m) in the meso-tidal range (Veerayya et al., 1981).
3. Determination of sediment transport direction
The patterns of net alongshore sediment trans- port can be determined by finding littoral-drift sectors based on the variations in coastal configu- rations and nearby oceanographic conditions. A littoral-drift sector is a shoreline segment contain- ing three elements: (1) an erosional shoreline or other sediment source; (2) an accretional beach where sand and sediments are deposited; and (3) a neutral transport shoreline or driftway along which sediments move between erosional sources and accretional beaches.
Drift-direction indicators are reported in the literature (Jacobsen and Schwartz, 1981; Taggart and Schwartz, 1988; Kunte and Wagle, 1993a,b). Of these, indicators like stream-mouth diversion, direction of spit growth, active recession of cliffs, relative beach width, beach location and orienta- tion, orientation of tombolos, progradational beach ridges, and patterns of offshore turbidity that can be mapped readily from remote-sensing and field studies, were used. The indicators and their utilization are described below.
3.1. Stream-mouth diversion
If the volume of sediment accumulating on the updrift side of the stream mouth exceeds the stream's capacity to remove it, the stream will become progressively offset in the other direction (Jacobsen and Schwartz, 1981). Accordingly, southward diversion of rivers Chapora, Sal,
Badgane, and the creeks near Mandre and Haramal (Fig. 2) suggests sediment-transport direction toward the south. Other rivers like Sharavati and Aghnashini demonstrate that the alongshore sediment-transport direction is north. Lithologically and structurally diverted rivers like the Terekhol, Mandovi, Zuari, Talpona, Kali, and Gangavali are probably not representative of alongshore sediment-transport direction.
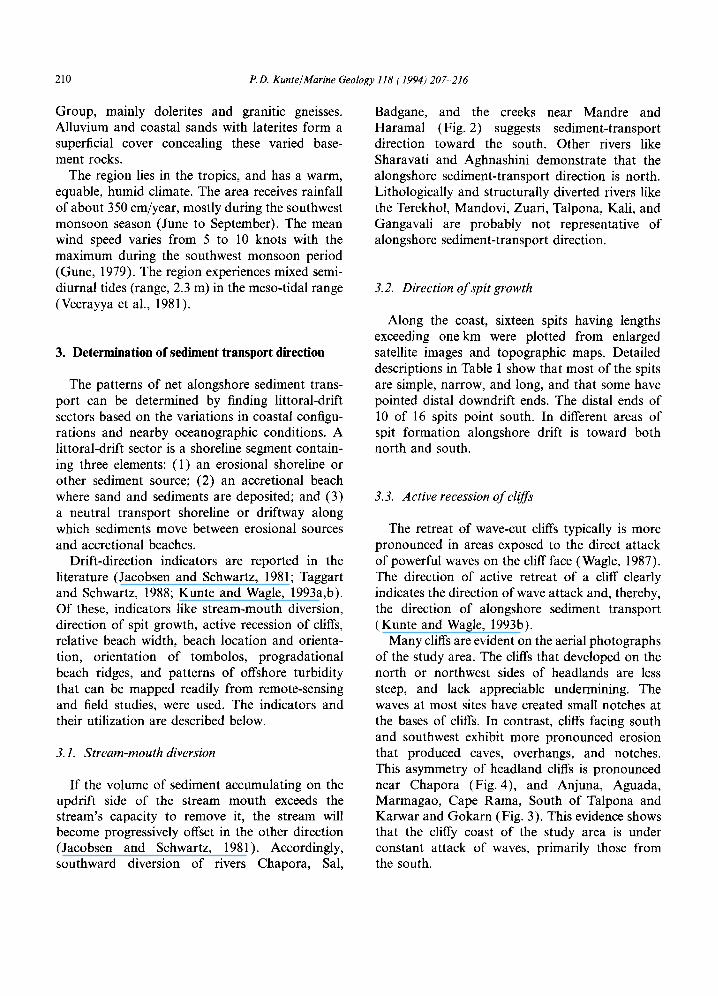
3.2. Direction of spit growth
Along the coast, sixteen spits having lengths exceeding one km were plotted from enlarged satellite images and topographic maps. Detailed descriptions in Table 1 show that most of the spits are simple, narrow, and long, and that some have pointed distal downdrift ends. The distal ends of 10 of 16 spits point south. In different areas of spit formation alongshore drift is toward both north and south.
3.3. Active recession of cliffs
The retreat of wave-cut cliffs typically is more pronounced in areas exposed to the direct attack of powerful waves on the cliff face (Wagle, 1987). The direction of active retreat of a cliff clearly indicates the direction of wave attack and, thereby, the direction of alongshore sediment transport (Kunte and Wagle, 1993b).
Many cliffs are evident on the aerial photographs of the study area. The cliffs that developed on the north or northwest sides of headlands are less steep, and lack appreciable undermining. The waves at most sites have created small notches at the bases of cliffs. In contrast, cliffs facing south and southwest exhibit more pronounced erosion that produced caves, overhangs, and notches. This asymmetry of headland cliffs is pronounced near Chapora (Fig. 4), and Anjuna, Aguada, Marmagao, Cape Rama, South of Talpona and Karwar and Gokarn (Fig. 3). This evidence shows that the cliffy coast of the study area is under constant attack of waves, primarily those from the south.
Tab
le
1
Loc
atio
ns
and
desc
ript
ions
of
sp
its
Sam
ple
Spit
no.
nam
e
Loc
atio
n T
otal
latit
udes
le
ngth
(“N
) (k
m)
Dis
tal
end
Def
lect
ion
of
rive
r Sp
it ty
pe
Len
gth
Wid
th
Des
crip
tion
Poin
ting
Nam
e of
T
owar
ds
Dis
tanc
e
(km
) (k
m)
rive
r
Ker
i 15
”42’
15”~
15”4
3’10
” 1.
75
0.50
0.
50
Har
amal
15
”55’
00”-
15”4
1’30
” 3.
75
1 .oo
0.
30
Man
dre
15”3
9’40
”-15
”39’
00”
1.50
0.
75
0.20
Mor
ji 15
”37’
35”-
15”3
6’40
” 2.
00
0.50
0.
50
5 B
etul
15
”11’
10’~
15”0
8’30
” 5.
00
3.00
0.
75
6 T
alpo
na
14”5
9’40
’-14
”59’
00”
1.25
0.
50
0.10
7
Gal
giba
g 14
”57’
40”-
14”5
7’25
” 0.
75
0.50
0.
40
8 Sa
dash
ivga
x .h
14”
52’0
0’-1
4”50
’30”
3.
75
2.50
0.
10
9 K
arw
ar
14”4
9’10
”-14
50’2
5”
2.00
0.
50
0.20
10
B
elek
eri
14”4
3’10
”-14
”42’
40”
1.00
0.
40
0.20
11
G
anga
vali
14”3
5’00
”~14
”35’
45”
1.50
0.
75
0.30
12
Tad
ri
14”2
6’30
’-14
31’3
0”
9.50
7.
50
1 .oo
13
Kum
ta
14”2
3’10
”-14
”25’
30”
5.55
3.
00
0.50
14
Hon
avar
14
”17’
05”~
14”2
3’00
” 9.
50
7.50
0.
50
15
Kas
arko
d 14
”15’
00”-
14”1
6’30
” 4.
00
2.00
0.
40
16
Shir
ali
14”0
1’15
”-14
”03’
15”
3.75
1.
00
0.30
Wid
e,
blun
t N
Nar
row
, bl
unt
S
Nar
row
, po
inte
d S
Wid
e,
blun
t S
Tri
angu
lar
Nar
row
, po
inte
d S
Nar
row
, po
inte
d S
Nar
row
, po
inte
d S
Lon
g,
curv
ed
S
Wid
e,
blun
t N
Poin
ted,
na
rrow
S
Wid
e,
blun
t N
Bro
ad,
squa
rish
N
Bro
ad,
squa
rish
N
Wid
e,
blun
t S
Poin
ted,
na
rrow
N
Poin
ted,
na
rrow
S
Ter
ekho
l
Har
amal
cr
eek
Man
dre
cree
k
Cha
pora
Sal
Tal
pona
Gal
giba
g
Cre
ek
Kal
i
Mad
ana
Gan
gava
li
Agh
nash
ini
Cre
ek
Bad
gane
Sh
arav
ati
Cre
ek
N
0.50
S
1.50
S 1.
25
S 1.
00
S 3.
00
S 0.
40
S 0.
50
S 2.
50
N
0.50
S 0.
40
N
0.75
N
7.
50
N
2.00
S 6.
50
N
3.00
S 3.
00
Com
posi
te
Sim
ple
Sim
ple
Com
posi
te
recu
rved
ty
pe
Sim
ple
Sim
ple
Sim
ple
Sim
ple,
cu
rved
Com
posi
te
Sim
ple
Com
posi
te,
curv
ed
Com
posi
te
Sim
ple
Com
posi
te
Com
nosi
te.
curv
ed
212 P.D. Kunte/Marine Geology 118 (1994) 207-216
southward or westward sediment transport direc- tion, opposed to the net direction in that coastal segment, whereas beaches 3, 28 and 32 suggest the other direction.
Fig. 4. View of the promontory situated just south of Chapora River. The promontory retreated under the powerful attack of waves from the northwest and southwest side.
3.4. Relative beach width
Thirty two separate beaches with asymmetry were identified on the aerial photographs in the study area. The width, location, and orientation of each beach with respect to other landforms, such as promontories, bays, rivers and estuaries, and to wave approach are very significant predic- tors of alongshore sediment transport. Generally, beach width increases through a drift cell in the down-drift direction (Taggart and Schwartz, 1988). Thirteen beaches widen toward the south and four protected beaches widen to the southeast, whereas nine beaches widen toward the north and one widens towards the northwest (Table2). Beaches 6, 12, 13, 30 and 31 have greater widths at both ends, which suggests that the shore drift may be in both directions. Thus, asymmetric beach widths suggest that alongshore sediment transport is bidirectional.
3.5. Beach location and orientation
In the study area, promontories, like Marmagao, Cape Rama, and Karwar, lie almost normal to the shoreline. Beaches 8, 17, 18, 19 and 20 (Table 2) are stretched nearly E-W along the south side of these promontories. This sand accumulation results because northward alongshore sediment transport is partially obstructed by these promon- tories. Beaches 14, 21 and 24 suggest a local
3.6. Orientation o f tombolos
From aerial photos taken at low tide, it is observed that sand accumulates initially in the shadow zone of wave fronts, between an island and the coast, to form cone-shape accumulations where the alongshore drift is obstructed. The cone points in the direction of net alongshore drift. At an advanced stage, this accumulation joins an island with the coast, to form a tombolo. A tombolo is present off Mavalli (14°05'36"N), where Murdashwar Island has been joined to the coast. Similarly, a tombolo has joined St. Jesinto Island with the coast. Off Ankola (14°39'20"N), a growing spit (Fig. 2) is likely to join Magtodev Island with the coast.
According to Feio (1956) the present Marmagao headland was also an island now connected with the mainland by a tombolo on which now stands the city of Vasco. Panaji City (Altinho hillock) and Aguada headland have been joined to the mainland by tombolos (Wagle, 1987).
3. 7. Progradational beach ridges
Multiple beach ridges form by progradation. Such abandoned beach ridges locally show moder- ate to major changes in the orientation of succes- sive shorelines. Such changes in trend can be useful in understanding present and past sediment trans- port directions (Kunte and Wagle, 1993a).
On the aerial photographs the multiple beach ridges appear as light to medium gray speckled areas with medium texture. Such ridges are located behind the modern beaches at Miramar, Car- anzalem (near Panaji), Colva, and north of Chapora. Although the spacing between the beach ridges is variable, they are oriented mostly parallel to the present shoreline (Fig. 3). Almost straight beach ridges parallel to the present shoreline indi- cate that the previous sediment transport was bi-directional (Kunte and Wagle, 1993a,b).
P.D. Kunte/Marine Geology 118 (1994) 207-216
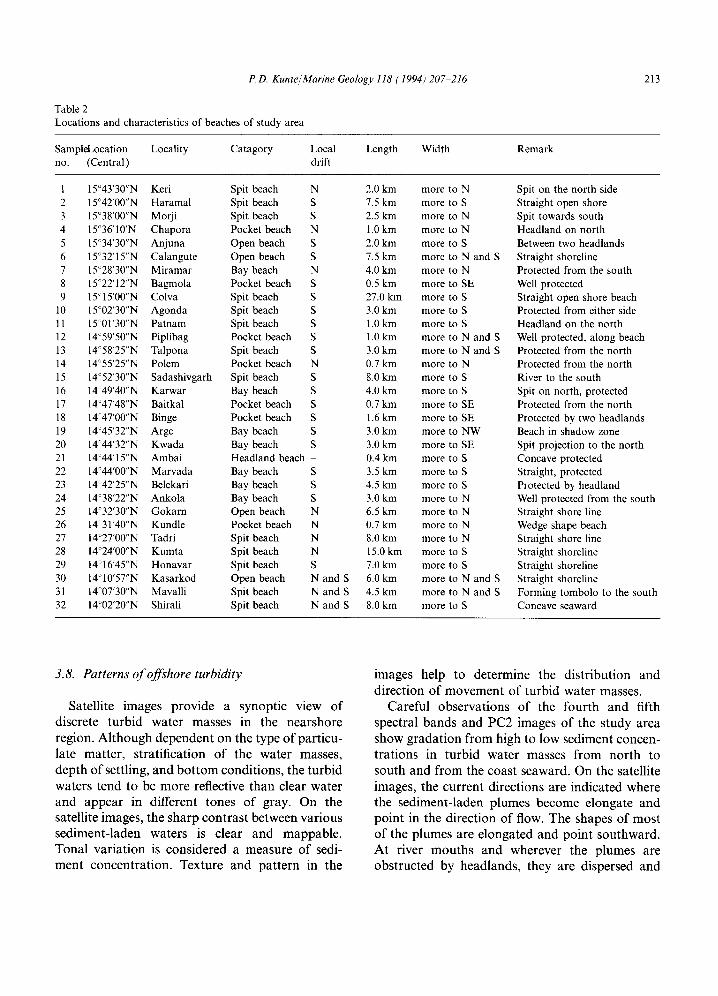
Table 2 Locations and characteristics of beaches of study area
213
SampleLocation Locality Catagory Local Length Width Remark no. (Central) drift
1 15°43'30"N Keri Spit beach N 2.0 km more to N 2 15°42'00"N Haramal Spit beach S 7.5 km more to S 3 15°38'00"N Morji Spit beach S 2.5 km more to N 4 15°36'10'N Chapora Pocket beach N 1.0 km more to N 5 15°34'30"N Anjuna Open beach S 2.0 km more to S 6 15°32'15"N Calangute Open beach S 7.5 km more to N and S 7 15°28'30"N Miramar Bay beach N 4.0 km more to N 8 15°22'12"N Bagmola Pocket beach S 0.5 km more to SE 9 15°15'00"N Colva Spit beach S 27.0 km more to S
10 15°02'30"N Agonda Spit beach S 3.0 km more to S 1l 15°01'30"N Patnam Spit beach S 1.0 km more to S 12 14°59'50"N Piplibag Pocket beach S 1.0 km more to N and S 13 14°58'25"N Talpona Spit beach S 3.0 km more to N and S 14 14°55'25"N Polem Pocket beach N 0.7 km more to N 15 14°52'30"N Sadashivgarh Spit beach S 8.0 km more to S 16 14°49'40"N Karwar Bay beach S 4.0km more to S 17 14°47'48"N Baitkal Pocket beach S 0.7 km more to SE 18 14°47'00"N Binge Pocket beach S 1.6 km more to SE 19 14°45'32"N Arge Bay beach S 3.0 km more to NW 20 14°44'32"N Kwada Bay beach S 3.0 km more to SE 21 14°44'15"N Ambai Headland beach 0.4km more to S 22 14°44'00"N Marvada Bay beach S 3.5 km more to S 23 14°42'25"N Belekari Bay beach S 4.5 km more to S 24 14°38'22"N Ankola Bay beach S 3.0 km more to N 25 14°32'30"N Gokarn Open beach N 6.5 km more to N 26 14°31'40"N Kundle Pocket beach N 0.7 km more to N 27 14°27'00"N Tadri Spit beach N 8.0 km more to N 28 14°24'00"N Kumta Spit beach N 15.0 km more to S 29 14°16'45"N Honavar Spit beach S 7.0 km more to S 30 14°10'57"N Kasarkod Open beach N and S 6.0 km more to N and S 31 14°0T30"N Mavalli Spit beach N and S 4.5 km more to N and S 32 14°02'20"N Shirali Spit beach N and S 8.0 km more to S
Spit on the north side Straight open shore Spit towards south Headland on north Between two headlands Straight shoreline Protected from the south Well protected Straight open shore beach Protected from either side Headland on the north Well protected, along beach Protected from the north Protected from the north River to the south Spit on north, protected Protected from the north Protected by two headlands Beach in shadow zone Spit projection to the north Concave protected Straight, protected Protected by headland Well protected from the south Straight shore line Wedge shape beach Straight shore line Straight shoreline Straight shoreline Straight shoreline Forming tombolo to the south Concave seaward
3.8. Patterns of offshore turbidity
Sa te l l i t e i m a g e s p r o v i d e a s y n o p t i c v i e w o f
d i s c r e t e t u r b i d w a t e r m a s s e s in t h e n e a r s h o r e
r e g i o n . A l t h o u g h d e p e n d e n t o n t h e t y p e o f p a r t i c u -
l a t e m a t t e r , s t r a t i f i c a t i o n o f t h e w a t e r m a s s e s ,
d e p t h o f se t t l ing , a n d b o t t o m c o n d i t i o n s , t h e t u r b i d
w a t e r s t e n d t o b e m o r e re f lec t ive t h a n c l ea r w a t e r
a n d a p p e a r in d i f f e r e n t t o n e s o f g ray . O n t he
sa te l l i t e i m a g e s , t h e s h a r p c o n t r a s t b e t w e e n v a r i o u s
s e d i m e n t - l a d e n w a t e r s is c l e a r a n d m a p p a b l e .
T o n a l v a r i a t i o n is c o n s i d e r e d a m e a s u r e o f sedi-
m e n t c o n c e n t r a t i o n . T e x t u r e a n d p a t t e r n in t he
i m a g e s h e l p to d e t e r m i n e t he d i s t r i b u t i o n a n d
d i r e c t i o n o f m o v e m e n t o f t u r b i d w a t e r m a s s e s .
C a r e f u l o b s e r v a t i o n s o f t h e f o u r t h a n d f i f th
s p e c t r a l b a n d s a n d P C 2 i m a g e s o f t he s t u d y a r e a
s h o w g r a d a t i o n f r o m h i g h to l ow s e d i m e n t c o n c e n -
t r a t i o n s in t u r b i d w a t e r m a s s e s f r o m n o r t h to
s o u t h a n d f r o m t h e c o a s t s e a w a r d . O n t he sa te l l i t e
i m a g e s , t h e c u r r e n t d i r e c t i o n s a re i n d i c a t e d w h e r e
t h e s e d i m e n t - l a d e n p l u m e s b e c o m e e l o n g a t e a n d
p o i n t in t h e d i r e c t i o n o f f low. T h e s h a p e s o f m o s t
o f t h e p l u m e s a r e e l o n g a t e d a n d p o i n t s o u t h w a r d .
A t r i v e r m o u t h s a n d w h e r e v e r t he p l u m e s a re
o b s t r u c t e d b y h e a d l a n d s , t h e y a re d i s p e r s e d a n d
214 P.D. Kunte/Marine Geology 118 (1994) 207-216
deflected seaward. Based on tonal gradation and current direction, the suspended-sediment trans- port direction is to the south.
4. Sediment budget
A sediment budget is a volumetric accounting of the material eroded and deposited in a given stretch of coast (Stapor, 1973). It is based on quantification of sediment transport, erosion, and deposition for a given coastal segment. The sedi- ment usually discussed is sand, and the controlling processes are either alongshore drift or those caused by humans. Any process that increases the quantity of sand available downdrift in a given coastal segment is a source, whereas any process that decreases the quantity of sand available down- drift is a sink. The coastal sector, for which sediment budget is to be calculated, would have shore-parallel boundaries landward of the line of expected erosion and at or beyond the seaward limit of significant transport (CERC, 1977).
Offshore bathymetry, studied from Indian Naval Hydrographic Chart No. 257 (Naval Hydro- graphic Office, India, 1979), shows no submarine canyons along the coast under study, so their role as a sink is unlikely. The continental shelf received deposits of sandy sediments as a consequence of postglacial transgression (Nair and Pylee, 1968). Therefore, it is likely that substantial quantities of sediments have been derived from offshore and added to the littoral zone under conditions of rising sea level (Murty et al., 1976). Under con- stant attack of strong waves, cliffs and headlands are eroding rapidly (Fig. 4). Rock fractures, which are parallel to the coast, accelerate wave erosion. Sand fractions contributed by major rivers like the Mandovi and Zuari are a minor factor. These sands are trapped in estuaries and in turn nourish the bay beaches (Nair and Hashimi, 1986). Kali River is nourishing beaches situated to the south of it (Nayak and Chavadi, 1989). The Gangavali, Aghnashini and Sharavati rivers are contributing sediments to local spits.
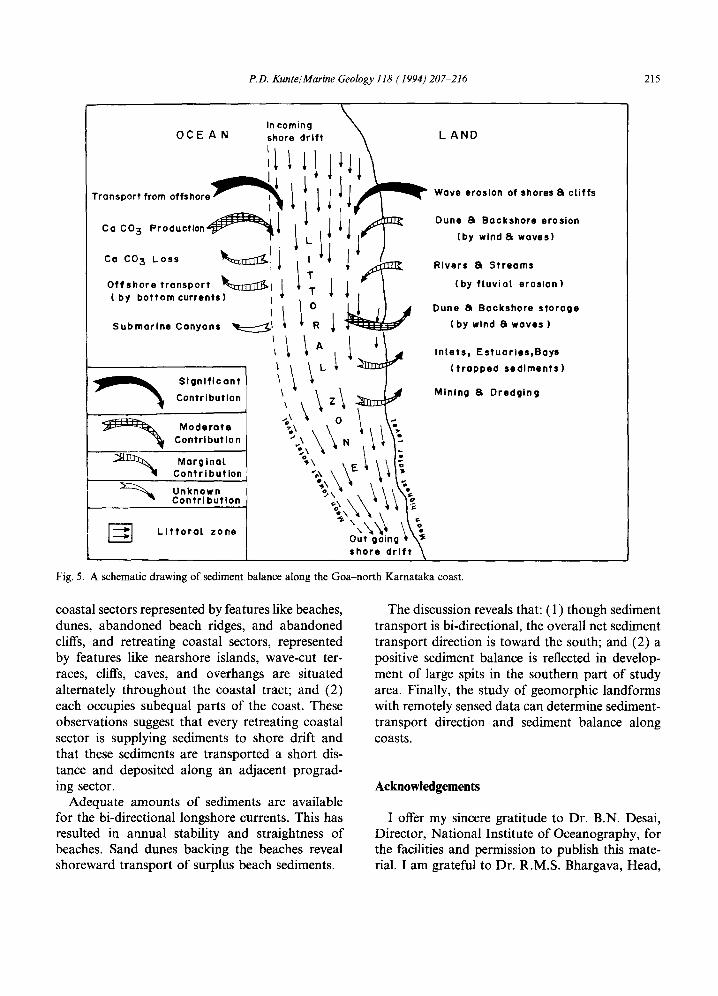
The processes of transport of sand are presented in Fig. 5. From these, an estimate of sediment balance can be made. Wave erosion of shores and cliffs, dune and backshore erosion by waves, winds,
and streams, landward transfer from offshore by storm waves, and carbonate production by organ- isms (Wagle, 1987) are identified as sources. Sediment trapped in inlets, estuaries, bays, and dunes, or transferred to offshore slopes, plus car- bonate loss, and mining and dredging are identified as sinks. Within the study area, the contributions of sources and losses due to sinks are assessed qualitatively as significant, moderate, marginal, and unknown (Fig. 5).
5. Discussion and conclusion
The present study of landform indicators and turbidity patterns identified thirty four sectors of alongshore sediment transport. Of these, eighteen sectors show sediment transport to the south and twelve sectors, to the north. The sediment- transport direction in four sectors is not clearly defined. Though nearly half of the alongshore- drift sectors have a northward drift direction, those sectors with a southward drift direction are much longer. Therefore, it is likely that net sediment- transport direction overall is toward the south.
A heavy-mineral study (Nayak and Chavadi, 1989) revealed that the Kali River is the source for the sediments of beaches at Karwar, Baitkal, Binge, Arge and Kwada, situated south of the Kali River. Sediment-transport direction, determined from landform drift indicators along the coasts north and south of the study area (Kunte and Wagle, 1991, 1993a) are also to the south.
The Arabian sea as a whole is dominated by a reversal of winds during the two monsoon seasons. As a consequence, along the west coast of India, during the southwestern monsoon, winds blow southwards from May to September and attain a northerly direction during the northeastern mon- soon, with a transitional period between. Thus, the seasonally reversing wind pattern influences southward drift during the southwestern monsoon while northward drift occurs during the northeast- ern monsoon. Therefore, the sediment-transport direction within each littoral-drift sector can be either north or south, coincident with the dominant seasonal winds.
It is interestingly observed that: (1) prograding
P.D. Kunte/Marine Geology 118 (1994) 207-216 215
O C E A N In coming shore d r i f t
Transport from offshore
Ca CO 3 P r o d u c t i o n ~ i ~
Ca CO 3 Loss ~ - r ~ [ i 1
Offshore t r anspo r t ~r i " t ' t ' t~v l ( b y b o t t o m currents) L
'1 S u b m a r i n e Canyons '~:::::Z~I
S i g n i f i c a n t
Cont r ibu t ion
M o d e r a t e Con t r l bu t l on
Marginal C o n t r l b u t l o n
Unknown C o n t r l b u t t o n
L l f f o r o t zone
iI i=
LAND
Wove erosion of shores ~ ctiffs
Dune ~ Bookshore erosion
(by w i n d ~ waves)
R ivers ~ S t reams
l by f l u v i a l e r o s l o n l
Dune a Bockshore storage
(by wlnd ~ waves )
I n te t s , E s t u a r i e s , B o y s
( t r a p p e d sed imen ts )
Mining 8, Dredging
Fig. 5. A schematic drawing of sediment balance along the Goa-north Karnataka coast.
coastal sectors represented by features like beaches, dunes, abandoned beach ridges, and abandoned cliffs, and retreating coastal sectors, represented by features like nearshore islands, wave-cut ter- races, cliffs, caves, and overhangs are situated alternately throughout the coastal tract; and (2) each occupies subequal parts of the coast. These observations suggest that every retreating coastal sector is supplying sediments to shore drift and that these sediments are transported a short dis- tance and deposited along an adjacent prograd- ing sector.
Adequate amounts of sediments are available for the bi-directional longshore currents. This has resulted in annual stability and straightness of beaches. Sand dunes backing the beaches reveal shoreward transport of surplus beach sediments.
The discussion reveals that: ( 1 ) though sediment transport is bi-directional, the overall net sediment transport direction is toward the south; and (2) a positive sediment balance is reflected in develop- ment of large spits in the southern part of study area. Finally, the study of geomorphic landforms with remotely sensed data can determine sediment- transport direction and sediment balance along coasts.
Acknowledgements
I offer my sincere gratitude to Dr. B.N. Desai, Director, National Institute of Oceanography, for the facilities and permission to publish this mate- rial. I am grateful to Dr. R.M.S. Bhargava, Head,
216 P.D. Kunte/Marine Geology 118 (1994) 207-216
Data and Information Division for his keen inter- est and encouragement. I am also thankful to Dr. B.G. Wagle for critically going through the manu- script and for his help. Clarity and organisation of the final draft was improved by the helpful reviews of Drs. Robert Oaks Jr. and the late Andr6 Guilcher.
References
Coastal Engineering Research Center, 1977. Shore protection manual. U.S. Gov. Print. Press, Washington, 1: 116-134.
Feio, M., 1956. Problemas geomorphologicas de Goa. Garcia de Orta Rev. Junta Miss Geogr. Invest. Ultram, 78, 39 pp.
Finkelstein, K., 1982. Morphological variations and sediment transport in crenulate-bay beaches, Kodiak Island, Alaska. Mar. Geol., 47: 261-81.
Gune, V.T., 1979. Gazetter of the union territory Goa, Daman and Diu. District Gazetter, Part 1, Goa.
Gokul, A.R., Srinivasan, M.D., Gopalkrisna, K. and Viswanathan, L.S., 1981. Stratigraphy and structure of Goa. Seminar on Earth Resources for Goa's development. GSI, Calcutta, pp. 1-13.
Jacobsen, E.E. and Schwartz, M.L., 1981. The use of geomorphic indicators to determine the direction of net shore-drift. Shore Beach, 49: 38-43.
Kunte, P.D., in press. Potential usage of remote sensing data for studying behavior of shore drift along Kerala coast, India. J. Estuarine Coastal Shelf Sci.
Kunte, P.D. and Wagle, B.G., 1991. Spit evolution and shore drift direction along south Karnataka coast, India. G. Geol., 53(2): 71-80.
Kunte, P.D. and Wagle, B.G., 1993a. Remote sensing approach to determine net shore drift direction--A case study of central east coast of India. J. Coastal Res., 9(3): 663-672.
Kunte, P.D. and Wagle, B.G., 1993b. Determination of net shore drift direction of central west coast of India using remotely sensed data. J. Coastal Res., 9(3): 811-822.
Murty, C.S., Das, P.K., Nair, R.R., Veerayya M. and Varadachari, V.V.R., 1976. Circulation and sedimentation processes in and around the Aguada bar. Indian J. Mar. Sci., 5: 9-17.
Nair, R.R. and Hashimi, N.H., 1986. Influence of estuaries on shelf sediment texture. J. Coastal Res., 2(2): 199-203.
Nair, R.R. and Pylee, A., 1968. Size distribution and carbonate content of the sediments of western shelf of India. Bull. Natl. Inst. Sci. India, 38, 411 pp.
Naval Hydrographic Office, India, 1979. Hydrographic Chart No. 257; Malvan to Honnavar.
Nayak, G.N. and Chavadi, V.C., 1989. Distribution of heavy minerals in the beach sediments around Kali River, Karwar, West coast of India. Geol. Soc. India Spec. Publ., 24: 241-245.
Schwartz, M.L., Mahala, J. and Bronson, H.J., 1985. Net shore-drift along the Pacific Coast of Washington State. Shore Beach, 53:21 25.
Schwartz, M.L. and Anderson, B., 1986. Coastal geomorphol- ogy of Padre Island, Mexico. Shore Beach, 54: 22-29.
Shuisky, Y.D. and Schwartz, M.L., 1983. Basic principle of sediment budget study in the coastal zone. Shore Beach, 51: 34-40.
Stapor, F.W., 1973. History and sand budget of the barrier island system in the Panama City, Florida region. Mar. Geol., 14: 277-286.
Taggart, B.E., 1989. Determination of net shore-drift of Kitsap County, Washington using geomorphic and sedimentological indicators. In: W.F. Tanner (Editor), Coastal Sediment Mobility. Proc. 8th Symp. Coastal Sedimentology. Florida State Univ., Tallahassee, FL, pp. 167-182.
Taggart, B.E. and Schwartz, M.L., 1988. Net shore-drift direction determination: A systematic approach. J. Shoreline Management, 4: 285-309.
Veerayya, M., Murty, C.S. and Varadachari, V.V.R., 1981. Wave refraction and littoral currents off Colva beach, Goa. Indian J. Mar. Sci., 10: 1-9.
Wagle, B.G., 1987. Geomorphology and evolution of the coastal and offshore areas of Maharashtra and Goa, India. Ph.D. Thesis, Univ. Bombay, 166 pp.
Wallace, R.S., 1988. Quantification of net shore-drift rates in Puget Sound and the Strait of Juan de Fuca, Washington. J. Coastal Res., 4: 395-403.