The dependence of chemical exchange on boundary selection in a fibronectin type III domain from...
14
The Dependence of Chemical Exchange on Boundary Selection in a Fibronectin Type III Domain from Human Tenascin Alison E. Meekhof, Stefan J. Hamill, Vickery L. Arcus, Jane Clarke and Stefan M. V. Freund* MRC Unit for Protein Function and Design Cambridge Center for Protein Engineering, University Chemical Laboratories, Lensfield Road, Cambridge, CB2 1EW United Kingdom The third fibronectin type III domain from human tenascin adopts a com- pact b-sandwich fold. Its boundaries were originally selected to encode a 90-residue domain (TNfn3 1-90 ). We conclude that the dynamic properties of TNfn3 are more accurately represented when the C terminus is extended by the two naturally succeeding residues. Longitudinal (R 1 ) and transverse (R 2 ) 15 N relaxation rates, and { 1 H- 15 N} NOE enhancements at pH 4.9 and 300 K are presented for TNfn3 1-90 and TNfn3 1-92 , the extended form, at two field strengths (11.74 and 14.10 T). Nearly identical results confirm their similar motional properties over a broad range of timescales. However, a number of residues near the C terminus in TNfn3 1-90 exhibit elevated transverse relaxation rates and broadened sig- nals in 1 H- 15 N HSQC spectra. Explicit rates of chemical exchange for five residues in TNfn3 1-90 were determined by measuring transverse relax- ation rates in a series of CPMG experiments with spin-echo refocusing delays increasing from 311 to 1436 ms. Calculated exchange rates average 1000(311) s 1 , with individual uncertainties near 20%. Homonuclear TOCSY experiments collected between pH 4 and 7 reveal the coincident titration of two acidic clusters in TNfn3 1-90 at pH 5.64(0.47). The repul- sive electrostatic interaction of the C-terminal carboxylate with one of these clusters may promote chemical exchange in the shorter domain. Additionally, NOE and chemical shift data suggest hydrogen bond for- mation between the added residues and adjacent loops. The data affirm the importance of judiciously selecting domain boundaries prior to the characterization of molecular properties. # 1998 Academic Press Keywords: NMR; fibronectin type III; domain; boundary selection; backbone dynamics *Corresponding author Introduction Independently folding subunits of larger pro- teins, called domains or modules, are common in biological systems. These proteins act as stable building blocks for larger proteins with diverse structural and functional roles (Baron et al., 1991; Bork, 1992). Convenient for NMR study, domains are typically less than 100 amino acids in length. Their characteristics can provide valuable insight into the behaviour of the larger proteins which they comprise. One of the biggest challenges confronting research on such proteins is the appropriate selec- tion of domain boundaries. The relationship between boundary selection and protein stability was first examined in the immunoglobulin Present addresses: V. L. Arcus, School of Biological Sciences, University of Auckland, Auckland, New Zealand; J. Clarke, University of Cambridge, Department of Chemistry, Lensfield Road, Cambridge CB2 1EW, United Kingdom. Abbreviations used: TNfn3, third fibronectin type III domain from human tenascin; NMR, nuclear magnetic resonance; 2D, two-dimensional; 3D, three-dimensional; TOCSY, total correlation spectroscopy; NOESY, nuclear Overhauser effect spectroscopy; HSQC, heteronuclear single-quantum correlation; CPMG, Carr-Purcell- Meiboom-Gill; R 1 , longitudinal relaxation rate; R 2 , transverse relaxation rate; ppm, parts per million; rms, root mean square; TSP, 3-(Trimethylsilyl) propionic acid. E-mail address of the corresponding author: [email protected] Article No. mb982019 J. Mol. Biol. (1998) 282, 181–194 0022 – 2836/98/360181–14 $30.00/0 # 1998 Academic Press
-
Upload
independent -
Category
Documents
-
view
0 -
download
0
Transcript of The dependence of chemical exchange on boundary selection in a fibronectin type III domain from...

Article No. mb982019 J. Mol. Biol. (1998) 282, 181±194
The Dependence of Chemical Exchange on BoundarySelection in a Fibronectin Type III Domain fromHuman Tenascin
Alison E. Meekhof, Stefan J. Hamill, Vickery L. Arcus, Jane Clarkeand Stefan M. V. Freund*
MRC Unit for ProteinFunction and DesignCambridge Center for ProteinEngineering, UniversityChemical Laboratories, Lens®eldRoad, Cambridge, CB2 1EWUnited Kingdom
Present addresses: V. L. Arcus, SSciences, University of Auckland,Zealand; J. Clarke, University of CDepartment of Chemistry, Lens®elCB2 1EW, United Kingdom.
Abbreviations used: TNfn3, thirddomain from human tenascin; NMresonance; 2D, two-dimensional; 3TOCSY, total correlation spectroscOverhauser effect spectroscopy; Hsingle-quantum correlation; CPMGMeiboom-Gill; R1, longitudinal relatransverse relaxation rate; ppm, paroot mean square; TSP, 3-(Trimeth
E-mail address of the [email protected]
0022±2836/98/360181±14 $30.00/0
The third ®bronectin type III domain from human tenascin adopts a com-pact b-sandwich fold. Its boundaries were originally selected to encode a90-residue domain (TNfn31-90). We conclude that the dynamic propertiesof TNfn3 are more accurately represented when the C terminus isextended by the two naturally succeeding residues. Longitudinal (R1)and transverse (R2) 15N relaxation rates, and {1H-15N} NOE enhancementsat pH 4.9 and 300 K are presented for TNfn31-90 and TNfn31-92, theextended form, at two ®eld strengths (11.74 and 14.10 T). Nearly identicalresults con®rm their similar motional properties over a broad range oftimescales. However, a number of residues near the C terminus inTNfn31-90 exhibit elevated transverse relaxation rates and broadened sig-nals in 1H-15N HSQC spectra. Explicit rates of chemical exchange for ®veresidues in TNfn31-90 were determined by measuring transverse relax-ation rates in a series of CPMG experiments with spin-echo refocusingdelays increasing from 311 to 1436 ms. Calculated exchange rates average1000(�311) sÿ1, with individual uncertainties near 20%. HomonuclearTOCSY experiments collected between pH 4 and 7 reveal the coincidenttitration of two acidic clusters in TNfn31-90 at pH 5.64(�0.47). The repul-sive electrostatic interaction of the C-terminal carboxylate with one ofthese clusters may promote chemical exchange in the shorter domain.Additionally, NOE and chemical shift data suggest hydrogen bond for-mation between the added residues and adjacent loops. The data af®rmthe importance of judiciously selecting domain boundaries prior to thecharacterization of molecular properties.
# 1998 Academic Press
Keywords: NMR; ®bronectin type III; domain; boundary selection;backbone dynamics
*Corresponding authorchool of BiologicalAuckland, Newambridge,d Road, Cambridge
®bronectin type IIIR, nuclear magneticD, three-dimensional;opy; NOESY, nuclearSQC, heteronuclear, Carr-Purcell-xation rate; R2,rts per million; rms,ylsilyl) propionic acid.ing author:
Introduction
Independently folding subunits of larger pro-teins, called domains or modules, are common inbiological systems. These proteins act as stablebuilding blocks for larger proteins with diversestructural and functional roles (Baron et al., 1991;Bork, 1992). Convenient for NMR study, domainsare typically less than 100 amino acids in length.Their characteristics can provide valuable insightinto the behaviour of the larger proteins whichthey comprise.
One of the biggest challenges confrontingresearch on such proteins is the appropriate selec-tion of domain boundaries. The relationshipbetween boundary selection and protein stabilitywas ®rst examined in the immunoglobulin
# 1998 Academic Press
182 Boundary Selection and TNfn3 Dynamics
domains of titin (Politou et al., 1994). Extending theN terminus of the M5 domain by six residues pro-vided new hydrogen bonds to the existing b sheetand increased hydrophobic packing, stabilizing theprotein by 4.7 kcal molÿ1 at neutral pH (Pfuhl et al.,1997). Module stability may be further improved atthe interdomain interface. The stability of the ninth®bronectin type III domain of ®bronectin increasedfrom 0.6 to 3.4 kcal molÿ1 when paired with itsC-terminal neighbour (Spitzfaden et al., 1997).A reduction in ¯exibility was also noted for one ofthe loop residues at the domain interface. If an iso-lated domain does not retain the native propertiesof the intact protein, a true understanding of phys-iological form and function is impossible. Althoughstructural integrity is the primary requirement fordomain selection, changes in molecular dynamicproperties can have functional consequences(BruÈ nger et al., 1987).
The ®bronectins form one of the largestdomain families. These proteins are found mostprevalently in the extracellular matrix, wherethey ful®ll structural roles or act as cell surfacesignaling receptors important during growth,healing, and disease (Bork & Doolittle, 1992;Erickson, 1997). The third ®bronectin type IIIdomain from human tenascin, TNfn3, originallyde®ned as residues 802 to 891 of the multimodu-lar protein, has been particularly well-studied. AnX-ray crystal structure was determined to a resol-ution of 1.8 AÊ (Leahy et al., 1992b), and its stab-ility, folding kinetics (Clarke et al., 1997), anddynamic properties (Akke et al., 1998; Carr et al.,1997) have been characterized.
Using 15N relaxation measurements, we demon-strate the impact of C-terminal boundary selectionon dynamic motion. In the original domain,TNfn31-90, chemical exchange on a millisecondtimescale is observed for a cluster of non-contigu-ous residues in the C-terminal region. This motionis eliminated, and domain stability increases(Hamill et al., 1998), when the C terminus isextended by the two naturally succeeding residues.The titration properties of acidic residues sur-rounding the C terminus suggest that unfavourableelectrostatic interactions may promote chemicalexchange in TNfn31-90. Additionally, NOE andchemical shift data indicate the formation of twohydrogen bonds between the extended strand andthe surrounding loops. Homology studies implythat these hydrogen bonds are present in the nativemultimodular protein (Hamill et al., 1998). Therelationship between motional properties and crys-tallographic B factors is also discussed.
We have further attempted to characterize ratesof chemical exchange on the millisecond timescalein TNfn31-90 by recording 15N transverse relaxationrates, R2, in a series of CPMG experiments withincreasing spin-echo refocusing delays (Orekhovet al., 1994). We supplement traditional analysiswith a second approach, in which the ``exchange-free'' component of R2 for each residue is ®xed atthe corresponding rate in TNfn31-92. This method
adds an independent point to each data set, whilereducing the number of curve ®tting parameters.Agreement between the two methods con®rms theutility of TNfn31-92 as a reference against whichanomalies in the truncated version can be directlycompared.
Results
Assignment of resonances
Sequence assignments for TNfn31-90 at pH 4.9and 300 K were determined from 3D 1H, 15NTOCSY and NOESY experiments. A 1H, 13C, 15NCBCA(CO)NH spectrum was collected to con®rmsequential connectivities. Conditions for theseexperiments were carefully selected to maximizeprotein stability (Clarke et al., 1997) and to avoidthe effects of acidic residue titration at higher pH(see Discussion).
Few chemical shift differences were observed inthe longer domain, but a duplicate set of exper-iments, including HBHA(CO)NH and HNCACBexperiments, was performed in order to con®rmthe sequence assignment. 1H and 15N assignmentsfor TNfn31-92 are shown in Figure 1.
Temperature and sequence dependence ofsignal intensities
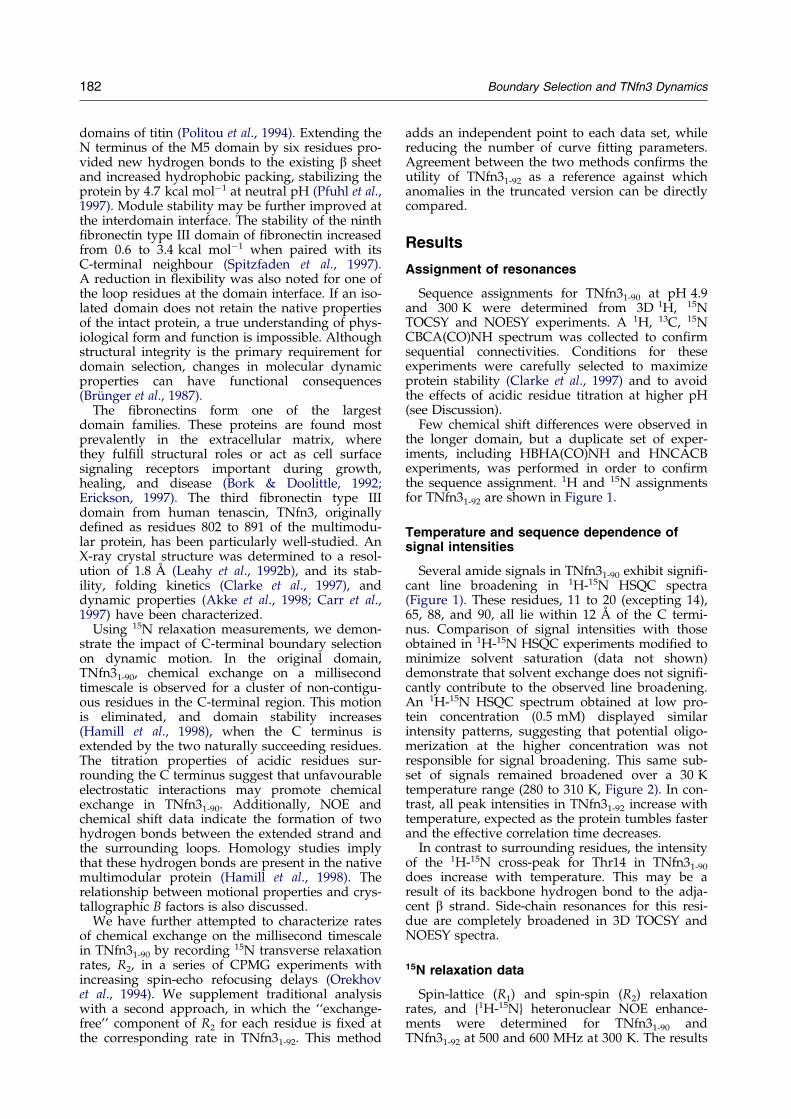
Several amide signals in TNfn31-90 exhibit signi®-cant line broadening in 1H-15N HSQC spectra(Figure 1). These residues, 11 to 20 (excepting 14),65, 88, and 90, all lie within 12 AÊ of the C termi-nus. Comparison of signal intensities with thoseobtained in 1H-15N HSQC experiments modi®ed tominimize solvent saturation (data not shown)demonstrate that solvent exchange does not signi®-cantly contribute to the observed line broadening.An 1H-15N HSQC spectrum obtained at low pro-tein concentration (0.5 mM) displayed similarintensity patterns, suggesting that potential oligo-merization at the higher concentration was notresponsible for signal broadening. This same sub-set of signals remained broadened over a 30 Ktemperature range (280 to 310 K, Figure 2). In con-trast, all peak intensities in TNfn31-92 increase withtemperature, expected as the protein tumbles fasterand the effective correlation time decreases.
In contrast to surrounding residues, the intensityof the 1H-15N cross-peak for Thr14 in TNfn31-90
does increase with temperature. This may be aresult of its backbone hydrogen bond to the adja-cent b strand. Side-chain resonances for this resi-due are completely broadened in 3D TOCSY andNOESY spectra.
15N relaxation data
Spin-lattice (R1) and spin-spin (R2) relaxationrates, and {1H-15N} heteronuclear NOE enhance-ments were determined for TNfn31-90 andTNfn31-92 at 500 and 600 MHz at 300 K. The results

Figure 1. 1H-15N HSQC spectra of TNfn31-90 (a) and TNfn31-92 (b) at 600 MHz and 294 K. Samples were 2.0 mM inprotein and contained 50 mM deuterated acetate buffer (pH 4.9). Sequence assignments are presented for TNfn31-92.Signals that exhibit signi®cant line broadening in the shorter domain are labelled in both plots. In plot a, D15 andL19 are partially overlapped by much stronger signals. T16 is completely broadened.
Boundary Selection and TNfn3 Dynamics 183
of these experiments are shown in Figure 3. Relax-ation behaviour could not be determined for pro-line residues 5, 25, 42, 64 and 83. Spectral overlapprecluded quantitative analysis of nine signals inTNfn31-90 and ten signals in TNfn31-92. The lack ofdata for residues 11, 12, 13, 16, 18, 21 and 65 inTNfn31-90 results from extreme line broadening,forecasting the presence of chemical exchange onthe milli- to microsecond timescale.
Mean values for each of the relaxation par-ameters are presented in Table 1. Calculatedaverages do not include values more than onestandard deviation from the aggregate mean.There is signi®cant agreement between the twodomains, particularly in their average R1 and{1H-15N} NOE enhancement values, which suggestsa similar propensity for high frequency motion(10ÿ8 to 10ÿ12 sÿ1) in both proteins (Kay et al.,1989). The difference in R1 relaxation rates at thetwo ®eld strengths simply re¯ects the direct bear-ing of the 15N Larmor frequency on the value of
the measurement. Differences in average R2 relax-ation rates, though larger, are within calculatedstandard deviations and probably re¯ect the great-er errors inherent in the CPMG experiment (Rosset al., 1997).
Calculation of chemical exchange rates
Five series of T2-CPMG experiments with refo-cusing delays ranging from 311 to 1436 ms werecollected for TNfn31-90. Variation in recorded R2
rates over this range of delays were observed forVal10, Thr17, Ile20, Thr87, and Thr90 (Figure 4).These ®ve residues all fall within the C-terminalregion. None shows evidence of chemical exchangein the longer domain.
Two methods were used to analyse the relax-ation rate data for these ®ve residues. In method 1,R2 rates at each of the ®ve delays were used to ®tR�2, kex, and ex according to equation (3). In meth-od 2, R�2 was ®xed at the value of the R2 relaxation
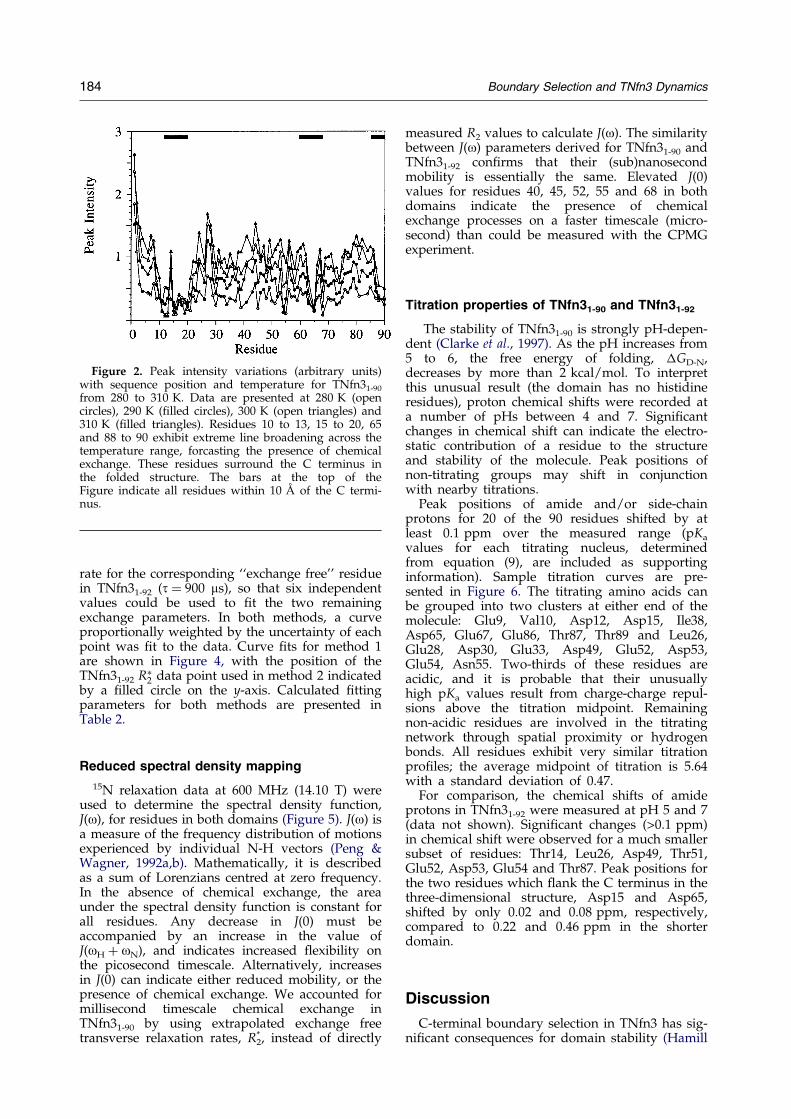
Figure 2. Peak intensity variations (arbitrary units)with sequence position and temperature for TNfn31-90
from 280 to 310 K. Data are presented at 280 K (opencircles), 290 K (®lled circles), 300 K (open triangles) and310 K (®lled triangles). Residues 10 to 13, 15 to 20, 65and 88 to 90 exhibit extreme line broadening across thetemperature range, forcasting the presence of chemicalexchange. These residues surround the C terminus inthe folded structure. The bars at the top of theFigure indicate all residues within 10 AÊ of the C termi-nus.
184 Boundary Selection and TNfn3 Dynamics
rate for the corresponding ``exchange free'' residuein TNfn31-92 (t � 900 ms), so that six independentvalues could be used to ®t the two remainingexchange parameters. In both methods, a curveproportionally weighted by the uncertainty of eachpoint was ®t to the data. Curve ®ts for method 1are shown in Figure 4, with the position of theTNfn31-92 R�2 data point used in method 2 indicatedby a ®lled circle on the y-axis. Calculated ®ttingparameters for both methods are presented inTable 2.
Reduced spectral density mapping
15N relaxation data at 600 MHz (14.10 T) wereused to determine the spectral density function,J(o), for residues in both domains (Figure 5). J(o) isa measure of the frequency distribution of motionsexperienced by individual N-H vectors (Peng &Wagner, 1992a,b). Mathematically, it is describedas a sum of Lorenzians centred at zero frequency.In the absence of chemical exchange, the areaunder the spectral density function is constant forall residues. Any decrease in J(0) must beaccompanied by an increase in the value ofJ(oH � oN), and indicates increased ¯exibility onthe picosecond timescale. Alternatively, increasesin J(0) can indicate either reduced mobility, or thepresence of chemical exchange. We accounted formillisecond timescale chemical exchange inTNfn31-90 by using extrapolated exchange freetransverse relaxation rates, R2
*, instead of directly
measured R2 values to calculate J(o). The similaritybetween J(o) parameters derived for TNfn31-90 andTNfn31-92 con®rms that their (sub)nanosecondmobility is essentially the same. Elevated J(0)values for residues 40, 45, 52, 55 and 68 in bothdomains indicate the presence of chemicalexchange processes on a faster timescale (micro-second) than could be measured with the CPMGexperiment.
Titration properties of TNfn31-90 and TNfn31-92
The stability of TNfn31-90 is strongly pH-depen-dent (Clarke et al., 1997). As the pH increases from5 to 6, the free energy of folding, �GD-N,decreases by more than 2 kcal/mol. To interpretthis unusual result (the domain has no histidineresidues), proton chemical shifts were recorded ata number of pHs between 4 and 7. Signi®cantchanges in chemical shift can indicate the electro-static contribution of a residue to the structureand stability of the molecule. Peak positions ofnon-titrating groups may shift in conjunctionwith nearby titrations.
Peak positions of amide and/or side-chainprotons for 20 of the 90 residues shifted by atleast 0.1 ppm over the measured range (pKa
values for each titrating nucleus, determinedfrom equation (9), are included as supportinginformation). Sample titration curves are pre-sented in Figure 6. The titrating amino acids canbe grouped into two clusters at either end of themolecule: Glu9, Val10, Asp12, Asp15, Ile38,Asp65, Glu67, Glu86, Thr87, Thr89 and Leu26,Glu28, Asp30, Glu33, Asp49, Glu52, Asp53,Glu54, Asn55. Two-thirds of these residues areacidic, and it is probable that their unusuallyhigh pKa values result from charge-charge repul-sions above the titration midpoint. Remainingnon-acidic residues are involved in the titratingnetwork through spatial proximity or hydrogenbonds. All residues exhibit very similar titrationpro®les; the average midpoint of titration is 5.64with a standard deviation of 0.47.
For comparison, the chemical shifts of amideprotons in TNfn31-92 were measured at pH 5 and 7(data not shown). Signi®cant changes (>0.1 ppm)in chemical shift were observed for a much smallersubset of residues: Thr14, Leu26, Asp49, Thr51,Glu52, Asp53, Glu54 and Thr87. Peak positions forthe two residues which ¯ank the C terminus in thethree-dimensional structure, Asp15 and Asp65,shifted by only 0.02 and 0.08 ppm, respectively,compared to 0.22 and 0.46 ppm in the shorterdomain.
Discussion
C-terminal boundary selection in TNfn3 has sig-ni®cant consequences for domain stability (Hamill

Figure 3. 15N relaxation parameters R2, R1, and {1H-15N} NOE enhancements for TNfn31-90 (a to c) and TNfn31-92
(d to f) at 500 MHz (®lled circles) and 600 MHz (open circles). Data were collected at 300 K and pH 4.9. {1H-15N}NOE enhancements, I/Io, represent the ratios of intensities in 2D experiments with and without NOE enhance-ment, respectively. Error bars for R1 and R2 were derived from curve ®tting uncertainties, while those for NOEenhancements were estimated from peak signal to noise ratios. Extreme line broadening prevented the determinationof relaxation parameters for several residues within the C-terminal region of TNfn31-90. Undetectable proline residuesare found at positions 5, 25, 42, 64 and 83 in both domains.
Boundary Selection and TNfn3 Dynamics 185
et al., 1998) and dynamics. Our comparison ofTNfn31-90 and TNfn31-92 explains the presence ofchemical exchange near the C terminus in theshorter domain. Sample conditions were optimized
Table 1. Average 15N relaxation rates for TNfn31-90 and TN
500 MHzTNfn31-90 TNfn31-9
R1 (sÿ1) 2.22 � 0.13 2.06 � 0.1R2 (sÿ1) 8.55 � 0.67 8.83 � 0.61H-15N NOE 0.74 � 0.06 0.70 � 0.0R2/R1 3.85 � 0.38 4.29 � 0.4tm
a 6.4 � 0.5 6.9 � 0.5
Averages are determined for residues within one standard deviaa Isotropic correlation times are based on the ratio of R2 and R1.
(pH 4.9) to maximize domain stability and avoidthe effects of substantial acidic residue titrationbetween pH 5 and 6. A previous backbonedynamics study of TNfn31-90, the truncated form,
fn31-92
600 MHz
2 TNfn31-90 TNfn31-92
4 1.82 � 0.09 1.82 � 0.071 8.16 � 0.62 8.70 � 0.897 0.77 � 0.07 0.76 � 0.072 4.48 � 0.41 4.78 � 0.52
5.9 � 0.3 6.2 � 0.5
tion of the aggregate mean.

Figure 4. Transverse relaxation rates, R2, as a function of spin-echo delay time (2t) in the T2-CPMG experiment forresidues Val10 (a), Thr17 (b), Thr87 (c) and Thr90 (d) in TNfn31-90. Error bars represent uncertainties in individual R2
rates. Curves shown in these plots were determined solely from the ®ve points collected for each residue in domain[1-90] (open circles, method 1). Exchange-free R2 relaxation rates (with 2t � 900 ms) for the analogous residues inTNfn31-92 are shown in each plot by a ®lled circle on the y-axis. In method 2, all six points were used to calculateexchange rates.
Table 2. Exchange parameters for residues in TNfn31-90
exhibiting a transverse relaxation rate dependence onspin-echo delay length
Residue(method)a R2
* (sÿ1) kex (sÿ1) �ex (Hz)b
Val10 (1) 8.28 � 0.18 954 � 205 415 � 16Val10 (2) 8.73 � 0.44 560 � 196 458 � 60Thr17 (1) 8.97 � 0.28 651 � 343 376 � 52Thr17 (2) 8.47 � 0.35 1063 � 212 360 � 11Ile20 (1) 9.22 � 1.18 1750 � 760 406 � 59Ile20 (2) 8.32 � 0.23 2248 � 479 453 � 20Thr87 (1) 8.19 � 0.23 995 � 205 299 � 7Thr87 (2) 8.12 � 0.29 1044 � 134 301 � 5Thr90 (1) 9.68 � 0.31 1180 � 379 300 � 13Thr90 (2) 9.56 � 0.32 1302 � 255 304 � 8
a In method 1, all three parameters are derived from ®ttingthe ®ve successive R2 relaxation rates (measured at increasingspin echo delay length) for TNfn31-90 to equation (3). In method2, R2
* is ®xed at the value of the R2 relaxation rate (2t � 900 ms)for the corresponding residue in TNfn31-92, and all six pointsare used to ®t the remaining two parameters.
b Values for �ex given here assume two-site exchangewhere pA � pB. If the exchanging populations are unequal, thenthe calculated chemical shift difference would be greater.
186 Boundary Selection and TNfn3 Dynamics
was performed at the titration midpoint (Akkeet al., 1998; Carr et al., 1997).
Comparing 15N relaxation behaviour ofTNfn31-90 and TNfn31-92
Similarities in measured relaxation rates forTNfn31-90 and TNfn31-92 indicate that chain exten-sion does not alter the general features of theTNfn3 module. In both domains, above-average R2
rates were observed for a number of identical resi-dues. These include Thr16, Asp40, Arg45, Glu52,Asn55 and Tyr68. (R2 relaxation rates could not bequantitatively determined for Asp40 in TNfn31-90
due to spectral overlap.) R2 values determined forGlu52 exhibit an unexpected variation with ®eldstrength. Because its 1H-15N HSQC signal alsoexhibits unusual line broadening along the 15Ndimension, the discrepancies may result from ananomalous dispersion of R2 with the magnetic®eld. Relaxation properties are also conserved inregions biased towards high frequency motion.Apart from the N terminus, these areas, centredaround residues 26 to 29 and 44 to 46, fall withinextended loop regions.
There are, however, some important differencesbetween the two domains. In TNfn31-90, elevatedR2 relaxation rates are observed for a number of
residues in the C-terminal strand, and in the twoloop regions (A-B and E-F) surrounding the C ter-minus. Line broadening, itself an indication ofchemical exchange, precludes relaxation rate anal-
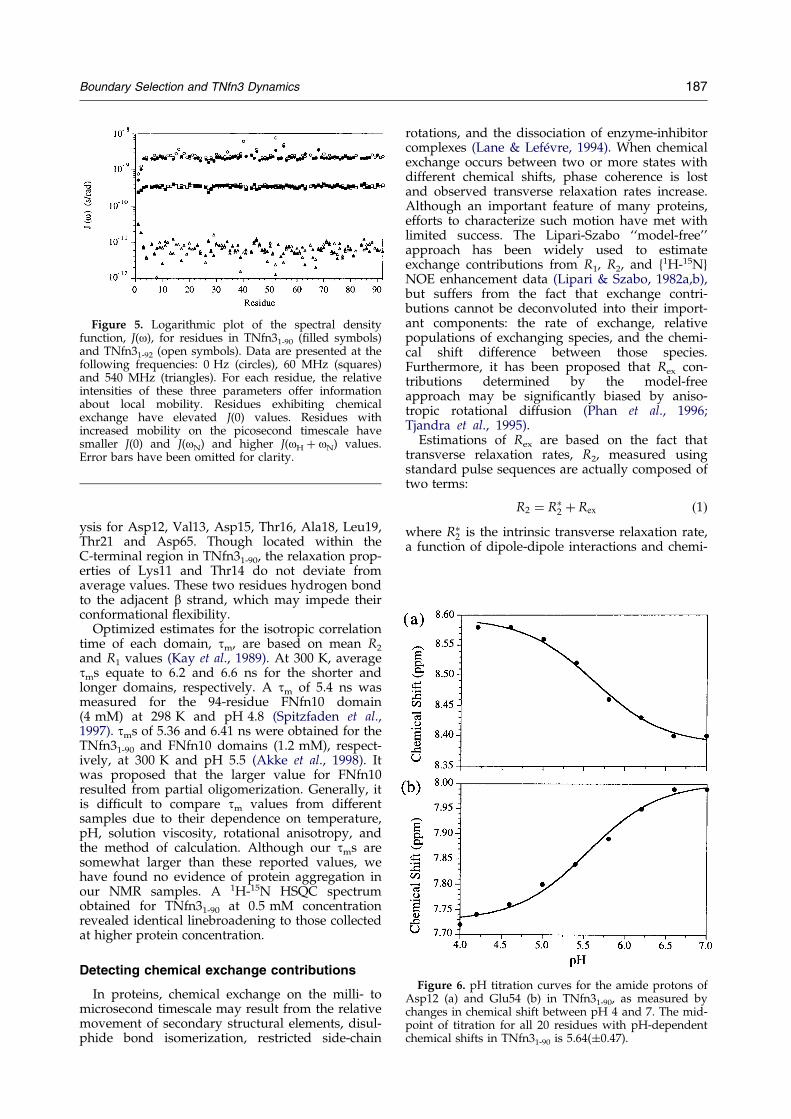
Figure 5. Logarithmic plot of the spectral densityfunction, J(o), for residues in TNfn31-90 (®lled symbols)and TNfn31-92 (open symbols). Data are presented at thefollowing frequencies: 0 Hz (circles), 60 MHz (squares)and 540 MHz (triangles). For each residue, the relativeintensities of these three parameters offer informationabout local mobility. Residues exhibiting chemicalexchange have elevated J(0) values. Residues withincreased mobility on the picosecond timescale havesmaller J(0) and J(oN) and higher J(oH � oN) values.Error bars have been omitted for clarity.
Figure 6. pH titration curves for the amide protons ofAsp12 (a) and Glu54 (b) in TNfn31-90, as measured bychanges in chemical shift between pH 4 and 7. The mid-point of titration for all 20 residues with pH-dependentchemical shifts in TNfn31-90 is 5.64(�0.47).
Boundary Selection and TNfn3 Dynamics 187
ysis for Asp12, Val13, Asp15, Thr16, Ala18, Leu19,Thr21 and Asp65. Though located within theC-terminal region in TNfn31-90, the relaxation prop-erties of Lys11 and Thr14 do not deviate fromaverage values. These two residues hydrogen bondto the adjacent b strand, which may impede theirconformational ¯exibility.
Optimized estimates for the isotropic correlationtime of each domain, tm, are based on mean R2
and R1 values (Kay et al., 1989). At 300 K, averagetms equate to 6.2 and 6.6 ns for the shorter andlonger domains, respectively. A tm of 5.4 ns wasmeasured for the 94-residue FNfn10 domain(4 mM) at 298 K and pH 4.8 (Spitzfaden et al.,1997). tms of 5.36 and 6.41 ns were obtained for theTNfn31-90 and FNfn10 domains (1.2 mM), respect-ively, at 300 K and pH 5.5 (Akke et al., 1998). Itwas proposed that the larger value for FNfn10resulted from partial oligomerization. Generally, itis dif®cult to compare tm values from differentsamples due to their dependence on temperature,pH, solution viscosity, rotational anisotropy, andthe method of calculation. Although our tms aresomewhat larger than these reported values, wehave found no evidence of protein aggregation inour NMR samples. A 1H-15N HSQC spectrumobtained for TNfn31-90 at 0.5 mM concentrationrevealed identical linebroadening to those collectedat higher protein concentration.
Detecting chemical exchange contributions
In proteins, chemical exchange on the milli- tomicrosecond timescale may result from the relativemovement of secondary structural elements, disul-phide bond isomerization, restricted side-chain
rotations, and the dissociation of enzyme-inhibitorcomplexes (Lane & LefeÂvre, 1994). When chemicalexchange occurs between two or more states withdifferent chemical shifts, phase coherence is lostand observed transverse relaxation rates increase.Although an important feature of many proteins,efforts to characterize such motion have met withlimited success. The Lipari-Szabo ``model-free''approach has been widely used to estimateexchange contributions from R1, R2, and {1H-15N}NOE enhancement data (Lipari & Szabo, 1982a,b),but suffers from the fact that exchange contri-butions cannot be deconvoluted into their import-ant components: the rate of exchange, relativepopulations of exchanging species, and the chemi-cal shift difference between those species.Furthermore, it has been proposed that Rex con-tributions determined by the model-freeapproach may be signi®cantly biased by aniso-tropic rotational diffusion (Phan et al., 1996;Tjandra et al., 1995).
Estimations of Rex are based on the fact thattransverse relaxation rates, R2, measured usingstandard pulse sequences are actually composed oftwo terms:
R2 � R�2 � Rex �1�where R�2 is the intrinsic transverse relaxation rate,a function of dipole-dipole interactions and chemi-

Figure 7. Distribution of chemically exchanging resi-dues in TNfn3. Residues exhibiting substantial chemicalexchange on a microsecond timescale in both TNfn31-90
and TNfn31-92 are coloured red. Exchange contributionson a slower, millisecond timescale, are exclusive to theshorter domain (TNfn31-90). These residues are indicatedin blue, and all lie within 12 AÊ of the C terminus. ThisFigure was prepared with the program MOLMOL(Koradi et al., 1996).
188 Boundary Selection and TNfn3 Dynamics
cal shift anisotropy, and Rex is the exchange contri-bution. The former is generally re¯ective of motionon the nanosecond timescale, whereas the latter isa function of events on the milli- to microsecondtimescale.
One way to separate R�2 and Rex is to measure R2
at two magnetic ®eld strengths. Although R�2 isvery nearly ®eld-independent, Rex contributions,which are proportional to the difference betweenthe precession frequencies of exchanging popu-lations, increase with ®eld strength. The theoreticalratio of Rex contributions at 11.74 and 14.10 T is:
Rex; 11:74T
Rex; 14:10T� 50:7 MHz
60:8 MHz
� �2
� 0:7 �2�
where 50.7 and 60.8 MHz refer to the precessionfrequencies of 15N at the two ®eld strengths.
For each of the two domains, at both ®eldstrengths, Rex values were determined for eachresidue as the difference between individual R2
rates and the aggregate average. For TNfn31-90, theaverage Rex ratio for the 13 residues with measur-able exchange contributions is 0.93, but when threeresidues with signi®cant uncertainties are omitted,the average is 0.68. For TNfn31-92, the average forall ten exchanging residues is 0.83. Chemicalexchange rates can be explicitly calculated bymeasuring R2 relaxation rates at three or moremagnetic ®eld strengths (Phan et al., 1996).
Calculation of chemical exchange rates
Variable delay T2-CPMG experiments permit areasonable estimation of chemical exchange on themillisecond timescale at a single ®eld strength.Explicit rates of exchange were calculated for resi-dues Val10, Thr17, Ile20, Thr87 and Thr90 inTNfn31-90 using a conventional ®tting routine(equation (3), model 1). These display excellentagreement with a second approach (model 2), inwhich ``exchange-free'' transverse relaxation rateswere ®xed at the values of measured relaxationrates in TNfn31-92 (Table 2). The agreementbetween these two methods establishes TNfn31-92
as a useful and even unique internal standard.Calculated uncertainties are largest for residues
with weaker signal intensities, especially Ile20.Exchange rates for Thr87 and Thr90, which giverelatively sharp signals in 1H-15N HSQC spectra,could be calculated with greater assurance. Uncer-tainties in the ®ve measured kex values average20%. Excluding Ile20, their cumulative average is1000(�311) sÿ1. The coincidence of these ratessuggests that the exchange motions may be related.Hydrogen/deuterium exchange experiments(Hamill et al., 1998) reveal the presence of a stablehydrogen bonding network in the C-terminalregion, which also suggests that the exchangemotion is segmental. It is dif®cult to interpret ex,the population-averaged chemical shift difference,because neither the number, populations, or chemi-cal shifts of the exchanging species are known.
In principle, it is also dif®cult to interpret Rex
values. Not always due to active milli- to micro-second motion, exchange may result from modu-lation of the chemical environment caused by otherexchanging residues, particularly aromatics(Constantine et al., 1993). Regardless of cause, theabsence of chemical exchange in the C-terminalregion of TNfn31-92 pinpoints domain truncation asthe source of exchange in the shorter domain. Pre-viously, exchange in the A-B loop region (includ-ing portions of the A and B strands) of TNfn31-90
was tentatively attributed to a b-bulge in the Astrand (Carr et al., 1997).
Interestingly, none of the residues with elevatedR2 rates in both domains, Thr16, Asp40, Arg45,Glu52, Asn55 and Tyr68, exhibit a relaxation ratedependence over the range of CPMG spin echodelays used in these experiments. This suggeststhat, for these residues, chemical exchange occurson a much faster timescale (Figure 7), a result con-®rmed by recent investigations of microsecondtimescale chemical exchange in TNfn31-90 (Akkeet al., 1998).
Comparison of structural changes in TNfn31-92
Backbone amide and amide proton chemicalshifts for the two domains are nearly identical.Excluding residues 15 and 65, which spatially
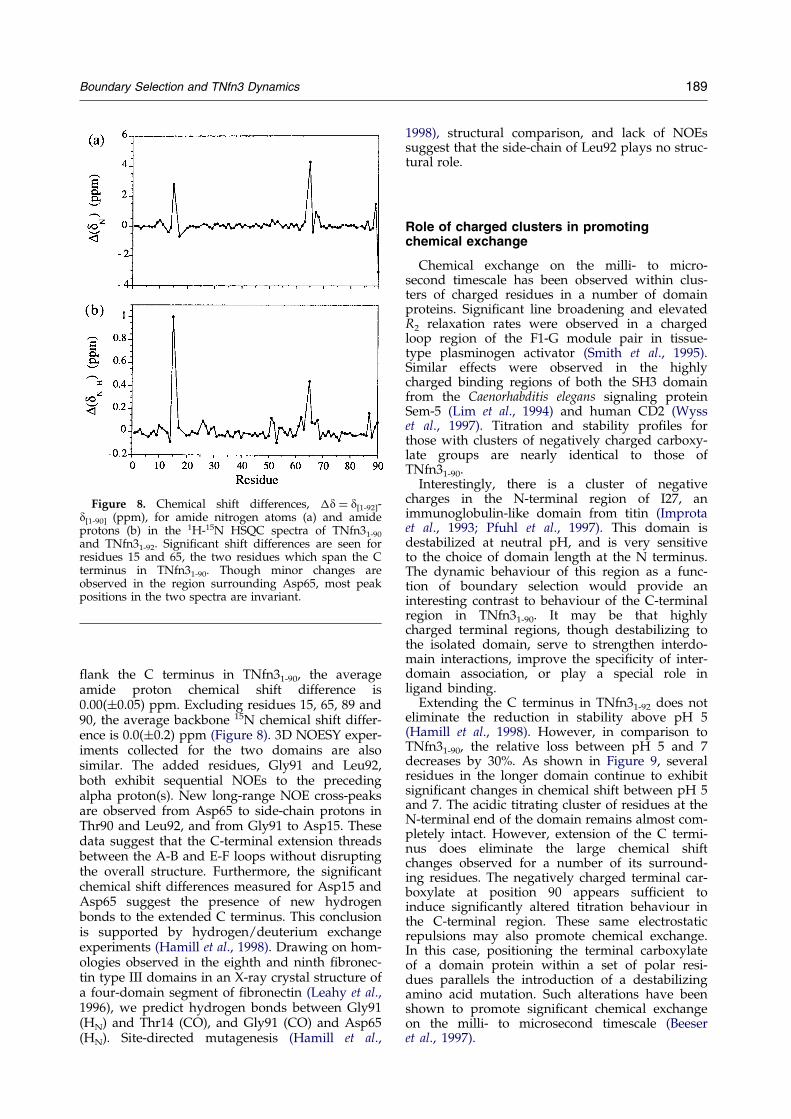
Figure 8. Chemical shift differences, �d � d[1-92]-d[1-90] (ppm), for amide nitrogen atoms (a) and amideprotons (b) in the 1H-15N HSQC spectra of TNfn31-90
and TNfn31-92. Signi®cant shift differences are seen forresidues 15 and 65, the two residues which span the Cterminus in TNfn31-90. Though minor changes areobserved in the region surrounding Asp65, most peakpositions in the two spectra are invariant.
Boundary Selection and TNfn3 Dynamics 189
¯ank the C terminus in TNfn31-90, the averageamide proton chemical shift difference is0.00(�0.05) ppm. Excluding residues 15, 65, 89 and90, the average backbone 15N chemical shift differ-ence is 0.0(�0.2) ppm (Figure 8). 3D NOESY exper-iments collected for the two domains are alsosimilar. The added residues, Gly91 and Leu92,both exhibit sequential NOEs to the precedingalpha proton(s). New long-range NOE cross-peaksare observed from Asp65 to side-chain protons inThr90 and Leu92, and from Gly91 to Asp15. Thesedata suggest that the C-terminal extension threadsbetween the A-B and E-F loops without disruptingthe overall structure. Furthermore, the signi®cantchemical shift differences measured for Asp15 andAsp65 suggest the presence of new hydrogenbonds to the extended C terminus. This conclusionis supported by hydrogen/deuterium exchangeexperiments (Hamill et al., 1998). Drawing on hom-ologies observed in the eighth and ninth ®bronec-tin type III domains in an X-ray crystal structure ofa four-domain segment of ®bronectin (Leahy et al.,1996), we predict hydrogen bonds between Gly91(HN) and Thr14 (CO), and Gly91 (CO) and Asp65(HN). Site-directed mutagenesis (Hamill et al.,
1998), structural comparison, and lack of NOEssuggest that the side-chain of Leu92 plays no struc-tural role.
Role of charged clusters in promotingchemical exchange
Chemical exchange on the milli- to micro-second timescale has been observed within clus-ters of charged residues in a number of domainproteins. Signi®cant line broadening and elevatedR2 relaxation rates were observed in a chargedloop region of the F1-G module pair in tissue-type plasminogen activator (Smith et al., 1995).Similar effects were observed in the highlycharged binding regions of both the SH3 domainfrom the Caenorhabditis elegans signaling proteinSem-5 (Lim et al., 1994) and human CD2 (Wysset al., 1997). Titration and stability pro®les forthose with clusters of negatively charged carboxy-late groups are nearly identical to those ofTNfn31-90.
Interestingly, there is a cluster of negativecharges in the N-terminal region of I27, animmunoglobulin-like domain from titin (Improtaet al., 1993; Pfuhl et al., 1997). This domain isdestabilized at neutral pH, and is very sensitiveto the choice of domain length at the N terminus.The dynamic behaviour of this region as a func-tion of boundary selection would provide aninteresting contrast to behaviour of the C-terminalregion in TNfn31-90. It may be that highlycharged terminal regions, though destabilizing tothe isolated domain, serve to strengthen interdo-main interactions, improve the speci®city of inter-domain association, or play a special role inligand binding.
Extending the C terminus in TNfn31-92 does noteliminate the reduction in stability above pH 5(Hamill et al., 1998). However, in comparison toTNfn31-90, the relative loss between pH 5 and 7decreases by 30%. As shown in Figure 9, severalresidues in the longer domain continue to exhibitsigni®cant changes in chemical shift between pH 5and 7. The acidic titrating cluster of residues at theN-terminal end of the domain remains almost com-pletely intact. However, extension of the C termi-nus does eliminate the large chemical shiftchanges observed for a number of its surround-ing residues. The negatively charged terminal car-boxylate at position 90 appears suf®cient toinduce signi®cantly altered titration behaviour inthe C-terminal region. These same electrostaticrepulsions may also promote chemical exchange.In this case, positioning the terminal carboxylateof a domain protein within a set of polar resi-dues parallels the introduction of a destabilizingamino acid mutation. Such alterations have beenshown to promote signi®cant chemical exchangeon the milli- to microsecond timescale (Beeseret al., 1997).
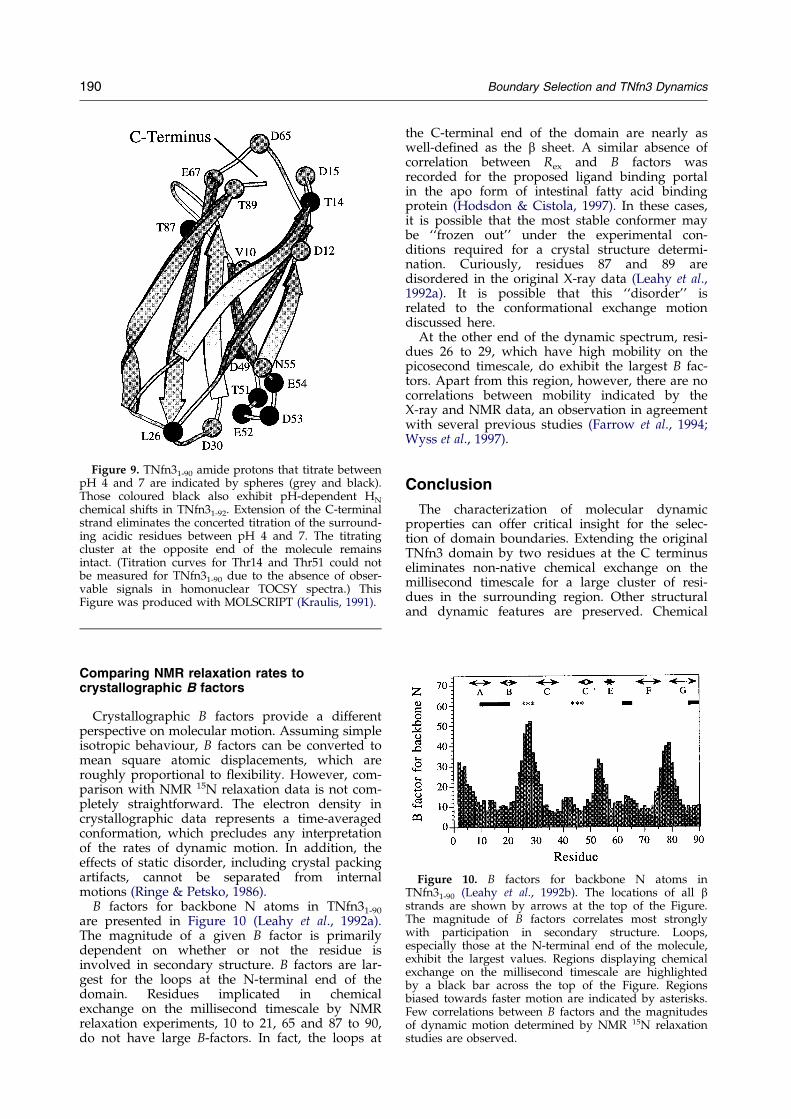
Figure 10. B factors for backbone N atoms inTNfn31-90 (Leahy et al., 1992b). The locations of all bstrands are shown by arrows at the top of the Figure.The magnitude of B factors correlates most stronglywith participation in secondary structure. Loops,especially those at the N-terminal end of the molecule,exhibit the largest values. Regions displaying chemicalexchange on the millisecond timescale are highlightedby a black bar across the top of the Figure. Regionsbiased towards faster motion are indicated by asterisks.Few correlations between B factors and the magnitudesof dynamic motion determined by NMR 15N relaxationstudies are observed.
Figure 9. TNfn31-90 amide protons that titrate betweenpH 4 and 7 are indicated by spheres (grey and black).Those coloured black also exhibit pH-dependent HN
chemical shifts in TNfn31-92. Extension of the C-terminalstrand eliminates the concerted titration of the surround-ing acidic residues between pH 4 and 7. The titratingcluster at the opposite end of the molecule remainsintact. (Titration curves for Thr14 and Thr51 could notbe measured for TNfn31-90 due to the absence of obser-vable signals in homonuclear TOCSY spectra.) ThisFigure was produced with MOLSCRIPT (Kraulis, 1991).
190 Boundary Selection and TNfn3 Dynamics
Comparing NMR relaxation rates tocrystallographic B factors
Crystallographic B factors provide a differentperspective on molecular motion. Assuming simpleisotropic behaviour, B factors can be converted tomean square atomic displacements, which areroughly proportional to ¯exibility. However, com-parison with NMR 15N relaxation data is not com-pletely straightforward. The electron density incrystallographic data represents a time-averagedconformation, which precludes any interpretationof the rates of dynamic motion. In addition, theeffects of static disorder, including crystal packingartifacts, cannot be separated from internalmotions (Ringe & Petsko, 1986).
B factors for backbone N atoms in TNfn31-90
are presented in Figure 10 (Leahy et al., 1992a).The magnitude of a given B factor is primarilydependent on whether or not the residue isinvolved in secondary structure. B factors are lar-gest for the loops at the N-terminal end of thedomain. Residues implicated in chemicalexchange on the millisecond timescale by NMRrelaxation experiments, 10 to 21, 65 and 87 to 90,do not have large B-factors. In fact, the loops at
the C-terminal end of the domain are nearly aswell-de®ned as the b sheet. A similar absence ofcorrelation between Rex and B factors wasrecorded for the proposed ligand binding portalin the apo form of intestinal fatty acid bindingprotein (Hodsdon & Cistola, 1997). In these cases,it is possible that the most stable conformer maybe ``frozen out'' under the experimental con-ditions required for a crystal structure determi-nation. Curiously, residues 87 and 89 aredisordered in the original X-ray data (Leahy et al.,1992a). It is possible that this ``disorder'' isrelated to the conformational exchange motiondiscussed here.
At the other end of the dynamic spectrum, resi-dues 26 to 29, which have high mobility on thepicosecond timescale, do exhibit the largest B fac-tors. Apart from this region, however, there are nocorrelations between mobility indicated by theX-ray and NMR data, an observation in agreementwith several previous studies (Farrow et al., 1994;Wyss et al., 1997).
Conclusion
The characterization of molecular dynamicproperties can offer critical insight for the selec-tion of domain boundaries. Extending the originalTNfn3 domain by two residues at the C terminuseliminates non-native chemical exchange on themillisecond timescale for a large cluster of resi-dues in the surrounding region. Other structuraland dynamic features are preserved. Chemical

Boundary Selection and TNfn3 Dynamics 191
exchange in the shorter domain may be pro-moted by the unfavourable position of the nega-tively charged C-terminal carboxylate within acluster of acidic residues. Exchange contributionsmay be further mediated in the longer version bynative-like hydrogen bond formation between thenew C-terminal residues and the surroundingloop regions. All evidence suggests that the orig-inal 90 residue domain was prematurely trun-cated. This study demonstrates for the ®rst timethat boundary selection can in¯uence not onlythe stability, but also the dynamic properties of aprotein domain in signi®cant ways. It also illus-trates the potential complications of ``introdu-cing'' a C-terminal carboxyl moiety. Futurestudies of protein domains, or indeed, truncationmutants, should proceed with these consider-ations carefully in mind.
Materials and Methods
Preparation of samples
TNfn31-90 and TNfn31-92, ®bronectin type III domainscorresponding to residues 802 to 891 and 802 to 893,respectively, of human tenascin, were expressed andpuri®ed according to the procedures described by Clarkeet al. (1997). Uniformly 15N- and 15N/13C-labelledsamples were obtained through bacterial growth in M9minimal media using 15N-labelled ammonium chlorideand 13C-labelled glucose, when required, as the solenitrogen and carbon sources. NMR samples contained2.0 mM protein except where indicated. In most samples,the protein was buffered by 50 mM deuterated acetate,(pH 4.9), in 90/10% H2O/2H2O in a total volume of0.5 ml. Samples contained 0.05% NaN3 to prevent thegrowth of microorganisms.
Sequence-specific assignment of domains
NMR spectra were obtained on a Bruker AMX 500spectrometer equipped with an inverse detection tripleresonance probe, single axis gradients, and an externalfourth channel, and a Bruker DRX 600 spectrometer withan inverse detection triple resonance probe and tripleaxis gradients. T2-CPMG experiments were collected onan AMX 600 spectrometer at the SON Large Scale NMRFacility in Utrecht. Felix 2.30 (Biosym) was used to pro-cess and analyse all data.
3D 15N-resolved TOCSY-HMQC and NOESY-HMQCspectra at 300 K were obtained for both proteins. TheTOCSY experiments were recorded at 500 MHz withmixing times of 55 ms. The NOESY spectra wererecorded at 600 MHz with mixing times of 250 ms.CBCA(CO)NH spectra were recorded at 293 K (TNfn31-90)and 300 K (TNfn31-92) at 500 MHz. HBHA(CO)NH andHNCACB spectra were obtained for TNfn31-92 at 300 Kand 500 MHz. Sweep widths were generally set to14 ppm in the proton domain, 35 ppm in the nitrogendomain, and 70 ppm in the carbon domain. For allexperiments, 1024 complex data points were collected inthe acquisition domain. The 3D TOCSY and NOESYexperiments comprised 96 complex points in the nitro-gen domain and 196 complex points in the indirect pro-
ton domain. For the HBHA(CO)NH experiment, these®gures were 64 and 256. For the CBCA(CO)NH exper-iment, 64 and 108 complex points were collected in thenitrogen and carbon domains, respectively. For theHNCACB experiment, 64 and 128 points were obtained.Ten 1H-15N HSQC spectra of 1024 � 512 points eachwere collected for TNfn31-90 at temperatures rangingfrom 280 to 310 K. For TNfn31-92, four spectra wereobtained between 290 and 303 K. Solvent suppressionwas achieved in some cases by the WATERGATEsequence (Piotto et al., 1992) more often, experimentsincorporated echo-antiecho gradient selection and sensi-tivity enhancement strategies.
15N relaxation measurements
15N T1 (spin-spin) and T2 (spin-lattice) relaxationtimes, and heteronuclear {1H-15N} steady state NOEenhancements for both domains were determined at11.74 T (500 MHz) and 14.10 T (600 MHz), 300 K. Allexperiments incorporated gradient selection and sensi-tivity enhancement (Kay et al., 1992). T1 relaxation delayswere set to 40, 200, 300, 400, 500, 600, 800 and 1000 ms.T2 experiments featured a CPMG pulse train with a spinecho delay of 900 ms. Relaxation delays were set to 7, 28,42, 56, 70, 84, 98, 112, 126, 140, 168 and 182 ms.Additional sets of CPMG experiments with interpulsespin-echo delays (2t) of 311, 498, 686, 1061 and 1436 mswere collected for TNfn31-90 at 600 MHz. The recycledelays for the T1 and T2 experiments were 2.0 and 3.0seconds, respectively. Each spectrum comprised1024 � 256 data points which were zero-®lled twofold inboth dimensions and multiplied by a sinebell windowfunction in the nitrogen dimension prior to analysis.Peak intensities were ®t to monoexponential decaycurves in Kaleidagraph (Abelbeck software) to determineR1 (1/T1) and R2 (1/T2) rates for individual amides.Rates and uncertainties were estimated from non-linearleast squares ®tting according to the Levenberg-Marquardt algorithm.
{1H-15N} NOE enhancements were calculated as theratio of peak heights from spectra obtained with andwithout presaturation of amide proton resonances. Pre-saturation was achieved by applying WALTZ16 compo-site pulse decoupling with a ®eld strength of 1 kHzduring the ®ve seconds recycle delay. Reference spectrawere obtained by replacing the presaturation sequencewith off-resonance continuous wave decoupling or asimple delay. Errors were estimated from the rms noiseof the spectra (Derome, 1987).
A modi®ed HSQC water ¯ip-back experiment wascollected for TNfn31-90 (Grzesiek & Bax, 1993). Severalother experiments were repeated with an independentlyprepared sample of TNfn31-90, including a low concen-tration 1H-15N HSQC (0.5 mM in protein), in order toensure that the extreme line broadening observed at theC-terminal end of the protein was not due to sampleartifacts.
Calculation of chemical exchange rates byT2-CPMG experiments
Chemical exchange rates, kex, can be explicitly deter-mined with T2-CPMG experiments. Transverse relax-ation rates are measured in sets of experiments withincreasing CPMG spin-echo delays (Orekhov et al.,1994). Suppression of relaxation due to chemicalexchange (Rex) occurs when the frequency of the
192 Boundary Selection and TNfn3 Dynamics
exchange process is of similar magnitude as the fre-quency of pulses in the CPMG pulse train. When thepulse repetition rate is signi®cantly faster than theexchange rate, Rex contributions are completely sup-pressed. Alternatively, if the shortest interpulse delay(2t) has no effect on reducing Rex, the rate of exchangemust be at least 2/(2t). Experimental limits on thespin-echo delay length are determined by the dutycycle of the transmitter at high frequency and the evol-ution of antiphase magnetization at low frequency, sothat only motion on the millisecond timescale can bemeasured. Within these limits, the dependence of Rex
upon spin-echo delay length, 2t, can be used to calcu-late kex, the exchange rate, and ex, the population-averaged chemical shift difference between exchangingspecies (Bloom et al., 1965). When kex > ex:
R2 � R�2 � Rex
� R�2 �1
4kex ÿ 1
2tsinhÿ1
kex sinh 2t����������������������jk2
ex ÿ2exj
p� �����������������������jk2
ex ÿ2exj
p0@ 1A24 35
�3�where R2 is the measured transverse relaxation rateand R�2 is the intrinsic exchange free transverse relax-ation rate. The exchange rate, kex,, is de®ned as theaverage of the forward (kA ! B) and reverse (kB ! A)exchange rates. Assuming the exchange is between twostates, A and B:
2ex � 4pApB02ex �4�
where pA and pB are the relative populations ofexchanging species and 'ex is the absolute chemicalshift difference between those species.
Reduced spectral density mapping
The spectral density function, J(o), for an N-H bondvector describes the frequency spectrum of its rotationalmotion (Abragam, 1961). Assuming that J(o) haszero slope at high frequency, that is,J(oH) � J(oH � oN) � J(oH ÿ oN), the spectral densityfunction for each amide can be approximated throughmeasurement of the 15N R1 and R2 relaxation rates, and{1H-15N} NOE enhancements. The values of J(o) at 0, oN,and (oH � oN) Hz are expressed by:
J�0� � 3
2�3d� c� ÿ1
2R1 � R2 ÿ 3
5Rnoe
� ��5�
J�oN� � 1
3d� cR1 ÿ 7
5Rnoe
� ��6�
J�oH � oN� � 1
5dRnoe �7�
where
Rnoe � �f1H-15NgNOEÿ 1�R1gN
gH
�8�
and d � g2Hg
2N(h/2p)2/4r6
HN and c � �2o2N/3. In these
equalities, gH and gN are the gyromagnetic ratios for 1Hand 15N, h is Planck's constant, rHN is the N-H bondlength, and � is the chemical shift anisotropy of theamide nitrogen. For rHN � 1.02 AÊ and � � ÿ160 ppm, dis approximately 1.3 � 109 (rad/s)2 and c is approxi-mately 0.87 � 109 (rad/s)2 at 11.74 T (Peng & Wagner,
1994). For residues with measured chemical exchangecontributions, exchange-free transverse relaxation rates(R�2) were used in place of directly measured R2 values inthe spectral density calculations.
The statistical distribution of the spectral densityfunction at the three frequencies was estimated byMonte Carlo simulation of 10,000 input data sets ran-domly generated from a normal distribution of the R1,R2, and {1H-15N} NOE relaxation data, with the esti-mated errors of these data incorporated as standarddeviations.
Calculation of pKa values
A series of homonuclear TOCSY spectra with mixingtimes of 55 ms were collected for TNfn31-90 at 298 K. Thesweep width in both dimensions was 16 ppm(2048 � 512 points, 500 MHz). Spectra were collected atnine pHs between 4 and 7. Dilute solutions of HCl orNaOH were used to adjust each sample to the desiredpH. Values were redetermined after each NMR exper-iment, and never varied by more than 0.1 pH unit.Averages of the initial and ®nal pH were recorded.Chemical shifts were referenced to TSP.
pKa values were determined for each hydrogennucleus in TNfn31-90 that experienced a change inchemical shift of at least 0.1 ppm over the measuredrange by ®tting shift data to the following derivativeof the Henderson-Hasselbalch equation (Forman-Kayet al., 1992):
dobs � dHA � dAÿ�10�pKaÿpH��1� 10�pKaÿpH� �9�
where dobs represents the chemical shift of the nucleusat a given pH, and dHA and dA represent baselinevalues of the titration at acidic and basic pH as deter-mined by the ®tting algorithm.
To compare the pH dependence of backboneamide proton resonances in TNfn31-92, an 1H-15NHSQC spectrum of the domain was collected atpH 7.0, 300 K.
Acknowledgements
We thank the European Community for providingaccess to the SON Large Scale NMR Facility in Utrecht,NL. Discussions with Mark Bycroft, Rolf Boelens andFrans Mulder are gratefully acknowledged. A.E.M. issupported by a British Marshall scholarship. J.C. is aWellcome career development fellow.
References
Abragam, A. (1961). The Principles of Nuclear Magnetism,Clarendon Press, Oxford.
Akke, M., Liu, J., Cavanagh, J., Erickson, H. P. &Palmer, A. G. (1998). Pervasive conformational ¯uc-tuations on microsecond time scales in a ®bronectintype III domain. Nature Struct. Biol. 5, 55±59.
Baron, M., Norman, D. G. & Campbell, I. D. (1991). Pro-tein modules. Trends Biochem. Sci. 16, 13±17.
Beeser, S. A., Goldenberg, D. P. & Oas, T. G. (1997).Enhanced protein ¯exibility caused by a destabiliz-

Boundary Selection and TNfn3 Dynamics 193
ing amino acid replacement in BPTI. J. Mol. Biol.269, 154±164.
Bloom, M., Reeves, L. W. & Wells, E. J. (1965). Spinechoes and conformational exchange. J. Chem. Phys.42, 1615±1624.
Bork, P. (1992). Mobile modules and motifs. Curr. Opin.Struct. Biol. 2, 413±421.
Bork, P. & Doolittle, R. (1992). Proposed acquisition ofan animal protein domain by bacteria. Proc. NatlAcad. Sci. USA, 89, 8990±8994.
BruÈ nger, A. T., Huber, R. & Karplus, M. (1987). Trypsi-nogen-trypsin transition: a molecular dynamicsstudy of induced conformational change in the acti-vation domain. Biochemistry, 26, 5153±5162.
Carr, P. A., Erickson, H. P. & Palmer, A. G. (1997). Back-bone dynamics of homologous ®bronectin type IIIcell adhesion domains from ®bronectin and tenas-cin. Structure, 5, 949±959.
Clarke, J., Hamill, S. J. & Johnson, C. M. (1997). Foldingand stability of a ®bronectin type III domain ofhuman tenascin. J. Mol. Biol. 270, 771±778.
Constantine, K. L., Friedrichs, M. L., Goldfarb, V.,Jeffrey, P. D., Sheriff, S. & Mueller, L. (1993).Characterization of the backbone dynamics of ananti-digoxin antibody VL domain by inverse detec-tion 1H-15N NMR: comparisons with X-ray dataon the fab. Proteins: Struct. Funct. Genet. 15, 290±311.
Derome, A. E. (1987). Modern NMR Techniques for Chem-istry Research, Pergamon Press, Oxford.
Erickson, H. P. (1997). A tenascin knockout with a phe-notype. Nature Genet. 17, 5±7.
Farrow, N. A., Muhandiram, R., Singer, A. U.,Pascal, S., Kay, C. M., Gish, G., Shoelson, S. E.,Pawson, R., Forman-Kay, J. D. & Kay, L. E.(1994). Backbone dynamics of a free and a phos-phopeptide-complexed Src homology 2 domainstudied by 15N NMR relaxation. Biochemistry, 33,5984±6003.
Forman-Kay, J. D., Clore, G. M. & Gronenborn, A. M.(1992). Relationship between electrostatics andredox function in human theoredoxin: characteriz-ation of pH titration shifts using two-dimensionalhomo- and heteronuclear NMR. Biochemistry, 31,3442±3452.
Grzesiek, S. & Bax, A. (1993). The importance of notsaturating H2O in protein NMR. Application to sen-sitivity enhancement and NOE measurements. J. Am.Chem. Soc. 115, 12593±12594.
Hamill, S. J., Meekhof, A. E. & Clarke, J. (1998). Effectsof boundary selection on the stability and folding ofa ®bronectin type III domain from human tenascin.Biochemistry, 37, 8071±8079.
Hodsdon, M. E. & Cistola, D. P. (1997). Ligand bindingalters the backbone mobility of intestinal fattyacid-binding protein as monitored by 15N NMRrelaxation and 1H exchange. Biochemistry, 36,2278±2290.
Improta, S., Politou, A. S. & Pastore, A. (1993). Immuno-globulin-like modules from titin I-band: extensiblecomponents of muscle elasticity. Structure, 4, 323±337.
Kay, L. E., Torchia, D. A. & Bax, A. (1989). Backbonedynamics of proteins as studied by 15N inversedetected heteronuclear NMR spectroscopy: appli-cation to staphyloccocal nuclease. Biochemistry, 28,8972±8979.
Kay, L. E., Keifer, P. & Saarinen, T. (1992). Pure absorp-tion gradient enhanced heteronuclear single quan-
tum correlation spectroscopy with improvedsensitivity. J. Am. Chem. Soc. 114, 10663±10665.
Koradi, R., Billeter, M. & WuÈ thrich, K. (1996). MOL-MOL: a program for display and analysis of macro-molecular structures. J. Mol. Graphics, 14, 51±55.
Kraulis, P. (1991). Molscript ± a program to produceboth detailed and schematic plots of protein struc-tures. J. Appl. Crystallog. 24, 946±950.
Lane, A. N. & LefeÂvre, J.-F. (1994). Nuclear magneticresonance measurements of slow conformationaldynamics in macromolecules. Methods Enzymol. 239,596±619.
Leahy, D. J., Hendrickson, W. A., Aukhil, I. & Erickson,H. A. (1992a). Structure of a ®bronectin type IIIdomain from tenascin phased by MAD analysis of theselenomethionyl protein. PDB ®le (1ten).
Leahy, D. J., Hendrickson, W. A., Aukhil, I. &Erickson, H. A. (1992b). Structure of a ®bronectintype III domain from tenascin phased by MADanalysis of the selenomethionyl protein. Science,258, 987±991.
Leahy, D. J., Aukhil, I. & Erickson, H. A. (1996). 2.0 AÊ
crystal structure of a four-domain segment ofhuman ®bronectin encompassing the RGD loop andsynergy region. Cell, 84, 155±164.
Lim, W. A., Fox, R. O. & Richards, F. M. (1994). Stabilityand peptide binding af®nity of an SH3 domainfrom the Caenorhabditis elegans signaling proteinSem-5. Protein Sci. 3, 1261±1266.
Lipari, G. & Szabo, A. (1982a). Model-free approachto the interpretation of nuclear magnetic reson-ance relaxation in macromolecules. 1. Theory andrange of validity. J. Am. Chem. Soc. 104, 4546±4559.
Lipari, G. & Szabo, A. (1982b). Model-free approachto the interpretation of nuclear magnetic reson-ance relaxation in macromolecules. 2. Analysis ofexperimental results. J. Am. Chem. Soc. 104,4559±4570.
Orekhov, V. Y., Pervushin, K. V. & Arseniev, A. S.(1994). Backbone dynamics of (1±71)bacterioopsinstudied by two-dimensional 1H-15N NMR spec-troscopy. Eur. J. Biochem. 219, 887±896.
Peng, J. W. & Wagner, G. (1992a). Mapping of spec-tral density functions using heteronuclear NMRrelaxation measurements. J. Magn. Reson. 98, 308±332.
Peng, J. W. & Wagner, G. (1992b). Mapping of the spec-tral densities of N-H bond motions in eglin C usingheternuclear relaxation measurements. Biochemistry,31, 8571±8586.
Peng, J. W. & Wagner, G. (1994). Investigation of proteinmotions via relaxation measurements. MethodsEnzymol. 239, 563±596.
Pfuhl, M., Improta, S., Politou, A. S. & Pastore, A.(1997). When a module is also a domain: the role ofthe N terminus in the stability and the dynamics ofimmunoglobulin domains from titin. J. Mol. Biol.265, 242±256.
Phan, I. Q. H., Boyd, J. & Campbell, I. A. (1996).Dynamic studies of a ®bronectin type I module pairat three frequencies: anisotropic modelling anddirect determination of conformational exchange.J. Biomol. NMR, 8, 369±378.
Piotto, M., Saudek, V. & SklenaÂr, V. (1992). Gradient-tailored excitation for single-quantum NMR spec-troscopy of aqueous solutions. J. Biomol. NMR, 2,661±665.

194 Boundary Selection and TNfn3 Dynamics
Politou, A. S., Gautel, M. & Pastore, J. A. (1994). Immu-noglobulin-type domains of titin are stabilized byamino-terminal extension. FEBS Letters, 352, 27±31.
Ringe, D. & Petsko, G. A. (1986). Study of proteindynamics by X-ray diffraction. Methods Enzymol.131, 389±433.
Ross, A., Czisch, M. & King, G. C. (1997). Systematicerrors associated with the CPMG pulse sequenceand their effect on motional analysis of biomole-cules. J. Magn. Reson. 124, 355±365.
Smith, B. O., Downing, A. K., Driscoll, P. C., Dudgeon,T. J. & Campbell, I. A. (1995). The solution structureand backbone dynamics of the ®bronectin type Iand epidermal growth factor-like pair of modulesof tissue-type plasminogen activator. Structure, 3,823±833.
Spitzfaden, C., Grant, R. P., Mardon, H. J. & Campbell,I. A. (1997). Module-module interactions in the cellbinding region of ®bronectin: stability, ¯exibilityand speci®city. J. Mol. Biol. 265, 565±579.
Tjandra, N., Feller, S. E., Pastor, R. W. & Bax, A. (1995).Rotational diffusion anisotropy of human ubiquitinfrom 15N NMR relaxation. J. Am. Chem. Soc. 117,12562±12566.
Wyss, D., Dayie, K. T. & Wagner, G. (1997). The coun-terreceptor binding site of human CD2 exhibits andextended surface patch with multiple conformations¯uctuating with millisecond to microsecondmotions. Protein Sci. 6, 534±542.
Edited by P. E. Wright
(Received 19 March 1998; received in revised form12 June 1998; accepted 17 June 1998)
http://www.hbuk.co.uk/jmb
Supplementary Material comprising a Table of pKa
values is available on JMB OnLine.