Small Molecule Inhibitors Target the Tissue Transglutaminase and Fibronectin Interaction
10
Small Molecule Inhibitors Target the Tissue Transglutaminase and Fibronectin Interaction Bakhtiyor Yakubov 1 *, Lan Chen 2 , Alexey M. Belkin 3 , Sheng Zhang 2 , Bhadrani Chelladurai 1 , Zhong-Yin Zhang 4,5 , Daniela Matei 1,4,5,6 * 1 Indiana University Department of Medicine, Indiana University School of Medicine, Indianapolis, Indiana, United States of America, 2 Chemical Genomics Core Facility, Indiana University School of Medicine, Indianapolis, Indiana, United States of America, 3 University of Maryland Department of Biochemistry and Molecular Biology, Indiana University School of Medicine, Indianapolis, Indiana, United States of America, 4 Indiana University Simon Cancer Center, Indiana University School of Medicine, Indianapolis, Indiana, United States of America, 5 Department of Biochemistry and Molecular Biology, Indiana University School of Medicine, Indianapolis, Indiana, United States of America, 6 VA Roudebush Hospital, Indiana University School of Medicine, Indianapolis, Indiana, United States of America Abstract Tissue transglutaminase (TG2) mediates protein crosslinking through generation of e2(c-glutamyl) lysine isopeptide bonds and promotes cell adhesion through interaction with fibronectin (FN) and integrins. Cell adhesion to the peritoneal matrix regulated by TG2 facilitates ovarian cancer dissemination. Therefore, disruption of the TG2-FN complex by small molecules may inhibit cell adhesion and metastasis. A novel high throughput screening (HTS) assay based on AlphaLISA TM technology was developed to measure the formation of a complex between His-TG2 and the biotinylated FN fragment that binds TG2 and to discover small molecules that inhibit this protein-protein interaction. Several hits were identified from 10,000 compounds screened. The top candidates selected based on .70% inhibition of the TG2/FN complex formation were confirmed by using ELISA and bioassays measuring cell adhesion, migration, invasion, and proliferation. In conclusion, the AlphaLISA bead format assay measuring the TG2-FN interaction is robust and suitable for HTS of small molecules. One compound identified from the screen (TG53) potently inhibited ovarian cancer cell adhesion to FN, cell migration, and invasion and could be further developed as a potential inhibitor for ovarian cancer dissemination. Citation: Yakubov B, Chen L, Belkin AM, Zhang S, Chelladurai B, et al. (2014) Small Molecule Inhibitors Target the Tissue Transglutaminase and Fibronectin Interaction. PLoS ONE 9(2): e89285. doi:10.1371/journal.pone.0089285 Editor: Jung Weon Lee, Seoul National University, Republic of Korea Received August 28, 2013; Accepted January 20, 2014; Published February 20, 2014 This is an open-access article, free of all copyright, and may be freely reproduced, distributed, transmitted, modified, built upon, or otherwise used by anyone for any lawful purpose. The work is made available under the Creative Commons CC0 public domain dedication. Funding: This work was supported by the American Cancer Society RSG-118022, US Department of Veterans Affairs, and Indiana University Simon Cancer Center Pilot Funds to DM, and the American Heart Association grant to AMB. The funders had no role in study design, data collection and analysis, decision to publish, or preparation of the manuscript. Competing Interests: The authors have declared that no competing interests exist. * E-mail: [email protected] (DM); [email protected] (BY) Introduction Protein-protein interactions (PPIs) regulate numerous cellular functions, including cell interactions with the extracellular matrix (ECM) and signaling pathways that go awry in cancer. Therefore, disruption of PPIs has been a desirable goal for drug discovery in cancer, as well as in other pathological conditions. The classical approach consists of designing peptides or peptide mimetics that competitively inhibit specific PPIs. Peptides inhibitors have been useful to demonstrate proof of principle concepts related to biological processes regulated by PPIs; however their restricted bioavailability and stability has limited their usefulness for clinical development. Small molecule inhibitors (SMIs) offer several advantages. They are fast-acting, reversible, and can serve as leads for subsequent drug optimization efforts. In this manuscript, we used high throughput screening (HTS) to identify SMIs for interacting tissue transglutaminase (TG2) and fibronectin (FN). TG2 is a member of the transglutaminase family that catalyzes Ca 2+ dependent protein crosslinking via formation of amide bonds. One of its unique properties compared to the other transglutaminases is its interaction with FN. The FN-binding site of TG2 has been mapped to amino acids 88–106 at its N-terminus [1], encompassing two anti-parallel b-strands located within the first b sandwich domain of TG2 and forming an extended hairpin. This region binds with high affinity to the 42-kDa domain of FN, consisting of modules I 6 II 1,2 I 7–9 [1–3]. The TG2-FN interaction strengthens b-integrin-mediated cellular adhesion to the ECM [4], playing a role in a variety of physiological and pathological processes. The well-described recognition sequence for FN on TG2 provides an opportunity for developing SMIs to disrupt this interaction. Often PPIs comprise large and flat interfaces difficult to block by SMIs; however, the TG2-FN interaction is an attractive target, because the interacting domains are not flat surfaces, but rather a relatively small TG2 hairpin inserting into a deep pocket of FN. We and others described increased expression of TG2 in epithelial malignancies, specifically in ovarian, breast and pancre- atic cancers [5–7]. TG2 has been linked to various functions in this context, but by and large the protein acts as a promoter of chemotherapy resistance [8,9] and a facilitator of metastasis [5,10,11]. By using intraperitoneal and orthotopic ovarian cancer xenograft models, our group demonstrated that TG2 increases peritoneal metastasis [5,11] and linked this process to b-integrin mediated ovarian cancer cell adhesion to the peritoneal matrix. We also showed that TG2 induces epithelial-to-mesenchymal transition (EMT) [11] which is a critical step in the initiation of PLOS ONE | www.plosone.org 1 February 2014 | Volume 9 | Issue 2 | e89285
-
Upload
independent -
Category
Documents
-
view
0 -
download
0
Transcript of Small Molecule Inhibitors Target the Tissue Transglutaminase and Fibronectin Interaction

Small Molecule Inhibitors Target the TissueTransglutaminase and Fibronectin InteractionBakhtiyor Yakubov1*, Lan Chen2, Alexey M. Belkin3, Sheng Zhang2, Bhadrani Chelladurai1,
Zhong-Yin Zhang4,5, Daniela Matei1,4,5,6*
1 Indiana University Department of Medicine, Indiana University School of Medicine, Indianapolis, Indiana, United States of America, 2 Chemical Genomics Core Facility,
Indiana University School of Medicine, Indianapolis, Indiana, United States of America, 3 University of Maryland Department of Biochemistry and Molecular Biology,
Indiana University School of Medicine, Indianapolis, Indiana, United States of America, 4 Indiana University Simon Cancer Center, Indiana University School of Medicine,
Indianapolis, Indiana, United States of America, 5 Department of Biochemistry and Molecular Biology, Indiana University School of Medicine, Indianapolis, Indiana, United
States of America, 6 VA Roudebush Hospital, Indiana University School of Medicine, Indianapolis, Indiana, United States of America
Abstract
Tissue transglutaminase (TG2) mediates protein crosslinking through generation of e2(c-glutamyl) lysine isopeptide bondsand promotes cell adhesion through interaction with fibronectin (FN) and integrins. Cell adhesion to the peritoneal matrixregulated by TG2 facilitates ovarian cancer dissemination. Therefore, disruption of the TG2-FN complex by small moleculesmay inhibit cell adhesion and metastasis. A novel high throughput screening (HTS) assay based on AlphaLISATM technologywas developed to measure the formation of a complex between His-TG2 and the biotinylated FN fragment that binds TG2and to discover small molecules that inhibit this protein-protein interaction. Several hits were identified from 10,000compounds screened. The top candidates selected based on .70% inhibition of the TG2/FN complex formation wereconfirmed by using ELISA and bioassays measuring cell adhesion, migration, invasion, and proliferation. In conclusion, theAlphaLISA bead format assay measuring the TG2-FN interaction is robust and suitable for HTS of small molecules. Onecompound identified from the screen (TG53) potently inhibited ovarian cancer cell adhesion to FN, cell migration, andinvasion and could be further developed as a potential inhibitor for ovarian cancer dissemination.
Citation: Yakubov B, Chen L, Belkin AM, Zhang S, Chelladurai B, et al. (2014) Small Molecule Inhibitors Target the Tissue Transglutaminase and FibronectinInteraction. PLoS ONE 9(2): e89285. doi:10.1371/journal.pone.0089285
Editor: Jung Weon Lee, Seoul National University, Republic of Korea
Received August 28, 2013; Accepted January 20, 2014; Published February 20, 2014
This is an open-access article, free of all copyright, and may be freely reproduced, distributed, transmitted, modified, built upon, or otherwise used by anyone forany lawful purpose. The work is made available under the Creative Commons CC0 public domain dedication.
Funding: This work was supported by the American Cancer Society RSG-118022, US Department of Veterans Affairs, and Indiana University Simon Cancer CenterPilot Funds to DM, and the American Heart Association grant to AMB. The funders had no role in study design, data collection and analysis, decision to publish, orpreparation of the manuscript.
Competing Interests: The authors have declared that no competing interests exist.
* E-mail: [email protected] (DM); [email protected] (BY)
Introduction
Protein-protein interactions (PPIs) regulate numerous cellular
functions, including cell interactions with the extracellular matrix
(ECM) and signaling pathways that go awry in cancer. Therefore,
disruption of PPIs has been a desirable goal for drug discovery in
cancer, as well as in other pathological conditions. The classical
approach consists of designing peptides or peptide mimetics that
competitively inhibit specific PPIs. Peptides inhibitors have been
useful to demonstrate proof of principle concepts related to
biological processes regulated by PPIs; however their restricted
bioavailability and stability has limited their usefulness for clinical
development. Small molecule inhibitors (SMIs) offer several
advantages. They are fast-acting, reversible, and can serve as
leads for subsequent drug optimization efforts. In this manuscript,
we used high throughput screening (HTS) to identify SMIs for
interacting tissue transglutaminase (TG2) and fibronectin (FN).
TG2 is a member of the transglutaminase family that catalyzes
Ca2+ dependent protein crosslinking via formation of amide
bonds. One of its unique properties compared to the other
transglutaminases is its interaction with FN. The FN-binding site
of TG2 has been mapped to amino acids 88–106 at its N-terminus
[1], encompassing two anti-parallel b-strands located within the
first b sandwich domain of TG2 and forming an extended hairpin.
This region binds with high affinity to the 42-kDa domain of FN,
consisting of modules I6 II1,2 I7–9 [1–3]. The TG2-FN interaction
strengthens b-integrin-mediated cellular adhesion to the ECM [4],
playing a role in a variety of physiological and pathological
processes. The well-described recognition sequence for FN on
TG2 provides an opportunity for developing SMIs to disrupt this
interaction. Often PPIs comprise large and flat interfaces difficult
to block by SMIs; however, the TG2-FN interaction is an
attractive target, because the interacting domains are not flat
surfaces, but rather a relatively small TG2 hairpin inserting into a
deep pocket of FN.
We and others described increased expression of TG2 in
epithelial malignancies, specifically in ovarian, breast and pancre-
atic cancers [5–7]. TG2 has been linked to various functions in this
context, but by and large the protein acts as a promoter of
chemotherapy resistance [8,9] and a facilitator of metastasis
[5,10,11]. By using intraperitoneal and orthotopic ovarian cancer
xenograft models, our group demonstrated that TG2 increases
peritoneal metastasis [5,11] and linked this process to b-integrin
mediated ovarian cancer cell adhesion to the peritoneal matrix.
We also showed that TG2 induces epithelial-to-mesenchymal
transition (EMT) [11] which is a critical step in the initiation of
PLOS ONE | www.plosone.org 1 February 2014 | Volume 9 | Issue 2 | e89285

metastasis and that the FN-binding domain of TG2 is sufficient to
initiate this process [12,13].
In addition, the TG2-mediated interaction between b-integrin
and FN activates cell survival pathways [14] and contributes to
doxorubicin resistance in breast cancer cells [15], as well as
cisplatin and dararbazine resistance in melanoma cells [16].
Downregulation of TG2 in U87MG glioblastoma cells disrupted
the assembly of FN in the ECM and sensitized tumors to
chemotherapy [17], supporting the key role of this protein at the
interface between cancer cells and the surrounding ECM. These
findings support the concept that targeting the TG2-FN interac-
tion with SMIs will disrupt cancer cell adhesion to the ECM, and
subsequently inhibit initiation of metastasis and development of
drug resistance.
In this study, we used HTS technology to identify SMIs for the
TG2-FN complex. For this, we developed and optimized an
AlphaLISATM assay to measure the interaction between the two
proteins and to screen a 10,000 compounds library for potential
inhibitors. The ChemDiv collection used for this study contains
highly purified compounds, diverse in structure, with drug-like
physical and chemical properties. The compounds obey the
Lipinski’s ‘‘rule of five’’ demonstrating good ADME (absorption,
distribution, metabolism and exertion) profiles, rendering them
suitable compounds for future development. Through subsequent
cell based validation assays we identified several hits that potently
blocked TG2-mediated cell adhesion and migration. We propose
that these SMIs can be further optimized and studied as potential
inhibitors of metastasis.
Materials and Methods
CellsSKOV3 and IGROV1 cells were obtained from the American
Type Culture Collection (ATCC, Manassas, VA), and cultured in
growth media containing 1:1 MCDB 105 (Sigma, St. Louis, MO)
and M199 (Cellgro, Manassas, VA) in the presence of 10% FBS at
37uC in a humidified atmosphere containing 5% CO2.
Chemical CompoundsA library of 10,000 compounds with diverse structures was
obtained from the Chemical Genomics Core Facility at Indiana
University. These 10,000 compounds were selected from over
500,000 novel compounds synthesized at ChemDiv in recent
years, representing a large chemical space. Average purity of the
compounds measured by mass spectrometry (MS) was greater than
95% (Figures S1 and S2 in File S1). Identified in the primary
screen and confirmed in a re-screen, 77 compounds were
purchased from ChemDiv, Inc (San Diego, CA).
HPLC-MS Analysis of Compound TG53Analytical HPLC-MS analysis was carried out on a Agilent
1200 analytic HPLC system with a 6130 Quadrupole MS
detector, equipped with a Phenomenex Kinetex 2.6 m XB-C18
column (2.5 mm, 4.6 mm 6 50 mm), eluted with a 0–90%
MeOH-H2O with 0.1% (v/v) TFA at 0.8 mL/min flow-rate
(gradient method: 3 min 0% MeOH, followed by 9 min 0–90%
MeOH linear gradient, followed by 5 min 90% MeOH).
Protein PurificationFull length TG2 was expressed in Escherichia coli (E. coli) and
purified as described [18], with minor modifications. Briefly,
overnight cultures from E. coli BL21 cells (Invitrogen, Grand
Island, NY) transformed with pET28-TG2 expression vector (gift
from Dr. R. Cerione Cornell University) were grown at 37uC.
Protein expression was induced with 300 uM IPTG for 24 h at
25uC. Cell pellets were lysed by sonication at 0uC in lysis buffer
(50 mM Na2HPO4, pH 7.5, 400 mM NaCl, 5 mM benzamidine,
5 mM 2-mercaptoethanol) containing 50 mM GTP, 50 mM ATP,
and 50 mg/ml PMSF. After sonication, NP-40 was added to a
concentration of 0.5% (vol/vol). Cell debris was removed by high-
speed centrifugation and the supernatant was passed through a
Talon metal-affinity resin column (Clontech, Mountain View,
CA). The His6-TG2 fusion protein was eluted with 50 mM Hepes
(pH 7.0), 50 mM NaCl, 5 mM 2-mercaptoethanol, 20 mM GDP,
160 mM imidazole. The eluted protein was dialyzed against
50 mM MES (pH 6.5), 50 mM NaCl, 10% glycerol, 1 mM
EDTA, 5 mM DTT and loaded onto a HiTrap anion exchange
column (GE Healthcare Life Biosciences, Pittsburgh, PA).
Recombinant TG2 was eluted by using a gradient of 50 mM to
450 mM NaCl in MES buffer. Fractions containing TG2 were
pooled and concentrated. Purity of TG2 was confirmed by SDS-
PAGE. The biotinylated 42-kDa gelatin binding fragment of FN
(FN42) was obtained by digestion with thermolysin from human
plasma, as previously described [1,14,19]. Briefly, the thermolysin
digest of human plasma FN was applied on a column with Gelatin-
Sepharose (Sigma-Aldrich, St. Louis, MO) and bound material
containing the 42 kDa (modules I6II1,2I7–9) and the 56 kDa
(modules I6II1,2III1) fragments was eluted with 1M arginine in
20 mM TrisHCl ph7.5. The resulting gelatin-binding fragments
were separated by binding to Heparin-Sepharose as only the
56 kDa fragment was able to bind under low salt conditions [19],
whereas the FN42 fragment remained in the flow through. The
FN42 fragment was biotinylated using sulfo-NHS-biotin (Pierce,
Rockfort, IL) and separated from free label by dialysis. The
labeling efficiency was 4.8 biotin groups per FN42 molecule.
AlphaLISA Assay for TG2-FN InteractionAn AlphaLISA assay in microplate format (PerkinElmer,
Shelton, CT) was developed to measure the TG2-FN interaction.
Interacting labeled proteins bring donor and acceptor beads into
close proximity (, 200 nm) generating a measurable chemilumi-
nescence signal. In brief, biotinylated FN42 and His6-TG2 were
serially diluted in 1.25X Universal Buffer (PerkinElmer) at
concentrations ranging from 1 to 10 nM and 1 to 25 nM,
respectively, in 96–well white solid plates (PerkinElmer). After 1
hour incubation at RT, 10 ml nickel chelate acceptor beads
(20 mg/ml) were added and incubated with the protein mixture for
1 h at RT. Lastly 10 ml streptavidin donor beads (20 mg/ml) were
added before the reading. Nonspecific binding was measured in
the absence of TG2 representing less than 5% of total binding.
The hook point was calculated from the titration curve plotted
using GraphPad Prism software (San Diego, CA). For the
subsequent high throughput screening, FN42 was diluted to
2.8 nM and TG2 to 8.3 nM, correspondingly, to achieve optimal
binding affinity. To determine the dynamic range of the assay the
Z9 value was measured by taking into account the means (m) and
the standard deviations (s) of the positive and the negative control,
according to the formula shown [20]. The controls represent the
upper and lower limit of the assay
Z~1{3(sn{sp)
Dmn{mpD
Average alpha signal for 1% DMSO alone was 105757.4 6
9995.5 (mean 6 SD) and estimated Z9 factor was 0.7, indicating
robust assay for HTS. The primary screen was performed in
TG2-Fibronectin Inhibitors
PLOS ONE | www.plosone.org 2 February 2014 | Volume 9 | Issue 2 | e89285

384-well plates with compounds arrayed at 10 mM concentration
in 1% DMSO. The alpha signal was measured using EnVisionHMultilabel Reader (PerkinElmer). After the initial screening,
compounds inducing greater than 50% of inhibition were re-
tested for validation.
Enzyme-linked Immunosorbent Assay (ELISA)ELISA measured the TG2-FN interaction in 96 well plates pre-
coated with monoclonal anti-His antibody (Roche, Indianapolis,
IN; 1:6000). Protein mixture of 10 nM TG2 and 3 nM FN42 was
used and SMIs were added at 1–30 mM concentrations. After 1 h
incubation at RT, plates were washed 3 times with 0.5% BSA in
PBS prior to 1 h incubation with streptavidin-HRP (Cell
Signalling, Boston, MA) diluted in PBS (1:2000). Following four
washes, 3,39,5,59 tetramethylbenzidine (TMB) substrate (Sigma)
was added for 5–15 minutes and the optical density was
determined at 405 nM with 450 nm as a reference filter using
Ultra Multifunctional Microplate Reader (Tecan, Durham, NC).
Data shown are means 6 SE of three replicates. The IC50 for
TG53 was calculated after incubating TG2 and FN42 in the
presence of various concentrations of TG53 (from 0 mM to
16 mM). The data were fitted by using non-linear regression to a
1-site competition model by GraphPad Prism. The inhibition
constant Ki was computed by using equations KmObs =
Km*(1+[I]/Ki) and Y = Vmax*X/(KmObs+X) in GraphPad
Prism, where X is substrate concentration, Y is response, I is the
concentration of inhibitor, Vmax is the maximum response, in the
absence of inhibitor, expressed in the same units as Y. Km is the
Michaelis-Menten constant, expressed in the same units as X.
Solid-phase Adhesion AssaysCells were labeled with calcein AM (Molecular Probes) and
seeded at a density of 46104 cells in 96-well plates pre-coated with
FN (5 mg/mL, Sigma), collagen type I (10 mg/ml, Sigma), or
bovine serum albumin (BSA, 1% w/v, Sigma) in the presence of
selected compounds diluted from 1–25 mM. All matrices were
blocked with BSA (1%) for 1 hour prior to cell seeding. After 60
minutes, adherent cells were quantified in a fluorescence plate
reader (Applied Biosystems). Experiments were performed in
quadruplicate and repeated at least twice.
Cell ProliferationCells were seeded in 96-well plates at a density of 26104 cells/
well in medium containing 10% FBS. After 16 h cells were
allowed to proliferate in serum free medium for up to 48 h in
presence or absence of selected SMIs. Cell proliferation was
measured by using the Cell Counting Kit-8 (CCK-8, Dojindo,
Japan) following the manufacturer’s directions. Absorbance values
were read using the Ultra Multifunctional Microplate Reader
(Tecan, Durham, NC). EC50 was determined by nonlinear
regression using GraphPad Prism software (GraphPad Software,
Inc., La Jolla, CA).
Scratch Wound Healing AssayWound healing was performed in 12-well plates coated with 1
mg/ml FN (Sigma) overnight at 4uC. SKOV3 cells were plated at a
density of 26105 cells/well in media containing 2% FBS. Under
these conditions cells adhered on substrate, but cell proliferation
was minimized. After 16 hours the cell monolayer was scraped in
straight line. Cell debris was removed and serum free media
containing selected SMIs or control was replenished. For
consistency during image acquisition, a reference point was
marked close to the scratch mark and the plate was imaged under
phase-contrast microscope at 0, 2, 6, 12 and 24 hours. Wound
closure was assessed as the distance between the wound edges,
calculated and quantified using the Image Pro-Express software.
The percentage of wound closure was evaluated using the formula
(wound size at 24 hours/ initial wound size) 6 100. The rate of
migration (mm/h) of SKOV3 cells into the wound space was
evaluated as the distance difference between wound edges at 0 and
24 h, divided by 24. The experiments were performed in
duplicates.
Invasion AssayAfter serum starvation overnight, 106 SKOV3 cells were seeded
into Millicell Cell Culture Inserts (Millipore, Billerica, MA) coated
with 0.3 mg/ml of matrigel (BD Biosciences, San Jose, California)
in serum free media containing selected SMIs or controls (10 mM).
Media in the bottom part of the transwell contained 20% FBS.
After 24 h incubation at 37uC and 5% CO2 transwells were
washed, migrating cells were fixed with 10% formalin (Fisher
Scientific, Waltham, MA) and stained for 30 minutes with 0.2%
crystal violet solution (MP Biomedicals, Solon, OH). Washed and
dried inserts were then photographed and the number of stained
cells was counted in 5 random fields. Average numbers of invading
cells per insert area were calculated and reported relative to the
number of cells seeded. The experiment was performed in
duplicates.
TG2 Enzymatic Activity AssayTo measure transglutaminase enzymatic activity, the formation
of hydroxamate from Na-CBZ-glutaminyl-glycine and hydroxyl-
amine was measured by using a colorimetric assay previously
described [21]. In brief, 1 mg of purified His-TG2 was incubated
with Na-CBZ-glutaminyl-glycine and hydroxylamine in the
presence of Ca2+ at 37uC and TGase activity was measured as
the amount of hydroxamate generated in the reaction. The
colorimetric reaction was measured at 525 nm in an ELISA plate
reader (SpectraMax 190). Selected inhibitors were used in
concentrations ranging from 1 to 30 mM. All assays were
performed in triplicates. Data are presented as means +/2 SD.
Results
AlphaLISA Assay Measures TG2-FN InteractionAn AlphaLISA assay adaptable to HTS in 384 well plates was
designed to measure the TG2-FN interaction. The assay measures
the interaction between His6-TG2 bound to Ni-chelated acceptor
beads and biotinylated FN42 bound to streptavidin coated donor
beads (Figure 1A). Protein concentrations were titrated to optimize
the assay, as the alpha beads have specific binding capacity and
become progressively saturated at increasing protein concentra-
tions. To determine optimal conditions, beads were incubated with
serial concentrations of TG2 and FN42, and saturation curves
determined the Kd for the interaction. Saturation was reached
with 3 nM of FN42 and 10 nM of His6-TG2, the Kd value being
2.43 nM (Figure 1B). At hook point, both beads are saturated
generating the maximum signal. Excess protein above these levels
inhibits the association between target molecules and beads
causing a decrease in signal. The hook point was reached at
10 nM of His6-TG2 and 3 nM of FN42 (Figure 1C). To further
evaluate the performance of the assay in HTS mode, the Z9 value
was calculated by taking into account the means (m) and the
standard deviations (s) of the positive and the negative controls.
The average Alpha signal was 105757.4 6 9995.5 (mean 6 SD)
and the estimated Z9 was 0.7, indicating robustness of the assay for
HTS.
TG2-Fibronectin Inhibitors
PLOS ONE | www.plosone.org 3 February 2014 | Volume 9 | Issue 2 | e89285

HTS Using the ChemDiv LibraryThe ChemDiv library containing 10,000 diverse compounds
arrayed at 10 mM each was screened using the assay described.
Primary hits (n = 90) were selected as those compounds yielding $
50% inhibition of control signal and were re-tested. Seventy seven
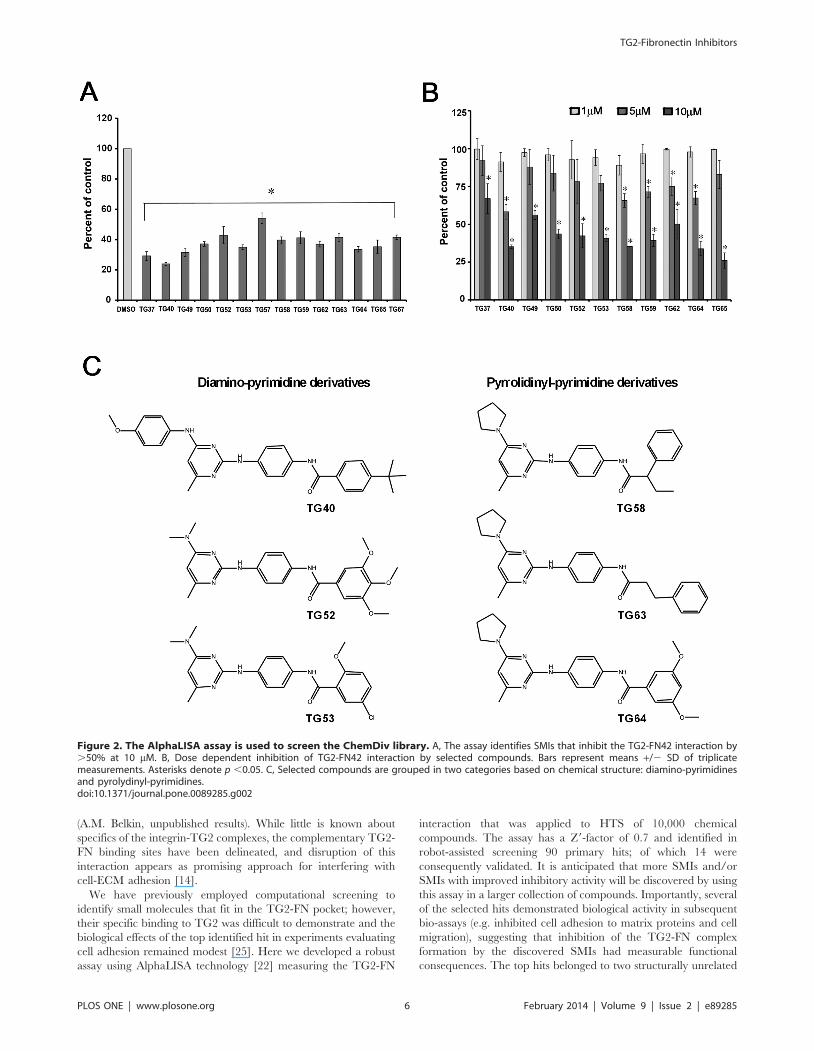
confirmed hits were selected and re-tested in triplicates (Figure 2A).
Of those, 14 compounds were selected based on confirmed $70%
inhibitory effect in validation AlphaLISA assay and were
characterized further. Dose-response experiments for selected
SMIs using the AlphaLISA assay demonstrated inhibition of the
TG2-FN interaction at concentrations greater than 1 mM. The
interaction was inhibited by .25% at 5 mM by several SMI
(TG49, TG53, TG58, TG59, TG62, TG63, TG64) and by 33%
to 79% by all tested compounds at 10 mM concentration
(Figure 2B). The top 14 hits have a common core (N2(4-
aminophenyl)pyrimidine-2,4-diamine) and belong to two groups
based on chemical structures (Table 1). One group of diamino-
pyrimidines includes compounds TG37, TG40, TG49, TG50,
TG52, TG53 and the other group of pyrolydinyl-pyrimidines
encompasses compounds TG58, TG59, TG63, TG64, and TG65
(Figure 2C). MS spectra of selected compounds are included in
Figures S1 and S2 in File S1. Purity of compound TG53 was
validated by HPLC-MS and was . 98% (Figure S1 in File S1).
Confirmation of Hits Using ELISAELISA measured TG2-FN interaction by using biotinylated
FN42 and His6-TG2 (Figure 3A). Specificity of the assay was
confirmed by using increasing concentrations of un-labeled FN42
(from 0 nM to 16 nM) added to the mixture of His-TG2 (5 nM)
and biotinylated FN42 (0 nM to 16 nM; Figure 3B). The data
indicate a competitive antagonism of unlabeled FN42-Bio towards
biotinylated FN42, showing that FN42 is capable of displacing
biotinylated FN42 from its binding site in TG2. Additionally, an
antibody against the FN binding domain of TG2 (4G3, MAB3839)
known to partially block the TG2-FN interaction decreased the
ELISA signal by 25%, suggesting that the assay can effectively
measure the properties of TG2-FN inhibitors (Figure 3C).
Compounds selected from the AlphaLISA screen were validated
by ELISA (Figure 3D). Most active compounds inhibited the
ELISA signal by 30 to 70%, TG53 being the most active inhibitor.
A dose-dependent decrease in the ELISA signal induced by TG53
was used to calculate the IC50 at 10 mM (Figure 3E). The
inhibition constant Ki for TG53 was calculated as 4.15 mM from
the effect of TG53 on FN42-Bio to TG2 (Figure 3F). As expected,
Lineweaver-Burk plot analysis of the binding data reveals that
TG53 competes for the same binding site in TG2 as FN42
(Figure 3F). A structurally similar compound incapable of blocking
TG2-FN interaction as measured by AlphaLISA assay was
selected from the ChemDiv library (TG288, see structure in
Figure S1A in File S1) and used as a negative control. The ELISA
signal was blocked by TG53, but not by TG288 (Figure S3B in
File S1).
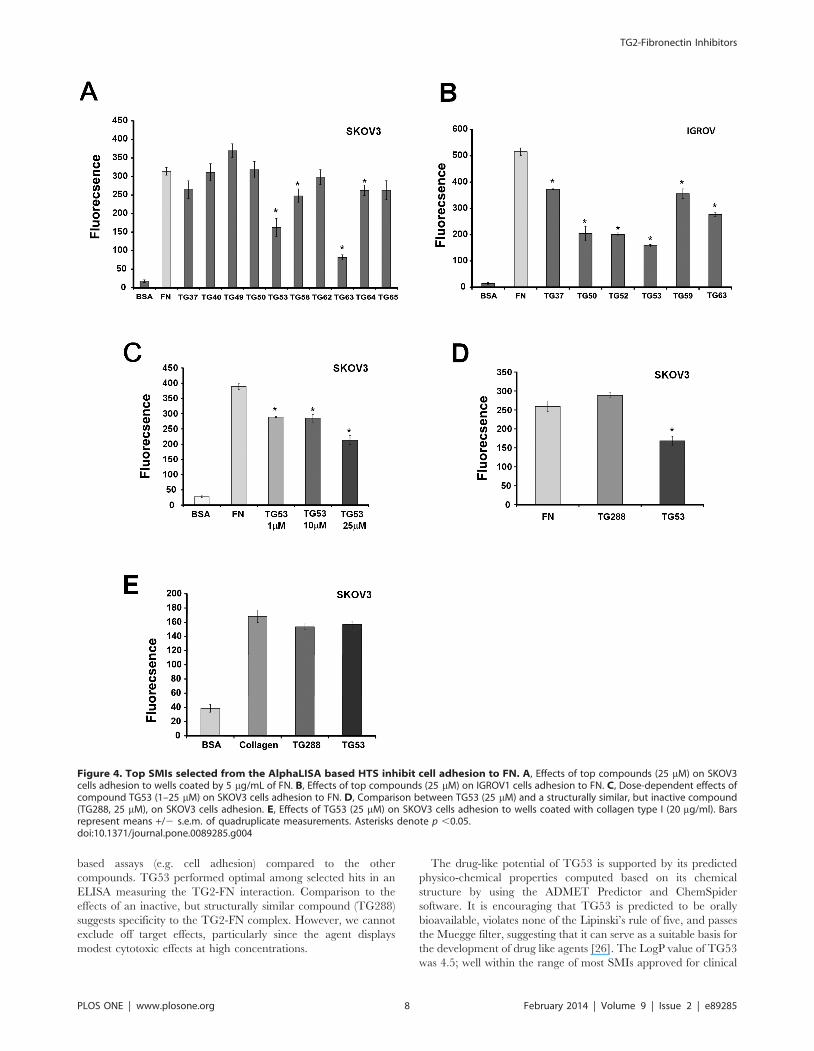
Selected SMIs Block Cancer Cell AdhesionAs TG2-FN interaction critically regulates cellular adhesion to
the ECM, we next studied the effects of selected SMIs on cell
adhesion to FN by using SKOV3 and IGROV1 ovarian cancer
cells that endogenously express TG2. We had previously
Figure 1. Characteristics of the AlphaLISATM assay developed to measure the TG2-FN42 interaction. A, Design of the AlphaLISA assaythat measures the TG2-FN interaction. Donor beads coated with streptavidin and acceptor nickel chelate beads were used to capture biotinylatedFN42 and His tagged TG2 protein, respectively. After excitation at 680 nm singlet oxygen is transferred from donor to acceptor beads coming withina distance of 200 nm, resulting in a chemiluminescence signal. B, Cross-titration was performed to optimize detection of the TG2-FN interaction bythe assay. Saturation isotherms of FN42 binding to TG2 were generated. The Kd was 2.43 nM. C, Titration curves represented with GraphPad Prismdemonstrate reaching the hook point at 3 nM biotinylated FN42 and 10 nM TG2-His.doi:10.1371/journal.pone.0089285.g001
TG2-Fibronectin Inhibitors
PLOS ONE | www.plosone.org 4 February 2014 | Volume 9 | Issue 2 | e89285

demonstrated using these cells that stable TG2 knock-down
inhibited adhesion to FN [5]. For this, we used a solid phase
adhesion assay in the presence of the selected compounds or
vehicle (control). TG53, TG58, TG63 and TG64 significantly
inhibited cell adhesion to FN in SKOV3 cells (Figure 4A). Similar
effects were noted in IGROV1 cells (Figure 4B); of the selected
SMIs, TG53 showing consistent and .50% inhibition in both cell
lines. Subsequent characterization of TG53 demonstrated dose-
dependent inhibition of cell adhesion to FN (Figure 4C), compared
to structurally similar, but inactive TG288 (Figure 4D). Further-
more, TG53 did not inhibit cell adhesion to collagen, another
ECM protein, suggesting specificity to the TG2-FN complex
(Figure 4E).
TG53 Blocks Cell Migration and InvasionAs cell adhesion and migration are intimately linked, we next
explored the effects of TG53 on cell motility and invasiveness by
using the wound healing and the transwell invasion assays.
Changes in wound size (distance between wound edges) at 24
hours post wounding and the rate of cell migration were analyzed,
as described. TG53 diluted to 10 mM significantly decreased
wound closure (Figure 5A–B; p,0.05) and cell migration rate (p,
0.05; Figure 5C) as compared to DMSO control. Furthermore, the
invasion rate through a trans-well coated with matrigel was also
decreased by TG53 compared to control (Figure 5D, p,0.05),
supporting that the compound inhibits cell motility and invasive-
ness.
TG53 Inhibits Cell Proliferation without Affecting TG2Enzyme Activity
As the catalytic domain is distinct from the FN-binding region
of TG2, we did not expect that SMIs that interfere with the TG2-
FN interaction would alter the transamidating activity of TG2.
Indeed, TG53 did not inhibit TG2 enzymatic activity at 1–30 mM
concentrations (Figure 5E). Anti-proliferative properties of selected
compounds, including those of TG53, were characterized by using
a CKK-8 assay after 48 hour incubation in the presence of
compounds diluted from 1 to 100 mM or vehicle. Dose-response
analyses revealed EC50 values in the 9 mM (e.g. TG63) to 21 mM
range (e.g. TG53; Figure 5F). TG53 induced less cytotoxicity
compared to other SMIs selected from the screen (e.g. TG64,
TG63, and TG37), suggesting less off-target effects; however the
compound was toxic to ovarian cancer cells at higher concentra-
tions. Importantly, TG53 was not cytotoxic at concentrations up
to 30 mM during shorter periods of treatment (Figure S4 in File
S1), as used in the previously described bioassays.
Discussion
In this manuscript, we describe a new strategy to measure the
interaction between TG2 and FN through proximity based
binding AlphaLISA assay [22]. Application of this assay to the
ChemDiv library of chemical compounds led to the discovery of
several potent TG2-FN inhibitors, which were subsequently shown
to block cell adhesion and migration in OC cell lines. Our findings
have several implications.
First, we demonstrate that the TG2-FN interaction is druggable.
Generally PPIs represent a daunting target for disruption by small
molecules due to their large interfacial areas and their often
noncontiguous contact points. However, the TG2-FN interaction
is characterized by a TG2 b-hairpin inserting into a deep pocket of
FN, rendering it an attractive complex to be disrupted by SMIs.
Resolution of the three-dimensional structure of TG2 has provided
important insight into the complex regulation of its functions
[18,23,24]. In addition to the catalytic triad consisting of Cys- 277,
His-335, and Asp-358, the protein has the FN-binding within its
N-terminal. The binding site to FN is located around the b-hairpin
loop (amino acids 88–106), and mutations within this sequence
significantly alter formation of a complex with FN [1].
On the surface of various cells, the complex between TG2 and
FN is further supported and stabilized by direct interactions of
both proteins with integrins, the major adhesion receptors
involved in cellular adhesion to the ECM proteins, including
FN. Due to modest affinity for the integrin-FN binding and strong
noncovalent association of TG2 with both these proteins, TG2
significantly enhances the interaction of cells with FN serving as a
bridge between integrins and FN, and a key mediator of the
integrin-TG2-FN ternary adhesion complexes [4,14]. Precise
mapping of the integrin-TG2 interaction is difficult, as the
composite integrin binding site on TG2 involves both its first
and fourth domains, whereas the TG2-binding site on integrins
includes several membrane-proximal epidermal growth factor
(EGF) like repeats of the b subunit away from the FN-binding site
Table 1. List of top hits from the HTS using AlphaLISA and their predicted physico-chemical characteristics.
Mass Formula LogP Rule of 5 Bio-availability Ghose filter Muegge filter Veber filter% inhibitionalphaLISA
TG 37 399.4 C23H21N5O2 5 yes yes yes yes yes 70.8
TG 40 481.6 C29H31N5O2 6.8 no yes no no yes 76.1
TG 49 453.5 C27H27N5O2 6.3 no yes no no yes 68.6
TG 50 453.5 C27H27N5O2 6.3 no yes no no yes 62.9
TG 52 437.5 C23H27N5O4 3.6 yes yes yes yes yes 57.1
TG 53 411.9 C21H22ClN5O2 4.5 yes yes yes yes yes 65
TG 58 433.5 C24H27N5O3 4.18 yes yes yes yes yes 60.3
TG 59 463.5 C25H29N5O4 4.03 yes yes no yes yes 58.8
TG 62 425.9 C22H21ClFO 5.25 no yes yes no yes 63
TG 63 415.5 C25H29N5O 5.47 no yes yes no yes 58.5
TG 64 401.5 C24H27N5O 4.92 yes yes yes yes yes 66.4
TG65 415.5 C25H29N5O 5.37 no yes yes no yes 64.7
doi:10.1371/journal.pone.0089285.t001
TG2-Fibronectin Inhibitors
PLOS ONE | www.plosone.org 5 February 2014 | Volume 9 | Issue 2 | e89285
(A.M. Belkin, unpublished results). While little is known about
specifics of the integrin-TG2 complexes, the complementary TG2-
FN binding sites have been delineated, and disruption of this
interaction appears as promising approach for interfering with
cell-ECM adhesion [14].
We have previously employed computational screening to
identify small molecules that fit in the TG2-FN pocket; however,
their specific binding to TG2 was difficult to demonstrate and the
biological effects of the top identified hit in experiments evaluating
cell adhesion remained modest [25]. Here we developed a robust
assay using AlphaLISA technology [22] measuring the TG2-FN
interaction that was applied to HTS of 10,000 chemical
compounds. The assay has a Z9-factor of 0.7 and identified in
robot-assisted screening 90 primary hits; of which 14 were
consequently validated. It is anticipated that more SMIs and/or
SMIs with improved inhibitory activity will be discovered by using
this assay in a larger collection of compounds. Importantly, several
of the selected hits demonstrated biological activity in subsequent
bio-assays (e.g. inhibited cell adhesion to matrix proteins and cell
migration), suggesting that inhibition of the TG2-FN complex
formation by the discovered SMIs had measurable functional
consequences. The top hits belonged to two structurally unrelated
Figure 2. The AlphaLISA assay is used to screen the ChemDiv library. A, The assay identifies SMIs that inhibit the TG2-FN42 interaction by.50% at 10 mM. B, Dose dependent inhibition of TG2-FN42 interaction by selected compounds. Bars represent means +/2 SD of triplicatemeasurements. Asterisks denote p ,0.05. C, Selected compounds are grouped in two categories based on chemical structure: diamino-pyrimidinesand pyrolydinyl-pyrimidines.doi:10.1371/journal.pone.0089285.g002
TG2-Fibronectin Inhibitors
PLOS ONE | www.plosone.org 6 February 2014 | Volume 9 | Issue 2 | e89285

classes of compounds that phenocopied each other, suggesting that
the compounds may be specific for the TG2-FN interface. We
recognize potential limitations of assays relying on purified labeled
proteins that might differ from their native conformations. The
specific binding of selected SMIs to the TG2-FN pocket remains to
be demonstrated in future analyses.
One of the newly discovered SMIs, TG53, was subsequently
characterized through complementary assays including dose-
response analyses, ELISA measuring the TG2-FN interaction,
and other bioassays quantifying cell adhesion, migration, and
proliferation. The focus on TG53 was based on its predicted drug-
like properties and highest observed inhibitory activity in cell-
Figure 3. ELISA-based approach measures the TG2-FN interaction. A, Design of the ELISA measuring the TG2-FN interaction. His tagged TG2is captured by the anti-His antibody coating the wells. Biotinylated FN42 interacting with TG2 is recognized by streptavidin-HRP, which reacts with aTMB substrate. The signal is abrogated if the TG2-FN interaction is disrupted. B, Specificity of the assay is demonstrated by incubating His-tagged TG2with increasing concentrations of biotinylated FN42 (from 0 nM to 16 nM) in the presence of unlabeled FN42 (from 0 nM to 16 nM). C, ELISA in thepresence of the competitive inhibitor 4G3, an anti-TG2 antibody against the FN-binding domain of TG2 (5 mg/ml), and in the presence of unlabeledFN42 (3 nM). D, ELISA measures inhibition of the TG2-FN42 interaction by SMIs selected from the AlphaLISA HTS. Bars represent means +/2 SD oftriplicate measurements. Asterisks denote p ,0.05. E, ELISA measures dose dependent inhibition of TG2-FN42 interaction by TG53. F, Saturationcurves of FN42 in the presence of increasing concentrations of TG53 were used to calculate the Ki (4.15 mM) of TG53 for TG2. Inset corresponds torepresentative Lineweaver-Burk plots showing that TG53 competes for the same binding site in TG2 as FN42.doi:10.1371/journal.pone.0089285.g003
TG2-Fibronectin Inhibitors
PLOS ONE | www.plosone.org 7 February 2014 | Volume 9 | Issue 2 | e89285
based assays (e.g. cell adhesion) compared to the other
compounds. TG53 performed optimal among selected hits in an
ELISA measuring the TG2-FN interaction. Comparison to the
effects of an inactive, but structurally similar compound (TG288)
suggests specificity to the TG2-FN complex. However, we cannot
exclude off target effects, particularly since the agent displays
modest cytotoxic effects at high concentrations.
The drug-like potential of TG53 is supported by its predicted
physico-chemical properties computed based on its chemical
structure by using the ADMET Predictor and ChemSpider
software. It is encouraging that TG53 is predicted to be orally
bioavailable, violates none of the Lipinski’s rule of five, and passes
the Muegge filter, suggesting that it can serve as a suitable basis for
the development of drug like agents [26]. The LogP value of TG53
was 4.5; well within the range of most SMIs approved for clinical
Figure 4. Top SMIs selected from the AlphaLISA based HTS inhibit cell adhesion to FN. A, Effects of top compounds (25 mM) on SKOV3cells adhesion to wells coated by 5 mg/mL of FN. B, Effects of top compounds (25 mM) on IGROV1 cells adhesion to FN. C, Dose-dependent effects ofcompound TG53 (1–25 mM) on SKOV3 cells adhesion to FN. D, Comparison between TG53 (25 mM) and a structurally similar, but inactive compound(TG288, 25 mM), on SKOV3 cells adhesion. E, Effects of TG53 (25 mM) on SKOV3 cells adhesion to wells coated with collagen type I (20 mg/ml). Barsrepresent means +/2 s.e.m. of quadruplicate measurements. Asterisks denote p ,0.05.doi:10.1371/journal.pone.0089285.g004
TG2-Fibronectin Inhibitors
PLOS ONE | www.plosone.org 8 February 2014 | Volume 9 | Issue 2 | e89285
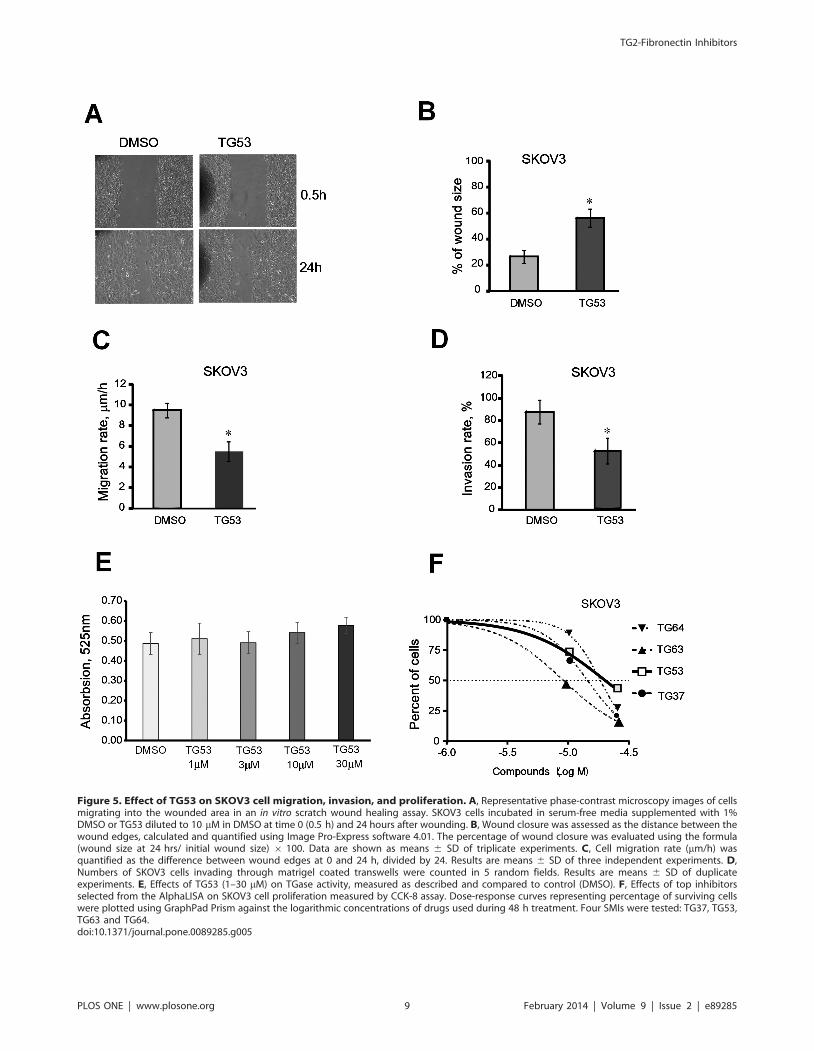
Figure 5. Effect of TG53 on SKOV3 cell migration, invasion, and proliferation. A, Representative phase-contrast microscopy images of cellsmigrating into the wounded area in an in vitro scratch wound healing assay. SKOV3 cells incubated in serum-free media supplemented with 1%DMSO or TG53 diluted to 10 mM in DMSO at time 0 (0.5 h) and 24 hours after wounding. B, Wound closure was assessed as the distance between thewound edges, calculated and quantified using Image Pro-Express software 4.01. The percentage of wound closure was evaluated using the formula(wound size at 24 hrs/ initial wound size) 6 100. Data are shown as means 6 SD of triplicate experiments. C, Cell migration rate (mm/h) wasquantified as the difference between wound edges at 0 and 24 h, divided by 24. Results are means 6 SD of three independent experiments. D,Numbers of SKOV3 cells invading through matrigel coated transwells were counted in 5 random fields. Results are means 6 SD of duplicateexperiments. E, Effects of TG53 (1–30 mM) on TGase activity, measured as described and compared to control (DMSO). F, Effects of top inhibitorsselected from the AlphaLISA on SKOV3 cell proliferation measured by CCK-8 assay. Dose-response curves representing percentage of surviving cellswere plotted using GraphPad Prism against the logarithmic concentrations of drugs used during 48 h treatment. Four SMIs were tested: TG37, TG53,TG63 and TG64.doi:10.1371/journal.pone.0089285.g005
TG2-Fibronectin Inhibitors
PLOS ONE | www.plosone.org 9 February 2014 | Volume 9 | Issue 2 | e89285

use and its aqueous solubility was low at 5.45 mole/liter. Its
predicted cellular permeability in Madin-Darby canine kidney
(MDCK) cells was 378 [27], the highest among the top hits
selected from the screen, indicating intermediate solubility.
Further optimization of this compound may increase its potency,
cellular permeability, and bioavailability.
As the TG2-FN interaction plays a role in cell adhesion to the
matrix, we postulate that SMIs targeting this complex may be
developed into agents that block cancer metastasis, particularly for
tumors like ovarian cancer that rely on adhesion to the ECM, as a
primary mode of dissemination. We recognize that SMIs targeting
the TG2-FN interaction might interfere with other physiological
processes mediated by this PPI, such as formation of blood clots,
wound healing, or certain immune responses involving cell
adhesion to FN [28–31]. Therefore, future evaluation of such
SMI in vivo must include careful assessment of potential toxic
effects due to interference with TG2-mediated physiologic
processes.
In summary, our results support that the TG2-FN interaction is
a novel targetable PPI whose disruption could inhibit cell adhesion
to the ECM. The AlphaLISATM technology based assay
developed here is suitable for HTS and can be used to screen
larger libraries. We propose that the top compound identified,
TG53, is a specific inhibitor of the TG2-FN complex with
potential utility as a novel therapeutic targeting cancer metastasis
or as a new biochemical tool to study cell adhesion to the matrix.
Supporting Information
File S1 Figures S1–S4.
(DOCX)
Acknowledgments
We thank Dr. John Turchi for helpful suggestions.
Author Contributions
Conceived and designed the experiments: BY LC BC DM. Performed the
experiments: BY LC SZ BC. Analyzed the data: BY LC BC SZ ZYZ DM.
Contributed reagents/materials/analysis tools: BY LC AB BC ZYZ DM.
Wrote the paper: BY LC AB ZYZ BC DM.
References
1. Hang J, Zemskov EA, Lorand L, Belkin AM (2005) Identification of a novelrecognition sequence for fibronectin within the NH2-terminal beta-sandwich
domain of tissue transglutaminase. J Biol Chem 280: 23675–23683.
2. Akimov SS, Belkin AM (2001) Cell-surface transglutaminase promotesfibronectin assembly via interaction with the gelatin-binding domain of
fibronectin: a role in TGFbeta-dependent matrix deposition. J Cell Sci 114:2989–3000.
3. Radek JT, Jeong JM, Murthy SN, Ingham KC, Lorand L (1993) Affinity of
human erythrocyte transglutaminase for a 42-kDa gelatin-binding fragment ofhuman plasma fibronectin. Proc Natl Acad Sci U S A 90: 3152–3156.
4. Zemskov EA, Janiak A, Hang J, Waghray A, Belkin AM (2006) The role of tissuetransglutaminase in cell-matrix interactions. Front Biosci 11: 1057–1076.
5. Satpathy M, Cao L, Pincheira R, Emerson R, Bigsby R, et al. (2007) Enhancedperitoneal ovarian tumor dissemination by tissue transglutaminase. Cancer Res
67: 7194–7202.
6. Verma A, Wang H, Manavathi B, Fok JY, Mann AP, et al. (2006) Increasedexpression of tissue transglutaminase in pancreatic ductal adenocarcinoma and
its implications in drug resistance and metastasis. Cancer Res 66: 10525–10533.7. Mann AP, Verma A, Sethi G, Manavathi B, Wang H, et al. (2006)
Overexpression of Tissue Transglutaminase Leads to Constitutive Activation
of Nuclear Factor-{kappa}B in Cancer Cells: Delineation of a Novel Pathway.Cancer Res 66: 8788–8795.
8. Kumar A, Xu J, Brady S, Gao H, Yu D, et al. (2010) Tissue transglutaminasepromotes drug resistance and invasion by inducing mesenchymal transition in
mammary epithelial cells. PLoS One 5: e13390.
9. Verma A, Guha S, Diagaradjane P, Kunnumakkara AB, Sanguino AM, et al.(2008) Therapeutic significance of elevated tissue transglutaminase expression in
pancreatic cancer. Clin Cancer Res 14: 2476–2483.10. Satpathy M, Shao M, Emerson R, Donner DB, Matei D (2009) Tissue
transglutaminase regulates matrix metalloproteinase-2 in ovarian cancer bymodulating cAMP-response element-binding protein activity. The Journal of
biological chemistry 284: 15390–15399.
11. Shao M, Cao L, Shen C, Satpathy M, Chelladurai B, et al. (2009) Epithelial-to-mesenchymal transition and ovarian tumor progression induced by tissue
transglutaminase. Cancer Res 69: 9192–9201.12. Cao L, Shao M, Schilder J, Guise T, Mohammad KS, et al. (2012) Tissue
transglutaminase links TGF-beta, epithelial to mesenchymal transition and a
stem cell phenotype in ovarian cancer. Oncogene 31: 2521–2534.13. Condello S, Cao L, Matei D (2013) Tissue transglutaminase regulates beta-
catenin signaling through a c-Src-dependent mechanism. FASEB J.14. Akimov SS, Krylov D, Fleischman LF, Belkin AM (2000) Tissue transgluta-
minase is an integrin-binding adhesion coreceptor for fibronectin. J Cell Biol148: 825–838.
15. Herman JF, Mangala LS, Mehta K (2006) Implications of increased tissue
transglutaminase (TG2) expression in drug-resistant breast cancer (MCF-7) cells.Oncogene 25: 3049–3058.
16. Fok JY, Ekmekcioglu S, Mehta K (2006) Implications of tissue transglutaminaseexpression in malignant melanoma. Mol Cancer Ther 5: 1493–1503.
17. Yuan L, Siegel M, Choi K, Khosla C, Miller CR, et al. (2007) Transglutaminase
2 inhibitor, KCC009, disrupts fibronectin assembly in the extracellular matrix
and sensitizes orthotopic glioblastomas to chemotherapy. Oncogene 26: 2563–
2573.
18. Liu S, Cerione RA, Clardy J (2002) Structural basis for the guanine nucleotide-
binding activity of tissue transglutaminase and its regulation of transamidation
activity. Proc Natl Acad Sci U S A 99: 2743–2747.
19. Borsi L, Castellani P, Balza E, Siri A, Pellecchia C, et al. (1986) Large-scale
procedure for the purification of fibronectin domains. Anal Biochem 155: 335–
345.
20. Zhang JH, Chung TD, Oldenburg KR (1999) A Simple Statistical Parameter for
Use in Evaluation and Validation of High Throughput Screening Assays.
J Biomol Screen 4: 67–73.
21. Folk JE, Cole PW (1966) Transglutaminase: mechanistic features of the active
site as determined by kinetic and inhibitor studies. Biochim Biophys Acta 122:
244–264.
22. Pfluger M, Kapuscik A, Lucas R, Koppensteiner A, Katzlinger M, et al. (2013) A
combined impedance and AlphaLISA-based approach to identify anti-
inflammatory and barrier-protective compounds in human endothelium.
J Biomol Screen 18: 67–74.
23. Han BG, Cho JW, Cho YD, Jeong KC, Kim SY, et al. (2010) Crystal structure
of human transglutaminase 2 in complex with adenosine triphosphate.
International Journal of Biological Macromolecules 47: 190–195.
24. Pinkas DM, Strop P, Brunger AT, Khosla C (2007) Transglutaminase 2
undergoes a large conformational change upon activation. Plos Biology 5: 2788–
2796.
25. Khanna M, Chelladurai B, Gavini A, Li L, Shao M, et al. (2011) Targeting
ovarian tumor cell adhesion mediated by tissue transglutaminase. Molecular
cancer therapeutics 10: 626–636.
26. Muegge I, Heald SL, Brittelli D (2001) Simple selection criteria for drug-like
chemical matter. J Med Chem 44: 1841–1846.
27. Gertz M, Harrison A, Houston JB, Galetin A (2010) Prediction of human
intestinal first-pass metabolism of 25 CYP3A substrates from in vitro clearance
and permeability data. Drug Metab Dispos 38: 1147–1158.
28. Belkin AM, Tsurupa G, Zemskov E, Veklich Y, Weisel JW, et al. (2005)
Transglutaminase-mediated oligomerization of the fibrin(ogen) {alpha}C-
domains promotes integrin-dependent cell adhesion and signaling. Blood.
29. Belkin AM, Zemskov EA, Hang J, Akimov SS, Sikora S, et al. (2004) Cell-
surface-associated tissue transglutaminase is a target of MMP-2 proteolysis.
Biochemistry 43: 11760–11769.
30. Falasca L, Iadevaia V, Ciccosanti F, Melino G, Serafino A, et al. (2005)
Transglutaminase type II is a key element in the regulation of the anti-
inflammatory response elicited by apoptotic cell engulfment. J Immunol 174:
7330–7340.
31. Fesus L, Piacentini M (2002) Transglutaminase 2: an enigmatic enzyme with
diverse functions. Trends Biochem Sci 27: 534–539.
TG2-Fibronectin Inhibitors
PLOS ONE | www.plosone.org 10 February 2014 | Volume 9 | Issue 2 | e89285