Intergranular and intragranular behavior of polycrystalline aggregates. Part 1: F.E. model
Upload
independentCategory
view
2download
0
ARTICLE IN PRESS
0304-8853/$
doi:10.1016
CorrespE-mail a
Journal of Magnetism and Magnetic Materials 306 (2006) 60–68
www.elsevier.com/locate/jmmm
The contribution of grain boundary and defects to the resistivityin the ferromagnetic state of polycrystalline manganites
P.R. Sagdeoa,, Shahid Anwara, N.P. Lallaa, S.I. Patilb
aUGC-DAE Consortium for Scientific Research, Khandwa Road, University Campus, Indore 452017, IndiabDepartment of Physics, University of Pune, Pune 411007, India
Received 12 August 2005; received in revised form 8 February 2006
Available online 9 March 2006
Abstract
In the present study we report the precise resistivity measurements for the polycrystalline bulk sample as well as highly oriented thin-
films of La0.8Ca0.2MnO3. The poly crystalline sample was prepared by standard solid-state reaction route and the oriented thin film was
prepared by pulsed laser deposition (PLD). The phase purity of these samples was confirmed by X-ray diffraction and the back-scattered
electron imaging using scanning electron microscopy (SEM). The oxygen stoichiometry analysis was done by iodimetry titration. The
resistivities of these samples were carried out with four-probe resistivity measurement setup. The observed temperature dependence of
resistivity data for both the samples was fitted using the polaron model. We have found that polaronic model fits well with the
experimental data of both polycrystalline and single crystal samples. A new phenomenological model is proposed and used to estimate
contribution to the resistivity due to grain boundary in the ferromagnetic state of polycrystalline manganites and it has been shown that
the scattering of electrons from the grain boundary (grain surface) is a function of temperature and controlled by the effective grain
resistance at that temperature.
r 2006 Elsevier B.V. All rights reserved.
PACS: 75.47.Lx; 73.40.c; 61.72.Mm
Keywords: Manganites; Grain boundary; Electric transport
1. Introduction
The discovery of colossal magnetoresistance (CMR) inperovskite manganites triggered the intense scientificresearch to understand the physical origin of variousproperties of manganites [1]; on the other hand, this systemhas its applications in new emerging spintronics industry[2]. Despite tremendous experimental efforts [1], the basicphysics and the microscopic mechanism for the colossalmagnetoresistance and the temperature dependence of itselectrical resistivity in these materials are still hot topics. Inthe case of lanthanum manganites it has been observed thatsize of the grains and grain boundaries play a very crucialrole in determining the transport and magneto-transportproperties [3,4] and it has been observed that the presence
- see front matter r 2006 Elsevier B.V. All rights reserved.
/j.jmmm.2006.02.106
onding author. Tel.: +917312463913; fax: +917312462294.
ddress: [email protected] (P.R. Sagdeo).
of grain-boundaries increase the magnetoresistance effect.Due to anisotropy in the magnetization in the singlecrystals of these materials [5], polycrystalline manganitesseems to be more useful than that of the single crystals,hence for most of the applications it may be important toknow the contribution of these grain boundaries to theresistivity, magneto-resistance, etc.The present study is focused on the calculation of the
grain-boundary contribution to the resistivity of thesematerials. In order to address the issue of grain boundarycontribution to the resistivity we have precisely measuredthe temperature dependence of DC electrical resistivity ofpulsed laser-deposited oriented thin film and that ofpolycrystalline bulk sample of La0.8Ca0.2MnO3. A newphenomenological model is proposed and used to estimatecontribution to the residual resistivity due to grainboundaries in the ferromagnetic state of polycrystallinemanganites.

ARTICLE IN PRESSP.R. Sagdeo et al. / Journal of Magnetism and Magnetic Materials 306 (2006) 60–68 61
2. Experimental
(A)
Sample preparations and characterizations: The poly-crystalline bulk sample of La0.8Ca0.2MnO3 was pre-pared by standard solid-state reaction route; usingstoichiometric proportions of CaCO3, La2O3, andMnO2 as the starting ingredients. Powders of CaCO3and MnO2 were preheated at 100 1C and that of La2O3
was preheated at 800 1C before weighing. The appro-priate proportions of the powders were mixed,numbers of wet grindings were followed by heatingat 900, 1000, 1100, 1250 1C, for 24 h and the palletswere finally sintered for 40 h at 1350 1C in a closedmuffle furnace. The thin film of La0.8Ca0.2MnO3 wasdeposited by PLD using Excimer laser (KrF, l ¼248 nm and pulse width of 20 ns) on LaAlO3 (0 0 z)substrate. During deposition the substrate temperaturewas maintained at 650 1C and the oxygen pressure wasmaintained at 200m-Torr. For oxygen stoichiometryand the relaxation strain if any in the film, thedeposited thin film was annealed at 850 1C for 15 h inair ambient and slowly cooled at the rate of 3 1C/min.to room temperature. Bulk structural characterizationof the as-prepared samples was carried out using X-raydiffraction (XRD) on a Rigaku diffractometermounted on a Rigaku rotating anode X-ray generator.The angular aperture of the divergence and thescattering slits was kept at 0.51 and that of thereceiving slit was kept at 0.0461. A plane crystalgraphite [0 0 2] monochromator was used in thediffracted beam path. Back-scattered electron imagingusing a JEOL-SEM 5600 was carried out for all thesamples to explore the possibility of secondary phases,which might have been missed by bulk XRDcharacterization. Ca concentrations in the synthesizedsamples were verified using EDAX analysis. Theobtained XRD data for poly crystalline sample wasrefined using FULLPROF-2K Rietveld refinementprogram [6].
(B)
Iodimetry titration: In order to estimate the oxygenstoichiometry of the polycrystalline sample we haveused the fine powder of polycrystalline sample foriodimetry titration. The iodimetry titration was doneusing potassium dichromate (K2Cr2O7), hydrochloricacid (H–Cl), potassium iodide (K–I), sodium phiosul-phate penta hydrate (Na2S2O3:5H2O) and sodiumhydrogen carbonate (Na–H–CO3).(C)
Resistivity measurements: The temperature dependenceof DC resistivity was carried out using Van Der Pauwfour-probe measurement technique [7]. In order toavoid even the smallest contribution of contactresistance in the resistance measurements, the sampleswere subjected to the proper shape as discussed by VanDer Pauw [7]. The resistivity of both the samples wasmeasured down to 80K at temperature intervals of0.5K and with a temperature stability of better than10mK during measurements. In order to achieveuniform temperature throughout the polycrystallinesample it was thinned to below 0.5mm. For each datapoint the voltage measurements were carried out after3min of extra dwell period once the requiredtemperature gets stabilized. The thinning of thesamples also improves the signal to noise ratio in themeasurement. The value of the constant current waschosen such that the heating effects at the contactsand within the sample as such were negligible. Inorder to avoid the thermoelectric effect we collectedthe data for positive as well as negative currentdirections (bipolar measurements) and average 10such bipolar voltage data to find the value ofresistance. For above measurements Keithley’ssource-meter model-2400, multimeter-2000 and Lake-shore’s 331-temperature controller were used throughGPIB interface.
3. Results and discussions
(a)
X-ray diffraction: Fig. 1(a) shows the X-ray diffraction(XRD) pattern for polycrystalline sample. The ob-tained XRD for polycrystalline sample was refinedusing FULLPROF 2K Reitveld Refinement programwith the space group Pnma; the absence of anyunaccounted peak confirms the phase purity of thesample. Fig. 1(b) is the XRD for the thin film sample.Presence of only (00 l) peaks shows the oriented growthalong [0 0 1]. The inset of Fig. 1(b) is a o scans for thesame film. The FWHM of the [0 0 2] peak is found to be0.351, whereas the FWHM for o scans is found to be0.511. The comparable values of these FWHMs showthat the film is highly oriented.(b)
Iodimetry titration: We have performed the iodimetrytitration of the powder samples six times and find theMn4+ content in the powder sample and have foundthat the Mn4+ content in our sample is around 20.86%which is very close to 20% as expected, this suggeststhat the sample is very close to stoichiometry and thusit is possible to compare the resistivities of thepolycrystalline sample and oriented thin film.(c)
SEM-EDAX: Fig. 2(a) and (b) shows the scanningelectron micrographs of oriented thin film and poly-crystalline sample, respectively taken in back scatteringmode. Both the figures show uniform contrast through-out the sample, which confirms that the samples aresingle phase. We could not find any grain boundary ormicro cracks on the oriented thin film, which confirmsthat the oriented film is nearly single crystalline. TheEDAX analysis shows that the ratio of La/Ca is nearlysame in thin film as well as in bulk sample.(d)
Resistivity measurements: As mentioned above we havemeasured the resistivity as a function of temperaturewith necessary precautions. The resistivity as a functionof temperature (r–T) for polycrystalline and orientedthin-film samples are shown in Fig. 3(a) and (b),
ARTICLE IN PRESS
20 40 60 80 100 120
-5000
0
5000
10000
15000
20000
25000 Polycrystalline La0.8Ca0.2MnO3
Inte
nsity
(a.u
.)
2θ
20 40 60
0
1x10⁵
2x10⁵
3x10⁵
20 22 24 26
0
1x1042x1043x1044x1045x104Oriented thin film of La0.8Ca0.2MnO3
2T= 46.96
Inte
nsity
(a.u
.)
θ
Inte
nsity
(a.u
.)
2θ(b)
(a)
Fig. 1. (a) XRD for polycrystalline powder sample (open circle) Black line
shows the Reitveld fit to the obtained XRD with the space group Pnma.
(b) XRD for thin film, showing the oriented growth along [0 0 1]. The inset
shows the o scans for the film.
Fig. 2. Scanning electron microscopy images taken in back scattering
mode, showing uniform contrast. (a) For oriented thin film. (b) For
polycrystalline bulk sample.
P.R. Sagdeo et al. / Journal of Magnetism and Magnetic Materials 306 (2006) 60–6862
respectively. We have analyzed our data with thepolaronic model as discussed by Zhao et al. [8]. Beforewe present our actual results we wish to justify the useof polaronic model.
The temperature dependence electrical resistivity oflanthanum manganites may be divided in to three differentregimes it is shown schematically in Fig. 4.
3.1. Mechanism of electrical transport in Region I
(the paramagnetic insulating phase)
In the case of lanthanum manganites the electricaltransport properties and the simultaneous occurrence offerromagnetic and metal–insulator transition may bequalitatively explained by double exchange model asexplained by Zener [9]. But It has been recognized byMillis et al. [10] that the double exchange model isinsufficient to explain the experimental results, and theyproposed that in order to explain the temperaturedependence of electrical resistivity and the dependence toferromagnetic transition temperature (TC) on bare band-
width (W) one must consider the strong coupling ofitinerant electrons with the lattice which arises due to thedynamic Jahn Teller effect, these arguments lead to thepolaronic nature of the charge carriers. Many experimentalinvestigations have suggested the evidence of polaronformation in the paramagnetic regime [11–13] of manga-nites. In the case of lanthanum manganites, the tempera-ture dependence of small polaronic resistivity may bedescribed by
rðTÞ ¼ CT expðEP=kBTÞ. (1)
The quantity C is given by C ¼ ðh=ed2ÞðkBT=_oÞ, d is the
site-to-site hopping distance. But on the basis of Oxygenisotopic studies Zhao et al. [14] argued that the electricaltransport in the paramagnetic state is due to small polaronhopping but such polarons are thermally excited fromlocalized bipolaronic states. This is due to the fact that thesmall polaronic model unable to account the experimentalobservations of isotopic exchange in these systems. Inorder to over come this problem they proposed theimmobile bipolaron formation in the paramagnetic state
ARTICLE IN PRESS
Temperature (K)
Region III Region II Region I
Res
istiv
ity (
Ω-c
m)
Fig. 4. A schematic for temperature dependence of resistivity for
La1xCaxMnO3 (0.2oxo 0.5). Region I: sample is in paramagnetic
insulating state. Region II: Sample is in competing region, the width of
this region is purely depends on the macroscopic properties of the sample
and may be decided by measuring hysterysis in the resistivity. Region III:
sample is in ferromagnetic metallic state.
50 100 150 200 250 300 350 400-0.005
0.000
0.005
0.010
0.015
0.020
0.025
0.030
0.035
50 100 150 200 250 300
0.00
0.05
0.10
0.15
0.20
0.25Polycrystalline Sample
Temperature(K)
Res
istiv
ity(Ω
-cm
)
Thin film
(a)
(b)
Fig. 3. The resistivity as a function of temperature (r–T): (a) for
polycrystalline sample; (b) for oriented thin-film samples.
P.R. Sagdeo et al. / Journal of Magnetism and Magnetic Materials 306 (2006) 60–68 63
and proposed the temperature dependence of resistivity ofthe form,
rðTÞ ¼ ðD=ffiffiffiffi
TpÞ expðEP=kBTÞ. (2)
This equation not only fit the region of interest butalso explains the observed results of isotopic exchangequantitatively.
3.2. Mechanism of electrical transport in Region II
‘‘competing regime’’ (the paramagnetic insulating
phase+ferromagnetic metallic regime)
In the Region II, the sample is in the competing region,here both the paramagnetic insulating and ferromagneticmetallic cluster may co-exists, and there is strong competi-tion between self-trapped polarons and their delocalizationdue to the ferromagnetic ordering [15,16]. Li et al. recentlyshown that the ferromagnetic clusters exist in theparamagnetic phase in these materials [17]. Hence theresistivity in this regime may be described by two-component model as suggested by Rubinstein [18] andYuan et al. [19].
3.3. Mechanism of electrical transport in Region III
(low-temperature regime)
As explained above, the resistivity of the manganitesmay be described within the framework of double exchangemodel. Kubo and Ohata [20] have calculated the tempera-ture dependence of electrical resistivity within the frame-work of double exchange model, and proposed that thelow-temperature resistivity is due to the second orderelectron–magnon scattering and found that the resistivityat low temperature should be proportional to T9/2. This isin consistent with the band structure calculation ofmanganites which assumes half metallic double exchangesystem [21], hence the first order electron–magnon scatter-ing is forbidden in these systems. It has been proposed bySchiffer et al. [22] and also by Synder et al. [23] that the lowtemperature resistivity of manganites may be described inthe terms of power law as
rðTÞ ¼ r0 þ C1T9=2 þ C2T2. (3)
Here r0, C1 and C2 are constants, and the term C2 T2
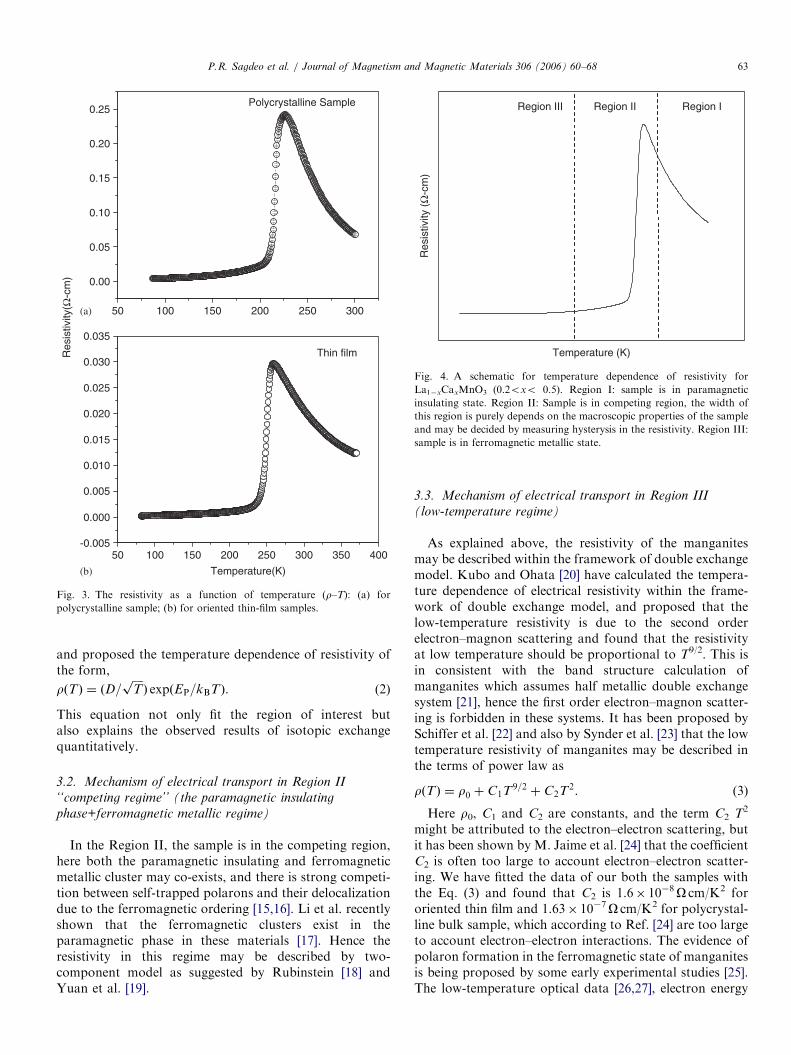
might be attributed to the electron–electron scattering, butit has been shown by M. Jaime et al. [24] that the coefficientC2 is often too large to account electron–electron scatter-ing. We have fitted the data of our both the samples withthe Eq. (3) and found that C2 is 1.6 108O cm/K2 fororiented thin film and 1.63 107O cm/K2 for polycrystal-line bulk sample, which according to Ref. [24] are too largeto account electron–electron interactions. The evidence ofpolaron formation in the ferromagnetic state of manganitesis being proposed by some early experimental studies [25].The low-temperature optical data [26,27], electron energy
ARTICLE IN PRESS
80 100 120 140
3.0x10⁻⁴
4.0x10⁻⁴
5.0x10⁻⁴
80 100 120 140
-1.0x10⁻⁶
1.0x10⁻⁶
80 100 120 140
4.0x10⁻³
5.0x10⁻³
6.0x10⁻³
7.0x10⁻³
8.0x10⁻³
80 100 120 140
-2.0x10⁻⁵
0.0
2.0x10⁻⁵
Temperature(K)
Res
istiv
ity(Ω
-cm
)
∆ρ/ρ
Temperature(K)
∆ρ/ρ
Temperature(K)
(a)
(b)
0.0
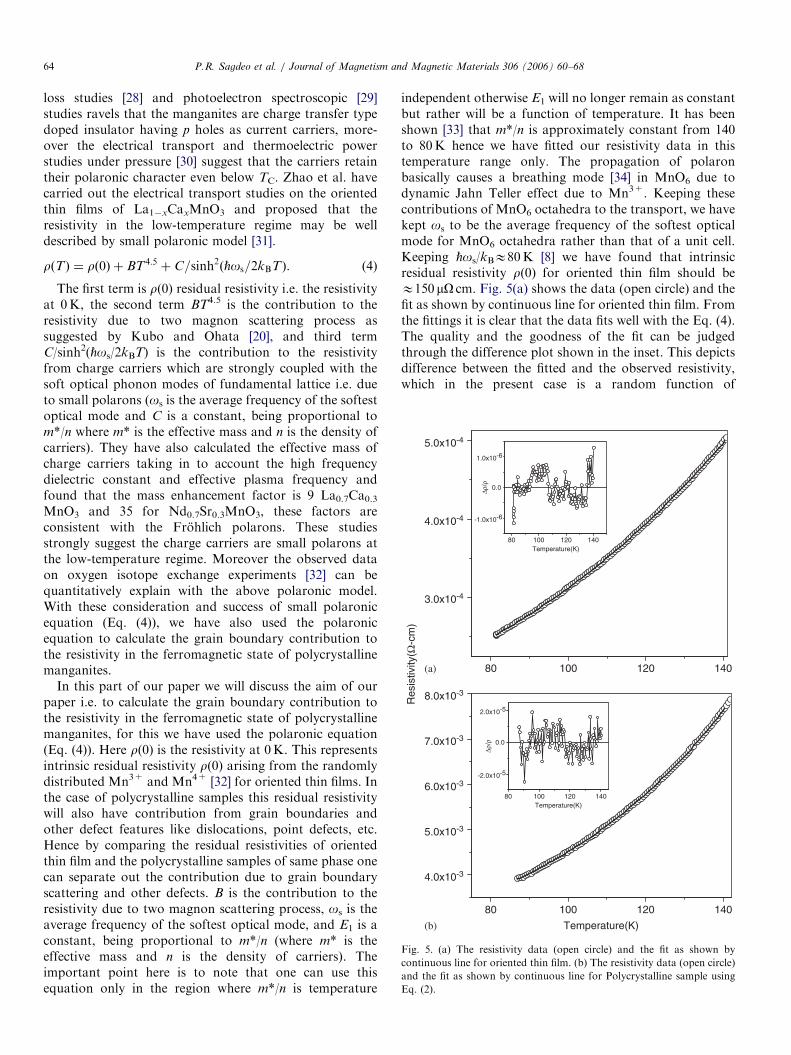
Fig. 5. (a) The resistivity data (open circle) and the fit as shown by
continuous line for oriented thin film. (b) The resistivity data (open circle)
and the fit as shown by continuous line for Polycrystalline sample using
Eq. (2).
P.R. Sagdeo et al. / Journal of Magnetism and Magnetic Materials 306 (2006) 60–6864
loss studies [28] and photoelectron spectroscopic [29]studies ravels that the manganites are charge transfer typedoped insulator having p holes as current carriers, more-over the electrical transport and thermoelectric powerstudies under pressure [30] suggest that the carriers retaintheir polaronic character even below TC. Zhao et al. havecarried out the electrical transport studies on the orientedthin films of La1xCaxMnO3 and proposed that theresistivity in the low-temperature regime may be welldescribed by small polaronic model [31].
rðTÞ ¼ rð0Þ þ BT4:5 þ C=sinh2ð_os=2kBTÞ. (4)
The first term is r(0) residual resistivity i.e. the resistivityat 0K, the second term BT4.5 is the contribution to theresistivity due to two magnon scattering process assuggested by Kubo and Ohata [20], and third termC/sinh2(_os/2kBT) is the contribution to the resistivityfrom charge carriers which are strongly coupled with thesoft optical phonon modes of fundamental lattice i.e. dueto small polarons (os is the average frequency of the softestoptical mode and C is a constant, being proportional tom*/n where m* is the effective mass and n is the density ofcarriers). They have also calculated the effective mass ofcharge carriers taking in to account the high frequencydielectric constant and effective plasma frequency andfound that the mass enhancement factor is 9 La0.7Ca0.3MnO3 and 35 for Nd0.7Sr0.3MnO3, these factors areconsistent with the Frohlich polarons. These studiesstrongly suggest the charge carriers are small polarons atthe low-temperature regime. Moreover the observed dataon oxygen isotope exchange experiments [32] can bequantitatively explain with the above polaronic model.With these consideration and success of small polaronicequation (Eq. (4)), we have also used the polaronicequation to calculate the grain boundary contribution tothe resistivity in the ferromagnetic state of polycrystallinemanganites.
In this part of our paper we will discuss the aim of ourpaper i.e. to calculate the grain boundary contribution tothe resistivity in the ferromagnetic state of polycrystallinemanganites, for this we have used the polaronic equation(Eq. (4)). Here r(0) is the resistivity at 0K. This representsintrinsic residual resistivity r(0) arising from the randomlydistributed Mn3+ and Mn4+ [32] for oriented thin films. Inthe case of polycrystalline samples this residual resistivitywill also have contribution from grain boundaries andother defect features like dislocations, point defects, etc.Hence by comparing the residual resistivities of orientedthin film and the polycrystalline samples of same phase onecan separate out the contribution due to grain boundaryscattering and other defects. B is the contribution to theresistivity due to two magnon scattering process, os is theaverage frequency of the softest optical mode, and E1 is aconstant, being proportional to m*/n (where m* is theeffective mass and n is the density of carriers). Theimportant point here is to note that one can use thisequation only in the region where m*/n is temperature
independent otherwise E1 will no longer remain as constantbut rather will be a function of temperature. It has beenshown [33] that m*/n is approximately constant from 140to 80K hence we have fitted our resistivity data in thistemperature range only. The propagation of polaronbasically causes a breathing mode [34] in MnO6 due todynamic Jahn Teller effect due to Mn3+. Keeping thesecontributions of MnO6 octahedra to the transport, we havekept os to be the average frequency of the softest opticalmode for MnO6 octahedra rather than that of a unit cell.Keeping _os/kBE80K [8] we have found that intrinsicresidual resistivity r(0) for oriented thin film should beE150 mO cm. Fig. 5(a) shows the data (open circle) and thefit as shown by continuous line for oriented thin film. Fromthe fittings it is clear that the data fits well with the Eq. (4).The quality and the goodness of the fit can be judgedthrough the difference plot shown in the inset. This depictsdifference between the fitted and the observed resistivity,which in the present case is a random function of
ARTICLE IN PRESS
80 90 100 110 120 130 140 1500.002
0.003
0.004
0.005
0.006
0.007
0.008
0.009
Res
istiv
ity(Ω
-Cm
)
Temperature(K)
The Generated data Orignal data of polycrystalline sample
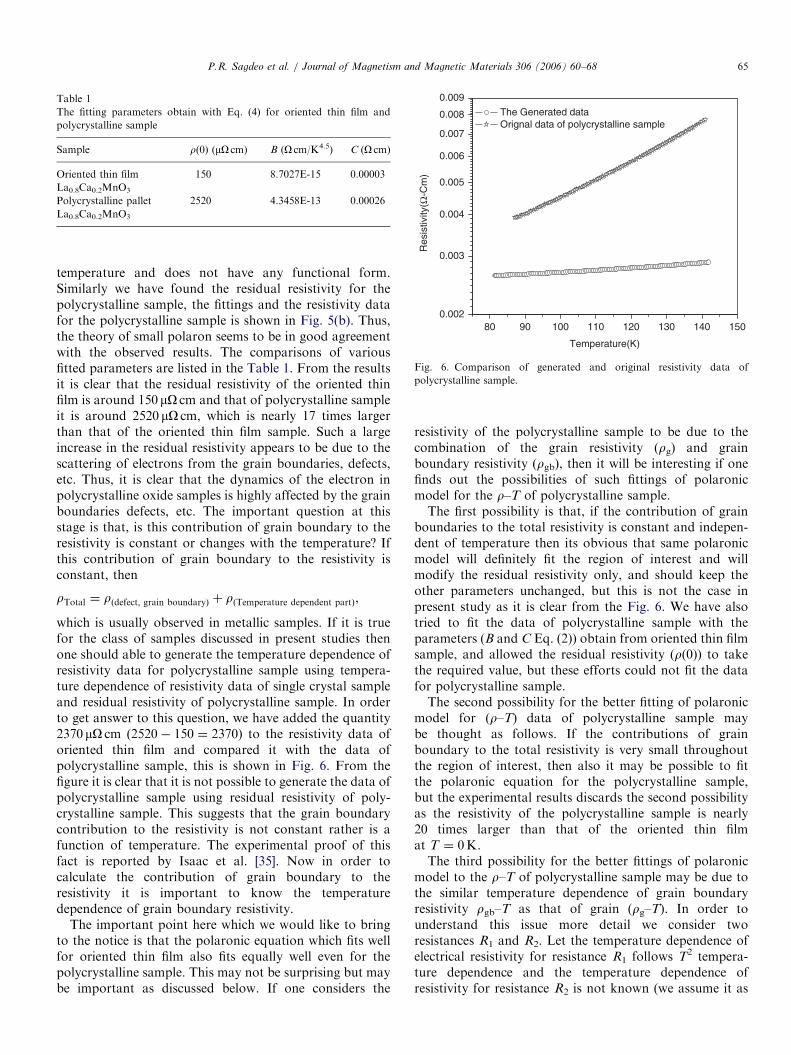
Fig. 6. Comparison of generated and original resistivity data of
polycrystalline sample.
Table 1
The fitting parameters obtain with Eq. (4) for oriented thin film and
polycrystalline sample
Sample r(0) (mO cm) B (O cm/K4.5) C (O cm)
Oriented thin film
La0.8Ca0.2MnO3
150 8.7027E-15 0.00003
Polycrystalline pallet
La0.8Ca0.2MnO3
2520 4.3458E-13 0.00026
P.R. Sagdeo et al. / Journal of Magnetism and Magnetic Materials 306 (2006) 60–68 65
temperature and does not have any functional form.Similarly we have found the residual resistivity for thepolycrystalline sample, the fittings and the resistivity datafor the polycrystalline sample is shown in Fig. 5(b). Thus,the theory of small polaron seems to be in good agreementwith the observed results. The comparisons of variousfitted parameters are listed in the Table 1. From the resultsit is clear that the residual resistivity of the oriented thinfilm is around 150 mO cm and that of polycrystalline sampleit is around 2520 mO cm, which is nearly 17 times largerthan that of the oriented thin film sample. Such a largeincrease in the residual resistivity appears to be due to thescattering of electrons from the grain boundaries, defects,etc. Thus, it is clear that the dynamics of the electron inpolycrystalline oxide samples is highly affected by the grainboundaries defects, etc. The important question at thisstage is that, is this contribution of grain boundary to theresistivity is constant or changes with the temperature? Ifthis contribution of grain boundary to the resistivity isconstant, then
rTotal ¼ rðdefect; grain boundaryÞ þ rðTemperature dependent partÞ,
which is usually observed in metallic samples. If it is truefor the class of samples discussed in present studies thenone should able to generate the temperature dependence ofresistivity data for polycrystalline sample using tempera-ture dependence of resistivity data of single crystal sampleand residual resistivity of polycrystalline sample. In orderto get answer to this question, we have added the quantity2370 mO cm (2520 150 ¼ 2370) to the resistivity data oforiented thin film and compared it with the data ofpolycrystalline sample, this is shown in Fig. 6. From thefigure it is clear that it is not possible to generate the data ofpolycrystalline sample using residual resistivity of poly-crystalline sample. This suggests that the grain boundarycontribution to the resistivity is not constant rather is afunction of temperature. The experimental proof of thisfact is reported by Isaac et al. [35]. Now in order tocalculate the contribution of grain boundary to theresistivity it is important to know the temperaturedependence of grain boundary resistivity.
The important point here which we would like to bringto the notice is that the polaronic equation which fits wellfor oriented thin film also fits equally well even for thepolycrystalline sample. This may not be surprising but maybe important as discussed below. If one considers the
resistivity of the polycrystalline sample to be due to thecombination of the grain resistivity (rg) and grainboundary resistivity (rgb), then it will be interesting if onefinds out the possibilities of such fittings of polaronicmodel for the r–T of polycrystalline sample.The first possibility is that, if the contribution of grain
boundaries to the total resistivity is constant and indepen-dent of temperature then its obvious that same polaronicmodel will definitely fit the region of interest and willmodify the residual resistivity only, and should keep theother parameters unchanged, but this is not the case inpresent study as it is clear from the Fig. 6. We have alsotried to fit the data of polycrystalline sample with theparameters (B and C Eq. (2)) obtain from oriented thin filmsample, and allowed the residual resistivity (r(0)) to takethe required value, but these efforts could not fit the datafor polycrystalline sample.The second possibility for the better fitting of polaronic
model for (r–T) data of polycrystalline sample maybe thought as follows. If the contributions of grainboundary to the total resistivity is very small throughoutthe region of interest, then also it may be possible to fitthe polaronic equation for the polycrystalline sample,but the experimental results discards the second possibilityas the resistivity of the polycrystalline sample is nearly20 times larger than that of the oriented thin filmat T ¼ 0K.The third possibility for the better fittings of polaronic
model to the r–T of polycrystalline sample may be due tothe similar temperature dependence of grain boundaryresistivity rgb–T as that of grain (rg–T). In order tounderstand this issue more detail we consider tworesistances R1 and R2. Let the temperature dependence ofelectrical resistivity for resistance R1 follows T2 tempera-ture dependence and the temperature dependence ofresistivity for resistance R2 is not known (we assume it as

ARTICLE IN PRESS
90 100 110 120 130 140
0.004
0.005
0.006
0.007
80 90 100 110 120 130 140-0.008
-0.004
0.000
0.004
0.008
∆ρ/ρ
Temperature(K)
(1/ρt) = (G/ρg) + ((1-G)/ρgb)
Res
istiv
ity(Ω
-cm
)
Temperature(K)
Fig. 7. The resistivity data (open circle) and the fit as shown by
continuous line for polycrystalline sample using Eq. (5).
80 100 120 140
4.0x10⁻³
5.0x10⁻³
6.0x10⁻³
7.0x10⁻³
8.0x10⁻³
80 90 100 110 120 130 140-2.0x10⁻⁵
-1.0x10⁻⁵
0.0
1.0x10⁻⁵
∆ρ/ρ
Temperature(K)
ρt = (G) ρg + (1-G) ρgb
Res
istiv
ity(Ω
-Cm
)
Temperature(K)
Fig. 8. The resistivity data (open circle) and the fit as shown by
continuous line for polycrystalline sample using Eq. (6).
80 90 100 110 120 130 1401E-5
1E-4
1E-3
0.01
Res
istiv
ity(Ω
-Cm
)
Temperature(K)
Grain ResistivityGrain Boundary/Surface Resistivity
Fig. 9. The graph showing variation of grain and grain boundary
resistivity as a function of temperature.
P.R. Sagdeo et al. / Journal of Magnetism and Magnetic Materials 306 (2006) 60–6866
Tn), if we know the temperature dependence of resistivityfor resistance R which is R ¼ R1 þ R2 is known andsuppose it is also T2 then the temperature dependence ofelectrical resistivity for R2 should also follow T2 tempera-ture dependence otherwise R could have some differenttemperature dependence, the same analogy is true forparallel combination of R1 and R2 we have also followedthe same analogy in the present case, as we know thetemperature dependence of resistivity for polycrystallinesample (grain+grain boundary resistance) and that oforiented thin film (which should be equivalent to that ofgrain resistivity in the present case). As the data forpolycrystalline sample and oriented thin film can be fittedwith the polaronic model hence the temperature depen-dence of electrical resistivity should also follow the similartemperature dependence. Hence we assume the similar typeof temperature dependence for grain boundary resistivity.Now depending on the distribution of different grains andgrain boundaries within the sample it is possible to modelthe total resistivity rt as a parallel or series combination ofgrain resistivity rg and grain boundary resistivity rgb
ð1=rtÞ ¼ ð1=rgÞ þ ð1=rgbÞ.
We have modified this equation by considering the grainresistivity contributing factor G, and rewrite aboveequation as
ð1=rtÞ ¼ ðG=rgÞ þ ðð1 GÞ=rgbÞ. (5)
Here G is the contribution of grain to the total resistivityand may purely depend on the geometry (shape, size, areashared between two grains, and physical porosity in thesample) of the grains within the sample. From the fittings ofthe polaronic model to both high qualities oriented thin filmand to the polycrystalline bulk samples it seems that polaronmodel is suitable for explaining the resistivity data of thesesamples. Hence we have fitted the data below 140K bykeeping rg ¼ rð1Þ þ B1T
4:5 þ C1=sinh2ð_os=2kBTÞ and
rgb ¼ rð2Þ þ B2T4:5 þ C2=sinh
2ð_os=2kBTÞ in Eq. (4), here
r(1) and r(2) are the residual resistivity due to grain andgrain boundary, respectively. In order to calculate theresidual resistivity due to grain boundary resistance we keptrð1Þ ¼ 150mO cm, B1 ¼ 8:7027E 15 and C1 ¼ 0:00003which were obtain from the fittings of oriented thin filmand found that rð2Þ ¼ 2670mO cm thus it is clear that theresidual resistivity due to grain boundary is nearly 18-timegreater that that of the grain resistivity. Fig. 7 shows thequality and the goodness of fit to the Eq. (5). Similarly wehave also calculated the resistivity of grain boundary byconsidering the series combination of grain and grainboundary resistance.
rt ¼ ðGÞrg þ ð1 GÞrgb. (6)
In this case also we have got the resistivity of grainboundary of the same order as we have got earlier which isnearly 27 times large that that of the grain resistivity. Thequality and the goodness of fit to the Eq. (6) are given inFig. 8. The temperature dependence of grain boundary

ARTICLE IN PRESS
Table 2
The fitting parameters obtain with various models for polycrystalline sample
Model G r(1) (mO cm) B1 (O cm/K4.5) C1 (O cm) r(2) mO cm B2 (O cm/K4.5) C2 (O cm)
Series resistance 0.06276 150 8.7027E-15 0.00003 2670 4.6179E-13 0.00028
Parallel resistance 0.02415 150 8.7027E-15 0.00003 4000 8.5438E-13 0.00028
Brick layer 150 474000
P.R. Sagdeo et al. / Journal of Magnetism and Magnetic Materials 306 (2006) 60–68 67
resistivity and grain resistivity is shown in Fig. 9, from thefigure it is clear that the grain boundary resistivity goesalmost parallel with the grain resistance i.e. the contribu-tion of grain boundary resistivity is higher when theresistivity of the grain is high. This means that the grainwith the higher value of resistance will back scatter orreflect more electrons. As the resistance of individual grainis inversely proportional to the area of cross section, henceit is natural to expect that the grain boundary contributionto the resistivity will be small of the higher value of grainsize and large for the samples smaller grains, as experi-mentally shown by Lee et al. [36]. Thus, the scattering ofelectrons from the grain boundary (grain surface) ismodulated or controlled by the effective grain resistanceat that temperature. Hence it is natural to expect thesimilar temperature dependence for grain, and grainboundary resistance.
The role of grain boundary on the total resistivity isdescribed earlier with the help of brick layer model [37].According to this model the total resistivity rt is the sum ofthe grain (rg) and grain boundary (rgb) resistivities, i.e.
rt ¼ rg þ ðs=dÞrgb. (7)
Keeping grain boundary thickness s ¼ 100 A [38] andaverage grain diameter d ¼ 2mm, we have obtain the grainboundary resistivity at 0K to be 474mO cm, thus accord-ing to the brick layer model the grain boundary resistivityis nearly 1000 times larger than that of the grain resistivity.The results obtained from brick layer model and thoseobtained from Eqs. (5) and (6), differs by large amount (seeTable 2), this difference may be due to the non-uniformdistribution of grain size and also that of the grainboundary thickness within the sample, secondly brick layermodel does not provide information regarding the natureof transport process through the grain boundary. Thus, theresistivity model proposed in the present work seems to bemore suitable for explaining the resistivity of polycrystal-line sample. And it is possible to find out the accuratecontribution due to grain boundary resistance to the totalresistivity without the knowledge of grain diameter, grainboundary thickness, etc.
4. Conclusion
In summary, we report the precise resistivity data forhighly oriented thin film and polycrystalline samples ofLa0.8Ca0.2MnO3. The data below 140K has been fittedwith the polaronic model. From the results it is clear that
the dynamics of the electron in polycrystalline oxidesamples is highly affected by the grain boundaries. Theanalysis of the present results strongly favors thatthe carriers in the metal like ferromagnetic state of themanganites are small polarons. Based on this analysis wehave very first time evidently shown that scattering ofelectrons from the grain boundary (grain surface) ismodulated or controlled by the effective grain resistanceat that temperature. Even though we can fit the tempera-ture dependence of grain boundary resistivity can be fittedwith the help of polaronic equation, but in order to predictthe correct nature of charge carriers in grain boundaryresistance more experimental and theoretical studies arerequired to understand this issue.
Acknowledgments
Authors would like to acknowledge Prof. V.N. Bhor-askar, Former Director UGC-DAE CSR, Prof. P. Chad-dah, Director UGC-DAE CSR and Prof. Ajay Gupta,Center Director UGC-DAE CSR Indore for their encour-agement and interest in the work. Authors sincerely thankDr. Archna Jaiswal and Dr. Rajeev Rawat, for theircontinuous help at various stages of this work. Authorssincerely thank Dr. Guo-Meng Zhao for his help and emaildiscussions at various stages. Authors would also like tothank Department of Science and Technology Governmentof India for providing partial support.
References
[1] D. Elbio, Nanoscale Phase Separation and Colossal Magnetoresis-
tance. pringer Series in Solid-State Sciences, vol. 136, Springer,
Berlin, 2003.
[2] G.A. Prinz, Phys. Today 48 (1995) 58.
[3] A. Gupta, G.Q. Gong, G. Xiao, P.R. Duncombe, P. Lecoeur,
P. Trouilloud, Y.Y. Wang, V.P. Dravid, J.Z. Sun, Phys. Rev. B 54
(1996) R15629.
[4] X. Li, A. Gupta, G. Xiao, G. Gong, Appl. Phys. Lett. 71 (1997) 1124.
[5] M. Ziese, S.P. Sena, J. Phys.: Condens. Matter 10 (1998) 2727.
[6] J. Rodriguez-Carvajal, Physica B 192 (1993) 55.
[7] L.J. Van der Pauw, Philips Tech. Rev. 20 (1958) 220.
[8] G.M. Zhao, H. Keller, W. Prellier, J. Phys.: Condens. Matter 12
(1958) L361.
[9] C. Zener, Phys. Rev. 82 (1951) 403.
[10] A.J. Millis, P.B. Littlewood, B.I. Shraiman, Phys. Rev. Lett. 74
(1995) 5144–5147.
[11] M. Ziese, C. Srinitiwarawong, Phys. Rev. B 58 (1998) 11519.
[12] D.C. Worledge, L. Mieville, T.H. Geballe, Phys. Rev. B 57 (1998)
15267.
ARTICLE IN PRESSP.R. Sagdeo et al. / Journal of Magnetism and Magnetic Materials 306 (2006) 60–6868
[13] A. Machida, Y. Moritomo, A. Nakamura, Phys. Rev. B 58 (1998)
R4281.
[14] G.-M. Zhao, Y.S. Wang, D.J. Kang, W. Prellier, M. Rajeswari, H.
Keller, T. Venkatesan, C.W. Chu, R.L. Greene, Phys. Rev. B 62
(2000) R11 949.
[15] M. Jaime, P. Lin, S.H. Chun, M.B. Salamon, P. Dorsey,
M. Rubinstein, Phys. Rev. B 60 (1999) 1028.
[16] Y. Motome, N. Furukawa, N. Nagaosa, Phys. Rev. Lett. 91 (2003)
167204.
[17] J.Q. Li, S.L. Yuan, Solid State Commun. 134 (2005) 295.
[18] M. Rubinstein, J. Appl. Phys. 87 (2000) 5019.
[19] S.L. Yuan, J.Q. Li, G. Li, Y. Jiang, X.Y. Zeng, Y.P. Yang, S.Z. Jin,
J. Phys.: Condens. Matter 12 (2000) L337.
[20] K. Kubo, N. Ohata, J. Phys. Soc. Japan 33 (1972) 21.
[21] W.E. Pickett, D.J. Singh, Phys. Rev. B 53 (1996) 1146.
[22] P. Schiffer, A.P. Ramirez, W. Bao, S.-W. Cheong, Phys. Rev. Lett. 75
(1995) 3336.
[23] G.J. Snyder, R. Hiskes, S. DiCarolis, M.R. Beasley, T.H. Geballe,
Phys. Rev. B 53 (1996) 14434.
[24] M. Jaime, P. Lin, M.B. Salamon, P.D. Han, Phys. Rev. B 58 (1998)
R5901.
[25] M.F. Hundley, et al., Appl. Phys. Lett. 67 (1995) 860.
[26] Y. Okimoto, et al., Phys. Rev. Lett. 75 (1995) 109;
Y. Okimoto, et al., Phys. Rev. B 55 (1997) 4206.
[27] K.H. Kim, J.H. Jung, T.W. Noh, Phys. Rev. Lett. 81 (1998) 1517.
[28] H.L. Ju, H.-C. Sohn, K.M. Krishnan, Phys. Rev. Lett. 79 (1997)
3230.
[29] D.S. Dessau, T. Saitoh, C.-H. Park, Z.-X. Shen, P. Villella,
N. Hamada, Y. Moritomo, Y. Tokura, Phys. Rev. Lett. 81 (1998)
192.
[30] J.-S. Zhou, J.B. Goodenough, A. Asamitsu, Y. Tokura, Phys. Rev.
Lett. 79 (1997) 3234.
[31] G.M. Zhao, V. Smolyaninova, W. Prellier, H. Keller, Phys. Rev. Lett.
84 (2000) 6086.
[32] G.-M. Zhao, D.J. Kang, W. Prellier, M. Rajeswari, H. Keller,
T. Venkatesan, R.L. Greene, Phys. Rev. B 63 (2000) 060402.
[33] J.R. Simpson, H.D. Drew, V.N. Smolyaninova, R.L. Greene,
M.C. Robson, A. Biswas, M. Rajeswari, Phys. Rev. B 60 (1999)
R16263.
[34] S.J. Hibble, S.P. Cooper, A.C. Hannon, I.D. Fawcett, M. Greenblatt,
J. Phys.: Condens. Matter 11 (1999) 9221.
[35] S.P. Isaac, N.D. Mathur, J.E. Evetts, M.G. Blamire, App. Phys. Lett.
72 (1998) 2038.
[36] H.M. Lee, I.-B. Shim, C.S. Kim, J. Magn. Magn. Mater. 282 (2004)
291.
[37] H.L. Ju, Y. Sohn, Solid State Commun. 102 (1997) 463.
[38] B.I. Belevtsev, D.G. Naugle, K.D.D. Rathnayaka, A. Parasiris,
J. Fink-Finowicki, arXiv: cond-mat/0501165 v1, 8 January 2005.
Copyright © 2022 FDOKUMEN