The Conceptualisation of GrowthAre Employment and Turnover Interchangeable Criteria?
26
http://joe.sagepub.com Journal of Entrepreneurship DOI: 10.1177/097135570801800102 2009; 18; 21 Journal of Entrepreneurship Frank Janssen Interchangeable Criteria? The Conceptualisation of Growth: Are Employment and Turnover http://joe.sagepub.com/cgi/content/abstract/18/1/21 The online version of this article can be found at: Published by: http://www.sagepublications.com can be found at: Journal of Entrepreneurship Additional services and information for http://joe.sagepub.com/cgi/alerts Email Alerts: http://joe.sagepub.com/subscriptions Subscriptions: http://www.sagepub.com/journalsReprints.nav Reprints: http://www.sagepub.in/about/permissions.asp Permissions: http://joe.sagepub.com/cgi/content/refs/18/1/21 Citations at Univ Catholique Louvain Bib on April 20, 2009 http://joe.sagepub.com Downloaded from
Transcript of The Conceptualisation of GrowthAre Employment and Turnover Interchangeable Criteria?
http://joe.sagepub.comJournal of Entrepreneurship
DOI: 10.1177/097135570801800102 2009; 18; 21 Journal of Entrepreneurship
Frank Janssen Interchangeable Criteria?
The Conceptualisation of Growth: Are Employment and Turnover
http://joe.sagepub.com/cgi/content/abstract/18/1/21 The online version of this article can be found at:
Published by:
http://www.sagepublications.com
can be found at:Journal of Entrepreneurship Additional services and information for
http://joe.sagepub.com/cgi/alerts Email Alerts:
http://joe.sagepub.com/subscriptions Subscriptions:
http://www.sagepub.com/journalsReprints.navReprints:
http://www.sagepub.in/about/permissions.aspPermissions:
http://joe.sagepub.com/cgi/content/refs/18/1/21 Citations
at Univ Catholique Louvain Bib on April 20, 2009 http://joe.sagepub.comDownloaded from

The Journal of Entrepreneurship, 18, 1 (2009): 21–45!"#$%&'()*+,-*./0 Los Angeles/London/New Delhi/Singapore/Washington DCDOI: 10.1177/097135570801800102
The Conceptualisation of Growth: Are Employment and Turnover
Interchangeable Criteria?
FRANK JANSSEN
Many different variables have been used to measure the rm’s growth. Employment and sales are the two most used criteria within the literature on growth determinants. Most of the time, researchers do not provide any theoretical justi cation for using one or the other criterion and appear to use them interchangeably, as if they constituted equivalent representations of the same observable reality, that is, the rm’s size. Using a sample of Belgian small and medium sized enterprises (SMEs), we have tested the interchangeability of these two criteria. Our results show that these two types of growth are determined by factors that are largely distinct. Organisational growth is thus shown to be a multifaceted phenomenon that cannot be reduced to a single dimension. This also means that growth cannot be measured through composite indicators, mixing different variables like sales or workforce, because they do not measure the same phenomenon. From a managerial point of view, this means that the resources that are mobilised and the strategies that are implemented by a rm should vary depending on whether it wishes to attain one or the other type of growth.
12,/3%4,/005/%*0%625752.75%89,*2%&2.:500.2%.:%$/-25;25/5'209*;%,-%<.'=,*/%!+9..)%.:%>,/,?5@5/-A%8,-9.)*+%B/*=520*-C%.:%<.'=,*/A%65)?*'@D
E'@52.'0%0-'7*50%9,=5 tried to identify the determinants of rms’ growth, mainly in order to isolate those factors which would allow us to distinguish the successful businesses of tomorrow from those which will fail to grow. Ideally, this would allow the implementation of better-targeted economic policies, since growing rms greatly contribute to the creation of jobs and of wealth. (Birley & Westhead, 1990; Gallagher & Miller, 1991; McMahon, 1999; Storey et al., 1987). However, the way in which growth has been conceptualised varies considerably from one study to the other. It has been measured by many different variables, such as pro t, assets, capital, added value, return on investment (ROI), em-ployment, sales or even subjective measures, generally based on the
at Univ Catholique Louvain Bib on April 20, 2009 http://joe.sagepub.comDownloaded from
22 / Frank Janssen
The Journal of Entrepreneurship, 18, 1 (2009): 21–45
objectives of the entrepreneur. Few studies have explained why they chose a given criterion rather than another (Birley & Westhead, 1990). The use of distinct measures, combined with an absence of justi cation for the choice made, can generate inconsistencies and constitutes an obstacle to the de-velopment of a coherent theoretical framework.
Several studies, however, tend to show that the different criteria used for measuring growth are correlated. This could mean that the criteria are interchangeable and would allow researchers not to have to justify their choice. Some studies have concluded that there is a correlation between employment growth and sales growth (Chrisman & McMullan, 2000; Delmar, 1997; Wiklund, 1999). Another study measuring growth in terms of assets, equity, added value, sales and employment has also observed im-portant correlations between these variables (Manigart, 1996). Similarly, Morrison and Roth (1992) found strong correlations between ROI, return on assets (ROA) and sales growth. McPherson (1992) also reached the conclusion that exports, pro t, added value, product and process devel-opment are signi cantly correlated with each other. Previously, Child (1973) had also observed signi cant correlations between the different measures of an organisation’s size, such as assets, workforce and sales.
Therefore, these measures could appear to encompass the same concept of rm size and could be interchangeable from an empirical point of view. This could also mean that the time lag between sales growth and employment growth is of little importance. However, a minority of re-searchers has taken the view that the factors in uencing some type’s growth are not the same as those affecting other types (Weinzimmer et al., 1998). Our purpose is to test the interchangeability of employment growth and sales growth.
In the rst part of this article, we will examine the main criteria used to conceptualise growth within the literature on growth determinants and show that employment and sales are the most frequently used variables. In the second part, on the basis of a literature review, we will try to iden-tify all potential determinants of growth previously used in empirical works. In the third part, we will investigate whether the use of different conceptualisations of growth has an effect, or not, on the results of causal tests on growth determinants. We will rst present our methodological framework and then test the impact of each of these determinants on em-ployment growth and on sales growth, in order to control whether these two types of growth are determined by the same factors.
at Univ Catholique Louvain Bib on April 20, 2009 http://joe.sagepub.comDownloaded from
The Conceptualisation of Growth / 23
The Journal of Entrepreneurship, 18, 1 (2009): 21–45
Main Conceptualisations of Growth
According to Westhead and Birley (1995), the heterogeneity of research on growth determinants is partly due to an absence of consensus on how to de ne growth. Most studies contain no discussion of the appropriateness of the variable used to measure growth and most do not justify the use of one speci c criterion rather than another. Delmar (1997) stresses that this heterogeneity hinders the development of a coherent theoretical body.
Firm growth is, in essence, the result of an increased demand for the products or services of the rm. First, it will result in an increase in sales. Second, it will allow the rm to invest in additional factors of production in order to adapt itself to the new level of demand. Theoretically, sales growth is chronologically the rst form of growth and precedes employment growth. It is also possible for a rm to increase its sales without hiring add-itional personnel and without acquiring other resources by, for example, sub-contracting or outsourcing (Delmar 1999). Increasing productivity could also allow an increase in the level of production without additional hiring. It would also be possible to replace workers by capital. Hence there should be an inverse relation between capital investment and employment growth (Wiklund, 1999). In some European countries, the high wage costs could also be an incentive to choose capital, rather than labour.
For Kirchoff, the creation of jobs is of primary importance because it measures economic growth (1991). For the entrepreneur, it can be an in-dicator of his or her success and, for society as a whole; it is a measure of the economic contribution of the rm to the common good (Dunkelberg & Cooper, 1982). This is why many economists and sociologists have used the criterion of employment growth to measure performance. According to Child (1973), employment is the most appropriate criterion to meas-ure the size of an organisation because it is, above all, human beings who are ‘organised’. Further, to the extent that the manager will, in principle, wait for demand to stabilise before recruiting more personnel, employment is a less volatile measure of growth than the sales criterion (Delmar, 1997). In certain European countries, the stability of this criterion is increased by labour-market rigidities linked to restrictive social legislation.
Within rms themselves, however, it would appear that success is mainly measured in terms of sales growth (Donckels, 1990). A study conducted in the UK on the barriers to growth faced by small and medium-sized enterprises (SMEs) found that, although the rms composing their survey
at Univ Catholique Louvain Bib on April 20, 2009 http://joe.sagepub.comDownloaded from

24 / Frank Janssen
The Journal of Entrepreneurship, 18, 1 (2009): 21–45
sample had been selected on the basis of employment growth, the managers themselves generally expressed their growth objectives in terms of sales growth (Hughes, 1998).
The use of employment or sales criteria could also depend on the sector under study. For highly capitalised rms, such as those belonging to certain manufacturing sub-sectors, variation in assets would be a more accurate measure of growth than variation in the workforce. This criterion cannot be used in the service sector, which is more labour-intensive, and for which the employment criterion is a better t. These observations cannot, however, be generalised across all sectors. In fact, certain service sub-sectors, such as the transport sector, for instance, are highly capitalised, while certain manufacturing sub-sectors, such as the garment industry, are highly labour-intensive (Weinzimmer et al., 1998). In addition, the growth of a rm which is capital-intensive will be re ected in its sales before impacting on its assets.
On the whole, the employment criterion seems to be more relevant from a societal point of view, while the sales criterion is more relevant from the manager’s point of view. It is therefore logical that these two cri-teria predominate within the empirical literature on growth determinants (Delmar, 1997).
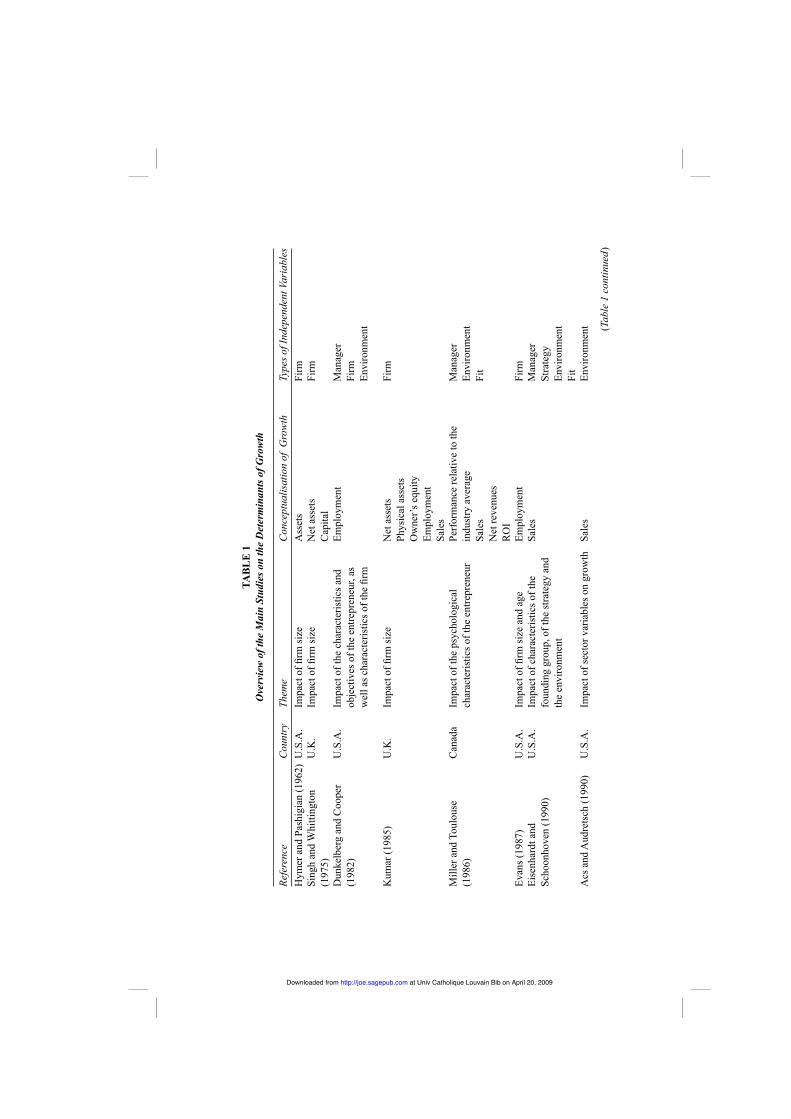
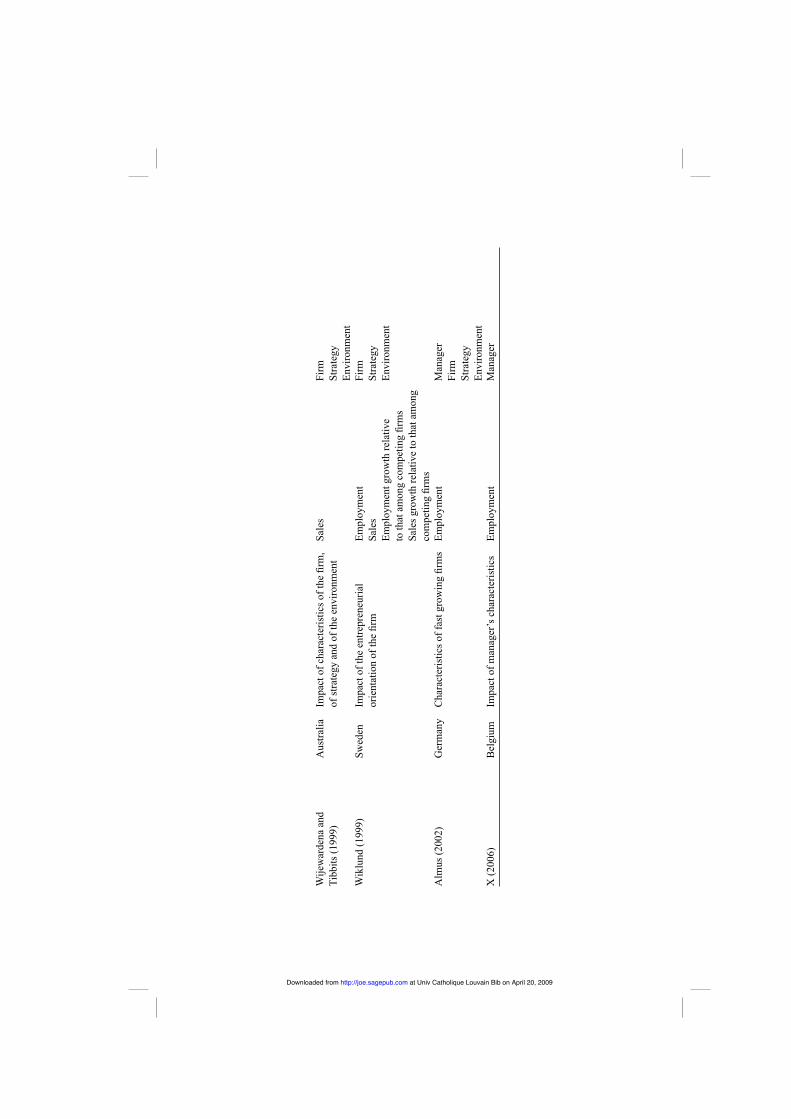
Table 1 presents the studies on growth determinants that we consider to be the most representative. We have selected these for ve reasons. First, we have mainly chosen studies that integrate the ndings of earlier work and study the simultaneous impact of several variables. Certain studies are not mentioned because they have been either partially or entirely replicated by other authors. Further, we have restricted this overview to studies of causality. We exclude studies that do not establish a clear causal link between the independent variables and growth. The studies that supply all the data necessary for their comprehension have been selected. Some studies have not been selected because the resulting publications are not suf ciently precise about the elements necessary to replicate the results. We have also sought to list studies that can be linked to different scienti c disciplines, mainly economics and management. Finally, even though the literature on this topic is mainly American, we have sought to present studies from other countries as well.
The table identi es the country where the research was carried out, the theme of the research, the conceptualisation of growth that each study used (employment, sales, and so on) and nally, the type of independent variables used.
at Univ Catholique Louvain Bib on April 20, 2009 http://joe.sagepub.comDownloaded from
F"6<$%G
Ove
rvie
w of
the
Mai
n St
udie
s on
the
Det
erm
inan
ts of
Gro
wth
Refe
renc
eC
ount
ryTh
eme
Con
cept
ualis
atio
n of
Gro
wth
Type
s of I
ndep
ende
nt V
aria
bles
Hym
er a
nd P
ashi
gian
(196
2)U
.S.A
.Im
pact
of
rm si
ze
Ass
ets
Firm
Sing
h an
d W
hitti
ngto
n (1
975)
U.K
.Im
pact
of
rm si
ze
Net
ass
ets
Cap
ital
Firm
Dun
kelb
erg
and
Coo
per
(198
2)U
.S.A
.Im
pact
of t
he c
hara
cter
istic
s and
ob
ject
ives
of t
he e
ntre
pren
eur,
as
wel
l as c
hara
cter
istic
s of t
he
rm
Empl
oym
ent
Man
ager
Firm
Envi
ronm
ent
Kum
ar (1
985)
U.K
.Im
pact
of
rm si
ze
Net
ass
ets
Phys
ical
ass
ets
Ow
ner’s
equ
ityEm
ploy
men
tSa
les
Firm
Mill
er a
nd T
oulo
use
(198
6)C
anad
a Im
pact
of t
he p
sych
olog
ical
ch
arac
teris
tics o
f the
ent
repr
eneu
rPe
rfor
man
ce re
lativ
e to
the
indu
stry
ave
rage
Sale
s N
et re
venu
es
RO
I
Man
ager
Envi
ronm
ent
Fit
Evan
s (19
87)
U.S
.A.
Impa
ct o
f rm
size
and
age
Em
ploy
men
tFi
rmEi
senh
ardt
and
Sc
hoon
hove
n (1
990)
U.S
.A.
Impa
ct o
f cha
ract
eris
tics o
f the
fo
undi
ng g
roup
, of t
he st
rate
gy a
nd
the
envi
ronm
ent
Sale
sM
anag
erSt
rate
gyEn
viro
nmen
tFi
tA
cs a
nd A
udre
tsch
(199
0)U
.S.A
.Im
pact
of s
ecto
r var
iabl
es o
n gr
owth
Sale
sEn
viro
nmen
t (Tab
le 1
con
tinue
d)
at Univ Catholique Louvain Bib on April 20, 2009 http://joe.sagepub.comDownloaded from

(Tab
le 1
con
tinue
d)
Refe
renc
eC
ount
ryTh
eme
Con
cept
ualis
atio
n of
Gro
wth
Type
s of I
ndep
ende
nt V
aria
bles
Kal
lebe
rg a
nd L
eich
t (1
991)
U.S
.A.
Impa
ct o
f the
cha
ract
eris
tics o
f th
e en
trepr
eneu
r, of
org
anis
atio
nal
stru
ctur
es a
nd o
f the
indu
stry
Gro
ss re
venu
esM
anag
erFi
rmSt
rate
gyEn
viro
nmen
tM
cCar
thy
et a
l. (1
993)
U.S
.A.
Impa
ct o
f esc
alat
ion
of c
omm
itmen
t A
sset
sM
anag
erW
einz
imm
er (1
993)
U.S
.A.
Impa
ct o
f the
cha
ract
eris
tics o
f the
m
anag
ing
team
, of t
he st
rate
gy a
nd
the
envi
ronm
ent
Sale
s A
sset
s Em
ploy
men
t
Man
ager
St
rate
gy
Envi
ronm
ent
Fit
Sieg
el e
t al.
(199
3)U
.S.A
.D
istin
guis
hing
cha
ract
eris
tics o
f r
ms s
how
ing
stro
ng g
row
thR
even
ueM
anag
er
Stra
tegy
En
viro
nmen
tW
esth
ead
and
Birl
ey
(199
5)U
.K.
Impa
ct o
f cha
ract
eris
tics o
f the
m
anag
er, o
f the
rm
and
of t
he
envi
ronm
ent
Empl
oym
ent
Man
ager
Fi
rm
Envi
ronm
ent
Wes
thea
d (1
995)
U.K
.Im
pact
of c
hara
cter
istic
s of t
he
man
ager
, of t
he
rm a
nd o
f the
en
viro
nmen
t
Empl
oym
ent
Man
ager
Firm
St
rate
gyB
rush
and
Cha
gant
i (1
999)
U.S
.A.
In u
ence
of
rm’s
reso
urce
s Em
ploy
men
t N
et c
ash o
wM
anag
er
Stra
tegy
En
viro
nmen
tD
elm
ar (1
999)
Swed
enR
elat
ion
betw
een
grow
th
mot
ivat
ion
and
real
gro
wth
Empl
oym
ent
Sale
sM
anag
er
Firm
St
rate
gy
Envi
ronm
ent
at Univ Catholique Louvain Bib on April 20, 2009 http://joe.sagepub.comDownloaded from
Wije
war
dena
and
Ti
bbits
(199
9)A
ustra
liaIm
pact
of c
hara
cter
istic
s of t
he
rm,
of st
rate
gy a
nd o
f the
env
ironm
ent
Sale
sFi
rm
Stra
tegy
En
viro
nmen
tW
iklu
nd (1
999)
Swed
enIm
pact
of t
he e
ntre
pren
euria
l or
ient
atio
n of
the r
m
Empl
oym
ent
Sale
sEm
ploy
men
t gro
wth
rela
tive
to th
at a
mon
g co
mpe
ting r
ms
Sale
s gro
wth
rela
tive
to th
at a
mon
g co
mpe
ting r
ms
Firm
St
rate
gy
Envi
ronm
ent
Alm
us (2
002)
Ger
man
yC
hara
cter
istic
s of f
ast g
row
ing r
ms
Empl
oym
ent
Man
ager
Fi
rmSt
rate
gy
Envi
ronm
ent
X (2
006)
Bel
gium
Impa
ct o
f man
ager
’s c
hara
cter
istic
sEm
ploy
men
tM
anag
er
at Univ Catholique Louvain Bib on April 20, 2009 http://joe.sagepub.comDownloaded from
28 / Frank Janssen
The Journal of Entrepreneurship, 18, 1 (2009): 21–45
As the table shows, a multiplicity of criteria has been used to con-ceptualise growth. The authors mentioned within this table have, for ex-ample, used nancial measures (assets, ROI, pro ts, owner’s equity, added value and cash ow), employment and sales criteria as well as sub-jective measures such as the entrepreneur’s expectations for relative growth. In most cases, the choice of a speci c criterion was determined by the available data, and did not depend on any theoretical justi cation.
As we had expected, the two most frequently used criteria are employ-ment (58 per cent) and sales (53 per cent). This observation con rms the results of a study carried out by Delmar (1997). It also raises two new questions: Do these variables indeed constitute interchangeable measures within a single conception of organisational growth, which seems to be the assertion made by many authors? Conversely, does the use of different conceptualisations of growth in uence the results of studies on growth determinants?
In order to answer these questions, we will test the interchangeability of the two principal conceptualisations of growth by verifying whether the two types of growth are determined by the same factors. Before that we will brie y present the determinants of growth that we have identi ed in literature and that we will use in our empirical tests.
Determinants of Growth
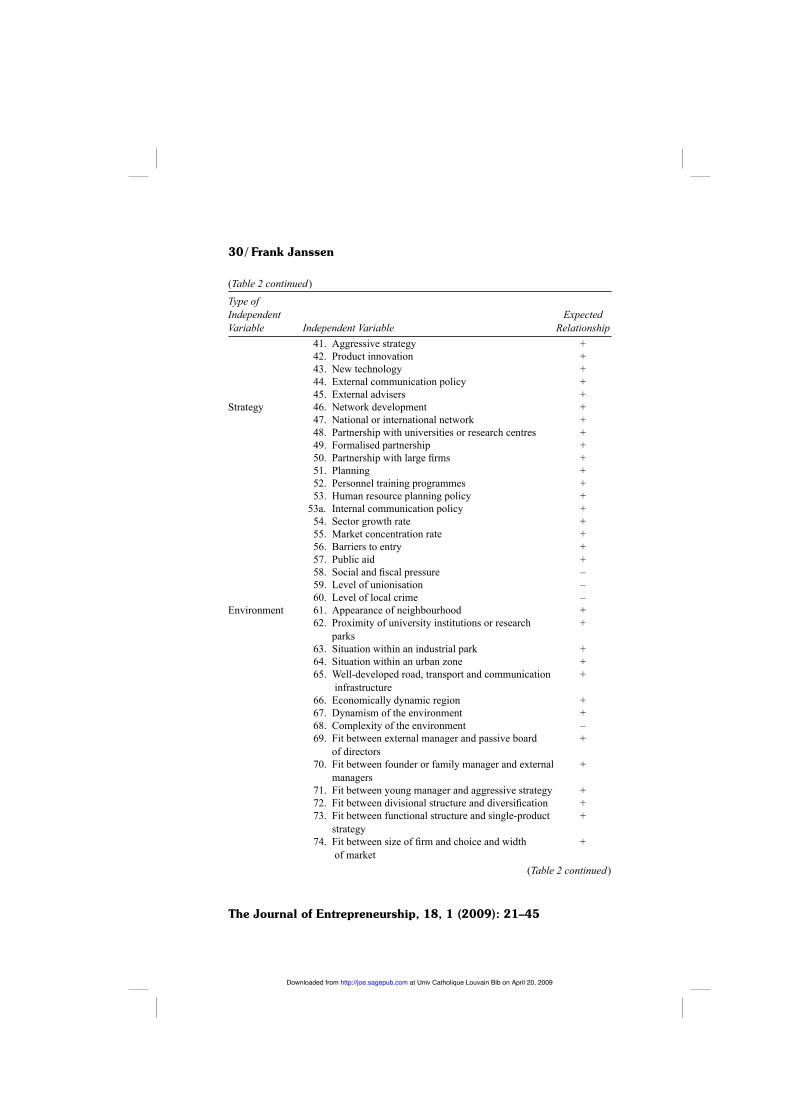
To test this interchangeability, on the basis of a literature review, we have attempted to identify all potential determinants of growth used in empirical studies. In order to create homogeneous groups, we have linked each of these determinants to one of ve groups of variables that might in uence the growth of a rm1: determinants linked to the man-ager(s), determinants linked to the characteristics of the rm, strategic determinants, environmental determinants and interactions (fit) be-tween different variables. Within the rst group, that is, managerial char-acteristics, we have listed 28 previously studied independent variables. For the second group, composed of determinants relative to the rm, our literature review leads us to retain 11 potential determinants. Among studies devoted to the impact of strategy on growth, we have identi ed 15 variables potentially in uencing growth. For environmental determinants, 15 potential determinants emerge from earlier studies. Finally, we have also identi ed 15 interactions between variables. Table 2 classi es the
at Univ Catholique Louvain Bib on April 20, 2009 http://joe.sagepub.comDownloaded from

The Conceptualisation of Growth / 29
The Journal of Entrepreneurship, 18, 1 (2009): 21–45
F"6<$%HList of Independent Variables Potentially In uencing Growth
Type of Independent Variable Independent Variable
Expected Relationship
1. Internal locus of control + 2. Management experience + 3. Marketing, sales or R&D experience + 4. Consulting experience + 5. Experience within higher education institutions – 6. Experience within a large rm + 7. Former start-up experience + 8. Independent work experience + 9. Number of years of professional experience +10. Experience within the sector +11. Owner of several rms –12. Other activities during start-up phase +13. Previous entrepreneurial failure –
Characteristics 14. Education level +of manager 15. Education related to activity of the rm +
16. Management training +17. Entrepreneurship training +18. Belongs to entrepreneurial family +19. External manager +20. Second generation manager –21. ‘Pull’-type motivation at time of start-up +22. ‘Push’-type motivation at time of start-up –23. Age of manager –24. Gender (female) –25. Immigrant –26. Team of managers +27. Heterogeneous team +28. Previous common work experience +29. Size of rm –30. Age of rm –31. Bureaucratic and/or centralised structure –32. Limited liability +
Characteristics 33. Corporate governance +of the rm 34. Autonomy of the rm –
35. Local branch of foreign rm +36. Amount of nancial resources at start-up +37. Openness of capital +38. Amount of shares owned by employees +39. Rented premises +40. Exports +
(Table 2 continued)
at Univ Catholique Louvain Bib on April 20, 2009 http://joe.sagepub.comDownloaded from
30 / Frank Janssen
The Journal of Entrepreneurship, 18, 1 (2009): 21–45
Type of Independent Variable Independent Variable
Expected Relationship
41. Aggressive strategy + 42. Product innovation + 43. New technology + 44. External communication policy + 45. External advisers +
Strategy 46. Network development + 47. National or international network + 48. Partnership with universities or research centres + 49. Formalised partnership + 50. Partnership with large rms + 51. Planning + 52. Personnel training programmes + 53. Human resource planning policy + 53a. Internal communication policy + 54. Sector growth rate + 55. Market concentration rate + 56. Barriers to entry + 57. Public aid + 58. Social and scal pressure – 59. Level of unionisation – 60. Level of local crime –
Environment 61. Appearance of neighbourhood + 62. Proximity of university institutions or research
parks+
63. Situation within an industrial park + 64. Situation within an urban zone + 65. Well-developed road, transport and communication infrastructure
+
66. Economically dynamic region + 67. Dynamism of the environment + 68. Complexity of the environment – 69. Fit between external manager and passive board of directors
+
70. Fit between founder or family manager and external managers
+
71. Fit between young manager and aggressive strategy + 72. Fit between divisional structure and diversi cation + 73. Fit between functional structure and single-product strategy
+
74. Fit between size of rm and choice and width of market
+
(Table 2 continued)
(Table 2 continued)
at Univ Catholique Louvain Bib on April 20, 2009 http://joe.sagepub.comDownloaded from
The Conceptualisation of Growth / 31
The Journal of Entrepreneurship, 18, 1 (2009): 21–45
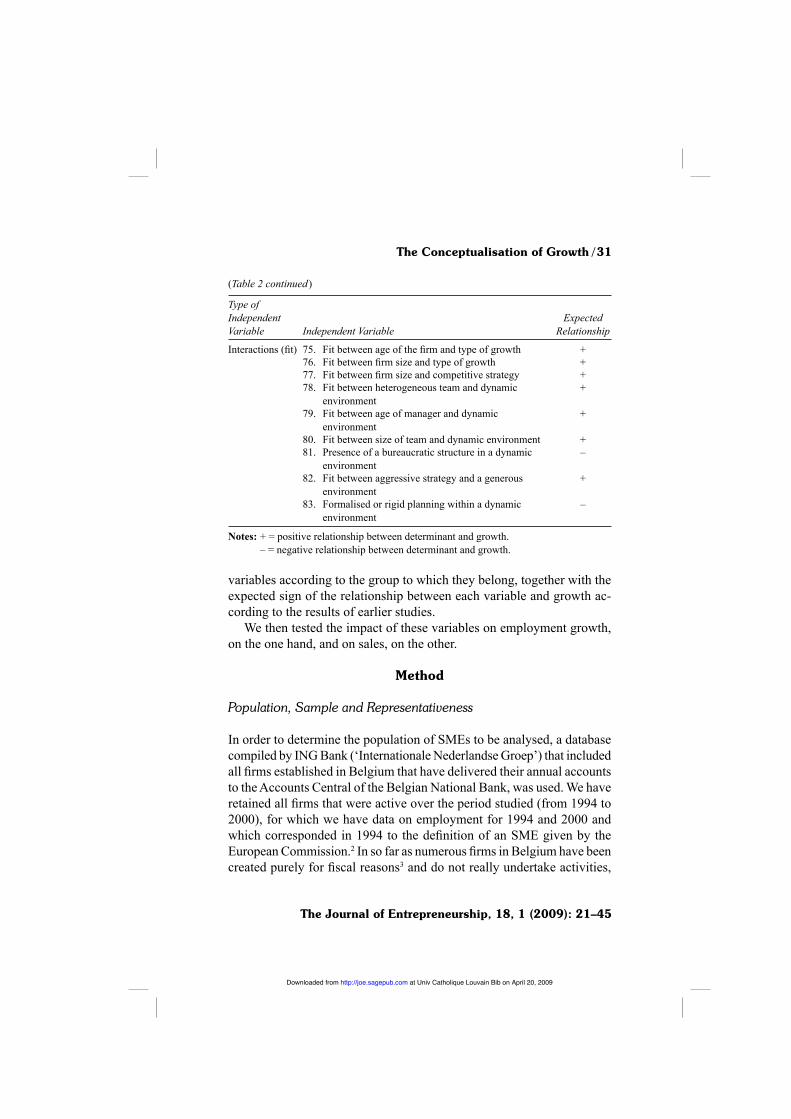
variables according to the group to which they belong, together with the expected sign of the relationship between each variable and growth ac-cording to the results of earlier studies.
We then tested the impact of these variables on employment growth, on the one hand, and on sales, on the other.
Method
Population, Sample and Representativeness
In order to determine the population of SMEs to be analysed, a database compiled by ING Bank (‘Internationale Nederlandse Groep’) that included all rms established in Belgium that have delivered their annual accounts to the Accounts Central of the Belgian National Bank, was used. We have retained all rms that were active over the period studied (from 1994 to 2000), for which we have data on employment for 1994 and 2000 and which corresponded in 1994 to the de nition of an SME given by the European Commission.2 In so far as numerous rms in Belgium have been created purely for scal reasons3 and do not really undertake activities,
Type of Independent Variable Independent Variable
Expected Relationship
Interactions ( t) 75. Fit between age of the rm and type of growth +76. Fit between rm size and type of growth +77. Fit between rm size and competitive strategy +78. Fit between heterogeneous team and dynamic environment
+
79. Fit between age of manager and dynamic environment
+
80. Fit between size of team and dynamic environment +81. Presence of a bureaucratic structure in a dynamic environment
–
82. Fit between aggressive strategy and a generous environment
+
83. Formalised or rigid planning within a dynamic environment
–
E.-50I + = positive relationship between determinant and growth. – = negative relationship between determinant and growth.
(Table 2 continued)
at Univ Catholique Louvain Bib on April 20, 2009 http://joe.sagepub.comDownloaded from
32 / Frank Janssen
The Journal of Entrepreneurship, 18, 1 (2009): 21–45
we have eliminated rms that were already active in 1994, but that still employed less than ve people in 2000.
On the basis of these criteria, the population was composed of 11,481 rms. We randomly selected 788 rms, while at the same time ensuring proportions of micro (less than 10 people), small (between 10 and 49 people) and medium-sized (between 50 and 249 people) rms identical to those of the total population. In order to allow a dynamic analysis, this size criterion was checked at the beginning of the period studied, that is, 1994. We also kept the proportions of rms from the three regions of the country (Flanders, Wallonia and Brussels) identical to those of the population.
Out of the 788 rms, 331 refused to participate in the survey and 186 were not available during the interview period. For 121 other rms, the telephone numbers in the database were incorrect or corresponded to fax numbers. Our study therefore focused on a sample of 150 rms. Ac-cording to Harris (1985), the size of the sample must exceed the number of predictors by at least 50. Our sample of 150 observations respects this rule.4
In order to determine the representativeness of our sample in relation to the original population, we compared the average growth5 of the sample rms to the one of the population6 using a bilateral t test. One of the ap-plication conditions underlying this test on two independent samples is the homogeneity of variances (Howell, 1997). We rst used Levene’s test to check that there is no signi cant difference in the variances (F = 1.476 and p = 0.224), and then tested the difference between the averages of employment growth for the two groups. The results of the bilateral t test (t = –0.823; df = 11.479; p = 0.411) indicate that the average employ-ment growth of the rms in our sample is not signi cantly different from that of the rms of the overall population.
As our sample was composed on the basis of size and regional location constraints characteristic of the population, it is no longer necessary to examine the representativeness of the sample in relation to the population with regard to these two criteria. Finally, we also examined the percentages of independent rms within the population and the sample. These are also identical (66.7 per cent). These particular elements of comparison were chosen because they appear in the initial database.
at Univ Catholique Louvain Bib on April 20, 2009 http://joe.sagepub.comDownloaded from
The Conceptualisation of Growth / 33
The Journal of Entrepreneurship, 18, 1 (2009): 21–45
Data Collection Method and Measurement of the Dependent Variable
The data published by Belgian rms do not make it possible to test the vast majority of the hypotheses developed in our research. Hence, we opted for a telephone survey.7 We rst established a questionnaire consisting of closed questions that we had pre-tested on several SME managers. The managers of 150 SMEs were interviewed by phone in November 2001.
The value of the dependent variable was calculated using the initial database. The choice of an appropriate growth index has given rise to a number of theoretical discussions (Birch, 1986; OECD, 1998; Wooden and Hawke, 2000). As none of the proposed measures is neutral, we decided to use a simple measure, namely the relative variation ‘(Et – Et–1)/Et–1)’, as this is the most frequently used index in studies on growth determinants (Delmar, 1997). In our case, this measure reads (E2000 – E1994/E1994).
In order to carry out a logistical regression (see infra), these dependent variables were split into ‘high growth’ (code one) and ’low growth’ stagnation or ‘regression’ (code zero). We de ned ‘high growth’ as being growth above or equal to 50 per cent over the period studied. 34.3 per cent of the rms in our sample can be considered as having undergone high growth.8
Previous studies differ enormously in terms of the time period studied. In order to identify irregular short-term tendencies and to allow for a reliable estimation of organisational performances, the time period studied should be at least ve years (Weinzimmer et al., 1998). On the basis of the constraints of our database, we have measured growth over a period of seven years, stretching from 1994 to 2000.9
So as to avoid static measures, when growth is essentially a dynamic phenomenon, we have excluded rms that were established during the period studied.
Data Processing
In order to test our hypotheses, we have rst carried out ve binomial logistic regressions of employment growth and ve binomial logistic regressions of sales growth, which means one for each group of inde-pendent variables. This method presents certain advantages in comparison to the standard multiple regressions that are subject to more restrictive
at Univ Catholique Louvain Bib on April 20, 2009 http://joe.sagepub.comDownloaded from
34 / Frank Janssen
The Journal of Entrepreneurship, 18, 1 (2009): 21–45
application conditions (Garson, 2001; Howell, 1997).10 Among these advantages, we could draw particular attention to the fact that, contrary to standard regression, logistic regression does not presuppose a linear re-lationship between the dependent variable and the independent variables, and does not require a normal distribution of the variables. We had ob-served that our dependent variable did not present a normal distribution. The logistic regression also made it possible to integrate dichotomous or polytomous and metrical predictors into one single model. Each modality of an original variable gave rise to a dummy variable coded one if the characteristic was realised and zero in the opposite case. In order to avoid a linear relation between the independent variables, for each original vari-able, one of the binary variables created was excluded from the model. In the case of ‘ ltering’, in other words when part of the sample is not concerned by a question, we created a dummy variable composed of the rms not concerned.
Having tested the variables by groups of determinants, we next sought to set up two ‘optimal’ regression equations by means of a selection pro-cedure, in order to identify the most important predictors for employment growth, on the one hand, and for sales, on the other. To this end, we carried out a forward stepwise regression11 which, according to Howell (1997), is the best selection procedure. A selection procedure aims to identify those variables which, taking all else into consideration, allows us to explain a signi cant proportion of the total variation. The independent variables or interactions between variables that are generated by the hypotheses are tested one by one on the basis of the degree of signi cance of the score test. The score test is a statistic based on the comparison between two models that allows us to make a judgment on the statistical signi cance of the model coef cients (Bernard, 1999). This variable selection procedure results in the model with the highest !2 score. We set the entry threshold at 0.05. The variable with the lowest probability below 0.05 enters the model. The variable with the next lowest probability enters next, and so on. After each variable enters the equation, the previously entered vari-ables are tested by means of a Wald test to determine whether they should be eliminated from the model. We xed the exit threshold at 0.1.12 At each step of the procedure, the variables introduced in previous steps are re-examined. The variable with the highest probability greater than 0.1 is removed from the model, which is then re-estimated. The other variables are then re-evaluated in order to determine whether they
at Univ Catholique Louvain Bib on April 20, 2009 http://joe.sagepub.comDownloaded from
The Conceptualisation of Growth / 35
The Journal of Entrepreneurship, 18, 1 (2009): 21–45
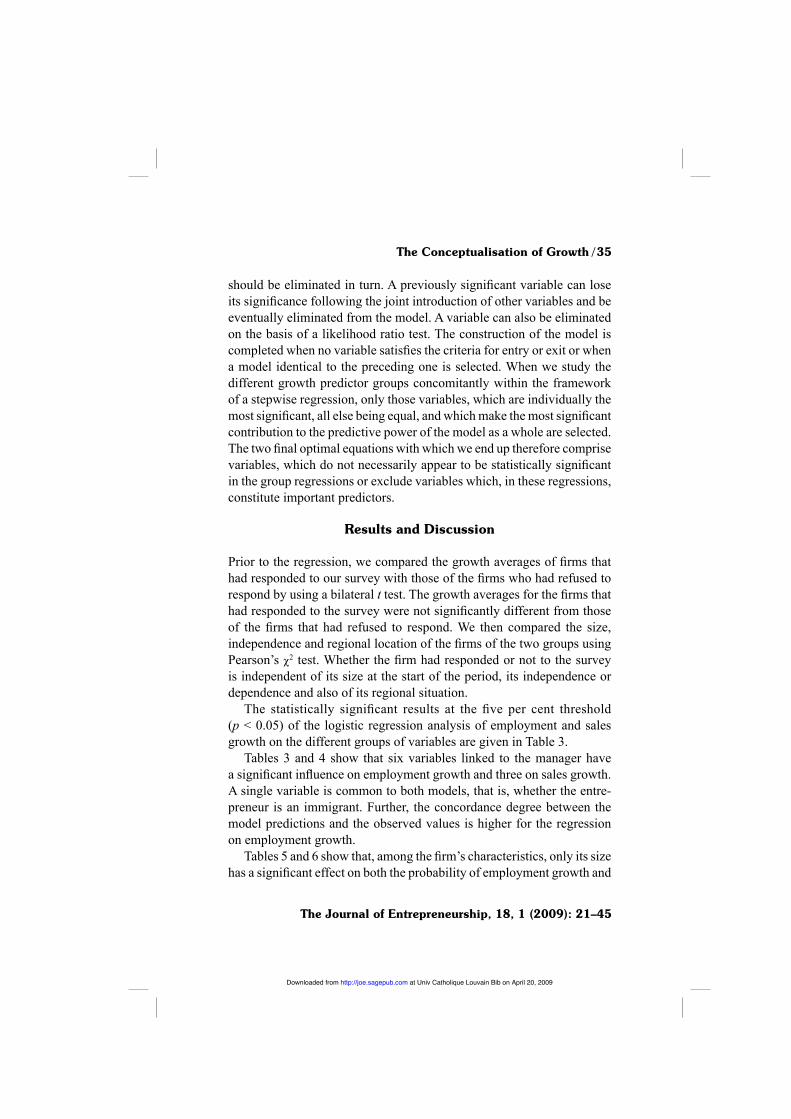
should be eliminated in turn. A previously signi cant variable can lose its signi cance following the joint introduction of other variables and be eventually eliminated from the model. A variable can also be eliminated on the basis of a likelihood ratio test. The construction of the model is completed when no variable satis es the criteria for entry or exit or when a model identical to the preceding one is selected. When we study the different growth predictor groups concomitantly within the framework of a stepwise regression, only those variables, which are individually the most signi cant, all else being equal, and which make the most signi cant contribution to the predictive power of the model as a whole are selected. The two nal optimal equations with which we end up therefore comprise variables, which do not necessarily appear to be statistically signi cant in the group regressions or exclude variables which, in these regressions, constitute important predictors.
Results and Discussion
Prior to the regression, we compared the growth averages of rms that had responded to our survey with those of the rms who had refused to respond by using a bilateral t test. The growth averages for the rms that had responded to the survey were not signi cantly different from those of the rms that had refused to respond. We then compared the size, independence and regional location of the rms of the two groups using Pearson’s !2 test. Whether the rm had responded or not to the survey is independent of its size at the start of the period, its independence or dependence and also of its regional situation.
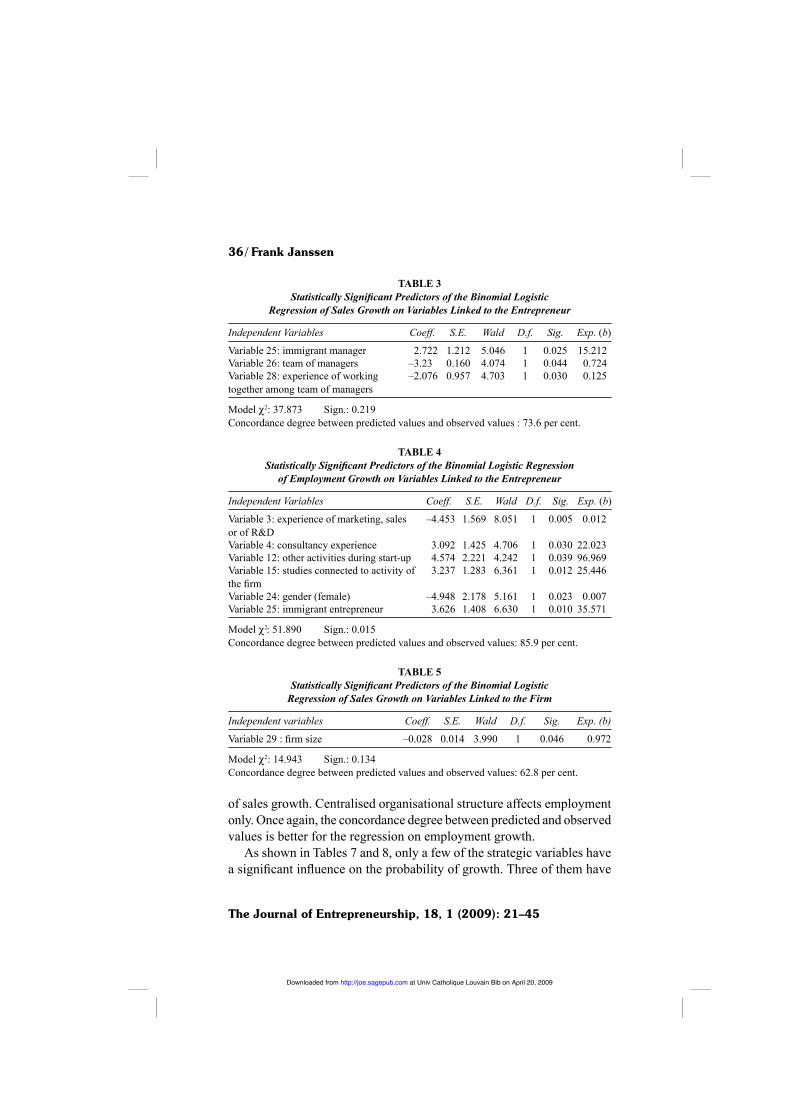
The statistically signi cant results at the ve per cent threshold (p < 0.05) of the logistic regression analysis of employment and sales growth on the different groups of variables are given in Table 3.
Tables 3 and 4 show that six variables linked to the manager have a signi cant in uence on employment growth and three on sales growth. A single variable is common to both models, that is, whether the entre-preneur is an immigrant. Further, the concordance degree between the model predictions and the observed values is higher for the regression on employment growth.
Tables 5 and 6 show that, among the rm’s characteristics, only its size has a signi cant effect on both the probability of employment growth and
at Univ Catholique Louvain Bib on April 20, 2009 http://joe.sagepub.comDownloaded from
36 / Frank Janssen
The Journal of Entrepreneurship, 18, 1 (2009): 21–45
F"6<$%JStatistically Signi cant Predictors of the Binomial Logistic
Regression of Sales Growth on Variables Linked to the Entrepreneur
Independent Variables Coeff. S.E. Wald D.f. Sig. Exp. (b)
Variable 25: immigrant manager 2.722 1.212 5.046 1 0.025 15.212Variable 26: team of managers –3.23 0.160 4.074 1 0.044 0.724Variable 28: experience of working together among team of managers
–2.076 0.957 4.703 1 0.030 0.125
Model !2: 37.873 Sign.: 0.219Concordance degree between predicted values and observed values : 73.6 per cent.
F"6<$%K%Statistically Signi cant Predictors of the Binomial Logistic Regression
of Employment Growth on Variables Linked to the Entrepreneur
Independent Variables Coeff. S.E. Wald D.f. Sig. Exp. (b)
Variable 3: experience of marketing, sales or of R&D
–4.453 1.569 8.051 1 0.005 0.012
Variable 4: consultancy experience 3.092 1.425 4.706 1 0.030 22.023Variable 12: other activities during start-up 4.574 2.221 4.242 1 0.039 96.969Variable 15: studies connected to activity of the rm
3.237 1.283 6.361 1 0.012 25.446
Variable 24: gender (female) –4.948 2.178 5.161 1 0.023 0.007Variable 25: immigrant entrepreneur 3.626 1.408 6.630 1 0.010 35.571
Model !2: 51.890 Sign.: 0.015Concordance degree between predicted values and observed values: 85.9 per cent.
F"6<$%LStatistically Signi cant Predictors of the Binomial Logistic
Regression of Sales Growth on Variables Linked to the Firm
Independent variables Coeff. S.E. Wald D.f. Sig. Exp. (b)
Variable 29 : rm size –0.028 0.014 3.990 1 0.046 0.972
Model !2: 14.943 Sign.: 0.134Concordance degree between predicted values and observed values: 62.8 per cent.
of sales growth. Centralised organisational structure affects employment only. Once again, the concordance degree between predicted and observed values is better for the regression on employment growth.
As shown in Tables 7 and 8, only a few of the strategic variables have a signi cant in uence on the probability of growth. Three of them have
at Univ Catholique Louvain Bib on April 20, 2009 http://joe.sagepub.comDownloaded from

The Conceptualisation of Growth / 37
The Journal of Entrepreneurship, 18, 1 (2009): 21–45
F"6<$%MStatistically Signi cant Predictors of the Binomial Logistic
Regression of Employment Growth on Variables Linked to the Firm
Independent Variables Coeff. S.E. Wald D.f. Sig. Exp. (b)
Variable 29: rm size –0.045 0.018 5.929 1 0.015 0.956Variable 31: centralised structure 1.765 0.609 8.409 1 0.004 5.839
Model !2: 33.042 Sign.: 0.000Concordance degree between predicted values and observed values: 75.6 per cent.
F"6<$%NStatistically Signi cant Predictors of the Binomial
Logistic Regression of Sales Growth on Strategic Variables
Independent Variables Coeff. S.E. Wald D.f. Sig. Exp. (b)
Variable 43: new technologies 1.008 0.510 3.907 1 0.048 2.739Variable 47: national or international networks
1.881 0.926 4.125 1 0.042 6.561
Variable 50: partnership with big rms –1.367 0.665 4.227 1 0.040 0.255
Model !2: 29.353 Sign.: 0.022Concordance degree between predicted values and observed values: 73.0 per cent.
F"6<$%O%Statistically Signi cant Predictors of the Binomial Logistic Regression of Employment Growth on Strategic Variables
Independent Variables Coeff. S.E. Wald D.f. Sig. Exp. (b)
Variable 53A: internal communication 1.072 0.467 5.263 1 0.022 2.921
Model !2: 24.865 Sign.: 0.072Concordance degree between predicted values and observed values: 67.6 per cent.
a signi cant impact on sales growth and only one affects employment growth. This last variable is absent from the rst model. Contrary to pre-vious regressions, the concordance degree between predicted and observed values is higher for the regression on sales growth.
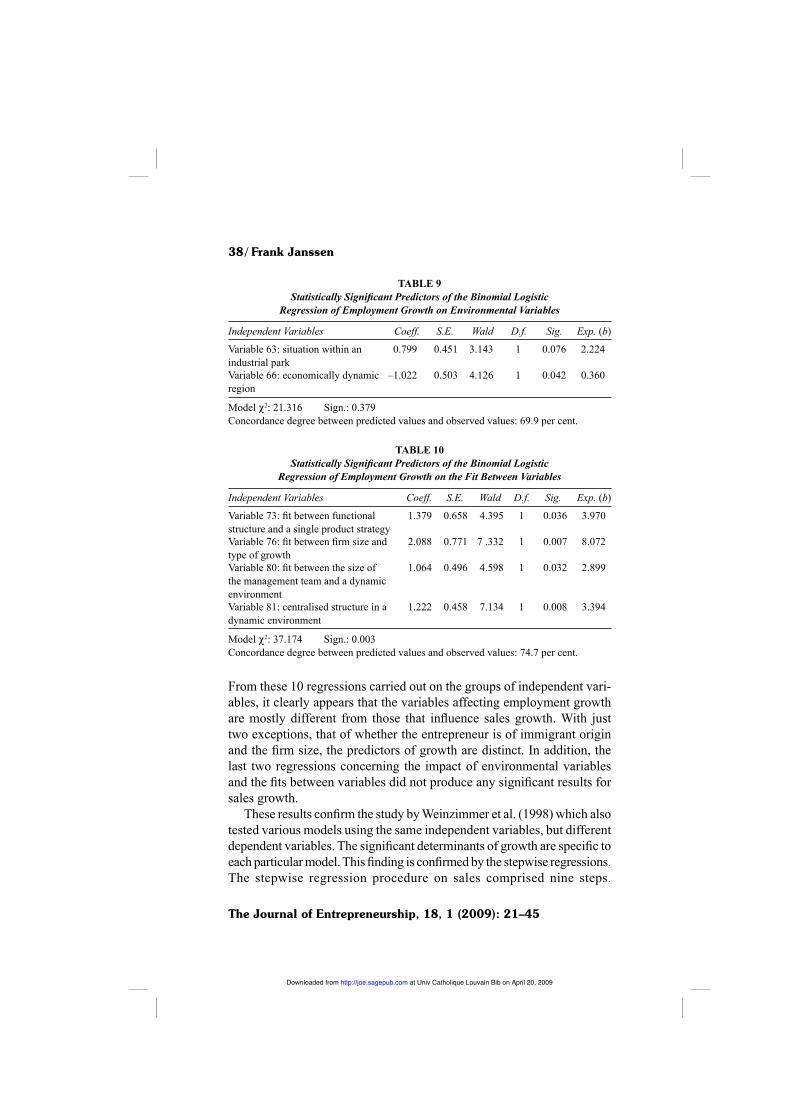
None of the coef cients of the independent variables of the binomial logistic regression of sales growth on environmental variables was sig-ni cant. In the regression on employment, two signi cant factors appeared, as shown in Table 9. None of the coef cients of the binomial logistic re-gression of sales growth on the t between variables is statistically signi cant. On the other hand, Table 10 shows that for employment growth, the coef cients of four interactions are statistically signi cant.
at Univ Catholique Louvain Bib on April 20, 2009 http://joe.sagepub.comDownloaded from
38 / Frank Janssen
The Journal of Entrepreneurship, 18, 1 (2009): 21–45
F"6<$%P%Statistically Signi cant Predictors of the Binomial Logistic
Regression of Employment Growth on Environmental Variables
Independent Variables Coeff. S.E. Wald D.f. Sig. Exp. (b)
Variable 63: situation within an industrial park
0.799 0.451 3.143 1 0.076 2.224
Variable 66: economically dynamic region
–1.022 0.503 4.126 1 0.042 0.360
Model !2: 21.316 Sign.: 0.379Concordance degree between predicted values and observed values: 69.9 per cent.
F"6<$%GQStatistically Signi cant Predictors of the Binomial Logistic
Regression of Employment Growth on the Fit Between Variables
Independent Variables Coeff. S.E. Wald D.f. Sig. Exp. (b)
Variable 73: t between functional structure and a single product strategy
1.379 0.658 4.395 1 0.036 3.970
Variable 76: t between rm size and type of growth
2.088 0.771 7 .332 1 0.007 8.072
Variable 80: t between the size of the management team and a dynamic environment
1.064 0.496 4.598 1 0.032 2.899
Variable 81: centralised structure in a dynamic environment
1.222 0.458 7.134 1 0.008 3.394
Model !2: 37.174 Sign.: 0.003Concordance degree between predicted values and observed values: 74.7 per cent.
From these 10 regressions carried out on the groups of independent vari-ables, it clearly appears that the variables affecting employment growth are mostly different from those that in uence sales growth. With just two exceptions, that of whether the entrepreneur is of immigrant origin and the rm size, the predictors of growth are distinct. In addition, the last two regressions concerning the impact of environmental variables and the ts between variables did not produce any signi cant results for sales growth.
These results con rm the study by Weinzimmer et al. (1998) which also tested various models using the same independent variables, but different dependent variables. The signi cant determinants of growth are speci c to each particular model. This nding is con rmed by the stepwise regressions. The stepwise regression procedure on sales comprised nine steps.
at Univ Catholique Louvain Bib on April 20, 2009 http://joe.sagepub.comDownloaded from
The Conceptualisation of Growth / 39
The Journal of Entrepreneurship, 18, 1 (2009): 21–45
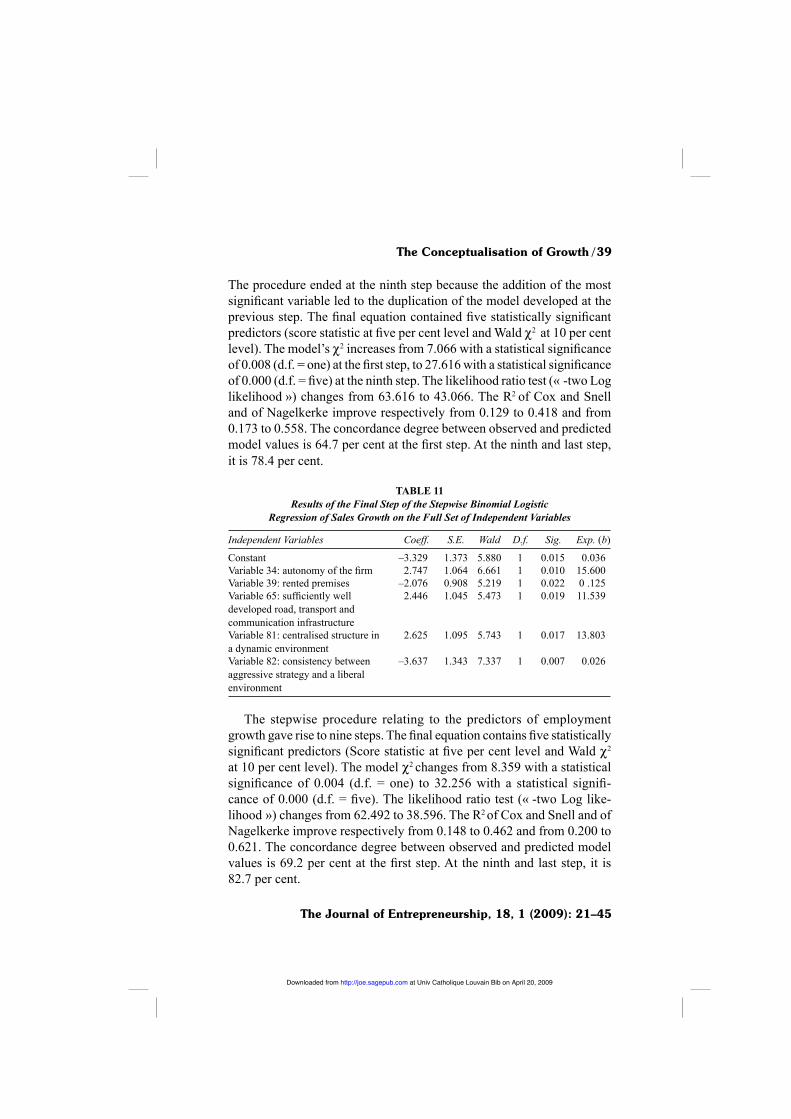
The procedure ended at the ninth step because the addition of the most signi cant variable led to the duplication of the model developed at the previous step. The nal equation contained ve statistically signi cant predictors (score statistic at ve per cent level and Wald !2 at 10 per cent level). The model’s !2 increases from 7.066 with a statistical signi cance of 0.008 (d.f. = one) at the rst step, to 27.616 with a statistical signi cance of 0.000 (d.f. = ve) at the ninth step. The likelihood ratio test (« -two Log likelihood ») changes from 63.616 to 43.066. The R2 of Cox and Snell and of Nagelkerke improve respectively from 0.129 to 0.418 and from 0.173 to 0.558. The concordance degree between observed and predicted model values is 64.7 per cent at the rst step. At the ninth and last step, it is 78.4 per cent.
F"6<$%GG%Results of the Final Step of the Stepwise Binomial Logistic
Regression of Sales Growth on the Full Set of Independent Variables%
Independent Variables Coeff. S.E. Wald D.f. Sig. Exp. (b)
Constant –3.329 1.373 5.880 1 0.015 0.036Variable 34: autonomy of the rm 2.747 1.064 6.661 1 0.010 15.600Variable 39: rented premises –2.076 0.908 5.219 1 0.022 0 .125Variable 65: suf ciently well developed road, transport and communication infrastructure
2.446 1.045 5.473 1 0.019 11.539
Variable 81: centralised structure in a dynamic environment
2.625 1.095 5.743 1 0.017 13.803
Variable 82: consistency between aggressive strategy and a liberal environment
–3.637 1.343 7.337 1 0.007 0.026
The stepwise procedure relating to the predictors of employment
growth gave rise to nine steps. The nal equation contains ve statistically signi cant predictors (Score statistic at ve per cent level and Wald !2 at 10 per cent level). The model !2 changes from 8.359 with a statistical signi cance of 0.004 (d.f. = one) to 32.256 with a statistical signi -cance of 0.000 (d.f. = ve). The likelihood ratio test (« -two Log like-lihood ») changes from 62.492 to 38.596. The R2 of Cox and Snell and of Nagelkerke improve respectively from 0.148 to 0.462 and from 0.200 to 0.621. The concordance degree between observed and predicted model values is 69.2 per cent at the rst step. At the ninth and last step, it is 82.7 per cent.
at Univ Catholique Louvain Bib on April 20, 2009 http://joe.sagepub.comDownloaded from
40 / Frank Janssen
The Journal of Entrepreneurship, 18, 1 (2009): 21–45
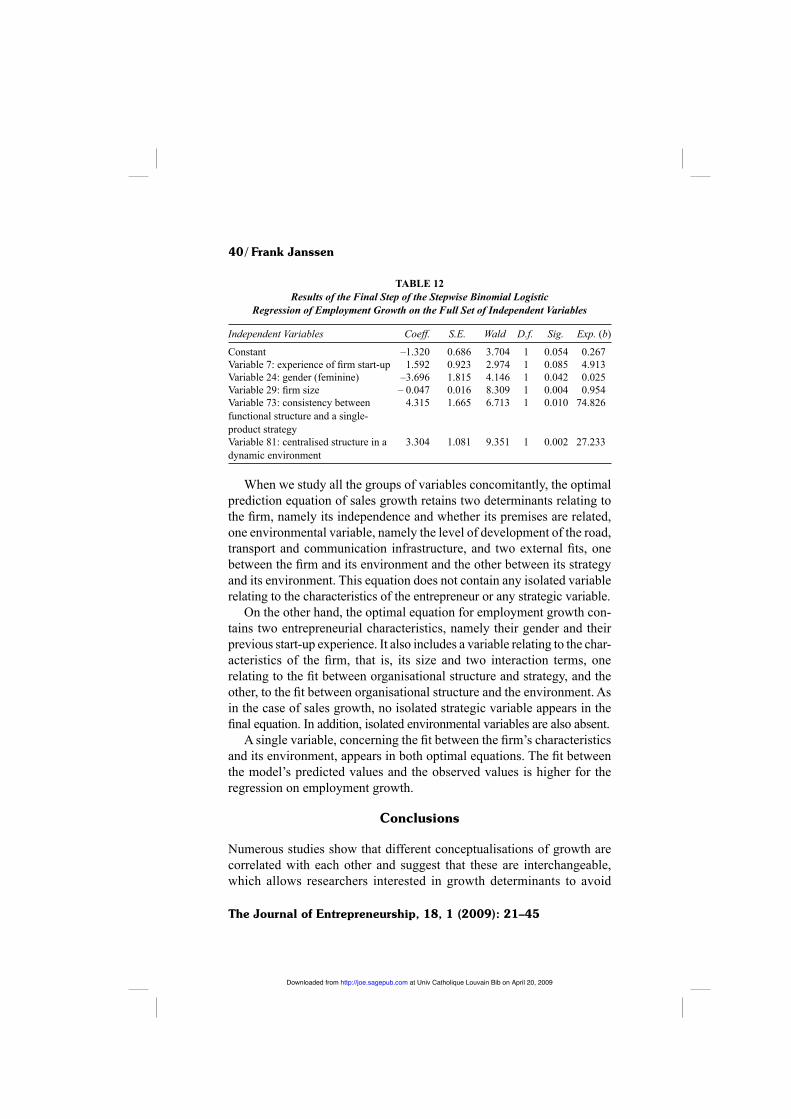
When we study all the groups of variables concomitantly, the optimal prediction equation of sales growth retains two determinants relating to the rm, namely its independence and whether its premises are related, one environmental variable, namely the level of development of the road, transport and communication infrastructure, and two external ts, one between the rm and its environment and the other between its strategy and its environment. This equation does not contain any isolated variable relating to the characteristics of the entrepreneur or any strategic variable.
On the other hand, the optimal equation for employment growth con-tains two entrepreneurial characteristics, namely their gender and their previous start-up experience. It also includes a variable relating to the char-acteristics of the rm, that is, its size and two interaction terms, one relating to the t between organisational structure and strategy, and the other, to the t between organisational structure and the environment. As in the case of sales growth, no isolated strategic variable appears in the nal equation. In addition, isolated environmental variables are also absent.
A single variable, concerning the t between the rm’s characteristics and its environment, appears in both optimal equations. The t between the model’s predicted values and the observed values is higher for the regression on employment growth.
Conclusions
Numerous studies show that different conceptualisations of growth are correlated with each other and suggest that these are interchangeable, which allows researchers interested in growth determinants to avoid
F"6<$%GH%Results of the Final Step of the Stepwise Binomial Logistic
Regression of Employment Growth on the Full Set of Independent Variables
Independent Variables Coeff. S.E. Wald D.f. Sig. Exp. (b)
Constant –1.320 0.686 3.704 1 0.054 0.267Variable 7: experience of rm start-up 1.592 0.923 2.974 1 0.085 4.913Variable 24: gender (feminine) –3.696 1.815 4.146 1 0.042 0.025Variable 29: rm size – 0.047 0.016 8.309 1 0.004 0.954Variable 73: consistency between functional structure and a single-product strategy
4.315 1.665 6.713 1 0.010 74.826
Variable 81: centralised structure in a dynamic environment
3.304 1.081 9.351 1 0.002 27.233
at Univ Catholique Louvain Bib on April 20, 2009 http://joe.sagepub.comDownloaded from
The Conceptualisation of Growth / 41
The Journal of Entrepreneurship, 18, 1 (2009): 21–45
all discussion on the theoretical justi cation of the chosen variable. We have asked ourselves if the use of different conceptualisations of growth does or does not in uence the results of studies on growth determinants. If it does not, the different concepts could indeed be considered as interchangeable.
Among the different measures of growth, employment can be considered as the criterion that is the most relevant from the societal point of view, and sales, from the manager’s point of view. Our study shows that these are also the two criteria that are the most frequently used within research on growth determinants, as much in economics as in management. In order to test the interchangeability of these criteria, on the basis of a literature review, we tried to identify all the potential determinants of growth that had been tested in former studies. We classi ed these into ve groups and then carried out ve binomial logistic regressions on employment growth and ve binomial logistic regressions on sales growth, that is, one for each group of independent variables.
The results of these 10 regressions clearly show that the variables af-fecting employment growth are largely different from those that in uence sales growth. With just two exceptions, the predictors of growth are distinct. Furthermore, the last two regressions concerning the impact of environmental variables and of ts between variables on sales growth do not contain any signi cant predictor. We also constructed two ‘optimal’ regression equations by means of a selection process. These con rmed our ndings. The two optimal equations only contained a single common variable.
As a result, employment and sales cannot be considered as inter-changeable conceptualisations of the same phenomenon. The two types of growth are determined by quite distinct factors. The use of different conceptualisations of growth does actually in uence the results of studies on growth determinants. This explains, at least partly, the inconsistencies found within the literature on growth. The choice of a particular concept of growth must therefore be justi ed theoretically. This also means that research on organisational growth has to recognise this heterogeneity and cannot approach the different forms of growth in an undifferentiated way. The results of research on employment growth, for example, cannot be generalised to all types of growth and each piece of research has to de ne precisely the type of growth being measured, while also providing a theoretical foundation for its choice.
at Univ Catholique Louvain Bib on April 20, 2009 http://joe.sagepub.comDownloaded from

42 / Frank Janssen
The Journal of Entrepreneurship, 18, 1 (2009): 21–45
In addition, our results show that organisational growth is a multifaceted phenomenon, which cannot be reduced to a unique dimension. This also means that growth cannot be measured through composite indicators, mixing different variables like sales or workforce, because they do not measure the same phenomenon.
From a managerial point of view, this means that the resources that are mobilised and the strategies that are implemented by a rm whose objective is to grow should vary depending on whether it wishes to attain one or the other type of growth. In the same way, economic policies designed to stimulate growth must also take this heterogeneity into account.
The results of our research are subject to certain limitations. First of all, this study is solely concerned with individual companies. However, some organisations are liable to grow thanks to creation of franchises. We did not use groups as our analysis unit, so this type of growth was inevitably ignored. Furthermore, we measure growth on the basis of data relating to the start and end of the period. However, growth does not necessarily follow a regular pattern. The development process may in fact be full of ups and downs. Nevertheless, our study does not take this phenomenon into consideration, because it does not take account of intermediate data. Moreover, the type of survey conducted and the questions asked prevented us from obtaining longitudinal data for a number of variables.
Notes
1. The nal column of Table 1 classi es the different types of independent variables used in the context of these studies within each of these groups.
2. According to the European Commission’s Recommendation of 3 April 1996, the following rms must be considered as SMEs:
— those employing less than 250 people; the number of people employed corres-ponds to the number of annual work units.
— those whose either sales does not exceed 40 million EUR, or the annual balance sheet total does not exceed 27 million EUR.
— those that respect an independence criterion. Independent rms are those which are not owned as to 25 per cent or more of the capital or the voting rights by one or several large rms. We have not used this criterion, given that one of our hypotheses presupposed that the fact that a rm is dependent on another rm would have a positive in uence on the growth of the former.
The Commission also establishes a distinction between medium-sized, small and micro-sized enterprises. The small rm is that which employs less than 50 people, who
at Univ Catholique Louvain Bib on April 20, 2009 http://joe.sagepub.comDownloaded from

The Conceptualisation of Growth / 43
The Journal of Entrepreneurship, 18, 1 (2009): 21–45
respects the independence criterion de ned above and for which either the sales does not exceed 7 million EUR, or the annual balance-sheet total does not exceed 5 million EUR. A rm is considered to be micro-sized if it has less than 10 workers.
3. The scal regime for companies is in fact more advantageous than the regime for physical persons. As a result many people create ‘empty’ rms only in order to deduce expenses. These empty shelves do, of course, not grow.
4. According to other authors (Bernard, 1999), a minimum of 10 observations per predictor is necessary. Harris (1985) underlines that this principle is not based on any empirical proof. Others suggest more liberal rules than Harris and consider that the number of observations must only exceed the number of variables by 40 (see Howell, 1997).
5. For the measure of this variable, see next section. 6. From which we withdrew rms that belonged to the examined sample. 7. The major advantage of this method in relation to personal surveys or by post is
its rapidity. In comparison with the personal survey, it also presents a lower risk of bias linked to the person of the interviewer (Lambin, 1990). Finally, it allows for the immediate codi cation of the responses, thus reducing risks of error.
8. The cut-off point of 50 per cent has been chosen in order to generate a proportion of high-growth rms (34.3 per cent) important enough to generate signi cant results.
9. During this period, the average annual growth rate of the Belgian GDP in constant prices has been of 2.68 per cent (National Bank of Belgium).
10. This also represents certain advantages in comparison to the discriminant analysis that can also be used when the dependent variable is dichotomised. Apart from the fact that the discriminant analysis involves a normal distribution of the variables, it can give rise to ‘impossible’ probabilities of success situated outside the 0–1 range (Howell, 1997).
11. This procedure is a combination of forward and backward procedures.12. It is necessary to use an exit threshold that is higher than the entry threshold in order
to avoid having the same variable selected and then discarded at consecutive steps of the procedure.
References
Acs, Z.J. & Audretsch, D.B. (1990). The determinants of small- rm growth in US manu-facturing. Applied Economics, 22, 2: 143–53.
Almus, M. (2002). What characterizes a fast-growing rm. Applied Economics, 34, 12: 1497–1508.
Bernard, P.-M. (1999). Régression logistique. Cours EPM–64312, Doctorate in epidemiology, Université Laval, URL, Available at http://w3.res.ulaval.ca/cours-epm-64312/Default.htm
Birch, D. (1986). The job generation process and small business. In P.A. Julien, J. Chicha and A. Joyal (eds) La P.M.E. dans un Monde en Mutation. Québec: Les Presses de l’Université du Québec.
Birley, S. & Westhead, P. (1990). Growth and performance contrasts between ‘types’ of small rms. Strategic Management Journal, 11, 7: 535–57.
at Univ Catholique Louvain Bib on April 20, 2009 http://joe.sagepub.comDownloaded from
44 / Frank Janssen
The Journal of Entrepreneurship, 18, 1 (2009): 21–45
Brush, C.G. & Chaganti, R. (1999). Business without glamour? An analysis of resources on performance by size and age in small service and retail rms. Journal of Business Venturing, 14, 3: 233–57.
Child, J. (1973). Predicting and understanding organizational structure. Administrative Science Quarterly, 18: 168–85.
Chrisman, J.J. & McMullan, W.E. (2000). A preliminary assessment of outsider assistance as a knowledge resource: The longer-term impact of new venture counseling. Entre-preneurship Theory and Practice, 24, 3: 37–53.
Delmar, F. (1997). Measuring growth : Methodological considerations and empirical results. In R. Donckels and A. Miettinen (eds), Entrepreneurship and SME Research: On Its Way to the Next Millennium (pp.199–215). Aldershot: Ashgate.
——— (1999). Entrepreneurial growth motivation and actual growth—a longitudinal study. Presented at RENT XIII, Research on Entrepreneurship, London, 25–26 November.
Donckels, R. (1990). Les Leviers de Croissance de la P.M.E. Fondation Roi Baudouin, Brussels: Roularta Books.
Dunkelberg, W.G. & Cooper, A.C. (1982). Patterns of small business growth. Academy of Management Proceedings: 409–13.
Eisenhardt, K.M. & Schoonhoven, C.B. (1990). Organizational growth: Linking the founding team strategy, environment, and growth among U.S. semiconductor ventures, 1978–1988. Administrative Science Quarterly, 35, September: 504–29.
Evans, D. (1987). Tests of alternative theories of rm growth. Journal of Political Economy, 95, 4: 657–74.
Gallagher, C.C. & Miller, P. (1991). New fast-growing companies create jobs. Long Range Planning, 24, 1: 96–101.
Garson, G.D. (2001). Logistic regression, North Carolina State University. http://www2.chass.ncsu.edu/garson/pa765/logistic.htm.
Harris, R.J. (1985). A Primer of Multivariate Statistics. Second edition. New York: Academic Press.
Howell, D.C. (1997). Statistical Methods for Psychology. Fourth Edition. London : Duxbury.
Hughes, A. (1998). Growth constraints on small and medium-sized rms. Working Paper No. 107, ESRC Centre for Business Research, University of Cambridge, November.
Hymer, S. and Pashigian, P. (1962). Firm size and rate of growth. Journal of Political Economy, 70, 6: 556–69.
Kalleberg, A.L. & Leicht, K.T. (1991). Gender and organizational performance: Deter-minants of small business survival and success. Academy of Management Journal, 34, 1: 136–61.
Kirchhoff, B.A. (1991). Entrepreneur’s contribution to economics. Entrepreneurship Theory and Practice, 16, 2: 93–112.
Kumar, M.S. (1985). Growth, acquisition activity and rm size: Evidence from the United Kingdom. Journal of Industrial Economics, 33, 3: 327–38.
Lambin, J.-J. (1990). La recherche marketing: Analyser, mesurer, prévoir. Paris: Ediscience International.
Manigart, S. (1996). Start-up characteristics and growth. Proceedings of the 41st ICSB World Conference, Stockholm, 16–19 June.
at Univ Catholique Louvain Bib on April 20, 2009 http://joe.sagepub.comDownloaded from
The Conceptualisation of Growth / 45
The Journal of Entrepreneurship, 18, 1 (2009): 21–45
McCarthy, A.M., Schoorman, F.D. & Cooper, A.C. (1993). Reinvestment decisions by entrepreneurs: Rational decision-making or escalation of commitment? Journal of Business Venturing, 8, 1: 9–24.
McMahon, R.G.P. (1998). Development orientation and business growth and performance amongst Australian manufacturing SMEs. Flinders University of South Australia, School of Commerce research paper series, 1441–3906: 98/4.
McPherson, A.D. (1992). Innovation, external linkages and small rm commercial per-formance: An empirical analysis from Western New York. Entrepreneurship and Regional Development, 4: 165–83.
Miller, D. & Toulouse, J-M. (1986). Chief executive personality and corporate strategy and structure in small rms. Management Science, 32, 11: 1389–1409.
Morrison, A.J. & Roth, K. (1992). A taxonomy of business-level strategies in global indus-tries. Strategic Management Journal, 13, 6: 399–418.
National Bank of Belgium, Belgostat, http://www.bnb.beOECD (1998). Les P.M.E. à forte croissance et l’emploi: Évaluation des pratiques exem-
plaires des pouvoirs publics. Report presented at the Athens meeting, 26–28 April, Paris, OECD, OCDE DSTI/IND/P.M.E.(98)11.
Siegel, R., Siegel, E. & Macmillan, I.C. (1993). Characteristics distinguishing high-growth ventures. Journal of Business Venturing, 8, 2: 169–80.
Singh, A. and Whittington, G. (1975). The size and growth of rms. Review of Economic Studies, 42, 1: 15–26.
Storey, D., Keasey, K., Watson, R. & Wynarczyk, P. (1987). The Performance of Small Firms: Pro ts, Jobs and Failures. London: Croom Helm.
Weinzimmer, L. (1993). Organizational growth of U.S. corporations: Environmental, organizational and managerial determinants. Doctoral thesis, University of Wisconsin— Milwaukee, Ann Arbor, U.M.I.
Weinzimmer, L.G., Nystrom, P.C. & Freeman, S.J. (1998). Measuring organizational growth: Issues, consequences and guidelines. Journal of Management Studies, 24, 2: 235–62.
Westhead, P. (1995). Survival and employment growth contrasts between types of owner-managed high-technology rms. Entrepreneurship Theory and Practice, 20, Fall: 5–27.
Westhead, P. & Birley, S. (1995). Employment growth in new independent owner-managed rms in Great Britain. International Small Business Journal, 13, 3: 11–34.
Wijewardena, H. & Tibbits, G.E. (1999). Factors contributing to the growth of small manufacturing rms: Data from Australia. Journal of Small Business Management, 37, 2: 88–95.
Wiklund, J. (1999). The sustainability of the entrepreneurial orientation-performance rela-tionship. Entrepreneurship Theory and Practice, 24, 1: 37–48.
Wooden, M. & Hawke, A. (2000). Unions and employment growth: Panel data evidence. Industrial Relations, 39, 1: 88–107.
at Univ Catholique Louvain Bib on April 20, 2009 http://joe.sagepub.comDownloaded from