Employee Turnover
41
Can Employee Empowerment Reduce Turnover? Evidence from the U.S. Federal Bureaucracy Sergio Fernandez & Sun Young Kim Indiana University School of Public and Environmental Affairs Paper presented at the Public Management Research Conference, hosted by the Public Management Research Association and the University Of Wisconsin Robert M. La Follette School of Public Affairs, in Madison, Wisconsin, June 20-22, 2013.
-
Upload
independent -
Category
Documents
-
view
2 -
download
0
Transcript of Employee Turnover

Can Employee Empowerment Reduce Turnover?
Evidence from the U.S. Federal Bureaucracy
Sergio Fernandez
&
Sun Young Kim
Indiana University School of Public and Environmental Affairs
Paper presented at the Public Management Research Conference, hosted by the Public Management Research Association and the University Of Wisconsin Robert M. La Follette
School of Public Affairs, in Madison, Wisconsin, June 20-22, 2013.
2
Abstract
Avoiding high employee turnover in the U.S. federal government has been an ongoing goal of
policymakers in Washington. A large literature emerging during the last three decades has
identified a range of antecedents of turnover, including individual characteristics, employee
attitudes, organizational conditions and managerial practices. Very little is known, however,
about the influence of employee empowerment on turnover. In this study, a causal model of how
employee empowerment impacts turnover in the U.S. federal bureaucracy is developed. The
model is tested using structural equation modeling (SEM) techniques and different sources of
data across multiple points in time. The empirical results support the hypothesized causal model.
Employee empowerment impacts turnover intention indirectly through its influence on job
satisfaction. Turnover intention, in turn, impacts turnover behavior.

3
The concept of employee empowerment has deep roots stretching back to Follett’s (1926)
research on employee participation, Argyris (1957) analysis of managerial styles, McGregor’s
(1960) Theory Y, and the groundbreaking Ohio and Michigan leadership studies (Fleishman,
1953; Halpin and Winer, 1957; Hemphill and Coons, 1957). It was not until the 1990s, however,
that empowerment programs became widely adopted. In a variety of industries, including food
and hospitality, nursing, education and government, employee empowerment practices have been
found to be effective at raising performance (Lee, Cayer and Lan, 2006; Fernandez and
Moldogaziev, 2010; Spreitzer, 1995; Lawler, Mohrman, and Ledford, 1992, 1995; Neilsen and
Pedersen, 2003; Kirkman and Rosen, 1999), encouraging innovation (Spreitzer, 1995; Fernandez
and Moldogaziev, 2013a, 2013b), and improving employee job satisfaction (Lawler, Mohrman,
and Ledford, Jr., 1992, 1995; Bowen and Lawler, 1992; Davies, Laschinger and Andrusyszyn,
2006; Sarmiento, Laschinger, and Iwasiw, 2004; Seibert, Silver and Randolph, 2004;
Kuokkanen, Leino-Kilpi and Katajisto, 2003, Ugboro and Obeng, 2000; Wu and Short, 1996;
Klecker, and Loadman, 1996; Fulford and Enz, 1995; Kim, 2002; Wright and Kim, 2004; Savery
and Luks, 2001; Lee, Cayer and Lan, 2006), organizational commitment (Lawler, Mohrman, and
Ledford, 1992, 1995; Guthrie, 2001; Kirkman and Rosen, 1999) and job involvement (Coye and
Belohlav, 1995). We know very little, however, about employee empowerment’s effects on
employee turnover.
Policymakers and public managers in Washington have expressed strong concern for
turnover in the federal government at various points in the nation’s history. In 2012, the turnover
rate in the federal bureaucracy reached a level unseen since the end of the Second World War
(Society for Human Resource Management, 2012; Losey, 2012). High turnover can have
deleterious effects on organizations, including higher personnel administration costs, lower

4
performance, and declining morale (Selden and Moynihan, 2000; Kim, 2006; Pitts, Marvel and
Fernandez, 2011; Cho and Lewis, 2012; Boushey and Glynn, 2012). In this study, we develop a
causal model of how employee empowerment impacts turnover. The model is tested using
structural equation modeling (SEM) techniques and different sources of data from the U.S.
federal government across multiple points in time. The empirical results support the
hypothesized causal model. Employee empowerment impacts turnover intention indirectly
through its influence on job satisfaction. Turnover intention, in turn, impacts turnover behavior.
The study contributes to the literatures on employee empowerment and turnover in
several ways. First, it borrows Bowen and Lawler’s (1992; 1995) conceptualization of employee
empowerment as a multifaceted managerial approach and develops and validates a
multidimensional measure of this construct. Second, unlike many previous studies of turnover in
the public sector, it examines how job satisfaction mediates the relationship between employee
empowerment and turnover intention. Third, it goes beyond predicting turnover intention to
estimate how turnover intention affects actual turnover behavior. Finally, it employs an
innovative approach to structural equation modeling (SEM), along with data from multiple
points in time, to create time lags that allow for more accurate estimates of causal effects (see
Gollob and Reichardt, 1987; Biddle and Marlin, 1987).
Turnover in the U.S. Federal Bureaucracy
Concerns about high turnover in the federal government are as old as the founding of the
American republic. White (1948) described how during the first Washington Administration
cabinet officials expressed frustration about their inability to hire and retain competent clerks
who were in short supply and lured by employment opportunities in business. Turnover rates
were high in the early period of the republic, with the spoils system in place and well before a
5
merit-based personnel system had emerged. The elections of Presidents Jefferson and Jackson
brought about turnover rates of almost 20% (Appleby, 1948). In the 20th century, the end of
World War I and World War II brought about unprecedented turnover rates of about 25% and
40%, respectively due to large reductions in federal spending and the implementation of policies
that gave veterans preferences for civilian jobs (Appleby, 1948).
In the wake of the Great Society and the expansion of the regulatory state, President
Reagan launched a frontal assault on the bureaucracy, relying on cuts in domestic programs and
privatization to scale back the size and scope of the federal government. Near the end of the
second Reagan Administration, the National Commission on the Public Service issued a report
pointing to the “quiet crisis” in the federal bureaucracy characterized by high turnover and an
inability to recruit highly-qualified employees (National Commission on the Public Service,
1989). The crisis was attributed to a variety of factors, including anti-bureaucracy rhetoric,
declining prestige of public service, low morale and relative decline in pay for federal
employees. A comprehensive analysis of federal turnover and retention rates during the 1970s
and 1980s found mixed evidence of a crisis (Lewis, 1991). It found the turnover rate for white-
collar employees remained quite stable from the Carter Administration to the end of the second
Reagan Administration, rising only from about 9.5 to 10% per year. The overall trend, however,
masked other disconcerting patterns, such as increasing turnover rates among more experienced
and college educated employees.
President Clinton’s efforts to reform the federal bureaucracy focused, among other
things, on reducing the federal workforce to reduce the cost of government. His administration
claimed a reduction in the federal workforce of 426,200 as evidence of the effectiveness of the
reforms (Breul and Kamensky, 2008). While the cuts varied across the bureaucracy, with
6
defense-related and support positions experiencing the largest impact, they succeed in bring
down federal employment to its lowest levels since the Kennedy Administration (Kettl, 2005).
By the late 1990s, Republican Senators began alerting the public of a looming federal human
capital crisis precipitated in part by these personnel cuts. A report by senator Voinovich of Ohio
noted that by 2004, over half of the non-postal civilian federal workforce of 1.8 million will be
eligible to leave federal service through regular or early retirement (U.S. Senate, Committee on
Government Affairs, 2000a). It was estimated that at least 660,000 employees would retire from
the federal workforce by 2010, “taking with them valuable and perhaps irreplaceable institutional
knowledge, threatening to leave the government with an inexperienced and ineffective
workforce” (U.S. Senate, Committee on Governmental Affairs, 2000a, p. 2). Similarly, Senator
Thompson of Tennessee issued a report critical of the Clinton Administrations’ downsizing of
the federal bureaucracy during the 1990s, claiming that the downsizing was accomplished
indiscriminately and randomly with little consideration for how reduced staffing levels would
affect the ability of federal agencies to accomplish their missions (U.S. Senate, Committee on
Governmental Affairs, 2000b).
During the two George W. Bush Administrations, growth in defense and domestic
entitlement spending kept federal turnover rates steady. Very recently, however, signs of the
much anticipated federal human capital crisis have begun to emerge. A study by the Society for
Human Resource Management (2012) found that the federal government had a voluntary
turnover rate of 17% in 2011, a figure significantly higher than that found in various other
industries. The Federal Times reported that from 2010 to 2011, spikes in rates of retirement and
voluntary turnover had contributed to the largest decline in the federal workforce since 1999
(Losey, 2012). The report also highlighted the dire consequences of high turnover in the federal
7
government (see also Selden and Moynihan, 2000; Kim, 2006; Pitts, Marvel and Fernandez,
2011; Cho and Lewis, 2012). First is the loss of institutional knowledge of what worked and
didn’t work in the past and knowledge of why and how things are currently done in federal
agencies. Second, staff reductions without a reduction in workload mean additional duties,
increased frustration and declining morale for many current employees, raising the odds that they
in turn will also depart. Third, all things being equal, turnover can result in rising backlogs and
declining work productivity. Studies of public organizations show that a more stable workforce
is related to higher performance (Meier and Hicklin 2008; O’Toole and Meier 2003). Finally,
turnover imposes replacement costs for recruitment, selection and training and development of
new employees. A recent review of the literature indicates these costs are more than one-fifth of
an employee’s salary, with the cost rising for more highly educated workers and those
performing more complex tasks (Boushey and Glynn, 2012).
In light of these negative impacts, scholars have devoted time to the study of ways to
reduce turnover. Research has identified a number of antecedents of turnover, including
personal characteristics like employee age and length of employment (Kellough and Osuna,
1995; Lewis, 1991; Meyer, et al., 1979; Arnold and Feldman, 1982; Cotton and Tuttle, 1986;
Griffeth, Hom, and Gaertner 2000; Choi, 2009; Bertelli, 2007), and employee attitudes toward
work, including organizational commitment, job involvement and satisfaction with work, pay,
benefits and promotional opportunities (Lambert, Hogan, and Barton 2001; Cotton and Tuttle,
1985; Park, Ofori-Dankwa, and Bishop 1994; Shaw, et al., 1998; Griffeth, Hom, and Gaertner
2000; Porter and Steers 1973; Spector 1985; Guthrie, 2001; Johnston et al. 1993; Kim, 2005;
Bertelli, 2007; Jung, 2010; Llorens and Stazyk, 2011; Cho and Lewis, 2012). A range of
managerial practices and policies have also been found to be effective at reducing turnover,

8
including fostering open communication, building trust, enriching jobs, promoting fairness,
instilling identification with the organization and supporting family life (Porter and Steers, 1973;
Cotton and Tuttle 1986; Griffeth, Hom, and Gaertner, 2000; Lambert, Hogan, and Barton 2001;
Costigan, Ilter and Berman, 1998; Pitts, Marvel and Fernandez, 2011; Cooper-Hakim and
Viswesvaran, 2005; Griffeth, Hom, and Gaertner 2000; Selden and Moynihan, 2000; Rubin,
2009; Moynihan and Landuyt, 2008; Cho and Lewis, 2012; Choi 2011; Kim and Wiggins, 2011).
Interestingly, only a handful of studies have explored the impact of employee empowerment on
turnover in the public sector. Moynihan and Landuyt (2008) and Pitts, Marvel and Fernandez
(2011) found that employee empowerment had a small negative influence on turnover intention.
Park and Rainey (2008) report that employee empowerment mediates the relationship between
transformation-oriented leadership and turnover intention.
Employee Empowerment
Employee empowerment has been viewed alternatively as a cognitive state and a
managerial approach. From a psychological perspective, employee empowerment is viewed as a
cognitive state in which someone believes strongly in their ability to perform a task (Conger and
Kanungo, 1988) or experiences a heightened level of intrinsic task motivation (Thomas and
Velthouse, 1990). Spreitzer (1995, 1996) described employee empowerment as a four-
dimensional motivational construct composed of four cognitions—meaning, competence, self-
determination and impact—that reflect an active rather than passive orientation toward a work
role. From a managerial perspective, employee empowerment describes behavior or practices
on the part of managers aimed at sharing power, information, resources and rewards with lower-
level employees. For instance, Kanter (1979) viewed empowerment as a process by which
managers provide employees with access to three sources of power: supply of essential

9
resources, information and feedback, and support and authority to act. Arnold, et al. (2000) and
Ahearne, et al. (2005) define employee empowerment as a leadership style. For the former, an
empowering leadership style involves behaviors that enhance the meaningfulness of work, foster
participation in decision making, express confidence in high performance, and provide autonomy
from bureaucratic constraints. For the latter, empowering leadership entails leading by example,
involving others in decision making, coaching, informing, and showing concern for others.
Perhaps the most well-known conceptualization of employee empowerment is that
developed by Bowen and Lawler (1992, 1995). They view employee empowerment an approach
to service delivery in which managers share with their employees four organizational
ingredients: “(1) information about the organization’s performance, (2) rewards based on the
organization’s performance, (3) knowledge that enables employees to understand and contribute
to organizational performance, and (4) power to make decisions that influence organizational
direction and performance” (1992; p. 32). Their analysis of the burgeoning empowerment trend
beginning revealed that while sharing authority with lower level employees was an essential part
of an empowerment, successful employee empowerment programs also required redistributing
information, knowledge and rewards with lower-level employees close to the customer.
The debate over the meaning of employee empowerment is ongoing, and trying to reach a
resolution is beyond the scope of this study. Bowen and Lawler’s four-dimensional
conceptualization of employee empowerment as a relational construct or managerial approach is
chosen for this study for several reasons. First, doing so allows this study’s results to be
compared with and contribute to a growing body of evidence of the effects of employee
empowerment practices on employee attitudes and behavior (Bowen and Lawler, 1992, 1995;
Lawler, Mohrman, and Ledford, Jr., 1992, 1995; Kim, 2002; Wright and Kim, 2004; Savery and
10
Luks, 2001; Lee, Cayer and Lan, 2006; Perry, 2004; Pitts, 2005; Mesch, Perry and Wise, 1995;
Fernandez and Moldogaziev, 2010, 2013a, 2013b). Second, employee empowerment conceived
of as a managerial approach resonates with normative theory in public administration calling for
democratization of the workplace, sharing of power with employees, and flattening of
bureaucratic hierarchies (Golembiewski, 1967, 1972; Kirkhart, 1971; Denhardt, 1984). Finally,
empowerment as a relational construct directly points to a set of recognizable and widely
understood practices or levers managers can pull to influence employee behavior.
A Causal Model of the Impact of Employee Empowerment on Turnover
In this section we develop a causal model of how employee empowerment impacts
employee turnover. As noted above, few studies have analyzed the relationship between
employee empowerment and turnover. Many more studies show employee empowerment to
increase job satisfaction, and various others find job satisfaction to be a key antecedent of
turnover intention. Thus, we propose that the effect of employee empowerment on turnover
intention is indirect and mediated by job satisfaction. Turnover intention, in turn, is expected to
impact turnover behavior. Each of the links in this hypothesized causal structure is described
below.
Employee empowerment and job satisfaction
Bowen and Lawler (1992, 1995) argued that empowerment practices improve job
satisfaction, in part by giving employees a sense of control and making work more meaningful.
Empirical evidence from manufacturing, health care, basic and higher education and other
service industries seems to confirm this proposition (Davies, Laschinger and Andrusyszyn, 2006;
Sarmiento, Laschinger, and Iwasiw, 2004; Seibert, Silver and Randolph, 2004; Wu and Short,
1996; Fulford and Enz, 1995; Lawler, Mohrman and Ledford, 1995). These results are
11
consistent with those from large meta-analyses showing that empowerment practices aimed at
providing feedback and granting autonomy are positively related to job satisfaction (Fried and
Ferris, 1987; Kinicki, et al., 2002). Studies from the public sector also reveal a positive
relationship between employee empowerment and job satisfaction (Savery and Luks, 2001; Lee,
Cayer and Lan, 2006: Kim, 2002; Wright and Kim, 2004; Fernandez and Moldogaziev, 2013b).
Self-Determination Theory (SDT) offers a window into why and how employee
empowerment practices positively impact job satisfaction (Deci, 1971; Deci and Ryan, 1985;
Ryan, 1995; Ryan and Deci, 2000). SDT posits that people have an innate tendency toward
growth and intrinsic motivation, and that intrinsic motivation and well-being requires satisfying
the three psychological needs for relatedness, competence and autonomy (Deci and Ryan, 1985;
Ryan, Kuhl and Deci, 1997; Ryan, 1995; Gagne and Deci, 2005; Deci and Ryan, 1987; Ryan and
Deci, 2000). In many social settings, including the workplace, external regulations or stimuli are
used to induce desired behavior. To the extent that these three needs are satisfied, people
internalize and integrate external regulations. That is, they take in external values and
contingencies and transform them into personal values and self-motivation. Through this
process of internalization and integration, extrinsically prescribed behavior becomes internally or
autonomously regulated so that motivation to act becomes self-determined.
Organizational policies, supervisory styles and other managerial interventions that
promote satisfaction of the need for autonomy, competence and relatedness have been found to
positively influence work-related attitudes, including organizational commitment (Gagne and
Koestner, 2002), commitment to change (Gagne, Koestner and Zuckerman, 2000), work
engagement (Deci, et al., 2001), task enjoyment (Black and Deci, 2000) and job satisfaction
(Illardi, et al., 1993; Deci, Connell and Ryan, 1989; Vansteenkiste, et al., 2007). Illardi, et al.
12
(1993) found that employees who felt strongly that their work allowed them to experience
autonomy, competence and relatedness reported higher levels of job satisfaction. The findings
from Deci, Connell and Ryan (1989) indicate that a managerial orientation that promotes self-
determination has a positive effect on general satisfaction among employees and that the effect
grows as work climate—particularly pay and job security—increases. Vansteenkiste, et al.’s
(2007) findings indicates that employees who experience working conditions that promote
intrinsic (versus extrinsic) motivation are more satisfied with their job and life than others.
Managerial practices and behavior that promote self-determination, including
empowerment practices like granting employees more discretion and providing them with the
feedback and skills needed to perform their jobs, may increase job satisfaction in different ways.
They may increase employees’ trust and feelings of psychological safety, thereby encouraging
employees to satisfy their own needs at work (Deci, Connell and Ryan, 1989). They may also
promote job satisfaction by making employees feel they have more control, or the ability to make
decisions about their work. Perceived control over various job-related factors has been found to
be positively correlated with job satisfaction (Spector, 1986). In addition, managerial
interventions that provide greater autonomy and feedback may increase job satisfaction by
making work more meaningful and intrinsically satisfying (Hackman and Oldham, 1976; Fried
and Ferris, 1987). Finally, efforts to promote self-determination in the workplace may increase
employees’ self-esteem (Ilardi, et al., 1993; Deci, Connell and Ryan, 1989), an important
antecedent of job satisfaction (Judge, Locke and Durham, 1997).
We now arrive at our first hypothesis:
H1. Employee empowerment will have a positive effect on job satisfaction.
13
Job satisfaction and turnover
Employee satisfaction has been a prevailing theme in research on employee turnover.
Dissatisfaction with certain facets of work, including pay (Blau and Kahn, 1981; Cotton and
Tuttle, 1986; Lambert, et al., 2001; Park, et al., 1994; Shaw, et al., 1998), fringe benefits (Shaw,
et al., 1998; Ippolito, 1987), and growth and promotional opportunities (Cotton and Tuttle, 1986;
Spector, 1985; Porter and Steers, 1973; Griffeth, et al., 2000; Mobley, 1977; Johnston, et al.,
1993) have been found to increase the likelihood of turnover. A large body of empirical research
also points to a consistent and inverse relationship between job satisfaction and turnover (Porter,
et al., 1974; Carsten and Spector, 1987; Lambert, et al., 2001; Bluedorn, 1982; Mobley, 1977;
Porter and Steers, 1973; Cotton and Tuttle, 1986), with job satisfaction typically defined as a
general feeling or attitude toward one’s job rather than towards a particular facet of a job such as
pay or benefits.
Job satisfaction’s effect on turnover behavior appears to be indirect. Specifically, the job
satisfaction-turnover behavior relationship seems to be mediated by employee intentions,
particularly the intention to leave (Mobley, 1977; Steers and Mowday, 1981). Empirical tests of
voluntary turnover models reveal that turnover intention is the immediate antecedent of actual
leaving (Lee and Mowday, 1987; Michaels and Spector, 1982). Other studies suggest turnover
intention’s effect on actual turnover is greater than job satisfaction’s effect and that turnover
intention mediates the impact of employee attitudes such as job satisfaction and organizational
commitment on turnover behavior (Bluedorn, 1982; Tett and Meyer, 1993; Carsten and Spector,
1987). In the public setting, Cho and Lewis (2011) found that turnover intention and actual
turnover rates are strongly and positively correlated. Since they did not differentiate voluntary
and involuntary turnover, their results might underestimate the true correlation between turnover

14
intention and voluntary turnover. Importantly, the relationship between turnover intention and
turnover behavior is likely to strengthen as the time interval between attitude and behavior
diminishes (Porter, et al., 1974).
Based on this research, we model the relationship between job satisfaction and turnover
behavior as mediated by turnover intention and offer the next two hypotheses:
H2. Job satisfaction will have a negative effect on turnover intention.
H3. Turnover intention will have a positive effect on turnover behavior.
Data and Methods
In this section we describe the data, variables, measures and methods used in the
empirical analysis.
Data
Data for the empirical analysis were drawn from two sources. For employee
empowerment, job satisfaction, and turnover intention, 2006 and 2008 Federal Human Capital
Survey (FHCS) data and the 2010 Federal Employee Viewpoint Survey (FEVS) data were used.
These surveys were conducted by the U.S. Office of Personnel Management (OPM), and were
administered to 390,657, 540,727, and 504,609 federal government employees working in
cabinet-level and independent agencies in 2006, 2008, and 2010, respectively. Among them,
221,479, 212,223, and 263,475 employees completed the survey, yielding the response rates of
57%, 51%, and 52% in 2006, 2008, and 2010, respectively. Due to missing data on one or more
variables, the final sample sizes were reduced to 187,516, 178,681, and 202,972 in 2006, 2008,
and 2010, respectively. There were no meaningful differences between those observations that
were included in the final samples and those that were dropped due to missing data on at least
15
one variable. Turnover behavior data for 2009, 2010 and 2011 were obtained from OPM’s
FedScope website, which provides data on employee separations by federal sub-agency.
The empirical analysis was carried out at two levels of analysis: at the level of the
individual survey respondent, and at the level of the federal sub-agency. Whereas employee
empowerment, job satisfaction and turnover intention data are available at the individual level,
turnover behavior is only available at the sub-agency level. The analysis at the sub-agency level
required averaging individual survey responses to FHCS/FEVS from each sub-agency and then
merging these with FedScope turnover behavior data for each sub-agency, using the four-digit
sub-agency codes used by OPM. At the sub-agency level of analysis, the final sample sizes were
153, 153, and 152 for 2009, 2010, and 2011, respectively, due to limited availability of turnover
rates for sub-agencies. No meaningful differences were found between the sub-agencies
included in the analysis and those that were dropped due to missing turnover rates.
Variables
The variables in the analysis are employee empowerment, job satisfaction, turnover
intention, and turnover behavior, all of which are treated as latent variables in our structural
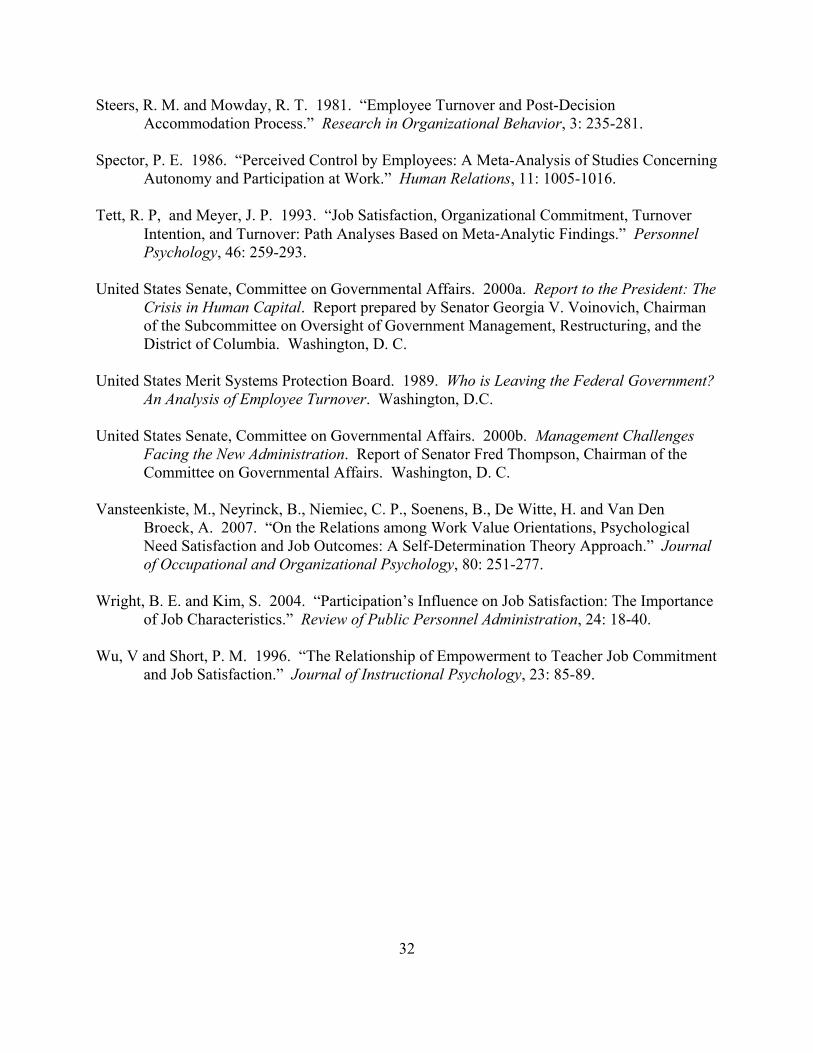
equation models. Table 1 shows the descriptive statistics and a correlations matrix for these
variables. The latent variable employee empowerment represents a multi-faceted management
approach composed of four practices: providing information about goals and performance
(observable variable practice 1); offering rewards based on performance (observable variable
practice 2); providing access to job related knowledge and skills (observable variable practice
3); and granting discretion to change work processes (observable variable practice 4) (Bowen
and Lawler, 1992; 1995). It is measured using four summated rating scales, one for each
practice (practice 1 through practice 4), that are created from multiple survey items from the
16
FHCS/FEVS (see Appendix 1 for variables and measures). The Cronbach’s alphas for these
scales range from 0.74 for practice 3 to 0.88 for practice 2. A higher-order confirmatory factor
analysis (CFA) of this four-dimensional definition of an employee empowerment approach
offers evidence of both convergent and discriminant validityi.
--- Insert Table 1 about here ---
The variable job satisfaction represents the cognitive and affective response to one’s job.
It is measured using two survey items from the FHCS/FEVS that represent global measures of
job satisfaction and not measures of facets of a job. Global and faceted measures of job
satisfaction do not correlated very highly, leading some to argue that they are not measuring the
same construct, or that the whole is not the sum of its parts (Scarpello and Campbell, 1983). We
follow Judge and Church’s (2000) lead and use a two-item rather than single-item global
measure of job satisfaction, since the former tends to be somewhat more reliable than the latter.
The Cronbach’s alpha for a summated rating scale developed from these two survey indicators is
0.70.
The latent variable turnover intention is measured using one survey item from the
FHCS/FEVS (observable measure turnover intention 1) in which respondents are asked if they
are considering leaving their organization during the next year. Response categories include
“No,” “Yes, to retire,” “Yes, to take another job within the federal government,” “Yes, to take
another job outside the federal government,” and “Yes, other”. To capture the intent to
voluntarily leave an organization, the responses are coded 1 for “Yes, to take another job within
the federal government,” “Yes, to take another job outside the federal government,” and “Yes,
other.” Responses “No” and “Yes, to retire” are coded 0. We do not count intent to retire as
voluntary turnover since this response may indicate required termination of employment
17
contracts after meeting certain age and service requirements (Selden and Moynihan, 2000) and
because retirement and voluntary turnover have different antecedents (see Pitts, Marvel and
Fernandez, 2011).
Finally, the latent variable turnover behavior represents voluntary turnover behavior and
is measured using a single indicator (observable variable turnover rate): the sub-agency
voluntary turnover rate. We calculated the voluntary turnover rate as the proportion of
employees in a sub-agency in a given year who reported either voluntarily leaving or quitting
their sub-agency. Mass transfer, retirement, reductions-in-force, termination or removal, and
death are not considered forms of voluntary turnover behavior in the analysis.
At the individual level, measures of the latent variables exhibit discriminant validity. As
the literature suggests, employee empowerment and job satisfaction have a moderate positive
correlation (r = 0.67), and the correlation between these two latent variables and turnover
intention is moderate and negative (r = -0.36 and r = -0.38, respectively). At the sub-agency
level of analysis, the direction and strength of correlations among latent variables also bode well
for discriminant validity. Again, we find that the correlation between employee empowerment
and job satisfaction is moderate and positive (r = 0.60), and the correlation between these two
latent variables and turnover intention is moderate and negative (r = -0.30 and r = -0.40,
respectively). As expected, turnover intention and the measures of turnover behavior are
moderately and positively correlated, with the strength of the correlation weakening as the time
interval between intention and behavior increases. Finally, employee empowerment has a very
weak positive correlation to the measures of turnover behavior.

18
Modeling
A series of structural equation models are developed and tested at the two levels of
analysis: individual and sub-agency. All models are analyzed using Mplus 6. At the individual
level of analysis, the indicators for the latent variables job satisfaction and turnover intention are
categorical. This requires us to use a robust weighted least squares mean- and variance-adjusted
(WLSMV) estimator. The WLSMV estimator uses a diagonal weight matrix with robust
standard errors and a robust mean- and variance-adjusted chi-square test statistic, and is a default
estimator in Mplus for models with at least one binary or ordered categorical dependent variable
(Muthén and Muthén, 1998-2012). The WLSMV estimator provides superior model fit and
more precise path coefficients than does the maximum likelihood (ML) estimator, especially
when the number of categories is low (e.g., two or three categories) (Beauducel and Herzberg,
2006). For the sub-agency level models, the ML estimator is used since all observed variables
are continuous.
Our structural equation models include two latent variables measured using a single
indicator: turnover intention and turnover behavior. The identification is problematic when a
single indicator is used to measure the underlying construct, and the measurement error variance
of the indicator cannot be specified as a free parameter (Bollen, 1989). For the identification of
the model, the measurement error of the indicator should be fixed using “a priori estimate of the
proportion of variance of the single indicator that is due to measurement error based on the
researcher’s experience with the measure or on results reported in the research literature” (Kline,
2011). For the latent variable turnover intention, previous studies used a reliability of 0.85 for
the single-item turnover intention measures in order to set the measurement error variance (e.g.,
Anderson, Coffey, & Byerly, 2002; Jaramillo, Mulki, & Solomon, 2006). Hence, at the sub-
19
agency level of analysis, we fix the measurement error of the turnover intention indicator
(turnover intention 1) as 15 percent of the observed variance of the indicator (i.e., the product of
the observed variance and one minus the reliability) (Bollen, 1989). At the individual level of
analysis, we fix the variance of the latent variable turnover intention as 1.0 for the model
identification. This is because Mplus does not estimate residual parameters of categorical
observed variables, and thus, the measurement error of the indicator cannot be fixed
appropriately. For the latent variable turnover behavior, the single indicator of sub-agency
turnover rates is measured using the data drawn from FedScope’s official administrative database
(EHRI-SDM). We assume that turnover rates are measured without error and the indicator
(observable variable turnover rate) is the perfect measure of the latent variable turnover
behavior. The variance of this measurement error term is fixed to equal 0.
Results
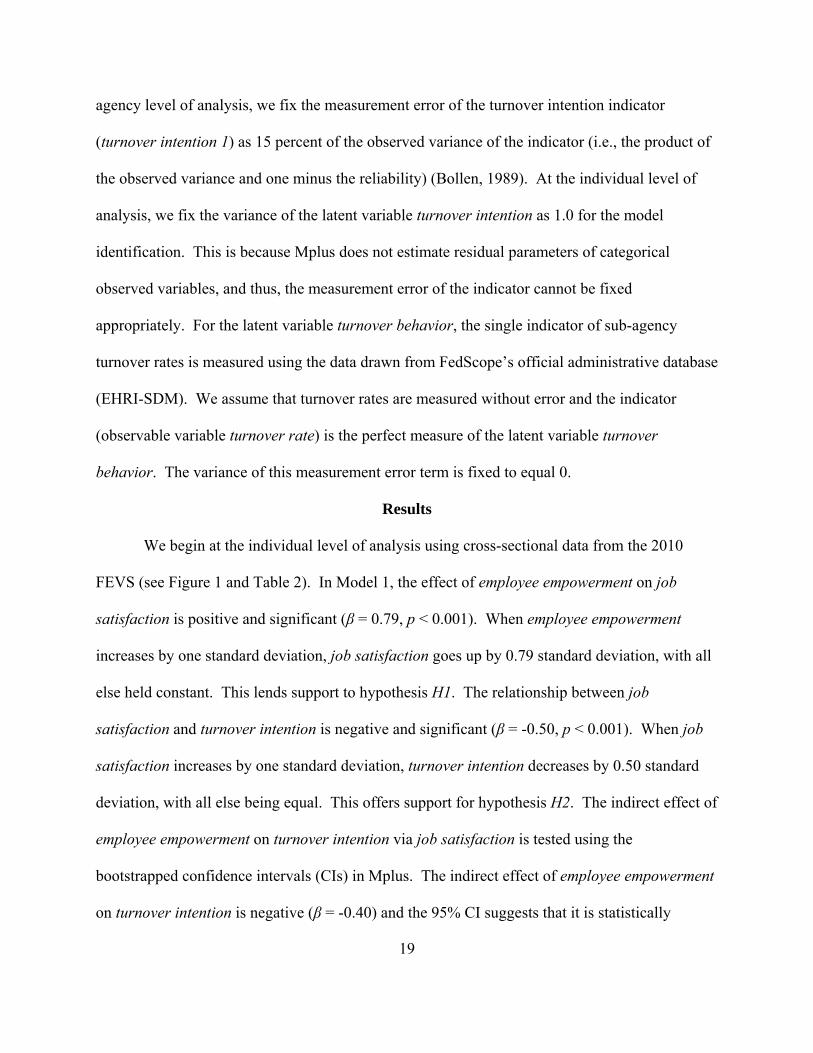
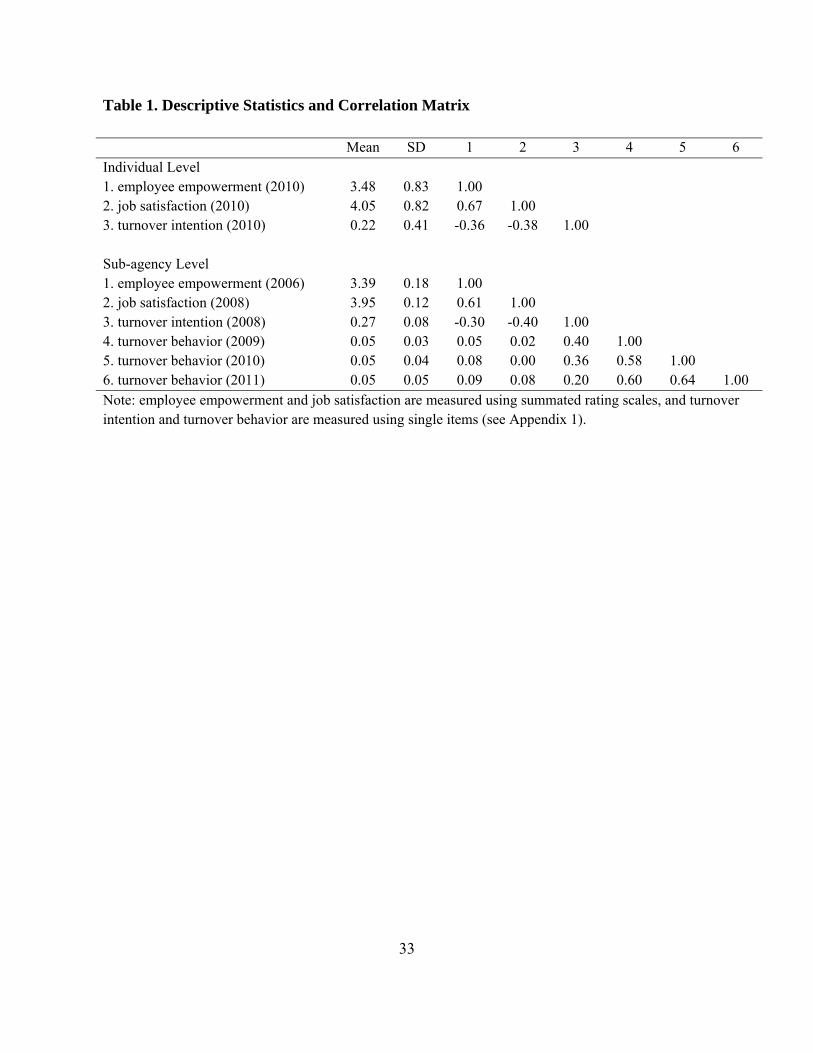
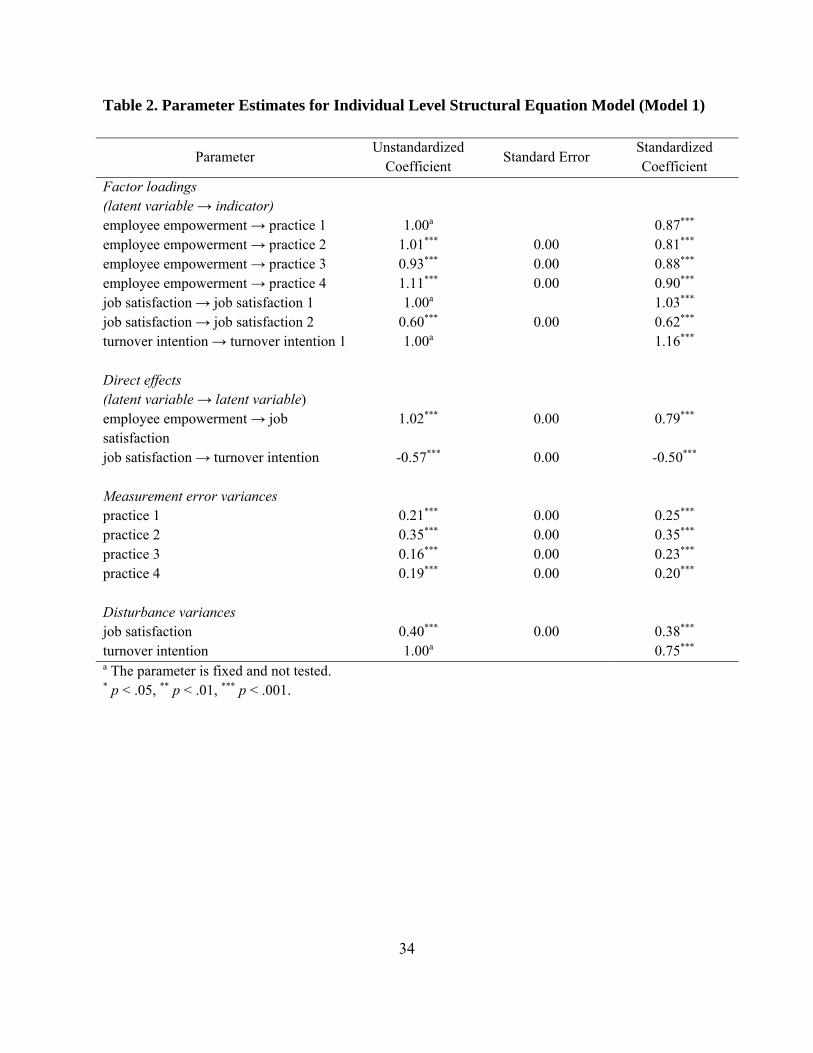
We begin at the individual level of analysis using cross-sectional data from the 2010
FEVS (see Figure 1 and Table 2). In Model 1, the effect of employee empowerment on job
satisfaction is positive and significant (β = 0.79, p < 0.001). When employee empowerment
increases by one standard deviation, job satisfaction goes up by 0.79 standard deviation, with all
else held constant. This lends support to hypothesis H1. The relationship between job
satisfaction and turnover intention is negative and significant (β = -0.50, p < 0.001). When job
satisfaction increases by one standard deviation, turnover intention decreases by 0.50 standard
deviation, with all else being equal. This offers support for hypothesis H2. The indirect effect of
employee empowerment on turnover intention via job satisfaction is tested using the
bootstrapped confidence intervals (CIs) in Mplus. The indirect effect of employee empowerment
on turnover intention is negative (β = -0.40) and the 95% CI suggests that it is statistically

20
significant. When employee empowerment increases by one standard deviation, turnover
intention goes down by 0.40 standard deviation, with all else held constant. These results are
consistent when the same model is analyzed using data from the 2006 and 2008 FHCS (results
not shown).
--- Insert Table 2 and Figure 1 about here ---
The fit statistics indicate that the model has strong fit to the data (see Table 3). The
comparative fit index (CFI) and the Tucker-Lewis fit index (TLI) are greater than 0.95, which
are indicative of good fit of the model (Hu and Bentler, 1999). The root mean square error of
approximation (RMSEA) is smaller than 0.05, also suggesting good model fit (Browne and
Cudeck, 1993). The chi-square (χ2) statistic indicates the model has poor fit, but it is highly
sensitive to the sample size. If the sample size is large, the value of the model χ2 may lead to
rejection of the model even though differences between observed and predicted covariances are
slight (Kline, 2011). Considering the extremely large sample size for the model as well as other
fit statistics, we conclude the model has good fit.
--- Insert Table 3 about here ---
The discussion now turns to the results of the analyses at the sub-agency level of analysis.
The variable turnover behavior can only be measured at the sub-agency level. To extend our
analysis and estimate the relationship between turnover intention and turnover behavior as stated
in hypothesis H3, we develop and test a series of three structural equation models at the sub-
agency level using lagged variables and data from five points in time: 2006 and 2008 FHCS data
to measure employee empowerment, job satisfaction, and turnover intention, and 2009, 2010 and
2011 FedScope data to measure turnover behavior. One of the limitations of the structural
equation modeling (SEM) approach is that this kind of analysis is typically based on cross-

21
sectional data that do not allow for time lags, and as a result, often produce biased estimates of
causal effects (Gollob and Reichardt, 1987; Biddle and Marlin, 1987). The use of time lags can
reduce this bias. The three models at the sub-agency level of analysis vary in terms of the time
lag. In the first sub-agency level model (Model 2), employee empowerment is measured in 2006,
job satisfaction and turnover intention in 2008, and turnover behavior in 2009. In second and
third of the sub-agency level models (Models 3 and 4), again we measure employee
empowerment in 2006 and job satisfaction and turnover intention in 2008, but turnover behavior
is measured in 2010 and 2011, respectively, generating greater time lags between turnover
intention and turnover behavior. These structural equation models with multiple time lags allow
us to examine the direction of causal relationships and the changes in effect size and statistical
significance with less bias.
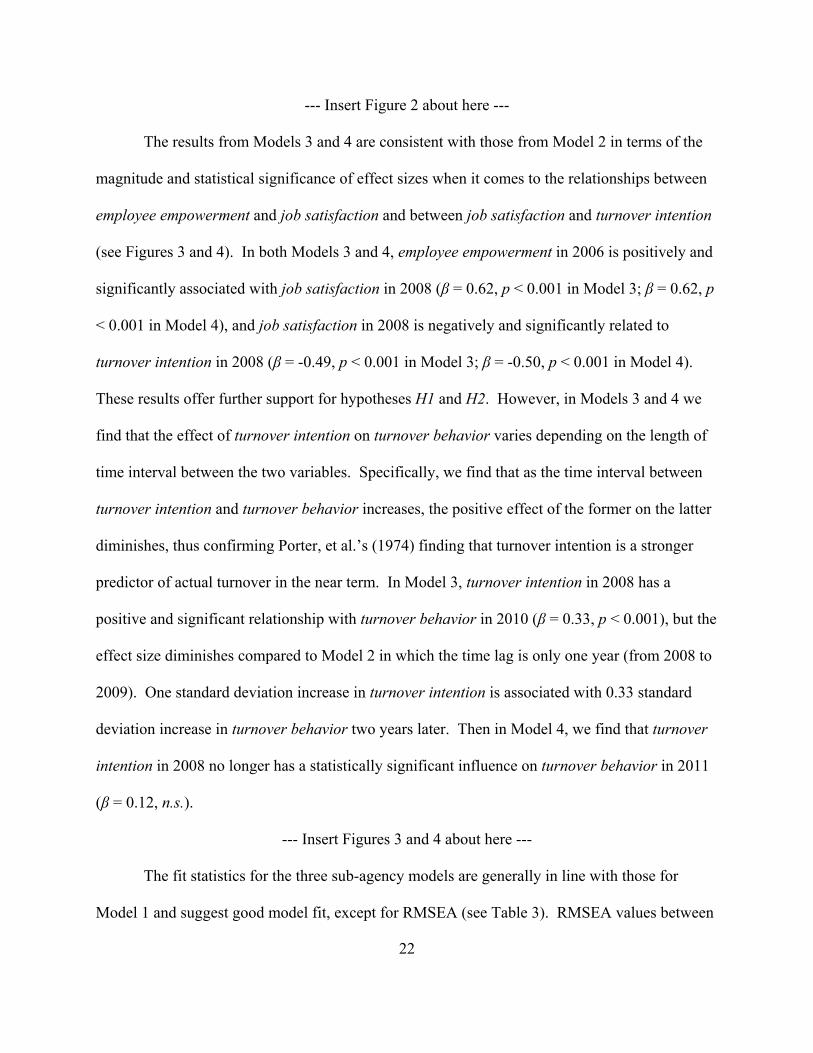
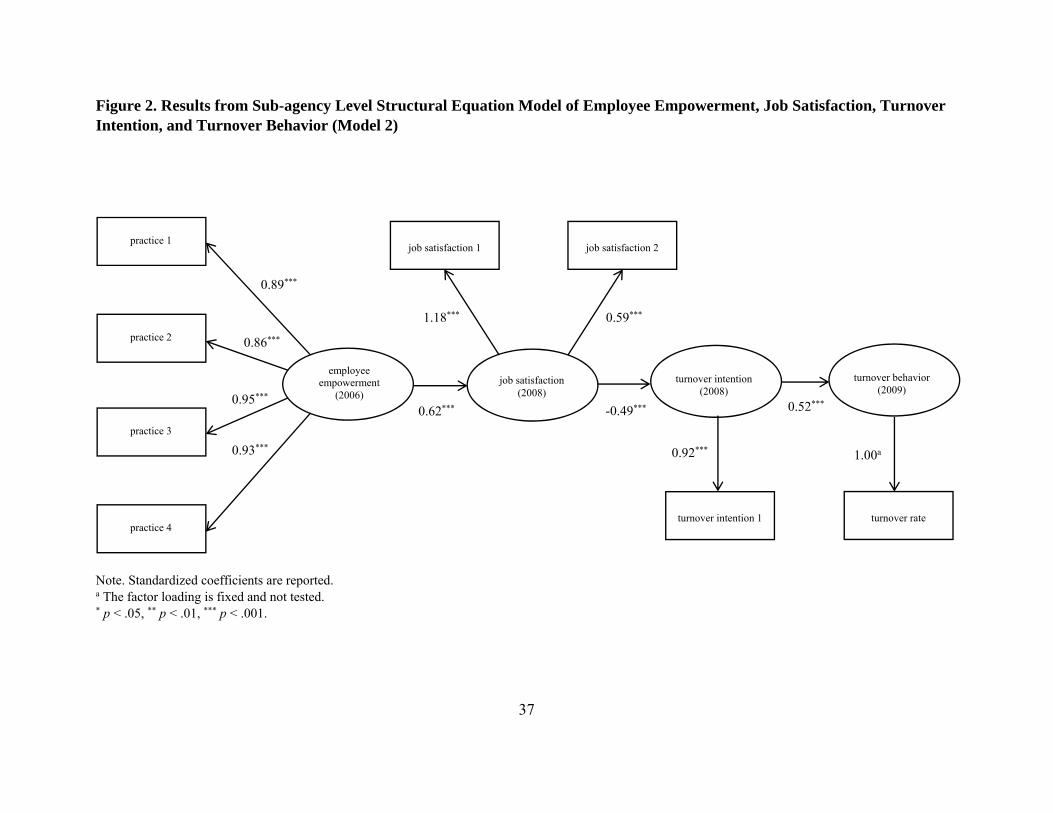
In Model 2, employee empowerment in 2006 is positively related to job satisfaction in
2008 (β = 0.62, p < 0.001) (see Figure 2). When employee empowerment increases by one
standard deviation, job satisfaction goes up by 0.62 standard deviation, with all else being equal.
The variable job satisfaction in 2008 is negatively associated with turnover intention in 2008 (β
= -0.49, p < 0.001). One standard deviation increase in job satisfaction is related to 0.49
standard deviation decrease in turnover intention (i.e., the proportion of employees who
expressed the intent to leave a subagency), with all else held constant. These two results provide
additional support for hypotheses H1 and H2. Additionally, we find that turnover intention in
2008 has a positive and significant impact on turnover behavior in 2009 (β = 0.52, p < 0.001).
One standard deviation increase in turnover intention is associated with 0.52 standard deviation
increase in turnover behavior in the following year, with all other factors held fixed. This offers
support for hypothesis H3.
22
--- Insert Figure 2 about here ---
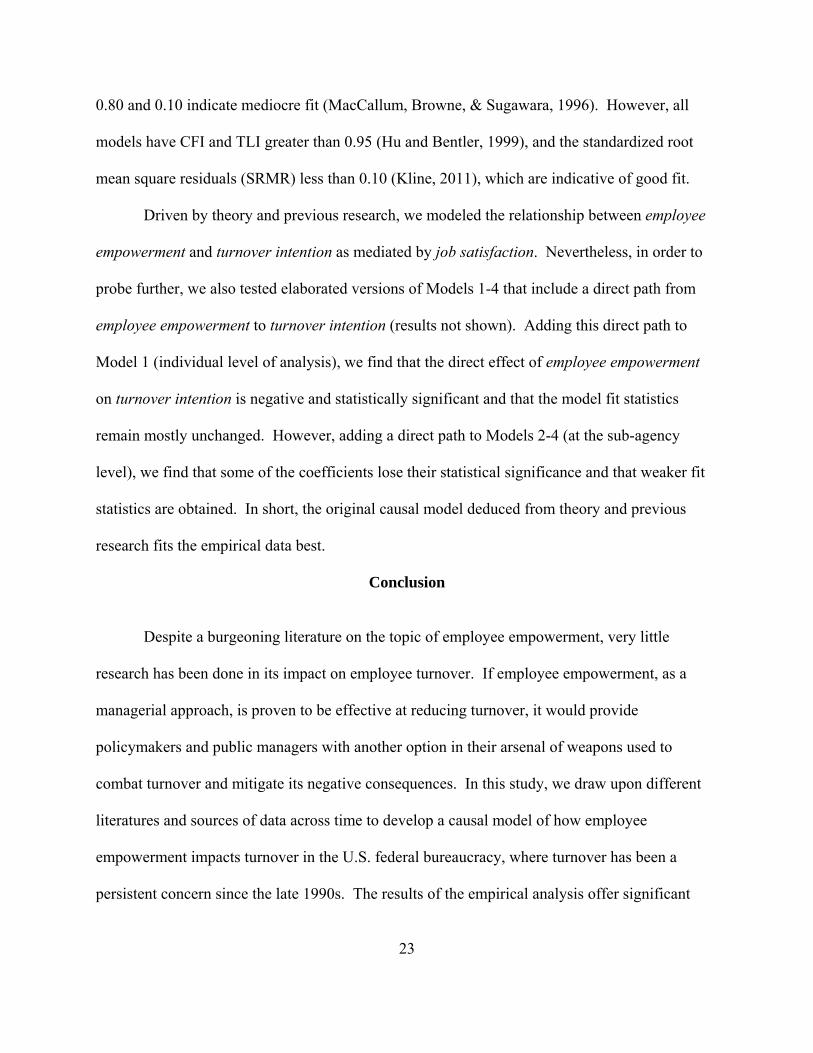
The results from Models 3 and 4 are consistent with those from Model 2 in terms of the
magnitude and statistical significance of effect sizes when it comes to the relationships between
employee empowerment and job satisfaction and between job satisfaction and turnover intention
(see Figures 3 and 4). In both Models 3 and 4, employee empowerment in 2006 is positively and
significantly associated with job satisfaction in 2008 (β = 0.62, p < 0.001 in Model 3; β = 0.62, p
< 0.001 in Model 4), and job satisfaction in 2008 is negatively and significantly related to
turnover intention in 2008 (β = -0.49, p < 0.001 in Model 3; β = -0.50, p < 0.001 in Model 4).
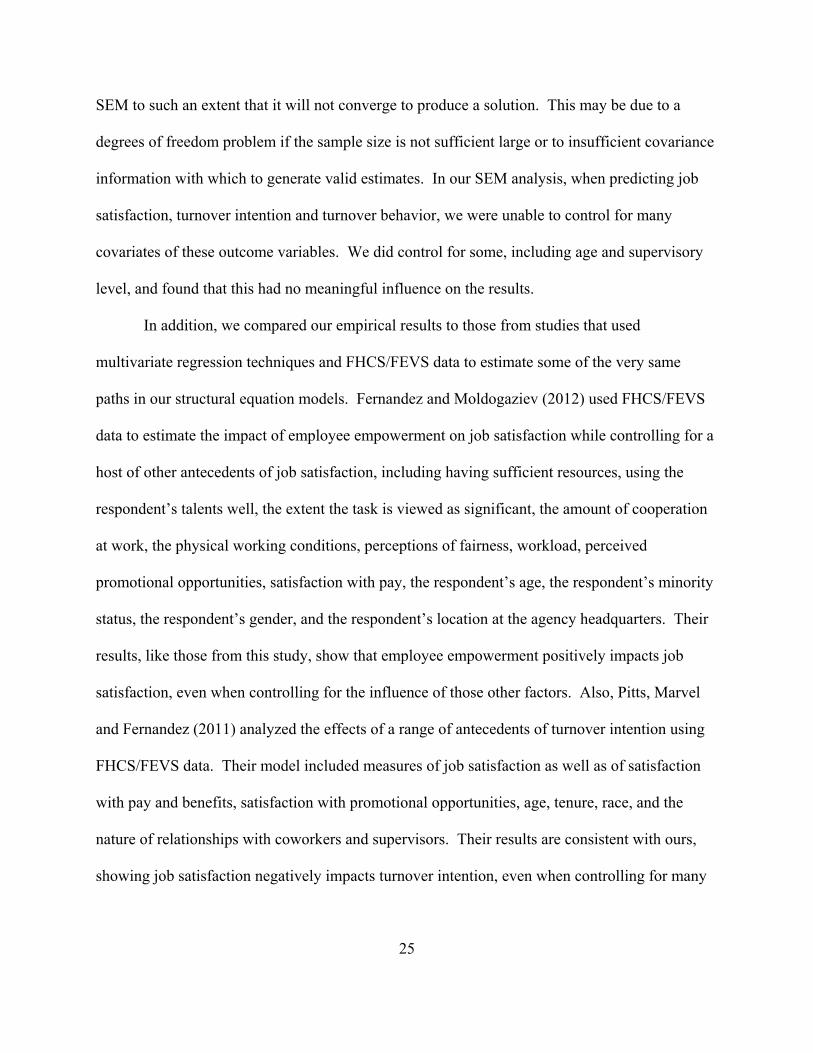
These results offer further support for hypotheses H1 and H2. However, in Models 3 and 4 we
find that the effect of turnover intention on turnover behavior varies depending on the length of
time interval between the two variables. Specifically, we find that as the time interval between
turnover intention and turnover behavior increases, the positive effect of the former on the latter
diminishes, thus confirming Porter, et al.’s (1974) finding that turnover intention is a stronger
predictor of actual turnover in the near term. In Model 3, turnover intention in 2008 has a
positive and significant relationship with turnover behavior in 2010 (β = 0.33, p < 0.001), but the
effect size diminishes compared to Model 2 in which the time lag is only one year (from 2008 to
2009). One standard deviation increase in turnover intention is associated with 0.33 standard
deviation increase in turnover behavior two years later. Then in Model 4, we find that turnover
intention in 2008 no longer has a statistically significant influence on turnover behavior in 2011
(β = 0.12, n.s.).
--- Insert Figures 3 and 4 about here ---
The fit statistics for the three sub-agency models are generally in line with those for
Model 1 and suggest good model fit, except for RMSEA (see Table 3). RMSEA values between
23
0.80 and 0.10 indicate mediocre fit (MacCallum, Browne, & Sugawara, 1996). However, all
models have CFI and TLI greater than 0.95 (Hu and Bentler, 1999), and the standardized root
mean square residuals (SRMR) less than 0.10 (Kline, 2011), which are indicative of good fit.
Driven by theory and previous research, we modeled the relationship between employee
empowerment and turnover intention as mediated by job satisfaction. Nevertheless, in order to
probe further, we also tested elaborated versions of Models 1-4 that include a direct path from
employee empowerment to turnover intention (results not shown). Adding this direct path to
Model 1 (individual level of analysis), we find that the direct effect of employee empowerment
on turnover intention is negative and statistically significant and that the model fit statistics
remain mostly unchanged. However, adding a direct path to Models 2-4 (at the sub-agency
level), we find that some of the coefficients lose their statistical significance and that weaker fit
statistics are obtained. In short, the original causal model deduced from theory and previous
research fits the empirical data best.
Conclusion
Despite a burgeoning literature on the topic of employee empowerment, very little
research has been done in its impact on employee turnover. If employee empowerment, as a
managerial approach, is proven to be effective at reducing turnover, it would provide
policymakers and public managers with another option in their arsenal of weapons used to
combat turnover and mitigate its negative consequences. In this study, we draw upon different
literatures and sources of data across time to develop a causal model of how employee
empowerment impacts turnover in the U.S. federal bureaucracy, where turnover has been a
persistent concern since the late 1990s. The results of the empirical analysis offer significant

24
support for the proposed causal model and its three hypothesized relationships. Specifically, we
find that employee empowerment, defined as a relational construct, has a positive and
substantively meaningful effect on job satisfaction, which in turn has a negative and
substantively meaningful effect on turnover intention. Thus, the relationship between employee
empowerment and turnover intention is negative and mediated by job satisfaction, as previous
research suggests. We also find that turnover intention has a positive and substantively
meaningful effect on turnover behavior.
One limitation of structural equation modeling (SEM) is that it is typically used to
analyze cross-sectional data and is therefore susceptible to producing biased estimates of causal
effects (Gollob and Reichardt, 1987; Biddle and Marlin, 1987). Because FHCS/FEVS surveys
do not identify individual respondents, it is not possible to track them over time in order to test a
model with lagged variables at the individual level of analysis. However, we were able to use
SEM with time lags by aggregating individual respondents to the sub-agency level of analysis
and estimating relationships among variables across three points in time. Doing this significantly
diminished the sample size from tens of thousands of observations in any given year of the
FHCS/FEVS to just several hundred observations, but it also reduced bias in estimating causal
effects. In addition, using multiple sources of data gathered at three points in time mitigates the
threat of common method, one that many public management studies—including those based on
FHCS/FEVS data—appear vulnerable to.
Another limitation of SEM is that it does not lend itself to controlling for many variables
other than the latent and observable ones. This is due to the statistical method’s complexity,
particularly the large number of equations in the measurement and structural models that are
estimated simultaneously. Adding just a few control variables can increase the complexity of
25
SEM to such an extent that it will not converge to produce a solution. This may be due to a
degrees of freedom problem if the sample size is not sufficient large or to insufficient covariance
information with which to generate valid estimates. In our SEM analysis, when predicting job
satisfaction, turnover intention and turnover behavior, we were unable to control for many
covariates of these outcome variables. We did control for some, including age and supervisory
level, and found that this had no meaningful influence on the results.
In addition, we compared our empirical results to those from studies that used
multivariate regression techniques and FHCS/FEVS data to estimate some of the very same
paths in our structural equation models. Fernandez and Moldogaziev (2012) used FHCS/FEVS
data to estimate the impact of employee empowerment on job satisfaction while controlling for a
host of other antecedents of job satisfaction, including having sufficient resources, using the
respondent’s talents well, the extent the task is viewed as significant, the amount of cooperation
at work, the physical working conditions, perceptions of fairness, workload, perceived
promotional opportunities, satisfaction with pay, the respondent’s age, the respondent’s minority
status, the respondent’s gender, and the respondent’s location at the agency headquarters. Their
results, like those from this study, show that employee empowerment positively impacts job
satisfaction, even when controlling for the influence of those other factors. Also, Pitts, Marvel
and Fernandez (2011) analyzed the effects of a range of antecedents of turnover intention using
FHCS/FEVS data. Their model included measures of job satisfaction as well as of satisfaction
with pay and benefits, satisfaction with promotional opportunities, age, tenure, race, and the
nature of relationships with coworkers and supervisors. Their results are consistent with ours,
showing job satisfaction negatively impacts turnover intention, even when controlling for many

26
other factors. In short, these additional results from multivariate analyses enhance the veracity of
the causal estimates obtained from SEM.
Finally, fit statistics and other evidence suggest that the measurement of the latent
variables in our models is acceptable but could be improved further. The measurement of
employee empowerment could be improved by developing additional indicators of the four
empowerment practice, particularly the practice of granting discretion to change work processes,
which was measured using only two indicators. Judge and Church (2000) suggest that using a
three-item scale like the one they developed can improve internal reliability above the level
achieved in this study using a two-item scale. Finally taking advantage of multi-item turnover
intention measures like that used by Konovsky and Cropanzano (1991) could improve the
validity and reliability of how that latent construct is measured.
27
Bibliography Anderson, S. E., Coffey, B. S. and Byerly, R. T. 2002. “Formal Organizational Initiatives and
Informal Workplace Practices: Links to Work-Family Conflict and Job-Related Outcomes.” Journal of Management, 28: 787-810.
Appleby, P. H. 1948. “A Reappraisal of Federal Employment as a Career.” Public
Administration Review, 8: 85-90. Arnold, H. J. and Feldman, D. C. 1982. “A Multivariate Analysis of the Determinants of Job Turnover.” Journal of Applied Psychology, 67: 350-360. Beauducel, A. and Herzberg, P. Y. 2006. “On the Performance of Maximum Likelihood Versus
Means and Variance Adjusted Weighted Least Squares Estimation in CFA.” Structural Equation Modeling: A Multidisciplinary Journal, 13: 186-203.
Bertelli, A. M. 2007. “Determinants of Bureaucratic Turnover Intention: Evidence from the
Department of the Treasury.” Journal of Public Administration Research and Theory, 17: 235-258.
Biddle, B. J. and Marlin, M. M. 1987. “Causality, Confirmation, Credulity, and Structural
Equation Modeling.” Child Development, 58: 4-17. Black, A. E. and Deci, E. L. 2000. “The Effects of Instructors Autonomy Support and Students’
Autonomy Motivation on Learning Organic Chemistry: A Self-Determination Theory Perspective.” Science Education, 84: 740–756.
Bluedorn, A. C. 1982. “A Unified Model of Turnover in Organizations.” Human Relations, 35:
135-153. Bollen, K. A. 1989. Structural Equations with Latent Variables. New York, NY: Wiley.
Boushey, H. and Glynn, S. J. 2012. “There are Significant Business Costs to Replacing Employees.” Washington, D.C.: Center for American Progress.
Bowen, D. E. and Lawler, E. E. 1992. "The Empowerment of Service Workers: What, Why,
How, and When." Sloan Management Review, 33: 31-39. Bowen, D. E. and Lawler, E. E. 1995. “Empowering Service Employees.” Sloan Management
Review, 36:73-84. Breul, J. D. and Kamensky, J. M. 2008. “Federal Government Reform: Lessons from Clinton’s
‘Reinventing Government’ and Bush’s ‘Management Agenda’ Initiatives.” Public Administration Review, 68: 1009-1026.
28
Browne, M. W. and Cudeck, R. 1993. “Alternative Ways of Assessing Model Fit.” In Bollen, K. A. and Long, J. S. (Eds.). Testing Structural Equation Models (pp. 136-162). Newbury Park, CA: Sage.
Carsten, J. M. and Spector, P. E. 1987. “Unemployment, Job Satisfaction, and Employee
Turnover: A Meta-Analytic Test of the Muchinsky Model.” Journal of Applied Psychology, 72: 374-381.
Cho, Y. J. and Lewis, G. B. 2012. “Turnover Intention and Turnover Behavior: Implications for
Retaining Federal Employees.” Review of Public Personnel Administration, 32: 4-23. Choi, S. 2011. “Organizational Justice and Employee Work Attitudes: The Federal Case.”
American Review of Public Administration, 41: 185-204. Davies, M., Laschinger, H. K. S. and Andrusyszyn, M. 2006. “Clinical Educators'
Empowerment, Job Tension, and Job Satisfaction: A Test of Kanter's Theory.” Journal for Nurses in Staff Development, 22: 78-86.
Deci, E. 1971. “Effects of Externally Mediated Rewards on Intrinsic Motivation.” Journal of
Personality and Social Psychology, 18: 105-115. Deci, E. L., Connell, J. P. and Ryan, R. M. 1989. “Self-Determination in a Work Organization.”
Journal of Applied Psychology, 74: 580-590. Deci, E. L. and Ryan, R. M. 1985. Intrinsic Motivation and Self-Determination in Human
Behavior. New York: Plenum. Deci, E. L. and Ryan, R. M. 1987. “The Support of Autonomy and the Control of Behavior.”
Journal of Personality and Social Psychology, 53: 1024-1037. Deci, E. L., Ryan, R. M., Gagne, M., Leone, D. R., Usunov, J. and Kornazheva, B. P. 2001.
“Need Satisfaction, Motivation, and Well-Being in the Work Organizations of a Former Eastern Bloc Country: A Cross Cultural Study of Self-Determination.” Personality and Social Psychology Bulletin, 27: 930-942.
Fernandez, S. and Moldogaziev, T. 2011. “Empowering Public Sector Employees to Improve
Performance: Does it Work?” American Review of Public Administration, 41: 23-47. Fernandez, S. and Moldogaziev, T. 2012. “Employee Empowerment, Self-Determination and
Job Satisfaction: An Empirical Analysis of Employee Empowerment Practices in the U.S. Federal Bureaucracy.” Paper presented at the Converging and Conflicting Trends in the Public Administration of the US, Europe, and Germany Conference, Speyer, Germany.
29
Fernandez, S. and Moldogaziev, T. 2013a. “Using Employee Empowerment to Encourage Innovative Behavior in the Public Sector. Journal of Public Administration Research and Theory, 23: 155-187.
Fernandez, S. and Moldogaziev, T. 2013b. “Employee Empowerment, Employee Attitudes and
Performance: Testing a Causal Model.” Public Administration Review, 73: 490-506. Fried, Y. and Ferris, G. R. 1987. “The Validity of the Job Characteristics Model: A Review and
Meta-Analysis.” Personnel Psychology, 40: 287-322. Fulford, M. D. and Enz, C. A. 1995. “The Impact of Empowerment on Service Employees.”
Journal of Managerial Issues, 7: 161-175. Gagne, M. and Deci, E. L. 2005. “Self-Determination Theory and Work Motivation.” Journal
of Organizational Behavior, 26: 331-362. Gagne, M. and Koestner, R. 2002. “Self-Determination Theory as a Framework for
Understanding Organizational Commitment.” Paper presented at the Annual Meeting of the Society for Industrial and Organizational Psychology, Ontario, Canada.
Gagne, M., Koestner, R. and Zuckerman, M. 2000. “Facilitating the Acceptance of
Organizational Change: The Importance of Self-Determination.” Journal of Applied Social Psychology, 30: 1843-1852.
Gollob, H. F. and Reichardt, C. S. 1987. “Taking Account of Time Lags in Causal
Models.” Child Development, 58: 80-92. Hackman, J. R. and Oldham, G. R. 1976. “Motivation through the Design of Work: Test of a
Theory.” Organizational Behavior and Human Performance, 16: 250-279. Hu, L. and Bentler, P. M. 1999. “Cutoff Criteria for Fit Indices in Covariance Structure
Analysis: Conventional Criteria Versus New Alternatives.” Structural Equation Modeling: A Multidisciplinary Journal, 6: 1-55.
Illardi, B. C., Leone, D., Kasser, T. and Ryan, R. M. 1993. “Employee and Supervisor Ratings
of Motivation: Main Effects and Discrepancies Associated with Job Satisfaction and Adjustment in a Factory Setting.” Journal of Applied Social Psychology, 23: 1789-1805.
Jaramillo, F., Mulki, J. P. and Solomon, P. 2006. “The Role of Ethical Climate on Salesperson's
Role Stress, Job Attitudes, Turnover Intention, and Job Performance.” Journal of Personal Selling and Sales Management, 26: 271-282.
Judge, T. A. and Church, A. H. 2000. “Job Satisfaction: Research and Practice.” In Cooper, C.
L. and Locke, E. A. (Eds.) Industrial and Organizational Psychology. Oxford: Blackwell.

30
Judge, T. A., Locke, E. A., and Durham, C. C. 1997. “The Dispositional Causes of Job Satisfaction: A Core Evaluations Approach.” Research in Organizational Behavior, 19, 151-188.
Kettl, D. F. 2005. The Global Public Management Revolution. Second Edition. Washington,
D. C.: Brookings. Kim, J. and Wiggins, M. E. 2011. “Family‐Friendly Human Resource Policy: Is It Still
Working in the Public Sector?” Public Administration Review, 71: 728-739. Kim, S. 2002. “Participative Management and Job Satisfaction: Lessons for Management
Leadership.” Public Administration Review, 62: 231-241. Kim, S. 2005. “Factors Affecting State Government Information Technology Employee
Turnover Intentions.” The American Review of Public Administration, 35: 137-156. Kinicki, A. J., McKee-Ryan, F. M., Schriesheim, C. A., and Carson, K. P. 2002. “Assessing the
Construct Validity of the Job Descriptive Index: A Review and Meta-Analysis.” Journal of Applied Psychology, 87: 14–32.
Kline, R. B. 2011. Principles and Practice of Structural Equation Modeling. Third Edition.
New York: Guilford Press. Lawler, E. E. III., Mohrman, S. A. and Ledford, G. E. 1995. Creating High Performance
Organizations: Impact of Employee Involvement and Total Quality Management. San Francisco: Jossey-Bass Publishers.
Lee, H., Cayer, N. J. and Lan, G. Z. 2006. “Changing Federal Government Employee Attitudes
since the Civil Service Reform Act of 1978.” Review of Public Personnel Administration, 26: 21-51.
Lee, T. W. and Mowday, R. T. 1987. “Voluntarily Leaving an Organization: An Empirical
Investigation of Steers and Mowday's Model of Turnover.” Academy of Management Journal, 30: 721-743.
Llorens, J. J. and Stazyk, E. C. 2011. “How Important Are Competitive Wages? Exploring the
Impact of Relative Wage Rates on Employee Turnover in State Government.” Review of Public Personnel Administration, 31: 111-127.
Losey, S. 2012. “Retirements Surge, New Hires Plummet.” Federal Times, October 15, 2012. MacCallum, R. C., Browne, M. W., and Sugawara, H. M. 1996. “Power Analysis and
Determination of Sample Size for Covariance Structure Modeling.” Psychological Bulletin, 1: 130-149.
31
Michaels, C. E and Spector, P. E. 1982. “Causes of Employee Turnover: A Test of the Mobley, Griffeth, Hand, and Meglino Model.” Journal of Applied Psychology, 67: 53-59.
Mobley, W. H. 1977. “Intermediate Linkages in the Relationship between Job Satisfaction and
Employee Turnover.” Journal of Applied Psychology, 62: 237-240. Muthén, L. K. and Muthén, B. O. 1998-2012. Mplus User’s Guide. 7th ed. Los Angeles, CA:
Muthén & Muthén. Park, S. M. and Rainey, H. G. 2008. “Leadership and Public Service Motivation in U.S. Federal
Agencies.” International Public Management Journal, 11: 109-142. Pitts, D., Marvel, J. and Fernandez, S. 2011. “So Hard to Say Goodbye? Turnover Intention
among U.S. Federal Employees.” Public Administration Review, 71: 751-760. Porter, L. W., Steers, R. M., Mowday, R. T. and Boulian, P. V. 1974. “Organizational
Commitment, Job Satisfaction, and Turnover among Psychiatric Technicians.” Journal of Applied Psychology, 59: 603-609.
Ryan, R. M. 1995. “Psychological Needs and the Facilitation of Integrative Processes.”
Journal of Personality, 63: 397-427. Ryan, R. M. and Deci, E. L. 2000. “Self-Determination Theory and the Facilitation of Intrinsic
Motivation, Social Development, and Well-Being.” American Psychologist, 55: 68-78. Ryan, R. M., Kuhl, J. and Deci, E. L. 1997. “Nature and Autonomy: An Organizational View of
Social and Neurobiological Aspects of Self-Regulation in Behavior and Development.” Development and Psychopathology, 9: 701-728.
Sarmiento, T. P., Laschinger, H. K. S. and Iwasiw, C. 2004. “Nurse Educators’ Workplace
Empowerment, Burnout, and Job Satisfaction: Testing Kanter's Theory.” Journal of Advanced Nursing, 46: 134–143.
Savery, L. K. and Luks, J. A. 2001. "The Relationship between Empowerment, Job Satisfaction
and Reported Stress Levels: Some Australian Evidence." Leadership and Organization Development Journal, 22: 97-104.
Seibert, S. E., Silver, S. R. and Randolph, W. A. 2004. “Taking Empowerment to the Next
Level: A Multiple-Level Model of Empowerment, Performance, and Satisfaction.” Academy of Management Journal, 47: 332-349.
Selden, S. C. and Moynihan, D. P. 2000. “A Model of Voluntary Turnover in State
Government.” Review of Public Personnel Administration, 20: 63-74.
32
Steers, R. M. and Mowday, R. T. 1981. “Employee Turnover and Post-Decision Accommodation Process.” Research in Organizational Behavior, 3: 235-281.
Spector, P. E. 1986. “Perceived Control by Employees: A Meta-Analysis of Studies Concerning
Autonomy and Participation at Work.” Human Relations, 11: 1005-1016. Tett, R. P, and Meyer, J. P. 1993. “Job Satisfaction, Organizational Commitment, Turnover
Intention, and Turnover: Path Analyses Based on Meta‐Analytic Findings.” Personnel Psychology, 46: 259-293.
United States Senate, Committee on Governmental Affairs. 2000a. Report to the President: The
Crisis in Human Capital. Report prepared by Senator Georgia V. Voinovich, Chairman of the Subcommittee on Oversight of Government Management, Restructuring, and the District of Columbia. Washington, D. C.
United States Merit Systems Protection Board. 1989. Who is Leaving the Federal Government?
An Analysis of Employee Turnover. Washington, D.C. United States Senate, Committee on Governmental Affairs. 2000b. Management Challenges
Facing the New Administration. Report of Senator Fred Thompson, Chairman of the Committee on Governmental Affairs. Washington, D. C.
Vansteenkiste, M., Neyrinck, B., Niemiec, C. P., Soenens, B., De Witte, H. and Van Den
Broeck, A. 2007. “On the Relations among Work Value Orientations, Psychological Need Satisfaction and Job Outcomes: A Self-Determination Theory Approach.” Journal of Occupational and Organizational Psychology, 80: 251-277.
Wright, B. E. and Kim, S. 2004. “Participation’s Influence on Job Satisfaction: The Importance
of Job Characteristics.” Review of Public Personnel Administration, 24: 18-40. Wu, V and Short, P. M. 1996. “The Relationship of Empowerment to Teacher Job Commitment
and Job Satisfaction.” Journal of Instructional Psychology, 23: 85-89.
33
Table 1. Descriptive Statistics and Correlation Matrix Mean SD 1 2 3 4 5 6 Individual Level 1. employee empowerment (2010) 3.48 0.83 1.00 2. job satisfaction (2010) 4.05 0.82 0.67 1.00 3. turnover intention (2010) 0.22 0.41 -0.36 -0.38 1.00 Sub-agency Level 1. employee empowerment (2006) 3.39 0.18 1.00 2. job satisfaction (2008) 3.95 0.12 0.61 1.00 3. turnover intention (2008) 0.27 0.08 -0.30 -0.40 1.00 4. turnover behavior (2009) 0.05 0.03 0.05 0.02 0.40 1.00 5. turnover behavior (2010) 0.05 0.04 0.08 0.00 0.36 0.58 1.00 6. turnover behavior (2011) 0.05 0.05 0.09 0.08 0.20 0.60 0.64 1.00 Note: employee empowerment and job satisfaction are measured using summated rating scales, and turnover intention and turnover behavior are measured using single items (see Appendix 1).
34
Table 2. Parameter Estimates for Individual Level Structural Equation Model (Model 1)
Parameter Unstandardized
Coefficient Standard Error
Standardized Coefficient
Factor loadings (latent variable → indicator)
employee empowerment → practice 1 1.00a 0.87*** employee empowerment → practice 2 1.01*** 0.00 0.81*** employee empowerment → practice 3 0.93*** 0.00 0.88*** employee empowerment → practice 4 1.11*** 0.00 0.90*** job satisfaction → job satisfaction 1 1.00a 1.03*** job satisfaction → job satisfaction 2 0.60*** 0.00 0.62*** turnover intention → turnover intention 1 1.00a 1.16*** Direct effects (latent variable → latent variable)
employee empowerment → job satisfaction
1.02*** 0.00 0.79***
job satisfaction → turnover intention -0.57*** 0.00 -0.50*** Measurement error variances practice 1 0.21*** 0.00 0.25*** practice 2 0.35*** 0.00 0.35*** practice 3 0.16*** 0.00 0.23*** practice 4 0.19*** 0.00 0.20*** Disturbance variances job satisfaction 0.40*** 0.00 0.38*** turnover intention 1.00a 0.75*** a The parameter is fixed and not tested. * p < .05, ** p < .01, *** p < .001.

35
Table 3. Fit Statistics for Individual and Sub-agency Level Structural Equation Models
Statistic Model 1 Model 2 Model 3 Model 4 χ2 5031.75 49.69 45.62 44.30 df 13 19 19 19 χ2/df 387.06 2.62 2.40 2.33 p 0.00 0.00 0.00 0.00 AICa -2799.55 -2512.43 -2506.02 BICa -2723.79 -2436.66 -2430.26 RMSEA 0.04 0.10 0.10 0.09 CFI 0.99 0.97 0.97 0.97 TLI 0.98 0.95 0.96 0.96 SRMRa 0.06 0.05 0.04 a The fit statistic is not provided when the WLSMV estimator is used in Mplus.
36
Figure 1. Results from Individual Level Structural Equation Model of Employee Empowerment, Job Satisfaction, and Turnover Intention (Model 1)
Note. Standardized coefficients are reported. * p < .05, ** p < .01, *** p < .001.
employee empowerment
(2010)
practice 1
job satisfaction (2010)
practice 2
practice 3
practice 4
job satisfaction 1 job satisfaction 2
0.87***
0.81***
0.88***
0.90***
0.79***
1.03*** 0.62***
-0.50*** turnover intention (2010)
turnover intention 1
1.16***
37
Figure 2. Results from Sub-agency Level Structural Equation Model of Employee Empowerment, Job Satisfaction, Turnover Intention, and Turnover Behavior (Model 2)
Note. Standardized coefficients are reported. a The factor loading is fixed and not tested. * p < .05, ** p < .01, *** p < .001.
employee empowerment
(2006)
practice 1
practice 2
practice 3
practice 4
0.89***
0.86***
0.95***
0.93***
0.62***
1.18***
job satisfaction (2008)
job satisfaction 1 job satisfaction 2
0.59***
turnover intention (2008)
turnover behavior (2009)
turnover intention 1 turnover rate
-0.49*** 0.52***
0.92*** 1.00a

38
Figure 3. Results from Sub-agency Level Structural Equation Model of Employee Empowerment, Job Satisfaction, Turnover Intention, and Turnover Behavior (Model 3)
Note. Standardized coefficients are reported. a The factor loading is fixed and not tested. * p < .05, ** p < .01, *** p < .001.
employee empowerment
(2006)
practice 1
practice 2
practice 3
practice 4
0.87***
0.86***
0.95***
0.93***
0.62***
1.18***
job satisfaction (2008)
job satisfaction 1 job satisfaction 2
0.59***
turnover intention (2008)
turnover behavior (2010)
turnover intent 1 turnover rate
-0.49*** 0.33***
0.92*** 1.00a

39
Figure 4. Results from Sub-agency Level Structural Equation Model of Employee Empowerment, Job Satisfaction, Turnover Intention, and Turnover Behavior (Model 4)
Note. Standardized coefficients are reported. a The factor loading is fixed and not tested. * p < .05, ** p < .01, *** p < .001.
employee empowerment
(2006)
practice 1
practice 2
practice 3
practice 4
0.89***
0.86***
0.95***
0.93***
0.62***
1.17***
job satisfaction (2008)
job satisfaction 1 job satisfaction 2
0.59***
turnover intention (2008)
turnover behavior (2011)
turnover intention 1 turnover rate
-0.50*** 0.12
0.92*** 1.00a

40
Appendix 1. Variables and Measures employee empowerment practice 1 (providing information about goals and performance)
Managers review and evaluate the organization's progress toward meeting its goals and objectives. (1 = strongly disagree to 5 = strongly agree)
Supervisors/team leaders provide employees with constructive suggestions to improve their job performance. (1 = strongly disagree to 5 = strongly agree)
How satisfied are you with the information you receive from management on what's going on in your organization? (1 = very dissatisfied to 5 = very satisfied)
practice 2 (offering rewards based on performance)
Promotions in my work unit are based on merit. (1 = strongly disagree to 5 = strongly agree)
Employees are rewarded for providing high quality products and services to customers. (1 = strongly disagree to 5 = strongly agree)
Pay raises depend on how well employees perform their jobs. (1 = strongly disagree to 5 = strongly agree)
Awards in my work unit depend on how well employees perform their jobs. (1 = strongly disagree to 5 = strongly agree)
practice 3 (providing access to job-related knowledge and skills)
I am given a real opportunity to improve my skills in my organization. (1 = strongly disagree to 5 = strongly agree)
The workforce has the job-relevant knowledge and skills necessary to accomplish organizational goals. (1 = strongly disagree to 5 = strongly agree)
Supervisors/team leaders in my work unit support employee development. (1 = strongly disagree to 5 = strongly agree)
practice 4 (granting discretion to change work processes)
Employees have a feeling of personal empowerment with respect to work processes. (1 = strongly disagree to 5 = strongly agree)
How satisfied are you with your involvement in decisions that affect your work? (1 = very dissatisfied to 5 = very satisfied)
job satisfaction job satisfaction 1
Considering everything, how satisfied are you with your job? (1 = very dissatisfied to 5 = very satisfied) job satisfaction 2 I like the kind of work I do. (1 = strongly disagree to 5 = strongly agree) turnover intention
Are you considering leaving your organization within the next year, and if so, why? (A = No; B = Yes, to retire; C = Yes, to take another job within the Federal Government; D = Yes, to take another job outside the Federal Government; E = Yes, other)

41
Notes
i A higher-order confirmatory factor analysis (CFA) was performed to assess the measurement of Bowen and Lawler’s four-dimensional empowerment construct using data from the 2010 FEVS. Multiple ordinal survey items shown in Appendix 1 were used to measure the four empowerment practices. In the four-factor model, each of the survey items loaded strongly and in the anticipated direction with the corresponding factor (i.e., empowerment practice) (p < 0.001). Those four factors, in turn, have very strong positive correlations with a second-order factor representing the underlying construct of employee empowerment (p < 0.001). The statistics for several goodness-of-fit indices support the four-factor model of empowerment. The statistics for the comparative fit index (CFI), which is minimally affected by sample size, is 0.94, indicating a good fit for the four-factor model (Fan, Thompson, and Wang, 1999). The Joreskog and Sorbom goodness-of-fit index of 0.93 also suggests a good model fit. The normed fit index (NFI) statistic of 0.94 and the root mean square error of approximation (RMSEA) of 0.09 both point to an acceptable fit for the four-factor model (Schumacker and Lomax, 2004). Complex models are more likely to generate better fit statistics than parsimonious ones. It is recommended, therefore, that models be subjected to goodness of fit measures that penalize for lack of parsimony. The model with a four-factor structure has parsimony ratio (PRATIO) and parsimony normed fit index (PNFI) statistics of 0.76 and 0.71, respectively, both of which are indicative of a reasonably parsimonious fit. It should be noted that the chi square test results reject the four-factor model (67,091, n = 154,793, 50 degrees of freedom) at the p < 0.01 level. Large sample sizes like the one used in this CFA are much more likely to result in Type II errors. Garson (2009) suggests, therefore, discounting the chi square results if other fit statistics support a model with such a large sample size. In contrast to the evidence favoring a four-factor model of employee empowerment, the higher-order CFA results reject a model with a one-factor structure. The CFI and NFI statistics for a one-factor model fail to reach the 0.90 cutoff point; both are only 0.89. And the RMSEA statistic (0.12) is above the conventional cutoff for even an adequate model fit (Schumacker and Lomax, 2004). In addition, a comparison of the four-factor and one-factor models, in terms of their Akaike information criterion (AIC) statistics, favors the former over the latter. The lower AIC statistic for the four-factor model (67,147.25) is considerably lower than the AIC statistic for the one-factor model (125,414.95), indicating a significantly better model fit (Burnham and Anderson, 2004; Long, 1997). Finally, the absolute value of the difference in chi-squares between the four-factor model (chi-square = 67,091, n = 154,793, 50 degrees of freedom) and one-factor model (chi-square = 125,367, n = 154,793, 54 degrees of freedom) is 58,276. This is indicative of a statistically significant difference (p < 0.001) in support of the four-factor model. According to Fornell and Larcker (1981), average variance explained (AVE) statistics greater than 0.50 are indicative of convergent validity. The four empowerment practices have AVEs between 0.74 and 0.96. Discriminant validity is assessed by comparing the square root of the AVE of an empowerment practice to the correlations between that practice and the remaining practices. A square root of an AVE greater than the correlations between an empowerment practice and the remaining practices is indicative of divergent validity. The results show that the square root of AVE is greater than all the relevant correlations for all four empowerment practices, with differences ranging from 0.24 to 0.12.