EMPLOYEE TURNOVER IN “IT” INDUSTRY WITH SPECIAL ...
18
ZENITH International Journal of Multidisciplinary Research Vol.2 Issue 7, July 2012, ISSN 2231 5780 www.zenithresearch.org.in 160 EMPLOYEE TURNOVER IN “IT” INDUSTRY WITH SPECIAL REFERENCE TO CHENNAI CITY-AN EXPLORATORY STUDY MRS. E. DEEPA*; MRS. M. STELLA** *Assistant Professor, Vivekanandha College of Engineering for Women, Elayapalayam,Tiruchengode, Tamilnadu. **Assistant Professor, Vivekanandha College of Engineering for Women, Elayapalayam,Tiruchengode, Tamilnadu. ABSTRACT The research paper entitled EMPLOYEE TURNOVER IN IT INDUSTRY WITH SPECIAL REFERENCE TO CHENNAI CITY-AN EXPLORATORY STUDY. The objective of this article is to find the level of job satisfaction, safety measures, retaining the employees, working conditions & work load and its reason for Employees Turnover in IT Industries. The employee turnover springs up as a vital issue in IT businesses. The researchers had taken 250 respondents as their sample size from universe and descriptive research design was adopted. This research study uses various methods to analyze the reasons and causes for employee turnover in IT businesses. The tools used are Chi-square analysis, weighted average method, T-test and F-test. Based on the analysis and interpretation, it is inferred that the IT Industry has to implement the Retention Plan by compensation Policies, Changes in work Requirements & improvement in working conditions. KEYWORDS: Level of job satisfaction, safety measures, retaining the employees, Working conditions & work load. ______________________________________________________________________________ INTRODUCTION EMPLOYEE TURNOVER Employee turnover is a ratio comparison of the number of employees a company must replace in a given time period to the average number of total employees. A huge concern to most companies, employee turnover is a costly expense especially in lower paying job roles, for which the employee turnover rate is highest. Many factors play a role in the employee turnover rate of any company, and these can stem from both the employer and the employees. Wages, company benefits, employee attendance, and job performance are all factors that play a significant role in employee turnover.
-
Upload
khangminh22 -
Category
Documents
-
view
2 -
download
0
Transcript of EMPLOYEE TURNOVER IN “IT” INDUSTRY WITH SPECIAL ...

ZENITH
International Journal of Multidisciplinary Research
Vol.2 Issue 7, July 2012, ISSN 2231 5780
ww
w.z
enit
hre
sear
ch.o
rg.in
1
60
EMPLOYEE TURNOVER IN “IT” INDUSTRY WITH SPECIAL
REFERENCE TO CHENNAI CITY-AN EXPLORATORY STUDY
MRS. E. DEEPA*; MRS. M. STELLA**
*Assistant Professor,
Vivekanandha College of Engineering for Women,
Elayapalayam,Tiruchengode,
Tamilnadu.
**Assistant Professor,
Vivekanandha College of Engineering for Women,
Elayapalayam,Tiruchengode,
Tamilnadu.
ABSTRACT
The research paper entitled EMPLOYEE TURNOVER IN IT INDUSTRY WITH
SPECIAL REFERENCE TO CHENNAI CITY-AN EXPLORATORY STUDY. The
objective of this article is to find the level of job satisfaction, safety measures, retaining the
employees, working conditions & work load and its reason for Employees Turnover in IT
Industries. The employee turnover springs up as a vital issue in IT businesses. The
researchers had taken 250 respondents as their sample size from universe and descriptive
research design was adopted. This research study uses various methods to analyze the
reasons and causes for employee turnover in IT businesses. The tools used are Chi-square
analysis, weighted average method, T-test and F-test. Based on the analysis and
interpretation, it is inferred that the IT Industry has to implement the Retention Plan by
compensation Policies, Changes in work Requirements & improvement in working
conditions.
KEYWORDS: Level of job satisfaction, safety measures, retaining the employees,
Working conditions & work load.
______________________________________________________________________________
INTRODUCTION
EMPLOYEE TURNOVER
Employee turnover is a ratio comparison of the number of employees a company must
replace in a given time period to the average number of total employees. A huge concern to
most companies, employee turnover is a costly expense especially in lower paying job roles,
for which the employee turnover rate is highest. Many factors play a role in the employee
turnover rate of any company, and these can stem from both the employer and the
employees. Wages, company benefits, employee attendance, and job performance are all
factors that play a significant role in employee turnover.

ZENITH
International Journal of Multidisciplinary Research
Vol.2 Issue 7, July 2012, ISSN 2231 5780
ww
w.z
enit
hre
sear
ch.o
rg.in
1
61
CAUSES OF TURNOVER
There are a number of factors that contribute to employee turnover. We explore
some of these factors in more detail below.
1. THE ECONOMY: Some minimum wage workers report leaving one job for
another that pays only 50 cents an hour more. Obviously, in a better economy the
availability of alternative jobs plays a role in turnover, but this tends to be
overstated in exit interviews.
2. THE PERFORMANCE OF THE ORGANIZATION - an organization perceived
to be in economic difficulty will also raise the specter of impending layoffs.
Workers believe that it is rational to seek other employment.
3. THE ORGANIZATIONAL CULTURE - much has been written about
organizational culture. It is sufficient to note here that the reward system, the
strength of leadership, the ability of the organizations to elicit a sense of
commitment on the part of workers, and its development of a sense of shared
goals, among other factors, will influence such indices of job satisfaction as
turnover intentions and turnover rate.
4. THE CHARACTERISTICS OF THE JOB - some jobs are intrinsically more
attractive than others. A job's attractiveness will be affected by many
characteristics, including its repetitiveness, challenge, danger, perceived
importance, and capacity to elicit a sense of accomplishment. A job's status is
also important, as are many other factors.
5. UNREALISTIC EXPECTATIONS - Another factor is the unrealistic
expectations and general lack of knowledge that many job applicants has about
the job at the time that they receive an offer. When these unrealistic expectations
are not realized, the worker becomes disillusioned and decides to quit.
6. DEMOGRAPHICS - empirical studies have demonstrated that turnover is
associated in particular situations with demographic and biographical
characteristics of workers. But to use lifestyle factors (e.g. smoking) or past
employment history (e.g. many job changes) as an explicit basis for screening
applicants, it is important for legality and fairness to job applicants to verify such
bio-data empirically.
7. THE PERSON - These include both personal and trait-based factors. Personal
factors include things such as changes in family situation, a desire to learn a new
skill or trade, or an unsolicited job offer. These traits are some of the same
characteristics that predict job performance and counterproductive behaviors
such as loafing, absenteeism, theft, substance abuse on the job, and sabotage of
employer's equipment or production. These traits can be measured and used in
employee screening to identify individuals showing lower probability of turnover.

ZENITH
International Journal of Multidisciplinary Research
Vol.2 Issue 7, July 2012, ISSN 2231 5780
ww
w.z
enit
hre
sear
ch.o
rg.in
1
62
ABOUT THE INDUSTRY
THE INDIAN IT INDUSTRY
The Information Technology (IT) sector in India holds the distinction of advancing
the country into the new-age economy. The growth momentum attained by the overall
economy since the late 1990s to a great extent can be owed to the IT sector, well supported
by a liberalized policy regime with reduction in telecommunication cost and import duties
on hardware and software. Perceptible is the transformation since liberalization – India
today is the world leader in information technology and business outsourcing.
Correspondingly, the industry’s contribution to India’s GDP has grown significantly from
1.2% in 1999-2000 to around 4.8% in FY06, and has been estimated to cross 5% in FY07.
The sector has been growing at an annual rate of 28% per annum since FY01.
EMERGING TRENDS IN THE INDIAN IT SERVICES INDUSTRY
While the global IT players are aggressively scaling up their operations in India,
due to the advantages that the Indian industry offers, the Indian IT companies are also
preparing to tap the global market. The companies are witnessing significant change with
regard to their service offerings and geographical concentration. Today, companies are
expanding their service offerings from application development and maintenance to high
end services like testing, consulting and engineering designing. The global delivery model
has not only facilitated the companies in delivering quality of work but also helped them to
control costs.
Presently, the Indian IT companies are on a hiring spree which indicates their
bullishness on their order flows. All the major players have increased their manpower by
15-50%, and the trend is expected to continue further. As a result, the companies are
expected to scale up their operations. The Indian IT companies are also vying for inorganic
growth, with a quest for newer geographical areas, service offerings, domain expertise,
customers and markets
REVIEW OF LITERATURE
Price & Muller (1981) observed that job dissatisfaction influenced actual turnover
indirectly through its direct effect on turnover intention. The variables that affect
job satisfaction are pay, promotion opportunities, immediate supervisor, fringe
benefits, contingent rewards, rules and procedures, relation with co-workers, type of
work done, and communication within the organization.
Williams and Hazer (1986) has differentiated between job satisfaction and
commitment by explaining the former as an emotional reaction to specific aspects of
job and the latter as an emotional reaction to the whole organization. Both the

ZENITH
International Journal of Multidisciplinary Research
Vol.2 Issue 7, July 2012, ISSN 2231 5780
ww
w.z
enit
hre
sear
ch.o
rg.in
1
63
individual factors as well as the organizational factors influence organizational
commitment which eventually influences turnover intentions amongst employees.
Costly et al. (1987) points out that a high labour turnover may mean poor personnel
policies, poor recruitment policies, poor supervisory practices, poor grievance
procedures, or lack of motivation. All these factors contribute to high employee
turnover in the sense that there is no proper management practices and policies on
personnel matters hence employees are not recruited scientifically, promotions of
employees are not based on spelled out policies, no grievance procedures in place
and thus employees decides to quit.
Magner et al. (1996) argues that employees feel comfortable to stay longer, in
positions where they are involved in some level of the decision-making process. That
is employees should fully understand about issues that affect their working
atmosphere.
Labov, (1997) has highlighted that employees have a strong need to be informed.
Organisation with strong communication systems enjoyed lower turnover of staff.
Mobley (1977) first proposed a model explaining the relationship between job
satisfaction and thoughts of quitting which, ultimately led to actual turnover.
Trevor (2001) argues that local unemployment rates interact with job satisfaction to
predict turnover in the market. Role stressors also lead to employees’ turnover. Role
ambiguity refers to the difference between what people expect of us on the job and
what we feel we should do. This causes uncertainty about what our role should be. It
can be a result of misunderstanding what is expected, how to meet the expectations,
or the employee thinking the job should be different.
Manu et al. (2004) argue that employees quit from organization due economic
reasons. Using economic model they showed that people quit from organization due
to economic reasons and these can be used to predict the labour turnover in the
market.
Loi et al. (2006) has indicated contrary to be true, that is, there existed negative
relationship between turnover intention and both procedural and distributional
justice.
Elanain Abu, (2010) the study disclosed that the perception of organizational justice
had an influence on work outcomes. A low degree of turnover intention was
observed on employees who showed positive feelings towards procedural and
distributive justice.
OBJECTIVES OF THE STUDY
A study on employee turnover in IT industry with special reference to Chennai city.
ZENITH
International Journal of Multidisciplinary Research
Vol.2 Issue 7, July 2012, ISSN 2231 5780
ww
w.z
enit
hre
sear
ch.o
rg.in
1
64
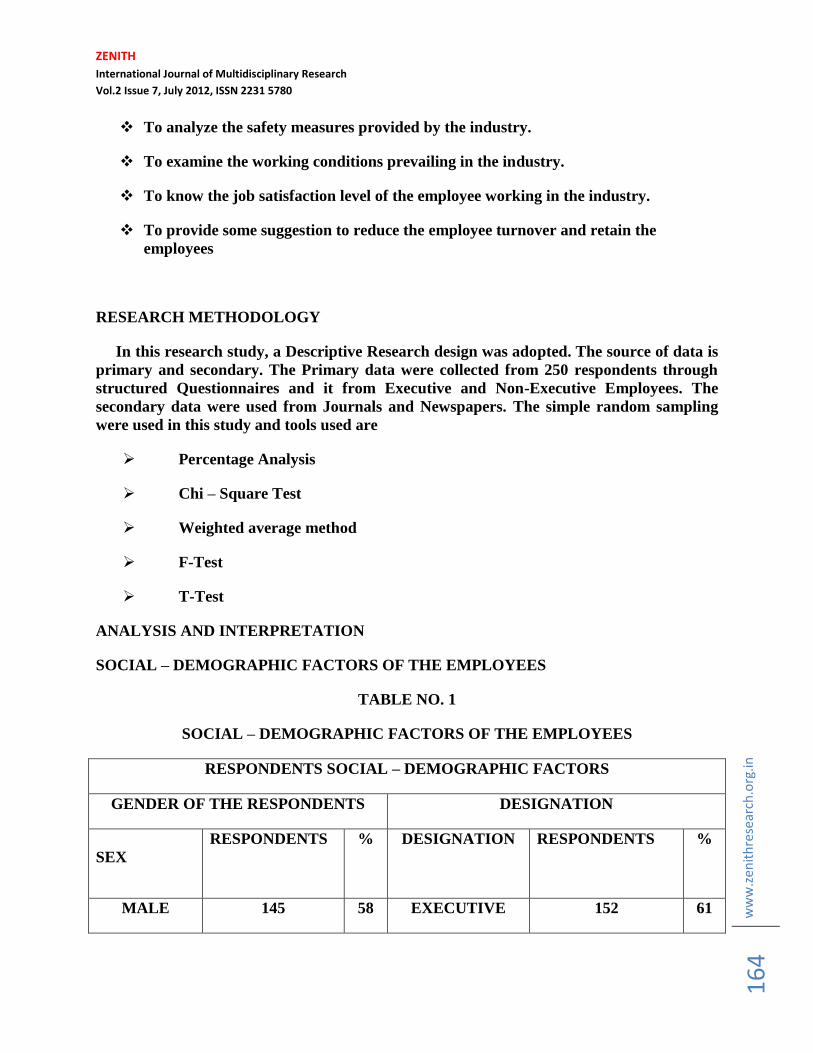
To analyze the safety measures provided by the industry.
To examine the working conditions prevailing in the industry.
To know the job satisfaction level of the employee working in the industry.
To provide some suggestion to reduce the employee turnover and retain the
employees
RESEARCH METHODOLOGY
In this research study, a Descriptive Research design was adopted. The source of data is
primary and secondary. The Primary data were collected from 250 respondents through
structured Questionnaires and it from Executive and Non-Executive Employees. The
secondary data were used from Journals and Newspapers. The simple random sampling
were used in this study and tools used are
Percentage Analysis
Chi – Square Test
Weighted average method
F-Test
T-Test
ANALYSIS AND INTERPRETATION
SOCIAL – DEMOGRAPHIC FACTORS OF THE EMPLOYEES
TABLE NO. 1
SOCIAL – DEMOGRAPHIC FACTORS OF THE EMPLOYEES
RESPONDENTS SOCIAL – DEMOGRAPHIC FACTORS
GENDER OF THE RESPONDENTS DESIGNATION
SEX
RESPONDENTS
% DESIGNATION RESPONDENTS
%
MALE 145 58 EXECUTIVE 152 61

ZENITH
International Journal of Multidisciplinary Research
Vol.2 Issue 7, July 2012, ISSN 2231 5780
ww
w.z
enit
hre
sear
ch.o
rg.in
1
65
FEMALE 105 42 NON-
EXECUTIVE
98 39
TOTAL 250 100 TOTAL 250 100
AGE OF THE RESPONDENTS YEARS OF SERVICE
AGE RESPONDENTS
% YEARS OF
SERVICE
RESPONDENTS
%
LESS THAN
20 YEARS
63 25 LESS THAN
5YEARS
96 38
20-30 YEARS 87 35 5-10YEARS 75 30
30-40YEARS 67 27 10-15 YEARS 45 18
ABOVE 40
YEARS
33 13 ABOVE10YEARS 34 14
TOTAL 250 100 TOTAL 250 100
MONTHLY INCOME OF
EMPLOYEES QUALIFICATION
MONTHLY
INCOME(IN
Rs)
RESPONDENTS
% QUALIFICATION RESPONDENTS
%
BELOW
5000
76 30 H.Sc 32 13
5001-10000 82 33 DIPLOMA 64 26
10001-15000 45 18 U.G 86 34
15001-20000 37 15 P.G 45 18
ABOVE
20000
10 4 Above P.G 23 9
TOTAL 250 100 TOTAL 250 100
(Source: Primary data from survey)
INFERENCE

ZENITH
International Journal of Multidisciplinary Research
Vol.2 Issue 7, July 2012, ISSN 2231 5780
ww
w.z
enit
hre
sear
ch.o
rg.in
1
66
The above table reveals the demographic factors in the study. The majority of
respondents are male i.e., 58%, the maximum respondents belong to the age group 20-30
years i.e., 35%, and the majority of respondents belongs to executive level i.e., 61% and the
majority of respondents experience is below 5 years and the monthly income earned by
majority of respondents belongs to above 10,000 i.e., 33% and the majority of the
respondents qualification belongs to undergraduate i.e., 34%.
CHI SQUARE ANALYSIS OF SALARY AND JOB SATISFACTION LEVEL
TABLE NO. 2
SALARY AND JOB SATISFACTION LEVEL
Job
satisfaction
Salary
Highly
satisfied
Satisfied Neutral Dissatisfied Highly
dissatisfied
Total
Highly
satisfied
65 42 33 15 0 155
Satisfied 0 0 0 50 0 50
Neutral 0 0 0 0 28 28
Dissatisfied 0 0 0 0 11 11
Highly
dissatisfied
0 0 0 0 6 6
Total
65 42 33 65 45 250
(Source: Primary data from survey)
CALCULATION OF CHI-SQUARE ANALYSIS
40.3 26.0
4
20.4
6
40.3 27.9
13 8.4 6.6 13 9
7.3 4.7 3.7 7.3 5.0
2.9 1.8 1.5 2.9 1.9
1.5 1.0 0.7 1.5 1.0

ZENITH
International Journal of Multidisciplinary Research
Vol.2 Issue 7, July 2012, ISSN 2231 5780
ww
w.z
enit
hre
sear
ch.o
rg.in
1
67
NULL HYPOTHESIS (H0)
There is no significant difference between salary and job satisfaction level.
ALTERNATIVE HYPOTHESIS (H1)
There is significant difference between salary and job satisfaction level.
Degree of freedom At the 5 percent level
(r - 1) (c - 1) Table value = 7.962
(5 - 1) (5 - 1) Calculated value = 210.7
4 * 4 = 16
CHI – SQUARE TEST TABLE
Factor Level of
significance
Degree of
freedom
Table
value
Calculated
value Result
Relationship between salary
and level of satisfaction with
training
0.05 16 7.962 210.7 Rejected
INFERENCE
The calculated value of chi-square (210.7) is greater than the table value (7.962), the
null hypothesis is rejected.
CHI SQUARE ANALYSIS OF WORKLOAD AND JOB SATISFACTION LEVEL
TABLE NO.3
WORKLOAD AND JOB SATISFACTION LEVEL
Job
satisfaction
Work Load
Highly
satisfied
Satisfied Neutral Dissatisfied Highly
dissatisfied
Total

ZENITH
International Journal of Multidisciplinary Research
Vol.2 Issue 7, July 2012, ISSN 2231 5780
ww
w.z
enit
hre
sear
ch.o
rg.in
1
68
Highly
satisfied
73 31 26 0 0 130
Satisfied 0 0 16 32 0 48
Neutral 0 0 0 25 0 25
Dissatisfied 0 0 0 16 0 16
Highly
dissatisfied
0 0 0 10 21 31
Total
73 31 42 83 21 250
(Source: Primary data from survey)
CALCULATION OF CHI-SQUARE ANALYSIS
NULL HYPOTHESIS (H0)
There is no significant difference between workload and job satisfaction level
ALTERNATIVE HYPOTHESIS (H1)
There is significant difference between workload and job satisfaction level.
Degree of freedom At the 5 percent level
(r - 1) (c - 1) Table value = 7.962
(5 - 1) (5 - 1) Calculated value = 241.9
4 * 4 = 16
CHI – SQUARE TEST TABLE
Factor Level of
significance
Degree of
freedom
Table
value
Calculated
value Result
37.9 16.1 21.8 43.1 10.9
14.0 5.9 8.0 15.9 4.0
7.3 3.1 4.2 8.3 2.1
4.6 1.9 2.6 5.3 1.3
9.0 3.8 5.2 10.2 2.6

ZENITH
International Journal of Multidisciplinary Research
Vol.2 Issue 7, July 2012, ISSN 2231 5780
ww
w.z
enit
hre
sear
ch.o
rg.in
1
69
Relationship between
workload and level of
satisfaction with training
0.05 16 7.962 241.9 Rejected
INFERENCE
The calculated value of chi-square (241.9) is greater than the table value (7.962), the
null hypothesis is rejected.
REASONS FOR LEAVING THE ORGANIZATION USING WEIGHTED AVERAGE
METHOD
TABLE NO. 4
REASONS FOR LEAVING THE ORGANIZATION USING WEIGHTED AVERAGE
METHOD
S.NO FACTORS X W XW XW/∑W RANK
1 Nature of the job
93 5 465 31 1
2 Problems with
management
15 4 60 4 4
3 Maternity
75 3 225 15 2
4 Relocation to another
area
35 2 70 4.66 3
5 Others
32 1 32 2.13 5
TOTAL 250 15 852 56.8

ZENITH
International Journal of Multidisciplinary Research
Vol.2 Issue 7, July 2012, ISSN 2231 5780
ww
w.z
enit
hre
sear
ch.o
rg.in
1
70
INFERENCE
The above table indicates the various reasons for leaving the organization.
According to the opinion given by the respondents, the Employee Turnover is due to nature
of job.
WORK LOAD AND WORKING CONDITION OF EMPLOYEES
TABLE NO: 5
T-TEST
COMPARISON BETWEEN WORK LOAD AND WORKING CONDITION OF
EMPLOYEES
WORKLOAD AND WORKING
CONDITION
FREQUENCY FREQUENCY
HIGHLY SATISFIED 73 33
SATISFIED 52 37
NEUTRAL 45 56
DISSATISFIED 39 72
HIGHLY DISSATISFIED 41 52
TOTAL 250 250
MEAN 50 50
STANDARD DEVIATION 13.78 15.67

ZENITH
International Journal of Multidisciplinary Research
Vol.2 Issue 7, July 2012, ISSN 2231 5780
ww
w.z
enit
hre
sear
ch.o
rg.in
1
71
STANDARD ERROR 6.16 7.01
UNPAIRED T TEST RESULTS
P VALUE AND STATISTICAL SIGNIFICANCE
The two-tailed P value equals 1.0000
By conventional criteria; this difference is considered to be not statistically
significant.
CONFIDENCE INTERVAL
The mean of Group One minus Group Two equals 0.00
95% confidence interval of this difference: From -21.52 to 21.52
INTERMEDIATE VALUES USED IN CALCULATIONS
t = 0.0000
df = 8
standard error of difference = 9.333
INFERENCE
The comparison between the working condition of employees’ in the organization
and the work load of employees reveals that the result of the t test is not significant to each
other. Hence the work load and working condition does not coincide.
HEALTH & SAFETY MEASURES AND WORKING ENVIRONMENT
TABLE NO. 6
T-TEST
COMPARISON BETWEEN HEALTH & SAFETY MEASURES AND WORKING
ENVIRONMENT
HEALTH & SAFETY MEASURES AND
WORK ENVIRONMENT
FREQUENCY FREQUENCY
HIGHLY SATISFIED 47 33

ZENITH
International Journal of Multidisciplinary Research
Vol.2 Issue 7, July 2012, ISSN 2231 5780
ww
w.z
enit
hre
sear
ch.o
rg.in
1
72
SATISFIED 43 37
NEUTRAL 52 56
DISSATISFIED 49 72
HIGHLY DISSATISFIED 59 52
TOTAL 250 250
MEAN 50 50
STANDARD DEVIATION 15.67 6
STANDARD ERROR 7.01 2.68
UNPAIRED T TEST RESULTS
P VALUE AND STATISTICAL SIGNIFICANCE
The two-tailed P value equals 1.0000
By conventional criteria; this difference is considered to be not statistically significant.
CONFIDENCE INTERVAL
The mean of Group One minus Group Two equals 0.00
95% confidence interval of this difference: From -17.30 to 17.30
INTERMEDIATE VALUES USED IN CALCULATIONS
t = 0.0000
df = 8
standard error of difference = 7.503
INFERENCE
The comparison between the working environment and the health & safety
measures provided to the employees reveals that the result of the t test is not significant to
each other. Hence the work environment has no significance over safety measures.
TRAINING PROGRAM AND EMPLOYEE TURNOVER REASONS

ZENITH
International Journal of Multidisciplinary Research
Vol.2 Issue 7, July 2012, ISSN 2231 5780
ww
w.z
enit
hre
sear
ch.o
rg.in
1
73
TABLE NO. 7
F TEST
COMPARISON BETWEEN TRAINING PROGRAM AND EMPLOYEE TURNOVER
REASONS
TRAINING
PROGRAM
FREQUENCY REASON FREQUENCY
HIGHLY SATISFIED 82 NATURE OF THE
JOB
93
SATISFIED 75 PROBLEM WITH
MANAGEMENT
15
NEUTRAL 67 MATERNITY 75
DISSATISFIED 15 RELOCATION TO
ANOTHER AREA
35
HIGHLY
DISSATISFIED
11 OTHERS 32
TOTAL 250 TOTAL 250
RESULT
F statistics 1.1026
degrees of freedom 4 | 4
two-tailed p-value 0.9268
95% confidence intervals
upper 10.5903
lower 0.1148
INFERENCE

ZENITH
International Journal of Multidisciplinary Research
Vol.2 Issue 7, July 2012, ISSN 2231 5780
ww
w.z
enit
hre
sear
ch.o
rg.in
1
74
The relationship between training program provided to employees and the reasons
for leaving the organization by employees analyzed using f test reveals that both has an
equal variation.
COWORKERS RELATIONSHIP AND TOP MANAGEMENT PERSONNEL
TABLE NO. 8
F-TEST
COMPARISON BETWEEN COWORKERS RELATIONSHIP AND TOP
MANAGEMENT PERSONNEL
RELATIONSHIP WITH
COWORKERS AND TOP MANAGEMENT
FREQUENCY FREQUENCY
GOOD 135 126
AVERAGE 95 86
POOR 20 38
TOTAL 250 250
RESULT
F statistic 1.7557
degrees of freedom 2 | 2

ZENITH
International Journal of Multidisciplinary Research
Vol.2 Issue 7, July 2012, ISSN 2231 5780
ww
w.z
enit
hre
sear
ch.o
rg.in
1
75
two-tailed p-value 0.7258
95% confidence intervals
upper 68.471
lower 0.045
INFERENCE
The relationship between the co-workers relationship and top management
personnel was analyzed using f test reveals that both had an equal variation. This states
that both the samples are equal variant among themselves.
FINDINGS
The demographic factors in the study reveals that the major respondents are male 58%,
the maximum respondents belong to the age group 20-30 years i.e., 35%, and the
majority of respondents belongs to executive level i.e., 61% and the majority of
respondents experience is below 5 years and the monthly income earned by majority of
respondents belongs to above 10,000 i.e., 33% and the majority of the respondents
qualification belongs to undergraduate i.e., 34% .
Chi square reveals that there is a significant relationship between salary and level of
satisfaction with job.
The comparison between the working condition of employees’ in the organization and
the work load of employees reveals that the result of the t test is not significant to each
other. Hence the work load and working condition does not coincide.
The comparison between the working environment and the health & safety measures
provided to the employees reveals that the result of the t test is not significant to each
other. Hence the work environment has no significance over safety measures.
The relationship between training program provided to employees and the reasons for
leaving the organization by employees analyzed using f test reveals that both has an
equal variation.
The relationship between the co-workers relationship and top management personnel
was analyzed using f test reveals that both had an equal variation. This states that both
the samples are equal variant among themselves
SUGGESTIONS

ZENITH
International Journal of Multidisciplinary Research
Vol.2 Issue 7, July 2012, ISSN 2231 5780
ww
w.z
enit
hre
sear
ch.o
rg.in
1
76
Create a rotational schedule for roles with sets of tasks that cycle 2 or 3 times a year.
Encourage employee pride by offering innovative programs that demonstrate that
they are important to the success of the company or organization.
Demonstrate respect for employees at all times.
At the same time, don't neglect to hire people with the innate talent, ability, and
smarts to work in almost any position even if you don't currently have the "best"
match available. Hire the smartest people you can find to reduce employee turnover.
CONCLUSION
The researcher has attempted to study some of the factors which may be the
possible reasons for an employee to leave the organization. This research will help the
organization to make the necessary measures to retain the employees. This will certainly
bring down the causes for employee turnover and helps the management to reduce the
employee turnover level.To reduce the employee turnover rate the company has to
concentrate more on working condition and Safety measures. So it leads the organization
to retain their employees.
BIBLIOGRAPHY
JOURNALS
Williams, L.J., Hazer, J.T. (1986), "Antecedents and consequences of satisfaction
and commitment in turnover models: a re-analysis using latent variable structural
equation methods", Journal of Applied Psychology, Vol. 72 No.1, pp.219-31.
Price, J. & Muller, C. (1981). A casual model of turnover of nurses. Academy of
Management Journal, 24(3), 543-565.
Mobley, W.H. (1977). Intermediate linkages in the relationship between job
satisfaction and employee turnover. Journal of Applied Psychology, 62, 237-240.
Elanain Abu, M.H. (2010). Testing the direct and indirect relationship between
organizational justice and work outcomes in a non-western context of the UAE.
Journal of Management Development, 29 (1), 05-27.
Simon Booth, Kristian Hamer (2007). “Labour turnover in the retail industry” the
Inte. J. Retail distribution manage. 35 (4): 289-307
Zuber A (2001). "A career in food service cons: high turnover", Nations Restaurant
News, 35 (21):147-148.

ZENITH
International Journal of Multidisciplinary Research
Vol.2 Issue 7, July 2012, ISSN 2231 5780
ww
w.z
enit
hre
sear
ch.o
rg.in
1
77
Morrell K, Loan-Clarke J, Wilkinson A (2001). "Unweaving leaving: the use of
models in the management of employee turnover", Int. J. Manage. Rev. 3 (3): 219-
144.
Catherine M Gustafson (2002). “staff turnover: Retention”. International j.
contemp. Hosp. manage. 14 (3) : 106-110.
Maertz CP, Griffeth RW (2004). Eight Motivational Forces and Voluntary
Turnover: A Theoretical Synthesis with Implications for Research. J. Manage.,
30(5): 667-683.
Zhang M (2004). The positive research on the employees’ dynamic turnover model
in IT industry of China. Unpublished Master paper, Xi'an Jiaotong University.
BOOKS
M. Ganagadhar Rao, V.S.P.Rao, Human Resource Management, P.S Narayana
organizational Ltd, 2nd
edition
Kitab Mahal, Research Methodology, 1st edition.
Fisher Schoenfelt Shaw (1997), Human Resource Management, Houghton Mifflin
Company, New Jersey, 3rd
edition.
Kothari C.R., Research Methodology, New Delhi, Vishwa Prakashan, 2006.
WEBSITES
www.ezinearticles.com
www.abcarticledirectory.com
www.citehr.com