Job Satisfaction and Employee Turnover Determinants in High ...
63
This is a repository copy of Job Satisfaction and Employee Turnover Determinants in High Contact Services: Insights from Employees’Online Reviews. White Rose Research Online URL for this paper: https://eprints.whiterose.ac.uk/146147/ Version: Accepted Version Article: Stamolampros, P orcid.org/0000-0001-8143-7244, Korfiatis, N, Chalvatzis, K et al. (1 more author) (2019) Job Satisfaction and Employee Turnover Determinants in High Contact Services: Insights from Employees’Online Reviews. Tourism Management, 75. pp. 130- 147. ISSN 0261-5177 https://doi.org/10.1016/j.tourman.2019.04.030 © 2019, Elsevier. This manuscript version is made available under the CC-BY-NC-ND 4.0 license http://creativecommons.org/licenses/by-nc-nd/4.0/. [email protected] https://eprints.whiterose.ac.uk/ Reuse This article is distributed under the terms of the Creative Commons Attribution-NonCommercial-NoDerivs (CC BY-NC-ND) licence. This licence only allows you to download this work and share it with others as long as you credit the authors, but you can’t change the article in any way or use it commercially. More information and the full terms of the licence here: https://creativecommons.org/licenses/ Takedown If you consider content in White Rose Research Online to be in breach of UK law, please notify us by emailing [email protected] including the URL of the record and the reason for the withdrawal request.
-
Upload
khangminh22 -
Category
Documents
-
view
4 -
download
0
Transcript of Job Satisfaction and Employee Turnover Determinants in High ...

This is a repository copy of Job Satisfaction and Employee Turnover Determinants in High Contact Services: Insights from Employees’Online Reviews.
White Rose Research Online URL for this paper:https://eprints.whiterose.ac.uk/146147/
Version: Accepted Version
Article:
Stamolampros, P orcid.org/0000-0001-8143-7244, Korfiatis, N, Chalvatzis, K et al. (1 moreauthor) (2019) Job Satisfaction and Employee Turnover Determinants in High Contact Services: Insights from Employees’Online Reviews. Tourism Management, 75. pp. 130-147. ISSN 0261-5177
https://doi.org/10.1016/j.tourman.2019.04.030
© 2019, Elsevier. This manuscript version is made available under the CC-BY-NC-ND 4.0 license http://creativecommons.org/licenses/by-nc-nd/4.0/.
[email protected]://eprints.whiterose.ac.uk/
Reuse
This article is distributed under the terms of the Creative Commons Attribution-NonCommercial-NoDerivs (CC BY-NC-ND) licence. This licence only allows you to download this work and share it with others as long as you credit the authors, but you can’t change the article in any way or use it commercially. More information and the full terms of the licence here: https://creativecommons.org/licenses/
Takedown
If you consider content in White Rose Research Online to be in breach of UK law, please notify us by emailing [email protected] including the URL of the record and the reason for the withdrawal request.

1
Job Satisfaction and Employee Turnover
Determinants in High Contact Services: Insights from
Employees’Online Reviews
Panagiotis Stamolampros1*, Nikolaos Korfiatis2, Konstantinos
Chalvatzis2, Dimitrios Bouhalis3
1 Leeds University Business School, University of Leeds LS6 1AN Leeds, United
Kingdom.
E-mail: [email protected]
2Norwich Business School, University of East Anglia, NR4 7TJ, Norwich, United
Kingdom.
E-mail: {n.korfiatis;k.chalvatzis}@uea.ac.uk
3Department of Tourism and Hospitality, School of Services Management,
Bournemouth University, BH12 5BB, Bournemouth, United Kingdom.
E-mail: [email protected]
Abstract: We explore a special case of electronic word of mouth that of employees'
online reviews to study the determinants of job satisfaction and employee turnover. We
perform our analysis using a novel dataset of 297,933 employee online reviews from 11,975
US tourism and hospitality firms, taking advantage of both the review score and text.
Leadership and cultural values are found to be better predictors of high employee satisfaction,
while career progression is critical for employee turnover. One unit increase in the rating for
* Corresponding author We are grateful to Dr. Efthymia Symitsi for providing us with helpful comments and Glassdoor's Data
Science Team for providing access to the dataset used in this study.

2
career progression reduces the likelihood of an employee to leave a company by 14.87%.
Additionally, we quantify the effect of job satisfaction on firm profitability, where one unit
increase leads to an increase between 1.2 and 1.4 in ROA. We do not find evidence supporting
the reverse relationship, that growth on firm profitability increases job satisfaction. The
feedback to management in employee reviews provides specific managerial implications.
Keywords: Employee eWOM, Employee Turnover, Employee Satisfaction, Firm
Profitability
1. Introduction
Skill shortage and high employee turnover intention for tourism and hospitality employees are
important challenges in this sector (Marchante, Ortega, & Pagán, 2006). In the US specifically,
the Federal Bureau of Labor Statistics reports that the annual quits rate for tourism and
hospitality employees is persistently the highest among all sectors, close to or even exceeding
50%2. David Scowsill, former President and CEO of World Travel & Tourism Council,
highlighted the problem stating that “…When I speak to the leaders of the world’s Travel and
Tourism companies, it is clear that the biggest challenge to their growth plans is the supply
and retention of talent across all levels of their businesses...” 3. This problem is of high
economic significance for firms due to the costs associated with severance, training, and
replacement, as well as the differential cost between the performance of the leavers and the
2 Bureau of Labour Statistics (2018). Annual quits rates by Industry. US Department of Labor. Available at: https://www.bls.gov/news.release/jolts.t18.htm
3 WTC Press Release (2015): 14 million jobs at risk due to global Travel & Tourism talent shortage Available at: https://sp.wttc.org/about/media-centre/press-releases/press-releases/2015/14-million-jobs-
at-risk-due-to-global-travel-tourism-talent-shortage/

3
newcomers (Cascio, 1991). While exact figures are not disclosed, academic research calculates
that cost between 90% to 200% of the annual salary (Allen, Bryant, & Vardaman, 2010).
Job satisfaction is a critical factor in attracting and retaining a skilled workforce. The
extant scholarly thought substantiates a positive relationship among employee satisfaction,
customer satisfaction, and corporate performance (Harter, Schmidt, & Hayes, 2002; Huang,
Li, Meschke, & Guthrie, 2015; Symitsi, Stamolampros, & Daskalakis, 2018). This link is
stronger in high-contact service industries that require a substantial level of contact between
the service provider and the customer (Yee, Yeung, & Cheng, 2008). This is mainly attributed
to the moderating effect of the customer-employee interaction during the consumption
experience (see Brown & Lam, 2008 for a review and meta-analysis). Tourism and hospitality
is a high-contact service sector, where most of the services are delivered with a high level of
interaction between customers and employees (Kong, Jiang, Chan, & Zhou, 2018). Employees
with a low level of satisfaction have less incentive to excel and, as such, may deliver lower
service quality (McPhail, Patiar, Herington, Creed, & Davidson, 2015), affecting, in turn,
corporate performance through the service satisfaction-profitability link (Lam, Baum, & Pine,
2003). The literature embraces this view and a significant stream of studies evaluate the
determinants of employee satisfaction and its effect on firms’ operating and financial
performance (Chi & Gursoy, 2009a; Huang & Rundle-Thiele, 2014; Lam, Zhang, & Baum,
2001; Spinelli & Canavos, 2000). While most of these studies rely on the collection of primary
data, mainly from employee satisfaction surveys, issues such as sampling and attenuation bias
become pertinent to the external validity of their findings. To this end, the advent of platforms
that enable employees to evaluate their current or previous employers by posting online reviews
offers unprecedented opportunities for the investigation of job satisfaction drivers, both in
sector and firm-specific contexts.

4
Hitherto, online reviews have been extensively explored by scholars in other areas of
tourism and hospitality research, mainly under the prism of consumer evaluations in a post-
transactional context (Gao, Li, Liu, & Fang, 2018; Guo, Barnes, & Jia, 2017; Sparks, So, &
Bradley, 2016). By considering this unexplored informational cue, which arrives directly from
current and former employees, this study provides new evidence about the facets and dynamics
of job determinants, as well as, their association with corporate profitability. We are doing that
analyzing a dataset of 297,933 employee review ratings and their corresponding textual
justifications for 11,975 US tourism and hospitality firms for the period 2008-2017 provided
by Glassdoor Inc., one of US’s most popular online platform for job recruiting and employee
reviews.
This paper contributes to the existing literature as the first study that uses online
employee reviews to explore job satisfaction determinants in the context of high-contact
services. Compared to existing literature that examines job satisfaction drivers in isolation, our
approach is to capture the overall effect of multiple factors measured either directly through
numerical scales or extracted indirectly from the text that often accompanies review ratings,
and find their relative importance in explaining employee satisfaction variation. By
incorporating the opinions of former employees, this study also attempts to shed light on the
rather unexplored determinants of employee turnover. As mentioned previously, in addition to
skill deficiencies, high turnover is an essential topic for the tourism and hospitality sector
(Zopiatis, Constanti, & Theocharous, 2014). A significant departure of our study is that, instead
of focusing on particular industries or employee roles, we derive more general insights based
on a large volume of participants which are representative of all tourism and hospitality
industries and different employment roles. Finally, this paper revisits the link between
employee satisfaction and firm profitability and quantifies the effect per satisfaction unit

5
increase on Return-on-Assets (ROA) for tourism and hospitality firms, providing further
evidence on the directionality of this relationship.
The aim of this study is to present the information value of employee online reviews
and the complementary benefits they offer for academic research and managerial practice
alongside primary data from employee satisfaction surveys. In the extant tourism and
hospitality literature, measurement scales such as the Minnesota Satisfaction Questionnaire
(MSQ) and the Job Descriptive Index (JDI) have been extensively utilized. Questionnaires can
be designed to allow a more systematic investigation of specific dimensions than online
reviews, which have a broader structure. However, an approach exhausted to specific
dimensions poses constraints as employee satisfaction or other relevant outcomes are
multidimensional constructs (Matzler & Renzl, 2007) affected by a plethora of factors beyond
the measurement scales (Stamolampros, Korfiatis, Chalvatzis, & Bouhalis, 2019). As such,
latent factors that affect employee satisfaction or relevant outcomes that are not contained
within survey instruments will remain unnoticed and their effects unexplored rending the
interpretation of the results problematic (Jung et al., 2009).
Online reviews bring many complementarities to these survey-based metrics for
researchers and practitioners. The limitations imposed on online reviews by a general closed-
end structure are moderated through the unstructured review text voluntarily and anonymously
provided by employees. The review text allows employees to reflect on their work experience
with a company, without being constrained by predefined items unveiling up-to-date
preferences as reviewers discuss their current experience with specific employers and argue
based on factors beyond the established closed-form questions. Under the reasonable
assumption that employees comment on the most critical drivers of their satisfaction (or
dissatisfaction) with an employer, a proper methodology will identify those factors within the
review text. In that area, text mining methods have been shown to capture latent dimensions
6
that are not explicitly mentioned or measured by scales but significantly affect reviewers’
opinion formulation (see, for example, Korfiatis, Stamolampros, Kourouthanassis, &
Sagiadinos, 2019; Tirunillai & Tellis, 2014, among others). In addition to identifying up-to-
date conditions, review text can offer further benefits by revealing sector-related factors of
employee satisfaction. As a result, online reviews mitigate concerns when psychometric
measures are adopted from different sectors in the spirit of “one size fits all” without being
appropriately adjusted to capture current and specific industry conditions (Hom, Lee, Shaw, &
Hausknecht, 2017). Finally, the large volume of participating employees reviewing their
employers allows for more representative samples and comparative benchmarking between
companies and sectors/industries.
In addition to studying job satisfaction determinants, the focus of this paper extends to
employee turnover, motivated by the substantially high quits rates and the costly consequences
in tourism and hospitality industries. In employee turnover research, even the most extensive
models fail to incorporate important constructs; therefore their empirical estimation is
problematic and the explained variation in employee turnover behavior is low (Maertz Jr &
Griffeth, 2004). There is also difficulty in finding data for the work experience of previous
employees and those factors that led to a “leave the company” decision. Online reviews resolve
this issue offering access to a large pool of opinions expressed by former employees allowing
us to investigate employee turnover determinants through actual departures from a post
(actions) and not through the intention to leave (scenarios) as is the case in most studies.
In terms of managerial practice, online reviews can complement the information
derived through internal mechanisms. Information about employee satisfaction, motivation or
engagement delivered through internal surveys and systems arrives in lower frequency time
intervals, usually collected once a year (Lee, Hom, Eberly, Li, & Mitchell, 2017). This

7
approach ignores any seasonal dynamics and may be influenced by specific events that occur
during the data collection period. Shocks in the variables of interest (for example sudden
decreases in employee satisfaction) will also be captured with a delay. Most importantly,
information from internal procedures is likely to be biased as employees may be reluctant to
speak the truth and share information eponymously and the fear of retribution may undermine
participation in such initiatives leading to employee silence (Milliken, Morrison, & Hewlin,
2003). The anonymity of online reviews enables employees to overcome such hesitations and
discuss openly more issues (for example managerial behaviour). This suffers from limitations
in the case of very small firms where, perhaps, it could be possible for a firm to identify the
author of a review post. Furthermore, whereas the collection of primary data is a costly process
in terms of the resources and time required, online reviews are readily available through review
aggregators. Therefore, firms can easily, timely, and cheaply have a depiction of the current
employee opinions. In addition to gaining within-firm insights, managers can enjoy further
benefits from freely available reviews for thousands of companies. For instance, managers
could identify success factors within the sector or map the competition and benchmark their
performance with that of their competitors.
Our approach considers both the numerical ratings for specific job elements and the
provided textual justification. We are doing that introducing a machine learning approach to
explore the effect of textual features extracted from hospitality employee reviews. Using a
particular class of topic models, i.e., the Structural Topic Model – STM (Roberts, Stewart, &
Airoldi, 2016), we evaluate the impact of these features on the overall satisfaction and
employee turnover. To this end, this paper is structured as follows: Section (2) reviews the
related literature and outlines the contribution; Section (3) describes the methodology and
variables used and presents the empirical results of the regression analysis; Section (4) provides
the framework for the textual analysis and the empirical results of this method; Section (5)

8
explores the effect of job satisfaction on firm performance; Section (6) discusses the theoretical
and managerial implications of the study; and Section (7) concludes with a discussion of the
limitations and the future research avenues of the current research.
2. Related Work
Online reviews occupy a central position in the literature due to the influence they exert on
consumers’ purchase decisions with regards to tangible products, as well as, services such as
hotel room bookings (Viglia, Minazzi, & Buhalis, 2016). A significant number of studies
examine online reviews from different perspectives, such as their effect on consumer
expectations (Narangajavana, Fiol, Tena, Artola, & García, 2017), customer satisfaction
determinants (Guo et al., 2017), psychological influences (Stamolampros & Korfiatis, 2018),
and firm responses (Sparks et al., 2016). Although electronic word-of-mouth research is
abundant, it is solely examined through the lens of product/service evaluation of a consumption
experience shared online by consumers.
Employee review platforms that allow users to share their opinions about their current
and previous employers form a novel case of electronic word of mouth. Job listing sites, such
as Glassdoor and Indeed, act as a valuable tool for job-seekers, particularly when they lack
internal connections to gain knowledge about the work conditions within a company (Ladkin
& Buhalis, 2016). In doing so, job-seekers access information about the benefits, culture,
managerial practices, and several other specific job elements of the company of interest, either
through the provided numerical ratings or the review text. Online platforms and social media
have been shown to affect recruitment in hospitality organizations (Ladkin & Buhalis, 2016),
though, their effect is not exhausted to recruiting processes. Online employee reviews provide
new opportunities for the study of employee satisfaction and performance in the context of
tourism and hospitality literature, however, until now this informational cue has remained
unexplored.

9
In particular, in high-contact services, employee satisfaction plays a vital role in the
formation of customer experience, while it also has a significant effect on firm profitability
(Yee et al., 2008). The service-profit chain model (Heskett et al., 1994) describes the
mechanisms that govern this relationship. Better satisfied employees offer higher service
quality to customers, leading to improved customer satisfaction and establishing customer
loyalty. In turn, loyalty further stimulates firm profitability and growth.
Not surprisingly, the extant literature dedicates significant effort on tourism labor
research, as a high-contact services industry (Baum, Kralj, Robinson, & Solnet, 2016; Janta,
Ladkin, Brown, & Lugosi, 2011; Ladkin, 2011). Scholars try to understand the determinants
of employee satisfaction and measure its effect both on customer satisfaction and corporate
profitability. This is particularly important, as the continuous “exodus” of staff (in terms of
annual job quits) in this sector is a major problem. Other studies document positive associations
between employee and customer satisfaction (Spinelli & Canavos, 2000) and between satisfied
employees and financial performance (Chi & Gursoy, 2009).
2.1 Understanding the Employment Characteristics in Tourism and Hospitality
Tourism and hospitality workforce belongs to the pool of “peripheral labor” which is primarily
composed of semi-skilled or unskilled workers in full-time, part-time or short-term contracts
(Krakover, 2000). The pertinent nature of tourism and hospitality jobs has also made them
particularly attractive to employees of a certain demographic profile. Ladkin and Buhalis
(2016) note that the sector often relies on the input of young and inexperienced labour for filling
up vacancies as more skilled and experienced employees find employment in other industries.
In several economies around the world, the sector’s workforce has traditionally been much
younger than across the economy as a whole (ILO, 2010). This lack in experience is not filled
by educational programs which fail to equip employees with the actual skills expected from
them to perform on their roles and do not meet the changing needs of the industry (Chi &

10
Gursoy, 2009b). In addition to poor training, the industry has been also characterized with poor
salaries which work as a disincentive for employees required to satisfy the demands of
customers who pay to be served, obeyed, and entertained (Poulston, 2008).
Various stressors such as excessively demanding customers and supervisors, alongside the
repetitive nature of duties, inefficient training and long-lasting shifts establish a unique context
of work conditions in this sector (Law, Pearce, & Woods, 1995; Tepeci & Bartlett, 2002).
Employment flexibility for family reasons such as short time off or paid (non-paid) leave,
which is often considered as standard in other sectors, is not the norm for hospitality employees
whose performance, to some extent, is evaluated by the long and unsocial hours spent at work
(Zhao & Ghiselli, 2016). This has made tourism and hospitality jobs to be widely regarded as
stressful with a considerable imbalance between employees’ work and personal life
commitments (O’Neill & Xiao, 2010). On that aspect, past research has highlighted the
vulnerability of hospitality workers to adverse outcomes such as stress, burnout, “emotional
injury”, violence and physical injuries (McNamara, Bohle, & Quinlan, 2011).
Frontline employees, such as those in hotels and restaurants, are often treated poorly,
not just by managers, but also by customers deriving from their high expectations for the
service provider (Poulston, 2009). The primary philosophy in high contact service industries
that “the customer is always right”, results in an unequal power between frontline employees
and customers and requires employees to serve customers in a friendly and polite manner even
in the event of customer verbal aggression and harassment and encourages “pleasing the
customer” at any cost. The later has also detrimental effects on employee satisfaction
(Karatepe, Yorganci, & Haktanir, 2009). These effects are magnified when customers
anticipate extremely high-quality services from employees in tourism and hospitality industries
and, particularly, when high expectations frame special occasions (e.g., family vacations,
delivery of important business events, family occasions). Under these conditions, there exists

11
relatively significant intolerance to service failures (e.g., departure delays, sub-standard
delivery of upfront paid services). Not surprisingly, managers coming face-to-face with
dissatisfied customers generate extra pressure for hospitality and tourism employees,
particularly when they have to sacrifice economic gain in order to compensate customers in the
form of future discounts or refunds (Harris & Reynolds, 2004).
Altogether, these characteristics in tourism and hospitality posts induce a higher level
of employee dissatisfaction compared to other industries with surveys reporting that more than
half of the workforce in the sector is unhappy and considers a move4. Out of these demographic
characteristics, the young age, which is described by a higher penetration rate to technology
and social media, increases the propensity that employees will resort to online employee
platforms to disclose their experience. As such, we argue that online employee reviews can be
particularly informative for researchers and practitioners to better understand the drivers of
employee satisfaction and turnover in hospitality and tourism. Moreover, it is expected that the
information content of these reviews will reflect the contextual characteristics discussed above.
2.2 Drivers of employee satisfaction in tourism and hospitality
Extant research in this area examines the relationships among several individual, social and
family, work-related, and organizational factors on job satisfaction or similar outcomes. These
outcomes are outlined below.
Organizational Factors: Several organizational aspects influence job satisfaction for
employees in the tourism and hospitality industry. Nadiri and Tanova (2010) report that
4 Investors in People (2018). Job Exodus Trends: 2017 Employee Sentiment Poll. Available at: https://www.investorsinpeople.com/wp-content/uploads/2018/07/IIP-Job-Exodus-Trends-2017-employee-sentiment-poll.pdf

12
organizational justice, i.e., the individual perception of fairness received from an organization,
is positively related to job satisfaction. Organizational support is also found to be positively
related to job satisfaction. For example, Kim, Leong, and Lee (2005) found that restaurant
employees are more satisfied when they receive service training and greater encouragement
from management as well as when organizational procedures for optimal service are in place.
Sparrowe (1994) reported that employee empowerment and the relationship employees have
with their immediate supervisors (high leader-member exchange) influence positively some
facets of job satisfaction and more specifically promotion satisfaction for the former factor and
pay satisfaction for the latter. Organizational culture, especially culture that is team-oriented,
enhance innovation, employee development, and value customers lead to higher job
satisfaction, especially in the case of high perceived person-organization fit (Tepeci & Bartlett,
2002).
Employees also have an increased level of job satisfaction when they work for
companies that display corporate social responsibility. In the case of casino employees, Lee,
Song, Lee, Lee, and Bernhard (2013) found that legal CSR and supplementary Responsible
Gambling (RG) policies have a positive effect on organizational trust, which in turn influences
job satisfaction positively. Other organizational factors that explain job satisfaction are training
(Lam et al., 2001); work engagement (Yeh, 2013); organizational structure (Øgaard, Marnburg,
& Larsen, 2008); role clarity (Li & Tse, 1998); compensation (Ineson, Benke, & László, 2013);
career prospects (McPhail et al., 2015); and internal market orientation (Ruizalba, Bermúdez-
González, Rodríguez-Molina, & Blanca, 2014).
Social and Family Characteristics: A parallel body of literature points out to several
social and family factors that affect the perceived job satisfaction of tourism and hospitality
employees. A significant stream of studies investigates the role of work-family conflicts. For
example, Namasivayam and Zhao (2007) provided evidence that work-family conflicts (and

13
mainly the direction where family-related roles interfered with work-related roles) are
negatively related to job satisfaction. Similarly, Karatepe and Kilic (2007) found that there is
a negative relationship to job satisfaction when job interferes with family roles and as a result
employees cannot be involved in important family and social activities. The authors, however,
reported the positive effect of a supportive supervisor in work and family problems on
employee job satisfaction. Extant literature also sheds light to the interaction with other social
groups such as colleagues and friends. Bufquin, DiPietro, Orlowski, and Partlow (2017)
revealed that employees are more likely to experience higher job satisfaction when they
perceive their co-workers as warm and competent individuals. Yang (2010) found that
employee socialization contributed significantly to the prediction of job satisfaction for
frontline employees in hotels in Taiwan. Song, Chon, Ding, and Gu (2015) confirmed this
effect, showing that hotel employee job satisfaction for newcomers is positively affected by
organizational socialization tactics (OST).
Individual characteristics: Several individual characteristics have direct or moderating
effects on job satisfaction. Karatepe and Sokmen (2006) reported a positive impact of education
and a negative relationship of age on job satisfaction. Additionally, the authors reported the
positive effect of organizational tenure, self-efficacy, and effort (frontline employees spending
a significant amount of energy in a series of job-related duties). Kim, Murrmann, & Lee (2009)
found that gender and organizational levels (supervisory and non-supervisory roles) have a
moderating effect on the impact of role stress on job satisfaction, which is significantly stronger
for female employees and supervisory roles than male employees and non-supervisory roles.
Generational differences between Baby Boomers and Millennials moderate the effects on the
relationship between emotional exhaustion and job satisfaction (Lu & Gursoy, 2016), with
emotionally exhausted Millennials reporting significantly lower job satisfaction levels and
higher employee turnover intention than emotionally exhausted Baby Boomers.
14
Work-Related Characteristics: This group of factors examines characteristics such as
the content of the job and the employment characteristics. Role conflict (when incompatible
roles are performed) and role ambiguity (when employees are uncertain about the expectations
within a certain role) have a significant negative impact on job satisfaction (Karatepe &
Sokmen, 2006). Yang (2010) identified an adverse effect of role conflict on job satisfaction.
Job content has a substantial negative impact on overall satisfaction when satisfaction in this
aspect is low but no impact when satisfaction is high (Matzler & Renzl, 2007). On the other
hand, job polychronicity is positively linked to job satisfaction (Jang & George, 2012).
Similarly, job roles that require higher emotive effort increase job satisfaction (Chu, Baker, &
Murrmann, 2012), while the same effect is reported for relational and cognitive job crafting
(Kim, Im, & Qu, 2018). Moreover, job characteristics can moderate the effect of other factors,
as in the study of Lee, Kim, and Perdue (2016), who reported a positive effect of empowerment
on employee satisfaction, with higher effect on customer-facing than non-customer facing
employees.
2.3 Outline of contribution
As discussed in the previous section, the mainstream approach followed in the literature is to
establish a relationship between a specific or a number of factors with job satisfaction and other
relevant outcomes, without controlling for other factors that have been found to explain the
satisfaction levels of employees with their employers. To this end, one of the most significant
shortcomings of existing quantitative research is the selection of the measurements that will be
operationalized in the research. Aspects that are not contained within survey instruments are
not measured and as such remain unnoticed and their effects unexplored, rendering the
interpretation of the results problematic (Jung et al., 2009). Of course, there are some
exceptions, such as the work of Pan (2015), who performed an importance-performance
analysis for six factors “Evaluation & Promotion”; “Compensation and Fringe Benefits”; “Job

15
Content”; “Work Environment”; “Supervising and Leading”; “Interpersonal Relationships”;
and overall satisfaction. However, even those studies are based on predefined constructs that
may not fully capture the multidimensionality of employee satisfaction (Matzler & Renzl,
2007) and feature the limitations discussed previously. In the present study, a different
approach is followed, as the goal is not to establish a relationship between a specific factor and
job satisfaction but instead to assess the relative importance of all factors captured through the
review rating and text.
A second aspect that is strikingly common in extant research is that researchers utilize
primary data sourced from employee responses in cross-sectional questionnaires. Thus,
information that employees (former and current) share online remains unexplored. Data
collection for previous employees is always a difficult task for researchers and practitioners.
By collaborating with firms, researchers have access mainly to the pool of current employees
and as such panel-based longitudinal studies are needed. Indeed, there is a link between the
perceptions of current employees about their company and employee turnover performance.
However, current employees may be more hesitant to speak out, reveal their true satisfaction,
and raise issues with an employer, while there is also a distinct line between them and former
employees, which resides on the decision of the latter to leave the company. In this study, we
do not gauge employee turnover intention but actual employee departures from a job. Previous
studies have shown that these two should be considered as distinct concepts that are predicted
by different sets of variables (Cohen, Blake, & Goodman, 2016).
Finally, extant literature is usually context-specific and does not explore the tourism
and hospitality industry as a whole. For example, in Table 1 we summarise the context of the
studies that study employee satisfaction directly or indirectly. It is clear that most of the studies
are sector-specific and firm-specific (usually taking into consideration employees from a few
hotels), role-specific (frontline employees, travel agent employees, chefs, etc.) and the analysis

16
is based on a limited number of questionnaires. However, it is known that employment
characteristics regulate the relationship between job satisfaction factors and overall job
satisfaction, with employees that work in different domains reporting different factors as more
important (Lee & Way, 2010). As such, the generalization of the results from context-specific
studies is problematic, and consequently, the extant literature may fail to answer which factors
capture employee satisfaction for the whole industry.
Considering the above research gaps, this study aims to answer the following research
questions: (a) Which factors drive employee satisfaction for tourism and hospitality firms?
Considering that numerical ratings can also be decomposed into specific aspects, which are the
most influential aspects? (b) Which factors can be significant predictors of actual employee
turnover? Likewise, this study evaluates which aspects of the overall rating predict employee
turnover. In addition, and considering the textual justification of the employee reviews, this
study answers (c) what other factors (not captured by the rating interface) are revealed from
the text as important drivers of employee satisfaction? How does the prevalence of these
themes change across the continuum of the rating scale, and employment status (former vs.
current)? Finally, (d) how does employee satisfaction (captured through ratings) affect the
performance of a tourism and hospitality firm? Considering the economic significance of this
question, there are managerial implications that are also pertinent to this analysis, such as what
can travel and hospitality firms do to address this issue.
Table 1: Indicative sample sizes and firm contexts reported in the literature.
Study Context Sample Size Pan (2015) Employees of a specific hotel 474 questionnaires Karatepe and Sokmen (2006)
Frontline employees of 37 3,4,5* hotels in Ankara, Turkey
723 questionnaires
Matzler and Renzl (2007) Employees of Austrian Hotels 752 questionnaires Namasivayam and Zhao (2007) Employees of a large hotel in India 93 questionnaires Øgaard et al. (2008) Employees of 54 hotels 734 questionnaires Robinson and Beesley (2010) Chefs or cooks from clubs in southeast
Queensland 196 questionnaires

17
Larsen et al. (2012) Employees of cruise crew 216 questionnaires Alexander et al. (2012) Full-time employed chefs across Scotland 164 questionnaires Belhassen and Shani (2013) Employees of 3 hotels in Eilat, Israel 473 questionnaires Lin et al. (2013) Frontline employees of various tourism and
hospitality industries 587 questionnaires
Zopiatis et al. (2014) Employees of 3,4,5* hotels in Cyprus 482 questionnaires Huang and Rundle-Thiele (2014) Australian and Taiwanese hospitality
employees in Australia 458 questionnaires
Díaz et al. (2015) Travel agent employees in Spain 497 questionnaires Elbaz and Haddoud (2017) Travel agent employees in Egypt 505 questionnaires Youn et al. (2018) Employees of a casino company in Seoul 206 questionnaires Tsaur and Yen (2018) Employees from several tourism and
hospitality industries in Taiwan 363 questionnaires
This study Employees of 11,975 US tourism and hospitality firms from all industries.
297,933 online reviews
3. Data, Methods, and Results
3.1 Dataset Description
Glassdoor ‒ the second most popular jobs listing website in the US with 50 million unique
users5 made available to the authors all employee reviews submitted to the platform for the
period between 2008 and 2017. These reviews included both publicly available data as well as
other variables, such as job and company classification codes used to source reviews of travel
and hospitality employees. As such, no web crawling was used to collect the dataset, and full
compliance with the terms of use was obtained under Glassdoor’s permission. Glassdoor
accommodates a platform where employees share their experiences with current and previous
employers, providing ratings about their overall satisfaction with a company as well as for
specific job elements. In addition to their overall satisfaction, employees evaluate career
opportunities, compensations and benefits, senior leadership, work-life balance, and cultural
5 Yahoo Finane (2018): How Glassdoor became the No. 2 jobs site in the US (https://finance.yahoo.com/news/glassdoor-became-no-2-jobs-site-us-222246364.html)

18
values of the company. Glassdoor has a particular process in place to safeguard the content and
quality of each employee rating from manipulation, and every review that is submitted to the
review system is vetted with a variety of methods, employing both automated procedures and
curation by human inspectors.
Glassdoor collects information about employee’s tenure (Current vs. Former) as well
as demographics. It offers company-specific information in the form of industry/sector, stock
ticker (which allows distinguishing between private and public companies), number of
employees, and annual revenue. For the review text, Glassdoor asks users to provide separate
responses for the positive and negative aspects of their work experience, as well as feedback
to management. This text categorization, enforced by Glassdoor’s user interface, provides a
distinct advantage for analyzing the textual parts of an employee review as no sentiment
detection method is needed.
Table 2: Sample characteristics
Reviewer Characteristics
Total Number of Reviews 297,933 - Former employees 161,494 - Current Employees 136,439 Female Employees
Male Employees
Education High School Education Bachelor Education Postgrad (MSc/MBA/ Ph.D.)
95,206 86,695 18,384 79,054 7,123
Average Reviewer Age 32.7 Employer Characteristics
Total Number of Employers 11,975 Average Number of Employees 1,446.3 Average Annual Revenue ($ millions) 4,324
Table 2 provides a depiction of the dataset used in this study. A total of 297,933
employee reviews from 11,975 US firms formed our dataset, with the well-balanced
participation of former (161,494) and current employees (136,439). The sample almost equally

19
represents female (52%) and male (48%) employees, while the average age reported is 32.7
years. The companies in our sample have on average 1,446 employees and annual revenues of
$4.324 million. A breakdown of the sample and the mean overall rating (and standard
deviation) per industry is provided in Appendix Table B. We used Glassdoor’s internal
categorization to select two sectors of interest for this study: (a) restaurants, bars and food
services; and (b) travel and tourism; which, as seen in Appendix Table B, contain five and ten
industries respectively. The rating provided by previous employees is lower than that of current
employees (Figure 1). However, it is important to note that the rating distribution does not
follow the expected U-shaped (or J- shaped) curve that is prevalent on other review aggregators
(Hu, Zhang, & Pavlou, 2009) but, especially in the case of former employees, it is closer to a
normal distribution. This suggests that the dataset is not affected by the self-selection bias (Li
& Hitt, 2008), induced by the participation of only the overly satisfied (or dissatisfied)
employees.
Figure 1: Distribution of star rating (overall rating) by employment relation (type).

20
3.2 Results
What Drives Overall Employee Satisfaction?
In the first part of the analysis, the overall satisfaction rating is decomposed to the job attributes
measured on the platform in order to understand which factors are valued more by employees.
Four different econometric specifications were evaluated (Table 2), with a baseline
representing a regression of the overall satisfaction with the five rating subcategories
previously described in the sample of all employees. As the dependent variable is an ordinal
variable that takes values from 1 to 5 stars (with five denoting the highest satisfaction),
following previous studies (Gao et al., 2018; Sridhar & Srinivasan, 2012), we use an ordered
logistic regression specification. Let 𝑆𝑖𝑗∗ be the underlying latent variable which captures the
employee’s i evaluation for firm j; 𝑆𝑖𝑗 the observed rating scores that take values 𝑘 ∈ [1,5];
and 𝜇2 − 𝜇5 the cutoffs for the levels of the latent variable. The main model, controlling for
employee (reviewer) and firm characteristics, has the following form:
P r(𝑆𝑖𝑗 = 𝑘) = P r(𝜇 𝑘−1 < 𝑆𝑖𝑗∗ ≤ 𝜇𝑘) , 𝑘 ∈ [1,5] (1)
𝑆𝑖𝑗∗ = 𝛽𝑋𝑖𝑗 + 𝛾𝑍𝑖 + 𝛿𝑊𝑗 + 𝜖𝑖𝑗 (2)
where, 𝑋𝑖𝑗 are the rating scores the reviewer i provides for the five specific rating aspects; 𝑍𝑖 is a vector of reviewer demographics that includes age, sex, and level of education (an ordered
categorical variable with three levels, namely high school, bachelor degree, and postgraduate);
and 𝑊𝑗 contains the firm specific variables (number of employees, annual revenues, and a
binary variable whether the firm is public or not). The model described above is applied for all
reviews but also to subsamples that contain current-only and former-only employees.
Table 3 presents the results of the regression analysis for the baseline model (Model 1)
as well as for the subsample for former (Model 2), current (Model 3), and with all employee
and firm controls (Model 4). When it comes to the rating aspects, the lower coefficient is
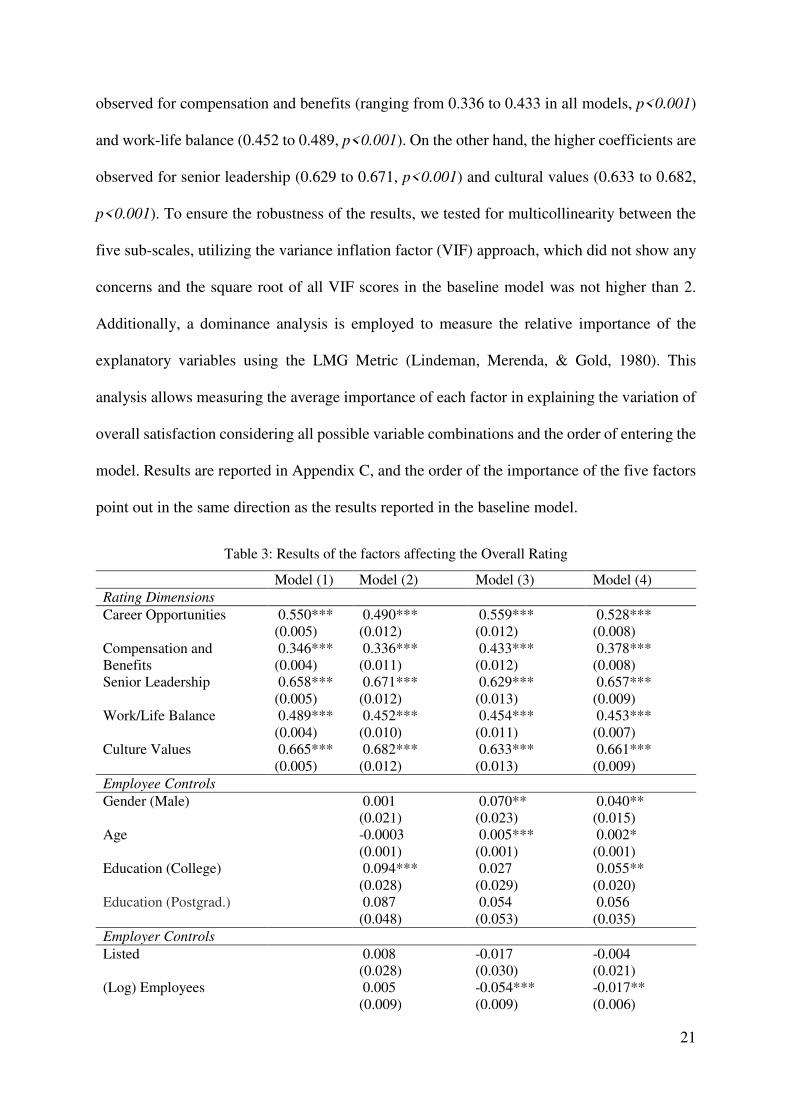
21
observed for compensation and benefits (ranging from 0.336 to 0.433 in all models, p<0.001)
and work-life balance (0.452 to 0.489, p<0.001). On the other hand, the higher coefficients are
observed for senior leadership (0.629 to 0.671, p<0.001) and cultural values (0.633 to 0.682,
p<0.001). To ensure the robustness of the results, we tested for multicollinearity between the
five sub-scales, utilizing the variance inflation factor (VIF) approach, which did not show any
concerns and the square root of all VIF scores in the baseline model was not higher than 2.
Additionally, a dominance analysis is employed to measure the relative importance of the
explanatory variables using the LMG Metric (Lindeman, Merenda, & Gold, 1980). This
analysis allows measuring the average importance of each factor in explaining the variation of
overall satisfaction considering all possible variable combinations and the order of entering the
model. Results are reported in Appendix C, and the order of the importance of the five factors
point out in the same direction as the results reported in the baseline model.
Table 3: Results of the factors affecting the Overall Rating
Model (1) Model (2) Model (3) Model (4) Rating Dimensions Career Opportunities 0.550***
(0.005) 0.490*** (0.012)
0.559*** (0.012)
0.528*** (0.008)
Compensation and Benefits
0.346*** (0.004)
0.336*** (0.011)
0.433*** (0.012)
0.378*** (0.008)
Senior Leadership 0.658*** (0.005)
0.671*** (0.012)
0.629*** (0.013)
0.657*** (0.009)
Work/Life Balance 0.489*** (0.004)
0.452*** (0.010)
0.454*** (0.011)
0.453*** (0.007)
Culture Values 0.665*** (0.005)
0.682*** (0.012)
0.633*** (0.013)
0.661*** (0.009)
Employee Controls
Gender (Male) 0.001 (0.021)
0.070** (0.023)
0.040** (0.015)
Age -0.0003 (0.001)
0.005*** (0.001)
0.002* (0.001)
Education (College) 0.094*** (0.028)
0.027 (0.029)
0.055** (0.020)
Education (Postgrad.) 0.087 (0.048)
0.054 (0.053)
0.056 (0.035)
Employer Controls Listed 0.008
(0.028) -0.017 (0.030)
-0.004 (0.021)
(Log) Employees 0.005 (0.009)
-0.054*** (0.009)
-0.017** (0.006)

22
(Log) Revenues -0.013 (0.008)
0.016 (0.008)
-0.001 (0.006)
Mc Fadden R2 0.52 0.86 0.85 0.86 AIC 450016 70938 60948 132187 Log Lik. -224999 -35439 -30444 -66063 Observations 237,135 35,789 32,744 68,533 Sample Segment Full Sample Former Only Current Only Full Sample
Note: * p<0.05; ** p<0.01; *** p<0.001. Model (1) is the model that employs only the five
measurement scales captured in Glassdoor to the total sample. Models (2), (3) and (4) are with all
control variables for the former only, current only, and to the total sample of employees, respectively.
The interpretation of the results requires careful analysis, as they could lead to the
fallacy that compensation/benefits and work-life balance are not essential drivers for employee
satisfaction. A better explanation of the results is that compensation/benefits and work-life
balance are basic needs of employees, where their lower level can increase dissatisfaction but
their higher level by itself, will not lead to high satisfaction. Strong cultural values and
leadership are the factors that present a significant increase in job satisfaction. In this sample,
it is common to observe high compensation/benefits and work-life balance ratings coupled with
average overall satisfaction ratings, while strong cultural values and leadership usually lead to
high overall scores.
Focusing on demographics and firm characteristics, the analysis provides further
insights into the way they affect overall satisfaction and the rating to specific job elements.
Understanding the differences in the provided ratings among current and former employees,
gender, different education background, age as well as private and public corporations, size,
and profitability of the firms provides critical insights. As such, a similar econometric
specification is utilized, where the depended variable is not only the overall rating but also the
rating aspects to the specific job satisfaction elements. The explanatory variables contain two
clusters of firm and reviewer characteristics as well as an additional binary variable that denotes

23
whether the reviewer is a current or a former employee (with “1” assigned to former and “0”
to current employees).
The results are presented in Table 4. The negative coefficient of former employees is
quite intuitive and stable for all models (Model 1: β=-0.625, p<0.001). As expected, those
employees who choose to leave a company are likely to be the most dissatisfied. When it comes
to gender, in all job satisfaction aspects (except career opportunities which is statistically
insignificant), male employees appear to be more satisfied than their female colleagues.
Table 4: Impact of employee status (former vs. current) on rating dimensions.
Model (1) Model (2) Model (3) Model (4) Model (5) Model (6) Former Employee -0.625***
(0.012) -0.615*** (0.013)
-0.442*** (0.013)
-0.598*** (0.013)
-0.426*** (0.013)
-0.581*** (0.014)
Employee Controls
Gender (Male) 0.091*** (0.012)
-0.008 (0.013)
0.096*** (0.013)
0.120*** (0.013)
0.079*** (0.013)
0.081*** (0.014)
Age -0.008*** (0.001)
-0.003*** (0.001)
0.004*** (0.001)
-0.008*** (0.001)
-0.014*** (0.001)
-0.011*** (0.001)
Education (College) 0.225*** (0.016)
0.089*** (0.017)
0.169*** (0.017)
0.179*** (0.017)
0.195*** (0.017)
0.239*** (0.018)
Education (Postgrad.) 0.289*** (0.028)
0.057 (0.029)
0.189*** (0.029)
0.275*** (0.030)
0.379*** (0.030)
0.299*** (0.031)
Employer Controls
Listed
0.062*** (0.016)
0.073*** (0.017)
0.130*** (0.017)
0.016 (0.017)
0.067*** (0.017)
0.108*** (0.018)
(Log)Employees
-0.021*** (0.005)
0.036*** (0.005)
0.022*** (0.005)
-0.020*** (0.005)
-0.040*** (0.005)
-0.017** (0.006)
(Log) Revenues
0.030*** (0.005)
0.025*** (0.005)
0.034*** (0.005)
0.028*** (0.005)
0.021*** (0.005)
0.031*** (0.005)
Mc Fadden R2 0.72 0.71 0.71 0.71 0.71 0.72
AIC 261,432 249,044 251,550 243,604 252,012 218,134
Log Lik. -130,690 -124,492 -125,745 -121,772 -125,976 -109,041
Observations 85,091 75,557 75,374 74,211 75,640 70,250
Note: * p<0.05; ** p<0.01; *** p<0.001. Response variable for Model (1): Overall rating, Model (2):
Career Opportunities, Model (3): Compensation and Benefits, Model (4): Senior Leadership, Model
(5): Work/Life Balance, and Model (6): Culture Values.
Companies with higher revenue also tend to achieve higher employee satisfaction as
the annual revenue is significantly positive for all models. Similarly, publicly listed companies

24
also appear to have higher employee satisfaction than private companies. However, the
coefficient representing the size of the company regarding employees provides mixed results.
Although companies with many employees may offer better compensation benefits and career
opportunities compared to smaller ones, they seem to lack in terms of cultural values, senior
leadership, and work-life balance, which eventually leads to lower employee satisfaction. A
higher level of employee education is linked to higher satisfaction, although this could be also
the result of different job roles. Finally, employee age is linked to lower satisfaction except for
the satisfaction with compensation and benefits. Some of the coefficients in Table 4 are not in
agreement with the previous model in Table 3, such as employee age or company status.
However, including all measurement scales that explain a high level of the variation of the
overall rating as well as not controlling for employee status may suppress the effect of the
control variables presented in the following sections.
What Drives Employee Turnover in Travel and Hospitality Firms?
In the previous model, as well as in the initial descriptive analysis, a statistically significant
difference was found on the rating provided by former and current employees. Investigating
this further we look directly into the factors that lead to employee turnover. At this point, the
focus is only on the provided numerical rating. The depended variable is a proxy of the decision
of an employee to stay with or leave a company, as it is revealed by the time they provided the
review. Therefore, a binary variable which takes the value of “1” if the reviewer is a former
employee and “0” otherwise is considered. Controlling for all previously used employee and
firm characteristics, the effect of the specific job elements to the decision of an employee to
leave a company is examined. This is done in isolation, by studying the factors separately and
also by examining their joint effect. Given the nature of this variable, a logistic regression
model is considered appropriate for the analysis. As such, six models are estimated under the
following specification:

25
𝐿𝑛 [ 𝑃𝑖1 − 𝑃𝑖] = 𝛼 + 𝛽𝑋𝑖𝑗 + 𝜀 (3)
where P refers to the probability of the employee I to be a former employee at company
j. Xij is the matrix of independent variables, where on its full specification includes all the firm-
specific, reviewer-specific variables, and rating scores used in the previous models, while,
when examined in isolation, only the rating of the job element of interest is employed.
Table 5: Contribution of rating aspects to employee turnover. (Dependent variable: Status is former)
Model (1) Model (2) Model (3) Model (4) Model (5) Model (6) Rating Dimensions
Career Opportunities -0.266*** (0.006)
-0.161*** (0.008)
Compensation and Benefits
-0.197*** (0.006)
-0.005 (0.008)
Senior Leadership -0.242*** (0.005)
-0.107*** (0.009)
Work/Life Balance -0.182*** (0.006)
-0.007 (0.007)
Culture Values -0.232*** (0.005)
-0.061*** (0.009)
Employee Controls
Gender (Male) -0.180*** (0.015)
-0.168*** (0.015)
-0.159*** (0.015)
-0.170*** (0.015)
-0.164*** (0.015)
-0.160*** (0.016)
Age 0.003*** (0.001)
0.005*** (0.001)
0.003*** (0.001)
0.002** (0.001)
0.003*** (0.001)
0.003*** (0.001)
Education (College) 0.174*** (0.019)
0.177*** (0.019)
0.192*** (0.020)
0.184*** (0.019)
0.184*** (0.020)
0.177*** (0.021)
Education (Postgrad.) 0.296*** (0.034)
0.313*** (0.034)
0.337*** (0.034)
0.342*** (0.034)
0.343*** (0.036)
0.325*** (0.037)
Employer Controls
Listed
0.016 (0.020)
0.025 (0.020)
0.010 (0.020)
0.012 (0.020)
0.022 (0.021)
0.026 (0.021)
(Log)Employees
-0.046*** (0.006)
-0.050*** (0.006)
-0.057*** (0.006)
-0.058*** (0.006)
-0.059*** (0.006)
-0.055*** (0.006)
(Log) Revenues
0.001 (0.006)
0.001 (0.006)
0.001 (0.006)
-0.001 (0.005)
0.004 (0.006)
0.006 (0.006)

26
Mc Fadden R2 0.75 0.75 0.76 0.75 0.77 0.78 AIC 101,235 102,029 99,569 102,487 94,340 91,173 Log Lik. -50,594 -50,991 -49,761 -51,220 -47,147 -45,559 Observations 75,557 75,374 74,211 75,640 70,250 68,533
Note: * p<0.05; ** p<0.01; *** p<0.001. Models 1-5 examine the effect of a specific factor in isolation,
while Model 6 employs their joint effect.
Results from all models are reported in Table 5 and point out in the same direction. The
likelihood of an employee to leave a company is affected more by culture values (β=-0.061,
p<0.001), senior leadership (β=-0.107, p<0.001), and career opportunities (β=-0.161,
p<0.001). Most importantly in their joint examination, the effect of compensation/benefits and
work-life balance vanishes. Either in the stand-alone models or the joint examination with the
other factors, career opportunities is what influences the results the most. Keeping all other
variables constant, an increase in the rating score for career opportunities by one unit decreases
the likelihood of an employee to be a former employee by (𝑒(−0.161) − 1) = 14.87%.
4. Extracting qualitative dimensions of employee satisfaction using topic
modeling
A limitation of numerical ratings provided by employees against a set of predefined satisfaction
aspects is that their information content is constrained by the availability of the measurement
scales. As such, other job elements, which are not measured directly and may be of importance
for employees, are not captured (e.g., their beliefs about the provided customer service). Online
employee reviews have the advantage of coupling the numerical ratings with open-ended
responses; thus, allowing employees to reflect on their experience with their current or former
employer. Glassdoor asks employees to write their opinion in three separate texts,
distinguishing the negative and positive factors of their working experience with the specific
company, as well as providing feedback to management. This information allows us to perform
a qualitative analysis and to shed further light on the topics of interest. As a tool to perform this

27
analysis, a novel text mining method is used, which advances established topic models, such
as Latent Dirichlet Allocation (LDA) based on Bayesian inference (Blei, Ng, & Jordan, 2003).
Topic models, an unsupervised machine learning technique, identifies and organizes
(based on hidden semantic structures) a textual corpus in groups of words that appear together
in specific groups/topics (deriving a topic-word distribution) as well as documents that can be
grouped in a particular topic (deriving a document-topic distribution). Those techniques have
recently gained popularity in marketing, tourism, and hospitality research (Guo et al., 2017;
Stamolampros, Korfiatis, Kourouthanassis, & Symitsi, 2019; Tirunillai & Tellis, 2014) as
methods that allow researchers to perform text analysis in large corpora, while offering at the
same time reproducibility of the results, since no human coders are used. For this analysis, the
structural topic model (STM) (Roberts et al., 2016) is employed. STM is a new methodology
that extends established probabilistic topic models such as LDA (Blei et al., 2003). The novelty
of STM, compared to the aforementioned topic models, is that it allows the document metadata
(or covariates) to be included in the prior distributions of the document-topic and topic-word
distribution. This relaxes the restrictive assumption of exchangeability, where all authors are
considered equally likely to write a document (Blei et al., 2003). As such, the probability of
topic prevalence can be modeled, taking into account other covariates, while the change in this
probability can be observed across the range of values of these covariates.
The analysis is performed in three steps: the first step considers the pre-processing of
the text; the second the identification of the number of topics that explain better the variability
of the corpus, and the final step is to see how the topics change with the rating the employees
provide, which in fact captures the dominant topics for more satisfied and dissatisfied
employees.

28
4.1 Text Preparation for Analysis
Glassdoor provides a user interface that separates the textual feedback into positive, negative,
and feedback to management. After initial inspection, a sentiment scoring procedure utilizing
the Hu & Liu (2004) sentiment dictionary was applied to the negative and feedback to
management fields to identify and remove those text parts that were used by employees as
placeholders for empty text (e.g., nothing to report; no feedback that I can think of etc).
This resulted in three different textual corpora of uneven size. A subsequent text pre-
processing workflow was used to prepare the text for the analysis to each one of the corpora in
accordance with the prior literature (Guo et al., 2017; Tirunillai & Tellis, 2014). This included
(a) word text tokenization, (b) elimination of numbers and punctuation marks, (c) removal of
English language stop words (using the SMART stop-word list) as well as (d) removal of
context-specific stop words, such as the names of the companies in the sample and words
attributed to job roles. The resulted corpus was tagged using part-of-speech (POS) tagging.
Following the prior literature, token filtering was applied in order to keep only nouns, adverbs,
and adjectives as these are the parts-of-speech that contain information. For step (d) the
Stanford NLP parser was used. After pre-processing, the remaining words were lemmatized,
and filtering was applied in order to keep only those terms appearing in at least 1% of the initial
corpus. The final datasets are a set of Nprosstm=149,289 reviews for the positive,
Nnegstm=148,354 reviews for the negative and Nfeedstm =135,506 for the feedback to
management.
4.2 Estimating the Topic Solution
The topic solution was estimated in R with the STM package (Roberts, Stewart, and Tingley,
2017). Considering that all three parts of the textual feedback stem from the same author, the
assumption of a uniform number of topics across all three corpora was incorporated and
confirmed by the evaluation of each topic solution. As such, an iterative process to select and

29
evaluate the number of topics was followed (Roberts, Stewart, and Tingley, 2017), utilizing
three particular criteria: (a) Held-out likelihood: a measure on how the number of topics
explains the overall variability in each of the corpora; (b) Exclusivity of topic words to the
topic; and (c) Semantic coherence of the topic structure.
The estimation procedure was initialized with a spectral decomposition following the
algorithm of Lee & Mimno, (2014) to get an idea about the extensiveness of the number of
topics computed for each of the corpora (positive and negative feedback) and a seed vector of
the possible values for the candidate number of topics (K) was constructed. Considering that
the primary metadata associated with the employees’ textual feedback is the numerical rating
that captures the overall satisfaction, we used this and the employee’s status as the primary
prevalence covariates. For each of the corpora in the topic solution, the seed vector of the
number of topics had a range of Kmin=6 topics as a seed value, since this is the number of all
rating aspects that are provided by Glassdoor on its review interface and evaluated the held-
out likelihood for a maximum of Kmax=12 topics in the sample.
The candidate topic solutions with the highest held-out likelihood were then evaluated
against the ratio of their semantic coherence and exclusivity. Roberts et al. (2016) proposed a
combination of these measures through the FREX criterion, which considers a weighted
harmonic mean of a word’s rank in terms of exclusivity and frequency in a k-topic solution
(Equation 4).
𝐹𝑅𝐸𝑋𝑘,𝑢 = ( ω𝐸𝐶𝐷𝐹(β𝑘,𝑢/ ∑ β𝑗,𝑢𝑘𝑗=1 ) + 1 − ω𝐸𝐶𝐷𝐹(β𝑘,𝑢))−1
(4)
𝑊here 𝑘 ∈ 𝐾 is the k-th topic, u is the word under consideration, β is the topic-word
distribution for this topic, and ω is a prior used to impose exclusivity (in our case it was equal
to 0.3) in order to avoid highly correlated topics appearing in the topic solution.

30
After considering the above criteria (See Appendix A), a K=10 topic solution was found
to best describe the variability of each of the three corpora, subject to rating and employee
status. For the labeling of the topics, a two-step procedure was followed. First, two experts in
human resource management and organizational behavior were recruited to help on the labeling
of the topics, based on a discussion and reading of the top loading reviews from the topic
solution, estimated for each corpus. The second step involved a concordance study of the
assigned labels among a panel of 8 experts with substantial experience in human resource
management for travel and hospitality services. For each label, the pool of raters provided an
agreement (1) or disagreement (0) score with the assigned label. The resulted Cohen’s kappa
was κ=0.88, indicating an almost perfect agreement among the experts. Considering their
feedback, some of the topic labels were adjusted accordingly to reflect the topic content better.
In addition to the estimation of the topic-word and topic-document distribution, we
estimated the proportion that each topic reflects on the overall corpus. For the topic solution on
the positive feedback (Table 6), some topics occupy a significant portion in that corpus. More
specifically, intangible aspects such as the working environment (Topic #1), career
opportunities (Topic #2), and on-the-job aspects such as task variety (Topic #3) and flexibility
with scheduling (Topic #4) accounted for over 50% of the positive aspects of the textual
feedback. Tangible benefits such as compensation (Topic #5) and employee benefits (Topic #6
and Topic #7) accounted for less, highlighting the importance of intangible aspects of the work
environment in hospitality and tourism services on driving employee satisfaction. This result
is also supported by the insights provided in the previous analysis based on the numerical
ratings.
Negative points raised by the employees (Table 7) were mostly concentrated on issues
pertinent to management processes and communication (Topic #1) as well as the continuous
shift of management roles and managerial turnover (Topic #2). A surprising topic that emerged

31
from the topic solution was topic #8 related to customer behavior. As a high-interaction service
industry, customers’ challenging behavior has a direct effect on employees’ dissatisfaction with
their work. Therefore, not only employees moderate the consumption experience but also
customers moderate the work experience.
Table 6: Topic Solution for Positive Feedback
Topic # Topic Label Prop. (%) Top 7 Frex Words 1 Working Environment 16.51 great, staff, atmosphere, awesome, fun,
friendly, environment 2 Career Opportunities 15.34 opportunity, growth, culture, advancement,
training, many, room 3 Task Variety 11.71 always, guest, part, new, place, something,
people 4 Scheduling Flexibility 9.49 flexible, schedule, easy, coworkers, co-
worker, college, scheduling 5 Compensation 8.91 pretty, money, nice, busy, much, manager,
server 6 Employee Perks 8.37 free, discount, food, coffee, drink, meal,
shift 7 Benefits 8.05 health, benefits, pro, benefit, insurance,
better, bonus 8 Working Hours 7.71 hour, good, high, school, work, wage, job 9 Skills Development 7.18 customer, service, experience, skill, able,
fast, product 10 Work/Life Balance 6.73 day, week, month, store, long, night,
decent
Other issues that arose from the negative feedback involved particular issues of work
conditions such as scheduling (Topic #4) and working unsocial hours with limited rewards
(Topic #6). In comparison with the distribution of topics for the positive text provided by the
employees, the distribution of topics for the negative text seems to have a more uniform
distribution. In the subsequent section, we are evaluating how these distributions change (for
the positive and negative text topics) under the influence of two main covariates: Overall
Rating and Employee Status (Former vs. Current).
Table 7: Topic Solution for Negative Feedback.
Topic # Topic Label Prop. (%) Top 7 Frex Words

32
1 Leadership/Communication 13.49 upper, poor, lack, communication, leadership, management, corporate
2 Management Turnover 12.79 store, year, different, month, manager, first, something
3 Work/Life Balance 11.79 long, life, stressful, hour, balance, sometimes, work
4 Scheduling 9.93 back, day, call, one, right, even, front 5 Career Opportunities 9.26 great, little, opportunity, difficult,
con, advancement, position 6 Night Shifts and Tips 9.20 server, shift, night, tip, wage, food,
break 7 Employee Turnover 8.99 turnover, high, low, rate, extremely,
culture, salary 8 Customer Behavior 8.48 rude, customer, service, worker,
schedule, enough, amount 9 Benefits 8.41 much, really, car, lot, pretty,
insurance, good 10 Managerial Behavior 7.66 horrible, bad, managers, family,
favoritism, terrible, benefit
4.3 Assessing the Effect of Overall Rating and Employee Status on the Topic Distribution
The topic distribution, highlighted in the textual justification of employees’ online reviews for
both the positive and negative aspects, provides an overall picture of the main
satisfaction/dissatisfaction determinants. Following the estimation of the topic solution and
considering that STM allows us to model the dependence between topic prevalence and other
covariates, we investigate: (a) How does the topic distribution change when other factors are
considered?; (b) What are the dominant positive (or negative) topics that employees reflect
upon when they are overly satisfied (or overly dissatisfied)?; and finally, (c) How does the
topic distribution change between former and current employees?
An advantage of structural topic models, a contrast to LDA, is that they allow the
incorporation of covariates in the topic-document distribution. This is very important because
the fundamental assumption of a topic modeling application considers the case of
exchangeability in the textual feedback. Employees may use a particular topic as a dominant

33
theme in the text to reflect upon or may equally distribute their feedback (positive or negative)
between two or more topics. Having estimated the topic model solution, we can estimate
marginal effects in the topic distribution.
Figure 2: Marginal effects of overall rating (low to high) for the topic distribution of positive (upper)
and negative (lower) aspects of the review text. The dotted line represents the zero effect.
Figure 2 provides a graphical depiction of the marginal effects on the topic distribution
between low and high overall ratings. The dotted line represents the zero effect. The topics that
appear on the right side are those that are discussed more when the overall rating satisfaction
increases and the opposite stands for the left side topics. The horizontal axes show the marginal
effect, i.e. the positive feedback, where an increase of one unit in overall satisfaction signifies
an increase by almost 3% on the reviews that discuss mainly Career Opportunities. The same
effect is also observed for the discussion about Working Environment.

34
It is evident that for satisfied employees the prevalence of the topics related to Career
Opportunities and Working Environment is increasing (as a positive aspect of the job). When
ratings become lower, issues such as Employee Perks and Compensation tend to become more
dominant.
Figure 3: Marginal effects of employee status (former to current) for the topic distribution of positive
(upper) and negative (lower) aspects of the review text. The dotted line is the zero effect, and in our
case, the topics that are close to this line are the topics that do not differ between former and current
employees. The topics that are on the right side are those that were discussed more by current
employees and vice-versa for topics on the left side having been discussed mainly by former employees.
A similar result is observed in Figure 3 when assessing the impact of employee status
on the prevalence of topics. When it comes to the positive aspects of the job, current employees
discuss similar aspects with those reported for overly satisfied employees with career
opportunities (together with the benefits) being the dominant topic. This comes as no surprise
given the analysis in Section 3.2 regarding the significant drivers of employee turnover. For

35
former employees, the most negative topics discussed tend to cluster around managerial and
leadership issues as well as working during unsocial hours.
5. Job satisfaction and Financial Performance of Travel and Hospitality
Firms
Having assessed the drivers of employee satisfaction and dissatisfaction and employee
turnover, we turn our attention to the economic significance of employee ratings for travel and
hospitality firms. Based on the service-profit chain model (Heskett et al., 1994), we should
expect that more satisfied employees perform better; thus, influencing positively firm
performance. In high-contact services, this effect is expected to be higher due to the higher
interaction of employees with customers. At this point, the study aims to quantify the economic
effect of employee satisfaction on firm performance, taking into account the changes in overall
satisfaction rating. A couple of recent studies have seen this relationship, but they have been
conducted for the whole market and not for a specific sector (Huang et al., 2015; Symitsi et al.,
2018).
In order to explore this relationship, a subsample of the companies found in our dataset
is employed. The reason is that there is a total of 297,933 reviews spread across a 10-year
period for the 11,975 firms, meaning that for most of the companies there are no reviews for
many periods or the number of reviews is so limited that will induce bias to the information
derived. As such, following previous literature (Symitsi et al., 2018) a cutoff of 100 reviews
was selected for the whole period. For those companies, several financial data were collected
from Thomson Reuters Eikon Database. After omitting those that were found to report financial
results as part of the group of companies they belong to and those for which no financial data
were available, the final sample consisted of an unbalanced dataset of 78 firms. Corporate
performance is measured with ROA. For the effect of employee satisfaction, the average
overall rating employees provide for the specific company for a month is used. Controlling for

36
several financial variables that are used in the finance literature our full model has the following
form (Equation 5).
𝑅𝑂𝐴𝑖𝑡 = 𝐴𝑣𝑒𝑟𝑎𝑔𝑒𝑅𝑎𝑡𝑖𝑛𝑔𝑖𝑡−1 + 𝑇𝑜𝑡𝑎𝑙𝐴𝑠𝑠𝑒𝑡𝑠𝑖𝑡−1 + 𝐿𝑒𝑣𝑒𝑟𝑎𝑔𝑒𝑖𝑡−1 + 𝑅𝑂𝐴𝑖𝑡−1 + 𝐶𝐴𝑃𝐸𝑋𝑖𝑡−1 + 𝐹𝑖𝑟𝑚𝐴𝑔𝑒𝑖𝑡 + 𝑇 + 𝐶 + 𝜖𝑖𝑡 (5)
where 𝐴𝑣𝑒𝑟𝑎𝑔𝑒𝑅𝑎𝑡𝑖𝑛𝑔𝑖𝑡−1 is the mean rating of current employees6 for the company
for the previous year; 𝑇𝑜𝑡𝑎𝑙𝐴𝑠𝑠𝑒𝑡𝑠𝑖𝑡−1 is the logarithm of the total assets of the company for
the previous year; 𝐿𝑒𝑣𝑒𝑟𝑎𝑔𝑒𝑖𝑡−1 is the ratio Debt/Total Assets; 𝐶𝐴𝑃𝐸𝑋𝑖𝑡−1 refers to the capital
expenditures; 𝐹𝑖𝑟𝑚𝐴𝑔𝑒𝑖𝑡 is computed from the date of incorporation; 𝑇 is for time-fixed
effects; and 𝐶 is for industry-fixed effect based on the NAICS sector.
Three specifications were employed for this analysis. The baseline model (1) is for all
observations with more than one employee review. However, if only one review exists for the
examined period, the insufficient information that arrives from employees could be noisy and
may not capture the actual employee satisfaction for a particular firm. Therefore, for reasons
of robustness, we employ two subsamples where the first subsample (Model 2) is for all firms
with annual reviews above the 25th percentile (n ≥ 4 observations) and the second (Model 3)
for annual reviews equal to and above eight (n ≥ 8). Results (Table 8) reveal that in all cases
employee satisfaction has a statistically significant positive relationship with firm performance.
On average, an increase by one star in the overall rating of a company is linked with an increase
6 We take into consideration only the information that arrives from current employees as this information is representative of the financial period under examination. In the case of former employees while we know the calendar date the employee posted the review, we do not know his/her departure date from the company, as such those reviews should not represent up-to-date information. For example, an employee who may have left the company five years ago cannot articulate the current working conditions of a company. Therefore, to reduce the noise we used only current employees, and this is an approach that has been followed in the aforementioned previous relevant literature.

37
between 1.2 and 1.4 of ROA. Reverse causality is not an issue here, as lagged variables are
employed. Instead, a contemporaneous relationship could reveal dubious results, as higher
profitability may also lead to higher employee satisfaction, i.e., in the case of a better bonus.
Table 8: Employee Satisfaction and Firm Profitability
Dependent Variable: ROA t
Model (1) Model (2) Model (3) Average Rating t-1 1.199*
(0.533) 1.127* (0.545)
1.563* (0.771)
Leverage t-1 2.000** (0.561)
2.339** (0.597)
2.534** (0.796)
ROA t-1 0.592*** (0.076)
0.594*** (0.084)
0.562*** (0.093)
Total Assets t-1 -0.512 (0.294)
-0.201 (0.299)
-0.261 (0.351)
Firm Age t 0.066*** (0.020)
0.073*** (0.022)
0.056* (0.024)
CAPEX t-1 0.000 (0.000)
-0.004 (0.004)
0.000 (0.000)
Constant 2.152 (4.927)
-3.695 (4.830)
-1.667 (5.264)
Time Effects Yes Yes Yes Industry Effects Yes Yes Yes Observations 404 350 276 R2 0.49 0.57 0.57 Adjusted R2 0.47 0.55 0.54
Note: * p<0.05; ** p<0.01; *** p<0.001. Robust clustered (firm) standard errors in parentheses.
Considering other studies in the literature, which report that employee satisfaction is
the outcome of a company’s financial performance (see for example Schneider, Hanges, Smith,
& Salvaggio, 2003; Yee et al., 2008), we wanted to evaluate whether any reverse causality
issues would be exhibited. Using the econometric specification provided in equation (5), we
tested the reverse model shown in equation (6) below with the employee rating as a dependent
variable.

38
𝐴𝑣𝑒𝑟𝑎𝑔𝑒𝑅𝑎𝑡𝑖𝑛𝑔𝑖𝑡= 𝑅𝑂𝐴𝑖𝑡−1 + 𝐴𝑣𝑒𝑟𝑎𝑔𝑒𝑅𝑎𝑡𝑖𝑛𝑔𝑖𝑡−1 + 𝑇𝑜𝑡𝑎𝑙𝐴𝑠𝑠𝑒𝑡𝑠𝑖𝑡−1+ 𝐿𝑒𝑣𝑒𝑟𝑎𝑔𝑒𝑖𝑡−1 + 𝐶𝐴𝑃𝐸𝑋𝑖𝑡−1 + 𝐹𝑖𝑟𝑚𝐴𝑔𝑒𝑖𝑡 + 𝑇 + 𝐶 + 𝜖𝑖𝑡 (6)
Employing the same model identification procedure as in the previous specification,
the results are provided in Table 9.
Table 9: Robustness check for reverse causality
Dependent Variable: Average Rating t
Model (1) Model (2) Model (3) ROA t-1 0.001
(0.003) 0.005 (0.003)
0.002 (0.002)
Average Rating t-1 0.544*** (0.065)
0.588*** (0.066)
0.710*** (0.071)
Leverage t-1 -0.066 (0.052)
-0.093 (0.053)
-0.073 (0.042)
Total Assetst-1 0.021 (0.022)
0.019 (0.019)
0.032* (0.015)
Firm Age t -0.001 (0.002)
-0.004* (0.002)
-0.002 (0.002)
CAPEX t-1 0.000 (0.000)
0.000 (0.000)
0.000 (0.000)
Constant 1.171** (0.358)
1.034** (0.350)
0.568 (0.320)
Time Effects Yes Yes Yes Industry Effects Yes Yes Yes Observations 414 356 280 R2 0.34 0.40 0.54 Adjusted R2 0.31 0.36 0.51
Note: * p<0.05; ** p<0.01; *** p<0.001. Robust clustered (firm) standard errors in parentheses.
Results of all three models reveal no dependence between the current average rating
and the return on assets of the previous period when controlling for all the additional parameters
discussed in the previous specification.

39
6. Discussion and implications
6.1 Theoretical Implications
Our study contributes to the ever-growing stream of the tourism and hospitality literature,
which tackles with the perspective of service providers and human resource management
aspect of employees in this industry (Baum et al., 2016; Janta et al., 2011; Ladkin, 2011). The
results of our analysis reveal a set of important insights about the drivers of employee
satisfaction and dissatisfaction in the tourism and hospitality industry and their concomitant
effect on employee turnover. This has implications for research in this critical aspect of the
tourism and hospitality literature, which are outlined below.
The first theoretical implication of our study is that it is the first to concurrently evaluate the
relative importance of the satisfaction aspects extracted from the information content of online
employee reviews. While several studies have tried to rank the importance of these factors on
employee satisfaction (and subsequently employee turnover intentions), we were able to
evaluate the relative importance of these factors by utilizing both numerical ratings and textual
content. Hitherto, most studies explore the relationship among a specific factor and job
satisfaction or other relevant outcomes. Based on the numerical scales, our analysis shows that
some factors are better in explaining satisfaction while other factors are better predictors of
dissatisfaction. Following Herzberg’s two-factor motivation theory (Herzberg, Mausner, &
Snyderman, 2011), the compensation/salary and work-life balance are the “hygienes” for
employees, while high cultural values and leadership are the “motivators”, i.e., the factors that,
when present, significantly increase job satisfaction.
These findings are also in agreement with the topic analysis which reveals what the employees
discuss freely instead of the rating which constrains the information to specific scales. Again,

40
reviewers that provide a high satisfaction score significantly discussed less the
remuneration/benefits as positive factors, while also managerial factors such as
leadership/communication are discussed less as negative topics by highly satisfied employees.
The study also provides theoretical implications for the determinants of employee turnover. To
this end, our findings support the findings of previous studies that report that, although a high
dissatisfaction with pay exists in the industry, this has no significant relationship with employee
turnover (see, for example, Deery & Iverson, 1996; Riley, Lockwood, Powell-Perry, & Baker,
1998). As our analysis reveals, what mainly causes employees to leave a company is the lack
of opportunities for career advancement.
A second theoretical implication of our study considers the direction of causality
between employee satisfaction and financial performance. Our analysis clearly shows no
reverse causality in that aspect. Satisfied employees bring higher returns, especially in an
industry where service quality is a critical success factor. While a set of studies have found (see
for example Schneider et al.,2003; Yee et al., 2008) that a reverse link co-exists between job
satisfaction and financial performance, our study in the context of tourism and hospitality
shows that there is no such reciprocal link. Two major reasons can explain this. The first is the
industry effect and its associated employee turnover rate. As we discussed previously, tourism
and hospitality is an industry characterized by a high employee turnover rate and the
embeddedness in the workforce is minimal, since these jobs are characterized by part-time
working hours and seasonal occupation. Furthermore, the low barriers to entry in this particular
job, as well as the limited training required to be employed, impose a pressure in compensation.
These results provide theoretical support for the direct link of the service-profit model which
is confirmed empirically in our study. As such, researchers in the human resource management
aspect of the tourism and hospitality literature can evaluate this implication further by
considering the satisfaction aspects of the job role.

41
Finally, our study demonstrates the importance of online employee reviews (and social
media in general) as a reliable data source, which also has methodological advances when
compared to established measurement scales. As Matzler and Renzl (2007) argue, employee
satisfaction is a multidimensional construct and as such no single measurement instrument can
capture all the aspects of satisfaction that are context and industry-specific. As such,
researchers in tourism and hospitality human resources can focus their attention on employee
feedback expressed in job sites such as Glassdoor, which contains highly representative and
reliable information.
6.2 Managerial Implications: What should Hospitality and Tourism Firms Do?
In this study, we showcase the informational value of employee online reviews which can
complement information coming from internal metrics. This complementarity arises because
online reviews arrive at a higher frequency than internal surveys, but, most importantly,
because they offer unconstrained information through the review text offer. Therefore, online
reviews can be particularly valuable for firms in order to (a) validate the results of existing
internal metrics mostly based on primary data; (b) capture changes that may occur in the interim
period of the lower frequency internal metrics; (c) provide information for the adjustment of
internal metrics in case employees discuss topics beyond those currently measured; (d) address
employee silence issues; and (e) gain knowledge of the whole market, acting as a benchmark
for the performance of the company.
Considering the results of our analysis, managers need to act to increase employee
satisfaction and address the adverse effects of employee turnover and demotivation at work. In
order to give tangible guidelines, we utilize the feedback to management field that employees
provide on Glassdoor. Using the same topic-modeling approach discussed in Section (4), we
provide three main directions for improvement for tourism and hospitality companies.

42
The highest loading is for the discussion about employee treatment. Many employees
refer to the need to be respected, treated equally, and receive better behavior. “…stop treating
your employees like thieves, not everyone is trying to steal…”; “…start treating your employees
with respect and you will actually have less employee turnover…”; “…treat women with
respect, treat anyone with respect…”; “…employees are real people who need to be treated
with respect like real people…” are some of the many quotes that refer to this problem. Many
employees report that they receive negative treatment from their line managers, a fact that
signifies lack of training but also inappropriate policies and mechanisms for capturing such
behaviors.
To this direction, tourism and hospitality service providers should implement
mechanisms that will identify toxic behaviors. Such mechanisms could take the form of
anonymous hotlines where employees can report negative treatment towards them or towards
other employees, multi-source performance reviews (where employees can give feedback on
their bosses anonymously, i.e., 360 reviews), and post-exit interviews, among others. In
addition, open dialogue and discussion through communication and agreement of achievable
and agreed targets are critical management tools.
Lack of training and its connection with the high employee turnover rate is also revealed
in a separate topic. Representative reviews include reflections such as: “…new employee
training should be more straightforward…”; “…offer more elaborate training, there is basic
training mostly online…”; “…get additional training and training plans, following the training
plans, will prevent the outrageous turnover rates…” are what some employees say. It is
common knowledge that professionalism is an issue in this industry and in many cases,
employees in tourism and hospitality work part-time or on a temporary basis to cover their
financial needs (e.g., during their studies). As such, their relationship with a firm has an
expiration date, and thus they cannot imagine themselves being part of this company in the

43
future. Considering the nature of the employment in the specific industry, which is based
significantly on young people, online and social media recruitment strategies can be used for
both attracting applicants to fill vacancies but also for better screening of the applicants and
their fit with the organization (Ladkin & Buhalis, 2016).
It is also clear that firms fail to motivate employees and make the sector more attractive
as well as offer a long-time career prospect. Extant research has found that employee perception
of training program accessibility is positively related to their commitment level. Employees in
tourism and hospitality are more loyal to their organization when training programs upgrade
and develop their required skills (Dhar, 2015). Firms can employ several practices in this
direction, such as to support employee development through paid or subsidized courses,
webinars, job shadowing, mentoring, among others. In doing so, they communicate a message
to their employees that the latter is an essential part of the enterprise and they can have a career
within this company. In this direction, it is critical for firms to understand their employees’
actual needs and goals and then align training with those expectations (Yang, Wan, & Fu,
2012).
Employees also discuss compensatory aspects, such as better payment and reward for
their efforts. Typical quotes found in these reviews are: “…you should not be paying us
minimum wage but expect maximum efficiency…”; “…minimum wage is not sufficient to cover
one’s financial obligation…”; “…I am a very hard worker that makes the job done, and I’m
just looking for better opportunities, so I can support my family a little more financially…”.
Most companies do not monitor the financial situation of their employees and do not have an
understanding of the personal circumstances of their employees. Neither can they provide
solutions following a “stand-by-me” approach. Those firms fail to understand that their
employees are their sustainable competitive advantage and their interaction with customers
forms the tangible part of an intangible service (Kusluvan, Kusluvan, Ilhan, & Buyruk, 2010).

44
A direction for those firms is to make clear what is expected from their employees in order to
gain a better reward. In most cases, employees do not just ask for better wages but for
performance-based compensations. “…embrace the workers and reward the hard working…”,
“…recognize your hard workers and not your favorites…”; “…give more incentives for your
hard workers to continue work hard…” are some of their quotes, which signify that in many
cases productivity is not connected to rewards or the imposed criteria are not clear.
The effect of culture, leadership, and communication is also prevalent, and many
employee reviews reflect those values. Typical quotes include: “…listen to your associates.
The associates that are on your front line and have the interaction with your guest are your
most valuable assets. Do not get too focused on numbers and analytics when you have raw
data from your associates and your guests…”; “…when you say you would like feedback don’t
dismiss what is being said by them or talk over them because you don’t like or agree…”;
“…continue listening to your employees and assist their needs. Already doing a great job at
it…”. In many cases, employees ask for their active participation in the design and
implementation of the policies or product offerings. Firms should not only employ policies and
procedures where employees can express their opinions, but they should consider these
suggestions, rewarding smart ideas and outline implementation action plans or provide clear
justification when an idea cannot be applied. Here comes the crucial role of employee
empowerment that simultaneously improves operational performance and the employees’ work
experience (Cheung, Baum, & Wong, 2012; Lin, Wu, & Ling, 2017). Firms should direct their
focus on the implementation of strategies that will allow sharing of information, rewards, and
power with employees to make them more autonomous and eager to take initiative and make
their own decisions to facilitate the customer experience. While the design of HR policies,
which are already in place for most firms in our sample, focuses on continuous improvement
and evaluation of the company environment, it seems prevalent that a significant portion of

45
employees do not recognize those efforts, signifying that their implementation is unsuccessful
or that those policies do not address their actual issues.
7. Conclusions, Limitations and Future Research
Although online reviews have been extensively studied in extant tourism and hospitality
research, this is mainly done taking into consideration consumer evaluation, neglecting other
information that is shared online and is of interest to researchers and practitioners. A special
case of that information is found on employees’ electronic word of mouth about their current
and previous employers. Extant platforms, such as Glassdoor, allow access to millions of
reviews that rate thousands of companies, offering unprecedented opportunities to extend
research about the factors that increase job satisfaction/dissatisfaction and employee
turnover/attrition.
This study takes advantage of this opportunity and explores the tourism and hospitality
industry specifically, an industry with skill-deficiency and high employee turnover. The results
are robust, as both numerical rating and text point out in the same direction. i.e., the fact that
satisfied employees cite work environment culture, leadership, and career opportunities as what
their companies offer. These are also factors that reduce employee turnover. In specific, the
regression analysis revealed that a one-unit increase on the rating provided for career
opportunities reduces the likelihood of an employee leaving a company by 14.87%. The textual
analysis unveils that the discussion about career opportunities as a positive aspect increases
significantly when the overall satisfaction increases. On the other hand, the low ratings are
connected with more discussion about leadership, communication with management, and
managerial behavior in the negative text of the reviews. Tourism and hospitality firms should
take into consideration the factors revealed in online employee reviews if they want to increase
the job satisfaction of their employees and reduce employee turnover, which eventually leads
46
to higher financial performance. The “wisdom of employees”, expressed through the feedback
to management, prescribes specific HR policies that firms should follow.
While our study has extensively explored the above by utilizing a novel data set in both
the numerical rating and the information content of online reviews, it does not come without
limitations, pertinent to the nature of online reviews. A number of biases have been found to
govern consumer online reviews, such as self-selection (Li & Hitt, 2008) and response biases
(Hu et al., 2009). Interestingly the online reviews found in our sample do not follow the
established U-shaped distribution, giving an indication that may be free of these biases.
Secondly, the numerical scales for the subcategories in Glassdoor measure satisfaction with
career development, compensation and benefits, senior management, and work/life balance,
and culture values. Though these categories are important in explaining a big part of employee
satisfaction and employee turnover, several critical variables are still not measured, such as
working hours, work overload, role ambiguity, role conflict, etc. The topic analysis addressed
to some extent this limitation, as the free text employees provide gives rise to some other topics,
essential and relevant to tourism and hospitality research. Moreover, while we looked for direct
effects of the job satisfaction aspects, the literature has shown that some act as moderators and,
as such, exploring the moderating relationships of these factors needs to be addressed in future
research.
There are several future research avenues to extend this study. For example, the effect
of a managerial role on job satisfaction is another aspect that needs to be examined more
thoroughly. While we examined the satisfaction aspects in the industry as a whole in our
sample, considering the differences in perspective between managers and non-managers is
something that also needs to be addressed in future studies. Furthermore, within-sector
differences may be present, which might be linked to different locations and demographics of
the employees as well as employee service culture. While we were able to control for age and

47
education, considering that our sample is limited to US only employees, further cross-country
studies could be used to address regional and cultural differences. Moreover, an interesting
extension of the current findings could be on the examination of the effect of employee
satisfaction on operational performance and customer satisfaction and its
moderating/mediating effect on other important factors such as financial constraints and macro-
variables (Stamolampros & Korfiatis, 2019). Finally, as employee online reviews are
representative of all sectors of the economy, it will be interesting to examine cross-sectoral
differences between the factors the affect employee satisfaction in tourism and hospitality
industries and other sectors.

48
References
Alexander, M., MacLaren, A., O’Gorman, K., & Taheri, B. (2012). “He just didn’t seem to
understand the banter”: Bullying or simply establishing social cohesion? Tourism
Management, 33(5), 1245–1255.
Allen, D. G., Bryant, P. C., & Vardaman, J. M. (2010). Retaining talent: Replacing
misconceptions with evidence-based strategies. Academy of Management Perspectives,
24(2), 48–64.
Baum, T., Kralj, A., Robinson, R. N., & Solnet, D. J. (2016). Tourism workforce research: A
review, taxonomy and agenda. Annals of Tourism Research, 60, 1–22.
Belhassen, Y., & Shani, A. (2013). Substance abuse and job attitude among hotel workers:
Social labeling perspectives. Tourism Management, 34, 47–49.
Blei, D. M., Ng, A. Y., & Jordan, M. I. (2003). Latent Dirichlet Allocation. Journal of Machine
Learning Research, 3(Jan), 993–1022.
Brown, S. P., & Lam, S. K. (2008). A meta-analysis of relationships linking employee
satisfaction to customer responses. Journal of Retailing, 84(3), 243–255.
Bufquin, D., DiPietro, R., Orlowski, M., & Partlow, C. (2017). The influence of restaurant co-
workers’ perceived warmth and competence on employees’ turnover intentions: The
mediating role of job attitudes. International Journal of Hospitality Management, 60,
13–22.
Cascio, W. F. (1991). Costing human resources: The financial impact of behavior in
organizations (3rd ed.). Boston: PWS-Kent.
Cheung, C., Baum, T., & Wong, A. (2012). Relocating empowerment as a management
concept for Asia. Journal of Business Research, 65(1), 36–41.

49
Chi, C. G., & Gursoy, D. (2009a). Employee satisfaction, customer satisfaction, and financial
performance: An empirical examination. International Journal of Hospitality
Management, 28(2), 245–253.
Chi, C. G., & Gursoy, D. (2009b). How to help your graduates secure better jobs? An industry
perspective. International Journal of Contemporary Hospitality Management, 21(3),
308–322.
Chu, K. H., Baker, M. A., & Murrmann, S. K. (2012). When we are onstage, we smile: The
effects of emotional labor on employee work outcomes. International Journal of
Hospitality Management, 31(3), 906–915.
Cohen, G., Blake, R. S., & Goodman, D. (2016). Does turnover intention matter? Evaluating
the usefulness of turnover intention rate as a predictor of actual turnover rate. Review
of Public Personnel Administration, 36(3), 240–263.
Deery, M. A., & Iverson, R. (1996). Enhancing productivity: intervention strategies for
employee turnover. Productivity Management in Hospitality and Tourism, 68–95.
Dhar, R. L. (2015). Service quality and the training of employees: The mediating role of
organizational commitment. Tourism Management, 46, 419–430.
Díaz, E., Martín-Consuegra, D., & Esteban, Á. (2015). Perceptions of service cannibalisation:
The moderating effect of the type of travel agency. Tourism Management, 48, 329–342.
Elbaz, A. M., & Haddoud, M. Y. (2017). The role of wisdom leadership in increasing job
performance: Evidence from the Egyptian tourism sector. Tourism Management, 63,
66–76.
Gao, B., Li, X., Liu, S., & Fang, D. (2018). How power distance affects online hotel ratings:
The positive moderating roles of hotel chain and reviewers’ travel experience. Tourism
Management, 65, 176–186.
50
Guo, Y., Barnes, S. J., & Jia, Q. (2017). Mining meaning from online ratings and reviews:
Tourist satisfaction analysis using latent dirichlet allocation. Tourism Management, 59,
467–483.
Harris, L. C., & Reynolds, K. L. (2004). Jaycustomer behavior: an exploration of types and
motives in the hospitality industry. Journal of Services Marketing, 18(5), 339–357.
Harter, J. K., Schmidt, F. L., & Hayes, T. L. (2002). Business-unit-level relationship between
employee satisfaction, employee engagement, and business outcomes: a meta-analysis.
Journal of Applied Psychology, 87(2), 268.
Herzberg, F., Mausner, B., & Snyderman, B. B. (2011). The motivation to work (Vol. 1).
Transaction publishers.
Heskett, J. L., Jones, T. O., Loveman, G. W., Sasser, W. E., Schlesinger, L. A., & others.
(1994). Putting the service-profit chain to work. Harvard Business Review, 72(2), 164–
174.
Hom, P. W., Lee, T. W., Shaw, J. D., & Hausknecht, J. P. (2017). One hundred years of
employee turnover theory and research. Journal of Applied Psychology, 102(3), 530.
Hu, N., Zhang, J., & Pavlou, P. A. (2009). Overcoming the J-shaped distribution of product
reviews. Communications of the ACM, 52(10), 144–147.
Huang, M., Li, P., Meschke, F., & Guthrie, J. P. (2015). Family firms, employee satisfaction,
and corporate performance. Journal of Corporate Finance, 34, 108–127.
Huang, Y.-T., & Rundle-Thiele, S. (2014). The moderating effect of cultural congruence on
the internal marketing practice and employee satisfaction relationship: An empirical
examination of Australian and Taiwanese born tourism employees. Tourism
Management, 42, 196–206.
ILO. (2010). Developments and challenges in the hospitality and tourism sector. International
Labour Organization Geneva.
51
Ineson, E. M., Benke, E., & László, J. (2013). Employee loyalty in Hungarian hotels.
International Journal of Hospitality Management, 32, 31–39.
Jang, J., & George, R. T. (2012). Understanding the influence of polychronicity on job
satisfaction and turnover intention: A study of non-supervisory hotel employees.
International Journal of Hospitality Management, 31(2), 588–595.
Janta, H., Ladkin, A., Brown, L., & Lugosi, P. (2011). Employment experiences of Polish
migrant workers in the UK hospitality sector. Tourism Management, 32(5), 1006–1019.
Jung, T., Scott, T., Davies, H. T., Bower, P., Whalley, D., McNally, R., & Mannion, R. (2009).
Instruments for exploring organizational culture: A review of the literature. Public
Administration Review, 69(6), 1087–1096.
Karatepe, O. M., & Kilic, H. (2007). Relationships of supervisor support and conflicts in the
work–family interface with the selected job outcomes of frontline employees. Tourism
Management, 28(1), 238–252.
Karatepe, O. M., & Sokmen, A. (2006). The effects of work role and family role variables on
psychological and behavioral outcomes of frontline employees. Tourism Management,
27(2), 255–268.
Karatepe, O. M., Yorganci, I., & Haktanir, M. (2009). Outcomes of customer verbal aggression
among hotel employees. International Journal of Contemporary Hospitality
Management, 21(6), 713–733.
Kim, B. P., Murrmann, S. K., & Lee, G. (2009). Moderating effects of gender and
organizational level between role stress and job satisfaction among hotel employees.
International Journal of Hospitality Management, 28(4), 612–619.
Kim, H., Im, J., & Qu, H. (2018). Exploring antecedents and consequences of job crafting.
International Journal of Hospitality Management, 75, 18–26.

52
Kim, W. G., Leong, J. K., & Lee, Y.-K. (2005). Effect of service orientation on job satisfaction,
organizational commitment, and intention of leaving in a casual dining chain restaurant.
International Journal of Hospitality Management, 24(2), 171–193.
Kong, H., Jiang, X., Chan, W., & Zhou, X. (2018). Job satisfaction research in the field of
hospitality and tourism. International Journal of Contemporary Hospitality
Management, (Forthcoming).
Korfiatis, N., Stamolampros, P., Kourouthanassis, P., & Sagiadinos, V. (2019). Measuring
service quality from unstructured data: A topic modeling application on airline
passengers’ online reviews. Expert Systems with Applications, 116, 472–486.
Krakover, S. (2000). Partitioning seasonal employment in the hospitality industry. Tourism
Management, 21(5), 461–471.
Kusluvan, S., Kusluvan, Z., Ilhan, I., & Buyruk, L. (2010). The human dimension: A review
of human resources management issues in the tourism and hospitality industry. Cornell
Hospitality Quarterly, 51(2), 171–214.
Ladkin, A. (2011). Exploring tourism labor. Annals of Tourism Research, 38(3), 1135–1155.
Ladkin, A., & Buhalis, D. (2016). Online and social media recruitment: Hospitality employer
and prospective employee considerations. International Journal of Contemporary
Hospitality Management, 28(2), 327–345.
Lam, T., Baum, T., & Pine, R. (2003). Subjective norms: Effects on job satisfaction. Annals of
Tourism Research, 30(1), 160–177.
Lam, T., Zhang, H., & Baum, T. (2001). An investigation of employees’ job satisfaction: the
case of hotels in Hong Kong. Tourism Management, 22(2), 157–165.
Larsen, S., Marnburg, E., & Øgaard, T. (2012). Working onboard–Job perception,
organizational commitment and job satisfaction in the cruise sector. Tourism
Management, 33(3), 592–597.

53
Law, J., Pearce, P. L., & Woods, B. A. (1995). Stress and coping in tourist attraction employees.
Tourism Management, 16(4), 277–284.
Lee, C., & Way, K. (2010). Individual employment characteristics of hotel employees that play
a role in employee satisfaction and work retention. International Journal of Hospitality
Management, 29(3), 344–353.
Lee, C.-K., Song, H.-J., Lee, H.-M., Lee, S., & Bernhard, B. J. (2013). The impact of CSR on
casino employees’ organizational trust, job satisfaction, and customer orientation: An
empirical examination of responsible gambling strategies. International Journal of
Hospitality Management, 33, 406–415.
Lee, G., Kim, P. B., & Perdue, R. R. (2016). A longitudinal analysis of an accelerating effect
of empowerment on job satisfaction: Customer-contact vs. non-customer-contact
workers. International Journal of Hospitality Management, 57, 1–8.
Lee, M., & Mimno, D. (2014). Low-dimensional Embeddings for Interpretable Anchor-based
Topic Inference. In Proceedings of the 2014 Conference on Empirical Methods in
Natural Language Processing (EMNLP) (pp. 1319–1328). Doha, Qatar: Association
for Computational Linguistics.
Lee, T. W., Hom, P. W., Eberly, M. B., Li, J. (Jason), & Mitchell, T. R. (2017). On the next
decade of research in voluntary employee turnover. Academy of Management
Perspectives, 31(3), 201–221.
Li, L., & Tse, E. (1998). Antecedents and consequences of expatriate satisfaction in the Asian
Pacific. Tourism Management, 19(2), 135–143.
Li, X., & Hitt, L. M. (2008). Self-selection and information role of online product reviews.
Information Systems Research, 19(4), 456–474.

54
Lin, J.-H., Wong, J.-Y., & Ho, C. (2013). Promoting frontline employees’ quality of life:
Leisure benefit systems and work-to-leisure conflicts. Tourism Management, 36, 178–
187.
Lin, M., Wu, X., & Ling, Q. (2017). Assessing the effectiveness of empowerment on service
quality: A multi-level study of Chinese tourism firms. Tourism Management, 61, 411–
425.
Lindeman, R., Merenda, P., & Gold, R. (1980). Introduction to bivariate and multivariate
analysis. Scott, Foresman.
Lu, A. C. C., & Gursoy, D. (2016). Impact of job burnout on satisfaction and turnover intention:
Do generational differences matter? Journal of Hospitality & Tourism Research, 40(2),
210–235.
Maertz Jr, C. P., & Griffeth, R. W. (2004). Eight motivational forces and voluntary turnover:
A theoretical synthesis with implications for research. Journal of Management, 30(5),
667–683.
Marchante, A. J., Ortega, B., & Pagán, R. (2006). Determinants of skills shortages and hard-
to-fill vacancies in the hospitality sector. Tourism Management, 27(5), 791–802.
Matzler, K., & Renzl, B. (2007). Assessing asymmetric effects in the formation of employee
satisfaction. Tourism Management, 28(4), 1093–1103.
McNamara, M., Bohle, P., & Quinlan, M. (2011). Precarious employment, working hours,
work-life conflict and health in hotel work. Applied Ergonomics, 42(2), 225–232.
McPhail, R., Patiar, A., Herington, C., Creed, P., & Davidson, M. (2015). Development and
initial validation of a hospitality employees’ job satisfaction index: Evidence from
Australia. International Journal of Contemporary Hospitality Management, 27(8),
1814–1838.

55
Milliken, F. J., Morrison, E. W., & Hewlin, P. F. (2003). An exploratory study of employee
silence: Issues that employees don’t communicate upward and why. Journal of
Management Studies, 40(6), 1453–1476.
Nadiri, H., & Tanova, C. (2010). An investigation of the role of justice in turnover intentions,
job satisfaction, and organizational citizenship behavior in hospitality industry.
International Journal of Hospitality Management, 29(1), 33–41.
Namasivayam, K., & Zhao, X. (2007). An investigation of the moderating effects of
organizational commitment on the relationships between work–family conflict and job
satisfaction among hospitality employees in India. Tourism Management, 28(5), 1212–
1223.
Narangajavana, Y., Fiol, L. J. C., Tena, M. Á. M., Artola, R. M. R., & García, J. S. (2017). The
influence of social media in creating expectations. An empirical study for a tourist
destination. Annals of Tourism Research, 65, 60–70.
Øgaard, T., Marnburg, E., & Larsen, S. (2008). Perceptions of organizational structure in the
hospitality industry: Consequences for commitment, job satisfaction and perceived
performance. Tourism Management, 29(4), 661–671.
O’Neill, J. W., & Xiao, Q. (2010). Effects of organizational/occupational characteristics and
personality traits on hotel manager emotional exhaustion. International Journal of
Hospitality Management, 29(4), 652–658.
Pan, F. C. (2015). Practical application of importance-performance analysis in determining
critical job satisfaction factors of a tourist hotel. Tourism Management, 46, 84–91.
Poulston, J. M. (2008). Hospitality workplace problems and poor training: a close relationship.
International Journal of Contemporary Hospitality Management, 20(4), 412–427.

56
Poulston, J. M. (2009). Working conditions in hospitality: Employees’ views of the
dissatisfactory hygiene factors. Journal of Quality Assurance in Hospitality & Tourism,
10(1), 23–43.
Riley, M., Lockwood, A., Powell-Perry, J., & Baker, M. (1998). Job satisfaction, organisation
commitment and occupational culture: a case from the UK pub industry. Progress in
Tourism and Hospitality Research, 4(2), 159–168.
Roberts, M. E., Stewart, B. M., & Airoldi, E. M. (2016). A Model of Text for Experimentation
in the Social Sciences. Journal of the American Statistical Association, 111(515), 988–
1003.
Roberts, M. E., Stewart, B. M., & Tingley, D. (2017). stm: R Package for Structural Topic
Models. Retrieved from http://www.structuraltopicmodel.com
Robinson, R. N., & Beesley, L. G. (2010). Linkages between creativity and intention to quit:
An occupational study of chefs. Tourism Management, 31(6), 765–776.
Ruizalba, J. L., Bermúdez-González, G., Rodríguez-Molina, M. A., & Blanca, M. J. (2014).
Internal market orientation: An empirical research in hotel sector. International Journal
of Hospitality Management, 38, 11–19.
Schneider, B., Hanges, P. J., Smith, D. B., & Salvaggio, A. N. (2003). Which comes first:
employee attitudes or organizational financial and market performance? Journal of
Applied Psychology, 88(5), 836.
Song, Z., Chon, K., Ding, G., & Gu, C. (2015). Impact of organizational socialization tactics
on newcomer job satisfaction and engagement: Core self-evaluations as moderators.
International Journal of Hospitality Management, 46, 180–189.
Sparks, B. A., So, K. K. F., & Bradley, G. L. (2016). Responding to negative online reviews:
The effects of hotel responses on customer inferences of trust and concern. Tourism
Management, 53, 74–85.

57
Sparrowe, R. T. (1994). Empowerment in the hospitality industry: An exploration of
antecedents and outcomes. Hospitality Research Journal, 17(3), 51–73.
Spinelli, M. A., & Canavos, G. C. (2000). Investigating the Relationhip between Employee
Satisfaction and Guest Satisfaction. Cornell Hotel and Restaurant Administration
Quarterly, 41(6), 29–33.
Sridhar, S., & Srinivasan, R. (2012). Social influence effects in online product ratings. Journal
of Marketing, 76(5), 70–88.
Stamolampros, P., & Korfiatis, N. (2018). Exploring the Behavioral Drivers of Review
Valence: The Direct and Indirect Effects of Multiple Psychological Distances.
International Journal of Contemporary Hospitality Management, 30(10), 3083–3099.
Stamolampros, P., & Korfiatis, N. (2019). Airline service quality and economic factors: An
ARDL approach on US airlines. Journal of Air Transport Management, 77, 24–31.
Stamolampros, P., Korfiatis, N., Chalvatzis, K., & Bouhalis, D. (2019). Harnessing the
“Wisdom of Employees” from Online Reviews. Annals of Tourism Research,
Forthcoming.
Stamolampros, P., Korfiatis, N., Kourouthanassis, P., & Symitsi, E. (2019). Flying to Quality:
Cultural Influences on Online Reviews. Journal of Travel Research, 58(3).
Symitsi, E., Stamolampros, P., & Daskalakis, G. (2018). Employees’ online reviews and equity
prices. Economics Letters, 162, 53–55.
Tepeci, M., & Bartlett, A. B. (2002). The hospitality industry culture profile: a measure of
individual values, organizational culture, and person–organization fit as predictors of
job satisfaction and behavioral intentions. International Journal of Hospitality
Management, 21(2), 151–170.

58
Tirunillai, S., & Tellis, G. J. (2014). Mining Marketing Meaning from Online Chatter: Strategic
Brand Analysis of Big Data Using Latent Dirichlet Allocation. Journal of Marketing
Research, 51(4), 463–479.
Tsaur, S.-H., & Yen, C.-H. (2018). Work–leisure conflict and its consequences: Do
generational differences matter? Tourism Management, 69, 121–131.
Viglia, G., Minazzi, R., Buhalis, D. (2016). The influence of e-word-of-mouth on hotel
occupancy rate. International Journal of Contemporary Hospitality Management,
28(9), 2035–2051.
Yang, J.-T. (2010). Antecedents and consequences of job satisfaction in the hotel industry.
International Journal of Hospitality Management, 29(4), 609–619.
Yang, J.-T., Wan, C.-S., & Fu, Y.-J. (2012). Qualitative examination of employee turnover and
retention strategies in international tourist hotels in Taiwan. International Journal of
Hospitality Management, 31(3), 837–848.
Yee, R. W., Yeung, A. C., & Cheng, T. E. (2008). The impact of employee satisfaction on
quality and profitability in high-contact service industries. Journal of Operations
Management, 26(5), 651–668.
Yeh, C. M. (2013). Tourism involvement, work engagement and job satisfaction among
frontline hotel employees. Annals of Tourism Research, 42, 214–239.
Youn, H., Lee, K., & Lee, S. (2018). Effects of corporate social responsibility on employees in
the casino industry. Tourism Management, 68, 328–335.
Zhao, X., & Ghiselli, R. (2016). Why do you feel stressed in a “smile factory”? Hospitality job
characteristics influence work–family conflict and job stress. International Journal of
Contemporary Hospitality Management, 28(2), 305–326.

59
Zopiatis, A., Constanti, P., & Theocharous, A. L. (2014). Job involvement, commitment,
satisfaction and turnover: Evidence from hotel employees in Cyprus. Tourism
Management, 41, 129–140.

60
Appendix A: Diagnostic values for the number of topics in the topic solution
Note: The plot describes the diagnostic values in terms of Held-out Likelihood, Semantic Coherence, Lower Bound for word importance and the residuals obtained for the full model. As can be
seen, the best combination is achieved when the number of topics (K) is 10, as this provides the best relationship between the held-out likelihood and semantic coherence

61
Appendix B
Descriptive statistics of our sample for broken down by sector / industry and employee status (Current, Former).
Current Employees (M, SD) Former Employees (M, SD)
Sector / Industry
% of Sample
Overall Rating
Career Ops.
Comp. Benefits
Senior Lead.
Work Life
Culture Values
Overall Rating
Career Ops
Comp. Benefits
Senior Lead.
Work Life
Culture Values
Restaurants, Bars & Food Services
Casual Restaurants 32.24 3.51 (1.22)
3.24 (1.33)
3.01 (1.29)
3.14 (1.40)
3.26 (1.34)
3.54 (1.38)
3.07 (1.27)
2.76 (1.30)
2.66 (1.26)
2.64 (1.40)
2.93 (1.36)
3.08 (1.44)
Catering & Food Service Contractors
4.17 3.43 (1.31)
3.24 (1.39)
3.13 (1.27)
3.08 (1.47)
3.26 (1.38)
3.38 (1.45)
2.83 (1.36)
2.63 (1.34)
2.72 (1.29)
2.45 (1.42)
2.79 (1.41)
2.75 (1.47)
Convenience Stores & Truck Stops
1.56 3.53 (1.27)
3.43 (1.33)
3.50 (1.34)
3.22 (1.41)
3.05 (1.37)
3.58 (1.42)
3.01 (1.39)
2.89 (1.41)
3.05 (1.41)
2.59 (1.46)
2.67 (1.38)
2.93 (1.53)
Fast-Food & Quick-Service Restaurants
29.17 3.47 (1.21)
3.15 (1.32)
2.89 (1.37)
3.05 (1.38)
3.25 (1.33)
3.47 (1.40)
3.16 (1.25)
2.76 (1.31)
2.57 (1.30)
2.70 (1.38)
3.06 (1.34)
3.10 (1.43)
Upscale Restaurants 1.58 3.67 (1.26)
3.38 (1.34)
3.35 (1.27)
3.34 (1.44)
3.40 (1.32)
3.61 (1.41)
3.15 (1.36)
2.81 (1.34)
2.97 (1.29)
2.73 (1.47)
2.89 (1.37)
3.04 (1.49)
Travel & Tourism
Airlines 4.7 3.57 (1.29)
3.37 (1.33)
3.36 (1.28)
3.07 (1.44)
3.36 (1.33)
3.48 (1.43)
3.19 (1.36)
3.00 (1.37)
3.16 (1.33)
2.65 (1.44)
3.01 (1.39)
3.11 (1.50)
Bus Transportation Services 0.88 3.16 (1.28)
2.87 (1.38)
2.87 (1.33)
2.73 (1.41)
3.05 (1.43)
2.93 (1.45)
2.82 (1.36)
2.62 (1.35)
2.80 (1.36)
2.36 (1.43)
2.71 (1.45)
2.57 (1.43)
Camping & RV Parks 0.03 3.86 (1.21)
3.27 (1.52)
3.23 (1.23)
3.52 (1.43)
3.46 (1.36)
3.59 (1.41)
2.60 (1.55)
2.26 (1.12)
2.30 (1.10)
2.40 (1.50)
2.71 (1.38)
2.34 (1.36)
Car Rental 4.29 3.45 (1.25)
3.68 (1.29)
3.30 (1.25)
3.31 (1.39)
2.71 (1.42)
3.58 (1.39)
2.83 (1.22)
3.07 (1.30)
2.78 (1.20)
2.63 (1.33)
2.15 (1.23)
2.92 (1.40)
Charter Air Travel 0.43 3.17 (1.41)
2.94 (1.43)
3.08 (1.28)
2.78 (1.52)
3.01 (1.36)
3.06 (1.49)
2.69 (1.39)
2.42 (1.30)
2.77 (1.26)
2.24 (1.40)
2.62 (1.38)
2.56 (1.47)
Cruise Ships 0.5 3.54 (1.38)
3.30 (1.43)
3.26 (1.28)
3.09 (1.42)
3.11 (1.34)
3.37 (1.45)
2.97 (1.45)
2.80 (1.41)
3.00 (1.28)
2.49 (1.43)
2.52 (1.37)
2.86 (1.54)
Hotels, Motels, & Resorts 17.27 3.65 (1.28)
3.43 (1.38)
3.31 (1.31)
3.29 (1.45)
3.38 (1.35)
3.68 (1.41)
3.12 (1.37)
2.89 (1.38)
2.96 (1.33)
2.71 (1.47)
2.93 (1.38)
3.11 (1.52)
Passenger Rail 0.22 3.26 (1.31)
2.99 (1.45)
3.59 (1.28)
2.57 (1.36)
3.14 (1.45)
2.76 (1.39)
2.98 (1.37)
2.94 (1.35)
3.51 (1.36)
2.45 (1.36)
3.09 (1.41)
2.68 (1.40)
Taxi & Limousine Services 0.27 3.42 (1.48)
3.12 (1.52)
2.92 (1.40)
3.21 (1.57)
3.34 (1.40)
3.32 (1.58)
2.50 (1.44)
2.13 (1.29)
2.31 (1.31)
2.19 (1.44)
2.55 (1.44)
2.34 (1.46)
Travel Agencies 2.7 3.72 (1.39)
3.50 (1.44)
3.43 (1.30)
3.49 (1.51)
3.66 (1.37)
3.77 (1.46)
2.74 (1.41)
2.51 (1.35)
2.74 (1.29)
2.40 (1.47)
2.83 (1.42)
2.74 (1.51)

62
Appendix C: Relative Importance of Explanatory Variables
Note: The plot describes the relative importance of the five job elements measurements scales to the overall satisfaction. The computation is based on partial R2 partitioned by averaging over
orders also known as the LMG metric (Lindeman et al., 1980).