The charge-transfer states in a stacked nucleobase dimer complex: A benchmark study
11
The Charge-Transfer States in a Stacked Nucleobase Dimer Complex: A Benchmark Study ADE ´ LIA J. A. AQUINO, 1,2 DANA NACHTIGALLOVA, 3 PAVEL HOBZA, 3 DONALD G. TRUHLAR, 4 CHRISTOF HA ¨ TTIG, 5 HANS LISCHKA 1,3 1 Institute for Theoretical Chemistry, University of Vienna, Wa¨hringer Straße 17, A-1090 Vienna, Austria 2 Institute of Soil Research, University of Natural Resources and Life Sciences Vienna, Peter-Jordan-Straße 82, A-1190 Vienna, Austria 3 Institute of Organic Chemistry and Biochemistry, Academy of Sciences of the Czech Republic and Center for Biomolecules and Complex Molecular Systems, Flemingovo nam. 2, 166 10 Prague 6, Czech Republic 4 Department of Chemistry and Supercomputing Institute, University of Minnesota, Minneapolis, Minnesota 55455-0431 5 Lehrstuhl fu¨r Theoretische Chemie, Ruhr-Universita¨t Bochum, Universita¨tsstrasse 150, D-44801 Bochum, Germany Received 9 August 2010; Revised 27 September 2010; Accepted 1 October 2010 DOI 10.1002/jcc.21702 Published online 29 November 2010 in Wiley Online Library (wileyonlinelibrary.com). Abstract: Electronic singlet excitations of stacked adenine–thymine (AT) and guanine–cytosine (GC) complexes have been investigated with respect to local excitation and charge-transfer (CT) characters. Potential energy curves for rigid displacement of the nucleobases have been computed to establish the distance dependence of the CT states. The second-order algebraic diagrammatic construction [ADC(2)] method served as reference approach for compari- son to a selected set of density functionals used within the time-dependent density functional theory (TD-DFT). Particular attention was dedicated to the performance of the recently developed family of M06 functionals. The calculations for the stacked complexes show that at the ADC(2) level, the lowest CT state is S 6 for the AT and as S 4 for the GC pair. At the reference geometry, the actual charge transferred is found to be 0.73 e for AT. In case of GC, this amount is much smaller (0.17 e). With increasing separation of the two nucleobases, the CT state is strongly destabilized. The M06-2X version provides a relatively good reproduction of the ADC(2) results. It avoids the serious overstabilization and overcrowding of the spectrum found with the B3LYP functional. On the other hand, M06-HF destabilizes the CT state too strongly. TD-DFT/M06-2X calculations in solution (heptane, isoquino- line, and water) using the polarizable continuum model show a stabilization of the CT state and an increase in CT character with increasing polarity of the solvent. q 2010 Wiley Periodicals, Inc. J Comput Chem 32: 1217–1227, 2011 Key words: charge transfer; excited states; coupled cluster; DFT; stacked nucleobases Additional Supporting Information may be found in the online version of this article. Correspondence to: A. J. A. Aquino; e-mail: [email protected] or H. Lischka; e-mail: [email protected] Contract/grant sponsor: Austrian Science Fund [Special Research Pro- grams F16 (Advanced Light Sources) and F41 (ViCoM)] and contract/ grant number: P18411-N19 Contract/grant sponsor: German Research Foundation (priority program SPP 1315); contract/grant number: GE 1676/1-1 Contract/grant sponsors: Ministry of Education of the Czech Republic (Center for Biomolecules and Complex Molecular Systems, LC512) and Praemium Academiae of the Academy of Sciences of the Czech Republic awarded to PH in 2007 Contract/grant sponsor: Institute of Organic Chemistry and Biochemistry of the Academy of Sciences of the Czech Republic; contract/grant number: research project Z40550506 Contract/grant sponsor: U. S. National Science Foundation; contract/grant number: CHE09-56776 Contract/grant sponsor: Vienna Scientific Cluster; contract/grant numbers: 70019 and 70151 q 2010 Wiley Periodicals, Inc.
-
Upload
independent -
Category
Documents
-
view
4 -
download
0
Transcript of The charge-transfer states in a stacked nucleobase dimer complex: A benchmark study
The Charge-Transfer States in a Stacked Nucleobase
Dimer Complex: A Benchmark Study
ADELIA J. A. AQUINO,1,2 DANA NACHTIGALLOVA,3 PAVEL HOBZA,3 DONALD G. TRUHLAR,4
CHRISTOF HATTIG,5 HANS LISCHKA1,3
1Institute for Theoretical Chemistry, University of Vienna, Wahringer Straße 17, A-1090 Vienna,Austria
2Institute of Soil Research, University of Natural Resources and Life Sciences Vienna,Peter-Jordan-Straße 82, A-1190 Vienna, Austria
3Institute of Organic Chemistry and Biochemistry, Academy of Sciences of the Czech Republicand Center for Biomolecules and Complex Molecular Systems, Flemingovo nam. 2, 166 10
Prague 6, Czech Republic4Department of Chemistry and Supercomputing Institute, University of Minnesota, Minneapolis,
Minnesota 55455-04315Lehrstuhl fur Theoretische Chemie, Ruhr-Universitat Bochum, Universitatsstrasse 150, D-44801
Bochum, Germany
Received 9 August 2010; Revised 27 September 2010; Accepted 1 October 2010DOI 10.1002/jcc.21702
Published online 29 November 2010 in Wiley Online Library (wileyonlinelibrary.com).
Abstract: Electronic singlet excitations of stacked adenine–thymine (AT) and guanine–cytosine (GC) complexes
have been investigated with respect to local excitation and charge-transfer (CT) characters. Potential energy curves
for rigid displacement of the nucleobases have been computed to establish the distance dependence of the CT states.
The second-order algebraic diagrammatic construction [ADC(2)] method served as reference approach for compari-
son to a selected set of density functionals used within the time-dependent density functional theory (TD-DFT).
Particular attention was dedicated to the performance of the recently developed family of M06 functionals. The
calculations for the stacked complexes show that at the ADC(2) level, the lowest CT state is S6 for the AT and as
S4 for the GC pair. At the reference geometry, the actual charge transferred is found to be 0.73 e for AT. In case of
GC, this amount is much smaller (0.17 e). With increasing separation of the two nucleobases, the CT state is
strongly destabilized. The M06-2X version provides a relatively good reproduction of the ADC(2) results. It avoids
the serious overstabilization and overcrowding of the spectrum found with the B3LYP functional. On the other
hand, M06-HF destabilizes the CT state too strongly. TD-DFT/M06-2X calculations in solution (heptane, isoquino-
line, and water) using the polarizable continuum model show a stabilization of the CT state and an increase in CT
character with increasing polarity of the solvent.
q 2010 Wiley Periodicals, Inc. J Comput Chem 32: 1217–1227, 2011
Key words: charge transfer; excited states; coupled cluster; DFT; stacked nucleobases
Additional Supporting Information may be found in the online version of
this article.
Correspondence to: A. J. A. Aquino; e-mail: [email protected]
or H. Lischka; e-mail: [email protected]
Contract/grant sponsor: Austrian Science Fund [Special Research Pro-
grams F16 (Advanced Light Sources) and F41 (ViCoM)] and contract/
grant number: P18411-N19
Contract/grant sponsor: German Research Foundation (priority program
SPP 1315); contract/grant number: GE 1676/1-1
Contract/grant sponsors: Ministry of Education of the Czech Republic
(Center for Biomolecules and Complex Molecular Systems, LC512) and
Praemium Academiae of the Academy of Sciences of the Czech Republic
awarded to PH in 2007
Contract/grant sponsor: Institute of Organic Chemistry and Biochemistry of
the Academy of Sciences of the Czech Republic; contract/grant number:
research project Z40550506
Contract/grant sponsor: U. S. National Science Foundation; contract/grant
number: CHE09-56776
Contract/grant sponsor: Vienna Scientific Cluster; contract/grant numbers:
70019 and 70151
q 2010 Wiley Periodicals, Inc.
Introduction
The last decade has witnessed remarkable advances in the field
of photophysics and photochemistry of nucleic acids in both
theory and experiment. The nature of the electronically excited
states of these systems is of major importance because of the
fact that the reactivity of DNA bases in the excited state can
lead to serious damage of the nucleic acids and to alteration of
the genetic code. It is now well established that isolated nucleo-
bases are photostable because of ultrafast (few ps) deactivation
from the lowest excited singlet states to the electronic ground
state because of the existence of ultrafast nonradiative relaxation
mechanisms.1–6
Interaction of nucleobases in their excited states via inter-
strand hydrogen bonding and intrastrand stacking result in addi-
tional mechanisms of self-protection of nucleic acid bases from
UV damage by opening new decay channels.7–10 Time-resolved
spectra of both single- and double-stranded DNA oligomers and
polymers clearly demonstrate the existence of different excited
state dynamics of bases in stacking interactions when compared
with isolated DNA bases.11,12 The nature of these interactions
and their dynamics is, however, still a matter of intense discus-
sion. Intrastrand excimer formation connected with charge-trans-
fer (CT) character have played a major role in the interpretation
of experiments, but delocalized excitons have also been pro-
posed to play a role as well.10 It follows that a number of ques-
tions still need to be answered, in particular, on (i) the character
of excited states during the UV absorption process, (ii) the
degree of delocalization, (iii) the role of geometry relaxation on
the nature of an excited state, (iv) the CT effect in the excited
state dynamics, and (v) the role of dark states.
Theoretical methods have played an important role in clarify-
ing the mechanisms of the photostability of single nucleobases.
High-level multireference methods such as complete active space
self-consistent field, CAS with perturbation theory to second order
(CASPT2), and multireference configuration interaction have been
used.3–6,13,14 Fleig et al.15 have investigated the excited states of
the nucleobases with the approximate coupled cluster singles-and-
doubles method CC2.16 Other computational research on the char-
acter of the excited states in stacking interactions has been pub-
lished recently as well.17–21 To investigate similar questions of
photostability beyond single bases requires methods that are still
accurate enough to properly describe excited states and the inter-
actions of excited state molecules but are capable of treating sig-
nificantly larger systems. Unfortunately, the size of these systems
prevents the extensive use (e.g., see refs. 21–23) of the highly cor-
related methods just mentioned. In most cases, less time-consum-
ing methods have to be applied.
Density functional theory (DFT) methods would be a natural
choice for studying larger systems. For example, Tonzani and
Schatz24 used molecular dynamics simulations combined with
time-dependent density functional theory (TD-DFT) calculations
for the (dA)11 oligomer, and absorption and emission spectra were
calculated using the polarized continuum model (PCM) and TD-
DFT/PBE0 on stacked dimers and trimers of adenine.25 It has been
suggested that geometry relaxation results in the localization of the
originally delocalized excited state on a single base. However, the
TD-DFT method requires a careful selection of the functional for
the correct treatment of the CT character of the excited states.
Standard functionals are known to fail.26–28 Various attempts have
been made to solve this problem to obtain a satisfactory description
of CT in nucleobase oligomers. Extensive investigation of CT arti-
facts of the TD-DFT/PBE0 method can be found in ref. 29 together
with successful applications of long-range corrections to remove
the overstabilization of CT states. In calculations of (dA)2.(dT)2oligomers, in which both hydrogen bonding and stacking interac-
tions were considered,30 the reliability of the PBE0 functional for
describing the UV absorption spectrum was compared with that
obtained from M05-2X calculations.31 The recently introduced
M06 suite of density functionals32,33 has been shown to provide
very good results for noncovalent interactions in general and, more-
over, has been developed also for calculations of electronic excita-
tions. The (TD-)DFT/M06 approach thus represents a promising
tool for calculations of ground and excited state properties of differ-
ent types of noncovalent complexes including various structural
types of DNA base pairs and oligomers. Further, the method can be
efficiently combined with polarizable continuum methods for a
global description of the surrounding environment.
In spite of this progress, extensive testing and benchmarkingof these and future DFT methods is necessary. The purpose ofthis work is to provide extended benchmark results for excitationenergies, oscillator strengths, and characters of the low-lying sin-glet excited states of the nucleobase pairs, including the just-dis-cussed CT states in excimer complexes of DNA bases. The diffi-culties of using multireference methods in such cases, which arecaused by a prohibitive computational effort, have already beenmentioned above. The approximate coupled cluster singles-and-doubles model CC216 and the second-order algebraic diagram-matic construction [ADC(2)]34 with the resolution of the identityhave been proven as reliable and cost-effective methods for cal-culating excited states of larger molecules.35,36
As benchmark systems for exploring CT states, two stacked
dimers, adenine–thymine (AT) and guanine–cytosine (GC), have
been selected. Besides the characterization of vertical electronic
excitations, the dependence of excited states on the distance
between the stacked nucleobases, with particular emphasis on
the CT states, is also investigated. These calculations should
allow first assessments of the performance of computational
methods concerning interactions over larger distances in DNA
and concerning states delocalized over several base units.
This article is organized as follows: (i) a survey of the per-
formance of various methods for vertical excitations in individ-
ual bases is given, (ii) based on this experience, vertical excita-
tions in the stacked complexes are discussed, (iii) potential
curves for rigid displacement between bases are presented, and
(iv) solvent effects are investigated for selected cases.
Computational Details
The reference geometries of the AT and CG dimers (see Scheme
1 for structures and numbering) used in the vertical excitation
calculations were taken from a ground state of B-DNA structure
optimized at Møller-Plesset perturbation theory to second-order
MP2/TZVPP level for AT37 and from an experimental structure
determined from NMR measurements for the CG dimer.38 The
nucleobases are not methylated.
1218 Aquino et al. • Vol. 32, No. 7 • Journal of Computational Chemistry
Journal of Computational Chemistry DOI 10.1002/jcc
The calculations were performed at RI-CC216,39–41 (only for
isolated base monomers), RI-ADC(2)34,42–44, and TD-DFT45–48
levels of theory. In the last case, the hybrid functionals B3-
LYP49 and PBE050 and the recently developed M06-2X32
and M06-HF33 functionals were selected. The RI-CC2 and
RI-ADC(2) methods are computationally less expensive modifi-
cations of the coupled cluster theory with single and double
excitations. The RI method,39 applied for ADC(2) and CC2, is
important as it decreases the computational effort for the time-
consuming two-electron integrals considerably. The advantage of
the ADC(2) method over CC2 in the present context of calculat-
ing a large number of excited states is the use of a Hermitian
secular matrix which is constructed by many body perturbation
theory. Thus, it was chosen as the major reference method for
comparison with the TD-DFT results. The calculations have
been performed using the SVP51 and TZVP52 basis sets. The
SVP basis provides a cost-effective choice for performing calcu-
lations on larger systems whereas the TZVP basis enhances the
flexibility of the valence orbitals. As the description of Rydberg
states is out of the aim of the present work, no extra diffuse
functions for their description were added to the basis. The
geometry of the isolated bases adenine, thymine, guanine, and
cytosine were fully optimized at the MP2/TZVP level. All calcu-
lations were performed in C1 point-group symmetry and only
singlet excitations were considered.
The assignment of the excitations (local or CT) was per-
formed by considering the weight of the orbital excitation and
the corresponding character of the orbitals. Cases of similar
weights of different configurations to a given state are indicated
in the tables. Potential curves were computed for vertical dis-
placement of the stacked AT and GC structures along the
A(N9)–T(O9) distance in AT and the G(C5)–C(C4) distance in
GC (see Scheme 1). This distance is 3.154 A in the reference
geometry of AT and 3.104 A in the GC reference structure.
Intermonomer distances R were selected in the interval of 2.5–
5.0 A for both AT and GC complexes using a maximum of 12
points for each curve. The 10 lowest singlet excited states within
the basis set used were calculated at each distance using the RI-
ADC(2), M06-2X, M06-HF, PBE0, and B3-LYP methods and
the SVP basis set. The final calculations were performed at the
RI-ADC(2)/TZVP and M06-2X/TZVP levels. Atomic charges
were calculated for both AT and GC through fits to the electro-
static potential calculated at spherical shells of grid points
around the atoms using Bragg-Slater atomic radii.53 These
charges are denoted below as ESP charges.
Calculations based on the PCM54,55 using the linear response
method of Cammi et al.56 were performed for the AT and GC
complexes using the M06-2X functional and the TZVP basis set.
Three different solvents, heptane (dielectric constant e 5 1.920),
isoquinoline (e 5 10.430), and water (e 5 78.39) were selected
using UA0 atomic radii (united atom topological model) of the
universal force field57 to carry out single-point calculations at the
reference geometry of AT and GC for 10 excited singlet states.
Nonequilibrium PCM calculations were performed at the TD-DFT
level.58 The present treatment treats solvation only in terms of
bulk electrostatic effects and does not consider the geometry
relaxation in solution. Corrections for hydrogen bonding, disper-
sion, and geometry relaxation in solution could be significant59
but they are beyond the present scope. The TURBOMOLE pro-
gram suite60 has been used for the RI-CC2, RI-ADC(2), RI-MP2,
TD-DFT/B3LYP, and TD-DFT/PBE0 calculations. The TD-DFT
calculations for M06-2X and M06-HF functionals were carried
out using a development version of Gaussian.61
Results and Discussion
Vertical Excitations of Isolated Bases
The vertical singlet excitation energies of the monomers were
computed using the RI-CC2, RI-ADC(2), and TD-DFT methods.
Tables 1 and 2, Supporting Information Tables 1S and 2S collect
results and compare them with those obtained from CASPT2
calculations and with available experimental data. For a more
extended discussion of the spectra of isolated nucleobases
including a semiclassical simulation of the vibrational broaden-
ing see ref. 68 Cartesian geometries of optimized MP2/TZVP
structures used in these calculations are given in the Supporting
Information (Tables A–D).
Adenine
Only the N(9)H tautomer was considered as it corresponds to
the tautomer treated in the stacked dimer, which appears in natu-
rally occurred nucleic acids and has also been found as the
major form both in gas phase and in solution.69 The lowest ver-
tical excited state (S1) of adenine corresponds to an n-p* excita-
tion for all methods used. In the CASPT2 calculations of
Fulscher et al.,70 the S1 state is of p-p* character. However, a
recent, more extended CASPT2 study on adenine71 shows (Table
1) that the S1 state is of n-p* nature in agreement with RI-CC2
results of Fleig et al.15 The S2 and S3 states are two energeti-
cally closely located p-p* excitations where the latter [described
as transition between the highest occupied molecular orbital
(HOMO) and the lowest unoccupied orbital (LUMO)] has a sig-
nificantly larger intensity.
Guanine
As for adenine, only the 9H tautomer was investigated. Different
from adenine, for guanine, the p-p* state is S1 for all methods
used in this work, excepted for M06-HF, which gives a too low
n-p* transition. The S2 state is of n-p* character for all methods,
again with exception of M06-HF. The S1 p-p* excitation is of
type HOMO 2 LUMO 1 1. In contrast to adenine, both lowest
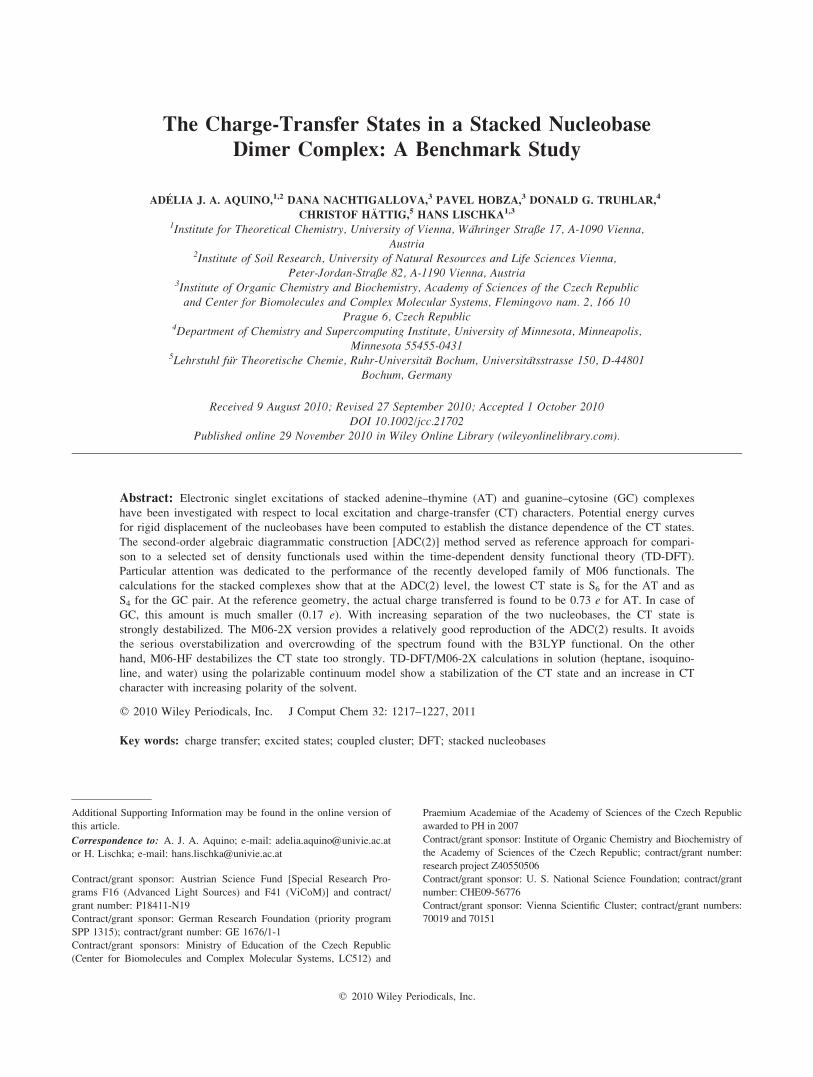
Scheme 1. AT (left) and GC (right) complexes. [Color figure can be
viewed in the online issue, which is available at wileyonlinelibrary.com.]
1219The Charge Transfer States in a Stacked Nucleobase Dimer Complex
Journal of Computational Chemistry DOI 10.1002/jcc
p-p* transitions have comparable intensities. Recent CASPT2
calculations on guanine62 also give the order p-p*, n-p*, and p-p* as the excitations for S1, S2, and S3 states, respectively.
Thymine
For thymine, the S1, S2, and S3 states correspond to n-p*, p-p*,and n-p* excitations, respectively, for all methods used in this
study (Table 2). Similar results have been obtained in the
RI-CC2 study by Fleig et al.15 The excitation energies shown in
Table 2 demonstrate that the three excited states are well sepa-
rated. A characteristic feature of thymine and also of cytosine
discussed below is the occurrence of two low-lying n-p* states.
The n orbitals are mostly located on the oxygen atoms.
Cytosine
All computed vertical singlet excitation energies collected in
Table 2 show the pp* state to be the lowest one. This state is
followed closely by the second excited state (S2), which corre-
sponds to an np* excitation. The third excited state (S3) is again
of n-p* type. The n orbitals occurring in the two n-p* excita-
Table 2. Vertical Excitations Energies (eV) and Oscillator Strengths (In Parentheses) for the Three Lowest
Singlet Excited States of the Thymine and Cytosine Using Different Methods and the TZVP Basis Set.
State RI-ADC(2) RI-CC2 M06-2X M06-HF CASPT2 Exp.
Thymine
S1 4.68 (0.000) 4.94 (0.000) 4.95 (0.000) 4.62 (0.000) 4.81a 4.70b
n-p* n-p* n-p* n-p* p-p*S2 5.31 (0.254) 5.40 (0.197) 5.33 (0.204) 5.51 (0.267) 4.97a
p-p* p-p* p-p* p-p* n-p*S3 6.10 (0.000) 6.34 (0.000) 6.26 (0.000) 5.86 (0.000) 5.99a
n-p* n-p* n-p* n-p* p-p*Cytosine
S1 4.57 (0.057) 4.76 (0.055) 4.99 (0.074) 5.19 (0.100) 4.50c (0.065) 4.66d
p-p* p-p* p-p* p-p* p-p*S2 4.76 (0.002) 4.96 (0.002) 5.17 (0.003) 5.28 (0.001) 4.88c (0.001)
n-p* n-p* n-p* n-p* n-p*S3 5.17 (0.003) 5.36 (0.002) 5.75 (0.000) 5.43 (0.000) 5.23c (0.003)
n-p* n-p* n-p* n-p* n-p*
aRef. 4bRef. 67cRef. 66dRef. 65
Table 1. Vertical Excitations Energies (eV) and Oscillator Strengths (In Parentheses) for the Three Lowest
Singlet Excited States of Adenine and Guanine Using Different Methods and the TZVP Basis Set.
State RI-ADC(2) RI-CC2 M06-2X M06-HF CASPT2 Exp.
Adenine
S1 5.09 (0.006) 5.17 (0.004) 5.27 (0.006) 5.56 (0.009) 4.96 (0.0037)a
n-p* n-p* n-p* n-p* n-p*S2 5.22 (0.035) 5.29 (0.003) 5.42 (0.294) 5.65 (0.313) 5.16 (0.0042)a 5.07b; 4.92c
p-p* p-p* p-p* p-p* p-p*S3 5.33 (0.305) 5.42 (0.301) 5.57 (0.009) 5.86 (0.044) 5.35 (0.1747)a
p-p* p-p* p-p* p-p* p-p*Guanine
S1 5.05 (0.229) 5.19 (0.190) 5.23 (0.189) 4.89 (0.000) 4.93 (0.158)d 4.37c; 4.50e
p-p* p-p* p-p* n-p* p-p*S2 5.27 (0.001) 5.55 (0.002) 5.36 (0.002) 5.43 (0.213) 5.54 (0.002)d
n-p* n-p* n-p* p-p* n-p*S3 5.63 (0.327) 5.71 (0.288) 5.70 (0.321) 6.03 (0.432) 5.77 (0.145)d 5.07e
p-p* p-p* p-p* p-p* p-p*
aRef. 71bRef. 63cRef. 64dRef. 62eRef. 65
1220 Aquino et al. • Vol. 32, No. 7 • Journal of Computational Chemistry
Journal of Computational Chemistry DOI 10.1002/jcc
tions are mostly distributed on N(3) and O. In the CASPT2
results,72,73 the S1, S2, and S3 excited states correspond to p-p*,p-p*, and n-p* excitations, respectively.
Vertical Excitations in the Adenine–Thymine Complex
Vertical excitations energies, oscillator strengths, and state
assignments are collected in Table 3 for the 10 lowest vertical
singlet excitations of the AT complex for the different methods
and the TZVP basis used. In Supporting Information Table 3S,
RI-ADC(2) results are presented for the SVP basis. A compari-
son of the TZVP results with those obtained with the smaller
SVP basis is of interest in view of future investigations on larger
stacked oligomers. As already mentioned, the RI-CC2 calcula-
tions were not performed for the stacked structures as the RI-
ADC(2) method gives very similar results and is computation-
ally more efficient. Therefore, the RI-ADC(2) method was taken
as reference for the analysis of the TD-DFT methods.
Comparison of the excitation energies of the AT complex
(Table 3) to those of the isolated monomers discussed before
(Tables 1 and 2) illustrates the shifts of the local excitations.
These shifts are caused by environmental changes induced by
the interacting bases and by geometry changes because of the
use of optimized geometries of the isolated bases and experi-
mental/optimized geometries in the stacked system. Most of the
transitions can be characterized as either n-p* or p-p* type
being mainly localized on one of the bases. However, as
expected, a few transitions are of mixed nature and display CT
character.
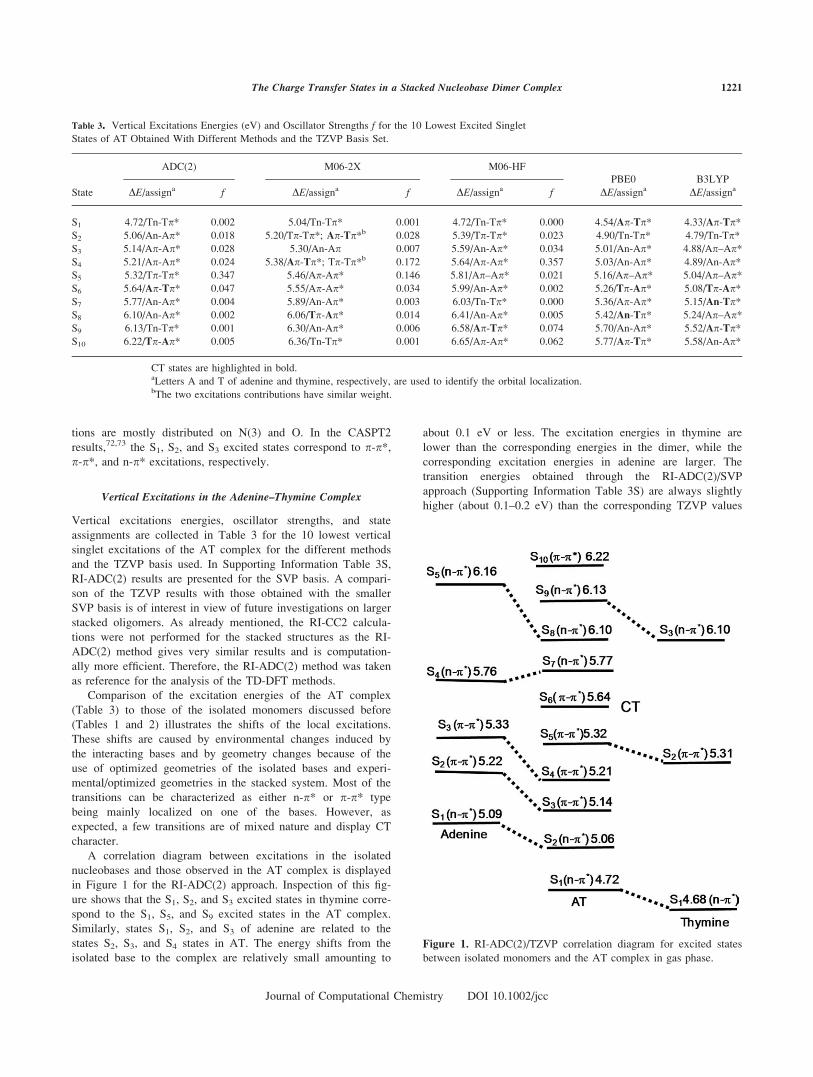
A correlation diagram between excitations in the isolated
nucleobases and those observed in the AT complex is displayed
in Figure 1 for the RI-ADC(2) approach. Inspection of this fig-
ure shows that the S1, S2, and S3 excited states in thymine corre-
spond to the S1, S5, and S9 excited states in the AT complex.
Similarly, states S1, S2, and S3 of adenine are related to the
states S2, S3, and S4 states in AT. The energy shifts from the
isolated base to the complex are relatively small amounting to
about 0.1 eV or less. The excitation energies in thymine are
lower than the corresponding energies in the dimer, while the
corresponding excitation energies in adenine are larger. The
transition energies obtained through the RI-ADC(2)/SVP
approach (Supporting Information Table 3S) are always slightly
higher (about 0.1–0.2 eV) than the corresponding TZVP values
Table 3. Vertical Excitations Energies (eV) and Oscillator Strengths f for the 10 Lowest Excited Singlet
States of AT Obtained With Different Methods and the TZVP Basis Set.
ADC(2) M06-2X M06-HF
PBE0 B3LYP
State DE/assigna f DE/assigna f DE/assigna f DE/assigna DE/assigna
S1 4.72/Tn-Tp* 0.002 5.04/Tn-Tp* 0.001 4.72/Tn-Tp* 0.000 4.54/Ap-Tp* 4.33/Ap-Tp*S2 5.06/An-Ap* 0.018 5.20/Tp-Tp*; Ap-Tp*b 0.028 5.39/Tp-Tp* 0.023 4.90/Tn-Tp* 4.79/Tn-Tp*S3 5.14/Ap-Ap* 0.028 5.30/An-Ap 0.007 5.59/An-Ap* 0.034 5.01/An-Ap* 4.88/Ap–Ap*S4 5.21/Ap-Ap* 0.024 5.38/Ap-Tp*; Tp-Tp*b 0.172 5.64/Ap-Ap* 0.357 5.03/An-Ap* 4.89/An-Ap*S5 5.32/Tp-Tp* 0.347 5.46/Ap-Ap* 0.146 5.81/Ap–Ap* 0.021 5.16/Ap–Ap* 5.04/Ap–Ap*S6 5.64/Ap-Tp* 0.047 5.55/Ap-Ap* 0.034 5.99/An-Ap* 0.002 5.26/Tp-Ap* 5.08/Tp-Ap*S7 5.77/An-Ap* 0.004 5.89/An-Ap* 0.003 6.03/Tn-Tp* 0.000 5.36/Ap-Ap* 5.15/An-Tp*S8 6.10/An-Ap* 0.002 6.06/Tp-Ap* 0.014 6.41/An-Ap* 0.005 5.42/An-Tp* 5.24/Ap–Ap*S9 6.13/Tn-Tp* 0.001 6.30/An-Ap* 0.006 6.58/Ap-Tp* 0.074 5.70/An-Ap* 5.52/Ap-Tp*S10 6.22/Tp-Ap* 0.005 6.36/Tn-Tp* 0.001 6.65/Ap-Ap* 0.062 5.77/Ap-Tp* 5.58/An-Ap*
CT states are highlighted in bold.aLetters A and T of adenine and thymine, respectively, are used to identify the orbital localization.bThe two excitations contributions have similar weight.
Figure 1. RI-ADC(2)/TZVP correlation diagram for excited states
between isolated monomers and the AT complex in gas phase.
1221The Charge Transfer States in a Stacked Nucleobase Dimer Complex
Journal of Computational Chemistry DOI 10.1002/jcc
(Table 3). Note as well that the CT state is moved from S6 in theTZVP calculation to S7 in SVP. The lowest singlet excited state S1is dominated by a local excitation n-p* in thymine for the RI-ADC(2), M06-2X, and M06-HF methods with the n orbital locatedmainly on the lone pairs of the oxygen atoms of the pyrimidinering. A completely different behavior is found for PBE0 andB3LYP as the S1 state is a CT excitation between the p orbitalslocalized on adenine and thymine (Ap–Tp*). The S2 state corre-sponds to a local n-p* excitation in adenine for RI-ADC(2) but isthe lowest p-p* excitation for M06-HF. For M06-2X, the S2 statecontains a mixing of p-p* excitations each being localized in oneof the base moieties. Therefore, this excitation can be described asan excitonic coupling between two p-p* excitations. For the RI-ADC(2) calculations, the remaining S3, S4, S7, and S8 states corre-spond to local n-p* or p-p* excitations in adenine and the S5 andS9 states refer to p-p* and n-p* excitations on thymine, respec-tively. Two nonlocal CT excitations were observed in the RI-ADC(2) calculations for the S6 and S10 states. The S6 state is char-acterized by an excitation from the p orbital localized on adenineinto the p* orbital of thymine. On the other hand, the S10 CT stateis an excitation from a p orbital in thymine to a p* orbital on ade-nine. It is important to point out, therefore, that in this latter case,adenine is not the charge donor as observed for the state S6 justmentioned above.
Excitations that are not localized on a single monomer are
observed for the S2, S4, and S8 states in the calculations carried
out by the M06-2X method; however, the M06-2X calculations
also show contributions from localized excitations in the S2 and
S4 states. A clean CT state is observed only in case of the state
S8. In this case, the CT occurs in the direction from thymine to
adenine. In the M06-HF approach, only state S9 corresponds to
a nonlocal CT excitation with CT from adenine to thymine. All
remaining excited states are local excitations. The PBE0 and
B3LYP functionals lead to four nonlocal excitations, and the
first excited state has already CT character. In both methods, the
CT process occurs from thymine to adenine in the S6 state.
The CT is characterized by means of ESP charges computed
at the RI-ADC(2)/TZVP level (Table 4). The CT is clearly seen
for S6 amounting to 0.73 e. The density difference plot between
S6 and S0 (Fig. 2a) illustrates this CT from A to T in the p-p*states very well.
Vertical Excitations in the Guanine–Cytosine Complex
Vertical excitation energies, oscillator strengths, and state assign-
ments are shown in Table 5 for the 10 lowest vertical singlet exci-
tations of the GC complex for the various methods and the TZVP
basis used. In Supporting Information Table 3S, RI-ADC(2)
results are presented for the SVP basis. Comparing the RI-ADC(2)
excitation energies of the GC complex with those to the isolated
bases (Tables 1 and 2), it is observed (see Fig. 3) that the S1, S2,
and S3 excited states in cytosine correspond to the S1, S2, and S6excited states in the complex. Similarly, states S1, S2, and S3 in
guanine are related to the states S3, S5, and S7 in GC. The excita-
tion energies for the isolated monomer and in the complex are
quite close in both cases. The excitation energies in cytosine are
lower than the corresponding energies in the dimer, while the cor-
responding excitation energies in guanine are larger than in the
dimer. Similar to the AT case, the transition energies obtained
with the RI-ADC(2)/SVP approach (Supporting Information Table
3S) are always slightly higher (about 0.1–0.2 eV) than the corre-
sponding TZVP values. It is observed that the CT state is moved
from S4 in the TZVP calculation to S6 in SVP.
Table 4. ADC(2)/TZVP Charge Transfer (e) in the AT and GC Pairs,
Respectively, Based on ESP Charges and Computed at the Reference
Geometry.
Charge
State A ? T G ? C
S1 0.018 0.009
S2 0.068 0.073
S3 0.076 0.071
S4 0.063 0.170
S5 0.056 0.063
S6 0.730 0.126
S7 0.081 0.055
S8 0.043 0.279
S9 0.019 20.041
S10 20.097 0.066
Figure 2. RI-ADC(2)/TZVP density difference plots between the
densities of (a) AT, S6, and S0 and (b) GC, S4, and S0 in gas phase;
Contour values: turquoise (light gray): 20.002 e, red (dark gray):
0.002 e. [Color figure can be viewed in the online issue, which is
available at wileyonlinelibrary.com.]
1222 Aquino et al. • Vol. 32, No. 7 • Journal of Computational Chemistry
Journal of Computational Chemistry DOI 10.1002/jcc
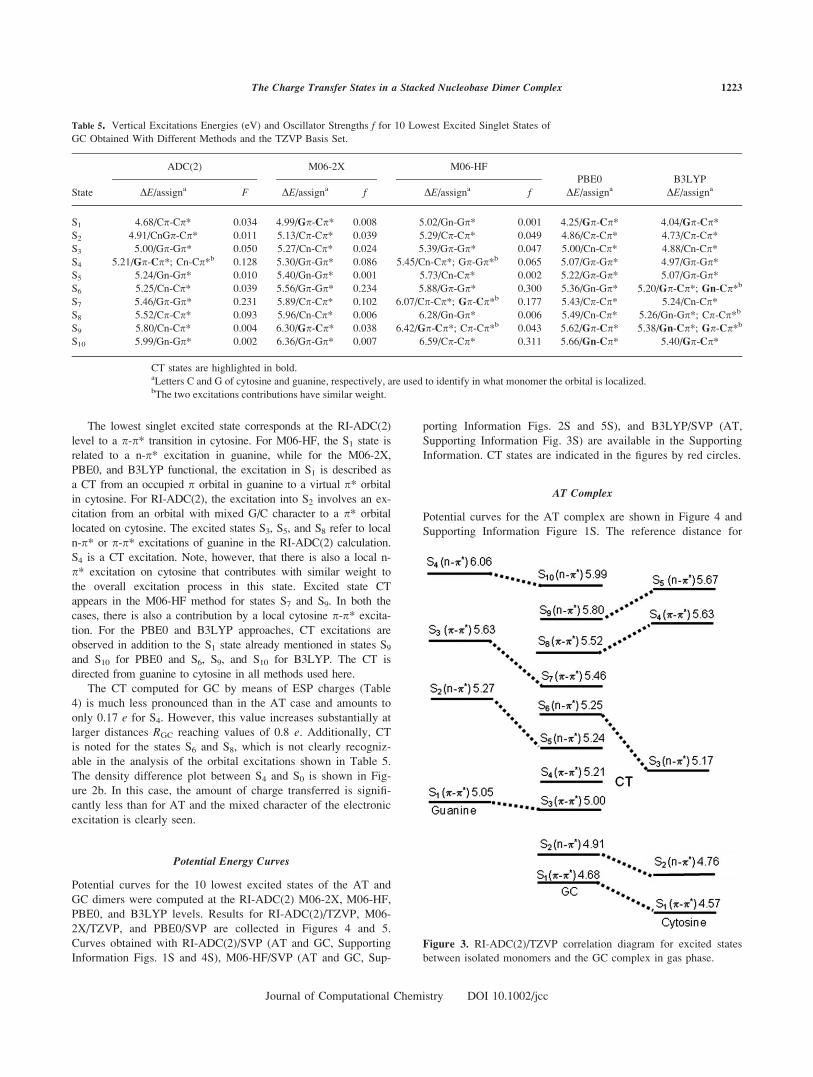
The lowest singlet excited state corresponds at the RI-ADC(2)
level to a p-p* transition in cytosine. For M06-HF, the S1 state is
related to a n-p* excitation in guanine, while for the M06-2X,
PBE0, and B3LYP functional, the excitation in S1 is described as
a CT from an occupied p orbital in guanine to a virtual p* orbital
in cytosine. For RI-ADC(2), the excitation into S2 involves an ex-
citation from an orbital with mixed G/C character to a p* orbital
located on cytosine. The excited states S3, S5, and S8 refer to local
n-p* or p-p* excitations of guanine in the RI-ADC(2) calculation.
S4 is a CT excitation. Note, however, that there is also a local n-
p* excitation on cytosine that contributes with similar weight to
the overall excitation process in this state. Excited state CT
appears in the M06-HF method for states S7 and S9. In both the
cases, there is also a contribution by a local cytosine p-p* excita-
tion. For the PBE0 and B3LYP approaches, CT excitations are
observed in addition to the S1 state already mentioned in states S9and S10 for PBE0 and S6, S9, and S10 for B3LYP. The CT is
directed from guanine to cytosine in all methods used here.
The CT computed for GC by means of ESP charges (Table
4) is much less pronounced than in the AT case and amounts to
only 0.17 e for S4. However, this value increases substantially at
larger distances RGC reaching values of 0.8 e. Additionally, CTis noted for the states S6 and S8, which is not clearly recogniz-
able in the analysis of the orbital excitations shown in Table 5.
The density difference plot between S4 and S0 is shown in Fig-
ure 2b. In this case, the amount of charge transferred is signifi-
cantly less than for AT and the mixed character of the electronic
excitation is clearly seen.
Potential Energy Curves
Potential curves for the 10 lowest excited states of the AT and
GC dimers were computed at the RI-ADC(2) M06-2X, M06-HF,
PBE0, and B3LYP levels. Results for RI-ADC(2)/TZVP, M06-
2X/TZVP, and PBE0/SVP are collected in Figures 4 and 5.
Curves obtained with RI-ADC(2)/SVP (AT and GC, Supporting
Information Figs. 1S and 4S), M06-HF/SVP (AT and GC, Sup-
porting Information Figs. 2S and 5S), and B3LYP/SVP (AT,
Supporting Information Fig. 3S) are available in the Supporting
Information. CT states are indicated in the figures by red circles.
AT Complex
Potential curves for the AT complex are shown in Figure 4 and
Supporting Information Figure 1S. The reference distance for
Table 5. Vertical Excitations Energies (eV) and Oscillator Strengths f for 10 Lowest Excited Singlet States of
GC Obtained With Different Methods and the TZVP Basis Set.
ADC(2) M06-2X M06-HF
PBE0 B3LYP
State DE/assigna F DE/assigna f DE/assigna f DE/assigna DE/assigna
S1 4.68/Cp-Cp* 0.034 4.99/Gp-Cp* 0.008 5.02/Gn-Gp* 0.001 4.25/Gp-Cp* 4.04/Gp-Cp*S2 4.91/CnGp-Cp* 0.011 5.13/Cp-Cp* 0.039 5.29/Cp-Cp* 0.049 4.86/Cp-Cp* 4.73/Cp-Cp*S3 5.00/Gp-Gp* 0.050 5.27/Cn-Cp* 0.024 5.39/Gp-Gp* 0.047 5.00/Cn-Cp* 4.88/Cn-Cp*S4 5.21/Gp-Cp*; Cn-Cp*b 0.128 5.30/Gp-Gp* 0.086 5.45/Cn-Cp*; Gp-Gp*b 0.065 5.07/Gp-Gp* 4.97/Gp-Gp*S5 5.24/Gn-Gp* 0.010 5.40/Gn-Gp* 0.001 5.73/Cn-Cp* 0.002 5.22/Gp-Gp* 5.07/Gp-Gp*S6 5.25/Cn-Cp* 0.039 5.56/Gp-Gp* 0.234 5.88/Gp-Gp* 0.300 5.36/Gn-Gp* 5.20/Gp-Cp*; Gn-Cp*b
S7 5.46/Gp-Gp* 0.231 5.89/Cp-Cp* 0.102 6.07/Cp-Cp*; Gp-Cp*b 0.177 5.43/Cp-Cp* 5.24/Cn-Cp*S8 5.52/Cp-Cp* 0.093 5.96/Cn-Cp* 0.006 6.28/Gn-Gp* 0.006 5.49/Cn-Cp* 5.26/Gn-Gp*; Cp-Cp*b
S9 5.80/Cn-Cp* 0.004 6.30/Gp-Cp* 0.038 6.42/Gp-Cp*; Cp-Cp*b 0.043 5.62/Gp-Cp* 5.38/Gn-Cp*; Gp-Cp*b
S10 5.99/Gn-Gp* 0.002 6.36/Gp-Gp* 0.007 6.59/Cp-Cp* 0.311 5.66/Gn-Cp* 5.40/Gp-Cp*
CT states are highlighted in bold.aLetters C and G of cytosine and guanine, respectively, are used to identify in what monomer the orbital is localized.bThe two excitations contributions have similar weight.
Figure 3. RI-ADC(2)/TZVP correlation diagram for excited states
between isolated monomers and the GC complex in gas phase.
1223The Charge Transfer States in a Stacked Nucleobase Dimer Complex
Journal of Computational Chemistry DOI 10.1002/jcc
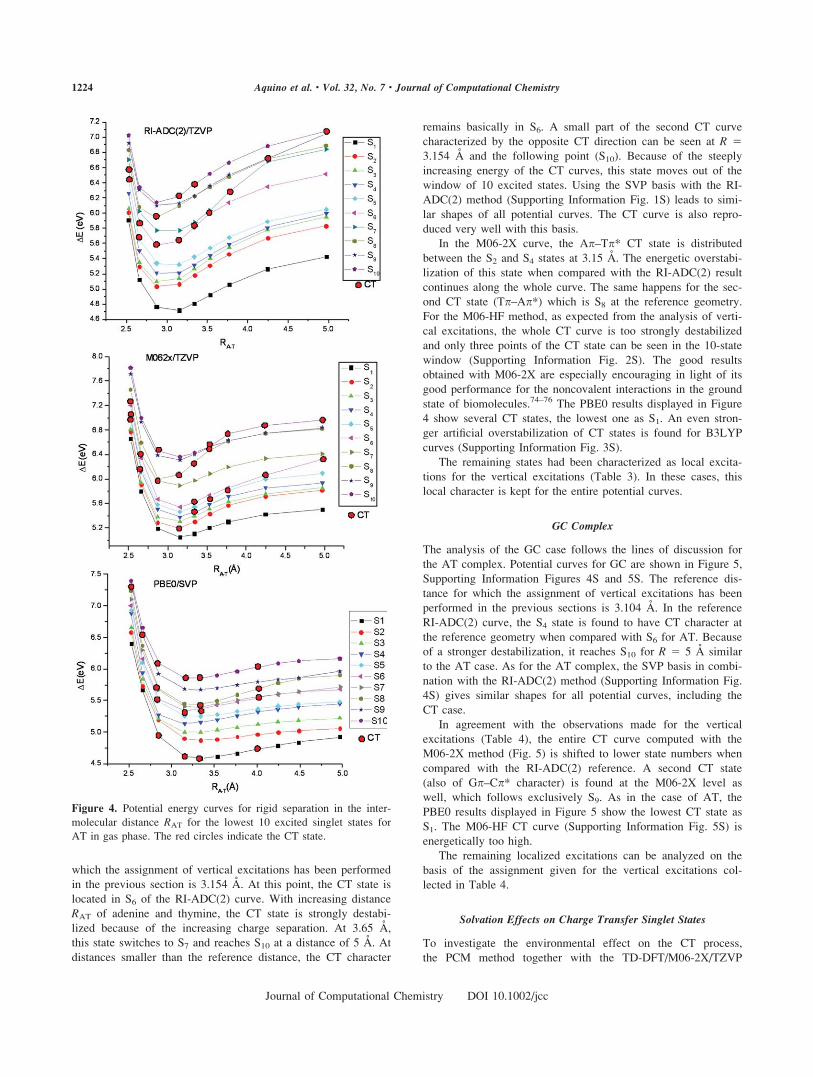
which the assignment of vertical excitations has been performed
in the previous section is 3.154 A. At this point, the CT state is
located in S6 of the RI-ADC(2) curve. With increasing distance
RAT of adenine and thymine, the CT state is strongly destabi-
lized because of the increasing charge separation. At 3.65 A,
this state switches to S7 and reaches S10 at a distance of 5 A. At
distances smaller than the reference distance, the CT character
remains basically in S6. A small part of the second CT curve
characterized by the opposite CT direction can be seen at R 53.154 A and the following point (S10). Because of the steeply
increasing energy of the CT curves, this state moves out of the
window of 10 excited states. Using the SVP basis with the RI-
ADC(2) method (Supporting Information Fig. 1S) leads to simi-
lar shapes of all potential curves. The CT curve is also repro-
duced very well with this basis.
In the M06-2X curve, the Ap–Tp* CT state is distributed
between the S2 and S4 states at 3.15 A. The energetic overstabi-
lization of this state when compared with the RI-ADC(2) result
continues along the whole curve. The same happens for the sec-
ond CT state (Tp–Ap*) which is S8 at the reference geometry.
For the M06-HF method, as expected from the analysis of verti-
cal excitations, the whole CT curve is too strongly destabilized
and only three points of the CT state can be seen in the 10-state
window (Supporting Information Fig. 2S). The good results
obtained with M06-2X are especially encouraging in light of its
good performance for the noncovalent interactions in the ground
state of biomolecules.74–76 The PBE0 results displayed in Figure
4 show several CT states, the lowest one as S1. An even stron-
ger artificial overstabilization of CT states is found for B3LYP
curves (Supporting Information Fig. 3S).
The remaining states had been characterized as local excita-
tions for the vertical excitations (Table 3). In these cases, this
local character is kept for the entire potential curves.
GC Complex
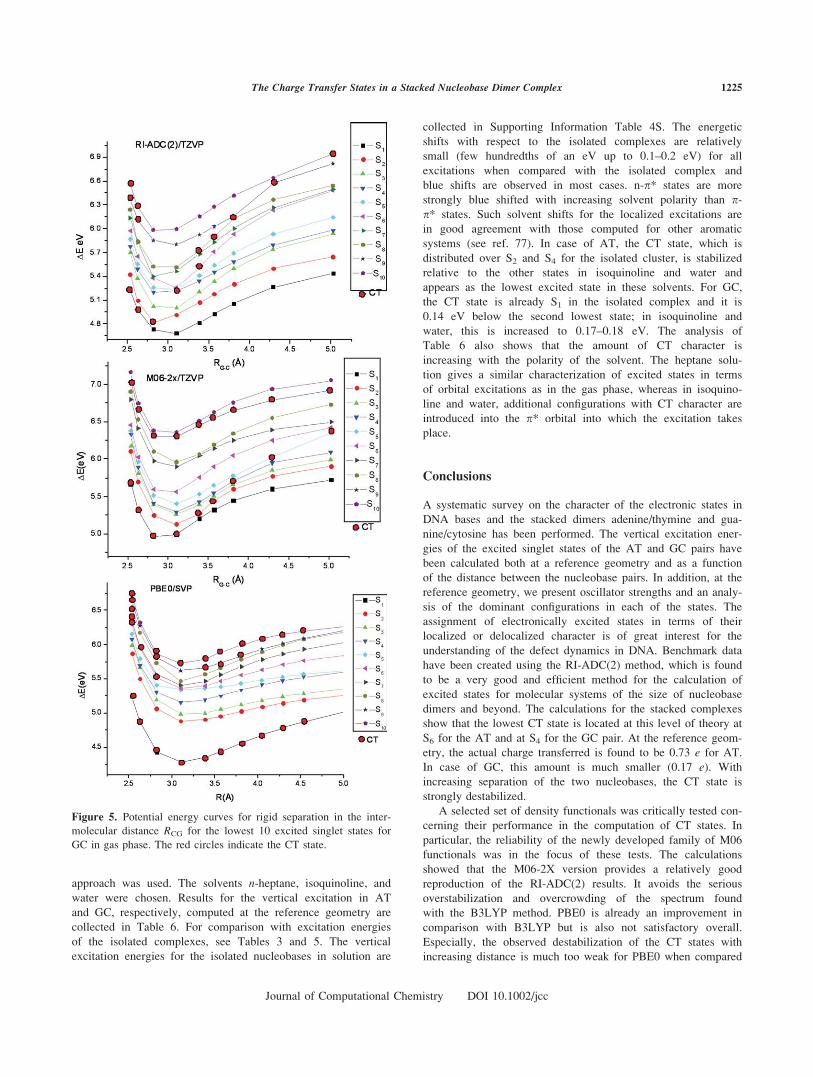
The analysis of the GC case follows the lines of discussion for
the AT complex. Potential curves for GC are shown in Figure 5,
Supporting Information Figures 4S and 5S. The reference dis-
tance for which the assignment of vertical excitations has been
performed in the previous sections is 3.104 A. In the reference
RI-ADC(2) curve, the S4 state is found to have CT character at
the reference geometry when compared with S6 for AT. Because
of a stronger destabilization, it reaches S10 for R 5 5 A similar
to the AT case. As for the AT complex, the SVP basis in combi-
nation with the RI-ADC(2) method (Supporting Information Fig.
4S) gives similar shapes for all potential curves, including the
CT case.
In agreement with the observations made for the vertical
excitations (Table 4), the entire CT curve computed with the
M06-2X method (Fig. 5) is shifted to lower state numbers when
compared with the RI-ADC(2) reference. A second CT state
(also of Gp–Cp* character) is found at the M06-2X level as
well, which follows exclusively S9. As in the case of AT, the
PBE0 results displayed in Figure 5 show the lowest CT state as
S1. The M06-HF CT curve (Supporting Information Fig. 5S) is
energetically too high.
The remaining localized excitations can be analyzed on the
basis of the assignment given for the vertical excitations col-
lected in Table 4.
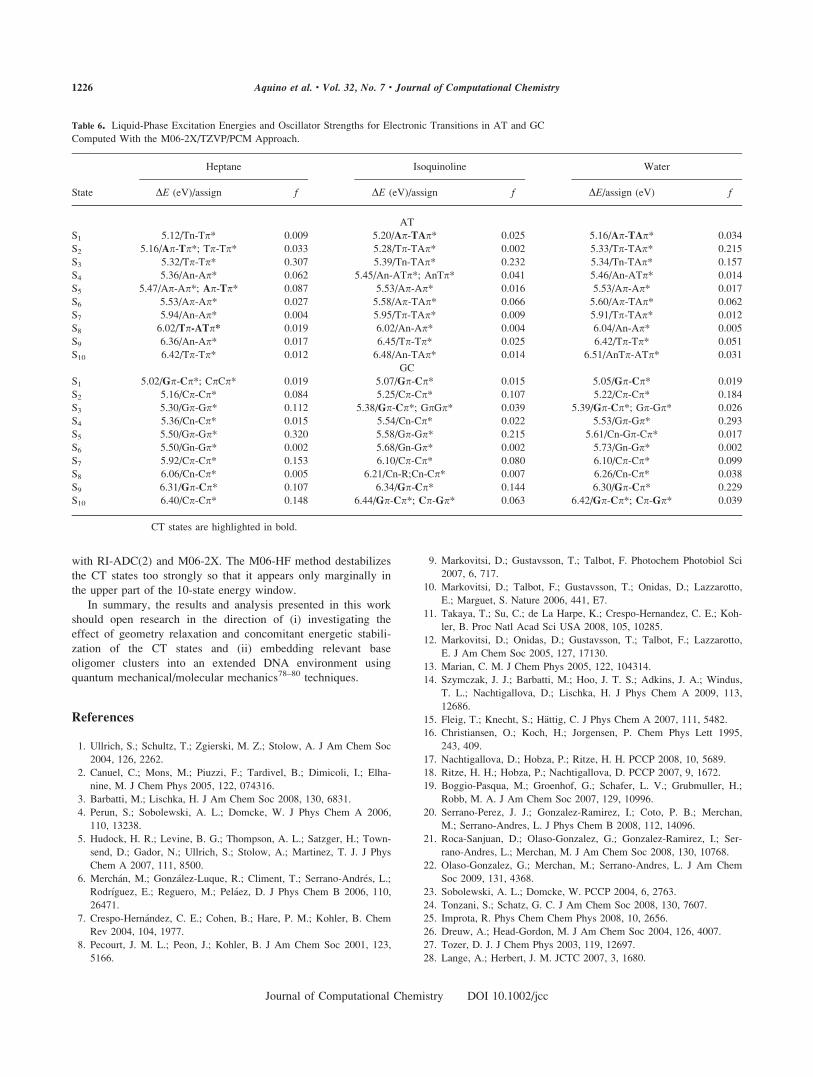
Solvation Effects on Charge Transfer Singlet States
To investigate the environmental effect on the CT process,
the PCM method together with the TD-DFT/M06-2X/TZVP
Figure 4. Potential energy curves for rigid separation in the inter-
molecular distance RAT for the lowest 10 excited singlet states for
AT in gas phase. The red circles indicate the CT state.
1224 Aquino et al. • Vol. 32, No. 7 • Journal of Computational Chemistry
Journal of Computational Chemistry DOI 10.1002/jcc
approach was used. The solvents n-heptane, isoquinoline, and
water were chosen. Results for the vertical excitation in AT
and GC, respectively, computed at the reference geometry are
collected in Table 6. For comparison with excitation energies
of the isolated complexes, see Tables 3 and 5. The vertical
excitation energies for the isolated nucleobases in solution are
collected in Supporting Information Table 4S. The energetic
shifts with respect to the isolated complexes are relatively
small (few hundredths of an eV up to 0.1–0.2 eV) for all
excitations when compared with the isolated complex and
blue shifts are observed in most cases. n-p* states are more
strongly blue shifted with increasing solvent polarity than p-p* states. Such solvent shifts for the localized excitations are
in good agreement with those computed for other aromatic
systems (see ref. 77). In case of AT, the CT state, which is
distributed over S2 and S4 for the isolated cluster, is stabilized
relative to the other states in isoquinoline and water and
appears as the lowest excited state in these solvents. For GC,
the CT state is already S1 in the isolated complex and it is
0.14 eV below the second lowest state; in isoquinoline and
water, this is increased to 0.17–0.18 eV. The analysis of
Table 6 also shows that the amount of CT character is
increasing with the polarity of the solvent. The heptane solu-
tion gives a similar characterization of excited states in terms
of orbital excitations as in the gas phase, whereas in isoquino-
line and water, additional configurations with CT character are
introduced into the p* orbital into which the excitation takes
place.
Conclusions
A systematic survey on the character of the electronic states in
DNA bases and the stacked dimers adenine/thymine and gua-
nine/cytosine has been performed. The vertical excitation ener-
gies of the excited singlet states of the AT and GC pairs have
been calculated both at a reference geometry and as a function
of the distance between the nucleobase pairs. In addition, at the
reference geometry, we present oscillator strengths and an analy-
sis of the dominant configurations in each of the states. The
assignment of electronically excited states in terms of their
localized or delocalized character is of great interest for the
understanding of the defect dynamics in DNA. Benchmark data
have been created using the RI-ADC(2) method, which is found
to be a very good and efficient method for the calculation of
excited states for molecular systems of the size of nucleobase
dimers and beyond. The calculations for the stacked complexes
show that the lowest CT state is located at this level of theory at
S6 for the AT and at S4 for the GC pair. At the reference geom-
etry, the actual charge transferred is found to be 0.73 e for AT.
In case of GC, this amount is much smaller (0.17 e). With
increasing separation of the two nucleobases, the CT state is
strongly destabilized.
A selected set of density functionals was critically tested con-
cerning their performance in the computation of CT states. In
particular, the reliability of the newly developed family of M06
functionals was in the focus of these tests. The calculations
showed that the M06-2X version provides a relatively good
reproduction of the RI-ADC(2) results. It avoids the serious
overstabilization and overcrowding of the spectrum found
with the B3LYP method. PBE0 is already an improvement in
comparison with B3LYP but is also not satisfactory overall.
Especially, the observed destabilization of the CT states with
increasing distance is much too weak for PBE0 when compared
Figure 5. Potential energy curves for rigid separation in the inter-
molecular distance RCG for the lowest 10 excited singlet states for
GC in gas phase. The red circles indicate the CT state.
1225The Charge Transfer States in a Stacked Nucleobase Dimer Complex
Journal of Computational Chemistry DOI 10.1002/jcc
with RI-ADC(2) and M06-2X. The M06-HF method destabilizes
the CT states too strongly so that it appears only marginally in
the upper part of the 10-state energy window.
In summary, the results and analysis presented in this work
should open research in the direction of (i) investigating the
effect of geometry relaxation and concomitant energetic stabili-
zation of the CT states and (ii) embedding relevant base
oligomer clusters into an extended DNA environment using
quantum mechanical/molecular mechanics78–80 techniques.
References
1. Ullrich, S.; Schultz, T.; Zgierski, M. Z.; Stolow, A. J Am Chem Soc
2004, 126, 2262.
2. Canuel, C.; Mons, M.; Piuzzi, F.; Tardivel, B.; Dimicoli, I.; Elha-
nine, M. J Chem Phys 2005, 122, 074316.
3. Barbatti, M.; Lischka, H. J Am Chem Soc 2008, 130, 6831.
4. Perun, S.; Sobolewski, A. L.; Domcke, W. J Phys Chem A 2006,
110, 13238.
5. Hudock, H. R.; Levine, B. G.; Thompson, A. L.; Satzger, H.; Town-
send, D.; Gador, N.; Ullrich, S.; Stolow, A.; Martinez, T. J. J Phys
Chem A 2007, 111, 8500.
6. Merchan, M.; Gonzalez-Luque, R.; Climent, T.; Serrano-Andres, L.;
Rodrıguez, E.; Reguero, M.; Pelaez, D. J Phys Chem B 2006, 110,
26471.
7. Crespo-Hernandez, C. E.; Cohen, B.; Hare, P. M.; Kohler, B. Chem
Rev 2004, 104, 1977.
8. Pecourt, J. M. L.; Peon, J.; Kohler, B. J Am Chem Soc 2001, 123,
5166.
9. Markovitsi, D.; Gustavsson, T.; Talbot, F. Photochem Photobiol Sci
2007, 6, 717.
10. Markovitsi, D.; Talbot, F.; Gustavsson, T.; Onidas, D.; Lazzarotto,
E.; Marguet, S. Nature 2006, 441, E7.
11. Takaya, T.; Su, C.; de La Harpe, K.; Crespo-Hernandez, C. E.; Koh-
ler, B. Proc Natl Acad Sci USA 2008, 105, 10285.
12. Markovitsi, D.; Onidas, D.; Gustavsson, T.; Talbot, F.; Lazzarotto,
E. J Am Chem Soc 2005, 127, 17130.
13. Marian, C. M. J Chem Phys 2005, 122, 104314.
14. Szymczak, J. J.; Barbatti, M.; Hoo, J. T. S.; Adkins, J. A.; Windus,
T. L.; Nachtigallova, D.; Lischka, H. J Phys Chem A 2009, 113,
12686.
15. Fleig, T.; Knecht, S.; Hattig, C. J Phys Chem A 2007, 111, 5482.
16. Christiansen, O.; Koch, H.; Jorgensen, P. Chem Phys Lett 1995,
243, 409.
17. Nachtigallova, D.; Hobza, P.; Ritze, H. H. PCCP 2008, 10, 5689.
18. Ritze, H. H.; Hobza, P.; Nachtigallova, D. PCCP 2007, 9, 1672.
19. Boggio-Pasqua, M.; Groenhof, G.; Schafer, L. V.; Grubmuller, H.;
Robb, M. A. J Am Chem Soc 2007, 129, 10996.
20. Serrano-Perez, J. J.; Gonzalez-Ramirez, I.; Coto, P. B.; Merchan,
M.; Serrano-Andres, L. J Phys Chem B 2008, 112, 14096.
21. Roca-Sanjuan, D.; Olaso-Gonzalez, G.; Gonzalez-Ramirez, I.; Ser-
rano-Andres, L.; Merchan, M. J Am Chem Soc 2008, 130, 10768.
22. Olaso-Gonzalez, G.; Merchan, M.; Serrano-Andres, L. J Am Chem
Soc 2009, 131, 4368.
23. Sobolewski, A. L.; Domcke, W. PCCP 2004, 6, 2763.
24. Tonzani, S.; Schatz, G. C. J Am Chem Soc 2008, 130, 7607.
25. Improta, R. Phys Chem Chem Phys 2008, 10, 2656.
26. Dreuw, A.; Head-Gordon, M. J Am Chem Soc 2004, 126, 4007.
27. Tozer, D. J. J Chem Phys 2003, 119, 12697.
28. Lange, A.; Herbert, J. M. JCTC 2007, 3, 1680.
Table 6. Liquid-Phase Excitation Energies and Oscillator Strengths for Electronic Transitions in AT and GC
Computed With the M06-2X/TZVP/PCM Approach.
Heptane Isoquinoline Water
State DE (eV)/assign f DE (eV)/assign f DE/assign (eV) f
AT
S1 5.12/Tn-Tp* 0.009 5.20/Ap-TAp* 0.025 5.16/Ap-TAp* 0.034
S2 5.16/Ap-Tp*; Tp-Tp* 0.033 5.28/Tp-TAp* 0.002 5.33/Tp-TAp* 0.215
S3 5.32/Tp-Tp* 0.307 5.39/Tn-TAp* 0.232 5.34/Tn-TAp* 0.157
S4 5.36/An-Ap* 0.062 5.45/An-ATp*; AnTp* 0.041 5.46/An-ATp* 0.014
S5 5.47/Ap-Ap*; Ap-Tp* 0.087 5.53/Ap-Ap* 0.016 5.53/Ap-Ap* 0.017
S6 5.53/Ap-Ap* 0.027 5.58/Ap-TAp* 0.066 5.60/Ap-TAp* 0.062
S7 5.94/An-Ap* 0.004 5.95/Tp-TAp* 0.009 5.91/Tp-TAp* 0.012
S8 6.02/Tp-ATp* 0.019 6.02/An-Ap* 0.004 6.04/An-Ap* 0.005
S9 6.36/An-Ap* 0.017 6.45/Tp-Tp* 0.025 6.42/Tp-Tp* 0.051
S10 6.42/Tp-Tp* 0.012 6.48/An-TAp* 0.014 6.51/AnTp-ATp* 0.031
GC
S1 5.02/Gp-Cp*; CpCp* 0.019 5.07/Gp-Cp* 0.015 5.05/Gp-Cp* 0.019
S2 5.16/Cp-Cp* 0.084 5.25/Cp-Cp* 0.107 5.22/Cp-Cp* 0.184
S3 5.30/Gp-Gp* 0.112 5.38/Gp-Cp*; GpGp* 0.039 5.39/Gp-Cp*; Gp-Gp* 0.026
S4 5.36/Cn-Cp* 0.015 5.54/Cn-Cp* 0.022 5.53/Gp-Gp* 0.293
S5 5.50/Gp-Gp* 0.320 5.58/Gp-Gp* 0.215 5.61/Cn-Gp-Cp* 0.017
S6 5.50/Gn-Gp* 0.002 5.68/Gn-Gp* 0.002 5.73/Gn-Gp* 0.002
S7 5.92/Cp-Cp* 0.153 6.10/Cp-Cp* 0.080 6.10/Cp-Cp* 0.099
S8 6.06/Cn-Cp* 0.005 6.21/Cn-R;Cn-Cp* 0.007 6.26/Cn-Cp* 0.038
S9 6.31/Gp-Cp* 0.107 6.34/Gp-Cp* 0.144 6.30/Gp-Cp* 0.229
S10 6.40/Cp-Cp* 0.148 6.44/Gp-Cp*; Cp-Gp* 0.063 6.42/Gp-Cp*; Cp-Gp* 0.039
CT states are highlighted in bold.
1226 Aquino et al. • Vol. 32, No. 7 • Journal of Computational Chemistry
Journal of Computational Chemistry DOI 10.1002/jcc
29. Lange, A. W.; Herbert, J. M. J Am Chem Soc 2009, 131, 3913.
30. Santoro, F.; Barone, V.; Improta, R. Chemphyschem 2008, 9, 2531.
31. Zhao, Y.; Schultz, N. E.; Truhlar, D. G. JCTC 2006, 2, 364.
32. Zhao, Y.; Truhlar, D. G. Theor Chem Acc 2008, 120, 215.
33. Zhao, Y.; Truhlar, D. G. J Phys Chem A 2006, 110, 13126.
34. Trofimov, A. B.; Schirmer, J. J Phys B: At Mol Opt Phys 1995, 28, 2299.
35. Sobolewski, A. L.; Domcke, W.; Hattig, C. J Phys Chem A 2006,
110, 6301.
36. Aquino, A. J. A.; Lischka, H.; Hattig, C. J Phys Chem A 2005, 109,
3201.
37. Hobza, P.; Jurecka, P. J Am Chem Soc 2003, 125 15608.
38. Zidek, L.; Wu, H. H.; Feigon, J.; Sklenar, V. J Biomol NMR 2001,
21, 153.
39. Hattig, C. J Chem Phys 2003, 118, 7751.
40. Kohn, A.; Hattig, C. J Chem Phys 2003, 119, 5021.
41. Hattig, C.; Weigend, F. J Chem Phys 2000, 113, 5154.
42. Hattig, C. PCCP 2005, 7, 59.
43. Trofimov, A. B.; Schirmer, J. Chem Phys 1997, 214, 153.
44. Trofimov, A. B.; Schirmer, J. Chem Phys 1977, 224, 175.
45. Casida, M. E. Time-Dependent Density-Functional Response Theory
for Molecules; World Scientific: Singapore, 1995.
46. Bauernschmitt, R.; Ahlrichs, R. Chem Phys Lett 1996, 256, 454.
47. Furche, F.; Ahlrichs, R. J Chem Phys 2002, 117, 7433.
48. Runge, E.; Gross, E. K. U. Phys Rev Lett 1984, 52, 997.
49. Becke, A. D. J Chem Phys 1993, 98, 5648.
50. Perdew, J. P.; Burke, K.; Ernzerhof, M. Phys Rev Lett 1996, 77,
3865.
51. Schafer, A.; Horn, H.; Ahlrichs, R. J Chem Phys 1992, 97, 2571.
52. Schafer, A.; Huber, C.; Ahlrichs, R. J Chem Phys 1994, 100, 5829.
53. Slater, J. C. J Chem Phys 1964, 41, 3199.
54. Miertus, S.; Scrocco, E.; Tomasi, J. Chem Phys 1981, 55, 117.
55. Mennucci, B.; Cances, E.; Tomasi, J. J Phys Chem B 1997, 101,
10506.
56. Cammi, R.; Corni, S.; Mennucci, B.; Tomasi, J. J Chem Phys 2005,
122, 104513.
57. Rappe, A. K.; Casewit, C. J.; Colwell, K. S.; Goddard, W. A.; Skiff,
W. M. J Am Chem Soc 1992, 114, 10024.
58. Cossi, M.; Barone, V. J Chem Phys 2001, 115, 4708.
59. Li, J.; Cramer, C. J.; Truhlar, D. G. Int J Quantum Chem 2000, 77,
264.
60. Ahlrichs, R.; Bar, M.; Haser, M.; Horn, H.; Kolmel, C. Chem Phys
Lett 1989, 162, 165.
61. Gaussian 09, Revision A.1, Frisch, M. J.; Trucks, G. W.; Schlegel,
H. B.; Scuseria, G. E.; Robb, M. A.; Cheeseman, J. R.; Scalmani,
G.; Barone, V.; Mennucci, B.; Petersson, G. A.; Nakatsuji, H.; Cari-
cato, M.; Li, X.; Hratchian, H. P.; Izmaylov, A. F.; Bloino, J.;
Zheng, G.; Sonnenberg, J. L.; Hada, M.; Ehara, M.; Toyota, K.;
Fukuda, R.; Hasegawa, J.; Ishida, M.; Nakajima, T.; Honda, Y.;
Kitao, O.; Nakai, H.; Vreven, T.; Montgomery, Jr., J. A.; Peralta, J.
E.; Ogliaro, F.; Bearpark, M.; Heyd, J. J.; Brothers, E.; Kudin, K.
N.; Staroverov, V. N.; Kobayashi, R.; Normand, J.; Raghavachari,
K.; Rendell, A.; Burant, J. C.; Iyengar, S. S.; Tomasi, J.; Cossi, M.;
Rega, N.; Millam, N. J.; Klene, M.; Knox, J. E.; Cross, J. B.;
Bakken, V.; Adamo, C.; Jaramillo, J.; Gomperts, R.; Stratmann, R.
E.; Yazyev, O.; Austin, A. J.; Cammi, R.; Pomelli, C.; Ochterski, J.
W.; Martin, R. L.; Morokuma, K.; Zakrzewski, V. G.; Voth, G. A.;
Salvador, P.; Dannenberg, J. J.; Dapprich, S.; Daniels, A. D.; Farkas,
O.; Foresman, J. B.; Ortiz, J. V.; Cioslowski, J.; Fox, D. J. Gaussian,
Inc., Wallingford CT, 2009.
62. Serrano-Andres, L.; Merchan, M.; Borin, A. C. J Am Chem Soc
2008, 130, 2473.
63. Li, L.; Lubman, D. M. Anal Chem 1987, 59, 2538.
64. Clark, L. B.; Peschel, G. G.; Tinoco, I. J Phys Chem 1965, 69,
3615.
65. Du, H.; Fuh, R. C. A.; Li, J. Z.; Corkan, L. A.; Lindsey, J. S. Photo-
chem Photobiol 1998, 68, 141.
66. Merchan, M.; Serrano-Andres, L. J Am Chem Soc 2003, 125,
8108.
67. Zaloudek, F.; Novros, J. S.; Clark, L. B. J Am Chem Soc 1985, 107,
7344.
68. Barbatti, M.; Aquino, A. J. A.; Lischka, H. PCCP 2010, 12, 4959.
69. Holmen, A.; Broo, A. Int J Quantum Chem 1995, 22, 113.
70. Fulscher, M. P.; Serrano-Andres, L.; Roos, B. O. J Am Chem Soc
1997, 119, 6168.
71. Serrano-Andres, L.; Merchan, M.; Borin, A. C. Chem—Eur J 2006,
12, 6559.
72. Fulscher, M. P.; Roos, B. O. J Am Chem Soc 1995, 117, 2089.
73. Blancafort, L.; Migani, A. J Photochem Photobiol Chem 2007, 190,
283.
74. Zhao, Y.; Truhlar, D. G. JCTC 2007, 3, 289.
75. Zhao, Y.; Truhlar, D. G. Acc Chem Res 2008, 41, 157.
76. Morgado, C. A.; Jurecka, P.; Svozil, D.; Hobza, P.; Sponer, J. PCCP
2010, 12, 3522.
77. Georgieva, I.; Trendafilova, N.; Aquino, A.; Lischka, H. J Phys
Chem A 2005, 109, 11860.
78. Gao, J. L.; Xia, X. F. Science 1992, 258, 631.
79. Lin, H.; Truhlar, D. G. Theor Chem Acc 2007, 117, 185.
80. Senn, H. M.; Thiel, W. Angew Chem Int Ed Engl 2009, 48, 1198.
1227The Charge Transfer States in a Stacked Nucleobase Dimer Complex
Journal of Computational Chemistry DOI 10.1002/jcc