The application of ultrasound to dairy ultrafiltration: The influence of operating conditions
10
The application of ultrasound to dairy ultrafiltration: The influence of operating conditions Shobha Muthukumaran a , Sandra E. Kentish a, * , Geoffrey W. Stevens a , Muthupandian Ashokkumar b , Raymond Mawson c a Particulate Fluids Processing Centre, Department of Chemical and Biomolecular Engineering, University of Melbourne, Vic. 3010, Australia b Particulate Fluids Processing Centre, School of Chemistry, University of Melbourne, Vic. 3010, Australia c Food Science Australia, Private Bag 16, Werribee, Vic. 3030, Australia Received 7 November 2005; received in revised form 9 November 2006; accepted 9 November 2006 Available online 2 January 2007 Abstract Work previously presented has shown that ultrasound can be effective in enhancing both the production and cleaning cycles of dairy membrane processes. In this present work we extend these previous results to consider the effect of ultrasonic frequency and the use of intermittent ultrasound. These results show that the use of continuous low frequency (50 kHz) ultrasound is most effective in both the fouling and cleaning cycles. The application of intermittent high frequency (1 MHz) ultrasound is less effective. At higher transmembrane pressure, high frequency pulsed sonication can indeed lead to a reduction in steady state membrane flux. The benefits of ultrasound arise from a reduction in both concentration polarization and in the resistance provided by the more labile protein deposits that are removed during a water wash. Conversely, the loss of membrane flux when high frequency pulsed sonication is used arises from a significant increase in the more tenacious ‘irreversible’ fouling deposit. Ó 2006 Elsevier Ltd. All rights reserved. Keywords: Ultrasound; Whey solutions; Ultrafiltration; Flux; Fouling; Cleaning 1. Introduction One of the critical issues in the development of effective whey ultrafiltration processes is the decline in system per- formance due to protein fouling, which limits the economic efficiency of the processing operation. Membrane fouling is generally characterized as a reduction of permeate flux through the membrane as a result of increased flow resis- tance due to pore blocking and cake formation. Several approaches have been proposed to reduce such membrane fouling and to improve the membrane cleaning efficiency. Such methods include intermittent backflushing, flow pul- sation and electrical field inducement. Of particular interest to the present work is the use of ultrasound for this purpose. Ultrasound has been studied in both cross-flow systems (Chai, Kobayashi, & Fujii, 1998, 1999; Kobayashi, Chai, & Fujii, 1999; Kobayashi, Kobayashi, Hosaka, & Fujii, 2003; Li, Sanderson, & Jacobs, 2002; Matsumoto, Miwa, Nakao, & Kimura, 1996; Wakeman & Tarleton, 1991) as well as in dead end filtration (Simon, Gondrexon, Taha, Cabon, & Dorange, 2000a; Simon, Penpenic, Gondrexon, Taha, & Dorange, 2000), often in combination with chemical and or water cleaning (Kobayashi et al., 2003). In our earlier studies (Muthukumaran, Kentish, Ashokkumar, & Ste- vens, 2005; Muthukumaran, Kentish, Lalchandani, et al., 2005; Muthukumaran et al., 2004), we have shown that the use of low frequency (50 kHz) ultrasound at low power densities enhances whey ultrafiltration and the cleaning of whey fouled membranes. Ultrasound has been found to increase the flux by both increasing the mass transfer coef- ficient within the concentration polarization layer and by providing a less compressible or ‘looser’ fouling cake. 0260-8774/$ - see front matter Ó 2006 Elsevier Ltd. All rights reserved. doi:10.1016/j.jfoodeng.2006.11.008 * Corresponding author. Tel.: +61 3 8344 6682; fax: +61 3 8344 4153. E-mail address: [email protected] (S.E. Kentish). www.elsevier.com/locate/jfoodeng Journal of Food Engineering 81 (2007) 364–373
-
Upload
independent -
Category
Documents
-
view
6 -
download
0
Transcript of The application of ultrasound to dairy ultrafiltration: The influence of operating conditions

www.elsevier.com/locate/jfoodeng
Journal of Food Engineering 81 (2007) 364–373
The application of ultrasound to dairy ultrafiltration: The influenceof operating conditions
Shobha Muthukumaran a, Sandra E. Kentish a,*, Geoffrey W. Stevens a,Muthupandian Ashokkumar b, Raymond Mawson c
a Particulate Fluids Processing Centre, Department of Chemical and Biomolecular Engineering, University of Melbourne, Vic. 3010, Australiab Particulate Fluids Processing Centre, School of Chemistry, University of Melbourne, Vic. 3010, Australia
c Food Science Australia, Private Bag 16, Werribee, Vic. 3030, Australia
Received 7 November 2005; received in revised form 9 November 2006; accepted 9 November 2006Available online 2 January 2007
Abstract
Work previously presented has shown that ultrasound can be effective in enhancing both the production and cleaning cycles of dairymembrane processes. In this present work we extend these previous results to consider the effect of ultrasonic frequency and the use ofintermittent ultrasound. These results show that the use of continuous low frequency (50 kHz) ultrasound is most effective in both thefouling and cleaning cycles. The application of intermittent high frequency (1 MHz) ultrasound is less effective. At higher transmembranepressure, high frequency pulsed sonication can indeed lead to a reduction in steady state membrane flux. The benefits of ultrasound arisefrom a reduction in both concentration polarization and in the resistance provided by the more labile protein deposits that are removedduring a water wash. Conversely, the loss of membrane flux when high frequency pulsed sonication is used arises from a significantincrease in the more tenacious ‘irreversible’ fouling deposit.� 2006 Elsevier Ltd. All rights reserved.
Keywords: Ultrasound; Whey solutions; Ultrafiltration; Flux; Fouling; Cleaning
1. Introduction
One of the critical issues in the development of effectivewhey ultrafiltration processes is the decline in system per-formance due to protein fouling, which limits the economicefficiency of the processing operation. Membrane fouling isgenerally characterized as a reduction of permeate fluxthrough the membrane as a result of increased flow resis-tance due to pore blocking and cake formation. Severalapproaches have been proposed to reduce such membranefouling and to improve the membrane cleaning efficiency.Such methods include intermittent backflushing, flow pul-sation and electrical field inducement. Of particular interestto the present work is the use of ultrasound for thispurpose.
0260-8774/$ - see front matter � 2006 Elsevier Ltd. All rights reserved.
doi:10.1016/j.jfoodeng.2006.11.008
* Corresponding author. Tel.: +61 3 8344 6682; fax: +61 3 8344 4153.E-mail address: [email protected] (S.E. Kentish).
Ultrasound has been studied in both cross-flow systems(Chai, Kobayashi, & Fujii, 1998, 1999; Kobayashi, Chai, &Fujii, 1999; Kobayashi, Kobayashi, Hosaka, & Fujii, 2003;Li, Sanderson, & Jacobs, 2002; Matsumoto, Miwa, Nakao,& Kimura, 1996; Wakeman & Tarleton, 1991) as well as indead end filtration (Simon, Gondrexon, Taha, Cabon, &Dorange, 2000a; Simon, Penpenic, Gondrexon, Taha, &Dorange, 2000), often in combination with chemical andor water cleaning (Kobayashi et al., 2003). In our earlierstudies (Muthukumaran, Kentish, Ashokkumar, & Ste-vens, 2005; Muthukumaran, Kentish, Lalchandani, et al.,2005; Muthukumaran et al., 2004), we have shown thatthe use of low frequency (50 kHz) ultrasound at low powerdensities enhances whey ultrafiltration and the cleaning ofwhey fouled membranes. Ultrasound has been found toincrease the flux by both increasing the mass transfer coef-ficient within the concentration polarization layer and byproviding a less compressible or ‘looser’ fouling cake.

Nomenclature
Jf permeate flux (l/m2 h)Jwi pure water flux (l/m2 h)Jwr water flux after fouling (l/m2 h)Jwc water flux after cleaning (l/m2 h)DP transmembrane pressure difference (kPa)Rtotal total resistance (m�1)Rm clean membrane resistance (m�1)Rb reversible resistance (m�1)Rf irreversible resistance (m�1)f0R0 cake growth factor (m/kg)
Rpo initial resistance of the protein deposit (m�1)Rc cleaned resistance (m�1)Eus ultrasonic enhancement factorTMP applied transmembrane pressure difference
(kPa)CFV cross-flow velocity (m/s)
Greek symbols
a pore blockage parameter (m2/kg)l solution viscosity (kg/m s)
Feed tank
Transducer array
Membraneunit
retentate permeate
balance
pump
Fig. 1. Experimental set-up. The cross-flow membrane module isimmersed in a water bath equipped with ultrasonic transducers. Dairywhey solution is pumped through the membrane unit and the retentaterecycled to the feed tank, while permeate mass is recorded on anautomated balance.
S. Muthukumaran et al. / Journal of Food Engineering 81 (2007) 364–373 365
Our work to date has considered only the use of contin-uous ultrasound at a single ultrasonic frequency (50 kHz).In this report, our aim is to consider a broader range ofoperating parameters. Firstly, we consider the use of inter-mittent rather than continuous ultrasonic application asthis is likely to be less energy intensive. Pulsed ultrasoundhas previously been shown to be very effective in maintain-ing high fluxes and high permeability of bovine serum albu-min (BSA) during cross-flow ultrafiltration (Yuk & Youm,2003). Similarly, Matsumoto et al. (1996) found that alter-nate operation of an ultrasonic generator and the feedpump was effective in removing BSA fouling layers froma membrane during cross-flow microfiltration. Conversely,Simon et al. (2000a) indicated that the use of intermittentultrasonic application was less effective than continuousapplication when applied to polymer solutions.
In this paper, we also consider the use of ultrasound at ahigher frequency (1 MHz). It is well established that at lowultrasonic frequencies, bubbles produced through acousticcavitation are relatively large and their violent collapseleads to microjetting and localized turbulence. At higherfrequencies, smaller bubbles are produced leading to lessintensive cavitational collapse events. Conversely, theacoustic energy radiated from a higher frequency ultra-sound source is more readily absorbed by the sonicatingfluid, leading to greater acoustic streaming flow rates thanat lower frequencies for the same power intensity (Suslick,1988). Both Kobayashi et al. (1999) and Lamminen et al.(2004) found that the ultrasonic enhancement of membraneprocesses was maximized at low frequency. Kobayashiet al. (1999) found that the permeate flux of dextran solu-tion could be maximized by using concurrent continuousultrasound at 28 kHz in a cross-flow system. There wasno effect on permeate flux at 100 kHz. Lamminen, Walker,and Weavers (2004) noted that the effectiveness of mem-brane cleaning was maximized at 70 kHz but that ultra-sound still had some effect at the maximum frequency of1062 kHz.
Finally, the experimental apparatus used in our priorwork was restricted in the range of cross-flow velocitiesthat could be studied. In this earlier work (Muthukumaran,Kentish, Ashokkumar, et al., 2005), the ultrasonic flux
enhancement was consistent across a range of cross-flowvelocities. However, the range of velocities that could betested was limited by equipment constraints. In this study,we also consider an alternate membrane module design inan attempt to increase the cross-flow velocity and hencethe shear stresses over the membrane. The intent here isto consider membrane performance over shear stressranges that are more consistent with the commercial appli-cation of spiral wound polymeric membrane systems.
2. Materials and methods
2.1. Experimental set-up
The same experimental set-up as described in our previ-ous reports (Muthukumaran, Kentish, Ashokkumar, et al.,2005; Muthukumaran, Kentish, Lalchandani, et al., 2005;Muthukumaran et al., 2004) has been used for this study.As shown in Fig. 1, a gear pump operating at 300–1000 ml/min is used to pump a feed solution through across-flow ultrafiltration unit. Permeate mass is measuredat 1 min intervals by an electronic balance connected to aPC. During the experiments the retentate is recycled tothe feed tank.

Fig. 2. Images of the membrane modules: (a) Minitan unit and (b) Vivaflow unit.
366 S. Muthukumaran et al. / Journal of Food Engineering 81 (2007) 364–373
For the present investigation two types of membranemodules were used. The first membrane module was a stan-dard Millipore Minitan module as used previously(Fig. 2(a)). In this unit, a polysulfone (PS) or polyethersulf-one (PES) membrane (15 cm � 8 cm) was placed betweentwo acrylic manifolds of thickness 2.3 cm, which were inturn held in place by metal plates of 1.1 cm thickness.The original membrane holder design was modified byreplacing the lower stainless steel plate with a perforatedaluminium plate to increase the penetration of ultrasonicwaves. Standard silicone separators of approximately0.5 mm thickness were used on both the feed and permeateside of the membrane, to create nine linear flow channelseach of approximately 7 mm width.
The second membrane module was a Sartorius Vivaflow50 modular cross-flow system (Fig. 2(b)). This unit con-tains an inbuilt polyethersulfone ultrafiltration membranewith 10000 MWCO and an effective area of 50 cm2. Theacrylic manifold encasing the membrane in this case ismuch thinner, of the order of 2 mm, thus allowing forgreater penetration of ultrasonic irradiation to the mem-
brane itself. The technical specifications of both units aresummarised in Table 1.
Further, in the present work, two alternate ultrasonicunits were used to generate low and high frequencyultrasonic irradiation respectively. As in our previouswork, an ultrasonic bath (Ultrasonics Australia, ModelFXP14DH) of internal dimensions 29.5 cm � 24 cm �20 cm provided continuous low frequency ultrasound(50 kHz) using 4 disc transducers with a total nominalpower of 300 W. However we also employed a megasonicsystem (SONOSYS� Ultraschallsysteme GmbH, Ger-many) to provide high frequency (1 MHz) ultrasound witha total nominal power of 300 W. This unit was comprisedof 4 linear arrays of transducer elements, arranged insidea rectangular plate (16 cm � 16 cm � 3.5 cm). The platewas immersed in a stainless steel bath of internal dimen-sions 29.5 cm � 24 cm � 23.5 cm so that the total depthof water above the transducers matched that in the ultra-sonic bath above. This megasonic unit could not be oper-ated continuously but rather in either an intermittentsequential mode, where the four linear transducer arrays

Table 1Technical specifications of the Minitan and Vivaflow membrane units
Technical specifications Minitan S unit Vivaflow 50 unit
Membrane used (MWCO) Polysulfone 8000 and 30000 Polyethersulfone 10000 (inbuilt)Polyethersulfone 10000
Membrane surface properties Hydrophobic NeutralActive membrane area (cm2) 30 50Feed flowrate (ml/min) 550 400Flow channel depth and width (mm) 0.5 � 63 0.3 � 15Cross-flow velocity (m/s) 0.28 1.5Wall shear stress (Pa) 0.0022 0.02Reynolds numbers 290 900
Wall shear stress for laminar flow = 4ul/w where u = cross-flow velocity, l = viscosity and w = channel depth.
S. Muthukumaran et al. / Journal of Food Engineering 81 (2007) 364–373 367
in the plate switched sequentially or in an intermittentpulsed mode, where all four transducers operated simulta-neously for a given period. In either case the pulse ‘on’ timewas 8 s and the ‘off’ time was 2 s. This implies that thepower delivery to any particular area of the membrane isof greater intensity but lower pulsing frequency in thesequential mode when all power is delivered through onelinear array at a time.
Both the membrane units were completely immersed in5000 ml of water and kept 3 cm above the transducerarrays throughout the entire experimental period. The bathwater was replaced as necessary to maintain the tempera-ture in the range, 20–22 �C.
Whey solutions were used as the foulant in all experi-ments. These solutions were reconstituted to 6 wt% totalsolids from spray dried non-hygroscopic sweet whey pow-der (Bonlac Foods Ltd. Australia) of approximately12 wt% total protein. The powder was mixed with deion-ised water and stirred at 50 �C for at least 30 min or untilcompletely clear. The solution was then cooled to roomtemperature. The pH of the prepared whey solution was6.4 and the average molecular weight of the constituentsof the whey powder was approximately 24,000 Da.
Deionised or distilled water was used throughout formembrane flushing, cleaning and measurement of waterfluxes.
2.2. Experimental procedure
2.2.1. Ultrasonic power determination
The power transferred from the transducers into thewater bath was measured calorimetrically by observingthe temperature change with time (Kimura et al., 1996;Ratoarinoro, Wilhelm, Berlan, & Delmas, 1995) using adigital thermometer. Power calibrations were carried outwithout the membrane unit in place, but with the bathfilled to the same vertical height as during experiments.While both ultrasonic units had a nominal power inputof 300 W, the average power dissipation into the bathwas found to be only 100 W (20 W/l or 0.14 W/cm2) forthe low frequency unit. For the megasonic unit in pulsedmode, the average dissipation was 75 W but this equatesto 94 W during the ‘on’ times of the pulses. Similarly, the
average dissipation in sequential mode was measured as60 W equating to 75 W during the ultrasonically activeperiods.
The actual power penetrating to the membrane surfacewould be less than this again, due to dissipation and reflec-tion from the membrane holder. Kobayashi et al. (2003)indicated that the power intensity reaching the membranein a Minitan unit similar to the present system would bereduced by a factor of 10 by these effects. However, inthe present work, the use of a perforated aluminium lowerplate (acoustic impedance of aluminium = 17 � 106 kg/m2 s) in place of a solid stainless steel plate (acousticimpedance of steel = 45 � 106 kg/m2 s) would increasetransmission of the ultrasonic waves. Similarly, the Viva-flow unit has a thin plastic casing (acoustic impedance ofplastic = 3 � 106 kg/m2 s) so there should be relatively lit-tle reduction in energy transmission to the membranesurface.
2.2.2. Ultrasound assisted cross-flow experiments
In all experiments, the permeate water flux (Jwi) was ini-tially measured and this value was used to obtain the cleanmembrane resistance (Rm) using the well known equation:
J ¼ DPlR
ð1Þ
where DP is the transmembrane pressure, l is the viscosityof the permeate solution and R is the resistance to solventpermeation.
Subsequently, the membrane was fouled for 4 h with afreshly prepared 6% w/w whey solution. In selected exper-iments, ultrasound of a given frequency and power levelwas applied during this fouling cycle. In all cases, themajority of the flux reduction occurred in the first 30 minof operation (see Fig. 3 for an example) with flow stabiliz-ing beyond this point. The steady state permeate flux (Jf)was determined by averaging the last 10 recorded valuesof permeate mass (i.e. last 10 min of flow in a 4 h run).Selected experiments were performed in duplicate and anaverage experimental error in this steady state whey fluxwas found to be ±6% or ±1 l/m2 h. The total fouling resis-tance Rtotal was calculated from this steady state value,again using Eq. (1).

10
20
30
40
50
0 10 20 30 40 50 60 70
Time (min)
Per
mea
te F
lux
(l/m
.hr)
2 Continuous UltrasoundIntermittent UltrasoundNo Ultrasound
Fig. 3. Effect of intermittent sonication on whey permeation using theMinitan unit and a PS30000 MWCO membrane (TMP = 55 kPa,CFV = 0.28 m/s).
368 S. Muthukumaran et al. / Journal of Food Engineering 81 (2007) 364–373
After this fouling cycle, the membrane surface wasrinsed with water for 10 min. This rinsing is intended toremove the reversible fouling resistance that results fromboth concentration polarization and labile surface deposits,leaving the more tenacious deposits. A water flux value(Jwr) was recorded over the last 5 min of this 10 min flush.
Results from these experiments were analysed using thewell known resistance in series model. In this case, the totalresistance Rtotal can be considered as the sum of three termsi.e., the membrane resistance, Rm, the reversible resistancearising from both concentration polarization and looseprotein deposits, Rb and the resistance due to the irrevers-ible, tenacious deposits, Rf:
Rtotal ¼ Rm þ Rb þ Rf ð2Þ
As given above, Rm was determined from the initial purewater flux, Rtotal from the steady state flux after fouling,and the sum Rm + Rf from the water rinsed flux. By differ-ence, Rf and Rb could then be individually determined.
The effect of ultrasound was also determined via anultrasonic enhancement factor (Muthukumaran, Kentish,Lalchandani, et al., 2005),
Eus ¼J f; ultrasound
J f ;no ultrasound
ð3Þ
where Jf, ultrasound and Jf, no ultrasound are the average steadystate permeate fluxes achieved with and withoutultrasound.
Finally, we also utilized in our analysis the model devel-oped by Ho and Zydney (2000) that describes the fluxdecay as a function of time when both pore blockage andcake filtration mechanisms are active. This model requiresthe simultaneous solution of two equations:
JJ 0
¼ exp � aDPCb
lRm
t� �
þ Rm
Rm þ Rp
1� expaDPCb
lRm
t� �� �
ð4Þ
Rp ¼ ðRm þ RpoÞffiffiffiffiffiffiffiffiffiffiffiffiffiffiffiffiffiffiffiffiffiffiffiffiffiffiffiffiffiffiffiffiffiffiffi1þ 2f 0R0DPCbt
lðRm þ RpoÞ2
s� Rm ð5Þ
The model contains three adjustable parameters i.e., thepore blockage factor a which describes the extent ofblocked pores, the initial resistance of the cake deposit(Rpo) and the cake growth factor (f0R0) which is the productof the fractional amount of protein present that contributesto deposit growth and the specific protein layer resistance.The best-fit values of these parameters were determined byminimizing the sum of the squared residuals between theexperimental filtrate flux data and the model calculations.
2.2.3. Ultrasound assisted cleaning experiments
Cleaning experiments followed a protocol similar to theone discussed above. After recording the clean water flux,the membrane was fouled for 30 min with freshly prepared6% w/w whey solution. The membrane was then rinsedwith water for 10 min to remove the reversible fouling loadand the water flux again recorded as above Jwr. This wasused to calculate Rf, the resistance of the irreversible foul-ing deposit (Eq. (1)).
The fouled membrane was next cleaned for a further10 min under different levels of both ultrasonic powerand frequency. After this cleaning cycle, the membrane sur-face was rinsed with water again for 10 min to removecleaning solutions and provide a consistent regime for fluxcalculation. The cleaned membrane flux (Jwc) was deter-mined over the final 5 min of this water rinse and thecleaned resistance Rc calculated.
Results from these cleaning experiments are presentedhere as a cleaning efficiency (CE) defined by Matzinosand Alvarez (2002):
CE ¼ Rf � Rc
Rf � Rm
� 100 ð6Þ
In both the fouling and cleaning experiments, the mem-brane was finally cleaned by circulating 0.1 M sodiumhydroxide and 15 mM of sodium dodecyl sulfate for5 min. The membrane was then left to soak in this solution.Milli-Q water/distilled water was fed into the unit to flushout the cleaning solution. A further permeate water fluxwas recorded and compared to the initial water flux. If nec-essary, further membrane cleaning was conducted until theoriginal clean membrane flux was restored. The experimen-tal variability in the final cleaned membrane flux measure-ment was ±9 l/m2 h or ±5% of the total value.
3. Results and discussion
3.1. Influence of intermittent ultrasound on the permeate flux
As discussed above, the high frequency ultrasonic unitcould only be operated in an intermittent format. Hence,to determine the effects of intermittent operation, the lowfrequency ultrasonic bath was first utilized in an intermit-tent mode for 1 h (5 min on/5 min off) and results com-pared to continuous operation. As shown in Fig. 3, whilesuch intermittent ultrasound appeared effective at shortoperation times, there was little flux improvement over

S. Muthukumaran et al. / Journal of Food Engineering 81 (2007) 364–373 369
longer time frames. This is consistent with the results ofSimon et al. (2000a). The ultrasonic enhancement factorfor intermittent ultrasound after 1 h was calculated as 1.1compared to a factor of 1.4 for continuous ultrasound.
3.2. Frequency effects
Fig. 4 compares the long term permeate flux achievedwhen using the Minitan membrane unit and a 30000MWCO membrane. In the absence of ultrasound, the per-meate flux declines as the transmembrane pressureincreases. This trend is somewhat unusual and can berelated to both the low cross-flow velocities in the Minitanunit, and the deformable nature of colloidal solids such aswhey proteins. At higher transmembrane pressures, thecompressive forces exerted on the cake layer favor a thickerand more densely packed cake layer which provides moreresistance to permeate flow.
With the addition of low frequency ultrasound, the fluxincreases across the full range of transmembrane pressures.The ultrasonic enhancement factor of around 1.5 (seeTable 2) is consistent with our previous results across arange of transmembrane pressures.
The high frequency pulsed unit provides a flux enhance-ment of 1.2 at low transmembrane pressures. While lowerthan the enhancement provided by the continuous low fre-quency ultrasound, this result is consistent with the resultsfor intermittent application described above. Of greaterconcern is the reduction in flux observed under these con-
0
5
10
15
20
0 50 100 150 200 250 300 350
Transmembrane Pressure (kPa)
Per
mea
te F
lux
(l/m
.hr)
2
50 kHz continuous1 MHz PulsedNo Ultrasound
Fig. 4. Effect of ultrasonic frequency on whey permeation using theMinitan unit and a PS30000 MWCO membrane (CFV = 0.28 m/s).
Table 2Whey permeate flux and ultrasonic enhancement factor at variable frequencie
Average permeate flux (l/m2 h)
Membrane pore size (MWCO) 30000
Transmembrane pressure (kPa) 55 150 300
Mode of operation50 kHz continuous 15 13 121 MHz pulsed 12 9.5 4.3No ultrasound 11 8.7 7.2
ditions at higher transmembrane pressures. Under theseconditions, the long term flux falls below the level providedin the absence of ultrasound. Similar results are obtainedwhen the membrane pore size is reduced from 30000 to8000 MWCO (Table 2).
These results are consistent with the work of Kobayashiet al. (1999) who found that while operating at 30 kPatransmembrane pressure, 20 kHz ultrasound was effective,but operation at 100 kHz resulted in no ultrasonic fluxenhancement. Similarly Duriyabunleng and Petmunee(2001) find that there is an optimum transmembrane pres-sure beyond which ultrasound is less effective. The distinc-tion in the present case is that the ultrasound appears to bepositively detrimental when both high transmembranepressures and ultrasonic frequencies are applied incombination.
In order to elucidate the cause of this loss in flux, thebehaviour of the individual resistances to flow were consid-ered. As expected, the hydraulic resistance of the mem-brane Rm is insensitive to sonication. At all pressures, the‘reversible’ fouling resistance, Rb is lower when either50 kHz or 1 MHz ultrasound is applied (Fig. 5(a)), relativeto the no-ultrasound case. This is consistent with the resultsof our previous work (Muthukumaran, Kentish, Ashokku-mar, et al., 2005), which indicate that ultrasound increasesthe mass transfer coefficient within the polarization bound-ary layer.
The irreversible fouling resistance Rf (Fig. 5(b)), pro-vided by the no-ultrasound case and the 50 kHz ultrasoundare comparable, indicating that ultrasound is relativelyineffective in reducing the extent of more tightly bounddeposits within the fouling cake and any pore blockage.Again, this is consistent with our previous work whichshowed that pore blockage was little affected by low fre-quency ultrasonic application. Of greater note is the dra-matic increase in irreversible fouling that occurs with thecombination of high frequency ultrasonic pulsed applica-tion and high transmembrane pressures. The fouling loadin this case is clearly greater than in the absence of ultra-sound. This increase in fouling could result either fromcompaction of the protein deposits into a more denselypacked cake layer or from such deposits being forced intothe membrane pores under the influence of this ultrasonicfield.
To gain further insight into these phenomena, the aboveresults were also analysed using the theoretical model
s using the Minitan unit (CFV = 0.28 m/s)
Ultrasonic enhancement factor
8000 30000 8000
300 55 150 300 300
7.6 1.4 1.5 1.7 1.63.8 1.2 1.1 0.6 0.84.8

Rev
ersi
ble
Res
ista
nce
(Rb)
x10
13 (
m-1)
Irre
vers
ible
Res
ista
nce
(Rf)
x10
13 (
m-1)
0
2
4
6
8
10
12
14
0 5 1 150 20 250 300 350
T
0
2
4
6
8
10
12
14
0 5 1 150 20 250 300 350
T
0
2
4
6
8
10
12
14
0 50 100 150 200 250 300 350
Transmembrane Pressure (kPa)
Transmembrane Pressure (kPa)
1 MHz Pulsed 30000MWCO50 kHz Continuous 30000MWCONo Ultrasound 8000 MWCO1 MHz Pulsed 8000MWCO50 kHz Continuous 8000MWCO
No Ultrasound 30000MWCO
1 MHz Pulsed 30000MWCO50 kHz Continuous 30000MWCONo Ultrasound 8000 MWCO1 MHz Plused 8000MWCO50 kHz Continuous 8000MWCO
No Ultrasound 30000MWCO
0
5
10
15
20
25
0 50 100 150 200 250 300 350
Fig. 5. Permeation resistance values as a function of transmembranepressure in the Minitan unit with a PS30000 MWCO membrane(CFV = 0.28 m/s): (a) reversible resistance and (b) irreversible resistance.
0
1
2
3
4
5
6
7
0 100 200 300 400
Transmembrane Pressure (kPa)
Transmembrane P
Por
e B
lock
age
Par
amet
er
(m /
kg)
2
0.01
0.1
1
10
100
0 100 200
Cak
e Gro
wth
Fac
tor
x1013
(m/k
g)
Fig. 6. Best-fit values of the fouling parameters as a function of the transmem(CFV = 0.28 m/s).
370 S. Muthukumaran et al. / Journal of Food Engineering 81 (2007) 364–373
developed by Ho and Zydney (2000). The best-fit values ofa, Rpo and f0R0 across a range of pressures are shown inFig. 6 for the 30000 MWCO membrane.
Results for the no-ultrasound and 50 kHz ultrasoundare comparable to our prior results. The use of ultrasoundreduces the pore blockage and initial deposit resistance alittle, but has most effect on the cake growth factor, reduc-ing this value by an order of magnitude. This implies thatthe fouling cake is either thinner (lower f0) and/or less com-pressed (lower R0) and thus offers less resistance.
There is no evidence of the high frequency ultrasoundproviding increased pore blockage, as the pore blockageparameter (a) is within the range of data for both low fre-quency and no ultrasound, and if anything decreases astransmembrane pressure increases. The initial deposit resis-tance matches that of the no-ultrasound case. However, thecake growth factor, while matching that for no ultrasoundat low transmembrane pressures, is significantly larger athigher TMP values. This indicates that either the fractionof the total protein contributing to cake formation (f0) isincreasing or that this cake layer is offering more resistance(R0) at high TMP. Sonication has been reported to causeboth particle agglomeration (Thompson & Doraiswamy,1990; Vimini, Kemp, & Fox, 1983) and possibly whey pro-tein denaturation (Villamiel & de Jong, 2000) and either ofthese effects could contribute to a thicker and/or morecompacted fouling cake.
3.3. Results with a high cross-flow velocity membrane module
Experiments were also carried out using the Viva flowmodule. This unit was operated at a cross-flow rate around
Transmembrane Pressure (kPa)
ressure (kPa)
0123456789
0 100 200 300 400
Init
ial D
epos
it R
esis
tanc
e
x1013
( m-1
)
300 400
50 kHz Continous
1 MHz Pulsed
No Ultrasound
brane pressure using the Minitan unit and a PS30000 MWCO membrane

S. Muthukumaran et al. / Journal of Food Engineering 81 (2007) 364–373 371
five times that used in the Minitan unit (1.5 versus 0.28 m/s) resulting in wall stresses a factor of 10 greater in magni-tude. However, experimental results with this unit dis-played a significant reduction in the steady state permeateflux after 4 h of operation. The surface potential of thePES membrane used in the Vivaflow unit is described asneutral whereas hydrophobic membranes were employedin the Minitan unit. This difference in membrane surfacepotential results in a significantly different pattern in thetotal flow resistance over time. As shown in Fig. 7, whilethe resistance is initially lower for the Vivaflow unit, thisresistance increases almost linearly with time, whereas theresistance in the Minitan unit levels off rapidly.
Table 3 shows the steady state whey permeate flux andthe permeation resistance values in the Vivaflow unit undervariable sonication modes after 4 h of permeation. Theultrasonic enhancement factor with the low frequency unitis comparable to that in the Minitan unit. This indicatesthat even with the increased wall shear stresses present inthis unit, ultrasound is still effective. This is consistent withour prior work (Muthukumaran, Kentish, Ashokkumar,et al., 2005) which showed that the addition of membranespacers also did not dramatically effect the ultrasonicenhancement. However, contrary to the Minitan module,ultrasound remains effective even with the use of high fre-quency ultrasound. The greater effectiveness of the highfrequency unit in this case can be related to both the highercross-flow velocities that will assist in preventing the depo-sition of a thicker fouling cake and the fact that the trans-
0
10
20
30
40
50
60
70
0 1 3 4
Tot
al R
esis
tanc
e (R
tot)
x10
13 (
m-1)
10
20
30
40
50
60
70
0.5 1.5 2.5 3.5
Time (Hours)
Vivaflow ModuleMinitan Module
2
Fig. 7. Total resistance as a function of time (Minitan unit, PES10000MWCO membrane, TMP = 300 kPa, CFV = 0.28 m/s: Viva flow unit,PES10000 MWCO membrane, TMP = 200 kPa, CFV = 1.5 m/s).
Table 3Whey permeate flux and permeation resistances at variable frequencies using
Mode of operation Average permeate flux (l/m2 h) Ultraso
50 kHz continuous 1.6 1.41 MHz pulsed 1.6 1.41 MHz sequential 1.6 1.4No ultrasound 1.2
membrane pressure utilized in this experiments (200 kPa) islower than the highest value used in the Minitan unit(300 kPa).
The ‘reversible’ fouling resistance (Rb) is much greaterthan in the Minitan module, but the ultrasonic fluxenhancement again occurs predominantly through a reduc-tion in this ‘reversible’ resistance. These effects may againbe attributed to an increase in the mass transfer coefficientwithin the flow boundary layer. Conversely, the irreversiblefouling resistance (Rf) is unaffected by sonication at anyfrequency.
3.4. Effect of ultrasonic frequency on the cleaning efficiency
Experiments were also carried out to determine the effectof ultrasound on cleaning efficiency. It should be noted thatthese cleaning experiments were conducted on a fouledmembrane that had already been subjected to a 10 minwater flush, so the results are indicative of the ability ofultrasound to remove the irreversible fouling layer.
Fig. 8 shows the effect of sonication time on the mem-brane permeate flux for a fixed fouling time of 30 min usingthe Vivaflow unit. It can be seen from this figure, that thecleaning efficiency is relatively low for all forms of ultra-sound, consistent with the discussion above that suggestsultrasound is less effective on this irreversible fouling.Cleaning is most effective when the low frequency continu-ous ultrasound is used relative to the 1 MHz pulsed source.Both modes of operation provide higher cleaning efficiency
the Vivaflow unit (TMP = 200 kPa, CFV = 1.5 m/s)
nic enhancement factor Resistance � 1013 (m�1)
Rm Rf Rb
0.40 12 320.44 11 320.51 12 330.41 11 51
0
5
10
15
20
25
30
35
0 5 10 15 20 25 30 35
1 MHz Sequential
0
5
10
15
20
25
30
35
Water Flush Time (min)
Cle
anin
g E
ffic
ienc
y (%
)
50 kHz Continuous
1 MHz PulsedNo Ultrasound
Fig. 8. Effect of ultrasonic frequency on the cleaning efficiency using theVivaflow unit for 30 min fouling at 200 kPa, 1.5 m/s and cleaning at60 kPa, 1.5 m/s.
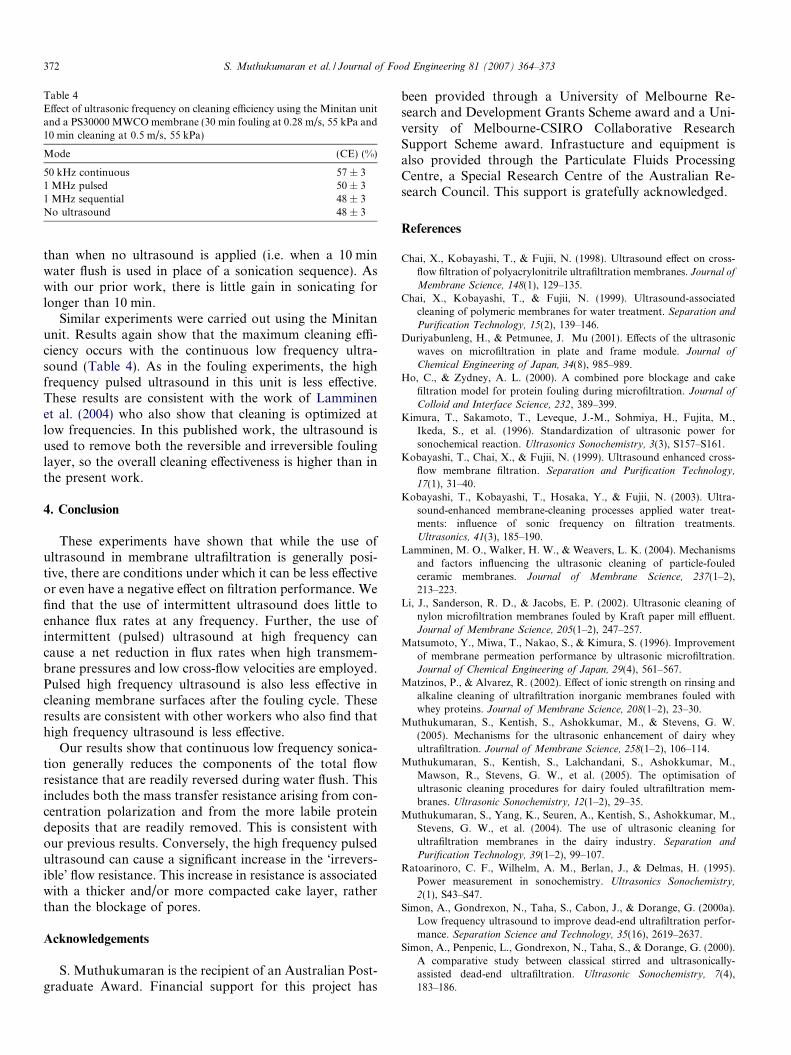
Table 4Effect of ultrasonic frequency on cleaning efficiency using the Minitan unitand a PS30000 MWCO membrane (30 min fouling at 0.28 m/s, 55 kPa and10 min cleaning at 0.5 m/s, 55 kPa)
Mode (CE) (%)
50 kHz continuous 57 ± 31 MHz pulsed 50 ± 31 MHz sequential 48 ± 3No ultrasound 48 ± 3
372 S. Muthukumaran et al. / Journal of Food Engineering 81 (2007) 364–373
than when no ultrasound is applied (i.e. when a 10 minwater flush is used in place of a sonication sequence). Aswith our prior work, there is little gain in sonicating forlonger than 10 min.
Similar experiments were carried out using the Minitanunit. Results again show that the maximum cleaning effi-ciency occurs with the continuous low frequency ultra-sound (Table 4). As in the fouling experiments, the highfrequency pulsed ultrasound in this unit is less effective.These results are consistent with the work of Lamminenet al. (2004) who also show that cleaning is optimized atlow frequencies. In this published work, the ultrasound isused to remove both the reversible and irreversible foulinglayer, so the overall cleaning effectiveness is higher than inthe present work.
4. Conclusion
These experiments have shown that while the use ofultrasound in membrane ultrafiltration is generally posi-tive, there are conditions under which it can be less effectiveor even have a negative effect on filtration performance. Wefind that the use of intermittent ultrasound does little toenhance flux rates at any frequency. Further, the use ofintermittent (pulsed) ultrasound at high frequency cancause a net reduction in flux rates when high transmem-brane pressures and low cross-flow velocities are employed.Pulsed high frequency ultrasound is also less effective incleaning membrane surfaces after the fouling cycle. Theseresults are consistent with other workers who also find thathigh frequency ultrasound is less effective.
Our results show that continuous low frequency sonica-tion generally reduces the components of the total flowresistance that are readily reversed during water flush. Thisincludes both the mass transfer resistance arising from con-centration polarization and from the more labile proteindeposits that are readily removed. This is consistent withour previous results. Conversely, the high frequency pulsedultrasound can cause a significant increase in the ‘irrevers-ible’ flow resistance. This increase in resistance is associatedwith a thicker and/or more compacted cake layer, ratherthan the blockage of pores.
Acknowledgements
S. Muthukumaran is the recipient of an Australian Post-graduate Award. Financial support for this project has
been provided through a University of Melbourne Re-search and Development Grants Scheme award and a Uni-versity of Melbourne-CSIRO Collaborative ResearchSupport Scheme award. Infrastucture and equipment isalso provided through the Particulate Fluids ProcessingCentre, a Special Research Centre of the Australian Re-search Council. This support is gratefully acknowledged.
References
Chai, X., Kobayashi, T., & Fujii, N. (1998). Ultrasound effect on cross-flow filtration of polyacrylonitrile ultrafiltration membranes. Journal of
Membrane Science, 148(1), 129–135.Chai, X., Kobayashi, T., & Fujii, N. (1999). Ultrasound-associated
cleaning of polymeric membranes for water treatment. Separation and
Purification Technology, 15(2), 139–146.Duriyabunleng, H., & Petmunee, J. Mu (2001). Effects of the ultrasonic
waves on microfiltration in plate and frame module. Journal of
Chemical Engineering of Japan, 34(8), 985–989.Ho, C., & Zydney, A. L. (2000). A combined pore blockage and cake
filtration model for protein fouling during microfiltration. Journal of
Colloid and Interface Science, 232, 389–399.Kimura, T., Sakamoto, T., Leveque, J.-M., Sohmiya, H., Fujita, M.,
Ikeda, S., et al. (1996). Standardization of ultrasonic power forsonochemical reaction. Ultrasonics Sonochemistry, 3(3), S157–S161.
Kobayashi, T., Chai, X., & Fujii, N. (1999). Ultrasound enhanced cross-flow membrane filtration. Separation and Purification Technology,
17(1), 31–40.Kobayashi, T., Kobayashi, T., Hosaka, Y., & Fujii, N. (2003). Ultra-
sound-enhanced membrane-cleaning processes applied water treat-ments: influence of sonic frequency on filtration treatments.Ultrasonics, 41(3), 185–190.
Lamminen, M. O., Walker, H. W., & Weavers, L. K. (2004). Mechanismsand factors influencing the ultrasonic cleaning of particle-fouledceramic membranes. Journal of Membrane Science, 237(1–2),213–223.
Li, J., Sanderson, R. D., & Jacobs, E. P. (2002). Ultrasonic cleaning ofnylon microfiltration membranes fouled by Kraft paper mill effluent.Journal of Membrane Science, 205(1–2), 247–257.
Matsumoto, Y., Miwa, T., Nakao, S., & Kimura, S. (1996). Improvementof membrane permeation performance by ultrasonic microfiltration.Journal of Chemical Engineering of Japan, 29(4), 561–567.
Matzinos, P., & Alvarez, R. (2002). Effect of ionic strength on rinsing andalkaline cleaning of ultrafiltration inorganic membranes fouled withwhey proteins. Journal of Membrane Science, 208(1–2), 23–30.
Muthukumaran, S., Kentish, S., Ashokkumar, M., & Stevens, G. W.(2005). Mechanisms for the ultrasonic enhancement of dairy wheyultrafiltration. Journal of Membrane Science, 258(1–2), 106–114.
Muthukumaran, S., Kentish, S., Lalchandani, S., Ashokkumar, M.,Mawson, R., Stevens, G. W., et al. (2005). The optimisation ofultrasonic cleaning procedures for dairy fouled ultrafiltration mem-branes. Ultrasonic Sonochemistry, 12(1–2), 29–35.
Muthukumaran, S., Yang, K., Seuren, A., Kentish, S., Ashokkumar, M.,Stevens, G. W., et al. (2004). The use of ultrasonic cleaning forultrafiltration membranes in the dairy industry. Separation and
Purification Technology, 39(1–2), 99–107.Ratoarinoro, C. F., Wilhelm, A. M., Berlan, J., & Delmas, H. (1995).
Power measurement in sonochemistry. Ultrasonics Sonochemistry,
2(1), S43–S47.Simon, A., Gondrexon, N., Taha, S., Cabon, J., & Dorange, G. (2000a).
Low frequency ultrasound to improve dead-end ultrafiltration perfor-mance. Separation Science and Technology, 35(16), 2619–2637.
Simon, A., Penpenic, L., Gondrexon, N., Taha, S., & Dorange, G. (2000).A comparative study between classical stirred and ultrasonically-assisted dead-end ultrafiltration. Ultrasonic Sonochemistry, 7(4),183–186.

S. Muthukumaran et al. / Journal of Food Engineering 81 (2007) 364–373 373
Suslick, K. S. (1988). Ultrasound: Its chemical physical and biological
effects. New York: VCH Publishers.Thompson, L. H., & Doraiswamy, L. K. (1990). Sonochemistry: science
and engineering. Industrial & Engineering Chemistry Research, 38,1215–1249.
Villamiel, M., & de Jong, P. (2000). Influence of high-intensity ultrasoundand heat treatment in continuous flow on fat, proteins and nativeenzymes of milk. Journal of Agricultural and Food Chemistry, 48(2),472–478.
Vimini, R. J., Kemp, J. D., & Fox, J. D. (1983). Effects of low-frequencyultrasound on properties of restructured beef rolls. Journal of Food
Science, 48, 1572.Wakeman, R. J., & Tarleton, E. S. (1991). An experimental study of
electroacoustic crossflow microfiltration. Chemical Engineering
Research and Design, 69(A5), 386–397.Yuk, Y. J., & Youm, K. H. (2003). Enhancement of ultrafiltration
performance using ultrasound. Memburein, 13(4), 283–290.