The 2007 flood in Tabasco, Mexico: an integral analysis of a devastating phenomenon
14
PLEASE SCROLL DOWN FOR ARTICLE This article was downloaded by: [UNIVERSIDAD JUAREZ AUTONOMA DE TABASCO] On: 21 September 2010 Access details: Access Details: [subscription number 917418368] Publisher Taylor & Francis Informa Ltd Registered in England and Wales Registered Number: 1072954 Registered office: Mortimer House, 37- 41 Mortimer Street, London W1T 3JH, UK International Journal of River Basin Management Publication details, including instructions for authors and subscription information: http://www.informaworld.com/smpp/title~content=t916241382 The 2007 flood in Tabasco, Mexico: an integral analysis of a devastating phenomenon Fabian Rivera-Trejo a ; Gabriel Soto-Cortés b ; Baldemar Méndez-Antonio b a Juarez Autonomous University of Tabasco, Tabasco, México b Metropolitan Autonomous University, Azcapotzalco, México First published on: 15 September 2010 To cite this Article Rivera-Trejo, Fabian , Soto-Cortés, Gabriel and Méndez-Antonio, Baldemar(2010) 'The 2007 flood in Tabasco, Mexico: an integral analysis of a devastating phenomenon', International Journal of River Basin Management,, First published on: 15 September 2010 (iFirst) To link to this Article: DOI: 10.1080/15715124.2010.508746 URL: http://dx.doi.org/10.1080/15715124.2010.508746 Full terms and conditions of use: http://www.informaworld.com/terms-and-conditions-of-access.pdf This article may be used for research, teaching and private study purposes. Any substantial or systematic reproduction, re-distribution, re-selling, loan or sub-licensing, systematic supply or distribution in any form to anyone is expressly forbidden. The publisher does not give any warranty express or implied or make any representation that the contents will be complete or accurate or up to date. The accuracy of any instructions, formulae and drug doses should be independently verified with primary sources. The publisher shall not be liable for any loss, actions, claims, proceedings, demand or costs or damages whatsoever or howsoever caused arising directly or indirectly in connection with or arising out of the use of this material.
Transcript of The 2007 flood in Tabasco, Mexico: an integral analysis of a devastating phenomenon
PLEASE SCROLL DOWN FOR ARTICLE
This article was downloaded by: [UNIVERSIDAD JUAREZ AUTONOMA DE TABASCO]On: 21 September 2010Access details: Access Details: [subscription number 917418368]Publisher Taylor & FrancisInforma Ltd Registered in England and Wales Registered Number: 1072954 Registered office: Mortimer House, 37-41 Mortimer Street, London W1T 3JH, UK
International Journal of River Basin ManagementPublication details, including instructions for authors and subscription information:http://www.informaworld.com/smpp/title~content=t916241382
The 2007 flood in Tabasco, Mexico: an integral analysis of a devastatingphenomenonFabian Rivera-Trejoa; Gabriel Soto-Cortésb; Baldemar Méndez-Antoniob
a Juarez Autonomous University of Tabasco, Tabasco, México b Metropolitan Autonomous University,Azcapotzalco, México
First published on: 15 September 2010
To cite this Article Rivera-Trejo, Fabian , Soto-Cortés, Gabriel and Méndez-Antonio, Baldemar(2010) 'The 2007 flood inTabasco, Mexico: an integral analysis of a devastating phenomenon', International Journal of River Basin Management,,First published on: 15 September 2010 (iFirst)To link to this Article: DOI: 10.1080/15715124.2010.508746URL: http://dx.doi.org/10.1080/15715124.2010.508746
Full terms and conditions of use: http://www.informaworld.com/terms-and-conditions-of-access.pdf
This article may be used for research, teaching and private study purposes. Any substantial orsystematic reproduction, re-distribution, re-selling, loan or sub-licensing, systematic supply ordistribution in any form to anyone is expressly forbidden.
The publisher does not give any warranty express or implied or make any representation that the contentswill be complete or accurate or up to date. The accuracy of any instructions, formulae and drug dosesshould be independently verified with primary sources. The publisher shall not be liable for any loss,actions, claims, proceedings, demand or costs or damages whatsoever or howsoever caused arising directlyor indirectly in connection with or arising out of the use of this material.
Research paper
The 2007 flood in Tabasco, Mexico: an integral analysis of a devastatingphenomenon
FABIAN RIVERA-TREJO, Professor of Hydraulic Engineering, Juarez Autonomous University of Tabasco.Cunduacan, Tabasco, Mexico. Email: [email protected] (Author for correspondence)
GABRIEL SOTO-CORTES, Professor of Civil Engineering, Metropolitan Autonomous University, Azcapotzalco,Mexico. Email: [email protected]
BALDEMAR MENDEZ-ANTONIO, Professor of Civil Engineering, Metropolitan Autonomous University,Azcapotzalco, Mexico. Email: [email protected]
ABSTRACTA markedly intense rain fell on southeastern Mexico during the period of 29 October–1 November 2007. As a result, the state of Tabasco recorded thegravest flood in the last 50 years. A reconstruction of the event is presented, including the identification of the factors that aggravated the sequels, and adiscussion of the actions that were carried out to evaluate the flooding. The phenomenon consisted of a succession of rains in the region, including 3 daysof continuous rain with over 403 mm d21. The operation of a system of dams, the saturation of the soil, and runoff times below 16 h were the factors thatgenerated the catastrophe, in synergy with the meteorological phenomenon. The analysis presented here will aid in understanding the development ofthe phenomenon in an integral way, and in establishing the minimum procedures to be followed to evaluate similar events in other regions where, as inMexico, one does not have timely access to information. In the case of this disaster, for example, different versions of the causes of the flood continued tocirculate 6 months after it took place, some lacking technical bases and some access-restricted. However, the information generated provided the aca-demic community and state officials with a reference on which to evaluate the event. This analysis also makes a contribution by placing emphasis on theneed to establish non-structural mitigation measures such as future urban growth and regulation plans and future early warning systems against flooding,monitoring the variables that were analysed and generating products useful to the decision-makers involved in civil protection systems and in carryingout preventive measures to mitigate the effects of extreme events.
Keywords: Rainfall; extreme events; effects; risks; protection plans
1 Introduction
The state of Tabasco suffered its gravest flood of the last 50 years
during the year 2007. An intense rain fell on southeastern Mexico
from 29 October to 1 November, and mainly affected the states of
Chiapas and Tabasco (Figures 1 and 2). The heavy rain followed
the combination of a cold front from the USA and tropical storm
‘Noel’ (Hernandez Unzon 2007). The result was 4 days of rain
that recorded the equivalent of 1 year’s rain in Tabasco
(CONAGUA 2007). The overflowing of rivers and streams
caused one of the greatest floods in the country, although fortu-
nately there were no human losses. As a result of its geographic
position, the history of Tabasco has documented a great number
of floods (Velazquez 2001). Floods are extreme natural events
that have occurred in diverse regions of the world including
Italy (Ratto et al. 2007), India (Shankar 2005), the Netherlands
(De Witt et al. 2007), England (Marsh and Hannaford 2007)
and the USA (Biloxi 2008), together with the resulting problems.
Ganoulis (2003) commented that floods are infrequent natural
phenomena, with extreme rains as the main cause. At the same
time, the effect is maximized by anthropogenic activities and
hydraulic constructions that alter the natural conditions of
runoff patterns and ecosystems in general. The flood of 2007
severely damaged the infrastructure established in the state of
Tabasco. Damage was reported in highways, urban areas, electric
networks, educational buildings, hydraulic installations and the
media, among others (SAOP 2008). To date, although there are
a variety of versions on the causes that originated the flood,
several lack technical support or are access-restricted. The objec-
tives of this study were to describe the 2007 event, to analyse
Received 6 October 2009. Accepted 13 July 2010.
ISSN 1571-5124 print/ISSN 1814-2060 onlineDOI:10.1080/15715124.2010.508746http://www.informaworld.com
1
Intl. J. River Basin Management iFirst, 2010, 1–13
# 2010 International Association for Hydro-Environment Engineering and Research
Downloaded By: [UNIVERSIDAD JUAREZ AUTONOMA DE TABASCO] At: 14:05 21 September 2010
some of the actions that were implemented after the event to
mitigate future risks, and to discuss the need to install an early
warning system. This analysis will make it possible to identify
the causes and/or factors that originated this phenomenon and
to help evaluate the system for the protection against future poten-
tial flooding, considering that the data and information on the
event were provided after it took place – a posteriori (diagnosis).
The reason behind this is that there is no entity in Tabasco, or in
Mexico, in charge of real-time monitoring of this type of event.
Phenomena such as those described here need to be monitored,
with forecasting and operational objectives, in order to generate
useful hydrometeorological products that decision-makers may
use to mitigate future damage caused by extreme events of this
type in areas like Tabasco, where flooding is extreme and frequent
and economic losses are considerable. CENAPRED (2009)
reported a loss of 3100 million dollars for this flood. Also,
Mexico has no urban growth and regulation plans that consider
areas prone to flooding.
2 Location
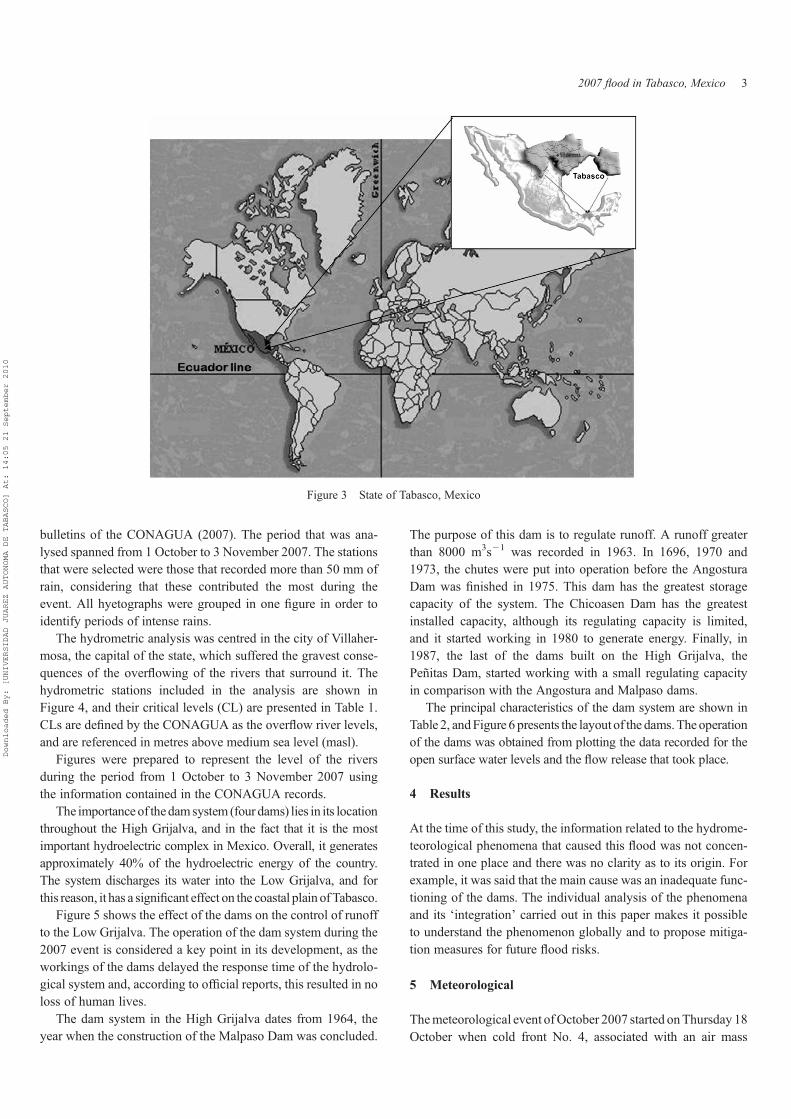
The state of Tabasco is located in southeastern Mexico, in the
physiographic province of the Coastal Plain of the Southern
Gulf of Mexico (Figure 3). It covers an area of approximately
24,661 km2, equivalent to 1.3% of the national territory (Velazquez
1994). The average annual rainfall (recorded from 1941 to 2005)
is the highest in the country at 2405 mm (CONAGUA 2006).
3 Method
The processing and analysis of the information was based on the
hydrometric, climate and dam data published daily by the Comi-
sion Nacional del Agua (CONAGUA – National Water Com-
mission) at its office for the Frontera Sur basin. The region that
was affected harbours the data recording network located in
the basins of the High Grijalva, Low Grijalva and Usumacinta.
The phenomenon was described by separating it into its climato-
logical, pluviometric, hydrometric and dam operation com-
ponents. Tides were not included in the analysis as there was
no access to the official data. Each element was considered indi-
vidually, and was later integrated, to allow a better comprehen-
sion of the event. The meteorological analysis was carried out
using the information contained in a description of cold front
No. 4 prepared by the National Water Commission in 2007 (Her-
nandez Unzon 2007). This event was described chronologically
from the moment it was predicted to its conclusion. The pluvio-
metric analysis consisted of constructing rain hyetographs for
some stations, based on the rainfall data presented in the official
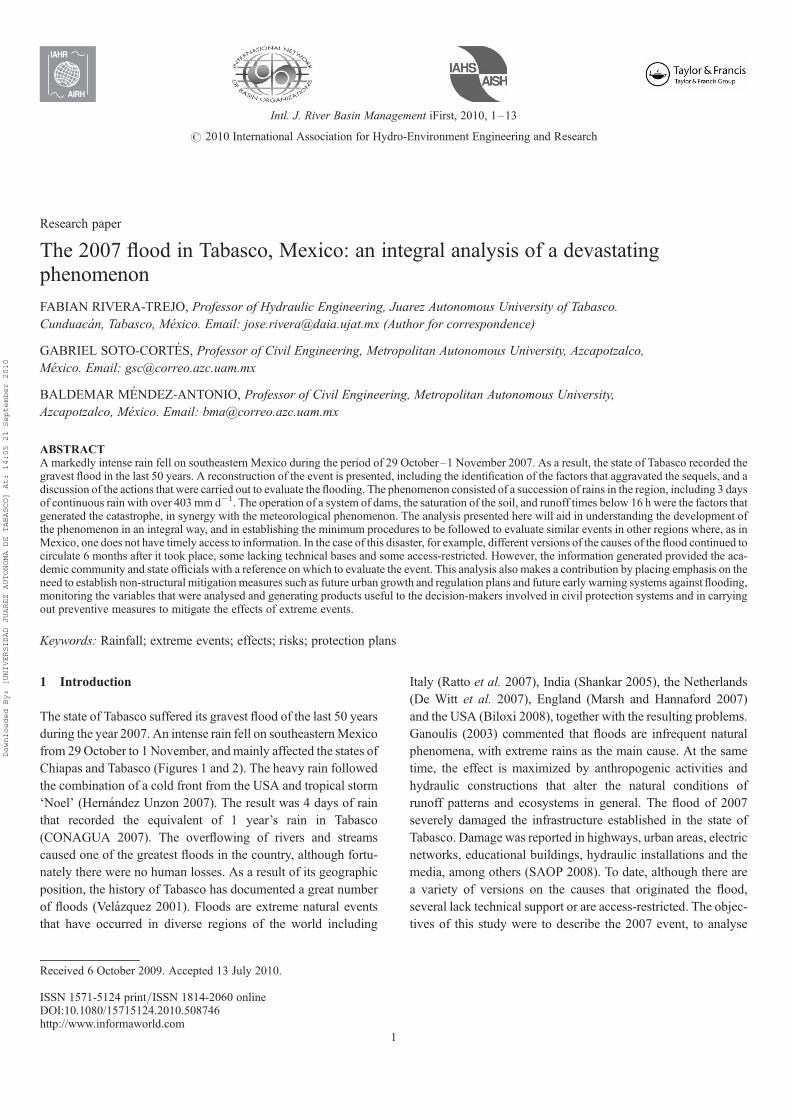
Figure 2 Gaviotas neighbourhood, Villahermosa, Tabasco
Figure 1 Downtown Villahermosa, Tabasco
2 Fabian Rivera-Trejo et al.
Downloaded By: [UNIVERSIDAD JUAREZ AUTONOMA DE TABASCO] At: 14:05 21 September 2010
bulletins of the CONAGUA (2007). The period that was ana-
lysed spanned from 1 October to 3 November 2007. The stations
that were selected were those that recorded more than 50 mm of
rain, considering that these contributed the most during the
event. All hyetographs were grouped in one figure in order to
identify periods of intense rains.
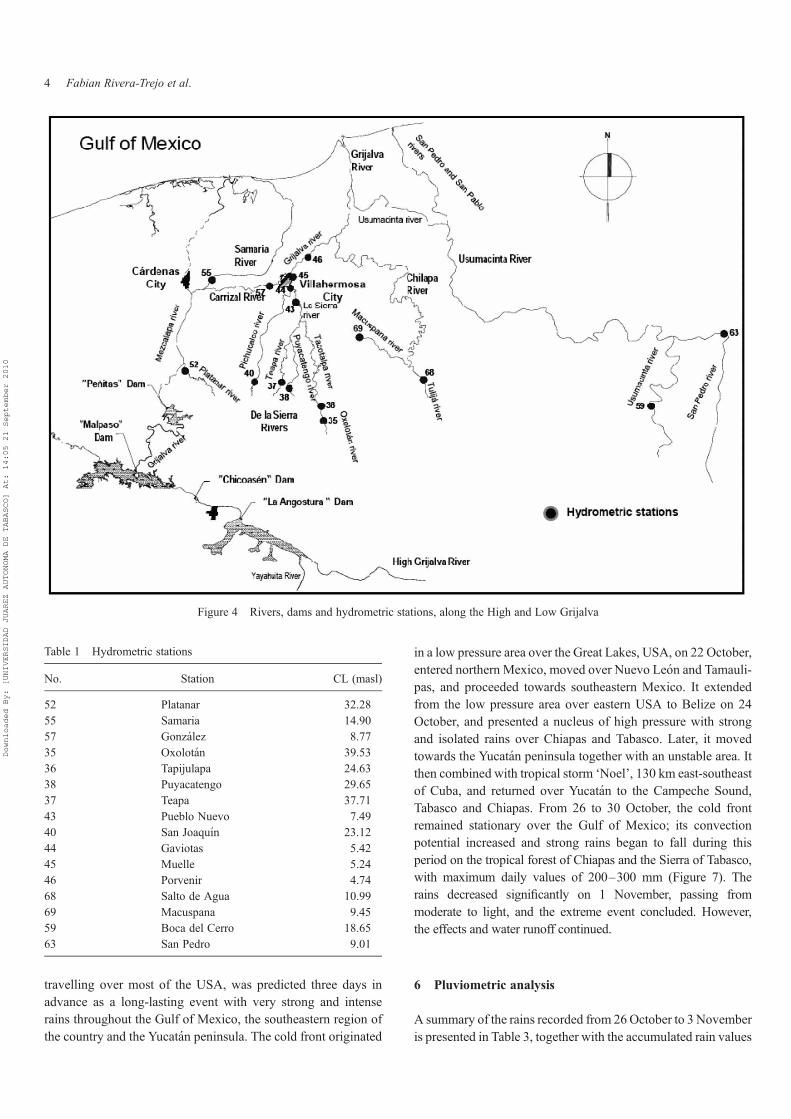
The hydrometric analysis was centred in the city of Villaher-
mosa, the capital of the state, which suffered the gravest conse-
quences of the overflowing of the rivers that surround it. The
hydrometric stations included in the analysis are shown in
Figure 4, and their critical levels (CL) are presented in Table 1.
CLs are defined by the CONAGUA as the overflow river levels,
and are referenced in metres above medium sea level (masl).
Figures were prepared to represent the level of the rivers
during the period from 1 October to 3 November 2007 using
the information contained in the CONAGUA records.
The importance of the dam system (four dams) lies in its location
throughout the High Grijalva, and in the fact that it is the most
important hydroelectric complex in Mexico. Overall, it generates
approximately 40% of the hydroelectric energy of the country.
The system discharges its water into the Low Grijalva, and for
this reason, it has a significant effect on the coastal plain of Tabasco.
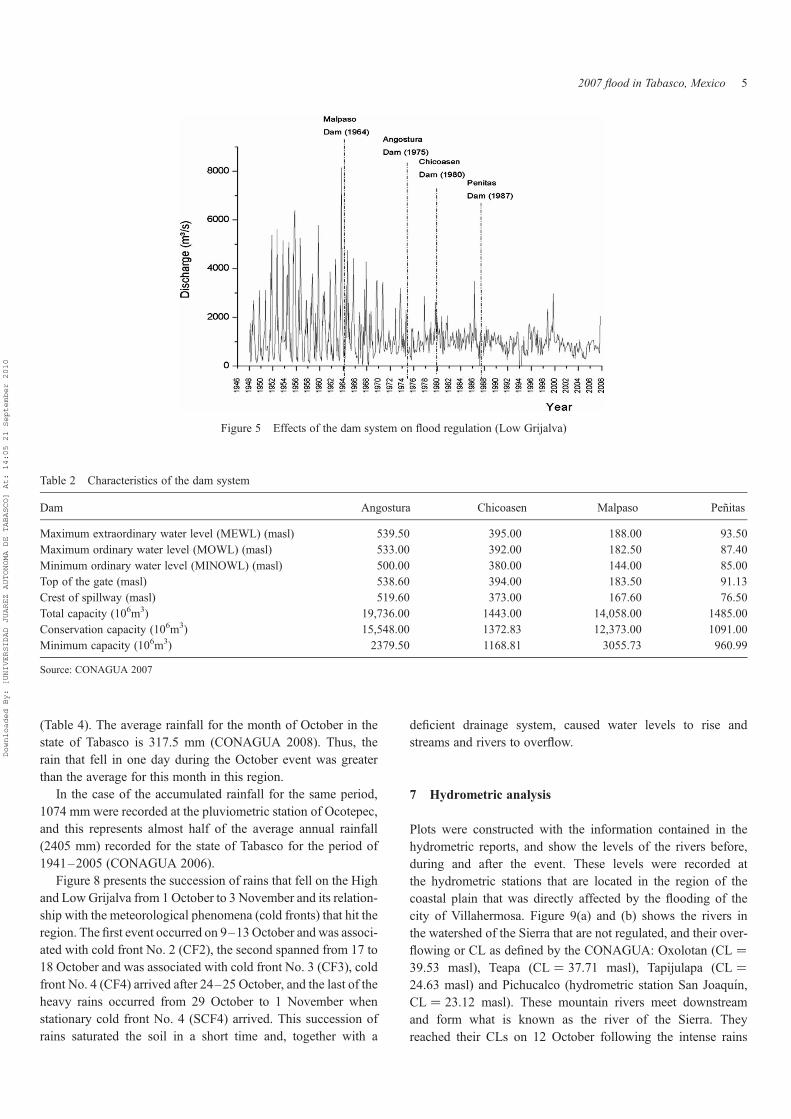
Figure 5 shows the effect of the dams on the control of runoff
to the Low Grijalva. The operation of the dam system during the
2007 event is considered a key point in its development, as the
workings of the dams delayed the response time of the hydrolo-
gical system and, according to official reports, this resulted in no
loss of human lives.
The dam system in the High Grijalva dates from 1964, the
year when the construction of the Malpaso Dam was concluded.
The purpose of this dam is to regulate runoff. A runoff greater
than 8000 m3s21 was recorded in 1963. In 1696, 1970 and
1973, the chutes were put into operation before the Angostura
Dam was finished in 1975. This dam has the greatest storage
capacity of the system. The Chicoasen Dam has the greatest
installed capacity, although its regulating capacity is limited,
and it started working in 1980 to generate energy. Finally, in
1987, the last of the dams built on the High Grijalva, the
Penitas Dam, started working with a small regulating capacity
in comparison with the Angostura and Malpaso dams.
The principal characteristics of the dam system are shown in
Table 2, and Figure 6 presents the layout of the dams. The operation
of the dams was obtained from plotting the data recorded for the
open surface water levels and the flow release that took place.
4 Results
At the time of this study, the information related to the hydrome-
teorological phenomena that caused this flood was not concen-
trated in one place and there was no clarity as to its origin. For
example, it was said that the main cause was an inadequate func-
tioning of the dams. The individual analysis of the phenomena
and its ‘integration’ carried out in this paper makes it possible
to understand the phenomenon globally and to propose mitiga-
tion measures for future flood risks.
5 Meteorological
The meteorological event of October 2007 started on Thursday 18
October when cold front No. 4, associated with an air mass
Figure 3 State of Tabasco, Mexico
2007 flood in Tabasco, Mexico 3
Downloaded By: [UNIVERSIDAD JUAREZ AUTONOMA DE TABASCO] At: 14:05 21 September 2010
travelling over most of the USA, was predicted three days in
advance as a long-lasting event with very strong and intense
rains throughout the Gulf of Mexico, the southeastern region of
the country and the Yucatan peninsula. The cold front originated
in a low pressure area over the Great Lakes, USA, on 22 October,
entered northern Mexico, moved over Nuevo Leon and Tamauli-
pas, and proceeded towards southeastern Mexico. It extended
from the low pressure area over eastern USA to Belize on 24
October, and presented a nucleus of high pressure with strong
and isolated rains over Chiapas and Tabasco. Later, it moved
towards the Yucatan peninsula together with an unstable area. It
then combined with tropical storm ‘Noel’, 130 km east-southeast
of Cuba, and returned over Yucatan to the Campeche Sound,
Tabasco and Chiapas. From 26 to 30 October, the cold front
remained stationary over the Gulf of Mexico; its convection
potential increased and strong rains began to fall during this
period on the tropical forest of Chiapas and the Sierra of Tabasco,
with maximum daily values of 200–300 mm (Figure 7). The
rains decreased significantly on 1 November, passing from
moderate to light, and the extreme event concluded. However,
the effects and water runoff continued.
6 Pluviometric analysis
A summary of the rains recorded from 26 October to 3 November
is presented in Table 3, together with the accumulated rain values
Figure 4 Rivers, dams and hydrometric stations, along the High and Low Grijalva
Table 1 Hydrometric stations
No. Station CL (masl)
52 Platanar 32.28
55 Samaria 14.90
57 Gonzalez 8.77
35 Oxolotan 39.53
36 Tapijulapa 24.63
38 Puyacatengo 29.65
37 Teapa 37.71
43 Pueblo Nuevo 7.49
40 San Joaquın 23.12
44 Gaviotas 5.42
45 Muelle 5.24
46 Porvenir 4.74
68 Salto de Agua 10.99
69 Macuspana 9.45
59 Boca del Cerro 18.65
63 San Pedro 9.01
4 Fabian Rivera-Trejo et al.
Downloaded By: [UNIVERSIDAD JUAREZ AUTONOMA DE TABASCO] At: 14:05 21 September 2010
(Table 4). The average rainfall for the month of October in the
state of Tabasco is 317.5 mm (CONAGUA 2008). Thus, the
rain that fell in one day during the October event was greater
than the average for this month in this region.
In the case of the accumulated rainfall for the same period,
1074 mm were recorded at the pluviometric station of Ocotepec,
and this represents almost half of the average annual rainfall
(2405 mm) recorded for the state of Tabasco for the period of
1941–2005 (CONAGUA 2006).
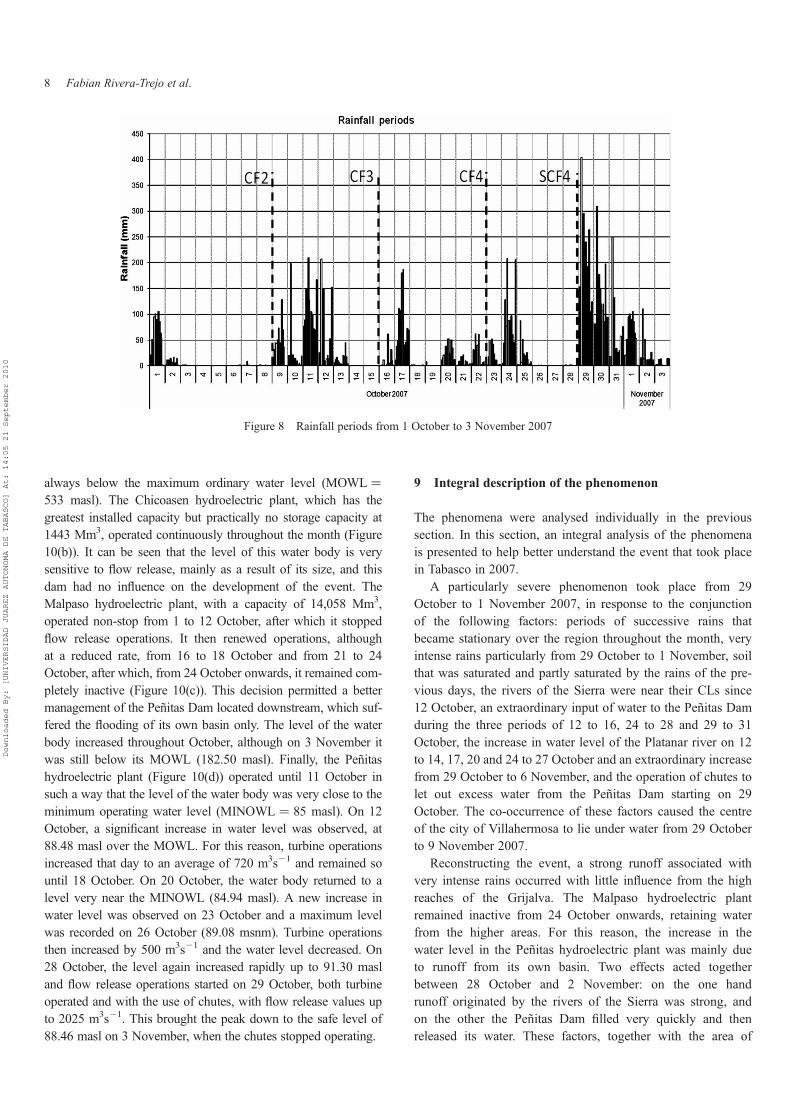
Figure 8 presents the succession of rains that fell on the High
and Low Grijalva from 1 October to 3 November and its relation-
ship with the meteorological phenomena (cold fronts) that hit the
region. The first event occurred on 9–13 October and was associ-
ated with cold front No. 2 (CF2), the second spanned from 17 to
18 October and was associated with cold front No. 3 (CF3), cold
front No. 4 (CF4) arrived after 24–25 October, and the last of the
heavy rains occurred from 29 October to 1 November when
stationary cold front No. 4 (SCF4) arrived. This succession of
rains saturated the soil in a short time and, together with a
deficient drainage system, caused water levels to rise and
streams and rivers to overflow.
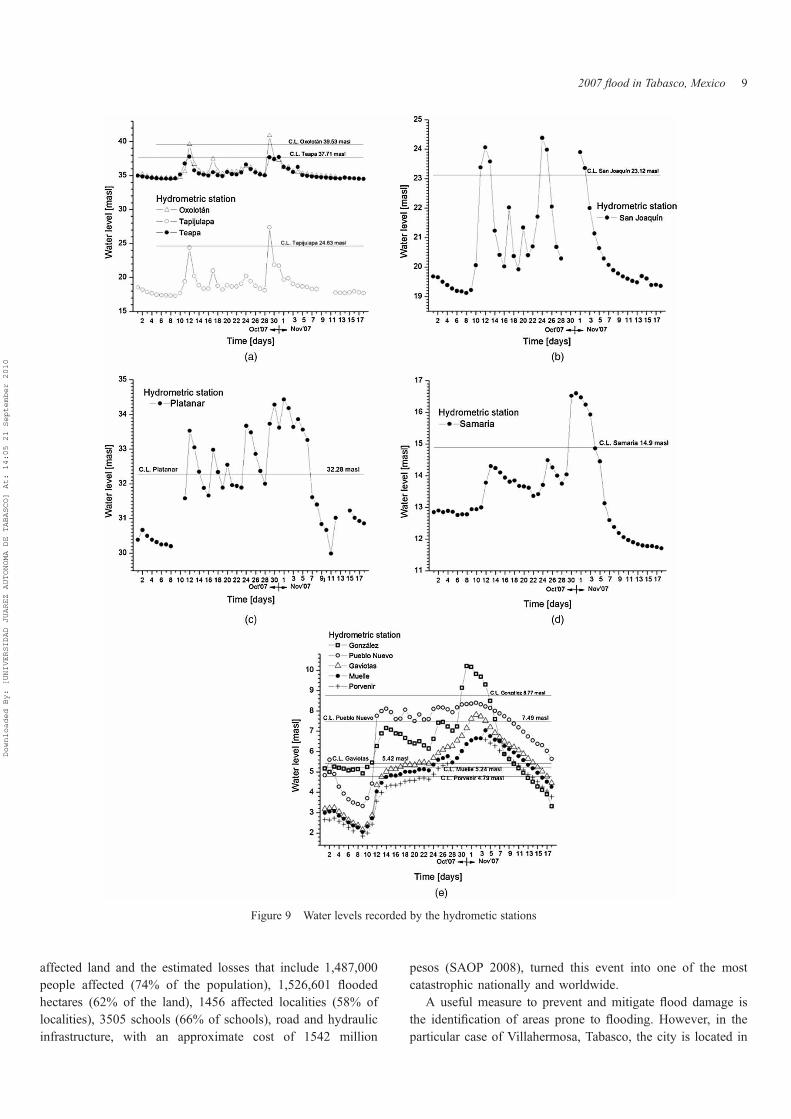
7 Hydrometric analysis
Plots were constructed with the information contained in the
hydrometric reports, and show the levels of the rivers before,
during and after the event. These levels were recorded at
the hydrometric stations that are located in the region of the
coastal plain that was directly affected by the flooding of the
city of Villahermosa. Figure 9(a) and (b) shows the rivers in
the watershed of the Sierra that are not regulated, and their over-
flowing or CL as defined by the CONAGUA: Oxolotan (CL ¼
39.53 masl), Teapa (CL ¼ 37.71 masl), Tapijulapa (CL ¼
24.63 masl) and Pichucalco (hydrometric station San Joaquın,
CL ¼ 23.12 masl). These mountain rivers meet downstream
and form what is known as the river of the Sierra. They
reached their CLs on 12 October following the intense rains
Figure 5 Effects of the dam system on flood regulation (Low Grijalva)
Table 2 Characteristics of the dam system
Dam Angostura Chicoasen Malpaso Penitas
Maximum extraordinary water level (MEWL) (masl) 539.50 395.00 188.00 93.50
Maximum ordinary water level (MOWL) (masl) 533.00 392.00 182.50 87.40
Minimum ordinary water level (MINOWL) (masl) 500.00 380.00 144.00 85.00
Top of the gate (masl) 538.60 394.00 183.50 91.13
Crest of spillway (masl) 519.60 373.00 167.60 76.50
Total capacity (106m3) 19,736.00 1443.00 14,058.00 1485.00
Conservation capacity (106m3) 15,548.00 1372.83 12,373.00 1091.00
Minimum capacity (106m3) 2379.50 1168.81 3055.73 960.99
Source: CONAGUA 2007
2007 flood in Tabasco, Mexico 5
Downloaded By: [UNIVERSIDAD JUAREZ AUTONOMA DE TABASCO] At: 14:05 21 September 2010

generated by cold front No. 2. Later, the Pichucalco river reached
and once again overpassed its CL on 24 October follwing cold
front No. 4, while the Teapa and Tapijulapa rivers remained at
lower levels during the same period. These two rivers presented
a new peak on 29 October when cold front No. 4 returned. This
also caused an increase in levels in the Pichucalco river on
1 November.
The Platanar river that runs freely (Figure 9(c)) and is a branch
of the Mezcalapa river presented several peaks that reached its
CL (CL ¼ 32.28 masl) on 12–14, 17, 20 and 24–27 October,
as well as an extraordinary increase from 29 October to
6 November. Figure 9(d) shows that the water at the station on
the Samaria river rose above its CL (CL ¼ 14.20 masl) from
30 October to 4 November. It is important to point out that the
water in this river drains practically into the sea; for this
reason, an improvement in its drainage may contribute to
decrease the risk of flooding in the Low Grijalva. The water in
the Carrizal river (hydrometric station Gonzalez) above the
city of Villahermosa rose above its CL (CL ¼ 8.77 masl) on
29 October and 5 November. The hydrometric stations located
around the city of Villahermosa include: (1) the Gaviotas
station located upriver from the city where the water rose
Figure 7 Infrared image. Increased convection potential on Chiapas and TabascoSource: Hernandez Unzon 2007
Figure 6 Dam system along the High Grijalva
6 Fabian Rivera-Trejo et al.
Downloaded By: [UNIVERSIDAD JUAREZ AUTONOMA DE TABASCO] At: 14:05 21 September 2010
above its CL (CL ¼ 5.42 masl) from 14 October to 16 Novem-
ber, (2) the Muelle station at the city broadwalk (5.24 masl)
where the water rose above its CL from 24 October to 14 Novem-
ber and (3) the Porvenir station downriver that reached its CL
(CL ¼ 4.74 masl) on 24 October and remained there until 14
November (Figure 9(e)).
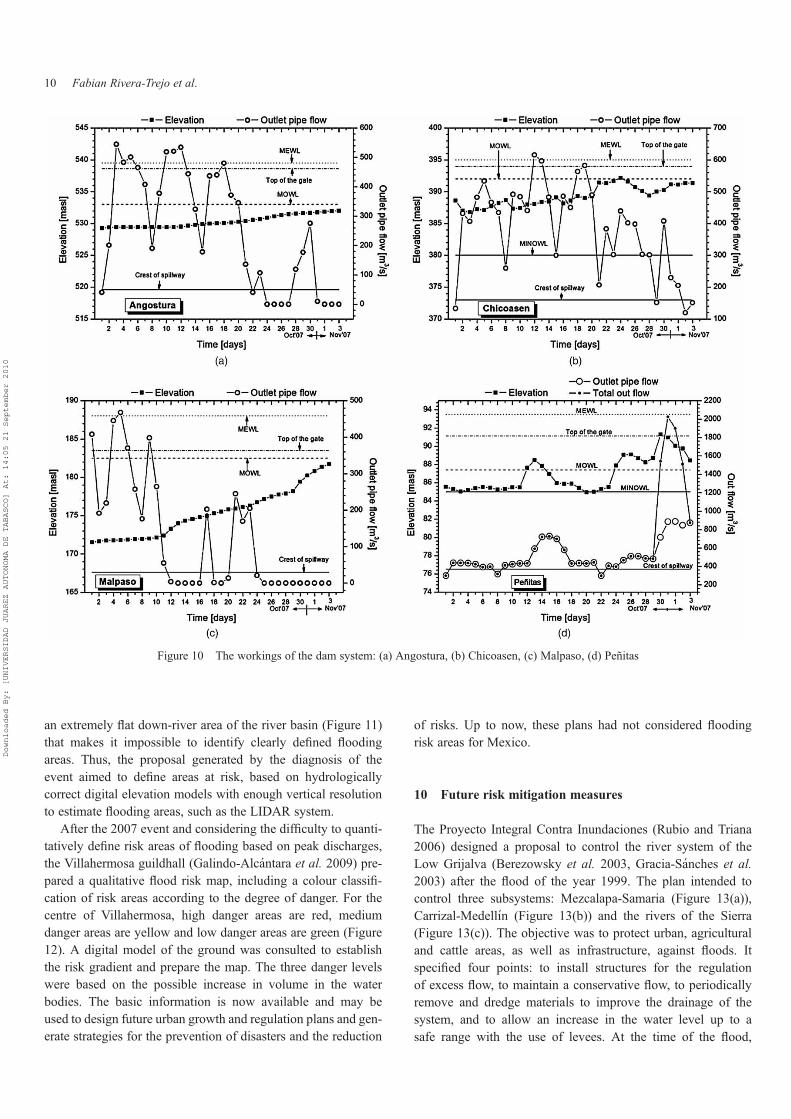
8 The workings of the dam system
Plots were constructed using the information contained in the
CONAGUA reports, to represent the operation of the dams that
constitute the hydroelectric system of the Low Grijalva. The
period considered was 1 October–3 November 2007. The
elevation of the open surface water was plotted on the left side
of the vertical axis, and its discharge was plotted on the right
side. The operation of the dam system during October was the
following (CONAGUA reports). The Angostura hydroelectric
plant, which has the greatest storage capacity of 19,736 Mm3,
maintained a turbine operated flow release from 1 to 24 October.
It then stopped the flow release operations until 27 October
when it renewed operations, although at a lower scale, after
which it again stopped operations on 31 October (Figure 10(a)).
The level of the water body during the study period remained
Table 3 Rainfall
Location Station
Rainfall (mm)
October 2007 November 2007
26 27 28 29 30 31 1 2 3
21 Santa Maria 0.0 0.0 0.0 153.0 81.8 18.7 21.4 15.4 0.8
25 C.H. Malpaso 0.0 0.0 1.3 85.3 39.8 16.0 51.4 15.5 3.6
27 Ocotepec 0.0 0.0 1.0 403.4 308.9 250.5 0.0 110.6 0.0
28 Romulo Calzada 0.0 0.0 0.0 160.4 107.2 41.4 94.9 13.9 12.4
35.5 Sayula 0.0 0.0 0.0 294.4 177.8 131.9 100.3 51.2 6.7
30 C.H. Penitas 0.2 0.0 0.3 217.6 149.5 32.5 90.2 11.5 13.6
51 Plan de Ayala 0.0 0.0 0.2 240.0 120.4 34.0 83.0 8.4 0.3
52 Platanar 0.3 0.0 1.4 192.2 107.1 26.7 105.1 12.6 0.0
54 Cardenas 0.0 0.0 0.0 176.0 120.0 20.0 86.0 0.0 0.0
55 Samaria 0.0 0.0 0.0 263.9 86.0 29.4 63.4 13.8 0.0
57 Gonzalez 0.0 0.0 0.0 105.9 197.4 57.6 53.5 27.1 0.0
68 Salto de Agua 0.0 0.0 0.0 77.9 44.5 6.2 0.3 3.7 14.6
69 Macuspana 0.0 0.0 0.0 124.7 94.0 76.0 0.0 11.5 14.2
Table 4 Accumulated rainfall
Location Station
Accumulated rainfall (mm)
October 2007 November 2007
26 27 28 29 30 31 1 2 3
21 Santa Maria 0.0 0.0 0.0 153.0 234.8 253.5 274.9 290.3 291.1
25 C.H. Malpaso 0.0 0.0 1.3 86.6 126.4 142.4 193.8 209.3 212.9
27 Ocotepec 0.0 0.0 1.0 404.4 713.3 963.8 963.8 1074.4 1074.4
28 Romulo Calzada 0.0 0.0 0.0 160.4 267.6 309.0 403.9 417.8 430.2
35.5 Sayula 0.0 0.0 0.0 294.4 472.2 604.1 704.4 755.6 762.3
30 C.H. Penitas 0.2 0.2 0.5 218.1 367.6 400.1 490.3 501.8 515.4
51 Plan de Ayala 0.0 0.0 0.2 240.2 360.6 394.6 477.6 486.0 486.3
52 Platanar 0.3 0.3 1.7 193.9 301.0 327.7 432.8 445.4 445.4
54 Cardenas 0.0 0.0 0.0 176.0 296.0 316.0 402.0 402.0 402.0
55 Samaria 0.0 0.0 0.0 263.9 349.9 379.3 442.7 456.5 456.5
57 Gonzalez 0.0 0.0 0.0 105.9 303.3 360.9 414.4 441.5 441.5
68 Salto de Agua 0.0 0.0 0.0 77.9 122.4 128.6 128.9 132.6 147.2
69 Macuspana 0.0 0.0 0.0 124.7 218.7 294.7 294.7 306.2 320.4
2007 flood in Tabasco, Mexico 7
Downloaded By: [UNIVERSIDAD JUAREZ AUTONOMA DE TABASCO] At: 14:05 21 September 2010
always below the maximum ordinary water level (MOWL ¼
533 masl). The Chicoasen hydroelectric plant, which has the
greatest installed capacity but practically no storage capacity at
1443 Mm3, operated continuously throughout the month (Figure
10(b)). It can be seen that the level of this water body is very
sensitive to flow release, mainly as a result of its size, and this
dam had no influence on the development of the event. The
Malpaso hydroelectric plant, with a capacity of 14,058 Mm3,
operated non-stop from 1 to 12 October, after which it stopped
flow release operations. It then renewed operations, although
at a reduced rate, from 16 to 18 October and from 21 to 24
October, after which, from 24 October onwards, it remained com-
pletely inactive (Figure 10(c)). This decision permitted a better
management of the Penitas Dam located downstream, which suf-
fered the flooding of its own basin only. The level of the water
body increased throughout October, although on 3 November it
was still below its MOWL (182.50 masl). Finally, the Penitas
hydroelectric plant (Figure 10(d)) operated until 11 October in
such a way that the level of the water body was very close to the
minimum operating water level (MINOWL ¼ 85 masl). On 12
October, a significant increase in water level was observed, at
88.48 masl over the MOWL. For this reason, turbine operations
increased that day to an average of 720 m3s21 and remained so
until 18 October. On 20 October, the water body returned to a
level very near the MINOWL (84.94 masl). A new increase in
water level was observed on 23 October and a maximum level
was recorded on 26 October (89.08 msnm). Turbine operations
then increased by 500 m3s21 and the water level decreased. On
28 October, the level again increased rapidly up to 91.30 masl
and flow release operations started on 29 October, both turbine
operated and with the use of chutes, with flow release values up
to 2025 m3s21. This brought the peak down to the safe level of
88.46 masl on 3 November, when the chutes stopped operating.
9 Integral description of the phenomenon
The phenomena were analysed individually in the previous
section. In this section, an integral analysis of the phenomena
is presented to help better understand the event that took place
in Tabasco in 2007.
A particularly severe phenomenon took place from 29
October to 1 November 2007, in response to the conjunction
of the following factors: periods of successive rains that
became stationary over the region throughout the month, very
intense rains particularly from 29 October to 1 November, soil
that was saturated and partly saturated by the rains of the pre-
vious days, the rivers of the Sierra were near their CLs since
12 October, an extraordinary input of water to the Penitas Dam
during the three periods of 12 to 16, 24 to 28 and 29 to 31
October, the increase in water level of the Platanar river on 12
to 14, 17, 20 and 24 to 27 October and an extraordinary increase
from 29 October to 6 November, and the operation of chutes to
let out excess water from the Penitas Dam starting on 29
October. The co-occurrence of these factors caused the centre
of the city of Villahermosa to lie under water from 29 October
to 9 November 2007.
Reconstructing the event, a strong runoff associated with
very intense rains occurred with little influence from the high
reaches of the Grijalva. The Malpaso hydroelectric plant
remained inactive from 24 October onwards, retaining water
from the higher areas. For this reason, the increase in the
water level in the Penitas hydroelectric plant was mainly due
to runoff from its own basin. Two effects acted together
between 28 October and 2 November: on the one hand
runoff originated by the rivers of the Sierra was strong, and
on the other the Penitas Dam filled very quickly and then
released its water. These factors, together with the area of
Figure 8 Rainfall periods from 1 October to 3 November 2007
8 Fabian Rivera-Trejo et al.
Downloaded By: [UNIVERSIDAD JUAREZ AUTONOMA DE TABASCO] At: 14:05 21 September 2010
affected land and the estimated losses that include 1,487,000
people affected (74% of the population), 1,526,601 flooded
hectares (62% of the land), 1456 affected localities (58% of
localities), 3505 schools (66% of schools), road and hydraulic
infrastructure, with an approximate cost of 1542 million
pesos (SAOP 2008), turned this event into one of the most
catastrophic nationally and worldwide.
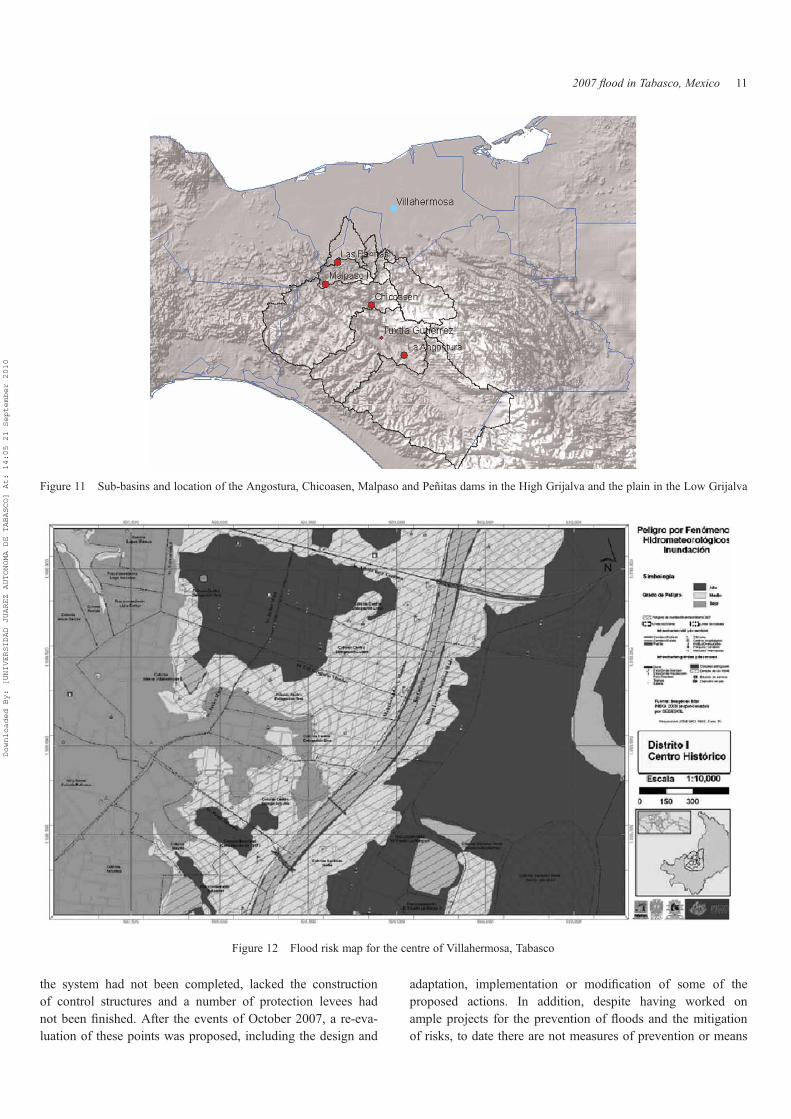
A useful measure to prevent and mitigate flood damage is
the identification of areas prone to flooding. However, in the
particular case of Villahermosa, Tabasco, the city is located in
Figure 9 Water levels recorded by the hydrometic stations
2007 flood in Tabasco, Mexico 9
Downloaded By: [UNIVERSIDAD JUAREZ AUTONOMA DE TABASCO] At: 14:05 21 September 2010
an extremely flat down-river area of the river basin (Figure 11)
that makes it impossible to identify clearly defined flooding
areas. Thus, the proposal generated by the diagnosis of the
event aimed to define areas at risk, based on hydrologically
correct digital elevation models with enough vertical resolution
to estimate flooding areas, such as the LIDAR system.
After the 2007 event and considering the difficulty to quanti-
tatively define risk areas of flooding based on peak discharges,
the Villahermosa guildhall (Galindo-Alcantara et al. 2009) pre-
pared a qualitative flood risk map, including a colour classifi-
cation of risk areas according to the degree of danger. For the
centre of Villahermosa, high danger areas are red, medium
danger areas are yellow and low danger areas are green (Figure
12). A digital model of the ground was consulted to establish
the risk gradient and prepare the map. The three danger levels
were based on the possible increase in volume in the water
bodies. The basic information is now available and may be
used to design future urban growth and regulation plans and gen-
erate strategies for the prevention of disasters and the reduction
of risks. Up to now, these plans had not considered flooding
risk areas for Mexico.
10 Future risk mitigation measures
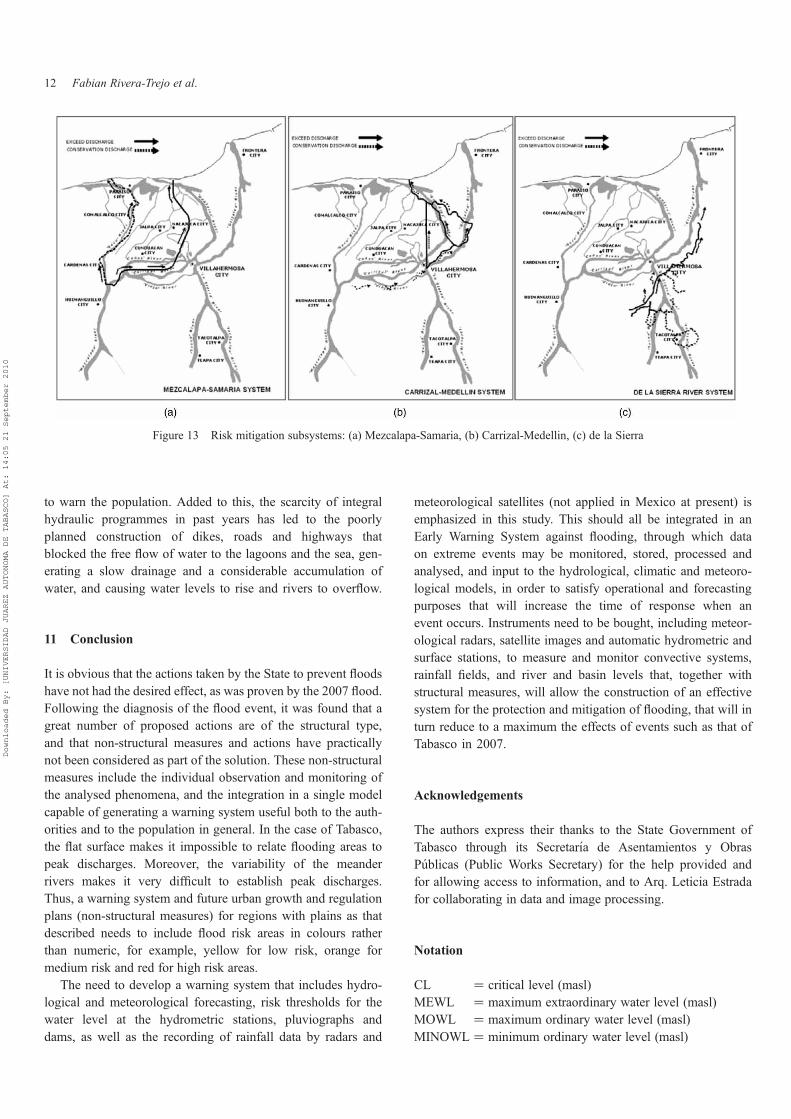
The Proyecto Integral Contra Inundaciones (Rubio and Triana
2006) designed a proposal to control the river system of the
Low Grijalva (Berezowsky et al. 2003, Gracia-Sanches et al.2003) after the flood of the year 1999. The plan intended to
control three subsystems: Mezcalapa-Samaria (Figure 13(a)),
Carrizal-Medellın (Figure 13(b)) and the rivers of the Sierra
(Figure 13(c)). The objective was to protect urban, agricultural
and cattle areas, as well as infrastructure, against floods. It
specified four points: to install structures for the regulation
of excess flow, to maintain a conservative flow, to periodically
remove and dredge materials to improve the drainage of the
system, and to allow an increase in the water level up to a
safe range with the use of levees. At the time of the flood,
Figure 10 The workings of the dam system: (a) Angostura, (b) Chicoasen, (c) Malpaso, (d) Penitas
10 Fabian Rivera-Trejo et al.
Downloaded By: [UNIVERSIDAD JUAREZ AUTONOMA DE TABASCO] At: 14:05 21 September 2010
the system had not been completed, lacked the construction
of control structures and a number of protection levees had
not been finished. After the events of October 2007, a re-eva-
luation of these points was proposed, including the design and
adaptation, implementation or modification of some of the
proposed actions. In addition, despite having worked on
ample projects for the prevention of floods and the mitigation
of risks, to date there are not measures of prevention or means
Figure 11 Sub-basins and location of the Angostura, Chicoasen, Malpaso and Penitas dams in the High Grijalva and the plain in the Low Grijalva
Figure 12 Flood risk map for the centre of Villahermosa, Tabasco
2007 flood in Tabasco, Mexico 11
Downloaded By: [UNIVERSIDAD JUAREZ AUTONOMA DE TABASCO] At: 14:05 21 September 2010
to warn the population. Added to this, the scarcity of integral
hydraulic programmes in past years has led to the poorly
planned construction of dikes, roads and highways that
blocked the free flow of water to the lagoons and the sea, gen-
erating a slow drainage and a considerable accumulation of
water, and causing water levels to rise and rivers to overflow.
11 Conclusion
It is obvious that the actions taken by the State to prevent floods
have not had the desired effect, as was proven by the 2007 flood.
Following the diagnosis of the flood event, it was found that a
great number of proposed actions are of the structural type,
and that non-structural measures and actions have practically
not been considered as part of the solution. These non-structural
measures include the individual observation and monitoring of
the analysed phenomena, and the integration in a single model
capable of generating a warning system useful both to the auth-
orities and to the population in general. In the case of Tabasco,
the flat surface makes it impossible to relate flooding areas to
peak discharges. Moreover, the variability of the meander
rivers makes it very difficult to establish peak discharges.
Thus, a warning system and future urban growth and regulation
plans (non-structural measures) for regions with plains as that
described needs to include flood risk areas in colours rather
than numeric, for example, yellow for low risk, orange for
medium risk and red for high risk areas.
The need to develop a warning system that includes hydro-
logical and meteorological forecasting, risk thresholds for the
water level at the hydrometric stations, pluviographs and
dams, as well as the recording of rainfall data by radars and
meteorological satellites (not applied in Mexico at present) is
emphasized in this study. This should all be integrated in an
Early Warning System against flooding, through which data
on extreme events may be monitored, stored, processed and
analysed, and input to the hydrological, climatic and meteoro-
logical models, in order to satisfy operational and forecasting
purposes that will increase the time of response when an
event occurs. Instruments need to be bought, including meteor-
ological radars, satellite images and automatic hydrometric and
surface stations, to measure and monitor convective systems,
rainfall fields, and river and basin levels that, together with
structural measures, will allow the construction of an effective
system for the protection and mitigation of flooding, that will in
turn reduce to a maximum the effects of events such as that of
Tabasco in 2007.
Acknowledgements
The authors express their thanks to the State Government of
Tabasco through its Secretarıa de Asentamientos y Obras
Publicas (Public Works Secretary) for the help provided and
for allowing access to information, and to Arq. Leticia Estrada
for collaborating in data and image processing.
Notation
CL ¼ critical level (masl)
MEWL ¼ maximum extraordinary water level (masl)
MOWL ¼ maximum ordinary water level (masl)
MINOWL ¼ minimum ordinary water level (masl)
Figure 13 Risk mitigation subsystems: (a) Mezcalapa-Samaria, (b) Carrizal-Medellin, (c) de la Sierra
12 Fabian Rivera-Trejo et al.
Downloaded By: [UNIVERSIDAD JUAREZ AUTONOMA DE TABASCO] At: 14:05 21 September 2010
References
Berezowsky, M., Jimenez, A., and Gracia-Sanchez, J., 2003.
Morphodynamics of the lower Grijalva river, Mexico.
Proceedings of the 3rd IAHR symposium on river, coastaland estuarine morphodynamics, 604–610.
Biloxi, M., 2008. Hurricane Katrina Mississippi recovery
update – 31 Mar 2008. Federal Emergency ManagementAgency (FEMA), Release 1604-639.
CENAPRED, 2009. Socioeconomic characteristics and impact
of major disasters in Mexico in 2007 (Spanish). Series:socio-economic impact of disasters in Mexico. Mexico,
619 pp.
CONAGUA, 2006. Average annual rainfall (Spanish) [online].
Available from: http://smn.cna.gob.mx/productos/map-lluv/
precipit.gif [Accessed 3 March 2008].
CONAGUA, 2007. Hydrometric records, October and Novem-
ber of 2007 (Spanish) [Online], National Water Commission.
Available from: http://200.23.34.73/ [Accessed 4 February
2008].
CONAGUA, 2008. Monthly normal rainfall (Spanish) [Online],
Available from: http://smn.cna.gob.mx/productos/map-lluv/
estados/est-2008.gif [Accessed 3 March 2008].
De Witt, M.J.M., et al., 2007. Floods in the Meuse basin: event
descriptions and international views on ongoing measures.
International Journal of River Basin Management, 5 (4),
279–292.
Galindo-Alcantara, A., et al., 2009. Atlas of risks of the munici-pality of Centro, 2009 (Spanish). 1st ed. Mexico: Municipal
City Hall of Centro, Tabasco and the Secretary of Social
Development, 109 pp.
Ganoulis, J., 2003. Risk-based floodplain management: a case
study from Greece. International Journal of River BasinManagement, 1 (1), 41–47.
Gracia-Sanches, J., et al., 2003. Sedimentation in a bifurcation, a
study case. Proceedings of the 3rd IAHR symposium on river,coastal and estuarine morphodynamics, 1068–1078.
Hernandez Unzon, A., 2007. Review of the intense cold
front No. 4 based on notifications issued by the NationalWeather Service (Spanish). Storm Warning No. 866, National
Weather Service – CONAGUA, 27 pp.
Marsh, T.J. and Hannaford, J., 2007. The summer 2007 floods inEngland and Wales – a hydrological appraisal. Centre for
Ecology and Hydrology, 32 pp. ISBN 978-0-9557672-4-1.
Ratto, S., Bonetto, F., and Comoglio, C., 2007. The October
2000 flooding in Valley d’Aosta (Italy): event description
and land planning measures for the risk mitigation. Inter-national Journal of River Basin Management, 1 (2), 105–116.
Rubio, H. and Triana, C., 2006. Integrated flood management.
Study case Mexico: River Grijalva (Spanish). AssociatedProgram on Flood Management, OMM/GWP, 15 pp.
SAOP, 2008. Flooding report (Spanish). Proceedings of thefactors and actors seminary of the flooding in Tabasco:lessons from a disaster prevention policy. Series compositedialogue on Environment. Colegio de Mexico, 16 pp.
Shankar, J., 2005. Over 222,000 villagers evacuated as India reelsrural floods. Agence France – Presse (AFP), 05 Aug 2005.
Velazquez, V.G., 1994. The hydraulic resources of Tabasco
(Spanish). Mexico: Juarez Autonomous University of
Tabasco, 241 pp.
Velazquez, V.G., 2001. The flooding in Tabasco (Spanish).
Tabasco, Mexico: Popular University of Chontalpa, 103 pp.
2007 flood in Tabasco, Mexico 13
Downloaded By: [UNIVERSIDAD JUAREZ AUTONOMA DE TABASCO] At: 14:05 21 September 2010


![.Noah's Flood WTJ2004[1]](https://static.fdokumen.com/doc/165x107/631c39e73e8acd997705cf6b/noahs-flood-wtj20041.jpg)