Texture classification by center-symmetric auto-correlation, using Kullback discrimination of...
11
Texture Classification by Center-symmetric Auto-correlation, using Kullback Discrimination of Distributions David Harwood 3* , Timo Ojala 1 , Matti Pietikäinen 1 , Shalom Kelman 2 , and Larry Davis 3 1 Department of Electrical Engineering University of Oulu, SF-90570 Oulu, Finland 2 Department of Opthalmology University of Maryland Medical School Baltimore, Maryland 3 Computer Vision Laboratory Center for Automation Research University of Maryland College Park, Maryland 20742 Abstract We propose a new method of texture analysis and classification based on a local center-symmet- ric covariance analysis, using Kullback (log-likelihood) discrimination of sample and prototype distri- butions. Features of our analysis are generalized, invariant, local measures of texture having center- symmetric patterns, which is characteristic of many natural and artificial textures. We introduce two local center-symmetric auto-correlations, with linear and rank-order versions (SAC and SRAC), together with a related covariance measure (SCOV) and variance ratio (SVR). All of these are rota- tion-invariant, and three are locally grey-scale invariant, robust measures. In classification experi- ments, we compare their discriminant information to that of Laws’ well-known convolutions, which have specific center-symmetric masks. We find that our new covariance measures, which can be regar- ded as generalizations of Laws’ measures, achieve fairly low classification error rates despite their abstract measure of texture pattern and grey-scale. Keywords. Texture analysis, texture classification, feature extraction, entropy optimization. Texture analysis is important in many applications of computer image analysis for classification, detection, or segmentation of images based on local spatial patterns of intensity or color. Essentially, textures are replications, symmetries, and combinations of various basic patterns or local image func- tions, usually with some random variation. There are many characteristics and local measures of such patterns which can be employed, depending on the application and textured imagery which must be discriminated. Important applications include industrial and biomedical surface inspection, for example of defects or disease, and ground classification and segmentation of satellite or aerial ima- gery. See Van Gool et al. (1985), Rao (1990) and Haralick and Shapiro (1992) for recent surveys of texture analysis. In his well-known studies Laws proposed a texture analysis using convolutions, a kind of corre- lation, with various feature masks representing local patterns (Laws, 1979; Laws, 1980). He empiri- cally determined that several of these, of appropriate sizes, were very informative for discriminating many kinds of textures. Originally, Laws classified samples based on expected values of variance-like square measures of these convolutions, called “texture energy measures”, and achieved fairly low ave- rage error rates. Pietikäinen et al. (1983) found that this performance mainly depended on the general forms of the masks rather than on their specific values. Subsequently, Harwood et al. (1985) confirmed this, fin-
Transcript of Texture classification by center-symmetric auto-correlation, using Kullback discrimination of...
Texture Classification by Center-symmetric Auto-correlation,using Kullback Discrimination of Distributions
David Harwood3*, Timo Ojala1, Matti Pietikäinen1,Shalom Kelman2, and Larry Davis3
1Department of Electrical EngineeringUniversity of Oulu, SF-90570 Oulu, Finland
2Department of OpthalmologyUniversity of Maryland Medical School
Baltimore, Maryland
3Computer Vision LaboratoryCenter for Automation Research
University of MarylandCollege Park, Maryland 20742
AbstractWe propose a new method of texture analysis and classification based on a local center-symmet-
ric covariance analysis, using Kullback (log-likelihood) discrimination of sample and prototype distri-butions. Features of our analysis are generalized, invariant, local measures of texture having center-symmetric patterns, which is characteristic of many natural and artificial textures. We introduce twolocal center-symmetric auto-correlations, with linear and rank-order versions (SAC and SRAC),together with a related covariance measure (SCOV) and variance ratio (SVR). All of these are rota-tion-invariant, and three are locally grey-scale invariant, robust measures. In classification experi-ments, we compare their discriminant information to that of Laws’ well-known convolutions, whichhave specific center-symmetric masks. We find that our new covariance measures, which can be regar-ded as generalizations of Laws’ measures, achieve fairly low classification error rates despite theirabstract measure of texture pattern and grey-scale.
Keywords. Texture analysis, texture classification, feature extraction, entropy optimization.
������������ ������������
Texture analysis is important in many applications of computer image analysis for classification,detection, or segmentation of images based on local spatial patterns of intensity or color. Essentially,textures are replications, symmetries, and combinations of various basic patterns or local image func-tions, usually with some random variation. There are many characteristics and local measures of suchpatterns which can be employed, depending on the application and textured imagery which must bediscriminated. Important applications include industrial and biomedical surface inspection, forexample of defects or disease, and ground classification and segmentation of satellite or aerial ima-gery. See Van Gool et al. (1985), Rao (1990) and Haralick and Shapiro (1992) for recent surveys oftexture analysis.
In his well-known studies Laws proposed a texture analysis using convolutions, a kind of corre-lation, with various feature masks representing local patterns (Laws, 1979; Laws, 1980). He empiri-cally determined that several of these, of appropriate sizes, were very informative for discriminatingmany kinds of textures. Originally, Laws classified samples based on expected values of variance-likesquare measures of these convolutions, called “texture energy measures”, and achieved fairly low ave-rage error rates.
Pietikäinen et al. (1983) found that this performance mainly depended on the general forms ofthe masks rather than on their specific values. Subsequently, Harwood et al. (1985) confirmed this, fin-

ding that local rank-order correlations of images with Laws’ masks could perform better than thebasic convolutions, for suitable image and mask sizes. These more robust measures of correlation areless sensitive to local random pattern and grey-scale variabilities which are everywhere apparent inlarge textured images. Other approaches related to Laws’ measures have been considered, forexample, by Ade (1983), Unser (1986), Benke et al. (1988), and Cohen and You (1992). These kindsof texture measures have performed well in comparative studies carried out by, among others, Du Bufet al. (1990) and Ng et al. (1992). Laws’ or related approaches have been successfully used, forexample, in the application studies of Ade et al. (1984), Dewaele et al. (1988), Neubauer (1992) andKjell (1992).
Here, we can observe some properties of Laws’ masks which reflect local patterns of realistictextures. First of all, they are derived from convolving pairs of basis vectors representing levels, spots,and edges. Some of the two dimensional masks numerically represent first and second directionalderivative operators; geometrically, some represent extended edge or ridge or saddle patterns.
But what is more important is that Laws’ masks are zero sum, with center-symmetric patterns ofeither the same or opposite values. The abstract forms are purely center-symmetric or -antisymmetric.
Laws’ and other related studies of texture analysis would suggest what is apparent anyway; thatmany natural and artificial textures are measurably “loaded” with distributions of various specificlocal patterns of texture having these abstract symmetrical forms. Moreover, to measure the local“loading” of grey-value symmetric (positive) or antisymmetric (negative) texture, we have only tocompute local auto-covariances or auto-correlations of center-symmetric pixel values of suitably sizedneighborhoods (usually 3x3 as before). This symmetric texture analysis obviates convolution or corre-lation with feature masks.
In this paper, we propose a new method of texture analysis based on abstract, local auto-cova-riance measures of texture, and of simple but powerful nearest-neighbor texture classification usingKullback’s log-likelihood discrimination of sample and prototype distributions of these measures(Kullback, 1968). Our method can be regarded as a generalization of Laws’ approach. For this reasonwe compare our results to those obtained with Laws’ measures. Performance evaluation of differenttypes of texture measures is carried out in Ojala et al. (1994).
��������������������������� �!���� #"$�����%������
&('*),+.-0/21436587(9:58;=<>7?7A@=7A<>B:C�DE7(-:14;F<>7(1
Laws’ properties, which he called “texture energy measures”, are derived from three simple vec-tors of length 3, L3≡ (1,2,1), E3≡ (-1,0,1), and S3≡ (-1,2,-1), which represent the one-dimensionaloperations of center-weighted local averaging, symmetric first differencing (edge detection), andsecond differencing (spot detection) (Laws, 1980; Pietikäinen et al., 1983). If we convolve these vec-tors with themselves or each other we obtain five vectors of length 5:
L5 ≡ (1,4,6,4,1) = L3 * L3S5≡ (-1,0,2,0,-1) = - E3 * E3 = L3 * S3R5≡ (1,-4,6,-4,1) = S3 * S3E5≡ (-1,-2,0,2,1) = L3 * E3W5 ≡ (-1,2,0,-2,1) = - E3 * S3
where L5 is again a local average, S5 and E5 are, respectively, spot and edge detectors, and R5and W5 can be regarded as “ripple” and “wave” detectors. Sets of larger vectors can be defined byrepeating this convolution process.
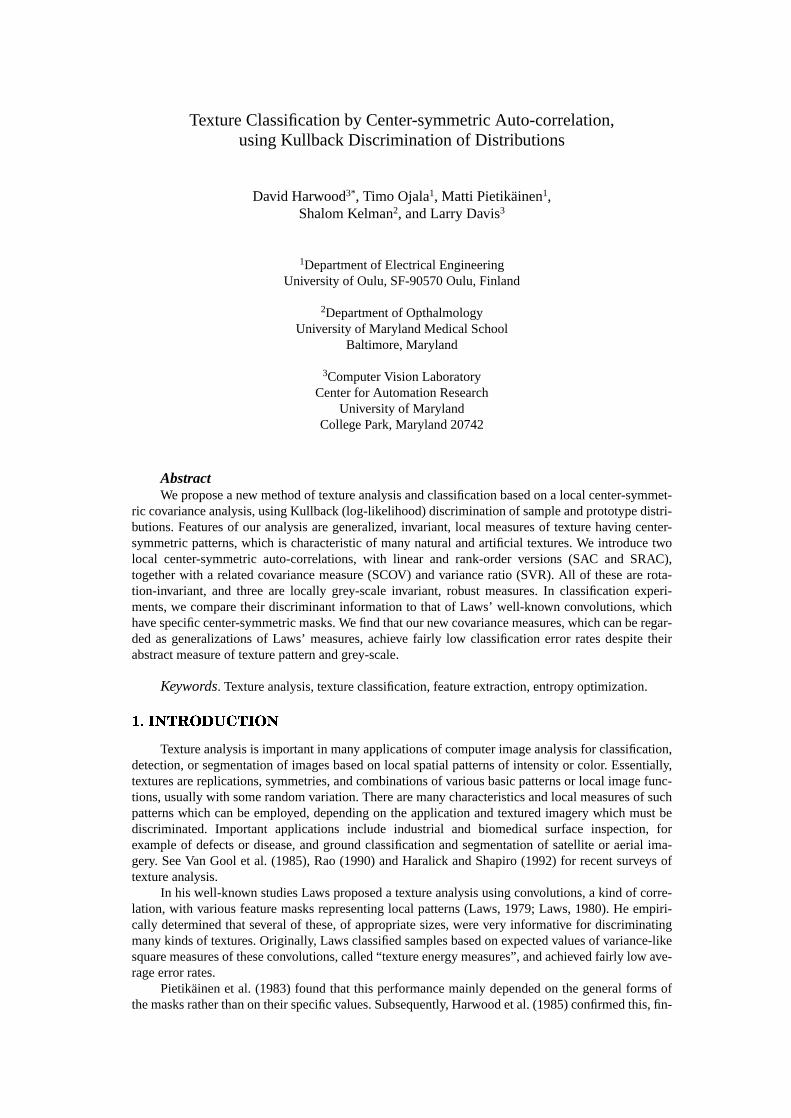
If we now multiply the column vectors of length 3 or 5 by row vectors of the same length, weobtain Laws’ 3x3 or 5x5 masks. The eight zero-sum 3x3 masks used in this study are shown in Fig. 1.
To use these masks to describe the texture in a (sub)image, we convolve them with the image anduse statistics of the results as textural properties. Laws concluded that the most useful statistics are thesums of the squared or absolute values of the image after these masks are convolved with it. The sumof squares justifies the terminology “texture energy measures,” but the sum of absolute values is prefe-rable because it is computationally cheaper. In our study, however, we used the whole distribution ofmask responses for describing textural properties.
L3E3 L3S3 E3E3 E3L3
E3S3 S3S3 S3L3 S3E3
Fig. 1. Eight 3x3 Laws’ masks used in this study.
&('G&?H,7(@F587(<>IJ14C:D!DE7(58<>KML�LON:P:-:<>KM-:@=LO7?DE7A-:14;=<>7A1
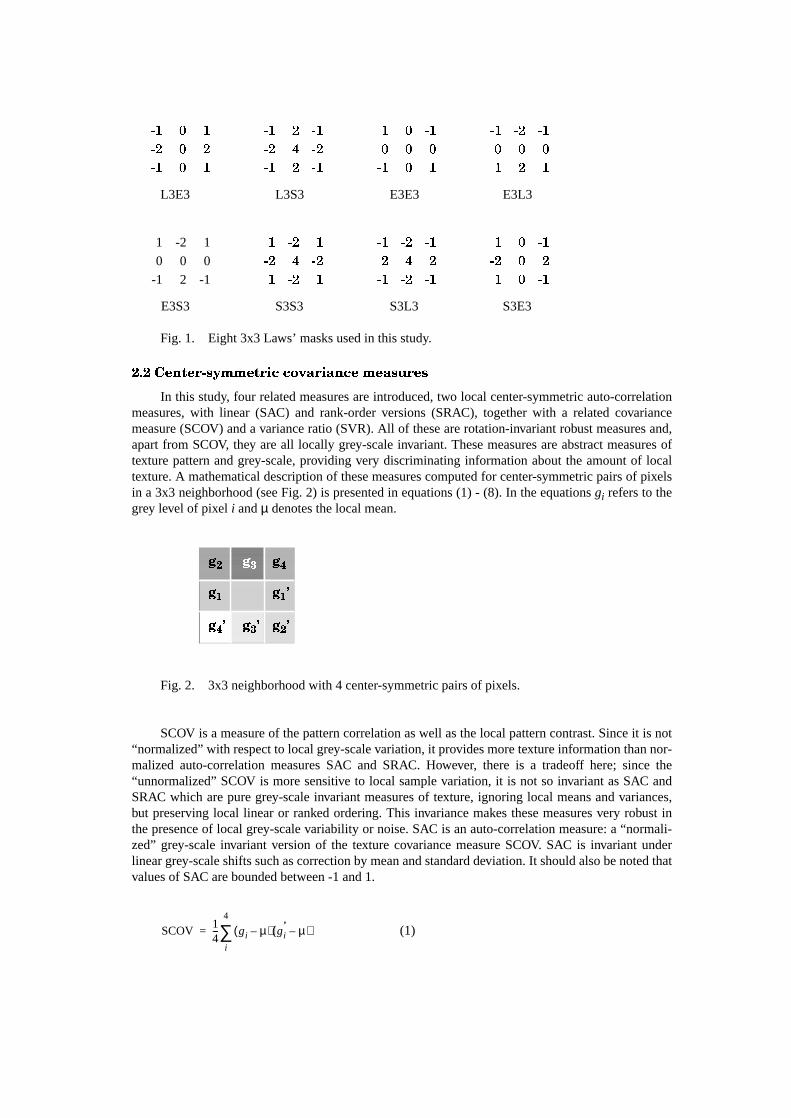
In this study, four related measures are introduced, two local center-symmetric auto-correlationmeasures, with linear (SAC) and rank-order versions (SRAC), together with a related covariancemeasure (SCOV) and a variance ratio (SVR). All of these are rotation-invariant robust measures and,apart from SCOV, they are all locally grey-scale invariant. These measures are abstract measures oftexture pattern and grey-scale, providing very discriminating information about the amount of localtexture. A mathematical description of these measures computed for center-symmetric pairs of pixelsin a 3x3 neighborhood (see Fig. 2) is presented in equations (1) - (8). In the equationsgi refers to thegrey level of pixel i andµ denotes the local mean.
Fig. 2. 3x3 neighborhood with 4 center-symmetric pairs of pixels.
SCOV is a measure of the pattern correlation as well as the local pattern contrast. Since it is not“normalized” with respect to local grey-scale variation, it provides more texture information than nor-malized auto-correlation measures SAC and SRAC. However, there is a tradeoff here; since the“unnormalized” SCOV is more sensitive to local sample variation, it is not so invariant as SAC andSRAC which are pure grey-scale invariant measures of texture, ignoring local means and variances,but preserving local linear or ranked ordering. This invariance makes these measures very robust inthe presence of local grey-scale variability or noise. SAC is an auto-correlation measure: a “normali-zed” grey-scale invariant version of the texture covariance measure SCOV. SAC is invariant underlinear grey-scale shifts such as correction by mean and standard deviation. It should also be noted thatvalues of SAC are bounded between -1 and 1.
QSR T R QSR UVQSR R TVQSR QSRWQJUVQSRQJU T U QJU XVQJU T T T T T TQSR T R QSR UVQSR QSR T R R U R
1 -2 1 RWQJU R QSRWQJUVQSR R TVQSR0 0 0 QJU XVQJU U X U QJU T U
-1 2 -1 RWQJU R QSRWQJUVQSR R TVQSR
B Y B Z B [
B \ B \ 3
B Y 3B Z 3B [ 3
SCOV14--- gi µ–( ) gi
’ µ–( )i
4
∑= (1)

Texture statistics based directly on grey values of an image are sensitive to noise and monotonicshifts in the grey scale. Therefore, order statistics might be better suited for texture analysis than sta-tistics derived directly from grey values. With SRAC, the local rank order of the grey values is usedinstead of the grey values themselves. Hence, SRAC is invariant under any monotonic transformationincluding correction by mean and standard deviation and histogram equalization. The amount of auto-correlation in the ranked neighborhood is given by Spearman’s rank correlation (Udny Yule and Ken-dall, 1968). It is defined for the nxn neighborhood with 4 center-symmetric pairs of pixels as (3)wherem is n2 and eachti is the number of ties at rankr i. l defines the number of different ranks andr irefers to the rank of the grey level of pixel i in the ranked 3x3 neighborhood of Fig. 2. The values ofSRAC are bounded between -1 and 1.
The symmetric variance ratio (ratio between the within-pair and between-pair variances), SVR,is a statistic equivalent to the auto-correlation measure SAC. SVR is also invariant under linear grey-scale shifts.
Additionally, the discrimination information provided by three local variance measures was eva-luated. VAR (= BVAR + WVAR) and the two elements contributing to it are all measures of localgrey-scale variation, very sensitive to noise and other local grey-scale transformations. The between-pair variance, BVAR, is mostly a measure of residual texture variance and usually it is a very smallpart of VAR. The majority of local variance is generally due to the within-pair variance WVAR.
]�������������%�_^`������a�bEc?��d�?e���f�g��h�����,������#� �%����aji���ee�c�����ik ��(�%�l^��m"$�������������
In our study, the classification of a sample was based on comparing sample distribution of fea-ture values to several pre-defined model distributions of feature values with known true class labels.The sample was assigned the label of the model that optimized Kullback’s minimum cross-entropyprinciple (9) (Kullback, 1968). Heres andm are the sample and model distributions, n is the numberof bins andsi, mi are the respective sample and model probabilities at bin i. This (pseudo-) metric
SAC SCOVVAR
----------------= (2)
SRAC 1
12 r i r i‘
–( )2
i
4
∑ Tx+î
m3
m–------------------------------------------------------–= (3)
Tx112------ t i
3t i–( )
i
l
∑= (4)
SVR WVARBVAR------------------= (5)
VAR18--- g
2i gi
‘ 2+( )
i
4
∑ µ2–= (6)
BVAR116------ gi gi
‘+( )
2
i
4
∑ µ2–= (7)
WVAR116------ gi gi
‘–( )
2
i
4
∑= (8)

measures likelihoods that samples are from alternative texture classes, based on exact probabilities offeature values of pre-classified texture prototypes.
The model distribution for each class was obtained by scanning the grey-scale corrected600x450 texture image with the local 3x3 texture operator. The distributions of local statistics weredivided into histograms having a fixed number of bins; hence, the Kullback’s cross-entropy measurehad the same number of degrees-of-freedom for every pairing of a sample and a model. The numberof bins used in quantization of the feature space plays a crucial role. Histograms with too modestnumber of bins fail in providing enough discriminative information about the distributions. However,since the distributions have a finite amount of entries, it does not make sense to go to the other ext-reme. If histograms have too many bins and the average number of entries per bin is very small, histo-grams become sparse and unstable. As a rule of thumb, the average number of entries per bin shouldbe at least 10. In our experiments histograms with 32 bins appeared to be a good choice, providingsufficient resolution for capturing the essential discriminative information and yet producing reliablehistograms. 32 bins corresponded to average number of 8372, 120 and 28 entries per bin for models(600x450 in size) and test samples (64x64 and 32x32 in size), respectively.
Another interesting issue regarding the quantization of distributions is how to divide the conti-nuous feature space into discrete intervals. The simplest approach is to find the range of feature valuesand divide it into intervals of equal length. However, the problem here is that the quantization resolu-tion can be totally misslocated outside the “interesting” area of the feature axis where majority of theentries is situated, due to one extreme value stretching the range. A straight-forward way to neutralizethe effect of these outlier values is to assume a small portion, say 0.1 %, of entries being outliers at theboth ends of the range, and ignore them while computing the range. Finally, the outlier values areaccumulated to the first or last bin of the histogram, respectively. Another approach for reliable quan-tization would be to cover the range with large initial number of discrete intervals (bins) and then“compress” the histograms by adding consecutive bins with modest number of entries together untilthe number of total entries accumulated exceeds a pre-defined threshold, starting from the other end ofthe range.
However, in this study we preferred to use a more robust way to quantize the feature space. Fea-ture distributions for every single model image were added together in a total distribution which wasdivided into 32 bins having equal number of entries. Hence the cut values of the bins of the histogramscorresponded to 3.125 (100 / 32) percentile of the combined data. Deriving the cut values from thetotal distribution and allocating every bin the same amount of the combined data guarantees that thehighest resolution of quantization is used where the number of entries is largest and vice versa.
n�������������"$�����o�
In the experiments, 15 classes of fine-grained textures - pressed cork (D4), grass lawn (D9), her-ringbone weave (D16), woolen cloth (D19), french canvas (D21), calf leather (D24), beach sand(D29), pressed cork (D32), straw cloth (D53), handmade paper (D57), wood grain (D68), cotton can-vas (D77), raffia (D84), pigskin (D92) and calf fur (D93) - shown in Fig. 3 were taken from Brodatz’salbum (1966). The texture images were corrected by Gaussian match (Carstensen, 1993) in order tominimize discrimination by overall gray-level variation which is unrelated to local image texture.
The test samples were obtained by randomly subsampling the original texture images. 1000subsamples of 64x64 or 32x32 pixels in size were extracted from every texture class, resulting in aclassification of 15000 random samples in total. When classifying a particular sample, the sampledistribution was subtracted from the model distribution of the true class of this sample so that an unbi-ased error estimate was obtained.
Fig. 4 (a) demonstrates the nature of SAC. The comparison of sample and model distributions isvisualized in Fig.4 (b) for two texture classes, grass lawn and raffia. The solid lines define the modeldistributions and the dashed lines correspond to distributions of a 64x64 pixel sample. The slightlyragged appearance of sample curves is due to smaller number of sample entries (3844) compared tomodels (267904 entries). Although the sample distribution has been subtracted from the model distri-bution of the true class of the sample, the model and sample distributions are definitely very similar inboth cases. This shows the discriminative power of SAC.
D s:m( ) si
si
mi-----log
i 1=
n
∑= (9)


Fig. 3. Brodatz textures.
Fig. 4. (a) Two neighborhoods with antisymmetric and symmetric pattern, i.e. neighborhoodsare loaded with a negative and a positive covariance, respectively. (b) Visualization of sample andmodel distributions for two texture classes, grass lawn and raffia.
D4 D9 D16 D19 D21
D24 D29 D32 D53 D57
D68 D77 D84 D92 D93
grass & raffia
models
samples
P x 10-3
SAC0.00
10.00
20.00
30.00
40.00
50.00
60.00
-1.00 0.00 1.00
p q r
s t u v v
t u w x u
y t z {
SAC = + 0.66
SAC = - 0.67
| } ~ | � ~

��������g��eF�o�
Table 1 shows the classification error rates for 64x64 and 32x32 samples from 15 600x450 ima-ges representing 15 texture classes. To obtain more reliable estimates which avoid aliasing effects offixed partitioning, we extract 1000 uniformly random but overlapping subsamples from each image,for a total of 9000 trials.
It should be noted that our texture images are corrected by Gaussian match, in order to minimizediscrimination by overall grey-level variation which is unrelated to local image texture. Moreover, ourmeasures SAC and SVR are invariant under linear (affine) grey-scale shifts, such as correction bymean and standard deviation, while our rank-order measure SRAC is invariant under any monotonictransformations, including histogram equalization. This property makes them more robust, less sensi-tive to local grey-scale variability or noise.
Table 1Classification error rates (in %) for 64x64 and 32x32 samples
of 15 texture classes. 1000 random subsamples per class.
Covariance measures Laws texture measures
Better error rates are obtained for the larger 64x64 samples, with the new symmetric linear andrank-order auto-correlations, SAC and SRAC, achieving error rates of about 15 percent. The symmet-ric variance ratio (SVR) achieves a comparable rate, as expected, since it is a statistic equivalent to theSAC auto-correlation. The symmetric covariance measure SCOV, which is not normalized by localvariance, achieves a somewhat larger error rate of about 27.6 percent.
For the same size 64x64 samples, the range of classification error rates for all eight Laws’ featu-res is between 25.3 and 37.4 percent, with an average of about 31.9 percent. None of the Laws’ masksachieves an error rate comparable to that of the new invariant, generalized measures of texture, thesymmetric auto-correlations, SRAC and SAC.
For smaller 32x32 samples, the rank-order auto-correlation SRAC gives misclassification rate ofroughly 30 percent, while the rates of SAC and equivalent SVR statistics are about 32.7 percent. Forthese samples, the range of error rates for the eight Laws’ convolutions is between 32.2 and 49.1 per-cent, with an average of 41.0 percent. Only S3L3, which measures in effect a second y-directionalderivative, performs comparably to the best covariance measures, SRAC, SAC and SVR.
We also investigated how the true classes ranked in the cases of classification errors for 64x64samples. For classification errors made by SRAC and SAC, 99 and 95 percents of true classes rankedin the top 4 choices out of 15 classes, respectively. For those by the best Laws’ feature S3L3, 93 per-cent ranked in the top 6 choices. This emphasizes the discriminant information of these features andthe power of our classifier. But it also points to the utility of progressive classification using additionaldiscriminating features.
Additionally, we verified how the quantization of the feature space affects the discriminativepower of feature histograms. 1000 random samples, 64x64 pixels in size, were classified with featureSAC, using different number of bins in the quantization procedure. For number of bins of 8, 16, 32,64, 128 and 256 we obtained misclassification rates of 16.09, 15.06, 15.05, 15.27, 15.75 and 17.09
� � } � � � � � X � � X � U � � U � � } � � � � � X � � X � U � � U� � � � R X � R � � T � R � � � � � � � � � R X � � T �� � � R � � T � � U � � � � � � � U � � � � � � � U R� � � � U � � � � � � � � � � � � � � � � � U X U � � �
� � � � � � � � U X � � T R� � � R � � T � � U � � T � � � � � T � X � � � � � �
� � � � U � � � � � � � � R� � � X T � � � X � � � � � � � � U � � U � � U � U T� � � � � � � T � X � � � R � � � � � � � X � X X � R �� � � � � U � U � � � � � R � � � � } � � � R � � � X T � � �

percent, respectively. The slightly larger error rate of 16.09 percent for only 8 bins implies that thequantization is too coarse, producing histograms which lack discriminative information. On the otherhand, histograms with 256 bins are obviously becoming too sparse, which results in a somewhathigher error rate of 17.09 percent. However, the wide “safety region” between the extreme choicesexhibits very stable performance, underlining the versatility and reliability of the quantization algo-rithm.
Finally, we did experiments with 24 different Laws’ 5x5 masks in order to see if the size of themask has much influence on the results. The best performing mask S5S5 achieved error rates of25.9% and 39.2% for 64x64 and 32x32 samples, respectively.
����h��������������g������?b����� #������e���?�����m��� �
The covariance and auto-correlation measures introduced here, SCOV, SAC, and SRAC, can begeneralized and combined with complementary features in various important ways. And there aremany industrial and biomedical applications for detection and classification of surface defects emplo-ying our general method of Kullback discrimination of sample and model distributions of feature vec-tors.
�('*)4'O��7A@=7A<>-:��KM �-:5¡KMN:@F1¢£N0<�14KM �7?-:@F¤¥LON:��N:<
Two obviously important generalizations are for neighborhood sizes and color or multiple-bandimages. We can straightforwardly compute center-symmetric covariances for suitably symmetricaldigital neighborhoods of any size, such as disks or boxes of odd or even sizes.
Also, we can compute linear measures, with or without normalization, similar to SAC or SCOV,for multi-band images by a weighted vector inner-product formula (10).
�('G&A'OH,N:DE¦§��7ADE7(@F5¡-:<>C�587(9:58;=<>7?-:@F-:��C:147A1
Our two auto-correlation measures, SAC and SRAC, are essentially pure grey-scale invariantmeasures of texture, ignoring local means and variances, but preserving local linear or rank ordering.SCOV is the product of SAC and local variance. This invariance makes these measures very robust inthe presence of local variability or noise.
Because our measures are abstract, measuring covariances of any local center-symmetric pat-terns, they provide robust, but very discriminating information about the amount of local texture, butvery little information about exact local spatial patterns. This immediately suggests that we shouldconsider texture analysis of pure spatial patterns, which would complement our present analysis. Wewill consider this in a separate paper using Local Binary Patterns obtained by locally thresholding tex-tures and their combinations with pure local grey-scale measures (Ojala et al., 1994). Local BinaryPatterns are, in fact, a two-level version of the texture spectrum method of Wang and He (1990).
6.3. Classification based on Kullback DiscriminationWe employ nearest-neighbor classification based on Kullback discrimination of sample and
model distribution of feature values (or vectors). This (pseudo-) metric measures likelihoods thatsamples are from alternative texture classes, based on exact probabilities of feature values (or vectors)of texture models. In many ordinary applications, involving massive data acquisition and computerimage analysis, these distributions can be reliably estimated by very large feature model histograms ofpre-classified texture prototype samples.
There are three practical issues here. First, even with massive data acquisition, we can onlyexpect to reliably estimate joint distributions for perhaps four or five non-independent features offairly small dimension. We might expect that the total size of model histograms might be 220 bins atmost.
First of all, this means that we must find the most discriminating feature combinations. It shouldbe noted that Kullback discrimination can be employed to directly evaluate the information of various
SCOV* αb gpb µb–( ) gpb
‘ µb–( )p
pai r s
∑b
bands
∑=| R T ~

candidate feature combinations in discriminating textures. In this preliminary evaluation we do notneed to experimentally determine classification error rates by subsampling or independent samples.Rather, first we can find feature combinations which separate pre-classified texture prototype samplesas far as possible.
Instead of maximizing the overall Kullback statistic of discrimination among all texture proto-type samples, we might do well to maximize the minimum distance between any pair of textures. Still,for practical applications, we eventually need to consider estimating classification error rates of samp-les of various sizes, allowing for prior probabilities of classes and costs of errors.
We also note that we employ nearest-neighbor classification, representing each texture class byonly one texture prototype distribution. But in more complex classification problems involving lesshomogenous classes, we should expect to use multiple prototypes of each class. We may employ Kull-back discrimination to determine an optimal set of prototypes for each class, e.g. for use in NN classi-fication.
Finally, we note that not all textures will be discriminated equally well, especially by a small setof features, however informative. Also, as we reported, when there are classification errors, very oftenthe true class ranks second or third. Since our method of classification uses only a few combined fea-tures, we should expect to carry out classification in stages, selecting features which best discriminateamong remaining alternatives.
�('G¨A'O©%7(9:58;=<>7?¤§7A5¡7ALª58KMN:@
We can also employ Kullback discrimination for texture detection, such as local detection ofspecific or general defect classes, by using a suitable Bayesian model. We may compare local samplesto prototypes, or we may estimate likelihood of alternatives. For example, we may estimate the log-likelihood of a defect locally or even at every point, based on normal and one or more defect prototy-pes. In the latter case, we obtain a log-likelihood image, for which we obtain the linear Kullbackmeasure of local defect by simply local integration (sum). This approach has many potential applica-tions because of its simple visualization as an image with obvious defective “hot spots” which may besimply thresholded.
«����?�����?e� �%�����
This paper proposes a new method of texture analysis and classification based on a local center-symmetric covariance analysis, with very simple nearest-neighbor classification using Kullback disc-rimination of sample and prototype distributions of local covariance measures. With this we introducefour related measures: two local center-symmetric auto-correlations (SAC and SRAC), a covariancemeasure (SCOV), and a variance ratio (SVR).
In classification experiments, the present generalized method compares favorably to the relatedmethod of Laws which is based on convolutions with various feature masks. In a difficult classifica-tion problem of 15 fine-grained textures, reasonable classification error rates are obtained by eachsingle measure, about 15 percent by each of the three locally grey-scale invariant measures, SRAC,SAC, and SVR, for 64x64 samples. All these are interesting, robust and discriminating abstractmeasures of texture, which should find many applications.
���h�������������
Ade, F. (1983). Characterization of textures by “eigenfilter”.Signal Processing, Vol. 5, pp. 451-457.
Ade, F., N. Lins and M. Unser (1984). Comparison of various filter sets for defect detection intextiles.Proc. 7th International Conference on Pattern Recognition, Montreal, Canada, pp. 428-431.
Benke, K.K., D.R. Skinner and C.J. Woodruff (1988). Convolution operators as a basis forobjective correlates for texture perception.IEEE Transactions on Systems, Man, and Cybernetics, Vol.SMC-18, pp. 158-163.
Brodatz, P. (1966).Textures: A Photographic Album for Artists and Designers. Dover Publica-tions, New York.
Carstensen, J.M. (1993). Cooccurrence feature performance in texture classification.Proc. 8thScandinavian Conference on Image Analysis, Vol. II, Tromsö, Norway, pp. 831-838.
Cohen, H.A. and J. You (1992). A multi-scale texture classifier based on multi-resolution ‘tuned’

mask. Pattern Recognition Letters 13, pp. 599-604.Dewaele, P., L. Van Gool, P. Wambacq and A. Oosterlinck (1988). Texture inspection with self-
adaptive convolution filters.Proc. 9th International Conference on Pattern Recognition, Vol. I, Rome,Italy, pp. 56-60.
Du Buf, J. M.H., M. Kardan and M. Spann (1990). Texture feature performance for image seg-mentation.Pattern Recognition, Vol. 23, No. 3/4, pp. 291-309.
Haralick, R.M. and L. Shapiro (1992).Computer and Robot Vision,Vol. 1, Addison-Wesley.Harwood, D., M. Subbarao and L.S. Davis (1985). Texture classification by local rank correla-
tion. Computer Vision, Graphics, and Image Processing, Vol. 32, pp. 404-411.Kjell, B. (1992). Determining composition of grain mixtures using texture energy operators.
SPIE Vol. 1825 Intelligent Robots and Computer Vision XI, pp. 395-400.Kullback, S. (1968).Information Theory and Statistics, Dover, New York.Laws, K. I. (1979). Texture energy measures.Proc. Image Understanding Workshop, pp. 47-51.Laws, K. I. (1980). Textured image segmentation. Report 940, Image Processing Institute, Univ.
of Southern California.Neubauer, C. (1992). Segmentation of defects in textile fabric.Proc. 11th International Confe-
rence on Pattern Recognition, Vol. I, The Hague, The Netherlands, pp. 688-691.Ng, I., T. Tan and J. Kittler (1992). On local linear transform and Gabor filter representation of
texture.Proc. 11th International Conference on Pattern Recognition, Vol. III, The Hague, The Nether-lands, pp. 627-631.
Ojala, T., M. Pietikäinen and D. Harwood (1994). Performace evaluation of texture measureswith classification based on Kullback discrimination of distributions.Proc. 12th International Confe-rence on Pattern Recognition, Jerusalem, Israel, to be published.
Pietikäinen, M., A. Rosenfeld and L.S. Davis (1983). Experiments with texture classificationusing averages of local pattern matches.IEEE Transactions on Systems, Man, and Cybernetics, Vol.SMC-13, No. 3, pp. 421-426.
Rao, A. (1990).A Taxonomy for Texture Description and Identification. Springer-Verlag.Udny Yule, G. and Kendall, M. G.,An Introduction to the Theory of Statistics, Hafner Publishing
Co. New York, 1968.Unser, M. (1986). Local linear transforms for texture measurements.Signal Processing, Vol. 11,
pp. 61-79.Van Gool, L., P. Dewaele and A. Oosterlinck (1985). Texture Analysis Anno 1983.Computer
Vision, Graphics and Image Processing, Vol. 29, No. 3, pp. 336-357.Wang, L. and D.C. He (1990). Texture classification using texture spectrum.Pattern Recogni-
tion, Vol. 23, No. 8, pp. 905-910.