Tests and limit analysis of loop connections between precast concrete elements loaded in tension
12
Tests and limit analysis of loop connections between precast concrete elements loaded in tension Henrik B. Joergensen 1 , Linh C. Hoang ⇑ Institute of Technology and Innovation, University of Southern Denmark, Campusvej 55, 5230 Odense, Denmark article info Article history: Received 5 June 2012 Revised 28 February 2013 Accepted 5 March 2013 Available online 17 April 2013 Keywords: Loop connections In situ concrete joints U-bars Composite bridges Precast deck elements Tensile strength abstract This paper deals with loop connections loaded in tension. Such connections; also known as U-bar joints, are frequently used in practice to establish continuity between precast deck elements in steel–concrete composite bridges. The tensile strength of a loop connection may either be governed by yielding of the U- bars or by failure in the joint concrete. Only few investigations of the case of concrete failure can be found in the literature. This paper presents an experimental program dedicated to study loop connections crit- ical to concrete failure. The results show that the ultimate load is influenced by important design param- eters such as the overlapping length of the U-bars, the spacing between adjacent U-bars and the amount of transverse reinforcement. Knowledge about the parameters that have an effect on the failure of the joint concrete is important in order to avoid this failure mode in practice. The paper also presents an upper bound plasticity model, which is able to capture the experimental tendencies in a satisfactory manner. Finally, the paper includes discussions of how the presented research may be utilized in practice to design connections that are able to transfer the full yield strength of the connecting precast elements. Ó 2013 Elsevier Ltd. All rights reserved. 1. Introduction This paper deals with tests and limit analysis of loop connec- tions loaded in tension. Such connections are widely used in prac- tice, e.g. in steel–concrete composite bridges with precast deck elements. Basically, a loop connection is an in situ cast joint in which U-bars protrude from the precast elements and overlap each other (see Fig. 1). The overlapping U-bars confine a flattened cylin- drical concrete core, which is reinforced with transverse bars. The position of the transverse bars may vary from case to case, but they are always placed inside the core. The spacing between adjacent, overlapping U-bars is usually about 2–6 times the bar diameter to account for construction tolerances. A Loop connection transfers tension if it is located at an intermedi- ate pier, where hogging moments occur in the composite bridge girder. In cable supported bridges; for example the Busan–Geoje bridge [1], the loop connections may be loaded in tension when the girder is sub- jected to wind or seismic loads transverse to the bridge. In practice, the engineers prefer to design loop connections in such a way that yielding of the U-bars is governing. In this way, the full tensile strength of the precast deck elements may be uti- lized and a ductile behavior can be obtained. Yielding of the U-bars is, however, only possible if premature failure in the concrete core can be prevented. It is in practice a challenging task to prevent con- crete failure when the connection has to be as narrow as possible in order to minimize the flange dimensions of the supporting cross beams (see Fig. 1) and to limit the extent of in situ concreting. Despite the practical significance of loop connections, only lim- ited experimental investigations have been published. In particu- lar, tests dedicated to study concrete core failure are rare. Consequently, in current practice, there are no reliable models to determine the margin between the ultimate load related to con- crete failure and the load related to yielding of U-bars. This paper presents an experimental program conducted at the University of Southern Denmark. The program comprised 30 test specimens. The aim was to investigate the influence of important design parameters on the tensile strength of loop connections gov- erned by concrete core failure. The paper also presents an upper bound plasticity model devel- oped with inspiration from the experimental observations. The model provides a design-oriented solution to determine the load margin between U-bar yielding and concrete core failure. The solu- tion has been compared with test results and satisfactory agree- ment was found. Finally, in the Appendix, aspects related to practical applications of the developed model are discussed. 2. Previous investigations Leonhardt et al. [2] were the first to publish results of tests of loop connections loaded in tension. However, the tests comprised 0141-0296/$ - see front matter Ó 2013 Elsevier Ltd. All rights reserved. http://dx.doi.org/10.1016/j.engstruct.2013.03.015 ⇑ Corresponding author. Current address: Technical University of Denmark, Department of Civil Engineering, Brovej, building 118, Kgs. Lyngby, Denmark. Tel.: +45 45251706. E-mail addresses: [email protected] (H.B. Joergensen), [email protected] (L.C. Hoang). 1 Tel.: +45 65507520; fax: +45 65507384. Engineering Structures 52 (2013) 558–569 Contents lists available at SciVerse ScienceDirect Engineering Structures journal homepage: www.elsevier.com/locate/engstruct
-
Upload
independent -
Category
Documents
-
view
0 -
download
0
Transcript of Tests and limit analysis of loop connections between precast concrete elements loaded in tension
Engineering Structures 52 (2013) 558–569
Contents lists available at SciVerse ScienceDirect
Engineering Structures
journal homepage: www.elsevier .com/locate /engstruct
Tests and limit analysis of loop connections between precast concreteelements loaded in tension
0141-0296/$ - see front matter � 2013 Elsevier Ltd. All rights reserved.http://dx.doi.org/10.1016/j.engstruct.2013.03.015
⇑ Corresponding author. Current address: Technical University of Denmark,Department of Civil Engineering, Brovej, building 118, Kgs. Lyngby, Denmark.Tel.: +45 45251706.
E-mail addresses: [email protected] (H.B. Joergensen), [email protected] (L.C.Hoang).
1 Tel.: +45 65507520; fax: +45 65507384.
Henrik B. Joergensen 1, Linh C. Hoang ⇑Institute of Technology and Innovation, University of Southern Denmark, Campusvej 55, 5230 Odense, Denmark
a r t i c l e i n f o
Article history:Received 5 June 2012Revised 28 February 2013Accepted 5 March 2013Available online 17 April 2013
Keywords:Loop connectionsIn situ concrete jointsU-barsComposite bridgesPrecast deck elementsTensile strength
a b s t r a c t
This paper deals with loop connections loaded in tension. Such connections; also known as U-bar joints,are frequently used in practice to establish continuity between precast deck elements in steel–concretecomposite bridges. The tensile strength of a loop connection may either be governed by yielding of the U-bars or by failure in the joint concrete. Only few investigations of the case of concrete failure can be foundin the literature. This paper presents an experimental program dedicated to study loop connections crit-ical to concrete failure. The results show that the ultimate load is influenced by important design param-eters such as the overlapping length of the U-bars, the spacing between adjacent U-bars and the amountof transverse reinforcement. Knowledge about the parameters that have an effect on the failure of thejoint concrete is important in order to avoid this failure mode in practice. The paper also presents anupper bound plasticity model, which is able to capture the experimental tendencies in a satisfactorymanner. Finally, the paper includes discussions of how the presented research may be utilized in practiceto design connections that are able to transfer the full yield strength of the connecting precast elements.
� 2013 Elsevier Ltd. All rights reserved.
1. Introduction is, however, only possible if premature failure in the concrete core
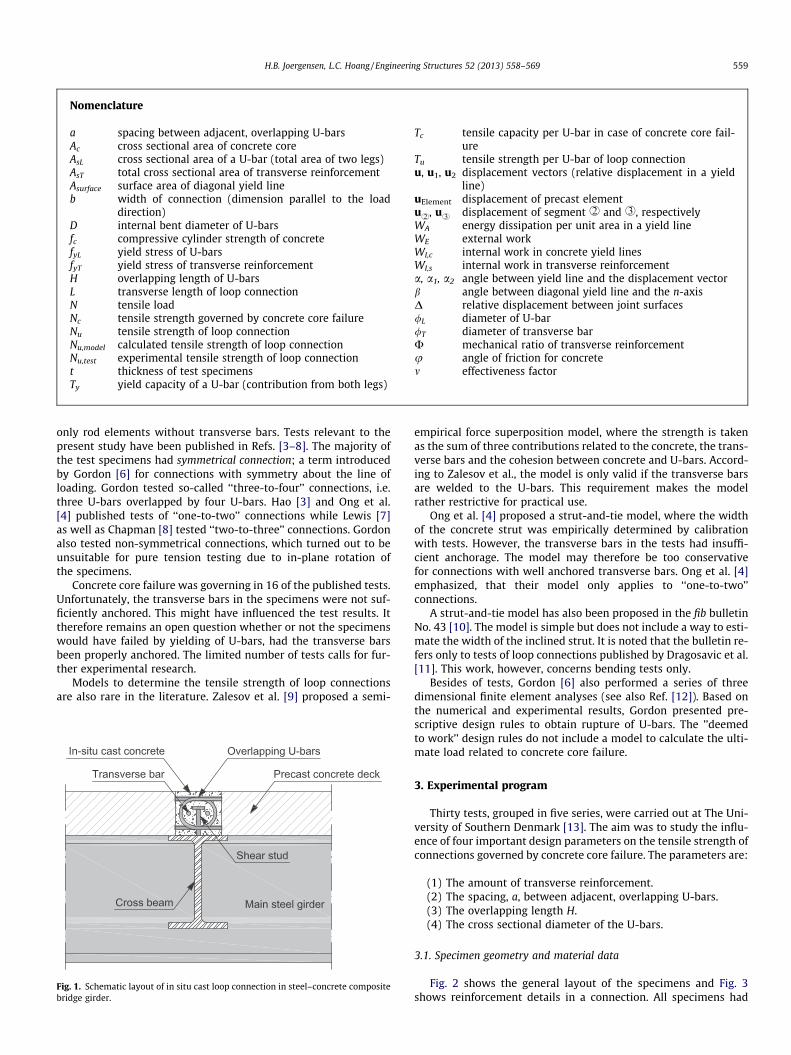
This paper deals with tests and limit analysis of loop connec-tions loaded in tension. Such connections are widely used in prac-tice, e.g. in steel–concrete composite bridges with precast deckelements. Basically, a loop connection is an in situ cast joint inwhich U-bars protrude from the precast elements and overlap eachother (see Fig. 1). The overlapping U-bars confine a flattened cylin-drical concrete core, which is reinforced with transverse bars. Theposition of the transverse bars may vary from case to case, but theyare always placed inside the core. The spacing between adjacent,overlapping U-bars is usually about 2–6 times the bar diameterto account for construction tolerances.
A Loop connection transfers tension if it is located at an intermedi-ate pier, where hogging moments occur in the composite bridge girder.In cable supported bridges; for example the Busan–Geoje bridge [1],the loop connections may be loaded in tension when the girder is sub-jected to wind or seismic loads transverse to the bridge.
In practice, the engineers prefer to design loop connections insuch a way that yielding of the U-bars is governing. In this way,the full tensile strength of the precast deck elements may be uti-lized and a ductile behavior can be obtained. Yielding of the U-bars
can be prevented. It is in practice a challenging task to prevent con-crete failure when the connection has to be as narrow as possiblein order to minimize the flange dimensions of the supporting crossbeams (see Fig. 1) and to limit the extent of in situ concreting.
Despite the practical significance of loop connections, only lim-ited experimental investigations have been published. In particu-lar, tests dedicated to study concrete core failure are rare.Consequently, in current practice, there are no reliable models todetermine the margin between the ultimate load related to con-crete failure and the load related to yielding of U-bars.
This paper presents an experimental program conducted at theUniversity of Southern Denmark. The program comprised 30 testspecimens. The aim was to investigate the influence of importantdesign parameters on the tensile strength of loop connections gov-erned by concrete core failure.
The paper also presents an upper bound plasticity model devel-oped with inspiration from the experimental observations. Themodel provides a design-oriented solution to determine the loadmargin between U-bar yielding and concrete core failure. The solu-tion has been compared with test results and satisfactory agree-ment was found. Finally, in the Appendix, aspects related topractical applications of the developed model are discussed.
2. Previous investigations
Leonhardt et al. [2] were the first to publish results of tests ofloop connections loaded in tension. However, the tests comprised
Nomenclature
a spacing between adjacent, overlapping U-barsAc cross sectional area of concrete coreAsL cross sectional area of a U-bar (total area of two legs)AsT total cross sectional area of transverse reinforcementAsurface surface area of diagonal yield lineb width of connection (dimension parallel to the load
direction)D internal bent diameter of U-barsfc compressive cylinder strength of concretefyL yield stress of U-barsfyT yield stress of transverse reinforcementH overlapping length of U-barsL transverse length of loop connectionN tensile loadNc tensile strength governed by concrete core failureNu tensile strength of loop connectionNu,model calculated tensile strength of loop connectionNu,test experimental tensile strength of loop connectiont thickness of test specimensTy yield capacity of a U-bar (contribution from both legs)
Tc tensile capacity per U-bar in case of concrete core fail-ure
Tu tensile strength per U-bar of loop connectionu, u1, u2 displacement vectors (relative displacement in a yield
line)uElement displacement of precast elementus, ut displacement of segment s and t, respectivelyWA energy dissipation per unit area in a yield lineWE external workWI,c internal work in concrete yield linesWI,s internal work in transverse reinforcementa, a1, a2 angle between yield line and the displacement vectorb angle between diagonal yield line and the n-axisD relative displacement between joint surfaces/L diameter of U-bar/T diameter of transverse barU mechanical ratio of transverse reinforcementu angle of friction for concretem effectiveness factor
H.B. Joergensen, L.C. Hoang / Engineering Structures 52 (2013) 558–569 559
only rod elements without transverse bars. Tests relevant to thepresent study have been published in Refs. [3–8]. The majority ofthe test specimens had symmetrical connection; a term introducedby Gordon [6] for connections with symmetry about the line ofloading. Gordon tested so-called ‘‘three-to-four’’ connections, i.e.three U-bars overlapped by four U-bars. Hao [3] and Ong et al.[4] published tests of ‘‘one-to-two’’ connections while Lewis [7]as well as Chapman [8] tested ‘‘two-to-three’’ connections. Gordonalso tested non-symmetrical connections, which turned out to beunsuitable for pure tension testing due to in-plane rotation ofthe specimens.
Concrete core failure was governing in 16 of the published tests.Unfortunately, the transverse bars in the specimens were not suf-ficiently anchored. This might have influenced the test results. Ittherefore remains an open question whether or not the specimenswould have failed by yielding of U-bars, had the transverse barsbeen properly anchored. The limited number of tests calls for fur-ther experimental research.
Models to determine the tensile strength of loop connectionsare also rare in the literature. Zalesov et al. [9] proposed a semi-
Fig. 1. Schematic layout of in situ cast loop connection in steel–concrete compositebridge girder.
empirical force superposition model, where the strength is takenas the sum of three contributions related to the concrete, the trans-verse bars and the cohesion between concrete and U-bars. Accord-ing to Zalesov et al., the model is only valid if the transverse barsare welded to the U-bars. This requirement makes the modelrather restrictive for practical use.
Ong et al. [4] proposed a strut-and-tie model, where the widthof the concrete strut was empirically determined by calibrationwith tests. However, the transverse bars in the tests had insuffi-cient anchorage. The model may therefore be too conservativefor connections with well anchored transverse bars. Ong et al. [4]emphasized, that their model only applies to ‘‘one-to-two’’connections.
A strut-and-tie model has also been proposed in the fib bulletinNo. 43 [10]. The model is simple but does not include a way to esti-mate the width of the inclined strut. It is noted that the bulletin re-fers only to tests of loop connections published by Dragosavic et al.[11]. This work, however, concerns bending tests only.
Besides of tests, Gordon [6] also performed a series of threedimensional finite element analyses (see also Ref. [12]). Based onthe numerical and experimental results, Gordon presented pre-scriptive design rules to obtain rupture of U-bars. The ’’deemedto work’’ design rules do not include a model to calculate the ulti-mate load related to concrete core failure.
3. Experimental program
Thirty tests, grouped in five series, were carried out at The Uni-versity of Southern Denmark [13]. The aim was to study the influ-ence of four important design parameters on the tensile strength ofconnections governed by concrete core failure. The parameters are:
(1) The amount of transverse reinforcement.(2) The spacing, a, between adjacent, overlapping U-bars.(3) The overlapping length H.(4) The cross sectional diameter of the U-bars.
3.1. Specimen geometry and material data
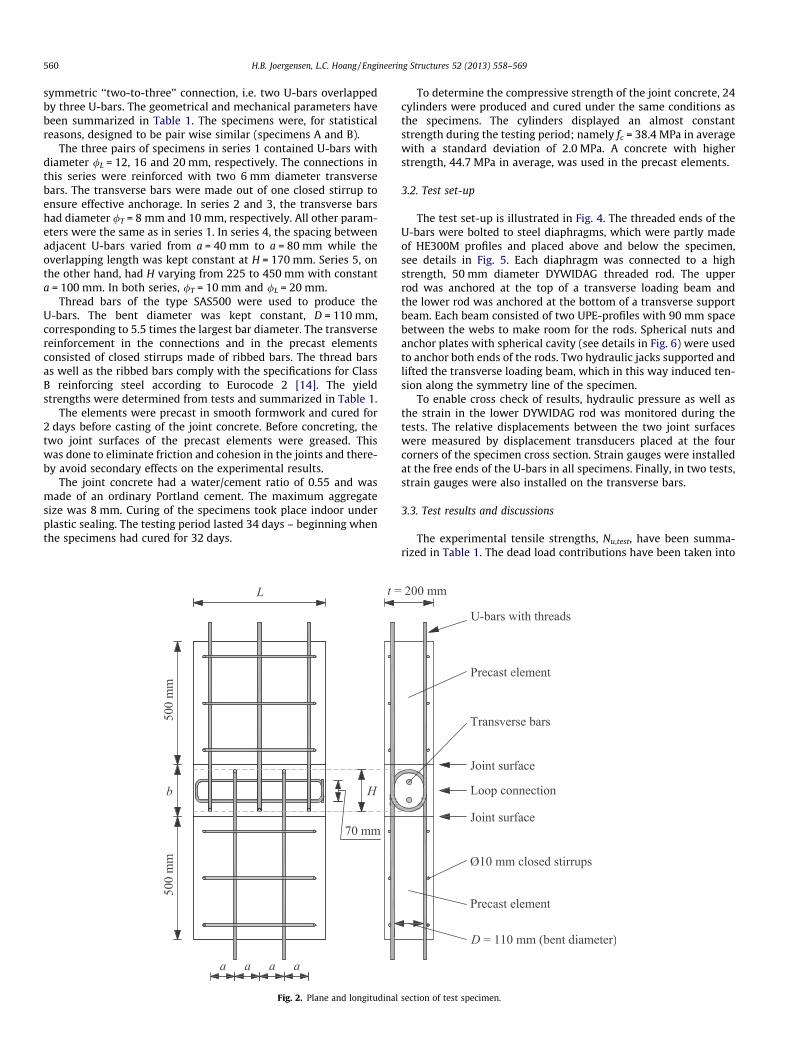
Fig. 2 shows the general layout of the specimens and Fig. 3shows reinforcement details in a connection. All specimens had
560 H.B. Joergensen, L.C. Hoang / Engineering Structures 52 (2013) 558–569
symmetric ‘‘two-to-three’’ connection, i.e. two U-bars overlappedby three U-bars. The geometrical and mechanical parameters havebeen summarized in Table 1. The specimens were, for statisticalreasons, designed to be pair wise similar (specimens A and B).
The three pairs of specimens in series 1 contained U-bars withdiameter /L = 12, 16 and 20 mm, respectively. The connections inthis series were reinforced with two 6 mm diameter transversebars. The transverse bars were made out of one closed stirrup toensure effective anchorage. In series 2 and 3, the transverse barshad diameter /T = 8 mm and 10 mm, respectively. All other param-eters were the same as in series 1. In series 4, the spacing betweenadjacent U-bars varied from a = 40 mm to a = 80 mm while theoverlapping length was kept constant at H = 170 mm. Series 5, onthe other hand, had H varying from 225 to 450 mm with constanta = 100 mm. In both series, /T = 10 mm and /L = 20 mm.
Thread bars of the type SAS500 were used to produce theU-bars. The bent diameter was kept constant, D = 110 mm,corresponding to 5.5 times the largest bar diameter. The transversereinforcement in the connections and in the precast elementsconsisted of closed stirrups made of ribbed bars. The thread barsas well as the ribbed bars comply with the specifications for ClassB reinforcing steel according to Eurocode 2 [14]. The yieldstrengths were determined from tests and summarized in Table 1.
The elements were precast in smooth formwork and cured for2 days before casting of the joint concrete. Before concreting, thetwo joint surfaces of the precast elements were greased. Thiswas done to eliminate friction and cohesion in the joints and there-by avoid secondary effects on the experimental results.
The joint concrete had a water/cement ratio of 0.55 and wasmade of an ordinary Portland cement. The maximum aggregatesize was 8 mm. Curing of the specimens took place indoor underplastic sealing. The testing period lasted 34 days – beginning whenthe specimens had cured for 32 days.
Fig. 2. Plane and longitudinal
To determine the compressive strength of the joint concrete, 24cylinders were produced and cured under the same conditions asthe specimens. The cylinders displayed an almost constantstrength during the testing period; namely fc = 38.4 MPa in averagewith a standard deviation of 2.0 MPa. A concrete with higherstrength, 44.7 MPa in average, was used in the precast elements.
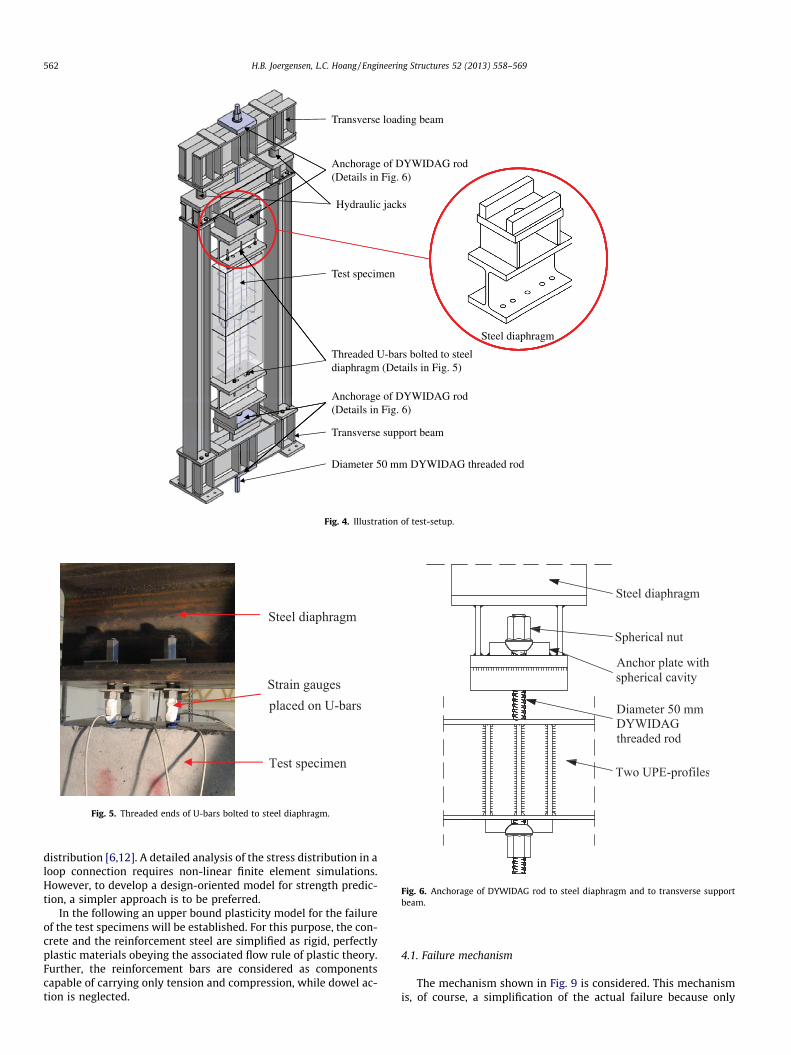
3.2. Test set-up
The test set-up is illustrated in Fig. 4. The threaded ends of theU-bars were bolted to steel diaphragms, which were partly madeof HE300M profiles and placed above and below the specimen,see details in Fig. 5. Each diaphragm was connected to a highstrength, 50 mm diameter DYWIDAG threaded rod. The upperrod was anchored at the top of a transverse loading beam andthe lower rod was anchored at the bottom of a transverse supportbeam. Each beam consisted of two UPE-profiles with 90 mm spacebetween the webs to make room for the rods. Spherical nuts andanchor plates with spherical cavity (see details in Fig. 6) were usedto anchor both ends of the rods. Two hydraulic jacks supported andlifted the transverse loading beam, which in this way induced ten-sion along the symmetry line of the specimen.
To enable cross check of results, hydraulic pressure as well asthe strain in the lower DYWIDAG rod was monitored during thetests. The relative displacements between the two joint surfaceswere measured by displacement transducers placed at the fourcorners of the specimen cross section. Strain gauges were installedat the free ends of the U-bars in all specimens. Finally, in two tests,strain gauges were also installed on the transverse bars.
3.3. Test results and discussions
The experimental tensile strengths, Nu,test, have been summa-rized in Table 1. The dead load contributions have been taken into
section of test specimen.
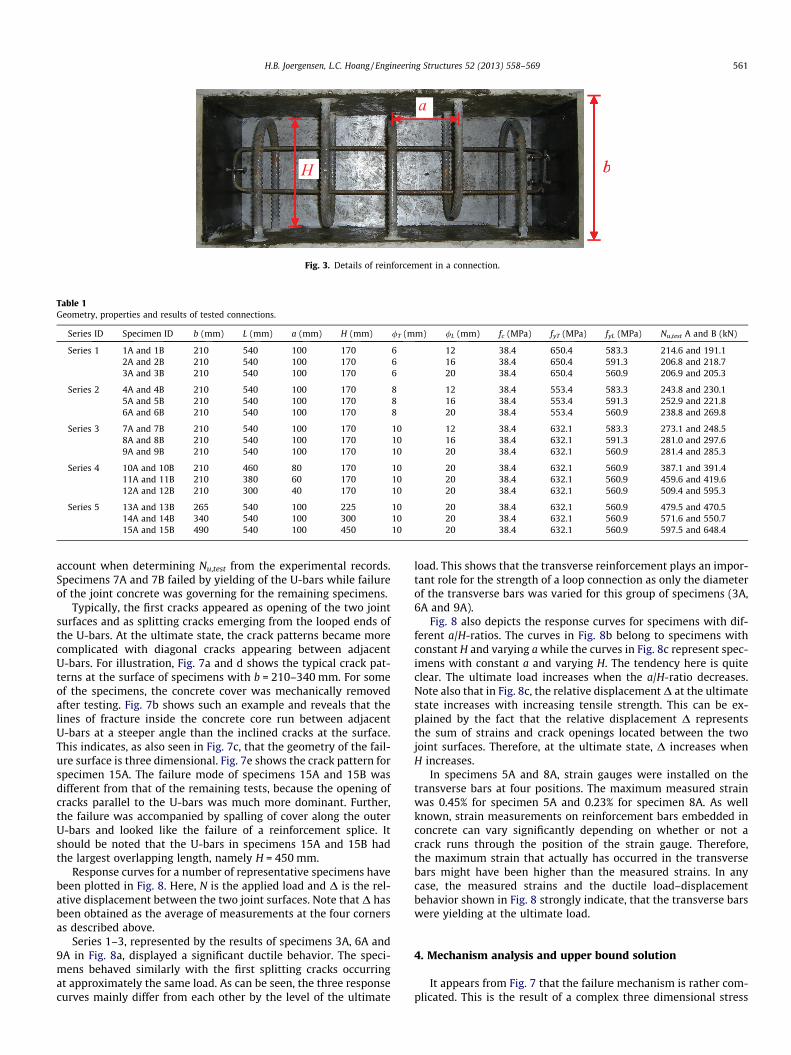
Fig. 3. Details of reinforcement in a connection.
Table 1Geometry, properties and results of tested connections.
Series ID Specimen ID b (mm) L (mm) a (mm) H (mm) /T (mm) /L (mm) fc (MPa) fyT (MPa) fyL (MPa) Nu,test A and B (kN)
Series 1 1A and 1B 210 540 100 170 6 12 38.4 650.4 583.3 214.6 and 191.12A and 2B 210 540 100 170 6 16 38.4 650.4 591.3 206.8 and 218.73A and 3B 210 540 100 170 6 20 38.4 650.4 560.9 206.9 and 205.3
Series 2 4A and 4B 210 540 100 170 8 12 38.4 553.4 583.3 243.8 and 230.15A and 5B 210 540 100 170 8 16 38.4 553.4 591.3 252.9 and 221.86A and 6B 210 540 100 170 8 20 38.4 553.4 560.9 238.8 and 269.8
Series 3 7A and 7B 210 540 100 170 10 12 38.4 632.1 583.3 273.1 and 248.58A and 8B 210 540 100 170 10 16 38.4 632.1 591.3 281.0 and 297.69A and 9B 210 540 100 170 10 20 38.4 632.1 560.9 281.4 and 285.3
Series 4 10A and 10B 210 460 80 170 10 20 38.4 632.1 560.9 387.1 and 391.411A and 11B 210 380 60 170 10 20 38.4 632.1 560.9 459.6 and 419.612A and 12B 210 300 40 170 10 20 38.4 632.1 560.9 509.4 and 595.3
Series 5 13A and 13B 265 540 100 225 10 20 38.4 632.1 560.9 479.5 and 470.514A and 14B 340 540 100 300 10 20 38.4 632.1 560.9 571.6 and 550.715A and 15B 490 540 100 450 10 20 38.4 632.1 560.9 597.5 and 648.4
H.B. Joergensen, L.C. Hoang / Engineering Structures 52 (2013) 558–569 561
account when determining Nu,test from the experimental records.Specimens 7A and 7B failed by yielding of the U-bars while failureof the joint concrete was governing for the remaining specimens.
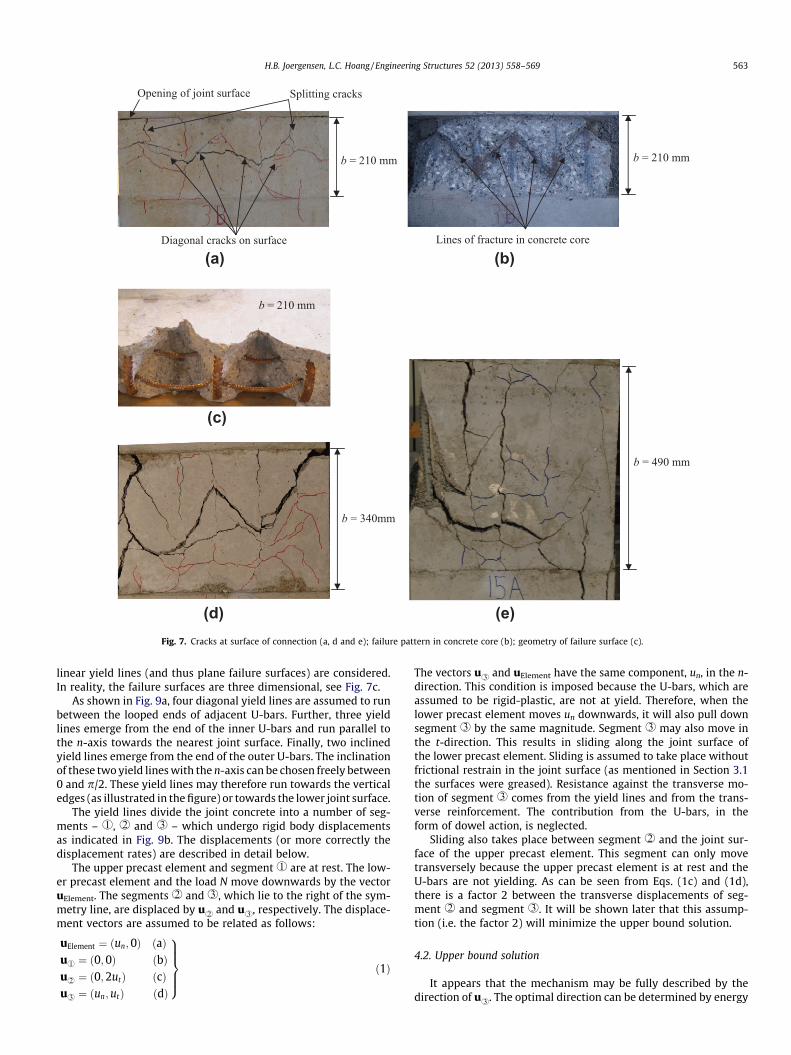
Typically, the first cracks appeared as opening of the two jointsurfaces and as splitting cracks emerging from the looped ends ofthe U-bars. At the ultimate state, the crack patterns became morecomplicated with diagonal cracks appearing between adjacentU-bars. For illustration, Fig. 7a and d shows the typical crack pat-terns at the surface of specimens with b = 210–340 mm. For someof the specimens, the concrete cover was mechanically removedafter testing. Fig. 7b shows such an example and reveals that thelines of fracture inside the concrete core run between adjacentU-bars at a steeper angle than the inclined cracks at the surface.This indicates, as also seen in Fig. 7c, that the geometry of the fail-ure surface is three dimensional. Fig. 7e shows the crack pattern forspecimen 15A. The failure mode of specimens 15A and 15B wasdifferent from that of the remaining tests, because the opening ofcracks parallel to the U-bars was much more dominant. Further,the failure was accompanied by spalling of cover along the outerU-bars and looked like the failure of a reinforcement splice. Itshould be noted that the U-bars in specimens 15A and 15B hadthe largest overlapping length, namely H = 450 mm.
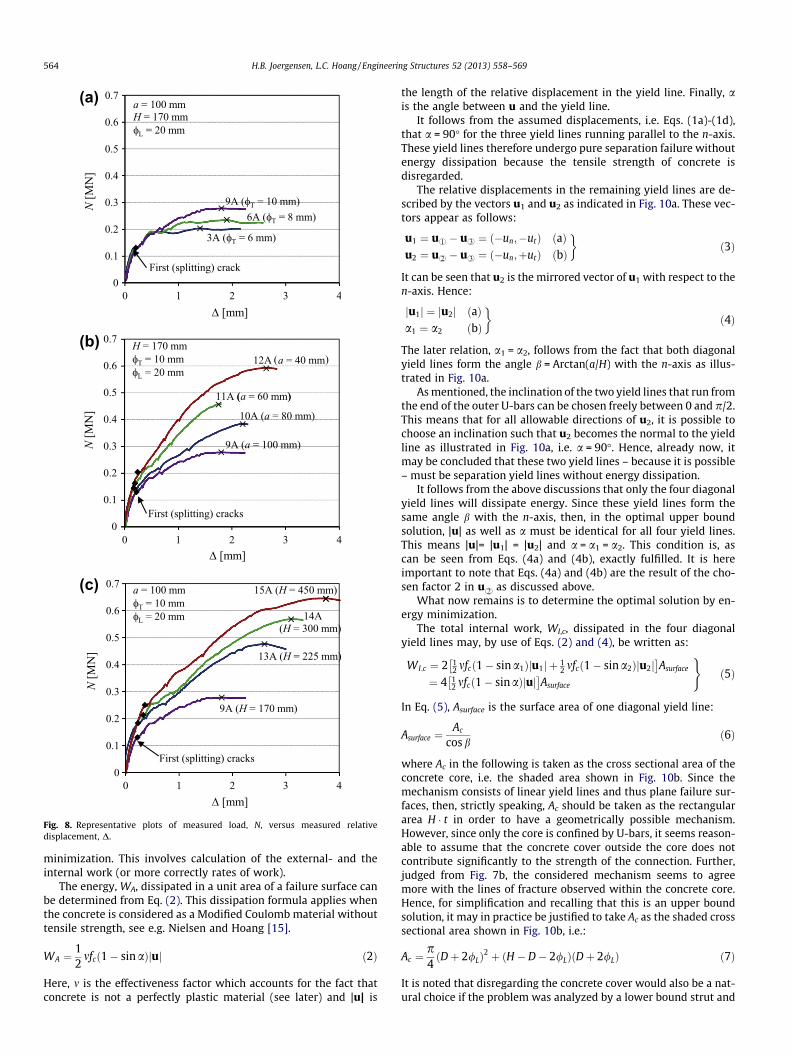
Response curves for a number of representative specimens havebeen plotted in Fig. 8. Here, N is the applied load and D is the rel-ative displacement between the two joint surfaces. Note that D hasbeen obtained as the average of measurements at the four cornersas described above.
Series 1–3, represented by the results of specimens 3A, 6A and9A in Fig. 8a, displayed a significant ductile behavior. The speci-mens behaved similarly with the first splitting cracks occurringat approximately the same load. As can be seen, the three responsecurves mainly differ from each other by the level of the ultimate
load. This shows that the transverse reinforcement plays an impor-tant role for the strength of a loop connection as only the diameterof the transverse bars was varied for this group of specimens (3A,6A and 9A).
Fig. 8 also depicts the response curves for specimens with dif-ferent a/H-ratios. The curves in Fig. 8b belong to specimens withconstant H and varying a while the curves in Fig. 8c represent spec-imens with constant a and varying H. The tendency here is quiteclear. The ultimate load increases when the a/H-ratio decreases.Note also that in Fig. 8c, the relative displacement D at the ultimatestate increases with increasing tensile strength. This can be ex-plained by the fact that the relative displacement D representsthe sum of strains and crack openings located between the twojoint surfaces. Therefore, at the ultimate state, D increases whenH increases.
In specimens 5A and 8A, strain gauges were installed on thetransverse bars at four positions. The maximum measured strainwas 0.45% for specimen 5A and 0.23% for specimen 8A. As wellknown, strain measurements on reinforcement bars embedded inconcrete can vary significantly depending on whether or not acrack runs through the position of the strain gauge. Therefore,the maximum strain that actually has occurred in the transversebars might have been higher than the measured strains. In anycase, the measured strains and the ductile load–displacementbehavior shown in Fig. 8 strongly indicate, that the transverse barswere yielding at the ultimate load.
4. Mechanism analysis and upper bound solution
It appears from Fig. 7 that the failure mechanism is rather com-plicated. This is the result of a complex three dimensional stress
Transverse loading beam
Anchorage of DYWIDAG rod (Details in Fig. 6)
Hydraulic jacks
Test specimen
Steel diaphragm
Threaded U-bars bolted to steel diaphragm (Details in Fig. 5)
Anchorage of DYWIDAG rod
Transverse support beam
(Details in Fig. 6)
Diameter 50 mm DYWIDAG threaded rod
Fig. 4. Illustration of test-setup.
Fig. 5. Threaded ends of U-bars bolted to steel diaphragm.
Fig. 6. Anchorage of DYWIDAG rod to steel diaphragm and to transverse supportbeam.
562 H.B. Joergensen, L.C. Hoang / Engineering Structures 52 (2013) 558–569
distribution [6,12]. A detailed analysis of the stress distribution in aloop connection requires non-linear finite element simulations.However, to develop a design-oriented model for strength predic-tion, a simpler approach is to be preferred.
In the following an upper bound plasticity model for the failureof the test specimens will be established. For this purpose, the con-crete and the reinforcement steel are simplified as rigid, perfectlyplastic materials obeying the associated flow rule of plastic theory.Further, the reinforcement bars are considered as componentscapable of carrying only tension and compression, while dowel ac-tion is neglected.
4.1. Failure mechanism
The mechanism shown in Fig. 9 is considered. This mechanismis, of course, a simplification of the actual failure because only
(a)
(c)
(d) (e)
(b)
Fig. 7. Cracks at surface of connection (a, d and e); failure pattern in concrete core (b); geometry of failure surface (c).
H.B. Joergensen, L.C. Hoang / Engineering Structures 52 (2013) 558–569 563
linear yield lines (and thus plane failure surfaces) are considered.In reality, the failure surfaces are three dimensional, see Fig. 7c.
As shown in Fig. 9a, four diagonal yield lines are assumed to runbetween the looped ends of adjacent U-bars. Further, three yieldlines emerge from the end of the inner U-bars and run parallel tothe n-axis towards the nearest joint surface. Finally, two inclinedyield lines emerge from the end of the outer U-bars. The inclinationof these two yield lines with the n-axis can be chosen freely between0 and p/2. These yield lines may therefore run towards the verticaledges (as illustrated in the figure) or towards the lower joint surface.
The yield lines divide the joint concrete into a number of seg-ments – r, s and t – which undergo rigid body displacementsas indicated in Fig. 9b. The displacements (or more correctly thedisplacement rates) are described in detail below.
The upper precast element and segment r are at rest. The low-er precast element and the load N move downwards by the vectoruElement. The segments s and t, which lie to the right of the sym-metry line, are displaced by us and ut, respectively. The displace-ment vectors are assumed to be related as follows:
uElement ¼ ðun;0Þ ðaÞur ¼ ð0;0Þ ðbÞus ¼ ð0;2utÞ ðcÞut ¼ ðun;utÞ ðdÞ
9>>>=>>>;
ð1Þ
The vectors ut and uElement have the same component, un, in the n-direction. This condition is imposed because the U-bars, which areassumed to be rigid-plastic, are not at yield. Therefore, when thelower precast element moves un downwards, it will also pull downsegment t by the same magnitude. Segment t may also move inthe t-direction. This results in sliding along the joint surface ofthe lower precast element. Sliding is assumed to take place withoutfrictional restrain in the joint surface (as mentioned in Section 3.1the surfaces were greased). Resistance against the transverse mo-tion of segment t comes from the yield lines and from the trans-verse reinforcement. The contribution from the U-bars, in theform of dowel action, is neglected.
Sliding also takes place between segment s and the joint sur-face of the upper precast element. This segment can only movetransversely because the upper precast element is at rest and theU-bars are not yielding. As can be seen from Eqs. (1c) and (1d),there is a factor 2 between the transverse displacements of seg-ment s and segment t. It will be shown later that this assump-tion (i.e. the factor 2) will minimize the upper bound solution.
4.2. Upper bound solution
It appears that the mechanism may be fully described by thedirection of ut. The optimal direction can be determined by energy
(a)
(b)
(c)
Fig. 8. Representative plots of measured load, N, versus measured relativedisplacement, D.
564 H.B. Joergensen, L.C. Hoang / Engineering Structures 52 (2013) 558–569
minimization. This involves calculation of the external- and theinternal work (or more correctly rates of work).
The energy, WA, dissipated in a unit area of a failure surface canbe determined from Eq. (2). This dissipation formula applies whenthe concrete is considered as a Modified Coulomb material withouttensile strength, see e.g. Nielsen and Hoang [15].
WA ¼12mfcð1� sin aÞjuj ð2Þ
Here, m is the effectiveness factor which accounts for the fact thatconcrete is not a perfectly plastic material (see later) and |u| is
the length of the relative displacement in the yield line. Finally, ais the angle between u and the yield line.
It follows from the assumed displacements, i.e. Eqs. (1a)-(1d),that a = 90� for the three yield lines running parallel to the n-axis.These yield lines therefore undergo pure separation failure withoutenergy dissipation because the tensile strength of concrete isdisregarded.
The relative displacements in the remaining yield lines are de-scribed by the vectors u1 and u2 as indicated in Fig. 10a. These vec-tors appear as follows:
u1 ¼ ur � ut ¼ ð�un;�utÞ ðaÞu2 ¼ us � ut ¼ ð�un;þutÞ ðbÞ
�ð3Þ
It can be seen that u2 is the mirrored vector of u1 with respect to then-axis. Hence:
ju1j ¼ ju2j ðaÞa1 ¼ a2 ðbÞ
�ð4Þ
The later relation, a1 = a2, follows from the fact that both diagonalyield lines form the angle b = Arctan(a/H) with the n-axis as illus-trated in Fig. 10a.
As mentioned, the inclination of the two yield lines that run fromthe end of the outer U-bars can be chosen freely between 0 and p/2.This means that for all allowable directions of u2, it is possible tochoose an inclination such that u2 becomes the normal to the yieldline as illustrated in Fig. 10a, i.e. a = 90�. Hence, already now, itmay be concluded that these two yield lines – because it is possible– must be separation yield lines without energy dissipation.
It follows from the above discussions that only the four diagonalyield lines will dissipate energy. Since these yield lines form thesame angle b with the n-axis, then, in the optimal upper boundsolution, |u| as well as a must be identical for all four yield lines.This means |u|= |u1| = |u2| and a = a1 = a2. This condition is, ascan be seen from Eqs. (4a) and (4b), exactly fulfilled. It is hereimportant to note that Eqs. (4a) and (4b) are the result of the cho-sen factor 2 in us as discussed above.
What now remains is to determine the optimal solution by en-ergy minimization.
The total internal work, WI,c, dissipated in the four diagonalyield lines may, by use of Eqs. (2) and (4), be written as:
WI;c ¼ 2 12 mfcð1� sina1Þju1j þ 1
2 mfcð1� sin a2Þju2j� �
Asurface
¼ 4 12 mfcð1� sinaÞjuj� �
Asurface
)ð5Þ
In Eq. (5), Asurface is the surface area of one diagonal yield line:
Asurface ¼Ac
cos bð6Þ
where Ac in the following is taken as the cross sectional area of theconcrete core, i.e. the shaded area shown in Fig. 10b. Since themechanism consists of linear yield lines and thus plane failure sur-faces, then, strictly speaking, Ac should be taken as the rectangulararea H � t in order to have a geometrically possible mechanism.However, since only the core is confined by U-bars, it seems reason-able to assume that the concrete cover outside the core does notcontribute significantly to the strength of the connection. Further,judged from Fig. 7b, the considered mechanism seems to agreemore with the lines of fracture observed within the concrete core.Hence, for simplification and recalling that this is an upper boundsolution, it may in practice be justified to take Ac as the shaded crosssectional area shown in Fig. 10b, i.e.:
Ac ¼p4ðDþ 2/LÞ
2 þ ðH � D� 2/LÞðDþ 2/LÞ ð7Þ
It is noted that disregarding the concrete cover would also be a nat-ural choice if the problem was analyzed by a lower bound strut and
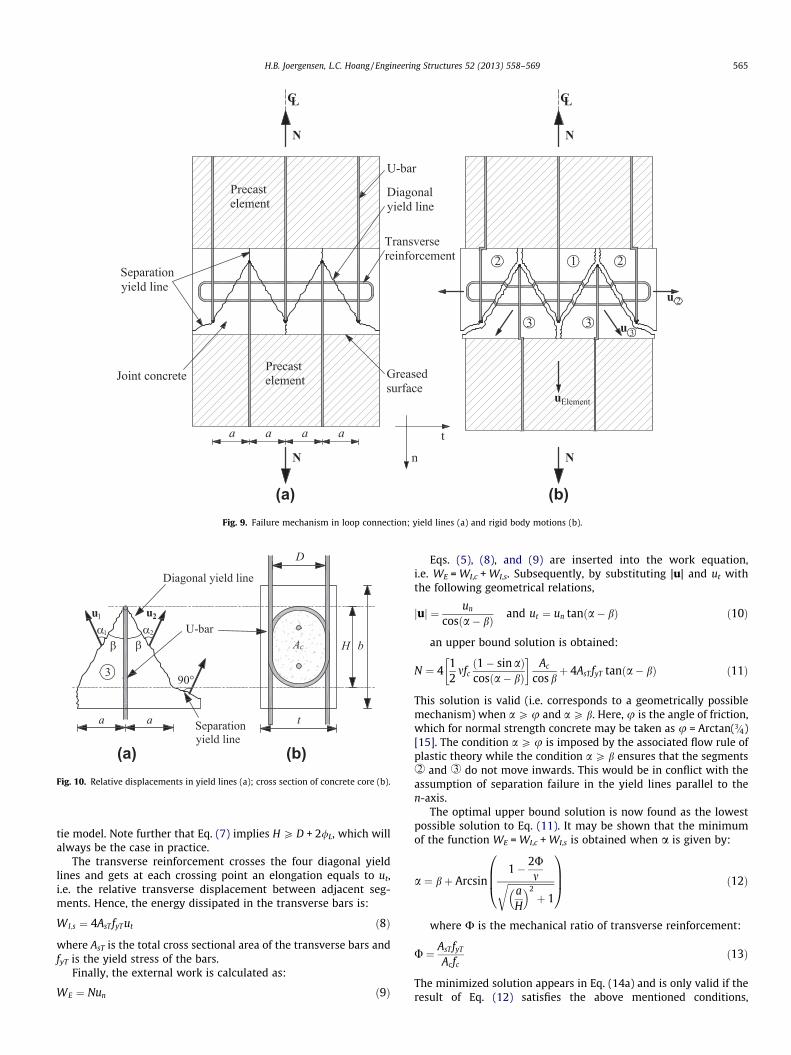
(a) (b)Fig. 9. Failure mechanism in loop connection; yield lines (a) and rigid body motions (b).
(a) (b)Fig. 10. Relative displacements in yield lines (a); cross section of concrete core (b).
H.B. Joergensen, L.C. Hoang / Engineering Structures 52 (2013) 558–569 565
tie model. Note further that Eq. (7) implies H P D + 2/L, which willalways be the case in practice.
The transverse reinforcement crosses the four diagonal yieldlines and gets at each crossing point an elongation equals to ut,i.e. the relative transverse displacement between adjacent seg-ments. Hence, the energy dissipated in the transverse bars is:
WI;s ¼ 4AsT fyT ut ð8Þ
where AsT is the total cross sectional area of the transverse bars andfyT is the yield stress of the bars.
Finally, the external work is calculated as:
WE ¼ Nun ð9Þ
Eqs. (5), (8), and (9) are inserted into the work equation,i.e. WE = WI,c + WI,s. Subsequently, by substituting |u| and ut withthe following geometrical relations,
juj ¼ un
cosða� bÞ and ut ¼ un tanða� bÞ ð10Þ
an upper bound solution is obtained:
N ¼ 412mfcð1� sin aÞcosða� bÞ
� �Ac
cos bþ 4AsT fyT tanða� bÞ ð11Þ
This solution is valid (i.e. corresponds to a geometrically possiblemechanism) when a P u and a P b. Here, u is the angle of friction,which for normal strength concrete may be taken as u = Arctan(3=4)[15]. The condition a P u is imposed by the associated flow rule ofplastic theory while the condition a P b ensures that the segmentss and t do not move inwards. This would be in conflict with theassumption of separation failure in the yield lines parallel to then-axis.
The optimal upper bound solution is now found as the lowestpossible solution to Eq. (11). It may be shown that the minimumof the function WE = WI,c + WI,s is obtained when a is given by:
a ¼ bþ Arcsin1� 2U
mffiffiffiffiffiffiffiffiffiffiffiffiffiffiffiffiffiffiffiffiaH
� 2þ 1
r0BB@
1CCA ð12Þ
where U is the mechanical ratio of transverse reinforcement:
U ¼ AsT fyT
Acfcð13Þ
The minimized solution appears in Eq. (14a) and is only valid if theresult of Eq. (12) satisfies the above mentioned conditions,

566 H.B. Joergensen, L.C. Hoang / Engineering Structures 52 (2013) 558–569
i.e. a P u and a P b. Therefore, a = u must be inserted into Eq. (11)to obtain a valid solution when the result of Eq. (12) becomes smal-ler than u. This leads to Eq. (14b). Further, a = b must be insertedinto Eq. (11) when the result of Eq. (12) becomes smaller than b.By doing so, solution (14c) is obtained. Now, because tanb = a/Hand tanu = 3=4, the condition a P u will be violated before the con-dition a P b when a/H < 3=4 (and vice versa when a/H > 3=4). Hence,the entire solution and the criteria for its validation appear as fol-lows:
Table 2Comparison of experimental and theoretical results.
Specimen ID Nu,model
(kN)Failure mode Nu;test
Nu;model
Nu;test
Nu;model
Observed Predicted SpecimenA
SpecimenB
1 (A and B) 183.6 C C 1.17 1.072 (A and B) 185.7 C C 1.11 1.183 (A and B) 187.6 C C 1.10 1.094 (A and B) 246.0 C C 0.99 0.945 (A and B) 249.8 C C 1.01 0.896 (A and B) 253.2 C C 0.94 1.077 (A and B) 263.9 Y Y 1.03 0.948 (A and B) 351.9 C C 0.80 0.859 (A and B) 359.4 C C 0.78 0.7910 (A and B) 403.2 C C 0.96 0.9711 (A and B) 455.4 C C 1.01 0.9212 (A and B) 517.4 C C 0.98 1.1513 (A and B) 464.8 C C 1.03 1.0114 (A and B) 585.3 C C 0.98 0.9415 (A and B) 704.8 C Y 0.85 0.92
C = concrete core failure; Y = yielding of U-bars.Mean value = 0.98; standard deviation = 0.11.
Nc
mfcAc¼ 2
ffiffiffiffiffiffiffiffiffiffiffiffiffiffiffiffiffiffiffiffiffiffiffiffiffiffiffiffiffiffiffiffiffiffiffiffiffiffiffiffiffiffiffiffi4Um
1�Um
� �þ a
H
� 2s
� aH
!; if a P u and a P b ðaÞ
2Um
3� 4aH
� þ a
H
� 2þ 1
� �
4þ 3aH
; if a < u andaH<
34ðbÞ
ffiffiffiffiffiffiffiffiffiffiffiffiffiffiffiffiffiffiffiffiffiaH
� 2þ 1
r� a
H
!; if a < b and
aH
P34ðcÞ
8>>>>>>>>>>>>><>>>>>>>>>>>>>:
ð14Þ
The solution reveals some interesting details. The ultimate load isproportional to mfc and Ac while the dependency on the dimension-less parameters U/m as well as a/H is non-linear. It is also interestingto note that solution (14) is similar to the shear strength solution forbeams without shear reinforcement [15] and for deep beams andpile caps [16]. Indeed, the mechanism shown in Fig. 9 may also beused to analyse the shear failure of a two span continuous deepbeam (with depth = H and span = 2a) subjected to point loads atthe mid spans. This shows that the concrete core failure in a loopconnection is related to the shear failure in beams. However, unlikebeams, the a/H-ratio in loop connections is usually smaller than 3=4.This means that Eq. (14c) seldom becomes relevant in practice.
4.3. Complete solution for strength prediction of test specimens
Solution (14) is related to concrete core failure (as indicated bythe index ‘‘c’’ in Nc). Of course, the test specimens may also fail byyielding of the U-bars. Hence, the complete solution for strengthprediction of the test specimens may be written as:
Nu ¼minNcðEq: ð14ÞÞ;Concrete failure ðaÞNy ¼ 2AsLfyL;Yielding of U-bars ðbÞ
ð15Þ
Here, AsL is the total cross sectional area of one U-bar,i.e. AsL ¼ 2 p
4 /2L .
Applications of solution (15) to design loop connections withmany U-bars in practice are discussed in the Appendix.
5. Comparison of tests with theory
5.1. The effectiveness factor
It is necessary to introduce a so-called effectiveness factor m,when plasticity theory is applied to structural concrete. As men-tioned, m accounts for the fact that concrete is not a perfectly plas-tic material [15]. To determine m for a specific problem, twoapproaches may normally be used. The first is to calibrate the the-oretical solution with a large experimental data base. This is notpossible in the present case because a large data base does not ex-ist for loop connections loaded in tension. The second approach isto adopt and adjust an existing m-formula for a related problem andverify it with the available tests.
As discussed above, the failure mechanism shown in Fig. 9 issimilar to the shear failure in beams. It is therefore worthwhileto investigate, whether the m-formula proposed in Refs. [15,17]for beam shear problems can be used for loop connections as well.When adjusted to the problem of loop connections, this formulaappears as follows:
m ¼ 0:88ffiffiffiffifc
p 1þ 1ffiffiffiffiHp
� �ðfc in MPa;H in mÞ ð16Þ
Note that for beam shear, H in this formula will represent the beamdepth. Compared to the original formula, two modifications havebeen introduced in Eq. (16). First, a multiplication factor ms � 0.5has been excluded. This factor accounts for crack sliding in beamshear problems, i.e. sliding in a crack that initially was developedby a rotational mechanism. This implies that the relative displace-ment initially is perpendicular to the crack and thereafter shiftsdirection to form an angle a < 90� with the crack. Such a rotationalcracking mechanism is not possible in a loop connection due to theneighboring precast elements. The second modification is an exclu-sion of the factor (1 + 26q), where q is the reinforcement ratio. Thisfactor accounts for dowel action in the longitudinal bars when deal-ing with shear in beams without stirrups. Transformed to the pres-ent problem, this factor should be equivalent to dowel action in thetransverse bars. However, these bars have already been utilized totensile yielding in solution (14). It may therefore be argued thatdowel action must vanish.
(a) (b)
(c)
(e)
(d)
Fig. 11. Experimental and calculated strength, Nu, versus theoretical tensile capacity, 2AsLfyL, of U-bars in lower precast element.
H.B. Joergensen, L.C. Hoang / Engineering Structures 52 (2013) 558–569 567
5.2. Calculations and discussions
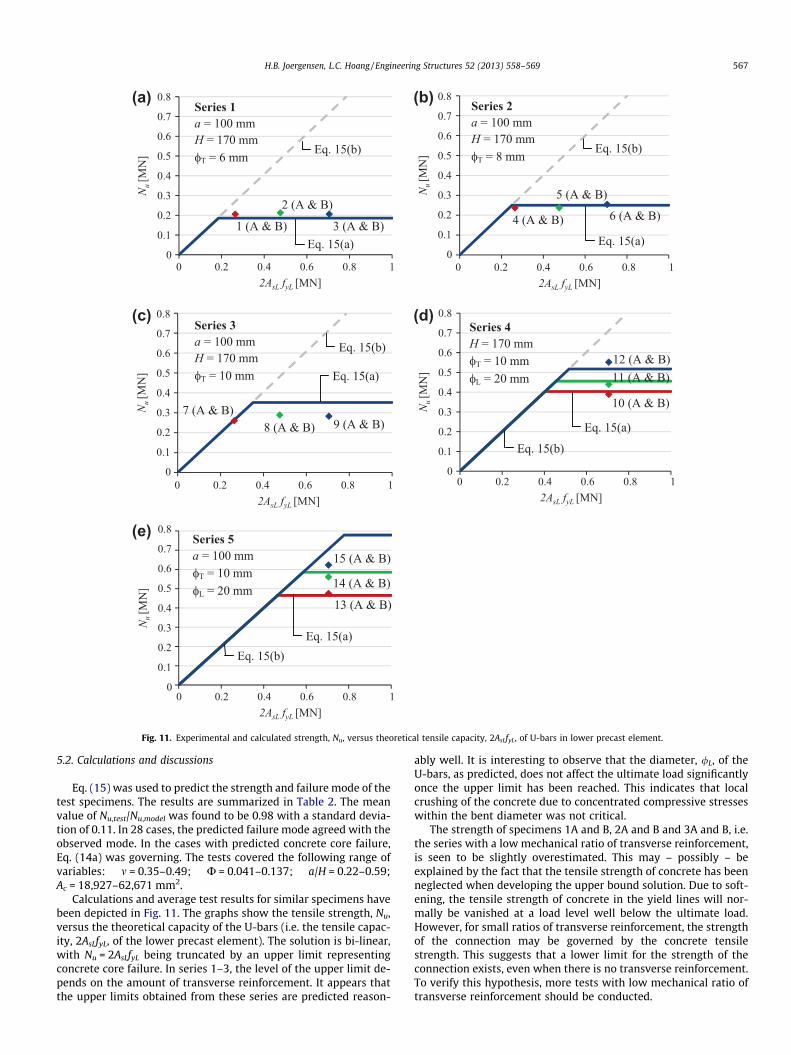
Eq. (15) was used to predict the strength and failure mode of thetest specimens. The results are summarized in Table 2. The meanvalue of Nu,test/Nu,model was found to be 0.98 with a standard devia-tion of 0.11. In 28 cases, the predicted failure mode agreed with theobserved mode. In the cases with predicted concrete core failure,Eq. (14a) was governing. The tests covered the following range ofvariables: m = 0.35–0.49; U = 0.041–0.137; a/H = 0.22–0.59;Ac = 18,927–62,671 mm2.
Calculations and average test results for similar specimens havebeen depicted in Fig. 11. The graphs show the tensile strength, Nu,versus the theoretical capacity of the U-bars (i.e. the tensile capac-ity, 2AsLfyL, of the lower precast element). The solution is bi-linear,with Nu = 2AsLfyL being truncated by an upper limit representingconcrete core failure. In series 1–3, the level of the upper limit de-pends on the amount of transverse reinforcement. It appears thatthe upper limits obtained from these series are predicted reason-
ably well. It is interesting to observe that the diameter, /L, of theU-bars, as predicted, does not affect the ultimate load significantlyonce the upper limit has been reached. This indicates that localcrushing of the concrete due to concentrated compressive stresseswithin the bent diameter was not critical.
The strength of specimens 1A and B, 2A and B and 3A and B, i.e.the series with a low mechanical ratio of transverse reinforcement,is seen to be slightly overestimated. This may – possibly – beexplained by the fact that the tensile strength of concrete has beenneglected when developing the upper bound solution. Due to soft-ening, the tensile strength of concrete in the yield lines will nor-mally be vanished at a load level well below the ultimate load.However, for small ratios of transverse reinforcement, the strengthof the connection may be governed by the concrete tensilestrength. This suggests that a lower limit for the strength of theconnection exists, even when there is no transverse reinforcement.To verify this hypothesis, more tests with low mechanical ratio oftransverse reinforcement should be conducted.
(a) (b)
Fig. 12. Experimental and calculated strength, Nu, versus a/H-ratio.
568 H.B. Joergensen, L.C. Hoang / Engineering Structures 52 (2013) 558–569
In graph (d) of Fig. 11, three upper limits have been showncorresponding to the variation of the parameter ‘‘a’’ in series 4.The same color (red, blue and green) has been assigned to corre-sponding test- and predicted results. It can be seen that the testsand the model display comparable tendencies as well as reason-able agreements.
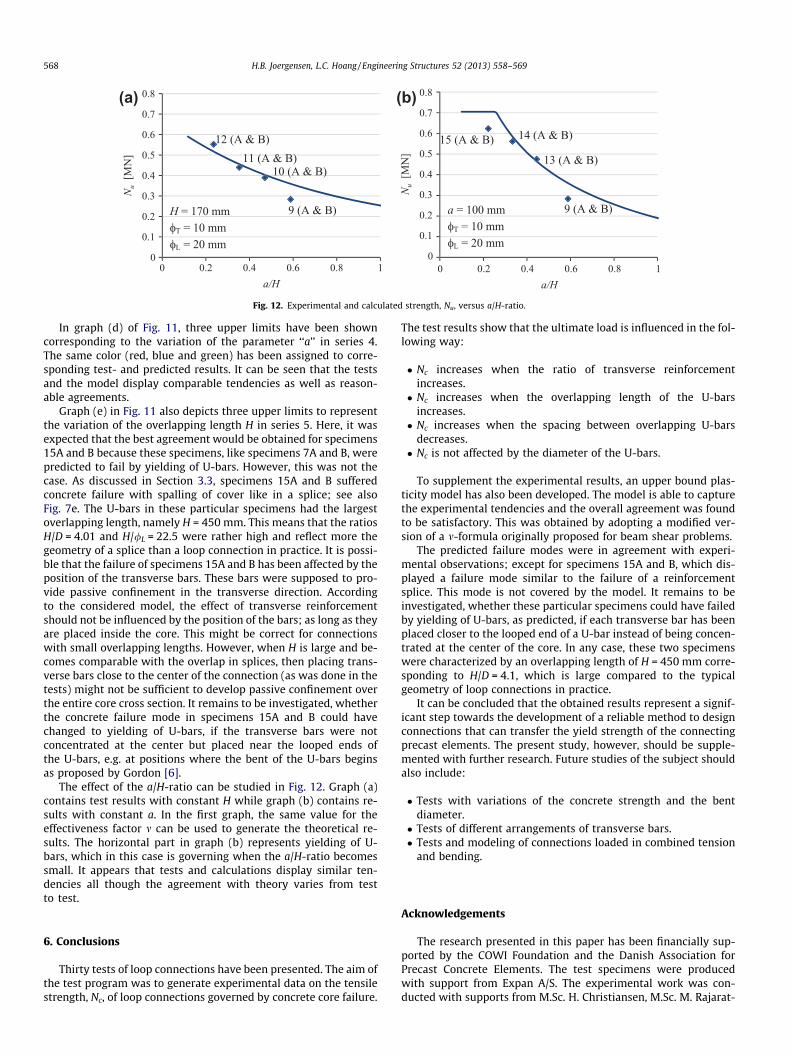
Graph (e) in Fig. 11 also depicts three upper limits to representthe variation of the overlapping length H in series 5. Here, it wasexpected that the best agreement would be obtained for specimens15A and B because these specimens, like specimens 7A and B, werepredicted to fail by yielding of U-bars. However, this was not thecase. As discussed in Section 3.3, specimens 15A and B sufferedconcrete failure with spalling of cover like in a splice; see alsoFig. 7e. The U-bars in these particular specimens had the largestoverlapping length, namely H = 450 mm. This means that the ratiosH/D = 4.01 and H//L = 22.5 were rather high and reflect more thegeometry of a splice than a loop connection in practice. It is possi-ble that the failure of specimens 15A and B has been affected by theposition of the transverse bars. These bars were supposed to pro-vide passive confinement in the transverse direction. Accordingto the considered model, the effect of transverse reinforcementshould not be influenced by the position of the bars; as long as theyare placed inside the core. This might be correct for connectionswith small overlapping lengths. However, when H is large and be-comes comparable with the overlap in splices, then placing trans-verse bars close to the center of the connection (as was done in thetests) might not be sufficient to develop passive confinement overthe entire core cross section. It remains to be investigated, whetherthe concrete failure mode in specimens 15A and B could havechanged to yielding of U-bars, if the transverse bars were notconcentrated at the center but placed near the looped ends ofthe U-bars, e.g. at positions where the bent of the U-bars beginsas proposed by Gordon [6].
The effect of the a/H-ratio can be studied in Fig. 12. Graph (a)contains test results with constant H while graph (b) contains re-sults with constant a. In the first graph, the same value for theeffectiveness factor m can be used to generate the theoretical re-sults. The horizontal part in graph (b) represents yielding of U-bars, which in this case is governing when the a/H-ratio becomessmall. It appears that tests and calculations display similar ten-dencies all though the agreement with theory varies from testto test.
6. Conclusions
Thirty tests of loop connections have been presented. The aim ofthe test program was to generate experimental data on the tensilestrength, Nc, of loop connections governed by concrete core failure.
The test results show that the ultimate load is influenced in the fol-lowing way:
� Nc increases when the ratio of transverse reinforcementincreases.� Nc increases when the overlapping length of the U-bars
increases.� Nc increases when the spacing between overlapping U-bars
decreases.� Nc is not affected by the diameter of the U-bars.
To supplement the experimental results, an upper bound plas-ticity model has also been developed. The model is able to capturethe experimental tendencies and the overall agreement was foundto be satisfactory. This was obtained by adopting a modified ver-sion of a m-formula originally proposed for beam shear problems.
The predicted failure modes were in agreement with experi-mental observations; except for specimens 15A and B, which dis-played a failure mode similar to the failure of a reinforcementsplice. This mode is not covered by the model. It remains to beinvestigated, whether these particular specimens could have failedby yielding of U-bars, as predicted, if each transverse bar has beenplaced closer to the looped end of a U-bar instead of being concen-trated at the center of the core. In any case, these two specimenswere characterized by an overlapping length of H = 450 mm corre-sponding to H/D = 4.1, which is large compared to the typicalgeometry of loop connections in practice.
It can be concluded that the obtained results represent a signif-icant step towards the development of a reliable method to designconnections that can transfer the yield strength of the connectingprecast elements. The present study, however, should be supple-mented with further research. Future studies of the subject shouldalso include:
� Tests with variations of the concrete strength and the bentdiameter.� Tests of different arrangements of transverse bars.� Tests and modeling of connections loaded in combined tension
and bending.
Acknowledgements
The research presented in this paper has been financially sup-ported by the COWI Foundation and the Danish Association forPrecast Concrete Elements. The test specimens were producedwith support from Expan A/S. The experimental work was con-ducted with supports from M.Sc. H. Christiansen, M.Sc. M. Rajarat-
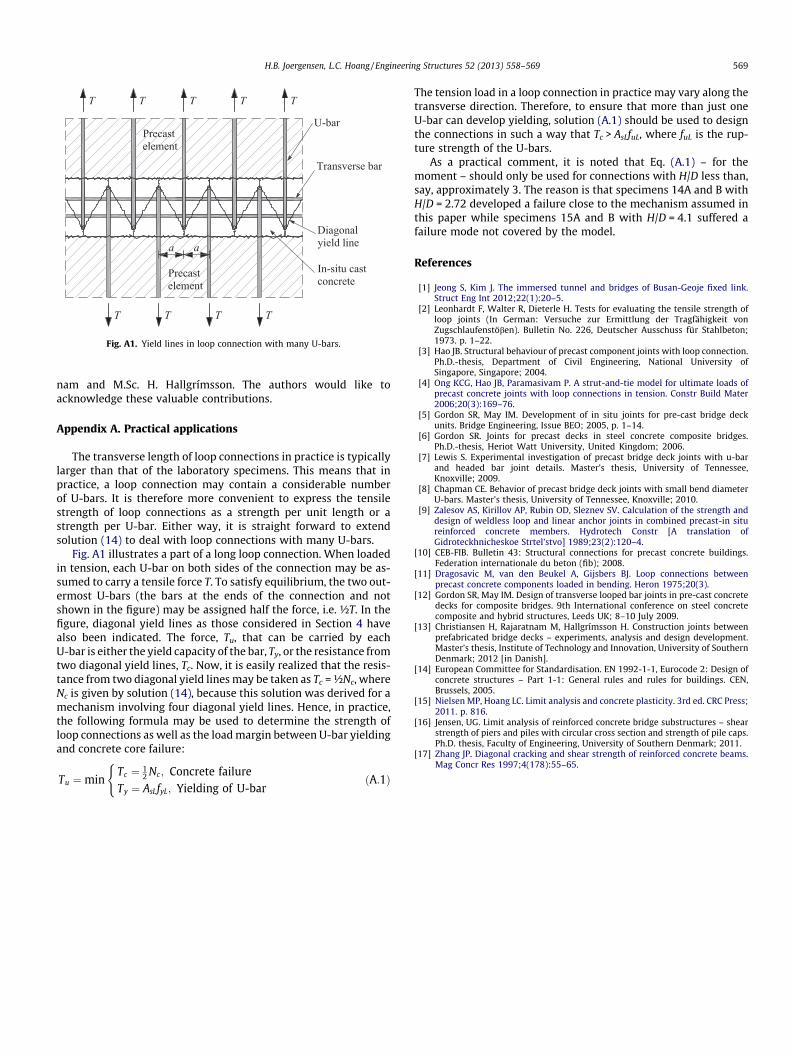
Fig. A1. Yield lines in loop connection with many U-bars.
H.B. Joergensen, L.C. Hoang / Engineering Structures 52 (2013) 558–569 569
nam and M.Sc. H. Hallgrímsson. The authors would like toacknowledge these valuable contributions.
Appendix A. Practical applications
The transverse length of loop connections in practice is typicallylarger than that of the laboratory specimens. This means that inpractice, a loop connection may contain a considerable numberof U-bars. It is therefore more convenient to express the tensilestrength of loop connections as a strength per unit length or astrength per U-bar. Either way, it is straight forward to extendsolution (14) to deal with loop connections with many U-bars.
Fig. A1 illustrates a part of a long loop connection. When loadedin tension, each U-bar on both sides of the connection may be as-sumed to carry a tensile force T. To satisfy equilibrium, the two out-ermost U-bars (the bars at the ends of the connection and notshown in the figure) may be assigned half the force, i.e. ½T. In thefigure, diagonal yield lines as those considered in Section 4 havealso been indicated. The force, Tu, that can be carried by eachU-bar is either the yield capacity of the bar, Ty, or the resistance fromtwo diagonal yield lines, Tc. Now, it is easily realized that the resis-tance from two diagonal yield lines may be taken as Tc = ½Nc, whereNc is given by solution (14), because this solution was derived for amechanism involving four diagonal yield lines. Hence, in practice,the following formula may be used to determine the strength ofloop connections as well as the load margin between U-bar yieldingand concrete core failure:
Tu ¼minTc ¼ 1
2 Nc; Concrete failureTy ¼ AsLfyL; Yielding of U-bar
(ðA:1Þ
The tension load in a loop connection in practice may vary along thetransverse direction. Therefore, to ensure that more than just oneU-bar can develop yielding, solution (A.1) should be used to designthe connections in such a way that Tc > AsLfuL, where fuL is the rup-ture strength of the U-bars.
As a practical comment, it is noted that Eq. (A.1) – for themoment – should only be used for connections with H/D less than,say, approximately 3. The reason is that specimens 14A and B withH/D = 2.72 developed a failure close to the mechanism assumed inthis paper while specimens 15A and B with H/D = 4.1 suffered afailure mode not covered by the model.
References
[1] Jeong S, Kim J. The immersed tunnel and bridges of Busan-Geoje fixed link.Struct Eng Int 2012;22(1):20–5.
[2] Leonhardt F, Walter R, Dieterle H. Tests for evaluating the tensile strength ofloop joints (In German: Versuche zur Ermittlung der Tragfähigkeit vonZugschlaufenstöben). Bulletin No. 226, Deutscher Ausschuss für Stahlbeton;1973. p. 1–22.
[3] Hao JB. Structural behaviour of precast component joints with loop connection.Ph.D.-thesis, Department of Civil Engineering, National University ofSingapore, Singapore; 2004.
[4] Ong KCG, Hao JB, Paramasivam P. A strut-and-tie model for ultimate loads ofprecast concrete joints with loop connections in tension. Constr Build Mater2006;20(3):169–76.
[5] Gordon SR, May IM. Development of in situ joints for pre-cast bridge deckunits. Bridge Engineering, Issue BEO; 2005, p. 1–14.
[6] Gordon SR. Joints for precast decks in steel concrete composite bridges.Ph.D.-thesis, Heriot Watt University, United Kingdom; 2006.
[7] Lewis S. Experimental investigation of precast bridge deck joints with u-barand headed bar joint details. Master’s thesis, University of Tennessee,Knoxville; 2009.
[8] Chapman CE. Behavior of precast bridge deck joints with small bend diameterU-bars. Master’s thesis, University of Tennessee, Knoxville; 2010.
[9] Zalesov AS, Kirillov AP, Rubin OD, Sleznev SV. Calculation of the strength anddesign of weldless loop and linear anchor joints in combined precast-in situreinforced concrete members. Hydrotech Constr [A translation ofGidroteckhnicheskoe Strtel’stvo] 1989;23(2):120–4.
[10] CEB-FIB. Bulletin 43: Structural connections for precast concrete buildings.Federation internationale du beton (fib); 2008.
[11] Dragosavic M, van den Beukel A, Gijsbers BJ. Loop connections betweenprecast concrete components loaded in bending. Heron 1975;20(3).
[12] Gordon SR, May IM. Design of transverse looped bar joints in pre-cast concretedecks for composite bridges. 9th International conference on steel concretecomposite and hybrid structures, Leeds UK; 8–10 July 2009.
[13] Christiansen H, Rajaratnam M, Hallgrímsson H. Construction joints betweenprefabricated bridge decks – experiments, analysis and design development.Master’s thesis, Institute of Technology and Innovation, University of SouthernDenmark; 2012 [in Danish].
[14] European Committee for Standardisation. EN 1992-1-1, Eurocode 2: Design ofconcrete structures – Part 1-1: General rules and rules for buildings. CEN,Brussels, 2005.
[15] Nielsen MP, Hoang LC. Limit analysis and concrete plasticity. 3rd ed. CRC Press;2011. p. 816.
[16] Jensen, UG. Limit analysis of reinforced concrete bridge substructures – shearstrength of piers and piles with circular cross section and strength of pile caps.Ph.D. thesis, Faculty of Engineering, University of Southern Denmark; 2011.
[17] Zhang JP. Diagonal cracking and shear strength of reinforced concrete beams.Mag Concr Res 1997;4(178):55–65.