Loaded Polymers for Solar Energy Conversion
84
Ultrafast Dynamics in Multifunctional Ru(II)-Loaded Polymers for Solar Energy Conversion Published as part of the Accounts of Chemical Research special issue “Ultrafast Excited-State Processes in Inorganic Systems”. Zachary A. Morseth, † Li Wang, † Egle Puodziukynaite, § Gyu Leem, § Alexander T. Gilligan, † Thomas J. Meyer, † Kirk S. Schanze, § John R. Reynolds, ‡ and John M. Papanikolas* ,† † Department of Chemistry, University of North Carolina at Chapel Hill, Chapel Hill, North Carolina 27599, United States ‡ School of Chemistry and Biochemistry, School of Materials Science and Engineering, Center for Organic Photonics and Electronics, Georgia Institute of Technology, Atlanta, Georgia 30332, United States § Department of Chemistry, Center for Macromolecular Science and Engineering, University of Florida, Gainesville, Florida 32611, United States CONSPECTUS: The use of sunlight to make chemical fuels (i.e., solar fuels) is an attractive approach in the quest to develop sustainable energy sources. Using nature as a guide, assemblies for artificial photosynthesis will need to perform multiple functions. They will need to be able to harvest light across a broad region of the solar spectrum, transport excited-state energy to charge- separation sites, and then transport and store redox equivalents for use in the catalytic reactions that produce chemical fuels. This multifunctional behavior will require the assimilation of multiple components into a single macromolecular system. A wide variety of different architectures including porphyrin arrays, peptides, dendrimers, and polymers have been explored, with each design posing unique challenges. Polymer assemblies are attractive due to their relative ease of production and facile synthetic modification. However, their disordered nature gives rise to stochastic dynamics not present in more ordered assemblies. The rational design of assemblies requires a detailed understanding of the energy and electron transfer events that follow light absorption, which can occur on time scales ranging from femtoseconds to hundreds of microseconds, necessitating the use of sophisticated techniques. We have used a combination of time-resolved absorption and emission spectroscopies with observation times that span 9 orders of magnitude to follow the excited-state evolution within polymer-based molecular assemblies. We complement experimental observations with molecular dynamics simulations to develop a microscopic view of these dynamics. This Account provides an overview of our work on polymers decorated with pendant Ru(II) chromophores, both in solution and on surfaces. We have examined site-to-site energy transport among the Ru(II) complexes, and in systems incorporating π- conjugated polymers, we have observed ultrafast formation of a long-lived charge-separated state. When attached to TiO 2 , these assemblies exhibit multifunctional behavior in which photon absorption is followed by energy transport to the surface and electron injection to produce an oxidized metal complex. The oxidizing equivalent is then transferred to the conjugated polymer, giving rise to a long-lived charge-separated state. ■ INTRODUCTION Multifunctional molecular and macromolecular assemblies that are able to harvest light, separate charge, and utilize the resulting redox equivalents to drive solar fuels reactions are an integral component in many artificial photosynthetic strat- egies. 1,2 Multifunctional behavior is achieved through a combination of fundamental energy and electron transfer events. While both of these processes have been extensively characterized in simple, well-defined systems consisting of only a few (often only two) molecular components, the structural complexity arising from the integration of multiple components leads to dynamical phenomena that are not found in dyads and triads. Thus, functionality in artificial assemblies cannot be understood through studies of individual components or small model systems. The characterization of dynamical phenomena (e.g., charge and energy migration) in large polymer-based assemblies is a challenging problem. Transport phenomena, for example, depend upon the macromolecular structure, which in turn depends upon the polymer support and the chemical structure of the monomer. The spatial relationship of the monomer’s excited-state wave function to other assembly components, rigidity of the polymer, solvent polarity, and the nature of the counterion can influence the structure and affect the exciton dynamics. In large macromolecular systems, 3−13 the separation between adjacent components is described not by a single distance but rather by a distribution of distances that, in turn, Received: October 16, 2014 Article pubs.acs.org/accounts © XXXX American Chemical Society A DOI: 10.1021/ar500382u Acc. Chem. Res. XXXX, XXX, XXX−XXX
-
Upload
khangminh22 -
Category
Documents
-
view
2 -
download
0
Transcript of Loaded Polymers for Solar Energy Conversion

Ultrafast Dynamics in Multifunctional Ru(II)-Loaded Polymers forSolar Energy ConversionPublished as part of the Accounts of Chemical Research special issue “Ultrafast Excited-State Processes inInorganic Systems”.
Zachary A. Morseth,† Li Wang,† Egle Puodziukynaite,§ Gyu Leem,§ Alexander T. Gilligan,†
Thomas J. Meyer,† Kirk S. Schanze,§ John R. Reynolds,‡ and John M. Papanikolas*,†
†Department of Chemistry, University of North Carolina at Chapel Hill, Chapel Hill, North Carolina 27599, United States‡School of Chemistry and Biochemistry, School of Materials Science and Engineering, Center for Organic Photonics and Electronics,Georgia Institute of Technology, Atlanta, Georgia 30332, United States§Department of Chemistry, Center for Macromolecular Science and Engineering, University of Florida, Gainesville, Florida 32611,United States
CONSPECTUS: The use of sunlight to make chemical fuels (i.e., solar fuels) is an attractiveapproach in the quest to develop sustainable energy sources. Using nature as a guide, assembliesfor artificial photosynthesis will need to perform multiple functions. They will need to be able toharvest light across a broad region of the solar spectrum, transport excited-state energy to charge-separation sites, and then transport and store redox equivalents for use in the catalytic reactionsthat produce chemical fuels. This multifunctional behavior will require the assimilation of multiplecomponents into a single macromolecular system.A wide variety of different architectures including porphyrin arrays, peptides, dendrimers, andpolymers have been explored, with each design posing unique challenges. Polymer assemblies areattractive due to their relative ease of production and facile synthetic modification. However, theirdisordered nature gives rise to stochastic dynamics not present in more ordered assemblies. Therational design of assemblies requires a detailed understanding of the energy and electron transferevents that follow light absorption, which can occur on time scales ranging from femtoseconds tohundreds of microseconds, necessitating the use of sophisticated techniques. We have used a combination of time-resolvedabsorption and emission spectroscopies with observation times that span 9 orders of magnitude to follow the excited-stateevolution within polymer-based molecular assemblies. We complement experimental observations with molecular dynamicssimulations to develop a microscopic view of these dynamics.This Account provides an overview of our work on polymers decorated with pendant Ru(II) chromophores, both in solution andon surfaces. We have examined site-to-site energy transport among the Ru(II) complexes, and in systems incorporating π-conjugated polymers, we have observed ultrafast formation of a long-lived charge-separated state. When attached to TiO2, theseassemblies exhibit multifunctional behavior in which photon absorption is followed by energy transport to the surface andelectron injection to produce an oxidized metal complex. The oxidizing equivalent is then transferred to the conjugated polymer,giving rise to a long-lived charge-separated state.
■ INTRODUCTION
Multifunctional molecular and macromolecular assemblies thatare able to harvest light, separate charge, and utilize theresulting redox equivalents to drive solar fuels reactions are anintegral component in many artificial photosynthetic strat-egies.1,2 Multifunctional behavior is achieved through acombination of fundamental energy and electron transferevents. While both of these processes have been extensivelycharacterized in simple, well-defined systems consisting of onlya few (often only two) molecular components, the structuralcomplexity arising from the integration of multiple componentsleads to dynamical phenomena that are not found in dyads andtriads. Thus, functionality in artificial assemblies cannot beunderstood through studies of individual components or smallmodel systems.
The characterization of dynamical phenomena (e.g., chargeand energy migration) in large polymer-based assemblies is achallenging problem. Transport phenomena, for example,depend upon the macromolecular structure, which in turndepends upon the polymer support and the chemical structureof the monomer. The spatial relationship of the monomer’sexcited-state wave function to other assembly components,rigidity of the polymer, solvent polarity, and the nature of thecounterion can influence the structure and affect the excitondynamics. In large macromolecular systems,3−13 the separationbetween adjacent components is described not by a singledistance but rather by a distribution of distances that, in turn,
Received: October 16, 2014
Article
pubs.acs.org/accounts
© XXXX American Chemical Society A DOI: 10.1021/ar500382uAcc. Chem. Res. XXXX, XXX, XXX−XXX

results in a distribution of electron and energy transfer rates.Furthermore, the presence of flexible linkages can give rise tolarge-scale conformational motions that can occur on timescales similar to the transfer rates,14 leading to rate constantsthat may be more influenced by molecular motions than thequantities normally associated with electron and energytransfer, including electronic couplings, reorganization energies,and driving forces.15 Thus, even the relatively simple process ofsite-to-site energy transport will exhibit highly nonexponentialkinetics, and disentangling contributions from the variousdynamical phenomena can oftentimes only be accomplishedthrough the use of sophisticated simulations and modeling toextract intrinsic rates from experimental data.In this Account, we focus on the ultrafast dynamics of
polymeric assemblies consisting of multiple Ru(II) polypyridylcomplexes linked together by a polymer backbone (Figure 1).We have used a combination of ultrafast spectroscopic methodsand computer simulation (Monte Carlo and moleculardynamics) to characterize the fundamental photophysicalprocesses that take place on time scales ranging from severalhundred femtoseconds to hundreds of microseconds. Earlywork from our laboratory focused on light-harvestingassemblies utilizing poly(styrene) (PS) as the scaffold.4,16−19
The electronic states of the polymer lie at higher energy, and asa result, visible excitation occurs at the pendant metal
complexes. The PS serves only a structural function, holdingthe metal complexes in close proximity to one another tofacilitate excited-state transport. More recent work has exploredassemblies based on π-conjugated polymers.20−22 Here, notonly does the polymer serves as a structural support, butbecause of its strongly allowed π → π* transitions, it can alsofunction as a secondary light-absorbing component.Excitation of the polymer results in either energy transfer to
the pendants or electron transfer from the polymer to one ofthe pendant metal complexes, producing a charge-separatedstate that persists from nanoseconds to microseconds. Multi-functional behavior is readily apparent in PF-Ru assembliesattached to TiO2. With the use of transient absorptionspectroscopy across a broad range of time scales, we observelight harvesting by the pendant complexes, charge separation atthe interface, and transfer of the oxidative equivalents to thebackbone, resulting in a charge-separated state that persists forseveral hundreds of microseconds.
■ POLYMER STRUCTURES
The fundamental photophysical processes of energy andelectron transfer that take place in these complex assembliesdepend on the separation and relative orientation of theindividual components. The macromolecular structure isdetermined by a number of factors, including the torsional
Figure 1. Chemical structures of polymer assemblies consisting of either saturated (PS-Ru) or π-conjugated backbones (PF-Ru, PFT-Ru, PF2T-Ru,and PT-Ru). The variable n refers to the average length of the polymer backbones.
Accounts of Chemical Research Article
DOI: 10.1021/ar500382uAcc. Chem. Res. XXXX, XXX, XXX−XXX
B

Figure 2. Condensed phase polymer assembly structures obtained from molecular dynamics simulations. Structures were calculated using periodicboundary conditions in the presence of explicit acetonitrile solvent and PF6
− counterions. The polymer scaffold is shown in green color, and the Ruatoms are depicted as orange spheres with enlarged diameters. A portion of the solvent is shown in the PF-Ru16 structure.
Figure 3. (left) Time resolved emission monitoring Os(II) photoluminescence in PS-Ru17Os3 and PF-Ru60Os10. (right) Illustration of site-to-siteenergy transport within a subsection of PS-Ru17Os3 (upper) and PF-Ru60Os10 (lower). The initial Ru excited state (blue) undergoes energy transferto adjacent Ru complexes and is ultimately transferred to the Os trap (red).
Accounts of Chemical Research Article
DOI: 10.1021/ar500382uAcc. Chem. Res. XXXX, XXX, XXX−XXX
C

flexibility of the backbone, the size and spacing of the pendantgroups, the length of the side chains, and the solvent, whichvary among the five different assemblies shown in Figure 1. InPS-Ru, for example, each repeat unit of the polymer scaffold isfunctionalized by a metal complex that is connected to thebackbone by a short side chain (Figure 2). This densechromophore loading combined with the flexible nature of thepoly(styrene) causes significant twisting of the polymerbackbone in order to accommodate the large pendant metalcomplexes. Monte Carlo and molecular dynamics simulationsindicate that the structure is close-packed, with each complexlying within 2−3 Å of its neighbors.4 Whereas the macro-molecular structure of the PS-Ru system is determinedprimarily by steric considerations and packing, the poly-(fluorene)-Ru (PF-Ru) and poly(thiophene)-Ru (PT-Ru)structures are more heavily influenced by intramolecular andintermolecular forces (Figure 2). The conjugated π-networkpresent in PF and PT reduces the torsional flexibility of thescaffold, resulting in more extended structures, and thiscombined with the significantly longer side chains leads tolarger average separations between adjacent complexescompared with PS-Ru. Solvent can also play a significant role,particularly in the more open PF-Ru and PT-Ru systems. Polarsolvents have favorable interactions with the pendantcomplexes but not the polymer backbone, and as a result theassembly may adopt a structure where the side chains extendout into the solvent or one in which the metal complexes takepositions near the polymer to shield it from the more polarenvironment.
■ SITE-TO-SITE ENERGY TRANSPORTSite-to-site energy migration is initiated through metal-to-ligandcharge transfer (MLCT) excitation of one of the pendantRu(II) complexes. The singlet MLCT state decays rapidly intoa long-lived triplet MLCT, whose lifetime can extend fromhundreds of nanoseconds to microseconds.23 Because of theclose proximity of the neighboring complexes, Ru* excitationmigrates along the chain in a random-walk like fashion througha series of isoenergetic triplet−triplet (i.e., Dexter) energytransfer events between adjacent complexes. Energy transport isobserved by replacing a small fraction of the Ru sites withOs(II) complexes, that is, PS-Ru17Os3 and PF-Ru60Os10.Because the Os sites have a lower energy excited state, theyserve as traps that terminate the site-to-site random walk.4,16−18
Thus, photoexcitation of the Ru sites is followed by a delayedrise in the Os* emission, which is a clear signature of thetransport of excited-state energy to the Os traps (Figure 3).(Note that the instantaneous rise in the emission intensity at t= 0 is not the result of Ru* → Os energy transfer, but ratherreflects a combination of emission resulting from both directexcitation of the Os sites and weak Ru emission that is alsodetected at the monitored wavelength, ∼780 nm).The energy transport process includes a series of Ru* → Ru
hops followed by a terminating Ru* → Os energy transferevent. The growth in the Os* emission reflects the total timefor this process and thus reflects both the hopping time (τ) andthe number of hops needed to reach the trap. The latterdepends upon the fraction of Os sites; the greater the Osloading, the fewer the number of hops needed and the fasterthe rise in the photoluminescence intensity. Thus, while thegrowth indicates the presence of energy transport, the rise timeitself is not a direct measure of the intrinsic Ru* → Ru hoppingtime.
Stochastic kinetic simulations provide a means of extractingthe microscopic details of energy transport from theexperimental data. The first step involves determining themacromolecular structure of the assembly using Monte Carlosimulation methods.4 A structure is selected from the ensemble,and each site is assigned to be Ru or Os according to theloading statistics. One of the Ru sites is selected as the initiallocation of the excited state and energy transfer rate constants(kEnT) are calculated to its nearest neighbors using a Dexterformalism, that is, kEnT(R) = k0 exp(−βR), where R is theseparation between sites, k0 is the rate constant at closestcontact, and β is an attenuation parameter that determines thefalloff of the electronic coupling with distance.15 Because thechemical linkage connecting adjacent complexes contains asignificant number of saturated carbons, the electronic couplingbetween sites arises primarily from direct orbital overlapbetween the donor and acceptor complexes. In this limit, β is∼1−2 Å−1, making energy transfer extremely short-range.Energy migration “trajectories” are propagated using a
stochastic kinetic algorithm. The simulation averages manytrajectories, each obtained by sampling different structures andloading configurations, to produce an output that is “fit” to theexperimental data in an ad hoc fashion.24 The simulations ofenergy transport in the PS-Ru17Os3 assembly reveals adistribution of hopping times (τavg = 1−3 ns) with a broaddistribution in the number of hops needed to reach the Os trap.The wide variation in the number of hops needed to reach an
Os site is (in part) a reflection of the significant chain-to-chainvariation in the Os loading. The fraction of Os sites in PS-Ru17Os3 is 15%, but this represents an average of the entireensemble of chains. We estimate that only a quarter of thechains have three Os complexes, while many (∼20%) have onlyone or none, and about 10% have six or more. For chains with alarge fraction of Os sites, the number of hops needed to reachthe trap may be as small as 2−3, but for chains with only asingle Os site it may take tens or even hundreds of hops. Thepresence of migration trajectories with a large number of Ru*→ Ru hops is suggested by the persistence of sensitized Osemission 200−400 ns after excitation, well beyond the ∼50 nsexcited-state lifetime of the Os complex (Figure 3).The energy transfer times observed in the PS-Ru17Os3
assembly (1−3 ns) are long compared with singlet−singlet(i.e., Forster) energy transfer times observed in manysystems.25−27 Despite the slower energy transfer time, thetransport of the excited state to the Os trap sites is extremelyefficient. We estimate that about 95% of the Ru* excited statescreated on polymer chains with at least one Os complex areeventually transported to a trap site. The high transportefficiency in the PS-Ru assembly stems in part from the densepacking of the metal complexes, which ensures that a Ru*excited state is always in close contact with one of its neighbors.While this dense packing is important, the long lifetime of theRu* excited state (∼1 μs) also plays a role. Thus, even thoughthe energy transfer time is long (1−3 ns), it is fast comparedwith the Ru* lifetime, suggesting that the efficiency of a singleenergy transfer step is greater than 99.7%.Transient photoluminescence data collected from the PF-
Ru60Os10 assembly also exhibits the delayed rise in the Os*emission that is characteristic of site-to-site transport (Figure3). Compared with PS-Ru17Os3, the slower rise is suggestive ofa longer time scale for energy transport. While we have not yetperformed Monte Carlo simulations on this system, analysis ofthe emission spectra suggests ∼80% of the Ru* excited states
Accounts of Chemical Research Article
DOI: 10.1021/ar500382uAcc. Chem. Res. XXXX, XXX, XXX−XXX
D

produced by photoexcitation are transferred to one of the Ossites. This relatively high efficiency is remarkable, especiallygiven the low packing density of the metal complexes comparedwith PS-Ru17Os3 (Figure 3) and the close contact needed fortriplet−triplet energy transfer. The high efficiency observed inthe PF-Ru60Os10 assembly may be an indication that energytransport is facilitated by the conformational fluctuations thatbring two complexes into close proximity where the short-rangetriplet−triplet energy transfer is possible. If this is the case, thenone would anticipate that solvent viscosity could have adramatic effect on the dynamical behavior when thechromophore density gives rise to large separations betweencomplexes.Conformational flexibility may not only help overcome the
limitations of short triplet−triplet energy transfer distances butalso mitigate effects of energetic disorder. The highly chargednature of the polymer and corresponding counterions gives riseto a heterogeneous electrostatic environment that lifts thedegeneracy of neighboring sites. The lower energy sites act asshallow traps that impede energy transport. In fluid solution,like the examples discussed above, conformational motion is
constantly changing this environment, and the effects ofenergetic disorder are masked. When polymer assemblies aredispersed in rigid matrices, this conformational motion is frozenout on the time scale of energy hopping. As a result, energytransfer is biased toward lower energy, and once the lowestenergy sites are reached, transport of the excited state slowsconsiderably.28 Transient photoluminescence experimentsperformed on assemblies embedded in rigid environmentsshow evidence of the loss of conformational flexibility. Whereasemission spectra in fluid solution show little (or no) time-dependent shift in the band position, experiments on PS-Os20exhibit a clear red shift in the emission band with increasingtime after excitation that results from this energetic disorder.17
The exploitation of conformational flexibility could be apowerful design concept in the development of multifunctionalassemblies.
■ COMPETITIVE CHARGE SEPARATION ANDENERGY TRANSFER
In assemblies utilizing π-conjugated polymers, photoexcitationof delocalized π → π* transitions in the visible gives rise to
Figure 4. Condensed phase structure of a 40-repeat unit PF in explicit acetonitrile solvent obtained from molecular dynamics simulations. Most ofthe solvent is omitted for clarity, but a portion is shown for scale. The conformational subunits are colored based on the energy level with darkershades indicating subunits with shorter lengths and hence higher energies. The enlarged section shows a zoomed-in view of adjacent conformationalsubunits with a conjugation break.
Figure 5. (left) Illustration of excitonic energy transfer (top) and excited-state self-trapping by torsional relaxation (bottom) along a π-conjugatedpolymer backbone following excitation into a high-energy conformational subunit. (right) Transient absorption difference spectra ofunfunctionalized PF (upper) and PT (lower) from 300 fs to 1.4 ns following 388 nm excitation.
Accounts of Chemical Research Article
DOI: 10.1021/ar500382uAcc. Chem. Res. XXXX, XXX, XXX−XXX
E

additional dynamical phenomena. The excited-state dynamicsof conjugated polymers have been studied extensively, both insolution and as thin films.29−33 Conformational disorder breaksup the conjugation along the backbone as a result of relativelylow energy barriers for bond rotations between subunits,resulting in a chain of linked chromophores of varyingconjugation lengths,34,35 as depicted in the PF structure inFigure 4. The final structure is an energetic compromisebetween the entropic gain associated with producing adisordered structure and the energetic destabilization thatoccurs upon breaking the conjugation. The broad absorbancespectrum of the solvated polymer is a manifestation of thisdisorder, with longer conjugation lengths contributing to thered edge of the spectrum and shorter to the blue.33
Photoexcitation of PF and PT polymers results in a rich setof dynamical phenomena. On very short time scales (<100 fs),coupling of the excitation to small-scale torsional motionscauses rapid relaxation and localization of the exciton onto asmall number of monomer units.31,36 Transient spectraobtained on longer time scales from PF and PT (i.e.,unfunctionalized) chains in solution are dominated by a seriesof negative-amplitude features in the blue that arise from acombination of ground-state bleach and stimulated emission, aswell as a low-energy absorption associated with the singletexcited state of the polymer (Figure 5). The stimulatedemission bands decay in amplitude (due to excited-staterelaxation) and shift to lower energy with increasing time. Thered shift is indicative of torsional relaxation or excitonmigration.31,33,37,38 In PF, the stimulated emission shifts a fewnanometers over several hundreds of picoseconds, due to acombination of large-scale conformational rearrangements andintrachain energy transfer to lower energy sites (Figure 5).31,32
In PT, the spectral changes are much more extensive, reflectingslow torsional relaxation that results in large-scale planarizationof the backbone, such that by 100 ps, the fully relaxed excitons
are formed. It has been previously shown that additionalexciton stabilization is achieved through the presence ofstrongly coupled low-frequency torsional degrees of freedom,39
which is consistent with the greater spectral evolution (Stokesshift) observed in PT compared with PF. In both PF and PT,the exciton decays through either emission or intersystemcrossing to form longer-lived triplet excitons.30,31
The transient spectra obtained from PF-Ru followingexcitation of the PF backbone are dramatically altered by thepresence of the pendant Ru complexes (Figure 6). Thestimulated emission feature observed at early times resemblesthat seen in PF, but in PF-Ru it is quenched within severalpicoseconds. The transient spectra are also qualitativelydifferent. Whereas in PF the stimulated emission shiftscontinuously to the red, in PF-Ru this band initially shifts tothe red, but after a few picoseconds shifts back to higher energy.This behavior is the result of PF* quenching through acombination of energy and electron transfer mechanisms.Energy transfer to give a singlet Ru excited state (i.e., 1PF* +Ru2+ → PF + 1Ru2+*) occurs with a time constant of 450 fs,accounting for ∼85% of the PF* quenching events in PF-Ru,while electron transfer to produce a charge-separated state (i.e.,1PF* + Ru2+ → PF+ + Ru1+) takes place on a slower time scale,τ = 1.5 ps. In PF-Ru, the apparent blue shift of the stimulatedemission is due to the formation of PF+.Assemblies incorporating PT, as well as scaffolds with mixed
thiophene and fluorene content, PFT and PF2T (Figure 1),also show competitive energy and electron transfer. Like PF-Ru,all of these assemblies exhibit negative-going stimulatedemission features that are quenched in the presence of thependant Ru(II) complexes. Analysis of the quenching kineticsreveals that the electron transfer time across this series ofpolymers is relatively constant, varying between 1 and 2 ps(Figure 6).20−22 The energy transfer times, on the other hand,increase with greater thiophene content, and as a result, the
Figure 6. (left, top) Transient absorption difference spectra following primary excitation of the polymer backbone at 388 nm for PF-Ru (upper left)and PT-Ru (upper right). (left, bottom) Ru(II) absorbance (εA(λ)) and normalized (to unit area) polymer emission spectra (FD(λ)). The shadedgray area reflects the integrand, FD(λ)εA(λ)λ
4, which is scaled for clarity. (right) Kinetic traces of the polymer assemblies showing the initial polymerexcited-state quenching during the first 20 ps following excitation.
Accounts of Chemical Research Article
DOI: 10.1021/ar500382uAcc. Chem. Res. XXXX, XXX, XXX−XXX
F

fraction of polymer excited states that decay through the energytransfer pathway also decreases across the series (Table 1).
The trend in energy transfer rates across the polymer seriescan be understood in terms of the absorption and emissionproperties of assemblies. The rate constant for resonant energytransfer (RET) between a donor (D) and acceptor (A)separated by a distance R is given by
τ τ= ⎜ ⎟⎛
⎝⎞⎠
RR
1 1
RET D
06
(1)
where τD is the excited-state lifetime of the donor and R0 is theForster distance, the distance at which energy transfer is 50%efficient. The Forster distance can be estimated fromindependent spectroscopic measurements of the donor andacceptor according to
∫κ λ λ λ λ= Φ ε∞
R A F ( ) ( ) d06
D2
0D A
4(2)
where ΦD is the quantum yield of the donor in the absence ofthe acceptor and κ is a factor describing the relative orientations
of the donor and acceptor. The constant A is given by A =9000(ln 10)/(128π5n4NA), where n is the refractive index andNA is Avogadro’s number. The integral in eq 2 describes theproduct of the emission spectrum of the donor normalized tounity area and the absorption spectrum of the acceptor, asillustrated in Figure 6.The large energy transfer rate constant observed in the PF-
Ru assembly results from the significant spectral overlapbetween the PF emission and the Ru absorption (Figure 6) andlarge quantum yield of PF*. The decrease in the energy transferrate across the series is attributed to a systematic shift in theemission spectrum to lower energy with increasing thiophenecontent, which results in an overall decrease in the overlapbetween the donor emission and acceptor absorption, as well asa decrease in the quantum yield of the polymer (ΦD). Energytransfer rates predicted using eq 1 are in good agreement withthe experimentally observed values (Table 1).20−22
The lifetime of the charge-separated state produced byelectron transfer also depends upon the polymer backbone.While the charge-separated state in PF-Ru undergoesrecombination (i.e., back electron transfer) to reform theground state with τ = 6 ns, in PT-Ru, it decays with τ ≈ 20 μs.The dramatic difference between these two assemblies may be aconsequence of the high hole mobility of the PT polymerbackbone,40 which could quickly and efficiently separate theelectron and the hole.
■ MULTIFUNCTIONAL BEHAVIOR
The eventual utilization of molecular assemblies in artificialphotosynthetic applications will require that they performmultiple functions, including light harvesting and chargeseparation, as well as storage and transport of redox equivalentsto catalytic sites. Multifunctional behavior is observed in theexcited-state photophysics of PF-Ru assemblies anchored toTiO2 through carboxylate groups placed on ∼30% of the Ru
Table 1. Energy and Electron Transfer Data for π-Conjugated Polymer Assemblies with Pendant Ru(II)Chromophores
energy transfer electron transfer
assembly
energytransfer/electron
transfer ratio τ (ps)τRET(ps)
τ(ps)
−ΔG°(eV) λ (eV)
PF-Ru 85:15 0.45 0.45 1.5 0.72 ↑PFT-Ru 75:25 0.7 1.2 2.0 0.45 0.50−0.75PF2T-Ru
25:75 4.8 4.0 1.8 0.46
PT-Ru 15:85 8.1 10.0 1.1 0.50 ↓
Figure 7. (left) Transient absorption difference spectra of a PF-Ru-loaded TiO2 film following excitation at 450 nm from 1 ps to 100 μs. The 10 and100 μs spectra have been scaled for clarity, while regions containing scatter from the 450 nm pump have been marked with a dashed line. (upperright) Illustration of the initial dynamic processes occurring following the excitation of the Ru(II) pendants within the PF-Ru assembly attached tothe surface of a TiO2 nanoparticle. (lower right) Combined kinetics traces from 200 fs to 150 μs for the PF-Ru assembly (red) at 400, 480, and 580nm and the Ru-model (black) at 385 nm.
Accounts of Chemical Research Article
DOI: 10.1021/ar500382uAcc. Chem. Res. XXXX, XXX, XXX−XXX
G

complexes.41 The result is a composite structure, in which theassembly is attached to the surface through a few complexeswhile the remaining chromophores serve as antennas for lightabsorption and excited-state transport.The photophysics of this assembly on TiO2 were studied
across 9 decades of time using transient absorption spectros-copy. Photoexcitation of surface-bound Ru(II) sites results inprompt electron injection into the TiO2, producing a Ru(III)species. The electron injection process is observed bymonitoring the loss of the bipyridine radical anion (bpy•−)absorption at 385 nm (Figure 7). Experiments performed on amodel Ru complex that has the same ligand configuration as thependant complexes in the PF-Ru assembly, but without thepolymer backbone, show that the injection process ischaracterized by both fast (τ1 = 60 ps) and slow (τ2 = 500ps) components.42 Following electron injection, the hole on theRu(III) complex is transferred to the PF backbone, giving riseto the PF+ features at 400 and 580 nm that first appear at about100 ps (Figure 7). The appearance of these features coincideswith the loss of the Ru* due to electron injection, implying thathole transfer is fast (τ < 100 ps) compared with the slowerinjection components. These PF+ features continue to grow inamplitude, reaching their peak at ∼500 ns (Figure 7). Thiscontinued growth is attributed to photoexcitation of unboundcomplexes, which is followed by site-to-site energy transport ofthe excited state to the surface, electron injection, and transferof the hole to the polymer (Figure 7). Charge recombinationoccurs between electrons within the TiO2 and holes residing onthe PF backbone. Monitoring the loss of the PF+ featuresindicates that the recombination time is greatly extended, withthe charge-separated state persisting for up to 150 μs. Theformation of a long-lived charge-separated state is a desirableproperty for the production of solar fuels as it enables effectivetransfer of redox equivalents to be used in multielectroncatalytic reactions.
■ SUMMARY AND CONCLUSIONSThe rational design of molecular assemblies for solar energyconversion will require a full understanding of the dynamicalprocesses that occur following the absorption of light. Thedevelopment of this detailed microscopic picture of theunderlying energy and electron transfer events faces severalchallenges. Because of the structural complexity, the observedkinetics cannot be described by a single rate constant but reflecta superposition of many different processes that may includefundamental energy and electron transfer events, as well asconformational motions. Disentangling these contributions,which can span time scales ranging from femtoseconds tohundreds of microseconds, requires modeling that can link theobserved kinetics to the underlying structure. Our work thus farhas demonstrated that this is possible in systems exhibitingmultiple functions, including light harvesting, charge separation,and storage. The lessons learned are being used in the design ofthe next generation of assemblies that will integrate catalyticsites for solar fuels production.
■ AUTHOR INFORMATIONCorresponding Author
*E-mail: [email protected]
We gratefully acknowledge support from the UNC EFRC:Solar Fuels and Next Generation Photovoltaics, an Energy
Frontier Research Center funded by the U.S. Department ofEnergy, Office of Science, and Office of Basic Energy Sciencesunder Award Number DE-SC0001011.
Notes
The authors declare no competing financial interest.
Biographies
Zachary A. Morseth received his B.S. and B.A. from Minnesota StateUniversityMoorhead and is currently a Ph.D. student at UNCChapel Hill under the direction of Professor John Papanikolas. Hisresearch interests include computational chemistry and the develop-ment and application of ultrafast methods in light-harvesting systems.
Li Wang received her undergraduate degree in Chemistry from ShanxiUniversity in China and her Ph.D. in Chemistry from MemorialUniversity in Canada. She then moved to UNCChapel Hill to workas a Postdoctoral Associate with Professor John Papanikolas. In 2014,she joined the Research Institute of Environmental Science at ShanxiUniversity in China. Her research interests include the developmentand application of functional materials for environmental pollutioncontrol.
Egle Puodziukynaite earned her undergraduate degree in AppliedChemistry from Kaunas University of Technology and her Ph.D. inChemistry from the University of Florida with Professor JohnReynolds. In 2013, she moved to University of MassachusettsAmherst as a Postdoctoral Associate. Her research interests includeelectroactive and dipole-rich polymer platforms for application inorganic optoelectronic devices.
Gyu Leem received his B.S. in chemical engineering from the HanyangUniversity and Ph.D. in Chemistry from the University of Houston in2008. In 2009, he moved to LG Chem and worked in the division ofpetrochemical and polymer before joining the University of Floridawith Professor Kirk Schanze as a Postdoctoral Associate in 2012. Hisresearch focuses on designing and synthesizing polymer-based metalchromophores for potential use in light-harvesting antennas.
Alexander T. Gilligan is currently completing his B.S. in Chemistry atthe UNCChapel Hill. As a member of the Papanikolas group, he hasperformed molecular dynamics simulations on polymer assemblies.
Thomas J. Meyer was an early pioneer in the field of artificialphotosynthesis with research published in the 1970s and was the firstto design a molecular water oxidation catalyst. He has gained aninternational reputation in photochemistry, mechanisms, and chemicalreactivity and catalysis. He is currently the Arey Professor ofChemistry at UNCChapel Hill and Director of the UNC EnergyFrontier Research Center. His group is focused on water oxidation,carbon dioxide reduction, and DSPEC water splitting and CO2
reduction to carbon fuels.
Kirk S. Schanze earned his B.S. in Chemistry from Florida StateUniversity and his Ph.D. in Chemistry from the UNCChapel Hill.He was appointed a Miller Postdoctoral Fellow at the University ofCalifornia, Berkeley, and began his independent faculty career at theUniversity of Florida in 1986, where he is currently a UniversityDistinguished Professor and Prominski Professor of Chemistry. Hisresearch focuses on organic and organometallic materials chemistry.
John R. Reynolds received his B.S. in Chemistry from San Jose StateUniversity, and his M.S. and Ph.D. in Polymer Science andEngineering from the University of Massachusetts. In 1984, he joinedthe Chemistry faculty at the University of Texas at Arlington, movingto the Chemistry Department at the University of Florida in 1992, andsubsequently joining the Schools of Chemistry and Biochemistry,along with Materials Science and Engineering, at the Georgia Institute
Accounts of Chemical Research Article
DOI: 10.1021/ar500382uAcc. Chem. Res. XXXX, XXX, XXX−XXX
H

of Technology in 2012. His research interests are directed atelectrically conducting and electroactive conjugated polymers.
John M. Papanikolas earned his B.A. in Chemistry from BowdoinCollege and his Ph.D. in Chemical Physics from the University ofColorado at Boulder. Afterwards, he remained in Boulder as aPostdoctoral Associate, and in 1997, he joined the faculty in theChemistry Department at UNCChapel Hill. His research focuses onthe development and application of ultrafast spectroscopic methods tothe study of molecular assemblies and nanomaterials.
■ REFERENCES(1) Alstrum-Acevedo, J. H.; Brennaman, M. K.; Meyer, T. J.Chemical Approaches to Artificial Photosynthesis. 2. Inorg. Chem.2005, 44, 6802−6827.(2) Gust, D.; Moore, T. A.; Moore, A. L. Mimicking PhotosyntheticSolar Energy Transduction. Acc. Chem. Res. 2001, 34, 40−48.(3) Sykora, M.; Maxwell, K. A.; DeSimone, J. M.; Meyer, T. J.Mimicking the Antenna-Electron Transfer Properties of Photosyn-thesis. Proc. Natl. Acad. Sci. U.S.A. 2000, 97, 7687−7691.(4) Fleming, C. N.; Maxwell, K. A.; DeSimone, J. M.; Meyer, T. J.;Papanikolas, J. M. Ultrafast Excited-State Energy Migration Dynamicsin an Efficient Light-Harvesting Antenna Polymer Based on Ru(II)and Os(II) Polypyridyl Complexes. J. Am. Chem. Soc. 2001, 123,10336−10347.(5) Fang, Z.; Ito, A.; Stuartt, A. C.; Luo, H. L.; Chen, Z. F.;Vinodgopal, K.; You, W.; Meyer, T. J.; Taylor, D. K. Soluble ReducedGraphene Oxide Sheets Grafted with Polypyridylruthenium-Derivat-ized Polystyrene Brushes as Light Harvesting Antenna for PhotovoltaicApplications. ACS Nano 2013, 7, 7992−8002.(6) Devadoss, C.; Bharathi, P.; Moore, J. S. Energy Transfer inDendritic Macromolecules: Molecular Size Effects and the Role of anEnergy Gradient. J. Am. Chem. Soc. 1996, 118, 9635−9644.(7) Balzani, V.; Campagna, S.; Denti, G.; Juris, A.; Serroni, S.;Venturi, M. Designing Dendrimers Based on Transition MetalComplexes. Light-Harvesting Properties and Predetermined RedoxPatterns. Acc. Chem. Res. 1998, 31, 26−34.(8) Nantalaksakul, A.; Reddy, D. R.; Bardeen, C. J.; Thayumanavan,S. Light Harvesting Dendrimers. Photosynth. Res. 2006, 87, 133−150.(9) McCafferty, D. G.; Friesen, D. A.; Danielson, E.; Wall, C. G.;Saderholm, M. J.; Erickson, B. W.; Meyer, T. J. Photochemical EnergyConversion in a Helical Oligoproline Assembly. Proc. Natl. Acad. Sci.U.S.A. 1996, 93, 8200−8204.(10) Knorr, A.; Galoppini, E.; Fox, M. A. Photoinduced Intra-molecular Electron Transfer in Dichromophore-appended Alpha-helical Peptides: Spectroscopic Properties and Preferred Conforma-tions. J. Phys. Org. Chem. 1997, 10, 484−498.(11) Serron, S. A.; Aldridge, W. S.; Fleming, C. N.; Danell, R. M.;Baik, M. H.; Sykora, M.; Dattelbaum, D. M.; Meyer, T. J. Evidence forThrough-Space Electron Transfer in the Distance Dependence ofNormal and Inverted Electron Transfer in Oligoproline Arrays. J. Am.Chem. Soc. 2004, 126, 14506−14514.(12) Wilger, D. J.; Bettis, S. E.; Materese, C. K.; Minakova, M.;Papoian, G. A.; Papanikolas, J. M.; Waters, M. L. Tunable EnergyTransfer Rates via Control of Primary, Secondary, and TertiaryStructure of a Coiled Coil Peptide Scaffold. Inorg. Chem. 2012, 51,11324−11338.(13) Bettis, S. E.; Ryan, D. M.; Gish, M. K.; Alibabaei, L.; Meyer, T.J.; Waters, M. L.; Papanikolas, J. M. Photophysical Characterization ofa Helical Peptide Chromophore−Water Oxidation Catalyst Assemblyon a Semiconductor Surface Using Ultrafast Spectroscopy. J. Phys.Chem. C 2014, 118, 6029−6037.(14) Davis, W. B.; Ratner, M. A.; Wasielewski, M. R. ConformationalGating of Long Distance Electron Transfer through Wire-like Bridgesin Donor-Bridge-Acceptor Molecules. J. Am. Chem. Soc. 2001, 123,7877−7886.
(15) Barbara, P. F.; Meyer, T. J.; Ratner, M. A. Contemporary Issuesin Electron Transfer Research. J. Phys. Chem. 1996, 100, 13148−13168.(16) Fleming, C. N.; Dupray, L. M.; Papanikolas, J. M.; Meyer, T. J.Energy Transfer between Ru(II) and Os(II) Polypyridyl ComplexesLinked to Polystyrene. J. Phys. Chem. A 2002, 106, 2328−2334.(17) Fleming, C. N.; Jang, P.; Meyer, T. J.; Papanikolas, J. M. EnergyMigration Dynamics in a Ru(II)- and Os(II)-Based Antenna PolymerEmbedded in a Disordered, Rigid Medium. J. Phys. Chem. B 2004, 108,2205−2209.(18) Fleming, C. N.; Brennaman, M. K.; Papanikolas, J. M.; Meyer,T. J. Efficient, Long-range Energy Migration in Ru-II PolypyridylDerivatized Polystyrenes in Rigid Media. Antennae for ArtificialPhotosynthesis. Dalton Trans. 2009, 3903−3910.(19) Shaw, G. B.; Papanikolas, J. M. Triplet-triplet Annihilation ofExcited States of Polypyridyl Ru(II) Complexes Bound to Polystyrene.J. Phys. Chem. B 2002, 106, 6156−6162.(20) Wang, L.; Puodziukynaite, E.; Vary, R. P.; Grumstrup, E. M.;Walczak, R. M.; Zolotarskaya, O. Y.; Schanze, K. S.; Reynolds, J. R.;Papanikolas, J. M. Competition between Ultrafast Energy Flow andElectron Transfer in a Ru(II)-Loaded Polyfluorene Light-HarvestingPolymer. J. Phys. Chem. Lett. 2012, 3, 2453−2457.(21) Wang, L.; Puodziukynaite, E.; Grumstrup, E. M.; Brown, A. C.;Keinan, S.; Schanze, K. S.; Reynolds, J. R.; Papanikolas, J. M. UltrafastFormation of a Long-Lived Charge-Separated State in a Ru-LoadedPoly(3-hexylthiophene) Light-Harvesting Polymer. J. Phys. Chem. Lett.2013, 4, 2269−2273.(22) Puodziukynaite, E.; Wang, L.; Schanze, K. S.; Papanikolas, J. M.;Reynolds, J. R. Poly(fluorene-co-thiophene)-based Ionic Transition-Metal Complex Polymers for Solar Energy Harvesting and StorageApplications. Polym. Chem. 2014, 5, 2363−2369.(23) McCusker, J. K. Femtosecond Absorption Spectroscopy ofTransition Metal Charge-transfer Complexes. Acc. Chem. Res. 2003, 36,876−887.(24) Gillespie, D. T. Exact Stochastic Simulation of CoupledChemical-reactions. J. Phys. Chem. 1977, 81, 2340−2361.(25) Chen, Z.; Grumstrup, E. M.; Gilligan, A. T.; Papanikolas, J. M.;Schanze, K. S. Light-Harvesting Polymers: Ultrafast Energy Transfer inPolystyrene-based Arrays of π-Conjugated Chromophores. J. Phys.Chem. B 2014, 118, 372−378.(26) Yeow, E. K. L.; Ghiggino, K. P.; Reek, J. N. H.; Crossley, M. J.;Bosman, A. W.; Schenning, A. P. H. J.; Meijer, E. W. The Dynamics ofElectronic Energy Transfer in Novel Multiporphyrin FunctionalizedDendrimers: A Time-Resolved Fluorescence Anisotropy. J. Phys. Chem.B 2000, 104, 2596−2606.(27) Kleiman, V. D.; Melinger, J. S.; McMorrow, D. UltrafastDynamics of Electronic Excitations in a Light-Harvesting Phenyl-acetylene Dendrimer. J. Phys. Chem. B 2001, 105, 5595−5598.(28) Akselrod, G. M.; Deotare, P. B.; Thompson, N. J.; Lee, J.;Tisdale, W. A.; Baldo, M. A.; Menon, V. M.; Bulovic, V. Visualizationof Exciton Transport in Ordered and Disordered Molecular Solids.Nat. Commun. 2014, 5, No. 3646.(29) Bredas, J. L.; Beljonne, D.; Coropceanu, V.; Cornil, J. Charge-Transfer and Energy-Transfer Processes in π-Conjugated Oligomersand Polymers: A Molecular Picture. Chem. Rev. 2004, 104, 4971−5003.(30) Banerji, N.; Cowan, S.; Vauthey, E.; Heeger, A. J. UltrafastRelaxation of the Poly(3-hexylthiophene) Emission Spectrum. J. Phys.Chem. C 2011, 115, 9726−9739.(31) Hintschich, S. I.; Dias, F. B.; Monkman, A. P. Dynamics ofConformational Relaxation in Photoexcited Oligofluorenes andPolyfluorene. Phys. Rev. B 2006, 74, No. 045210.(32) Nelson, T.; Fernandez-Alberti, S.; Roitberg, A. E.; Tretiak, S.Nonadiabatic Excited-state Molecular Dynamics: Modeling Photo-physics in Organic Conjugated Materials. Acc. Chem. Res. 2014, 47,1155−1164.(33) Hwang, I.; Scholes, G. D. Electronic Energy Transfer andQuantum-Coherence in pi-Conjugated Polymers. Chem. Mater. 2011,23, 610−620.
Accounts of Chemical Research Article
DOI: 10.1021/ar500382uAcc. Chem. Res. XXXX, XXX, XXX−XXX
I

(34) Bredas, J. L.; Heeger, A. J. Theoretical Investigation of Gas-Phase Torsion Potentials Along Conjugated Polymer Backbones -Polyacetylene, Polydiacetylene, and Polythiophene. Macromolecules1990, 23, 1150−1156.(35) Chen, H. L.; Huang, Y. F.; Lim, T. S.; Su, C. H.; Chen, P. H.;Su, A. C.; Wong, K. T.; Chao, T. C.; Chan, S. I.; Fann, W. Excited-State Backbone Twisting of Polyfluorene as Detected from Photo-thermal After-Effects. J. Phys. Chem. B 2009, 113, 8527−8531.(36) Wells, N. P.; Blank, D. A. Correlated Exciton Relaxation inPoly(3-hexylthiophene). Phys. Rev. Lett. 2008, 100, No. 086403.(37) Busby, E.; Carroll, E. C.; Chinn, E. M.; Chang, L. L.; Moule, A.J.; Larsen, D. S. Excited-State Self-Trapping and Ground-StateRelaxation Dynamics in Poly(3-hexylthiophene) Resolved withBroadband Pump-Dump-Probe Spectroscopy. J. Phys. Chem. Lett.2011, 2, 2764−2769.(38) Westenhoff, S.; Beenken, W. J. D.; Friend, R. H.; Greenham, N.C.; Yartsev, A.; Sundstrom, V. Anomalous Energy Transfer DynamicsDue to Torsional Relaxation in a Conjugated Polymer. Phys. Rev. Lett.2006, 97, No. 166804.(39) Heimel, G.; Daghofer, M.; Gierschner, J.; List, E. J. W.;Grimsdale, A. C.; Mullen, K.; Beljonne, D.; Bredas, J. L.; Zojer, E.Breakdown of the Mirror Image Symmetry in the Optical Absorption/Emission Spectra of Oligo(para-phenylene)s. J. Chem. Phys. 2005, 122,54501−54511.(40) Sirringhaus, H.; Tessler, N.; Friend, R. H. IntegratedOptoelectronic Devices Based on Conjugated Polymers. Science1998, 280, 1741−1744.(41) Leem, G.; Morseth, Z. A.; Puodziukynaite, E.; Jiang, J.; Zhen, F.;Gilligan, A. T.; Reynolds, J. R.; Papanikolas, J. M.; Schanze, K. S. Light-Harvesting and Charge-Separation in a π-Conjugated AntennaPolymer Bound to TiO2. J. Phys. Chem. C 2014, 118, 28535−28541.(42) It is interesting to note that this metal complex does not exhibitthe sub-picosecond injection component that is commonly observedin dye-sensitized solar cells. Ongoing work in our laboratory suggeststhat its absence is the result of the ligand functionalization, which actsto lower the energy of the MLCT injecting state and slow injection.
Accounts of Chemical Research Article
DOI: 10.1021/ar500382uAcc. Chem. Res. XXXX, XXX, XXX−XXX
J

Light Harvesting and Charge Separation in a π‑Conjugated AntennaPolymer Bound to TiO2
Gyu Leem,† Zachary A. Morseth,‡ Egle Puodziukynaite,† Junlin Jiang,† Zhen Fang,‡
Alexander T. Gilligan,‡ John R. Reynolds,§ John M. Papanikolas,*,‡ and Kirk S. Schanze*,†
†Department of Chemistry, University of Florida, Gainesville, Florida 32611, United States‡Department of Chemistry, University of North Carolina at Chapel Hill, Chapel Hill, North Carolina 27599, United States§School of Chemistry and Biochemistry, School of Materials Science and Engineering, Center for Organic Photonics and Electronics,Georgia Institute of Technology, Atlanta, Georgia 30332, United States
*S Supporting Information
ABSTRACT: This paper describes the photophysical and photoelectrochemicalcharacterization of a light harvesting polychromophore array featuring a polyfluorenebackbone with covalently attached Ru(II) polypyridyl complexes (PF-Ru-A),adsorbed on the surface of mesostructured TiO2 (PF-Ru-A//TiO2). The surfaceadsorbed polymer is characterized by transmission electron microscopy (TEM),scanning electron microscopy (SEM), and attenuated total reflectance-Fouriertransform infrared (ATR-FTIR) spectroscopy, providing evidence for themorphology of the surface adsorbed polymer and the mode of binding.Photoexcitation of the Ru(II) complexes bound to the metal oxide surface (proximal)results in electron injection into the conduction band of TiO2, which is then followedby ultrafast hole transfer to the polymer to form oxidized polyfluorene (PF+). Moreinterestingly, chromophores that are not directly bound to the TiO2 interface (distal)that are excited participate in site-to-site energy transfer processes that transport theexcited state to surface bound chromophores where charge injection occurs, underscoring the antenna-like nature of the polymerassembly. The charge separated state is long-lived and persists for >100 μs, a consequence of the increased separation betweenthe hole and injected electron.
■ INTRODUCTION
The development of molecular assemblies that mimic thecharacteristics of photosynthetic systems is central to therealization of solar fuel technologies. Using natural photosyn-thesis as a guide, artificial photosynthetic assemblies must beable to perform multiple functions spanning light harvesting,charge separation, and charge transfer of the redox equivalentsto catalytic sites that drive multielectron reactions such as wateroxidation or CO2 reduction.
1,2 Coupling of light harvesting tocharge separation has been successfully demonstrated in anumber of solution phase systems employing a broad range ofsensitizers.3−5 Although these molecular systems elegantlydemonstrate proof-of-concept principles regarding the photo-physical mechanisms of directional energy flow, they aretypically limited to a single or small group of chromophoresand are difficult to synthesize, limiting their scalability topractical solar energy conversion applications. Multichromo-phore light harvesting assemblies based on polymers,6−8
dendrimers,9 and peptides10 are less challenging to synthesizeand thus provide a potentially scalable architecture, but only afew examples exist in which multiple functions (e.g., lightharvesting, energy transport, charge separation) are incorpo-rated into a single assembly.10,11
We previously reported the synthesis and photophysicalstudy of a polyfluorene (PF)-based Ru(II) polypyridyl assembly(PF-Ru, Chart 1), where selective photoexcitation of the PFbackbone gives rise to a kinetic competition between ultrafastenergy and electron transfer to the pendant Ru(II) sites,producing a charge-separated state that persists for approx-imately 6 ns.6 In the present investigation, we describe anapproach that anchors a structurally similar PF-based assemblythrough ionic carboxylate-functionalized Ru(II) chromophoresto metal oxide (TiO2) films. When bound to TiO2, the polymerexhibits multifunctional characteristics in which light absorptionis coupled with energy transport and charge separation.Through pump−probe transient absorption methods thephotophysical events are followed on time scales rangingfrom hundreds of femtoseconds to hundreds of microseconds.Photoexcitation of one of the Ru(II) complexes is followed byenergy transport through site-to-site hopping to the interface,where electrons inject (i.e., charge separation) into the TiO2.Hole transfer from the oxidized Ru complex to the PFbackbone regenerates the chromophore at the interface on thepicosecond time scale. The holes that reside on the PF
Received: November 12, 2014Published: November 17, 2014
Article
pubs.acs.org/JPCC
© 2014 American Chemical Society 28535 dx.doi.org/10.1021/jp5113558 | J. Phys. Chem. C 2014, 118, 28535−28541

backbone are stable for >100 μs, implying that the PF servesnot only as a structural scaffold but also as a functional elementthat can transport and potentially store multiple oxidativeequivalents, for consumption by relatively slow catalytic cycles.
■ EXPERIMENTAL SECTION
Materials. The required materials, i.e., 4,4′-dimethyl-2,2′-bipyridyl, selenium dioxide, silver nitrate, potassium dichro-mate, potassium hydroxide, N,N′-dicyclohexylcarbodiimide(DCC), N-hydroxysuccinimide (NHS), sodium azide, potas-sium carbonate, potassium acetate, 1,6-dibromohexane, 1-bromohexane, 1-bromooctane, fluorene, tetrabutylammoniumbromide, tributylamine, 1,8-diazabicyclo[5.4.0]undec-7-ene(DBU), sodium ascorbate, 4-(dimethylamino)pyridine(DMAP), N-bromosuccinimide, copper(I) bromide (CuBr,99.999%), hexafluorophosphoric acid solution (∼55 wt % inH2O), hydrochloride acid (37% in water), tetrabutylammoniumhydroxide solution (∼40 wt % in H2O), and N,N,N′,N″,N″-pentamethyldiethylenetriamine (PMDETA), were purchasedfrom Sigma-Aldrich. Ammonium hexafluorophosphate(NH4PF6), ruthenium(III) chloride hydrate, and cis-bis(2,2′-bipyridine)dichlororuthenium(II) dihydrate (Ru(bpy)2Cl2·2H2O) were purchased from Alfa Aesar. Tetrakis-(triphenylphosphine)palladium and dichloro[1,1′-bis-(diphenylphosphino)ferrocene]palladium(II) dichloromethaneadduct (Pd(dppf)Cl2) were purchased from STREM Chem-icals, Inc. All the chemicals were used as received unlessotherwise indicated. Silica gel or alumina gel (reactivity grade I)was used for column chromatography. Dry solvents wereobtained from a MBRAUN MB-SPS dry solvent system orpurified using standard methods.12 Solvents or liquid reagentsfor the use in a glovebox were also degassed using at least threefreeze−pump−thaw cycles.Synthesis of the Model-Ru-A and Polymer Assemblies
PF-Ru-A. Synthesis details and characterization data for thenew materials Model-Ru-A and PF-Ru-A are provided in theSupporting Information.Fabrication of Dye Sensitized Solar Cells (DSSCs). The
DSSCs were fabricated and modified following the liter-ature.13,14 Briefly, the TiO2 paste was doctor-bladed onto aclean FTO glass slide followed by sintering at 500 °C for 30min with 1 °C of the heating and cooling rate. The TiO2 layer
thickness was approximately 12−13 μm as measured by SEM.After cooling down to 80 °C, the annealed TiO2 films werethen dipped into the PF-Ru-A solution in a 1:2 (v/v) mixture ofacetonitrile:methanol for 48 h. The PF-Ru-A//TiO2 active cellarea was controlled as 0.18 cm2 to allow for consistentmeasurements of IPCE and J−V characteristics. A Pt counterelectrode was prepared by spinning 0.01 M H2PtCl6 inisopropyl alcohol on FTO substrates with two holes createdusing a drill and by sintering 450 °C for 30 min. A Surlyn (25μm, Solaronix) film as a spacer was sandwiched and fixedtogether at ∼80 °C between PF-Ru-A//TiO2 photoanode anda Pt counter electrode. Finally, an electrolyte solutioncontaining 0.05 M I2 and 0.1 M LiI, 0.5 M 4-tert-butylpyridine,and 0.6 M 1-methyl-3-n-propylimidazolium iodide in ananhydrous nitrite solution was injected into two holes on thePt counter electrode side.The current−voltage characteristics of the cells were
measured with a Keithley 2400 source meter under AM1.5(100 mW/cm2) solar simulator. For IPCE measurements, thecells were illuminated by monochromatic light from an OrielCornerstone spectrometer, and the current response undershort circuit conditions was recorded at 10 nm intervals using aKeithley 2400 source meter.
Characterization Methods. NMR spectra were measuredon a Gemini-300 FT-NMR, a VXR 300 FT-NMR, or aMercury-300 FT-NMR. High-resolution mass spectrometrywas performed on a Bruker APEX II 4.7 T Fourier transformion cyclotron resonance mass spectrometer (Bruker Daltonics,Billerica, MA) or a Finnigan LCQ-quadrupole ion trap(Thermo Finnigan, San Jose, CA). The ATR-FTIR spectrawere obtained with a PerkinElmer Spectrum One ATR-FTIRspectrometer. The spectra were collected for 128 scans at aresolution of 4 cm−1. A Hitachi H-7000 TEM was operated atan accelerating voltage of 100 kV to monitor the morphology ofPF-Ru-A anchored TiO2 particles. Analysis of SEM wasperformed using a Hitachi S-4000 with an accelerating voltageof 10 kV, and additional carbon conductive layers were coatedon both bare TiO2 and PF-Ru-A//TiO2 films.
Transient Absorption Measurements. Transient absorp-tion measurements were performed using a home-builttransient absorption spectrometer. The spectrometer is basedon a commercially available ultrafast laser system (Clark MXR
Chart 1. Structure of Model-Ru-A, PF-Ru, and PF-Ru-A
The Journal of Physical Chemistry C Article
dx.doi.org/10.1021/jp5113558 | J. Phys. Chem. C 2014, 118, 28535−2854128536

CPA-2210). The system consists of an erbium-doped fiber ringoscillator pumped by a solid-state fiber coupled laser diodeoperating at 980 nm and a chirped pulse Ti:sapphireregenerative amplifier pumped by a frequency-doubled, Q-switched Nd:YAG laser. Following pulse compression, theamplifier produces pulses centered at 775 nm with 120 fs fwhmduration at 1 kHz with pulse energies of 1.6 mJ/pulse. The 450nm pump pulse was generated in a 2 mm BBO crystal by sumfrequency generation of the 775 nm fundamental and thesecond harmonic of the 1070 nm signal from an opticalparametric amplifier (Light Conversion TOPAS-C). Thefemtosecond probe pulse is generated by focusing 3 mW ofthe 775 nm amplifier output into a translating 5 mm thick CaF2window. The pump beam is focused onto the sample using a300 mm lens, and the probe beam is focused and overlappedwith a 250 mm spherical aluminum mirror. Spectra werecollected on a shot-by-shot (1 kHz) basis over the range of350−820 nm with a sensitivity of up to 0.1 mOD. The anglebetween the pump and probe polarization vectors was set tomagic angle (∼54.7°) to avoid polarization effects and ensurethat only excited-state population dynamics were beingmonitored, and the sample was raster scanned to provide fora fresh sample between laser pulses. Following data collection,the frequency chirp in the probe pulse was characterized usingthe optical Kerr response of liquid CCl4 in a 2 mm cuvette in apolarization gating geometry. The spectra were chirp-correctedusing a data processing program written in LabVIEW.Sub-nanosecond transient measurements were performed
with an Ultrafast Systems EOS spectrometer, in which theprobe pulse is generated by continuum generation from aphotonic crystal fiber and detected by a fiber-optic coupledmultichannel spectrometer with a CMOS sensor. The pump−probe delay is electronically controlled. The kinetic windowranges from 500 ps to 400 μs, and the time resolution of the
instrument is around 500 ps, dictated by the width of the probepulse and the timing electronics.For transient absorption sample preparation, thin films of
TiO2 deposited on FTO glass were soaked for 48 h in asolution containing the sensitizer dissolved in a 1:2 (v/v)mixture of acetonitrile:methanol and were placed in ahomemade 1 cm quartz cuvette at a 45° angle relative to thefront face of the cuvette. All transient absorption experimentswere performed with the sensitized films immersed in argon-saturated solutions of 100 mM LiClO4 dissolved in acetonitrileand were raster scanned to prevent photodegradation of thesamples.Injection yield calculations were determined by comparing
the intensity of the 385 nm bpy•− absorption to the 450 nmground state bleach. The maximum absorbance at 385 nmoccurs when Φinj = 0%, which is observed from the transientabsorption spectrum on ZrO2, where injection is not possibledue to the location of the conduction band edge. The minimumabsorbance at 385 nm occurs when Φinj = 100%, in which thetransient absorption spectrum represents Ru(III) on TiO2. Thisis approximated as the inverse of the ground state absorptionspectrum, normalized to the Ru(II) bleach. By comparing theamplitude of the 385 nm band with respect to these two limits,we can estimate Φinj as a function of pump−probe delay times.
Transient Absorption Kinetics Fitting Parameters. ThefsTA kinetics traces at 385 nm were fit to a biexponentialfunction with an x- and y-offset as implemented in Origin 9.0.The instrument response function (IRF) at 385 nm from thecross-correlation determined the earliest time point in thefitting function. The fitting function was minimized using theLevenberg−Marquardt method until a reduced χ2 value of 1e−9
was achieved.Molecular Dynamics Simulations. The polymer struc-
tures for the MD simulations were constructed using theMaterials Studio suite (Accelrys Software, Inc., San Diego,
Figure 1. (A) Cartoon of PF-Ru-A anchored onto a TiO2 surface. (B) TEM image of PF-Ru-A coated onto TiO2 nanoparticles deposited on acarbon-coated grid. SEM images of as-prepared TiO2 film (C) before and (D) after the immobilization of PF-Ru-A.
The Journal of Physical Chemistry C Article
dx.doi.org/10.1021/jp5113558 | J. Phys. Chem. C 2014, 118, 28535−2854128537

2011). The ground-state geometry of the monomer wasoptimized using the B3LYP DFT functional and the LANL2DZbasis set, as implemented in Gaussian09 version 09a02.15 Afteroptimizing the gas-phase monomer structures, the homopol-ymer was constructed in Materials Studio. The gas-phasegeometries of the polymers were then optimized and annealedwith atomic charges (NPA) obtained from the Gaussian09 QMcalculations. The annealing step consisted of five temperaturecycles using the universal force field with the temperatureranging from 300 to 700 K in a time step of 1 fs, with fiveheating ramps per cycle and 200 dynamics steps per ramp for atotal of 1 ns. The simulation cell consisted of an eight-repeatunit polymer, 32 PF6
− (counterion), and 1180 CH3CNmolecules. The cell was then annealed using the same forcefield as the gas phase polymer with the temperature rangingfrom 300 to 1200 K in a time step of 1 fs with two heatingramps per cycle and 100 000 dynamics steps per ramp for atotal of 800 ps. The annealed simulation cells were then usedfor molecular dynamics calculations with the canonicalensemble, NVT, at a temperature of 298 K controlled by theNose thermostat with a Q-ratio of 0.01. Dynamics werecalculated for a total of 1 ns in each polymer system, andsnapshots were collected every 1 ps, giving a trajectory with1000 snapshots for analysis for each annealed simulation cell.
■ RESULTS AND DISCUSSIONThe chemical structures of the molecular systems studied areshown in Chart 1 which include the model Ru(II) complex(Model-Ru-A) and polymer assemblies PF-Ru and PF-Ru-A.PF-Ru was previously studied6 in solution, leading us to designPF-Ru-A to allow anchoring of the assembly to metal oxidesurfaces. Within the PF-Ru-A assembly, 30% of the pendantRu(II) chromophores feature 4,4′-(dicarboxylate)-2,2-bipyri-dine ligands allowing for multiple surface binding pointsrandomly positioned along the chain, leaving 70% of theunsubstituted Ru(II) 2,2-bipyridine chromophores to partic-ipate as antennas that transfer excited state energy to surfacebound Ru(II) centers.16 Figure 1A schematically illustrates thestructure of PF-Ru-A obtained from solution moleculardynamics (MD) simulations. The MD simulation indicatesthat the polymer takes on an extended cylindrical conforma-tion, with an effective diameter of approximately 6 nm. In thecartoon PF-Ru-A is shown anchored onto a TiO2 surface (PF-Ru-A//TiO2), with surface attachment facilitated by interactionof the polar carboxylate units with the oxide interface.In the experiments, PF-Ru-A was adsorbed on mesoporous
TiO2 films by deposition from a 1:2 (v/v) mixture ofacetonitrile:methanol solution for 48 h, followed by rinsingwith MeOH and acetonitrile. The resulting surface wascharacterized by scanning electron microscopy (SEM), andthe polymer modified TiO2 particles were also imaged bytransmission electron microscopy (TEM). Figure 1B shows aTEM image of PF-Ru-A//TiO2 nanoparticles that were gentlyremoved from a mesoporous film and transferred onto a TEMgrid. The TEM image clearly shows an approximately 6 ± 2 nmcoating of PF-Ru-A on the TiO2 nanoparticles; note that thislayer thickness is consistent with the diameter of the solutionstructure obtained from MD simulations, suggesting that thepolymer adsorbs as a monolayer on the TiO2 surface. SEMimages of uncoated mesoporous TiO2 films and PF-Ru-A//TiO2 films are shown in Figure 1C,D. Analysis of the particlesize distribution in the SEM image for the TiO2 films after thedeposition of PF-Ru-A revealed that the particles have an
average size of roughly 26.2 ± 5.5 nm for the uncoated TiO2film and 31.9 ± 5.3 nm for PF-Ru-A//TiO2 films, consistentwith the PF-Ru-A layer thickness determined from TEMimages. The binding of the PF-Ru-A to the TiO2 nanoparticlesindicated by the images presumably results from the interactionof the ionic carboxylate groups from multiple complexes perchain with the TiO2 surface.
17
The photoelectrochemical response of the PF-Ru-A//TiO2films was tested in a standard dye-sensitized solar cell (DSSC)configuration. Figure 2 shows that the photocurrent action
spectrum (IPCE) of the PF-Ru-A sensitized solar cell exhibits apeak IPCE value of ∼20% at 480 nm. Importantly, the mostpronounced band seen in the photocurrent spectrumcorresponds to the metal-to-ligand charge transfer (MLCT)absorption of the Ru(II) chromophores. A feature correspond-ing to absorption of the PF backbone (λ < 425 nm) is weakerthan expected in the photocurrent spectrum, indicating thatexcitations on the polymer are less efficient in charge injectioncompared to excitations on the Ru chromophores.18 In thesepolymer assemblies, PF excitation decays through competitivePF* to Ru(II) energy and charge transfer pathways.6
Energy transfer from PF* to Ru(II)* should give the samephotocurrent (on a per absorbed photon basis) as directphotoexcitation of a surface bound Ru(II) unit. On the otherhand, deactivation via PF* to Ru(II) charge transfer will likelyproduce little or no photocurrent due to the kineticcompetition between transport of the charge between unboundcomplexes to the surface for charge injection and the rapidcharge recombination time (∼6 ns). The reduced photocurrentefficiency observed for PF excitation could indicate that on theTiO2 surface charge separation/recombination is the dominantdecay pathway. The PF-Ru-A//TiO2 cell exhibited a peakabsorbed photon-to-current efficiency (APCE = IPCE/[1 − T],where T = transmittance) value of ∼30% at 480 nm. Under 100mW, AM 1.5 simulated solar illumination the performance ofthe PF-Ru-A//TiO2 DSSC exhibited a photocurrent density−photovoltage (J−V) curve as shown in Figure S4, with an open-circuit voltage of Voc = 0.54 V, short-circuit current density ofJsc = 1.31 mA/cm2, fill factor of FF = 0.59, and overall powerconversion efficiency of η = 0.43%.
Figure 2. Incident photon to current efficiency (IPCE) spectra of aphotoelectrochemical cell based on a PF-Ru-A//TiO2 photoanode(black solid line with squares). UV−vis absorption spectrum of a PF-Ru-A//TiO2 photoanode (blue solid curve) for comparison with IPCEplot. Note that the absorption increase for λ < 425 nm is due to onsetof the PF backbone absorption.
The Journal of Physical Chemistry C Article
dx.doi.org/10.1021/jp5113558 | J. Phys. Chem. C 2014, 118, 28535−2854128538

Transient absorption measurements performed on Model-Ru-A//TiO2 and PF-Ru-A//TiO2 films reveal a cascading seriesof energy and electron transfer events that occur followingphotoexcitation, as illustrated in Scheme 1. Photoexcitation of a
surface-bound (proximal) Ru(II) chromophore (1b) results inrapid electron injection into TiO2 (3), followed by the transferof the hole on the oxidized Ru(III) complex to the PFbackbone (4). Excitation of a Ru(II) chromophore that is distalwith respect to the interface (1a) can lead to multiple Ru* →Ru energy hopping events (2). Transport of the energy tosurface bound chromophores is followed by electron injection(3) and hole transfer to the polymer (4). On longer time scales,back electron transfer between Ru(III) and TiO2(e
−) (5a) orcharge recombination between PF+ and TiO2(e
−) (5b) give theoriginal ground state Ru(II) species.The electron injection process (3) is monitored by fs−ps
transient absorption on the Model-Ru-A//TiO2 film. Spectraacquired shortly after 450 nm excitation of the Model-Ru-A//TiO2 film (Figure 3A) show the characteristic π → π*absorption at 385 nm of the reduced polypyridyl radical anion(bpy•−) along with a prominent ground-state bleach at 450 nmand a ligand-to-metal charge transfer (LMCT) and bpy•− bandthat extends to the red of 500 nm.19 Loss of the bpy•−
absorption at 385 nm without loss of the ground state bleachat 450 nm is the spectral signature of electron injection into theTiO2. By monitoring the loss of the 385 nm excited stateabsorption (Figure 3B), the decay is described well by fast (τ1 =60 ps) and slow (τ2 = 500 ps) components. Photoinducedelectron injection has been shown to be a multiexponentialprocess, owing to the intrinsic heterogeneity and dynamicrelaxation processes following excitation.20,21 These slowerdecay components most likely reflect electron injection from athermalized 3MLCT excited state, as reported for other Ru(II)dyes.20 The presence of multiple kinetic components has beenobserved for other related sensitizers and arises from a numberof factors, including the dye-binding motifs, electronic coupling,and overlap of the dye donor levels with the TiO2 acceptor
states.22−24 Furthermore, based on the analysis of the transientspectra,25 there is negligible ultrafast (τ < 200 fs) electroninjection in this complex, and by 1.4 ns the overall injectionyield is 45%.26
Photoexcitation of the PF-Ru-A//TiO2 film at 450 nm givesrise to similar spectral features as seen for the Model-Ru-A//TiO2 film at early times (Figure 3C). The intensity of the 385nm absorption decays with time components that are similar tothe Model-Ru-A complex (τ1 = 60 ps and τ2 = 500 ps) (Figure3D), but the overall injection yield is significantly lower basedon inspection of the transient spectra.25 In addition, thetransient spectra for the PF-Ru-A//TiO2 assembly showadditional bleach and absorption features at 400 and 580 nm,respectively (Figure 3C), and a concomitant loss of the MLCTground state bleach at 450 nm. The 400 nm bleach and the 580nm absorption are both attributed to oxidized PF polymer(PF+) on the basis of spectroelectrochemical observations.6
The absence of these two features in the transient spectra forPF-Ru-A//ZrO2 (Figure S5) indicates that formation of PF+ isa consequence of charge injection, most likely due to holetransfer from Ru(III), produced by charge injection, to the PFbackbone (Scheme 1, step 4). Furthermore, the loss of thebpy•− absorption at 385 nm occurs simultaneously withappearance of the PF+ feature at 400 nm, suggesting thathole transfer takes place on a time scale that is short comparedto the longer injection components.The spectral features associated with the formation of PF+ at
400 and 580 nm become increasingly pronounced on longertime scales, as seen in Figure 4A,C. Their continued growthduring the first 200−300 ns is consistent with triplet−tripletenergy transport from unbound Ru(II) complexes through site-to-site hopping to a chromophore bound to the TiO2 surface,which then undergoes electron injection and hole localizationon the PF (Scheme 1, steps 2 and 3). Thus, the time scaleassociated with the growth of the PF+ features at 400 and 580nm reflects the total time needed for the Ru* created byphotoexcitation to reach the interface, which in turn dependsupon the Ru* → Ru hopping time as well as the number of
Scheme 1. Schematic Representation of PhotophysicalEvents of PF-Ru-A on the Surface of TiO2
a
aBalls represent Ru(L)32+ chromophores, and the gray ribbon
represents the poly(fluorene) backbone.
Figure 3. (A) Transient absorption spectra following 450 nm laserexcitation for the Model-Ru-A complex on TiO2 at 0.25, 1, 5, 10, 100,and 1400 ps. (B) Model-Ru-A//TiO2 kinetics trace at 385 nm. (C)Transient absorption spectra of PF-Ru-A//TiO2 at 0.25, 1, 5, 10, 100,and 1400 ps. (D) PF-Ru-A//TiO2 kinetics trace at 385 nm. The filmswere immersed in argon-saturated acetonitrile with 0.1 M LiClO4.
The Journal of Physical Chemistry C Article
dx.doi.org/10.1021/jp5113558 | J. Phys. Chem. C 2014, 118, 28535−2854128539

hops. Work on a related polymer assembly27−29 suggests thatthe Ru*→ Ru hopping time is <10 ns. Thus, the growth of PF+
over 200−300 ns implies that some Ru(II)* excited states maymake as many as 20−30 hops prior to charge injection,underscoring the antenna-like nature of the PF-Ru-A polymerassembly. The fraction of unbound Ru(II)* that reach theinterface (Fs) can be estimated from the APCE efficiency(ηAPCE) and the injection efficiency (ηinj), i.e., where f B and f Uare the fractions of complexes that are bound and unbound tothe surface, respectively. Using an APCE efficiency of 30% andan injection efficiency of 45%, we estimate (to a lower limit)that approximately 50% of the photoexcitations on unboundcomplexes are eventually transported to the surface where theycan undergo electron injection.
ηη
= −⎛⎝⎜⎜
⎞⎠⎟⎟F f
f1
sAPCE
injB
U
By 200−300 ns after photoexcitation, the transient spectrumcontains both the prominent features associated with the PF+ aswell as a significant Ru(II) bleach at 450 nm. Since hole transferto form the positive polaron repopulates the Ru(II) groundstate, the bleach must arise from Ru(III) complexes that havenot undergone hole transfer or Ru(II)* excited states thatremain. Although it is difficult to distinguish between these twocontributions, the rapid hole transfer time would suggest that itis the Ru(II)* that is responsible for the bleach.Furthermore, the Ru(II) ground state bleach decays before
the PF+ features (Figure 4B,C), indicating that the transientspectrum observed at the longest times arises almost entirelyfrom the positive polaron, PF+. A small population of Ru(III)still exists at 150 μs, most likely a result of the similar oxidationpotentials for PF and non-carboxylated Ru(II) chromophores,
leading to an equilibrium between the hole residing on thepolymer backbone and the pendant chromophores. The charge-separated state decays through recombination of the injectedelectron in the TiO2 with holes on the PF backbone (Scheme 1,5b). Its lifetime (∼150 μs) is significantly longer than that ofModel-Ru-A//TiO2 (Figure S6), consistent with a greaterseparation between the PF positive polaron and the surface.
■ CONCLUSIONPF-Ru chromophores functionalized with a small fraction ofionic carboxylate moieties have been prepared by “click”chemistry to attach the mixture of Ru(II) polypyridylcomplexes and ester-containing Ru(II) polypyridyl complexes,following the deprotection step to form ionic carboxylatefunctionalized Ru(II) polypyridyl complexes. With thesuccessful synthesis of PF-Ru-A, the polymer-based chromo-phores were anchored to TiO2 films. The solar characteristicsdemonstrate TiO2 surface anchoring and light harvesting abilitywhen applied in solar photoelectrochemical cells. These lightharvesting mechanisms were studied with femtosecond pump−probe spectroscopy, where direct excitation of the Ru(II)chromophores leads to rapid and efficient electron injection forchromophores directly bound to the TiO2 surface. This event isfollowed by ultrafast hole transfer to the polyfluorene chain,thereby facilitating repopulation of the ground state Ru(II)species and avoiding deleterious charge recombinationprocesses. The pendant Ru(II) chromophores undergo energytransfer to surface-bound chromophores on the nanosecondtime scale, where electron injection can precede hole transfer tothe polymer backbone. Charge recombination for the Ru(II)chromophores occurs on the microsecond time scale, whereinjected electrons recombine with oxidized chromophores thathave not undergone hole transfer, whereas charge recombina-tion involving the oxidized polymer occurs on longer timescales. This study reveals the promise for coupling polymericassemblies to a semiconductor interface for light harvesting,charge separation, and transient charge storage. Work inprogress seeks to include oxidation catalyst centers into theassemblies with the objective of accomplishing water oxidationat the photoanode of a dye-sensitized photoelectrosynthesiscell.
■ ASSOCIATED CONTENT*S Supporting InformationExperimental procedures, ATR-FTIR, TEM, AFM, J−V curve,absorption and emission spectra of PF-Ru-A//TiO2 films, andtransient absorption spectra of PF-Ru-A//ZrO2 results. Thismaterial is available free of charge via the Internet at http://pubs.acs.org.
■ AUTHOR INFORMATIONCorresponding Authors*E-mail [email protected] (K.S.S.).*E-mail [email protected] (J.M.P.).Author ContributionsG.L. and Z.A.M. contributed equally.NotesThe authors declare no competing financial interest.
■ ACKNOWLEDGMENTSThis material is based on work supported as part of the UNCEFRC: Solar Fuels and Next Generation Photovoltaics, an
Figure 4. (A) Nanosecond transient absorption spectra of PF-Ru-A//TiO2 films following excitation at 450 nm from 1 ns to 2 μs. (B)Nanosecond transient absorption spectra of PF-Ru-A//TiO2 filmsfrom 2 to 100 μs. The shaded region is the spectrum at 100 μs. (C)Kinetics traces for PF-Ru-A//TiO2 films at probe wavelengths 400 nm(blue), 485 nm (red), and 580 nm (black) from 250 fs to 150 μsfollowing 450 nm excitation. The gray-filled points represent thefemtosecond and picosecond kinetic traces. The films were immersedin argon-saturated acetonitrile with 0.1 M LiClO4.
The Journal of Physical Chemistry C Article
dx.doi.org/10.1021/jp5113558 | J. Phys. Chem. C 2014, 118, 28535−2854128540

Energy Frontier Research Center funded by the U.S.Department of Energy, Office of Science, Office of BasicEnergy Sciences, under Award DE-SC0001011. We also thankKaren L. Kelly in the Interdisciplinary Center for Biotechnol-ogy Research (ICBR) Electron Microscopy and BioimagingLaboratory at University of Florida for help with the TEM andSEM.
■ REFERENCES(1) Ashford, D. L.; Song, W.; Concepcion, J. J.; Glasson, C. R. K.;Brennaman, M. K.; Norris, M. R.; Fang, Z.; Templeton, J. L.; Meyer,T. J. Photoinduced Electron Transfer in a Chromophore−CatalystAssembly Anchored to TiO2. J. Am. Chem. Soc. 2012, 134, 19189−19198.(2) Song, W.; Glasson, C. R. K.; Luo, H.; Hanson, K.; Brennaman, M.K.; Concepcion, J. J.; Meyer, T. J. Photoinduced Stepwise OxidativeActivation of a Chromophore−Catalyst Assembly on TiO2. J. Phys.Chem. Lett. 2011, 2, 1808−1813.(3) Tomizaki, K.; Loewe, R. S.; Kirmaier, C.; Schwartz, J. K.; Retsek,J. L.; Bocian, D. F.; Holten, D.; Lindsey, J. S. Synthesis andPhotophysical Properties of Light-Harvesting Arrays Composed of aPorphyrin Bearing Multiple Perylene-Monoimide Accessory Pigments.J. Org. Chem. 2002, 67, 6519−6534.(4) Gust, D.; Moore, T. A.; Moore, A. L. Mimicking PhotosyntheticSolar Energy Transduction. Acc. Chem. Res. 2001, 34, 40−48.(5) Wasielewski, M. R. Photoinduced Electron Transfer inSupramolecular Systems for Artificial Photosynthesis. Chem. Rev.1992, 92, 435−461.(6) Wang, L.; Puodziukynaite, E.; Vary, R. P.; Grumstrup, E. M.;Walczak, R. M.; Zolotarskaya, O. Y.; Schanze, K. S.; Reynolds, J. R.;Papanikolas, J. M. Competition between Ultrafast Energy Flow andElectron Transfer in a Ru(II)-Loaded Polyfluorene Light-HarvestingPolymer. J. Phys. Chem. Lett. 2012, 3, 2453−2457.(7) Wang, L.; Puodziukynaite, E.; Grumstrup, E. M.; Brown, A. C.;Keinan, S.; Schanze, K. S.; Reynolds, J. R.; Papanikolas, J. M. UltrafastFormation of a Long-Lived Charge-Separated State in a Ru-LoadedPoly(3-hexylthiophene) Light-Harvesting Polymer. J. Phys. Chem. Lett.2013, 4, 2269−2273.(8) Chen, Z.; Grumstrup, E. M.; Gilligan, A. T.; Papanikolas, J. M.;Schanze, K. S. Light-Harvesting Polymers: Ultrafast Energy Transfer inPolystyrene-Based Arrays of π-Conjugated Chromophores. J. Phys.Chem. B 2014, 118, 372−378.(9) Adronov, A.; Gilat, S. L.; Frechet, J. M. J.; Ohta, K.; Neuwahl, F.V. R.; Fleming, G. R. Light Harvesting and Energy Transfer in Laser-Dye-Labeled Poly(Aryl Ether) Dendrimers. J. Am. Chem. Soc. 2000,122, 1175−1185.(10) Ma, D.; Bettis, S. E.; Hanson, K.; Minakova, M.; Alibabaei, L.;Fondrie, W.; Ryan, D. M.; Papoian, G. A.; Meyer, T. J.; Waters, M. L.;Papanikolas, J. M. Interfacial Energy Conversion in Ru-II Polypyridyl-Derivatized Oligoproline Assemblies on TiO2. J. Am. Chem. Soc. 2013,135, 5250−5253.(11) Sykora, M.; Maxwell, K. A.; DeSimone, J. M.; Meyer, T. J.Mimicking the Antenna-Electron Transfer Properties of Photosyn-thesis. Proc. Natl. Acad. Sci. U. S. A. 2000, 97, 7687−7691.(12) Armarego, W. L. F.; Chai, C. Purification of LaboratoryChemicals, 5th ed.; Butterworth-Heinemann: Oxford, UK, 2003.(13) Fang, Z.; Eshbaugh, A. A.; Schanze, K. S. Low-Bandgap Donor−Acceptor Conjugated Polymer Sensitizers for Dye-Sensitized SolarCells. J. Am. Chem. Soc. 2011, 133, 3063−3069.(14) Lee, Y.-G.; Park, S.; Cho, W.; Son, T.; Sudhagar, P.; Jung, J. H.;Wooh, S.; Char, K.; Kang, Y. S. Effective Passivation of Nano-structured TiO2 Interfaces with Peg-Based Oligomeric Coadsorbentsto Improve the Performance of Dye-Sensitized Solar Cells. J. Phys.Chem. C 2012, 116, 6770−6777.(15) Frisch, M. J.; et al. Gaussian 09, Revision C.01; Gaussian, Inc.:Wallingford, CT, 2009.(16) The 30% loading of the bis(dicarboxy)bpy Ru(II) on thepolyfluorene chain reflects the stoichiometry in the click reaction used
to attach the acetylene functionalized Ru(II) chromophores to theazide functionalized polyfluorene.(17) Comparison of ATR-IR spectra of PF-Ru-A and PF-Ru-A//TiO2 (Figure S1) supports the premise that the surface bonding is viathe carboxylate groups.(18) The absorption of the polyfluorene backbone has a bandmaximum at 393 nm; see absorption spectrum in SupportingInformation, Figure S5.(19) Rack, J. J. Electron Transfer Triggered Sulfoxide Isomerizationin Ruthenium and Osmium Complexes. Coord. Chem. Rev. 2009, 253,78−85.(20) Koops, S. E.; O’Regan, B. C.; Barnes, P. R. F.; Durrant, J. R.Parameters Influencing the Efficiency of Electron Injection in Dye-Sensitized Solar Cells. J. Am. Chem. Soc. 2009, 131, 4808−4818.(21) Juozapavicius, M.; Kaucikas, M.; van Thor, J. J.; O’Regan, B. C.Observation of Multiexponential Pico- to Subnanosecond ElectronInjection in Optimized Dye-Sensitized Solar Cells with Visible-PumpMid-Infrared-Probe Transient Absorption Spectroscopy. J. Phys. Chem.C 2013, 117, 116−123.(22) Giokas, P. G.; Miller, S. A.; Hanson, K.; Norris, M. R.; Glasson,C. R. K.; Concepcion, J. J.; Bettis, S. E.; Meyer, T. J.; Moran, A. M.Spectroscopy and Dynamics of Phosphonate-Derivatized RutheniumComplexes on TiO2. J. Phys. Chem. C 2013, 117, 812−824.(23) Li, L. S.; Giokas, P. G.; Kanai, Y.; Moran, A. M. Modeling Time-Coincident Ultrafast Electron Transfer and Solvation Processes atMolecule-Semiconductor Interfaces. J. Chem. Phys. 2014, 140, 234109.(24) Asbury, J. B.; Anderson, N. A.; Hao, E. C.; Ai, X.; Lian, T. Q.Parameters Affecting Electron Injection Dynamics from RutheniumDyes to Titanium Dioxide Nanocrystalline Thin Film. J. Phys. Chem. B2003, 107, 7376−7386.(25) Wang, L.; Ashford, D. L.; Thompson, D. W.; Meyer, T. J.;Papanikolas, J. M. Watching Photoactivation in a Ru(II) Chromo-phore−Catalyst Assembly on TiO2 by Ultrafast Spectroscopy. J. Phys.Chem. C 2013, 117, 24250−24258.(26) This injection yield is substantially lower than those observedfor similar Ru(II) complexes on TiO2. It is most likely a result of thechemical modification needed to attach the complex to the polymer,which could lead to low-energy MLCT excited states associated withthe ancillary ligands that slow electron injection and diminish theoverall injection yield.(27) Fleming, C. N.; Maxwell, K. A.; DeSimone, J. M.; Meyer, T. J.;Papanikolas, J. M. Ultrafast Excited-State Energy Migration Dynamicsin an Efficient Light-Harvesting Antenna Polymer Based on Ru(II)and Os(II) Polypyridyl Complexes. J. Am. Chem. Soc. 2001, 123,10336−10347.(28) Fleming, C. N.; Jang, P.; Meyer, T. J.; Papanikolas, J. M. EnergyMigration Dynamics in a Ru(II)- and Os(II)-Based Antenna PolymerEmbedded in a Disordered, Rigid Medium. J. Phys. Chem. B 2004, 108,2205−2209.(29) Fleming, C. N.; Brennaman, M. K.; Papanikolas, J. M.; Meyer,T. J. Efficient, Long-Range Energy Migration in Ru-II PolypyridylDerivatized Polystyrenes in Rigid Media. Antennae for ArtificialPhotosynthesis. Dalton Trans. 2009, 3903−3910.
The Journal of Physical Chemistry C Article
dx.doi.org/10.1021/jp5113558 | J. Phys. Chem. C 2014, 118, 28535−2854128541

Poly(fluorene-co-thiophene)-based ionictransition-metal complex polymers for solar energyharvesting and storage applications†
Egle Puodziukynaite,a Li Wang,b Kirk S. Schanze,a John M. Papanikolasb
and John R. Reynolds*c
This paper describes the synthesis, electrochemical and photophysical properties of two poly(fluorene-co-
thiophene)-based polymers featuring pendant Ru(II) polypyridyl-based ionic transition metal complexes.
These systems combine long-lived excited states of the Ru(II) chromophores and the large optical cross-
sections of the conjugated backbones, potentially allowing for polymer-assisted solar radiation-
harvesting and storage functions via ultrafast energy and charge transfer processes. Modified azide–
alkyne “click” cycloaddition chemistry conditions are demonstrated as an effective approach to obtain
quantitatively functionalized conjugated polymer–ionic transition metal complex assemblies.
Introduction of variable fractions of electron-rich thiophene units into these architectures induces a
bathochromic shift in the polyfluorene absorption maxima, while simultaneously stabilizing the oxidized
states of the conjugated scaffolds, as determined by electrochemical and in situ spectroelectrochemical
experiments. The hybrid assemblies exhibit ultrafast energy flow (700 fs to 4.8 ps) and photoinduced
charge-separation (1.8–2.0 ps) between the conjugated backbone and the Ru(II) moieties. Notably, the
chemical composition of the main-chain repeat unit determines the dominant pathway for decay of the
conjugated backbone excited states with the fraction of electron transfer increasing from 25% to 75%
upon incorporation of an additional thiophene heterocycle.
Introduction
Ionic transition metal complex (iTMC) assemblies haveemerged as attractive light-harvesting, charge transport, andcatalytic media for solar electrochemical cells and solar fueldevices.1–4 Among such systems, multichromophoric iTMCarrays have attracted a considerable amount of attention dueto their large cumulative optical cross-sections and long-livedphotostable excited states enabling exciton migration over longdistances.5–9 Additionally, optical and electrochemical proper-ties of iTMCs can be ne-tuned via relatively simple structuralmodication of their ligands, ultimately affecting both indi-vidual rates and direction of exciton hopping in the resultantmacromolecular architectures.6,9–14
To date, multi-chromophoric assemblies have been mostlycomprised of saturated polymer backbones, such as polystyrene
or polyproline.5,8,15 However, while these scaffolds act as faciletemplates to align the pendant iTMC units thus controllinginter-chromophore exciton migration, intrinsically, such poly-mers are non-electroactive and do not perform functions relatedto solar energy harvesting. As a result, we have recently reporteda Ru(II)-loaded polyuorene assembly, where a basis for lightharvesting is provided by the electroactive polymer backbone,followed by ultrafast energy and charge transfer processes.16 Inthis system, the combination of the large extinction coefficientof the conjugated polymer backbone and the long lifetime of theRu(II) excited states is demonstrated, allowing for long excitondiffusion lengths. Whereas this polyuorene–Ru(II)-tris(bipyr-idyl) hybrid essentially serves as a model system, providinginsight into the excitonic processes in this general class ofiTMC-conjugated polymer assemblies (Fig. 1), the limitations ofthis scaffold arise due to the high energy gap of the polymer.Polyuorene exhibits absorption centered around 390 nm,where the radiation of the solar emission spectrum is limited.Additionally, the energy transfer process is the dominant pho-tophysical phenomenon in this assembly, while electrontransfer, leading to high energy redox intermediates, accountsfor only �15% of the total energy absorbed by the polymerbackbone.
To utilize the light harvesting potential of hybrid conjugatedpolymer–iTMC assemblies, inducing a bathochromic shi in
aDepartment of Chemistry, Center for Macromolecular Science and Engineering,
University of Florida, Gainesville, FL 32611-7200, USAbDepartment of Chemistry, University of North Carolina at Chapel Hill, Chapel Hill,
North Carolina 27599, USAcSchool of Chemistry and Biochemistry, School of Materials Science and Engineering,
Center for Organic Photonics and Electronics, Georgia Institute of Technology,
Atlanta, GA 30332, USA. E-mail: [email protected]
† Electronic supplementary information (ESI) available: Detailed experimentaland additional synthesis data. See DOI: 10.1039/c3py01582c
Cite this: Polym. Chem., 2014, 5, 2363
Received 10th November 2013Accepted 27th December 2013
DOI: 10.1039/c3py01582c
www.rsc.org/polymers
This journal is © The Royal Society of Chemistry 2014 Polym. Chem., 2014, 5, 2363–2369 | 2363
PolymerChemistry
PAPER
Publ
ishe
d on
20
Janu
ary
2014
. Dow
nloa
ded
by U
nive
rsity
of
Nor
th C
arol
ina
at C
hape
l Hill
on
06/0
6/20
14 1
9:40
:29.
View Article OnlineView Journal | View Issue

the polymer backbone absorption, as well as increasing thefraction of electron transfer, becomes a necessity. To addressthis issue, we have recently reported a poly(3-hexylthiophene)–Ru(II) assembly that demonstrates preferential formation of thelong-lived charge separated state.17 However, to fully under-stand the photophysical properties of conjugated polymer–iTMC hybrids and ultimately explore such architectures ascatalytic scaffold building blocks in solar fuel devices, furtherne-tuning of energy transfer and charge separation fractions isof importance (Fig. 1). Additionally, precise control of polymerbackbone HOMO levels is critical, as this could allow for tran-sition-metal catalyst oxidation by the conjugated main-chain,potentially facilitating the respective water splitting reactions.
Reported herein are the synthesis and characterizationresults of a new family of poly(uorene-co-thiophene)–Ru(II)polypyridyl assemblies, where the optical and electronic prop-erties of the polymer backbones are controlled by incorporationof various fractions of electron-rich thiophene units. ModiedCu-assisted “click” chemistry conditions are employed for post-polymerization functionalization of these assemblies, allowingfor quantitative “click” conversion under mild conditions.Electrochemical, spectroelectrochemical and photophysicalcharacterization results are given for the polymers synthesizedwith the focus on establishing the structure–property relation-ships in these systems. Ultrafast transient absorption experi-ments suggest a signicant increase in the electron transferfraction (from 25% to 75%) from the polymer backbone to theRu(II) pendants upon the introduction of an additional thio-phenemoiety into the repeat unit of the conjugatedmain-chain.
Efficient formation of charge-separated states in the macro-molecular antennae is expected to facilitate electron injectionand chromophore-assisted catalytic processes in the respectivesolar energy-harvesting and storage devices.
Results and discussionSynthesis
The emphasis of this study was multichromophoric Ru(II) arraysbased on perfectly alternating poly(uorene-co-thiophene)(PFT–Ru) and poly(bithiophene-co-uorene) (PF2T–Ru) back-bones, as shown in Scheme 1. Polymers PFT–Ru and PF2T–Ruwere obtained using a general multi-step route as depicted inScheme 1, as well as Schemes S1 and S2 (ESI†). The bromide-functionalized polymer precursors were synthesized via a Pd-mediated Suzuki cross-coupling approach (Schemes S1 and S2,ESI†) with the yields of their chloroform soluble fractions being58% and 70%, respectively. The compounds were then treatedwith sodium azide to obtain PFT–N3 and PF2T–N3. Thesereactive polymers, due to their increased sensitivity to azide-cross-linking,18 were immediately subjected to the Cu(I)-assisted“click” reaction with an alkynyl-containing amide-functional-ized Ru(II) polypyridyl complex to afford PFT–Ru and PF2T–Ruin 88% and 85% yields, correspondingly (Schemes 1, S1 andS2†). This Ru(II) tris(bipyridyl) derivative has been chosen as thecoupling partner, as introduction of an electron-withdrawingamide functionality to the 4-position of the 2,20-bipyridineligands of the chromophores has been previously demonstratedto contribute to the excited MLCT state dipole alignment in therespective iTMC polystyrene arrays, allowing for orders ofmagnitude faster Ru* / Ru inter-chromophore excitonhopping rates.8 In the “click” reaction, CuBr, PMDETA andsodium ascorbate were used as the Cu(I)-source, base/ligandand reducing agent, respectively. Additionally, an excess ofNH4PF6 salt was added to the reaction mixture to prevent theRu(II) complex counter ion exchange, leading to precipitation ofthe reaction intermediates and the consecutive inhibition of the“click” conversion. In both cases, quantitative functionalizationof PFT and PF2T backbones with iTMC units was conrmedusing 1H NMR and IR spectroscopies. Hybrid assembliesPFT–Ru and PF2T–Ru were estimated to contain on average ca.
Fig. 1 Controlled exciton and charge transfer processes in a hybridconjugated polymer–ionic transition metal complex array.
Scheme 1 Synthetic routes to polymers PFT–Ru, PF2T–Ru, PFT–Hex and PF2T–Hex.
2364 | Polym. Chem., 2014, 5, 2363–2369 This journal is © The Royal Society of Chemistry 2014
Polymer Chemistry Paper
Publ
ishe
d on
20
Janu
ary
2014
. Dow
nloa
ded
by U
nive
rsity
of
Nor
th C
arol
ina
at C
hape
l Hill
on
06/0
6/20
14 1
9:40
:29.
View Article Online

46 and 30 pendent Ru(II) units per chain, respectively. Azide-based precursors PFT–N3 and PF2T–N3 were also reacted with1-octyne to obtain hexyl-functionalized model polymersPFT–Hex and PF2T–Hex (Schemes 1, S1 and S2†).
Photophysical properties
The photophysical properties of PFT–Ru, PF2T–Ru, and thecorresponding model polymers PFT–Hex and PF2T–Hex werestudied by steady state UV-Vis and photoluminescence spec-troscopies. Normalized solution absorption and emissionspectra of PFT–Ru, PF2T–Ru, PFT–Hex and PF2T–Hex aregiven in Fig. 2, and the optical properties are summarized inTable 1.
As can be seen in Fig. 2A, the model polymers exhibited, inprinciple, similar UV-Vis absorption behavior with broadabsorption bands centered at 399 and 402 nm (Fig. 2 andTable 1). The resemblance of the absorption spectra washypothesized to arise from the opposing steric and electroniceffects. Whereas the presence of an additional electron rich
thiophene moiety in the polymer repeat unit would be expectedto generate a bathochromic shi in the ground state absorptionof PF2T–Hex, the backbone twisting caused by the stericallybulky thiophene octyl chains adjacent to the uorene unitsmight result in a decrease in the mean conjugation length and arespective hypsochromic shi. Nonetheless, the slight bath-ochromic shis in the peak position (3 nm) and the absorptionband onset (6 nm) for PF2T–Hex indicated a somewhat loweroptical gap, which was consistent with the more electron-richcharacter of the polymer. More signicant variations emergedin the photoluminescence spectra of the two polymers, wherean �25 nm red shi, as well as the corresponding increase inthe Stokes shi, was observed for PF2T–Hex. This nding ismost likely indicative of more pronounced conformationalrelaxation of the polymer backbone upon excitation or/andexcitonic energy migration differences between the PFT andPF2T scaffolds.19 Both polymers exhibited structured emissionbands with maxima of 462 nm and 487 nm for PFT–Hex, as wellas 485 nm and 512 nm for PF2T–Hex. The emission quantumyields of the polymers were 0.65 and 0.50 for PFT and PF2Tscaffolds, respectively.
Absorption spectra of PFT–Ru and PF2T–Ru generallyresembled a linear combination of the polymer backbone andRu polypyridyl complex absorption signatures, suggesting littleor no electronic interactions in the ground state between thetwo components. In addition to the p–p* transitions of thepolymer backbones with the maxima at ca. 416–419 nm, eachabsorption spectrum also exhibited shoulders at ca. 470 nmcharacteristic of metal-to-ligand charge transfer (MLCT) ofRu(II) complexes, as well as the bipyridine ligand p–p* transi-tion centered at around 289 nm. When excited at 388 nm,emission spectra of the hybrid polymers were dominated by thebroad featureless Ru(II) complex MLCT triplet emission at644 nm, and the polymer backbone emission was signicantlyquenched (F ¼ 6.0 � 10�4 for PFT–Ru and F ¼ 1.3 � 10�3 forPF2T–Ru). This result was partially attributed to uorescenceresonance energy transfer (FRET) occurring from the polymerbackbones to the iTMC units via the 1MLCT excited state and isconsistent with literature examples when the donor emissionand acceptor absorption spectral signatures overlap.16,20,21
Furthermore, in the excitation spectra of the hybrid polymersmonitored for the Ru(II) 3MLCT emission at 640 nm (Fig. 2B),the conjugated main-chain absorption spectra could be in partreproduced, in agreement with FRET. Meanwhile, deviationsbetween the polymer backbone absorption and excitationspectra were associated with another excited state relaxation
Fig. 2 (A) Normalized absorption and photoluminescence spectra ofPFT–Hex and PF2T–Hex in dilute tetrahydrofuran solutions; alongwith the corresponding photographs of the polymer solutions underlong-wave UV irradiation. (B) Normalized absorption, photo-luminescence and excitation spectra of PFT–Ru and PF2T–Ru in diluteAr-saturated acetonitrile solutions. All photoluminescence spectrawere acquired with lexc at 388 nm and the excitation spectra weremonitored at 640 nm of 3MLCT emission.
Table 1 Optical data for compounds PFT–Ru and PF2T–Ru inacetonitrile and PFT–Hex and PF2T–Hex in THF
Compound Abs lmax, nm (lonset, nm) Pl lmax, nm
PFT–Hex 399 (454) 462, 487PF2T–Hex 402 (462) 485, 512PFT–Ru 289, 419, 470 456, 644PF2T–Ru 289, 416, 470 470, 644
This journal is © The Royal Society of Chemistry 2014 Polym. Chem., 2014, 5, 2363–2369 | 2365
Paper Polymer Chemistry
Publ
ishe
d on
20
Janu
ary
2014
. Dow
nloa
ded
by U
nive
rsity
of
Nor
th C
arol
ina
at C
hape
l Hill
on
06/0
6/20
14 1
9:40
:29.
View Article Online

pathway, potentially electron transfer, as observed in the case ofRu(II)-functionalized assemblies of polyuorene and poly(3-hexylthiophene) homopolymers.16,17 This variation was morepronounced for PF2T–Ru in accordance with a decrease in theintegral spectral overlap and the respective energy transferefficiency.
To gain additional insight into the early time photophysicalbehavior of the hybrid assemblies, femtosecond transientabsorption data were recorded and the kinetic traces of PFT–Hex, PF2T–Hex, PFT–Ru, and PF2T–Ru conjugated backbonestimulated emission are shown in Fig. 3. Aer direct excitationat 388 nm, the stimulated emission of PFT–Ru and PF2T–Rubackbones decayed biexponentially on an ultrafast time scale(Fig. 3). The emission lifetimes of the hybrids were signi-cantly attenuated when compared to those characteristics ofthe model polymers exhibiting major transient components of380 ps for PFT–Hex and 405 ps for PF2T–Hex. The PFT–Rukinetic trace was dominated by the 700 fs component (75%)with the 2.0 ps (25%) constituent indicating a secondary non-radiative pathway. Meanwhile, the PF2T–Ru kinetic traceindicated two components of 1.8 ps (75%) and 4.8 ps (25%).Based on the integral overlap of donor emission and acceptorabsorption spectra, the predicted FRET rate constants wereestimated to be �1.2 and �4 ps for PFT–Ru and PF2T–Ru,respectively. As a result, the 700 fs and 4.8 ps components inthe kinetic traces of the hybrid polymers were attributed to theenergy transfer, whereas the 2.0 and 1.8 ps kinetic componentswere associated with charge-separation processes.16,17 Asmentioned previously, the signicant decrease of the FRETpathway in the PF2T–Ru system was attributed to a smallspectral overlap due to the bathochromically shied emissionof the polymer backbone and decreased quantum efficiency,kinetically favoring an electron transfer process. In the case ofthe model polymers PFT–Hex and PF2T–Hex, shorter 70 ps and50 ps time components, as well as the corresponding biexpo-nential character of the transients, were attributed to intra-chain exciton migration, structural and/or vibrationalrelaxation.22
Electrochemistry
The electrochemical properties of hybrids PFT–Ru and PF2T–Ruwere studied in 0.1M tetrabutylammonium hexauorophosphate(TBAPF6) acetonitrile solutions using a platinum button, plat-inum ag, and non-aqueous Ag/Ag+ electrode (calibrated versusthe ferrocene/ferrocenium standard redox couple) as working,counter, and reference electrodes, respectively. Electrochemicalexperiments on PFT–Hex and PF2T–Hex systems were carried outunder similar conditions in dichloromethane and tetrahydro-furan solutions for the oxidation and reduction scans, corre-spondingly. The cyclic voltammograms (CVs) and differentialpulse voltammograms (DPVs) of all the polymers are given inFig. 4. Redox potentials of the studied systems are summarized inTable 2.
As can be seen in Fig. 4A and C, in CV and DPV experiments,PFT–Hex and PF2T–Hex systems exhibited quasi-reversibleoxidation and reduction transitions with the potentials of 0.45 Vand �2.46 V, as well as 0.38 V and �2.37 V for PFT and PF2Tscaffolds, respectively. Ca. 70 mV cathodically shied oxidationpotential was characteristic of PF2T–Hex, consistent with themore electron-rich character of the polymer backbone.
As expected, hybrid systems PFT–Ru and PF2T–Ru exhibitedcumulative electrochemical behavior of both pendant Ru(II)polypyridyl complexes and polymer backbones. As a result, eachcyclic voltammogram contained a single reversible metal-centered Ru2+/3+ oxidation wave at ca. 0.9 V along with polymerbackbone oxidation waves with irreversibility caused by over-oxidation upon high scanning potentials required to study theoverall behavior of the assemblies. Forward cathodic scansrevealed three ligand-based iTMC reduction waves for PFT–Ruand PF2T–Ru, essentially similar to those of the parent Ru(II)complex.16 The lack of band denition and limited reversibilityof the reduction transitions upon the reverse cathodic scans forthe polymer hybrids were hypothesized to arise due to the highdensity of the iTMC chromophores, likely resulting in mixedvalence states, aggregation owing to partial reduction of theassembly, or different local environments felt by separate iTMCunits of the macromolecule. Similar observations were previ-ously made for polystyrene–ruthenium(II) polypyridyl systemswith high iTMC functionalization density.23
Due to partial irreversibility of the redox transitions, DPVexperiments were also employed to reliably access the photo-chemically signicant redox potentials of PFT–Ru and PF2T–Ruusing the same conditions as those employed for the CV experi-ments. This method has been shown to selectively extract fara-daic processes andminimize errors due to overpotential generallyencountered in CV experiments. Consequently, in both cases,Ru2+/3+ and Ru2+/1+ transitions were determined to occur at ca.0.9 V and �1.6 V, respectively, with the polymer backboneoxidation onsets appearing at 0.57 V for PFT and 0.46 V for PF2T(Table 2). It is interesting to note that polymer backbone oxida-tion waves were observed to occur ca. 0.1 V higher potentials inthe case of Ru(II)-based systems when compared to the Hex-basedanalogues. This nding can be partially attributed to the polymerbackbone twisting by the bulky iTMC chromophores, causing adecrease in the mean conjugation length of the main chain.
Fig. 3 (A) The decays of the stimulated emission transient signals forPFT–Hex (red) and PFT–Ru (green) at 490 nm and (B) for PF2T–Hex(red) and PF2T–Ru (green) at 500 nm along with the respectivebiexponential fittings.
2366 | Polym. Chem., 2014, 5, 2363–2369 This journal is © The Royal Society of Chemistry 2014
Polymer Chemistry Paper
Publ
ishe
d on
20
Janu
ary
2014
. Dow
nloa
ded
by U
nive
rsity
of
Nor
th C
arol
ina
at C
hape
l Hill
on
06/0
6/20
14 1
9:40
:29.
View Article Online

Based on the electrochemical data, an energy level diagramshowing the HOMO and LUMO values of PFT–Hex, PF2T–Hexand a monomeric Ru(II) model complex (Ru-M)16 was con-structed (Fig. 5). The onset and E1/2 potentials for the polymersand Ru-M, respectively, were used to estimate the HOMO andLUMO values relative to the vacuum level by employing theconversion HOMO (eV) ¼ Eox + 5.1 V and LUMO (eV) ¼ Ered +5.1 V.24,25 Additionally, the energy levels of II/III and III/IVredox couples for the Ru(ph-NH-CO-trpy) (bpy)(OH2)]
4+ Ru-Cwater splitting catalyst26 are given in Fig. 5, provided that NHEis positioned at 4.44 eV vs. vacuum (IUPAC recommendedvalue).
As can be seen in Fig. 5, model polymers PFT–Hex andPF2T–Hex possessed higher-lying HOMO and LUMO values byca. 0.4 eV and 0.5 eV, as well as 0.8 eV and 0.7 eV, respectively,when compared to the monomeric complex Ru-M. This ndingindicated that both polymer backbones were energetically
capable of undergoing photoinduced charge separation in thehybrid assemblies, with PF2T offering somewhat higher holestabilization. By analyzing electrochemical and optical data, thedriving force of electron transfer from the polymer backbone tothe Ru(II) sites was estimated to be DG0 ¼ �0.52 eV and DG0 ¼�0.51 eV for PFT–Ru and PF2T–Ru, respectively, from asimplied Rehm–Weller equation.27,28 These values indicate aminimal thermodynamic activation barrier for the photoin-duced electron transfer process in these assemblies, supportingsimilar assigned electron transfer rate constant values (2.0 and1.8 ps for PFT–Ru and PF2T–Ru, respectively), observed in thetransient absorption spectra (Fig. 3).29 Additionally, it is
Fig. 4 Cyclic voltammograms and differential pulse voltammograms of PFT–Hex (A) and PF2T–Hex (B) in 0.1 M TBAPF6 dichloromethane(oxidation scans) or tetrahydrofuran (reduction scans) solutions, as well as those of PFT–Ru (C) and PF2T–Ru (D) in 0.1 M TBAPF6 acetonitrilesolutions. A platinum button, platinum flag and non-aqueous Ag/Ag+ electrode (calibrated versus the Fc/Fc+ standard redox couple) were usedas the working, counter and reference electrodes, correspondingly. Cyclic voltammograms were recorded at a 100 mV s�1 scan rate.
Table 2 Electrochemical data for PFT–Hex, PF2T–Hex, PFT–Ru, andPF2T–Ru. Given in parentheses are DPV values
Compound PFT–Hex PF2T–Hex PFT–Ru PF2T–Ru
E0ox, V 0.45a
(0.45a)0.38a
(0.37a)0.59, 0.90(0.57,a 0.90)
0.49, 0.90(0.46,a 0.90)
E0red, V �2.46a
(�2.37a)�2.37a
(�2.37a)�1.67,b �1.83,b
�2.26b (�1.61)�1.63,b �1.84,b
�2.26b (�1.60)
a Onset values of redox transitions. b Peak values of forward cathodicscans. All potentials are given versus the Fc/Fc+ standard redox couple.
Fig. 5 Energy level diagram showing HOMO and LUMO levels ofPFT–Hex, PF2T–Hex and Ru–M vs. vacuum and NHE, along with II/IIIand III/IV redox couple energy levels of the [Ru(ph-NH-CO-trpy)(bpy)(OH2)]
4+ Ru-C water splitting catalyst.
This journal is © The Royal Society of Chemistry 2014 Polym. Chem., 2014, 5, 2363–2369 | 2367
Paper Polymer Chemistry
Publ
ishe
d on
20
Janu
ary
2014
. Dow
nloa
ded
by U
nive
rsity
of
Nor
th C
arol
ina
at C
hape
l Hill
on
06/0
6/20
14 1
9:40
:29.
View Article Online

interesting to note that the hybrid assembly backbones areenergetically capable of oxidizing the Ru(ph-NH-CO-trpy)(b-py)(OH2)]
4+ water splitting catalyst to the IV formal redox state,thus showing promise as scaffolds for solar energy storage.
To date, molecular chromophore-assemblies have emergedas dened systems to drive water splitting reactions in dye-sensitized photoelectrosynthesis cells.30 In these scaffolds,surface-bound chromophore excitation results in a charge-separated state, facilitating electron injection into the semi-conductor interface and the oxidation of the adjacent watersplitting catalyst to drive the respective reaction. As a result,chemical fuels are produced in such devices instead of photo-current, allowing for solar energy storage. Similarly, when usedin conjunction with catalysts, conjugated polymer–iTMCassemblies could function as effective redox shuttles in photo-chemical reactions with the advantages of large molar absorp-tivity and high-mobility multi-carrier formation provided by theconjugated backbone.
In situ spectroelectrochemistry
In situ spectroelectrochemical studies31 were employed toelucidate the properties of the polymer backbone oxidized andiTMC chromophore reduced states, as these states were antici-pated to be the products of photoinduced charge separation.For spectroelectrochemical studies, thin lms of the polymerswere prepared on ITO-coated glass transparent working elec-trodes by drop-casting either from acetone (PFT–Ru and PF2T–Ru) or tetrahydrofuran solutions. Sub-second changes in thepolymer lm absorption were monitored as they were subjected
to linear sweep voltammetry scans. Spectroelectrochemistryplots for all the polymers are given in Fig. 6.
As can be seen in Fig. 6A and D, upon oxidation of PFT–Hexand PF2T–Hex, visible region absorption signatures appeared atca. 560 nm and 610 nm, respectively. The 50 nm red shi in theoxidized state absorption peak of PF2T–Hex can be attributed toan increase in charge carrier delocalization and, possibly,overall stabilization of the oxidized state. Similar trends wereobserved upon oxidation of PFT–Ru and PF2T–Ru (Fig. 6B andE), where the polymer backbone polaron signals arose at ca. 585and 630 nm, respectively. Such observations are consistent withthe electrochemistry data (Fig. 4A and C) and the tendency ofthe PF2T–Ru assembly to preferentially undergo electrontransfer potentially followed by hole delocalization and stabili-zation of the charge-separated state. Further oxidation of thehybrid assemblies was accompanied by a bleach of Ru MLCTabsorption bands, in agreement with the literature.32–34
Upon reduction (Fig. 6C and F), a signal at ca. 550 nmappeared for both assemblies. In accordance with the CV andDPV results and the peak position, this signal was attributed tothe formation of a reduced complex [RuII(L)2(L
�)]+ (Ru(I)), as4,40-disubstituted Ru(II) polypyridines generally exhibit redshied absorption bands resembling those of the 2+ stateMLCT upon rst reduction.12,16,34 In the hybrid macromolecularantennae, along with the positive polarons on the conjugatedpolymer backbones, Ru(I) is an anticipated product of photo-induced charge separation, as well as a high-energy redoxintermediate, facilitating electron injection into the conduc-tion band of the semiconductor in solar photoelectrochemicalcells.
Fig. 6 Spectroelectrochemistry data for PFT–Hex (A) and PF2T–Hex (B) films immersed in 0.1 M TBAPF6 acetonitrile solution, as well as PFT–Ru(B and C) and PF2T–Ru (E and F) films immersed in 0.1 M TBAPF6 tetrahydrofuran solution. ITO/glass, platinum flag and silver wire pseudor-eference electrode were used as the working, counter and reference electrodes, respectively.
2368 | Polym. Chem., 2014, 5, 2363–2369 This journal is © The Royal Society of Chemistry 2014
Polymer Chemistry Paper
Publ
ishe
d on
20
Janu
ary
2014
. Dow
nloa
ded
by U
nive
rsity
of
Nor
th C
arol
ina
at C
hape
l Hill
on
06/0
6/20
14 1
9:40
:29.
View Article Online

Conclusions
A new family of ionic transition complex conjugated polymersbased on uorene and thiophene repeat units have beensynthesized via the Pd-mediated Suzuki cross-coupling and the1,3-dipolar “click” cycloaddition chemistry approach. Theresulting scaffolds exhibit a bathochromic shi in absorptionmaxima and, thus, an increase in the solar radiation spectrumcoverage when compared to their previously reported poly-uorene analogues. Additionally, variable fractions of electronrich thiophene units stabilize the oxidized states and allow foran efficient control of energy and charge transfer pathways inthe assemblies. A combination of long-lived Ru(II) tris(bipyr-idine) excited states, large optical cross-sections of the conju-gated backbones, as well as dened photophysical interactionsbetween the two building blocks, provides a basis for theapplication of these hybrid polymers in solar energy harvestingand storage architectures.
Acknowledgements
This material is based wholly upon work supported by the UNCEFRC: Solar Fuels, an Energy Frontier Research Center fundedby the U.S. Department of Energy, Office of Science, Office ofBasic Energy Sciences under Award number DE-SC0001011.
Notes and references
1 B. Oregan and M. Gratzel, Nature, 1991, 353, 737–740.2 D. Moonshiram, J. W. Jurss, J. J. Concepcion, T. Zakharova,I. Alperovich, T. J. Meyer and Y. Pushkar, J. Am. Chem. Soc.,2012, 134, 4625–4636.
3 J. J. Concepcion, J. W. Jurss, P. G. Hoertz and T. J. Meyer,Angew. Chem., Int. Ed., 2009, 48, 9473–9476.
4 J. J. Concepcion, J. W. Jurss, J. L. Templeton and T. J. Meyer,J. Am. Chem. Soc., 2008, 130, 16462–16463.
5 L. M. Dupray, M. Devenney, D. R. Striplin and T. J. Meyer, J.Am. Chem. Soc., 1997, 119, 10243–10244.
6 M. Sykora, K. A. Maxwell, J. M. DeSimone and T. J. Meyer,Proc. Natl. Acad. Sci. U. S. A., 2000, 97, 7687–7691.
7 B. Happ, A. Winter, M. D. Hager and U. S. Schubert, Chem.Soc. Rev., 2012, 41, 2222–2255.
8 C. N. Fleming, L. M. Dupray, J. M. Papanikolas andT. J. Meyer, J. Phys. Chem. A, 2002, 106, 2328–2334.
9 S. M. Baxter, W. E. Jones, E. Danielson, L. Worl, G. Strouse,J. Younathan and T. J. Meyer, Coord. Chem. Rev., 1991, 111,47–71.
10 S. Campagna, F. Puntoriero, F. Nastasi, G. Bergamini andV. Balzani, Top. Curr. Chem., 2007, 280, 117–214.
11 W. F. Wacholtz, R. A. Auerbach and R. H. Schmehl, Inorg.Chem., 1986, 25, 227–234.
12 C. M. Elliott and E. J. Hershenhart, J. Am. Chem. Soc., 1982,104, 7519–7526.
13 A. Juris, V. Balzani, F. Barigelletti, S. Campagna, P. Belserand A. Von Zelewsky, Coord. Chem. Rev., 1988, 84, 85–277.
14 K. Kalyanasundaram, Coord. Chem. Rev., 1982, 46, 159–244.15 D. G. McCafferty, D. A. Friesen, E. Danielson, C. G. Wall,
M. J. Saderholm, B. W. Erickson and T. J. Meyer, Proc.Natl. Acad. Sci. U. S. A., 1996, 93, 8200–8204.
16 L. Wang, E. Puodziukynaite, R. P. Vary, E. M. Grumstrup,R. M. Walczak, O. Y. Zolotarskaya, K. S. Schanze,J. R. Reynolds and J. M. Papanikolas, J. Phys. Chem. Lett.,2012, 3, 2453–2457.
17 L. Wang, E. Puodziukynaite, E. M. Grumstrup, A. C. Brown,S. Keinan, K. S. Schanze, J. R. Reynolds andJ. M. Papanikolas, J. Phys. Chem. Lett., 2013, 4, 2269–2273.
18 H. J. Kim, A. R. Han, C.-H. Cho, H. Kang, H.-H. Cho,M. Y. Lee, J. M. J. Frechet, J. H. Oh and B. J. Kim, Chem.Mater., 2012, 24, 215–221.
19 H. L. Vaughan, F. M. B. Dias and A. P. Monkman, J. Chem.Phys., 2005, 122, 014902.
20 J. A. Faiz, R. M. Williams, M. Silva, L. De Cola andZ. Pikramenou, J. Am. Chem. Soc., 2006, 128, 4520–4521.
21 G. J. Wilson, W. H. F. Sasse and A. W. H. Mau, Chem. Phys.Lett., 1996, 250, 583–588.
22 E. Busby, E. C. Carroll, E. M. Chinn, L. Chang, A. J. Mouleand D. S. Larsen, J. Phys. Chem. Lett., 2011, 2, 2764–2769.
23 Y. L. Sun, Z. Chen, E. Puodziukynaite, D. M. Jenkins,J. R. Reynolds and K. S. Schanze, Macromolecules, 2012, 45,2632–2642.
24 C. M. Cardona, W. Li, A. E. Kaifer, D. Stockdale andG. C. Bazan, Adv. Mater., 2011, 23, 2367–2371.
25 B. C. Thompson, Conjugated Polymer Electrochromic andLight-Emitting Devices, Ph.D. thesis, University of Florida,2005.
26 D. L. Ashford, D. J. Stewart, C. R. Glasson, R. A. Binstead,D. P. Harrison, M. R. Norris, J. J. Concepcion, Z. Fang,J. L. Templeton and T. J. Meyer, Inorg. Chem., 2012, 51,6428–6430.
27 D. Rehm and A. Weller, Isr. J. Chem., 1970, 8, 259–271.28 H. Oevering, M. N. Paddon-Row, M. Heppener, A. M. Oliver,
E. Cotsaris, J. W. Verhoeven and N. S. Hush, J. Am. Chem.Soc., 1987, 109, 3258–3269.
29 R. A. Marcus, Rev. Mod. Phys., 1993, 65, 599–610.30 D. L. Ashford, W. Song, J. J. Concepcion, C. R. K. Glasson,
M. K. Brennaman, M. R. Norris, Z. Fang, J. L. Templetonand T. J. Meyer, J. Am. Chem. Soc., 2012, 134, 19189–19198.
31 D. Y. Liu, A. D. Chilton, P. Shi, M. R. Craig, S. D. Miles,A. L. Dyer, V. W. Ballarotto and J. R. Reynolds, Adv. Funct.Mater., 2011, 21, 4535–4542.
32 P. M. S. Monk, R. J. Mortimer and D. R. Rosseinsky,Electrochromism and Electrochromic Devices, CambridgeUniversity Press, Cambridge, 2007.
33 R. J. Mortimer, A. L. Dyer and J. R. Reynolds, Displays, 2006,27, 2–18.
34 E. Puodziukynaite, J. L. Oberst, A. L. Dyer and J. R. Reynolds,J. Am. Chem. Soc., 2012, 134, 968–978.
This journal is © The Royal Society of Chemistry 2014 Polym. Chem., 2014, 5, 2363–2369 | 2369
Paper Polymer Chemistry
Publ
ishe
d on
20
Janu
ary
2014
. Dow
nloa
ded
by U
nive
rsity
of
Nor
th C
arol
ina
at C
hape
l Hill
on
06/0
6/20
14 1
9:40
:29.
View Article Online

Ultrafast Formation of a Long-Lived Charge-Separated State in a Ru-Loaded Poly(3-hexylthiophene) Light-Harvesting PolymerLi Wang,†,‡ Egle Puodziukynaite,⊥,‡ Erik M. Grumstrup,† Aaron C. Brown,† Shahar Keinan,†
Kirk S. Schanze,⊥ John R. Reynolds,*,§ and John M. Papanikolas*,†
†Department of Chemistry, University of North Carolina at Chapel Hill, Chapel Hill, North Carolina 27599, United States⊥Department of Chemistry, University of Florida, Gainesville, Florida 32611-7200, United States§School of Chemistry and Biochemistry, School of Materials Science and Engineering, Center for Organic Photonics and Electronics,Georgia Institute of Technology, Atlanta, Georgia 30332, United States
*S Supporting Information
ABSTRACT: A light-harvesting macromolecular assembly (PT-Ru) consisting of apoly(3-hexylthiophene) (P3HT) scaffold and pendant Ru(II) polypyridyl complexes thatexhibits rapid and efficient formation of a long-lived charge-separated state is describedhere. Photoinduced electron transfer from the polymer backbone to Ru(II) wasinvestigated by femtosecond transient absorption spectroscopy. Photoexcitation at 388nm results in the excitation of both the polymer backbone and Ru(II) complexes, withrelative excitation probabilities of 60 and 40%, respectively. The dominant pathway(∼85%) for decay of the polymer excited state is direct electron transfer from the polymerscaffold to Ru(II), forming a positive polaron and a reduced complex [RuII(L)2(L
−)]+,denoted Ru(I). The charge-separated state PT+•-Ru(I) is long-lived, persisting for 20−60μs, and is attributed to the high mobility of holes on the polymer backbone, whichfacilitates spatial separation of the electron and hole, delaying recombination. Theremaining 15% of the polymer excited states undergo an alternate deactivation mechanism,possibly energy transfer to Ru(II), forming Ru(II)*. Ru(II)* formed by either direct excitation or energy transfer undergoes backenergy transfer to the scaffold, forming the low-lying polymer triplet state on the nanosecond time scale.
SECTION: Spectroscopy, Photochemistry, and Excited States
Hybrid materials that combine the chemical functionalityof Ru(II) polypyridyl coordination complexes with the
light-harvesting ability of organic materials are particularlyattractive for next-generation solar energy conversion applica-tions. Ruthenium(II) complexes have visible absorption bandsthat produce long-lived, photostable excited states andelectronic properties that can be tuned through syntheticmanipulation, yielding complexes capable of performing chargeseparation and catalytic functions.1−3 While extremely versatile,they are limited by relatively weak absorptivities (ε ≈ 104 M−1
cm−1) compared to organic systems, thus necessitating longerpath lengths for efficient light collection. Furthermore, catalyticwater splitting requires their attachment to electrodes or thepresence of redox mediators to deliver the multiple redoxequivalents needed for this multielectron reaction. On the otherhand, organic materials such as conjugated polymers have largeextinction coefficients and exhibit rapid energy transport,making them ideal for light-harvesting functions.4,5 In addition,a single chain can store multiple charge carriers (electrons orholes) and thus serve as a reservoir of redox equivalents thatcan be used in multielectron catalytic reactions, such as watersplitting. However, their short singlet-state lifetimes competewith charge separation, and they lack the chemical versatility ofmetals to perform catalytic functions.
We have developed a series of modular macromolecularassemblies that combine the functionality of conjugatedpolymers with Ru(II) coordination complexes. One examplefrom this series is a light-harvesting assembly utilizing apolyfluorene scaffold (PF-Ru),6 where rapid energy transfer ofthe PF* excited state to the pendant complexes (τEnT = 500 fs)yields a long-lived 3MLCT excited state. This Letter describesan assembly incorporating poly(3-hexylthiophene) (P3HT) asthe polymer scaffold that consists of ∼85 thiophene repeatunits, each functionalized with a metal complex (PT-Ru, Figure1A; PT ≡ poly[3-(6-bromohexyl)thiophene). In contrast to PF-Ru, where energy transfer dominates, the primary relaxationpathway in PT-Ru is electron transfer, which results in the rapidformation of a PT+•-Ru(I) charge-separated (CS) state (Ru(I)≡ [RuII(L)2(L
−)]+) within 1−2 ps. Once formed, the CS statepersists for tens of microseconds, most likely due to a high holemobility on the polymer that allows the charges to becomespatially separated from each other, delaying recombination.7
The formation of long-lived CS states is critical to the functionof solar energy devices because it allows more time for slower
Received: May 27, 2013Accepted: June 26, 2013
Letter
pubs.acs.org/JPCL
© XXXX American Chemical Society 2269 dx.doi.org/10.1021/jz401089v | J. Phys. Chem. Lett. 2013, 4, 2269−2273

processes, such as catalytic reactions, to take place beforedeactivation via back electron transfer can occur.The PT-Ru assembly was synthesized via a multistep route,
as shown in Scheme S1 (Supporting Information). Theregioregular PT scaffold was obtained using the Grignardmetathesis (GRIM) polymerization approach8,9 and treatedwith sodium azide to yield poly[3-(6-azidohexyl)thiophene].Finally, the azide-functionalized polymer and an alkynyl-containing Ru(II) polypyridyl complex were combined underCu(I)-assisted “click” chemistry conditions6,10−12 to afford thePT-Ru assembly, which was obtained with essentiallyquantitative azide−alkyne cycloaddition conversion.The absorption spectrum of PT-Ru (Figure 1B) shows a
strong low-energy band centered at 450 nm that hascontributions from both the Ru(II) complexes and thepolythiophene backbone. The PT (Scheme S1, SupportingInformation) absorption, which corresponds to the lowest-energy π → π* transition, is broad and featureless with a molarabsorptivity of 1.2 × 104 cm−1 M−1 per repeat unit at itsmaximum, 445 nm. The MLCT transition of the model Ru(II)complex (Ru-M, Scheme S2 (Supporting Information)) iscentered at 455 nm with ε = 1.5 × 104 cm−1 M−1. Excited-stateformation is partitioned between the Ru(II) complexes and thepolymer backbone, and at 388 nm, 60% of the incident light isabsorbed by the polymer and the remaining 40% is absorbed bythe Ru(II) complexes.
When excited at 388 nm, the emission spectrum of PT-Ru isdominated by an intense 3MLCT emission band at 640 nm. Aslight distortion on the high-energy side of the band relative tothe Ru(II) monomer complex is attributed to the poly-thiophene polymer. The PT emission in tetrahydrofuran(THF) has clear vibronic structure with a 0−0 transition at575 nm, an excited-state lifetime of 580 ps, and a quantum yieldof 0.27.13 The relatively weak contribution of the polythio-phene to the overall emission in PT-Ru, despite significantphoton absorption by the polymer backbone, is indicative of anefficient quenching of the polythiophene excited state by theRu(II) complex.In principle, polythiophene excited-state quenching can
occur through either an energy- or electron-transfer processor a combination of the two. In the limit that energy transferplays no role, the 3MLCT emission observed in the PT-Ruassembly would arise entirely from direct excitation of theRu(II) complexes, and the emission excitation spectrum wouldmatch the absorption spectrum of the Ru(II) model. This is notthe case. The excitation spectrum of PT-Ru monitored at 640nm is significantly broader than the ground-state absorptionspectrum of the Ru-M complex. This suggests that energytransfer does contribute to the polythiophene quenching,although other observations described below indicate that it is arelatively minor contributor.The excited-state dynamics following 388 nm photo-
excitation of PT-Ru (in acetonitrile) and PT (in THF) aremonitored using broad-band pump−probe spectroscopy ontime scales ranging from femtoseconds to microseconds. Inboth cases, experiments were performed in solution at lowconcentration in order to minimize contributions from chain−chain interactions.Transient absorption spectra for the PT system are shown in
Figure 2A. At Δt = 0, the spectrum is characterized by aground-state bleach at 450 nm and stimulated emission bandcentered at 550 nm. The bleach feature exhibits a slight shifttoward the blue as it decays in amplitude with τ ≈ 585 ps. Thestimulated emission evolves to lower energy, shifting 25 nm inthe first 50 ps and another 5 nm over the next 200−300 ps,ultimately resulting in a structured spectrum with peaks at 575and 615 nm. This time-dependent red shift is attributed toexcited-state self-trapping by torsional relaxation rather than theexcitonic energy transfer to lower-energy segments.14
The transient spectra of the PT-Ru assembly differsignificantly from those of PT (Figure 2B). The absorptionband at ∼370 nm is the result of direct excitation of thependant Ru(II) complexes. The bleach feature that extendsfrom 400 to 500 nm is significantly broader than the Ru*bleach, especially at early times, suggesting that it results from acombination of the loss of polythiophene and Ru(II) ground-state absorption, as well as stimulated emission from thepolythiophene excited state. The stimulated emission (500−600 nm) is quenched during the first 1−2 ps and replaced by anabsorption band at 550 nm. Even at 50 ps, long after thepolythiophene excited state has decayed away, the transientspectrum does not resemble that of Ru*, indicating thepresence of a quenching mechanism other than energy transfer.Spectroelectrochemical data provide insight into the photo-
product and the band assignments. Figure 2D shows differencespectra obtained by subtracting the ground-state absorptionspectrum of the assembly, A(λ), from the spectra obtainedfollowing quantitative oxidation (AOx) or reduction (ARed), thatis
Figure 1. (A) Chemical structure of the PT-Ru assembly (left) and 3Dstructure obtained from molecular dynamics simulation of a PT-Ruassembly with 15 repeat units. Simulations included 300 explicitacetonitrile solvent molecules and 30 PF6
− counterions, which are notshown for clarity. Atoms highlighted in magenta show thepolythiophene backbone. (B) Absorption and emission spectra ofthe PT-Ru assembly, model polymer (PT), and model Ru complex(Ru-M). The PT-Ru and Ru-M spectra were obtained in acetonitrile;PT was obtained in THF. Extinction coefficients for polymers are perrepeat unit. Emission spectra are scaled to the intensity of theirabsorption spectra. (C) Comparison of the excitation spectrum(black) of PT-Ru monitored at 640 nm and the absorption spectrumof Ru-M. The yellow region depicts the spectral overlap between theabsorption spectrum of Ru-M and emission spectrum of PT.
The Journal of Physical Chemistry Letters Letter
dx.doi.org/10.1021/jz401089v | J. Phys. Chem. Lett. 2013, 4, 2269−22732270

λ λΔ = −A A A( ) ( )Ox Ox (1)
λ λΔ = −A A A( ) ( )Red Red (2)
These spectra represent contributions of oxidized (PT+•-Ru)and reduced (PT-Ru(I)) species to the transient absorptionspectrum. The ΔARed spectrum shows two bands centered at375 and 540 nm that are assigned to Ru(I). The ΔAOxspectrum reveals one broad bleach centered at 475 nm thatcorresponds to the loss of absorption intensity upon oxidationof the polythiophene (PT+•-Ru), and a weak absorption to thered of 550 nm that is assigned to the positive polaronabsorption.7
These spectra suggest that photoexcitation of the poly-thiophene results in the formation of a CS state by directelectron transfer from the polymer backbone to the pendantRu(II). The transient spectrum arising from the CS state(ΔACS) can be estimated from a superposition of ΔAOx andΔARed, that is, ΔACS = ΔAOx + 0.25 × ΔARed.
7 The factor of0.25 is present because in the electrochemical oxidation/reduction of the assembly, ∼4 times as many reducedcomplexes can be accommodated as positive polarons on asingle polymer chain. The similarity between the transientspectrum and ΔACS (Figure 2D) indicates that chargeseparation is the primary quenching mechanism of thepolythiophene excited state (1a in Scheme 1).The time scale for charge separation is obtained by
monitoring the growth of the 550 nm signal as a function ofpump−probe delay (Figure 2C). The growth is well-describedby a biexponential function with a large fast (1.1 ps, 85% ± 5%)
and a smaller slow (8.2 ps, 15% ± 5%) component. Thepresence of two kinetic components indicates that the twodynamical processes arise from different “states” in theassembly. Molecular dynamics simulations of a 15 repeat unitmodel polymer in explicit solvent (Figure 1A) show a broaddistribution of nearest distances between the polymer backboneand Ru(II) complexes that span 0.5−2.2 nm. While ∼40% ofRu chromophores are less than 1 nm from the backbone, thereis a significant fraction with a greater separation. Thisdistribution could be the origin of the biexponential kinetics,with faster quenching to the complexes situated near thebackbone and slower quenching occurring when the complex isfarther away.The fast component is assigned to the electron-transfer
process (1a, Scheme 1). The electron transfer frompolythiophene to Ru(II) displays no temperature dependence(Figure 3) in its rate constant, suggesting that it is probably
facilitated by a small activation barrier. The thermodynamicdriving force (ΔG°) is estimated to be −0.49 eV from the redoxpotentials (Supporting Information), which, given the smallbarrier, implies a reorganization energy of ∼0.5 eV.15
The physical origin of the slower (8.2 ps) component is lesscertain. One possibility is that it reflects a competitivepolythiophene excited state to Ru(II) energy-transfer pathway
Figure 2. (A) Transient absorption spectra of PT in THF at 0.25, 0.5,1, 2, 5, 10, 50, 100, and 200 ps. (B) Transient absorption spectra ofPT-Ru in acetonitrile at 0.20, 0.25, 0.35, 0.50, 0.75, 2, and 50 ps, aswell as Ru-M (gray, shaded). All transient spectra were obtained at anexcitation wavelength (λexc) of 388 nm (50 nJ/pulse). (C) Kinetictrace from PT-Ru monitored at 550 nm (circles); the solid line is a fitto a biexponential model with fast (1.1 ps, 85%) and slow (8.2 ps,15%) components. (D) Comparison of the PT-Ru transientabsorption spectrum at 50 ps (blue circle) with the transientabsorption spectrum of the PT+•-Ru(I) CS state, ΔACS, predicted byspectroelectrochemistry (gray shaded). The red and green lines arecontributions from the reduced (ΔARed) and oxidized (ΔAOx) species,respectively.
Scheme 1. Illustration of the Dynamic Processes Resultingfrom Photoexcitation of the PT-Ru Assembly in Acetonitrile
Figure 3. (A) Kinetic traces of PT-Ru at 550 nm in acetonitrile underdifferent temperatures, with excitation at 388 nm at 50 nJ/pulse. (B)The plot of lnkET versus 1/T. Error bars represent a 2% standarddeviation obtained from the fitting of the electron-transfer rate, kET.
The Journal of Physical Chemistry Letters Letter
dx.doi.org/10.1021/jz401089v | J. Phys. Chem. Lett. 2013, 4, 2269−22732271

(1b, Scheme 1). We recently reported on a Ru(II)-loadedpolyfluorene system, where energy- and electron-transferquenching both occur. In that case, rapid energy transfer(85%) is facilitated by a large spectral overlap between thepolymer emission and Ru(II) absorption (i.e., ∫ ε(υ)F(υ ) d(υ))that gives rise to energy transfer on the femtosecond timescale.6,16 The spectral overlap between the PT emission andRu(II) absorption is about a factor of 2.7 smaller in this system(2.8 × 10⁻¹⁴ versus 7.4 × 10⁻¹⁴ cm−4 for PF-Ru). We estimatefrom the spectral overlap in PT-Ru, as well as the lifetime andquantum yield measurements, that the energy-transfer rate kEnTis ∼(10 ps)−1, which is comparable to the 8.2 ps component.Dynamic spectral evolution on the nanosecond to micro-
second time scale (Figure 4) was monitored using an
electronically delayed continuum probe pulse generated by adiode-laser-pumped photonic crystal fiber with ∼500 ps timeresolution. On the nanosecond time scale, an absorption bandcentered ∼700 nm emerges in the PT-Ru transient spectra(Figure 4C). The band grows with a rise time of 70 ns, reachinga maximum intensity at about 200 ns, after which it decays onthe microsecond time scale (Figure 4D). This band isremarkably similar in both position and lifetime to the near-infrared excited-state absorption observed in PT (Figure 4A),which decays with τ = 13 μs (Figure 4B), and has beenattributed by others to a triplet excited state of the polymer.17,18
Its growth in PT-Ru implies a delayed formation of 3PT*-Ru,most likely through a PT-Ru* to 3PT*-Ru energy transfer (2,Scheme 1), which is then followed by excited-state decay (3,Scheme 1) on the microsecond time scale. Assignment totriplet back transfer is also supported by the observation of thelow quantum efficiency per complex (Φ = 0.13 × ΦRu‑M) andthe short (<100 ns) lifetime of the 3MLCT state compared tothat of the Ru(II) model complex (ΦRu‑M = 0.095, 1.25 μs). Wenote that this process is not competitive with the ultrafastcharge injection that typically occurs from Ru excited states intoTiO2 and thus should not interfere with light harvesting in thetraditional sense.By 30 μs, the 700 nm absorption band in PT-Ru has
disappeared, and the absorption band that remains matches the
intensity and shape of the 1 ns spectrum, other than the smalleramplitude of bleach (Figure 4C). At this point, the 3PT*-Ruformed either by direct excitation or back energy transfer hasdecayed back to the ground state, suggesting that the remainingabsorption is due almost entirely to the CS state, PT+•-Ru(I).The CS state persists for tens of microseconds, eventuallyundergoing back electron transfer (4, Scheme 1) with τ ≈ 20μs, which is comparable to the mean polaron lifetime inpolythiophene thin films (17 μs).19 As compared with thepolyfluorene assembly, the lifetime of the CS state of PT+•-Ru(I) is several hundred-fold longer than the 6 ns observed inPF+•-Ru(I).6 This long-lived state is perhaps a consequence ofthe high hole mobility in polythiophene, which would enablethe hole to become spatially separated from the Ru(I) anddelay recombination.7
The PT-Ru assembly couples the functional elements of bothconjugated polymers and metal complexes. Photoexcitation ofthe PT scaffold is followed by rapid electron transfer to producea PT+•-Ru(I) CS state (85% yield, based on amplitudes ofkinetic components) that exhibits a ∼20 μs lifetime. Theformation of a long-lived CS state is critical for solar energyconversion applications.
■ ASSOCIATED CONTENT*S Supporting InformationExperimental procedures, characterization data, electrochemis-try, and spectroelectrochemistry results. This material isavailable free of charge via the Internet at http://pubs.acs.org.
■ AUTHOR INFORMATIONCorresponding Author*E-mail: [email protected] (J.M.P.); [email protected] (J.R.R.).Author Contributions‡L.W. and E.P. contributed equally.NotesThe authors declare no competing financial interest.
■ ACKNOWLEDGMENTSThis work was supported by the UNC EFRC: Center for SolarFuels, an Energy Frontier Research Center funded by the U.S.Department of Energy, Office of Science, Office of Basic EnergySciences under Award Number DE-SC0001011. L.W. alsothanks Professor David W. Thompson at Memorial Universityfor the academic consultations and suggestions.
■ REFERENCES(1) Concepcion, J. J.; Jurss, J. W.; Templeton, J. L.; Meyer, T. J. OneSite is Enough. Catalytic Water Oxidation by [Ru(tpy)(bpm)-(OH2)]
2+ and [Ru(tpy)(bpz)(OH2)]2+. J. Am. Chem. Soc. 2008, 130,
16462−16463.(2) Kaveevivitchai, N.; Chitta, R.; Zong, R.; El Ojaimi, M.; Thummel,R. P. A Molecular Light-Driven Water Oxidation Catalyst. J. Am.Chem. Soc. 2012, 134, 10721−10724.(3) Duan, L.; Bozoglian, F.; Mandal, S.; Stewart, B.; Privalov, T.;Llobet, A.; Sun, L. A Molecular Ruthenium Catalyst with Water-Oxidation Activity Comparable to that of Photosystem II. Nature2012, 4, 418−423.(4) Collini, E.; Scholes, G. D. Coherent Intrachain Energy Migrationin a Conjugated Polymer at Room Temperature. Science 2009, 323,369−373.(5) Schindler, F.; Jacob, J.; Grimsdale, A. C.; Scherf, U.; Mullen, K.;Lupton, J. M.; Feldmann, J. Counting Chromophores in ConjugatedPolymers. Angew Chem. Int. Ed. 2005, 44, 1520−1525.
Figure 4. (A) Transient absorption spectra of PT in THF withexcitation at 388 nm. (B) Kinetic traces at 780 nm of PT in THF. (C)Transient absorption spectra of PT-Ru in acetonitrile with excitation at388 nm. (D) Kinetic trace at 550 nm of PT-Ru in acetonitrile.
The Journal of Physical Chemistry Letters Letter
dx.doi.org/10.1021/jz401089v | J. Phys. Chem. Lett. 2013, 4, 2269−22732272

(6) Wang, L.; Puodziukynaite, E.; Vary, R. P.; Grumstrup, E. M.;Walczak, R. M.; Zolotarskaya, O. Y.; Schanze, K. S.; Reynolds, J. R.;Papanikolas, J. M. Competition Between Ultrafast Energy Flow andElectron Transfer in a Ru(II)-Loaded Polyfluorene Light-HarvestingPolymer. J. Phys. Chem. Lett. 2012, 2453−2457.(7) Takeda, N.; Miller, J. R. Poly(3-decylthiophene) Radical Anionsand Cations in Solution: Single and Multiple Polarons and TheirDelocalization Lengths in Conjugated Polymers. J. Phys. Chem. B2012, 116, 14715−14723.(8) Loewe, R. S.; Khersonsky, S. M.; McCullough, R. D. A SimpleMethod to Prepare Head-to-Tail Coupled, Regioregular Poly(3-alkylthiophenes) Using Grignard Metathesis. Adv. Mater. 1999, 11,250−253.(9) Kiriy, A.; Senkovskyy, V.; Sommer, M. Kumada Catalyst-TransferPolycondensation: Mechanism, Opportunities, and Challenges. Macro-mol. Rapid Commun. 2011, 32, 1503−1517.(10) Rostovtsev, V. V.; Green, L. G.; Fokin, V. V.; Sharpless, K. B. AStepwise Huisgen Cycloaddition Process: Copper(I)-CatalyzedRegioselective “Ligation” of Azides and Terminal Alkynes. Angew.Chem., Int. Ed. 2002, 41, 2596−2599.(11) Binder, W. H.; Sachsenhofer, R. ‘Click’ Chemistry in Polymerand Materials Science. Macromol. Rapid Commun. 2007, 28, 15−54.(12) Meldal, M. Polymer “Clicking” by CuAAC Reactions. Macromol.Rapid Commun. 2008, 29, 1016−1051.(13) Measured with comparison to a Ru(II) polypyridyl complex inMeCN and corrected for the difference of the solvent refractiveindexes.(14) Busby, E.; Carroll, E. C.; Chinn, E. M.; Chang, L. L.; Moule, A.J.; Larsen, D. S. Excited-State Self-Trapping and Ground-StateRelaxation Dynamics in Poly(3-hexylthiophene) Resolved withBroadband Pump−Dump−Probe Spectroscopy. J. Phys Chem. Lett.2011, 2, 2764−2769.(15) Marcus, R. A.; Sutin, N. Electron Transfers in Chemistry andBiology. Biochim. Biophys. Acta 1985, 811, 265−322.(16) Faiz, J. A.; Williams, R. M.; Silva, M. J. J. P.; De Cola, L.;Pikramenou, Z. A Unidirectional Energy Transfer Cascade Process in aRuthenium Junction Self-Assembled by α- and β-Cyclodextrins. J. Am.Chem. Soc. 2006, 128, 4520−4521.(17) Kraabel, B.; Moses, D.; Heeger, A. J. Direct Observation of theIntersystem Crossing in Poly(3-octylthiophene). J. Chem. Phys. 1995,103, 5102−5108.(18) Wohlgenannt, M.; Jiang, X. M.; Vardeny, Z. V. Confined andDelocalized Polarons in π-Conjugated Oligomers and Polymers: AStudy of the Effective Conjugation Length. Phys. Rev. B 2004, 69,241204.(19) Kinoshita, K.; Koayashi, T.; Nagase, T. N.; Photoinduced, H.Absorption in P3HT/PCBM Bulk Heterostructures. Mater. Sci. Forum2010, 658, 503−506.
The Journal of Physical Chemistry Letters Letter
dx.doi.org/10.1021/jz401089v | J. Phys. Chem. Lett. 2013, 4, 2269−22732273

Frequency Modulated Femtosecond Stimulated RamanSpectroscopy of Ultrafast Energy Transfer in a Donor−AcceptorCopolymerErik M. Grumstrup,† Zhuo Chen,‡ Ryan P. Vary,† Andrew M. Moran,† Kirk S. Schanze,‡
and John M. Papanikolas*,†
†Department of Chemistry, University of North Carolina at Chapel Hill, Chapel Hill, North Carolina 27514, United States‡Department of Chemistry and Center for Macromolecular Science and Engineering, University of Florida, Gainesville, Florida 32611,United States
ABSTRACT: A Raman-pump frequency modulation scheme and an automated signal-processing algorithm are developed for improved collection of time-resolved femtosecondstimulated Raman spectra. Together, these two advancements remove the broadbackground signals endemic to FSRS measurements and retrieve signals with highsensitivity. We apply this frequency-modulated femtosecond stimulated Raman spectros-copy (FM-FSRS) to the characterization of ultrafast energy transport in a copolymercomprised of polystyrene linked oligo(phenylene−ethynylene) donor and thiophene−benzothiadiazole acceptor chromophores. After photoexcitation of the donor, ultrafastenergy transfer is monitored by the decay of donor vibrational modes and simultaneousgrowth of acceptor modes. The FM-FSRS method shows clear advantages in signal-to-noise levels, mitigation of artifact features, and ease of data processing over theconventional FSRS technique.
■ INTRODUCTION
Time-resolved femtosecond stimulated Raman spectroscopy(FSRS) has become an important tool for studying a broadrange of excited state photophysics in solvated chromophoresincluding charge transfer processes, isomerization kinetics, andexcited state proton transfer.1−10 In transient absorptionmeasurements, insight into evolving photophysics is oftenobscured by overlapping electronic resonances. In contrast,FSRS probes vibrational resonances, which are also sensitive toexcited state character but exhibit much narrower lineshapes incondensed phase samples.11 As a consequence, FSRS offersdistinct advantages over transient absorption spectroscopy,where excited state dynamics are often obscured by the broadlinewidths characteristic of electronic resonances.Despite these advantages, FSRS remains a technique that is
practiced by relatively few researchers. Adoption is difficult for anumber of reasons. Chief among these is that FSRS is formallya fifth order process (photoinduced change to the stimulatedRaman spectrum), making its signal size 1−2 orders ofmagnitude smaller than the intensity changes typically foundin transient absorption. Compounding the difficulty is that, incontrast to many nonlinear spectroscopies, the signal is notemitted in a background-free direction. Rather, the FSRS signalis emitted in the same direction as the probe beam, requiring itsisolation from other more intense signals. While many of theseadditional signals can be removed by pump modulation, as intransient absorption, analysis of FSRS spectra still requiressubtraction of a large background that is often an order ofmagnitude larger than the FSRS signal itself.
Background subtraction is not straightforward. It requires anelaborate, painstaking data processing procedure before thedesired signals are isolated, and in cases where a densecollection of overlapping resonances are present, delineation ofexactly where the baseline lies is often ambiguous. Compound-ing this problem is that small wavelength dependent variationsin the detection sensitivity, whether due to the imaging opticsin the spectrometer or the array detector itself, can introduceartifacts that are difficult to distinguish from actual FSRS peaks.Together these difficulties constitute a significant barrier toroutine application of the technique.In this paper we describe an experimental method and an
automated data-processing algorithm that mitigate theseproblems. We expand upon conventional FSRS instrumenta-tion by incorporating a spatial light modulator to control thecenter frequency of the Raman-pump beam, ωRP. We collecttwo FSRS spectra obtained at different Raman-pump centerfrequencies, f1 and f 2, where ΔωRP = f 2 − f1 is ∼30 cm−1. Bysubtracting these two spectra, we generate a FSRS dif ferencespectrum that removes much of the background. The FSRSspectrum is reconstructed from the difference spectrum using asimple, automated numerical algorithm that requires only twoparameters as input. While similar strategies that modulate theRaman pump frequency have been employed in ground andexcited state Raman spectroscopies, the lack of a straightfor-
Received: May 6, 2013Revised: June 9, 2013Published: June 12, 2013
Article
pubs.acs.org/JPCB
© 2013 American Chemical Society 8245 dx.doi.org/10.1021/jp404498u | J. Phys. Chem. B 2013, 117, 8245−8255

ward reconstruction algorithm that leaves peak shapes intacthas prevented widespread adoption.12−14
Collection of the FSRS difference spectra and subsequentreconstruction has many advantages over conventionallyprocessed single-Raman-pump frequency spectra. In additionto an improved signal-to-noise ratio and dramatically reducedbackground contributions, the frequency modulated FSRS(FM-FSRS) technique eliminates detector artifacts from therecovered spectra. Further, while use of a spatial lightmodulator makes FM-FSRS highly flexible and paves the wayfor more elaborate pulse shaping strategies, a simple mechanicalslit and a computer controlled actuator can easily besubstituted, making this technique readily accessible.
■ EXPERIMENTAL METHODSMaterials. Synthesis of the OPE-TBT polymer is described
elsewhere.15 For the spectroscopic experiments the polymerwas dissolved in THF to achieve an OD of 2 (∼180 μmol inpolymer repeat unit concentration) and placed in a 2 mmcuvette. All experiments were performed at room temperature.FM-FSRS Spectrometer. Time-resolved FSRS spectra are
collected on a home-built spectrometer diagrammed in Figure1. A Ti:sapphire regenerative amplifier (Clark-MXR CPA2210)
generates 150 fs fwhm pulses centered at 775 nm.Approximately 100 mW of this beam is frequency doubled ina 2 mm BBO crystal and coupled into a home-built, hollowfiber waveguide filled with Ar at 20 psig for spectral broadening.Prism compression results in 35 fs fwhm pump pulses, whichare focused to a 125 μm spot by a 300 mm lens at the sample(250 μJ/cm2).The stimulated Raman response is generated by a pair of
pulses, consisting of a narrow bandwidth Raman-pump (RP)pulse and a broadband white light (WL) continuum that arrive
at the sample simultaneously. The 490 nm Raman-pump pulseis generated in a 2 mm BBO crystal via sum frequency of the775 nm fundamental and the 1332 nm signal from an opticalparametric amplifier (Light Conversion TOPAS-C). It is thencoupled into a 4-f, zero dispersion optical compressor with aCRI 128 pixel dual mask spatial light modulator (SLM) placedat the Fourier plane. The SLM is used to attenuate all but anarrow band (∼1 nm) of the spectrum, effectively acting as acomputer-controlled slit. The WL continuum is generated byfocusing a small portion (3 mW) of the 775 nm amplifieroutput into a translating CaF2 window. The WL continuum iscollected and collimated by a spherical mirror. The Ramanpump and continuum are focused into the sample with a 300mm lens and a 250 mm spherical aluminum mirror,respectively. The WL is dispersed by a 0.15 m spectrographwith a 1200 g/mm grating and detected on a diode arraycapable of reading out at the 1 kHz repetition rate of the laser.The pump and Raman-pump beams are passed through a
dual blade mechanical chopper synched to the laser pulserepetition rate. The Raman-pump beam is chopped at half thefrequency of the pump beam so that four interleaved spectraare collected at up to shot-to-shot rates. A typical FM-FSRSspectrum involves the measurement of 1000 sets of interleavedspectra at ωRP = f1. The computer controlled SLM shifts thecenter frequency of the Raman pump pulse by 20−30 cm−1 toωRP = f 2, and an additional 1000 sets of interleaved spectra areacquired. The instrument can resolve changes in the Ramangain as small as ∼1 × 10⁻⁴ when conventional data processingtechniques are employed. However, because pixel-to-pixelvariations are subtracted out with the FM-FSRS method, bettersignal-to-noise levels are achievable and improve the minimumresolvable peak amplitude to ∼2 × 10⁻⁵.
■ RESULTS AND DISCUSSIONTime resolved FSRS probes the change in the stimulatedRaman spectrum following photoexcitation, allowing it tofollow photoinduced dynamics through the evolution ofvibrational modes. In this three-pulse technique, the samplefirst interacts with an electronically resonant pump pulse (ωPu)creating ground and excited state populations. After a well-defined delay, Δt, the sample interacts with two temporallyoverlapped pulses, a broadband white light continuum (WL)and a spectrally narrow Raman-pump (RP) pulse centered atωRP. Stimulated Raman transitions are detected as changes inthe WL intensity at wavelengths corresponding to ωRP ± ωvib.FSRS can be used to follow the evolution of the vibrationalspectrum using only visible lasers and without the need forexpensive IR detectors.Despite this advantage, FSRS remains a technique that has
not enjoyed widespread use, in part because of the difficulty indisentangling the Raman features from the broad backgroundthat is also present. The remainder of the paper describes theFM-FSRS technique, which provides a straightforward means ofisolating the FSRS response, and its application to energytransport in a donor−acceptor assembly consisting of oligo-(phenylene−ethynylene) (OPE) and thiophene−benzothiadia-zol (TBT) chromophores (Figure 2A). Section A describes thecharacterization of energy transport in this assembly usingtransient absorption spectroscopy for comparison with theFSRS technique. Section B discusses the difficulties associatedwith recovering FSRS spectra using conventional techniques. InSection C, the benefits of employing frequency modulationFSRS are discussed and FSRS spectra collected in the
Figure 1. Schematic of the FSRS spectrometer. Three pulses areoverlapped in the sample: the 388 nm pump pulse, the Raman pump(RP) pulse tunable by the spatial light modulator, and the white light(WL) continuum. The FSRS signal is emitted in the same direction asthe WL continuum and detected on a high-speed diode array.
The Journal of Physical Chemistry B Article
dx.doi.org/10.1021/jp404498u | J. Phys. Chem. B 2013, 117, 8245−82558246

conventional manner are compared to those collected usingFM-FSRS methods. Section D describes application of FM-FSRS to the OPE-TBT donor−acceptor copolymer. Thissystem exhibits a complex and dense FSRS spectrum with lowsignal amplitudes and thus provides an excellent test of themethod. Section E gives a step-by-step description of thereconstruction algorithm, compares it to other procedures, anddiscusses the limitations of the FM-FSRS method.A. Transient Absorption Monitoring of Ultrafast
Energy Transfer in OPE-TBT. The OPE-TBT assembly is arandom copolymer comprised of OPE and TBT monomer
units linked to a polystyrene scaffold. Each chain consists of∼60 repeat units with an average TBT loading of about 10%.This is the same polymer as P-10 in ref 15. The UV−visspectrum of the copolymer in THF (black solid) is shown inFigure 2B along with spectra of the TBT model acceptor (redtriangles) and the OPE donor homopolymer (blue squares).Comparison of the spectrum of the copolymer to itsconstituent model systems suggests that though the polystyrenebackbone maintains the chromophores in proximity, theelectronic states of the donor and acceptor remain unperturbed.Comparison of the absorbance of donor and acceptor modelsystems indicates that photoexcitation of the copolymer at 388nm creates 98.9% OPE* species.Figure 2C shows transient absorption (TA) spectra of the
copolymer following 388 nm photoexcitation by the pumpbeam (250 μJ/cm2). At early pump−probe delay times (Δt =185 fs) the TA spectrum of the copolymer (hollow triangles) ispredominately OPE* in nature, as can be seen by comparisonwith the donor homopolymer TA spectrum (blue shaded). Atlate times (Δt = 1.1 ns), the copolymer spectrum (hollowsquares) is largely TBT* in nature (red shaded), suggestingthat pendent donor chromophores are quenched by energytransfer to the lower energy acceptor sites with relatively highefficiency. The decay of the donor absorption at 600 nm(Figure 2D) is biphasic with time constants of 2.2 ± 0.3 ps(0.44) and 30.1 ± 3.0 ps (0.66). The faster component reflectsquenching of OPE* species that are formed within proximity toa TBT acceptor, while the slower time component arises fromOPE* that must first undergo OPE* → OPE energy migrationprior to the OPE* → TBT quenching step.
B. Difficulty in Isolating FSRS Signal. FSRS spectra areobtained following photoexcitation of the OPE chromophoresat 388 nm by the femtosecond pump pulse. The RP beam istuned to 490 nm to take advantage of resonance enhancementof the OPE excited state and TBT ground state absorptions.Resonance enhancement dramatically increases the stimulatedRaman signal intensity, which applies equally regardless ofwhether the RP beam is resonant with the ground or excitedstate absorption. The FSRS spectra were collected on theStokes side of the RP beam by monitoring the white lightcontinuum between 492 and 562 nm, which corresponds to ν =100−2600 cm−1.The difficulties with retrieving small FSRS signals are
illustrated by the series of spectra shown in Figure 3. Thebasic observable is the ratio of the WL intensity in the presenceof the pump pulse to that observed in its absence, i.e., S(ν) =I(ν)/I0(ν). In the absence of the RP pulse, the experimentalconfiguration is identical to that of transient absorption, andS(ν) − 1 is equivalent to the transient absorption signal ΔI(ν)/I(ν). Panel A shows S(ν) for the OPE-TBT copolymerobtained 12 ps after photoexcitation. The two spectra werecollected with (black) and without (red) the RP beam and aredenoted SON and SOFF, respectively. The overall negative signalthat is observed is a result of the excited state absorption in thisspectral region. With the RP beam present, FSRS transitionsshould appear as narrow features on this broad background, butat this scale, they are not visible. Rather, the structure that isobserved, in both spectra, is a consequence of variation insensitivity across the array detector or perhaps spectralinhomogeneities in the WL spectrum. It is only in calculationof the Raman gain (Figure 3B), where the RP “ON” spectrumhas been divided by the RP “OFF” spectrum, i.e.,
Figure 2. (A) Structure of the 90% oligo(phenylene−ethynylene)(OPE) and 10% thiophene−benzothiadiazol (TBT) copolymer. (B)UV−vis spectra of the donor−acceptor copolymer (black) and of themodel systems, p-OPE (blue squares) and TBT (red triangles). The p-OPE and TBT spectra are normalized to the copolymer spectrum at370 and 470 nm, respectively. (C) Transient absorption spectra of thecopolymer at pump−probe delay times of 185 fs (hollow triangles)and 1.1 ns (hollow squares). The normalized transient spectra for thep-OPE (blue filled) and TBT (red filled) model systems at Δt = 100ps are shown for comparison. (D) Single wavelength kinetics at λ =600 nm showing quenching of OPE* (black squares). A biexponentialfit with fast (2.2 ps) and slow (30.1 ps) time components is shown inred.
The Journal of Physical Chemistry B Article
dx.doi.org/10.1021/jp404498u | J. Phys. Chem. B 2013, 117, 8245−82558247
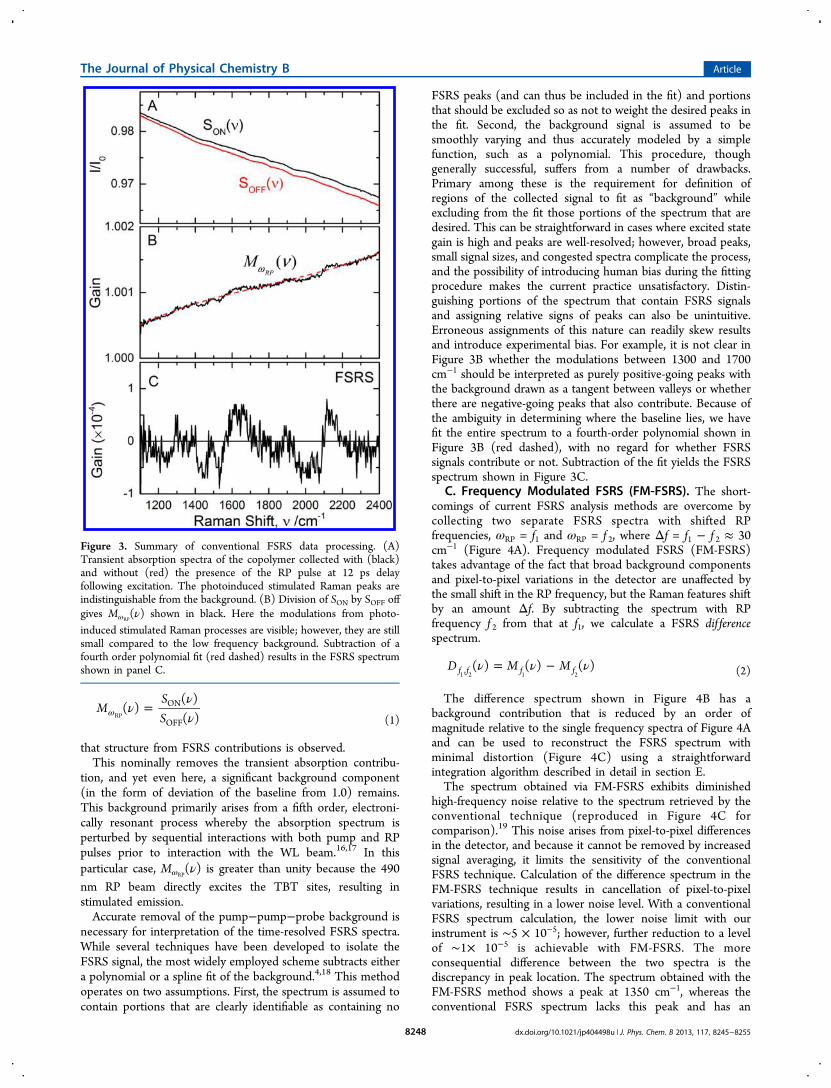
ννν
=ωMSS
( )( )( )
ON
OFFRP (1)
that structure from FSRS contributions is observed.This nominally removes the transient absorption contribu-
tion, and yet even here, a significant background component(in the form of deviation of the baseline from 1.0) remains.This background primarily arises from a fifth order, electroni-cally resonant process whereby the absorption spectrum isperturbed by sequential interactions with both pump and RPpulses prior to interaction with the WL beam.16,17 In thisparticular case, MωRP
(ν) is greater than unity because the 490nm RP beam directly excites the TBT sites, resulting instimulated emission.Accurate removal of the pump−pump−probe background is
necessary for interpretation of the time-resolved FSRS spectra.While several techniques have been developed to isolate theFSRS signal, the most widely employed scheme subtracts eithera polynomial or a spline fit of the background.4,18 This methodoperates on two assumptions. First, the spectrum is assumed tocontain portions that are clearly identifiable as containing no
FSRS peaks (and can thus be included in the fit) and portionsthat should be excluded so as not to weight the desired peaks inthe fit. Second, the background signal is assumed to besmoothly varying and thus accurately modeled by a simplefunction, such as a polynomial. This procedure, thoughgenerally successful, suffers from a number of drawbacks.Primary among these is the requirement for definition ofregions of the collected signal to fit as “background” whileexcluding from the fit those portions of the spectrum that aredesired. This can be straightforward in cases where excited stategain is high and peaks are well-resolved; however, broad peaks,small signal sizes, and congested spectra complicate the process,and the possibility of introducing human bias during the fittingprocedure makes the current practice unsatisfactory. Distin-guishing portions of the spectrum that contain FSRS signalsand assigning relative signs of peaks can also be unintuitive.Erroneous assignments of this nature can readily skew resultsand introduce experimental bias. For example, it is not clear inFigure 3B whether the modulations between 1300 and 1700cm−1 should be interpreted as purely positive-going peaks withthe background drawn as a tangent between valleys or whetherthere are negative-going peaks that also contribute. Because ofthe ambiguity in determining where the baseline lies, we havefit the entire spectrum to a fourth-order polynomial shown inFigure 3B (red dashed), with no regard for whether FSRSsignals contribute or not. Subtraction of the fit yields the FSRSspectrum shown in Figure 3C.
C. Frequency Modulated FSRS (FM-FSRS). The short-comings of current FSRS analysis methods are overcome bycollecting two separate FSRS spectra with shifted RPfrequencies, ωRP = f1 and ωRP = f 2, where Δf = f1 − f 2 ≈ 30cm−1 (Figure 4A). Frequency modulated FSRS (FM-FSRS)takes advantage of the fact that broad background componentsand pixel-to-pixel variations in the detector are unaffected bythe small shift in the RP frequency, but the Raman features shiftby an amount Δf. By subtracting the spectrum with RPfrequency f 2 from that at f1, we calculate a FSRS dif ferencespectrum.
ν ν ν= −D M M( ) ( ) ( )f f f f,1 2 1 2 (2)
The difference spectrum shown in Figure 4B has abackground contribution that is reduced by an order ofmagnitude relative to the single frequency spectra of Figure 4Aand can be used to reconstruct the FSRS spectrum withminimal distortion (Figure 4C) using a straightforwardintegration algorithm described in detail in section E.The spectrum obtained via FM-FSRS exhibits diminished
high-frequency noise relative to the spectrum retrieved by theconventional technique (reproduced in Figure 4C forcomparison).19 This noise arises from pixel-to-pixel differencesin the detector, and because it cannot be removed by increasedsignal averaging, it limits the sensitivity of the conventionalFSRS technique. Calculation of the difference spectrum in theFM-FSRS technique results in cancellation of pixel-to-pixelvariations, resulting in a lower noise level. With a conventionalFSRS spectrum calculation, the lower noise limit with ourinstrument is ∼5 × 10⁻⁵; however, further reduction to a levelof ∼1× 10⁻⁵ is achievable with FM-FSRS. The moreconsequential difference between the two spectra is thediscrepancy in peak location. The spectrum obtained with theFM-FSRS method shows a peak at 1350 cm−1, whereas theconventional FSRS spectrum lacks this peak and has an
Figure 3. Summary of conventional FSRS data processing. (A)Transient absorption spectra of the copolymer collected with (black)and without (red) the presence of the RP pulse at 12 ps delayfollowing excitation. The photoinduced stimulated Raman peaks areindistinguishable from the background. (B) Division of SON by SOFF offgives MωRP
(ν) shown in black. Here the modulations from photo-induced stimulated Raman processes are visible; however, they are stillsmall compared to the low frequency background. Subtraction of afourth order polynomial fit (red dashed) results in the FSRS spectrumshown in panel C.
The Journal of Physical Chemistry B Article
dx.doi.org/10.1021/jp404498u | J. Phys. Chem. B 2013, 117, 8245−82558248

additional negative-going peak at 1450 cm−1. These features arehighlighted by the box in Figure 4C. Close examination showsthat both peaks are present in the raw data and decay onqualitatively similar time scales as other features in thespectrum. While these characteristics are consistent with amolecular resonance, the peak at 1450 cm−1 is independent ofRP excitation frequency, revealing that it is in fact an artifact ofthe imaging optics or detector. As discussed in section D below,the peak in the FM-FSRS spectrum at 1350 cm−1 is correct,corresponding to a photoinduced loss of gain from the groundstate stimulated Raman spectrum.This example illustrates the insidious nature of imaging
artifacts that can arise in FSRS spectra. In the case above, thespurious peak is comparable in size to the actual Ramanfeatures. Such imaging artifacts are produced by imperfections(e.g., dust) on the optics after the WL beam is dispersed by thegrating in the spectrograph or by sensitivity variation across thedetector array. Further, because these artifacts scale with the
difference in intensity between RP OFF and RP ON spectra,they decay with the same time constant as the pump−pump−probe background, making them exceptionally difficult todistinguish from molecular resonances. Here the advantages ofacquiring difference spectra are highlighted; while the artifactremains in the spectrum obtained by the conventionalprocedure and is indistinguishable from the actual Ramanmodes, the spurious feature is completely subtracted out in theFM-FSRS method, since it is not RP frequency dependent. InFigure 4A, we have highlighted regions of the single frequencyspectra, MωRP
(ν), where artifacts (I and II) and a molecularresonance (III) are present. In FM-FSRS, the molecularresonance shifts with the RP frequency, creating a derivative-like line shape in the difference spectrum, whereas the artifactsremain stationary and are consequently removed uponcalculation of the difference spectrum.
D. FM-FSRS Monitoring of Ultrafast Energy Transferin OPE-TBT. We have performed FM-FSRS measurements onthe OPE-TBT copolymer, as well as the p-OPE and TBTmodel systems for comparison (Figure 5). The wavelength ofthe RP beam was set at 490 nm (320 μJ/cm2) to minimizespectral congestion and take advantage of resonance enhance-ment. With this choice for the RP wavelength we are able toclearly identify the OPE and TBT contributions to thecopolymer FSRS spectrum.
TBT Monomer. Because the RP pulse is electronicallyresonant with the ground state absorption, the TBT FM-FSRSspectrum (Figure 5A) is dominated by two negative-goingfeatures at 1355 and 1538 cm−1 (labeled I and II, respectively)that correspond to pump-induced loss of ground state Ramangain. The negative-going features correlate with transitionsobserved in the ground state stimulated Raman spectrum(labeled I′ and II′). Spectra simulated using DFT methods atthe B3LYP/6-31G* level (Figure 5B) indicate that theseground state modes involve concerted motion by several ringsin the TBT moiety. Since the 490 nm RP beam is not resonantwith the TBT excited state absorption, the positive featuresarising from these same modes on the excited state (denoted IIIand IV) are much less intense.The FM-FSRS spectra of the TBT model system do not
show any delay-dependent dynamical evolution. An absence ofdynamical shifting in the FSRS spectra indicates that relaxationof the initially formed excited state occurs too quickly to beresolved by the finite time resolution of the experiment or thatthe accompanying shift of vibrational modes due to relaxationof the electron density is too small to be spectrally resolved.This later scenario arises because of (lifetime or dispersive)peak broadening that obscures the shift or because of intrinsicspectral resolution limitations of the instrument.
OPE Homopolymer (p-OPE). In the case of the OPEhomopolymer, the FM-FSRS spectra (Figure 5C) possess bothpositive- and negative-going features that stem from the pump-induced excited state population, which reflects the fact that theRP overlaps with both excited state absorption and stimulatedemission bands of OPE.21 It does not overlap with the groundstate absorption spectrum, and as a result, the ground statestimulated Raman spectrum (Figure 5D) exhibits generallysmall signal intensity, and the ground state modes appear onlyas weak negative-going features superimposed on the moreintense excited state bands in the FM-FSRS spectrum.The spectrum is characterized by several overlapping modes
between 1100 and 1500 cm−1 which we have not specifically
Figure 4. (A) Single frequency FSRS spectra of the copolymer at Δt =12 ps collected with RP frequency, ωRP = f1 (red) and ωRP = f 2 (black).The gray boxes highlight portions of the spectrum that arise from ωRPindependent spectral fluctuations (I and II) and ωRP dependent FSRSpeaks (III). Without modulation of the RP frequency, such featurescan be indistinguishable. (B) FSRS difference spectrum, Df1,f 2(ν),
arrived at by subtracting Mf 2(ν)from Mf1(ν). (C) Comparison of FSRSspectra retrieved by the conventional technique of subtracting apolynomial fit (red) and via the FM-FSRS method (black, offset to 1 ×10⁻⁴). The qualitative discrepancies between the two methods in theboxed spectral region between 1300 and 1500 cm−1 arise fromdetection artifacts highlighted in panel A that are ωRP independent(see text). These artifacts are eliminated in the FM-FSRS spectrum.
The Journal of Physical Chemistry B Article
dx.doi.org/10.1021/jp404498u | J. Phys. Chem. B 2013, 117, 8245−82558249

assigned; however, simulated spectra obtained using DFTmethods (Figure 5D) indicate these modes generally involveconcerted breathing motion by the three aryl rings in OPE. TheOPE FM-FSRS spectrum also exhibits strong features peaked at1625 and 2130 cm−1 (labeled V and VI, respectively). On thebasis of calculations and comparison with the ground statestimulated Raman spectrum (Figure 5C), we have assignedpeak V to the symmetric deformation mode primarily localizedon the central aryl ring on OPE. This feature is shifted to higherenergy and significantly broadened compared to the corre-sponding ground state mode, labeled V′. Peak VI, centered at2130 cm−1, corresponds to the symmetric alkyne stretch inOPE. Like peak V, peak VI is significantly broadened relative tothe ground state mode, VI′, but is shifted to lower energy,presumably because of a weakening of the alkyne bond uponphotoexcitation.While the cause of the significant broadening of peaks V and
VI is not clear, its source could arise from a combination ofthree factors. Additional excited state modes that are convolvedtogether by the resolution of our instrument is a likelycontributor, especially in the case of peak VI where there is asignificant shoulder on the blue edge of the peak. The secondsource of broadening may arise because excited states along thehomopolymer OPE model system undergo site to site hoppingon time scales (∼2 ps) that are comparable to the vibrationaldephasing time, broadening the natural line width of individualmodes.15 Finally, since each individual chromophore within thesample experiences a slightly different environment because ofinteractions with the bath, inhomogeneous broadening mayalso contribute if the electronic wave functions are perturbedsufficiently to affect the vibrational frequency in these variedsites. Advances in excitation and detection schemes for FSRSmeasurements will be useful for delineating these contribu-tions.22
Copolymer. The delay dependent FM-FSRS spectra of theOPE-TBT copolymer are shown in Figure 6A. Comparison ofearly time spectra of the copolymer to the spectrum of themodel p-OPE homopolymer (labeled at bottom) suggest thatphotoexcitation at 388 nm primarily produces OPE excited
states. As the delay time increases, there is a decay of thefeatures associated with the donor OPE moiety and thesimultaneous growth of the features associated with theacceptor moiety. By 400 ps, the FSRS spectrum that began asalmost purely donor in nature has been transformed to one thatis almost purely acceptor. (The TBT model FM-FSRSspectrum is shown and labeled at the top of Figure 6A forcomparison.) The intensity of the alkyne stretch on the OPE at2130 cm−1 (blue squares) and the TBT acceptor ring breathingmode at 1538 cm−1 (red triangles) are shown in Figure 6B. Thetransients are well modeled by a biexponential function with anoffset. A global fit of the kinetics found time constants of 2.1 ±0.4 and 27 ± 4 ps in approximately equal proportion, consistentwith the results from transient absorption measurements.
E. FM-FSRS Data Analysis Algorithm. We illustrate theFM-FSRS spectral signal processing algorithm in Figure 7 usingthe Δt = 12 ps spectrum from Figure 6A as an example. Twomeasurements, shown in Figure 7A, are collected whose RPfrequencies, f1 and f 2, differ by 28 cm−1. Each of thesemeasurements is equivalent to a conventional FSRS spectrum.Because the RP beam is often tuned to be electronically
resonant with the excited state absorption spectrum, the desiredstimulated Raman peaks are convolved with a signal that arisesfrom (primarily) the pump−pump−probe signal, in which thesample is excited by sequential interactions with both pumpand RP beams. In the limit that the electronic resonance (∼700cm−1) is much broader than the bandwidth of the RP beam (25cm−1), the background arising from electronic resonancesshould only be weakly dependent on small shifts of theexcitation frequency.23 In contrast, vibrational resonances havenatural linewidths (∼10 cm−1) that are comparable to thespectral bandwidth of the RP beam and are sensitivelydependent on the beam’s frequency. Consequently, by shiftingthe RP frequency a small amount, Δf (on the order of thebandwidth), and collecting another gain measurement, weperturb the stimulated Raman spectrum by Δf while leaving thebackground largely unchanged, enabling almost completeelimination of the background through calculation of a FSRSdifference spectrum.
Figure 5. (A) FM-FSRS spectra of the model system TBT at Δt of 10 ps. Also shown is the ground state stimulated Raman spectrum of TBT. Thedashed lines correlate features in ground and FSRS spectra. (B) Calculated TBT ground state Raman spectrum with 30 cm−1 Gaussian lineshapes.(C) FSRS spectrum at Δt = 10 ps and ground state stimulated Raman spectra of p-OPE. Dashed gray lines are drawn correlating features associatedwith the OPE ground and photoinduced stimulated Raman spectra. (D) Calculated OPE ground state Raman spectrum. The frequency scales for thecalculated spectra in panels B and D were multiplied by 0.9614 to account for overestimation of the bond strength at the B3LYP/6-31G* level.20
The Journal of Physical Chemistry B Article
dx.doi.org/10.1021/jp404498u | J. Phys. Chem. B 2013, 117, 8245−82558250

The FSRS difference spectrum shown in Figure 7B (black) isobtained by subtracting the two measurements in Figure 7A.While the low frequency background (due to noise, smalldifferences in intensity of the two RP beams, or subtledifferences in the absorption spectrum) is not completelyeliminated, it is greatly reduced, revealing the stimulated Ramanfeatures much more clearly than in either of the measurementsshown in Figure 7A. Another benefit of collecting the differencespectrum is that subtraction removes nearly all differences inpixel-to-pixel sensitivity of the detector, a source of noise that isoften greater than the magnitude of the measured FSRS signals.While other methods have been developed to mitigate thissource of noise by averaging over different areas of thedetector,24 calculating the difference spectrum subtracts outthese contributions completely rather than averaging over twodetector regions with slightly different sensitivities. We also
note that sensitivity varies not only between adjacent pixelsleading to high frequency noise but also across small regions ofthe imaged spectrum, causing spurious peaks. As discussedpreviously, such regions of reduced sensitivity can arise fromimperfections of the imaging optics (from dust or coatingflaws) that are placed after the grating in a spectrometer or dueto the detector array itself.25 We have observed this effect in ourown instrument. While such spurious peaks are present in theconventional FSRS implementation involving a single RPfrequency, we note that the difference spectrum is completelyfree of these artifacts.The FSRS difference spectrum is reminiscent of the
derivative spectra obtained from a variety of experimentalmethods, including EPR. Though it is an accurate spectroscopicsignature of the molecular system, interpretation is moreintuitive if the conventional spectrum is reconstructed. Thenumerical operation for reconstruction (i.e., integration) fromthe derivative spectrum is just the cumulative sum of elements.The FSRS difference spectrum, however, is not a truederivative, and thus, the reconstruction algorithm must bemodified to avoid peak broadening, shifting, and an artificialamplification of signal (and noise) amplitude.When the two RP beams at ωrp = f1 and ωrp = f 2 are
separated by a discrete amount (δ detector pixels), thereconstructed signal at pixel n (Rn) is given by
ν ν ν= +δ−R R D( ) ( ) ( )n n n (3)
where Dn is the difference signal at pixel n and where Rn−δ is thereconstructed signal at pixel n − δ. While the reconstructionshould in principle be exact, application of eq 3 to actualdifference spectra reveals two complications.First, because reconstruction proceeds by a cumulative sum,
even the small offset seen in the difference spectrum (black) inFigure 7B causes a large background (effectively the net areaunder the difference spectrum) to accumulate as reconstructionproceeds from the red to blue edge of the spectrum. Toeliminate this component, we fit the entire difference spectrumwith a fourth order polynomial (Figure 7B, red dashed) prior toreconstruction which, when subtracted from the differencespectrum, removes any residual low frequency backgroundcontribution to the spectrum and centers it at zero (Figure 7C).This automated procedure is entirely robust, as the desiredsignal peaks in the FSRS difference spectrum deviate equally inpositive and negative directions relative to the nonzero baseline.This is in contrast with fitting single Raman frequency FSRSspectra (as is done conventionally) where the spectrum isasymmetric with respect to the zero signal and the polynomialfit is pulled upward (downward) by positive (negative) goingpeaks.The second complication of reconstruction from the
difference spectrum arises from the recursive nature of eq 3.This artifact manifests as an accumulation of high frequencyoscillation that recurs with a period of δ, superimposed with thereconstructed spectrum (Figure 7D). While this source ofoscillation is minimal for high signal-to-noise FSRS signals, wehave found its removal to be necessary when high frequency(pixel-to-pixel) noise is within a factor of 10 of the desiredsignals. To obtain FM-FSRS spectra free of this periodicmodulation, we Fourier transform the reconstructed FM-FSRSspectrum (into inverse pixel space, νpix) and then attenuatecomponents at 1/δ and its harmonics with a simple notch filteras shown in Figure 7E. The functional form of the notch filter is
Figure 6. (A) FSRS spectra showing photoinduced changes of theTBT-OPE stimulated Raman spectrum for pump−probe delays of −1to 400 ps. The excited state alkyne stretch at 2130 cm−1 decays asOPE* is quenched by TBT. Growth of the three ground state aromatic“bleaches” at 1355, 1444, and 1538 cm−1 indicates the formation ofTBT*. (B) Single frequency kinetics showing decay of OPE donoralkyne stretch at 2130 cm−1 (blue squares) and simultaneous growthof TBT acceptor aromatic stretch at 1538 cm−1 (red triangles) modesas indicated by the arrows in panel A. The global biexponential fits ofthe donor and acceptor mode kinetics are shown in blue (thick) andred (thick), respectively.
The Journal of Physical Chemistry B Article
dx.doi.org/10.1021/jp404498u | J. Phys. Chem. B 2013, 117, 8245−82558251

a product of hyperbolic tangent functionals centered atharmonics of 1/δ,
∏νν
α
ν
α
= −− −
++ −
δ
δ
=
⎡
⎣⎢⎢⎢
⎧⎨⎪⎩⎪
⎛
⎝⎜⎜
⎞
⎠⎟⎟
⎛
⎝⎜⎜
⎞
⎠⎟⎟⎫⎬⎪⎭⎪
⎤
⎦⎥⎥⎥
( )
( )
Fw
w
( ) 112
tanh
tanh
n
n
n
pix1,2,3...
pix
pix
(4)
Here, the parameters w and α determine the width andsharpness of the notch, respectively. Following application ofthe noise filter, we perform the inverse Fourier transform andrecover the FSRS spectrum, now free of the recursive artifact(Figure 7F, black solid).
While the spectrum in Figure 7F largely reproduces theexpected peaks in the spectrum, we have found that somespectra accumulate a slight baseline drift because mid-frequency, low-amplitude variations in the spectrum are notadequately fit by the low order polynomial fit. These variationsare often quite small (<5 × 10⁻⁵); however, when low fluenceand small Raman cross sections produce small signal sizes, itmay be necessary to correct for this drift. We have chosen touse a moving median filter, which has been successfullyemployed to isolate narrow peaks from their low frequencybackground.26 The moving median is a parametric fit of thetrend in a data series, which operates by finding the medianvalue of a window of length 2k + 1 elements centered at pixel n,as shown in eq 5.
= − − + −M S S S Smedian( , ,..., , )nk
k k k k1 1 (5)
Figure 7. (A) Raw spectra collected for each of the two RP frequencies. (B) Difference spectrum calculated from spectra shown in panel A (black).The red dashed curve is a fourth order polynomial fit of difference spectrum. (C) Residual after polynomial fit is subtracted from difference spectrumin panel B. (D) Reconstructed spectrum with periodic noise artifact arising from the recursive nature of reconstruction. (E) Fourier transformspectrum (black) and notch filter (red) used to remove the high frequency artifact and its higher harmonics. (F) Inverse Fourier transform producesthe reconstructed spectrum (black). Also shown is the moving median fit (red dashed) that represents baseline drift. (G) Final FSRS spectrumobtained by subtraction of the red curve from the black curve.
The Journal of Physical Chemistry B Article
dx.doi.org/10.1021/jp404498u | J. Phys. Chem. B 2013, 117, 8245−82558252

This filter is particularly well suited to eliminating a lowamplitude baseline, as the maxima and minima that correspondto FSRS peaks occupy the extremes of the sorted window ofpixel values, S. After subtraction of the moving median fit of thedata (shown in Figure 7F, red dashed), the algorithm arrives atthe final FSRS spectrum, as shown in Figure 7G.In effect, the moving median filter acts as a mid-band filter. It
serves to remove background that is higher frequency than thatwhich is removed by the polynomial fit while leaving the sharpFSRS peaks unperturbed. Figure 8 illustrates this effect bysimulating a spectrum consisting of five narrowband Gaussianpeaks (to represent the desired FSRS peaks) convolved with abroad Gausssian background, a low amplitude sinusoidalmodulation, and high frequency random noise. Panel A
shows the initial input spectra used to produce the simulateddifference spectrum. The two spectra are identical; however,the red trace is shifted six pixels to simulate the effect of shiftingthe RP frequency. Panel B shows the simulated differencespectrum with added background and noise (black) as well asits corresponding fourth order polynomial fit (red dashed).Since the polynomial is a global fit, the overall trend to thebaseline is subtracted, but the low amplitude mid-frequencymodulations remain in the difference spectrum. Thereconstructed spectrum, prior to application of the movingmedian filter, is shown in panel C. The desired peaks are clearlydistinguishable in this spectrum; however, the baseline hassignificant positive- and negative-going deviations that arisefrom the mid-frequency background component that was notadequately modeled with the low order polynomial. Applicationof the moving median filter (red, dashed) readily removes thiscomponent, yielding a final spectrum shown in panel D (red)that favorably compares with the initial input spectrum, whichis reproduced for comparison (black).Figure 8 shows that FM-FSRS can remove low frequency
background contributions and reliably reproduce complex,dense spectra with minimal artifacts. This is especiallyimportant because while RP modulation schemes are superiorin cancellation of noise and imaging artifacts, backgroundremoval is still a necessity and subsequent reconstruction of thespectrum must be carefully performed to avoid artifacts.Background removal from FSRS spectra is especially difficult
because well-established techniques such as low-pass Fourierfilters or wavelet decompositions often introduce ringingartifacts to the lineshapes.14 These filtering methods operateon the assumption that the Raman peaks of interest areprimarily composed of higher frequency components, whereasthe background is purely low frequency. However, the desiredFSRS peaks do in fact have low frequency components, and byremoval of enough low frequency amplitude from the Fouriertransform to eliminate the background, ringing artifacts areintroduced that qualitatively alter the Raman spectrum.27 It isimportant to note that while the FM-FSRS method does use aFourier filter, it is used to eliminate high frequency noise, aprocedure that has much less risk of distorting peak shapes.While several steps are required to process the final FSRS
spectrum, they are all completely automated and require noinput from the experimenter beyond a choice of twoparameters: the polynomial order for fitting the FSRSdifference spectrum and length of the window for the movingmedian filter. In this work, we have found that fourth orderpolynomials and median windows that are a factor of ∼5 largerthan the FSRS peak widths were good choices. Rational choiceof these two parameters will lead to robust and accuratereconstruction of most spectra; however, there are limitationsto the algorithm.The most notable is an attenuation of peaks with broad
linewidths. This is illustrated in Figure 9 where a spectrumconsisting of a series of Gaussian peaks of varying widths isexamined. Figure 9A shows the simulated difference spectrum.The reconstructed spectra obtained before and after theapplication of the moving medium filter are depicted in Figure9B and Figure 9C, respectively. The number shown near themidpoint of each peak in Figure 9C is the fwhm (in pixels) ofthe input peak shape. As the peak width approaches thewindow size of the moving median filter (we used a medianwindow size of 101 pixels), distortion from the algorithmbecomes considerable, leading to both attenuation and
Figure 8. (A) Simulated FSRS spectrum (black) constructed from asum of five variable width Gaussian peaks. The red spectrum, which isshifted six pixels higher, is subtracted from the black spectrum toproduce an ideal difference spectrum. (B) To the ideal differencespectrum, a broad Gaussian background, a low amplitude sin function,and random noise are added to simulate a typical experimentalspectrum (black). Subtraction of a fourth order polynomial fit (reddashed) from the spectrum eliminates the low amplitude backgroundin the region of the simulated peaks, leaving the difference spectrumcentered at 0. (C) Reconstruction of the difference spectrum aftersubtraction of the polynomial fit yields the black spectrum. The lowamplitude sine functional modulates the baseline in the reconstructedspectrum. After application of the moving median filter (red, dashed),the reconstructed spectrum reproduces the expected line shape shownin panel D with little baseline deviation. The ideal spectrum isreproduced in panel D for comparison.
The Journal of Physical Chemistry B Article
dx.doi.org/10.1021/jp404498u | J. Phys. Chem. B 2013, 117, 8245−82558253

narrowing of the reconstructed peaks. This behavior illustratesthat the FM-FSRS reconstruction algorithm loosely operates onthe separation of frequencies between FSRS peaks andbackground. As desired signals begin to span the samefrequency range as the background, differentiation betweenthe two becomes increasingly difficult. Nevertheless, for mostsystems, the conditions necessary for accurate retrieval of theFSRS spectrum should be fulfilled, making FSRS dataprocessing less susceptible to producing spurious peaks, lessprone to bias from the experimenter, and exceedingly simpleand fast.
■ CONCLUSIONWe have developed an improved method for collection andprocessing of FSRS spectra called frequency-modulated FSRS,and we have demonstrated its utility on ultrafast energy transferin a donor−acceptor copolymer. Employing a spatial lightmodulator to spectrally modulate the RP frequency allows facilecollection of high-sensitivity, artifact free spectra and sets thestage for enhancements to FSRS via femtosecond pulse shapingmethods. In addition, the data processing algorithm developedhere filters background signals from electronic absorption
pathways and fully reconstructs the FSRS spectrum withoutexperimenter input, paving the way for widespread applicationof the technique to chemical systems with complex, densespectra.
■ AUTHOR INFORMATIONCorresponding Author*E-mail: [email protected] authors declare no competing financial interest.
■ ACKNOWLEDGMENTSThis material is based upon work solely supported as part of theUNC EFRC: Center for Solar Fuels, an Energy FrontierResearch Center funded by the U.S. Department of Energy,Office of Science, Office of Basic Energy Sciences under AwardDE-SC0001011.
■ REFERENCES(1) Yoshizawa, M.; Kurosawa, M. Femtosecond Time-ResolvedRaman Spectroscopy Using Stimulated Raman Scattering. Phys. Rev. A1999, 61 (013808), 1−6.(2) Kukura, P.; McCamant, D. W.; Yoon, S.; Wandschneider, D. B.;Mathies, R. A. Structural Observation of the Primary Isomerization inVision with Femtosecond-Stimulated Raman. Science 2005, 310,1006−1009.(3) Laimgruber, S.; Schachenmayr, H.; Schmidt, B.; Zinth, W.; Gilch,P. A Femtosecond Stimulated Raman Spectrograph for the NearUltraviolet. Appl. Phys. B: Lasers Opt. 2006, 85, 557−564.(4) Kukura, P.; McCamant, D. W.; Mathies, R. A. FemtosecondStimulated Raman Spectroscopy. Annu. Rev. Phys. Chem. 2007, 58,461−488.(5) McCamant, D. W. Re-Evaluation of Rhodopsin’s RelaxationKinetics Determined from Femtosecond Stimulated Raman Line-shapes. J. Phys. Chem. B 2011, 115, 9299−9305.(6) Frontiera, R. R.; Henry, A.-I.; Gruenke, N. L.; Van Duyne, R. P.Surface-Enhanced Femtosecond Stimulated Raman Spectroscopy. J.Phys. Chem. Lett. 2011, 2, 1199−1203.(7) Brown, K. E.; Veldkamp, B. S.; Co, D. T.; Wasielewski, M. R.Vibrational Dynamics of a Perylene−Perylenediimide Donor−Accept-or Dyad Probed with Femtosecond Stimulated Raman Spectroscopy. J.Phys. Chem. Lett. 2012, 3, 2362−2366.(8) Rhinehart, J. M.; Challa, J. R.; McCamant, D. W. MultimodeCharge-Transfer Dynamics of 4-(Dimethylamino)benzonitrile Probedwith Ultraviolet Femtosecond Stimulated Raman Spectroscopy. J. Phys.Chem. B 2012, 116, 10522−10534.(9) Liu, W.; Han, F.; Smith, C.; Fang, C. Ultrafast ConformationalDynamics of Pyranine during Excited State Proton Transfer inAqueous Solution Revealed by Femtosecond Stimulated RamanSpectroscopy. J. Phys. Chem. B 2012, 116, 10535−10550.(10) Kuramochi, H.; Takeuchi, S.; Tahara, T. Ultrafast StructuralEvolution of Photoactive Yellow Protein Chromophore Revealed byUltraviolet Resonance Femtosecond Stimulated Raman Spectroscopy.J. Phys. Chem. Lett. 2012, 3, 2025−2029.(11) Hamaguchi, H.; Gustafson, T. L. Ultrafast Time-ResolvedSpontaneous and Coherent Raman Spectroscopy: The Structure andDynamics of Photogenerated Transient Species. Annu. Rev. Phys.Chem. 1994, 45, 593−622.(12) Shreve, A. P.; Cherepy, N. J.; Mathies, R. A. Effective Rejectionof Fluorescence Interference in Raman Spectroscopy Using a ShiftedExcitation Difference Technique. Appl. Spectrosc. 1992, 46, 707−711.(13) Weigel, A.; Ernsting, N. P. Excited Stilbene: IntramolecularVibrational Redistribution and Solvation Studied by FemtosecondStimulated Raman Spectroscopy. J. Phys. Chem. B 2010, 114, 7879−7893.(14) Kloz, M.; Grondelle, R. V.; Kennis, J. T. M. Wavelength-Modulated Femtosecond Stimulated Raman SpectroscopyApproach
Figure 9. (A) Simulated FSRS difference spectrum comprising fiveincreasing width peaks and random noise. (B) Reconstructed spectraprior to application of the moving median filter (black). The movingmedian with a window size (2k + 1) of 101 pixels is shown in red,dashed. (C) Final FSRS spectra recovered by the FM-FSRS method,after application of the moving median filter. As the peak widths(fwhm are indicated to the right of each peak) approach the size of themoving median window, attenuation and narrowing of thereconstructed peaks (black) occur. The red dashed trace shows theinput peak shapes.
The Journal of Physical Chemistry B Article
dx.doi.org/10.1021/jp404498u | J. Phys. Chem. B 2013, 117, 8245−82558254

towards Automatic Data Processing. Phys. Chem. Chem. Phys. 2011, 13,18123−18133.(15) Chen, Z.; Grumstrup, E. M.; Gilligan, A. T.; Papanikolas, J. M.;Schanze, K. S. Light Harvesting Polymers: Ultrafast Energy Transfer inPolystyrene Based Arrays of π-Conjugated Chromophores. J. Phys.Chem. Lett., submitted.(16) Frontiera, R. R.; Shim, S.; Mathies, R. A. Origin of Negative andDispersive Features in Anti-Stokes and Resonance FemtosecondStimulated Raman Spectroscopy. J. Chem. Phys. 2008, 129 (064507),1−6.(17) Sun, Z.; Lu, J.; Zhang, D. H.; Lee, S.-Y. Quantum Theory of(Femtosecond) Time-Resolved Stimulated Raman Scattering. J. Chem.Phys. 2008, 128 (144114), 1−13.(18) McCamant, D. W.; Kukura, P.; Yoon, S.; Mathies, R. A.Femtosecond Broadband Stimulated Raman Spectroscopy: Apparatusand Methods. Rev. Sci. Instrum. 2004, 75, 4971−4980.(19) To make the comparison more meaningful, we have notsubtracted out the contribution from photoinduced loss of groundstate mode gain as is conventionally performed.(20) Cramer, C. J. Essentials of Computational Chemistry; John Wileyand Sons Ltd.: New York, 2002.(21) Nakamura, R.; Hamada, N.; Abe, K.; Yoshizawa, M. UltrafastHydrogen-Bonding Dynamics in the Electronic Excited State ofPhotoactive Yellow Protein Revealed by Femtosecond StimulatedRaman Spectroscopy. J. Phys. Chem. B 2012, 116, 14768−14775.(22) Mukamel, S.; Biggs, J. D. Communication: Comment on theEffective Temporal and Spectral Resolution of Impulsive StimulatedRaman Signals. J. Chem. Phys. 2011, 134 (161101), 1−4.(23) Mukamel, S. Principles of Nonlinear Optical Spectroscopy; OxfordUniversity Press: Oxford, U.K., 1995.(24) Challa, J. R.; Du, Y.; McCamant, D. W. FemtosecondStimulated Raman Spectroscopy Using a Scanning MultichannelTechnique. Appl. Spectrosc. 2012, 66, 227−232.(25) Yetzbacher, M. K.; Courtney, T. L.; Peters, W. K.; Kitney, K. A.;Smith, E. R.; Jonas, D. M. Spectral Restoration for FemtosecondSpectral Interferometry with Attosecond Accuracy. J. Opt. Soc. Am. B2010, 27, 1104−1117.(26) Moore, A. W.; Jorgenson, J. W. Median Filtering for Removal ofLow-Frequency Background Drift. Anal. Chem. 1993, 65, 188−191.(27) Diniz, P. S. R.; da Silva, E. A. B.; Netto, S. L. Digital SignalProcessing; Cambridge University Press: Cambridge, U.K., 2010.
The Journal of Physical Chemistry B Article
dx.doi.org/10.1021/jp404498u | J. Phys. Chem. B 2013, 117, 8245−82558255

Competition between Ultrafast Energy Flow and Electron Transfer ina Ru(II)-Loaded Polyfluorene Light-Harvesting PolymerLi Wang,†,# Egle Puodziukynaite,‡,# Ryan P. Vary,† Erik M. Grumstrup,† Ryan M. Walczak,‡
Olga Y. Zolotarskaya,‡ Kirk S. Schanze,‡ John R. Reynolds,*,‡,§ and John M. Papanikolas*,†
†Department of Chemistry, University of North Carolina at Chapel Hill, Chapel Hill, North Carolina 27599, United States‡Department of Chemistry, Center for Macromolecular Science and Engineering, University of Florida, Gainesville, Florida32611-7200, United States§School of Chemistry and Biochemistry, School of Materials Science and Engineering, Center for Organic Photonics and Electronics,Georgia Institute of Technology, Atlanta, Georgia 30332, United States
*S Supporting Information
ABSTRACT: This Letter describes the synthesis and photophysical characterization of aRu(II) assembly consisting of metal polypyridyl complexes linked together by a polyfluorenescaffold. Unlike many scaffolds incorporating saturated linkages, the conjugated polymer inthis system acts as a functional light-harvesting component. Conformational disorder breaksthe conjugation in the polymer backbone, resulting in a chain composed of manychromophore units, whose relative energies depend on the segment lengths. Photoexcitationof the polyfluorene by a femtosecond laser pulse results in the excitation of polyfluorene,which then undergoes direct energy transfer to the pendant Ru(II) complexes, producingRu(II)* excited states within 500 fs after photoexcitation. Femtosecond transient absorptiondata show the presence of electron transfer from PF* to Ru(II) to form charge-separated(CS) products within 1−2 ps. The decay of the oxidized and reduced products, PF+• andRu(I), through back electron transfer are followed using picosecond transient absorptionmethods.
SECTION: Energy Conversion and Storage; Energy and Charge Transport
Ruthenium (II) polypyridyl complexes have been targetedextensively for use in next-generation solar energy
conversion applications. This interest stems in large part fromtheir visible absorption bands that produce long-lived, photo-stable excited states. Furthermore, their electronic propertiescan be tuned through synthetic manipulation, and a wide arrayof ligand structures have been designed, yielding complexescapable of performing charge separation and catalyticfunctions.1−3 This synthetic flexibility has also facilitated theirincorporation into molecular light-harvesting assembliesutilizing a variety of scaffold architectures. While thesecomplexes are extremely versatile, they are limited by relativelyweak absorptivities (ε ≈ 104 M−1 cm−1) compared to organicsystems, thus requiring longer path lengths for efficient lightcollection.Conjugated polymers (CPs), on the other hand, have large
extinction coefficients on a per-chain basis. Conformationaldisorder and chemical defects break the conjugation of thebackbone, leading to the formation of linked, yet “isolated”,chromophores4−6 that exhibit fast intra- and interchain excited-state transport.6 It is this combination of large absorptivity andfast energy transport that give CPs an extraordinary “light-harvesting” ability. While energy transfer along the chain israpid, the short singlet state lifetime limits the exciton diffusion
length, posing a major challenge for those developing organic-based devices.In this Letter, we report on a Ru(II) polypyridyl assembly
(PF−Ru) consisting of a number average of approximately 70metal complexes linked together by a polyfluorene backbone.Unlike the well-documented derivatized polystyrene sys-tems,7−10 in which the polymer only acts as a scaffold, thePF chain acts as an efficient, multichromophoric antenna thatabsorbs light and transfers the photonic energy to the pendantRu(II) complexes, resulting in a long-lived excitation that canpotentially be used to drive charge separation and/or catalyticfunctions.Synthesis of the PF−Ru assembly (Figure 1) was realized by
reacting an azide-functionalized polyfluorene with an alkynyl-containing Ru(II) polypyridyl complex under Cu(I)-assisted“click” chemistry11−13 conditions. Quantitative azide−alkynecycloaddition was verified by 1H NMR and FTIR spectros-copies. The azide-containing polyfluorene precursor wasobtained via the Pd-mediated Suzuki cross-coupling14−16
approach and consecutive treatment with sodium azide.
Received: July 18, 2012Accepted: August 15, 2012Published: August 15, 2012
Letter
pubs.acs.org/JPCL
© 2012 American Chemical Society 2453 dx.doi.org/10.1021/jz300979j | J. Phys. Chem. Lett. 2012, 3, 2453−2457

Figure 1. (A) Steady-state absorption (black), emission (blue), and emission excitation (red) spectra of PF−Ru in benzonitrile at room temperature.The emission spectrum was obtained following excitation at 390 nm; the weak band at 420 nm and the stronger band at 630 nm are emission fromthe PF scaffold and 3MLCT state, respectively. The excitation spectrum was measured with λmon = 630 nm at 298 K. (B) Structure of Ru(II)-functionalized polyfluorene.
Figure 2. (A) Femtosecond transient absorption spectra of PF−Hex in benzonitrile at different delays (blue). Excitation was at 388 nm, and thepump pulse energy was 25 nJ/pulse. The instrument response was 250 fs. (B) Femtosecond transient absorption spectrum of PF−Ru in benzonitrileat different delays. Excitation was at 388 nm, and the pump pulse energy was 50 nJ/pulse. (C) Expanded view of the ground-state bleach andstimulated emission region for PF−Hex. Stimulated emission shows a clear red shift with increasing delay. (D) Expanded view of the ground-statebleach and stimulated emission of PF−Ru, showing the evolution from a structured spectrum characteristic of PF* (gray/black) at early times to theCS state (red) at later times. (E) Ground-state absorption (black) and emission (red) of PF in benzonitrile. (F) The decays of the transient signals at443 nm for both PF−Hex and PF−Ru. Both have biexponetial decay forms. PF−Ru (τ1 = 450 ± 20 fs and τ2 = 1.50 ± 0.10 ps) and PF (τ1 = 10 ±0.30 ps and τ2 = 365 ± 1.70 ps).
The Journal of Physical Chemistry Letters Letter
dx.doi.org/10.1021/jz300979j | J. Phys. Chem. Lett. 2012, 3, 2453−24572454
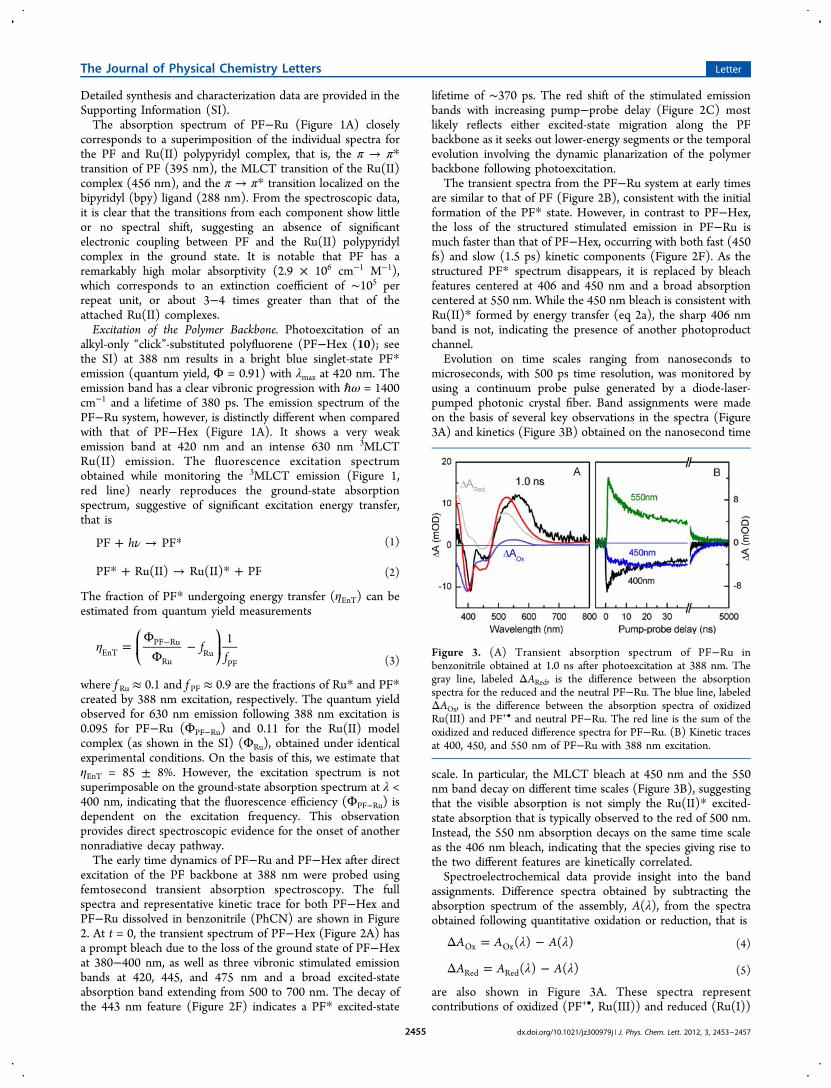
Detailed synthesis and characterization data are provided in theSupporting Information (SI).The absorption spectrum of PF−Ru (Figure 1A) closely
corresponds to a superimposition of the individual spectra forthe PF and Ru(II) polypyridyl complex, that is, the π → π*transition of PF (395 nm), the MLCT transition of the Ru(II)complex (456 nm), and the π → π* transition localized on thebipyridyl (bpy) ligand (288 nm). From the spectroscopic data,it is clear that the transitions from each component show littleor no spectral shift, suggesting an absence of significantelectronic coupling between PF and the Ru(II) polypyridylcomplex in the ground state. It is notable that PF has aremarkably high molar absorptivity (2.9 × 106 cm−1 M−1),which corresponds to an extinction coefficient of ∼105 perrepeat unit, or about 3−4 times greater than that of theattached Ru(II) complexes.Excitation of the Polymer Backbone. Photoexcitation of an
alkyl-only “click”-substituted polyfluorene (PF−Hex (10); seethe SI) at 388 nm results in a bright blue singlet-state PF*emission (quantum yield, Φ = 0.91) with λmax at 420 nm. Theemission band has a clear vibronic progression with ℏω = 1400cm−1 and a lifetime of 380 ps. The emission spectrum of thePF−Ru system, however, is distinctly different when comparedwith that of PF−Hex (Figure 1A). It shows a very weakemission band at 420 nm and an intense 630 nm 3MLCTRu(II) emission. The fluorescence excitation spectrumobtained while monitoring the 3MLCT emission (Figure 1,red line) nearly reproduces the ground-state absorptionspectrum, suggestive of significant excitation energy transfer,that is
ν+ → *hPF PF (1)
* + → * +PF Ru(II) Ru(II) PF (2)
The fraction of PF* undergoing energy transfer (ηEnT) can beestimated from quantum yield measurements
η =Φ
Φ−−
⎛⎝⎜
⎞⎠⎟f
f1
EnTPF Ru
RuRu
PF (3)
where f Ru ≈ 0.1 and f PF ≈ 0.9 are the fractions of Ru* and PF*created by 388 nm excitation, respectively. The quantum yieldobserved for 630 nm emission following 388 nm excitation is0.095 for PF−Ru (ΦPF−Ru) and 0.11 for the Ru(II) modelcomplex (as shown in the SI) (ΦRu), obtained under identicalexperimental conditions. On the basis of this, we estimate thatηEnT = 85 ± 8%. However, the excitation spectrum is notsuperimposable on the ground-state absorption spectrum at λ <400 nm, indicating that the fluorescence efficiency (ΦPF−Ru) isdependent on the excitation frequency. This observationprovides direct spectroscopic evidence for the onset of anothernonradiative decay pathway.The early time dynamics of PF−Ru and PF−Hex after direct
excitation of the PF backbone at 388 nm were probed usingfemtosecond transient absorption spectroscopy. The fullspectra and representative kinetic trace for both PF−Hex andPF−Ru dissolved in benzonitrile (PhCN) are shown in Figure2. At t = 0, the transient spectrum of PF−Hex (Figure 2A) hasa prompt bleach due to the loss of the ground state of PF−Hexat 380−400 nm, as well as three vibronic stimulated emissionbands at 420, 445, and 475 nm and a broad excited-stateabsorption band extending from 500 to 700 nm. The decay ofthe 443 nm feature (Figure 2F) indicates a PF* excited-state
lifetime of ∼370 ps. The red shift of the stimulated emissionbands with increasing pump−probe delay (Figure 2C) mostlikely reflects either excited-state migration along the PFbackbone as it seeks out lower-energy segments or the temporalevolution involving the dynamic planarization of the polymerbackbone following photoexcitation.The transient spectra from the PF−Ru system at early times
are similar to that of PF (Figure 2B), consistent with the initialformation of the PF* state. However, in contrast to PF−Hex,the loss of the structured stimulated emission in PF−Ru ismuch faster than that of PF−Hex, occurring with both fast (450fs) and slow (1.5 ps) kinetic components (Figure 2F). As thestructured PF* spectrum disappears, it is replaced by bleachfeatures centered at 406 and 450 nm and a broad absorptioncentered at 550 nm. While the 450 nm bleach is consistent withRu(II)* formed by energy transfer (eq 2a), the sharp 406 nmband is not, indicating the presence of another photoproductchannel.Evolution on time scales ranging from nanoseconds to
microseconds, with 500 ps time resolution, was monitored byusing a continuum probe pulse generated by a diode-laser-pumped photonic crystal fiber. Band assignments were madeon the basis of several key observations in the spectra (Figure3A) and kinetics (Figure 3B) obtained on the nanosecond time
scale. In particular, the MLCT bleach at 450 nm and the 550nm band decay on different time scales (Figure 3B), suggestingthat the visible absorption is not simply the Ru(II)* excited-state absorption that is typically observed to the red of 500 nm.Instead, the 550 nm absorption decays on the same time scaleas the 406 nm bleach, indicating that the species giving rise tothe two different features are kinetically correlated.Spectroelectrochemical data provide insight into the band
assignments. Difference spectra obtained by subtracting theabsorption spectrum of the assembly, A(λ), from the spectraobtained following quantitative oxidation or reduction, that is
λ λΔ = −A A A( ) ( )Ox Ox (4)
λ λΔ = −A A A( ) ( )Red Red (5)
are also shown in Figure 3A. These spectra representcontributions of oxidized (PF+•, Ru(III)) and reduced (Ru(I))
Figure 3. (A) Transient absorption spectrum of PF−Ru inbenzonitrile obtained at 1.0 ns after photoexcitation at 388 nm. Thegray line, labeled ΔARed, is the difference between the absorptionspectra for the reduced and the neutral PF−Ru. The blue line, labeledΔAOx, is the difference between the absorption spectra of oxidizedRu(III) and PF+• and neutral PF−Ru. The red line is the sum of theoxidized and reduced difference spectra for PF−Ru. (B) Kinetic tracesat 400, 450, and 550 nm of PF−Ru with 388 nm excitation.
The Journal of Physical Chemistry Letters Letter
dx.doi.org/10.1021/jz300979j | J. Phys. Chem. Lett. 2012, 3, 2453−24572455

species to the transient absorption spectrum. The ΔARedspectrum shows a band centered at 520 nm that is assignedto Ru(I). The ΔAOx spectrum reveals two bleach features at 390and 450 nm that correspond to loss of absorption intensityupon oxidation of the polymer backbone and metal complex,respectively, as well as a weak absorption of the oxidizedpolymer (PF+•) at 540 nm. These spectra suggest thatphotoexcitation of the PF backbone also results in theformation of a charge-separated (CS) state by direct electrontransfer from PF* to Ru(II), that is
* + → + +•PF Ru(II) Ru(I) PF (6)
The sum of ΔAOx and ΔARed, depicted as the red line in Figure3, provides an estimate of the contribution of the CS state tothe transient spectrum. This analysis suggests that the 550 nmvisible absorption in the transient spectrum arises primarilyfrom Ru(I), with perhaps a weak contribution from PF+•, andthe 406 nm bleach reflects the loss of the ground-state polymerabsorption upon oxidation. The kinetic correlation between the406 nm bleach and 550 nm absorption indicates that theformation of the CS state during the first few picoseconds isfollowed by back electron transfer on the nanosecond timescale.The bleach feature at 450 nm is most likely due to Ru(II)*
formed via energy transfer. Having said that, the electro-chemical measurements indicate similar oxidation potentials forPF and Ru(II), suggesting that subsequent hole transfer fromthe polymer to the metal complex is possible, that is
+ → ++•PF Ru(II) PF Ru(III) (7)
and thus the 450 nm bleach may also contain contributionsfrom Ru(III).Quenching of the PF* occurs through parallel energy- and
electron-transfer mechanisms (eqs 2 and 6), both taking placeon ultrafast time scales. Close inspection of the transientspectra, particularly the evolution of the 410 nm bleach feature,enables the disentanglement of these two processes. Theposition of the 410 nm feature is relatively constant during thefirst picosecond but then blue shifts over the next 2−3 ps to itsfinal position at 406 nm as the CS features are established. Onthe basis of this, we assign the faster 450 fs component toenergy transfer (eq 2) and the slower 1.5 ps component tocharge separation (eq 6). The other vibronic features in thePF−Ru spectra at 443 and 478 nm do not show the time-dependent red shift associated with expansion of the excitedstate and/or exciton migration that was observed in PF (Figure2D), indicating that the PF* quenching occurs before theseprocesses can occur.Regardless of the exact assignment, it is clear that both
energy transfer and electron transfer are taking place onultrafast time scales. Rapid energy transfer is presumably theresult of a large overlap between the PF emission and theRu(II) absorption, most likely producing a 1MLCT excitedstate through a dipole−dipole coupling mechanism.17−19
Ultrafast electron transfer is likely facilitated by a small barrierand/or a large electronic coupling. The similarity between thedriving force (ΔG° ≈ −0.72 eV) and estimates of thereorganization energy (λ = 0.5−1.0 eV) based on dielectriccontinuum models and comparisons with other systems pointtoward the possibility of a nearly activation-less electron-transfer process.20 The magnitudes of the two rate constantsindicate an energy-transfer efficiency, ηEnT = kEnT/(kEnT + kCS),of 77 ± 6%. The similarity between this value and that
determined from the emission spectra (85 ± 8%) suggests thatthe partitioning between the energy-transfer and electron-transfer pathways is governed by kinetic competition.Decay of the CS state occurs by back electron transfer on the
nanosecond time scale, resulting in a decay of both the 550 and406 nm bands. The decay traces are multiexponential, withboth fast and slow kinetic components (Figure 3B). The fastcomponent at 5.5−6.5 ns is assigned to the back electrontransfer of the initially formed CS products (eq 6). The slowercomponent likely reflects either Ru(II)* decay or slower backelectron transfer events that are delayed due to either electronor hole migration to other sites. The 550 nm signal decays tobaseline within 0.85 μs (Figure 3B), signifying a complete lossof the CS products and residual excited states.Back electron transfer could result in the formation of either
ground- or excited-state Ru(II), that is
+ → + Δ = −+• GRu(I) PF Ru(II) PF 2.23 eV(8a)
+ → * + Δ = −+• GRu(I) PF Ru(II) PF 0.13 eV(8b)
Given the presence of Ru(II)* formed by direct excitation andalso energy transfer, it is difficult to distinguish between thesetwo processes. The large driving force for formation of ground-state Ru(II) most likely places that process in the invertedregime, which would suggest excited-state formation. However,formation of Ru(II)* would involve the transfer of an electronfrom the Ru metal, which would correspond to a longerelectron-transfer distance than formation of Ru(II), where theelectron would transfer from the bpy ligand.The PF−Ru system combines functional elements of both
the conjugated polymer and the metal complex. The polymerprovides efficient light harvesting and energy transport thatenables energy to be collected and funneled to specificlocations. This energy can then be efficiently off-loaded to,and exploited by, pendant metal complexes designed for chargeseparation or photocatalytic functions. In addition, the PF−Rusystem also demonstrates a photoinduced long-range electrontransfer.
■ ASSOCIATED CONTENT*S Supporting InformationExperimental procedures, characterization data, electrochemis-try, and spectroelectrochemistry results. This material isavailable free of charge via the Internet at http://pubs.acs.org.
■ AUTHOR INFORMATIONCorresponding Author*E-mail: [email protected] (J.M.P); [email protected] (J.R.R.).Author Contributions#These authors contributed equally.NotesThe authors declare no competing financial interest.
■ ACKNOWLEDGMENTSThis material is based on work supported as part of the UNCEFRC: Solar Fuels and Next Generation Photovoltaics, anEnergy Frontier Research Center funded by the U.S.Department of Energy, Office of Science, Office of BasicEnergy Sciences under Award Number DE-SC0001011. Wealso acknowledge support for the purchase of instrumentation
The Journal of Physical Chemistry Letters Letter
dx.doi.org/10.1021/jz300979j | J. Phys. Chem. Lett. 2012, 3, 2453−24572456

from UNC SERC (the “Solar Energy Research CenterInstrumentation Facility” funded by the US Department ofEnergy − Office of Energy Efficiency & Renewable Energyunder Award Number DE-EE0003188). L.W. also thanksProfessor David W. Thompson at Memorial University for theacademic consultations and suggestions.
■ REFERENCES(1) Alstrum-Acevedo, J. H.; Brennaman, M. K.; Meyer, T. J.Chemical Approaches to Artificial Photosynthesis. 2. Inorg. Chem.2005, 44, 6802−6827.(2) Concepcion, J. J.; Jurss, J. W.; Templeton, J. L.; Meyer, T. J. OneSite is Enough. Catalytic Water Oxidation by [Ru(tpy)(bpm)-(OH2)]
2+ and [Ru(tpy)(bpz)(OH2)]2+. J. Am. Chem. Soc. 2008, 130,
16462−16463.(3) Jurss, J. W.; Concepcion, J. J.; Butler, J. M.; Omberg, K. M.;Baraldo, L. M.; Thompson, D. G.; Lebeau, E. L.; Hornstein, B.;Schoonover, J. R.; Jude, H.; et al. Electronic Structure of the WaterOxidation Catalyst cis,cis-[(bpy)2(H2O)Ru
IIIORuIII(OH2) (bpy)2]4+,The Blue Dimer. Inorg. Chem. 2012, 51, 1345−1358.(4) Schindler, F.; Lupton, J. M.; Feldmann, J.; Scherf, U. A UniversalPicture of Chromophores in π-Conjugated Polymers Derived fromSingle-Molecule Spectroscopy. Proc. Natl. Acad. Sci. U.S.A. 2004, 101,14695−14700.(5) Schindler, F.; Jacob, J.; Grimsdale, A. C.; Scherf, U.; MAllen, K.;Lupton, J. M.; Feldmann, J. Counting Chromophores in ConjugatedPolymers. Angew. Chem., Int. Ed. 2005, 44, 1520−1525.(6) Collini, E.; Scholes, G. D. Coherent Intrachain Energy Migrationin a Conjugated Polymer at Room Temperature. Science 2009, 323,369−373.(7) Dupray, L. M.; Devenney, M.; Striplin, D. R.; Meyer, T. J. AnAntenna Polymer for Visible Energy Transfer. J. Am. Chem. Soc. 1997,119, 10243−10244.(8) Fleming, C. N.; Dupray, L. M.; Papanikolas, J. M.; Meyer, T. J.Energy Transfer between Ru(II) and Os(II) Polypyridyl ComplexesLinked to Polystyrene. J. Phys. Chem. A 2002, 106, 2328−2334.(9) Fleming, C. N.; Jang, P.; Meyer, T. J.; Papanikolas, J. M. EnergyMigration Dynamics in a Ru(II)- and Os(II)-Based Antenna PolymerEmbedded in a Disordered, Rigid Medium. J. Phys. Chem. B 2004, 108,2205−2209.(10) Sykora, M.; Maxwell, K. A.; DeSimone, J. M.; Meyer, T. J.Mimicking the Antenna-Electron Transfer Properties of Photosyn-thesis. Proc. Natl. Acad. Sci. U.S.A. 2000, 97, 7687−7691.(11) Binder, W. H.; Sachsenhofer, R. 'Click' Chemistry in Polymerand Materials Science. Macromol. Rapid Commun. 2007, 28, 15−54.(12) Becer, C. R.; Hoogenboom, R.; Schubert, U. S. Click Chemistrybeyond Metal-Catalyzed Cycloaddition. Angew. Chem., Int. Ed. 2009,48, 4900−4908.(13) Le Droumaguet, B.; Velonia, K. Click Chemistry: A PowerfulTool to Create Polymer-Based Macromolecular Chimeras. Macromol.Rapid Commun. 2008, 29, 1073−1089.(14) Sakamoto, J.; Rehahn, M.; Wegner, G.; Schluter, A. D. SuzukiPolycondensation: Polyarylenes a la Carte. Macromol. Rapid Commun.2009, 30, 653−687.(15) Suzuki, K.; Kobayashi, A.; Kaneko, S.; Takehira, K.; Yoshihara,T.; Ishida, H.; Shiina, Y.; Oishic, S.; Tobita, S. Reevaluation ofAbsolute Luminescence Quantum Yields of Standard Solutions Usinga Spectrometer with an Integrating Sphere and a Back-Thinned CCDDetector. Phys. Chem. Chem. Phys. 2009, 11, 9850−9860.(16) Schluter, A. D. The Tenth Anniversary of Suzuki Poly-condensation (SPC). J. Polym. Sci., Part A: Polym. Chem. 2001, 39,1533−1556.(17) Faiz, J. A.; Williams, R. M.; Silva, M. J. J. P.; De Cola, L.;Pikramenou, Z. A Unidirectional Energy Transfer Cascade Process in aRuthenium Junction Self-Assembled by α- and β-Cyclodextrins. J. Am.Chem. Soc. 2006, 128, 4520−4521.(18) Tyson, D. S.; Castellano, F. N. Intramolecular Singlet andTriplet Energy Transfer in a Ruthenium(II) Diimine Complex
Containing Multiple Pyrenyl Chromophores. J. Phys. Chem. A 1999,103, 10955−10960.(19) Wilson, G. J.; Sasse, W. H. F.; Mau, A. W.-H. Singlet and TripletEnergy Transfer Processes in Ruthenium(II) Bipyridine ComplexesContaining Covalently Bound Arenes. Chem. Phys. Lett. 1996, 250,583−588.(20) Marcus, R. A. Electron Transfer Reactions in Chemistry. Theoryand Experiment. Rev. Mod. Phys. 1993, 65, 599−610.
The Journal of Physical Chemistry Letters Letter
dx.doi.org/10.1021/jz300979j | J. Phys. Chem. Lett. 2012, 3, 2453−24572457

Tunable Energy Transfer Rates via Control of Primary, Secondary,and Tertiary Structure of a Coiled Coil Peptide ScaffoldDale J. Wilger,† Stephanie E. Bettis,† Christopher K. Materese,† Maria Minakova,† Garegin A. Papoian,*,‡
John M. Papanikolas,*,† and Marcey L. Waters*,†
†Department of Chemistry, CB 3290, University of North Carolina, Chapel Hill, North Carolina 27599, United States‡Department of Chemistry and Biochemistry, University of Maryland, College Park, Maryland 20742, United States
*S Supporting Information
ABSTRACT: Herein we report energy transfer studies in aseries of Ru(II) and Os(II) linked coiled-coil peptides in whichthe supramolecular scaffold controls the functional propertiesof the assembly. A general and convergent method for the site-specific incorporation of bipyridyl Ru(II) and Os(II)complexes using solid-phase peptide synthesis and thecopper-catalyzed azide−alkyne cycloaddition is reported.Supramolecular assembly positions the chromophores forenergy transfer. Using time-resolved emission spectroscopy we measured position-dependent energy transfer that can be variedthrough changes in the sequence of the peptide scaffold. High level molecular dynamics simulations were used in conjunctionwith the spectroscopic techniques to gain molecular-level insight into the observed trends in energy transfer. The most efficientpair of Ru(II) and Os(II) linked peptides as predicted by molecular modeling also exhibited the fastest rate of energy transfer(with kEnT = 2.3 × 10⁷ s−1 (42 ns)). Additionally, the emission quenching for the Ru(II) and Os(II) peptides can be fit to bindingmodels that agree with the dissociation constants determined for the peptides via chemical denaturation.
I. INTRODUCTIONThe design of molecular materials capable of performingcomplex functions is pivotal to “bottom-up” approaches inmolecular electronics,1 sensing,1a,2 and solar energy conver-sion.3,4 The most common strategy for building artificialassemblies uses covalent bond formation to connect molecularcomponents with rigid linkers that dictate both distance andorientation. While this approach provides exquisite control overspatial parameters,5 the optimization of functional performanceoften requires the development of new synthetic routes makingthe implementation very difficult, especially as the number ofmolecular components increases. Alternatively, chromophoreshave been placed on easily synthesized scaffolds such aspolymers,6 dendrimers,1a,3c,7 and organogels.8 However thisapproach can yield assemblies that are not monodisperse inmolecular weight or chemical composition and incorporatemany different morphological constituents. While large systemsare readily made and some control over the primary structure ispossible, the flexible scaffolds result in solution structures thatvary from one assembly to the next.Another approach to achieve functional architectures draws
inspiration from natural systems, which combine simplemolecular building-blocks to form highly complex functionalsystems. Nature exploits relatively weak noncovalent inter-actions to achieve functional architectures with a hierarchicalcontrol, in which sequence defines structure and self-assembly,which defines function. Proteins, lipids, and oligonucleotidesform the structural framework that organize functionalelements in spatial proximity and with well-defined orienta-
tions.9 To this end, functionalized biological molecules such asoligonucleotides,10 amyloid-like peptide fibrils,11 and evenderivatized virus coated proteins have been designed andinvestigated as functional materials.12 These types of designedsystems11,13−15 that mimic the organizational strategies ofbiomolecules provide a number of advantages, including designflexibility, ease of synthesis, and spatial control of functionalitythrough supramolecular architectures that allow for fine-tuning ofmaterials properties.Herein we report the design of an artificial polypeptide
system based on a heterodimeric coiled-coil architecture inwhich the primary sequence defines both the secondary and thetertiary structure, resulting in self-assembly, which provides finecontrol of the positioning of octahedral tris(bipyridyl)transition metal complexes [MII(bpy)3]
2+ (M = Ru or Os,bpy = 2,2′-bipyridyl). Coiled-coils are a common protein motifand provide structural architecture for many important proteinscaffolds including α-keratin16 and tropomyosin.17 Moreover,the sequence-structure rules are well-defined, allowing for thedesign of highly tunable supramolecular architectures bycontrol of the primary sequence.18a In this study wedemonstrate the ability of the peptide secondary structure tocontrol self-assembly and hence relative positioning of theoctahedral complexes, resulting in systematic tuning of theenergy transfer properties of the system. The Ru(II) and Os(II)metal complexes are positioned near the midpoints of two
Received: March 30, 2012Published: June 8, 2012
Article
pubs.acs.org/IC
© 2012 American Chemical Society 11324 dx.doi.org/10.1021/ic300669t | Inorg. Chem. 2012, 51, 11324−11338

complementary peptide chains, each consisting of 28 residues(Figure 1). The primary sequence of each chain is chosen such
that they adopt a dimeric supramolecular structure consisting oftwo α-helical coils, in which the hydrophobic residues areshielded from the aqueous environment and the hydrogenbonding and ionic interactions are maximized. Photoexcitationof the Ru(II) complex in the folded assembly results in energytransfer to the lower energy Os(II) acceptor on the opposingchain. Since the metal complexes are placed on differentpeptide chains, energy transfer is only possible if the two chainsassociate in solution, making this system particularly sensitiveto the secondary and tertiary structure of the peptide scaffold.The peptide structures studied here take advantage of two
flexible synthetic methodologies: solid-phase peptide synthesis(SPPS) and the copper(I)-catalyzed azide−alkyne cyclo-addition (CuAAC or “click reaction”). SPPS is advantageousas it allows for exact positioning of the chromophores in theprimary sequence. The use of click chemistry as an orthogonallinkage strategy between the chromophores and the peptideshas several advantages. First, it avoids issues with formation ofstatistical mixtures of species, as was obtained in the electrontransfer coiled-coil systems developed by Ogawa, in which thechromophore linkage was accomplished via nonspecificcoordination chemistry.15 Second, click chemistry providesadvantages over the direct amide linkage used in the electron-transfer oligoproline systems reported by Meyer, in whichorthogonal protecting group strategies had to be employed.14
We have examined a series of peptide assemblies thatsystematically vary the placement of the complexes along thepeptide backbone, results in predictable changes in the energytransfer rate, which are measured using time-resolved emissionmethods. Variation in the rate by almost an order of magnitudeacross the series, as well as denaturation studies, confirm thatenergy transfer is the direct result of folding into a well-definedtertiary structure. All-atom molecular dynamics simulations
provide insight into the microscopic environment, revealing anassembly with a dynamic, yet robust, tertiary structure thateffectively controls the relative positioning of the twocomplexes.
II. RESULTS AND DISCUSSIONSystem Design. Since energy transfer between Ru(II) and
Os(II) polypyridine complexes has not been previously studiedusing this type of chemical scaffold, a number of designelements were considered crucial for the proper developmentof such a system, as discussed below: (1) the design of thecoiled-coil peptide scaffold, (2) the attachment chemistryincluding its utility, versatility, and compatibility with standardconditions for automated peptide synthesis, (3) the nature ofthe metal complexes including their chemical stability andphotophysical properties, (4) the nature of the linking groupand how it may affect coiled-coil secondary and quaternarystructure, and (5) the positions for Ru(II) and Os(II)modification within the coiled-coil peptides.
Coiled-Coil Peptide Scaffold Design. The coiled-coilpeptide scaffold was adopted from the heterodimeric self-assembling fiber (SAF) system originally reported by Woolfsonand co-workers (Figure 2).18 Both 28-residue peptides contain
the canonical repeating heptad sequence (designated abcdefg)that most coiled-coil peptides display. The a and d sites arereserved for hydrophobic residues which provide the primarydriving force for dimerization. Isoleucine and leucine residueswere specifically chosen for the a and d sites, respectively,because they have been shown superior promoters for thedesired parallel dimeric structure.18a,19 The e and g positionscontain oppositely charged residues such as lysine andglutamate that provide complementary interactions only whenthe heterodimeric and parallel partnering is considered.19c,20 Anasparagine residue is included at a single a position within eachsequence. Polar residues included at these positions must satisfytheir hydrogen bonding potential, and impart folding specificity
Figure 1. (a) Illustration of metallopeptide system containing the α-helical coiled-coil scaffold and metal complexes (coiled coil: pdb2AHP). (b) Structure of the metal complex and its attachment to theα-helix.
Figure 2. (a) Primary sequences of the P1 and P2 peptides using thesingle letter amino acid code (in capitals). Each 28-residue peptide hasfour heptad repeat units. The common letter designations for theheptad positions (abcdefg) are shown above the first heptad repeatunit for P1. The hydrophobic interactions are shown as blue lines, thehydrogen bonding interaction between Asn side chains is shown as acyan line, and the complementary ionic interactions between the twopeptides are shown as red dashed lines. (b) A helical-wheel diagramdisplaying the potential points for attachment when viewed down helixaxis from the N-terminus. The P1 peptide is modified with Os(II) atthe f, c, or g position within the second heptad. The P2 peptide ismodified with Ru(II) at the f, b, or e position within the secondheptad.
Inorganic Chemistry Article
dx.doi.org/10.1021/ic300669t | Inorg. Chem. 2012, 51, 11324−1133811325

through mutual alignment to give a parallel coiled-coilexclusively.19,20b,21 Although the incorporation of two aspar-agine residues within the hydrophobic core of the parallel dimerinterface is slightly destabilizing compared to more hydro-phobic residues at these positions, their incorporation is moredestabilizing within undesired structures including trimers,tetramers, antiparallel dimers, and misaligned dimers.19,20b,21
Thus, this sequence design provides parallel heterodimericcoiled-coils to the exclusion of other supramoleculararchitectures. Of significance for this study is the fact that themonomeric peptides with this type of sequence design typicallydo not fold into helical structures to any great extent. This isattributed to the fact that such a monomeric helix would displaya large hydrophobic patch on one face of the helix, which isunfavorable in aqueous solution.The majority of Woolfson’s SAF peptides contain comple-
mentary interactions that promote a staggered heterodimerstructure referred to as the “sticky-ends” design.18b The P1peptide sequence is a permutation which has been rearrangedto discourage longitudinal association, and therefore fiberformation.18b Natural coiled-coil peptides all share this “blunt”end assembly.22 The P2 apopeptide sequence remainsunchanged from several of Woolfson’s reports.18
Synthesis of Metallopeptides Using CuAAC. A numberof redox-active amino acids containing Ru(II) and Os(II)bipyridyl complexes have previously been reported.14,23 Theseamino acid derivatives are convenient because they can beincorporated into metallopeptides during traditional linearsolid-phase peptide synthesis (SPPS), although they ofteninclude longer coupling times, more exotic coupling reagents,and decreased yields. We chose a convergent synthetic strategybecause it would allow for the peptide, linker, and bipyridylcomplexes to be easily varied for later optimization andinvestigation. The Cu(I)-catalyzed azide−alkyne 1,3-dipolarcycloaddition provides general and robust conditions for theconjugation of biomolecules.24 Several alkynyl-functionalizedRu(II) and Os(II) complexes have been reported,10a−c,25
having previously been used for oligonucleotide modificationwith Sonogashira Pd(0) cross-coupling chemistry.26 The Ru(II)and Os(II) bipyridyl complexes 1a and 1b (Figure 3) wereselected,25 as opposed to previously described phenanthrolinecomplexes,10a−c because the sp3-hybridized carbon within thepropargyl amide group increases flexibility and electronically
decouples the metallobipyridine from the triazole ring formedduring the CuAAC reaction.Lysine ε-azide was selected to provide the tether for 1a and
1b since it contains four aliphatic methylene units, and wasanticipated to be less destabilizing toward the coiled-coilpeptide structure compared to shorter tether lengths (Figure3).18f,27 The linker was also selected to be sufficiently flexible soas to allow rotational freedom for the metal complexes sinceorientation and angular relationships between donor andacceptor modules have a strong influence on energy transferefficiencies.10c,d,13a
Azidopeptides were synthesized by incorporating Fmoc-lysine ε-azide (2) at the desired point of (donor/acceptor)attachment during SPPS (Scheme 1). After the azidopeptides
were cleaved from the solid-phase support and purified usingRP-HPLC, they were conjugated to 1a or 1b using the CuAACreaction (Scheme 1). Reactions containing a tris-(triazolylmethyl)amine ligand (3) demonstrated shorterreaction times and increased yields compared to reactionslacking the ligand.28 A more basic reaction medium (pH 8.5)provided shorter reaction times compared to lower pHmedia.24c After conjugation was complete, the metallopeptideswere purified using a combination of size-exclusion chromatog-raphy and RP-HPLC as described below.
Donor/Acceptor Placement in the Coiled-Coil. Thecoiled-coil peptide scaffold contains a multitude of possiblepositions for the attachment of polypyridyl donor/acceptorcomplexes. The positions selected for modification were chosento provide a range of well-defined donor/acceptor distances inthe self-assembled coiled-coil for measuring excited-state energytransfer. Substitutions on the first and last heptad repeat unitsof the peptides could potentially result in complications fromend fraying near the termini, and were therefore avoided.Conjugation of 1b (Os(II)) at the 2f, 2c, or 2g position withinthe P1 peptide sequence gave the excited state energy acceptormetallopeptides 2f-Os-P1, 2c-Os-P1, and 2g-Os-P1, respectively
Figure 3. (a) Alkynyl-functionalized Ru(II) and Os(II) containingcomplexes 1a and 1b, respectively. (b) Fmoc-lysine-ε-azide 2 used inthe synthesis of azidopeptides. (c) tris-(Triazolylmethyl)amine ligand3 used to accelerate the CuAAC conjugation reaction.
Scheme 1. Synthesis of Metallopeptides Using CuAACa
aConditions: (a) solid-phase peptide synthesis: Fmoc removal,piperidine/DMF (1:4); 2 × 15 min; coupling, 4 equiv of aminoacid, 4 equiv of HBTU, 4 equiv of HOBT, 4 equiv of DIPEA, DMF;capping, Ac2O/2,6-lutidine/DMF (5:6:89); (b) cleavage, TIPS/H20/TFA (2.5:2.5:95); purification, RP-HPLC (c) conjugation using theCuAAC reaction, 2 equiv of 1a or 1b, 1.5−2 equiv of [Cu(CH3CN)4]-PF6, 1 equiv of 3, DMF/buffer (1:1), buffer =10 mM sodiumphosphate buffer, pH 8.5.
Inorganic Chemistry Article
dx.doi.org/10.1021/ic300669t | Inorg. Chem. 2012, 51, 11324−1133811326

(Table 1). Similarly, conjugation of 1a (Ru(II)) at the 2f, 2b, or2e position within the P2 peptide sequence provided the donor
metallopeptides 2f-Ru-P2, 2b-Ru-P2, and 2e-Ru-P2, respectively(Table 1). Three specific pairs of metallopeptides were selectedfor structural analysis, photophysical characterization, and all-atom molecular dynamics simulation. The 2f-Os/2f-Ru metal-lopeptide pair refers to the heterodimer formed by the 2f-Os-P1and 2f-Ru-P2 metallopeptides and was expected to provide thelargest donor/acceptor separation distance, based on theanalysis of parallel dimeric coiled-coils with crystal structuresreported in the protein database (PDB code: 3NM6, 1UIX, and3M9B). The distance between the α-carbons of aligned fpositions to 14.9 Å in these crystal structures. Similar analysisindicated that b-c separations were 12.7−13.5 Å, and e-gseparations were 9.6−10.3 Å. Although these measurements donot account for the length or flexibility of the azidolysine linker,they qualitatively represent the general trends that may beexpected for the rates of energy transfer in the 2f-Os/2f-Ru, 2c-Os/2b-Ru, and 2g-Os/2e-Ru metallopeptide pairs.Structural Characterization of the Metallopeptide
Heterodimers by Circular Dichroism. Circular dichroism(CD) is a common technique for the characterization ofpeptide secondary structure.29a A well-formed α-helix exhibits amaximum in the CD spectrum below 200 nm and minima at208 and 222 nm. The CD spectra of the monomeric peptideseach exhibit relatively weak minima at 208 and 222 nm,characteristic of a dynamic partially folded helical structure, asexpected (Figure 4). Because peptide CD spectra are typicallyplotted with concentration-independent mean residue ellipticityon the y-axis, a 1:1 mixture of complementary peptides isexpected to exhibit deeper minima at 208 and 222 nm if an α-helical coiled-coil structure is formed, whereas if dimerizationdoes not occur, the spectrum of the mixture will be identical tothe average of the spectra for the two individual peptides. TheCD spectra for all three heterodimeric metallopeptide pairsindicate that they form coiled-coil structures when mixed in a1:1 ratio in aqueous buffer at μM concentrations (Figure 4).29
The ellipticity at 222 nm is a quantitative measure of α-helicityand can be used to monitor coiled-coil dimerization. All threepairs display maximum α-helicity when equimolar mixtures aremeasured, indicating that heterodimeric coiled-coil structuresare being formed (see Supporting Information). The 2f-Os/2f-Ru peptide pair exhibits the largest negative signal at 222 nm,with an ellipticity ratio for the 2f-Os/2f-Ru pair at 208 and 222nm, θ222/θ208, equal to 1.00. Similarly, the 2c-Os/2b-Ru and 2g-Os/2e-Ru peptide pairs both have θ222/θ208 values equal to
1.03. This ratio is characteristic of dimeric coiled-coil peptides,as single-stranded α-helices have values closer to 0.85.30
Thermodynamic Stability Determined Using Guanidi-nium Denaturation. Chemical denaturation using guanidi-
Table 1. Ru(II) and Os(II) Metallopeptide Sequencesa
aThe primary sequences for the peptides synthesized and charac-terized in this study are given using the single letter amino acid code(in capitals). X represent the artificial amino acid lysine ε-azide usedfor the attachment of Os(II) (green) or Ru(II) (red) complexes.
Figure 4. (a) Circular dichroism (CD) spectra of the individual 2f-Os(green) and 2f-Ru (red) peptides, both at a concentration of 50 μM at25 °C in 10 mM sodium phosphate buffer, pH 7.4. A 1:1 mixture ofthe two peptides (black, 50 μM combined peptide concentration)shows a more intense negative signal at 222 nm indicating an increasein the α-helicity for the two peptides. (b) CD spectra of the 2c-Os(green) and 2b-Ru (red) peptides and the 1:1 mixture (black) underthe same conditions as in (a). (c) CD spectra of the 2g-Os (green) and2e-Ru (red) peptides and the 1:1 mixture (black) under the sameconditions as in (a).
Inorganic Chemistry Article
dx.doi.org/10.1021/ic300669t | Inorg. Chem. 2012, 51, 11324−1133811327

nium chloride (GndHCl) provides a reliable tool for measuringcoiled-coil dissociation constants.20c,31 The method has beenused to compare small structural variations within families ofsimilarly designed coiled-coils.20c Gibbs free energy change ofunfolding (ΔGunfold) was measured for each of the metal-lopeptide dimers using the method of linear extrapolation(Figure 5).31 The different donor/acceptor modification points
for the metallopeptide pairs resulted in only subtle differencesin structural stability. As may be expected, the 2f-Os/2f-Ru pairformed the most thermodynamically favorable heterodimer(Table 2). The value of ΔGunfold measured for the 2f-Os/2f-Rupair, 8.6 ± 0.10 kcal/mol, corresponds to a dissociationconstant (Kd) equal to 0.49 ± 0.09 μM. The α-helicity of thefully folded 2f-Os/2f-Ru dimer was calculated to be 80%, basedon molar ellipticity measurements at 222 nm (−28,600 ± 800deg·cm2·dmol−1). The α-helical content determined for the 2f-Os/2f-Ru dimer falls within the range reported for similar
sequences since values from 69 to 96% are common for threeto five heptad-repeat coiled-coils.15,32 The fact that it is lessthan 100% helical likely arises from end-fraying.The 2c-Os/2b-Ru peptide pair showed a minor destabiliza-
tion when compared to the 2f-Os/2f-Ru pair. The difference inΔGunfold (8.2 ± 0.10 kcal/mol) for the 2c-Os/2b-Ru peptidepair corresponds to an increase in the extrapolated Kd (0.97 ±0.20 μM). The maximum ellipticity for the 2c-Os/2b-Ru pair(−26,400 ± 700 deg·cm2·dmol−1) corresponds to 74% α-helicity, indicating slightly less α-helical character whencompared to the 2f-Os/2f-Ru dimer. Not unexpectedly, the2g-Os/2e-Ru peptide pair was found to be the least stableheterodimer, as this pair places the Ru(II) and Os(II) closest tothe dimerization interface, although the magnitude of thedestabilization was again quite minimal. The extrapolatedΔGunfold (8.0 ± 0.10 kcal/mol) value for the 2g-Os/2e-Ru pairis within error of that reported for the 2c-Os/2b-Ru pair. Thecalculated Kd (1.4 ± 0.3 μM) value for 2g-Os/2e-Ru pair istherefore also within error. The maximum ellipticity (−25,900± 300 deg·cm2·dmol−1) for the 2g-Os/2e-Ru dimer corre-sponds to 72% α-helicity.Although the thermodynamic parameters (ΔGunfold, Kd, and
% α-helicity) for the 2b-Ru/2c-Os and 2e-Ru/2g-Os metal-lopeptide pairs are within error, the GndHCl denaturationmidpoints ([GndHCl]1/2 = 2.0 ± 0.05 M for the 2b-Ru/2c-Osand 1.8 ± 0.05 M for the 2e-Ru/2g-Os) for the two pairsanalyzed at the same total peptide concentrations are welloutside of error. Chemical denaturation midpoints are oftenused to compare structurally similar peptide sequences sinceΔGunfold values are extrapolated and inherently prone toerror.31,33 The difference in free energy of unfolding betweenthe 2b-Ru/2c-Os and 2e-Ru/2g-Os metallopeptide pairs(ΔΔGD) was calculated to be 0.3 kcal·mol−1 based on thedifference between the [GndHCl]1/2 values (see ExperimentalSection).31,33
Solubility issues prevented full analysis of the parentsequences lacking Ru(II) or Os(II) complexes by GndHCldenaturation. On the basis of the relatively small degree ofdestabilization within the different metallopeptide pairs, it isexpected that the 2f-Os/2f-Ru pair and the parent sequenceswould not be measurably different. Qualitative examination ofCD spectra for the parent sequences also indicated a similarfolding behavior (see Supporting Information). This conclusion
Figure 5. (a) Guanidinium chloride denaturation curves at 25 °C in 20mM sodium phosphate buffer, 100 mM NaCl, pH 7.4. Data plotted forthe 2f-Os/2f-Ru pair (black circles, 300 μM), the 2c-Os/2b-Ru pair(red squares, 200 μM), and the 2g-Os/2e-Ru pair (blue diamonds, 200μM). The calculation of fraction folded is described within theexperimental procedures section. (b) Gibbs free energy of unfolding isplotted as a function of guanidinium chloride concentration (ΔG =m[GndHCl] + ΔGunfold). Linear extrapolation (Experimental Section)gives the value of ΔGunfold at zero denaturant concentration. Datashown for the 2f-Os/2f-Ru pair (black circles, m = −1.7 kcal/mol·M,R2 = 0.997), the 2c-Os/2b-Ru pair (red squares, m = −1.5 kcal/mol·M,R2 = 0.999), and the 2g-Os/2e-Ru pair (blue diamonds, m = −1.7 kcal/mol·M, R2 = 0.997).
Table 2. Thermodynamic Stability of the MetallopeptideHeterodimers
peptide pair ΔGunfold (kcal/mol)a Kd [μM]b α-helicityc
2f-Os/2f-Ru 8.6 0.49 ± 0.09 80%2c-Os/2b-Ru 8.2 0.97 ± 0.2 74%2g-Os/2e-Ru 8.0 1.4 ± 0.3 72%
aGibbs free energy of unfolding (ΔGunfold) was measured for eachpeptide pair using the linear extrapolation method (ExperimentalSection). Error estimated to be ±0.10 kcal/mol based on error due tolinear extrapolation. bDissociation constants (Kd) were calculatedusing the equation ΔGunfold = −RT Ln Kd, using ΔGunfold valuesobtained by the linear extrapolation method. cMaximum ellipticityvalues for each pair were measured using the CD signal at 222 nm formultiple trials. The predicted maximum molar ellipticity for a 28residue helix (XH
28) is calculated to be −35,900 deg·cm2·dmol−1 usingthe equation: XH
n = XH∞(1 − k/n), where XH
∞ is the molar ellipticityfor a helix of infinite length and is equal to −39,500 deg·cm2·dmol−1, nis equal to 28 residues, and k is wavelength-dependent constant equal2.57 at 222 nm.33
Inorganic Chemistry Article
dx.doi.org/10.1021/ic300669t | Inorg. Chem. 2012, 51, 11324−1133811328

agrees with Ogawa’s studies of de novo designed electrontransfer metallopeptides, where very little destabilization wasmeasured when large transition metal complexes were attachedat f positions within the sequence.15 The ΔGunfold and Kd valuesreported for the three metallopeptide dimers were similar tothose reported by Ogawa,15 and other previously reportedvalues corresponding to four-heptad coiled-coils,20c taking intoaccount that the two asparagine substitutions are expected to beslightly destabilizing.19,20b,21
Subsequent photophysical measurements, including theappropriate control experiments, were conducted at concen-trations well above the measured Kd values.Photophysics. Steady-State Spectroscopy. The ground
state absorption spectrum for the 2g-Os/2e-Ru metallopeptidepair exhibits a peak at 450 nm and a lower energy band that iscentered at 650 nm (Figure 6). The peak centered at 450 nm is
the singlet metal-to-ligand charge transfer (1MLCT) for boththe Ru(II) and Os(II) bipyridyl complexes, while the lowerenergy band corresponds to direct excitation of the 3MLCT inthe Os(II) complex which is optically accessible because oflarge spin−orbit coupling. When excited at 450 nm, the steadystate emission spectrum for the 2g-Os/2e-Ru peptide exhibits ahigher energy band (λmax at 660 nm) that corresponds toRu(II) 3MLCT emission after fast intersystem crossing fromthe 1MLCT, while the peak centered at 800 nm is Os(II)3MLCT emission (Figure 6). The steady-state emission spectrashow an increase in the Os(II) emission as the chromophoresare moved closer to each other, providing direct evidence forRu(II) to Os(II) energy transfer (see Supporting Information,Figure S3).Time-Resolved Spectroscopy. Photoexcitation of the Ru(II)
center at 450 nm is followed by rapid relaxation into the3MLCT band, and potentially triplet−triplet energy transfer tothe lower energy Os(II) site. In principle, energy transfer can beobserved either through the quenching of Ru(II) emission at660 nm or the appearance of the Os(II) emission at 800 nm. Inpractice, however, the Os(II) emission due to energy transfer isobscured by Ru(II) emission in the low energy tail andphosphorescence arising from the direct excitation of Os(II) at450 nm. Both these contributions make a quantitative analysis
of the Os(II) emission difficult. While Ru(II) emissioncontaminates the emission of Os(II) at 800 nm, the converseis not true, and both the time-resolved and steady-stateemission measurements show no detectable Os(II) emission at660 nm. Thus, Ru(II) emission provides the cleanest windowthrough which to view Ru-to-Os energy transfer.The P1/2e-Ru coiled-coil was used as a control to measure
the Ru lifetime in the absence of energy transfer (Figure 7a).
The decay is single exponential with a lifetime around 450 ns(2.2 × 10⁶ s−1), comparable to the lifetime of Ru(bpy)3
2+ inwater.34 Pairing of 2e-Ru with the 2g-Os peptide instead of theunmodified P1 results in quenched Ru(II) emission due toenergy transfer (Figure 7a). The decay is biexponential with afast component of 42 ns that is related to energy transfer and aslow component that matches the Ru(II) lifetime of 450 ns.The slow component is attributed to a small fraction ofunassociated Ru(II) chains in solution that are present as aresult of the ground state equilibrium between the peptidechains.
Influence of Folding on Energy Transfer. A comparison ofthe energy transfer dynamics in the folded and unfolded statecan be achieved through denaturation of the peptide scaffold,which in principle can be accomplished by either heating or
Figure 6. The UV−vis absorption (black:25 μM 2e-Ru and 50 μM 2 g-Os) and steady state emission (blue: 25 μM 2e-Ru and 50 μM 2 g-Os)spectra of the 2g-Os/2e-Ru peptide coiled-coil in a 10 mM sodiumphosphate buffer solution, pH 7, 25 °C. Also shown are the 2e-Ru(II)peptide (green dashed: 25 μM 2e-Ru) and 2g-Os(II) peptide emissionspectra (gray dashed: 100 μM 2 g-Os). The excitation wavelength was450 nm.
Figure 7. (a) Time-resolved emission of 2e-Ru peptide in the presenceof the P1 peptide (black: 25 μM 2e-Ru and 50 μM P1) and the 2g-Ospeptide (green: 25 μM 2e-Ru and 50 μM 2g-Os) in a 10 mM sodiumphosphate buffer solution at pH 7 and 25 °C. (b) P1/2e-Ru peptidewith chemical denaturant (black: 25 μM 2e-Ru, 50 μM P1 and 5 Mguanidinium chloride, 20 mM sodium phosphate, and 100 mM sodiumchloride buffer at pH 7 and 25 °C and 2g-Os/2e-Ru peptide pair withchemical denaturant (green: 25 μM 2e-Ru, 50 μM 2g-Os, and 5 Mguanidinium chloride, 20 mM sodium phosphate, and 100 mM sodiumchloride buffer at pH 7 and 25 °C). Ru(II) emission quenching byenergy transfer is turned off in the presence of the chemicaldenaturant. The time-resolved emission data were collected at 660nm with an excitation of 444 nm.
Inorganic Chemistry Article
dx.doi.org/10.1021/ic300669t | Inorg. Chem. 2012, 51, 11324−1133811329

chemical additives. Temperature induced denaturation is moreproblematic because of the high thermal stability of the coiled-coil peptides. The analysis would be further complicated by thefact that the Ru(II) 3MLCT excited state lifetime is diminishedwith increasing temperature because of the thermally accessiblemetal-centered (3dd) excited states that undergo rapidnonradiative decay. Chemical denaturation with GndHClprovides a viable alternative method for studying the denaturedstate at the same concentration used for time-resolvedexperiments.The 660 nm decays for the P1/2e-Ru and 2g-Os/2e-Ru
systems in the presence of guanidine denaturant were measuredand compared to the nondenatured complex (Figure 7b). Theexcited state lifetime of the 2e-Ru peptide is slightly longer inthe highly polar 5 M GndHCl denaturation medium (τ = 520ns compared to 450 ns in buffer), but is unaffected by thepresence of up to 2 equiv (50 mM) of the 2g-Os peptide.The ability of the chemical denaturant to turn off energy
transfer confirms that the Ru(II) emission quenching arisesfrom the folded coiled-coil peptide structure and not fromnonspecific interactions between the peptide chains.In addition, an Os(II) “control complex” (4, Figure 8) was
designed to mimic the acceptor module, while lacking any
molecular recognition elements that would allow for associationwith the partner peptide. When the control complex (4) wasmixed with the 2b-Ru peptide, no change in the excited-statelifetime was observed with up to 2 equiv present. This differsfrom similar studies of Ru(II) and Os(II) modifiedoligonucleotides, which show that the addition of a non-covalently attached Os(II) complex ([Os(bpy)2(phen)]
2+) to aRu(II)-containing oligonucleotide solution results in somequenching (∼8%) of the Ru(II) based phosphorescence, evenat much lower Os(II) concentrations.10c This observation couldbe a consequence of the difference in the net charge on the twoscaffolds or intercalation.10e The oligonucleotides used in thatwork are polyanionic molecules, and may have attractivecharge−charge interactions with bipyridyl complexes that resultin aggregation in solution. The 2b-Ru peptide on the otherhand contains a net positive (+5) charge at pH 7, resulting in arepulsive charge−charge interactions with the control complex.In addition, weak intercalation of the bpy ligands into the DNAduplex may be responsible for the observed quenching in theDNA system, which is not possible in this peptide scaffold.10e
The results of the two control experiments clearlydemonstrate that energy transfer within the peptide systemoccurs between coiled-coil dimer partners, and requires thefolded self-assembled peptide scaffold for structural organ-ization.Positional Variation and Energy Transfer. We compared
the Ru(II) emission quenching for the three coiled-coilmetallopeptide pairs: 2f-Os/2f-Ru, 2c-Os/2b-Ru, and 2g-Os/
2e-Ru (Figure 9), along with the transients from three coiled-coils containing the Ru(II) metallopeptides paired to the P1
apopeptide. All three of the P1/Ru(II) systems exhibitqualitatively similar monoexponential decay kinetics (Table3). Each transient in the mixed Ru(II)/Os(II) systems is
biexponential, where the slow component arises from the freeRu chains in solution and the fast component reflects Ruquenching due to energy transfer. The peptide pair that placesthe complexes the farthest apart, 2f-Os/2f-Ru (Figure 9 blueline), has the largest distance between alpha carbons (14.0−14.9 Å), and results in the slowest energy transfer. The 2g-Os/2e-Ru peptide pair (Figure 9, green line) places the complexesthe closest to each other with an α-carbon distance of 9.6−10.3Å, and has the fastest energy transfer. Lastly, the 2c-Os/2b-Rupeptide pair has an intermediate spacing (12.7−13.5 Å) and itsenergy transfer rate falls in the middle (Figure 9, red line). Thetrend of the quenching rates indicates that the peptide assemblyinfluences the relative positions of the Ru(II) and Os(II)complexes, and thus their ability to undergo energy transfer, ina predictable manner.
Data Analysis. The emission decay was measured in a seriesof 2g-Os/2e-Ru samples in which the 2e-Ru peptide
Figure 8. Os(II) complex (4) was used as a diagnostic forintermolecular energy transfer not mediated by the peptide scaffold.
Figure 9. Time-resolved emission transients showing the distancedependence of the energy transfer rate for the 2f-Os/2f-Ru (blue: 25μM 2f-Ru and 50 μM 2f-Os), 2c-Os/2b-Ru (red: 25 μM 2b-Ru and 50μM 2c-Os), and 2g-Os/2e-Ru (green: 25 μM 2e-Ru and 50 μM 2 g-Os) peptide pairs in 10 mM phosphate buffer solution at pH 7 and 25°C. The P1/2e-Ru peptide (gray: 25 μM 2e-Ru and 50 μM P1) isshown for comparison. From the transients it is clear that the energytransfer rate is faster the closer the metal complexes are placed to oneanother. The time-resolved emission data were collected at 660 nmwith an excitation wavelength of 444 nm.
Table 3. Results of the Global Analysis Showing theDependence of the Energy Transfer Rate on the Positiona
Ka, μM−1 (Kd, μM)
kRu, × 106 s−1
(lifetime, ns)kEnT, × 106 s−1
(lifetime, ns)
2f-Os/2f-Ru 0.908 ± 0.005(1.101 ± 0.006)
2.9 ± 0.002(478.7 ± 0.5)
1.0 ± 0.02(816 ± 14)
2c-Os/2b-Ru 0.919 ± 0.001(1.088 ± 0.002)
2.2 ± 0.002(450.0 ± 0.5)
3.0 ± 0.02(304 ± 2)
2g-Os/2e-Ru 0.887 ± 0.001(1.127 ± 0.001)
2.1 ± 0.002(468.2 ± 0.4)
23 ± 0.1(42.0 ± 0.2)
aAll peptide samples contained 25 μM Ru peptide and 0 to 50 μM Ospeptide in 10 mM sodium phosphate buffer at pH 7 and 25 °C. Theerror is from the global fitting analysis.
Inorganic Chemistry Article
dx.doi.org/10.1021/ic300669t | Inorg. Chem. 2012, 51, 11324−1133811330

concentration is kept constant at 25 μM and the 2g-Os peptideconcentration is incrementally increased from 0 μM to 50 μM(Figure 10). As the 2g-Os peptide concentration is increased
the slow component decreases in amplitude, consistent with adiminishing amount of free Ru(II). The relative amplitudes ofthe two kinetic components reflect the fractions of Ru(II)/Os(II) dimer (fast) and free Ru(II) peptide (slow), resulting inan intensity decay that can be expressed as
= +−− + −
⎛⎝⎜
⎞⎠⎟
⎛⎝⎜
⎞⎠⎟I t( )
[RuOs][Ru]
e[Ru] [RuOs]
[Ru]ek k t k t
0
( ) 0
0
Ru EnT Ru
(1)
where kEnT is the energy transfer rate and kRu is the rate ofRu(II) excited state decay. The relative amplitudes of the twocomponents are dependent on the concentration of associatedheterodimers, [RuOs], which is determined by the ground stateequilibrium:
+ ⇄Ru Os RuOs (2)
= =− −
K[RuOs]
[Ru][Os][RuOs]
([Ru] [RuOs])([Os] [RuOs])a0 0
(3)
where [Ru]0 and [Os]0 are the total concentrations of the twopeptides and Ka is the equilibrium constant.The solid lines in Figure 10 are the result of a global
nonlinear least-squares fit of the series of decays obtained atdifferent Os(II) concentrations to eqs 1−3 with kEnT, kRu, andKa being adjustable parameters. Table 3 summarizes the fittingresults for the three peptide pairs. The 2g-Os/2e-Ru peptidepair exhibits the fastest energy transfer with kEnT = 2.3 × 10⁷ s−1
(42 ns) and the 2f-Os/2f-Ru peptide pair has the slowest withkEnT = 1.0 × 10⁶ s−1 (816 ns), and the 2c-Os/2b-Ru pair fell inthe middle at 3.0 × 10⁶ s−1 (304 ns). The relatively slow energytransfer times in comparison with the lifetime of the Os(II)excited state (16 ns, 6.21 × 10⁷ s−1) prevents a build-up ofOs(II) excited state population. Hence a delayed rise in the Os
emission, which has been observed in other systems,6e is notobserved here. The long linker between the chromophore andthe peptide scaffold will cause the attached chromophores toexperience a variety of conformations that interconvert on thetime scale of the excited state lifetime. Because energy transferwill be more favorable when the two chromophores are in closeproximity, the observed rate will likely also reflect the time scalefor structural fluctuations.All-atom molecular dynamics simulations (discussed below)
depict the bipyridyl complexes in the 2g-Os/2e-Ru and 2c-Os/2b-Ru systems in direct contact, and therefore the energytransfer occurs through Dexter energy transfer mechanism.35
On the other hand the simulations show the complexes in the2f-Os/2f-Ru system remaining at a significant metal−metalseparation (3 nm). Therefore the energy transfer mechanismfor the 2f-Os/2f-Ru system is unlikely to be through spaceDexter energy transfer. Forster, energy transfer, which occursthrough a dipole−dipole mechanism, can occur over largerdonor−acceptor separations.35 Although Forster energy trans-fer is formally forbidden for triplet−triplet energy transfer, thelarge spin−orbit coupling in these late transition metalcomplexes, particularly the Os(II), may provide it with someallowed character.35 The presence of Forster energy transfer atlonger separations is consistent with observations made inother Ru(II)/Os(II) energy transfer systems.6e,10a−c Regardlessof the mechanism, the coiled-coil peptide system is an effectivescaffold for controlling the donor/acceptor placement andhence energy transfer rate in molecular assemblies.
All-Atom Molecular Dynamics Simulations. All atommolecular dynamics simulations were performed on each of thethree coiled-coils to gain insight into the molecular levelinteractions in these systems. Since Ru(II) and Os(II), whenenveloped by the bipyridyl ligands, are practically identical froma molecular dynamics perspective, Ru(II) was used as thecentral atom for simulation in both bipyridyl complexes. Forthe sake of concise comparisons with experiments, we retain thesame nomenclature for the metallopeptide pairs. It is importantto mention that since a single metal−metal distance can mapinto a variety of different conformational arrangements betweentwo metal complexes, we present below detailed trajectoryanalysis, with supplementary movies providing additionalstructural information (see Supporting Information).
2f-Os/2f-Ru Heterodimer. Both bipyridyl complexes in the2f-Os/2f-Ru system start from a distal position relative to thepeptide backbone. During the equilibration phase thecomplexes were frequently found in the proximity of thecoiled-coil peptide backbone, likely driven by favorablehydrophobic interactions. To overcome the bias of thedeliberately chosen initial conditions, the first 250 ns of thesimulation were not included when calculating the distancedistributions. The subsequent data collection phase was run forapproximately 500 ns. The dynamics of the bipyridyl complexesand their unnatural side chains can be described by tworegimes. First, there are large-scale conformational rearrange-ments during which the tethered complexes escape from theirstates bound to the coiled-coil and are free to explore the phasespace to find new collapsed conformations. Second, there aresmall-scale oscillations within these conformations, which occuron a much faster time scale, but do not result in significantdisplacement of the metal complexes. The attachment pointsfor the bipyridyl complexes in the 2f-Os/2f-Ru system are farenough away from each other that the two complexes do notcome into direct contact during the entire course of the
Figure 10. Time-resolved emission for P1/2e-Ru peptide (black: 25μM 2e-Ru and 50 μM P1) and 2g-Os/2e-Ru peptide pair containingvarious amounts of the 2g-Os peptide (blue: 6.25 μM, red: 12.5 μM,green: 18.75 μM, gray: 25 μM, and purple: 50 μM with all containing25 μM 2e-Ru) in a 10 mM phosphate buffer solution at pH 7 and 25°C. The increase in 2g-Os peptide concentration drives the equilibriumto heterodimer formation and thus greater Ru(II) emission quenchingby energy transfer. The time-resolved emission data were collected at660 nm with an excitation wavelength of 444 nm.
Inorganic Chemistry Article
dx.doi.org/10.1021/ic300669t | Inorg. Chem. 2012, 51, 11324−1133811331

simulation. The corresponding metal-center displacementdistributions and the trajectories from which they were derivedare shown in Figure 11. The intermetal distance distribution is
broad (over a 3 nm range) and non-Gaussian. Throughout thecourse of the simulation, the metal-center displacementsobserved for the 2f-Os/2f-Ru system are relatively large andwould be expected to limit the efficiency of energy transfer. Asdiscussed above, these simulations indicate that the Forsterenergy transfer mechanism may play an important role for thiscomplex.Interestingly, the bipyridyl complexes appear to influence the
stability of the 2f-Os/2f-Ru coiled-coil structure as illustrated inthe Supporting Information, Movie 6. α-Helical peptides havean increased propensity toward fraying near the termini, andwhen the metal complex and the 2f-Os/2f-Ru peptide terminusapproach each other, the complex can entrain the ends of thepeptides by providing competing hydrophobic interactionswhich result in further fraying. This partial folding andunfolding can be observed in the timeline plot of the helicityindex α which is equal to the ratio of the number of residues inthe α-helical conformation compared to the total number ofresidues in a sequence (see Figure 12 and Table 4). Theimplications of this observation are elaborated below.2c-Os/2b-Ru Heterodimer. After extensive equilibration for
approximately 300 ns, the initial conformation for the datacollection corresponded to spatially separated bipyridylcomplexes with relaxed linkers and a slightly perturbed
structure for the coiled-coil scaffold. During the first 20 ns ofthe production run, the bipyridyl complexes do not form anystable close contact, with one complex actively exploring thesurface of the peptide scaffold. At ∼25 ns the two complexescontact each other and form a loose association, in which asingle bipyridyl ring aligns with the triazole ring of thecomplementary peptide linker (see Figure 13c). This wasfollowed by close packing of the metal complexes, and resultedin π−π stacking of bipyridine rings (see Figure 13b). The metalcomplexes showed relatively fast (∼0.2 ns) conformationalrearrangement of the bipyridine rings between them, oftenincluding a non-parallel, ∼45° metastable π−π stacking (seeSupporting Information, Movies 1 and 2).The comparative graph of distance distributions in Figure 11
shows that 2c-Os/2b-Ru system has three main peaksdominated by the close-packed geometry at less than 1.5 nm.The timeline of Ru−Os distance has a feature of switching fromone basin with more closely π−π stacked state(s), in whichbipyridine rings align in a mostly parallel fashion (Figure 13b),to another, where the complexes are in close proximity to one
Figure 11. (a) Comparative plot of Ru−Os distance histograms(normalized) for different chromophore placements, including 2f-Os/2f-Ru, 2c-Os/2b-Ru, and 2g-Os/2e-Ru. (b) Ru−Os distance evolutionin time for the 2f-Os/2f-Ru, 2c-Os/2b-Ru, and 2g-Os/2e-Rumetallopeptide pairs.
Figure 12. Fraction of α-helical content in each peptide as a functionof time shown for the 2f-Os/2f-Ru (top), 2c-Os/2b-Ru (middle), and2g-Os/2e-Ru (bottom) metallopeptide pairs. Each peptide activelyexplores its conformational space, while predominantly staying in an α-helical state. The exception is 2g-Os/2e-Ru system (see bottom graph),where an unfolding event is caught during MD. Visualization of thetrajectory showed that peptide termini started interacting with thebipyridyl complexes and significantly disrupted the overall coiled-coilternary and secondary structure.
Table 4. Dependence of the Coiled-Coil Secondary Structureand Metal-Center Displacement on Substitution Position
helicity index α,X-Os-P1
helicity index α,Y-Ru-P2
Ru−Os averagedistance
X = 2f,Y = 2f
0.458 ± 0.097 0.559 ± 0.079 3.100 ± 0.336
X = 2c,Y = 2b
0.631 ± 0.139 0.593 ± 0.124 1.444 ± 0.319
X = 2g,Y = 2e
0.249 ± 0.097 0.070 ± 0.116 1.195 ± 0.048
Inorganic Chemistry Article
dx.doi.org/10.1021/ic300669t | Inorg. Chem. 2012, 51, 11324−1133811332

another, yet not in direct contact. These conformationscorrespond to the 2c-Os bipyridine ring π−π stacking withthe triazole ring of 2b-Ru linker, as shown in Figure 13c.However the contribution from loose packing conformations isstatistically larger, as can be illustrated by comparing the heightsof the first peak at < 1 nm (π−π stacking, see Figure 13b) andthe second peak at approximately 1.2 nm (loose packing, seeFigure 13c) in the Figure 11a.In this system, we did not observe a similar perturbation of
the peptide scaffold by the bipyridyl complexes as was seen inthe 2f-Os/2f-Ru system. The peptide termini dynamicallyunfold and refold during the course of simulations (seeSupporting Information, Movies 2 and 3), but not because ofassociation with the bipyridyl complexes in this case. Thehelicity index of the 2c-Os-P1 and 2b-Ru-P2 peptides is shownin Figure 12. Interestingly, the standard deviation of the helicityindex is approximately 2-fold higher for the 2c-Os/2b-Rusystem, indicating that peptides are more dynamic and activelyexplore their phase space (see Table 4).2g-Os/2e-Ru Heterodimer. In a manner very similar to the
two previous systems, the bipyridyl complexes in the 2g-Os/2e-Ru system quickly collapsed onto the coiled-coil peptidescaffold during the equilibration phase ∼250 ns. The two metalcomplexes came into van der Waals contact with each other in aconformation very similar to the intermediate chromophorepacking arrangement that was observed in the 2c-Os/2b-Rusystem (Figure 13c). For 30 ns the bipyridyl complexesfluctuate between the π−π stacking (see Figure 13b) and looserligand arrangements, as shown in Figure 11b. Finally, weobserve one more major conformational rearrangement where atight “neck” stacking is achieved, which is characterized by thebipyridyl ring and a part of the connected linker of one complexaligning with the corresponding structural parts of the other. Asa result, the complexess are facing away from each other (seeFigure 13a and Supporting Information, Movie 4). Thisconformation, which was not observed in the 2c-Os/2b-Rusystem, persists until the end of the simulation. As shown inFigure 13a and Supporting Information, Movie 5, the bipyridylcomplexes in the 2g-Os/2e-Ru system also maintain a closeproximity with the bipyridyl ligands spending most of their timein van der Waals contact.
This “neck” stacking creates a significant amount of strain forthe peptide scaffold, as well as an additional hydrophobicsurface consisting of the linker side chains pulled together. Weshow in Figure 13a and Supporting Information, Movie 5 thatthe peptide termini closest to the bipyridyl complex detachfrom the coiled-coil interface and bind to the groove betweenlinkers or wrap around the bipyridyl complexes themselves,leading to more disruption of the coiled-coil structure,compared with the other two systems (see Figure 13). Theanalyses of the simulation data for all three systems suggest thatthe various placements of the complexes results in dissimilarcomplex-peptide interactions, where the latter influence thecorresponding coiled-coil stabilities (see Table 4). Further-more, although the trends predicted from the MD simulationsare qualitatively consistent with the corresponding thermody-namic measurements, the quantitative extents of the coiled-coildisruption seen in simulations are likely overestimated. Thefollowing possibilities could have contributed to producingextra fraying in our MD simulations: (1) overestimating themetal-complex-peptide interactions, (2) underestimating thestrength of the interpeptide bonding, or (3) preparing theinitial coiled-coil conformations in an imperfect way, which didnot allow tight enough packing of side-chains or accurateenough alignment of hydrophobic interactions (see theExperimental Section).In summary, comparison of the dynamics for all three
metallopeptide systems shows that the 2g-Os/2e-Ru pair hasthe narrowest Ru(II) to Os(II) distance distribution with thesmallest probable separation (∼1 nm), and would therefore bethe best promoter for energy transfer. A metal−metal distanceof 1 nm suggests that the complexes are in close contact witheach other and would imply efficient energy transfer, regardlessof which mechanism is considered. This is in agreement withthe photophysical measurements made on the metallopeptidesystems, which also indicated the 2g-Os/2e-Ru pair to be themost efficient energy transfer promoter, as discussed above.Importantly, we have not observed unfolding of the coiled-coilnear the linker attachment points for any of the three systems.This suggests that the dynamics of the bipyridyl complexesthemselves do not impose a significant stress along the peptidebackbone in our scaffold design. To gain deeper insights into
Figure 13. (a) Bipyridyl ligands arranged in a “neck” conformation, facing away from each other (1.2 nm feature). This conformation was onlyobserved in the 2g-Os/2e-Ru system. (b) π−π stacking arrangement where bipyridyl rings of two complexes are in van der Waals contact and parallelto each other (∼1 nm feature). In our simulations π−π stacking was often shifted and was not stable for longer than ∼10 ps. This tightly stackedconformation is observed consistently in 2c-Os/2b-Ru system and briefly in 2g-Os/2e-Ru system. (c) “Loose” packing arrangement of the bipyridylcomplexes (∼2 nm feature) is a stable basin of conformations with characteristic π−π stacking of one of bipyridine rings of one chromophore andthe triazole ring on the linker of the other. This stacking is stable in 2c-Os/2b-Ru system and transitory to closer intercomplex packing conformationsin 2g-Os/2e-Ru system.
Inorganic Chemistry Article
dx.doi.org/10.1021/ic300669t | Inorg. Chem. 2012, 51, 11324−1133811333

the mechanisms of energy transfer in these systems, subsequentquantum mechanical calculations can be carried out on selectedstructural snapshots of stable stacking conformations observedin the MD simulations. This, in turn, may help to improve thedesign of peptide scaffolds, allowing for more precise controlover molecular components.
III. CONCLUSIONSThe ability to control the positioning and organization ofmolecular components is central to the design of functionalmolecular-based materials.3 However, architectures that relysolely on covalent bonding for structure (e.g., polymers,dendrimers) have limited control over the assembly geometryand higher-order spatial control. Using peptides as scaffolds, wehave designed an artificial self-assembling system that utilizesweak forces to control the relative placement of Ru(II) andOs(II) complexes. The assemblies incorporate an α-helicalcoiled-coil peptide scaffold consisting of α-helical heterodimersin which each coil is functionalized with either a Ru(II)-containing energy donor or with an Os(II)-containing energyacceptor. This architecture differs from many other types ofmolecular assemblies in that it uses both intra- andintermolecular noncovalent interactions to adopt well-definedsecondary and tertiary structures that control the placement ofthe energy transfer complexes. Moreover, the use of “click”chemistry allows for straightforward and well-defined control ofthe placement of the covalently linked chromophores.Circular dichroism spectroscopy in conjunction with time-
resolved emission spectroscopy confirms the importance of theheterodimeric α-helical coiled-coil structure for modulatingenergy transfer. Ru(II) to Os(II) energy transfer is onlyobserved in the folded structures, and energy transfer ratesmeasured across a series of supramolecular structures areconsistent with a systematic variation of the metal complexseparation. Chemical agents that denature the peptide scaffoldalso serve as an on-off switch, and completely disable energytransfer. Molecular dynamics simulations show Ru(II)−Os(II)distance distributions that are consistent with the order of theexperimentally measured energy transfer rates. In addition, thesimulations suggest that the assemblies maintain their α-helicalcharacter, but are dynamic in nature, with stable cores butmultiple conformations interchanging on the nanosecond timescale. These studies demonstrate the sequence-structure-function paradigm found in natural proteins in a robustartificial self-assembling system and clearly establishes theessential role the supramolecular scaffold plays in controllingfunction. This system provides a promising new scaffold forfunctional materials that couples straightforward synthesis withfine control of three-dimensional structure that directly dictatesfunction.
IV. EXPERIMENTAL SECTIONGeneral Methods. Solvents were purchased from Fisher Scientific
and were used as received unless noted otherwise. cis-Dichlorobis(2,2′-bipyridine)ruthenium(II) dihydrate was purchased from StremChemicals. All α-N-Fmoc-amino acids, including α-N-Fmoc-lysine,were purchased from Novabiochem. Tetrakis(acetonitrile)copper(I)hexafluorophosphate, 2,2′-bipyridine, 4,4′-dimethyl-2,2′-bipyridine, andtripropargylamine were purchased from Aldrich. The compounds 4′-methyl-2,2′-bipyridine-4-carboxaldehyde, 4′-methyl-2,2′-bipyridine-4-carboxylic acid, and succinimidyl-4-carboxy-4′-methyl-2,2′-bipyridinewere synthesized according to reported procedures.36 cis-Dichlorobis-(2,2′-bipyridine)osmium(II) was synthesized using the procedurereported by Meyer.37 Deuterated solvents were purchased from
Cambridge Isotope Laboratories. 1H and 13C NMR spectra wererecorded at 400 and 100 MHz, respectively, on Bruker spectrometers.Chemical shifts were given in ppm relative to solvent peakscorresponding to residual protons for the deuterated solvents. Thesevalues were taken as δ 7.27, 1.93, and 5.32 for CDCl3, CD3CN, andCD2Cl2, respectively. Coupling constants are given in hertz. Thedetails for peptide synthesis and purification are provided below. High-resolution and low-resolution mass spectra were obtained using aBruker Biotof instrument. Milli-Q water was used for the preparationof all buffers and solutions.
Peptide Synthesis. Peptides were synthesized by standardautomated SPPS using a Thuramed tetras synthesizer. Fmoc-protectedamino acids were used along with a CLEAR-Amide resin fromPeptides International, Inc. Amino acid residues were activated withHBTU, HOBt, and DIPEA in DMF. Amino acids were deprotectedtwice with 2% DBU and 2% piperidine in DMF for 15 min each step.Commercially available amino acids were coupled using doublecoupling cycles of 30−60 min each. The N-terminus of each peptidewas acetylated using 5% acetic anhydride and 6% lutidine in DMF for30 min. Cleavage of the peptides from the resin was performed in95.0% TFA, 2.5% water, and 2.5% TIPS. TFA was evaporated with astream of nitrogen and diethyl ether was added to precipitate thecleavage products. The peptides were extracted with water or collectedas solids by centrifugation and lyophilized to dryness. Peptides werepurified by RP-HPLC using an Atlantis Prep OBD dC-18 semi-preparative column, with a gradient of 0−100% solvent B over 40 min,where solvent A was 95:5 water/ACN, 0.1% TFA, and solvent B was95:5 ACN/water, 0.1% TFA. Purified samples were lyophilized andthe peptide sequence was confirmed by ESI-MS. M was calculated as3212.73 (exact) for the P1 parent sequence (C142H237N37O47). MS m/z observed: 1608.4 ([M + 2H+]2+), 1072.6 ([M + 3H+]3+), 804.7 ([M+ 4H+]4+); M was calculated as 3363.95 (exact) for the P2 parentsequence (C149H258N46O42). MS m/z observed: 1123.0 ([M +3H+]3+), 842.5 ([M + 4H+]4+), 674.0 ([M + 5H+]5+).
Azidopeptide Synthesis. Peptides containing azidolysine residuesat desired positions were synthesized using an automated synthesizeras described above. α-Fmoc-ε-azido-l-lysine 2 was synthesized by thereported procedure.18f,27 α-Fmoc-ε-azido-L-lysine 2 was injectedmanually, and a single 3 h coupling reaction was performed. Theazidopeptides were cleaved from the resin, and purified in a fashionidentical to the parent sequences. Azidopeptide identities wereconfirmed by ESI-MS. M was calculated as 3238.76 (exact) for 2f-N3-P1 (C143H239N39O46). MS m/z observed: 1620.9 ([M + 2H+]2+),1081.0 ([M + 3H+]3+), 811.0 ([M + 4H+]4+); M was calculated as3295.78 (exact) for 2c-N3-P1 (C145H242N40O47). MS m/z observed:1649.3 ([M + 2H+]2+), 1099.9 ([M + 3H+]3+), 825.2 ([M + 4H+]4+);M was calculated as 3237.77 (exact) for 2g-N3-P1 (C143H240N40O45).MS m/z observed: 1620.3 ([M + 2H+]2+), 1080.6 ([M + 3H+]3+),810.7 ([M + 4H+]4+); M was calculated as 3389.97 (exact) for 2f-N3-P2 (C150H260N48O41). MS m/z observed: 1131.0 ([M + 3H+]3+),848.5 ([M + 4H+]4+), 679.1 ([M + 5H+]5+); M was calculated as3447.00 (exact) for 2b-N3-P2 (C152H263N49O42). MS m/z observed:1150.3 ([M + 3H+]3+), 863.0 ([M + 4H+]4+), 690.6 ([M + 5H+]5+); Mwas calculated as 3389.94 (exact) for 2e-N3-P2 (C149H256N48O42). MSm/z observed: 1131.0 ([M + 3H+]3+), 848.5 ([M + 4H+]4+), 679.0([M + 5H+]5+).
Metallopeptide Synthesis. In a typical procedure 8−15 mg(∼2−4 μmol) of azidopeptide would be partially dissolved in 1−3 mLof 50% (v/v) DMF in 10 mM sodium phosphate buffer, pH 8.5, thatwas deoxygenated with N2 for 30 min. The azidopeptide was reactedwith (2 equiv) of either the Ru(II) complex 1a or the Os(II) complex1b in the presence of tetrakis(acetonitrile)copper(I) hexafluorophos-phate (2 equiv), and tris-(triazolylmethyl)amine ligand (3, 1 equiv).The mixtures were allowed to stir overnight for 12−48 h, and thendiluted with water (10 mL). The aqueous solutions were frozen andlyophilized. The fully lyophilized residue was dissolved in 0.1 Maqueous TFA and passed through a Pierce polyacrylamide desaltingcolumn. The conjugates traveled through the size-exclusion mediamore quickly than 1a or 1b, and provided the final metallopeptidesafter purification by reversed-phase HPLC using the conditions listed
Inorganic Chemistry Article
dx.doi.org/10.1021/ic300669t | Inorg. Chem. 2012, 51, 11324−1133811334

above. Metallopeptide identities were confirmed by ESI-MS. M2+ wascalculated as 3993.96 (exact) for 2f-Os-P1 (C178H268N46O47Os). MSm/z observed: 1997.0 ([M2+]2+), 1331.8 ([M2+ + H+]3+), 999.0 ([M2+
+ 2H+]4+), 799.4 ([M2+ + 3H+]5+), 666.4 ([M2+ + 4H+]6+); M2+ wascalculated as 4050.98 (exact) for 2c-Os-P1 (C180H271N47O48Os). MSm/z observed: 2025.8 ([M2+]2+), 1350.7 ([M2+ + H+]3+), 1013.2([M2+ + 2H+]4+), 810.8 ([M2+ + 3H+]5+), 679.5 ([M2+ + 4H+]6+); M2+
was calculated as 3992.98 (exact) for 2g-Os-P1 (C178H269N47O46Os).MS m/z observed: 1996.5 ([M2+]), 1131.3 ([M2+ + H+]3+), 998.7([M2+ + 2H+]4+), 799.2 ([M2+ + 3H+]5+), 666.2 ([M2+ + 4H+]4+); M2+
was calculated as 4055.12 (exact) for 2f-Ru-P2 (C185H289N55O42Ru).MS m/z observed: 1352.0 ([M2+ + H+]3+), 1014.1 ([M2+ + 2H+]4+),811.6 ([M2+ + 3H+]5+), 676.5 ([M2+ + 4H+]6+), 580.0 ([M2+ +5H+]7+); M2+ was calculated as 4112.14 (exact) for 2b-Ru-P2(C187H292N56O43Ru); MS m/z observed: 1371.7 ([M2+ + H+]3+),1029.0 ([M2+ + 2H+]4+), 823.6 ([M2+ + 3H+]5+); M2+ was calculatedas 4055.09 (exact) for 2e-Ru-P2 (C184H285N55O43Ru). MS m/zobserved: 1352.6 ([M2+ + H+]3+), 1014.5 ([M2+ + 2H+]+4).Compound 1a. The propargyl amide derivatized Ru(II) complex
was prepared according to the procedure reported by Khan andGrinstaff.25a
Compound 1b. The propargyl amide derivatized Os(II) complexwas prepared according to the procedure reported by Khan andGrinstaff.25a A small round-bottom, equipped with a condenser, wascharged with cis-dichlorobis(2,2′-bipyridine)osmium(II) (39.7 mg,0.069 mmol), and 4′-methyl-2,2′-bipyridine-4-propargylamide (19.1mg, 0.076 mmol, 1.1 equiv). The reagents were heated at reflux in 50%aqueous EtOH for 24 h, and then concentrated under vacuum. Theresidue was suspended in H2O (100 mL), and filtered to removeunreacted cis-dichlorobis(2,2′-bipyridine)osmium(II). The aqueousfiltrate was washed with DCM (2 × 100 mL). A portion of saturatedNH4PF6 was added to the aqueous solution and a green precipitateformed. The precipitate was extracted into EtOAc and thenconcentrated to a solid under vacuum. The solid was partiallydissolved in DCM, filtered, and then concentrated to provide theproduct as a dark green solid (18.4 mg, 26%). 1H NMR (400 MHz,CD2Cl2): δ 8.80 (d, J = 1.2 Hz, 1H), δ 8.48 (s, 1H), δ 8.43−8.40 (m,4H), δ 7.90−7.84 (m, 4H), δ 7.78 (t, J = 5.6 Hz, 1H), δ 7.70−7.65 (m,4H), δ 7.63−7.59 (m, 4H), δ 7.41−7.34 (m, 4H), δ 7.44−7.41 (m,4H), δ 7.21 (dd, J = 5.8, 1.0 Hz, 1H), δ 4.20 (dd, J = 5.6, 2.4 Hz, 2H),δ 2.69 (s, 3H), δ 2.28 (t, J = 2.4 Hz, 1H); UV−vis (CH3CN) λmax (ε):247 (22,000), 291 (50,000), 485 (10,000), 593 (3,000); High-resolution ESI-MS: m/z calculated for C35H29N7OOs (M2+),337.6024; found 337.5952.Compound 3. The tris-(triazolylmethyl)amine ligand was prepared
according to the procedure reported by Chan and Fokin.28a,c Asolution of tripropargylamine (233.0 mg, 1.777 mmol), methylazidoacetate (805.4 mg, 6.998 mmol, 3.94 equiv), and tetrakis-(acetonitrile)copper(I) hexafluorophosphate (21.9 mg, 58.8 μmol),and DIPEA (1 mL, 5.741 mmol, ∼3 equiv to alkyne) in ACN (4 mL)was stirred under N2 for 24 h. The reaction warmed considerably whenDIPEA was added and was cooled in an ice bath. The reaction wasconcentrated in vacuo, and the residue was suspended in saturatedaqueous NaHCO3 (50 mL), extracted with CH2Cl2 (3 × 50 mL),dried over anhydrous Na2SO4, filtered, and concentrated. The product(3) was obtained as an off white solid after chromatography on silicagel using 5% (v/v) MeOH in CH2Cl2. Yield, 701 mg (83%).
1H NMR(400 MHz, CDCl3): δ 7.84 (s, 1H), δ 5.18 (s, 2H), δ 3.79 (s, 2H), δ3.78 (s, 3H); 13C NMR (100 MHz, CDCl3) δ 166.8, 144.6, 125.2,52.9, 50.7, 47.4. High-resolution ESI-MS: m/z calculated forC18H24N10O6 (M + Cs+), 609.0935; found 609.0920.Compound 4. A solution of 1b (6.95 mgs, 8 μmol), methyl
azidoacetate (1.42 mg, 10 μmol, 1.7 equiv), and DIPEA (3 μL) inACN (1.5 mL) was stirred in a round-bottom and cooled in an icebath before tetrakis (acetonitrile)copper(I) hexafluorophosphate (0.56mgs, 1.5 μmol, 20 mol %) was added. The solution was allowed towarm to room temperature slowly and stirred for 2 days under an inertatmosphere. The Os(II) complex was purified by RP-HPLC usingmethods identical to those described below for the metallopeptides.
ESI-MS: m/z calculated for C38H34N10O3Os (M2+), 435.12; found435.1.
Circular Dichroism. CD spectra were recorded on a chirascancircular dichroism spectrometer. CD spectra were recorded from 185to 260 nm using 10 mM sodium phosphate buffer, pH 7. CD spectrataken for guanidinium denaturation experiments were taken from 200to 260 nm. All spectra were recorded at 25 °C with an optical pathlength of 0.1 cm. The results are expressed as the mean molar residueellipticity [θ] with the units of degrees·cm2·dmol−1 and calculated asshown in eq 4:
θ θ= × × ×l c n[ ] /(10 )obs (4)
where θobs is the observed ellipticity in millidegrees, l is the opticalpath length in cm, c is the molar concentration of the peptide, and n isthe number of residues for the peptide.
Guanidinium Chloride Denaturations. The GndHCl denatura-tion experiments were conducted by monitoring the ellipticity at 222nm as a function of GndHCl concentration. Samples were preparedfrom stock peptide solutions, buffer (10 mM sodium phosphate, 100mM sodium chloride, pH 7), and a solution of 8 M GndHCl in samebuffer .
GndHCl denaturation curves were analyzed using a two-statefolding/unfolding model. The fraction folded (FF) was calculatedusing eq 5:
θ θ θ θ= − −F ([ ] [ ] )/([ ] [ ] )F D F D (5)
where [θ] is the observed molar ellipticity (eq 4), [θ]F is the molarellipticity of the fully folded state, and [θ]D is the molar ellipticity ofthe denatured state. The fraction unfolded (FU) was calculated usingeq 6:
= −F F1U F (6)
The free energy of unfolding was calculated using eq 7:
Δ = −G RT P F FLn(2 / )T U2
F (7)
where R is the molar gas constant, T is the temperature in Kelvin, andPT is the total peptide concentration. The free energy of unfolding wasthen calculated via the method of linear extrapolation using eq 8:20c,31
Δ = Δ −G G m[GndHCl]unfold (8)
where the points used for extrapolation were taken through themidpoint in the most linear portion of the denaturation curves.Dissociation constants (Kd) for all three metallopeptide pairs weredetermined using the ΔGunfold values and eq 9:
= Δ ×K G RTexp( / ) 10d unfold6 (9)
The difference in free energy of unfolding between the 2c-Os/2b-Ruand 2g-Os/2e-Ru metallopeptide pairs (ΔΔGD) was calculated basedon the difference between their [GndHCl]1/2 values using eq 10:8
ΔΔ = − +G m m([GndHCl] [GndHCl] )( )(0.5)D 1/2A
1/2B
A B
(10)
where [GndHCl]1/2A and [GndHCl]1/2
B are the GndHCl denaturationmidpoints for two metallopeptide pairs, and mA and mB are the slopevalues from eq 8 applied to the Os/2b-Ru and 2g-Os/2e-Rumetallopeptide pairs, respectively.
Time-Resolved Emission. Ground state absorbance measure-ments were conducted with a Hewlett-Packard 8453 UV−vis−NIRabsorption spectrophotometer. Steady state emission (SSE) data werecollected using an Edinburgh Instruments FLS920 equipped with a450 W xenon lamp and photomultiplier tube (Hamamatsu 2658P).SSE data were collected using a bandwidth no larger than 4.0 nm and,once collected, were corrected for the emission spectrophotometer’sspectral response. The FLS920 was also used for time-resolvedmeasurements by the time-correlated single photon counting(TCSPC) technique with an instrument response of <100 ps, usinga 444.2 nm diode laser (Edinburgh Instruments EPL-445, 73 ps fwhm
Inorganic Chemistry Article
dx.doi.org/10.1021/ic300669t | Inorg. Chem. 2012, 51, 11324−1133811335

pulsewidth) operated at 200 kHz. A 495 nm long pass color filter wasused for emission experiments.The samples were placed in a 2.0 mm cuvette and placed at 45
degree angle from the incident laser beam. Samples were purged inArgon for >25 min just prior to emission experiments. All experimentswere performed with Abs444 nm < 0.2 OD. The solvent for each samplewas 10 μM phosphate buffer at pH 7.Molecular Dynamic Modeling. Since no crystal structure was
available for the system, the initial structure was generated usingPyMOL,38 which is a molecular visualization tool capable ofconstructing simple peptides. The P1 and P2 peptides were initiallygenerated independently using PyMOL’s helical parameters and werethen manually aligned with care taken to avoid steric clashes andsatisfy the hydrophobic interface. The ε-triazolo-L-lysine linkersegment was constructed using Gaussview, part of the Gaussian 03suite.39 Ruthenium(II) and osmium(II) are very similar from an MDperspective. Since the primary focus of these simulations is peptidedynamics, ruthenium was used as the central atom in both complexesand osmium was not explicitly included. This is not expected to haveany significant impact on the simulations, since the metal atoms arenearly completely shielded from the rest of the system by the bipyridylligands, and metal’s formal charge, which is the sane for Ru(II) andOs(II), plays the most important role. To examine the effect of linkerpositioning on the compelexes, the following three systems werecreated: System 1, which corresponds to the 2f-Os/2f-Ru metal-lopeptide pair, System 2 which corresponds to the 2c-Os/2b-Rumetallopeptide pair, and System 3 which corresponds to the 2g-Os/2e-Ru metallopeptide pair.The simulations were prepared using the AMBER40 force field with
the ff99SB41 parameter set. Since the AMBER libraries do not possessparameters for the artificial amino acids used as tethers, or for thechromophores themselves, these values needed to be collected fromliterature or obtained through quantum calculations. Partial charges forthe linker and chromophores were obtained from Gaussiancalculations using restricted B3LYP42 with the LANL2DZ43 basisset. Charges derived using the restricted electrostatic potential (RESP)technique44 gave spurious results for ruthenium and the chelatingnitrogen atoms in the bipyridyl ligands. RESP has difficulty predictingthe correct charge for buried atoms since the charges are assigned in aneffort to reproduce the external electrostatic potential.44 Because ofthis, Mulliken charges were used in lieu of RESP charges. In general,Mulliken charges tend to be slightly more exaggerated than RESPcharges with an average difference in predicted charge of 0.1(±0.1)efor all atoms excluding the ruthenium and those atoms immediatelysurrounding it. There was insufficient memory to compute partialcharges for the entire linker and complex. To deal with this issue, thepartial charges for the base of the peptide up to the γ-carbon of theside chain were extracted from the standard lysine amino acid residue.Force constants for Ru−N stretches, N−Ru−N (cis/trans) bends, C−C−N−Ru dihedrals, H−C−N−Ru dihedrals and van der Waalsparameters were obtained from Brandt et al.45 Since AMBER does notexplicitly support Octahedral geometry, chelating nitrogen atoms weredivided into three distinctly named but chemically identical types toestablish different bending force constants for cis and trans positions.Each of the three simulations were performed with ∼13000 explicitTIP3P water molecules in a box with the dimensions ∼75 × 75 × 75 Åunder periodic boundary conditions. The charge of each system wasneutralized by the addition of sodium counterions, followed by thesubsequent introduction of an additional 10 mM NaCl. Each systemwas held at constant volume, and the peptides were frozen in placewhile the water and ions were minimized for 200,000 steps.Subsequently, all constraints were removed from the systems, andthey were minimized for an additional 200,000 steps. The systemswere gradually heated via Langevin temperature control to 300 K inincremental steps of 5 K every 50 ps. The production runs proceededunder the constant pressure, moderated by Langevin piston (set to 1atm), with 2 fs time steps using the SHAKE algorithm and Ewaldsummation for long-range interactions. Short-range nonbondedinteractions were calculated at each step, long-range interactionswere only calculated on even steps, and the pair list was updated every
10 steps. System coordinates were saved every 2000 steps (4 ps) foranalysis for a total simulation length of 300 ns for each system.
■ ASSOCIATED CONTENT*S Supporting InformationFigures containing the continuous variation experiments,additional circular dichroism spectra, denaturation of parentsequence, additional time-resolved emission transients, NMRspectra, and the complete ref 39 and 40. This material isavailable free of charge via the Internet at http://pubs.acs.org.
■ AUTHOR INFORMATIONCorresponding Author*E-mail: [email protected] (M.L.W.), [email protected] (J.M.P.), [email protected] (G.A.P.).
NotesThe authors declare no competing financial interest.
■ ACKNOWLEDGMENTSThis material is based upon work wholly supported as part ofthe UNC EFRC: Center for Solar Fuels, an Energy FrontierResearch Center funded by the U.S. Department of Energy,Office of Science, Office of Basic Energy Sciences under AwardNumber DE-SC0001011. Some of the instrumentation used inthis project was housed in the UNC SERC “Solar EnergyResearch Center Instrumentation Facility” funded by the U.S.Department of Energy−Office of Energy Efficiency & Renew-able Energy under Award Number DE-EE0003188.
■ REFERENCES(1) (a) Astruc, D.; Boisselier, E.; Ornelas, C. Chem. Rev. 2010, 110,1857−1959. (b) Drain, C. M.; Varotto, A.; Radivojevic, I. Chem. Rev.2009, 109, 1630−1658. (c) Szacilowski, K. Chem. Rev. 2008, 108,3481−3548. (d) Hoeben, F. J. M.; Jonkheijm, P.; Meijer, E. W.;Schenning, A. Chem. Rev. 2005, 105, 1491−1546.(2) (a) Lakowicz, J. R. Principles of Fluorescence Spectroscopy, 3rd ed.;Springer: New York, 2006. (b) McDonagh, C.; Burke, C. S.;MacCraith, B. D. Chem. Rev. 2008, 108, 400−422.(3) (a) Meyer, T. J. Acc. Chem. Res. 1989, 22, 163−170. (b) Alstrum-Acevedo, J. H.; Brennaman, M. K.; Meyer, T. J. Inorg. Chem. 2005, 44,6802−6827. (c) Gust, D.; Moore, T. A.; Moore, A. L. Acc. Chem. Res.2009, 42, 1890−1898. (d) Gust, D.; Moore, T. A. Science 1989, 244,35−41.(4) (a) Du, P. W.; Schneider, J.; Luo, G. G.; Brennessel, W. W.;Eisenberg, R. Inorg. Chem. 2009, 48, 4952−4962. (b) Youngblood, W.J.; Lee, S. H. A.; Maeda, K.; Mallouk, T. E. Acc. Chem. Res. 2009, 42,1966−1973. (c) Bonchio, M.; Carofiglio, T.; Carraro, M.; Fornasier,R.; Tonellato, U. Org. Lett. 2002, 4, 4635−4637.(5) (a) Hsiao, J. S.; Krueger, B. P.; Wagner, R. W.; Johnson, T. E.;Delaney, J. K.; Mauzerall, D. C.; Fleming, G. R.; Lindsey, J. S.; Bocian,D. F.; Donohoe, R. J. J. Am. Chem. Soc. 1996, 118, 11181−11193.(b) Wagner, R. W.; Lindsey, J. S. J. Am. Chem. Soc. 1994, 116, 9759−9760. (c) Song, H.; Taniguchi, M.; Speckbacher, M.; Yu, L.; Bocian, D.F.; Lindsey, J. S.; Holten, D. J. Phys. Chem. B 2009, 113, 8011−8019.(d) Bellows, D.; Goudreault, T.; Aly, S. M.; Fortin, D.; Gros, C. P.;Barbe, J.-M.; Harvey, P. D. Organometallics 2010, 29, 317−325.(6) (a) Jones, W. E.; Baxter, S. M.; Strouse, G. F.; Meyer, T. J. J. Am.Chem. Soc. 1993, 115, 7363−7373. (b) Dupray, L. M.; Meyer, T. J.Inorg. Chem. 1996, 35, 6299−6307. (c) Dupray, L. M.; Devenney, M.;Striplin, D. R.; Meyer, T. J. J. Am. Chem. Soc. 1997, 119, 10243−10244.(d) Friesen, D. A.; Kajita, T.; Danielson, E.; Meyer, T. J. Inorg. Chem.1998, 37, 2756−2762. (e) Fleming, C. N.; Maxwell, K. A.; DeSimone,J. M.; Meyer, T. J.; Papanikolas, J. M. J. Am. Chem. Soc. 2001, 123,10336−10347. (f) Sowash, G. G.; Webber, S. E. Macromolecules 1988,21, 1608−1611. (g) Webber, S. E. Chem. Rev. 1990, 90, 1469−1482.
Inorganic Chemistry Article
dx.doi.org/10.1021/ic300669t | Inorg. Chem. 2012, 51, 11324−1133811336

(7) (a) Marcaccio, M.; Paolucci, F.; Paradisi, C.; Roffia, S.; Fontanesi,C.; Yellowlees, L. J.; Serroni, S.; Campagna, S.; Denti, C.; Balzani, V. J.Am. Chem. Soc. 1999, 121, 10081−10091. (b) Campagna, S.; Denti,G.; Serroni, S.; Juris, A.; Venturi, M.; Ricevuto, V.; Balzani, V. Chem.Eur. J. 1995, 1, 211−221. (c) Van Patten, P. G.; Shreve, A. P.; Lindsey,J. S.; Donohoe, R. J. J. Phys. Chem. B 1998, 102, 4209−4216. (d) Xu,Z. F.; Moore, J. S. Acta Polym. 1994, 45, 83−87. (e) Balzani, V.;Campagna, S.; Denti, G.; Juris, A.; Serroni, S.; Venturi, M. Acc. Chem.Res. 1998, 31, 26−34. (f) Tsukube, H.; Suzuki, Y.; Paul, D.; Kataoka,Y.; Shinoda, S. Chem. Commun. 2007, 2533−2535. (g) Stapert, H. R.;Nishiyama, N.; Jiang, D. L.; Aida, T.; Kataoka, K. Langmuir 2000, 16,8182−8188. (h) Ahn, T. S.; Thompson, A. L.; Bharathi, P.; Muller, A.;Bardeen, C. J. J. Phys. Chem. B 2006, 110, 19810−19819.(i) Nantalaksakul, A.; Reddy, D. R.; Bardeen, C. J.; Thayumanavan,S. Photosynth. Res. 2006, 87, 133−150. (j) Larsen, J.; Puntoriero, F.;Pascher, T.; McClenaghan, N.; Campagna, S.; Akesson, E.; Sundstrom,V. ChemPhysChem 2007, 8, 2643−2651. (k) Andersson, J.; Puntoriero,F.; Serroni, S.; Yartsev, A.; Pascher, T.; Polivka, T.; Campagna, S.;Sundstrom, V. Faraday Discuss. 2004, 127, 295−305. (l) Thomas, K. R.J.; Thompson, A. L.; Sivakumar, A. V.; Bardeen, C. J.; Thayumanavan,S. J. Am. Chem. Soc. 2005, 127, 373−383.(8) (a) Giansante, C.; Raffy, G.; Schaefer, C.; Rahma, H.; Kao, M.-T.;Olive, A. G. L.; Del Guerzo, A. J. Am. Chem. Soc. 2011, 133, 316−325.(b) Babu, S. S.; Kartha, K. K.; Ajayaghosh, A. J. Phys. Chem. Lett. 2010,1, 3413−3424. (c) Ajayaghosh, A.; Praveen, V. K.; Vijayakumar, C.Chem. Soc. Rev. 2008, 37, 109−122. (d) Bhattacharya, S.; Samanta, S.K. Langmuir 2009, 25, 8378−8381.(9) Ferreira, K. N.; Iverson, T. M.; Maghlaoui, K.; Barber, J.; Iwata, S.Science 2004, 303, 1831−1838.(10) (a) Hurley, D. J.; Tor, Y. J. Am. Chem. Soc. 1998, 120, 2194−2195. (b) Hurley, D. J.; Tor, Y. J. Am. Chem. Soc. 2002, 124, 3749−3762. (c) Hurley, D. J.; Tor, Y. J. Am. Chem. Soc. 2002, 124, 13231−13241. (d) Lewis, F. D.; Zhang, L. G.; Zuo, X. B. J. Am. Chem. Soc.2005, 127, 10002−10003. (e) Holmlin, R. E.; Tong, R. T.; Barton, J.K. J. Am. Chem. Soc. 1998, 120, 9724−9725.(11) Channon, K. J.; Devlin, G. L.; MacPhee, C. E. J. Am. Chem. Soc.2009, 131, 12520−12521.(12) Nam, Y. S.; Shin, T.; Park, H.; Magyar, A. P.; Choi, K.; Fantner,G.; Nelson, K. A.; Belcher, A. M. J. Am. Chem. Soc. 2010, 132, 1462−1463.(13) (a) Stryer, L.; Haugland, R. P. Proc. Natl. Acad. Sci. 1967, 58,719−726. (b) Pispisa, B.; Venanzi, M.; Palleschi, A.; Zanotti, G.Macromolecules 1994, 27, 7800−7808. (c) McGimpsey, W. G.; Chen,L.; Carraway, R.; Samaniego, W. N. J. Phys. Chem. A 1999, 103, 6082−6090. (d) Pispisa, B.; Stella, L.; Venanzi, M.; Palleschi, A.; Viappiani,C.; Polese, A.; Formaggio, F.; Toniolo, C. Macromolecules 2000, 33,906−915. (e) Sahoo, H.; Roccatano, D.; Hennig, A.; Nau, W. M. J.Am. Chem. Soc. 2007, 129, 9762−9772.(14) Photoexcited-state electron transfer is a phenomenon closelyrelated to energy transfer and has been extensively studied in a numberof different peptide systems. (a) Mecklenburg, S. L.; Peek, B. M.;Erickson, B. W.; Meyer, T. J. J. Am. Chem. Soc. 1991, 113, 8540−8542.(b) Mecklenburg, S. L.; Peek, B. M.; Schoonover, J. R.; McCafferty, D.G.; Wall, C. G.; Erickson, B. W.; Meyer, T. J. J. Am. Chem. Soc. 1993,115, 5479−5495. (c) Mecklenburg, S. L.; McCafferty, D. G.;Schoonover, J. R.; Peek, B. M.; Erickson, B. W.; Meyer, T. J. Inorg.Chem. 1994, 33, 2974−2983. (d) McCafferty, D. G.; Bishop, B. M.;Wall, C. G.; Hughes, S. G.; Mecklenberg, S. L.; Meyer, T. J.; Erickson,B. W. Tetrahedron 1995, 51, 1093−1106.(15) (a) Kozlov, G. V.; Ogawa, M. Y. J. Am. Chem. Soc. 1997, 119,8377−8378. (b) Kornilova, A. Y.; Wishart, J. F.; Ogawa, M. Y.Biochemistry 2001, 40, 12186−12192. (c) Kornilova, A. Y.; Wishart, J.F.; Xiao, W. Z.; Lasey, R. C.; Fedorova, A.; Shin, Y. K.; Ogawa, M. Y. J.Am. Chem. Soc. 2000, 122, 7999−8006. (d) Fedorova, A.; Chaudhari,A.; Ogawa, M. Y. J. Am. Chem. Soc. 2003, 125, 357−362. (e) Fedorova,A.; Ogawa, M. Y. Bioconjugate Chem. 2002, 13, 150−154. (f) Hong, J.;Kharenko, O. A.; Ogawa, M. Y. Inorg. Chem. 2006, 45, 9974−9984.(16) Crick, F. H. C. Nature 1952, 170, 882−883.
(17) (a) Talbot, J. A.; Hodges, R. S. Acc. Chem. Res. 1982, 15, 224−230. (b) Holtzer, A.; Holtzer, M. E. Macromolecules 1987, 20, 671−675.(18) (a) Woolfson, D. N. Adv. Protein Chem. 2005, 70, 79−112.(b) Pandya, M. J.; Spooner, G. M.; Sunde, M.; Thorpe, J. R.; Rodger,A.; Woolfson, D. N. Biochemistry 2000, 39, 8728−8734. (c) Ryadnov,M. G.; Woolfson, D. N. Angew. Chem., Int. Ed. 2003, 42, 3021−3023.(d) Ryadnov, M. G.; Woolfson, D. N. Nat. Mater. 2003, 2, 329−332.(e) Ryadnov, M. G.; Woolfson, D. N. J. Am. Chem. Soc. 2004, 126,7454−7455. (f) Mahmoud, Z. N.; Gunnoo, S. B.; Thomson, A. R.;Fletcher, J. M.; Woolfson, D. N. Biomaterials. 2011, 32, 3712−3720.(19) (a) Oshea, E. K.; Klemm, J. D.; Kim, P. S.; Alber, T. Science1991, 254, 539−544. (b) Harbury, P. B.; Zhang, T.; Kim, P. S.; Alber,T. Science 1993, 262, 1401−1407. (c) Woolfson, D. N.; Alber, T.Protein Sci. 1995, 4, 1596−1607.(20) (a) Oshea, E. K.; Rutkowski, R.; Kim, P. S. Cell 1992, 68, 699−708. (b) Kohn, W. D.; Kay, C. M.; Hodges, R. S. J. Mol. Biol. 1998,283, 993−1012. (c) Litowski, J. R.; Hodges, R. S. J. Biol. Chem. 2002,277, 37272−37279. (d) Zhou, N. E.; Kay, C. M.; Hodges, R. S. J. Mol.Biol. 1994, 237, 500−512.(21) (a) Lumb, K. J.; Kim, P. S. Biochemistry 1995, 34, 8642−8648.(b) Oakley, M. G.; Kim, P. S. Biochemistry 1998, 37, 12603−12610.(c) Gonzalez, L.; Woolfson, D. N.; Alber, T. Nat. Struct. Biol. 1996, 3,1011−1018.(22) (a) Lupas, A. Trends Biochem. Sci. 1996, 21, 375−382.(b) Marvin, D. A. Curr. Opin. Struct. Biol. 1998, 8, 150−158.(c) Herrmann, H.; Aebi, U. Curr. Opin. Struct. Biol. 1998, 8, 177−185.(d) Phillips, G. N.; Fillers, J. P.; Cohen, C. J. Mol. Biol. 1986, 192,111−128. (e) McLachlan, A. D.; Karn, J. J. Mol. Biol. 1983, 164, 605−626.(23) (a) Geisser, B.; Ponce, A.; Alsfasser, R. Inorg. Chem. 1999, 38,2030−2037. (b) Kise, K. J.; Bowler, B. E. Inorg. Chem. 2002, 41, 379−386. (c) Kise, K. J.; Bowler, B. E. Inorg. Chem. 2003, 42, 3891−3897.(d) McCafferty, D. G.; Friesen, D. A.; Danielson, E.; Wall, C. G.;Saderholm, M. J.; Erickson, B. W.; Meyer, T. J. Proc. Natl. Acad. Sci.,U.S.A. 1996, 93, 8200−8204.(24) (a) Rostovtsev, V. V.; Green, L. G.; Fokin, V. V.; Sharpless, K. B.Angew. Chem., Int. Ed. 2002, 41, 2596−2599. (b) Tornoe, C. W.;Christensen, C.; Meldal, M. J. Org. Chem. 2002, 67, 3057−3064.(c) Meldal, M.; Tornoe, C. W. Chem. Rev. 2008, 108, 2952−3015.(25) (a) Khan, S. I.; Beilstein, A. E.; Grinstaff, M. W. Inorg. Chem.1999, 38, 418−418. (b) Khan, S. I.; Beilstein, A. E.; Smith, G. D.;Sykora, M.; Grinstaff, M. W. Inorg. Chem. 1999, 38, 2411−2415.(c) Khan, S. I.; Grinstaff, M. W. J. Am. Chem. Soc. 1999, 121, 4704−4705. (d) Khan, S. I.; Beilstein, A. E.; Tierney, M. T.; Sykora, M.;Grinstaff, M. W. Inorg. Chem. 1999, 38, 5999−6002. (e) Tierney, M.T.; Sykora, M.; Khan, S. I.; Grinstaff, M. W. J. Phys. Chem. B 2000, 104,7574−7576.(26) (a) Sonogashira, K.; Tohda, Y.; Hagihara, N. Tetrahedron Lett.1975, 4467−4470. (b) Chinchilla, R.; Najera, C. Chem. Rev. 2007, 107,874−922. (c) Hobbs, F. W. J. Org. Chem. 1989, 54, 3420−3422.(27) (a) Isaad, A. L. C.; Barbetti, F.; Rovero, P.; D’Ursi, A. M.; Chelli,M.; Chorev, M.; Papini, A. M. Eur. J. Org. Chem. 2008, 5308−5314.(b) Cantel, S.; Isaad, A. L. C.; Scrima, M.; Levy, J. J.; DiMarchi, R. D.;Rovero, P.; Halperin, J. A.; D’Ursi, A. M.; Papini, A. M.; Chorev, M. J.Org. Chem. 2008, 73, 5663−5674.(28) (a) Chan, T. R.; Hilgraf, R.; Sharpless, K. B.; Fokin, V. V. Org.Lett. 2004, 6, 2853−2855. (b) Lewis, W. G.; Magallon, F. G.; Fokin, V.V.; Finn, M. G. J. Am. Chem. Soc. 2004, 126, 9152−9153. (c) Juricek,M.; Stout, K.; Kouwer, P. H. J.; Rowan, A. E. Org. Lett. 2011, 13,3494−3497.(29) (a) Woody, R. W. Biochem. Spectrosc. 1995, 246, 34−71.(b) Greenfield, N. J. Nat. Protoc. 2006, 1, 2876−2890. (c) Hodges, R.S. Biochem. Cell Biol. 1996, 74, 133−154. (d) Zhou, N. E.; Zhu, B. Y.;Kay, C. M.; Hodges, R. S. Biopolymers 1992, 32, 419−426.(30) (a) Zhou, N. E.; Kay, C. M.; Hodges, R. S. Biochemistry 1992,31, 5739−5746. (b) Zhou, N. E.; Kay, C. M.; Hodges, R. S. J. Biol.Chem. 1992, 267, 2664−2670. (c) Su, J. Y.; Hodges, R. S.; Kay, C. M.Biochemistry 1994, 33, 15501−15510.
Inorganic Chemistry Article
dx.doi.org/10.1021/ic300669t | Inorg. Chem. 2012, 51, 11324−1133811337

(31) (a) Pace, C. N. In Methods in Enzymology; Hirs, C. H. W.,Timasheff, S. E. , Eds.; Academic Press: New York, 1986; Vol. 131.(b) Defrancesco, R.; Pastore, A.; Vecchio, G.; Cortese, R. Biochemistry1991, 30, 143−147.(32) (a) Chen, Y. H.; Yang, J. T.; Chau, K. H. Biochemistry 1974, 13,3350−3359. (b) Scholtz, J. M.; Qian, H.; York, E. J.; Stewart, J. M.;Baldwin, R. L. Biopolymers 1991, 31, 1463−1470. (c) Wendt, H.;Berger, C.; Baici, A.; Thomas, R. M.; Bosshard, H. R. Biochemistry1995, 34, 4097−4107.(33) (a) Kohn, W. D.; Kay, C. M.; Hodges, R. S. Protein Sci. 1995, 4,237−250. (b) Serrano, L.; Horovitz, A.; Avron, B.; Bycroft, M.; Fersht,A. R. Biochemistry 1990, 29, 9343−9352.(34) Juris, A.; Balzani, V.; Barigelletti, F.; Campagna, S.; Belser, P.;Vonzelewsky, A. Coord. Chem. Rev. 1988, 84, 85−277.(35) (a) Dexter, D. L. J. Chem. Phys. 1953, 21, 836−850. (b) Forster,Th. Discuss. Faraday Soc. 1959, 27, 7−17. (c) Murtaza, Z.; Graff, D. K.;Zipp, A. P.; Worl, L. A.; Jones, W. E.; Bates, W. D.; Meyer, T. J. J. Phys.Chem. 1994, 98, 10504−10513.(36) (a) Wang, G. Y.; Bergstrom, D. E. Synlett 1992, 422−424.(b) Peek, B. M.; Ross, G. T.; Edwards, S. W.; Meyer, G. J.; Meyer, T.J.; Erickson, B. W. Int. J. Pept. Protein Res. 1991, 38, 114−123.(c) Telser, J.; Cruickshank, K. A.; Schanze, K. S.; Netzel, T. L. J. Am.Chem. Soc. 1989, 111, 7221−7226.(37) Johnson, S. R.; Westmoreland, T. D.; Caspar, J. V.; Barqawi, K.R.; Meyer, T. J. Inorg. Chem. 1988, 27, 3195−3200.(38) The PyMOL Molecular Graphics System, 1.2r3pre ed.;Schrodinger, LLC: New York.(39) Frisch, M. J.; et al. Gaussian 03, Revision C.02; Gaussian, Inc.:Wallingford, CT, 2004.(40) Case, D. A.; et al. AMBER 11; University of California: SanFrancisco, CA, 2010.(41) Hornak, V.; Abel, R.; Okur, A.; Strockbine, B.; Roitberg, A.;Simmerling, C. Proteins: Struct., Funct., Bioinf. 2006, 65, 712−725.(42) Lee, C. T.; Yang, W. T.; Parr, R. G. Phys. Rev. B 1988, 37, 785−789.(43) (a) Hay, P. J.; Wadt, W. R. J. Chem. Phys. 1985, 82, 270−283.(b) Hay, P. J.; Wadt, W. R. J. Chem. Phys. 1985, 82, 299−310.(c) Wadt, W. R.; Hay, P. J. J. Chem. Phys. 1985, 82, 284−298.(44) Bayly, C. I.; Cieplak, P.; Cornell, W. D.; Kollman, P. A. J. Phys.Chem. 1993, 97, 10269−10280.(45) Brandt, P.; Norrby, T.; Akermark, E.; Norrby, P. O. Inorg. Chem.1998, 37, 4120−4127.
Inorganic Chemistry Article
dx.doi.org/10.1021/ic300669t | Inorg. Chem. 2012, 51, 11324−1133811338

Energy Migration Dynamics in a Ru(II)- and Os(II)-Based Antenna Polymer Embedded ina Disordered, Rigid Medium
Cavan N. Fleming, Paul Jang, Thomas J. Meyer,* and John M. Papanikolas*,†
Department of Chemistry, Venable and Kenan Laboratories, UniVersity of North Carolina at Chapel Hill,Chapel Hill, North Carolina 27599-3290
ReceiVed: August 25, 2003
The energy migration dynamics have been studied in multi-centered assemblies embedded in poly(methylmethacrylate) (PMMA) films using steady-state and time-resolved emission techniques. The assemblies consistof twenty Ru(II) and Os(II) polypyridyl coordination complexes linked through a polystyrene backbone. Energymigration is initiated by photoexcitation of one of the Ru(II) sites and terminated upon sensitization of alow-energy Os trap. The inhomogeneous environment of the assembly results in a distribution of excited-state energies, which is frozen in time due to the rigidity of the PMMA film. Energy migration proceedstoward the lower energy sites, resulting in a time-dependent red-shift in the polymer emission band.
I. Introduction
The ability of polymers to conduct excited-state energy iswell documented.1-11 There are many examples of multi-centered systems in which photoexcitation initially produces alocalized excited state that then migrates between pendentchromophores by Dexter or Forster energy transfer. In fluidsolution, the presence of fast solvent relaxation and a homo-geneous environment leads to energy migration between chro-mophores that are thermally equilibrated and, if chemicallyidentical, isoenergetic.
We have recently published results on the excited-state energymigration dynamics within a supramolecular assembly contain-ing polypyridyl Ru(II) and Os(II) chromophores.11 The chro-mophores are linked through a polystyrene backbone to yieldassemblies with approximately 20 coordination complexes (17RuII and 3 OsII) per chain. The chemical structures of thepolymer and monomer constituents are shown in Figure 1.Energy migration is initiated upon photoexcitation of the metal-to-ligand charge-transfer transition (MLCT) of one of the Rusites, which then leads to efficient energy transport to a lowerenergy Os trap through a series of Ru*f Ru energy hops. Themacromolecular structure of the assembly plays an importantrole in its energy transport properties. Figure 1 depicts a structurecalculated using Monte Carlo simulation methods. Here, thelarger spheres are the RuII or OsII chromophores and the smallerspheres are the PF6
- counterions that surround the polymerwhose overall charge is+40. The polymer adopts a twistedbackbone and extended rodlike structure that attempts toalleviate the steric and Coulombic repulsions between adjacentchromophores, and the result is a densely packed structure inwhich the average distance between the peripheries of adjacentchromophores is 2-3 Å. Our previous work11 shows efficientenergy transport along the polymer chain, which is facilitatedby the close proximity of the pendent groups.
We report here results on the incorporation of these supra-molecular assemblies into room-temperature solid solutions.Like its fluid solution counterpart, steady-state and time-resolved
emission studies indicate that this antenna polymer is capableof energy transport, even when it is embedded in poly(methylmethacrylate) (PMMA) films. This paper explores the effect ofthe rigid environment on the energy transport process.
One benchmark for comparison is electron transfer reactions,which are sensitive to the dynamical response of the surroundingmedium. Solvent molecules reorient in response to the changingcharge distribution between the donor and acceptor. In rigidmedia, where solvent motion is restricted, the energetics anddynamics of electron transfer reactions are significantly effected,often to the point where the reaction is shut down.12,13 Unlikeelectron transfer, the nature of the solvent should play a lessprominent role for energy transfer, since energy transfer involvesthe motion of a dipole, as opposed to individual charges. Thisrole is not necessarily negligible, however, given the sensitivityof the energetics of charge-transfer excited states toward thesolvent environment.
Our results point to additional complexities arising from thissolid surroundings. These complexities are manifested as (1)nonexponential decay kinetics in the monomers and homopoly-mers (PS-Ru20 and PS-Os20), (2) spectroscopic differencesbetween the monomers and their corresponding homopolymers,and (3) time-dependent spectral shifts in the emission spectraof the polymers. All of these are qualitatively different fromour observations in fluid solutions, and stem from a combinationof two factors: a lifting of degeneracy of adjacent excited statesdue to inhomogeneities in the local electrostatic field and therigid molecular environment. As a result, excited states migratetoward lower energy sites and can become trapped at electro-static minima. Although inhomogeneities are also present in fluidsolution, the motion of adjacent sites relative to each othercauses the energy of a particular site to fluctuate, and thisprevents trapping. Our conclusions have implications fordescribing energy transport in fluid solutions. In particular, itsuggests that the efficient energy migration observed in fluidsolution might arise (at least in part) from a trapeze-like motionof the side chains that brings adjacent sites into close physicalcontact, thus enhancing the overlap of donor and acceptor wavefunctions. If this is the case, then inter-site motion and flexibility
* Authors to whom correspondence should be addressed.† E-mail: [email protected].
2205J. Phys. Chem. B2004,108,2205-2209
10.1021/jp0365312 CCC: $27.50 © 2004 American Chemical SocietyPublished on Web 01/22/2004

would be an important architectural feature that is needed todesign efficient nanoscale materials for energy transport.
II. Experimental Section
Preparation of Polymer Films. An amount of 0.6 g ofPMMA was dissolved in 5 mL of chloroform. Dissolutionoccurred over a period of∼30 min with constant stirring andmild heat (∼40°C) applied. The PF6- salt of the complex orpolymer array was dissolved in chloroform or acetonitrile,depending upon its solubility, and its concentration was adjustedto achieve an OD of∼0.6 at the MLCT maximum. An amountof 1 mL of the complex solution was added to the polymersolution, stirred, and poured into a Teflon mold. The solventwas allowed to evaporate slowly over a period of 2-3 days inan open-air desiccator. The resulting film was then placed in avacuum desiccator for 2 days prior to making measurements.The films produced were 4 cm in length and 1 cm in width,and had a fairly uniform thickness of∼1 mm.
Measurements. UV-visible spectra were recorded on adiode array spectrometer with 2 nm resolution. The spectro-scopic grade acetonitrile used in the photophysical measurementswas either used as received or distilled over CaH2. Steady-state
emission spectra were recorded on a photon counting spectro-fluorimeter and were corrected for the instrument response.Optically dilute samples (less than 0.12 OD at the excitationwavelength) were argon sparged for 40 min prior to use.Measurements in rigid media were performed in open atmo-sphere. Emission quantum yields were calculated by relativeactinometry using eq 1.
In this equation,Φsam is the emission quantum yield of eitherthe sample or the reference compound,I is the integratedemission profile,n is the refractive index of the solvent, andAis the absorbance of the sample in a 1 cmquartz cuvette or in∼1 mm PMMA films drip-coated onto a quartz plate. For fluidsolution measurements, the reference was either [Ru(bpy)3]-(PF6)2 for which Φref ) 0.062 or [Os(bpy)3](PF6)2 for whichΦref ) 0.005 in acetonitrile at 298 K. The reference used formeasurements in PMMA is [Rhodamine 6G](Cl) in PMMA at298 K for whichΦref ) 0.77. The reference quantum yield usedhere is the average of two published values.14,15
Time-resolved measurements were conducted by time-cor-related single-photon counting (TCSPC). The apparatus consistsof a commercially available mode-locked Nd:YAG laser whosefrequency-tripled output is used to synchronously pump a singlejet dye laser with Stilbene 3. The dye laser output at 430 nm iscavity dumped to produce∼10 ps pulses with∼6 nJ/pulseenergies. The repetition rate of the dye laser was selected to beroughly 5 times the natural lifetime of the sample (475 kHz formeasurements at 780 nm or 190 kHz for measurements at 640nm at room temperature). The beam is passed through an irisand illuminated without focusing a 10 mm quartz cuvette. Theintensity of the detected luminescence is varied by use of NDfilters mounted before the monochromator. For luminescencemeasurements the emitted light is collected at 90° and focusedonto the slit of a 240 mm focal length, single grating mono-chromator and subsequently delivered to a cooled, multichannelplate-photomultiplier tube (MCP-PMT) with a 170 ps rise time.The signal from the MCP is amplified prior to sending it intoa 200 MHz constant fraction discriminator (CFD) whose outputserved as the start pulse for the time-to-amplitude converter(TAC). The stop pulse in the timing scheme is obtained bysplitting off 10% of the excitation beam and focusing it onto aphotodiode. The photodiode pulse is sent into a variable delaybox, then to the CFD, and finally to the TAC. The TAC’s outputis processed by a multichannel analyzer that is interfaced to aPC. The time-resolution of the apparatus is∼100 ps.
III. Results and Discussion
In a previous report on the energy transfer dynamics in room-temperature CH3CN,11 we combined steady-state and time-resolved spectroscopy with Monte Carlo simulations to obtaina detailed look at the polymer structure and its relationship tothe energy transfer dynamics in PS-Ru17Os3. In this paper weextend the fluid solution work to an amorphous solid, PMMA.
As with the fluid solution, the energy transport propertieswill be closely linked to the macromolecular structure of thepolymer array. Given the dense loading of complexes, we expectthat the polymer array will adopt a similar extended rodlikestructure in PMMA as it does in CH3CN. However, somedifferences may exist. In the low dielectric environment ofPMMA (Ds ) 3.6) the counterions are more closely associatedwith the assembly. Furthermore, in the absence of a small, highly
Figure 1. Chemical structures of the monomer and polymer systemsdiscussed in this work (top) and a three-dimensional view of thepolymer system obtained from Monte Carlo simulation (bottom), ref11.
Φsam) Φref(Isam
Iref)(nsam
nref)2( Aref
Asam) (1)
2206 J. Phys. Chem. B, Vol. 108, No. 7, 2004 Fleming et al.

polar solvent such as CH3CN, the electrostatic interactionsbetween adjacent complexes could be greater, and this wouldincrease the average periphery-periphery distance. Beyondthese small differences, the polymer arrays can be accuratelydescribed as a densely loaded system in which each site is inclose proximity to multiple neighbor sites.
The discussion of our spectroscopic results is divided intotwo sections. Section A describes our steady-state results, whiletime-resolved results are presented in Section B.
A. Steady-State Emission.Steady-state emission spectra of[Os(bpy)2(mab)]2+, PS-Os20, and PS-Ru17Os3 embedded inroom-temperature PMMA are displayed in Figure 2. Thesespectra differ from their fluid solution counterparts in severalregards.
The changes observed for the monomer complexes areconsistent with trends expected for rigid media. The emissionband of [Os(bpy)2(mab)]2+, which peaks at 715 nm, is shiftedto higher energy in rigid polymeric media relative to its valuein CH3CN whereλmax ) 780 nm. Furthermore, the band is notas broad and has more structure than it does in fluid solution;vibronic structure appears at∼775 nm in PMMA. Theseobservations are typical for emissive MLCT excited states inrigid environments.16,17The origin of this blue shift is also wellunderstood. In fluid solution, the solvent dipoles reorient toconfigurations appropriate to the electronic configuration of theexcited state, stabilizing the excited state, and leading to a red-shifted emission band. In rigid solvents, the medium is at leastpartially frozen on the time scale for excited-state decay;emission then occurs with the surrounding solvent dipoleorientations more like those surrounding the ground state andthe emission appears at higher energy. Emission quantum yieldsare also consistent with this picture (Table 1). The quantumyields of both Ru and Os complexesincreaseupon incorporationinto PMMA, consistent with the higher excited-state energy,as predicted by the energy gap law.
While the monomer emission is consistent with otherobservations in rigid environments, the polymer emission is not.In fluid solution, the homopolymers (PS-Ru20 and PS-Os20)are spectroscopically equivalent to their corresponding monomercomplexes. However, in PMMA there are stark differencesbetween the two. PS-Os20 in PMMA has an emission bandtypical of fluid acetonitrile, and the Os* emission from PS-Ru17Os3 is intermediate between these two cases (Figure 2). Inaddition, the increase in quantum yield observed upon incor-
poration of the monomer into the rigid environment is notobserved for the polymers. On the whole, comparison betweenthe PMMA and CH3CN results suggest that while the spectro-scopic properties of the monomer change upon incorporationinto the PMMA matrix, consistent with known rigid mediaeffects, the polymer arrays have spectroscopic properties thatremain more akin to those observed in fluid solution. Theseobservations can be explained by a dispersion in the Os* excited-state energies, which is discussed in more detail in Section B.
B. Time-Resolved Emission.This project examines the time-resolved emission from the mixed loaded polymer, PS-Ru17-Os3, the homopolymers, PS-Ru20 and PS-Os20, and thecorresponding monomers, [Os(bpy)2(mab)]2+ and [Ru(dab)2-(mab)]2+ in room-temperature PMMA. The monomers andhomopolymers serve as model systems for the mixed loadedsystem.
Energy transport along the polymer backbone is evident inthe time-resolved emission data obtained from the PS-Ru17-Os3/PMMA samples. Figure 3 shows the growth and decay ofOs emission (observed at 780 nm) and the decay of the Ruemission (observed at 640 nm) as a function of time afterphotoexcitation of the Ru sites in PS-Ru17Os3. The delayedgrowth in the Os emission, and its correlation with the Ru decay,is a clear indication of Os sensitization by Ru excited states.The time scale associated with the growth of the Os emissionreflects both the rates of individual Ru*f Ru energy transferevents and the number of steps needed to reach the Os trap.Qualitatively the Os* rise kinetics are similar in PMMA andacetonitrile. In acetonitrile a fast, instrument response limitedrise comprises∼55% of the signal. The fast rise has contribu-tions from both direct Os excitation and Ru emission (detectedas a result of the overlapping emission bands at 780 nm) aspreviously discussed.11 In PMMA the fast rise appears to be alarger fraction of the signal, 60-70%. This could be indicativeof a lower efficiency for energy transport compared with fluidsolution; however, a quantitative measure based on the time-resolved data was not possible.
In our fluid solution studies, we were able to determine thecontribution of direct Os excitation and Ru emission to the fast
Figure 2. Steady-state emission spectra of [Os(bpy)2(mab)]2+, PS-Ru17Os3, and PS-Os20 in room-temperature PMMA. Excitation wasat 423 nm.
TABLE 1: Summary of Room Temperature Lifetimes (τ)and Emission Quantum Yields (Φem) in PMMA and CH 3CN
CH3CNc PMMAc
complex Φem τ (ns) Φem τ (ns)
[Ru(dab)2(mab)]2+ 0.11 1100a 0.21 1490a
PS-Ru20 0.10 1000a 0.050 1200b
[Os(bpy)2(mab)]2+ 0.0030 56a 0.030 140a
PS-Os20 0.0032 49a 0.0027 40b
a A sum of two exponential functions was used to fit the decays.The results are as follows:τ1 ) 87 ns (0.42),τ2 ) 182 ns (0.55) for[Os(bpy)2(mab)]2+; τ1 ) 650 ns (0.30),τ2 ) 1850 ns (0.70) for[Ru(dab)2(mab)]2+. Average lifetimes are reported. Monitoring occurredat the emission band maximum.b A sum of three exponential functionswas used to fit the decays. The results are as follows:τ1 ) 2 ns (0.20),τ2 ) 13 ns (0.40),τ3 ) 40 ns (0.35) for PS-Os20; τ1 ) 20 ns (0.15),τ2 ) 225 ns (0.20),τ3 ) 1200 ns (0.60) for PS-Ru20. Slow componentis tabulated for two polymers samples. Spectral evolution is observedon the 1-10 ns time scale which is partly responsible for thenonexponential behavior observed in the PS-Os20 and PS-Ru20. Thisevolution does not reflect the emissive properties of the complexes,but rather energy migration among complexes with an inhomogeneousdistribution of excited-state energies. Monitoring occurred at theemission band maximum.c Care must be taken in making quantitativecomparisons between the two different solvents (PMMA versusCH3CN) because different references were used, and each reference ismost likely known to differing degrees of certainty.
Energy Migration in a Ru(II)- and Os(II)-Based Antenna Polymer J. Phys. Chem. B, Vol. 108, No. 7, 20042207

rise and use this information to assess the energy transferefficiency in CH3CN. This was possible in part because in fluidsolution the monomer complexes, [Ru(dab)2(mab)]2+ and [Os-(bpy)2(mab)]2+, are spectroscopically equivalent to their cor-responding homopolymers, PS-Ru20 and PS-Os20. This is notthe case in the rigid polymeric media where the excited-stateenergies, lifetimes, and emission quantum yields for Os emissionin PS-Os20, the mixed polymer PS-Ru17Os3, and [Os(bpy)2-(mab)]2+ are all different (Table 1).
While there are qualitative similarities in the kinetics foundin fluid solution versus PMMA, there are some significantdifferences. In fluid solution, both the monomers and ho-mopolymers show nearly identical spectroscopic signatures.Both exhibit single-exponential decay kinetics with similar decayrates, and the emission spectra decay without a change in shape(i.e., kinetics are independent of monitoring wavelength). InPMMA, on the other hand, the correspondence between themonomer and its corresponding homopolymer is lost.
Both the monomers, [Os(bpy)2(mab)]2+ and [Ru(dab)2-(mab)]2+, and homopolymers, PS-Os20 and PS-Ru20, displaynonexponential kinetics in PMMA, although the degree ofnonexponential behavior is significantly less in the monomers.Nonexponential decay kinetics are a common feature forpolypyridyl complexes in a variety of rigid media where it hasbeen attributed to the heterogeneity of the solvent.18 In short,the distribution of solvent microenvironments leads to adistribution of excited-state lifetimes. Here it appears that inthe case of the polymers, solvent heterogeneity plays only partof the role in the observed nonexponential kinetics.
In PMMA, the emission spectra for the PS-Ru20 or PS-Os20 polymers change with time after photoexcitation. Whenmonitored on the low energy side of emission band, the Os*emission from PS-Os20 is single exponential and similar to fluidCH3CN. Nonexponential decay kinetics becomes prominent atthe emission band maximum and to the high energy side.Reconstruction of the emission band from the single wavelengthkinetic traces reveals a spectral shift as a function of time (Figure4). The band maximum shifts∼50 nm to the red, reaching itsfinal form by about 10 ns. No monitoring wavelength depen-dence is observed for [Os(bpy)2(mab)]2+ in PMMA, i.e., theemission band decays uniformly with time (Figure 5).
The absence of a spectral shift for [Os(bpy)2(mab)]2+ inPMMA is telling. At the low concentration of monomer doping,the probability that multiple complexes occupy the same site is
negligible. The polymer arrays, on the other hand, have a highlocal concentration of chromophores. One of the consequencesof this high concentration is already known; close contact ofadjacent sites leads to weak electronic coupling and enablesOs* f Os energy transfer even in the rigid, low dielectricenvironment of PMMA. Another consequence is that an MLCTexcited state experiences an electrostatic interaction withsurrounding metal dications, counterions, in addition to thesurrounding PMMA matrix. The presence of the nearby ionscan significantly affect the energetics of the MLCT excited statein a way not present in monomer doped films. Because thedistance between nearest neighbors and the number of metalcomplexes that exist in close contact varies along the chain,there is a dispersion in Os* excited-state energies.
The combination of facile energy transfer and energeticdisorder leads to a situation where excited-state energy can relaxfrom higher energy sites to lower ones as the energy migratesspatially along the polymer array (Figure 6). In the case of thePS-Os20, MLCT photoexcitation of Os is followed by multipleOs* f Os energy transfer events whereby energy cascades tolower energy sites. In PS-Os20, the lowest energy sites can beaccessed. In the mixed polymer PS-Ru17Os3 the Os are deeptraps, surrounded by Ru. Thus, energy transfer from Ru*f Osis irreversible and many low-energy Os sites are not reached.Correspondingly, the emission max is to higher energy.
Figure 3. Time-resolved emission detected from PS-Ru17Os3 in roomtemperature PMMA while monitoring at 730 nm. The transient shownis an average of three measurements made from three different samples.In all cases we observe sensitized Os emission, but the exact kineticsof the rise vary slightly between samples, unlike our observations influid solution.
Figure 4. Time-resolved emission spectra of PS-Os20 in room-temperature PMMA. Spectra have been corrected for the instrumentresponse. Spectra measured att ) 110 ps, 510 ps, 2 ns, and 10 ns(from top to bottom).
Figure 5. Time-resolved emission spectra of [Os(bpy)2(mab)]2+ inroom-temperature PMMA. Spectra have been corrected for the instru-ment response. Spectra measured att ) 0, 10, 100, and 400 ns (fromtop to bottom).
2208 J. Phys. Chem. B, Vol. 108, No. 7, 2004 Fleming et al.

Energetic disorder and excitation dependent kinetics arecharacteristic features of amorphous polymer media. Thisbehavior has been observed in both singlet and triplet energytransfer in polymer films with pendant aromatic chromophores.Fayer et al.19 studied the excitation wavelength-dependentfluorescence depolarization in the 2-vinylnaphthalene/methylmethacrylate copolymer and attributed the observed wavelengthdependence to site inhomogeneity. Time-resolved phosphores-cence spectra have also revealed similar information.20
Dynamical solvent effects involving structural reorganizationof the environment in response to the excited-state chargedistribution could also contribute to the spectral shift. It ispossible that if the excited state were fixed (i.e., no energymigration) than a spectral shift could still be observed as a resultof solvation dynamics that occur on a time scale comparable toexcited-state decay. These could come in two forms, eitherrelaxation of the surrounding PMMA shell or mobility of thepolymer array. In the case of rigid, polymeric solvents such asPMMA, large amplitude motion of the polymer backbone ismost likely frozen on the time scale of excited-state decay andwill not participate in a solvation process involving rotation ortranslation. The primary glass transition temperature for thePMMA used in this study is 120°C. However, PMMA has a
very broad secondary phase transition involving motion of theester side chain centered at room temperature. Orientationalfreedom of the ester group could participate in the solvationdynamics and lead to the observed time dependence. Theabsence of spectral shift in [Os(bpy)2(mab)]2+ suggests that thePMMA motion is fast (<100 ps) and not contributing to theobserved dynamics which take place on a nanosecond time scalein the PS-Os20 system. The mobility of the polymer array is,on the other hand, still an open question. Direct excitation ofthe Os sites (at 700 nm) in PS-Ru17Os3 could provide insightinto this issue.
Acknowledgment. Funding for this project was providedby The Research Corporation (RI0048), the Petroleum ResearchFund (36385-G6), the United States Department of Energy, andthe National Science Foundation (CHE-0301266).
References and Notes
(1) Webber, S. E.Chem. ReV.1990,90, 1469-1482.(2) Holden, D. A.; Guillet, J. E.Macromolecules1980,13, 289.(3) Ng, D.; Guillet, J. E.Macromolecules1982,15, 724.(4) Watkins, D. M.; Fox, M. A.J. Am. Chem. Soc.1996,118, 4344-
4353.(5) Clements, J. H.; Webber, S. E.J. Phys. Chem. B1999,103, 9366.(6) Clements, J. H.; Webber, S. E.J. Phys. Chem. A1999, 103, 2513-
2523.(7) Jones, W. E.; Baxter, S. M.; Strouse, G. F.; Meyer, T. J.J. Am.
Chem. Soc.1993,115, 7363-7373.(8) Yekta, A.; Spiro, J. G.; Winnik, M. A.J. Phys. Chem. B1998,
102, 7960-7970.(9) Schillen, K.; Yekta, A.; Ni, S.; Winnik, M. A.Macromolecules
1998,31, 210-212.(10) Rharbi, Y.; Yekta, A.; Winnik, M. A.; DeVoe, R. J.; Barrera, D.
Macromolecules1999,32, 3241-3248.(11) Fleming, C. N.; Maxwell, K. A.; Meyer, T. J.; Papanikolas, J. M.
J. Am. Chem. Soc.2001,123, 10336-10347.(12) Gaines, G. L.; O’Neil, M. P.; Svec, W. A.; Niemczyk, M. P.;
Wasielewski, M. R.J. Am. Chem. Soc.1991,113, 719-721.(13) Chen, P.; Meyer, T. J.Inorg. Chem.1996,35, 5520-5524.(14) Reisfeld, R.; Zusman, R.; Cohen, Y.; Eyal, M.Chem. Phys. Lett.
1988,147, 142-147.(15) Deshpande, A. V.; Namdas, E. B.J. Lumin.2000,91, 25-31.(16) Chen, P.; Meyer, T. J.Chem. ReV.1998,98, 1439-1477.(17) Wrighton, M. S.; Morse, D. L.J. Am. Chem. Soc.1974,96, 998.(18) Maruszewski, K.; Strommen, D. P.; Kincaid, J. R.J. Am. Chem.
Soc.1993,115, 8345.(19) Stein, A. D.; Peterson, K. A.; Fayer, M. D.J. Chem. Phys.1990,
92, 5622-5635.(20) Hisada, K.; Ito, S.; Yamamoto, M.J. Phys. Chem. B1997,101,
6827-6833.
Figure 6. Schematic diagram depicting the energetic disorder containedin the PS-Ru17Os3 and PS-Os20 polymer systems. In the mixed loadedsystem, energy migration among the Ru sites occurs until energy transferto an Os trap, whose excited-state energy can be anywhere within thebroad Os* energy distribution. In the PS-Os20 system energy migrationamong the Os sites funnels the excited states toward lower energy sites.
Energy Migration in a Ru(II)- and Os(II)-Based Antenna Polymer J. Phys. Chem. B, Vol. 108, No. 7, 20042209

Triplet-Triplet Annihilation of Excited States of Polypyridyl Ru(II) ComplexesBound to Polystyrene
George B. Shaw and John M. Papanikolas*Department of Chemistry, Venable and Kenan Laboratories, The UniVersity of North Carolina at Chapel Hill,Chapel Hill, North Carolina 27599-3290
ReceiVed: December 12, 2001; In Final Form: March 14, 2002
Femtosecond transient absorption spectroscopy is used to study the triplet-triplet annihilation (TTA) interactionbetween the metal-to-ligand charge-transfer (MLCT) excited states of Ru(II) polypyridyl complexes boundto a polystyrene backbone. The polymer chains have, on average, 20 repeat units, each functionalized witha transition metal complex. Spectroscopic experiments are performed on assemblies dissolved in acetonitrileat room temperature. The time-resolved spectra show kinetics that depend on the intensity of the excitationlaser. These effects are attributed to the interaction between multiple excited states formed on a single chain.Fast and slow (intensity-dependent) kinetic components are observed. The fast (3 ps) component is assignedto the TTA of MLCT excited states formed at adjacent sites within the assembly, while the slow componentis attributed to TTA between excited states that must undergo energy migration prior to annihilation.Femtosecond experiments are also performed on Ru(bpy)3
2+ (bpy ) 2,2′-bipyridine) and a mixed-ligandRu(II) complex that serves as a reference system for the polymer.
I. Introduction
During the past decade, there has been an intense interest inthe development of molecular-based materials that are capableof performing complex functions.1-12 The ability to control thespatial arrangement of the molecular components is critical tothe success of this endeavor, especially if intermolecular energy-and charge-transfer processes are at the core of the material’sfunction. Derivatized polymers provide an attractive approachfor arranging molecular components because they offer simplic-ity and flexibility in the design of molecular assemblies. TheMeyer group has exploited this in their work on derivatizedpolystyrene,13-20 and the controlled positioning of chromophoresand other components along a polymer backbone has been dem-onstrated by other groups as well.21-33 We are using ultrafastspectroscopic techniques to characterize the functional propertiesof the molecular assemblies synthesized in the Meyer group.These systems are composed of a polystyrene (PS) backbonederivatized with polypyridyl Ru(II)- or Os(II)-based chromo-phores or both. The chemical structure of a typical system, andthe one that is studied in this work, is displayed in Figure 1.
The polymer chains consist of, on average, 20 repeat units,each one functionalized with a polypyridyl transition metalcomplex. The three-dimensional structure is greatly influencedby the large (14 Å diameter) metal dication monomer units.This is clearly evident in the structures calculated by molecularmodeling,34 one of which is depicted in Figure 2. The largerspheres are the transition-metal chromophores and the smallerspheres are the PF6
- counter ions that surround the polymer ofwhich the overall charge is+40. The densely loaded polymeradopts a twisted backbone and extended rodlike structure toalleviate the steric and Coulombic repulsions between adjacentcomplexes. One consequence of the dense loading is that theaverage distance between the peripheries of adjacent chro-mophores is 2-3 Å. It is this small spacing that makes efficient
energy transport possible. The main role of the polymerbackbone is thus to provide a structural support for holding thecomplexes in close proximity.
Photoexcitation of one of the Ru monomer units in the vicinityof 450 nm promotes the complex to a singlet metal-to-ligandcharge-transfer (1MLCT) excited state, which efficiently decaysinto a triplet state within a matter of a few hundred femtosec-onds. The3MLCT state has a lifetime of about 1µs, providingadequate time for excited-state energy transfer to other membersof the assembly.
In a recent paper, we presented a detailed study of the excited-state energy migration dynamics.34 Although that work wasperformed on a slightly different polymer system than the one
* To whom correspondence should be addressed. E-mail:[email protected].
Figure 1. Chemical structures of the polymer assembly and twotransition-metal complexes discussed in the text. Each polymer chaincontains, on average, 20 repeat units. The open circles in the structurerepresent other transition-metal complexes that are not shown for clarity.The notation MAB in Ru-MAB refers to the presence of the mono-amide functionalized ligand, while BPY denotes that all three ligandsare 2,2′-bipyridine.
6156 J. Phys. Chem. B2002,106,6156-6162
10.1021/jp0145006 CCC: $22.00 © 2002 American Chemical SocietyPublished on Web 05/29/2002

described here, it revealed the presence of efficient energymigration along the polymer backbone, suggesting that theseassemblies could perform light-harvesting functions in futuremolecular-scale solar energy conversion devices. Those energymigration studies were performed at low excitation irradiancesto ensure that each chain had at most a single excited state.
At higher irradiance, multiple excited states can be formedon a single chain. These excited states can interact with eachother, leading to additional deactivation pathways that couldultimately limit the polymer’s light-harvesting capabilities. Inthis paper, we explore this triplet-triplet annihilation (TTA)process using femtosecond transient absorption spectroscopy.Our experiments provide the first definitive measure of a timescale for this process. They suggest that when two excited statesare created next to each other, TTA occurs within just a fewpicoseconds. This deactivation process is not unique to ourpolymer but has been observed in a number of systems in whichRu(II) complexes are found in close proximity to each other.35-39
II. Experimental Section
A complete description of the experimental apparatus hasbeen provided elsewhere, so only a brief description will givenhere.40 The transient absorption spectrometer is based on acommercially available ultrafast laser system (Clark CPA-2001),consisting of an erbium-doped fiber ring oscillator and a chirpedpulse Ti:sapphire regenerative amplifier that is pumped by afrequency-doubled, mode-locked, Q-switched Nd:YAG laser.The amplifier produces 120 fs laser pulses at 775 nm at 1 kHzwith pulse energies of approximately 950µJ/pulse. The ampli-fied output is split into two beams by an uncoated glass window.
The larger, transmitted fraction (96%) pumps an opticalparametric amplifier (OPA), which generates tunable femto-second laser pulses used to excite the sample. For the experi-ments described here, the fourth harmonic of the OPA outputis tuned to 442 nm. This is the pump beam used to excite thepolymer sample. It is focused to a spot size of∼500µm at thesample. After passing through the sample, the pump beam isthen directed into a photodiode for normalization of the transientabsorption signal to changes in laser power.
The weak (4%) reflection from the front surface of theuncoated optic is used to generate the probe beam. This beamis directed into a computer-controlled translation stage that isused to vary the optical delay between pump and probe pulses.The resolution of the translation stage is 1µm. After passing
through the delay stage, it is focused with a 150 mm focal-length lens into a 6 mm thick CaF2 window to generate a whitelight continuum, which is then collimated with an 80 mm focallength achromatic lens. The white light is split into two weakerbeams of nearly equal intensity by taking the reflections offthe front and rear surfaces of a 2.5 cm thick quartz window.The front surface reflection, denoted the signal beam, is usedfor the probe pulse. The rear surface reflection is used as thereference beam in the transient absorption measurement. Thesignal and reference beams are focused to a spot size of∼150µm at the sample. While both beams are directed through thesample, only the signal is spatially overlapped with the pumpbeam. The signal and reference beams are simultaneouslydirected into a 0.27 m monochromator, dispersed with a 1200line/mm holographic grating, and detected with a two-dimensional 1028× 256 pixel liquid-nitrogen-cooled CCDarray. This apparatus is capable of measuring a 77 nm segmentof the transient absorption spectrum centered anywhere between350 and 1000 nm with a sensitivity of better than 1 mOD.
The excited-state dynamics are followed through the evolutionof the transient absorption spectra obtained at a series of pump-probe delay times. A typical data collection session consists ofmeasuring transient absorption spectra at a series of 96 differentpump-probe delay positions. First, the transient absorptionspectrum at a given delay is measured. Ten exposures of theCCD camera are performed, and the spectra from each areaveraged together before moving on to the next pump-probedelay position. The entire set of pump-probe delay positionsis repeated at least three times, and the spectra obtained at likedelays are averaged together. In some cases, the final spectrumrepresents a compilation of several different data collectionsessions. Thus, each transient absorption spectrum representsan average over at least 24 000 (and in some instances as manyas 150 000) laser pulses.
The PS-Ru20 polymer and Ru-MAB monomer were obtainedas PF6- salts as gifts from Thomas J. Meyer and used withoutfurther purification. The synthesis of these materials has beendescribed elsewhere.14,41 Spectroscopy-grade acetonitrile wasused as obtained from the vendor (Burdick and Jackson). Allexperiments were performed on room-temperature solutions ofwhich the concentrations were adjusted to give an optical densityof ∼0.25 at 450 nm in a 2 mmpath length cell.
III. Results and Discussion
The experiments discussed in this paper focus on thePS-Ru20 homopolymer and the Ru-MAB complex, whichserves as a reference system for the polymer. The ground-stateabsorption spectra of PS-Ru20 and its corresponding monomercomplex are displayed in Figure 3. The two spectra areremarkably similar, each showing a strong absorption centeredat 450 nm. The similarities between the polymer and monomerspectra indicate that the polymer chains are well described as acollection of independent chromophores. This view is furthersupported by steady-state and time-resolved emission measure-ments, which yield nearly identical spectroscopic signatures forboth the monomer and polymer, at least at low excitationintensities.34 Together these observations justify the comparisonbetween the monomer and the homopolymer.
To gain insight into Ru-MAB dynamics, we have alsoexamined Ru(bpy)3
2+ (denoted Ru-BPY). While the Ru-MABand Ru-BPY complexes are quite similar, the ligand asymmetrypresent in the Ru-MAB complex introduces some differences.The amide substituent used to link the complexes to the polymer
Figure 2. Structure of a polymer assembly containing 20 transition-metal complexes calculated by Monte Carlo simulations. Large spheresrepresent the metal complexes, and the small spheres are the PF6
-
counter ions.
Triplet-Triplet Annihilation of Excited States J. Phys. Chem. B, Vol. 106, No. 24, 20026157

increases theπ network of the mab ligand orbitals, loweringtheir energy relative to the unfunctionalized bipyridine (bpy)ligand by about 700 cm-1. Transient infrared experimentsconfirm this state ordering, showing that the photoexcitedelectron in Ru-MAB ultimately resides on the mab ligand.42
Despite the difference in energy, selective photoexcitation of aparticular ligand is not possible, and thus the transfer of theMLCT excitation to the lowest energy ligand is an importantrelaxation pathway.
The excited-state spectra exhibited by the polymer will showkinetic evolution arising from processes that are intrinsic to themonomer as well as the polymer. In section A, we present theresults of experiments performed on the monomer. Theseexperiments enable us to identify the spectroscopic signaturesof the monomer and at the same time provide insight into theexcited-state dynamics of mixed-ligand polypyridyl complexes.Transient absorption experiments performed on the polymer arediscussed in section B. These experiments complement ourpreviously published energy migration studies.34
A. Monomer Dynamics. The transient absorption spectraobserved at 0.4 and 400 ps following photoexcitation of theRu-MAB complex are displayed in Figure 4. These transientspectra are typical of those exhibited by ruthenium polypyridylcomplexes, showing a strong ground-state bleach to the blueof ∼490 nm and a weak excited-state absorption to the red. Acomparison of the early and late spectra shows that there is anoverall increase of the transient absorbance during the first 400ps. The kinetics of the growth is depicted in Figure 5, whichshows the transient absorption signal at 475 nm as a functionof pump-probe delay. The spectral changes occur with anaVerage time constant of 3.9 ps. Closer inspection revealsbiphasic kinetics with fast and slow time constants of 2 and 12ps, respectively.
Generally speaking, transient absorption spectra are a super-position of signals that arise from the ground-state bleach,excited-state absorption, and stimulated emission. The ground-state bleach and stimulated emission contributions are bothnegative, while the contribution from excited-state absorptionis positive. The observed increase in the transient absorptionsignal could be due to changes in any of these contributions.
Excited-state decay is one possibility. Relaxation back to theground state would decrease the magnitude of both the absorp-tion and bleach contributions, causing the transient absorptionsignal to decrease in magnitude. However, this process isdismissed because the lifetime of the lowest-energy MLCT stateis on the order of 1µs, and thus, there is essentially no ground-state recovery on the picosecond time scale. Another possibilityis that the observed spectral changes reflect changes in
stimulated emission intensity. If this were the source of thespectral reshaping, then the growth amplitude should increasewith increasing probe wavelength, because the luminescencepeaks further to the red at 620 nm. This is not observed. Thedifference between the 0.4 and 400 ps transient spectra (Figure6) shows that the maximum change in the transient absorptionsignal occurs in neighborhood of 480 nm. All in all, ourobservations suggest that the spectral reshaping in the monomeris due solely to a shift in the excited-state absorption ratherthan a change in the bleach or stimulated emission contributions.
In addition to single-photon dynamics, the evolution of theexcited-state spectrum could result from processes initiated bythe absorption of multiple photons. A power dependence studyof the transient absorption spectra obtained from the Ru-MABcomplex allows us to rule out effects due to multiphoton
Figure 3. Comparison of the ground-state absorption spectra forPS-Ru20 and its monomer complex, Ru-MAB. The arrow indicatesthe wavelength used to excite the samples.
Figure 4. Transient absorption spectra for Ru-MAB (top panel) andRu-BPY (bottom panel) observed following photoexcitation at 440 nm.Open (O) and filled (b) circles correspond to spectra obtained at 0.4and 400 ps after photoexcitation, respectively.
Figure 5. Transient absorption kinetics observed at a probe wavelengthof 475 nm for both Ru-BPY and Ru-MAB. Three transients are shownfor the Ru-MAB complex, which were obtained at different pump pulseenergies: (0) 0.25; (O) 0.6; (4) 1.20µJ/pulse. For display purposes,all transients were scaled to have a value of-1 at zero pump-probedelay.
6158 J. Phys. Chem. B, Vol. 106, No. 24, 2002 Shaw and Papanikolas

absorption. Shown in Figure 5 are the 475 nm transients obtainedfrom Ru-MAB at a range of pump-pulse powers. Each transientis normalized to have a value of-1 at zero pump-probe delay.By normalizing the transients, we are in effect presenting thetransient absorptionper excited state. In this “normalized”format, the growth/decay kinetics that arise from single-photonprocesses will always appear the same (i.e., have the sameshape), regardless of the excitation intensity. This is the casefor the Ru-MAB data presented in Figure 5, indicating that theobserved spectral changes stem from single-photon processes.Although we do not observe multiphoton effects, recentspectroscopic experiments on Ru-BPY performed under intenselaser irradiation have shown that such processes are possible.43
However, in those experiments, the laser intensities were morethan 2 orders of magnitude larger than those used here.
Linking observed spectral changes to specific relaxationprocesses requires the assignment of the excited-state absorptionfeature(s). Spectroelectrochemical measurements performed byMcCusker and co-workers44 on similar Ru polypyridyl com-plexes suggest that the excited-state absorption is actually asuperposition of two absorption features. One contributioncomes from aππ* transition localized on the reduced polypy-ridyl ligand that is present in the MLCT excited state. Thistransition, which peaks at∼500 nm and has a long tail thatextends to the red, should be sensitive to the substituents thatare present on the polypyridyl ligand and could thus be a goodspectral indicator of the location of the photoexcited electron.The second contribution to the excited-state absorption issuggested to come from a ligand-to-metal charge-transfer(LMCT) transition that is centered to the red of theππ*absorption. This excitation involves the promotion of an electronfrom one of theneutral polypyridyl ligands to the formallyoxidized metal center. Thus, the blue edge of the excited-stateabsorption feature is most likelyππ* in nature, whereas thered edge could contain contributions from bothππ* and LMCTtransitions. Our analysis of the transient spectra focuses primarilyon probe wavelengths to the blue of the zero crossing, wherethe contribution from the LMCT transition is minimized.
As a benchmark for comparison, we have performed a similarset of experiments on the symmetric Ru-BPY complex underidentical experimental conditions. The transient absorptionspectra for Ru-BPY also show a strong bleach to the blue of500 nm and a weak excited-state absorption to the red (Figure4). In this respect, they are qualitatively similar to those observedfor the asymmetric complex. The spectral reshaping that takesplace in the Ru-BPY spectra is qualitatively different, however.
For probe wavelengths to the blue of 470 nm, the transientabsorbance does not change after about 200 fs, consistent withultrafast measurements performed in other laboratories. To thered of 470 nm, there is an overalldecreasein the transientabsorption. The kinetics at 475 nm are displayed in Figure 5along with the mixed-ligand data. The decrease is well-describedby a single exponential with a 10-12 ps time constant. This issimilar to the slow time component observed in the asymmetriccomplex, suggesting that this dynamical process occurs in bothsystems. The slow time component could correspond tovibrational cooling or relaxation through the manifold of low-lying triplet states or both. It is interesting to note that if thesame dynamical process is responsible for the slow spectralchanges in both complexes, then it acts to increase the intensityof the excited-state absorption in the asymmetric complex anddecrease it in Ru-BPY.
Unlike the mixed-ligand complex, Ru-BPY shows no evi-dence of a fast time component. This suggests that the dynamicalprocess that gives rise to the 2 ps reshaping in Ru-MAB involvesthe mab ligand. One possibility is that it corresponds to thetransfer of the MLCT excitation from one of the bpy ligands tothe lower energy mab ligand in what amounts to interligandelectron transfer (ILET). Measurements performed in ourlaboratory on the Os-MAB complex yield an ILET time of 1.5ps, which is similar to the time constant observed here.40
However, that assignment was made on the basis of polarizationanisotropy data not spectral changes. Because evolution in thetransient absorption spectra could result from a number ofpotential processes, including solvent reorganization and vibra-tional relaxation, a definitive conclusion cannot be reached onthe basis of the available experimental data.
B. Polymer Dynamics.Transient absorption data has alsobeen collected for the PS-Ru20 polymer dissolved in acetonitrileunder similar experimental conditions. The transient spectraobserved for the polymer (not shown) have a qualitativelysimilar shape to those observed for the monomer complex.Furthermore, like the monomer, there is an overall increase inthe magnitudeof the transient absorption signal at later times;however, the kinetics of this growth are different. Shown inFigure 7 is the transient absorption signal at 475 nm as a functionof pump-probe delay for both the polymer and monomersystems. The figure shows three polymer transients that cor-respond to low (0.2µJ/pulse), medium (0.6µJ/pulse), and high(1.2 µJ/pulse) power excitation conditions (denoted LP, MP,
Figure 6. Growth in the transient absorption signal displayed as afunction of probe wavelength. The individual points are obtained bytaking the difference between the 0.4 and 400 ps spectra shown inFigure 4. Open (O) and filled (b) circles represent changes in theRu-MAB and Ru-BPY spectra, respectively.
Figure 7. Transient absorption signal observed at 475 nm as a functionof pump-probe delay. Open circles (O) represent data collected fromPS-Ru20 dissolved in CH3CN. Three transients corresponding to high,medium, and low excitation irradiance conditions (HP, MP, and LP,respectively) are displayed for the polymer. The filled circles (b) arethe data for the monomer complex, Ru-MAB. All four transients werescaled such that they had a value of unity at zero delay.
Triplet-Triplet Annihilation of Excited States J. Phys. Chem. B, Vol. 106, No. 24, 20026159

and HP, respectively). Each transient has been normalized to avalue of-1 at zero delay. The most notable difference is thatthe growth in the transient absorption signal for the polymerdepends on the intensity of the excitation laser, suggesting thata portion of the transient originates from a multiphoton process.Because multiphoton processes are not observed in the monomercomplexes themselves, we attribute the power-dependent kinet-ics observed in the polymer to a triplet-triplet annihilation(TTA) process involving multiple excited states formed on asingle chain.
As with the monomer spectra, the spectral changes stemmingfrom the TTA process could arise from the ground-state bleach,excited-state absorption, or a combination of the two. Ananalysis of the transient spectra (discussed in more detail below)suggests that these changes result from the replenishment ofthe ground-state population. That is, TTA results in thesimultaneous decay of both the absorption and the bleach.
To quantify the transient absorption changes, we have fit eachof the polymer decays to a sum of two exponentials,
where τf and τs are the time constants of the fast and slowcomponents, respectively, andcf andcs are their correspondingamplitudes. The results are provided in Table 1. The use of abiexponential model is not meant to imply that the polymershould be viewed as a two-state system, which it most certainlyis not, but rather to provide a quantitative description of thetemporal kinetics.
At low excitation intensities, the polymer’s fast component(4.3 ps) has a time constant that is very close to average timeconstant observed in the monomer (3.9 ps). The amplitude ofthis component is similar to that observed in the monomer,representing 14-16% of the total signal in both cases. Thesimilarity between the LP polymer and the monomer data atearly times suggests that these spectral changes arise almostentirely from the individual monomer complexes. In additionto the fast evolution, the polymer also exhibits a slow (105 ps)annihilation component.
At the higher excitation intensities (MP and HP), thedifferences between the polymer and monomer transientsbecome more pronounced. The first difference is that there isan overall increase in the total amplitude of the annihilationcomponent at the higher laser powers. Whereas at low powersthis amplitude is approximately 8%, at the higher excitationintensities it is closer to 20% (Table 1). The second differenceis that the annihilation kinetics at the higher excitation irradi-ances cannot be described by a single rate constant. The high-power (HP) transient shows clear evidence of this, and thenonlinear least-squares analysis extracts both a fast (3-4 ps)
and a slow (40-50 ps) component. The time constant of thefast component appears to be independent of the excitationintensity (Table 1). This is not true of the slow component,however, which varies from 105 ps at the lowest power studiedto about 44 ps at the highest. The amplitudes of both componentsincrease with increasing excitation intensity.
We assign the fast (3-5 ps) time component to the time scalefor TTA when the two excited states are formed at sites adjacentto each other. The amplitude of this component in thenormal-ized transient corresponds roughly to the number of adjacentexcited-state pairs that are formed in the photoexcitation processdivided by the total number of excited states, that is,NPAIRS/NES. BecauseNPAIRS scales with the square of the laser powerandNES scales linearly, the fast amplitude is only expected toexhibit linear power dependence. The fast annihilation ampli-tudes presented in Table 1 are consistent with this expectation.Namely, this amplitude in the HP (1.2µJ/pulse) transient isabout double that observed in the MP (0.6µJ/pulse) case. Ourassignment of the fast component to the TTA of adjacent pairsindicates that the Ru*-Ru* annihilation time is in the vicinityof 3-5 ps. Ultrafast TTA of Ru(II) excited states has beenobserved in other systems as well; however, in those studies,the instrumental time resolution prevented the measurement ofa definitive TTA time scale.36,39
The slow component is assigned to excited-state pairs thatmust undergo energy migration prior to deactivation. Althoughwe have not examined the energy migration in this polymersystem, we have investigated the Ru*f Ru energy transfer ina slightly different polymer.34 Those experiments suggesttransfer times in the range of 1-4 ns. The time scale for theformation of an excited-state pair and the energy-transfer time,while related to each other, are not numerically equivalent. Forexample, in the simple case of a linear trimer with two excitedstates (i.e., Ru*-Ru-Ru*), pair formation can be achieved viaenergy transfer of either complex to give Ru-Ru*-Ru* orRu*-Ru*-Ru. In this situation, the pair would be formed ona time scale that is half of the energy-transfer time. In reality,the number of pathways will depend on the number of nearestneighbors, as well as the number of excited states created perchain. For a given distribution of excited states, the pair-formation time is reduced from the energy-transfer time by thenumber of possible ways that pair can be formed. Monte Carlosimulations suggest that each complex has approximately 4-5nearest neighbors. As a result, the reduction from the energy-transfer time could be substantial and account for our observa-tions. In principle, an analysis of the slow component couldyield information about the energy migration/TTA process.However, the slow component reflects a combination of bothexcited-state energy migration and TTA, and definitive informa-tion regarding energy transfer in this polymer is not currentlyavailable. Furthermore, we only observe the first 200 ps of thisprocess, which probably represents the very beginning of amultiexponential decay that may continue for nanoseconds. Forthese reasons, we have opted not to pursue such an analysis atthis time.
Annihilation Mechanism.There are two triplet-triplet deac-tivation mechanisms that could lead to the observed power-dependent signals. Annihilation via energy transfer is onepossibility,
where the singlet state formed in the first step decays rapidly
TABLE 1: Summary of Parameters Obtained fromNonlinear Least Squares Analysis of the Polymer TransientsShown in Figure 7a
fit parameters annihilation contribution
time constants (ps) amplitudes fast total
τf τs cf cs cf - cfLP [cf - cf
LP] + cs
LP 4.3 105 0.14 0.08 0.00 0.08MP 5.3 64 0.16 0.13 0.02 0.15HP 3.5 44 0.19 0.15 0.05 0.20
a The amplitudes for the annihilation contribution were obtained byassuming that the entire fast component observed in the low-power(LP) case is due to dynamics that take place within the monomercomplex.
A(t) ) cf exp(-tτf
) + cs exp(-tτs
) (1)
3(Ru2+)* + 3(Ru2+)* f 1(Ru2+)* + (Ru2+) f3(Ru2+)* + (Ru2+)
6160 J. Phys. Chem. B, Vol. 106, No. 24, 2002 Shaw and Papanikolas
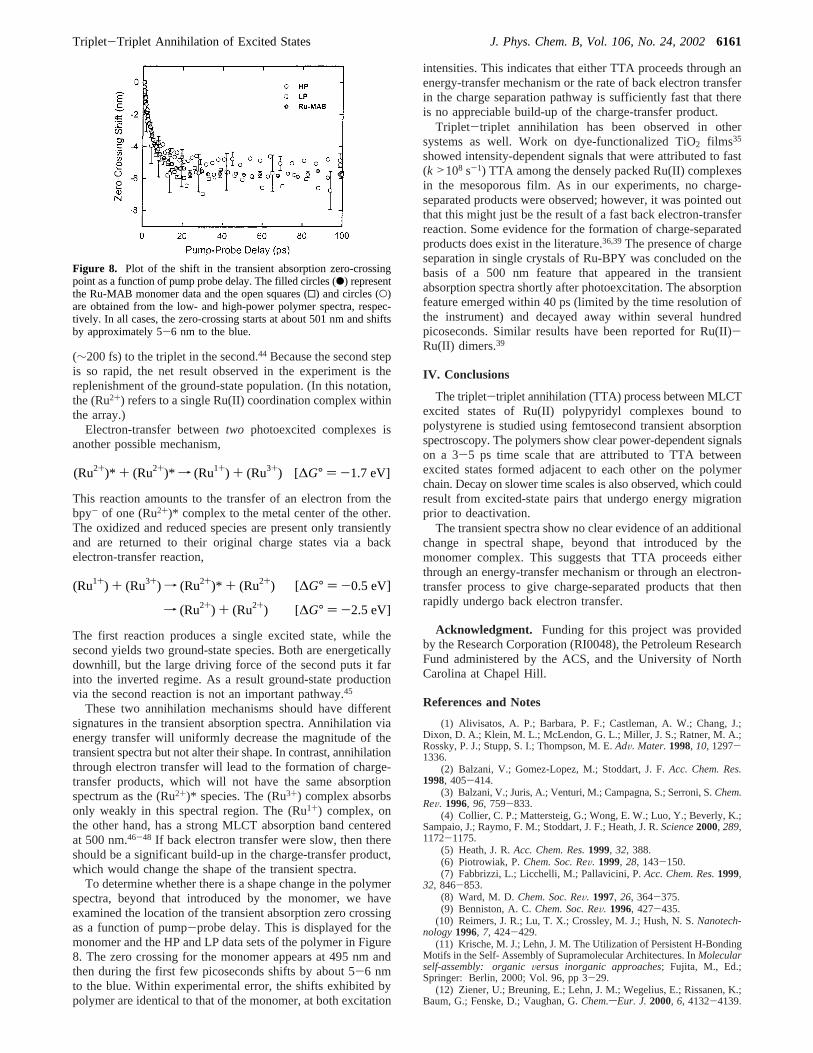
(∼200 fs) to the triplet in the second.44 Because the second stepis so rapid, the net result observed in the experiment is thereplenishment of the ground-state population. (In this notation,the (Ru2+) refers to a single Ru(II) coordination complex withinthe array.)
Electron-transfer betweentwo photoexcited complexes isanother possible mechanism,
This reaction amounts to the transfer of an electron from thebpy- of one (Ru2+)* complex to the metal center of the other.The oxidized and reduced species are present only transientlyand are returned to their original charge states via a backelectron-transfer reaction,
The first reaction produces a single excited state, while thesecond yields two ground-state species. Both are energeticallydownhill, but the large driving force of the second puts it farinto the inverted regime. As a result ground-state productionvia the second reaction is not an important pathway.45
These two annihilation mechanisms should have differentsignatures in the transient absorption spectra. Annihilation viaenergy transfer will uniformly decrease the magnitude of thetransient spectra but not alter their shape. In contrast, annihilationthrough electron transfer will lead to the formation of charge-transfer products, which will not have the same absorptionspectrum as the (Ru2+)* species. The (Ru3+) complex absorbsonly weakly in this spectral region. The (Ru1+) complex, onthe other hand, has a strong MLCT absorption band centeredat 500 nm.46-48 If back electron transfer were slow, then thereshould be a significant build-up in the charge-transfer product,which would change the shape of the transient spectra.
To determine whether there is a shape change in the polymerspectra, beyond that introduced by the monomer, we haveexamined the location of the transient absorption zero crossingas a function of pump-probe delay. This is displayed for themonomer and the HP and LP data sets of the polymer in Figure8. The zero crossing for the monomer appears at 495 nm andthen during the first few picoseconds shifts by about 5-6 nmto the blue. Within experimental error, the shifts exhibited bypolymer are identical to that of the monomer, at both excitation
intensities. This indicates that either TTA proceeds through anenergy-transfer mechanism or the rate of back electron transferin the charge separation pathway is sufficiently fast that thereis no appreciable build-up of the charge-transfer product.
Triplet-triplet annihilation has been observed in othersystems as well. Work on dye-functionalized TiO2 films35
showed intensity-dependent signals that were attributed to fast(k >108 s-1) TTA among the densely packed Ru(II) complexesin the mesoporous film. As in our experiments, no charge-separated products were observed; however, it was pointed outthat this might just be the result of a fast back electron-transferreaction. Some evidence for the formation of charge-separatedproducts does exist in the literature.36,39The presence of chargeseparation in single crystals of Ru-BPY was concluded on thebasis of a 500 nm feature that appeared in the transientabsorption spectra shortly after photoexcitation. The absorptionfeature emerged within 40 ps (limited by the time resolution ofthe instrument) and decayed away within several hundredpicoseconds. Similar results have been reported for Ru(II)-Ru(II) dimers.39
IV. Conclusions
The triplet-triplet annihilation (TTA) process between MLCTexcited states of Ru(II) polypyridyl complexes bound topolystyrene is studied using femtosecond transient absorptionspectroscopy. The polymers show clear power-dependent signalson a 3-5 ps time scale that are attributed to TTA betweenexcited states formed adjacent to each other on the polymerchain. Decay on slower time scales is also observed, which couldresult from excited-state pairs that undergo energy migrationprior to deactivation.
The transient spectra show no clear evidence of an additionalchange in spectral shape, beyond that introduced by themonomer complex. This suggests that TTA proceeds eitherthrough an energy-transfer mechanism or through an electron-transfer process to give charge-separated products that thenrapidly undergo back electron transfer.
Acknowledgment. Funding for this project was providedby the Research Corporation (RI0048), the Petroleum ResearchFund administered by the ACS, and the University of NorthCarolina at Chapel Hill.
References and Notes
(1) Alivisatos, A. P.; Barbara, P. F.; Castleman, A. W.; Chang, J.;Dixon, D. A.; Klein, M. L.; McLendon, G. L.; Miller, J. S.; Ratner, M. A.;Rossky, P. J.; Stupp, S. I.; Thompson, M. E.AdV. Mater.1998,10, 1297-1336.
(2) Balzani, V.; Gomez-Lopez, M.; Stoddart, J. F.Acc. Chem. Res.1998, 405-414.
(3) Balzani, V.; Juris, A.; Venturi, M.; Campagna, S.; Serroni, S.Chem.ReV.1996,96, 759-833.
(4) Collier, C. P.; Mattersteig, G.; Wong, E. W.; Luo, Y.; Beverly, K.;Sampaio, J.; Raymo, F. M.; Stoddart, J. F.; Heath, J. R.Science2000,289,1172-1175.
(5) Heath, J. R.Acc. Chem. Res.1999,32, 388.(6) Piotrowiak, P.Chem. Soc. ReV.1999,28, 143-150.(7) Fabbrizzi, L.; Licchelli, M.; Pallavicini, P.Acc. Chem. Res.1999,
32, 846-853.(8) Ward, M. D.Chem. Soc. ReV.1997,26, 364-375.(9) Benniston, A. C.Chem. Soc. ReV.1996, 427-435.
(10) Reimers, J. R.; Lu, T. X.; Crossley, M. J.; Hush, N. S.Nanotech-nology1996,7, 424-429.
(11) Krische, M. J.; Lehn, J. M. The Utilization of Persistent H-BondingMotifs in the Self- Assembly of Supramolecular Architectures. InMolecularself-assembly: organicVersus inorganic approaches; Fujita, M., Ed.;Springer: Berlin, 2000; Vol. 96, pp 3-29.
(12) Ziener, U.; Breuning, E.; Lehn, J. M.; Wegelius, E.; Rissanen, K.;Baum, G.; Fenske, D.; Vaughan, G.Chem.sEur. J.2000,6, 4132-4139.
Figure 8. Plot of the shift in the transient absorption zero-crossingpoint as a function of pump probe delay. The filled circles (b) representthe Ru-MAB monomer data and the open squares (0) and circles (O)are obtained from the low- and high-power polymer spectra, respec-tively. In all cases, the zero-crossing starts at about 501 nm and shiftsby approximately 5-6 nm to the blue.
(Ru2+)* + (Ru2+)* f (Ru1+) + (Ru3+) [∆G° ) -1.7 eV]
(Ru1+) + (Ru3+) f (Ru2+)* + (Ru2+) [∆G° ) -0.5 eV]
f (Ru2+) + (Ru2+) [∆G° ) -2.5 eV]
Triplet-Triplet Annihilation of Excited States J. Phys. Chem. B, Vol. 106, No. 24, 20026161

(13) Worl, L. A.; Jones, W. E.; Strouse, G. F.; Younathan, J. N.;Danielson, E.; Maxwell, K. A.; Sykora, M.; Meyer, T. J.Inorg. Chem.1999,38, 2705-2708.
(14) Friesen, D. A.; Kajita, T.; Danielson, E.; Meyer, T. J.Inorg. Chem.1998,37, 2756-2762.
(15) Maxwell, K. A.; Dupray, L. M.; Meyer, T. J.Polym. Prepr. (Am.Chem. Soc., DiV. Polym. Chem.)1997,38, 329-330.
(16) Dupray, L. M.; Meyer, T. J.Inorg. Chem.1996,35, 6299-6307.(17) Jones, W. E.; Baxter, S. M.; Strouse, G. F.; Meyer, T. J.J. Am.
Chem. Soc.1993,115, 7363-7373.(18) Dupray, L. M.; Devenney, M.; Striplin, D. R.; Meyer, T. J.J. Am.
Chem. Soc.1997,119, 10243-10244.(19) Peters, M. A.; Belu, A. M.; Linton, R. W.; Dupray, L. M.; Meyer,
T. J.; DeSimone, J. M.J. Am. Chem. Soc.1995,117, 3380-3388.(20) Sykora, M.; Maxwell, K. A.; DeSimone, J. M.; Meyer, T. J.Proc.
Natl. Acad. Sci. U.S.A.2000,97, 7687-7691.(21) Wong, K. T.; Lehn, J. M.; Peng, S. M.; Lee, G. H.Chem. Commun.
2000, 2259-2260.(22) Galoppini, E.; Fox, M. A.J. Am. Chem. Soc.1996,118, 2299-
2300.(23) Clements, J. H.; Webber, S. E.J. Phys. Chem. B1999,103, 9366.(24) Clements, J. H.; Webber, S. E.J. Phys. Chem. A1999, 103, 2513-
2523.(25) Schillen, K.; Yekta, A.; Ni, S.; Farinha, J. P. S.; Winnik, M. A.J.
Phys. Chem. B1999,103, 9090-9103.(26) Rharbi, Y.; Yekta, A.; Winnik, M. A.; DeVoe, R. J.; Barrera, D.
Macromolecules1999,32, 3241-3248.(27) Walters, K. A.; Trouillet, L.; Guillerez, S.; Schanze, K. S.Inorg.
Chem.2000,39, 5496-5509.(28) Walters, K. A.; Ley, K. D.; Schanze, K. S.Langmuir 1999,15,
5676-5680.(29) Mcquade, D. T.; Pullen, A. E.; Swager, T. M.Chem. ReV.2000,
100, 2537-2574.(30) Swager, T. M.Acc. Chem. Res.1998,31, 201-207.
(31) Chen, L. X.; Jager, W. J. H.; Gosztola, D. J.; Niemczyk, M. P.;Wasielewski, M. R.J. Phys. Chem. B2000,104, 1950-1960.
(32) Chen, L. X.; Jager, W. J. H.; Niemczyk, M. P.; Wasielewski, M.R. J. Phys. Chem. A1999,103, 4341-4351.
(33) Wolcan, E.; Ferraudi, G.J. Phys. Chem. A2000, 104, 9281-9286.(34) Fleming, C. N.; Maxwell, K. A.; Meyer, T. J.; Papanikolas, J. M.
J. Am. Chem. Soc.2001, 10336-10347.(35) Kelly, C. A.; Farzad, F.; Thompson, D. W.; Meyer, G. J.Langmuir
1999,15, 731-737.(36) Ikeda, N.; Yoshimura, A.; Tsushima, M.; Ohno, T.J. Phys. Chem.
A 2000,104, 6158-6164.(37) Sykora, M.; Kincaid, J. R.; Dutta, P. K.; Castagnola, N. B.J. Phys.
Chem. B1999,103, 309-320.(38) Milosavijevic, B. H.; Thomas, J. K.J. Phys. Chem.1983,87, 616-
621.(39) Nozaki, K.; Ikeda, N.; Ohno, T.New J. Chem.1996, 20, 739-
748.(40) Shaw, G. B.; Brown, C. L.; Papanikolas, J. M.J. Phys. Chem. A
2002,106, 1483-1495.(41) Maxwell, K. A. Doctoral Dissertation, University of North Carolina
at Chapel Hill, 1999.(42) Smith, G. D.; Maxwell, K. A.; Desimone, J. M.; Meyer, T. J.;
Palmer, R. A.Inorg. Chem.2000,39, 893-898.(43) Thompson, D. W.; Wishart, J. F.; Brunschwig, B. S.; Sutin, N.J.
Phys. Chem. A2001,105, 8117-8122.(44) Damrauer, N. H.; Cerullo, G.; Yeh, A.; Boussie, T. R.; Shank, C.
V.; McCusker, J. K.Science1997,275, 54-57.(45) Wallace, W. L.; Bard, A. J.J. Phys. Chem.1979,83, 1350-1357.(46) Coombe, V. T.; Heath, G. A.; MacKenzie, A. J.; Yellowlees, L. J.
Inorg. Chem.1984,23, 3423-3425.(47) Heath, G. A.; Yellowlees, L. J.; Braterman, P. S.Chem. Commun.
1981, 287-289.(48) Anderson, C. P.; Salmon, D. J.; Meyer, T. J.; Young, R. C.J. Am.
Chem. Soc.1977,99, 1980-1982.
6162 J. Phys. Chem. B, Vol. 106, No. 24, 2002 Shaw and Papanikolas

Ultrafast Excited-State Energy Migration Dynamics in an EfficientLight-Harvesting Antenna Polymer Based on Ru(II) and Os(II)Polypyridyl Complexes
Cavan N. Fleming, Kimberly A. Maxwell, Joseph M. DeSimone, Thomas J. Meyer,† andJohn M. Papanikolas*
Contribution from the Department of Chemistry, Venable and Kenan Laboratories,The UniVersity of North Carolina at Chapel Hill, Chapel Hill, North Carolina 27599-3290
ReceiVed May 29, 2001
Abstract: A detailed study of the excited state energy migration dynamics that take place within an assemblyof Ru(II) and Os(II) polypyridyl complexes linked together through a polymer backbone is presented. Theenergy migration process is initiated by the photoexcitation of the metal-to-ligand charge transfer (MLCT)transition in one of the Ru(II) complexes and terminated by energy transfer to a lower energy Os(II) trap.Energy transfer sensitization of Os(II) can occur in a single step if the excited state is formed adjacent to atrap, or after a series of hops between isoenergetic rutheniums prior to reaching a trap. The dynamics of theenergy transfer process are followed by monitoring the growth of Os(II)* luminescence at 780 nm. The kineticsof the growth are complex and can be fit by a sum of two exponentials. This kinetic complexity arises bothfrom the presence of a distribution of donor-acceptor distances and the variety of time scales by whichOs(II)* can be formed. We have augmented the time-resolved experiments with Monte Carlo simulations,which provide insight into the polymer array’s structure and at the same time form the basis of a molecular-level description of the energy migration dynamics. The simulations indicate that the most probable Ru*fOsenergy transfer time is∼400 ps while the time scale for Ru*fRu hopping is approximately 1-4 ns. The timescale for Ru*fRu hopping relative to its natural lifetime (1000 ns) suggests that this polymer system couldbe extended to considerably longer dimensions without an appreciable loss in its overall efficiency.
I. Introduction
One strategy for designing functional nanoscale materials isto organize molecular constituents into assemblies that performcomplex functions.1-12 A critical factor in the development ofsuch materials is the ability to control the spatial arrangementof the molecular components, especially if intermolecularenergy- and charge-transfer processes are at the core of thematerial’s function. Spatial organization can be achieved throughthe design of covalently bonded supramolecules in which
molecular subunits are linked together so that their relativegeometries (i.e. separations and orientations) are well defined.13-19
Structures of this kind are demanding to synthesize, but offerthe greatest amount of control over structural parameters. Analternative method utilizes disordered supports to organize thenecessary components.20-38 Derivatized polymers are attractivefor the positioning of molecular constituents because they offer
† Present address: Los Alamos National Laboratory MS A127, LosAlamos, NM 87545.
(1) Alivisatos, A. P.; Barbara, P. F.; Castleman, A. W.; Chang, J.; Dixon,D. A.; Klein, M. L.; McLendon, G. L.; Miller, J. S.; Ratner, M. A.; Rossky,P. J.; Stupp, S. I.; Thompson, M. E.AdV. Mater.1998,10 (16), 1297-1336.
(2) Balzani, V.; Gomez-Lopez, M.; Stoddart, J. F.Acc. Chem. Res.1998,31, 405-414.
(3) Balzani, V.; Juris, A.; Venturi, M.; Campagna, S.; Serroni, S.Chem.ReV.1996,96, 759-833.
(4) Collier, C. P.; Mattersteig, G.; Wong, E. W.; Luo, Y.; Beverly, K.;Sampaio, J.; Raymo, F. M.; Stoddart, J. F.; Heath, J. R.Science2000,289(5482), 1172-1175.
(5) Heath, J. R.Acc. Chem. Res.1999,32 (5), 388.(6) Piotrowiak, P.Chem. Soc. ReV.1999,28, 143-150.(7) Fabbrizzi, L.; Licchelli, M.; Pallavicini, P.Acc. Chem. Res.1999,
32, 846-853.(8) Ward, M. D.Chem. Soc. ReV.1997,26, 364-375.(9) Benniston, A. C.Chem. Soc. ReV.1996, 427-435.(10) Reimers, J. R.; Lu, T. X.; Crossley, M. J.; Hush, N. S.Nanotech-
nology1996,7, 424-429.(11) Krische, M. J.; Lehn, J. M. Struct. Bonding2000,96, pp 3-29.(12) Ziener, U.; Breuning, E.; Lehn, J. M.; Wegelius, E.; Rissanen, K.;
Baum, G.; Fenske, D.; Vaughan, G.Chem. Eur. J.2000,6 (22), 4132-4139.
(13) Kleverlaan, C. J.; Indelli, M. T.; Bignozzi, C. A.; Pavanin, L.;Scandola, F.; Hasselman, G. M.; Meyer, G. J.J. Am. Chem. Soc.2000,122 (12), 2840-2849.
(14) Bignozzi, C. A.; Argazzi, R.; Kleverlaan, C. J.Chem. Soc. ReV.2000,29 (2), 87-96.
(15) Bignozzi C. A.; Schoonover, J. R.; Scandola, F.Prog. Inorg. Chem.1997,44, 1-95.
(16) Gust, D.; Moore, T. A.; Moore, A. L.J. Photochem. Photobiol., B2000,58 (2-3), 63-71.
(17) Gust, D.; Moore, T. A.; Moore, A. L.Acc. Chem. Res.2001,34(1), 40-48.
(18) Hissler, M.; Mcgarrah, J. E.; Connick, W. B.; Geiger, D. K.;Cummings, S. D.; Eisenberg, R.Coord. Chem. ReV.2000,208, 115-137.
(19) Slate, C. A.; Striplin, D. R.; Moss, J. A.; Chen, P.; Erickson, B.W.; Meyer, T. J.J. Am. Chem. Soc.1998,120, 4885-4886.
(20) Mallouk, T. E.; Gavin, J. A.Acc. Chem. Res.1998,31, 209-217.(21) Kaschak, D. M.; Lean, J. T.; Waraksa, C. C.; Saupe, G. B.; Usami,
H.; Mallouk, T. E.J. Am. Chem. Soc.1999,121, 3435-3445.(22) Kaschak, D. M.; Johnson, S. A.; Waraksa, C. C.; Pogue, J.; Mallouk,
T. E. Coord. Chem. ReV.1999,186, 403-416.(23) Kincaid, J. R.Chem. Eur. J.2000,6 (22), 4055-4061.(24) Wu, A.; Yoo, D.; Lee, J. K.; Rubner, M. F.J. Am. Chem. Soc.
1999,121 (20), 4883-4891.(25) Mattoussi, H.; Rubner, M. F.; Zhou, F.; Kumar, J.; Tripathy, S. K.;
Chiang, L. Y.Appl. Phys. Lett.2000,77 (10), 1540-1542.(26) Baur, J. W.; Rubner, M. F.; Reynolds, J. R.; Kim, S.Langmuir
1999,15 (19), 6460-6469.(27) Lee, J. K.; Yoo, D.; Rubner, M. F.Chem. Mater.1997, 9 (8), 1710.
10336 J. Am. Chem. Soc.2001,123,10336-10347
10.1021/ja016304i CCC: $20.00 © 2001 American Chemical SocietyPublished on Web 10/02/2001

flexibility and simplicity in the design of multicomponentassemblies. The Meyer group has explored this approach in theirwork on derivatized polystyrene,39-46 and the controlled posi-tioning of chromophores and other components along a polymerbackbone has been demonstrated by other groups as well.47-59
In this paper we describe ultrafast spectroscopic experimentsthat are aimed at characterizing the light-harvesting functionof a polymer derivatized with Ru(II) and Os(II) chromophores.
The functional capabilities of light-harvesting systems canbe quantified on the basis of the efficiency with which theyconduct excited-state energy. For efficient conduction to occur,the time scale for energy transfer must be fast compared to thelifetime of the excited state. For example, if the time scale foran excited state to hop to an adjacent site is 10 times fasterthan its lifetime, energy transfer will occur with 90% efficiency.
Thus efficient energy migration is best achieved by combiningfast energy transfer between monomer units with long-livedexcited states.
A number of attempts have been made to mimic the energytransfer capabilities of biological photosynthetic systems. Earlyefforts focused on methacrylate polymers functionalized withnaphthalene- and anthracene-based chromophores.60-62 Follow-ing photoexcitation, the naphthalene excited state migrates alongthe polymer backbone until it is quenched by energy transferto an anthracene trap that exists in low concentrations (∼1%).A wide range of efficiencies has been reported for differentsystems; however, in general the efficiencies are much less thanunity, ranging from 30 to 80%. Fox and co-workers63-66
investigated a series of diblock and triblock copolymer systemsthat couple energy migration with electron transfer. In thesesystems, the rate of energy migration (τ ∼ 300 ps) is comparableto the lifetime of the photoexcited donor (τ ∼ 4 ns).
Efficient energy conduction has also been observed inporphyrin arrays, and a great deal has been learned about theenergy transfer dynamics in these multicentered systems.67-73
In the case of a Zn/free-base porphyrin dimer, energy transferto the free base subunit occurs with an efficiency of greaterthan 95%. When the system is extended to a trimer with twoisoenergetic Zn porphyrin donors, the energy hopping betweendonors occurs with a time constant of≈50 ps, or 40 times fasterthan the natural lifetime of the monomer. One consequence ofthe intrinsically short excited-state lifetime is that energyhopping competes with the decay of the excited state, limitingthe energy transfer efficiency. This effect is magnified whenthere are multiple energy transfer steps. The reported efficiency73
for donor and acceptor separated by three isoenergetic Znporphyrins is 76% and calculations indicate that this drops to13% when the array is extended to 20 monomer units.71
In this paper we describe an ultrafast spectroscopic investiga-tion of the photoinduced energy migration dynamics that takeplace within a supramolecular assembly consisting of 20Ru(II) and/or Os(II) polypyridyl coordination complexes linkedtogether through a polystyrene backbone (Figure 1). Ourexperiments are performed on a solution of polymer chainsdissolved in acetonitrile, and thus probe the dynamics thatoccur within individual assemblies. Energy migration is initiatedby photoexcitation of one of the Ru(II) complexes and termi-nated upon energy transfer to a lower energy Os(II) trap. Wefind that when there is an average of three Os complexes per
(28) Shortreed, M. R.; Swallen, S. F.; Shi, Z.; Tan, W.; Xu, Z.; Devadoss,C.; Moore, J. S.; Kopelman, R.J. Phys. Chem. B1997,101, 6318.
(29) Devadoss, C.; Bharathi, P.; Moore, J. S.J. Am. Chem. Soc.1996,118, 9635.
(30) Balzani, V.; Campagna, S.; Denti, G.; Juris, A.; Serroni, S.; Venturi,M. Acc. Chem. Res.1998,31, 26-34.
(31) Jiang, D.; Aida, T.J. Am. Chem. Soc.1998,120, 10895.(32) Adronov, A.; Gilat, S. L.; Frechet, J. M. J.; Ohta, K.; Neuwahl, F.
V. R.; Fleming, G. R.J. Am. Chem. Soc.2000,122 (6), 1175-1185.(33) Neuwahl, F. V. R.; Righini, R.; Adronov, A.; Malenfant, P. R. L.;
Frechet, J. M. J.J. Phys. Chem. B2001,105, 1307.(34) Vogtle, F.; Plevoets, M.; Nieger, M.; Azzellini, G. C.; Credi, A.;
Cola, L. D.; Marchis, V. D.; Venturi, M.; Balzani, V.J. Am. Chem. Soc.1999,121, 6290-6298.
(35) Newkome, G. R.; He, E.; Moorefield, C. N.Chem. ReV.1999,99,1689-1746.
(36) Stewart, G. M.; Fox, M. A.Chem. Mater.1998,10, 860.(37) Storrier, G. D.; Takada, K.; Abrun˜a, H. D.Langmuir1999, 15, 872-
884.(38) Yeow, E. K. L.; Ghiggino, K. P.; Reek, J. N. H.; Crossley, M. J.;
Bosman, A. W.; Schenning, A. P. H. J.; Meijer, E. W.J. Phys. Chem. B2000,104 (12), 2596-2606.
(39) Worl, L. A.; Jones, W. E.; Strouse, G. F.; Younathan, J. N.;Danielson, E.; Maxwell, K. A.; Sykora, M.; Meyer, T. J.Inorg. Chem.1999,38 (11), 2705-2708.
(40) Friesen, D. A.; Kajita, T.; Danielson, E.; Meyer, T. J.Inorg. Chem.1998,37 (11), 2756-2762.
(41) Maxwell, K. A.; Dupray, L. M.; Meyer, T. J.Polym. Prepr. (Am.Chem. Soc., DiV. Polym. Chem.)1997,38, 329-330.
(42) Dupray, L. M.; Meyer, T. J.Inorg. Chem.1996,35 (21), 6299-6307.
(43) Jones, W. E.; Baxter, S. M.; Strouse, G. F.; Meyer, T. J.J. Am.Chem. Soc.1993,115 (16), 7363-7373.
(44) Dupray, L. M.; Devenney, M.; Striplin, D. R.; Meyer, T. J.J. Am.Chem. Soc.1997,119 (42), 10243-10244.
(45) Peters, M. A.; Belu, A. M.; Linton, R. W.; Dupray, L. M.; Meyer,T. J.; DeSimone, J. M.J. Am. Chem. Soc.1995,117 (12), 3380-3388.
(46) Sykora, M.; Maxwell, K. A.; DeSimone, J. M.; Meyer, T. J.Proc.Natl. Acad. Sci. U.S.A.2000,97 (14), 7687-7691.
(47) Wong, K. T.; Lehn, J. M.; Peng, S. M.; Lee, G. H.Chem. Commun.2000,22, 2259-2260.
(48) Galoppini, E.; Fox, M. A.J. Am. Chem. Soc.1996,118(9), 2299-2300.
(49) Clements, J. H.; Webber, S. E.J. Phys. Chem. B1999,103, 9366.(50) Clements, J. H.; Webber, S. E.J. Phys. Chem. A1999,103, 2513-
2523.(51) Schillen, K.; Yekta, A.; Ni, S.; Farinha, J. P. S.; Winnik, M. A.J.
Phys. Chem. B1999,103, 9090-9103.(52) Rharbi, Y.; Yekta, A.; Winnik, M. A.; DeVoe, R. J.; Barrera, D.
Macromolecules1999,32, 3241-3248.(53) Walters, K. A.; Trouillet, L.; Guillerez, S.; Schanze, K. S.Inorg.
Chem.2000,39 (24), 5496-5509.(54) Walters, K. A.; Ley, K. D.; Schanze, K. S.Langmuir1999, 15 (17),
5676-5680.(55) Mcquade, D. T.; Pullen, A. E.; Swager, T. M.Chem. ReV.2000,
100 (7), 2537-2574.(56) Swager, T. M.Acc. Chem. Res.1998,31 (5), 201-207.(57) Chen, L. X.; Jager, W. J. H.; Gosztola, D. J.; Niemczyk, M. P.;
Wasielewski, M. R.J. Phys. Chem. B2000,104 (9), 1950-1960.(58) Chen, L. X.; Jager, W. J. H.; Niemczyk, M. P.; Wasielewski, M.
R. J. Phys. Chem. A1999,103 (22), 4341-4351.(59) Wolcan, E.; Ferraudi, G.J. Phys. Chem. A2000,104 (41), 9281-
9286.
(60) Webber, S. E.Chem. ReV.1990,90, 1469-1482.(61) Holden, D. A.; Guillet, J. E.Macromolecules1980,13, 289.(62) Ng, D.; Guillet, J. E.Macromolecules1982,15, 724.(63) Fox, M. A.Acc. Chem. Res.1999,32, 201-207.(64) Watkins, D. M.; Fox, M. A.J. Am. Chem. Soc.1996,118, 4344-
4353.(65) Whitesell, J. K.; Chang, H. K.; Fox, M. A.; Galoppini, E.; Watkins,
D. M.; Fox, H.; Hong, B.Pure Appl. Chem.1996,68, 1469-1774.(66) Fox, M. A.Macromol. Symp.1996,101, 219-226.(67) Li, J.; Lindsey, J. S.J. Org. Chem.1999,64 (25), 9101-9108.(68) Li, J.; Ambroise, A.; Yang, S. I.; Diers, J. R.; Seth, J.; Wack, C.
R.; Bocian, D. F.; Holten, D.; Lindsey, J. S.J. Am. Chem. Soc.1999,121(38), 8927-8940.
(69) Kuciauskas, D.; Liddell, P. A.; Lin, S.; Johnson, T. E.; Weghorn,S. J.; Lindsey, J. S.; Moore, A. L.; Moore, T. A.; Gust, D.J. Am. Chem.Soc.1999,121 (37), 8604-8614.
(70) Li, F.; Yang, S. I.; Ciringh, Y.; Seth, J.; Martin, C. H.; Singh, D.L.; Kim, D.; Birge, R. R.; Bocian, D. F.; Holten, D.; Lindsey, J. S.J. Am.Chem. Soc.1998,120 (39), 10001-10017.
(71) Van Patten, P. G.; Shreve, A. P.; Lindsey, J. S.; Donohoe, R. J.J.Phys. Chem. B1998,102, 4209.
(72) Cho, H. S.; Song, N. W.; Kim, Y. H.; Jeoung, S. C.; Hahn, S.;Kim, D.; Kim, S. K.; Yoshida, N.; Osuka, A.J. Phys. Chem. A2000,104(15), 3287-3298.
(73) Wagner, R. W.; Lindsey, J. S.J. Am. Chem. Soc.1994,116, 9759.
Ultrafast Excited-State Energy Migration Dynamics J. Am. Chem. Soc., Vol. 123, No. 42, 200110337

chain the sensitization efficiency of the Os sites by photoexcitedRu complexes is near unity (≈95%). Although this efficiencyis an indicator of its light-harvesting potential, its value dependson the degree of Os loading, and thus does not provide a windowthrough which to view the microscopic dynamics.
To gain a better understanding of theintrinsic properties ofthe energy migration process we have augmented our time-resolved experiments with Monte Carlo simulations. Theseprovide insight into the polymer array’s structure and at thesame time form the basis of a molecular-level description ofthe energy migration dynamics. Our simulations suggest thatthe Ru*fRu energy transfer times are in the range between 1and 4 ns, or about 250-1000 times faster than the naturallifetime of the Ru excited state (1000 ns). This implies a single-step energy transfer efficiency of 99.6 to 99.9%. The fast excitedstate hopping relative to the Ru excited state lifetime suggeststhat an excited state could make a large number of hops, andthus transport excited state energy over long distances withrelatively high efficiency.
II. Experimental Section
A. Synthesis and Materials.The primary focus of our spectroscopicexperiments is on the polymeric system with mixed Ru(II)/Os(II)loading, PS-Ru17Os3. The synthesis of this system is described fullyelsewhere40,74and so only a brief description is given here. The synthesisof the polystyrene backbone, PS-CH2CH2NH2, is accomplished via aliving anionic polymerization of a vinyl monomer with a protected
amine group. The living anionic method offers the advantage ofdecreased molecular weight polydispersity compared to free radicaltechniques (PDI) 1.08). In the present work, the polymerization wasterminated at 20 repeat units. The loading of the polystyrene backboneis accomplished by amide coupling of the deprotected amine withcarboxylic acid derivatized Ru and Os complexes. In the case of themixed-loaded polymers, the minority species is loaded first by reactingthe deprotected polymer with 3 equiv of Os(II) complex per polymerchain. The remaining sites are then loaded with Ru(II) complexes viareaction with an excess of the acid functionalized Ru(II) compound.The degree of metal site vacancies (i.e. binding sites with no attachedcomplex) was assessed by using1H NMR.41 The 17:3 Ru/Os loadingratio was confirmed by1H NMR and UV-vis absorption measurements.Spectroscopic experiments are performed on polymer chains dissolvedin room temperature acetonitrile.
B. Steady-State Methods.UV-visible spectra were recorded on adiode array spectrometer with 2 nm resolution. The spectroscopic gradeacetonitrile used in the photophysical measurements was either usedas received or distilled over CaH2. Steady state emission spectra wererecorded on a photon counting spectrofluorimeter and were correctedfor the instrument response. Optically dilute samples (less than 0.12OD at the excitation wavelength) were Argon sparged for 40 min priorto use. Emission quantum yields were determined by relative actinom-etry.75 The procedure involves the measurement of the integratedemission profile (I) and absorbance (A) of an unknown sample and areference compound. The quantum yield of the sample (Φ) is thendetermined by using
wheren is the refractive index of the solvent, andΦR, AR, andnR allrefer to the reference compound. The reference used in this work waseither [Ru(bpy)3](PF6)2, for whichΦem ) 0.062,76 or [Os(bpy)3](PF6)2,for which Φem ) 0.005,77 in acetonitrile at 298 K.
C. Time-Resolved Emission Methods.Time-resolved measurementswere conducted by time-correlated single photon counting (TCSPC).The apparatus consists of a mode-locked Nd:YAG laser (CoherentAntares) whose frequency tripled output is used to synchronously pumpa single jet dye laser with Stilbene 3. The dye laser output at 430 nmis cavity dumped to produce∼10 ps pulses with a pulse energy of∼6nJ/pulse. The repetition rate of the dye laser was selected to be at least5 times the natural lifetime of the sample (475 kHz for measurementsat 780 nm or 190 kHz for measurements at 640 nm). The beam passesthrough an iris and illuminates, without focusing, a 10 mm quartzcuvette containing the sample. The emitted light is collected at 90°and focused onto the slit of a 240 mm focal length, single gratingmonochromator and subsequently delivered to a cooled, multichannelplate-photomultiplier tube (MCP, Hamamatsu R3809U-51). The in-tensity of the detected luminescence is varied by use of neutral densityfilters mounted before the monochromator. The signal from the MCPis amplified prior to sending it into a 200 MHz constant fractiondiscriminator (CFD, Tennelec 454) whose output serves as the startpulse for a time-to-amplitude converter (TAC, Tennelec 864). The stoppulse is obtained by focusing 10% of the excitation beam onto a Si:PIN photodiode, whose output is sent into a variable delay box, thento a CFD, and finally to the TAC. The TAC’s output is sent to amultichannel analyzer that is interfaced to a PC. The instrumentresponse of the apparatus is 80 ps at the fwhm.
III. Results and Discussion
The energy migration process is initiated by photoexcitationof one of the Ru monomers to a singlet metal-to-ligand chargetransfer (1MLCT) state, which is followed by efficient inter-
(74) Maxwell, K. A. Doctoral Dissertation, University of North Carolinaat Chapel Hill, Chapel Hill, NC, 1999.
(75) Demas, J. N.; Crosby, G. A.J. Phys. Chem.1971,75, 991.(76) Casper, J. V.; Meyer, T. J.J. Am. Chem. Soc.1983,105, 5583.(77) Casper, J. V.; Kober, E. M.; Sullivan, B. P.; Meyer, T. J.J. Am.
Chem. Soc.1982,104, 630.
Figure 1. Schematic diagram depicting the structure of the polymericassembly. Ru(II) and Os(II) complexes are covalently linked to apolystyrene backbone. Open circles in the diagram represent othertransition metal complexes that are not shown for clarity. The structuresof the two monomer complexes, Ru(dab)2(mab)2+ and Os(bpy)2(mab)2+,are identified by the dashed lines. Our experiments were performedon polymer chains dissolved in CH3CN. At the bottom of the figureare the chemical structures of the three ligands (bpy, mab, and dab)referred to in the text.
Φ ) ΦR( IIR
)( nnR
)2(AR
A ) (1)
10338 J. Am. Chem. Soc., Vol. 123, No. 42, 2001 Fleming et al.

system crossing to a3MLCT state in a matter of several hundredfemtoseconds.78,79The lifetime of this low-lying triplet state isabout 1000 ns, and as a result there is sufficient time for theexcited state to either transfer to an adjacent Ru complex or bequenched by direct energy transfer to a lower energy Os sitebefore relaxation back to the ground state. Because the Osexcited state lies approximately 0.34 eV below the Ru excitedstate, the Os sites are considered to be deep traps that terminatethe energy migration process.
This work focuses on polymers with mixed Ru/Os loading(PS-Ru17Os3), their corresponding ruthenium and osmiumhomopolymers (PS-Ru20 and PS-Os20), and the two monomercomplexes, Ru(dab)2(mab)2+ and Os(bpy)2(mab)2+. The ho-mopolymers and monomer complexes serve as referencesystems.80 This approach is justified by a series of spectroscopicexperiments that indicate the polymers are well described as acollection of chromophores whose excited states remain intactupon incorporation into the array. Thus, the polymer backboneis primarily a structural support that holds complexes in closeproximity.
The outline of this section is as follows. In Section A weaddress some of the issues associated with the polymer structureand the arrangement of the metal complexes. These conceptsare central to the interpretation of the spectroscopic data, andthus the salient details are presented early in the discussion.The steady-state spectroscopy is discussed in Section B and thetime-resolved experiments are presented in Section C. In thatsection we discuss the kinetics of the energy transfer process,measurements of the sensitization efficiency, and the energytransfer mechanism. Finally in Section D we describe the MonteCarlo simulations that are used to model the polymer structureand gain insight into the intrinsic properties of the energymigration dynamics.
A. Supramolecular Structure and Metal Complex Load-ing. The microscopic details of the energy transfer dynamicswill depend on the polymer structure and this is greatlyinfluenced by the large (14 Å diameter) metal dication monomerunits. A typical structure calculated from molecular modelingis depicted in Figure 2 (the details of these calculations aredescribed later). The larger spheres are the Ru(II) or Os(II)chromophores and the smaller spheres are the PF6
- counterionsthat surround the polymer whose overall charge is+40. Thedensely loaded polymer adopts a twisted backbone and extendedrodlike structure to alleviate the steric and Coulombic repulsionsbetween adjacent chromophores. One consequence of the denseloading is that the average distance between the peripheries ofadjacent chromophores is 2-3 Å. It is this close proximity ofthe complexes that is partly responsible for the efficient energytransfer that is observed.
The arrangement of the Ru and Os complexes on the polymerchain plays an integral role in the description of the migrationdynamics. The mixed polymer is loaded with (on average) 17Ru and 3 Os complexes. The average, however, is over the entiresample not an individual chain. And furthermore, the loadingis random, allowing for a certain fraction of chains to have moreor less Os complexes in a number of possible configurations.The probability that a chain will haven Os sites is given by,
wherePRu (17/20) andPOs (3/20) are the probability that a givensite is Ru or Os, respectively, andN is the total number ofcomplexes. For our samples there is a narrow distribution ofchain lengths (PDI) 1.08) centered atN ) 20. Statisticallywe expect 24% of the chains to have three Os with 35% of thechains having more than three and 41% having less; 4% of thechains are expected to be Ru homopolymer (i.e.n ) 0).
B. Steady-State Spectra.The ground-state absorption spec-trum of the PS-Ru17Os3 polymer is displayed in Figure 3. Thespectrum shows an intense band centered at 450 nm and a
(78) Demas, J. N.; Crosby, G. A.J. Am. Chem. Soc.1971,93, 2841.(79) Damrauer, N. H.; Cerullo G.; Yeh, A.; Boussie, T. R.; Shank, C.
V.; McCusker, J. K.Science1997,275, 54-57.(80) Other possible choices for the homopolymer systems are PS-Ru17
and PS-Os3. However, the macromolecular structure is strongly influencedby the number of metal complexes, and therefore these systems (PS-Os3 inparticular) will more than likely have very different structures whencompared to their PS-Ru17Os3 parent. This would make them poor mimicsfor the mixed-loaded polymer.
Figure 2. Structure of a polymer assembly containing 20 transitionmetal complexes calculated by Monte Carlo simulations (see text).Large spheres represent the metal complexes and small spheres arethe PF6- counterions.
Figure 3. Absorption spectra of the PS-Ru17Os3 polymer assemblyand Ru and Os monomer complexes, Ru(dab)2(mab)2+ and Os(bpy)2-(mab)2+, in room temperature CH3CN. The monomer spectra are scaledby 17/20 and 3/20, respectively, to reflect their contributions to thepolymer sample. The solid lines are the experimental observation; theindividual points are obtained by the addition of the two monomerspectra. The arrow identifies the excitation wavelength used for thetime-resolved experiments discussed later in the text.
Pn ) N!(N - n)!n!
‚ PRu(N-n) ‚ POs
n (2)
Ultrafast Excited-State Energy Migration Dynamics J. Am. Chem. Soc., Vol. 123, No. 42, 200110339

weaker absorption that extends out to about 700 nm. Thepolymer spectrum can be understood in terms of the absorptionspectra of the two monomer complexes, Ru(dab)2(mab)2+ andOs(bpy)2(mab)2+. These spectra are also shown in the figure,but their absorptivities are weighted by 17/20 and 3/20,respectively, to reflect their relative abundances within thepolymer sample.
The broad absorption band centered near 450 nm (for bothRu and Os) is a metal-to-ligand charge transfer (MLCT)transition that involves the promotion of a metal dπ electron toa π* orbital on one of the polypyridyl ligands. Any of the threeligands could receive the electron in the optical excitationprocess, but at long times the photoexcited electron resides onthe lowest energy ligand, i.e. one of the twodab ligands.
On a per molecule basis, the absorption cross-section forexcitation of the Ru complex at 430 nm (the excitationwavelength used in these experiments) is comparable to that ofOs. As a result, the relative probability for Ru or Os excitationis determined by their mole fractions in the sample. In additionto the 450 nm band, the Os complex has a weak absorptionfeature centered around 630 nm. This transition corresponds todirect excitation to a3MLCT state. Although this is formally aspin-forbidden transition, its intensity becomes appreciable inOs as a result of the large spin-orbit coupling in the heaviermetal.
The absorption spectrum of the polymer can be reproducedby a superposition of the weighted monomer spectra. Thissuggests that the polymer can be described as an array of weaklycoupled chromophores whose electronic structures remainessentially intact upon loading onto the polymer backbone. Thisconclusion is also supported by other general observations. Atlow excitation energies, the spectroscopic signatures (i.e.absorption spectra, emission spectra, and excited-state lifetimes)exhibited by the Ru and Os homopolymers are almost identicalto their monomer counterparts.
Displayed in Figure 4 is the emission spectrum of PS-Ru17-Os3 in room temperature CH3CN. The spectrum shows twofeatures: a high-energy band with a maximum at 640 nm,and a low-energy shoulder in the vicinity of 750-800 nm.These features are assigned to Ru- and Os-complex emission,
respectively. The emission spectra of the two homopolymersare also displayed in the figure, with their intensities scaledto reflect their relative contributions to the PS-Ru17Os3
emission.The relative intensities of Ru and Os emission offer evidence
of extensive quenching of the Ru excited state. The ratio of thetwo emission intensities is determined by the number of Ruexcited states, the number of Os excited states (created by eitherdirect excitation or Ru*fOs energy transfer), and the relativeluminescence quantum yields. The steady-state emission spec-trum shows that Ru emission is about 3 times more intense thanthat of Os. However, the quantum yield for Ru emission is≈10%, or about 30 times larger than that of Os (Φ ) 0.32%).Once adjusted for the difference in quantum yields, the relativeintensities suggest that the Os excited states outnumber the Ruexcited states by a factor of 10. Since there are 5-6 times moreRu excited states produced by photoexcitation, the presence ofa larger number of excited Os complexes points to an efficientRu*fOs energy transfer process. Measurements of the energytransfer efficiency (Section C-2) support this conclusion. In fact,the majority of the Ru complex emission observed in the PS-Ru17Os3 spectrum is attributed to polymer chains that have zeroOs complexes, i.e. Ru homopolymers. Statistically, such chainsare expected to constitute 4% of the polymer sample.
C. Energy Transfer Dynamics.Photoinduced energy migra-tion is followed through the time-resolved luminescence detectedat 640 and 780 nm, both of which are displayed in Figure 5. At640 nm Ru is the sole emitter. The emission at this wavelengthdecays on multiple time scales, ranging from 2 to 980 ns. Theemission detected at 780 nm reflects the appearance of Os(II)excited states. The growth in emission at this wavelength showsa rapid rise followed by a slower rise to the maximum at 5-10ns. The rapid rise accounts for 56% of the maximum intensityand lies within the instrument response of the apparatus (80ps). The slower rise coincides with the fastest decay componentin the Ru emission, implying that the slower growth arises fromthe production of Os excited states by Ru*fOs energy transfer.The decay of the luminescence after the maximum is nonex-ponential. This differs from PS-Os20, which decays with singleexponential kinetics and a 49 ns lifetime. The nonexponentialbehavior observed in the decay of the 780 nm emission is
Figure 4. Emission spectra of PS-Ru17Os3 (open circles) and its Ruand Os homopolymer counterparts (solid lines). The arrows indicatethe two monitoring wavelengths used in the time-resolved experiments.Emission monitored at 640 nm arises entirely from Ru(II) luminescence,while the emission monitored at 780 nm has both Ru(II) and Os(II)contributions (see text).
Figure 5. Time-resolved emission from PS-Ru17Os3 detected at 640(entirely Ru(II)) and 780 nm (primarily Os(II)). Excitation was at 430nm. Both transients are normalized such that their maximum intensityis equal to unity.
10340 J. Am. Chem. Soc., Vol. 123, No. 42, 2001 Fleming et al.

probably the result of photosensitization events that are delayeddue to Ru*fRu energy migration.
The Ru emission past 500 ns decays with a lifetime of 980ns, which is characteristic of the PS-Ru20 homopolymer (1000ns). One possible explanation of this is that the Ru excited stategets trapped within a subset of complexes and is not able tofully explore the entire polymer. Although such a scenariocannot be entirely ruled out, our simulations of the energymigration dynamics (Section D) do not support its presence.Instead we attribute the long tail in the Ru luminescence toemission from the subset of polymer chains that do not haveany Os complexes, i.e. Ru homopolymer, which is present inthe mixed polymer sample due to the statistical nature of themetal complex loading.
The deviation from single-exponential kinetics in both theRu and Os data is a result of a complex energy transfer processwhere the number of Ru*fRu migration steps that precedeRu*fOs trapping varies from one excitation event to the next.As mentioned earlier, the average ratio of Ru to Os over theensemble of chains is 17:3 but the loading on an individualchain is random. This results in a distribution in the degree ofOs loading and a large number of possible chromophoreconfigurations. Furthermore, since an energy gradient towardthe trapping site does not exist, the propagation of the excitedstate from one Ru to the next is a series of uncorrelated hoppingevents. As a result, even if two polymer chains have exactlythe same arrangement of chromophores and the same initiallocation of the excited state, the random walk behavior couldcause the path that one excited state takes to the trap to bedifferent from another.
The growth in the Os emission intensity and the concomitantdecay in the Ru emission most certainly reflect the rates ofexcited state energy transfer. However, because the observedtime scales are closely linked to the degree of Os loading theydo not provide a direct measure of the energy transfer times.For example, a chain with a 16:4 Ru to Os loading would showa faster growth rate in the Os emission simply because a Ruexcited state would make on average fewer steps to the Os trap.Since the Ru*fRu energy transfer time should be independentof the number of Os complexes on a given chain, the growthand decay times extracted directly from the data can, at best,provide only a qualitative description of the energy migrationprocess. In the sections that follow, we present a more thoroughanalysis of the spectroscopic data, and develop a fundamentalpicture of the energy migration dynamics.
1. Time-Resolved DatasA Closer Look. There are twocontributions to the luminescence at 780 nm that do not arisefrom Os sensitization. These are (1) emission originating fromOs centers directly excited by the laser,and (2) Ru luminescencethat is also detected due to the overlap of Ru and Os emissionbands. The question therefore arises as to which features of the780 nm transient are due to energy migration and which aspectsare not.
The contributions to the transient emission that do not arisefrom sensitized emission are easily determined. The contributionfrom direct Os excitation is assessed by comparing the PS-Ru17-Os3 transient at 780 nm with that of PS-Os20 under the exactsame conditions of concentration and integrated irradiance. TheRu contribution is determined by exploiting the difference inRu and Os emission lifetimes. PS-Ru20 has an emission lifetimeof 1000 ns, which is substantially longer than the 49 ns lifetimeobserved for PS-Os20. Thus, the 780 nm luminescence observedat very long times (i.e.>500 ns) is due solely to Ru. Itscontribution is determined by scaling the emission transient
observed at 640 nm to match the 780 nm data at times greaterthan 500 ns. This assumes that the decay of the Ru emissiondetected at 780 nm has the same shape as that at 640 nm (whereRu is the sole emitter). This assumption is supported by time-resolved emission experiments performed on PS-Ru20 that showno spectral shifts in the decay of the Ru emission band,indicating that it decays uniformly. The sum of these twocontributions is displayed along with the total emission detectedat 780 nm in Figure 6.
The sensitized Os emission is determined simply by subtract-ing out the direct Os excitation and Ru contamination contribu-tions from the total emission. It represents a substantial fraction(≈60%) of the total luminescence detected at 780 nm. In thenext section, we will use this to determine the efficiency of Ossensitization.
The rise in thesensitizedemission is displayed in the toppanel of Figure 7. This portion of the transient cannot be fit bya single-exponential model, which is evidenced by the residuals(Figure 7). The rise is well described, on the other hand, by abiexponential function of the form,
The fit to this function is displayed as the solid line in the toppanel of Figure 7. The rise is comprised of a fast, 400 pscomponent, which accounts for about 25-30% of the maximumamplitude, and a slower component with a 3.6 ns time constant.The fit to a biexponential function is not meant to imply thatthe polymer system should be viewed as a two-state system,which it most certainly is not. Nevertheless, the presence oftwo kinetic components suggests that there are two qualitativelydistinct dynamical processes occurring on different time scales.The 400 ps component is attributed to the prompt Ru*fOsenergy transfer that occurs when the Ru excited state is formedat a site directly adjacent to the Os trap. As mentioned earlier,the Ru*fOs energy transfer will take place on a range of timescales. The fast time component observed here probablyrepresents the fastest portion of the distribution, since it is theseenergy transfer events that will give rise to prompt sensitization.
Figure 6. Contributions from direct Os excitation and Ru emission tothe total PS-Ru17Os3 emission detected at 780 nm. The total emissionat 780 nm is the same as that displayed in Figure 5, only on a longertime sale.
I(t) ) A1(1 - exp(- tτ1
)) + A2(1 - exp(- tτ2
)) (3)
Ultrafast Excited-State Energy Migration Dynamics J. Am. Chem. Soc., Vol. 123, No. 42, 200110341

The rest of the rise is attributed to emission from sensitized Oscomplexes that are formed after one or more Ru*fRu hops. Amore realistic model of the energy migration dynamics isincorporated into our Monte Carlo simulations, which arediscussed in Section D.
2. Efficiency of Sensitizing Os Traps.Energy transfercompetes with the intrinsic radiative (kr) and nonradiative (knr)pathways in depopulating the excited state of the donor. Thequantum yield, or efficiency (øΕΝ), of sensitizing the Os(II) sitescan be defined as,
Thus, quantum yield (Φ) or lifetime (τ) measurements of thedonor in the presence (ΦD or τD) and absence (ΦD
o or τDo) of the
acceptor can be used to calculateøΕΝ. The quantum yields forRu emission from PS-Ru17Os3 and PS-Ru20 polymers are 0.019and 0.1, respectively, implying a sensitization efficiency of 80( 10%.
Alternatively, the efficiency can be defined as the ratio ofthe number of sensitized acceptors, denotedN(OsEN), to thenumber of excited donors, i.e.
Both of these quantities can be determined by using theluminescence decay data of the acceptor.
The first quantity needed isN(OsEN), the number of Osexcited states formed via sensitization. This is given by,
whereη is an integrated intensity obtained from the emissiontransient, i.e.,η ) ∫I(t) dt. ηS andηR are the total number ofphotons observed at 780 nm from PS-Ru17Os3 (sample) and PS-Os20 (reference), respectively. (The Ru contribution is removedfrom the mixed polymer emission prior to performing thisanalysis.)ΦOs is the emission quantum yield of PS-Os20 in CH3-CN, POs is the mole fraction of Os in the sample (3/20), andGis a geometrical factor that reflects the photon collectionefficiency of our apparatus at 780 nm. The ratio [S]/[R] accountsfor differences in polymer chain concentration between thesample and reference: this is determined from absorptionmeasurements on the two separate samples. The first term ineq 6a is the total number of Os excited states produced by eithersensitization or direct excitation, while the second term reflectsthe number of Os excited states resulting from direct excitationalone.
The second quantity needed isN(Ru*), the number of directlyexcited donors. This is determined from the PS-Os20 referenceby using the following expression,
whereε is the molar absorptivity at the excitation wavelengthfor Ru and Os, andPRu is the mole fraction of Ru in the sample(17/20). The ratio of absorptivities is included to take intoaccount the difference in excitation probabilities of the Ruand Os complexes. In essence, the Os homopolymer is usedas a quantum counter. In principle the Ru emission could beused, but this would introduce the Ru quantum yield into theanalysis as well as the photon collection efficiency at 640nm. Not only is this avoided by using the Os emission, butsinceΦOs and G appear in both eqs 6a and 6b, they do notappear in the final expression for the efficiency (eq 5). Theefficiency of Os sensitization in the PS-Ru17Os3 polymer at roomtemperature in CH3CN is calculated in this manner to be 88(12%.
On the basis of these two methods we estimate the overallefficiency for the sensitization of the Os traps to be ap-proximately 85%. We point out, however, that this representsan average efficiency over the entire sample, including thosechains that do not have any Os complexes and hence remainunquenched. Depending upon the fraction of PS-Ru20 ho-mopolymer in the sample, the sensitization efficiency for thesubset of chains with at least one Os complex could besubstantially higher.
The presence of PS-Ru20 in the sample is expected, and duein part to the statistical nature of the loading. Statisticalarguments predict a 4% fraction of homopolymer. How-ever, the actual fraction appears greater than this. The ho-mopolymer contribution is seen most clearly in the long timedecay of the 640 nm emission, Figure 8. The longest timecomponent is assigned to emission from the homopolymerfraction. Extrapolating this emission tail back tot ) 0 wefind that 85% of the integrated emission at 640 nm can beattributed to Ru homopolymer. The fraction of homopolymer
Figure 7. The upper panel shows rise in sensitized Os(II) emissionfrom PS-Ru17Os3 detected at 780 nm. The individual points are theexperimental data and the solid line is the result of a nonlinear least-squares fit to a biexponential function. Attempts were made to fit therise to a single-exponential function. The residuals from this fit (middlepanel) show clear deviation from single-exponential behavior. Theresiduals displayed in the lowest panel are for the biexponential fit.The sum-of-squared residuals are 0.06 and 0.01 for the singleexponential and biexponential fits, respectively.
øEN )kEN
kEN + kr + knr) 1 -
ΦD
ΦDo
) 1 -τD
τDo
(4)
øEN )N(OsEN)
N(Ru*)(5)
N(OsEN) ) GΦOs
(ηS - ηR ‚[S]
[R]‚ POs) (6a)
N(Ru*) ) G( ηR
ΦOs‚εRu
εOs‚
[S]
[R]‚ PRu), (6b)
10342 J. Am. Chem. Soc., Vol. 123, No. 42, 2001 Fleming et al.

chains (FH) is given by
whereNH andNT are the number of homopolymer chains andthe total number of chains, respectively, andηH andηT representthe integrated emission intensities. The ratioηH/ηT is the fractionof the total emission that emanates from the homopolymerchains, 85%. The homopolymer fraction thus calculated is 10-12%. It is unclear why there is a larger fraction than statisticallypredicted. It is perhaps due to an artifact of the syntheticprocedure, arising from the limited solubility of the amine-derivatized polymer precursor. The implication is that thesensitization efficiency averaged over the entire sample can beat most 90%, and thus the efficiency of those polymer chainsthat have at least one Os complex is in fact closer to 95%. Wepoint out that deviation from the statistics of eq 2 does not affectany of the numerical results achieved thus far. The analysis ofthe steady-state spectra and the efficiency of energy transferdepend only upon the relative amounts of Ru(II) and Os(II)complexes in the sample, not on how they are distributed amongthe chains.
3. Energy Transfer Mechanism.The energy transfer rateconstant can be cast in a “golden-rule” expression in whichkEN
is proportional to the square of an electronic coupling matrixelement,HDA.15,81 This two-electron matrix element involvesthe molecular orbitals on both the donor and acceptor. Theelectronic factor can be split into a Coulombic term and anexchange term, which give rise to Forster and Dexter energytransfer mechanisms, respectively.
The Forster mechanism describes energy transfer through adipole-dipole coupling term. As a result, the rate constant hasa gradual dependence (1/R6) on the donor-acceptor separation,and energy transfer is capable of occurring over large distances.The Forster mechanism is most efficient when the opticaltransitions connecting the ground and excited states in bothpartners are electric-dipole allowed.82 On the surface this wouldseem to exclude the Forster mechanism for energy transferinvolving Ru and Os metal complexes, where optical transitionsto the lowest excited state are spin-forbidden. However, because
of the large spin-orbit coupling, this selection rule may not beabsolute. Spin-orbit coupling introduces some singlet characterinto the emitting states. The fraction is estimated to be less than11% in Ru(bpy)32+, and in Os(bpy)32+ it is probably around30%.83 Although we cannot completely rule out the Forstermechanism, the small percentage of singlet character in thedonor and acceptor complexes suggests that it may not be thedominant pathway.
The Dexter mechanism, on the other hand, involves theexchange of donor and acceptor electrons, and is thereforeexpected to operate only at short distances where the electronclouds can interpenetrate. Because this interaction requires over-lap between the orbitals, the energy transfer rate constant inthe Dexter formulation falls off exponentially with increasingseparation. The distance over which energy transfer occurs canbe extended, however, when the donor and acceptor are connect-ed through a series of covalent bonds. In these cases the orbitalscan indirectly mixed via a superexchange type interaction thatinvolves molecular orbitals on the intervening bonds. Thepolymer backbone in PS-Ru17Os3 is in essence a bridging ligandbetween adjacent complexes, and hence there is the potentialfor a through-bond pathway. Thus the question is whether thecoupling between the sites arises from a direct overlap of wavefunctions or a bridge-mediated superexchange pathway.
There are clear examples in the literature of efficient throughbond coupling in Ru/Os dimers. Harriman and co-workers84
report an energy transfer time of 6 ps for the complex [(bpy)2Ru-(bpy-CtC-bpy)Os(bpy)2](PF6)4. Although the observation isinteresting, the short bridging length and high degree ofconjugation make comparisons to this system irrelevant. Forenergy transfer to proceed through bond in our system, efficientcoupling would need to occur across a network consisting of18 σ and π bonds. Reports of Ru*fOs energy transfer insystems involving extended bridges have also appeared in theliterature. Balzani et al.85 observe a 1.5 ns energy transfer timefor [(bpy)2Ru(bpy-(ph)3-bpy)Os(bpy)2]4+, where the bridge is11 Å and 13 bonds in length. Here energy transfer is attributedto a through-bond-type mechanism, which is probably enhancedby the high degree of conjugation in the phenylene spacers.This is in contrast to the [(bpy)2Ru(bpy-S-bpy)Os(bpy)2]4+
dimer, where S consists of a bicyclooctane component linkedto two ethylene components.86 This bridging ligand is roughly9 Å in length, and unlike the previous case, the bicyclooctanebridge contains no conjugated bonds. The saturated bondssubstantially diminish the electronic communication betweenmetal centers, leading to a longer time scale for energy transfercompared to the phenylene bridge, despite its physically shorterlength. The range of energy transfer rate constants observed invarious dimers reflects the differences between bridging ligandsin their ability to mediate electronic communication betweenthe donor and acceptor. Thus, the most germane comparisonswill be those that have similar bonding networks between themetal centers.
Schmehl and co-workers87 provide an example of a bridgingligand that more closely resembles the combination ofσ andπbonds found in our polymer. They report an energy transfertime of about 10 ns in [(dmb)2Ru(bpy-etphet-bpy)Os(dmb)2]4+
(81) Speiser, S.Chem. ReV.1996,96, 1953-1976.(82) Forster, T.J. Chem. Soc., Faraday Trans.1959,27, 7.
(83) Kober, E. M.; Meyer, T. J.Inorg. Chem.1984,23, 3877-3886.(84) Harriman, A.; Romero, F. M.; Ziessel, R.; Benniston, A. C.J. Phys.
Chem. A1999,103 (28), 5399-5408.(85) Schlicke B.; Belser, P.; Cola, L. D.; Sabbioni, E.; Balzani, V.J.
Am. Chem. Soc.1999,121 (17), 4207-4214.(86) De Cola, L.; Balzani, V.; Barigelletti, F.; Flamigni, L.; Zelewsky,
A.; Frank, M.; Vogtle, F.Inorg. Chem.1993,32, 5228.(87) Shaw, J. R.; Sadler, G. S.; Wacholtz, W. F.; Ryu, C. K.; Schmehl,
R. H. New J. Chem.1996,20, 749-758.
Figure 8. Time-resolved emission from PS-Ru17Os3 detected at 640nm. The shaded area depicts the contribution from the Ru hompolymer.
FH )NH
NT) (ηH
ηT)(1 - øEN) (7)
Ultrafast Excited-State Energy Migration Dynamics J. Am. Chem. Soc., Vol. 123, No. 42, 200110343

where the bridge spans roughly 12 Å and 9 bonds. The Ru*fOsenergy transfer observed in this system is slower than that foundin our polymer (∼400 ps), despite the fact that there are fewerbonds in its bridging network. This trend is inconsistent with athrough-bond-type mechanism.
It is consistent with an energy transfer mechanism that arisesfrom a direct overlap of the donor and acceptor wave functions.The distance between Ru and Os complexes in the dimer willbe very different than that found in the polymer. The dimerwill probably adopt an extended structure that minimizes theCoulombic repulsions between the metal complexes. In contrast,our Monte Carlo simulations (Section D) suggest that the denseloading of the polymer leads to Ru and Os complexes that arein much closer proximity, despite the longer bridging networkbetween them. This suggests that energy transfer in the polymeris due, at least in part, to an effective coupling between adjacentchromophores that does not involve the orbitals on the bridgingnetwork. While this tends to rule out coupling through thepolymer backbone, there is also the possibility of a superex-change pathway involving the intervening solvent. Solvent-mediated superexchange has been discussed in relation to energytransfer in other systems.81
D. Monte Carlo Simulation of Energy Migration. Theenergy transfer time will be characterized not by a single rateconstant but rather a distribution of rate constants that reflectsa range of separations between metal complexes. Thus, todetermine the time scale for Ru*fRu and Ru*fOs energytransfer, the physical model must incorporate a microscopicdescription of the polymer’s structure. The kinetic model usedhere combines a Monte Carlo simulation that yields structuralinformation with a stochastic simulation of the energy migration.Together with the time-resolved measurements these calculationsprovide insight into the structure and dynamics at the molecularlevel.
1. Polymer Structure. The polymer structure is calculatedby using a Metropolis Monte Carlo algorithm. The potentialenergy function that describes the assembly represents eachmetal complex as a hard 14 Å diameter sphere with a+2 chargeplaced at its center. The polystyrene backbone is modeled as aflexible chain that is free to rotate about the C-C single bonds(whose lengths are held constant). The surrounding solvent istreated as a dielectric continuum and the PF6
- counterions arerepresented by hard spheres (6.3 Å diameter) with a-1 chargelocated at their centers. Our calculations are performed onpolymer chains in which every binding site is occupied by ametal complex. This is consistent with1H NMR measurementsthat indicate complete loading of the polymer chains.
The initial structure is constructed by placing the metalcomplexes on the side chains of an extended polystyrene chain.Because polystyrene is considered to have an atactic structure,the handedness of the chiral carbons in the backbone is chosenat random such that right- and left-handed sites are equallylikely. Starting with this structure, one C-C bond in the polymerbackbone is chosen at random. The array structure is alteredby rotation about this bond and the change in energy,∆E,between the old and the new configurations is calculated. Ifthe energy of the new structure is lower, the move is accepted.If the potential energy is increased, the new configuration isaccepted only if the quantity exp(-∆E/kBT) is less than arandom number chosen on the interval (0,1). The structure isannealed during the course of generating 5× 10⁵ configurations.After this annealing period an additional 106 structures aregenerated, from which 20 are selected. This is repeated 20 timesto produce an ensemble of 400 structures.
A typical structure is shown in Figure 1. The large spheresrepresent the transition metal complexes while the smallerspheres represent the PF6
- counterions. The carbon backboneundergoes significant twisting to relieve the steric and Cou-lombic repulsion between the large transition metal complexes.The result is a structure in which one complex is in closeproximity to several others within the array. In addition, thenearest neighbor through space is not necessarily the same asthe nearest neighbor through bond.
The metal-metal (MM) pair distribution function obtainedfrom analyzing 400 different chain structures is displayed inFigure 9. The largest MM separation with nonzero probabilityis around 6 nm, reflecting the average length of the polymerchain. The oscillations in the probability distribution indicatethe presence of structural organization that is analogous to thelevel of order found in other ostensibly disordered systems suchas molecular liquids. Each oscillation in the pair distributioncorresponds to a “chromophore shell” that surrounds the metalcomplex of interest. There are two distinct shells observed inthe distribution, one centered at 14 Å and the other at 29 Å.These two peaks correspond to the distribution of nearestneighbors (nn) and next-nearest neighbors (nnn), respectively.From the integrated area of the nearest neighbor (nn) peak, weestimate that each complex has between 4 and 5 nearestneighbors and that in more than half of the nearest neighborpairs the peripheries of the complexes are separated by less than2 Å.
2. Simulation of Energy Migration Dynamics. We haveextended our Monte Carlo simulations of the polymer structureto model the excited-state energy migration dynamics. Similarmethods have been implemented to simulate energy migrationin other systems.38,88 The output of the computer model is anemission transient that is directly comparable to our experimentaldata, and thus there is a direct link between the simulations,which provide insight into the dynamics at the molecular level,and the experimental observations. The simulations start witha structure selected at random from a 300 K thermal ensemblegenerated by the Monte Carlo simulation. Each site is randomlyassigned to be either a Ru or Os complex with a probability of17/20 and 3/20, respectively. To be consistent with the experi-ment, the PS-Ru20 homopolymer fraction is set to be 10%.
(88) Hisada, K.; Ito, S.; Yamamoto, M.Langmuir1996, 12, 3682-3687.
Figure 9. Metal-metal pair distribution function calculated fromMonte Carlo simulations of the polymer structure. nn and nnn refer tothe nearest neighbors and next nearest neighbors, respectively.
10344 J. Am. Chem. Soc., Vol. 123, No. 42, 2001 Fleming et al.

The macro structure of the polymers is such that there is arange of separations between adjacent complexes, and thus theRu*fRu and Ru*fOs energy transfer steps are not describedby a single rate constant, but rather a distribution of rateconstants. For a given polymer structure and Ru/Os loadingconfiguration, the rate constants for energy transfer betweenpairs of metal centers are calculated based on the physicalseparation between the complexes, i.e.
where the first and second expressions apply to Ru*fRu andRu*fOs energy transfer,Rij is the separation between siteiand sitej, ko is the rate constant at closest contact, andâ is anattenuation parameter. This definition assumes that the electroniccoupling between the donor and acceptor arises from a directorbital overlap.
A migration “trajectory” is started by randomly choosing oneof the metal sites as the initial location of the excited state.Each trajectory is comprised of a series of steps in which a Ruexcited state either hops to another site (with a rate constant ofkij
Ru or kijOs) or decays to its ground state at a rate given by the
Ru excited-state lifetime,kemRu. Each step is calculated by using
a stochastic kinetic algorithm adapted from Gillespie,89 thedetails of which are presented in the Appendix. Once energytransfer to an Os site occurs, energy migration is halted (i.e.Os*fRu energy transfer is not allowed), and the Os excitedstate decays to the ground state at a rate given by the Osemission lifetime,kem
Os. About 5 million trajectories are calcu-lated starting with different chain structures and Ru/Os loadingconfigurations.
There are six rate constant parameters that enter into thesimulation: k0
Ru, k0Os, âRu, âOs, kem
Ru, and kemOs. The last two
parameters, the Ru and Os complex emission rates, are measuredin separate experiments on the PS-Ru20 and PS-Os20 homopoly-mers to be 1000 and 49 ns, respectively. In the simulation theseare treated as fixed parameters. The attenuation parameters,âRu
and âOs, reflect the decrease in the exchange integral withincreasing donor-acceptor distance. The attenuation parametersfor Ru*fRu and Ru*fOs are expected to be similar to eachother, and thus for simplicity the two are taken to have the samevalue, i.e.âRu ) âOs ) â. Although we do not know the exactvalue for the attenuation parameter, we can identify a typicalrange of values based on studies of energy transfer in othersystems.
In many instances the magnitude ofâ has been estimatedbased on the distance dependence of the through-space energytransfer rate constants. Yamamoto and co-workers88,90-92 in-vestigated methylene-linked donor-acceptor complexes basedon organic chromophores embedded in frozen solutions, poly-methyl-methacrylate (PMMA) resins, and Langmuir-Blodgettfilms. They find â for intramolecularenergy transfer to be inthe neighborhood of 1.7-2.1 Å-1, which is quite similar to theattenuation parameters measured forintermolecular energytransfer in similar materials.93,94There are also examples in theliterature involving donor-acceptor assemblies based on transi-
tion metal coordination complexes. Elliott and co-workers95
examined a rigidly linked Ru(II)/Fe(II) complex in fluidsolutions, and concluded that energy transfer proceeded bymeans of a through-space Dexter mechanism with an attenuationparameter of 2.0 Å-1. Ohno and co-workers96 investigatedenergy transfer in Ru(bpy)3
2+ crystals doped with Os(bpy)32+,
and in that system, they estimate the attenuation parameter tobe about 1.2 Å-1, although even they remark that this value issomewhat low compared to the typically observed values. Ifwe use these systems as a guidepost, they suggest thatâ shouldfall in the neighborhood of 1.2-2.1 Å-1.
One limitation of this model is that the same polymer structureis used throughout the entire migration trajectory. This is clearlynot the case in the experiment, especially for trajectories thatspan hundreds of nanoseconds. It is possible that the relativemotion between complexes may facilitate energy migration, andby performing simulations on a “frozen” structure, this aspectof the dynamics is omitted. At the moment it is not clear howlarge this effect will be. Because of the dense loading, the spacebetween the peripheries of the complexes is relatively smalland thus large changes in the separation between nearestneighbors is probably not occurring to a great extent. Whatmight be taking place, on the other hand, is that the identity ofthe nearest neighbors may be changing with time. Although eachcomplex has 4-5 nearest neighbors, because of the exponentialfall off in the rate constant with separation, only 1-3 of theseare “connected” to the excited state through energy transfer.As the complexes move relative to each other some of theseconnections will be broken and new ones will be formed. Therole that this plays in the energy migration process is currentlyunder investigation and will be presented in a forthcomingpublication.
3. Simulation Results.Since we cannot identify a uniquevalue for the attenuation parameter, we have performed simula-tions for a range ofâ values between 1.2 and 2.1 Å-1. Thespecific values investigated are listed in Table 1.
The simulation generates two emission transients: one forthe Os growth and one for the Ru decay. These two transientswere fit to the experimental data. For a givenâ, this wasaccomplished by adjusting onlyk0
Ru andk0Os. The Ru transient
was compared directly with the time-resolved emission detectedat 640 nm, and the Os transient was compared to the emissiondetected at 780 nm, with the Ru contribution removed (SectionC-1). The “goodness of fit” was determined by eye with specialemphasis placed on the rise and rollover part of the transient(first 50-100 ns), the rational being that the majority of
(89) Gillespie, D. T.J. Phys. Chem.1977,81 (25), 2340-2361.(90) Hisada, K.; Ito, S.; Yamamoto, M.J. Phys. Chem. B1997,101,
6827-6833.(91) Katayama, H.; Ito, S.; Yamamoto, M.J. Phys. Chem.1992, 96,
10115.(92) Katayama, H.; Maruyama, S.; Ito, S.; Tsujii, Y.; Tsuchida, A.;
Yamamoto, M.J. Phys. Chem.1991,95, 3480.
(93) Kobashi, H.; Morita, T.; Mataga, N.Chem. Phys. Lett.1973,20,376.
(94) Strambini, G. B.; Galley, W. C.J. Chem. Phys.1975,63, 3467.(95) Larson, S. L.; Hendrickson, S. M.; Ferrere, S.; Derr, D. L.; Elliott,
C. M. J. Am. Chem. Soc.1997,119, 9937. The value for the attenuationparameter,â, should be multiplied by 2.302.
(96) Tsushima, M.; Ikeda, N.; Nozaki, K.; Ohno, T.J. Phys. Chem. A2000,104, 5176.
kijRu(Rij) ) ko
Ru exp(-âRuRij) (8a)
kijOs(Rij) ) ko
Os exp(-âOsRij) (8b)
Table 1. Monte Carlo simulation parameters (k0Ru andk0
Os) thatyield best agreement between experiment and simulation fordifferent values of the attenuation parameter,â and the mostprobable Ru*fRu and Ru*fOs energy transfer times that areobtained from distributions like those shown in Figure 11
â (Å-1) k0Ru (ns-1) k0
Os (ns-1) τmaxRu τmax
Os
1.2 0.370 2.86 4.0 0.631.3 0.588 3.33 2.5 0.501.5 0.800 4.00 1.6 0.401.7 1.250 5.00 1.0 0.321.9 2.220 5.00 0.6 0.32
Ultrafast Excited-State Energy Migration Dynamics J. Am. Chem. Soc., Vol. 123, No. 42, 200110345

sensitization events are occurring in this time window and shouldbe weighted accordingly.
A comparison of the simulation results (obtained withâ )1.5 Å-1) with the experimental data is shown in Figure 10. Thetime axis is plotted on a log scale to better represent both theshort and long time aspects of the data. In both the Ru and Oscases there is excellent qualitative agreement between thesimulation-generated transients and the experimental data.Overall, the agreement obtained with the otherâ values listedin Table 1 is qualitatively similar to that shown in Figure 10.Thus, we are unable to eliminate any of theâ values listed inthe table based solely on the inability of the simulation toreproduce the experimental data. This is not universally true,however, as there are some values of the attenuation parameterthat do not reproduce the experimental data. We also examinedâ values outside this range and found that in general the qualityof the fit deteriorates whenâ is less than 1.0 Å-1 or greaterthan 2.1 Å-1. Reasonable agreement can be achieved withâ )2.1 Å-1; however, the results are physically unreasonable (k0
Ru
> k0Os), and for this reason this value is omitted from the table.
The kinetics of the energy migration process are largelydetermined by the energy transfer rate constants that connectthe metal centers. The distribution of the Ru*fRu and Ru*fOsenergy transfer rate constants is displayed in Figure 11, for thecase whereâ ) 1.5 Å-1. Both distributions are highlyasymmetric, with the larger rate constants (faster hopping times)
occurring more often. For the distributions shown in Figure11, the most probable hopping timessdenoted byτmax
Ru andτmax
Os sare 1.6 and 0.4 ns, respectively. It is interesting to notethat the most probable Ru*fOs hopping time is similar inmagnitude to the fast (400 ps) component observed in the riseof the sensitized Os emission (Section C-1), supporting theassignment that the fast kinetic component is due to Os sen-sitization by Ru excited states that are formed directly adjacentto Os traps. Displayed in Table 1 are the most probable hoppingtimes observed for eachâ. The Ru*fOs energy transfer timesare fairly insensitive to the value used for the attenuationparameter. This is not the case for the Ru*fRu rate constantdistribution, which shows a decrease in the hopping time withincreasingâ. The explanation for this trend is fairly simple.
As â is increased, the average distance that an excited Rustate can transfer on any given step is reduced. Hence, there isa definite correlation betweenâ and the average number of hopsan excited state takes before sensitization. The distribution ofthe number of Ru*fRu hops that take place prior to sensitiza-tion is shown in Figure 12. Only migration trajectories thatterminate in the sensitization of an Os site are included in this
Figure 10. Comparison between the experimental data and theemission transients calculated by the simulation. The experimental Ostransient corresponds to the emission detected at 780 nm minus thecontribution from the Ru emission at that wavelength. The Ru transientis the emission detected at 640 nm.
Figure 11. Distribution of rate constants for Ru*fRu and Ru*fOsenergy transfer observed during the Monte Carlo simulation.
Figure 12. Distribution in the number of energy transfer jumpsobserved during a given trajectory.N ) 1 corresponds to a singleRu*fOs step.N > 1 corresponds to (N - 1) Ru*fRu migration stepsfollowed by one Ru*fOs step.
10346 J. Am. Chem. Soc., Vol. 123, No. 42, 2001 Fleming et al.

distribution. The most probable number of hops occurs atN )1, which corresponds to trajectories comprised of only theRu*fOs energy transfer step. Although this prompt sensitizationprocess is the most probable, it does not imply that Ru*fRuenergy migration is a minor component. Quite the contrary, thedistribution has a long tail that extends to largeN, indicatingthat there are some trajectories in which the excited stateundergoes as many as 100 to 1000 Ru*fRu steps. When theseare added together they account for about 80% of the totalprobability, and thus the majority of trajectories involve somedegree of Ru*fRu migration. When the attenuation parameteris increased, the distribution in the number of Ru*fRu hopsshifts toward largerN, reflecting the smaller average distanceper step.
A convenient measure of the polymer’s performance is theefficiency of a single Ru*fRu step, which can be defined interms of the average hopping time as,
The single step efficiency associated with a Ru*fRu hoppingtime on the order of 1-4 ns is in the range of 99.6-99.9%,suggesting that these polymeric systems could conduct excited-state energy over long distances without a significant loss inexcited-state population. With a 99.6% single-step efficiency,an excited state could make 100 energy transfer jumps with anexcited-state survival probability of about 65%. This increasesto 90% whenøSS is 99.9%.
IV. Summary and Implications
In this paper we present a detailed dynamics study of theexcited state energy migration that occurs following photoex-citation of a multicentered assembly based on polypyridylRu(II) and Os(II) complexes. These results demonstrate that theRu(II) derivatized polymers act as efficient “antennas” forcollecting visible light and transferring its energy along thepolymer backbone. This polymer system offers the designflexibility to readily create longer arrays, end functionalizedarrays that have a single trap or charge-separating structureplaced at one end, or nonrandom systems based on blockcopolymer architectures, all of which are currently underinvestigation in our laboratory. In addition to being soluble ina variety of nitrile solvents, it can also be embedded into plasticresins and inorganic glasses. This combined with its broadabsorption throughout the visible makes it a candidate for usein molecular scale devices and solar energy conversion applica-tions.
One path to optimizing the efficiency of these systemsinvolves increasing the rate of Ru*fRu self-exchange, for thiswill be the limiting factor in the overall efficiency of thepolymer. It is possible that the chemical structure of the Ru(II)monomer units may play a role in the energy transfer rate. Byreplacing thedab ligands withbpy we can force the MLCT
excitation to localize on themab ligand rather thandab. Weare beginning to investigate the role that the chemical structureof the monomer unit plays in the energy transfer process.
Another route to enhancing efficiency is extending theexcited-state lifetime of the Ru(II) monomer units. This can beaccomplished by ligand modification or by immersing thepolymer into rigid solvents. The use of rigid environments canincrease the Ru lifetime by a factor of 2 or more. Thus, to theextent that the energy transfer times remain the same, theincrease in lifetime afforded by the rigid solvent could greatlyenhance the overall efficiency of the molecular assemblies.Presently we are investigating the energy transfer dynamics ofthese molecular arrays doped into polymer films and silicaxerogel monoliths. These room temperature rigid solvents areattractive in terms of their ease of proccessing and long-termstability needed for potential molecular device applications.
Acknowledgment. Funding for this project was providedby the U.S. Department of Energy (DE-FG02-96ER14607) andthe Research Corporation (RI0048). We thank Dr. Dan AllenMyers from Kinston, North Carolina, whose gift to the UNC-CH Faculty Partners Fund also provided support for this project.
Appendix
The stochastic kinetic algorithm is adapted from Gillespie.89
The calculation requires the selection of two random numbers,r1 andr2, from a uniform distribution on the interval (0,1). Oneof the random numbers is used to calculate the amount of timeit will take the step to occur, i.e.
where∑k is the sum of all rate constants for all the pathways(energy transfer and deactivation) leading from the initial excitedstate; i.e.,∑k ) (ki,1 + ki,2 + ki,3‚‚‚ki,20 + kem), whereki,1 is therate constant for energy transfer fromsite i to site 1. The secondrandom number is used to determine which of the possiblepathways (e.g. energy transfer to another site, excited-statedecay, etc.) the system will follow. The probability that theexcited state will transfer tosite 1, for example, is given by
The selection of the pathway is then fairly straightforward.The interval (0,1) is divided into 20 subintervals, the sizes ofwhich are given by the probabilities for each of the 19 possibleenergy transfer pathways and excited-state deactivation. Theinterval in which the second random number,r2, lies correspondsto the pathway that the system follows. After selecting thepathway, the simulation time is increased by∆t, i.e. t ) t +∆t, and a new step is initiated.
JA016304I
∆t ) 1
∑kln(1
r1) (10)
Pi,1 )ki,1
∑k(11)
øss) 1 -⟨τRu⟩
τemRu
(9)
Ultrafast Excited-State Energy Migration Dynamics J. Am. Chem. Soc., Vol. 123, No. 42, 200110347