Testability Assessment of Aspect Oriented Software Using Multicriteria Decision Making Approaches
13
World Applied Sciences Journal 32 (4): 718-730, 2014 ISSN 1818-4952 © IDOSI Publications, 2014 DOI: 10.5829/idosi.wasj.2014.32.04.1102 Corresponding Aurthor: Pradeep Kumar Singh, Amity University Uttar Pradesh, Noida, India. 718 Testability Assessment of Aspect Oriented Software Using Multicriteria Decision Making Approaches Pradeep Kumar Singh, Om Prakash Sangwan, 1 2 Amrendra Pratap and Amar Pal Singh 1 1 Amity University Uttar Pradesh, Noida, India 1 Gautam Buddha University, Greater Noida, India 2 Abstract: Testability is an essential criterion for software quality and it is always difficult to measure. Multicriteria Decision Making (MCDM) approaches are very effectively and widely used in predicting the quality of the software. MCDM techniques are very helpful in ambiguous range of decisions. It has the ability to grip the uncertainty of pairwise comparisons. In this paper, multicriteria decision making approach has been used for qualitative assessment of aspect oriented software. MCDM approaches applied in this paper for testability predictions are Analytical Hierarchy Process (AHP), Fuzzy AHP (FAHP) and Preference Ranking Organization Method of Enrichment Evaluations (PROMETHEE-2). These approaches used for decision making through uncertainty of expert decisions. A pairwise comparison has been made based on expert judgements to a certain extent than exact numerical values. Four aspect oriented programs have been compared based on five quality attributes of software testability. Initially, the validations of software testability factors have been made through AHP. Ranking of programs are made through AHP, fuzzy AHP and PROMETHEE-2 approaches. Results show that the applied approaches are efficient and proved its suitability for the prediction of the testability of aspect oriented programs. Key words: Software Testability Aspect Oriented Programs (AOP) Aspect Oriented Software Development (AOSD) Multi Criteria Decision Making (MCDM) Controllability Observability, Built-in-test Capability Understandability and Complexity. INTRODUCTION The testability of software components can be Testability is one of the qualitative factors of software engineering and ISO has defined software Controllability: The degree to which it is possible to testability as functionality. It defines functionality as “the control all values of its individual output domain. collection of characteristics of software that bear on the effort required to authenticate the software produced” [1]. Observability: The degree to which it is possible IEEE defines it as “an activity in which a component to observe accurate output for a specified or a system is evaluated for some specific conditions, the input. results are examined and evaluation is based on some aspect of the component or the system” [2]. Built-in-Test Capability: It has the ability to test the It is also well known reality that more than 50% of the software itself. It reduces the complexity as well as total cost in the development of software is related to decreases the cost of software. It can improve the software testing activities [3]. Hence, in software controllability and observability. development life cycle, testing is the most expensive phase in terms of efforts needed, money as well as time. Understandability: The degree to which the So, it is very important to reduce the efforts and time component under test is documented or self- required for testing the software’s. explaining. determined by factors such as-
Transcript of Testability Assessment of Aspect Oriented Software Using Multicriteria Decision Making Approaches

World Applied Sciences Journal 32 (4): 718-730, 2014ISSN 1818-4952© IDOSI Publications, 2014DOI: 10.5829/idosi.wasj.2014.32.04.1102
Corresponding Aurthor: Pradeep Kumar Singh, Amity University Uttar Pradesh, Noida, India. 718
Testability Assessment of Aspect Oriented Software UsingMulticriteria Decision Making Approaches
Pradeep Kumar Singh, Om Prakash Sangwan, 1 2
Amrendra Pratap and Amar Pal Singh1 1
Amity University Uttar Pradesh, Noida, India1
Gautam Buddha University, Greater Noida, India2
Abstract: Testability is an essential criterion for software quality and it is always difficult to measure.Multicriteria Decision Making (MCDM) approaches are very effectively and widely used in predicting thequality of the software. MCDM techniques are very helpful in ambiguous range of decisions. It has the abilityto grip the uncertainty of pairwise comparisons. In this paper, multicriteria decision making approach has beenused for qualitative assessment of aspect oriented software. MCDM approaches applied in this paper fortestability predictions are Analytical Hierarchy Process (AHP), Fuzzy AHP (FAHP) and Preference RankingOrganization Method of Enrichment Evaluations (PROMETHEE-2). These approaches used for decision makingthrough uncertainty of expert decisions. A pairwise comparison has been made based on expert judgementsto a certain extent than exact numerical values. Four aspect oriented programs have been compared based onfive quality attributes of software testability. Initially, the validations of software testability factors have beenmade through AHP. Ranking of programs are made through AHP, fuzzy AHP and PROMETHEE-2 approaches.Results show that the applied approaches are efficient and proved its suitability for the prediction of thetestability of aspect oriented programs.
Key words: Software Testability Aspect Oriented Programs (AOP) Aspect Oriented SoftwareDevelopment (AOSD) Multi Criteria Decision Making (MCDM) ControllabilityObservability, Built-in-test Capability Understandability and Complexity.
INTRODUCTION The testability of software components can be
Testability is one of the qualitative factors ofsoftware engineering and ISO has defined software Controllability: The degree to which it is possible totestability as functionality. It defines functionality as “the control all values of its individual output domain.collection of characteristics of software that bear on theeffort required to authenticate the software produced” [1]. Observability: The degree to which it is possible
IEEE defines it as “an activity in which a component to observe accurate output for a specifiedor a system is evaluated for some specific conditions, the input.results are examined and evaluation is based on someaspect of the component or the system” [2]. Built-in-Test Capability: It has the ability to test the
It is also well known reality that more than 50% of the software itself. It reduces the complexity as well astotal cost in the development of software is related to decreases the cost of software. It can improvethe software testing activities [3]. Hence, in software controllability and observability.development life cycle, testing is the most expensivephase in terms of efforts needed, money as well as time. Understandability: The degree to which theSo, it is very important to reduce the efforts and time component under test is documented or self-required for testing the software’s. explaining.
determined by factors such as-

World Appl. Sci. J., 32 (4): 718-730, 2014
719
Complexity: It is the quantitative measurement of thecomplexity of the program. Low complexity of anysoftware system is an indication of high quality.
The Multicriterion Decision Making (MCDM)methods are widely used for the evaluation of complexreal-world problems. It has the ability to judge differentalternatives on various criteria for selection of the bestsuitable alternatives. Experts decisions are evaluatedthrough pairwise comparisons in AHP, however due touncertainty they cannot give crisp values. Thus, AHPprocess joined with fuzzy set theory for better prediction[4]. Stewart [5], analyzed the MCDM process and Fig. 1: Decision Making Levelsneedfulness in future as (a) the practical justification andanalysis of the different available approaches (b) theexpansion of MCDM for a set of decision makingconditions and (c) dealing with uncertainty.
There are some mathematical models which are usedto simplify MCDM method are analytical hierarchyprocess (AHP), Fuzzy-AHP and preference rankingorganization method of enrichment evaluations(PROMETHEE-2). These methods are possible toimplement in solving logistic as well as technical systems.More research work is still need to shrink the spacebetween practical and theory in MCDM approach for thepossibility to solve realistic problems. Duckstein et al. [6],prepared the procedural steps for the multicriteriaapproach to choose best suitable solution from availablechoices. It can be expressed as:
Identifying the criteria for the main problem.Collection of proper data.Organization of realistic/proficient alternatives.Preparing the payoff matrix.Choosing the proper way to solve the problem.Integration of decision maker’s preferencearrangement.Selecting the best suitable alternatives for theanalysis.
We have taken four alternatives from AspectJprograms i.e. Observer (P ), Bean (P ), Marketing (P ) and1 2 3
Progress Monitor (P ) evaluated on the basis of five4
criteria which are Controllability (F ), Observability (F ),1 2
Built in test capability (F ), Understandability (F ) and3 4
Complexity (F ) to access the software testability, whose5
relationship is shown in Figure 1. These five factors fortestability have been already analyzed and theirrelationship has been reported in our previous work [9].
The detail of Aspect Oriented Programs is shown inTable 1, as shown below:
Table 1: AspectJ Programs DetailsTLOC TNOC TNOM TNOP TCC CHE
Observer (P ) 72 6 13 1 13 89151
Bean (P ) 78 2 11 1 13 151472
Marketing (P ) 145 5 22 1 27 186843
Progress Monitor (P ) 227 6 29 2 32 264674
Where, TLOC, TNOC, TNOM, TNOP, TCC and CHE aredefined as total lines of code, total no. of classes, total no.of methods, total number of packages, total cyclomaticcomplexity and cumulative Halstead effort respectively.We have already evaluated these four programs in term ofreusability using MCDM approaches in our previouswork [25]. However, this paper emphasize on testabilityassessment using the MCDM approached for AOprograms.
This paper is divided in five sections. In first section,introduction to software testability and multicriteriaapproaches are discussed. In second part, the relatedwork based on testability of software’s and multicriteriaapproach used in the prediction of quality of software isconsidered. In next section, testability model and appliedapproaches are described. In fourth section, analysis ofAspectJ programs using the MCDM approaches is carriedout. Finally, conclusion in context of considered aspectoriented programs and their testability is drawn along withfuture scope.
Related Works: Till now, very few studies which arerelated to multicriteria decision making approach has beenpublished in context to software engineering problems.Some of the important theories determine that the decisionis defined as choice of the most suitable alternative withrespect to predefined criteria [7]. In [8], Saaty proposedAHP as one of the most practical method based onMCDM. Laarhoven et al. [4] combined classical AHP withfuzzy set theory. Stewart [5] analyzed the MCDM processand their needfulness in future. Tomi et al. [10]

World Appl. Sci. J., 32 (4): 718-730, 2014
720
discussed PROMETHEE method with multicriteriadecision making for four alternatives for choosing bestsuitable ones. In [11], Behzadian et al. introduces acomplete literature study on methodologies andapplications based on PROMETHEE approach.
In addition to MCDM, there are some theories inwhich testability is taken as an important factor formaintainability.
In [12], Challa et al. proposed a quality model in Fig. 2: Software Testability Model for AO Softwarewhich maintainability is one of the factor of softwarequality model and sub-characteristics of it asanalyzability, changeability, testability, stability,maintainability compliance and track-ability. In [13], Singhand Sangwan proposed a model based on maintainabilityfor aspect oriented software. In [14], Kumar describesmaintainability as a factor in which sub-characteristics areanalyzability, changeability, testability, stability andmodularity. In [15], Santos et al. proposed maintainabilityfor aspect oriented software implementation model inwhich analyzability, changeability, testability and stabilityare taken as a sub-characteristics of maintainability. In[16], Rønningen et al. describes six quality characteristicsof the ISO 9126 in which maintainability is one of thefactor and further divided in sub-characteristics asanalyzability, changeability, testability, stability andadaptability. In [17] Sharma et al. gives a maintainabilitymodel and a comparative analysis of sub-attributes whichare testability, understandability, modifiability, stability,analyzability, changeability, conciseness, selfdescriptiveness, modularity, compliance and simplicity. In[18], Ghosh et al. gives a comparative study ofmaintainability factors in which testability, modifiability,stability, analyzability, changeability, modularity,adaptability and many more sub-characteristics ofmaintainability are taken.
Based on review work mentioned above, it can beconcluded that testability is a sub-attribute ofmaintainability and important quality characteristics forsoftware. To evaluate the testability of software, MCDMapproaches may also be applied for qualitative andquantitative assessment. Based on MCDM, bestalternatives can be chosen, while selecting softwareamong multiple available choices in context to testability.So, we have considered four aspects programs to choosetheir testability based on MCDM approaches for analysis.
MATERIALS AND METHDS
As we have identified five factors to assesstestability for aspect oriented programs. A relationshipbetween identified factors and software testability is
Table 2: The Saaty Rating Scale [8]Intensityofimportance Definition Explanation1 The same importance Objective is donated by two
factors equally.3 Rather more important Judgements are slightly supported
one over the other.5 Much more important Experience and Judgement
strongly support one over theother.
7 Very much more Experience and Judgement veryimportant strongly favor one over the other.
9 Absolutely more Judgements are highly favor oneimportant. over the other.
2, 4, 6, 8 IntermediaryValues Where cooperation is needed.
shown in Figure 2. Testability is considered as the mainsub-characteristic of maintainability in several studies.However, in order to evaluate testability as a main and animportant sub-characteristic, we have applied amulticriteria decision making approach on the proposedmodel as show below:
Analytical Hierarchy Process (AHP): The AnalyticalHierarchical Processing (AHP) firstly introduced by Saatyand tells how to make a decision using AHP [19]. Initiallyconsumers of AHP make a hierarchy of factors todecompose their decision problem. Each of them can beevaluated autonomously to build the hierarchy. Tahiriet al. [20], determine different factors by comparing themaccording to their impact on the factors in the hierarchyusing AHP. AHP is used to quantify the significance ofthe factors. There are 25 professionals involved injudgement to formalize the significance of every factor.Every judgement are based on a scale and assigned anumber. A common scale by Saaty is shown in Table 2.
The Steps to Carry out the Ahp Process Are as Follows:Reciprocal Matrix: First, a pairwise comparisonmatrix has been constructed based on the factors. Everyfactor needs to compare with the immediate next factor[20].

1
n
1 1 1
F 12 1n
ij 2 12 2nF
1n 2n
F F . F1 m . m
A = m = F 1/m 1 . m. . . .
1/ m 1/ m . 1
max max, andA n= ≥
max1
nCIn
−=
−CICRRI
11 12 1
21 22 2
1 2
.
.. . . .
.
k
k
k k kk
a a aa a a
a a a
World Appl. Sci. J., 32 (4): 718-730, 2014
721
Eigen Vector: Next, we have to evaluate the relativeweights of the factors, which are relevant to the problemis called an eigenvector [21].
Consistency Index: Now, we have to evaluateConsistency Index (CI) for that matrix using ( max-n)/(n-1) [21].
Consistency Ratio: Finally, we have to evaluateconsistency ratio (CR) using CI divided by averageconsistency index (RI).
A necessary hypothesis, if factor F has much more1
importance than factor F then its value becomes 5 and F2 2
importance is less than F then its value will be 1/5. All1
pair wise comparisons are achieved through the factors,generally not exceeding to 7. Next, we have to measuretherelative weights and importance of the factors. Finally, wehave to evaluate consistency ratio (CR) to see theconsistency of the judgements. If the value of CR > 0.1,then judgements are unreliable.
Suppose for n number of factors, F , F ….F are1 2 n
considered, which are to be compared. Relative weight ofF relating to F denoted as m and a square matrix A = [m ]i j ij ij
of order n will be formed as given in equation (1.1).
Here, m =1/m and i does not equal to j and m =1 for allij ji ii
i. Hence the calculated matrix is known as reciprocalmatrix.
Human judgements are inconsistent. In this situation,find eigenvector satisfying (1.2) as:
(1.2)
Where, is eigen vector and is eigen value. Themax
difference between eigen value and n is the inconsistencyof the judgements. Saaty [19], suggested a ConsistencyRatio (CR) and Consistency Index (CI) and evaluated as:
(1.3)
(1.4)
Table 3: Fuzzy values used for making qualitative assessmentsFuzzy Values Triangular Membership Function1 (1, 1, 3)X (x-2, x, x+2) for x = 3, 5, 79 (7, 9, 11)
Where, RI is the average consistency index. Saatyproposed that if the CR > 0.1, the judgements may not beconsistent and unreliable. In this situation, a newcomparison matrix is needed to set up until CR < 0.1. Thisway we can apply the AHP for predicting a decisionbased on available choices at hand.
A Fuzzy AHP Multicriteria Approach for ProgramSelection [22]: In [9], Laarhoven et al. suggested theFuzzy AHP in 1983, which was an application of themixture of Analytic Hierarchy Process (AHP) and Fuzzyset theory. It converts the judgements of professionalsfrom earlier specific values to fuzzy numbers andmembership functions, triangular fuzzy numbers used forpair wise comparison of matrices to construct Fuzzy AHP.In this section, applicability of FAHP is discussed indetail.
Basic Methodology of FAHP: We have taken triangularfuzzy numbers for the evaluation. Fuzzy values are easilyused in articulating the judgements based on theassessment of quality for testability. For the pair wisecomparisons, triangular fuzzy numbers defined in Table 3are used.
The multicriteria decision problem generally consistsof following; (a) a number of alternative i.e. A (i = 1, 2,...,i
n), (b) assessment on set of criteria C (j = 1, 2,..., m), (c) aj
quantitative or qualitative assessment x (i = 1, 2,..., n; j =ij
1, 2,..., m) represent every alternative A relating to everyi
criterion C , used to make the decision matrix forj
alternatives, last (d) a weight vector W = (w , w ,...,w ) i.e.1 2 m
weights of criteria represent the significance forcriteriaevaluation relating to the whole problems inachieving main objective. Steps required for the appliedalgorithm are as follows:
Step 1: Prepare the problem like an multi attribute problemfor identifying the hierarchical structure.
Step 2: Establish the decision matrix (1.8) using (1.5) to(1.7) and Table 1.
C or W= , (1.5)j

1
1 1
,
k
lss
k k
lsl s
a
a
=
= =
∑
∑∑11 12 1
21 22 2
1 2
.
.. . . .
.
m
m
n n nm
a a aa a a
a a a
1 11 2 12 1 1
1 1 2 2
1 1 2 2
.
.j j n n
i i ij n in
m m j mj n mn
w r w r w r w rw r w r wjr w r
w r w r w r w r
11 11 12 12 1 1
21 21 22 22 2 2
1 1 2 2
, , ,
, , ,,
, , ,
l r l r ml mr
l r l r ml mr
n l n r n l n r nml nmr
Z Z Z Z Z Z
Z Z Z Z Z ZZ
Z Z Z Z Z Z
=
' ' '
' ' '
' ' '
11 12 1
21 22 2
1 2
.
. ,. . . .
.
m
m
n n nm
Z Z Z
Z Z Z
Z Z Z
'
' 2( )1
ZijZij n Zi ij
=∑ =
11 12 1
21 22 2
1 2
.
.. . . .
.
m
m
n n nm
Z Z ZZ Z Z
Z Z Z
1 2
1 2
( , ),
( , ),m
m
A Z Z ZA Z Z Z
+ + + +
− − − −
=
=
1 2
1 2
max( , ),
min( , ),j j nj
j j nj
Z Z Z Z
Z Z Z Z
+
−
=
=
,max( , )
i ii
i i i i
A ASA A A A
++
+ +=
,max( , )
i ii
i i i i
A ASA A A A
−−
− −=
,i
i i
SPS S
+
+ −=+
World Appl. Sci. J., 32 (4): 718-730, 2014
722
Where, Step 7: Evaluate the normalized performance matrix (1.14)
(1.6) (1.13)
X or w = (1.7) (1.14)ij j
X = (1.8) Step 8: Obtain the positive ideal result as well as the
Step 3: Find a weight vector (1.9) for each criteria using(1.5) to (1.7). Where,
W = (w , w w ), (1.9) (1.16)1 2… m
Step 4: Establish the fuzzy performance matrix (1.10) withthe help of (1.8) multiplied by (1.9). Step 9: Compute the level of likeness among every
Z = (1.10) (1.17)
Step 5: Find the interval performance matrix (1.11) with thehelp of an -cut on (1.10) obtained in Step 4.
(1.11) (1.19)
Step 6: Obtain the crisp performance matrix (1.12) by performance index values in the downward order.including the decision maker’s mind-set in the possibilityrepresented by confidence index k. A Preference Ranking Organization Method of
PROMETHEE-2 is a MCDM process for ranking. A
(1.12) criteria j. We have used usual criterion for their simplicity
using (1.13).
negative ideal result using (1.15) and (1.16).
(1.15)
alternative and the positive ideal result as well as thenegative ideal result by (1.17) and (1.18).
(1.18)
Step 10: Obtain the whole performance index for everyalternative using (1.19):
Step 11: Order the alternatives using their equivalent
Enrichment Evaluations (PROMETHEE-2) [23]:
preference function P (a, b) used in this process whichj
depends on the pair wise comparison d within thej
computations f (a) and f (b) of alternatives a and b forj j
for our analysis as shown in below Figure 3:

( , )1( , )
1
jw P a bj j
ja b jw j
j
∑==
∑=
( , )( )
( 1)
a bAa
N
∑+ =
−
( , )( )
( 1)
b aAa
N
∑− =
−
( ) ( ) ( )a a a+ −= −
World Appl. Sci. J., 32 (4): 718-730, 2014
723
Fig. 3: Usual Criteria Analyzability (A ), Changeability (A ), Testability (A ),
Here H (d ) represents preference function p (a, b). conducted on 25 professional from academia, industryj j
If d has positive number then it is represented as 1 and research scholars. Considered experts are those, whoj
otherwise 0. Mathematical analysis of preference function have either good knowledge of OO and AO technology orand its relationship with d for usual criteria function is are doing their research in AO development. Survey formj
shown in above Figure 3. was provided to all the experts. The survey form consistMulticriteria preference index (a, b) and P (a, b) as a square matrix for filling pair-wise relative weight valuesj
an average weight preference function for criteria is of factors. Firstly, square matrix is to fill pair-wise relativeshown below: weight values of these five factors A to A . The mean of
(1.20) is prepared using equation (1.1) to apply AHP process.
(1.21)
(1.22)
(1.23)
Where, w is weight of the criteria j; (a) is thej+
outranking index for N set of alternatives; Determining Eigen Vector and Eigen Values: Eigen-
(a) = Outranked index of a in the alternatives set N; (a) vector can be calculated by multiplying all the values inis the net rankingfor N set of alternatives; j = number of every row of the matrix A. The n root (in our case 5criteria. The higher value of (a) is an indicator of the root) of the product helps in getting excellent estimationbest suitable alternative. to the acceptable result. The values are given in Table 4.
Evaluation and Analysis of Aspectj Programs Using vector and the addition should be 1.0. The 5 root of firstMcdm Approaches: In previous section, we have row is 0.526 and this is divided by 5.458 gives 0.096 as thediscussed all three popular approaches of MCDM i.e. first value in the eigen vector shown in Table 4. ThusAHP, FAHP and PROMETHEE-2 respectively. In this Eigen vector of the relative importance of A , A , A , Asection, we will apply these approaches on AspectJ and A are 0.096, 0.165, 0.353, 0.211 and 0.175,programs to select the best suitable choice in order to respectively, which are given in Table 4. These values areestimate their testability. weights of main factors i.e. Analyzability (0.096),
Assesment of Aspectj Programs Using AHP: Firstly, and Modularity (0.175). Here based on the estimatedAHP is applied on the software testability relationship values for attributes, it is clearly shown that A i.e.model shown in Figure 2 for Aspect Oriented Software. Testability is the most important factor in software
AHP for Maintainability of Aspectj Programs: Accordingto figure 2, we will first calculate the importance of eachfactor related to maintainability using AHP, thereaftertestability has been computed.
Allocating the Weights to Factors: In order to assignweights to factors of software maintainability i.e.
1 2 3
Stability (A ) and Modularity (A ), a survey has4 5
1 5
collected samples of pair-wise relative weights are givenin square matrix A = [m ] given in equation (1.24), whichij
Next step is to determine Eigen vector and Eigenvalues to get corresponding weights of A , A , A , A and1 2 3 4
A and consistency ratio (CR).5
(1.24)
th th
The summation of n root is used to normalize the eigenth
th
1 2 3 4
5
Changeability (0.165), Testability (0.353), Stability (0.211)
3
World Appl. Sci. J., 32 (4): 718-730, 2014
724
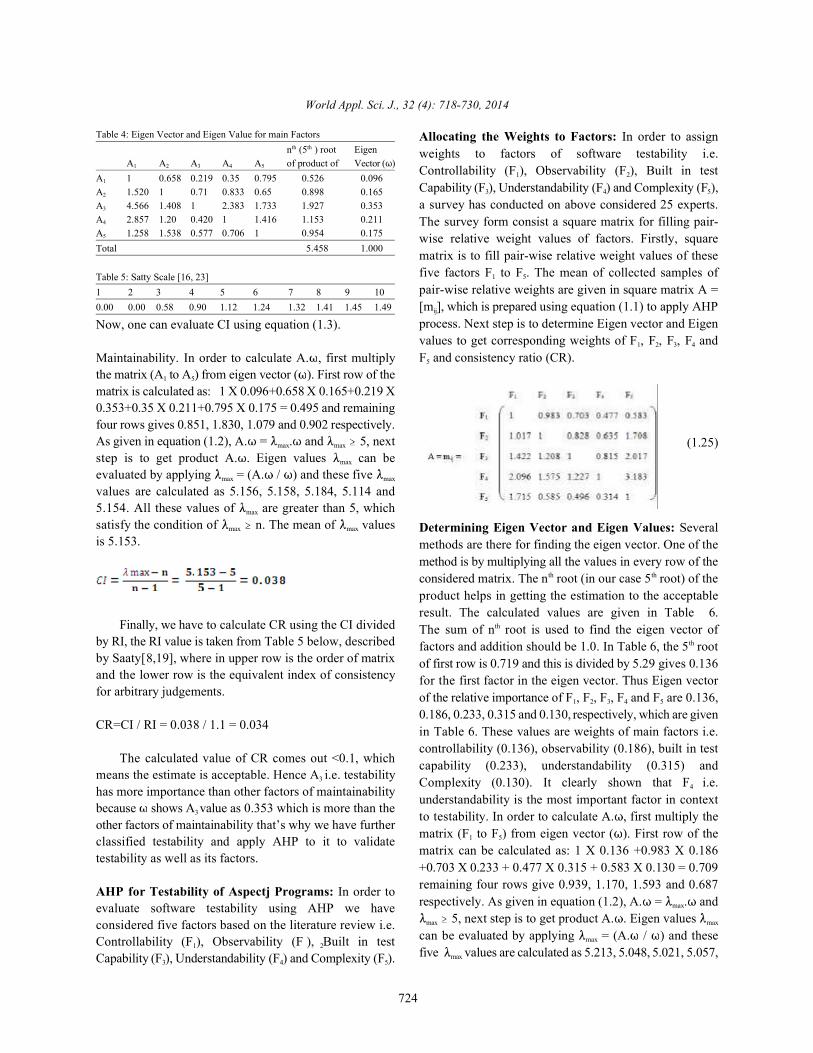
Table 4: Eigen Vector and Eigen Value for main Factorsn (5 ) root Eigenth th
A A A A A of product of Vector ( )1 2 3 4 5
A 1 0.658 0.219 0.35 0.795 0.526 0.0961
A 1.520 1 0.71 0.833 0.65 0.898 0.1652
A 4.566 1.408 1 2.383 1.733 1.927 0.3533
A 2.857 1.20 0.420 1 1.416 1.153 0.2114
A 1.258 1.538 0.577 0.706 1 0.954 0.1755
Total 5.458 1.000
Table 5: Satty Scale [16, 23]1 2 3 4 5 6 7 8 9 100.00 0.00 0.58 0.90 1.12 1.24 1.32 1.41 1.45 1.49
Now, one can evaluate CI using equation (1.3).
Maintainability. In order to calculate A. , first multiplythe matrix (A to A ) from eigen vector ( ). First row of the1 5
matrix is calculated as: 1 X 0.096+0.658 X 0.165+0.219 X0.353+0.35 X 0.211+0.795 X 0.175 = 0.495 and remainingfour rows gives 0.851, 1.830, 1.079 and 0.902 respectively.As given in equation (1.2), A. = . and 5, nextmax max
step is to get product A. . Eigen values can bemax
evaluated by applying = (A. / ) and these five max max
values are calculated as 5.156, 5.158, 5.184, 5.114 and5.154. All these values of are greater than 5, whichmax
satisfy the condition of n. The mean of valuesmax max
is 5.153.
Finally, we have to calculate CR using the CI dividedby RI, the RI value is taken from Table 5 below, describedby Saaty[8,19], where in upper row is the order of matrixand the lower row is the equivalent index of consistencyfor arbitrary judgements.
CR=CI / RI = 0.038 / 1.1 = 0.034
The calculated value of CR comes out <0.1, whichmeans the estimate is acceptable. Hence A i.e. testability3
has more importance than other factors of maintainabilitybecause shows A value as 0.353 which is more than the3
other factors of maintainability that’s why we have furtherclassified testability and apply AHP to it to validatetestability as well as its factors.
AHP for Testability of Aspectj Programs: In order toevaluate software testability using AHP we haveconsidered five factors based on the literature review i.e.Controllability (F ), Observability (F ), Built in test1 2
Capability (F ), Understandability (F ) and Complexity (F ).3 4 5
Allocating the Weights to Factors: In order to assignweights to factors of software testability i.e.Controllability (F ), Observability (F ), Built in test1 2
Capability (F ), Understandability (F ) and Complexity (F ),3 4 5
a survey has conducted on above considered 25 experts.The survey form consist a square matrix for filling pair-wise relative weight values of factors. Firstly, squarematrix is to fill pair-wise relative weight values of thesefive factors F to F . The mean of collected samples of1 5
pair-wise relative weights are given in square matrix A =[m ], which is prepared using equation (1.1) to apply AHPij
process. Next step is to determine Eigen vector and Eigenvalues to get corresponding weights of F , F , F , F and1 2 3 4
F and consistency ratio (CR).5
(1.25)
Determining Eigen Vector and Eigen Values: Severalmethods are there for finding the eigen vector. One of themethod is by multiplying all the values in every row of theconsidered matrix. The n root (in our case 5 root) of theth th
product helps in getting the estimation to the acceptableresult. The calculated values are given in Table 6.The sum of n root is used to find the eigen vector ofth
factors and addition should be 1.0. In Table 6, the 5 rootth
of first row is 0.719 and this is divided by 5.29 gives 0.136for the first factor in the eigen vector. Thus Eigen vectorof the relative importance of F , F , F , F and F are 0.136,1 2 3 4 5
0.186, 0.233, 0.315 and 0.130, respectively, which are givenin Table 6. These values are weights of main factors i.e.controllability (0.136), observability (0.186), built in testcapability (0.233), understandability (0.315) andComplexity (0.130). It clearly shown that F i.e.4
understandability is the most important factor in contextto testability. In order to calculate A. , first multiply thematrix (F to F ) from eigen vector ( ). First row of the1 5
matrix can be calculated as: 1 X 0.136 +0.983 X 0.186+0.703 X 0.233 + 0.477 X 0.315 + 0.583 X 0.130 = 0.709remaining four rows give 0.939, 1.170, 1.593 and 0.687respectively. As given in equation (1.2), A. = . andmax
5, next step is to get product A. . Eigen values max max
can be evaluated by applying = (A. / ) and thesemax
five values are calculated as 5.213, 5.048, 5.021, 5.057,max

1
n
i=∑
0.14 0.56 0.19 0.57 0.23 0.51 0.31 0.51 0.31 0.3 0.116× + × + × + × + × =
World Appl. Sci. J., 32 (4): 718-730, 2014
725
Table 6: Eigen Vector and Eigen Value for main Factors Table 7: Pairwise comparison matrix of AO Programs for Controllabilityn (5 ) root Eigenth th
A A A A A of product of Vector ( )1 2 3 4 5
F 1 0.983 0.703 0.477 0.583 0.719 0.1361
F 1.017 1 0.828 0.635 1.708 0.982 0.1862
F 1.422 1.208 1 0.815 2.017 1.231 0.2333
F 2.096 1.575 1.227 1 3.183 1.668 0.3154
F 1.715 0.585 0.496 0.314 1 0.690 0.1305
Total 5.29 1.000Now, one can evaluate CI using equation (1.3).
5.285. All these values of are greater than 5, whichmax
satisfy the condition of n. The mean of valuesmax max
is 5.125.
Now, one can evaluate CI using equation (1.3).
Finally, we have to calculate CRusing the CI divided byRI, the RI value is taken from Table 5 below, described bySaaty[8,19], wherein upper row is the order of matrix andthe lower row is the equivalent index of consistency forarbitrary judgements. Now, one can evaluate CR usingequation (1.4).
CR=CI / RI = 0.031 / 1.1 = 0.028
The calculated CR value should be <0.1, which indicatesthat the estimate is acceptable. Hence the calculatedvalue of testability is now valid. For the evaluation ofquality of AO programs, we have applied AHP processon pairwise relative weights of factors from F to F one1 5
by one and Eigen Vectors of set of factors from Table 6i.e. 0.136, 0.186, 0.233, 0.315 and 0.130 respectively,totaling to 1. Now, solving the pairwise comparisonmatrix of AO programs for each factor is shown in Table7 to 11:
From the above Table 7 Eigen vectors are (0.56, 0.26,0.12 and 0.06).
From the above Table 8 Eigen vectors are (0.57, 0.26,0.12 and 0.05).
From the above Table 9 Eigen vectors are (0.51, 0.29,0.14 and 0.06).
From the above Table 10 Eigen vectors are (0.51, 0.29,0.14 and 0.06).
From the above Table 11 Eigen vectors are (0.3, 0.3,0.3 and 0.1).
Now we have to calculate overall utility of AOPrograms. The summation of the products of the weightof AO Programs with reference to each factor by the
P P P P1 2 3 4
P 1 3 5 71
P 1/3 1 3 52
P 1/5 1/3 1 33
P 1/7 1/5 1/3 14
Table 8: Pairwise comparison matrix of AO Programs for Observability
P P P P1 2 3 4
P 1 3 5 71
P 1/3 1 3 52
P 1/5 1/3 1 33
P 1/7 1/5 1/3 14
Table 9: Pairwise comparison matrix of AO Programs for Built in TestCapability
P P P P1 2 3 4
P 1 3 3 51
P 1/3 1 3 52
P 1/3 1/3 1 53
P 1/5 1/5 1/5 14
Table 10: Pairwise comparison matrix of AO Programs for Understandability
P P P P1 2 3 4
P 1 3 3 51
P 1/3 1 3 52
P 1/3 1/3 1 53
P4 1/5 1/5 1/5 1
Table 11: Pairwise comparison matrix of AO Programs for Complexity
P P P P1 2 3 4
P 1 1 1 31
P 1 1 1 32
P 1 1 1 33
P 1/3 1/3 1/3 14
weights of corresponding factor yields the global utilityof each AO Programs. For example, overall utility of P is1
computed as:
AO Program Quality = Comparative value of P *i
Weight value of F .i
U (P ) = 1
Similarly, overall utility values for other AO Programs arecomputed. The best AO Program is the one which ishaving the highest overall utility values. Accordingly,ranking of AO Programs is done which are shown inTable 12 and P1 found to be the best choice.

1 1 1 1 1 1(1 3 5 7 3 1 3 5 5 3 1 3 7 5 3 1) 31.53− − − − − −+ + + + + + + + + + + + + + + =
1 1 1 1 1 11 3 5 7 3 1 3 5 5 3 1 3 7 5 3 11 31.53 31.53 31.53 31.53
X− − − − − − + + + + + + + + + + + + =
1 1 1 1 1 1(1 3 5 7 3 1 3 5 5 3 1 3 7 5 3 1) 31.53− − − − − −+ + + + + + + + + + + + + + + =
1 1 1 1 1 11 3 5 7 3 1 3 5 5 3 1 3 7 5 3 12 31.53 31.53 31.53 31.53
X− − − − − − + + + + + + + + + + + + =
1 1 1 1 1 1(1 3 3 5 3 1 3 5 3 3 1 5 5 5 5 1) 29.59− − − − − −+ + + + + + + + + + + + + + + =
1 1 1 1 1 11 3 3 5 3 1 3 5 3 3 1 5 5 5 5 13 29.59 29.59 29.59 29.59
X− − − − − − + + + + + + + + + + + + =
1 1 1 1 1 1(1 3 3 5 3 1 3 5 3 3 1 5 5 5 5 1) 29.59− − − − − −+ + + + + + + + + + + + + + + =
1 1 1 1 1 11 3 3 5 3 1 3 5 3 3 1 5 5 5 5 14 29.59 29.59 29.59 29.59
X− − − − − − + + + + + + + + + + + + =
1 1 1(1 1 1 3 1 1 1 3 1 1 1 3 3 3 3 1) 1 9 .99− − −+ + + + + + + + + + + + + + + =
1 1 11 1 1 3 1 1 1 3 1 1 1 3 3 3 3 15 19 .99 19.99 1 9 .99 19.99
X− − − + + + + + + + + + + + + =
0.19,0.51,1.26 0.19,0.51,1.26 0.12,0.41,1.18 0.12,0.41,1.18 0.08,0.30,1.030.10,0.30,0.84 0.10,0.30,0.84 0.10,0.32,0.94 0.10,0.32,0.94 0.08,0.30,1.030.04,0.14,0.49 0.04,0.14,0.49 0.09,0.23,0.71 0.09,0.23,0.71 0.
X=08,0.30,1.03
0.03,0.05,0.24 0.03,0.05,0.24 0.03,0.05,0.23 0.03,0.05,0.23 0.03,0.10,0.44
1 1 1 1 1 1 1(1 3 3 5 3 3 1 3 3 3 3 3 1 5
1 1 13 5 3 5 1 5 3 3 3 5 1) 43.91
− − − − − − −+ + + + + + + + + + + + +
− − −+ + + + + + + + + + + =
1 1 1 1 1 1 1 1 1 11 3 3 5 3 3 1 3 3 3 3 3 1 5 3 5 3 5 1 5 3 3 3 5 143.91 43.91 43.91 43.91 43.91
− − − − − − − − − − + + + + + + + + + ++ + + + ++ + + + +
World Appl. Sci. J., 32 (4): 718-730, 2014
726
Table 12: Global overall utility and Rank of AO ProgramsGlobal
Factors F F F F F overall utility Rank1 2 3 4 5
Weights 0.14 0.19 0.23 0.31 0.13P 0.56 0.57 0.51 0.51 0.3 0.116 11
P 0.26 0.26 0.29 0.29 0.3 0.073 22
P 0.12 0.12 0.14 0.14 0.3 0.055 33
P 0.06 0.05 0.06 0.06 0.1 0.015 44
A Fuzzy AHP Multicriteria Approach for Ao ProgramsSelection: In this section four AO programs areconsidered and FAHP is applied for selection. Selectingthe best program from available programs for an AOsystem is a difficult decision making procedure where inthe whole performance of those programs desires to beestimated concerning multicriteria approach. In [24],Nagpal et al. proposed ANFIS scheme to measure theperformance of institutional websites in similar way as weare focusing on measuring the aspect programs. Howeverthey have applied ANFIS we are using MCDMapproaches. The details of programs are shown inTable 1 with fuzzy values used in Table 3. A fuzzyreciprocal judgement matrix (from F to F ) derived from1 5
the pairwise comparisons with the help the fuzzy valuesdefined in Table 7 to 11. Here, the calculations shown areonly for medium values similarly low and high values arecalculated as medium values using Table 3. The steps areas follows:
Step 1: AO programs selection problem usingMulticriteria approach and the hierarchical structure isshown in Figure 1.
Step 2: By relating (1.5) to (1.7) in reciprocal matrix, therankings (x ) for the alternatives P (i = 1, 2, 3, 4) relating toij i
every criterion F (j = 1, 2, 3, 4, 5) were calculated as:j
Summation of the middle whole matrix for F i.e. in1
Table 7 is:
Summation of the middle whole matrix for F i.e. in2
Table 8 is:
Summation of the middle whole matrix for F i.e. in3
Table 9 is:
Summation of the middle whole matrix for F i.e. in4
Table 10 is:
\
Summation of the middle whole matrix for F i.e. in5
Table 11 as:
Where,
X = (x ,x ,x ,x ), X = (x ,x ,x ,x ),1 11 21 31 41 2 12 22 32 42
X = (x ,x ,x ,x ), X = (x ,x ,x ,x ),3 13 23 33 43 4 14 24 34 44
X = (x ,x ,x ,x ).5 15 25 35 45
Same calculations are also done for low and highvalues. The resulting decision matrix of an AO programscan be evaluated by fuzzy arithmetic is:
Step 3: A fuzzy pairwise comparison to calculate therelative importance for selection criterion, ensuing in fuzzyreciprocal matrix (W) in below Table 13:
In the above Table 13, CR = 0.086 which is <0.1 thatmeans pairwise comparison is acceptable. On the basis ofTable 13 i.e. medium values, a low and high values matrixcan be constructed using Table 3.
Summation of the middle whole matrix which is shownin Table 13 is:
Calculations for the medium values of w w , w , w , w :1, 2 3 4 5

0 .0 2 0 . 0 5 0 . 2 80 . 0 5 0 .2 4 0 . 8 30 . 0 3 0 . 1 1 0 . 4 50 .1 4 0 . 4 3 1 .2 70 .0 4 0 .1 7 0 . 6 3
W
=
0.004,0.03,0.35 0.01,0.12,1.05 0.004,0.05,0.53 0.02,0.18,1.50 0.003,0.05,0.650.002,0.02,0.24 0.005,0.07,0.70 0.003,0.04,0.42 0.01,0.14,1.19 0.003,0.05,0.65
0.0008,0.007,0.14 0.002,0.03,0.41 0.003,0.03,0.32 0.01Z=
,0.10,0.90 0.003,0.05,0.650.0006,0.003,0.07 0.002,0.01,0.20 0.0009,0.006,0.10 0.001,0.02,0.29 0.001,0.01,0.28
'Z
0.11 0.33 0.16 0.47 0.190.07 0.22 0.13 0.38 0.19'0.04 0.12 0.1 0.28 0.190.02 0.06 0.25 0.09 0.08
Z
=
0.79 0.79 0.47 0.70 0.560.5 0.52 0.38 0.58 0.560.29 0.29 0.29 0.42 0.560.14 0.14 0.74 0.13 0.24
Z
=
(0.79, 0.79, 0.74, 0.70, 0.24)
(0.14, 0.14, 0.29, 0.13, 0, 56)
A
A
+=
−=
( 2 .66 , 2.66, 2.5, 3.42, 1.56 )1
(1.60 ,1.60,0.90,1.26,0.35 )2
( 2.34,2.43,1.66,2.40,0.79 )3
(0 .37,0.37 ,1.83,0.3,0.19 )4
(0 .41,0.41,0.84,0.55,3.14 )1
(1.1,1.1,1.36,0.91,3.14 )2
(0 .7,03
S
S
S
S
S
S
S
+=
+ =
+ =
+ =
− =
− =
− = .73,1.1,0.75,3.14 )
(0 .44 , 0.44, 4.67 , 0.37 , 2.91)4S−
=
(2.66,2.66,2.5,3.42,1.56)(0.87, 0.87, 0.75, 0.86, 0.33)1 (3.07,3.07,3.34,3.97,4.7)
(1.60,1.60,0.90,1.26,0.35) (0.59,0.59,0.40,0.58,0.10)2 (2.7,2.7,2.26,2.17,3.49)
(2.34,2.43,1.66,2.40,0.79)3 (3.04,3.16,
P
P
P
= =
= =
= (0.77,0.77,0.60,0.76,0.20)2.76,3.15,3.93)
(0.37,0.37,1.83,0.3,0.19)(0.46, 0.46, 0.28, 0.45, 0.06)4 (0.81,0.81,6.5,0.67,3.1)P
=
= =
World Appl. Sci. J., 32 (4): 718-730, 2014
727
Table 13: Pairwise comparison based on the criterionF F F F F Eigen Vector ( )1 2 3 4 5
F 1 1/3 1/3 1/5 1/3 0.061
F 3 1 3 1/3 3 0.232
F 3 1/3 1 1/5 1/3 0.093
F 5 3 5 1 5 0.484
F 3 1/3 3 1/5 1 0.145
Total 1.000
Table 14: Interval performance matrix (Za)F1 F2 F3 F4 F5
P1 0.02,0.19 0.07,0.59 0.03, 0.29 0.1,0.84 0.03,0.35P2 0.01, 0.13 0.04, 0.39 0.02,0.23 0.08,0.67 0.03,0.35P3 0.004,0.07 0.02, 0.22 0.02, 0.18 0.06, 0.5 0.03,0.35P4 0.002,0.04 0.006,0.11 0.004,0.05 0.01,0.16 0.006,0.15
Same calculations are also for low and high values.Final values for W are shown below:
Step 4: A fuzzy performance matrix calculated using (1.10)as:
Step 5: As an average decision and taken as 0.5.Evaluate the interval performance matrix (Z ) as inequation (1.11) by means of -cut in the performancematrix given in Table 14:
Step 6: Construct the crisp performance matrix ( ) as
inequation (1.12) by including the decision makersmind-set in the possibility represented by confidenceindex k shown in Table 14:
Step 7: Determine the normalized performance matrix as inequation (1.14) by equation (1.13):
Step 8: Identify the positive ideal result as well as thenegative ideal result using equation (1.15) and (1.16).
Step 9: Identify the extent of resemblance among everyalternative and the positive ideal result as well as thenegative ideal result by equation (1.17) and (1.18).
Step 10: Identify the whole performance index for everyalternative by (1.19):
Step 11: Order the alternatives in the downward order bytheir equivalent performance index values.
The results in Table 15 show that program P is the1
finest. Hence, it is obvious that this process caneffectively imitate the imprecision and uncertainty relatedto the decision maker’s biased judgement in humanthoughts. It also presents the decision maker’s as asuitable tool for better recognizes the decision problemsand decision manners. Results shown in Table 15 are alsosimilar to AHP ranking shown in Table 12.
A Preference Ranking Organization Method ofEnrichment Evaluations (PROMETHEE-2) for AoPrograms Selection: In this section we have also appliedthe PROMETHEE-2 on same set of considered programs

0 0.87( ) 0.9131 30.87 1P + +
=++ =
0 0.87( ) 0.9131 30.87 1P + +
=++ =
( ) 01 30
P−
= =
World Appl. Sci. J., 32 (4): 718-730, 2014
728
Table 15: Performance Index and Ranking of the AO ProgramsAO Programs Performance Index RankingP 0.87 11
P 0.59 32
P 0.77 23
P 0.46 44
Table 16: Pairwise comparison of criteria for alternativesF F F F F1 2 3 4 5
P 0.56 0.57 0.51 0.51 0.31
P 0.26 0.26 0.29 0.29 0.32
P 0.12 0.12 0.14 0.14 0.33
P 0.06 0.05 0.06 0.06 0.14
of AO for cross validation purpose. First of all a pairwisecomparison of programs is to be done on the basis ofTable 1. Pairwise comparison of AO programs is shownfrom Table 7 to 11. Pairwise comparison of programs forcriteria F , F , F , F and F i.e. controllability,1 2 3 4 5
observability, built in test capability, understandabilityand complexity respectively on the basis of Table 2 havedone and final Eigen values are shown in Table 12.
Solution methodology of PROMETHEE-2 is dividedinto various steps for the computation of net andranking pattern as explained below:
Step 1: Pairwise comparison of alternatives for everycriteria. In this case there are five criteria for whichpairwise comparison of alternatives for every criterion isto be performed. For example, for criteria F , pairwise1
difference between alternatives P and P are 0.56 - 0.26 =1 2
0.3. Similarly, pairwise difference between alternatives P1
verses P is zero as they are comparing the same. Table 171
present pairwise differences between alternatives forcriterion F .1
Similarly pairwise difference matrix andpreference function has been calculated for the criterionF , F , F and F .2 3 4 5
Step 2: Exploring preference function values for criteria F1
to F (on the basis of Figure 3 i.e. usual criteria and5
Table 16): Sample calculations are presented below withreference to P and P :1 2
Usual Criterion: Pairwise difference between alternativesP and P for criterion F is 0.56 - 0.26 = 0.3 and1 2 1
corresponding preference function value P (P , P ) is 1 (asj 1 2
0.3 is positive) and similarly for P to P pairwise difference2 1
is -0.3 and corresponding preference function value Pj (P2,P1) is taken as 0 (as negative value). In case of usualcriterion function, elements of preference function matrixare either 0 or 1.
Step 3: Computation of multicriterion preferenceIndex based on Eq. 1.20 and (P , P ) is computed as1 2
follows:Preference function values for P and P for criterion1 2
F to F are 1, 1, 1, 1 and 0. Corresponding weights of1 5
criteria are 0.14, 0.19, 0.23, 0.31 and 0.13 (AHP weights offactors of testability from Table 6). Substitution in Eq. 1.20yields,
Similarly, + (P ), + (P ), + (P ) are 0.623, 0.333 and 02 3 4
respectively.
Step 4: Computation of (as per Eq. 1.21)+
Similarly (P ), (P ), (P ) are 0.623, 0.333 and 0+ + +2 3 4
respectively.
Step 5: Computation of (as per Eq. 1.22)-
Similarly (P ), (P ), (P ) are 0, 0.29, 0.58 and 1- - -2 3 4
respectively.
Step 6: Computation of net (as per Eq. 1.23)
Net (P ) = (P ) - (P ) = 0.913 - 0 = 0.9131 1 1+ -
Similarly (P ), (P ), (P ) values for other2 3 4
alternatives are calculated. The higher value of netdenotes to the best alternative. Table 19 represents , ,+ -
net and corresponding ranking pattern of eachalternative.
It is observed from Table 19 that ranking pattern inthe order of alternatives from P to P , alternative P with1 4 1
the maximum net value is considered as the bestsuitable program. Now we conclude based on the Tables12, 15 and 19 that ranking calculated by us true and crossvalidated. These approaches can also help the softwareprofessionals in selecting the best suitable choices in termof software quality. We have taken testability as anattribute for selection among the available choices of AOprograms and found program P1 as the best suitablechoice.

World Appl. Sci. J., 32 (4): 718-730, 2014
729
Table 17: Pairwise difference matrix and preference function values for F1
Alternatives P P P P1 2 3 4
P 0 (0) 0.3 (1) 0.44 (1) 0.5 (1)1
P -0.3 (0) 0 (0) 0.14 (1) 0.2 (1)2
P -0.44 (0) -0.14 (0) 0 (0) 0.06 (1)3
P -0.5 (0) -0.2 (0) -0.06 (0) 0 (0)4
Table 18: Multicriteria Preference Index Values
P P P P1 2 3 4
P 0 0.87 0.87 11
P 0 0 0.87 12
P 0 0 0 13
P 0 0 0 04
Table 19: , , net and ranking pattern of each alternative+ -
Alternatives Net Rank+ -
P1 0.913 0 0.913 1P 0.623 0.29 0.333 22
P 0.333 0.58 -0.247 33
P 0 1 -1 44
CONCLUSION
Present work relates the analysis of four aspectoriented programs based on the factors of softwaretestability i.e. controllability, observability, built in testcapability, understandability and complexity bypairwise comparison of factors and as well as programs.The evaluation is based on the Multicriteria decisionmaking (MCDM) approaches that are analytical hierarchyprocess (AHP), Fuzzy AHP and PROMETHEE-2. Firstly,the validation of testability has been made through AHPas a main sub characteristic of maintainability. Thereafter,validation of all factors of software testability has beenmade. The relative weight values taken through a surveybased on 25 experts of the domain area and mean of thevalues have been taken as a sample. From the abovecalculations of AHP which is applied on testability, it hasfound that understandability is the most important factorof software testability. In fuzzy AHP and PROMETHEE-2approaches a pairwise comparison of programs has beenevaluated and ranked accordingly. From thesemeasurements of programs, P i.e. Observer program1
found to be best. Hence, fuzzy AHP and PORMETHEE-2are efficiently used for testability of aspect orientedprograms and choosing the best ones. These approachescan be adopted by software professionals to choose thebest suitable software in term of quality attribute. In thesimilar way quality attributes can be quantitativelymeasured using MCDM approaches and help in selectingbest suitable choice for use.
In future these programs results can further be crossvalidated using the design metrics and other approachesin term of maintainability for real life projects too. Neuralnetworks, support vector machine, TOPSIS approachescan be considered for the evaluation of similar resultsfrom multiple dimensions. Software practitioners can usethe proposed approach for selecting the appropriateprogram in term of software testability for AO software.In future similar approaches may be used to evaluate theother quality attributes for Aspect Oriented Software.
ACKNOWLEDGMENT
We would like to express our sincere gratitude towardthe faculties of Amity University and Gautam BuddhaUniversity for helping us in refining the objectives andboth universities for providing us research environmentand facilities. We also like to thank Dr. Arun Sharma,Professor and Head, KIET Ghaziabad, India for hisvaluable suggestions and review comments for thismanuscript.
REFERENCES
1. Bruntink, M. and A.V. Deursen, 2004. PredictingClass Testability using Object-Oriented Metrics,Published in proceedings of 4 IEEE Internationalth
Workshop on Source Code Analysis andManipulation, pp: 136-145, Chicago, US.
2. IEEE Standard Glossary of Software EngineeringTerminology, IEEE, 1990.
3. Mary, J.H., 2000. Testing: a Roadmap, Published inproceedings of the Conference on The Future ofSoftware Engineering, pp: 61-72, Limerick, Ireland.
4. Laarhoven, P.J.M. and W. Pedrycz, 1983. A FuzzyExtension of Saaty’s Priority Theory, Fuzzy SetSystems, 11: 229-241.
5 Stewart, T., 1992. A Critical Survey on the Status ofmultiple Criteria Decision Making Theory andPractice, Omega, 20: 569-586.
6. Duckstein, L., A. Tecle, H. P. Nachnebel, B. F. Hobbs,1989. Multicriteria Analysis of Hydropoweroperation, Journal of Energy Engineering,115(3): 132-153.
7. Koontz, H. and H. Weihrich, 1990. Essentials ofManagement, McGraw-Hill publishing company,Fifth Edition.
8. Saaty, T.L., 2008. Decision Making with the AnalyticHierarchy Process, International Journal of ServicesSciences, 1(1): 83-98.

World Appl. Sci. J., 32 (4): 718-730, 2014
730
9. Singh, P.K., O.P. Sangwan, A. Pratap and A.P. Singh, 16. Rønningen, E. and T. Steinmoen, 2004. Metrics for2014. An Analysis on Software Testability and Aspect-Oriented Programming of middlewareSecurity in Context of Object and Aspect Oriented systems, Department of Computer and InformationSoftware Development, International Journal of Science (IDI), Norwegian University (NTNU),Security and Cybercrime, Romania, 3(1): 17-28. Trondheim.
10. Tomi Vojislav, Marinkovi Zoran and Janoševi 17. Sharma, V. and P. Baliyan, 2011. MaintainabilityDragoslav, 2011. PROMETHEE Method Analysis of Component Based Systems, InternationalImplementation with Multi-criteria Decisions, Journal of Software Engineering and Its Applications,FactaUniversitatis series: Mechanical Engineering, 5(3): 107-117.9(2): 193 - 202. 18. Ghosh, S., S.K. Dubey and A. Rana, 2011.
11. Behzadian, M., R.B. Kazemzadeh, A. Albadvi and Comparative Study of the Factors that AffectM. Aghdasi, 2010. PROMETHEE: A Comprehensive Maintainability, International Journal on Computerliterature Review on Methodologies and Science and Engineering (IJCSE), 3: 12.Applications, European Journal of Operation 19. Saaty, T.L., 1990. How to make a decision: TheResearch, 200(1): 198-215. Analytical Hierarchy Process, European Journal of
12. Challa, J.S., A. Paul, Y. Dada, V. Nerella, Operation Research, 48: 9-26, New Holland.P.R. Srivastava and A.P. Singh, 2011. Integrated 20. Tahiri, F., M.R. Osman, A. Ali and R.M. Yusuff, 2008.Software Quality Evaluation: A Fuzzy Multi-Criteria AHP Approach for Supplier Evaluation and SelectionApproach, Journal of Information Processing in a Steel Manufacturing Company, 1(2): 54-76.Systems, 7(3): 473-518. 21. Coyle, G., 2004. The Analytic Hierarchy Process
13. Singh, P.K. and O.P. Sangwan, 2013. Aspect Oriented (AHP), Practical Strategy, Open Access Material,Software Metrics Based Maintainability Assessment: Pearson Education.Framework and Model, published in proceeding's of 22. Deng, H., 1999. Multicriteria Analysis with FuzzyConfluence-2013, The Next Generation Information Pairwise Comparison, International Journal ofTechnology Submit, Amity University, Noida, India. Approximate Reasoning, 21: 215-231.
14. Kumar, A., P.S. Grover and R. Kumar, 2009. 23. Raju, S.K. and N.D. Kumar, 2010. MulticriterionA Quantitative Evaluation of Aspect-Oriented Analysis in Engineering and Management, PHISoftware Quality Model (AOSQUAMO), ACM Publication, pp: 103-107.SIGSOFT, Software Engineering Notes. 34(5): 1-9. 24. Nagpal, R., D. Mehrotra, A. Sharma and P. Bhatia,
15. Santos, R.P., H.A.X. Costa, P.A.P. Júnior, 2013. ANFIS method for usability assessment ofA.F. Amâncio, A.M.P. Resende and C.M.L. Werner, website of an Educational Institute, World Applied2008. An Approach Based on Maintainability Criteria Sciences Journal, 23(11): 1489-1498.for Building Aspect-Oriented Software 25. Singh, P.K., O.P. Sangwan, A. Pratap and A.P. Singh,Implementation Model, INFOCOMP Journal of 2014. A Quantitative Evaluation of Reusability forComputer Science, Special Edition, pp: 11-20. Aspect Oriented Software using Multi-criteria
Decision Making Approach World Applied SciencesJournal, 30(12): 1966-76.