
Gabor feature constrained statistical model for efficient landmark localization and face recognition
J. theor. Biol. (2002) 216, 327–336doi:10.1006/jtbi.2002.2538, available online at http://www.idealibrary.com on
Test of a Statistical Model for Molecular Recognition inBiological Repertoires
Shai Rosenwaldw, Ran Kafriw and Doron Lancetnw
wDepartment of Molecular Genetic and the Crown Human Genome Center, The Weizmann Instituteof Science, Rehovot 76100, Israel
(Received on 21 February 2001, Accepted in revised form on 14 January 2002)
A chance encounter between members of a random repertoire and a molecular targetis characteristic of different biological systems, including the immune and olfactorypathways as well as combinatorial libraries. In such systems, the affinity between the targetand members of the repertoire is distributed with a probability function describing thepropensity of obtaining a particular affinity value. We have previously proposed aphenomenological receptor affinity distribution (RAD) formalism, which describes thisprobability function based on simple statistical considerations. In the present analysis, we usepublished data from diverse experimental systems, including phage display libraries,immunoglobulins and enzymes, to test the RAD model and to compare it to other affinitydistribution formalisms. The RAD model is found to provide the best description for bindingdata for over eight orders of magnitude on the affinity scale, and to account for a relationshipbetween repertoire size and the maximal obtainable affinity within different repertoires. Thisapproach points to a potential universality of the rules that govern affinity distributions inbiology.
r 2002 Elsevier Science Ltd. All rights reserved.
Introduction
The notion of probabilistic recognition betweenrandomly encountered molecules is central tomany biological phenomena. This is particularlyevident in biological repertoires, which haveevolved to contain enough molecular diversity soas to bind any randomly encountered ligandwith a functionally sufficient affinity. Theimmune repertoires, immunoglobulins and T-cell receptors, provide the most well-knownexamples for systems displaying probability-based interactions. Other examples include themulti drug resistance (MDR) proteins that
*Author to whom correspondence should be addressed.E-mail: [email protected]
0022-5193/02/$35.00/0
underlie the cellular efflux of a large array ofcompounds (Bolhuis et al., 1997); the olfactoryreceptor repertoire, which recognizes multitudesof odorants (Buck & Axel, 1991; Lancet, 1986;Lancet & Ben-Arie, 1993); and biotransforma-tion enzymes such as Cytochromes P450, whichprovide examples of ‘‘probabilistic catalysis’’Fa phenomenon often based on chance interactionbetween enzyme and substrate (Cupp & Tracy,1998; Nebert & Gonzalez, 1990). Probabilisticinteractions are also at work in catalyticantibodies, whereby members of the immunerepertoire are shown to selectively interact witharbitrary transition-state analogs, and conse-quently to catalyse diverse chemical reactions(Janda et al., 1997; Schultz & Lerner, 1995).
r 2002 Elsevier Science Ltd. All rights reserved.
S. ROSENWALD ET AL.328
Probability-based recognition is also at thecore of the field of combinatorial chemistry.Here, ligand repertoires are used to find newbinders for specific molecular targets (Collins,1997; Hoogenboom, 1997; Lohse & Szostak,1994, 1996; Plunkett & Ellman, 1997; Scott &Smith, 1990). In an antithesis of rational design, alarge pre-prepared random repertoire is screenedand often found to contain high-affinity ligandsfor a pre-selected macromolecular targets.
A corollary of probabilistic recognition is theconcept of ‘‘affinity distribution’’, a formaldepiction of the statistics that govern theinteractions within ligand and receptor reper-toires. Such a distribution constitutes a fre-quency histogram for the affinities obtainedwhen a single target is tested against numerousmembers within a repertoire. While the existenceof such an affinity distribution may hardly bedisputed (Burnet, 1963; Inman, 1978; Kauvaret al., 1995; Lancet et al., 1994a; Levitan, 1997,1998; Macken & Perelson, 1991; Mandecki et al.,1995; Richards, 1975; Vant-Hull et al., 1998), itsparticular functional shape has been exploredonly to a limited extent.
An intriguing suggestion is that biologicalrecognition between receptors and ligands obeysa simple, perhaps universal, statistical law(Inman, 1978; Lancet et al., 1993, 1994a). Inother words, it is possible that a simplemathematical model could describe the affinitydistribution for many different repertoire types,including receptor multi-gene families and com-binatorial ligands such as in phage displaylibraries (Scott & Smith, 1990) or SELEX(Tuerk, 1997).
A central question related to probabilisticrecognition is how large and complex should arandom repertoire be, so as to ensure, with highprobability, that at least one member willmanifest a desired affinity value towards atarget. This is equivalent to asking how manyligands, on average, should one try randomlybefore getting a ligand with an affinity valuehigher than a pre-set threshold. We havepreviously suggested that this can be answeredbased on concrete knowledge of the mathema-tical shape of the entire affinity distributionCðKÞ for the repertoire in question. It wasargued that for any specified value of the desired
affinity Kn; the necessary repertoire size wouldbe roughly equal to 1=CðKnÞ (Lancet et al.,1993).
Several attempts have been aimed at predict-ing the functional shape of affinity distributions.Among the first predicted affinity distributionswas the Sips distribution (Sips, 1948). Due to theexistence of an easy test for its appropriateness,as it was often applied to describing the bindingof a hapten to heterogeneous polyclonal anti-bodies, it remained highly attractive for manyyears. Additional attempts were aimed at deriv-ing numerical procedures for the computation ofthe desired distribution from experimental bind-ing curves (Bowman, 1963; Erwin, 1976; Bruniet al., 1984) or attempting qualitative predic-tions, based on intuitive combinatorics (Burnet,1963).
More recently, an affinity distribution wasproposed, based on the assumption of five typesof non-covalent interactions (Inman, 1978). Anattempt at predicting the probability functionsand probability density functions for the highaffinity range ðlogK > 5Þ was described, basedon minimum cross-entropy procedure, resultingin a bimodal distribution (Yee, 1991). Inmodeling the immune system, Farmer et al.assumed only three levels of affinity values witharbitrary probabilities (Farmer et al., 1986) andlater an exponential decrease of probabilities, toobtain an affinity value above a certain thresh-old, was imposed (Detours et al., 1996). Severalother models assumed a continuous log-normaldistribution (Goldstein, 1975; Macken &Perelson, 1991). Only two of these models havebeen practically tested against experimental datausing a narrow range of affinities (Inman &Barnett 1988; Yee, 1991).
This paper is concerned with a receptoraffinity distribution (RAD) model, based onsimplified assumptions on the statistics of non-covalent molecular complementarity (Lancetet al., 1994a, 1993). This model, based on abinomial distribution, was tested using ligandtitrations for a heterogeneous immunoglobulinmixture. The RAD formalism was subsequentlyused in modeling the affinity values involvedin phage display procedure (Levitan, 1998) aswell as in the application of a theoreticaldistribution for analysing the procedure of
PROBABILISTIC RECOGNITION IN BIOLOGICAL REPERTOIRES 329
affinity fingerprinting (Kauvar et al., 1995). Asimilar statistical approach has been indepen-dently pursued in the analysis of idiotypicnetworks in the immune system (Detours et al.,1996; Farmer et al., 1986). An alternativeapproach, based on extreme value theory, wasused to fit the high-affinity tail of a distributionstemming from a low molecular weight ligandscreen (Young et al., 1997).
In the standard experimental approach ofmolecular searches within random ligand reper-toires, attention is usually directed to relativelyfew binders that show the highest affinity(Aujame et al., 1997; Burton, 1995; Griffiths &Duncan, 1998; Hoogenboom, 1997; Scott &Smith, 1990). Data on such high-affinity ligandsare, however, not sufficient to gain comprehen-sive insight on questions related to a completeaffinity distribution, which requires knowledgeof the entire affinity value range.
We describe here, an analysis of data from thefew past studies that actually provided data on awide range of affinities for large groups ofrandomly selected ligands towards targets suchas immunoglobulins (Inman & Barnett 1988;Varga et al., 1991) and enzymes (Kauvar et al.,1995). In addition, we include in the analysismaximal affinity data published for combinator-ial libraries. The analyses provide strong supportfor the statistical approach embodied in theRAD model, and lend credence to the notionthat this model may serve as a universal tool foranalysing molecular recognition in biologicalrepertoires.
Statistical Model
The RAD model (Lancet et al., 1993, 1994a,b) is a general statistical description for ligandand receptor repertoires. The RAD modelassumes that each molecule, when binding to atarget, forms L ‘‘formal interactions’’, eachgenerating an equal free energy contribution(a kcal mol�1) to the overall binding free energy.The variable L is assumed to obey a simplestatistical law, which underlies the affinitydistribution. In one of the embodiments of theRAD model, ligands and receptors are repre-sented by random strings (with length B) over analphabet of size S; and L is computed based on a
string complementarity rule. The assessment ofbinding potential through string representationsof molecular surfaces has been employed invarious previous reports (Farmer et al., 1986;Lancet et al., 1993, 1994a). One particularlyprominent series of studies used string comple-mentarity to model antigen–antibody binding inthe immune system (Detours et al., 1999, 2000;Detours & Perelson, 1999, 2000; Perelson &Weisbuch, 1997; Smith et al., 1999). In stringrepresentation models, complementarity be-tween two surfaces is defined by any number ofrules and the degree of complementarity can bequantified and used as a measure of affinitybetween the two molecules. Employing stringcomplementarity on RAD formalism (Lancetet al., 1993) results in a binomial distributionfor L:
CðLÞ ¼B!
L!ðB� LÞ!pLð1� pÞðB�LÞ; ð1Þ
where B is the maximal possible number offormal interactions (string length), and p is equalto 1=S:
The total binding free energy is given by DG ¼�aL; and therefore the affinity, i.e. the thermo-dynamic equilibrium association constant K; isgiven by
LogK ¼ aL=2:3RT ; ð2Þ
where R is the gas constant and T is the absolutetemperature. This formalism assumes additivityin free energy of binding, an assumption whichis well supported by experimental results(Horovitz, 1996; Horovitz & Rigbi, 1985). TheRAD formalism results in the prediction of aspecific functional shape for the entire affinitydistribution (Fig. 1).
Such string complementarity formalismcombined with the principle of additivity infree energy of binding may be shown to bereadily applicable to simple molecular recogni-tion systems such as the complementaritybetween DNA strands. In this case, where astring complementarity rule is rather natural, Bis the length of an oligonucleotide and p ¼ 1
4(derived from S ¼ 4) is the probability ofWatson–Crick base pairing. The binomialRAD model has, however, been suggested to
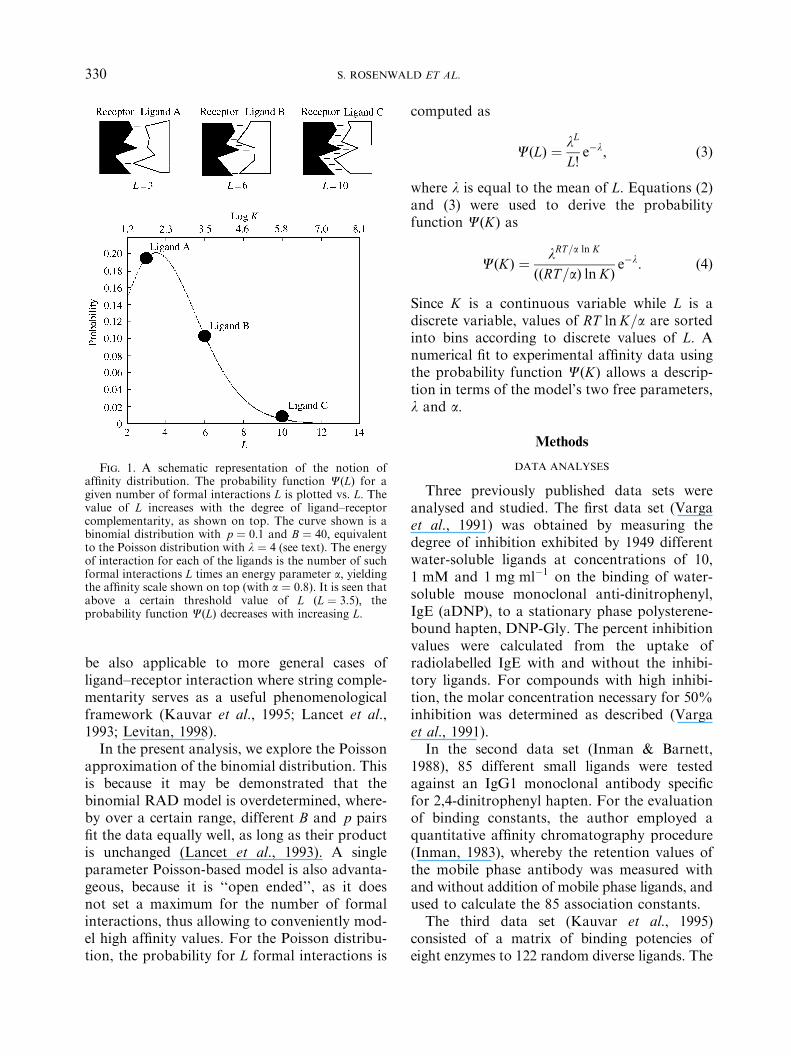
Fig. 1. A schematic representation of the notion ofaffinity distribution. The probability function CðLÞ for agiven number of formal interactions L is plotted vs. L: Thevalue of L increases with the degree of ligand–receptorcomplementarity, as shown on top. The curve shown is abinomial distribution with p ¼ 0:1 and B ¼ 40; equivalentto the Poisson distribution with l ¼ 4 (see text). The energyof interaction for each of the ligands is the number of suchformal interactions L times an energy parameter a; yieldingthe affinity scale shown on top (with a ¼ 0:8). It is seen thatabove a certain threshold value of L ðL ¼ 3:5Þ; theprobability function CðLÞ decreases with increasing L:
S. ROSENWALD ET AL.330
be also applicable to more general cases ofligand–receptor interaction where string comple-mentarity serves as a useful phenomenologicalframework (Kauvar et al., 1995; Lancet et al.,1993; Levitan, 1998).
In the present analysis, we explore the Poissonapproximation of the binomial distribution. Thisis because it may be demonstrated that thebinomial RAD model is overdetermined, where-by over a certain range, different B and p pairsfit the data equally well, as long as their productis unchanged (Lancet et al., 1993). A singleparameter Poisson-based model is also advanta-geous, because it is ‘‘open ended’’, as it doesnot set a maximum for the number of formalinteractions, thus allowing to conveniently mod-el high affinity values. For the Poisson distribu-tion, the probability for L formal interactions is
computed as
CðLÞ ¼lL
L!e�l; ð3Þ
where l is equal to the mean of L: Equations (2)and (3) were used to derive the probabilityfunction CðKÞ as
CðKÞ ¼lRT=a ln K
ððRT=aÞ ln KÞe�l: ð4Þ
Since K is a continuous variable while L is adiscrete variable, values of RT ln K=a are sortedinto bins according to discrete values of L: Anumerical fit to experimental affinity data usingthe probability function CðKÞ allows a descrip-tion in terms of the model’s two free parameters,l and a:
Methods
DATA ANALYSES
Three previously published data sets wereanalysed and studied. The first data set (Vargaet al., 1991) was obtained by measuring thedegree of inhibition exhibited by 1949 differentwater-soluble ligands at concentrations of 10,1 mM and 1 mg ml�1 on the binding of water-soluble mouse monoclonal anti-dinitrophenyl,IgE (aDNP), to a stationary phase polysterene-bound hapten, DNP-Gly. The percent inhibitionvalues were calculated from the uptake ofradiolabelled IgE with and without the inhibi-tory ligands. For compounds with high inhibi-tion, the molar concentration necessary for 50%inhibition was determined as described (Vargaet al., 1991).
In the second data set (Inman & Barnett,1988), 85 different small ligands were testedagainst an IgG1 monoclonal antibody specificfor 2,4-dinitrophenyl hapten. For the evaluationof binding constants, the author employed aquantitative affinity chromatography procedure(Inman, 1983), whereby the retention values ofthe mobile phase antibody was measured withand without addition of mobile phase ligands, andused to calculate the 85 association constants.
The third data set (Kauvar et al., 1995)consisted of a matrix of binding potencies ofeight enzymes to 122 random diverse ligands. The
PROBABILISTIC RECOGNITION IN BIOLOGICAL REPERTOIRES 331
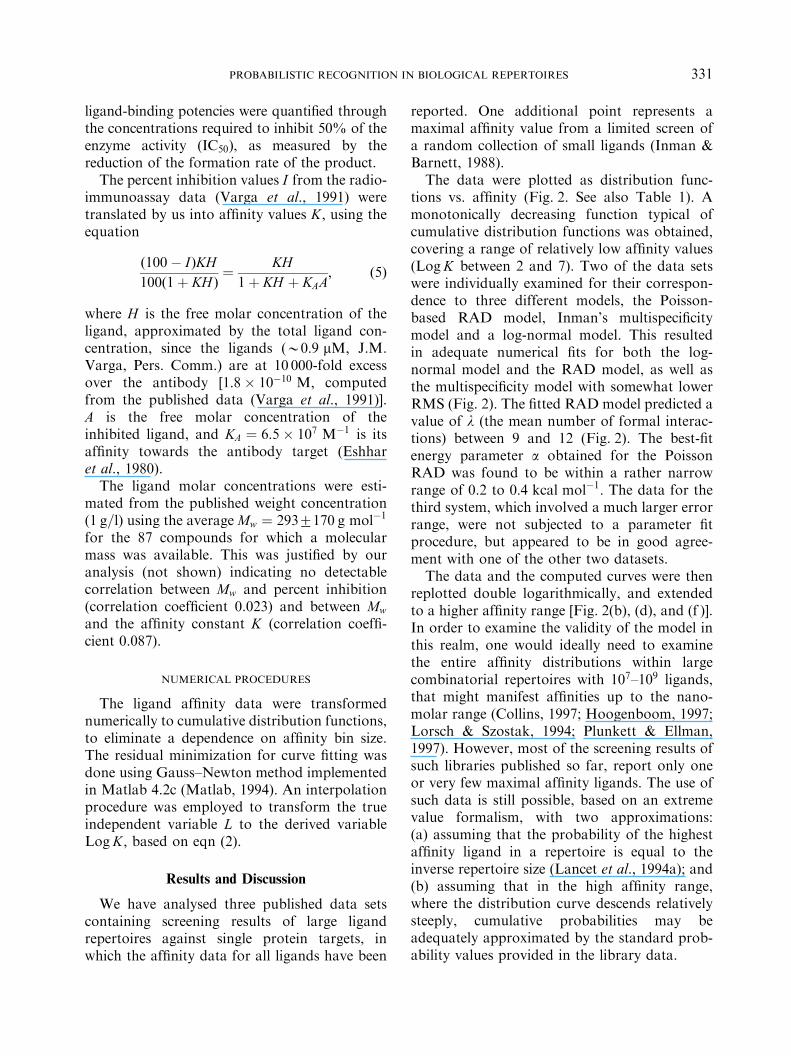
ligand-binding potencies were quantified throughthe concentrations required to inhibit 50% of theenzyme activity (IC50), as measured by thereduction of the formation rate of the product.
The percent inhibition values I from the radio-immunoassay data (Varga et al., 1991) weretranslated by us into affinity values K; using theequation
ð100� IÞKH100ð1þ KH Þ
¼KH
1þ KH þ KAA; ð5Þ
where H is the free molar concentration of theligand, approximated by the total ligand con-centration, since the ligands (B0:9 mM; J.M.Varga, Pers. Comm.) are at 10 000-fold excessover the antibody [1:8� 10�10 M; computedfrom the published data (Varga et al., 1991)].A is the free molar concentration of theinhibited ligand, and KA ¼ 6:5� 107 M�1 is itsaffinity towards the antibody target (Eshharet al., 1980).
The ligand molar concentrations were esti-mated from the published weight concentration(1 g=l) using the average Mw ¼ 2937170 g mol�1
for the 87 compounds for which a molecularmass was available. This was justified by ouranalysis (not shown) indicating no detectablecorrelation between Mw and percent inhibition(correlation coefficient 0.023) and between Mw
and the affinity constant K (correlation coeffi-cient 0.087).
NUMERICAL PROCEDURES
The ligand affinity data were transformednumerically to cumulative distribution functions,to eliminate a dependence on affinity bin size.The residual minimization for curve fitting wasdone using Gauss–Newton method implementedin Matlab 4.2c (Matlab, 1994). An interpolationprocedure was employed to transform the trueindependent variable L to the derived variableLogK; based on eqn (2).
Results and Discussion
We have analysed three published data setscontaining screening results of large ligandrepertoires against single protein targets, inwhich the affinity data for all ligands have been
reported. One additional point represents amaximal affinity value from a limited screen ofa random collection of small ligands (Inman &Barnett, 1988).
The data were plotted as distribution func-tions vs. affinity (Fig. 2. See also Table 1). Amonotonically decreasing function typical ofcumulative distribution functions was obtained,covering a range of relatively low affinity values(LogK between 2 and 7). Two of the data setswere individually examined for their correspon-dence to three different models, the Poisson-based RAD model, Inman’s multispecificitymodel and a log-normal model. This resultedin adequate numerical fits for both the log-normal model and the RAD model, as well asthe multispecificity model with somewhat lowerRMS (Fig. 2). The fitted RAD model predicted avalue of l (the mean number of formal interac-tions) between 9 and 12 (Fig. 2). The best-fitenergy parameter a obtained for the PoissonRAD was found to be within a rather narrowrange of 0.2 to 0:4 kcal mol�1: The data for thethird system, which involved a much larger errorrange, were not subjected to a parameter fitprocedure, but appeared to be in good agree-ment with one of the other two datasets.
The data and the computed curves were thenreplotted double logarithmically, and extendedto a higher affinity range [Fig. 2(b), (d), and (f )].In order to examine the validity of the model inthis realm, one would ideally need to examinethe entire affinity distributions within largecombinatorial repertoires with 107–109 ligands,that might manifest affinities up to the nano-molar range (Collins, 1997; Hoogenboom, 1997;Lorsch & Szostak, 1994; Plunkett & Ellman,1997). However, most of the screening results ofsuch libraries published so far, report only oneor very few maximal affinity ligands. The use ofsuch data is still possible, based on an extremevalue formalism, with two approximations:(a) assuming that the probability of the highestaffinity ligand in a repertoire is equal to theinverse repertoire size (Lancet et al., 1994a); and(b) assuming that in the high affinity range,where the distribution curve descends relativelysteeply, cumulative probabilities may beadequately approximated by the standard prob-ability values provided in the library data.
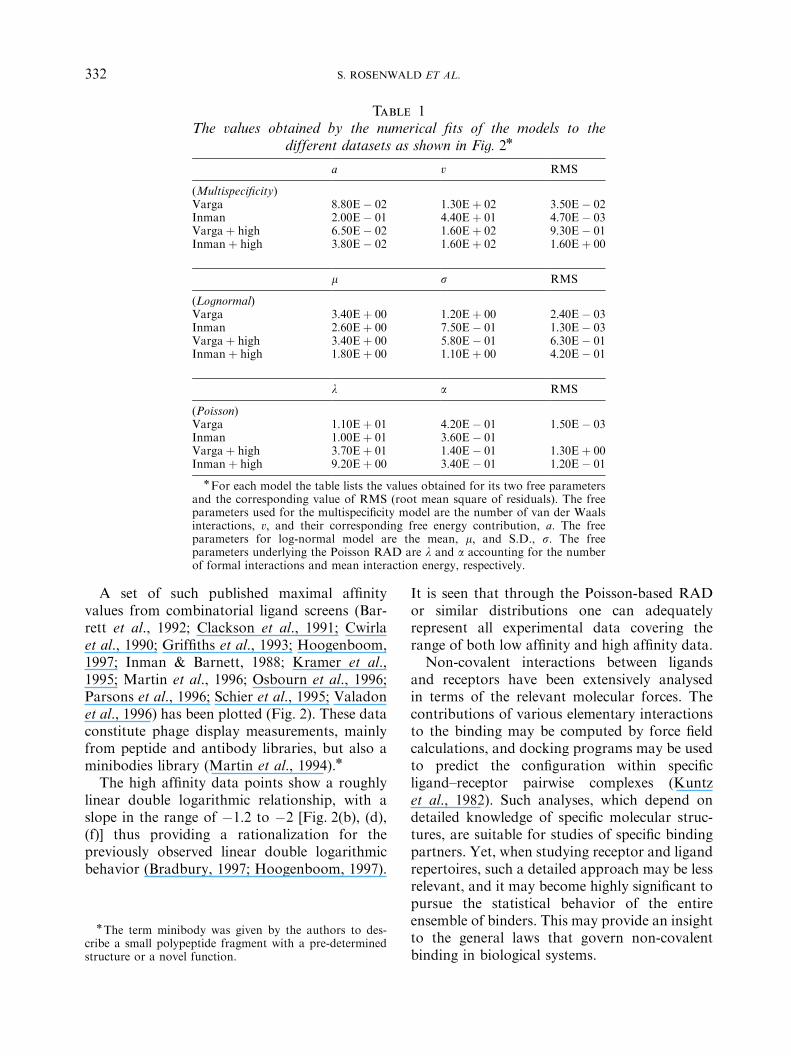
Table 1The values obtained by the numerical fits of the models to the
different datasets as shown in Fig. 2n
a v RMS
(Multispecificity)Varga 8:80E� 02 1:30Eþ 02 3:50E� 02Inman 2:00E� 01 4:40Eþ 01 4:70E� 03Vargaþ high 6:50E� 02 1:60Eþ 02 9:30E� 01Inmanþ high 3:80E� 02 1:60Eþ 02 1:60Eþ 00
m s RMS
(Lognormal)Varga 3:40Eþ 00 1:20Eþ 00 2:40E� 03Inman 2:60Eþ 00 7:50E� 01 1:30E� 03Vargaþ high 3:40Eþ 00 5:80E� 01 6:30E� 01Inmanþ high 1:80Eþ 00 1:10Eþ 00 4:20E� 01
l a RMS
(Poisson)Varga 1:10Eþ 01 4:20E� 01 1:50E� 03Inman 1:00Eþ 01 3:60E� 01Vargaþ high 3:70Eþ 01 1:40E� 01 1:30Eþ 00Inmanþ high 9:20Eþ 00 3:40E� 01 1:20E� 01
nFor each model the table lists the values obtained for its two free parametersand the corresponding value of RMS (root mean square of residuals). The freeparameters used for the multispecificity model are the number of van der Waalsinteractions, v; and their corresponding free energy contribution, a: The freeparameters for log-normal model are the mean, m; and S.D., s: The freeparameters underlying the Poisson RAD are l and a accounting for the numberof formal interactions and mean interaction energy, respectively.
S. ROSENWALD ET AL.332
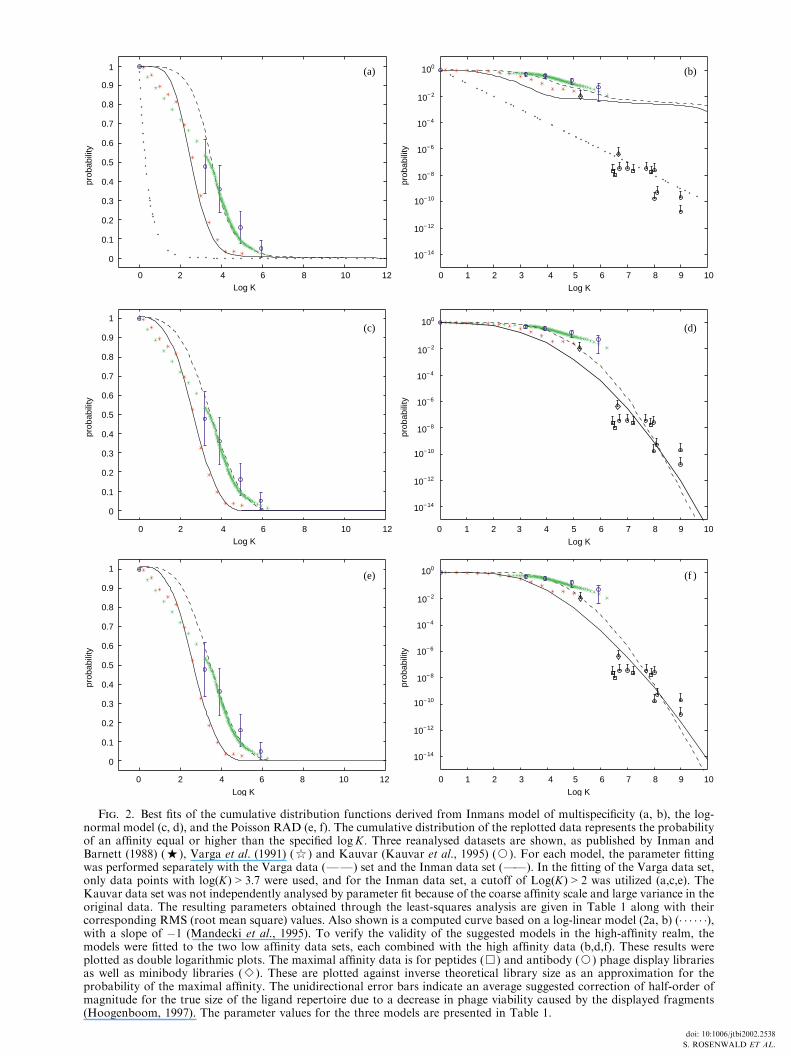
A set of such published maximal affinityvalues from combinatorial ligand screens (Bar-rett et al., 1992; Clackson et al., 1991; Cwirlaet al., 1990; Griffiths et al., 1993; Hoogenboom,1997; Inman & Barnett, 1988; Kramer et al.,1995; Martin et al., 1996; Osbourn et al., 1996;Parsons et al., 1996; Schier et al., 1995; Valadonet al., 1996) has been plotted (Fig. 2). These dataconstitute phage display measurements, mainlyfrom peptide and antibody libraries, but also aminibodies library (Martin et al., 1994).n
The high affinity data points show a roughlylinear double logarithmic relationship, with aslope in the range of �1:2 to �2 [Fig. 2(b), (d),(f)] thus providing a rationalization for thepreviously observed linear double logarithmicbehavior (Bradbury, 1997; Hoogenboom, 1997).
nThe term minibody was given by the authors to des-cribe a small polypeptide fragment with a pre-determinedstructure or a novel function.
It is seen that through the Poisson-based RADor similar distributions one can adequatelyrepresent all experimental data covering therange of both low affinity and high affinity data.
Non-covalent interactions between ligandsand receptors have been extensively analysedin terms of the relevant molecular forces. Thecontributions of various elementary interactionsto the binding may be computed by force fieldcalculations, and docking programs may be usedto predict the configuration within specificligand–receptor pairwise complexes (Kuntzet al., 1982). Such analyses, which depend ondetailed knowledge of specific molecular struc-tures, are suitable for studies of specific bindingpartners. Yet, when studying receptor and ligandrepertoires, such a detailed approach may be lessrelevant, and it may become highly significant topursue the statistical behavior of the entireensemble of binders. This may provide an insightto the general laws that govern non-covalentbinding in biological systems.
0
0.1
0.2
0.3
0.4
0.5
0.6
0.7
0.8
0.9
1
prob
abili
ty10− 2
10− 4
10− 6
10− 8
10− 10
10− 12
10− 14
100
prob
abili
ty
10− 2
10− 4
10− 6
10− 8
10− 10
10− 12
10− 14
100
prob
abili
ty
10− 2
10− 4
10− 6
10− 8
10− 10
10− 12
10− 14
100
prob
abili
ty
0
0.1
0.2
0.3
0.4
0.5
0.6
0.7
0.8
0.9
1
prob
abili
ty
0
0.1
0.2
0.3
0.4
0.5
0.6
0.7
0.8
0.9
1
prob
abili
ty
0 101 3 92
Log K
0 2 86 10 12Log K
4
0 2 86 10 12
Log K
4 4 6 7 85
0 101 3 92
Log K
4 6 7 85
0 2 86 10 12Log K
4 0 101 3 92
Log K
4 6 7 85
(a) (b)
(c) (d)
(e) (f )
Fig. 2. Best fits of the cumulative distribution functions derived from Inmans model of multispecificity (a, b), the log-normal model (c, d), and the Poisson RAD (e, f). The cumulative distribution of the replotted data represents the probabilityof an affinity equal or higher than the specified logK: Three reanalysed datasets are shown, as published by Inman andBarnett (1988) (%), Varga et al. (1991) ($) and Kauvar (Kauvar et al., 1995) (J). For each model, the parameter fittingwas performed separately with the Varga data (FF) set and the Inman data set (FF). In the fitting of the Varga data set,only data points with logðKÞ > 3:7 were used, and for the Inman data set, a cutoff of LogðKÞ > 2 was utilized (a,c,e). TheKauvar data set was not independently analysed by parameter fit because of the coarse affinity scale and large variance in theoriginal data. The resulting parameters obtained through the least-squares analysis are given in Table 1 along with theircorresponding RMS (root mean square) values. Also shown is a computed curve based on a log-linear model (2a, b) (� � � � � �),with a slope of �1 (Mandecki et al., 1995). To verify the validity of the suggested models in the high-affinity realm, themodels were fitted to the two low affinity data sets, each combined with the high affinity data (b,d,f). These results wereplotted as double logarithmic plots. The maximal affinity data is for peptides (&) and antibody (J) phage display librariesas well as minibody libraries (B). These are plotted against inverse theoretical library size as an approximation for theprobability of the maximal affinity. The unidirectional error bars indicate an average suggested correction of half-order ofmagnitude for the true size of the ligand repertoire due to a decrease in phage viability caused by the displayed fragments(Hoogenboom, 1997). The parameter values for the three models are presented in Table 1.
doi: 10:1006/jtbi2002.2538
S. ROSENWALD ET AL.

PROBABILISTIC RECOGNITION IN BIOLOGICAL REPERTOIRES 333
The most crucial aspect of such a statisticalview of biological recognition rests in the notionof affinity distributionsFthe relative pre-pon-derance of target affinity values within a ligandrepertoire (Kauvar et al., 1995; Lancet et al.,1994a; Levitan, 1997; Richards et al., 1975). Animportant notion pursued in the present paper isthat certain biological affinity distributions maymanifest continuity. Accordingly, we conjec-tured that individual measurements for severalhundred randomly chosen ligands (low affinitydomain), and data on ‘‘winning’’ ligands incombinatorial libraries (high affinity domain),may be described by the same mathematicalfunction. We therefore analysed such seeminglydisparate measurements and attempted to fitthem concomitantly to specific forms of affinitydistributions.
The Poisson-based RAD model, whose sim-plicity is deemed advantageous, is depicted hereas a limiting case of the previously proposedbinomial distribution RAD model. The values ofthe l parameter obtained in all the analyses werein the range of 8–16, suggesting that in adistribution of affinities for randomly selectedligands the typical value of the number of formalinteractions is about a dozen. This agrees wellwith an analysis based on protein data bankstructures for ligand–receptor pairs (M. Levitt,Pers. Comm.). When 26 different pairs ofstructures for ligand–protein complexes withligands up to B300 Da were analysed, theaverage number of contacts ð42 (A
2in area)
was 12.In the computer fits for the Poisson model,
each of the formal interactions was found to beassociated with a free energy change of around�1=3 kcal mol�1; as indicated by the best-fitvalue for the parameter a: Such a value is wellwithin the range of energies (B0:5 RT ) typical ofindividual non-covalent contacts, e.g. hydrogenbonds or van der Waals interactions (Chaires,1997; Klebe & Bohm, 1997; Levitt, 1974).
In the past, only a few attempts have beenmade to analyse low affinity data for ligandcollections. In one case, a multi-parameterbinome-related model of binding multispecificity(Inman, 1978) was used to examine a subset ofthe hapten binding data (Inman & Barnett, 1988;Varga et al., 1991) which are fully reanalysed
here. Inman’s formalism, similar to our own,modeled the binding process as a set of localweak Van der Waals interactions (with interac-tion energy a) occurring between the bindingsurfaces. The number of successful interactions,v; was sampled from a binome distribution andwas linearly related to the total binding strength.But in addition, the formalism also described thepossibility that a single higher energy interac-tion, such as hydrogen bonding or salt bridges,may occur. While this multispecificity modelfitted well the low affinity data [Fig. 2(a)], it isfound here to strongly deviate from the data inthe high-affinity part of the experimental dis-tribution [Fig. 2(b)]. Other models which havebeen proposed include a log-normal (Goldstein,1975; Macken & Perelson, 1991; Vant-Hull et al.,1998) and a log-linear (Mandecki et al., 1995)distribution. Parameters for both have beenoriginally selected based on simple assumptionsregarding the prevalence of maximal affinityligands. The log-normal distribution with theoriginally published fitted parameters (Vant-Hull et al., 1998) does not adequately explainthe experimental data (not shown). However, wedemonstrate here that a free parameter fit for thelog-normal distribution results is a match to theexperimental data that is as effective as that forthe Poisson distribution. While the latter dis-tribution has an advantage of providing insightinto the multiplicity of elementary interactionsand their energetics, using a log-normal distribu-tion may be equally useful in some cases (Segre’et al., 2001).
An important result of the present affinitydistribution analysis is an extrapolation of thefitted curves from the low affinity to the high-affinity domain. Thus, based on the parameterfitted to data derived from relatively small ligandlibraries (100–2000 members), which statisticallyattain affinities in the range of 10 mM to 1 mM;it is possible to derive information pertinent tothe much higher affinities encountered withinlarger libraries. The probability and affinityrange within which the combinatorial librarydata reside is found to fit adequately theextrapolated Poisson-based RAD curves as wellas the log-normal curves fitted to the low affinitydata. The curves corresponding to some of theother models also pass through this area, but
S. ROSENWALD ET AL.334
predict a slope considerably different from theexperimental value of about �2 in the highaffinity range (Bradbury, 1997; Hoogenboom,1997).
The affinity ranges spanned by the combina-torial libraries of particular sizes is rather broad.This is probably the result of the fact that thepanning selection procedures have a consider-able stochastic component in it (Levitan, 1998).Furthermore, it has been argued that thepanning procedure is limited in its ability to getthe highest affinity in certain situations (Balasset al., 1996) and that the quoted size for manylibraries constitutes an overestimate, relativeto the effective number of expressed ligands(Hoogenboom, 1997). The latter effects wouldresult in an under-estimate of the probabilityvalues. If corrected [as indicated by the unidirec-tional error bars, Fig. 2(b), (d), and (f)] it couldbring more points into the range of the extra-polated low affinity curves.
Based on its ability to describe affinitypatterns over a wide affinity range, more thaneight orders of magnitude, the RAD model canserve as a conceptual framework for analysingmolecular recognition in biological repertoires.In the future, it could be used to analyse immunephenomena such as self vs. non-self recognition(Mouthon et al., 1996; Nobrega et al., 1993),human olfactory threshold variability (Lancetet al., 1993, 1994a), and sensitivity to drugsbased on changes in the Cytochromes P450repertoire. A detailed knowledge of the statisticsof affinity distributions can, in parallel, lead to abetter understanding of molecular selection andin vitro evolution process such as combinatoriallibrary panning and SELEX (Levitan, 1997, 1998;Mandecki et al., 1995; Vant-Hull et al., 1998)and high throughput screens for pharmaceuticaldrugs (Kauvar et al., 1995; Young et al., 1997).
Doron Lancet holds the Ralph and Lois Silver Chairin Human Genomics. Supported by the CrownHuman Genome Center, a Ministry of Science grantto the National Laboratory for Genome Infrastruc-ture, by the National Institutes of Health (DC00305),the Krupp foundation, and the Weizmann InstituteGlasberg, Levy, Nathan Brunschwig and Levinefunds. We thank Prof. M. Levitt, Stanford Univer-sity, for the enlightening discussions and assistancewith the PDB analysis.
REFERENCES
Aujame, L., Geoggroy, F. & Sodoyer, R. (1997). Highaffinity human antibodies by phage display. HumAntibodies 8, 155–168.
Balass, M., Morag, E., Bayer, E. A., Fuchs, S.,Wilchek, M. & Katchalski-Katzir, E. (1996). Re-covery of high-affinity phage from a nitrostreptavidinmatrix in phage-display technology. Anal. Biochem. 243,264–269.
Barrett, R. W., Cwirla, S. E., Ackerman, M. S.,Olson, A. M., Peters, E. A. & Dower, W. J. (1992).Selective enrichment and characterization of high affinityligands from collections of random peptides on filamen-tous phage. Anal. Biochem. 204, 357–364.
Bolhuis, H., Van, V. H., Poolman, B., Driessen, A. J. &Konings, W. N. (1997). Mechanisms of multidrugtransporters. FEMS Microbiol. Rev. 21, 55–84.
Bowman Jr., A. F. (1963). A method for the determinationof heterogeneity of antibodies. J. theor. Biol. 4, 242–253.
Bradbury, A. (1997). Recent advances in phage display:the report of the Phage Club first meeting. Immunotech-nology 3, 227–231.
Bruni, C., Gandolfi, A. & Germani, A. (1984). Analysisof the parameter constraints for a proposed antibodyaffinity distribution. J. theor. Biol. 109, 71–76.
Buck, L. & Axel, R. (1991). A novel multigene family mayencode odorant receptors: a molecular basis for odorrecognition. Cell 65, 175–187.
Burnet, F. M. (1963). Cold spring harbor symp. Quant.Biol. 32, 1.
Burton, D. R. (1995). Phage display. Immunotechnology1, 87–94.
Chaires, J. B. (1997). Energetics of drug–DNA interac-tions. Biopolymers 44, 201–215.
Clackson, T., Hoogenboom, H. R., Griffiths, A. D. &Winter, G. (1991). Making antibody fragments usingphage display libraries. Nature 352, 624–628.
Collins, J. (1997). Phage display. In: Annual Reports inCombinatorial Chemistry and Molecular Diversity (Elling-ton, A. D., Moos, W. H., Pavia, M. R., Kay, B. K., eds),pp. 210–262. The Netherlands: ESCOM.
Cupp, M. J. & Tracy, T. S. (1998). Cytochrome P450: newnomenclature and clinical implications. Am Fam. Physi-cian 57, 107–116.
Cwirla, S. E., Peters, E. A., Barrett, R. W. & Dower,W. J. (1990). Peptides on phage: a vast library of peptidesfor identifying ligands. Proc. Natl Acad. Sci. U.S.A. 87,6378–6382.
Detours, V., Mehr, R. & Perelson, S. A. (1999). Aquantitative theory of affinity-driven T cell repertoirselection. J. theor. Biol. 200, 389–403.
Detours, V., Mehr, R. & Perelson, S. A. (2000).Deriving quantitative constraints on T cell selection fromdata on the mature T cell repertoire J. Immunol. 164,
121–128.Detours, V. & Perelson, S. A. (1999). Explaining
high alloreactivity as a quantitative cosequence ofaffinity-driven thymocyte selection. Proc. Natl Acad.
Sci. U.S.A. 96, 5153–5158.Detours, V. & Perelson, S. A. (2000). The paradox of
alloreactivity and self MHC restriction: quantitative
analysis and statistics. Proc. Natl Acad. Sci. U.S.A. 97,
8479–8483.
PROBABILISTIC RECOGNITION IN BIOLOGICAL REPERTOIRES 335
Detours, V., Sulzer, B. & Perelson, A. S. (1996). Sizeand connectivity of the idiotypic network are independentof the discreteness of the affinity distribution. J. theor.Biol. 183, 409–416.
Erwin, P. M. & Aladjem, F. (1976). The heterogeneity ofantibodies with respect to equilibrium constants. Calcu-lation by a new method using delta functions and analysisof the results. Immunochemistry 13, 873–883.
Eshhar, Z., Ofarim, M. & Waks, T. (1980). Generationof hybridomas secreting murine reaginic antibodies ofanti-DNP specificity. J. Immunol. 124, 775–780.
Farmer, J. D., Packard, H. N. & Perelson, S. A. (1986).The immune system, adaptation, and machine learning.Physica D 22, 187–204.
Goldstein, B. (1975). Theory of hapten binding to IgM:the question of repulsive interactions between bindingsites. Biophys. Chem. 3, 363–367.
Griffiths, A. D. & Duncan, A. R. (1998). Strategies forselection of antibodies by phage display. Curr. Opin.Biotechnol. 9, 102–108.
Griffiths, A. D., Malmqvist, M., Marks, J. D., Bye,J. M., Embleton, M. J., Mccafferty, J., Baier, M.,Holliger, K. P., Gorick, B. D. & Hughes-Jones,N. C. (1993). Human anti-self antibodies with highspecificity from phage display libraries. EMBO J. 12,
725–734.Berman, H. M., Westbrook, J., Feng, Z., Gilliland,
G., Bhat, T. N., Weissig, H., Shindyalov, I. N. &Bourne. (2000). The protein data bank. Nucleic AcidsResearch, 28, 235–242.
Hoogenboom, H. R. (1997). Designing and optimizinglibrary selection strategies for generating high-affinityantibodies. Trends Biotechnol. 15, 62–70.
Horovitz, A. (1996). Double-mutant cycles: a powerfultool for analyzing protein structure and function. FoldDes. 1, R121–126.
Horovitz, A. & Rigbi, M. (1985). Protein–proteininteractions: additivity of the free energies of associationof amino acid residues. J. theor. Biol. 116, 149–159.
Inman, J. K. (1978). The antibody combining region:speculations on the hypothesis of general multispecificity.In: Theoretical Immunology (Bell, G. I. P. A. S., PimblyJr. G. H., eds), New York: Marcel Dekker.
Inman, J. K. (1983). A study of multispecific interactionsby quantative affinity chromatography. In: AffinityChromatography and Biological Recognition (Chaiken,I. M., Wilcheck, M. Parkih, I., eds), Orlando, AcademicPress.
Inman, J. K. & Barnett, A. L. (1988). Affinities ofantibodies for diverse ligandsFtheoretical and practicalaspects. In: Protein Recognition of Immobilized Ligand;UCLA Symposia on Molecular and Cellular Biology(Hutchens, T. W., ed.), pp. 35–44. New York: Liss A. R.
Janda, K. D., Lo, L. C., Lo, C., Sim, M. M., Wang, R.,Wong, C. H. & Lerner, R. A. (1997). Chemicalselection for catalysis in combinatorial antibody libraries.Science 275, 945–948.
Kauvar, L. M., Higgins, D. L., Villar, H. O., Sports-man, J. R., Engqvist-goldstein, A., Bukar, R.,Bauer, K. E., Dilley, H. & Rocke, D. M. (1995).Predicting ligand binding to proteins by affinity finger-printing. Chem. Biol. 2, 107–118.
Klebe, G. & Bohm, H. J. (1997). Energetic and entropicfactors determining binding affinity in protein-ligand
complexes. J. Recept. Signal. Transduct. Res. 17,
459–473.Kramer, A., Vakalopoulou, E., Schleuning, W. D. &
Schneider-Mergener, J. (1995). A general route tofingerprint analyses of peptide–antibody interactionsusing a clustered amino acid peptide library: comparisonwith a phage display library. Mol. Immunol. 32,
459–465.Kuntz, I. D., Blaney, J. M., Oatley, S. J., Langridge,
R. & Ferrin, T. E. (1982). A geometric approach tomacromolecule–ligand interactions. J. Mol. Biol. 161,
269–288.Lancet, D. (1986). Vertebrate olfactory reception. Annu.
Rev. Neurosci. 9, 329–355.Lancet, D. & Ben-Arie, N. (1993). Olfactory receptors.
Curr. Biol. 3, 668–674.Lancet, D., Horovitz, A. & Katchalski-Katzir, E.
(1994a). Molecular recognition in biology: models foranalysis of protein–ligand interactions. In: The Lock-and-Key Principle (Behr, J. P., ed.), pp. 25–71. New York:John Wiley & Sons Ltd.
Lancet, D., Kedem, O. & Pilpel, Y. (1994b). Emerge oforder in small autocatalytic sets maintained far fromequilibrium: application of a probabilistic receptoraffinity distribution (RAD) model. Ber Bunseg. Phys.Chem. 98, 1166–1169.
Lancet, D., Sadovsky, E. & Seidemann, E. (1993).Probability model for molecular recognition in biologicalreceptor repertoires: significance to the olfactory system.Proc. Natl Acad. Sci. U.S.A. 90, 3715–3719.
Levitan, B. (1997). Models and search strategies forapplied molecular evolution. In: Annual Reports inCombinatorial Chemistry and Molecular Diversity (Elling-ton, A. D., Moos, W. H., Pavia, M. R. & Kay, B. K.,eds), pp. 95–152. The Netherlands: ESCOM.
Levitan, B. (1998). Stochastic modeling and optimizationof phage display. J. Mol. Biol. 277, 893–916.
Levitt, M. (1974). Energy refinement of hen egg-whitelysozyme. J. Mol. Biol. 82, 393–420.
Lorsch, J. R. & Szostak, J. W. (1994). In vitro selection ofRNA aptamers specific for cyanocobalamin. Biochemis-try 33, 973–982.
Lohse, P. A. & Szostak, J. W. (1996). Ribozyme-catalysedamino-acid transfer reactions. Nature 381, 442–444.
Macken, C. A. & Perelson, A. S. (1991). Affinitymaturation on rugged landscapes. In: Molecular Evolu-tion on Rugged Landscapes: Santa Fe Institute Studiesin the Sciences of Complexity (Perelson, A. S., Kauffman,S. A., eds), Reading, MA: Addison-Wesley.
Mandecki, W., Chen, Y. C. & Grihalde, N. (1995). Amathematical model for biopanning (affinity selection)using peptide libraries on filamentous phage. J. theor.Biol. 176, 523–530.
Martin, F., Toniatti, C., Salvati, A. L., Ciliberto, G.,Cortese, R. & Sollazzo, M. (1996). Coupling proteindesign and in vitro selection strategies: improvingspecificity and affinity of a designed beta-protein IL-6antagonist. J. Mol. Biol. 255, 86–97.
Martin, F., Toniatti, C., Salvati, A. L., Venturini, S.,Ciliberto, G., Cortese, R. & Sollazzo, M.(1994). The affinity-selection of a minibody polypeptideinhibitor of human interleukin-6. EMBO J. 13,5303–5309.
S. ROSENWALD ET AL.336
Matlab, (1994). Statistics TOOLBOX For Use withMATLAB, User’s Guide. Natick, MA., The MATHWORKS Inc.
Mouthon, L., Lacroix-Desmazes, S., Nobrega, A.,Barreau, C., Coutinho, A. & Kazatchkine, M. D.(1996). The self-reactive antibody repertoire of normalhuman serum IgM is acquired in early childhood andremains conserved throughout life. Scand. J. Immunol.44, 243–251.
Nebert, D. W. & Gonzalez, F. J. (1987). P450 genes:Structure, evolution, and regulation. Annu. Rev. Bio-chem. 56, 945–993.
Nobrega, A., Haury, M., Grandien, A., Malanchere,E., Sundblad, A. & Coutinho, A. (1993). Globalanalysis of antibody repertoires. II. Evidence for speci-ficity, self-selection and the immunological ‘‘homun-culus’’ of antibodies in normal serum. Eur. J. Immunol.23, 2851–2859.
Osbourn, J. K., Field, A., Wilton, J., Derbyshire, E.,Earnshaw, J. C., Jones, P. T., Allen, D. & McCaff-erty, J. (1996). Generation of a panel of related humanscFv antibodies with high affinities for human CEA.Immunotechnology 2, 181–196.
Parsons, H. L., Earnshaw, J. C., Wilton, J., Johnson,K. S., Schueler, P. A., Mahoney, W. & McCafferty,J. (1996). Directing phage selections towards specificepitopes. Protein Eng. 9, 1043–1049.
Perelson, S. A. & Weisbuch, G. (1997). Immunology forphysicists. Rev. Mod. Phys. 69, 1219–1267.
Plunkett, M. J. & Ellman, J. A. (1997). Combinatorialchemistry and new drugs. Sci. Am. 276, 68–73.
Richards, F. F., Konigsberg, W. H., Rosenstein, R. W.& Varga, J. M. (1975). On the specificity of antibodies.Science 187, 130–137.
Schier, R., Marks, J. D., Wolf, E. J., Apell, G., Wong,C., Mccartney, J. E., Bookman, M. A., Huston, J. S.,Houston, L. L. & Weiner, L. M. (1995). In vitro andin vivo characterization of a human anti-c-erbB-2 single-chain Fv isolated from a filamentous phage antibodylibrary. Immunotechnology 1, 73–81.
Schultz, P. G. & Lerner, R. A. (1995). From moleculardiversity to catalysis: lessons from the immune system.Science 269, 1835–1842.
Scott, J. K. & Smith, G. P. (1990). Searching forpeptide ligands with an epitope library. Science 249,
386–390.Segre’, D., Shenhav, B., Kafri, R. & Lancet, D. (2001).
The molecular roots of compositional inheritance.J. theor. Biol. 213, 481–491.
Sips, R. J. (1948). On the structure of a catalyst surface.J. Chem. Phys. 16, 490–495.
Smith, J. D., Forrest, S., Ackley, H. D. & Perelson,S. A. (1999). Variable efficacy of repeated annual influ-enza vaccination. Proc. Natl Acad. Sci. U.S.A. 24,14 001–14 006.
Tuerk, C. (1997). Using the SELEX combinatorialchemistry process to find high affinity nucleic acidligands to target molecules. Meth. Mol. Biol. 67,219–230.
Valadon, P., Nussbaum, G., Boyd, L. F., Margulies,D. H. & Scharff, M. D. (1996). Peptide librariesdefine the fine specificity of anti-polysaccharide antibo-dies to Cryptococcus neoformans. J. Mol. Biol. 261,
11–22.Vant-Hull, B., Payano-Baez, A., Davis, R. H. & Gold,
L. (1998). The mathematics of SELEX against complextargets. J. Mol. Biol. 278, 579–597.
Varga, J. M., Kalchshmid, G., Klein, G. F. &Fritsch, P. (1991). Mechanism of allergic cross-reac-tionFI. Multispecific binding of ligands to a mousemonoclonal anti-DNP IgE antibody. Mol. Immunol. 28,641–654.
Yee, E. (1991). Reconstruction of the antibody affinitydistribution from experimental binding data by a mini-mum cross-entropy procedure. J. theor. Biol. 153,
205–227.Young, S. S., Sheffield, C. F. & Farmen, M. (1997).
Optimum utilization of a compound collection orchemical library for drug discovery. J. Chem. Inf.Comput. Sci. 5, 892–899.
Copyright © 2022 FDOKUMEN