Tero Laihinen – Lanthanide doped NaYF4 up-conversion ...
78
TURUN YLIOPISTON JULKAISUJA – ANNALES UNIVERSITATIS TURKUENSIS Sarja - ser. AI osa - tom. 550 | Astronomica - Chemica - Physica - Mathematica | Turku 2016 Tero Laihinen LANTHANIDE DOPED NaYF 4 UP-CONVERSION LUMINESCENCE MATERIALS
-
Upload
khangminh22 -
Category
Documents
-
view
4 -
download
0
Transcript of Tero Laihinen – Lanthanide doped NaYF4 up-conversion ...
TURUN YLIOPISTON JULKAISUJA – ANNALES UNIVERSITATIS TURKUENSISSarja - ser. AI osa - tom. 550 | Astronomica - Chemica - Physica - Mathematica | Turku 2016
Tero Laihinen
LANTHANIDE DOPED NaYF4 UP-CONVERSION
LUMINESCENCE MATERIALS

Supervised by
Docent Mika LastusaariDepartment of ChemistryUniversity of TurkuFI-20014 Turku, Finland
Dr. Techn. Jorma HölsäDepartment of PhysicsUniversity of the Free StateZA-9300 Bloemfontein, South Africa
University of Turku
Faculty of Mathematics and Natural SciencesDepartment of ChemistryLaboratory of Materials Chemistry and Chemical AnalysisDoctoral Programme in Physical and Chemical Sciences
Reviewed by
Professor Maarit KarppinenDepartment of ChemistrySchool of Chemical TechnologyAalto UniversityP.O. Box 16100, FI-00076 Aalto, Finland
Dr. Sebastian VielhauerInstitute of PhysicsUniversity of TartuW. Ostwaldi 1, EE-50411 Tartu, Estonia
Opponent
Dr hab. Dariusz HreniakInstitute of Low Temperature and Structure ResearchPolish Academy of Sciencesul. Okolna 2, PL-50-422 Wroclaw, Poland
The originality of this thesis has been checked in accordance with the University of Turku quality assurance system using the Turnitin OriginalityCheck service.
ISBN 978-951-29-6670-7 (PRINT)ISBN 978-951-29-6671-4 (PDF)ISSN 0082-7002 (Print)ISSN 2343-3175 (Online)Painosalama Oy - Turku, Finland 2016
Custos
Docent Mika LastusaariDepartment of ChemistryUniversity of TurkuFI-20014 Turku, Finland
PREFACE
Life is smiling. That is the uppermost feeling I have now thinking how Igot at this point where I am about to finish the Doctor of Philosophydegree in chemistry. How cool is that? Of course there have also beensome not so glorious moments along the way but who cares – the goodones matter more. I am happy, and a bit surprised to be honest, to seethat writing the thesis was not that bad after all. Actually I must admit Ieven had a lot of fun working with it and the days, and the summer, wentreally fast.
The work was done mainly at the Laboratory of Materials Chemistryand Chemical Analysis of the University of Turku, during the years 2013-2016, within the Doctoral Programme in Physical and Chemical Sciences,in Turku, Finland. Some measurements were done at the University ofthe Free State (Bloemfontein, South Africa) and at HASYLAB/DESY(Hamburg, Germany).
The work was funded by University of Turku Graduate School,Academy of Finland (mobility funding from Finland to South Africa andprojects Energy Storage Luminophors 2 and Novel Rare Earth Optical Sensorsand Materials – a bilateral project of Academy of Finland and CNPq,Brazil), and Nordic Energy Research (AquaFEED project). All thefinanciers are gratefully acknowledged. I also want to thank ProfessorMaarit Karppinen and Dr. Sebastian Vielhauer for the thorough pre-examination, valuable comments and kind words, and Dr hab. DariuszHreniak for agreeing to be my opponent. Moreover, there is many otherpeople I want to acknowledge as well.
First of all, I am more than grateful for my supervisors Docent MikaLastusaari and Dr. Techn. Jorma Hölsä for making everything possibleand for all the help, guidance and advices. Thank you for the gooddiscussions and countless hours you have used to assist and teach me.Without your help the publications and this thesis would not exist. I alsowant to thank all the other co-authors for the help and valuablecomments.

I want to thank all the former and current colleagues and friendsfrom our laboratory. Especially I wish to thank Laura Pihlgren and EmiliaPalo for teaching me everything and for the warm welcome to thelaboratory, and also Ari Lehtonen, Iko Hyppänen, Lucas Rodrigues, JoséCarvalho, Liana Nakamura, Hellen Santos, Minnea Tuomisto, IsabellaNorrbo, Pasi Salonen, Milla Suominen and everyone else, for theexcellent working atmosphere and nice discussions. Special thanks goalso to Kari Loikas, Kaisa Ketomäki, Mauri Nauma and Kirsi Laaksonenfor all the technical and administrative support enabling us to concentrateon research.
One of the best experiences during these years was the possibility towork three months in South Africa at the University of the Free State.For that I am very grateful for Professor Hendrik Swart who kindlyinvited and allowed me to work at the laboratory and provided a lot ofvaluable measurement time. I also want to thank Mart-Mari Duvenhageand Elizabeth Coetsee-Hugo for all the measurements and also makingmy visit so much nicer and fun. I am also very grateful for everyone elsefor making me feel very welcome.
I am sure we all can agree that life would not be anything withoutgood friends so I want to thank my best friends, Aleksis Mattsson, KalleVirta, Kristian Lautkoski, Hanna-Mari Salmia, Marica Engström, MinneaTuomisto, Jasmin Moussa and Olli Moisio, for all the fun we have hadduring these years, and also for the support and company during thedifficult times. I hope we will keep in touch for a long time!
I want to express my deepest gratitude to my mother, father andbrothers. Thank you for the outstanding childhood, support and trust. Iam happy I have been able to do and study whatever I want withoutfeeling any pressure.
Finally, Hanna, thank you for bringing so much love and joy in mylife, as well as for all the help with the thesis.
Turku, November 28, 2016Tero Laihinen

TABLE OF CONTENTS
ABSTRACT ......................................................................................................7TIIVISTELMÄ ................................................................................................8LIST OF ORIGINAL PUBLICATIONS ...................................................9ABBREVIATIONS AND SYMBOLS ..................................................... 101. INTRODUCTION ................................................................................ 132. LITERATURE REVIEW ..................................................................... 15
2.1. Basic Requirements for Up-conversion Luminescence.............. 152.2. Up-conversion Luminescence Mechanisms ................................. 172.3. Ytterbium Sensitizer ........................................................................ 192.4. Lanthanide Activators ..................................................................... 192.5. Up-conversion Quantum Yield ...................................................... 222.6. Sodium Yttrium Tetrafluoride........................................................ 25
2.6.1. Tuning Characteristic Properties ........................................ 282.6.2. Co-precipitation Synthesis ................................................... 302.6.3. Core-shell Concept ............................................................... 312.6.4. Basic Characterization Methods ......................................... 33
3. AIMS OF THE EXPERIMENTAL WORK ..................................... 354. MATERIALS AND METHODS ........................................................ 36
4.1. Materials Preparation ....................................................................... 364.2. Characterization Methods ............................................................... 37
4.2.1. Transmission Electron Microscopy ................................... 374.2.2. Thermogravimetry and Differential Scanning
Calorimetry ............................................................................ 384.2.3. X-ray Powder Diffraction .................................................... 384.2.4. Extended X-ray Absorption Fine Structure ...................... 394.2.5. Time-of-flight Secondary Ion Mass Spectrometry ........... 404.2.6. X-ray Photoelectron Spectroscopy..................................... 404.2.7. Up-conversion Luminescence and Decay Time .............. 41
5. RESULTS AND DISCUSSION .......................................................... 43

Table of Contents
5.1. Effects of Different Preparation Methods ................................... 435.1.1. Thermal Behaviour................................................................ 435.1.2. Crystal Form and Phase Purity ............................................ 445.1.3. Particle Size and Shape ......................................................... 455.1.4. Elemental Distribution ......................................................... 465.1.5. Elemental Composition ........................................................ 495.1.6. Chemical Environment ........................................................ 515.1.7. Up-conversion Luminescence Enhancement ................... 57
5.2. Effect of Erbium Impurity on the Up-conversion Luminescenceof Terbium ........................................................................................ 58
5.3. Estimating the Amount of the Impurity Cubic Form................. 635.4. Up-conversion Luminescence of Other Lanthanides ................. 63
6. SUMMARY .............................................................................................. 67REFERENCES ............................................................................................. 69ORIGINAL PUBLICATIONS .................................................................. 79

7
ABSTRACT
UNIVERSITY OF TURKUFaculty of Mathematics and Natural Sciences, Department ofChemistry, Laboratory of Materials Chemistry and Chemical Analysis
LAIHINEN, TERO: Lanthanide doped NaYF4 up-conversionluminescence materialsDoctoral thesis, 118 p.November 28, 2016
The thesis includes literature and experimental parts. The first partintroduces the reader to the topic while the later part contains synthesisand characterization details, results and publications. Up-conversion(UPC) luminescence materials are very interesting and they have plentyof potential applications of which bioanalytical ones are probably themost promising.
A lot of research has been done to study and develop UPCluminescence materials and lanthanide (Ln) doped NaYF4 is maybe themost popular - especially Yb3+,Er3+ doped NaYF4. The trivalentlanthanides are very good for UPC luminescence due to their ladder-likeenergy level structures and long excited state lifetimes. Er3+, Tm3+ andHo3+ activators are the best ones and often they are used together withan Yb3+ sensitizer which enhances the UPC efficiency. Moreover, NaYF4
is considered as the best host.The aim of this work was to prepare, study and improve UPC
luminescence materials based on NaYF4. Yb3+ was used as the sensitizerand Pr3+, Nd3+, Sm3+, Eu3+, Tb3+, Dy3+, Ho3+, Er3+ and Tm3+ were usedas activators. The materials were prepared with co-precipitation synthesisand studied with TG-DSC, XPD, TEM, TOF-SIMS, XPS and EXAFS.UPC luminescence was studied under 976 nm excitation.
The synthesis was optimized so that the obtainable luminescenceintensity is now even 2 orders of magnitude stronger than before. Severalfactors contributing to differences between the old and the newimproved material were found: The cubic-to-hexagonal phase transitiontemperature is ca. 100 °C lower. The crystal structure is always hexagonal.The particles are covered with sodium. There are less lattice strains. TheNa site is partly occupied with Yb3+ ions which enhances the Yb3+-Ln3+
energy transfer. In the end, UPC luminescence is obtained from all thelanthanides except Sm3+ and Dy3+.

8
TIIVISTELMÄ
TURUN YLIOPISTOMatemaattis-luonnontieteellinen tiedekunta, Kemian laitos,Materiaalikemian ja kemiallisen analyysin laboratorio
LAIHINEN, TERO: Lantanideilla seostetut NaYF4-pohjaiset up-konversioluminesenssimateriaalitVäitöskirja, 118 s.28. marraskuuta 2016
Väitöskirja sisältää kirjallisen ja kokeellisen osan. Kirjallinen osa johdat-telee lukijan aiheeseen ja kokeellinen osa sisältää tiedot valmistus- ja tut-kimusmenetelmistä sekä tulokset ja julkaisut. Up-konversioluminesenssi-materiaalit ovat erittäin mielenkiintoisia ja niillä on useita potentiaalisiasovelluskohteita joista bioanalyyttiset sovellukset vaikuttaisivat olevan lu-paavimpia.
Up-konversioluminesenssimateriaaleja on tutkittu ja kehitetty paljonja lantanideilla (Ln) seostetut NaYF4-materiaalit ovat ehkä kaikkein suo-situimpia - erityisesti Yb3+,Er3+ seostettu NaYF4. Kolmivalenssiset lanta-nidit sopivat erittäin hyvin up-konversioluminesenssiin, koska niillä ontikapuumaiset energiatilarakenteet ja virittyneiden tilojen eliniät ovat riit-tävän pitkiä. Er3+-, Tm3+- ja Ho3+-aktivaattorit ovat parhaimpia ja useinniiden kanssa käytetään Yb3+-herkistintä mikä parantaa up-konversion te-hokkuutta. NaYF4:a pidetään parhaimpana pohja-aineena.
Työn tarkoitus oli valmistaa, tutkia ja parantaa NaYF4:iin pohjautu-via up-konversioluminesenssimateriaaleja. Yb3+-herkistintä ja seuraaviaaktivaattoreita käytettiin: Pr3+, Nd3+, Sm3+, Eu3+, Tb3+, Dy3+, Ho3+, Er3+
ja Tm3+. Materiaalit valmistettiin kerasaostusmenetelmällä ja niitä tutkit-tiin TG-DSC, XPD, TEM, TOF-SIMS, XPS ja EXAFS menetelmillä.Up-konversioluminesenssia tutkittiin 976 nm virityksellä.
Synteesiä optimoitiin, minkä seurauksena luminesenssin intensiteettion nyt jopa kaksi kertalukua voimakkaampi kuin ennen. Vanhan ja uudenparannellun materiaalin ominaisuuksissa havaittiin useita eroavuuksia:Kuutiollinen-heksagoninen rakennemuutoslämpötila on nyt n. 100 °Cmatalampi. Kiderakenne on aina heksagoninen. Partikkelit ovat natri-umin peitossa. Hilajännityksiä on vähemmän. Na-paikka on osittain täy-tetty Yb3+-ioneilla mikä parantaa Yb3+-Ln3+-energiansiirtoa. Nyt up-kon-versioluminesenssia voidaan havaita kaikista muista lantanideista paitsiSm3+:sta ja Dy3+:sta.
The original publications are reprinted with the permission from the copyright holders. Article I:
copyright © International Centre for Diffraction Data 2013. Article II: copyright © 2014 The
Chinese Society of Rare Earths. Article III: copyright © 2013 Elsevier B.V. Article IV: copyright
© 2013 Elsevier B.V. Article V: copyright © 2015, Akadémiai Kiadó, Budapest, Hungary.
LIST OF ORIGINAL PUBLICATIONS
The experimental part of the thesis is based on the following publicationsand supplementary unpublished results. The publications can be foundat the end and are referred to in the text by their Roman numerals.
I. Brito, H.F., Hölsä, J., Laamanen, T., Laihinen, T., Lastusaari, M.,Rodrigues, L.C.V., Pihlgren, L., and Soukka, T., Rare EarthDistribution in NaRF4: Effect on Up-Conversion Intensity, PowderDiffr. 28 (2013) S41-S50.
II. Brito, H.F., Hölsä, J., Laamanen, T., Laihinen, T., Lastusaari, M.,Pihlgren, L., Rodrigues, L.C.V., and Soukka, T., EXAFS Study ofCation Reordering in NaYF4:Yb3+,Tb3+ Up-ConversionLuminescence Materials, J. Rare Earths 32 (2014) 226-229.
III. Hölsä, J., Laihinen, T., Laamanen, T., Lastusaari, M., Pihlgren, L.,Rodrigues, L.C.V., and Soukka, T., Enhancement of the Up-Conversion Luminescence from NaYF4:Yb3+,Tb3+, Physica B 439(2014) 20-23.
IV. Hölsä, J., Laamanen, T., Laihinen, T., Lastusaari, M., Pihlgren, L.,and Rodrigues, L.C.V., White Up-Conversion Luminescence ofNaYF4:Yb3+,Pr3+,Er3+, Opt. Mater. 36 (2014) 1627-1630.
V. Laihinen, T., Lastusaari, M., Pihlgren, L., Rodrigues, L.C.V., andHölsä, J., Thermal Behaviour of the NaYF4:Yb3+,R3+ Materials, J.Thermal Anal. Calorim. 121 (2015) 37-43.
VI. Laihinen, T., Palo, E., Pihlgren, L., Rodrigues, L.C.V., Swart, H.C.,Lastusaari, M., and Hölsä, J., Comprehensive Up-ConversionLuminescence Tuning Through Selective Lanthanide Doping ofNaYF4, a manuscript.

10
ABBREVIATIONS AND SYMBOLS
2θ Bragg´s angle3D Three dimensionalA AreaAuc AbsorbanceA/D Analog-to-digitalAPTE Addition de photons par transfert d’énergieCCD Charge-coupled deviceCIE Commission internationale de l'éclairageCPS Counts per secondcryo-TEM Cryo-transmission electron microscopyd Mean crystallite sizeD Crystallite sized* Reciprocal d spacing (= 2sinq/l)DESY Deutsches Elektronen-SynchrotronDSC Differential scanning calorimetryE EnergyE0 Edge energyEs Intensity of excitation light not absorbed by the sampleEr Intensity of excitation light not absorbed by the referenceEDS Energy-dispersive X-ray spectroscopyEDTA Ethylenediaminetetraacetic acidEDX Energy-dispersive X-ray spectroscopyEELS Electron energy loss spectroscopyem EmissionESA Excited state absorptionETU Energy transfer up-conversioneUCQY External up-conversion quantum yieldEXAFS Extended X-ray absorption fine structureexc ExcitationFWHM Full width at half maximumGSA Ground state absorption

Abbreviations and Symbols
11
h Planck constanthνmax Maximum phonon energyHAADF High-angle annular dark-fieldHASYLAB Hamburger SynchrotronstrahlungslaborHRTEM High-resolution transmission electron microscopyI IrradianceICP-MS Inductively coupled plasma mass spectrometryIR InfrarediUCQY Internal up-conversion quantum yieldk Photoelectron wave vectorkB Boltzmann constantKDP KH2PO4
Ls Emission intensity of the sampleLn LanthanideNIR Near infraredppm Parts per millionR Rare earthr.m.s. Root mean squareS.H.G. Second harmonic generationSAED Selected area electron diffractionSDD Silicon drift detectorSTEM Scanning transmission electron microscopyt TimeTEM Transmission electron microscopyTG ThermogravimetryTOF-SIMS Time-of-flight secondary ion mass spectrometryTPA Two-photon absorption excitationUCQY Up-conversion quantum yieldUV Ultravioletw Full width at half maximumxc CenterxLn Mole fraction of a lanthanide dopantXPD X-ray powder diffraction

Abbreviations and Symbols
12
XPS X-ray photoelectron spectroscopyXRD X-ray diffractiony0 Baseβ Full width at half maximumΔE Energy gapDK Relative reflection broadeningΔθ Half of full width at half maximume Strainθ Angleλ Wavelengthν Frequencyφabs Photon flux of absorbed photonsφin Photon flux of incident photonsφuc Photon flux of up-converted photonsω Multiphonon relaxation rate

13
1. INTRODUCTION
Lanthanides (Ln), often unknown elements even for some chemists, arevery versatile and widely used in everyday applications includingfluorescent lamps, displays and security markings in euro notes – not tomention the scientific field. A new research area where lanthanides arealso essential is up-conversion luminescence where lower energyradiation, e.g. infrared (IR), is converted to higher energy radiation suchas visible or even ultraviolet (UV) radiation.1–3 In other words, two ormore low-energy photons are converted to one high-energy photon. Up-conversion luminescence materials have many established and potentialapplications including lasers,4–6 displays,7 security printing,8 solar cells,9–13
enhancing photosynthesis,14 bioimaging15–20 and biodetection.21–23
The unique ladder-like energy level structures of trivalentlanthanides are ideal for up-conversion luminescence and it has beenobtained of almost every lanthanide. Er3+, Tm3+ and Ho3+ are the mostefficient ones showing strong UV, blue, green, red and IR luminescence.To minimize cross-relaxation processes lowering the efficiency, theconcentration of the emitting ion, i.e. activator, must be relatively low (afew percent at the most). Therefore, a host lattice such as NaYF4 mustbe used to dilute the concentration of the activator. However, a sensitizer(e.g. Yb3+) with higher concentration can be used to enhance theefficiency by increasing the absorption. In NaYF4, the lanthanide dopantssubstitute the Y3+ ions with similar size and valence well with even highconcentrations.
In theory, an activator with n energy levels could absorb and stack nphotons before a radiative emission. However, often only emissionsfollowed by absorption of two or three photons are obtained due to thedecreasing efficiency of the up-conversion mechanisms with increasingamount of photons involved in the process. Also for example small

Introduction
14
energy gaps between energy levels, short lifetimes and cross-relaxationprocesses weaken the up-conversion luminescence, as does smallcrystallite size.
Small nanocrystals with sizes well below 100 nm have attracted a lotof attention due to their high potential especially for bioanalyticalapplications but the decreasing efficiency with decreasing size is aproblem for many applications. Thus, many have studied and developedup-conversion luminescence materials further to enhance the efficiency.For example adding a shell to the particles to hinder the surfacequenching have shown good results but there is still work to do. Manydifferent synthesis methods have been developed to produce high-qualitylanthanide doped NaYF4 up-conversion luminescence materials. Wehave used a co-precipitation method24, because it is simple and fast, tostudy lanthanide doped NaYF4 up-conversion luminescence materials.
As a result, we were able to modify the synthesis to producematerials showing stronger up-conversion luminescence than before.The details behind this enhancement were studied using transmissionelectron microscopy (TEM), thermogravimetry (TG), differentialscanning calorimetry (DSC), X-ray powder diffraction (XPD), extendedX-ray absorption fine structure (EXAFS), time-of-flight secondary ionmass spectrometry (TOF-SIMS) and X-ray photoelectron spectroscopy(XPS). Finally, up-conversion luminescence of praseodymium,neodymium, samarium, europium, terbium, dysprosium, holmium,erbium and thulium was studied in the NaYF4 host in the presence of theytterbium sensitizer under 976 nm excitation.
The experimental part of the thesis includes details of the materials’preparation and characterization methods (section 4), and the mainresults (section 5). Moreover, the original publications, referred to in thetext with the Roman numerals I-VI, can be found in the end. But first,the following section introduces you to the truly fascinating field of up-conversion luminescence with some additional details.

15
2. LITERATURE REVIEW
2.1. Basic Requirements for Up-conversion Luminescence
The main requirements for efficient up-conversion luminescence are thefollowing: a ladder-like energy level structure with matching energydifferences between the levels and the intermediate energy levels musthave long enough lifetimes to enable the stacking of photons.1-3
Moreover, the energy difference to the energy level below theintermediate energy level, participating to the up-conversion process,should be big enough to avoid efficient multiphonon de-excitation. Themultiphonon relaxation rate (ω) decreases exponentially with increasingenergy gap (ΔE):25,26
∝∆ (1)
where kB is the Boltzmann constant and hνmax is the maximum phononenergy (lattice or impurities). Therefore, the radiative and non-radiativephoton and phonon emissions, respectively, are competing processesand high phonon energies can be harmful for the luminescence.
Almost all the trivalent lanthanides fulfill these requirements moreor less well (Figure 1) – depending on the excitation energy of course.Due to the use of the Yb3+ sensitizer, maybe the most common excitationenergy is ca. 10200 cm-1 (ca. 980 nm). Using this amount of energy forexample, just by looking at the energy level diagram, Pr3+, Nd3+, Sm3+,Dy3+, Ho3+, Er3+ and Tm3+ seem to be the best candidates to be anactivator while the others do not have any intermediate energy levels evenclose to the 2F5/2 level of Yb3+.

Literature Review
16
Figure 1. The 4f energy levels of the trivalent lanthanide ions below 50000 cm-1.27–29
The high amount of the energy levels (Figure 1) exposes thelanthanides to cross-relaxation processes which can quench theluminescence and change the intensity ratios of the emissions (Figure2).1,2 Cross-relaxation means that energy transfers between two similarions of which at least one is already excited. The result is that one ion de-excites to a lower energy level and the other ion excites to a higher energylevel. The probability of the cross-relaxation processes increases with

Up-conversion Luminescence Mechanisms
17
increasing concentration because then the ions are closer and energytransfer becomes more probable. Therefore, there is an optimumconcentration for every lanthanide giving the strongest up-conversionluminescence. Usually it is on the scale of couple percent.
Figure 2. Cross-relaxation mechanisms between two identical activator ions (A).
2.2. Up-conversion Luminescence Mechanisms
There are several different up-conversion mechanisms such as energytransfer up-conversion (ETU) which is referred to also as APTE(addition de photons par transfert d’énergie), two-step absorption(ground state absorption (GSA) followed by excited state absorption(ESA)), cooperative sensitization, cooperative luminescence, secondharmonic generation (S.H.G.) and two-photon absorption excitation(TPA; Figure 3).1

Literature Review
18
Figure 3. Various two-photon up-conversion processes with their relative efficiency inthe specified materials (KDP: KH2PO4).1
The ETU (APTE) mechanism is clearly the most efficient one forup-conversion. It includes three ions: two sensitizers (e.g. Yb3+) and anactivator (e.g. Er3+). First a sensitizer is excited and subsequently it relaxesback to the ground level and its energy is transferred to an activatorwhich is now excited. Then the other sensitizer transfers a second photonto the same activator while it is still excited. As a consequence, theactivator has excited to an energy level with higher energy than theexcitation source by absorbing two photons. Finally, the activator canabsorb more energy and excite to even higher energy levels or it can relaxback to the ground level.
The two-step absorption mechanism, which is often referred to asthe ESA mechanism, is the second most efficient one. The difference toETU is that it does not include sensitizers. Therefore, the mechanismincludes only one ion (e.g. Er3+) which absorbs two (or more) photonsbefore relaxing back to the ground level.
The cooperative sensitization mechanism has the same principle asETU but the activator (e.g. Tb3+) does not have an intermediate energylevel able to absorb a photon from the sensitizer (e.g. Yb3+). Therefore,two sensitizers have to transfer the photons at the same time to theactivator. Then the activator can excite to an energy level with energycorresponding to two excitation photons. The efficiency of the

Ytterbium Sensitizer
19
cooperative sensitization mechanism is already several orders ofmagnitude weaker compared to the ETU mechanism due to the lack ofthe appropriate intermediate energy levels and the cooperativeluminescence, S.H.G. and TPA mechanisms are even much moreinefficient.
2.3. Ytterbium Sensitizer
Evidently the best efficiency of the Yb3+-Er3+ ETU mechanism (severalorders of magnitude better than the others) is due to the Yb3+ sensitizer.It has only one excited 4f energy level (Figure 1) resulting in anabsorption band at around 980 nm due to the 2F7/2 → 2F5/2 transition.The absorption cross-section of the Yb3+ 2F5/2 level is rather good – atleast several times better than that of the Er3+ 4I11/2 level also at ca.980 nm.30 Moreover, while the activator concentration must be kept low(below ca. 5 %) to avoid cross-relaxation processes quenching up-conversion luminescence, the sensitizer concentration can be higher (upto even 100 %)31 resulting in more efficient absorption and subsequentenergy transfer to activator ions.
2.4. Lanthanide Activators
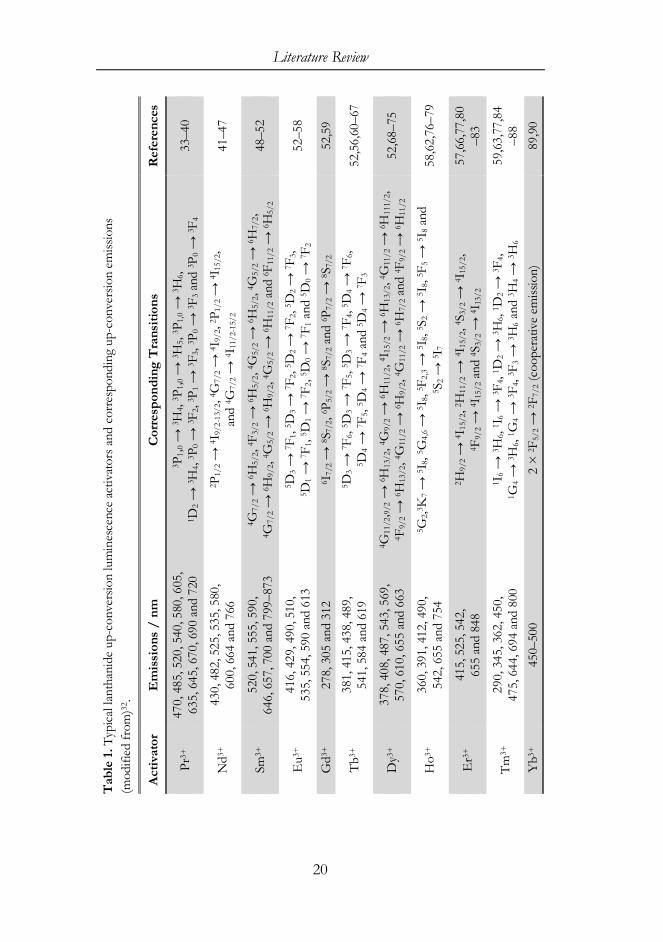
Up-conversion luminescence has been observed from almost everytrivalent lanthanide:32 praseodymium, neodymium, samarium, europium,gadolinium, terbium, dysprosium, holmium, erbium, thulium and evenof ytterbium with only one excited 4f energy level. These typicallanthanide activators show up-conversion luminescence emissions atnear infrared (NIR), visible and even UV wavelengths (Table 1).
Literature Review
20
Ref
eren
ces
33–4
0
41–4
7
48–5
2
52–5
8
52,5
9
52,5
6,60
–67
52,6
8–75
58,6
2,76
–79
57,6
6,77
,80
–83
59,6
3,77
,84
–88
89,9
0
Tab
le1.
Typi
call
anth
anid
eup
-con
vers
ion
lum
ines
cenc
eac
tivat
orsa
ndco
rres
pond
ing
up-c
onve
rsio
nem
issio
ns(m
odifi
edfr
om)32
.
Cor
resp
ondi
ngT
rans
ition
s3 P
1, 0→
3 H4,
3 P1, 0
→3 H
5,3 P
1,0
→3 H
6,1 D
2→
3 H4,
3 P0
→3 F
2,3 P
1→
3 F3,
3 P0
→3 F
3an
d3 P
0→
3 F4
2 P1/
2→
4 I9/
2-13
/2,4
G7/
2→
4 I9/
2,2 P
1/2
→4 I
15/2
,an
d4 G
7/2
→4 I
11/2
-15/
2
4 G7/
2→
6 H5/
2,4 F
3/2
→6 H
5/2,
4 G5/
2→
6 H5/
2,4 G
5/2
→6 H
7/2,
4 G7/
2→
6 H9/
2,4 G
5/2
→6 H
9/2,
4 G5/
2→
6 H11
/2an
d6 F
11/2
→6 H
5/2
5 D3
→7 F
1,5 D
3→
7 F2,
5 D2
→7 F
2,5 D
2→
7 F3,
5 D1
→7 F
1,5 D
1→
7 F2,
5 D0
→7 F
1an
d5 D
0→
7 F2
6 I7/
2→
8 S7/
2,6 P
5/2
→8 S
7/2
and
6 P7/
2→
8 S7/
2
5 D3
→7 F
6,5 D
3→
7 F5,
5 D3
→7 F
4,5 D
4→
7 F6,
5 D4
→7 F
5,5 D
4→
7 F4
and
5 D4
→7 F
3
4 G11
/2, 9/
2→
6 H13
/2,4
G9/
2→
6 H11
/2,4
I 15/
2→
6 H13
/2,4
G11
/2→
6 H11
1/2,
4 F9/
2→
6 H13
/2,4
G11
/2→
6 H9/
2,4 G
11/2
→6 H
7/2
and
4 F9/
2→
6 H11
/2
5 G2,3
K7
→5 I
8,5 G
4,6
→5 I
8,5 F
2,3
→5 I
8,5 S
2→
5 I8,
5 F5
→5 I
8an
d5 S
2→
5 I7
2 H9/
2→
4 I15
/2,2
H11
/2→
4 I15
/2,4
S 3/2
→4 I
15/2
,4 F
9/2
→4 I
15/2
and
4 S3/
2→
4 I13
/2
1 I6
→3 H
6,1 I
6→
3 F4,
1 D2
→3 H
6,1 D
2→
3 F4,
1 G4
→3 H
6,1 G
4→
3 F4,
3 F3
→3 H
6an
d3 H
4→
3 H6
2×
2 F5/
2→
2 F7/
2(c
oope
rativ
eem
issio
n)
Em
issi
ons
/nm
470,
485,
520,
540,
580,
605,
635,
645,
670,
690
and
720
430,
482,
525,
535,
580,
600,
664
and
766
520,
541,
555,
590,
646,
657,
700
and
799–
873
416,
429,
490,
510,
535,
554,
590
and
613
278,
305
and
312
381,
415,
438,
489,
541,
584
and
619
378,
408,
487,
543,
569,
570,
610,
655
and
663
360,
391,
412,
490,
542,
655
and
754
415,
525,
542,
655
and
848
290,
345,
362,
450,
475,
644,
694
and
800
450–
500
Act
ivat
or
Pr3+
Nd3
+
Sm3+
Eu3
+
Gd3
+
Tb3+
Dy3
+
Ho3
+
Er3
+
Tm3+
Yb3
+

Lanthanide Activators
21
If one think about the energy level schemes (Figure 1), up-conversion processes (Figure 3) and the key requirements for up-conversion luminescence,1–3,32 it seems quite clear why up-conversionluminescence is so strong especially for Er3+. Its 4I15/2 → 4I11/2 transitionis in very good resonance with the energy of Yb3+ 2F5/2 level enabling themost efficient ETU mechanism. The energy difference between theintermediate energy level and the lower level is big and there is noquenching cross-relaxation process. Moreover, the absorption of thesecond photon (4I11/2 → 2F7/2 transition) is also efficient due to very goodenergy resonance. Therefore, Er3+ fulfils all the main requirements verywell. Also Tm3+ and Ho3+ show strong up-conversion luminescencethrough the ETU mechanism.
The rest of the lanthanides produce weaker up-conversionluminescence compared to Er3+, Tm3+ and Ho3+ even in the presence ofthe Yb3+ sensitizer.1–3,32 Trivalent praseodymium,33,34 samarium51 anddysprosium74,75 can excite with the ETU mechanism but the nonradiativerelaxation mechanisms weaken the efficiency. Pr3+ has several efficientcross-relaxation processes (Equations 2-4) that can de-excite itnonradiatively back to the 3H4 ground level. Sm3+ and Dy3+ have smallenergy differences between the energy levels below the ca. 10000 cm-1
excitation energy (Figure 1) resulting in efficient nonradiativemultiphonon de-excitation.
(1G4,3H4)→(3H5,3F4),(3H6,3F2),(3F2,3H6)or(3F4,3H5) (2)(1D2,3H4)→(1G4,3F4)or(3F4,1G4) (3)(3P0,3H4)→(1G4,1G4)or(1D2,3H6) (4)
Moreover, neodymium46,47 excites via the ESA mechanisms (λexc: 532or 797 nm) which is less efficient than the ETU mechanism, europiumand terbium excite through the even less efficient cooperativesensitization mechanism56 due to the lack of appropriate intermediateenergy levels (Figure 1) and the up-conversion luminescence of

Literature Review
22
ytterbium89 occurs due to the most inefficient mechanism, cooperativeluminescence. Gadolinium has the first excited level at ca. 32000 cm-1,26,91
well above the energy of NIR radiation, and thus the Yb3+ sensitizercannot transfer energy straight to Gd3+. Therefore, Tm3+ has been usedas an additional sensitizer and Yb3+-Tm3+-Gd3+ energy transfer have beenobtained.59
2.5. Up-conversion Quantum Yield
Up-conversion quantum yield (UCQY) is considerably smaller thanluminescence quantum yield which has been reported to be as high as85 %.92,93 Whereas even in theory the maximum internal UCQY(iUCQY) is only 50, 33 and 100/n % for two, three and n photonprocesses, respectively.94,95 In practice the iUCQY is with currentnanomaterials only about a few percent at the most and often ca. 0.1-1 %even under high power excitation (Table 2). Moreover, the UCQYdecreases rapidly with decreasing crystallite size and for example theiUCQY of a NaYF4:Yb3+,Er3+ material drops about 95 % (from 0.10 to0.005 %) when the crystallite size decreases from 30 to 10 nm (67 %decrease).94 Adding a NaYF4 shell to the NaYF4:Yb3+,Er3 core improvedthe iUCQY by 200 % but was still only 0.30 % with 30 nm crystallites.

Up-conversion Quantum Yield
23
Tab
le2.
iUC
QY
and
norm
alize
diU
CQ
Yva
lues
ofup
-con
vers
ion
lum
ines
cenc
em
ater
ials
with
diffe
rent
sizes
,w
avel
engt
hsan
dirr
adia
nce
(mod
ified
from
)96.
Ref
eren
ce
97 97 98 99 94 94 94 94 100
101
101
101
102
103
104
Nor
mal
ized
iUC
QY
/cm
2 W- 1
0.01
7±
0.00
20.
047
±0.
005
3.9
*10
-4
8*
10-5
2*
10-5
<6
*10
-5
<4
*10
-7
2*
10-5
1*
10-5
- - - -0.
02<
5*
10-4
iUC
QY
/%
0.71
±0.
082.
01±
0.19
0.7
1.2
±0.
10.
3±
0.1
0.10
±0.
050.
005
±0.
005
0.30
±0.
100.
05±
0.02
0.04
0.14 0.3
0.05
to0.
255
0.6
±0.
13.
5
Irra
dian
ce/
Wcm
-2
0.43
±0.
030.
43±
0.03
18 150
150
150
150
150
5060
mW
lase
r60
mW
lase
r60
mW
lase
r38
0m
Wla
ser
0.3 78
λ exc
/nm
1523
1523
1532
1490
980
980
980
980
980
976
976
976
972
980
980
Size
(with
shel
l)/
nm
19.2
(38.
8)19
.2(3
8.8)
22(2
5/38
)85 10
030 8–10 30 300
16 27 200
200
20(2
7)30
(42)
Mat
eria
ls
β-N
aYF 4
:Er3+
/β-N
aLuF
4
β-N
aYF 4
:Er3+
/β-N
aLuF
4in
PMM
Aβ-
NaY
F 4:E
r3+/β
-NaY
F 4Li
YF 4
:Er3
+
β-N
aYF 4
:Yb3
+,E
r3+
β-N
aYF 4
:Yb3
+,E
r3+
β-N
aYF 4
:Yb3
+,E
r3+
β-N
aYF 4
:Yb3
+,E
r3+/β
-NaY
F 4β-
NaY
F 4:Y
b3+,E
r3+
LiY
F 4:Y
b3+,E
r3+
LiY
F 4:Y
b3+,E
r3+
LiY
F 4:Y
b3+,E
r3+
β-N
aYF 4
:Yb3
+,E
r3+
β-N
aYbF
4:Tm
3+/C
aF2
β-N
aYF 4
:Yb3
+,T
m3+
/β-N
aYF 4

Literature Review
24
The iUCQY of a microcrystalline NaYF4:Er3+ has been reported tobe even 12 ± 1.0 % under low irradiance of 0.40 ± 0.02 Wcm-2 at1523 nm meaning that the normalized iUCQY is 0.3 cm2W-1.97,105
Therefore, more studies are needed to improve the efficiency of thenanomaterials. It is therefore important to know how small crystallitesyou really need to avoid unnecessary decrease in the up-conversionluminescence intensity. Even though some researchers think thequantum efficiency of up-conversion luminescence materials is too lowfor practical use, up-conversion luminescence materials are already goodenough for at least some bioanalytical applications such as thecommercial Upcon™ concept developed by Kaivogen Oy, Finland andLabrox Oy, Finland.106
UCQY can be measured using two different methods: externalUCQY (eUCQY) and iUCQY.13,96,97 The eUCQY and iUCQY describethe efficiency of the material and up-conversion process, respectively.The UCQY values depend on the excitation power density because up-conversion luminescence is a nonlinear process, i.e. at least two excitationphotons are needed for one emission photon.95,96 Therefore, alsonormalized UCQY values, which take into account the powerdependency, are used. The UCQY methods are defined as:1,13,94–97,107,108
eUCQY = (5)
iUCQY= =1
Auc= − (6)
normalizedUCQY =UCQY
I (7)
where ϕuc, ϕin and ϕabs are the photon fluxes of the up-converted,incident and absorbed photons, respectively. Auc is the absorbance of thesample, Ls is the emission intensity of the sample, Es and Er are the

Sodium Yttrium Tetrafluoride
25
intensities of the excitation light not absorbed by the sample and thereference sample, respectively, and I is the irradiance of the excitation.
An integrating sphere is usually used to ensure that all emitted,transmitted and reflected radiation is collected (Figure 4).94–96,107,109 Bothabsolute and relative quantum yield measurements are used but due tothe lack of reliable reference samples the absolute measurements aremore reliable if the system is properly calibrated.94,96,109 This includes thecalibration of the monochromators, detectors as well as the integratingsphere.94 All in all, measuring the UCQY reliably can be challenging andthus often UCQY values are not presented. However, such a method,using a commercially available spectrophotometer, has been presentedfor example by Boyer and van Veggel.94
Figure 4. Diagram of an integrating sphere setup for luminescence measurements.Dashed and solid line represent excitation light and sample emission, respectively.94
2.6. Sodium Yttrium Tetrafluoride
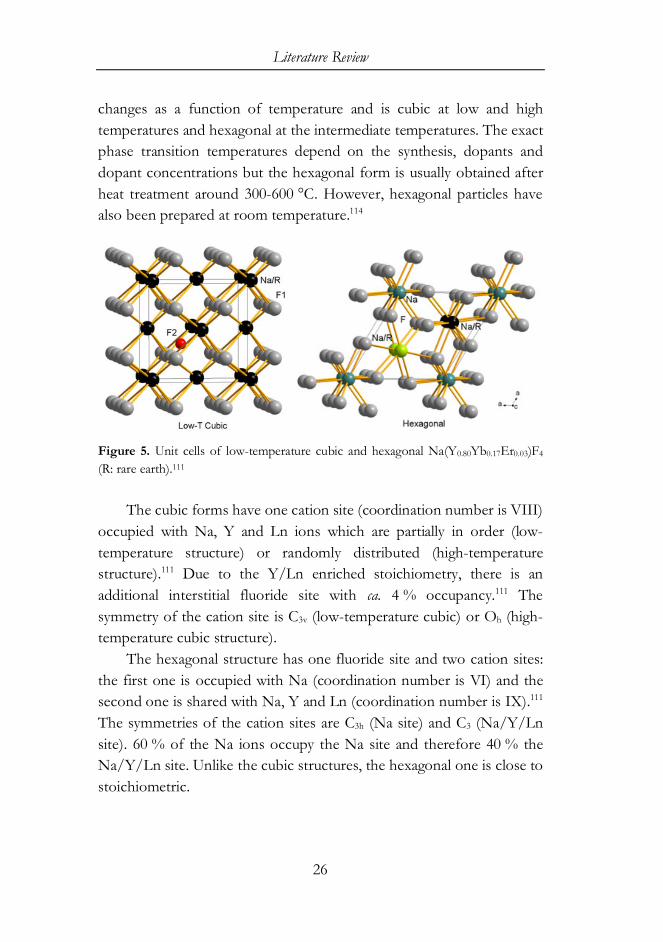
Lanthanide doped NaYF4 materials have three different crystalstructures:110,111 low- and high-temperature cubic fluorite (CaF2) typestructure (Fm3m, #225, Z: 2)112, as well as hexagonal structure (P63/m,#176, Z: 1.5)113 at the intermediate temperatures (Figure 5). The structure
Literature Review
26
changes as a function of temperature and is cubic at low and hightemperatures and hexagonal at the intermediate temperatures. The exactphase transition temperatures depend on the synthesis, dopants anddopant concentrations but the hexagonal form is usually obtained afterheat treatment around 300-600 °C. However, hexagonal particles havealso been prepared at room temperature.114
Figure 5. Unit cells of low-temperature cubic and hexagonal Na(Y0.80Yb0.17Er0.03)F4
(R: rare earth).111
The cubic forms have one cation site (coordination number is VIII)occupied with Na, Y and Ln ions which are partially in order (low-temperature structure) or randomly distributed (high-temperaturestructure).111 Due to the Y/Ln enriched stoichiometry, there is anadditional interstitial fluoride site with ca. 4 % occupancy.111 Thesymmetry of the cation site is C3v (low-temperature cubic) or Oh (high-temperature cubic structure).
The hexagonal structure has one fluoride site and two cation sites:the first one is occupied with Na (coordination number is VI) and thesecond one is shared with Na, Y and Ln (coordination number is IX).111
The symmetries of the cation sites are C3h (Na site) and C3 (Na/Y/Lnsite). 60 % of the Na ions occupy the Na site and therefore 40 % theNa/Y/Ln site. Unlike the cubic structures, the hexagonal one is close tostoichiometric.

Sodium Yttrium Tetrafluoride
27
The cubic forms are not as good as the hexagonal one for up-conversion luminescence and thus the hexagonal form is usuallypreferred.3,84,115–117 One difference between the cubic and hexagonalforms is the more compact structure of the hexagonal form resulting inshorter distances between lanthanides enabling more efficient energytransfer.111 The hexagonal form is considered to be among the best hostsfor efficient up-conversion luminescence – if not the best one.3,84,115–118
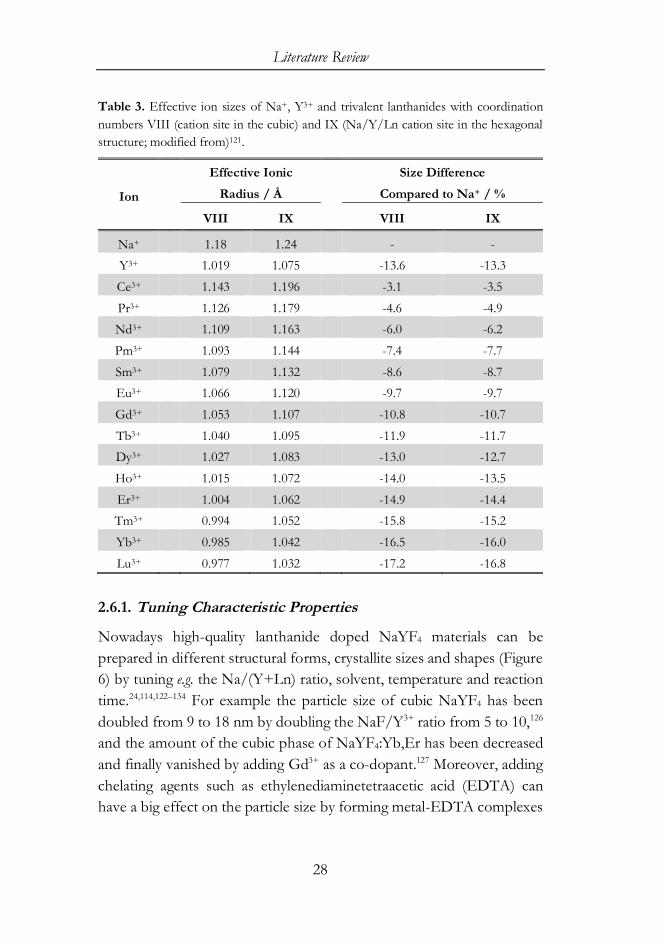
The hexagonal form has outstanding properties such as low phononenergy of the crystal lattice (ca. 500 cm-1 max118–120), two different latticesites for the dopant ions,116,118 and the quite similar effective ion sizes ofNa+, Y3+ and trivalent lanthanide dopants (the size differences are lessthan 18 % compared to Na+;121 Table 3). The weighted average of thephonon energy of NaYF4 is only ca. 360 cm-1,119 the phonon energies ofNaYF4 and NaLnF4 (Ln: La, Ce, Pr, Sm, Eu or Gd) materials are under500 cm-1,120 and therefore also NaYF4 material doped with Yb3+ and Er3+
have similar (under 500 cm-1) phonon energies.118 The low phononenergy hinders the nonradiative multiphonon de-excitation processes25,26
(section 2.1) which results in long lifetimes of the excited states.3 The twopossible lattice sites for the dopants increases the probability of theenergy transfer from a sensitizer to an activator.116 The similar cationsizes prevents the formation of lattice defects and stress.3
Literature Review
28
Table 3. Effective ion sizes of Na+, Y3+ and trivalent lanthanides with coordinationnumbers VIII (cation site in the cubic) and IX (Na/Y/Ln cation site in the hexagonalstructure; modified from)121.
Ion
Effective Ionic
Radius / Å
Size Difference
Compared to Na+ / %
VIII IX VIII IX
Na+ 1.18 1.24 - -Y3+ 1.019 1.075 -13.6 -13.3Ce3+ 1.143 1.196 -3.1 -3.5Pr3+ 1.126 1.179 -4.6 -4.9Nd3+ 1.109 1.163 -6.0 -6.2Pm3+ 1.093 1.144 -7.4 -7.7Sm3+ 1.079 1.132 -8.6 -8.7Eu3+ 1.066 1.120 -9.7 -9.7Gd3+ 1.053 1.107 -10.8 -10.7Tb3+ 1.040 1.095 -11.9 -11.7Dy3+ 1.027 1.083 -13.0 -12.7Ho3+ 1.015 1.072 -14.0 -13.5Er3+ 1.004 1.062 -14.9 -14.4Tm3+ 0.994 1.052 -15.8 -15.2Yb3+ 0.985 1.042 -16.5 -16.0Lu3+ 0.977 1.032 -17.2 -16.8
2.6.1. Tuning Characteristic Properties
Nowadays high-quality lanthanide doped NaYF4 materials can beprepared in different structural forms, crystallite sizes and shapes (Figure6) by tuning e.g. the Na/(Y+Ln) ratio, solvent, temperature and reactiontime.24,114,122–134 For example the particle size of cubic NaYF4 has beendoubled from 9 to 18 nm by doubling the NaF/Y3+ ratio from 5 to 10,126
and the amount of the cubic phase of NaYF4:Yb,Er has been decreasedand finally vanished by adding Gd3+ as a co-dopant.127 Moreover, addingchelating agents such as ethylenediaminetetraacetic acid (EDTA) canhave a big effect on the particle size by forming metal-EDTA complexes

Sodium Yttrium Tetrafluoride
29
resulting in smaller particle size and narrower size distribution (section2.6.2).24
Figure 6. TEM and HRTEM (inset) images of β-NaYF4 nanorods redispersed intoluene/hexane (1:1) (a) and in toluene/hexane/ethanol (1:1:0.48) (b), of β-NaYF4
nanoplates (c), of β-NaNdF4 nanorods (d), and of β-NaEuF4 nanorods (e). TEM andHRTEM (inset, upper: lying flat on the face; lower: standing on the side face from thehighlighted square) images of β-NaHoF4 hexagonal plates (f).122
Also co-doping for example with Mn2+ has a big effect on thestructural form and crystallite size of lanthanide doped NaYF4
materials.19,135 Adding Mn2+ favors the formation of the cubic form(adding 5 % or more Mn2+ shows only the cubic form) and the crystallite

Literature Review
30
size can be tuned by changing Mn2+ concentration. Interestingly, theMn2+ co-doping has also a huge effect on the red-to-green ratio (increasesfrom 1 to 160) of the Er3+ up-conversion luminescence: doping 30 mol-% Mn2+ quenches the green emissions almost entirely while the redemission becomes stronger (Figure 7 left). This has been attributed to bedue to nonradiative energy transfers from Er3+ to Mn2+ and then back toEr3+ feeding the 4F9/2 level emitting red luminescence (Figure 7 right).Moreover, the Mn2+ doping increases the up-conversion luminescenceintensity which has been presented to be due to changes in the activatorenvironment and the energy transfers between Er3+ and Mn2+.
Figure 7. Room temperature upconversion emission spectra of NaYF4:Yb/Er(18/2 mol-%) nanocrystals with 0 and 30 mol-% Mn2+ dopant ions dispersed incyclohexane (1 mg/dm3; left). Inset shows the corresponding luminescent photographs.Schematic energy level diagram showing the possible upconversion mechanism ofMn2+-doped NaYF4:Yb/Er nanocrystals (right).19
2.6.2. Co-precipitation Synthesis
NaYF4:Yb3+,Ln3+ nanomaterials can be prepared with several differenttechniques and co-precipitation24 is one of the simplest ones. Thus wechose to use this synthesis in the present experimental work. Thesynthesis is carried out by mixing aqueous solutions of NaF, YCl3 andLnCl3 (Ln: Yb and a lanthanide activator) and EDTA at roomtemperature to form metal-EDTA complexes. The precipitate isseparated by centrifuging, washed with water and ethanol, dried,annealed for five hours at desired temperature (ca. 400-600 °C) under

Sodium Yttrium Tetrafluoride
31
H2/N2 gas sphere and cooled down to room temperature. With the co-precipitation synthesis, the particle size can be controlled effectively from37 to 166 nm by chancing the molar ratio of EDTA and Ln3+ (Figure 8).However, impurity cubic form is observed when EDTA is used. Thisweakens the up-conversion luminescence and thus EDTA is sometimesnot used in the synthesis.
Figure 8. TEM image of as-prepared NaYF4:Yb,Er nanoparticles prepared with co-precipitation synthesis using a molar ratio of 1:1 EDTA/lanthanides (left) andrelationship between TEM particle size and EDTA/Ln3+ ratio (right).24
2.6.3. Core-shell Concept
The nanoscale size of the up-conversion luminescence particles ispreferred in many applications but unfortunately nanoparticles haveweaker efficiency compared to corresponding bulk materials (section 2.5)due to the bigger surface to volume ratio resulting in surfacequenching.136 Moreover, the molecules on the surface such as OH- ofwater can quench the luminescence due to multiphonon de-excitationprocesses.137,138 OH- for example has several times higher phononenergies (ca. 3500 cm-1) compared to the lattice phonons of the hexagonalNaYF4 (ca. 500 cm-1 max118–120) which increases the probability of themultiphonon de-excitation.
To avoid the quenching, different core-shell structures have beenstudied to protect the dopants contributing to the up-conversionluminescence process and both passive82,94,136,138–144 (e.g. silica or undopedhost) and active52,145–149 (e.g. host with dopants) shells have been studied.However, the core-shell interface may also, and probably will, contain

Literature Review
32
quenching sites which complicates the core-shell method. Anyway inmany cases (e.g. bio applications) some kind of surface modification ofthe up-conversion luminescence nanoparticles is usually required tomake them for example water dispersible and compatible with biologicalsubstrates and a silica shell is a common starting point.
High quality core-shell materials with a narrow size distribution canbe prepared using for example a layer-by-layer method to grow the shell,using Ostwald ripening dynamics, on nanocrystals prepared by using e.g.an oleic acid synthesis (Figure 9).140,143 The shell thickness increases by ca.1 nm with every layer which allows the fine tuning of the shell thickness.Moreover, each layer increases the up-conversion luminescence intensityshowing the protective effect of the shell. All in all, the core-shell concepthas proven to be an efficient method to enhance the luminescenceproperties of the lanthanide doped NaYF4 up-conversion luminescencenanomaterials.
Figure 9. (A–E) TEM images and size distribution of NaYF4:Yb3+/Er3+ (15/2 %) corenanocrystals (t = 0), NaYF4:Yb3+/Er3+ (15/2 %) core/NaYF4 shell nanocrystals aftersuccessive layer-by-layer epitaxial growth at t = 5, 10, 15, and 20 min, respectively; (F)ICP-MS (inductively coupled plasma mass spectrometry) elemental analysis of the coreand core–shell nanocrystals with same number concentration of nanocrystals; (G)upconversion emission spectra of the hexane dispersions of core and core–shellnanocrystals with same number concentration of nanocrystals under 980 nmexcitation.143

Sodium Yttrium Tetrafluoride
33
2.6.4. Basic Characterization Methods
Lanthanide doped NaYF4 up-conversion luminescence materials arecommonly characterized by using XPD, TEM and luminescencespectroscopy including decay and power dependence measurements.35,57–
59,67,81,82,84,85,87 XPD is used to determine the crystal from (cubic and/orhexagonal), the presence of crystalline impurities (e.g. NaF and NaCl) andcrystallite size by using the Scherrer formula (when smaller than ca.100 nm):150,151
=0.9
(8)
where d (m) is the mean crystallite size, λ (m) is the wavelength of theincident X-rays and θ (°) is half of the Bragg´s angle (2θ). Moreover, β isthe full width at half maximum (FWHM) of the reflection aftereliminating the broadening due to the instrument:
= − (9)
where s and r refers to the sample and microcrystalline reference,respectively.
TEM can be used to study the particle size and morphology. Thedecay and power dependence measurements are used to study excitationand energy transfer mechanisms. Up-conversion luminescence intensityincreases linearly, in a log-log diagram, as a function of excitation powerand the slope of the fitting curve reveals the amount of photons involvedin the process: the slope is ca. 2, 3 and n for two, three and n photonprocesses, respectively.
The formation of the core-shell structure can be shown by usingXPS, cryo-transmission electron microscopy (cryo-TEM), scanningtransmission electron microscopy (STEM), energy-dispersive X-rayspectroscopy (EDS or EDX), electron energy loss spectroscopy (EELS)and high-angle annular dark-field (HAADF) methods (Figure 10).140,152,153

Literature Review
34
Moreover, several indirect characterization methods such as selected areaelectron diffraction (SAED), TEM, high-resolution TEM (HRTEM) andX-ray diffraction (XRD) have been used to evaluate if a core-shellstructure is formed.82,144,147,149
Figure 10. HAADF image of a single NaYF4:Yb,Er@NaGdF4 nanocrystal (left). Theinsets show the corresponding chemical maps and reveal the presence of yttrium at thenanocrystals center (blue) and gadolinium at the periphery of nanocrystals (yellow).EELS spectra of yttrium L2,3 (right up) and gadolinium M4,5 (right down) edges takenfrom the probe location on the inferred NaYF4:Yb,Er core and NaGdF4 shell (left)using the nanocrystal with 6 monolayers NaGdF4 shell.140

35
3. AIMS OF THE EXPERIMENTAL WORK
The aim of the experimental work was to study and improve theproperties of lanthanide (Pr, Nd, Sm, Eu, Tb, Dy, Ho, Er, Tm and Ybwere used) doped NaYF4 up-conversion luminescence materials. Theproperties were studied comprehensively using novel methods such asTG-DSC, XPD, TEM, TOF-SIMS, XPS, EXAFS, and luminescencespectroscopy. The main research topics were the following:
1. Improving the co-precipitation synthesis to produce pure hexagonalNaYF4:Yb3+,Ln3+ materials (Publications I-III).
2. Studying the structural details causing the up-conversionluminescence enhancement (I and II).
3. Improving the up-conversion luminescence efficiency (I-III).
4. The role of the Er3+ impurity on the up-conversion luminescenceefficiency and color (III and IV).
5. Phase transition temperatures and behaviour under heating (V).
6. Up-conversion luminescence of lanthanides (III, IV and VI).
7. Utilizing the improved synthesis and up-conversion luminescenceefficiency (VI).

36
4. MATERIALS AND METHODS
4.1. Materials Preparation
Yttrium and lanthanide oxides (Table 4) were dissolved in hydrochloricacid (pro analysi, 37 %, Sigma Aldrich) and diluted with quartz distilledwater to prepare aqueous YCl3 and LnCl3 solutions with 0.5 moldm-3
Y3+/Ln3+ concentration (Equation 10). The pH was adjusted to ca. 2.Sodium fluoride (pro analysi, Sigma-Aldrich) and absolute ethanol(99.5 %, Altia) were used as received.
Table 4. The yttrium and lanthanide oxides used to synthesize lanthanide doped NaYF4
materials.
Compound Formula Purity* / % Manufacturer
Yttrium oxide Y2O3 99.99 Sigma-AldrichPraseodymium oxide Pr6O11 99 TyppiNeodymium oxide Nd2O3 99.9 Rhône-Poulenc
Samarium oxide Sm2O3 99.9 Rhône-PoulencEuropium oxide Eu2O3 99.99 Double Pilots Group HoldingsTerbium oxide Tb4O7 99.9 Rhodia
Dysprosium oxide Dy2O3 99.9 RhodiaHolmium oxide Ho2O3 99.9 RhodiaErbium oxide Er2O3 99.99 AldrichThulium oxide Tm2O3 99.9 Rhône-Poulenc
Ytterbium oxide Yb2O3 99.99 Metal Rare Earth
*With respect to other lanthanides.
( ) + 6 ( ) → 2 ( ) + 3 ( ) (10)

Characterization Methods
37
NaYF4, NaYbF4, NaYF4:Yb3+ and NaYF4:Yb3+,Ln3+ (Ln: Pr, Nd,Sm, Eu, Tb, Dy, Ho, Er or Tm) up-conversion luminescence materialswere prepared with selected dopant concentrations (xYb: 0.10-0.20,xPr: 0.001-0.01, xNd: 0.002-0.04, xSm: 0.002-0.02, xEu: 0.002-0.04,xTb: 0.005-0.08, xDy: 0.002-0.02, xHo: 0.02, xEr: 0.03 and xTm: 0.005) usingthe co-precipitation synthesis24. Solid NaF (2.1 g; 0.050 mol) wasdissolved to quartz distilled water (60 cm3). This solution was furthermixed with aqueous solution (20 cm3; 0.010 mol) containing YCl3, YbCl3and LnCl3 to obtain the stoichiometry desired (Equation 11). An excessamount of sodium was used to force the formation of the NaYF4 phaseinstead of the YF3 and to ensure the formation of the hexagonal crystalform during the post-annealing.
( ) + 4 ( ) → ( ) + 3 ( ) (11)
After stirring for one hour at room temperature, the precipitateformed was centrifuged (3766 g) for eight minutes, washed three timeswith water (3*20 cm3) and once with ethanol (20 cm3) or only once withethanol. Each washing was followed by centrifuging. The precipitate wasthen dried in a vacuum desiccator at room temperature and a selectedamount (ca. 0.15 of 0.8 g) of the dry product powder was annealed(Thermo Electron Corporation Lindberg/blue M furnace) inside a quartzglass reactor for five hours at 500 °C under a static N2 + 10 % H2 gassphere. After annealing, the materials were cooled down freely to theroom temperature under the same gas sphere. More N2 + 10 % H2 gaswas added to the quartz reactor during the cooling to preventreplacement air to enter.
4.2. Characterization Methods
4.2.1. Transmission Electron Microscopy
The particle size and shape of the NaYF4 materials were analyzed withTEM using a JEM-1400 Plus transmission electron microscope. Theacceleration voltage was 80 kV and resolution 0.38 nm. The microscope
Materials and Methods
38
was equipped with an OSIS Quemesa 11 Mpix bottom mounted digitalcamera.
4.2.2. Thermogravimetry and Differential Scanning Calorimetry
The thermal behaviour of the as-prepared materials was studied with aTA Instruments SDT Q600 simultaneous TG-DSC apparatus between25 and 720 °C in flowing N2 (100 cm3min-1). The materials were studiedwith the DSC to determine the cubic-to-hexagonal and hexagonal-to-cubic phase transition temperatures. This information is crucial whenselecting the annealing temperature for obtaining the hexagonal crystalform.
A heating rate of 5 °Cmin-1 and sample mass of ca. 10 mg were used.The sample pan was made of aluminium oxide and a similar but emptypan was used as a reference material. The specific enthalpies of the phasetransitions were calculated by integrating the corresponding DSC signals.Selected materials were studied to higher temperatures (up to 1300 °C)and some were also examined during the cooling phase to study thereversibility of the processes occurring during the heating.
4.2.3. X-ray Powder Diffraction
The structure and phase purity of the materials were analyzed with XPDmeasurements by comparing the patterns to the reference patterns of thecubic112 NaYF4 and hexagonal113 Na(Y0.57Yb0.39Er0.04)F4. The patternswere collected at room temperature with a Huber G670 image plateGuinier camera (2θ range 4–100°, data interval 0.005°) withmonochromatic copper Kα1 radiation (λ: 1.54056 Å). The effect of thepreferred orientation was minimized by oscillating the samplehorizontally. The asymmetry of the reflections at low angles is due to theapparatus used. However, this effect can be corrected even for Rietveldstructure refinements.
For the Rietveld analyses154 the dataset was summed from twelvehalf an hour measurements. The Rietveld analyses were carried out withthe FullProf.2k program.155 The microstrains and crystallite sizes were

Characterization Methods
39
calculated from the reflection widths of the whole diffraction patterns byusing Williamson-Hall plots,156,157 which are based on the followingequations:
=1
+ 2 ∗ (12)
and
= 2 (13)
with DK equal to the relative reflection broadening, D is the crystallitesize, e is the strain, d* is the reciprocal d spacing (= 2sinq/l) and Dq isequal to the half of the FWHM (in radians). The crystallite size and ther.m.s. (root mean square) strain were obtained from the intercept and theslope of the DK vs. d* plot, respectively. Silicon powder (NIST standard640b) was used as the reference for the reflection widths.
4.2.4. Extended X-ray Absorption Fine Structure
The environments of Y, Yb and Tb in selected NaYF4:Yb3+,Tb3+
materials were studied using EXAFS. The measurements were carriedout at room temperature at beamlines A1 and C at the DORIS storagering of HASYLAB (Hamburger Synchrotronstrahlungslabor) at DESY(Deutsches Elektronen-Synchrotron) in Hamburg, Germany.
Data was collected from the Y K, Tb LIII and Yb LIII edges using aSi(111) double crystal monochromator. The measurements were carriedout in a fluorescence mode using a M3 7 pixel silicon drift detector(SDD). The energy range was from -100 to 600 eV with respect to theabsorption edge. Steps of 0.3 eV and 0.4 nm–1 were used for the datacollection at the near edge and extended regions, respectively. The totaltime per measurement was ca. 1 h from which one minute took placebefore the edge.

Materials and Methods
40
The data handling and the extraction of the interatomic distancesfrom the EXAFS data was carried out with the EXAFSPAK programpackage.158 For the Fourier transforms, photoelectron wave vector (k;Equation 14 where E0 is the edge energy) ranges starting from 30 nm–1
were used to avoid the increased multiple scattering contributions atlower energies. The end value was set as high as allowed by the data,usually to 120 nm-1.
= 0.2625( − ) (14)
4.2.5. Time-of-flight Secondary Ion Mass Spectrometry
The elemental distributions, impurities and depth profiles were studiedwith TOF-SIMS using a TOF.SIMS 5 spectrometer (IONTOF) with apulsed 30 keV Bi+ beam. The measurement area was 100 * 100 μm2 andsputtering was done with oxygen to obtain three dimensional (3D)images. The TOF-SIMS measurements were kindly provided by Dr.Duvenhage and Prof. Swart (University of the Free State, Bloemfontein,South Africa).
4.2.6. X-ray Photoelectron Spectroscopy
The elemental compositions and dopant concentrations were studiedwith XPS using a PHI 5000 VersaProbe spectrometer withmonochromatic Al Kα radiation (E: 1486.6 eV). Survey spectra weremeasured from 0 to 1400 eV (1 eV/step) and high resolution spectra(0.1 eV/step) were measured in selected narrower energy ranges. Themeasurements were made from the surface and after 30 s sputtering (ca.18 nm/min). A low energy Ar+ ion gun and low energy neutralizerelectron gun was used to minimize charging on the surface. The XPSmeasurements were kindly provided by Dr. Coetsee-Hugo and Prof.Swart (University of the Free State, Bloemfontein, South Africa).
The spectra were corrected with the C1s signal at 284.6 eV and therelative atomic concentrations were estimated by calculating the peak

Characterization Methods
41
areas from the survey spectra. The Origin 2015 program159 was used tofit the high resolution XPS spectra using the Gaussian function:
= +
( )( )
4 (2)
(15)
where y0, xc, A and w are the base, center, area and FWHM, respectively.
4.2.7. Up-conversion Luminescence and Decay Time
Up-conversion luminescence spectra were measured from dry powdersinside a capillary tube at room temperature with a CCD (charge-coupleddevice) spectrometer (Ocean Optics PC2000). The NIR excitation(λexc: 976 nm; ν: 10246 cm-1) source was a continuous wave HamamatsuL9418-04 laser diode. The optical part of the setup consisted of tubularexcitation and emission chambers (Thorlabs) in a right-angleconfiguration, and an optical fiber to direct emission to the detector.(Figure 11). The spectra were collected with an Ocean Optics OOIIrradsoftware.
Figure 11. A schematic figure of the up-conversion luminescence measuring setup.
In the excitation light path, a RG850 long-pass filter (EdmundOptics) with a cutoff at 850 nm was used to ensure a pure NIR excitation(Figure 12). In the emission light path, an extended hot mirror filter(Edmund Optics) with a good transmission at the visible wavelengths

Materials and Methods
42
was used to exclude the scattered excitation radiation. However, thetransmission is poor around 390-420 nm.
Figure 12. Transmittance spectra of the filters used in the up-conversion luminescencemeasurements.
Up-conversion luminescence decay curves were measured from drypowders inside a capillary tube at room temperature with a head-onR1464 photomultiplier (Hamamatsu). The excitation source and theoptical setup of the excitation side was the same as in the spectralmeasurements (Figure 11). The optical setup of the emission side wasotherwise the same but it included a bandpass filter (Thorlabs FL543.5-10: 543.5 ± 5 nm or Newport 10LF10-488: 488 ± 5 nm) and the opticalfiber was replaced by the photomultiplier.
The photomultiplier signal was amplified with a DHPCA-100 high-speed current amplifier (Femto Messtechnik GmbH). The amplifiedsignal was recorded with a NI USB-6251 A/D (analog-to-digital)converter, which was connected to a computer via USB and controlledwith a computer program written in LabVIEW 8.5 (NationalInstruments). The pulse profile consisted of a 1 ms waiting time followedby a 20 ms excitation pulse and a 80 ms delay period after switching ofthe laser. Therefore, one cycle was 101 ms long. The pulse profile wascycled 10000 times during a single measurement.

43
5. RESULTS AND DISCUSSION
5.1. Effects of Different Preparation Methods
Since the hexagonal form shows stronger up-conversion luminescencethan the cubic forms and the presence of an excess Na is essential duringthe cubic-to-hexagonal phase transition,111 the effect of increasing the Naamount was studied. The co-precipitation synthesis includes an excessamount of the NaF precursor but the water washings dissolve most ofthe excess NaF away. Thus the water washings were omitted to simplyincrease the amount of the NaF and thus Na present during the post-annealing. The properties and differences of thus prepared lanthanidedoped NaYF4 materials with and without the water washings werestudied extensively.
5.1.1. Thermal Behaviour
The DSC curves show that the phase transitions occur at the sametemperature ranges when the same preparation method is used (III, V).The cubic-to-hexagonal transition occurs at 400-450 or 325-375 °C withor without water washings, respectively, and the hexagonal-to-cubictransition occurs at 650-700 °C with both washing methods (III). Thusthe cubic-to-hexagonal phase transition temperature is ca. 100 °Clower without the water washings due to the presence of the excess NaFwhich works as a source for the sodium needed for the transition.Whereas with the water washings the sodium deficiency hinders thetransition and therefore requires higher temperature. It is also notablethat the hexagonal-to-cubic phase transition temperature is almostunaffected by the dopant and its concentration although the cubic-to-hexagonal transition temperature decreases with decreasing dopant sizeand concentration. After the post-annealing, the materials can be cooledto the room temperature because the phase transitions are irreversible.160

Results and Discussion
44
The TG measurements show only minor (under 5 %) mass lossesbelow 800 °C (IV, V). The mass change is the fastest at low temperatures(below 300 °C) and can be attributed to occur mainly due to the removalof water, ethanol and possible water of crystallation. Above 300 °C themass loss is due to the slow evaporation of the NaF. The mass loss rateis small at intermediate temperatures between the phase transitiontemperatures and thus the annealing is safe regarding the stability of thematerials. At higher temperatures the mass decreases strongly and thetotal mass loss is ca. 40 % when heated up to 1200 °C. This is due to theevaporation of the NaF resulting in the decomposition of the NaYF4.However, such high temperatures are not necessary to obtain thehexagonal crystal form.
5.1.2. Crystal Form and Phase Purity
The XPD patterns show that with water washings some of the post-annealed materials contain also the cubic form in addition to thehexagonal one (III, V). The presence and amount of the cubic formdepends on the dopant and its concentration but no clear correlation wasobserved (V): For example with the Nd3+ and Eu3+ doped materialsincreasing the Ln3+ concentration reduced the amount of the cubic formand with the Sm3+ and Tb3+ doped materials it was the opposite.However, it was found out that if the water washings were omitted, thecrystal form of the post-annealed materials was pure hexagonal with notrace of the cubic form (III, VI).
The only drawback of omitting the water washings is the presenceof NaF and NaCl impurities (I, III, VI). However, those impurities couldprobably be washed away after the annealing without harming thematerial but that must be studied in the future. Anyway, as a result of thisfinding new materials can be prepared with pure hexagonal structurewhich is better than the cubic form for efficient up-conversionluminescence. Therefore, a wider selection of lanthanide dopants andconcentrations are now obtainable for the NaYF4 host using the samesynthesis.

Effects of Different Preparation Methods
45
5.1.3. Particle Size and Shape
TEM images show clearly that the particle surfaces of the as-preparedNaYF4 materials is smoother with than without the water washings(Figure 13). It seems that the particles are covered with some smallerparticles without the water washings and there are also bigger bar andstar-like particles. Otherwise the particle shape is quite similar with bothwashing methods. Based on the XPD studies showing the presence ofthe excess NaF (I, III, VI), it is probable that the as-prepared NaYF4
particles prepared without the water washings are covered with the NaF.The particle size is ca. 200-300 nm independent of the washing method.However, the particle size distribution is not very narrow so there is somesmaller and bigger particles as well.
Figure 13. TEM images of the as-prepared NaYF4 materials prepared without (a, c)and with (b, d) the water washings.
After annealing the NaYF4 materials at 500 °C for five hours, theTEM images show aggregated particles with both washings methods(Figure 14). Without the water washings, the particle size is over 500 nm,even 1 μm, which is considerably bigger than the ca. 200-300 nm with thewater washings. There are also some considerably smaller particles withthe water washings which could be for example due to impurity YF3
phase.

Results and Discussion
46
Figure 14. TEM images of the annealed (5 h @ 500 °C) NaYF4 materials preparedwithout (a, c) and with (b, d) the water washings.
5.1.4. Elemental Distribution
3D TOF-SIMS images show that the as-prepared NaYF4 materialobtained without the water washings, which have a layer on top of theparticles (Figure 13 a and c), clearly have more sodium on the surfacecompared to the bulk (Figure 15 left). With the corresponding NaYF4
material prepared with the water washings, sodium is more evenlydistributed (Figure 15 right). Thus, these results support the hypothesisof the NaF covering the as-prepared NaYF4 materials without the waterwashings.
Figure 15. 3D TOF-SIMS overlay images of the as-prepared NaYF4 materials preparedwithout (left) and with (right) the water washings showing sodium and yttrium with redand green color, respectively (surface area: 100 * 100 μm2, depth: unknown).

Effects of Different Preparation Methods
47
However, the corresponding Yb3+-Tb3+ co-doped NaYF4 materialsdo not show exactly the same kind of behaviour: sodium is more evenlydistributed all over the materials (Figure 16). But there is still moresodium on the surface compared to the bulk and the smaller amount ofyttrium in the bulk might be just due to the lower concentration ofyttrium due to the Yb3+-Tb3+ co-doping (total 23 mol-%). In any case,there might be, and probably is, some variation between syntheses.
Figure 16. 3D TOF-SIMS overlay images of the as-prepared NaYF4:Yb3+,Tb3+
materials prepared without (left) and with (right) the water washings showing sodiumand yttrium with red and green color, respectively (surface area: 100 * 100 μm2, depth:unknown).
The annealed (5 h @ 500 °C) NaYF4 and NaYF4:Yb3+,Tb3+
materials show much more variation in the sodium concentrationcompared to the as-prepared materials (Figure 17). Again the surfaces arericher of the sodium than the bulk. However, sodium is distributed quiteunevenly especially with the Yb3+-Tb3+ co-doped materials and there arespots with very high amounts of sodium going deep below the surface.This could mean that there is some sodium-richer compound among theparticles: e.g. NaF and/or NaCl which are observed in the XPDmeasurements (I, III, VI).

Results and Discussion
48
Figure 17. 3D TOF-SIMS overlay images of the annealed NaYF4 (a and b) andNaYF4:Yb3+,Tb3+ (c and d) materials prepared without (a and c) and with (b and d) thewater washings showing sodium and yttrium with red and green color, respectively(surface area: 100 * 100 μm2, depth: unknown).
More detailed TOF-SIMS image of the surface of annealedNaYF4:Yb3+,Tb3+ material prepared without the water washings showthat the ytterbium and terbium dopants are quite evenly distributed onthe same areas with yttrium (Figure 18 left). Moreover, there is alwayssodium and fluoride wherever there is yttrium (Figure 18 right).Therefore, it is concluded that the dopants have replaced some of theyttrium ions, and NaYF4 and NaYF4:Yb3+,Tb3+ have been formed asexcepted and wanted. Some impurities such as carbon, magnesium,potassium, calcium, titanium, manganese, iron and other lanthanidessuch as erbium and thulium were observed, as well.
Figure 18. TOF-SIMS images of the annealed NaYF4:Yb3+,Tb3+ material preparedwithout the water washings showing ytterbium, yttrium and terbium (as positive ions;left), and sodium, yttrium and fluoride (as negative ions; right) distributions.
Effects of Different Preparation Methods
49
5.1.5. Elemental Composition
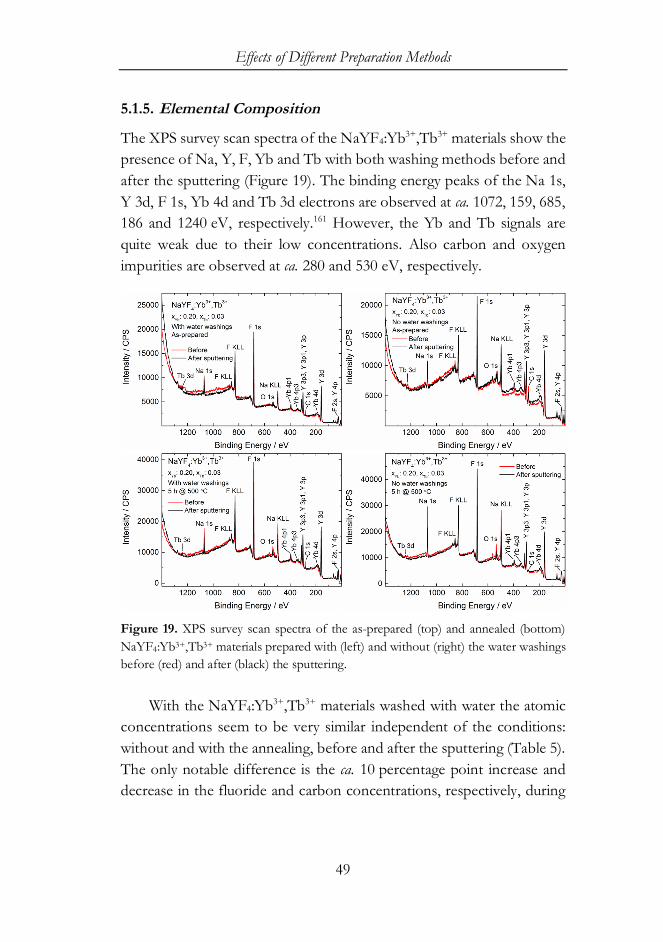
The XPS survey scan spectra of the NaYF4:Yb3+,Tb3+ materials show thepresence of Na, Y, F, Yb and Tb with both washing methods before andafter the sputtering (Figure 19). The binding energy peaks of the Na 1s,Y 3d, F 1s, Yb 4d and Tb 3d electrons are observed at ca. 1072, 159, 685,186 and 1240 eV, respectively.161 However, the Yb and Tb signals arequite weak due to their low concentrations. Also carbon and oxygenimpurities are observed at ca. 280 and 530 eV, respectively.
Figure 19. XPS survey scan spectra of the as-prepared (top) and annealed (bottom)NaYF4:Yb3+,Tb3+ materials prepared with (left) and without (right) the water washingsbefore (red) and after (black) the sputtering.
With the NaYF4:Yb3+,Tb3+ materials washed with water the atomicconcentrations seem to be very similar independent of the conditions:without and with the annealing, before and after the sputtering (Table 5).The only notable difference is the ca. 10 percentage point increase anddecrease in the fluoride and carbon concentrations, respectively, during

Results and Discussion
50
the sputtering. The difference is mainly due to surface impurities such asethanol used the last in the washings and carbon dioxide absorbed fromair.
Table 5. Percentage atomic concentrations of the as-prepared and annealedNaYF4:Yb3+,Tb3+ materials prepared with and without the water washings before andafter (the bolded values) the sputtering.
Element
Atomic % before and after the sputtering
As-prepared Annealed
with water without water with water without water
Na 13 16 4 9 15 13 28 19
Y 14 14 16 20 14 16 12 15
F 55 65 44 58 56 66 54 63Yb 2 2 2 <1 <1 1 <1 1
Tb <1 <1 <1 <1 <1 <1 <1 <1
C 13 1 32 4 12 3 5 2O 3 2 1 8 2 <1 1 <1
With the as-prepared NaYF4:Yb3+,Tb3+ material washed withoutwater the atomic concentrations vary more than with the water washedmaterials (Table 5). The carbon concentration is even almost 30percentage points (700 %) higher before the sputtering suggesting thereis lot of carbon including impurities such as ethanol on the surface. Thehuge decrease in the carbon concentration during the sputtering resultsin clear increases in the sodium, yttrium, fluoride and surprisingly alsooxide concentrations.
With the annealed NaYF4:Yb3+,Tb3+ materials there is a cleardifference between the sodium concentrations on the surfaces with bothwashing methods (Table 5). Without the water washings there is ca. 50 %more (9 percentage points) sodium on the surface (before the sputtering)compared to the core (after the sputtering). Whereas with the water

Effects of Different Preparation Methods
51
washings there is only ca. 15 % more (2 percentage points) sodium onthe surface compared to the core.
Therefore, the XPS studies confirm that the particle surfaces of theannealed material prepared without the water washings are richer insodium than the material prepared with the water washings, as expected.However, surprisingly the as-prepared material without the waterwashings has very low sodium concentration compared to all othermaterials even though the corresponding annealed material has thehighest sodium concentration. This might be due to the highconcentration of impurities (carbon and oxygen) with the as-preparedmaterial without the water washings. Also it should be kept in mind thatthese are only relative, not absolute, concentrations. Thus comparingdifferent materials might be complicated.
5.1.6. Chemical Environment
The high resolution XPS spectra before the sputtering show clearly thetypical doublet of yttrium around 160 eV due to the 3d electrons with allthe NaYF4:Yb3+,Tb3+ materials (Figure 20 left). The peak with higherbinding energy belongs to 3d3/2, and the one with lower energy and higherintensity to 3d5/2. After the sputtering an additional signal is obtainedright next to the yttrium doublet (Figure 20 right) which is due to yttriumwith different chemical environment in the material.162

Results and Discussion
52
Figure 20. Y (3d) XPS spectra with fitting curves of the as-prepared and annealedNaYF4:Yb3+,Tb3+ materials obtained with and without the water washings before (left)and after (right) the sputtering.

Effects of Different Preparation Methods
53
The presence of the two yttrium doublets is clearly seen of the fittingcurves where two (one doublet) and four peaks (two doublets) are neededbefore and after the sputtering, respectively. To be more precise, the twodoubles are due to yttrium ions on the surface and in the bulk.162 It is alsopossible that the two signals are observed because yttrium occupies partlyalso the Na site in the NaYF4 lattice. No clear difference was obtainedbetween materials with different washing methods. However, thebinding energies are slightly higher with the water washings.
The reason why the two doublets are present only (at least moreclearly since there might be a barely visible weak peak around 157 eV)after the sputtering could be the lower concentration of impurities on thesurface compared to the state before the sputtering. XPS detects mainlyions close to the surface and therefore thicker layer of impurities resultsin a thinner layer of actual material being measured. This could explainalso why the yttrium 3d signal of the as-prepared materials have lowerintensity, and signal-to-noise ratio, than with the annealed materials(Figure 20) since the as-prepared materials have higher concentration ofimpurities (Table 5) and a layer on top of the particles (Figure 13).Therefore, it is concluded that the stronger Y 3d doublet (3d3/2 and 3d5/2
peaks at ca. 161 and 159 eV, respectively) is due to yttrium ions on thesurface and the weaker Y 3d doublet (3d3/2 and 3d5/2 peaks at ca. 159 and157 eV, respectively) is due to yttrium ions inside the crystal.
The XPS spectra show also a singlet peak due to the Na 1s electronsat ca. 1072 eV with all the NaYF4:Yb3+,Tb3+ materials before and afterthe sputtering (Figure 21).161 The only notable difference is the weakerintensity of the as-prepared materials as it is with the Y 3d peaks (Figure20). Since only one singlet peak is obtained, all the Na ions have a verysimilar chemical environment. Earlier it was suspected that the layercovering the particles (Figure 13) could be due to NaF but these resultsseems to be against that theory since there is only one singlet due tosodium (Figure 21). However, this is not certain because there might betwo overlapping singlets. Also the Na 1s binding energies are higher withwater washings – as it is with the Y 3d peaks.

Results and Discussion
54
Figure 21. Na (1s) XPS spectra with fitting curves of the as-prepared and annealedNaYF4:Yb3+,Tb3+ materials obtained with and without the water washings before (left)and after (right) the sputtering.

Effects of Different Preparation Methods
55
All the NaYF4:Yb3+,Tb3+ materials show also a singlet peak due tothe F 1s electrons at ca. 685 eV and again the as-prepared materials haveweaker intensity (Figure 22). However, a second singlet is obtained atslightly higher binding energy with the material without the waterwashings. Therefore, there is fluoride ions with two different chemicalenvironments. The stronger singlet at ca. 685 eV is probably due to thefluoride ions on the surface and the weaker singlet at ca. 686 eV is due tofluoride ions inside the crystal. The presence of the two singlets could bedue to the layer covering the particles (Figure 13 a and c). Thus, theseresults support the NaF layer hypothesis unlike the sodium peaks (Figure21). It is interesting to see that also the F 1s peaks, as well as the Y 3dand Na 1s, have higher binding energies with the water washings.However, the reason is yet unclear.

Results and Discussion
56
Figure 22. F (1s) XPS peaks with fitting curves of the as-prepared and annealedNaYF4:Yb3+,Tb3+ materials prepared with and without the water washings before (left)and after (right) the sputtering.

Effects of Different Preparation Methods
57
5.1.7. Up-conversion Luminescence Enhancement
The most important consequence of omitting the water washings is thatthe up-conversion luminescence of the NaYF4:Yb3+,Tb3+ material is 1-2orders of magnitude stronger (Figure 23; I-III) – even though bothwashing methods resulted in the hexagonal structure. The up-conversionluminescence is not only stronger in general but also some newemissions, such as the Tb3+ 5D3 → 7F6-2, are now visible.
Figure 23. Up-conversion luminescence spectra of the hexagonal NaYF4:Yb3+,Tb3+
materials prepared with and without the water washings.
The structural details, affecting the up-conversion luminescenceenhancement of the NaYF4:Yb3+,Tb3+, were studied with theWilliamson-Hall and Rietveld analyses of the XPD data (I). First of all,as mentioned earlier, the crystal form is the hexagonal with both washingmethods. Moreover, the only impurity obtained is NaF with the materialwithout the water washings.
The Williamson-Hall analyses indicate only slightly larger crystallitesize (110 and 94 nm) for the high intensity material prepared without thewater washings. Therefore, the size is not at least the main reason causingthe luminescent enhancement. The e value, on the other hand, is 0.04and 0.008 % with and without the water washings, respectively. Thismeans the material without the water washings has less microstrainswhich can quench luminescence by causing energy traps and non-radiative relaxation processes. The smaller amount of strains is a

Results and Discussion
58
consequence from the ca. 100 °C lower cubic-to-hexagonal phasetransition temperature (III) giving more time to relax the structuralstrains resulting from the phase transition (I).
The Rietveld analyses show very similar results with both washingmethods (I). Nevertheless, the material without the water washings has atiny deficit of Y3+ and Ln3+ (Na/(Y+Ln) ratio is 101 %) which mayincrease the up-conversion luminescence by limiting excess energymigration in the Yb sublattice. Also these studies suggest that there mightbe cation re-ordering (involving Y3+ and Ln3+ ions occupying the Na site)with the material without the water washings which would enhance theYb3+-Tb3+ energy transfer and thus enhance the luminescence. This waslater studied with EXAFS (II).
EXAFS was used to calculate the distance distributions around Y3+,Yb3+ and Tb3+ (II). The Tb-F distance is the same (0.234 nm) with bothwashing methods. The Y-F and Yb-F distances are slightly different withthe material with the water washings while the distances are the same(0.230 nm) with the material without the water washings. This suggestthe latter material have fewer distortions in the Y/Ln sublattice whichsupports the Williamson-Hall microstrain analysis (I).
Moreover, without the water washings the signal around 0.32-0.40 nm is stronger than with the water washings suggesting that there isan increased number of Yb3+ ions occupying the Na sites and that theseYb species have formed clusters with the Tb3+ occupying the regularNa/Y/Ln sites (II). This improves the Yb3+-Tb3+ energy transferresulting in up-conversion luminescence enhancement. Together withthe Rietveld analyses (I) it was found out that as much as 10 mol-% (ca.2 % of the total cation amount) of the Yb3+ ions can occupy the Na site(II).
5.2. Effect of Erbium Impurity on the Up-conversionLuminescence of Terbium
The very good efficiency of the up-conversion luminescence of theYb3+,Er3+ pair, the presence of Er3+ as an impurity in the yttrium and

Effect of Erbium Impurity on the Up-conversion Luminescence of Terbium
59
lanthanide oxide precursors and the weakness of the Tb3+ up-conversionluminescence gave us a reason to suspect that Er3+ might have a role inthe up-conversion luminescence mechanism of Tb3+ (III). Up-conversion luminescence of Er3+ (and Tm3+ as well) is obtained evenfrom NaYF4 and NaYbF4 materials (Figure 24) without intentional Er3+
doping – when the impurity Er3+ concentration is probably on the scaleof couple hundred ppm (parts per million) at the most.
Figure 24. Up-conversion luminescence spectra of the NaYF4 and NaYbF4 materials.
The NaYF4:Yb3+ material shows strong up-conversionluminescence of the Er3+ and Tm3+ impurities (Figure 25). However, theintensities of these emissions decrease strongly when Tb3+ is added as aco-dopant, continue decreasing by increasing Tb3+ concentration andvanish completely when the Tb3+ concentration is ca. 7-8 mol-%. At thesame time, the intensity of the Tb3+ up-conversion luminescenceenhances and is the strongest with 6 mol-% Tb3+ after which the5D3 → 7F6-2 emissions weaken due to the (5D3, 7F6) → (5D4, 7F1) cross-relaxation mechanism.

Results and Discussion
60
Figure 25. Up-conversion luminescence spectra of the NaYF4:Yb3+ andNaYF4:Yb3+,Tb3+ (xTb: 0.01-0.08) materials.
As the emissions from the Er3+ and Tm3+ impurities weaken andfinally vanish with increasing Tb3+ concentration, up-conversionluminescence rise and decay times of the 544 nm emission increase(Figure 26). The rise and decay times increase until the Tb3+
concentration reaches 3 mol-% after which those are quite similar withall the dopant concentrations (xTb: 0.03-0.08). The up-conversionemission rise time increases from ca. 2 ms without Tb3+ to ca. 8 ms with3-8 mol-% Tb3+. Moreover, the shape of the rise curve is quite differentwith the intermediate 3 and 4 mol-% Tb3+ concentrations compared tothe higher concentrations even though the highest intensity is reached inabout the same time (Figure 26 left).
Figure 26. Up-conversion luminescence rise (left) and decay (right) curves of theNaYF4:Yb3+ and selected NaYF4:Yb3+,Tb3+ materials measured at 544 nm after 976 nmexcitation.

Effect of Erbium Impurity on the Up-conversion Luminescence of Terbium
61
The lifetime of the 544 nm emission increases from ca. 0.7 mswithout the Tb3+ co-doping to ca. 4.1-4.2 ms with 3-8 mol-% Tb3+ (Table6). Two different lifetimes (ca. 0.7 and 4.2 ms) are observed with 1 mol-%Tb3+. With the NaYF4:Yb3+ material the emission at 544 nm is only fromthe Er3+ impurity due to the 4S3/2 → 4F9/2 transition and with the Tb3+ co-doping also due to the 5D4 → 7F5 transition – at least with 1 mol-% Tb3+
showing two different lifetimes. Also the decay curve with 1 mol-%seems to have two different parts: first the intensity decreases rapidly likewithout Tb3+ (only Er3+ emission present) and then the intensitydecreases slower like with 8 mol-% Tb3+ (Figure 25 right). In otherwords, Er3+ and Tb3+ emissions are overlapping around 544 nm (Figure25). Therefore, the shorter ca. 0.7 ms lifetime is due to Er3+ and the longerca. 4.1-4.2 ms lifetime is due to Tb3+. All in all, it is concluded that allthese observations (Figures 24-26) supports the hypothesis of Er3+
having a role on the up-conversion luminescence mechanism of Tb3+ byYb3+-Er3+-Tb3+ energy transfer.
Table 6. Up-conversion luminescence lifetimes (t) of the NaYF4:Yb3+ andNaYF4:Yb3+,Tb3+ (xTb: 0.01-0.08) materials measured at 544 nm after 976 nmexcitation.
xTb t1 / ms t2 / ms xTb t1 / ms t2 / ms
0.08 4.2 - 0.04 4.1 -0.07 4.1 - 0.03 4.2 -0.06 4.1 - 0.01 0.7 4.20.05 4.2 - 0 0.7 -
It was interesting to observe how the decay curves measured for the488 nm emission of Tb3+ (Figure 27), without any contribution fromEr3+, show a very similar behaviour than the ones measured of the544 nm emission (Figure 26). The difference in the shape of the rise partis not that big but with 0 and 1 mol-% Tb3+ the maximum intensity isreached a little faster than with the higher Tb3+ concentrations: ca. 6 vs.8 ms. Also the decay part shows smaller differences but they are clear

Results and Discussion
62
anyway: without Tb3+ the intensity decreases faster than with 3-8 mol-%Tb3+ and the material with 1 mol-% Tb3+ show both the fast and slowparts.
Figure 27. Up-conversion luminescence excitation (left) and decay (right) curves of theNaYF4:Yb3+ and selected NaYF4:Yb3+,Tb3+ materials measured at 488 nm after 976 nmexcitation.
The fact that the emission at 488 nm is observed even without theTb3+ doping is due to the presence of the Tm3+ impurity. This is becausethe bandpass filter used to select the measured emission lets trough alsosome of the Tm3+ 1G4 → 3H6 emission centered at 475 nm (Figure 25).The lifetimes of the Tm3+ 1G4 → 3H6 and Tb3+ 5D4 → 7F6 emissions areca. 1.1 and 4.1 ms, respectively (Table 7). Finally, these results suggestthat also Tm3+ might have a role on the up-conversion luminescencemechanism of Tb3+ by the Yb3+-Tm3+-Tb3+ energy transfer.

Estimating the Amount of the Impurity Cubic Form
63
Table 7. Up-conversion luminescence lifetimes (t) of the NaYF4:Yb3+ andNaYF4:Yb3+,Tb3+ (xTb: 0.01-0.08) materials measured at 488 nm after 976 nmexcitation.
xTb t1 / ms t2 / ms xTb t1 / ms t2 / ms
0.08 4.2 - 0.04 4.2 -0.07 4.1 - 0.03 4.1 -0.06 4.0 - 0.01 1.2 4.20.05 4.2 - 0 1.1 -
5.3. Estimating the Amount of the Impurity Cubic Form
The cubic form was obtained as an impurity with some materials,depending on the dopant and its concentration, when the water washingmethod was used (V). One of the most interesting things was to observethe relation between the amount of the impurity cubic form and thespecific enthalpy of the cubic-to-hexagonal phase transition. The cubic-to-hexagonal phase transitions tends to occur at higher temperature withmore cubic form present after the annealing. Moreover, the exothermicDSC signal, showing the cubic-to-hexagonal transition, weakens at thesame time (V). So far there has not been any trace of the cubic form ifthe specific enthalpy is over 65 Jg-1. The DSC measurements can now beused to estimate if there is going to be impurity cubic form present afterthe post-annealing. Since the DSC is faster than the post-annealing, thiscan save time and resources when developing new materials
5.4. Up-conversion Luminescence of Other Lanthanides
The optimized synthesis conditions discussed above (section 5.1.7) wereused to prepare other hexagonal NaYF4:Yb3+,Ln3+ materials to obtain awider selection of up-conversion luminescence. Because of the enhancedemission intensities obtained, strong up-conversion luminescence wasobserved from activators that previously showed practically no emission(VI). Up-conversion luminescence is now observed from NaYF4:Yb3+
co-doped with Pr3+, Nd3+, Eu3+, Tb3+, Ho3+, Er3+ or Tm3+ under 976 nm

Results and Discussion
64
excitation. Tm3+, Er3+ and Ho3+ give clearly the strongest intensity whilethe rest are ca. 3-4 orders of magnitude weaker. Unfortunately, Sm3+ andDy3+ still do not show any up-conversion luminescence in the NaYF4
host under 976 nm excitation.Sm3+ in the 6H5/2 ground level does not have a transition in good
resonance with the energies of the Yb3+ 2F5/2 → 2F7/2 transition or 976 nmlaser (Figure 28).26,91 However, the energies of the Sm3+ 6H5/2 → 6F11/2,9/2
transitions are very close which should enable phonon-assisted Yb3+-Sm3+ energy transfer. Therefore, the absence of the Sm3+ up-conversionluminescence is probably due to the small energy differences between the6F1/2-11/2 and 6H5/2-15/2 levels (ca. 700-1200 cm-1 max26,91) enabling efficientmultiphonon de-excitation.
Figure 28. Up-conversion luminescence scheme of Yb3+ sensitized Sm3+ through 4fenergy levels.26,91
The small differences between the energy levels of Sm3+ (Figure 28)will also enable many cross-relaxation processes which hinder up-conversion mechanism. Thus it is probable that Sm3+ will de-excitebefore it can absorb a second photon, which would subsequently exciteSm3+ to higher energy levels capable of emitting visible photons. It iseven possible that Sm3+ quenches the very efficient Er3+ up-conversionluminescence because the emissions of the Er3+ impurity are notobserved (VI).
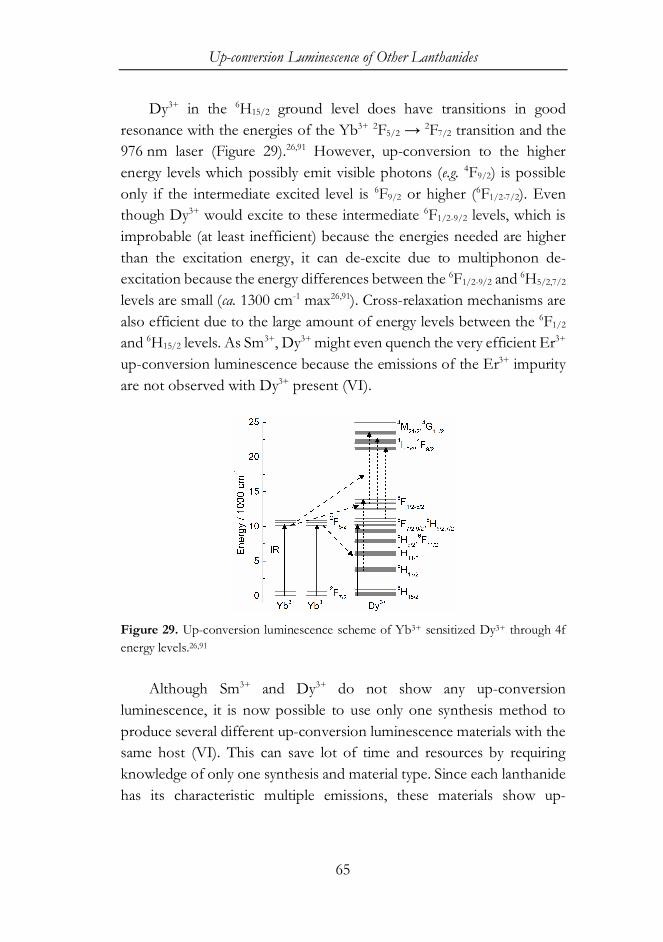
Up-conversion Luminescence of Other Lanthanides
65
Dy3+ in the 6H15/2 ground level does have transitions in goodresonance with the energies of the Yb3+ 2F5/2 → 2F7/2 transition and the976 nm laser (Figure 29).26,91 However, up-conversion to the higherenergy levels which possibly emit visible photons (e.g. 4F9/2) is possibleonly if the intermediate excited level is 6F9/2 or higher (6F1/2-7/2). Eventhough Dy3+ would excite to these intermediate 6F1/2-9/2 levels, which isimprobable (at least inefficient) because the energies needed are higherthan the excitation energy, it can de-excite due to multiphonon de-excitation because the energy differences between the 6F1/2-9/2 and 6H5/2,7/2
levels are small (ca. 1300 cm-1 max26,91). Cross-relaxation mechanisms arealso efficient due to the large amount of energy levels between the 6F1/2
and 6H15/2 levels. As Sm3+, Dy3+ might even quench the very efficient Er3+
up-conversion luminescence because the emissions of the Er3+ impurityare not observed with Dy3+ present (VI).
Figure 29. Up-conversion luminescence scheme of Yb3+ sensitized Dy3+ through 4fenergy levels.26,91
Although Sm3+ and Dy3+ do not show any up-conversionluminescence, it is now possible to use only one synthesis method toproduce several different up-conversion luminescence materials with thesame host (VI). This can save lot of time and resources by requiringknowledge of only one synthesis and material type. Since each lanthanidehas its characteristic multiple emissions, these materials show up-

Results and Discussion
66
conversion luminescence at the UV, violet, blue, green, yellow, orange,red and NIR wavelength ranges thus including almost the whole visiblerange. Moreover, additional color tuning is possible for example bychanging the dopant concentrations and/or doping more than oneactivator in the same material. For example the Er3+ doped material hasthe CIE (Commission internationale de l'éclairage) color coordinate inthe red region while the CIE color coordinate of Pr3+ doped material withsome amount of Er3+ impurity is close to white (IV). This is again a goodexample of how impurities might affect the materials’ properties and oneshould always keep in mind that there are, for sure, always someimpurities in each material – detectable or not.

67
6. SUMMARY
Up-conversion luminescence is a unique phenomenon where lowerenergy radiation is converted to higher energy radiation: usually IR tovisible. This is possible due to energy levels with long enough lifetimesto absorb and stack at least two photons before a radiative emission. Alsoladder-like energy levels with matching energy differences are needed toenable efficient energy absorption, transfer and stacking.
Several lanthanides, such as Er3+, Tm3+ and Ho3+, fulfill theserequirements very well and can act as an activator in these kind ofmaterials. Depending on the energy level structure and excitation energy,an activator can excite through different up-conversion mechanisms ofwhich ETU mechanism is the most efficient one. It includes an Yb3+
sensitizer which enhances the up-conversion by improving the energyabsorption efficiency. However, the up-conversion quantum efficiency isstill quite poor and an improvement is desired.
A host is needed because the activator concentration must be in therange of a couple percent to avoid cross-relaxation processes whichquench the luminescence efficiency and NaYF4 is among the best ones.It has low phonon energy which hinders the harmful multiphonon de-excitation processes and it is easy to prepare in different sizes and shapeswith different dopants.
Lanthanide doped (Pr, Nd, Sm, Eu, Tb, Dy, Ho, Er, Tm and Yb)NaYF4 materials were prepared with the co-precipitation synthesis tostudy up-conversion luminescence. Luminescence efficiency wasimproved by modifying the synthesis and structural properties werestudied using TG-DSC, XPD, TEM, TOF-SIMS, XPS and EXAFS. Asa result, a comprehensive selection of up-conversion luminescencematerials, with wide selection of spectra and colors, is now available bymastering only one synthesis.

Summary
68
Now lanthanide doped NaYF4 materials can be prepared always withthe hexagonal crystal form which is better for the luminescence. Beforealso the cubic form was obtained with some materials and it was foundout that the specific enthalpy of the cubic-to-hexagonal phase transitioncan help to predict the completeness of the phase transition: theprobability of the cubic form being present increases with decreasingspecific enthalpy.
The materials prepared with different synthesis conditions showedmany differences in the properties between the old and the newimproved material. The cubic-to-hexagonal phase transition occurs nowat a 100 °C lower temperature and the crystal structure is alwayshexagonal. Unfortunately, the crystallites are now more aggregatedresulting in a bigger particle size which could explain the strongerluminescence at least partly. However, the Williamson-Hall analysesindicated only a slightly larger crystallite size for the more luminescentsamples suggesting that the size is not the main reason causing theluminescence enhancement.
The new materials are covered with a sodium-rich surface layerwhich might protect the lanthanides from the surface impuritiesdecreasing the luminescence intensity. This might be at least one of thereasons why the up-conversion luminescence is now stronger. Anyway,it is known that the excess sodium is needed to form well crystallizedhexagonal NaYF4:Yb3+,Ln3+ materials and these results confirm thatwhen there is more sodium available the high intensity material isobtained. The presence of enough Na decreases the lattice strains andimproves the energy transfer which results in stronger up-conversionluminescence.
In the future, the lanthanide doped NaYF4 up-conversionluminescence materials would benefit from a better efficiency and themeans for obtaining that should be studied further. The core-shellconcept and addition of transition metals or organic compounds toenhance the energy absorption efficiency seem to be promising ways toproceed.

69
REFERENCES
1. Auzel, F. Upconversion and anti-Stokesprocesses with f and d ions in solids. Chem. Rev.104, 139–173 (2004).
2. Wang, F. & Liu, X. Recent advances in thechemistry of lanthanide-doped upconversionnanocrystals. Chem. Soc. Rev. 38, 976–989(2009).
3. Haase, M. & Schäfer, H. Upconvertingnanoparticles. Angew. Chem. Int. Ed. Engl. 50,5808–5829 (2011).
4. Grubb, S. G., Bennett, K. W., Cannon, R. S. &Humer, W. F. CW room-temperature blueupconversion fibre laser. Electron. Lett. 28,1243–1244 (1992).
5. Joubert, M. F., Guy, S. & Jacquier, B. Model ofthe photon-avalanche effect. Phys. Rev. B 48,10031–10037 (1993).
6. Scheps, R. Upconversion laser processes. Prog.Quantum Electron. 20, 271–358 (1996).
7. Downing, E., Hesselink, L., Ralston, J. &Macfarlane, R. A three-color, solid-state, three-dimensional display. Science 273, 1185–1189(1996).
8. Gutmann, R., Ahlers, B., Kapkke, F., Paugstadt,R. & Franz-Burgholz, A. Security documentwith optically excitable dyes for authenticitycheck. US Patent 6,234,537 (2001).
9. Shalav, A., Richards, B. S., Trupke, T., Krämer,K. W. & Güdel, H. U. Application ofNaYF4:Er3+ up-converting phosphors forenhanced near-infrared silicon solar cellresponse. Appl. Phys. Lett. 86, 13505 (2005).
10. de Wild, J., Meijerink, A., Rath, J. K., van Sark,W. G. J. H. M. & Schropp, R. E. I. Upconvertersolar cells: materials and applications. EnergyEnviron. Sci. 4, 4835–4848 (2011).
11. Zou, W., Visser, C., Maduro, J. A.,Pshenichnikov, M. S. & Hummelen, J. C.
Broadband dye-sensitized upconversion ofnear-infrared light. Nat. Photonics 6, 560–564(2012).
12. Huang, X., Han, S., Huang, W. & Liu, X.Enhancing solar cell efficiency: the search forluminescent materials as spectral converters.Chem. Soc. Rev. 42, 173–201 (2013).
13. Fischer, S., Fröhlich, B., Steinkemper, H.,Krämer, K. W. & Goldschmidt, J. C. Absoluteupconversion quantum yield of β-NaYF4 dopedwith Er3+ and external quantum efficiency ofupconverter solar cell devices under broad-band excitation considering spectral mismatchcorrections. Sol. Energy Mater. Sol. Cells 122,197–207 (2014).
14. Antal, T., Harju, E., Pihlgren, L., Lastusaari, M.,Tyystjärvi, T., Hölsä, J. & Tyystjärvi, E. Use ofnear-infrared radiation for oxygenicphotosynthesis via photon up-conversion. Int.J. Hydrogen Energy 37, 8859–8863 (2012).
15. Nyk, M., Kumar, R., Ohulchanskyy, T. Y.,Bergey, E. J. & Prasad, P. N. High contrast invitro and in vivo photoluminescencebioimaging using near infrared to near infraredup-conversion in Tm3+ and Yb3+ dopedfluoride nanophosphors. Nano Lett. 8, 3834–3838 (2008).
16. Wang, M., Mi, C.-C., Wang, W.-X., Liu, C.-H.,Wu, Y.-F., Xu, Z.-R., Mao, C.-B. & Xu, S.-K.Immunolabeling and NIR-excited fluorescentimaging of HeLa cells by using NaYF4:Yb,Erupconversion nanoparticles. ACS Nano 3,1580–1586 (2009).
17. Yang, Y., Shao, Q., Deng, R., Wang, C., Teng,X., Cheng, K., Cheng, Z., Huang, L., Liu, Z.,Liu, X. & Xing, B. In vitro and in vivo uncagingand bioluminescence imaging by usingphotocaged upconversion nanoparticles.Angew. Chem. Int. Ed. Engl. 51, 3125–3129

References
70
(2012).
18. Zhou, J., Liu, Z. & Li, F. Upconversionnanophosphors for small-animal imaging.Chem. Soc. Rev. 41, 1323–1349 (2012).
19. Tian, G., Gu, Z., Zhou, L., Yin, W., Liu, X.,Yan, L., Jin, S., Ren, W., Xing, G., Li, S. & Zhao,Y. Mn2+ dopant-controlled synthesis ofNaYF4:Yb/Er upconversion nanoparticles forin vivo imaging and drug delivery. Adv. Mater.24, 1226–1231 (2012).
20. Ylihärsilä, M., Valta, T., Karp, M., Hattara, L.,Harju, E., Hölsä, J., Saviranta, P., Waris, M. &Soukka, T. Oligonucleotide array-in-wellplatform for detection and genotyping humanadenoviruses by utilizing upconvertingphosphor label technology. Anal. Chem. 83,1456–1461 (2011).
21. Wu, S., Han, G., Milliron, D. J., Aloni, S., Altoe,V., Talapin, D. V, Cohen, B. E. & Schuck, P. J.Non-blinking and photostable upconvertedluminescence from single lanthanide-dopednanocrystals. Proc. Natl. Acad. Sci. U. S. A. 106,10917–10921 (2009).
22. Zhang, C., Yuan, Y., Zhang, S., Wang, Y. & Liu,Z. Biosensing platform based on fluorescenceresonance energy transfer from upconvertingnanocrystals to graphene oxide. Angew. Chem.Int. Ed. Engl. 50, 6851–6854 (2011).
23. Stepuk, A., Mohn, D., Grass, R. N., Zehnder,M., Krämer, K. W., Pellé, F., Ferrier, A. & Stark,W. J. Use of NIR light and upconversionphosphors in light-curable polymers. Dent.Mater. 28, 304–311 (2012).
24. Yi, G., Lu, H., Zhao, S., Ge, Y., Yang, W., Chen,D. & Guo, L.-H. Synthesis, characterization,and biological application of size-controllednanocrystalline NaYF4:Yb,Er infrared-to-visible up-conversion phosphors. Nano Lett. 4,2191–2196 (2004).
25. van Dijk, J. M. F. & Schuurmans, M. F. H. Onthe nonradiative and radiative decay rates and a
modified exponential energy gap law for 4f–4ftransitions in rare-earth ions. J. Chem. Phys. 78,5317 (1983).
26. Kano, T. in Phosphor Handbook (eds. Yen, W. M.,Shionoya, S. & Yamamoto, H.) 192–214 (CRCPress, 2006).
27. Carnall, W. T., Goodman, G. L., Rajnak, K. &Rana, R. S. A systematic analysis of the spectraof the lanthanides doped into single crystalLaF3. J. Chem. Phys. 90, 3443–3457 (1989).
28. Blasse, G. & Grabmaier, B. C. in LuminescentMaterials 26 (Springer-Verlag, 1994).
29. de Sousa Filho, P. C., Lima, J. F. & Serra, O. A.From lighting to photoprotection:Fundamentals and applications of rare earthmaterials. J. Braz. Chem. Soc. 26, 2471–2495(2015).
30. Strohhöfer, C. & Polman, A. Absorption andemission spectroscopy in Er3+-Yb3+ dopedaluminum oxide waveguides. Opt. Mater. 21,705–712 (2003).
31. Kale, V., Lastusaari, M., Hölsä, J. & Soukka, T.Intense UV upconversion through highlysensitized NaRF4:Tm (R:Y,Yb) crystals. RSCAdv. 5, 35858–35865 (2015).
32. Dong, H., Sun, L.-D. & Yan, C.-H. Energytransfer in lanthanide upconversion studies forextended optical applications. Chem. Soc. Rev.44, 1608–1634 (2015).
33. Balda, R., Fernández, J., Mendioroz, A., Voda,M. & Al-Saleh, M. Infrared-to-visibleupconversion processes in Pr3+/Yb3+-codopedKPb2Cl5. Phys. Rev. B 68, 165101 (2003).
34. Naccache, R., Speghini, A., Bettinelli, M.,Capobianco, J. A. & Vetrone, F. Cross-relaxation and upconversion processes in Pr3+
singly doped and Pr3+/Yb3+ codopednanocrystalline Gd3Ga5O12: Thesensitizer/activator relationship. J. Phys. Chem.C 112, 7 (2008).

References
71
35. Hao, S., Shao, W., Qiu, H., Shang, Y., Fan, R.,Guo, X., Zhao, L., Chen, G. & Yang, C. Tuningthe size and upconversion emission ofNaYF4:Yb3+/Pr3+ nanoparticles through Yb3+
doping. RSC Adv. 4, 56302–56306 (2014).
36. Hirao, K., Higuchi, M. & Soga, N.Upconversion mechanism of Pr3+-dopedfluoride fiber glass. J. Lumin. 60–61, 115–118(1994).
37. Fernández, J., Balda, R., Mendioroz, A. &García-Adeva, A. J. Upconversion processes inPr3+-doped chalcohalide glasses. J. Phys.Condens. Matter 13, 10347–10358 (2001).
38. Dereń, P. J., Mahiou, R., Strk, W.,Bednarkiewicz, A. & Bertrand, G. Up-conversion in KYb(WO4)2:Pr3+ crystal. Opt.Mater. 19, 145–148 (2002).
39. Gouveia-Neto, A. S., Da Costa, E. B., Bueno,L. A. & Ribeiro, S. J. L. Red, green, and blueupconversion luminescence in ytterbium-sensitized praseodymium-doped lead-cadmium-germanate glass. Opt. Mater. 26, 271–274 (2004).
40. Velázquez, J. J., Yanes, A. C., Del-Castillo, J.,Méndez-Ramos, J. & Rodríguez, V. D.Spectroscopic characterization and up-conversion in sol-gel derived Yb3+-Pr3+ co-doped SiO2-LaF3 nano-glass-ceramics. J. Non.Cryst. Solids 356, 1349–1353 (2010).
41. Holliday, K., Russell, D. L. & Henderson, B.Up-conversion spectroscopy of Nd3+:KLiYF5.J. Lumin. 72–74, 927–929 (1997).
42. Zhang, X., Daran, E., Serrano, C. & Lahoz, F.Up-conversion fluorescence in MBE-grownNd3+-doped LaF3/CaF2 waveguides. J. Lumin.87–89, 1011–1013 (2000).
43. Fernández, J., Balda, R., Sanz, M., Lacha, L. M.,Oleaga, A. & Adam, J. L. Upconversion lossesin Nd-doped fluoroarsenate glasses. J. Lumin.94–95, 325–329 (2001).
44. Balda, R., Sanz, M., Mendioroz, A., Fernández,
J., Griscom, L. & Adam, J.-L. Infrared-to-visible upconversion in Nd3+-dopedchalcohalide glasses. Phys. Rev. B 64, 144101(2001).
45. Fernández, J., Sanz, M., Mendioroz, A., Balda,R., Chaminade, J. P., Ravez, J., Lacha, L. M.,Voda, M. & Arriandiaga, M. A. Site-selectivespectroscopy and infrared-to-visibleupconversion in a Nd3+-doped Pb5Al3F19
crystal. J. Alloys Compd. 323–324, 267–272(2001).
46. Wang, X., Song, J., Sun, H., Xu, Z. & Qiu, J.Multiphoton-excited upconversionluminescence of Nd:YVO4. Opt. Express 15,1384 (2007).
47. Ramakrishna, P. V., Pammi, S. V. N. &Samatha, K. UV–visible upconversion studiesof Nd3+ ions in lead tellurite glass. Solid StateCommun. 155, 21–24 (2013).
48. Zhou, Y., Lin, J. & Wang, S. Energy transferand upconversion luminescence properties ofY2O3:Sm and Gd2O3:Sm phosphors. J. SolidState Chem. 171, 391–395 (2003).
49. Som, T. & Karmakar, B. Infrared-to-redupconversion luminescence in samarium-doped antimony glasses. J. Lumin. 128, 1989–1996 (2008).
50. Som, T. & Karmakar, B. Enhanced frequencyupconversion of Sm3+ ions by elliptical Aunanoparticles in dichroic Sm3+: Au-antimonyglass nanocomposites. Spectrochim. Acta - Part AMol. Biomol. Spectrosc. 75, 640–646 (2010).
51. Wang, X., Yan, X. & Kan, C. Thermal loadinginduced near-infrared broadband upconversionemission of Sm3+-doped β-NaYbF4 nano-phosphors. J. Lumin. 131, 2325–2329 (2011).
52. Wang, F., Deng, R., Wang, J., Wang, Q., Han,Y., Zhu, H., Chen, X. & Liu, X. Tuningupconversion through energy migration incore–shell nanoparticles. Nat. Mater. 10, 968–973 (2011).

References
72
53. Strek, W., Dereń, P. J., Bednarkiewicz, A.,Kalisky, Y. & Boulanger, P. Efficient up-conversion in KYb0.8Eu0.2(WO4)2 crystal. J.Alloys Compd. 300, 180–183 (2000).
54. MacIel, G. S., Biswas, A. & Prasad, P. N.Infrared-to-visible Eu3+ energy upconversiondue to cooperative energy transfer from anYb3+ ion pair in a sol-gel processed multi-component silica glass. Opt. Commun. 178, 65–69 (2000).
55. Dwivedi, Y., Thakur, S. N. & Rai, S. B. Study offrequency upconversion in Yb3+/Eu3+ bycooperative energy transfer in oxyfluoroborateglass matrix. Appl. Phys. B Lasers Opt. 89, 45–51(2007).
56. Marti n-Rodriguez, R., Valiente, R., Polizzi, S.,Bettinelli, M., Speghini, A. & Piccinelli, F.Upconversion luminescence in nanocrystals ofGd3Ga5O12 and Y3Al5O12 doped withTb3+−Yb3+ and Eu3+−Yb3+. J. Phys. Chem. C113, 12195–12200 (2009).
57. Wang, L., Xue, X., Chen, H., Zhao, D. & Qin,W. Unusual radiative transitions of Eu3+ ions inYb/Er/Eu tri-doped NaYF4 nanocrystalsunder infrared excitation. Chem. Phys. Lett. 485,183–186 (2010).
58. Wang, L., Liu, Z., Chen, Z., Zhao, D., Qin, G.& Qin, W. Upconversion emissions from high-energy states of Eu3+ sensitized by Yb3+ andHo3+ in β-NaYF4 microcrystals under 980 nmexcitation. Opt. Express 19, 25471–25478 (2011).
59. Jiang, T., Liu, Y., Liu, S., Liu, N. & Qin, W.Upconversion emission enhancement of Gd3+
ions induced by surface plasmon field inAu@NaYF4 nanostructures codoped withGd3+–Yb3+–Tm3+ ions. J. Colloid Interface Sci.377, 81–87 (2012).
60. Stręk, W., Bednarkiewicz, A. & Dereń, P. J.Power dependence of luminescence of Tb3+-doped KYb(WO4)2 crystal. J. Lumin. 92, 229–235 (2001).
61. Salley, G. M., Valiente, R. & Guedel, H. U.Luminescence upconversion mechanisms inYb3+-Tb3+ systems. J. Lumin. 94–95, 305–309(2001).
62. Gouveia-Neto, A. S., Bueno, L. A., Afonso, A.C. M., Nascimento, J. F., Costa, E. B.,Messaddeq, Y. & Ribeiro, S. J. L. Upconversionluminescence in Ho3+/Yb3+- and Tb3+/Yb3+-codoped fluorogermanate glass and glassceramic. J. Non. Cryst. Solids 354, 509–514(2008).
63. Scarnera, V., Richards, B., Jha, A., Jose, G. &Stacey, C. Green up-conversion in Yb3+-Tb3+
and Yb3+-Tm3+-Tb3+ doped fluoro-germanatebulk glass and fibre. Opt. Mater. 33, 159–163(2010).
64. Zhang, W. J., Chen, Q. J., Qian, Q., Zhang, Q.Y. & Jiang, Z. H. Cooperative energy transfer inTb3+/Yb3+- and Nd3+/Yb3+/Tb3+-codopedoxyfluoride glasses. Phys. B Condens. Matter 405,1062–1066 (2010).
65. Qiao, X., Fan, X., Xue, Z., Xu, X. & Luo, Q.Intense ultraviolet upconversion luminescenceof Yb3+ and Tb3+ co-doped glass ceramicscontaining SrF2 nanocrystals. J. Lumin. 131,2036–2041 (2011).
66. Qiao, X., Fan, X., Xue, Z., Xu, X. & Luo, Q.Upconversion luminescence ofYb3+/Tb3+/Er3+-doped fluorosilicate glassceramics containing SrF2 nanocrystals. J. AlloysCompd. 509, 4714–4721 (2011).
67. Prorok, K., Gnach, A., Bednarkiewicz, A. &Stręk, W. Energy up-conversion in Tb3+/Yb3+
co-doped colloidal α-NaYF4 nanocrystals. J.Lumin. 140, 103–109 (2013).
68. Wermuth, M., Riedener, T. & Güdel, H. U.Spectroscopy and upconversion mechanisms ofCsCdBr3:Dy3+. Phys. Rev. B 57, 4369–4376(1998).
69. Kam, C. H. & Buddhudu, S. NIR to visibleupconversion emission from Dy3+: ZBLYAN

References
73
glasses. Solid State Commun. 128, 309–313 (2003).
70. Kumar Rai, V. & Rai, S. B. Optical transitionsof Dy3+ in tellurite glass: Observation ofupconversion. Solid State Commun. 132, 647–652(2004).
71. Tripathi, G., Rai, V. K. & Rai, S. B.Spectroscopy and upconversion of Dy3+ dopedin sodium zinc phosphate glass. Spectrochim. Acta- Part A Mol. Biomol. Spectrosc. 62, 1120–1124(2005).
72. Rai, V. K., Rai, S. B. & Rai, D. K. Opticalstudies of Dy3+ doped tellurite glass:Observation of yellow-green upconversion.Opt. Commun. 257, 112–119 (2006).
73. Li, A., Lü, Q., Zheng, Z., Sun, L., Wu, W., Liu,W., Yang, Y. & Lü, T. Yellow-greenupconversion luminescence of Dy3+ ion inLiNbO3 crystal heavily codoped with ZnO. J.Appl. Phys. 102, 113102 (2007).
74. Dwivedi, Y. & Rai, S. B. Spectroscopic study ofDy3+ and Dy3+/Yb3+ ions co-doped in bariumfluoroborate glass. Opt. Mater. 31, 1472–1477(2009).
75. Li, C.-R., Li, S.-F., Dong, B., Sun, J.-C., Bo, X.-F. & Fan, X.-N. Intense up-conversionemissions of Yb3+/Dy3+ co-doped Al2O3
nanopowders prepared by non-aqueous sol—gel method. Chinese Phys. B 21, 97803 (2012).
76. Müller, P., Wermuth, M. & Güdel, H. U.Mechanisms of near-infrared to visibleupconversion in CsCdBr3:Ho3+. Chem. Phys.Lett. 290, 105–111 (1998).
77. Yi, G.-S. & Chow, G.-M. Colloidal LaF3:Yb,Er,LaF3:Yb,Ho and LaF3:Yb,Tm nanocrystals withmulticolor upconversion fluorescence. J. Mater.Chem. 15, 4460 (2005).
78. Wang, X., Bu, Y., Xiao, S., Yang, X. & Ding, J.W. Upconversion in Ho3+-doped YbF3 particleprepared by coprecipitation method. Appl. Phys.B Lasers Opt. 93, 801–807 (2008).
79. Xing, M., Cao, W., Zhong, H., Zhang, Y., Luo,X., Fu, Y., Feng, W., Pang, T. & Yang, X.Synthesis and upconversion luminescenceproperties of monodisperse Y2O3:Yb, Hospherical particles. J. Alloys Compd. 509, 5725–5730 (2011).
80. Zhang, H. X., Kam, C. H., Zhou, Y., Han, X.Q., Buddhudu, S. & Lam, Y. L. Visible up-conversion luminescence in Er3+:BaTiO3
nanocrystals. Opt. Mater. 15, 47–50 (2000).
81. Suyver, J. F., Grimm, J., Krämer, K. W. &Güdel, H. U. Highly efficient near-infrared tovisible up-conversion process inNaYF4:Er3+,Yb3+. J. Lumin. 114, 53–59 (2005).
82. Mai, H., Zhang, Y., Sun, L.-D. & Yan, C.-H.Highly efficient multicolor up-conversionemissions and their mechanisms ofmonodisperse NaYF4:Yb,Er core andcore/shell-structured nanocrystals. J. Phys.Chem. C 111, 13721–13729 (2007).
83. Hyppänen, I., Hölsä, J., Kankare, J., Lastusaari,M. & Pihlgren, L. Up-conversion luminescenceproperties of Y2O2S:Yb3+,Er3+ nanophosphors.Opt. Mater. 31, 1787–1790 (2009).
84. Heer, S., Kömpe, K., Güdel, H.-U. & Haase, M.Highly efficient multicolour upconversionemission in transparent colloids of lanthanide-doped NaYF4 nanocrystals. Adv. Mater. 16,2102–2105 (2004).
85. Yin, A., Zhang, Y., Sun, L. & Yan, C. Colloidalsynthesis and blue based multicolorupconversion emissions of size andcomposition controlled monodispersehexagonal NaYF4 : Yb,Tm nanocrystals.Nanoscale 2, 953–959 (2010).
86. Zeng, S., Ren, G., Li, W., Xu, C. & Yang, Q.Highly uniform Tm3+-doped NaYbF4
microtubes: Controlled synthesis and intenseultraviolet photoluminescence. J. Phys. Chem. C114, 10750–10754 (2010).
87. Liu, L., Li, B., Qin, R., Zhao, H., Ren, X. & Su,

References
74
Z. Synthesis and characterization ofnanoporous NaYF4:Yb3+,Tm3+@SiO2
nanocomposites. Solid State Sci. 12, 345–349(2010).
88. Xie, J., Zhang, Q., Zhuang, Y., Liu, X., Guan,M., Zhu, B., Yang, R. & Qiu, J. Enhanced mid-IR emission in Yb3+-Tm3+ co-dopedoxyfluoride glass ceramics. J. Alloys Compd. 509,3032–3037 (2011).
89. Nakazawa, E. & Shionoya, S. Cooperativeluminescence in YbPO4. Phys. Rev. Lett. 25,1710–1712 (1970).
90. Montoya, E., Espeso, O. & Bausá, L. E.Cooperative luminescence in Yb3+:LiNbO3. J.Lumin. 87, 1036–1038 (2000).
91. Hölsä, J., Lastusaari, M., Maryško, M. & Tukia,M. A few remarks on the simulation and use ofcrystal field energy level schemes of the rareearth ions. J. Solid State Chem. 178, 435–440(2005).
92. Malta, O. L., Brito, H. F., Menezes, J. F. S.,Silva, F. R. G. E., Donega, C. D. & Alves, S.Experimental and theoretical emissionquantum yield in the compoundEu(thenoyltrifluoroacetonate)3.2(dibenzylsulfoxide). Chem. Phys. Lett. 282, 233–238(1998).
93. Lima, N. B. D., Gonçalves, S. M. C., Júnior, S.A. & Simas, A. M. A comprehensive strategy toboost the quantum yield of luminescence ofeuropium complexes. Sci. Rep. 3, 2395 (2013).
94. Boyer, J.-C. & van Veggel, F. C. J. M. Absolutequantum yield measurements of colloidalNaYF4: Er3+, Yb3+ upconverting nanoparticles.Nanoscale 2, 1417–1419 (2010).
95. Zheng, W., Huang, P., Tu, D., Ma, E., Zhu, H.& Chen, X. Lanthanide-doped upconversionnano-bioprobes: electronic structures, opticalproperties, and biodetection. Chem. Soc. Rev. 44,1379–1415 (2015).
96. Goldschmidt, J. C. & Fischer, S. Upconversion
for photovoltaics - a review of materials,devices and concepts for performanceenhancement. Adv. Opt. Mater. 3, 510–535(2015).
97. Fischer, S., Johnson, N. J. J., Pichaandi, J.,Goldschmidt, J. C. & van Veggel, F. C. J. M.Upconverting core-shell nanocrystals with highquantum yield under low irradiance: On the roleof isotropic and thick shells. J. Appl. Phys. 118,193105 (2015).
98. Shao, W., Chen, G., Damasco, J., Wang, X.,Kachynski, A., Ohulchanskyy, T. Y., Yang, C.,Ågren, H. & Prasad, P. N. Enhancedupconversion emission in colloidal(NaYF4:Er3+)/NaYF4 core/shell nanoparticlesexcited at 1523 nm. Opt. Lett. 39, 1386–1389(2014).
99. Chen, G., Ohulchanskyy, T. Y., Kachynski, A.,Ågren, H. & Prasad, P. N. Intense visible andnear-infrared upconversion photoluminescencein colloidal LiYF4:Er3+ nanocrystals underexcitation at 1490 nm. ACS Nano 5, 4981–4986(2011).
100. Dyck, N. C., van Veggel, F. C. J. M. &Demopoulos, G. P. Size-dependentmaximization of upconversion efficiency ofcitrate-stabilized β-phase NaYF4:Yb3+,Er3+
crystals via annealing. ACS Appl. Mater. Interfaces5, 11661–11667 (2013).
101. Xue, X., Uechi, S., Tiwari, R. N., Duan, Z., Liao,M., Yoshimura, M., Suzuki, T. & Ohishi, Y.Size-dependent upconversion luminescenceand quenching mechanism of LiYF4: Er3+/Yb3+
nanocrystals with oleate ligand adsorbed. Opt.Mater. Express 3, 989–999 (2013).
102. Faulkner, D. O., Petrov, S., Perovic, D. D.,Kherani, N. P. & Ozin, G. A. Absolutequantum yields in NaYF4:Er,Yb upconverters –synthesis temperature and power dependence.J. Mater. Chem. 22, 24330–24334 (2012).
103. Chen, G., Shen, J., Ohulchanskyy, T. Y., Patel,N. J., Kutikov, A., Li, Z., Song, J., Pandey, R.

References
75
K., Ågren, H., Prasad, P. N. & Han, G. (α-NaYbF4:Tm3+)/CaF2 core/shell nanoparticleswith efficient near-infrared to near-infraredupconversion for high-contrast deep tissuebioimaging. ACS Nano 6, 8280–8287 (2012).
104. Xu, C. T., Svenmarker, P., Liu, H., Wu, X.,Messing, M. E., Wallenberg, L. R. &Andersson-Engels, S. High-resolutionfluorescence diffuse optical tomographydeveloped with nonlinear upconvertingnanoparticles. ACS Nano 6, 4788–4795 (2012).
105. Fischer, S., Martín-Rodríguez, R., Fröhlich, B.,Krämer, K. W., Meijerink, A. & Goldschmidt,J. C. Upconversion quantum yield of Er3+-doped β-NaYF4 and Gd2O2S: The effects ofhost lattice, Er3+ doping, and excitationspectrum bandwidth. J. Lumin. 153, 281–287(2014).
106. Kaivogen & Labrox. UpconTM. athttp://www.upcon.fi/
107. de Mello, J. C., Wittmann, H. F. & Friend, R. H.An improved experimental determination ofexternal photoluminescence quantumefficiency. Adv. Mater. 9, 230–232 (1997).
108. Auzel, F. & Pecile, D. Absolute efficiency forIR to blue conversion materials and theoreticalprediction for optimized matrices. J. Lumin. 11,321–330 (1976).
109. Würth, C., Geißler, D., Behnke, T., Kaiser, M.& Resch-Genger, U. Critical review of thedetermination of photoluminescence quantumyields of luminescent reporters. Anal. Bioanal.Chem. 407, 59–78 (2015).
110. Thoma, R. E., Insley, H. & Hebert, G. M. Thesodium fluoride-lanthanide trifluoride systems.Inorg. Chem. 5, 1222–1229 (1966).
111. Harju, E., Hyppönen, I., Hölsä, J., Kankare, J.,Lahtinen, M., Lastusaari, M., Pihlgren, L. &Soukka, T. Polymorphism of NaYF4:Yb3+, Er3+
up-conversion luminescence materials.Zeitschrift für Krist. Proc. 1, 381–387 (2011).
112. PCPDFWIN v. 1.30, Powder diffraction file,1997, international centre for diffraction data,entry 06-0342 (cubic NaYF4).
113. PCPDFWIN v. 1.30, Powder diffraction file,1997, international centre for diffraction data,entry 28-1192 (hexagonalNa(Y0.57Yb0.39Er0.04)F4).
114. Schäfer, H., Ptacek, P., Eickmeier, H. & Haase,M. Synthesis of hexagonal Yb3+,Er3+-dopedNaYF4 nanocrystals at low temperature. Adv.Funct. Mater. 19, 3091–3097 (2009).
115. Krämer, K. W., Biner, D., Frei, G., Güdel, H.U., Hehlen, M. P. & Lüthi, S. R. Hexagonalsodium yttrium fluoride based green and blueemitting upconversion phosphors. Chem. Mater.16, 1244–1251 (2004).
116. Aebischer, A., Hostettler, M., Hauser, J.,Krämer, K., Weber, T., Güdel, H. U. & Bürgi,H.-B. Structural and spectroscopiccharacterization of active sites in a family oflight-emitting sodium lanthanide tetrafluorides.Angew. Chem. Int. Ed. Engl. 45, 2802–2806(2006).
117. Hyppänen, I., Hölsä, J., Kankare, J., Lastusaari,M., Pihlgren, L. & Soukka, T. Preparation andup-conversion luminescence properties ofNaYF4:Yb3+,Er3+ nanomaterials. Terrae Rarae16:1-6 (2009).
118. Renero-Lecuna, C., Marti n-Rodri guez, R.,Valiente, R., Gonzalez, J., Rodri guez, F.,Kra mer, K. W. & Gu del, H. U. Origin of thehigh upconversion green luminescenceefficiency in β-NaYF4:2%Er3+,20%Yb3+. Chem.Mater. 23, 3442–3448 (2011).
119. Suyver, J. F., Grimm, J., van Veen, M. K., Biner,D., Krämer, K. W. & Güdel, H. U.Upconversion spectroscopy and properties ofNaYF4 doped with Er3+, Tm3+ and/or Yb3+. J.Lumin. 117, 1–12 (2006).
120. Lage, M. M., Moreira, R. L., Matinaga, F. M. &Gesland, J.-Y. Raman and infrared reflectivity

References
76
determination of phonon modes and crystalstructure of Czochralski-grown NaLnF4 (Ln =La, Ce, Pr, Sm, Eu, and Gd) single crystals.Chem. Mater. 17, 4523–4529 (2005).
121. Shannon, R. D. Revised effective ionic radii andsystematic studies of interatomic distances inhalides and chalcogenides. Acta Crystallogr. Sect.A 32, 751–767 (1976).
122. Mai, H.-X., Zhang, Y.-W., Si, R., Yan, Z.-G.,Sun, L., You, L.-P. & Yan, C.-H. High-qualitysodium rare-earth fluoride nanocrystals:Controlled synthesis and optical properties. J.Am. Chem. Soc. 128, 6426–6436 (2006).
123. Chen, Z., Chen, H., Hu, H., Yu, M., Li, F.,Zhang, Q., Zhou, Z., Yi, T. & Huang, C.Versatile synthesis strategy for carboxylicacid−functionalized upconvertingnanophosphors as biological labels. J. Am.Chem. Soc. 130, 3023–3029 (2008).
124. Zhang, Q. & Zhang, Q.-M. Synthesis andphotoluminescent properties of α-NaYF4:Nd/α-NaYF4 core/shell nanostructurewith enhanced near infrared (NIR) emission.Mater. Lett. 63, 376–378 (2009).
125. Wang, M., Liu, J.-L., Zhang, Y.-X., Hou, W.,Wu, X.-L. & Xu, S.-K. Two-phase solvothermalsynthesis of rare-earth doped NaYF4
upconversion fluorescent nanocrystals. Mater.Lett. 63, 325–327 (2009).
126. Liang, X., Wang, X., Zhuang, J., Peng, Q. & Li,Y. Synthesis of NaYF4 nanocrystals withpredictable phase and shape. Adv. Funct. Mater.17, 2757–2765 (2007).
127. Wang, F., Han, Y., Lim, C. S., Lu, Y., Wang, J.,Xu, J., Chen, H., Zhang, C., Hong, M. & Liu, X.Simultaneous phase and size control ofupconversion nanocrystals through lanthanidedoping. Nature 463, 1061–1065 (2010).
128. Boyer, J.-C., Vetrone, F., Cuccia, L. A. &Capobianco, J. A. Synthesis of colloidalupconverting NaYF4 nanocrystals doped with
Er3+, Yb3+ and Tm3+, Yb3+ via thermaldecomposition of lanthanide trifluoroacetateprecursors. J. Am. Chem. Soc. 128, 7444–7445(2006).
129. Mai, H.-X., Zhang, Y.-W., Sun, L.-D. & Yan,C.-H. Size- and phase-controlled synthesis ofmonodisperse NaYF4 :Yb,Er nanocrystals froma unique delayed nucleation pathway monitoredwith upconversion spectroscopy. J. Phys. Chem.C 111, 13730–13739 (2007).
130. Yi, G. S. & Chow, G. M. Synthesis ofhexagonal-phase NaYF4:Yb,Er andNaYF4:Yb,Tm nanocrystals with efficient up-conversion fluorescence. Adv. Funct. Mater. 16,2324–2329 (2006).
131. Li, C., Yang, J., Quan, Z., Yang, P., Kong, D. &Lin, J. Different microstructures of β-NaYF4
fabricated by hydrothermal process: Effects ofpH values and fluoride sources. Chem. Mater. 19,4933–4942 (2007).
132. Wang, L. & Li, Y. Na(Y1.5Na0.5)F6 single-crystalnanorods as multicolor luminescent materials.Nano Lett. 6, 1645–1649 (2006).
133. Wang, L. & Li, Y. Controlled synthesis andluminescence of lanthanide doped NaYF4
nanocrystals. Chem. Mater. 19, 727–734 (2007).
134. Li, C., Quan, Z., Yang, J., Yang, P. & Lin, J.Highly uniform and monodisperse β-NaYF4:Ln3+ (Ln = Eu, Tb, Yb/Er, andYb/Tm) hexagonal microprism crystals:Hydrothermal synthesis and luminescentproperties. Inorg. Chem. 46, 6329–6337 (2007).
135. Zeng, S., Yi, Z., Lu, W., Qian, C., Wang, H.,Rao, L., Zeng, T., Liu, H., Liu, H., Fei, B. &Hao, J. Simultaneous realization of phase/sizemanipulation, upconversion luminescenceenhancement, and blood vessel imaging inmultifunctional nanoprobes through transitionmetal Mn2+ doping. Adv. Funct. Mater. 24, 4051–4059 (2014).
136. Wang, F., Wang, J. & Liu, X. Direct evidence of

References
77
a surface quenching effect on size-dependentluminescence of upconversion nanoparticles.Angew. Chemie - Int. Ed. 49, 7456–7460 (2010).
137. Naccache, R., Vetrone, F., Mahalingam, V.,Cuccia, L. A. & Capobianco, J. A. Controlledsynthesis and water dispersibility of hexagonalphase NaGdF4:Ho3+/Yb3+ nanoparticles. Chem.Mater. 21, 717–723 (2009).
138. Boyer, J.-C., Manseau, M.-P., Murray, J. I. & vanVeggel, F. C. J. M. Surface modification ofupconverting NaYF4 nanoparticles with PEG-phosphate ligands for NIR (800 nm)biolabeling within the biological window.Langmuir 26, 1157–1164 (2010).
139. Yi, G. S. & Chow, G. M. Water-solubleNaYF4:Yb,Er(Tm)/NaYF4/polymercore/shell/shell nanoparticles with significantenhancement of upconversion fluorescence.Chem. Mater. 19, 341–343 (2007).
140. Zhang, F., Che, R., Li, X., Yao, C., Yang, J.,Shen, D., Hu, P., Li, W. & Zhao, D. Directimaging the upconversion nanocrystalcore/shell structure at the subnanometer level:Shell thickness dependence in upconvertingoptical properties. Nano Lett. 12, 2852–2858(2012).
141. Li, Z. & Zhang, Y. Monodisperse silica-coatedpolyvinyl-pyrrolidone/NaYF4 nanocrystalswith multicolor upconversion fluorescenceemission. Angew. Chemie - Int. Ed. 45, 7732–7735(2006).
142. Ostrowski, A. D., Chan, E. M., Gargas, D. J.,Katz, E. M., Han, G., Schuck, P. J., Milliron, D.J. & Cohen, B. E. Controlled synthesis andsingle-particle imaging of bright, sub-10 nmlanthanide-doped upconverting nanocrystals.ACS Nano 6, 2686–2692 (2012).
143. Johnson, N. J. J., Korinek, A., Dong, C. & VanVeggel, F. C. J. M. Self-focusing by Ostwaldripening: A strategy for layer-by-layer epitaxialgrowth on upconverting nanocrystals. J. Am.Chem. Soc. 134, 11068–11071 (2012).
144. Boyer, J.-C., Gagnon, J., Cuccia, L. A. &Capobianco, J. A. Synthesis, characterization,and spectroscopy of nanoparticles.Communications 19, 3358–3360 (2007).
145. Li, Z., Zhang, Y. & Jiang, S. Multicolorcore/shell-structured upconversion fluorescentnanoparticles. Adv. Mater. 20, 4765–4769(2008).
146. Liu, Y., Tu, D., Zhu, H., Li, R., Luo, W. &Chen, X. A strategy to achieve efficient dual-mode luminescence of Eu3+ in lanthanidesdoped multifunctional NaGdF4 nanocrystals.Adv. Mater. 22, 3266–3271 (2010).
147. Prorok, K., Pawlyta, M., Strek, W. &Bednarkiewicz, A. Energy migration up-conversion of Tb3+ in Yb3+ and Nd3+ co-dopedactive-core/active-shell colloidal nanoparticles.Chem. Mater. 28, 2295–2300 (2016).
148. Vetrone, F., Naccache, R., Mahalingam, V.,Morgan, C. G. & Capobianco, J. A. The active-core/active-shell approach: A strategy toenhance the upconversion luminescence inlanthanide-doped nanoparticles. Adv. Funct.Mater. 19, 2924–2929 (2009).
149. Qian, H. S. & Zhang, Y. Synthesis ofhexagonal-phase core-shell NaYF4 nanocrystalswith tunable upconversion fluorescence.Langmuir 24, 12123–12125 (2008).
150. Scherrer, P. Bestimmung der Größe und derinneren Struktur von Kolloidteilchen mittelsRöntgenstrahlen. Nachrichten von der Gesellschaftder Wissenschaften zu Göttingen, Math. Klasse 1918,98–100 (1918).
151. Patterson, A. L. The scherrer formula for X-rayparticle size determination. Phys. Rev. 56, 978–982 (1939).
152. Abel, K. A., Boyer, J. C. & Van Veggel, F. C. J.M. Hard proof of the NaYF4/NaGdF4
nanocrystal core/shell structure. J. Am. Chem.Soc. 131, 14644–14645 (2009).
153. Abel, K. A., Boyer, J.-C., Andrei, C. M. & van

References
78
Veggel, F. C. J. M. Analysis of the shellthickness distribution on NaYF4/NaGdF4
core/shell nanocrystals by EELS and EDS. J.Phys. Chem. Lett. 2, 185–189 (2011).
154. Rietveld, H. M. A profile refinement methodfor nuclear and magnetic structures. J. Appl.Crystallogr. 2, 65–71 (1969).
155. Rodriguez-Carvajal, J. FullProf.2k. (2007).
156. Williamson, G. K. & Hall, W. H. X-ray linebroadening from filed aluminium and wolfram.Acta Metall. 1, 22–31 (1953).
157. Ungár, T. in Industrial Applications of X-rayDiffraction (eds. Chung, F. H. & Smith, D. K.)847–852 (Marcel Dekker, 2000).
158. George, G. N. & Pickering, I. J. EXAFSPAK -a suite of computer programs for analysis of X-ray absorption spectra. (1993).
159. Origin 2015. (2015).
160. Mathews, M. D. D., Ambekar, B. R. R., Tyagi,A. K. K. & Köhler, J. High temperature X-raydiffraction studies on sodium yttrium fluoride.J. Alloys Compd. 377, 162–166 (2004).
161. Moulder, J. F., Stickle, W. F., Sobol, P. E. &Bomben, K. D. Handbook of X-ray photoelectronspectroscopy: A reference book of standard spectra foridentification and interpretation of XPS Data.(Physical Electronics, 1995).
162. Pichaandi, J., Das, G. K., Johnson, N. J. J.,Regier, T. & van Veggel, F. C. J. M. Probing thestructure of NaYF4 nanocrystals usingsynchrotron-based energy-dependent X-rayphotoelectron spectroscopy. J. Phys. Chem. C118, 21639–21646 (2014).