Temporal dynamics of perisylvian activation during language processing in children and adults
REVIEW
Temporal dynamics and network analysis
Benjamin Blonder1*, Tina W. Wey2, Anna Dornhaus1, Richard James3 and Andrew Sih2
1Department of Ecology and Evolutionary Biology, University of Arizona, 1041 E Lowell St., Tucson, Arizona 85721,
USA; 2Department of Environmental Science and Policy, University of California Davis, 1 Shields Ave., Davis, CA
95616, USA; and 3Department of Physics, University of Bath, 3 West 2.2D, Bath BA2 7AY, UK
Summary
1. Network analysis is widely used in diverse fields and can be a powerful framework for studying
the structure of biological systems. Temporal dynamics are a key issue for many ecological and evo-
lutionary questions. These dynamics include both changes in network topology and flow on the net-
work. Network analyses that ignore or do not adequately account for the temporal dynamics can
result in inappropriate inferences.
2. We suggest that existing methods are currently under-utilized in many ecological and evolution-
ary network analyses and that the broader incorporation of these methods will considerably
advance the current field. Our goal is to introduce ecologists and evolutionary biologists interested
in studying network dynamics to extant ideas and methodological approaches, at a level appropri-
ate for those new to the field.
3. Wepresent an overview of time-ordered networks, which provide a framework for analysing net-
work dynamics that addresses multiple inferential issues and permits novel types of temporally
informed network analyses. We review available methods and software, discuss the utility and con-
siderations of different approaches, provide a worked example analysis and highlight new research
opportunities in ecology and evolutionary biology.
Key-words: dynamics, flow, graph theory, network, time aggregated, time ordered,
time-scale
Introduction
Network analysis is of current and growing importance in
diverse fields including ecology and evolutionary biology.
Many biological systems consist of interconnected units and
can be usefully modelled as networks, which are mathematical
constructs describing a set of edges between vertices (Albert &
Barabasi 2002; Proulx, Promislow & Phillips 2005; Diestel
2010; Newman 2010). The identity of each varies with the
system and question of interest – for example, vertices can be
genes, proteins, neurons, individual organisms, species,
geographic regions, etc. and edges can represent regulatory
interactions, binding affinities, synapses, social associations,
predation, gene flow and so on (Dunne, Williams & Martinez
2002; Proulx, Promislow & Phillips 2005; May 2006;
Bascompte & Jordano 2007; Wey et al. 2008; Sih, Hanser &
Mchugh 2009; Bascompte 2010). Network topology refers to
the structure of edges and vertices and can be quantified with a
range of statistics about the pattern of connections among
vertices. Processes of flow can occur on these edges, repre-
senting transfers of resources, disease, information, etc.
Network theory provides a basis for analysing outcomes that
depend on network topology or flow and is thus a powerful
framework for testing hypotheses about biological interactions
bymeasuring and comparing network variation.
Questions of network dynamics are of key interest for many
ecological and evolutionary systems, for example, how and
why the topology of the network changes over time, how these
changes affect the flow of resources (or disease) through the
network, and the nature and importance of feedbacks between
flow processes and topological change. However, network
dynamics can be quantitatively challenging and difficult to
address and are largely unaccounted for in most extant net-
work analyses (James, Croft & Krause 2009; Sih, Hanser &
Mchugh 2009; Bascompte 2010).
In the current standard framework, networks are usually
taken as representations of a system aggregated over a certain
limited time interval. It is difficult to ask questions about how
and why a system changes over time using this static abstrac-
tion, which is based on several critical assumptions. Specifi-*Correspondence author. E-mail: [email protected]
Methods in Ecology and Evolution doi: 10.1111/j.2041-210X.2012.00236.x
� 2012 The Authors. Methods in Ecology and Evolution � 2012 British Ecological Society

cally, this approach assumes that the network’s topology is
fixed; processes of flow are at a dynamic steady state; edges
represent persistent interactions; interactions are sufficiently
stable to address the question of interest; and there is sufficient
sampling so that the structure of the network is accurately and
completely known. Together, these assumptions imply that the
chosen representation of interactions is sufficient to evaluate
equilibrium situations, but breaking them, which occurs in
many real networks, can lead to a range of serious inferential
problems (Box 1). Many networks involve dynamics but have
so far been analysed usingmethodsmore appropriate for static
systems. Thus, while these assumptions permit some simple
and fast analyses, an explicitly dynamic approach can be more
useful.
Here, we review current approaches that address the need
for incorporating temporal dynamics into network analysis of
observational data in ecology and evolutionary biology. Our
goal is to introduce ecologists and evolutionary biologists
interested in network dynamics but thatmay currently be unfa-
miliar with the concepts and techniques already available. We
survey basic concepts that are important in dynamic network
analysis as well as recent advances in a range of disciplines and
their applications in ecology and evolutionary biology. Fur-
thermore, we discuss considerations in determining the appro-
priate network representations for the dynamics of interest and
highlight important ecological and evolutionary questions that
can be understood as network dynamics questions at different
time-scales. These concepts are brought together via the time-
Box 1. Common inferential problems can arise when different time-scales are important to networks. Here, we highlight four common types of
problems.
a. Standard static network analyses measure a set of interactions with the implicit assumption that edges in a network are permanent
associations. If instead, interactions are brief, rarely connected vertices may appear connected more often than they should be,
changing the topology of the network. Varying the window over which to aggregate interactions into a network can produce a
range of topologies and resulting inferences. Too short of a window, and no individuals are connected; too long of a window, and
perhaps all individuals incorrectly appear connected (James, Croft & Krause 2009; Blonder & Dornhaus 2011). Alternatively,
weighting edges by interaction probabilities can represent true levels of connectivity.
b. If networks change more rapidly than an investigator samples (e.g. if the dashed edge in the illustration changes state during sam-
pling of interactions), dramatic changes in topological dynamics can occur (Stumpf, Wiuf & May 2005; de Silva et al. 2006;
Franks et al. 2009). Edges may not be persistent, well defined or adequately sampled at the time-scales of interest.
c. Simulated removal or addition of edges and vertices often neglect topological dynamics of a network. Investigators may incor-
rectly assume that networks do not change their structure in response to a perturbation (Albert, Jeong & Barabasi 2000). Many
networks rewire edges in response to perturbation, potentially even at time-scales relevant to flow dynamics. Removal simulations
that do not include rewiring should be considered critically if rewiring could occur at relevant time-scales.
d. The ordering of events is important to flow dynamics on a network and can affect inference about resource flow processes. Interac-
tions that are aggregated into a network may suggest that individuals are connected to each other. However, the ordering and tim-
ing of interactions imply that some paths are causally impossible, and some paths that appear short in terms of number of edges
may be long in time delay (Holme 2005; Chan, Holmes & Rabadan 2010; Blonder & Dornhaus 2011). In this example, the short-
est-length path from A to D is A-B-D, but the shortest-time path is actually A–B–C–D. Also, until Saturday, A can spread a
resource to D, but D cannot spread a resource to A. Neither inference is possible without knowledge of the ordering of events.
Tue
Mon
Wed
Fri
Sat
(a)
(b)
(c)
(d)
Time window 1 Time window 2 Time window 1+2
?
Fast sampling Slow sampling
B
A
C
D
B
A
C
D
?
?
Vertex removed
2 B. Blonder et al.
� 2012 The Authors. Methods in Ecology and Evolution � 2012 British Ecological Society, Methods in Ecology and Evolution
ordered network framework, which unifies dynamics at multi-
ple time-scales, resolves common inferential problems and
enables many new types of analyses. We provide a guide to
time-ordered network analysis that includes computational
resources, work through an example application and identify
research areas where this frameworkmay be valuable.
Two types of dynamics: topology and flow
Our concept of the network, and what it represents, depends
on two key types of dynamics: flow processes on the network
and changes in the underlying topology of the network. Flow
dynamics are how resources, contacts, information, disease,
etc. are propagated between network vertices, for a given set of
vertices and edges. Topological dynamics are how the network
structure changes through variation in the identity or weight of
edges (sometimes known as ‘rewiring’). Systems may exhibit
one or both types of dynamics, and questions of interest will
determine the appropriate focus. For example, evolutionary
and seasonal changes in the interactions between multiple
species in a pollination network (Bascompte & Jordano 2007;
Petanidou et al. 2008) are topological dynamics. Alternatively,
resource exchanges between plants and animals (e.g. biomass
in a food web (Jarre-Teichmann & Pauly 1993) or disease in a
population (Rothenberg et al. 1998)) would represent flow
dynamics.
The relative times-cales of underlying processes can be
important to understanding both topological and flow dynam-
ics. Topology can influence flow, and also flow can influence
topology. If both are occurring on a similar time-scale, feed-
backs between the two may exist. In the example of disease
transmission on a social network, contracting the disease (the
result of flow processes) can result in changes to interactions
with others (Croft et al. 2011a), either through changes in the
sick individual’s behaviour or through changes in response of
others to that individual and thus to the topology of the net-
work (Fefferman&Ng 2007; Bansal et al. 2010; Romano et al.
2010). Networks that exhibit coupling and strong feedback
between the two time-scales are sometimes considered ‘adap-
tive’ or ‘co-evolutionary’ (Gross &Blasius 2008).
Time-ordered networks as a unifyingframework
A framework for analysing network dynamics that unifies
topology and flow dynamics is available through the concepts
of time-ordered networks and time-aggregated networks
(Kempe, Kleinberg & Kumar 2002). Both types of networks
can be used to study different aspects of topological and flow
dynamics, as shown below. This framework encompasses
many extant approaches to network dynamics and can be used
not only to avoid the critical issues discussed earlier (Box 1)
but also to enable novel and temporally informed analyses.
References to extant studies, computational tools and future
opportunities are organized thematically in Table 1 and cited
from within the text. Additionally, the free R package ‘timeor-
dered’ implements many of these analyses, using any data that
list the identities of vertices and edge occurrence time for each
interaction. We provide an example analysis of ant colonies
using time-ordered networks that highlights the power of this
framework (Box 3).
TIME-ORDERED NETWORKS
Formany network phenomena, the order, duration and timing
of events can be critical (Box 1d) (Moody 2002). Time-ordered
networks represent data observed for a set of interactions that
occur at certain times, thereby retaining complete information
on the ordering, duration and timing of events. Graphically,
vertices in a time-ordered network can be represented as a ser-
ies of static networks with edges distributed over the time
dimension. Vertices always move forward in time, and edges
between vertices are visualized as arrows drawn at the start
and stop time steps for an interaction (Box 2a). The arrows
can be bidirectional if the interaction is undirected (i.e. A inter-
acts with B implies B interacts with A). Thus, the time-ordered
network is a complete record of all observed interactions at all
time points which describes all flow and topology changes.
Time-ordered networks have also been called temporal net-
works (Holme & Saramaki 2011), temporal graphs (Kostakos
2009), dynamic networks (Carley 2003; Lahiri et al. 2008) or
dynamic graphs (Berger-Wolf & Saia 2006).
Mathematically, time-ordered networks are directed acyclic
graphs (Diestel 2010). In the graph, a ‘temporary vertex’ is cre-
ated at the start and stop time for each interaction and assigned
a label corresponding to the identity of the corresponding ver-
tex in the static network. Thus, in the time-ordered network, a
single vertex in a static network (e.g. Individual 1) will be repre-
sented by multiple ‘temporary vertices’ (e.g. Individual 1, at
time t1; Individual 1, at t2). Next, an edge is created between
‘temporary vertices’ at the start and stop time of each interac-
tion, and a directed edge is created that connects the ‘tempo-
rary vertex’ to itself at the stop time for one interaction and the
start time for the next interaction. If certain vertices do not
exist at some time points, the investigator may choose to either
keep the vertex in the network without recording any further
interactions (e.g. an animal that has temporarily left the area of
observation) or instantiate a new time-ordered network with-
out this vertex being present (e.g. an animal that has died and
will never interact again). The latter approach may be more
appropriate when using statistics such as the network diameter
that are sensitive to global connectivity or extra zeros.
Time-ordered networks can be used to answer many
descriptive questions about flow dynamics (Table 1, F2). For
example, how fast (if at all) can a resource propagate from
one vertex to another? Determining these causally permitted
pathways of resource flow is possible with time-ordered net-
works by tracing any line that follows a non-decreasing path
in time (Kempe, Kleinberg & Kumar 2002). An example is
shown as a dotted yellow line in Box 2a. In Box 1d, we show
how for several apparently connected vertices, A can trans-
mit a resource to C via B only by interacting with B before
B interacts with C. Similarly, bounds on resource flow can
be determined by determining shortest-time or shortest-
Temporal dynamics and network analysis 3
� 2012 The Authors. Methods in Ecology and Evolution � 2012 British Ecological Society, Methods in Ecology and Evolution

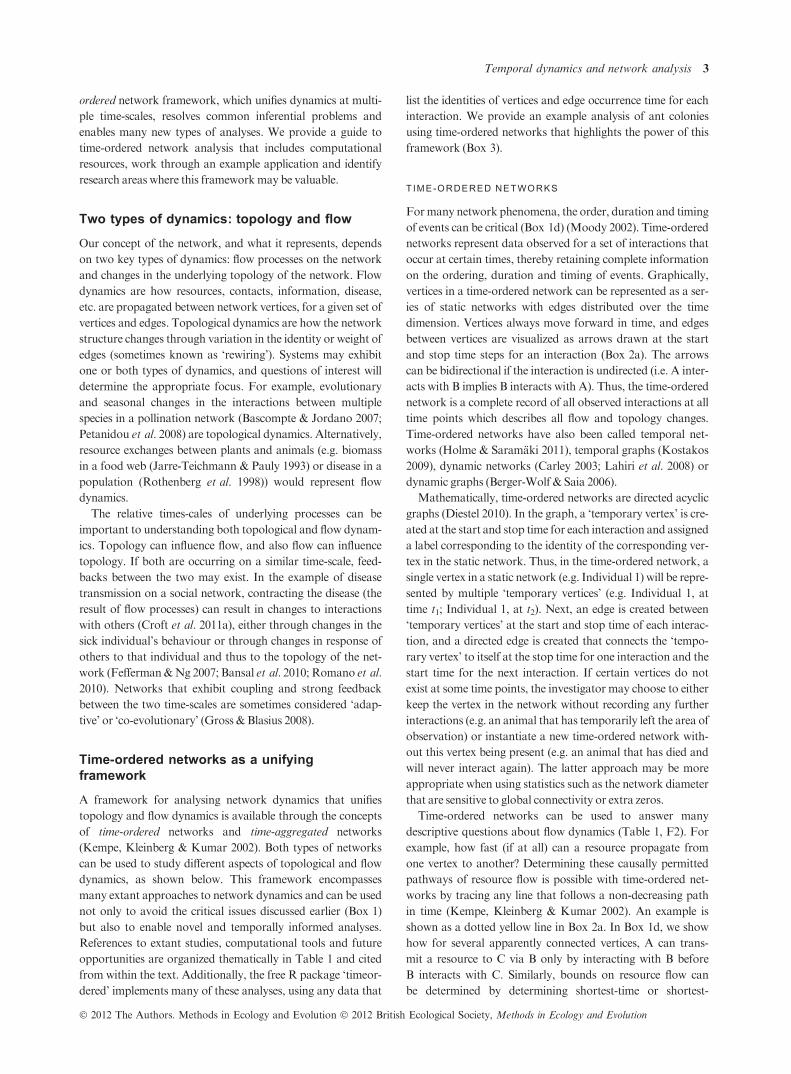
Table
1.Multiple
research
questionsin
ecology
andevolutionary
biologycould
beaddressed
withnetwork
dyn
amicsapproaches.This
table
highlights
sharedquestions,
key
referencesandavailable
computationalresources
Problem
Key
biologyreferences
Methodsreferencesandsoftware
Available
free
software
Example
future
applications
Topologicaldynamics(T)
T1.Measuringresponse
ofnetwork
toexternal
factororperturbation
Extinctionsin
foodwebs(D
unne&
Williams2009),
ecologicaldegradationin
food-w
ebdegradation
(Coll,Lotze&
Romanuk2008;Staniczenkoet
al.
2010),temporalvariabilityin
plant–pollinator
system
s(A
larcon,Waser&
Ollerton2008)andin
foodwebs(Ingset
al.1993)andother
eco
(Walters,Christensen&
Pauly
1997)logical
networks(O
lffet
al.2009),yeast
regulatory
gene
networksunder
variable
environments
(Luscombe
etal.2004),primate
socialnetworks(Flack
etal.
2006),marm
otdispersal(Blumstein,Wey
&Tang
2009).
Tim
eseries
andregressionmethodsapplied
totime-dependentstatistics(this
manuscript)
statnet
(R),
dynamicnetwork
(R),
SIE
NA
(R)
Conservation:whatwill
betheim
pactsofone
species’extinctionon
others?
T2.Predictionoffuture
network
state
from
currentnetwork
state
Plant–anim
almutualistic
networks(Bascompte
&Jordano2007),food-w
ebassem
bly
(Williams
&Martinez
2000)invasionsuccess(R
omanuk
etal.2009)stability(Thebault&
Fontaine2010).
Assessm
entofcausality
(Seth&
Edelman
2007),structure
prediction(Liben-N
owell
&Kleinberg2003;Lahiri&
Berger-W
olf
2007;Snijders,Koskinen
&Schweinberger
2010;Dunlavy,Kolda&
Acar2011;Lu
&Zhou2011)
MSBVAR
(R)
Mutualism
:istheidentity
ofspecialist
pollinators
consistentbetweenyears?
T3.Model
selectionand
hypothesistesting
Socialinsect
networks(Blonder
&Dornhaus2011)
Stochastic
actor-basedmodels(SAM)
(Snijders,VandeBunt&
Steglich
2010),
resampling(C
roftet
al.2011b)(this
manuscript)
SIE
NA
(R),
timeordered
(R)
Evolution:donew
ly
evolved
proteinsinteract
preferentiallywith
functionallycentral
proteins?
T4.Identificationof
temporallypersistent
network
structuresand
ofvariationbetween
groups
Communitymem
bership
inbatfission–fusion
societies(K
erth,Perony&
Schweitzer
2011),
queen-w
orker
differentiationin
antsocial
networks(Blonder
&Dornhaus2011),persistence
ofprimate
socialassociations(H
enzi
etal.2009)
Communitydetectionalgorithms
(Tantipathananandh,Berger-W
olf&
Kem
pe2007;Berger-W
olf,
Tantipathananandh&
Kem
pe2010;Mucha
etal.2010),resamplingoftime-dependent
network
statisticsfordifferentnetwork
subsets
(New
man2010;Croftet
al.2011b),
lagged
associationrates(W
hitehead2009)
CommDy,SIE
NA
(R)
Anim
albehaviour:over
whattime-scalesisgroup
mem
bership
consistent?
Flowdynamics(F)
F1.Model
selectionand
hypothesistesting
Sociallearning((Kendalet
al.2010)
Resampling(thismanuscript),network-
baseddiffusionanalysis(Franz&
Nunn
2009;Hoppitt,Boogert&
Laland2010),
stochastic
actor-basedmodels(Snijders,
VandeBunt&
Steglich
2010)
timeordered
(R),
NBDA
(R),
SIE
NA
(R)
Socialbehaviour:do
femalesshare
inform
ation
faster
thanmales?
4 B. Blonder et al.
� 2012 The Authors. Methods in Ecology and Evolution � 2012 British Ecological Society, Methods in Ecology and Evolution
Table
1.(C
ontinued)
Problem
Key
biologyreferences
Methodsreferencesandsoftware
Available
free
software
Example
future
applications
F2.Observationor
manipulationofresource
flows
Flow
ofindividualsbetweenpopulations(M
ay
2006;Fletcher
etal.2011),foodbetweenanim
als
(Otterstatter
andThomson2007;Naug2008;
Sendova-Frankset
al.2009;Romanoet
al.2010),
biomass
betweenspeciesin
afoodweb
(Jarre-Teichmann&
Pauly
1993),disease
between
people
(Chan,Holm
es&
Rabadan2010;Romano
etal.2010),inform
ationbetweenpeople
(Centola
2010,2011)
Food-w
ebdynamics(W
alters,Christensen&
Pauly
1997)
timeordered
(R)
Trophic
interactions:do
generalist
predators
have
adisproportionate
effect
onpopulationdynamics?
F3.Identificationofnodes
orprocesses
importantfor
maxim
izingorminim
izing
flow
Spreadofdisease
(Volz
&Meyers2007;Salathe
&Jones
2010).
Maxim
izinginfluence
insocialnetworks
(Kem
pe,
Kleinberg&
Tardos2003)(this
manuscript),findinginfluentialindividuals
(Prakash
etal.2011)
timeordered
(R)
Socialbehaviour:does
inform
ationflow
most
rapidly
throughhigh-
statusindividuals?
F4.Sim
ulationofresource
flow
Resourceorinform
ationtransfer
insocialinsects
(Naug2008;Blonder
&Dornhaus2011;
Pinter-Wollmanet
al.2011),sociallearning
(Kendalet
al.2010)
Sim
ulationofflow
onshortestpaths(H
olm
e
2005)(thismanuscript)orstochasticallyvia
anyallowed
path
(Onnelaet
al.2007;
Lahiriet
al.2008;Tanget
al.2010),
network-baseddiffusionanalysis
statnet
(R),
dynamicnetwork
(R),
epinet
(R),
timeordered
(R)
Disease
dynamics:isthe
spreadofanepidem
ic
dependentontheorder
in
whichanim
alscontact
each
other?
F5.Predictionofstable
outcomes
ofgames
or
individual-basedmodels
Evolutionofcooperation(Ifti,Killingback
&
Doebeli2004;Ohtsukiet
al.2006;Szolnoki
&Perc2009),geneinteractionsandadaptive
landscapes
(Kauffman&
Johnsen1991;Kauffman
etal.2003),origin
ofmacroecologicalpattern
(O’D
wyer
&Green
2010),cellularautomata
modelsforspatialdistributionofvegetation
(Scanlonet
al.2007)andspeciesinvasions
(Eppstein&
Molofsky2007).
Cellularautomata
models((Wolfram
2002)
andagent-basedmodels(Frantz
&Carley
2009;Yateset
al.2009)
NetLogo
Ecology:how
do
interactionsbetween
individualplants
leadto
landscape-scale
vegetation
patterning?
Coupleddynamics(C
)
C1.Measurementoftime
delaysandresourceflows
Socialinsect
networks(Blonder
&Dornhaus2011)
Reachabilityofnodes
(Holm
e2005),waiting
times
betweeninteractions(Barabasi2005;
Karsaiet
al.2010;Tanget
al.2010),vector
clock
latencies
establishingboundson
minim
um
timedelaysforresources
to
propagate
betweennodes
(Kossinets,
Kleinberg&
Watts2008)
timeordered
(R)
Metapopulations:what
limitsgeneflow
between
differentregions?
C2.Predictionofoutcomes
ofgames
orofnetwork
stable
states
Games
whereagents
maychangethenumber
andidentity
ofthepartnersthey
interact
with(Lieberman,Hauert&
Nowak2005;Bryden
etal.2011;Fehl,vander
Post
&Sem
mann2011;
Rand,Arbesman&
Christakis2011)
Adaptivenetworks(G
ross
&Blasius2008),
behaviouralnetworks(Sih,Hanser&
Mchugh2009),stabilityanalysis(G
ross,
D’Lim
a&
Blasius2006;Holm
e&
New
man
2006)
Evolutionary
theory:when
cancooperationbetween
multiple
agents
persist?
Temporal dynamics and network analysis 5
� 2012 The Authors. Methods in Ecology and Evolution � 2012 British Ecological Society, Methods in Ecology and Evolution

unique-vertices paths between individuals. For example, a
question like ‘At least how many unique individuals does a
resource pass through when moving from A to C?’ is impor-
tant for questions about network efficiency or the impor-
tance of certain individuals in determining resource flow.
One can also identify key vertices for resource-spreading pro-
cesses by computing standard network metrics on a time-
ordered network (Table 1, F3). For example, a high
betweenness centrality of a ‘temporary vertex’ (number of
shortest paths in the network passing through this vertex)
indicates that this vertex mediates many resource flow paths
at this time point.
Summary statistics of time-ordered networks also provide
insight into dynamic properties of the system (Table 1, F4,
C1). These metrics can be made explicitly dependent on abso-
lute time and time intervals and thus can provide more insight
into processes underlying networks than static metrics. One
useful metric is themean time delay between two randomverti-
ces over a certain time window. For example, a short average
time for resource flows between some individuals may indicate
membership in a common group, or identifying an individual
through which many shortest-unique-vertices paths pass can
indicate that this individual plays a preferred role in mediating
resource flows. Also, if this time delay is only short for the first
half of the data collection interval and later becomes longer,
we may conclude that the underlying dynamic process is
changing; this group no longer plays a preferred role in
resource flow processes. We further describe applications of
such statistics in the worked example (Box 3). Note that the
details of resource flow on the time-ordered network should
depend on the resource type – for example, some resources like
food are passed on but not retained while others like disease
are passed on and retained. This means that the dynamics of
resource flow processes may shift from a transfer to a broad-
cast process. Using the correctmetric for each type of flow pro-
cess is critical; we refer the reader to (Borgatti 2005) for a
comprehensive perspective on this issue.
Simulations or observations of flow dynamics occurring on
networks with fixed topology can be described using time-
ordered networks (Table 1, F4, C2). For a network with fixed
topology whose edges represent potential interactions that
depend on the details of the system, the occurrence and order-
ing of actual interactions can be completely described by a
time-ordered network. The approaches described in previous
sections can then be used to make time-dependent descriptions
and inferences about the system. This approach may also be
valuable for individual-based or cellular automata models
(Wolfram 2002) where network topology is fixed – for exam-
ple, in a cellular automata model of pollen flow between multi-
ple patches with unchanging connectivity, one could simulate
the activity of different pollen carriers and test the hypothesis
that plants with more conspecific neighbours had higher rates
of resource flow.An area of active application is in social learn-
ing, where network-based diffusion analysis (Franz & Nunn
2009; Hoppitt, Boogert & Laland 2010) is used to assess how
the social structure of a group predicts the rate of acquisition
of a new behaviour in group members. This general approachTable
1.(C
ontinued)
Problem
Key
biologyreferences
Methodsreferencesandsoftware
Available
free
software
Example
future
applications
C3.Response
to
perturbation
Behaviourshifts
duringepidem
ics(R
othenberg
etal.1998;Gross,D’Lim
a&
Blasius2006;Shaw
&Schwartz2008;Funket
al.2009;Volz
&
Meyers2009;Bansalet
al.2010),variable
species
interactionsin
foodwebsbecause
ofchanges
in
resourceflow
(Uchida&
Drossel
2007;Ingset
al.
2009;Staniczenkoet
al.2010;Valdovinoset
al.
2010)
Stochastic
actor-basedmodels(Snijders,Van
deBunt&
Steglich
2010)
statnet
(R),
dynamicnetwork
(R),
SIE
NA
(R)
Disease
dynamics:does
individualbehaviourshift
after
infection?
C4.Consequencesof
individualmobilityon
proxim
itynetworks
Socialinsect
(Pinter-Wollmanet
al.2011;Jeanson
2012)oranim
al(Flack
etal.2006;Couzin
2009;Onnelaet
al.2010)networks
Nullmodelsofproxim
itynetwork
properties
(Blonder
&Dornhaus2011;Bode,
Wood&
Franks2011)
Anim
albehaviour:how
do
themovem
entpatternsof
individualsaffectthespread
ofinform
ationin
thegroup?
C5.Controlofnetwork
Humancooperation(R
and,Arbesman&
Christakis
2011),Foodwebs(Sahasrabudhe&
Motter
2011),
genomic
networksandorganismaldevelopment
(Abdallah2011)
Controltheory
(Zecevic
&Siljak2010;Liu,
Slotine&
Barabasi2011)
Foodwebs:ifaspecialist
predatorgoes
extinct,can
theremovalofasecond
speciespermitthe
persistence
ofathird
speciesofinterest?
6 B. Blonder et al.
� 2012 The Authors. Methods in Ecology and Evolution � 2012 British Ecological Society, Methods in Ecology and Evolution
of fittingmultiple competingmodels of flow on a fixed network
to observed patterns of flowwould likely be applicable in other
areas.
Similarly, proximity networks have been another valuable
area for the application of time-ordered networks (Table 1,
C4). These networks are relevant to a wide range of animal
groups because they describe interactions between mobile
individuals (vertices) where edges are created when individu-
als are near each other and are destroyed as individuals
move apart. Here, time-ordered networks can describe
group dynamics, and observed data can be easily compared
to networks constructed from null models of individuals’
motion.
Time-ordered networks can also provide insight into pat-
terns in the processes of network rewiring after perturbation
by detecting new temporally variable or persistent structures
or by characterizing changes in flow (Table 1, C3). For exam-
ple, in a food web, energy flows may appear to become more
compartmentalized during some seasons (Jarre-Teichmann &
Pauly 1993); time-ordered network analyses can provide a rig-
orous test of this hypothesis.
Most powerfully, time-ordered networks enable new types
of null modelling of both topological and flow dynamics that
permit inferences to be made (Table 1, F1). Resampling of
time-ordered networks is a powerful approach in which certain
correlations within observed data are randomized while others
are preserved – for example, identities of interaction partners
or times of interactions. This approach is useful for under-
standing the processes controlling a network phenomenon and
for hypothesis testingwithout needing tomeet the assumptions
of more standard statistics (Franks et al. 2009; James, Croft &
Krause 2009; Karsai et al. 2010). For example, one can deter-
mine whether resources flow between two vertices significantly
faster than expected by simulating a large set of networks that
differ from the observed data only by randomization of the
times at which interactions were observed. If the observed
shortest path length between the focal vertices is indeed shorter
than in some fraction (e.g. 95%) of the simulated networks,
then there are processes causing temporal correlations between
interactions. As with any re-sampling procedure, investigators
must be careful to break only correlations in the structure of
interest while maintaining all other structures in the data set
(Holme 2005). We show how these approaches can be applied
in the worked example (Box 3).
T IME-AGGREGATED NETWORKS
A benefit of time-ordered networks is that they can be flexibly
decomposed into multiple time-aggregated networks based on
selected time windows, which can be analysed with standard
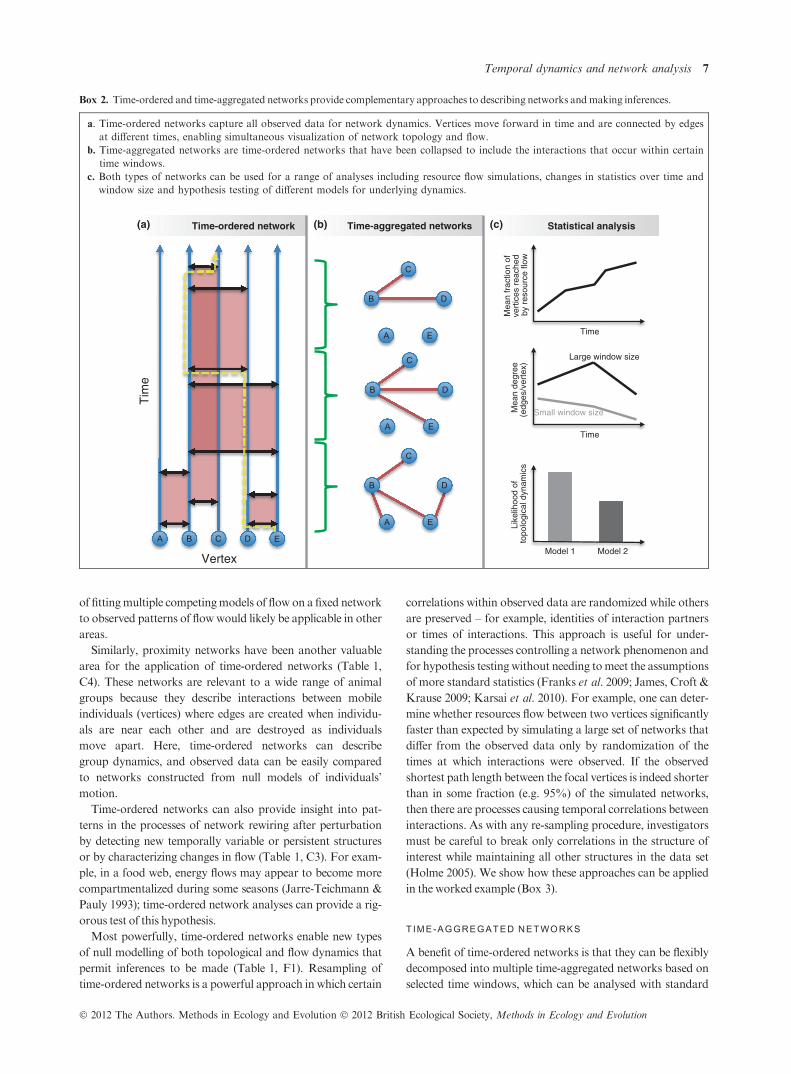
Box 2. Time-ordered and time-aggregated networks provide complementary approaches to describing networks andmaking inferences.
a. Time-ordered networks capture all observed data for network dynamics. Vertices move forward in time and are connected by edges
at different times, enabling simultaneous visualization of network topology and flow.
b. Time-aggregated networks are time-ordered networks that have been collapsed to include the interactions that occur within certain
time windows.
c. Both types of networks can be used for a range of analyses including resource flow simulations, changes in statistics over time and
window size and hypothesis testing of different models for underlying dynamics.
Time-ordered network Time-aggregated networks Statistical analysis
Tim
e
Vertex
A B C D E
E A
D
C
B
E A
D B
E A
D B
C
C
Mea
n fr
actio
n of
ve
rtic
es r
each
ed
by r
esou
rce
flow
Time
Mea
n de
gree
(edg
es/v
erte
x)
Time
Large window size
Small window size
Like
lihoo
d of
to
polo
gica
l dyn
amic
s
Model 1 Model 2
(a) (b) (c)
Temporal dynamics and network analysis 7
� 2012 The Authors. Methods in Ecology and Evolution � 2012 British Ecological Society, Methods in Ecology and Evolution

methods. Essentially, this approach reduces the time-ordered
data into a series of static networks. To generate time-aggre-
gated networks, one subsets the time-ordered network at differ-
ent start and stop time points and then projects along the time
axis to retain any interactions that begin or stopwithin thewin-
dow (Clauset & Eagle 2007) (Box 2b). They are sometimes
called panels, waves, or longitudinal data (Robins et al. 2007;
Snijders, Van de Bunt & Steglich 2010). Time-aggregated net-
works are identical to the networks studied using standard
approaches, except that they are associated with a given win-
dow of time. This explicit consideration of time allows one to
directly investigate how this time window impacts inferences
about the network (Yeung et al. 2011). Nearly, all extant net-
work data are time aggregated.
Using time-ordered networks to generate time-aggregated
networks lets us study topological dynamics by redefining net-
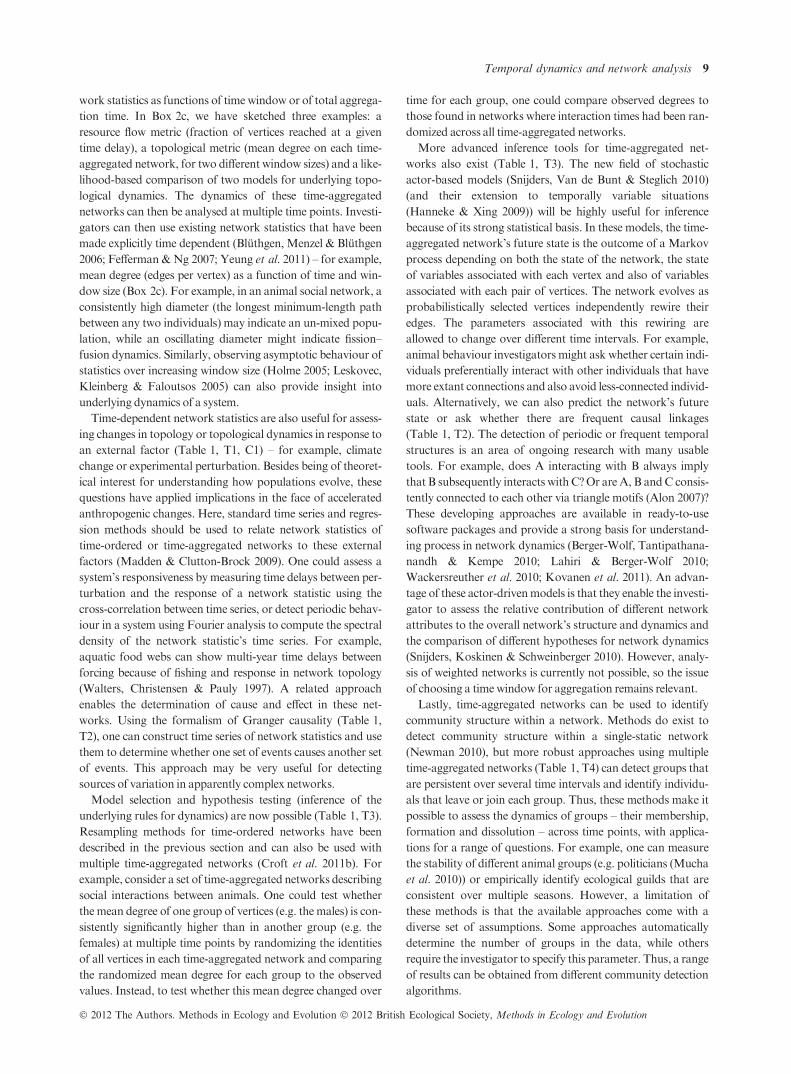
Box 3. An example analysis using time-ordered (a–c) and time-aggregated (d–f) networks. Many common questions can be quickly answered
using network dynamics approaches. Here, we use data from a study of interactions between individually marked Temnothorax rugatulus ants
(Blonder & Dornhaus 2011). The code for these analyses uses the timeordered R package which is available from http://cran.r-project.org/web/
packages/timeordered/index.html.
a. The interactions between ants can be visualized as a time-ordered network. Shortest-length paths for resource flow can be easily
calculated; one such path between two individuals is shown in red.
b. Resource flows can be traced. Here, resources are simulated as being transferred during every interaction. The hypothesis that
resources originating from the ant queen spread significantly faster than those from worker ants is falsified (P = 0Æ23) by compar-
ing the distributions of the ‘fraction of workers reached’ at Dt = 1000 s.
c. The effect of time-ordered network structure on network statistics can be quantified. For example, the importance of the ordering
of events to time delays for resource flows can be measured by calculating the observed network-mean vector clock latency at
t = 1440 s and comparing it to the distribution of latencies for a network where the ordering of interactions has been resampled.
Here, the observed network has significantly greater latencies (P = 0 for 1000 randomizations) than the networks with random
ordering of interactions, indicating that network structure retards the flow of resources.
d. The time-ordered network can be collapsed to several time-aggregated networks; here, nine networks with the same size of time
window are shown.
e. Network statistics can be computed for different sets of time-aggregated networks. Here, the degree distribution is shown for the
nine networks shown above (left), four networks with larger time windows (centre) and one network whose time window spans the
observation period (right). The observed properties of the degree distribution are highly sensitive to the time interval and window
size, potentially changing inferences.
f. Time-series analyses of time-aggregated network statistics can be used for hypothesis testing or pattern identification. Here, colony
activity level is hypothesized to drive network closeness centrality. The cross-correlation between these time series is highest
(q = 0Æ91) at zero time-lag, indicating a potentially strong and immediate causal relationship between activity level and closeness
centrality.
Individual
Tim
e
0 200 400 600 800 1000
0·0
0·2
0·4
0·6
0·8
1·0
Time delta
Frac
tion
of in
divi
dual
s re
ache
d
WorkersQueen
Latency
Pro
babi
lity
100 120 140 160 180 200
0·00
0·02
0·04
0·06
0·08 Resampled
Observed
0 – 160 160 – 320 320 – 480
480 – 640 640 – 800 800 – 960
960 – 1120 1120 – 1280 1280 – 1440
0 – 160
160 – 320
320 – 480
480 – 640
640 – 800
800 – 960
960 – 1120
1120 – 1280
1280 – 1440
0 – 360
360 – 720
720 – 1080
1080 – 1440
0 – 1440
Degree
Pro
babi
lity
0160
160320
320480
480640
640800
800960
9601120
11201280
12801440
Time interval
Act
ivity
leve
lC
lose
ness
cen
tralit
y
(a) (b) (c)
(d) (e) (f)
8 B. Blonder et al.
� 2012 The Authors. Methods in Ecology and Evolution � 2012 British Ecological Society, Methods in Ecology and Evolution
work statistics as functions of time window or of total aggrega-
tion time. In Box 2c, we have sketched three examples: a
resource flow metric (fraction of vertices reached at a given
time delay), a topological metric (mean degree on each time-
aggregated network, for two different window sizes) and a like-
lihood-based comparison of two models for underlying topo-
logical dynamics. The dynamics of these time-aggregated
networks can then be analysed at multiple time points. Investi-
gators can then use existing network statistics that have been
made explicitly time dependent (Bluthgen, Menzel & Bluthgen
2006; Fefferman &Ng 2007; Yeung et al. 2011) – for example,
mean degree (edges per vertex) as a function of time and win-
dow size (Box 2c). For example, in an animal social network, a
consistently high diameter (the longest minimum-length path
between any two individuals) may indicate an un-mixed popu-
lation, while an oscillating diameter might indicate fission–
fusion dynamics. Similarly, observing asymptotic behaviour of
statistics over increasing window size (Holme 2005; Leskovec,
Kleinberg & Faloutsos 2005) can also provide insight into
underlying dynamics of a system.
Time-dependent network statistics are also useful for assess-
ing changes in topology or topological dynamics in response to
an external factor (Table 1, T1, C1) – for example, climate
change or experimental perturbation. Besides being of theoret-
ical interest for understanding how populations evolve, these
questions have applied implications in the face of accelerated
anthropogenic changes. Here, standard time series and regres-
sion methods should be used to relate network statistics of
time-ordered or time-aggregated networks to these external
factors (Madden & Clutton-Brock 2009). One could assess a
system’s responsiveness bymeasuring time delays between per-
turbation and the response of a network statistic using the
cross-correlation between time series, or detect periodic behav-
iour in a system using Fourier analysis to compute the spectral
density of the network statistic’s time series. For example,
aquatic food webs can show multi-year time delays between
forcing because of fishing and response in network topology
(Walters, Christensen & Pauly 1997). A related approach
enables the determination of cause and effect in these net-
works. Using the formalism of Granger causality (Table 1,
T2), one can construct time series of network statistics and use
them to determine whether one set of events causes another set
of events. This approach may be very useful for detecting
sources of variation in apparently complex networks.
Model selection and hypothesis testing (inference of the
underlying rules for dynamics) are now possible (Table 1, T3).
Resampling methods for time-ordered networks have been
described in the previous section and can also be used with
multiple time-aggregated networks (Croft et al. 2011b). For
example, consider a set of time-aggregated networks describing
social interactions between animals. One could test whether
themean degree of one group of vertices (e.g. themales) is con-
sistently significantly higher than in another group (e.g. the
females) at multiple time points by randomizing the identities
of all vertices in each time-aggregated network and comparing
the randomized mean degree for each group to the observed
values. Instead, to test whether this mean degree changed over
time for each group, one could compare observed degrees to
those found in networks where interaction times had been ran-
domized across all time-aggregated networks.
More advanced inference tools for time-aggregated net-
works also exist (Table 1, T3). The new field of stochastic
actor-based models (Snijders, Van de Bunt & Steglich 2010)
(and their extension to temporally variable situations
(Hanneke & Xing 2009)) will be highly useful for inference
because of its strong statistical basis. In these models, the time-
aggregated network’s future state is the outcome of a Markov
process depending on both the state of the network, the state
of variables associated with each vertex and also of variables
associated with each pair of vertices. The network evolves as
probabilistically selected vertices independently rewire their
edges. The parameters associated with this rewiring are
allowed to change over different time intervals. For example,
animal behaviour investigators might ask whether certain indi-
viduals preferentially interact with other individuals that have
more extant connections and also avoid less-connected individ-
uals. Alternatively, we can also predict the network’s future
state or ask whether there are frequent causal linkages
(Table 1, T2). The detection of periodic or frequent temporal
structures is an area of ongoing research with many usable
tools. For example, does A interacting with B always imply
that B subsequently interacts withC?Or are A, B andC consis-
tently connected to each other via triangle motifs (Alon 2007)?
These developing approaches are available in ready-to-use
software packages and provide a strong basis for understand-
ing process in network dynamics (Berger-Wolf, Tantipathana-
nandh & Kempe 2010; Lahiri & Berger-Wolf 2010;
Wackersreuther et al. 2010; Kovanen et al. 2011). An advan-
tage of these actor-drivenmodels is that they enable the investi-
gator to assess the relative contribution of different network
attributes to the overall network’s structure and dynamics and
the comparison of different hypotheses for network dynamics
(Snijders, Koskinen & Schweinberger 2010). However, analy-
sis of weighted networks is currently not possible, so the issue
of choosing a timewindow for aggregation remains relevant.
Lastly, time-aggregated networks can be used to identify
community structure within a network. Methods do exist to
detect community structure within a single-static network
(Newman 2010), but more robust approaches using multiple
time-aggregated networks (Table 1, T4) can detect groups that
are persistent over several time intervals and identify individu-
als that leave or join each group. Thus, these methods make it
possible to assess the dynamics of groups – their membership,
formation and dissolution – across time points, with applica-
tions for a range of questions. For example, one can measure
the stability of different animal groups (e.g. politicians (Mucha
et al. 2010)) or empirically identify ecological guilds that are
consistent over multiple seasons. However, a limitation of
these methods is that the available approaches come with a
diverse set of assumptions. Some approaches automatically
determine the number of groups in the data, while others
require the investigator to specify this parameter. Thus, a range
of results can be obtained from different community detection
algorithms.
Temporal dynamics and network analysis 9
� 2012 The Authors. Methods in Ecology and Evolution � 2012 British Ecological Society, Methods in Ecology and Evolution
CONSIDERATIONS FOR BOTH KINDS OF NETWORKS
A strength of time-ordered and time-aggregated networks is
that the temporal dependence of network-based inference is
made explicit. For time-aggregated networks, different conclu-
sions will necessarily be reached depending on the particular
time window over which interactions are aggregated and the
size of that window (compare Box 1a). Thus, determining the
appropriatewindowused to define a network is critical. Choos-
ing the correct window size can be done bymeasuring lag times
between association events (lagged association rates)
(Whitehead 1997, 2009; Clauset & Eagle 2007). Alternatively,
window size can be chosen by determining when time series of
network statistics constructed from different temporal subsets
of the data become stationary(Sulo, Tanya & Robert 2011). A
final approach is to use prior knowledge about natural time-
scales in the system (Lahiri et al. 2008; Cattuto et al. 2010): for
example, for a pollinator network, 1 year may be a natural
window size if the network re-forms annually, but 1 day may
be a betterwindow size if seasonal changes in interactions occur
(Baldock et al. 2010). If the investigator believes the network is
at a dynamic steady state, it could be appropriate to use a very
longwindow size andweighted edges corresponding to interac-
tion probabilities. This could be necessary, for example, in
animal societies where all individuals can interact with all other
individuals but some interactions are always more likely
(Blonder & Dornhaus 2011). Unfortunately there is currently
no consensus on the bestmethod for choosing awindow size.
Time-ordered networks highlight the need to assess the
importance of investigator sampling rate to observed network
properties (Bluthgen 2010) (compare to Box 1b). Networks
can be very sensitive to missing data (Fletcher et al. 2011), and
there are currently nowidely agreed-uponmethods for correct-
ing sampling issues (Stumpf, Wiuf &May 2005; Kim & Jeong
2007) although some approaches work better than others
(Kurant, Markopoulou & Thiran 2011; Maiya & Berger-Wolf
2011). Many studies have shown that common topological
and flow statistics may have both high variance and bias when
networks are not completely sampled (Kossinets 2006; de Silva
et al. 2006). This problem may also arise when sampled edge
weights do not converge to a central value – that is, when the
underlying process generating these networks changes in time.
While it is not possible to avoid this problem, time-ordered
networks make it possible to detect insufficient sampling via
rarefaction procedures. Consider a statistic of interest, com-
puted from a time-ordered network. Rarefy the network by
randomly removing individual edges. If the statistic of interest
does not converge to a fixed value, the number of randomly
removed edges decreases (i.e. the amount of rarefaction
reaches zero), then one should be wary of analysing the data
as-is and instead increase the sampling rate (Clauset & Eagle
2007). For example, in a study of resource flow between
animals, a time-aggregated network diameter that does not
converge under rarefaction indicates that edges that could
dramatically change network connectivity are being under-
sampled. One approximate rule based on the Shannon–
Nyquist sampling theorem (Shannon 1949) is to ensure
sampling rates are at least twice that of the fastest dynamics of
interest. More recent work on graph entropy rates (a metric of
the difference from random of the information in a graph) pro-
vides a formal approach to determine the minimum sampling
rate required to ensure that the information lost does not
exceed an investigator-specified bound (Haddadi et al. 2011).
Applications and opportunities for networkdynamics
Network dynamics are relevant to a range of research ques-
tions in ecology and evolutionary biology.We have reviewed a
shared set of conceptual issues, common problems and meth-
odological solutions centred on network dynamics, and have
proposed an observational data-driven framework based on
time-ordered networks. The power of this framework lies in its
ability (i) to transform observed or simulated interaction data
into mathematical structures that describe dynamics at multi-
ple time-scales, (ii) to highlight the temporal issues that are rel-
evant to these questions, and (iii) to open a large number of
research questions to a unified set of descriptive and inferential
statistics. Note that this framework does not propose explicit
mathematical models for processes generating network
dynamics (e.g. as used in epidemiology (Bansal et al. 2010;
Pinar, Seshadhri & Kolda 2011; Seshadhri, Pinar & Kolda
2011)) – rather, it provides a common mathematical and
statistical language for networks based on real data that can
then be studied in the context of thesemodels.
Several research areas show high potential for the applica-
tion of this framework, which we have surveyed in Table 1.
For example, the structure of transport networks found in
many organisms (Heaton et al. 2010; Katifori, Szoll}osi &
Magnasco 2010; Tero et al. 2010) is rarely examined with
methods from network dynamics. A time-ordered network
perspective would be useful for assessing processes of network
growth and development and for comparing properties of net-
works across organisms. Secondly, time-ordered networks
could be used to understand species coexistence by providing a
framework for testing hypotheses about changes in connectiv-
ity over time and for predicting future interactions between
species. Although a network dynamics perspective has been
used in studying spatial effects related to landscape fragmenta-
tion andmetapopulations (Urban&Keitt 2001; Dale &Fortin
2010), many research opportunities remain. For example,
community assembly could be studied using time-ordered net-
works constructed from paleo-records of temporally resolved
species interactions and co-occurrence. Third, understanding
how to directly control network dynamics will also have many
practical implications (Table 1, C5). The control theory of net-
work dynamics provides principles to obtain and maintain a
desired future network state through targeted manipulations
of current network state and the connectivity of focal individu-
als. For example, what management decisions should be taken
to ensure the temporal persistence of multiple prey species for
an endangered predator? Are there mathematically necessary
tradeoffs between the robustness and performance of manage-
ment strategies? Control theory of time-ordered networks is a
10 B. Blonder et al.
� 2012 The Authors. Methods in Ecology and Evolution � 2012 British Ecological Society, Methods in Ecology and Evolution

new area of research (Zecevic & Siljak 2010; Abdallah 2011;
Liu, Slotine & Barabasi 2011) that is only beginning to be
applied to biology. Significant progress could be made using
these network approaches for the conservation of diversity and
the preservation of ecosystem functioning (Bascompte & Jord-
ano 2007; Sahasrabudhe & Motter 2011), and for better con-
trolling diseases (Salathe & Jones 2010). Time-ordered
networks can provide a natural framework for tracing changes
in network state and for identifying vertices and temporal pat-
terns that may be relevant for controlling the system.
Lastly, many apparently complex systemsmay be more par-
simoniously described and thus understood using time-ordered
networks. In many networks, flow dynamics and topological
dynamics occur on similar time-scales. In these systems, the
topology of the network influences flow on the network, and
vice-versa, leading to strong couplings between processes and
patterns at different scales. These networks exhibit many inter-
esting properties including phase transitions between states,
symmetry breaking where similar vertices spontaneously
diverge into topologically distinct populations with different
functions and identities, sudden synchronization of behaviour
or topology for multiple vertices, nonlinear shifts in waiting
times and flow processes and strong interactions between sim-
ple local dynamics and global whole-network dynamics (Gross
& Blasius 2008; Funk, Salathe & Jansen 2010). The ubiquity of
these phenomena suggests that many temporally variable sys-
tems could be understood in terms of the couplings between
the topology and flow of their underlying networks. While the
time-ordered network framework does not directly propose
differentmodels that could explain these couplings, it does pro-
vide a natural framework for describing these couplings and
for then comparing the validity of different generative models
(e.g. with stochastic actor-based models that couple processes
of flow and topological dynamics (Snijders, Van de Bunt &
Steglich 2010)). Thus, many biological phenomena – for exam-
ple, multiple stable animal community states, complex patterns
of disease spread or surprising population dynamics of multi-
ple species – may only be understood if we can develop models
that can link local and global-scale network dynamics at a
range of time-scales.
Challenges for the future
Despite the current popularity of network analysis, dynamic
approaches remain rare in ecology and evolutionary biology.
Fortunately, it is now becoming possible for biologists to take
advantage of many recent conceptual and methodological
advances (Table 1). However, several challenges still remain
before dynamic analyses become more accessible. Some rele-
vant questions cannot be addressed with current methods. For
example, the general prediction of future network structure
with or without perturbation is now only possible under the
limiting assumption that the network is in some dynamic
steady state (Snijders, Van de Bunt & Steglich 2010). Many
applied studies of metapopulations or multi-species interac-
tions where perturbations are of interest would be improved
by an advance in this area. Similarly, understanding couplings
between multiple time-scales in a network remains difficult.
For instance, how do rapidly occurring small-scale processes
feed into global-scale processes and patterns, and vice versa?
How do events at one time impact events at a later time? Being
able to scale up limited observations to make inferences about
entire networks over time would be tremendously useful when
data collection is expensive or impractical.
The analysis of network dynamics – time-ordered and other-
wise – still suffers from a limited set of inferential statistical
tools. Although it is clear that accounting for time-ordering
and for temporal dynamics is critical formany issues in ecology
and evolution, only the few methods we have described cur-
rently exist to compare models, carry out hypothesis testing or
detect within- and between-group variation. There is not yet a
general analytical statistical framework for the analysis of
time-ordered networks describing coupled processes. We also
call for the development of even more resources to teach and
implement the methods described. Although several free soft-
ware packages exist (Table 1), there is still a gap between tools
usable by investigators new to network analysis and theoretical
advances made in the field. Fortunately, recent books (Croft,
James & Krause 2008; Newman 2010) and reviews (Gross &
Blasius 2008; Snijders, Van de Bunt & Steglich 2010) are mak-
ing these mathematics more accessible. The interested reader
should also be aware of recent perspectives from the physics
(Holme & Saramaki 2011), computer science (Santoro et al.
2011) and engineering communities (Kuhn&Oshman 2011).
Time-ordered network analysis is only possible when suffi-
cient temporally resolved data are available. Generating
complete and accurate records of interactions at multiple
time points can be very difficult, but should become a prior-
ity. For example, food webs rarely contain more than a few
hundred species, and even more rarely assess their empirical
change over seasons and years (Jarre-Teichmann & Pauly
1993). Community networks involving a much smaller subset
of easily observed species (e.g. plant–pollinator interactions),
however, can include relatively dense data on time-ordered
networks (Bascompte & Jordano 2007). Similarly, good data
are available for animals social networks that are visually
observed semi-continuously (e.g. primates in a research cen-
tre (Flack et al. 2006), ant colonies in the lab (Blonder &
Dornhaus 2011)) or lizards remotely tracked semi-continu-
ously in the field (Godfrey et al. 2012). However, the situa-
tion is more difficult in animal groups analyses where
individuals are rarely observed (e.g., dolphins or meerkats in
the wild (Lusseau et al. 2003; Drewe, Madden & Pearce
2009) or pollinators on plants (Bascompte & Jordano 2007)).
In these cases, network analyses are often based on one or a
few time-aggregated networks. However, time-ordered net-
work analyses could be highly insightful in systems where
data coverage does not yet exist. While methods are avail-
able to correct for sampling and observation issues in time-
aggregated networks (Lusseau, Whitehead & Gero 2008), we
are aware of no tools for time-ordered networks. It is also
unclear how much missing data is acceptable in time-ordered
network analysis. Thus, an open challenge is to develop bet-
ter tools for missing data and also to obtain support for
Temporal dynamics and network analysis 11
� 2012 The Authors. Methods in Ecology and Evolution � 2012 British Ecological Society, Methods in Ecology and Evolution
long-term and high-coverage studies of the dynamics of a
range of systems. Advances in electronic sensors and video-
tracking may provide a way forward (Cattuto et al. 2010; Pin-
ter-Wollman et al. 2011; Jeanson 2012). Only with such data
will we realize the full potential of network dynamics to answer
a range of fundamental and applied questions. Comparative
studies of networks across time-scales and systems may reveal
general principles in the organization of biological networks
and would permit robust comparisons with theoretically opti-
mal networks and human-engineered networks.
In sum, the broader consideration and application of net-
work dynamics has great potential to push forward our
understanding of biological interactions. Temporal dynamics
are found in all natural systems and underlie many broad
scientific questions. By extending theory and data to account
for temporal dynamics, we can couple a powerful time-
ordered network framework to a much wider range of sys-
tems and questions.
Acknowledgements
Weare grateful toMarkMcPeek, VolkerGrimm, ElizabethHobson, theDorn-
haus and Enquist laboratories and several anonymous reviewers for comments
on earlier versions of this manuscript. BBwas supported by aNSFPre-doctoral
Fellowship. TWW was supported by NSF Postdoctoral Research Fellowship
in Biology DBI-1003282. AD was supported by NSF grants IOS 0841756 and
IOS 0921280. ASwas supported byNSF grant IOS 0952132.
References
Abdallah, C. (2011) Mathematical controllability of genomic networks. Pro-
ceedings of the National Academy of Sciences of the United States of America,
108, 17243–17244.
Alarcon, R., Waser, N.M. & Ollerton, J. (2008) Year-to-year variation in the
topology of a plant-pollinator interaction network.Oikos, 117, 1796–1807.
Albert, R. & Barabasi, A.-L. (2002) Statistical mechanics of complex networks.
Reviews ofModern Physics, 74, 47–97.
Albert, R., Jeong, H. & Barabasi, A. (2000) Error and attack tolerance of com-
plex networks.Nature, 406, 378–382.
Alon, U. (2007) Network motifs: theory and experimental approaches. Nature
Reviews Genetics, 8, 450–461.
Baldock, K.C.R., Memmott, J., Ruiz-Guajardo, J.C., Roze, D. & Stone, G.N.
(2010) Daily temporal structure in African savanna flower visitation net-
works and consequences for network sampling.Ecology, 92, 687–698.
Bansal, S., Read, J., Pourbohloul, B. & Meyers, L.A. (2010) The dynamic nat-
ure of contact networks in infectious disease epidemiology. Journal of Biolog-
ical Dynamics, 4, 478–489.
Barabasi, A. (2005) The origin of bursts and heavy tails in human dynamics.
Nature, 435, 207–211.
Bascompte, J. (2010) Structure and dynamics of ecological networks. Science,
329, 765–766.
Bascompte, J. & Jordano, P. (2007) Plant-animal mutualistic networks: the
architecture of biodiversity.Annual Review of Ecology Evolution and System-
atics, 38, 567–593.
Berger-Wolf, T. & Saia, J. (2006) A framework for analysis of dynamic social
networks.Proceedings of the 12th ACMSIGKDD international conference on
Knowledge discovery and data mining, pp. 523–528. ACM Publishing, New
York,NY,USA. doi: 10.1145/1150402.1150462
Berger-Wolf, T.Y., Tantipathananandh, C. & Kempe, D. (2010) Community
identification in dynamic social networks. LinkMining: Models, Algorithms,
and Applications (eds P.S. Yu, C. Faloutsos & J. Han), pp. 307–336.
Springer, NewYork, NY,USA.
Blonder, B. & Dornhaus, A. (2011) Time-ordered networks reveal limitations
to information flow in ant colonies.PLoSONE, 6, e20298.
Blumstein, D.T., Wey, T.W. & Tang, K. (2009) A test of the social cohesion
hypothesis: interactive female marmots remain at home. Proceedings of the
Royal Society of London. Series B, 276, 3007–3012.
Bluthgen, N. (2010) Why network analysis is often disconnected from commu-
nity ecology. A critique and an ecologist’s guide. Basic and Applied Ecology,
11, 185–195.
Bluthgen, N., Menzel, F. & Bluthgen, N. (2006) Measuring specialization in
species interaction networks.BMCEcology 2006, 6: 9.
Bode, N.W.F.,Wood, A.J. & Franks, D.W. (2011) Social networks andmodels
for collective motion in animals. Behavioral Ecology and Sociobiology, 65,
117–130.
Borgatti, S.P. (2005) Centrality and network flow. Social Networks, 27, 55–
71.
Bryden, J., Funk, S., Geard, N., Bullock, S. & Jansen, V.A.A. (2011) Stability
in flux: community structure in dynamic networks. Journal of The Royal
Society Interface, 8, 1031–1040.
Carley, K.M. (2003) Dynamic Network Analysis. Dynamic Social Network
Modeling and Analysis: Workshop Summary and Papers (eds R. Breiger,
K.M. Carley & P. Pattison), pp. 133–145. National Academies Press,
Washington,DC, USA.
Cattuto, C., Broeck, W.V.d., Barrat, A., Colizza, V., Pinton, J.-F. & Vespig-
nani, A. (2010) Dynamics of person-to-person interactions from distributed
RFID sensor networks.PLoSONE, 5, e11596.
Centola, D. (2010) The spread of behavior in an online social network experi-
ment. Science, 329, 1194–1197.
Centola, D. (2011) An experimental study of homophily in the adoption of
health behavior. Science, 334, 1269–1272.
Chan, J., Holmes, A. & Rabadan, R. (2010) Network analysis of global influ-
enza spread.PLoSComputational Biology, 6, e1001005.
Clauset, A. & Eagle, N. (2007) Persistence and periodicity in a dynamic
proximity network. DIMACS Workshop on Computational Methods for
Dynamic Interaction Networks.
Coll, M., Lotze, H. & Romanuk, T. (2008) Structural degradation in Mediter-
ranean Sea food webs: testing ecological hypotheses using stochastic and
mass-balancemodelling.Ecosystems, 11, 939–960.
Couzin, I. (2009) Collective cognition in animal groups.Trends in Cognitive Sci-
ences, 13, 36–43.
Croft, D., James, R. & Krause, J. (2008) Exploring Animal Social Networks.
PrincetonUniversity Press, Princeton, NJ, USA.
Croft, D., Edenbrow, M., Darden, S., Ramnarine, I., van Oosterhout, C. &
Cable, J. (2011a) Effect of gyrodactylid ectoparasites on host behaviour and
social network structure in guppies Poecilia reticulata. Behavioral Ecology
and Sociobiology, 65, 2219–2227.
Croft, D.P., Madden, J.R., Franks, D.W. & James, R. (2011b) Hypothesis test-
ing in animal social networks.Trends in Ecology & Evolution, 26, 502–507.
Dale, M. & Fortin, M. (2010) From graphs to spatial graphs. Annual Review of
Ecology Evolution and Systematics, 41, 21–38.
Diestel, R. (2010)Graph Theory. Springer-Verlag, Heidelberg, Germany.
Drewe, J., Madden, J. & Pearce, G. (2009) The social network structure of a
wild meerkat population: 1. Inter-group interactions. Behavioral Ecology
and Sociobiology, 63, 1295–1306.
Dunlavy, D.M., Kolda, T.G. & Acar, E. (2011) Temporal link prediction using
matrix and tensor factorizations. ACM Transactions on Knowledge Discov-
ery fromData, 5, 1–27.
Dunne, J. &Williams,R. (2009) Cascading extinctions and community collapse
in model food webs. Philosophical Transactions of the Royal Society of
London. Series B, Biological sciences, 364, 1711–1723.
Dunne, J.A., Williams, R.J. & Martinez, N.D. (2002) Food-web structure and
network theory: the role of connectance and size. Proceedings of the National
Academy of Sciences of the United States of America, 99, 12917–12922.
Eppstein, M.J. & Molofsky, J. (2007) Invasiveness in plant communities with
feedbacks.Ecology Letters, 10, 253–263.
Fefferman, N. & Ng, K. (2007) How disease models in static networks can
fail to approximate disease in dynamic networks. Physical Review E, 76,
031919.
Fehl, K., van der Post, D.J. & Semmann, D. (2011) Co-evolution of behaviour
and social network structure promotes human cooperation. Ecology Letters,
14, 546–551.
Flack, J.C., Girvan, M., De Waal, F.B.M. & Krakauer, D.C. (2006) Polic-
ing stabilizes construction of social niches in primates. Nature, 439, 426–
429.
Fletcher, R., Acevedo, M., Reichert, B., Pias, K. & Kitchens, W. (2011) Social
network models predict movement and connectivity in ecological land-
scapes. Proceedings of the National Academy of Sciences of the United States
of America, 108, 19282–19287.
Franks, D., James, R., Noble, J. & Ruxton, G. (2009) A foundation for devel-
oping a methodology for social network sampling. Behavioral Ecology and
Sociobiology, 63, 1079–1088.
12 B. Blonder et al.
� 2012 The Authors. Methods in Ecology and Evolution � 2012 British Ecological Society, Methods in Ecology and Evolution

Frantz, T.L. & Carley, K.M. (2009) Agent-based modeling within a dynamic
network.Chaos and complexity in psychology: The theory of nonlinear dynam-
ical systems (eds S.J. Guastello, M. Koopmans & D. Pincus), pp. 475–505.
CambridgeUniversity Press, NewYork,NY,USA.
Franz, M. & Nunn, C.L. (2009) Network-based diffusion analysis: a new
method for detecting social learning.Proceedings of the Royal Society B: Bio-
logical Sciences, 276, 1829–1836.
Funk, S., Salathe, M. & Jansen, V.A.A. (2010) Modelling the influence of
human behaviour on the spread of infectious diseases: a review. Journal of
The Royal Society Interface, 7, 1247–1256.
Funk, S., Gilad, E., Watkins, C. & Jansen, V.A.A. (2009) The spread of
awareness and its impact on epidemic outbreaks. Proceedings of the
National Academy of Sciences of the United States of America, 106, 6872–
6877.
Godfrey, S.S., Bradley, J.K., Sih, A. & Bull, C.M. (2012) Lovers and fighters in
sleepy lizard land: where do aggressive males fit in a social network? Animal
Behaviour, 83, 209–215.
Gross, T. & Blasius, B. (2008) Adaptive coevolutionary networks: a review.
Journal of the Royal Society, Interface, 5, 259–271.
Gross, T., D’Lima, C.J.D. & Blasius, B. (2006) Epidemic dynamics on an adap-
tive network.Physical Review Letters, 96, 208701.
Haddadi, H., King, A., Wills, A., Fay, D., Lowe, J., Morton, A., Hailes, S. &
Wilson, A. (2011) Determining association networks in social animals:
choosing spatial–temporal criteria and sampling rates. Behavioral Ecology
and Sociobiology, 65, 1659–1668.
Hanneke, S. & Xing, E. (2009) Discrete Temporal Models of Social Networks.
arXiv, stat.ML.
Heaton, L., Lopez, E., Maini, P., Fricker, M. & Jones, N. (2010) Growth-
induced mass flows in fungal networks. Proceedings of the Royal Society of
London. Series B, 277, 3265–3274.
Henzi, S., Lusseau, D.,Weingrill, T., van Schaik, C. &Barrett, L. (2009) Cyclic-
ity in the structure of female baboon social networks. Behavioral Ecology
and Sociobiology, 63, 1015–1021.
Holme, P. (2005) Network reachability of real-world contact sequences. Physi-
cal Review E, 71, 046119.
Holme, P. & Newman, M.E.J. (2006) Nonequilibrium phase transition in the
coevolution of networks and opinions.Physical Review E, 74, 056108.
Holme, P. & Saramaki, J. (2011) Temporal networks. arXiv, 1108.1780.
Hoppitt, W., Boogert, N.J. & Laland, K.N. (2010) Detecting social transmis-
sion in networks. Journal of Theoretical Biology, 263, 544–555.
Ifti, M., Killingback, T. & Doebeli, M. (2004) Effects of neighbourhood size
and connectivity on spatial Continuous Prisoner’s Dilemma. Journal of The-
oretical Biology, 231, 97–106.
Ings, T.C., Montoya, J.M., Bascompte, J., Bluethgen, N., Brown, L.,
Dormann, C.F., Edwards, F., Figueroa, D., Jacob, U., Jones, J.I.,
Lauridsen, R.B., Ledger,M.E., Lewis, H.M., Olesen, J.M., van Veen, F.J.F.,
Warren, P.H. & Woodward, G. (2009) Ecological networks - beyond food
webs. Journal of Animal Ecology, 78, 253–269.
James, R., Croft, D.P. & Krause, J. (2009) Potential banana skins in animal
social network analysis. Behavioral Ecology and Sociobiology, 63, 989–
997.
Jarre-Teichmann, A. & Pauly, D. (1993) Seasonal changes in the Peruvian
upwelling ecosystem. Trophic models of aquatic ecosystems. ICLARM Conf.
Proc. 26, 390 (eds V. Christensen & D. Pauly), pp. 307–314. ICLARM,
Makati,MetroManila, Philippines.
Jeanson, R. (2012) Long-term dynamics in proximity networks in ants. Animal
Behaviour, 83, 915–923.
Karsai, M., Kivela, M., Pan, R.K., Kaski, K., Kertesz, J., Barabasi, A.-L. &
Saramaki, J. (2010) Small but slow world: how network topology and bursti-
ness slow down spreading.Physical Review E, 83, 025102(R).
Katifori, E., Szoll}osi, G.J. &Magnasco, M.O. (2010) Damage and fluctuations
induce loops in optimal transport networks. Physical Review Letters, 104,
048704.
Kauffman, S. & Johnsen, S. (1991) Coevolution to the edge of chaos: coupled
fitness landscapes, poised states, and coevolutionary avalanches. Journal of
Theoretical Biology, 149, 467–505.
Kauffman, S., Peterson, C., Samuelsson, B. & Troein, C. (2003) Random Bool-
ean network models and the yeast transcriptional network. Proceedings of
the National Academy of Sciences of the United States of America, 100,
14796–14799.
Kempe,D., Kleinberg, J. &Kumar, A. (2002) Connectivity and inference prob-
lems for temporal networks. Journal of Computer and System Sciences, 64,
820–842.
Kempe, D., Kleinberg, J. & Tardos, E. (2003) Maximizing the spread of influ-
ence through a social network.Proceedings of the ninth ACMSIGKDD inter-
national conference on Knowledge discovery and data mining, pp. 137–146.
ACM,NewYork, NY,USA.
Kendal, R., Custance, D., Kendal, J., Vale, G., Stoinski, T., Rakotomalala, N.
& Rasamimanana, H. (2010) Evidence for social learning in wild lemurs
(Lemur catta).Learning & Behavior, 38, 220–234.
Kerth, G., Perony, N. & Schweitzer, F. (2011) Bats are able to maintain long-
term social relationships despite the high fission–fusion dynamics of their
groups.Proceedings of theRoyal Society ofLondon. SeriesB, 278, 2761–2767.
Kim, P. & Jeong, H. (2007) Reliability of rank order in sampled networks.
European Physical Journal B: Condensed Matter and Complex Systems, 55,
109–114.
Kossinets, G. (2006) Effects of missing data in social networks. Social Net-
works, 28, 247–268.
Kossinets, G., Kleinberg, J. & Watts, D. (2008) The structure of information
pathways in a social communication network. Proceeding of the 14th ACM
SIGKDD international conference on Knowledge discovery and data mining,
pp. 435–443. ACM,NewYork, NY,USA.
Kostakos, V. (2009) Temporal graphs. Physica A: Statistical Mechanics and its
Applications, 388, 1007–1023.
Kovanen, L., Karsai, M., Kaski, K., Kertesz, J. & Saramaki, J. (2011) Tempo-
ralmotifs in time-dependent networks. Journal of StatisticalMechanics: The-
ory and Experiment, vol. P11005.
Kuhn, F. & Oshman, R. (2011) Dynamic networks: models and algorithms.
SIGACTNews, 42, 82–96.
Kurant, M., Markopoulou, A. & Thiran, P. (2011) Towards Unbiased BFS
Sampling. arXiv, cs, 1102.4599.
Lahiri, M. & Berger-Wolf, T. (2007) Structure prediction in temporal networks
using frequent subgraphs. IEEE Symposium on Computational Intelligence
and DataMining, pp. 35–42.
Lahiri, M. & Berger-Wolf, T. (2010) Periodic subgraph mining in dynamic net-
works.Knowledge and Information Systems, 24, 467–497.
Lahiri, M., Arun, S., Habiba, R. & Wolf, T. (2008) The impact of structural
changes on predictions of diffusion in networks. IEEE International Confer-
ence onDataMiningWorkshops.
Leskovec, J., Kleinberg, J. & Faloutsos, C. (2005) Graphs over time: densifica-
tion laws, shrinking diameters and possible explanations. Proceedings of the
eleventh ACM SIGKDD international conference on Knowledge discovery in
datamining, pp. 177–187. ACM,NewYork, NY,USA.
Liben-Nowell, D. & Kleinberg, J. (2003) The link prediction problem for social
networks. Proceedings of the twelfth international conference on Information
and knowledgemanagement pp. 556–559. ACM,NewYork, NY,USA.
Lieberman, E., Hauert, C. & Nowak, M. (2005) Evolutionary dynamics on
graphs.Nature, 433, 312–316.
Liu, Y.-Y., Slotine, J.-J. & Barabasi, A.-L. (2011) Controllability of complex
networks.Nature, 473, 167–173.
Lu, L. & Zhou, T. (2011) Link prediction in complex networks: a survey.Physi-
ca A: StatisticalMechanics and its Applications, 390, 1150–1170.
Luscombe, N.M., Babu, M.M., Yu, H., Snyder, M., Teichmann, S.A. & Ger-
stein, M. (2004) Genomic analysis of regulatory network dynamics reveals
large topological changes.Nature, 431, 308–312.
Lusseau, D., Whitehead, H. & Gero, S. (2008) Incorporating uncertainty into
the study of animal social networks.Animal Behaviour, 75, 1809–1815.
Lusseau, D., Schneider, K., Boisseau, O.J., Haase, P., Slooten, E. & Dawson,
S.M. (2003) The bottlenose dolphin community of Doubtful Sound features
a large proportion of long-lasting associations. Behavioral Ecology and
Sociobiology, 54, 396–405.
Madden, J.R. & Clutton-Brock, T.H. (2009) Manipulating grooming by
decreasing ectoparasite load causes unpredicted changes in antagonism.Pro-
ceedings of the Royal Society B: Biological Sciences, 276, 1263–1268.
Maiya, A.S. &Berger-Wolf, T.Y. (2011) Benefits of bias: towards better charac-
terization of network sampling. Proceedings of the 17th ACM SIGKDD
international conference on Knowledge discovery and data mining, pp. 105–
113. ACM, SanDiego, CA, USA.
May, R. (2006) Network structure and the biology of populations. Trends in
Ecology & Evolution, 21, 394–399.
Moody, J. (2002) The Importance of Relationship Timing for Diffusion. Social
Forces, 81, 25–56.
Mucha, P.J., Richardson, T., Macon, K., Porter, M.A. & Onnela, J.-P. (2010)
Community structure in time-dependent, multiscale, and multiplex net-
works. Science, 328, 876–878.
Naug, D. (2008) Structure of the social network and its influence on transmis-
sion dynamics in a honeybee colony. Behavioral Ecology and Sociobiology,
62, 1719–1725.
Newman, M.E.J. (2010) Networks: an introduction. Oxford University Press,
Oxford.
Temporal dynamics and network analysis 13
� 2012 The Authors. Methods in Ecology and Evolution � 2012 British Ecological Society, Methods in Ecology and Evolution
O’Dwyer, J.P. & Green, J.L. (2010) Field theory for biogeography: a spatially
explicit model for predicting patterns of biodiversity. Ecology Letters, 13,
87–95.
Ohtsuki, H., Hauert, C., Lieberman, E. & Nowak, M. (2006) A simple rule for
the evolution of cooperation on graphs and social networks. Nature, 441,
502–505.
Olff, H., Alonso, D., Berg, M.P., Eriksson, B.K., Loreau, M., Piersma, T. &
Rooney, N. (2009) Parallel ecological networks in ecosystems. Philosophical
transactions of the Royal Society of London. Series B, Biological sciences, 364,
1755–1779.
Onnela, J.-P., Saramaki, J., Hyvonen, J., Szabo, G., Lazer, D., Kaski, K., Ker-
tesz, J. & Barabasi, A.-L. (2007) Structure and tie strengths in mobile com-
munication networks.Proceedings of the National Academy of Sciences of the
United States of America, 104, 7332–7336.
Onnela, J.-P., Arbesman, S., Barabasi, A.-L. & Christakis, N.A. (2010) Geo-
graphic constraints on social network groups.PLoSONE, 6, e16939.
Otterstatter,M.C. & Thomson, J.D. (2007) Contact networks and transmission
of an intestinal pathogen in bumble bee (Bombus impatiens) colonies.Oecolo-
gia, 154, 411–421.
Petanidou, T., Kallimanis, A.S., Tzanopoulos, J., Sgardelis, S.P. & Pantis, J.D.
(2008) Long-term observation of a pollination network: fluctuation in
species and interactions, relative invariance of network structure and
implications for estimates of specialization. Ecology Letters, 11, 564–
575.
Pinar, A., Seshadhri, C. & Kolda, T.G. (2011) The Similarity between Stochas-
tic Kronecker and Chung-LuGraphModels. arXiv, cs, 1110.4925.
Pinter-Wollman, N., Wollman, R., Guetz, A., Holmes, S. & Gordon, D.M.
(2011) The effect of individual variation on the structure and function of
interaction networks in harvester ants. Journal of The Royal Society Inter-
face, 8, 1562–1573.
Prakash, B.A., Chakrabarti, D., Faloutsos, M., Valler, N. & Faloutsos, C.
(2011) Threshold Conditions for Arbitrary Cascade Models on Arbitrary
Networks. ICDM (eds D.J. Cook, J. Pei, W. Wang, O.R. Zaıane & X. Wu),
pp. 537–546. Proceedings of the 2011 IEEE 11th International Conference
onData. IEEEComputer Society,WashingtonDC,USA.
Proulx, S., Promislow, D. & Phillips, P. (2005) Network thinking in ecology
and evolution.Trends in Ecology & Evolution, 20, 345–353.
Rand, D., Arbesman, S. & Christakis, N. (2011) Dynamic social networks
promote cooperation in experiments with humans. Proceedings of the
National Academy of Sciences of the United States of America, 108,
19193–19198.
Robins, G., Snijders, T., Wang, P., Handcock,M. & Pattison, P. (2007) Recent
developments in exponential random graph (p*) models for social networks.
Social Networks, 29, 192–215.
Romano, C.M., Guedes de Carvalho-Mello, I.M.V., Jamal, L.F., de Melo,
F.L., Iamarino, A., Motoki, M., Rebello Pinho, J.R., Holmes, E.C. & de
Andrade Zanotto, P.M. (2010) Social networks shape the transmission
dynamics of hepatitis C virus.PLoSONE, 5, e11170.
Romanuk, T., Zhou, Y., Brose, U., Berlow, E., Williams, R. & Martinez, N.
(2009) Predicting invasion success in complex ecological networks. Philo-
sophical Transactions of the Royal Society of London. Series B, Biological sci-
ences, 364, 1743–1754.
Rothenberg, R., Potterat, J., Woodhouse, D., Muth, S., Darrow, W. & Klov-
dahl, A. (1998) Social network dynamics and HIV transmission. Aids, 12,
1529–1536.
Sahasrabudhe, S. & Motter, A.E. (2011) Rescuing ecosystems from extinction
cascades through compensatory perturbations. Nature Communications, 2,
170.
Salathe, M. & Jones, J. (2010) Dynamics and control of diseases in networks
with community structure.PLoSComputational Biology, 6, e1000736.
Santoro, N., Quattrociocchi, W., Flocchini, P., Casteigts, A. & Amblard, F.
(2011) Time-varying graphs and social network analysis: temporal indicators
andmetrics. arXiv, 1102.0629v1101.
Scanlon, T., Caylor, K., Levin, S. & Rodriguez-Iturbe, I. (2007) Positive feed-
backs promote power-law clustering of Kalahari vegetation. Nature, 449,
209–212.
Sendova-Franks, A.B., Hayward, R.K., Wulf, B., Klimek, T., James, R., Plan-
que, R., Britton, N.F. & Franks, N.R. (2009) Emergency networking: famine
relief in ant colonies.Animal Behaviour, 79, 473–485.
Seshadhri, C., Pinar, A. & Kolda, T.G. (2011) An In-Depth Analysis of Sto-
chasticKroneckerGraphs. arXiv, cs, 1102.5046.
Seth,A.&Edelman,G. (2007)Distinguishing causal interactions in neural pop-
ulations.Neural Computation, 19, 910–933.
Shannon, C. (1949) Communication in the presence of noise. Proceedings of the
IRE, 37, 10–21.
Shaw, L.B. & Schwartz, I.B. (2008) Fluctuating epidemics on adaptive net-
works.Physical Review E, 77, 066101.
Sih, A., Hanser, S.F. & Mchugh, K.A. (2009) Social network theory: new
insights and issues for behavioral ecologists.Behavioral Ecology and Sociobi-
ology, 63, 975–988.
de Silva, E., Thorne, T., Ingram, P., Agrafioti, I., Swire, J., Wiuf, C. & Stumpf,
M.P.H. (2006) The effects of incomplete protein interaction data on struc-
tural and evolutionary inferences.BMCBiology, 4.
Snijders, T.A.B., Koskinen, J. & Schweinberger, M. (2010) Maximum likeli-
hood estimation for social network dynamics.Annals of Applied Statistics, 4,
567–588.
Snijders, T., Van de Bunt, G. & Steglich, C. (2010) Introduction to stochastic
actor-basedmodels for network dynamics. Social Networks, 32, 44–60.
Staniczenko, P., Lewis, O., Jones, N. & Reed-Tsochas, F. (2010) Structural
dynamics and robustness of food webs.Ecology Letters, 13, 891–899.
Stumpf, M., Wiuf, C. & May, R. (2005) Subnets of scale-free networks are
not scale-free: sampling properties of networks. Proceedings of the National
Academy of Sciences of the United States of America, 102, 4221–4224.
Sulo, R., Tanya, B.-W. & Robert, G. (2011) Temporal Scale of Processes in
Dynamic Networks. IEEE ICDM 2011 Workshop on Data Mining in Net-
works, pp. 925–932. Vancouver, Canada.
Szolnoki, A. & Perc, M. (2009) Resolving social dilemmas on evolving random
networks.Epl-Europhysics Letters, 86, 30007.
Tang, J., Musolesi, M.,Mascolo, C. & Latora, V. (2010) Characterising tempo-
ral distance and reachability in mobile and online social networks.Computer
Communication Review, 40, 118–124.
Tantipathananandh, C., Berger-Wolf, T. &Kempe, D. (2007) A framework for
community identification in dynamic social networks. Proceedings of the
13th ACM SIGKDD international conference on Knowledge discovery and
datamining, pp. 717–726. ACM,NewYork, NY,USA.
Tero, A., Takagi, S., Saigusa, T., Ito, K., Bebber, D.P., Fricker, M.D., Yumiki,
K., Kobayashi, R. & Nakagaki, T. (2010) Rules for biologically inspired
adaptive network design. Science, 327, 439–442.
Thebault, E. & Fontaine, C. (2010) Stability of ecological communities and the
architecture ofmutualistic and trophic networks.Science, 329, 853–856.
Uchida, S. & Drossel, B. (2007) Relation between complexity and stability in
food webs with adaptive behavior. Journal of Theoretical Biology, 247, 713–
722.
Urban, D. & Keitt, T. (2001) Landscape connectivity: a graph-theoretic per-
spective.Ecology, 82, 1205–1218.
Valdovinos, F.S., Ramos-Jiliberto, R., Garay-Narvaez, L., Urbani, P. & Dun-
ne, J.A. (2010) Consequences of adaptive behaviour for the structure and
dynamics of food webs.Ecology Letters, 13, 1546–1559.
Volz, E. & Meyers, L.A. (2007) Susceptible-infected-recovered epidemics in
dynamic contact networks. Proceedings of the Royal Society of London. Ser-
ies B, 274, 2925–2933.
Volz, E. & Meyers, L.A. (2009) Epidemic thresholds in dynamic contact net-
works. Journal of The Royal Society Interface, 6, 233–241.
Wackersreuther, B., Wackersreuther, P., Oswald, A., Bohm, C. & Borgwardt,
K.M. (2010) Frequent subgraph discovery in dynamic networks.Proceedings
of the Eighth Workshop on Mining and Learning with Graphs, pp. 155–162.
ACM,Washington, DC.
Walters, C., Christensen, V. & Pauly, D. (1997) Structuring dynamic models of
exploited ecosystems from trophic mass-balance assessments.Reviews in Fish
Biology and Fisheries, 7, 139–172.
Wey, T., Blumstein, D., Shen, W. & Jordan, F. (2008) Social network analysis
of animal behaviour: a promising tool for the study of sociality. Animal
Behaviour, 75, 333–344.
Whitehead, H. (1997) Analysing animal social structure. Animal Behaviour, 53,
1053–1067.
Whitehead, H. (2009) SOCPROG programs: analysing animal social struc-
tures.Behavioral Ecology and Sociobiology, 63, 765–778.
Williams, R.J. & Martinez, N.D. (2000) Simple rules yield complex food webs.
Nature, 404, 180–183.
Wolfram, S. (2002) A new kind of science. Wolfram Media, Champaign, IL,
USA.
Yates, C.A., Erban, R., Escudero, C., Couzin, I.D., Buhl, J., Kevrekidis, I.G.,
Maini, P.K. & Sumpter, D.J.T. (2009) Inherent noise can facilitate coherence
in collective swarmmotion.Proceedings of the National Academy of Sciences
of the United States of America, 106, 5464–5469.
Yeung, K., Dombek, K., Lo, K., Mittler, J., Zhu, J., Schadt, E.,
Bumgarner, R. & Raftery, A. (2011) Construction of regulatory
networks using expression time-series data of a genotyped population.
Proceedings of the National Academy of Sciences of the United States of
America, 108, 19436–19441.
14 B. Blonder et al.
� 2012 The Authors. Methods in Ecology and Evolution � 2012 British Ecological Society, Methods in Ecology and Evolution

Zecevic, A. & Siljak, D.D. (2010) Future directions: dynamic graphs.Control of
Complex Systems, pp. 165–212. Springer, USA.
Received 29April 2012; accepted 23 June 2012
Handling Editor: SeanRands
Glossary
Coupled dynamics: the simultaneous change of a network’s
topology and the flow of resources on it, involving strong
feedbacks between these two processes at the same time-
scale.
Degree: the number of edges for a given vertex, potentially
indicating the importance of a vertex in a network. The fre-
quency distribution of degree can indicate underlying
dynamic processes.
Edge: a link between two vertices in a network, indicating a
persistent interaction, an instantiation of an interaction or a
probability of an interaction. Edges may be weighted to
denote interaction strength.
Flow dynamics: the movement of resources (energy, disease,
information, etc.) on a network over time. Topological
dynamics of the networkmust be slower than flow dynamics.
Time-aggregated network: a network constructed by combin-
ing all interactions observed over some time window. Most
networks are time aggregated.
Time-ordered network: a network that represents exactly all
of the dynamic observations made by an investigator. Time-
ordered networks indicate the multiple time-scales inherent
to a biological system, can be used to study flow dynamics
and can be collapsed to time-aggregated networks to study
topological dynamics.
Topological dynamics: changes in the edges or vertices of a
network over time.
Vertex: an individual object in a network that represents the
biological phenomenon of interest.
Window size:An interval of time over which observed interac-
tions are aggregated into a network. Many descriptive statis-
tics like degree depend strongly onwindow size.
Temporal dynamics and network analysis 15
� 2012 The Authors. Methods in Ecology and Evolution � 2012 British Ecological Society, Methods in Ecology and Evolution
Copyright © 2022 FDOKUMEN