A Unified Neural Network Model of Spatio-Temporal Processing in X ...
17
A Unified Neural Network Model of Spatio-Temporal Processing in X and Y Retinal Ganglion Cells. I: Analytical Results Biological Cybernetics, 67, 23–34, 1992 Paolo Gaudiano Boston University, Department of Cognitive & Neural Systems 111 Cummington Street, Boston, MA 02215 USA Abstract This article makes use of a push-pull shunting network, which was introduced in the companion article, to model certain properties of X and Y retinal ganglion cells. Input to the push-pull network is preprocessed by a nonlinear mechanism for temporal adaptation, which is ascribed here to photoreceptor dynamics. The complete circuit is used to show that a simple change in receptive field morphology within a single model equation can change the network’s response characteristics to closely resemble those of either X or Y cells. Specifically, an increase in width of the receptive field center mechanism is sufficient to account for generation of on-off (Y-like) instead of null (X-like)responses to modulated gratings. In agreement with experimental data, the Y cell on-off response is independent of spatial phase. Also, the model accurately predicts that on-off responses can be observed in X cells for particular stimulus configurations. Taken together, the results show how the retina combines individually inadequate modules to efficiently handle the tasks required for accurate spatial and temporal visual information processing. The model is also able to clarify a number of controversial experimental findings on the nature of spatiotemporal visual processing in the retina. 1 Introduction Biological visual systems have been the subject of extensive theoretical and experimental studies. The technological advances of the past four decades have yielded detailed anatomical, physiological and pharmacological descriptions of many neural structures involved in visual processing. The retina, owing to its accessibility and to its fundamental role in the initial transduction of light into neural signals, is arguably the most extensively studied neural structure in vision. The pioneering work of Kuffler (1953) and Barlow (1953), among others, suggested that neural computation in the retina can be attributed to distinct classes of retinal cells, with cells in each class selectively responding to particular aspects of the visual stimulus. One of the best-known examples of functional selectivity in the retina was first proposed by Enroth-Cugell and Robson (1966), who analyzed the response of cat retinal ganglion cells (RGCs) to spatiotemporal visual stimulation. These authors reported the existence of two broad, but distinct classes of RGC: X cells, which respond to inputs in a sustained fashion, and appear to linearly summate luminance signals throughout their receptive field (RF); and Y cells, which respond to inputs in a transient fashion, and exhibit a more complicated, nonlinear spatial summation of luminance signals throughout their RF. This classification has been supported and extended through a number of physiological and anatomical studies, and a relationship has been established between the morphological classes of alpha and beta ganglion cells, respectively, and the functional classes of Y and X cells (Boycott and W¨ assle, 1974; Cleland and Levick, 1974; Fukuda et al., 1984; Hochstein and Shapley, 1976a,b; Saito, 1983). In spite of the vast amount of experimental and theoretical work sparked by the original findings, there are various controversial and paradoxical properties of X and Y cells that have not been satisfactorily clarified. I will summarize some of these controversial findings in the following two sections. After a brief overview of the push-pull shunting network (Fig. 1, see caption), which was introduced in the companion article (Gaudiano, 1992a), I will show in the remainder of the article that inclusion of a nonlinear mechanism for temporal adaptation enables the push-pull network to resolve many of these controversial issues, and leads to the novel hypothesis that X and Y cells consist of a single neural mechanism acting under different parametric regimes. Fig. 1 here 2 An Overview of X and Y Retinal Ganglion Cells The functional distinctions between X and Y cells reported by Enroth-Cugell and Robson (1966) were revealed through stimulation with temporally modulated spatial gratings. In these experiments, the activity of ganglion cells was recorded 1
-
Upload
khangminh22 -
Category
Documents
-
view
0 -
download
0
Transcript of A Unified Neural Network Model of Spatio-Temporal Processing in X ...
A Unified Neural Network Model of Spatio-Temporal Processing in X and Y RetinalGanglion Cells. I: Analytical Results
Biological Cybernetics, 67, 23–34, 1992
Paolo Gaudiano
Boston University, Department of Cognitive & Neural Systems111 Cummington Street, Boston, MA 02215 USA
Abstract
This article makes use of a push-pull shunting network, which was introduced in the companion article, to model certainproperties of X and Y retinal ganglion cells. Input to the push-pull network is preprocessed by a nonlinear mechanismfor temporal adaptation, which is ascribed here to photoreceptor dynamics. The complete circuit is used to showthat a simple change in receptive field morphology within a single model equation can change the network’s responsecharacteristics to closely resemble those of either X or Y cells. Specifically, an increase in width of the receptive fieldcenter mechanism is sufficient to account for generation of on-off (Y-like) instead of null (X-like) responses to modulatedgratings. In agreement with experimental data, the Y cell on-off response is independent of spatial phase. Also, themodel accurately predicts that on-off responses can be observed in X cells for particular stimulus configurations. Takentogether, the results show how the retina combines individually inadequate modules to efficiently handle the tasksrequired for accurate spatial and temporal visual information processing. The model is also able to clarify a number ofcontroversial experimental findings on the nature of spatiotemporal visual processing in the retina.
1 Introduction
Biological visual systems have been the subject of extensive theoretical and experimental studies. The technologicaladvances of the past four decades have yielded detailed anatomical, physiological and pharmacological descriptions ofmany neural structures involved in visual processing. The retina, owing to its accessibility and to its fundamental rolein the initial transduction of light into neural signals, is arguably the most extensively studied neural structure in vision.
The pioneering work of Kuffler (1953) and Barlow (1953), among others, suggested that neural computation in theretina can be attributed to distinct classes of retinal cells, with cells in each class selectively responding to particularaspects of the visual stimulus. One of the best-known examples of functional selectivity in the retina was first proposedby Enroth-Cugell and Robson (1966), who analyzed the response of cat retinal ganglion cells (RGCs) to spatiotemporalvisual stimulation. These authors reported the existence of two broad, but distinct classes of RGC: X cells, whichrespond to inputs in a sustained fashion, and appear to linearly summate luminance signals throughout their receptivefield (RF); and Y cells, which respond to inputs in a transient fashion, and exhibit a more complicated, nonlinear spatialsummation of luminance signals throughout their RF. This classification has been supported and extended through anumber of physiological and anatomical studies, and a relationship has been established between the morphologicalclasses of alpha and beta ganglion cells, respectively, and the functional classes of Y and X cells (Boycott and Wassle,1974; Cleland and Levick, 1974; Fukuda et al., 1984; Hochstein and Shapley, 1976a,b; Saito, 1983).
In spite of the vast amount of experimental and theoretical work sparked by the original findings, there are variouscontroversial and paradoxical properties of X and Y cells that have not been satisfactorily clarified. I will summarizesome of these controversial findings in the following two sections.
After a brief overview of the push-pull shunting network (Fig. 1, see caption), which was introduced in the companionarticle (Gaudiano, 1992a), I will show in the remainder of the article that inclusion of a nonlinear mechanism for temporaladaptation enables the push-pull network to resolve many of these controversial issues, and leads to the novel hypothesisthat X and Y cells consist of a single neural mechanism acting under different parametric regimes. Fig. 1 here
2 An Overview of X and Y Retinal Ganglion Cells
The functional distinctions between X and Y cells reported by Enroth-Cugell and Robson (1966) were revealed throughstimulation with temporally modulated spatial gratings. In these experiments, the activity of ganglion cells was recorded
1
in the optic nerve while spatiotemporal patterns were flashed on a screen located in front of paralyzed cats, in a way thatallowed accurate control of the location of the stimulus pattern relative to the RF center of the cell being recorded.
The primary distinction between X and Y response was found through what I will refer to as the null test, whichis carried out in the following manner: the response of a ganglion cell is recorded while a sinusoidal grating is turnedon and off, i.e., is modulated in time by a square wave of fixed temporal frequency. The sinusoidal spatial modulationis such that the average luminance of the grating superimposed on the background is equal to the luminance of thebackground alone. Measurement of the cell’s response to this spatiotemporal stimulus is repeated as the grating’s spatialphase relative to the RF center is systematically varied across trials (Fig. 2a).
As shown in Fig. 2a, one difference between X and Y cells is that for an X cell (left column) it is generally possibleto find two distinct relative phases, usually at �90�, at which no response is elicited by grating onset or offset (secondand fourth rows). On the other hand, Y cell response (right column) depends on the relative phase in a more complicatedmanner: when the relative phase is zero (top row) or 180 degrees (third row), grating onset and offset generate largetransient responses of opposite sign. When the relative phase is �90�, the Y cell exhibits an on-off, or frequencydoubling response, that is, it responds in the same fashion to both onset and offset of the grating (second and fourth rowsfrom the top of Fig. 2a). These results led to the conclusion that X cells perform linear spatial summation over the extentof their receptive field, while Y cells perform a more complex form of nonlinear spatial summation. Fig. 2 here
Hochstein and Shapley (1976a,b) confirmed and extended the X/Y classification on the basis of the null test. Theyfound that the linear/nonlinear classification holds for a wide range of temporal frequency of modulation and for varioustypes of spatial and temporal waveform, which led them to the hypothesis that the distinct behavior of X and Y cellsimplies different underlying retinal circuits. Specifically, these authors proposed that the RF of both X and Y cellsincludes linear center and surround mechanisms of the type proposed by Rodieck (1965), but that the Y cell RF furtherincludes small nonlinear subunits that overlap both the RF center and surround. This qualitative model is still consideredthe authoritative account of the Y cell RF, and is currently used as a basis for many quantitative Y cell models.
3 Some Unresolved Aspects of X and Y Cell Function
The findings outlined in the previous section have been the basis of much experimental and theoretical work. However,there are a number of issues that remain unclear and have not been satisfactorily explained.
Perhaps the most controversial aspect of retinal processing is that the approximately linear behavior of X cells has notbeen reconciled with the existence of nonlinear processing in the outer layers of the retina. Enroth-Cugell and Robson(1966) noted that the existence of null responses in X cells “... implies either that the signals from photoreceptors arelinearly related to their illumination or that they are non-linearly related in a way which is symmetrical about the meanilluminance.” These authors concluded that “the latter alternative can be ruled out by the observation that the nullpositions for grating patterns are not changed when the mean luminance is changed” (p. 524-525).
However, it is known that photoreceptor response is not linearly related to luminance; photoreceptors nonlinearlycompress the input range (e.g., Dowling, 1987; Rushton, 1958). From a functional point of view, it is important that thephotoreceptors be able to compress the input into a finite range, since any information that is lost at the photoreceptorscannot be recovered at later stages.
In addition to this static, compressive nonlinearity, any transient nonlinearity could also affect X cell linear responses(Gaudiano, 1992b). For instance, it is known that photoreceptors and bipolar cells exhibit transient overshoots andundershoots to sudden input changes. Such transients are the result of each photoreceptor trying to adjust its dynamicrange in response to local changes in input intensity. The purpose of these adjustments, in principle, is to maintain eachphotoreceptor within the linear portion of its dynamic range. However, such adjustments cannot be instantaneous, sothat rapid input fluctuations may temporarily drive the photoreceptor into the nonlinear portion of its dynamic range,until the adaptation mechanism can drive it back into the linear range. Hence photoreceptors should exhibit transientnonlinearities in response to rapid temporal fluctuations. In other words, one would not expect null responses at �90 �
spatial phase when the grating is square-wave modulated, as in the classical experiments of Enroth-Cugell and Robson(1966).
How is it possible for X cells to behave linearly even though they receive input from nonlinear preprocessing layers?As pointed out by Enroth-Cugell and Robson (1966), a nonlinear transducer—in the absence of some compensatorymechanism—would cause a strong dependence of subsequent processing layers upon average input intensity, an unde-sirable phenomenon that is not found experimentally. This question is of fundamental importance because most modelsof cortical and subcortical visual processing assume linear preprocessing in the retina.
Equally puzzling is the observation that the linearity of X cells does not hold for all types of spatial modulation
2
functions. For example, X cells sometimes exhibit frequency doubling in response to modulation of a sharp contrastedge. Models that assume linear preprocessing to X cells would have to invoke additional machinery to introduce thisresidual nonlinearity. Is the nonlinearity of X cells related to the nonlinearity of Y cells, or is it an insignificant, unrelatedphenomenon?
4 Toward a Unified Model
In the remainder of this article I will summarize the properties of the push-pull shunting network, which was introducedin the companion article (Gaudiano, 1992a), and show that when preceded by a nonlinear temporal adaptation mechanismthis network can qualitatively reproduce many aspects of X and Y cell behavior, and resolve all of the controversies justoutlined.
The model leads to the prediction that X and Y cells consist of the same mechanism acting in different parameterranges. In accord with experimental data linking X and Y cells to beta and alpha cells, respectively, an increase in thewidth of the RF center relative to the surround is sufficient to account for the generation of symmetrical on-off (Y like)instead of null (X like) responses to modulated sinusoidal gratings. The on-off response in Y cells is independent ofspatial phase and persists at higher spatial frequencies than the Y cell linear response. Finally, model X cells exhibiton-off responses to a modulated contrast edge.
All simulations throughout the article are obtained through numerical integration of equations (1), (4), (7), and (8)below, with a Fourth-Order Runge-Kutta routine. Parameters are: A � 0�0, B � 8�0, and D � 2�0 (see (1));C � 12�0,S � 1�0, �S � 12�0, �C � 3�0 for X and �C � 10�0 for Y cells (see (4)); F � 180�0, G � 20�0, and H � 400�0(see (8)). Dimensional analysis of this system and relationship to experimentally determined values will appear in afuture manuscript. All simulation results throughout the article are plotted in nondimensional units and use the samenetwork parameters chosen for Fig. 2b.
5 The Push-Pull Shunting Network
The shunting network (Grossberg, 1970; Sperling, 1970) has been used to model many aspects of static visual processingin the retina. However, it was shown in the companion article (Gaudiano, 1992a) that the same properties that enablethe shunting network to track spatial modulation also lead to poor temporal processing. The push-pull shunting networkwas designed to overcome this problem by preprocessing inputs through pairs of cells having opposite response polarity.Such a mechanism has been experimentally found in the retinal circuit connecting photoreceptors to RGCs throughpairs of push-pull bipolar cells (McGuire et al., 1986). Each bipolar cell receives input from a single photoreceptor ata given location, and converges onto a single RGC. The present model assumes that push-pull bipolar pairs are locatedthroughout the RGC’s receptive field, and contribute to both its center and surround mechanisms. If the bipolars actquickly relative to input fluctuations, their effect can be lumped into a discrete shunting equation:
dvidt
� �Avi � �B � vi�hX
C�k � i�Ik �X
S�k � i� (M � Ik)i
��D � vi�hX
S�k � i�Ik �X
C�k � i� (M � Ik)i
, (1)
where vi represents the activation of the ith cell in the network;A is the rate of passive decay toward the resting potential(which is assumed here to be zero); B and D represent the excitatory and inhibitory saturation points, respectively;M isthe maximum bipolar activation (bounded in the interval �0�M �);C�k � i� andS�k � i�, respectively, represent the RGCcenter and surround RF mechanisms. In the absence of inputs, activation vi decays to zero at a rate �Avi. Increasinginputs through the RF center cause an increase in excitation and a simultaneous, push-pull decrease in inhibition. Anequal and opposite effect takes place through the RF surround. In all cases activation is bounded in the interval ��D�B�.
Spatiotemporal analyses can be carried out by replacing the discrete summations with convolutions, thus express-ing (1) as a system which is continuous in both space and time. Under the assumption of space-time separable inputs ofthe form I�x� t� � I�x�m�t�, (1) reduces to a linear, time-invariant (LTI), first order, ordinary differential equation:
dv
dt� v (A�MC �MS) � m�t� (B �D) (IC � IS) � BMS �DMC , �2�
where IC and IS represent the convolution of an arbitrary spatial input distribution with the RF center and surround
3
mechanisms, and
MC � M � VC �M
Z�
��
C�x�dx and MS �M � VS �M
Z�
��
S�x�dx, �3�
with VC and VS thus representing the volume (area) of the center and surround components, respectively, of the RFprofile. Space-time separable functions can be used to represent many of the stimuliused for experimental measurements,including for example sinusoidally or square-wave modulated spatial gratings, and drifting sinusoidal gratings.
It was shown in the previous article (Gaudiano, 1992a) that (2) holds regardless of RF dimension (1- or 2-D) orspecific choice of RF profile. All simulation results presented here assume a 1-D RF with Gaussian center and surroundmechanisms:
C�k � i� � C exp
���k � i�2
2�2C
�; S�k � i� � S exp
���k � i�2
2�2S
�, �4�
where each Gaussian is described by its peak amplitude (C, S) and standard deviation (�C, �S).An LTI system such as (2) has the advantage of being analytically tractable, and leads to important predictions.
Perhaps most important is the system’s ability to segregate steady and temporally modulated input components. Toillustrate this point, consider the response of (2) to sinusoidal temporal modulation (m�t� � sin�t) of a cosinusoidalspatial grating (J�x� � � cos�x), superimposed upon a steady, uniform background (I�x� � I):
v�x� t� � v0e�at �B �D
a
�I (VC � VS )�
DVC � BVSB �D
� �1� e�at
��
B �D
a2 � �2
�VC exp
���2�2
C
2
�� VS exp
���2�2
S
2
��� cos�x
��e�at � a sin�t �� cos�t
�, (5)
witha � A�MC �MS � A �M �VC � VS�. �6�
This solution shows that amplitude of modulation in response to the temporally modulated input component J�x�m�t�is independent of the steady background I (see also Fig. 9 from Gaudiano, 1992a).
It should be emphasized that the push-pull shunting network behaves as a linear time-invariant system regardless ofthe nature of input preprocessing. The example above assumes that the input is a perfect sinusoid in space and time onlyfor clarity. In reality this input must be preprocessed by a layer of cells that can (nonlinearly) compress the luminancesignal into a finite range. In such a case the response of the push-pull network exhibits a sustained component thatdepends exclusively on the average output level of the preprocessing element, and a transient component that dependson the modulated response component of the preprocessing element. As a result, the push-pull shunting network mayappear to behave linearly in spite of nonlinear preprocessing, as will be shown later.
Equation (5) can be used to demonstrate further properties of the push-pull shunting network. First of all,manipulationof morphological and physiological parameters can selectively enhance transient or sustained response components. Inparticular, a uniform increase in a (which is approximately equal to the total area or volume of the RF) decreasesthe amplitude of sustained response components through the factor 1�a, and simultaneously increases the network’sintegration rate through the factor e�at. The switch from more sustained to more transient response characteristics withan increase in RF size is in general agreement with morphological and physiological data relating beta cells to X cells,and alpha cells to Y cells (Cleland and Levick, 1974; Fukuda et al., 1984; Saito, 1983), and thus suggests that thepush-pull network may be a valid model for spatiotemporal responses of both X and Y cells.
6 Discrepancies in the Push-Pull Model
An evaluation of the above hypothesis revealed a number of discrepancies between simulated and experimental X and Ycell data (Gaudiano, 1992a). First of all, the push-pull network requires that inputs be bounded to a finite range, whichimplicitly assumes a preprocessing layer that can compress luminance signals to the retina.
Secondly, the push-pull network is unable to generate the overshoots and undershoots typically found in both X andY responses to sudden input onsets and offsets, an example of which can be seen in Fig. 2a.
Finally, analysis of (5) is in disaccord with the experimental data on the null test: the term cos�x multiplying theentire modulated term of (5) indicates that a null response will always exist at�90 � in the push-pull network, regardlessof morphological and physiological parameter choices.
4
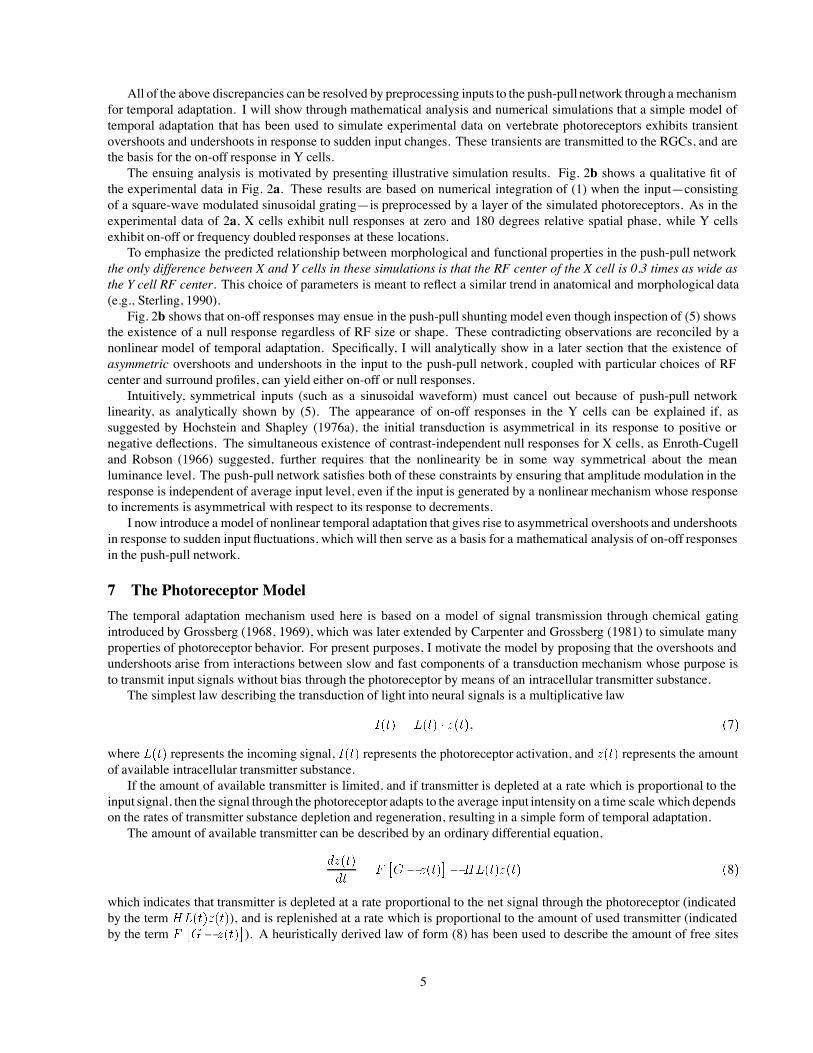
All of the above discrepancies can be resolved by preprocessing inputs to the push-pullnetwork through a mechanismfor temporal adaptation. I will show through mathematical analysis and numerical simulations that a simple model oftemporal adaptation that has been used to simulate experimental data on vertebrate photoreceptors exhibits transientovershoots and undershoots in response to sudden input changes. These transients are transmitted to the RGCs, and arethe basis for the on-off response in Y cells.
The ensuing analysis is motivated by presenting illustrative simulation results. Fig. 2b shows a qualitative fit ofthe experimental data in Fig. 2a. These results are based on numerical integration of (1) when the input—consistingof a square-wave modulated sinusoidal grating—is preprocessed by a layer of the simulated photoreceptors. As in theexperimental data of 2a, X cells exhibit null responses at zero and 180 degrees relative spatial phase, while Y cellsexhibit on-off or frequency doubled responses at these locations.
To emphasize the predicted relationship between morphological and functional properties in the push-pull networkthe only difference between X and Y cells in these simulations is that the RF center of the X cell is 0.3 times as wide asthe Y cell RF center. This choice of parameters is meant to reflect a similar trend in anatomical and morphological data(e.g., Sterling, 1990).
Fig. 2b shows that on-off responses may ensue in the push-pull shunting model even though inspection of (5) showsthe existence of a null response regardless of RF size or shape. These contradicting observations are reconciled by anonlinear model of temporal adaptation. Specifically, I will analytically show in a later section that the existence ofasymmetric overshoots and undershoots in the input to the push-pull network, coupled with particular choices of RFcenter and surround profiles, can yield either on-off or null responses.
Intuitively, symmetrical inputs (such as a sinusoidal waveform) must cancel out because of push-pull networklinearity, as analytically shown by (5). The appearance of on-off responses in the Y cells can be explained if, assuggested by Hochstein and Shapley (1976a), the initial transduction is asymmetrical in its response to positive ornegative deflections. The simultaneous existence of contrast-independent null responses for X cells, as Enroth-Cugelland Robson (1966) suggested, further requires that the nonlinearity be in some way symmetrical about the meanluminance level. The push-pull network satisfies both of these constraints by ensuring that amplitude modulation in theresponse is independent of average input level, even if the input is generated by a nonlinear mechanism whose responseto increments is asymmetrical with respect to its response to decrements.
I now introduce a model of nonlinear temporal adaptation that gives rise to asymmetrical overshoots and undershootsin response to sudden input fluctuations, which will then serve as a basis for a mathematical analysis of on-off responsesin the push-pull network.
7 The Photoreceptor Model
The temporal adaptation mechanism used here is based on a model of signal transmission through chemical gatingintroduced by Grossberg (1968, 1969), which was later extended by Carpenter and Grossberg (1981) to simulate manyproperties of photoreceptor behavior. For present purposes, I motivate the model by proposing that the overshoots andundershoots arise from interactions between slow and fast components of a transduction mechanism whose purpose isto transmit input signals without bias through the photoreceptor by means of an intracellular transmitter substance.
The simplest law describing the transduction of light into neural signals is a multiplicative law
I�t� � L�t� � z�t�, �7�
where L�t� represents the incoming signal, I�t� represents the photoreceptor activation, and z�t� represents the amountof available intracellular transmitter substance.
If the amount of available transmitter is limited, and if transmitter is depleted at a rate which is proportional to theinput signal, then the signal through the photoreceptor adapts to the average input intensity on a time scale which dependson the rates of transmitter substance depletion and regeneration, resulting in a simple form of temporal adaptation.
The amount of available transmitter can be described by an ordinary differential equation,
dz�t�
dt� F
�G� z�t�
��HL�t�z�t� �8�
which indicates that transmitter is depleted at a rate proportional to the net signal through the photoreceptor (indicatedby the term HL�t�z�t�), and is replenished at a rate which is proportional to the amount of used transmitter (indicatedby the term F
�G� z�t�
�). A heuristically derived law of form (8) has been used to describe the amount of free sites
5
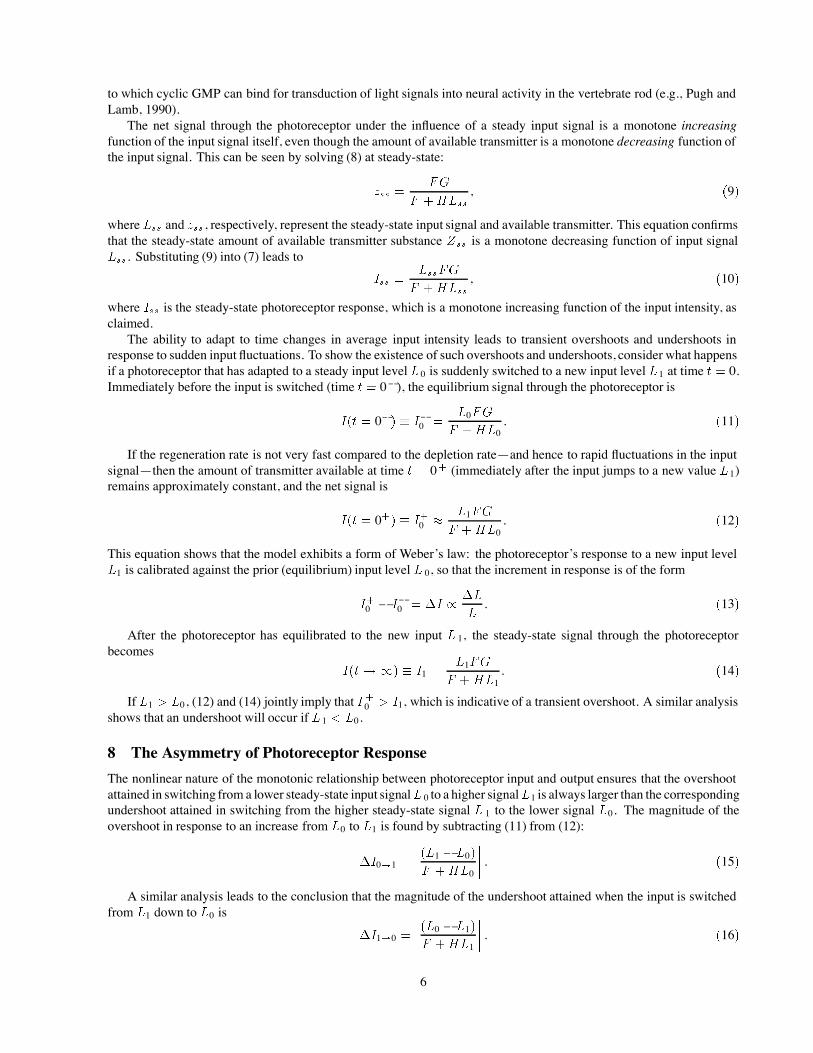
to which cyclic GMP can bind for transduction of light signals into neural activity in the vertebrate rod (e.g., Pugh andLamb, 1990).
The net signal through the photoreceptor under the influence of a steady input signal is a monotone increasingfunction of the input signal itself, even though the amount of available transmitter is a monotone decreasing function ofthe input signal. This can be seen by solving (8) at steady-state:
zss �FG
F �HLss
, �9�
where Lss and zss, respectively, represent the steady-state input signal and available transmitter. This equation confirmsthat the steady-state amount of available transmitter substance Zss is a monotone decreasing function of input signalLss. Substituting (9) into (7) leads to
Iss �LssFG
F �HLss
, �10�
where Iss is the steady-state photoreceptor response, which is a monotone increasing function of the input intensity, asclaimed.
The ability to adapt to time changes in average input intensity leads to transient overshoots and undershoots inresponse to sudden input fluctuations. To show the existence of such overshoots and undershoots, consider what happensif a photoreceptor that has adapted to a steady input level L0 is suddenly switched to a new input level L1 at time t � 0.Immediately before the input is switched (time t � 0�), the equilibrium signal through the photoreceptor is
I�t � 0�� � I�0 �L0FG
F �HL0. �11�
If the regeneration rate is not very fast compared to the depletion rate—and hence to rapid fluctuations in the inputsignal—then the amount of transmitter available at time t � 0� (immediately after the input jumps to a new value L1)remains approximately constant, and the net signal is
I�t � 0�� � I�0 �L1FG
F �HL0. �12�
This equation shows that the model exhibits a form of Weber’s law: the photoreceptor’s response to a new input levelL1 is calibrated against the prior (equilibrium) input level L 0, so that the increment in response is of the form
I�0 � I�0 � �I ��L
L. �13�
After the photoreceptor has equilibrated to the new input L 1, the steady-state signal through the photoreceptorbecomes
I�t��� � I1 �L1FG
F �HL1. �14�
If L1 � L0, (12) and (14) jointly imply that I �0 � I1, which is indicative of a transient overshoot. A similar analysisshows that an undershoot will occur if L1 � L0.
8 The Asymmetry of Photoreceptor Response
The nonlinear nature of the monotonic relationship between photoreceptor input and output ensures that the overshootattained in switching from a lower steady-state input signalL 0 to a higher signalL1 is always larger than the correspondingundershoot attained in switching from the higher steady-state signal L 1 to the lower signal L0. The magnitude of theovershoot in response to an increase from L0 to L1 is found by subtracting (11) from (12):
�I0�1 �
�L1 � L0�
F �HL0
. �15�
A similar analysis leads to the conclusion that the magnitude of the undershoot attained when the input is switchedfrom L1 down to L0 is
�I1�0 �
�L0 � L1�
F �HL1
. �16�
6
Given the assumption that L1 � L0, (15) and (16) together prove that, as claimed,
�I0�1 � �I1�0. �17�
The photoreceptor model as it stands has at least two shortcomings. First, the signal that is chemically gated cannotbe light itself, but must instead be a chemical substance resulting from a rapid chain reaction initiated by light. Such achain reaction is used by Baylor et al. (1974) and by Carpenter and Grossberg (1981), and receives support in recentphysiological and pharmacological data (for a review, see Pugh and Cobbs, 1988; Pugh and Lamb, 1990). Without sucha chain reaction, the simple photoreceptor model predicts that the size of the overshoot is proportional to the input signal,which implies unbounded photoreceptor output. If the chain reaction is fast it can be approximated as a steady-statesigmoidal compression, and inspection of (15) and (16) immediately shows that the asymmetry inequality (17) holds aslong as the signal L is a monotone increasing function of photoreceptor illuminance.
Second, there is evidence that the rate of transmitter regeneration, which in the present model is only proportional tothe amount of depleted transmitter, may be modulated by the incoming signal. Carpenter and Grossberg (1981) showedthat inclusion of such a mechanism is necessary to explain certain aspects of photoreceptor dynamics. The mechanismthey proposed is based on an intracellular second messenger, a hypothesis that receives support in recent data (Pughand Cobbs, 1988). Mathematically, Carpenter and Grossberg (1981) allowed the regeneration rate F to depend on thesize of the input signal, with larger input signals increasing the regeneration rate. It can be shown that the asymmetryinequality (17) holds under this modification as well.
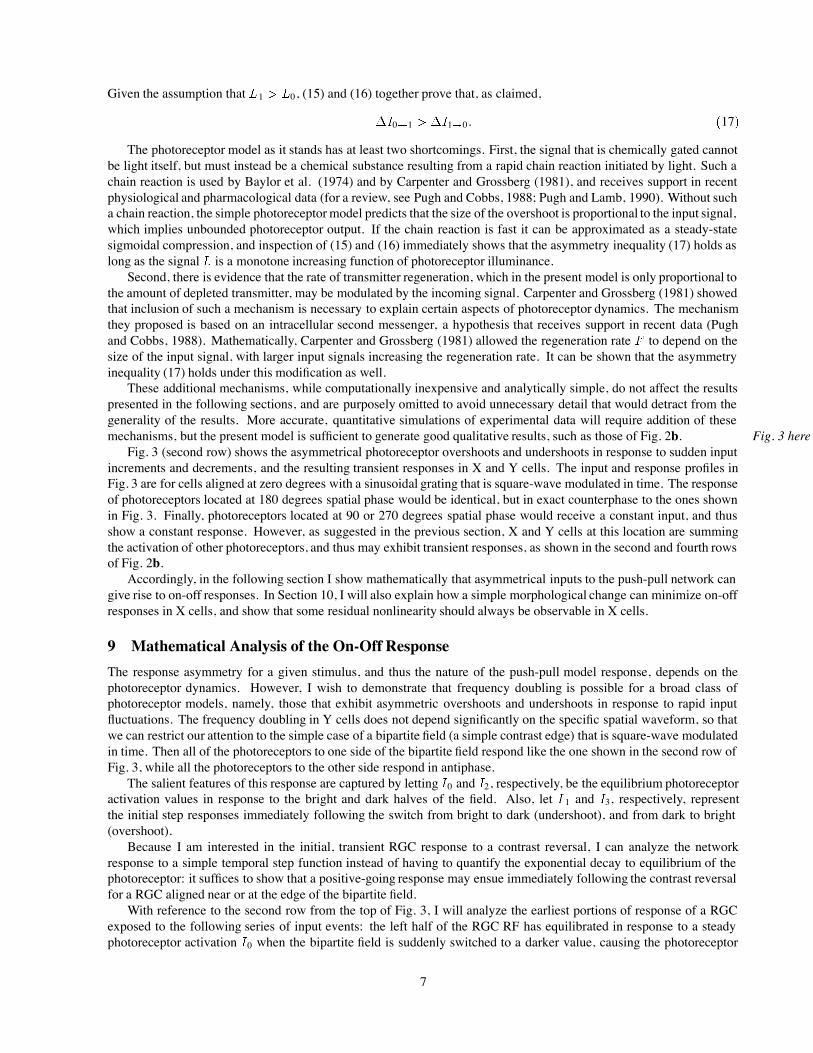
These additional mechanisms, while computationally inexpensive and analytically simple, do not affect the resultspresented in the following sections, and are purposely omitted to avoid unnecessary detail that would detract from thegenerality of the results. More accurate, quantitative simulations of experimental data will require addition of thesemechanisms, but the present model is sufficient to generate good qualitative results, such as those of Fig. 2b. Fig. 3 here
Fig. 3 (second row) shows the asymmetrical photoreceptor overshoots and undershoots in response to sudden inputincrements and decrements, and the resulting transient responses in X and Y cells. The input and response profiles inFig. 3 are for cells aligned at zero degrees with a sinusoidal grating that is square-wave modulated in time. The responseof photoreceptors located at 180 degrees spatial phase would be identical, but in exact counterphase to the ones shownin Fig. 3. Finally, photoreceptors located at 90 or 270 degrees spatial phase would receive a constant input, and thusshow a constant response. However, as suggested in the previous section, X and Y cells at this location are summingthe activation of other photoreceptors, and thus may exhibit transient responses, as shown in the second and fourth rowsof Fig. 2b.
Accordingly, in the following section I show mathematically that asymmetrical inputs to the push-pull network cangive rise to on-off responses. In Section 10, I will also explain how a simple morphological change can minimize on-offresponses in X cells, and show that some residual nonlinearity should always be observable in X cells.
9 Mathematical Analysis of the On-Off Response
The response asymmetry for a given stimulus, and thus the nature of the push-pull model response, depends on thephotoreceptor dynamics. However, I wish to demonstrate that frequency doubling is possible for a broad class ofphotoreceptor models, namely, those that exhibit asymmetric overshoots and undershoots in response to rapid inputfluctuations. The frequency doubling in Y cells does not depend significantly on the specific spatial waveform, so thatwe can restrict our attention to the simple case of a bipartite field (a simple contrast edge) that is square-wave modulatedin time. Then all of the photoreceptors to one side of the bipartite field respond like the one shown in the second row ofFig. 3, while all the photoreceptors to the other side respond in antiphase.
The salient features of this response are captured by letting I0 and I2, respectively, be the equilibrium photoreceptoractivation values in response to the bright and dark halves of the field. Also, let I 1 and I3, respectively, representthe initial step responses immediately following the switch from bright to dark (undershoot), and from dark to bright(overshoot).
Because I am interested in the initial, transient RGC response to a contrast reversal, I can analyze the networkresponse to a simple temporal step function instead of having to quantify the exponential decay to equilibrium of thephotoreceptor: it suffices to show that a positive-going response may ensue immediately following the contrast reversalfor a RGC aligned near or at the edge of the bipartite field.
With reference to the second row from the top of Fig. 3, I will analyze the earliest portions of response of a RGCexposed to the following series of input events: the left half of the RGC RF has equilibrated in response to a steadyphotoreceptor activation I0 when the bipartite field is suddenly switched to a darker value, causing the photoreceptor
7
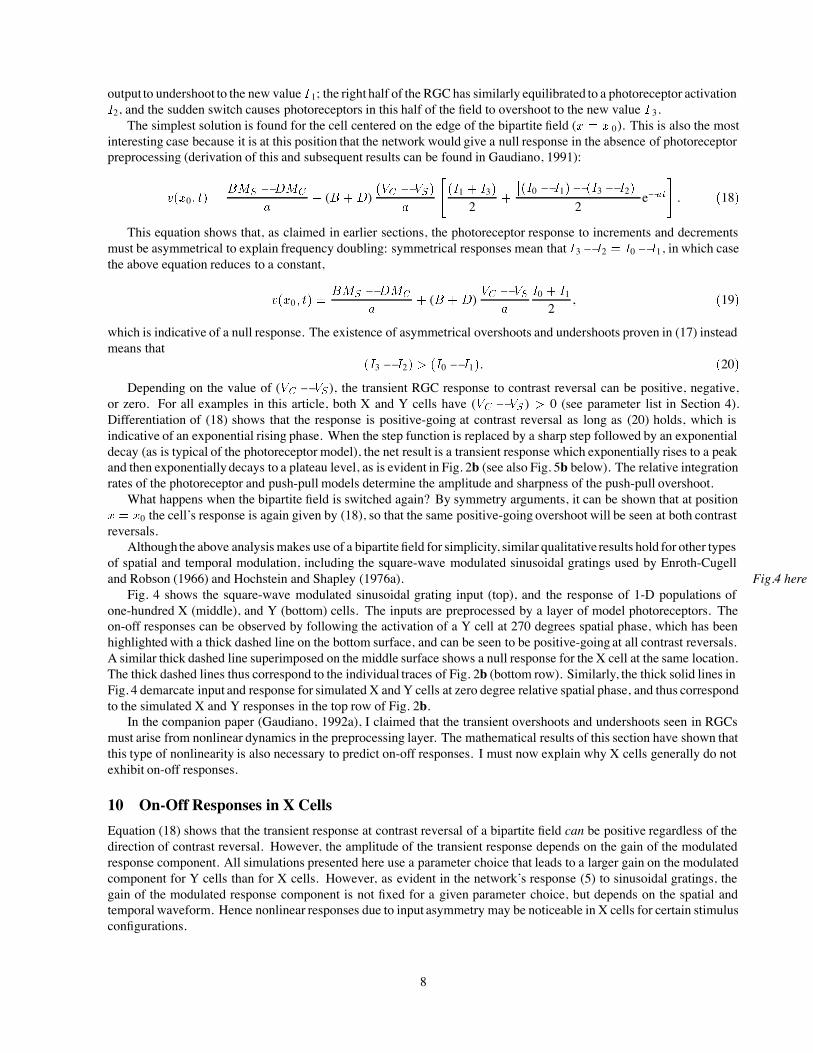
output to undershoot to the new value I 1; the right half of the RGC has similarly equilibrated to a photoreceptor activationI2, and the sudden switch causes photoreceptors in this half of the field to overshoot to the new value I 3.
The simplest solution is found for the cell centered on the edge of the bipartite field (x � x 0). This is also the mostinteresting case because it is at this position that the network would give a null response in the absence of photoreceptorpreprocessing (derivation of this and subsequent results can be found in Gaudiano, 1991):
v�x0� t� �BMS �DMC
a� (B �D)
�VC � VS�
a
�I1 � I3�
2�
��I0 � I1�� �I3 � I2�
�2
e�at�
. �18�
This equation shows that, as claimed in earlier sections, the photoreceptor response to increments and decrementsmust be asymmetrical to explain frequency doubling: symmetrical responses mean that I3 � I2 � I0 � I1, in which casethe above equation reduces to a constant,
v�x0� t� �BMS �DMC
a� (B �D)
VC � VSa
I0 � I1
2, �19�
which is indicative of a null response. The existence of asymmetrical overshoots and undershoots proven in (17) insteadmeans that
�I3 � I2� � �I0 � I1�. �20�
Depending on the value of (VC � VS), the transient RGC response to contrast reversal can be positive, negative,or zero. For all examples in this article, both X and Y cells have (VC � VS ) � 0 (see parameter list in Section 4).Differentiation of (18) shows that the response is positive-going at contrast reversal as long as (20) holds, which isindicative of an exponential rising phase. When the step function is replaced by a sharp step followed by an exponentialdecay (as is typical of the photoreceptor model), the net result is a transient response which exponentially rises to a peakand then exponentially decays to a plateau level, as is evident in Fig. 2b (see also Fig. 5b below). The relative integrationrates of the photoreceptor and push-pull models determine the amplitude and sharpness of the push-pull overshoot.
What happens when the bipartite field is switched again? By symmetry arguments, it can be shown that at positionx � x0 the cell’s response is again given by (18), so that the same positive-going overshoot will be seen at both contrastreversals.
Although the above analysis makes use of a bipartitefield for simplicity, similar qualitative results hold for other typesof spatial and temporal modulation, including the square-wave modulated sinusoidal gratings used by Enroth-Cugelland Robson (1966) and Hochstein and Shapley (1976a). Fig.4 here
Fig. 4 shows the square-wave modulated sinusoidal grating input (top), and the response of 1-D populations ofone-hundred X (middle), and Y (bottom) cells. The inputs are preprocessed by a layer of model photoreceptors. Theon-off responses can be observed by following the activation of a Y cell at 270 degrees spatial phase, which has beenhighlighted with a thick dashed line on the bottom surface, and can be seen to be positive-going at all contrast reversals.A similar thick dashed line superimposed on the middle surface shows a null response for the X cell at the same location.The thick dashed lines thus correspond to the individual traces of Fig. 2b (bottom row). Similarly, the thick solid lines inFig. 4 demarcate input and response for simulated X and Y cells at zero degree relative spatial phase, and thus correspondto the simulated X and Y responses in the top row of Fig. 2b.
In the companion paper (Gaudiano, 1992a), I claimed that the transient overshoots and undershoots seen in RGCsmust arise from nonlinear dynamics in the preprocessing layer. The mathematical results of this section have shown thatthis type of nonlinearity is also necessary to predict on-off responses. I must now explain why X cells generally do notexhibit on-off responses.
10 On-Off Responses in X Cells
Equation (18) shows that the transient response at contrast reversal of a bipartite field can be positive regardless of thedirection of contrast reversal. However, the amplitude of the transient response depends on the gain of the modulatedresponse component. All simulations presented here use a parameter choice that leads to a larger gain on the modulatedcomponent for Y cells than for X cells. However, as evident in the network’s response (5) to sinusoidal gratings, thegain of the modulated response component is not fixed for a given parameter choice, but depends on the spatial andtemporal waveform. Hence nonlinear responses due to input asymmetry may be noticeable in X cells for certain stimulusconfigurations.
8
The existence of nonlinear responses in X cells has been documented in the experimental literature. For example,Enroth-Cugell and Robson (1966) showed the experimentally measured response of a single X cell to introduction andwithdrawal of a bipartitefield. The authors stated that “there is virtually no response at all,” but inspection of their Fig. 12shows what may be small on-off responses. Furthermore, the original figure caption (Enroth-Cugell and Robson, 1966,Fig. 12) indicates that a contrast of only 0.2 was used for this example, whereas other figures showing null responsesused a contrast of 0.32. This point has been noted by Hochstein and Shapley (1976a, p. 247).
In terms of the present model, an explanation of X cell on-off responses to a modulated contrast edge is that such astimulus configuration enhances the asymmetry between the inputs reaching the two sides of a cell’s RF, and can thusovercome the relatively small gain of the X cell modulated response component. Fig. 5 here
The effectiveness of edge sharpness in enhancing on-off responses can be seen by tracing the activation of a singlecell located near the contrast edge in Fig. 5a (thick lines). It is apparent that Y cells at the edge exhibit a largepositive-going response at both contrast reversals. It is also apparent that, in this example, X cells at the contrast edgealso show positive responses at both contrast reversals (on-off). The parameters are the same as those used for earliersimulations. Once again, the different functional behavior of X and Y cells is due entirely to the different width of therespective RF center mechanisms. The activation of individual X and Y cells near the contrast edge is shown in Fig. 5b,confirming the existence of small on-off responses in the X cells, and more vigorous ones in Y cells. Note that theinput and photoreceptor responses at the position shown in Fig. 5a are constant because the input at the contrast edgeremains constant at the average luminance level. The on-off responses at that location arise from the nonlinearity in theactivation of photoreceptors on the two sides of the RGC’s receptive field (Gaudiano, 1991, 1992a).
11 Spatial Frequency and Phase Dependence of the On-Off Response
Hochstein and Shapley (1976a,b) extended the null test to include analysis of the temporal frequency components of Xand Y cell response. They found that under most stimulus conditions X cell response is dominated by a fundamentaltemporal frequency component equal to the modulation frequency. In contrast, Y cell response exhibits second harmonicdistortion, i.e., the response shows a mixture of fundamental and second harmonic (frequency doubling) components.The fundamental component exhibits linear spatial phase dependence similar to that of X cells, whereas the on-off, orsecond harmonic component is largely independent of spatial phase.
In general, the fundamental temporal frequency response component of Y cells falls off more rapidly at high spatialfrequencies than that of X cells, owing to the Y cell’s broader RF center. However, the Y cell second harmonic persistsat much higher spatial frequencies. Thus, there exists a range of moderately high spatial frequencies at which X cellsexhibit a normal spatial phase-dependent response at the fundamental temporal frequency of modulation, whereas Ycells exhibit a pure on-off (second harmonic) response independent of spatial phase.
This behavior is predicted by the push-pull shunting network, because the on-off response depends on photoreceptorasymmetry, which is propagated through the bipolar receptive fields. The results of Section 9 depend only partially on thespatial modulation function: as long as a significant portion of the photoreceptors within the RF are overshooting whilethe others are undershooting, the result will be similar regardless of whether all of the overshooting photoreceptors areon one side of the RF or whether they are uniformly interspersed with the undershooting photoreceptors. For instance,a sinusoidal grating whose spatial frequency is too high for detection by a Y cell’s center and surround RF components,can still cause asymmetrical responses in the bipolars, so that although unable to detect the spatial modulation, the Ycell can still exhibit on-off responses. Fig. 6 here
The response of X and Y cells to a moderately high spatial frequency sinusoid is shown in Fig. 6. All parameters arethe same as those of Fig. 4, but the spatial frequency is doubled. The figure shows that X cell response remains phasedependent, while Y cells exhibit on-off, or frequency doubling responses at all spatial phase values.
The model in its present form makes the simplifying assumption that the cone�bipolar connections are one-to-one,so that the second harmonic component of the response is expected to persist for the highest discriminable spatialfrequencies. A more accurate model including larger bipolar receptive fields would show loss of the second harmonicresponse for high spatial frequencies that cannot be discriminated by the bipolars.
The properties of X and Y cell response to the classes of stimuli analyzed thus far should change only at extremespatial frequency values if a more realistic bipolar cell model were used. However, a significant qualitative differencein RGC response may ensue for different classes of stimuli, particularly rapidly moving stimuli. Analysis of push-pullnetwork behavior under these conditions will be the subject of future research.
9
12 Discussion
The work introduced in this article is based on mathematical analyses of the spatiotemporal response of feed-forwardshunting networks. The resulting model leads to qualitative simulations of some important retinal data, and proposesfunctional reasons for the underlying retinal circuits. One of the most compelling observations to support the validityof this model is perhaps captured in the paradoxical conclusion of Enroth-Cugell and Robson (1966) on the linearityof photoreceptors, as was discussed in Section 3. The ability to adapt to ambient illumination without the undesirableside effects of nonlinear image processing has an obvious ecological value. The push-pull shunting network overcomesthis problem by combining two copies of the incoming signal in such a way that the net input to the RGCs is alwayssymmetrical about the average output level of a possibly nonlinear transducer, thus always yielding symmetrical nullresponses in X cells, and symmetrical on-off responses in Y cells. The results presented here also explain why X cellsare less sensitive than Y cells to nonlinearities and input transients, but may sometimes exhibit on-off responses.
In an earlier article, Gaudiano (1991) has shown that temporal adaptation laws of the form used in this article for thephotoreceptor model lead to loss of relative spatial contrast in response to sustained images. In other words, stabilizedimages fade (see also Gaudiano, 1992b). The relationship of this finding to the biologically observed fading of stabilizedimages will be the subject of future work. However, such loss of contrast appears to be an inescapable side effect oftemporal adaptation. Hence, just as the original shunting network sacrifices temporal resolution in order to achievespatial adaptation, so the photoreceptors sacrifice spatial resolution in order to achieve temporal adaptation.
Taken together with the results presented here, the above observations suggest that the push-pull retinal circuitprovides an efficient means of maintaining high resolution in both space and time by sharing the load between threesystems. The photoreceptors are able to optimize sensitivity in the temporal domain by adjusting their dynamic rangein response to changes in local luminance levels, but in doing so they lose much of their ability to process sustainedspatial information. Conversely, the center-surround receptive field mechanism and shunting dynamics in the RGCs canextract useful spatial information, but at least in some cases lead to degraded temporal resolution. Finally, the push-pullbipolar cells allow the RGCs to respond rapidly to increments and decrements of a nonnegative input signal, and in sodoing they ensure that spatial RGC processing is not affected by photoreceptor nonlinearities.
The existence of push-pull bipolar inputs to RGCs as proposed here receives some direct experimental support,though even this limited support has recently been questioned (Sterling, personal conversation). However, regardless ofits validity as a model of specific retinal circuitry, the push-pull shunting network forces the conclusion that functionalbehavior of any cell cannot be qualitatively inferred by the type and distribution of the inputs it receives. This is clearlydemonstrated by the X cell simulations in this chapter: the response of a simulated X cell appears linear in spite ofnonlinear preprocessing and nonlinear membrane properties of the X cell itself.
By the same token, the nature and distribution of input cells of different types cannot be inferred by observing RGCbehavior. For example this model shows that the lack of on-off responses in X cells does not preclude—but actuallyrequires—the existence of inputs from both depolarizing and hyperpolarizing bipolar cells.
In light of these observations, I suggest that it is possible that push-pull bipolar inputs are ubiquitous in the retina,but have not been reported because their existence is functionally elusive.
Note that a constraint similar to the one found for RGCs should also apply to other visual processing stages. Forinstance, RGC output signals rely on axonal transmission (throughaction potentials) and are thus relegated to nonnegativevalues. Hence faithful spatiotemporal processing by cortical cells should require convergence of on-center and off-centerRGCs. A similar mechanism has been suggested to explain the linearity of cortical simple cell responses in spite of floornonlinearities (e.g., thresholds) in RGC output (Emerson et al., 1987). The model presented in this chapter extends thatprediction by allowing for arbitrary preprocessing nonlinearities, and by suggesting that the same mechanism may applyto other cortical cell classes.
The mechanisms presented here may be of use in modeling other parts of the nervous system. For example,Melkonian (1990) has introduced a model of chemical synaptic transmission which is almost identical to the completephotoreceptor model of Carpenter and Grossberg (1981). With this model he was able to fit data on a number ofexperimentally studied synaptic junctions. Similarly, the push-pull mechanism may exist in other neural structures thatrequire faithful processing of spatiotemporal patterns, such as auditory or somato-sensory systems. An intercellularpush-pull mechanism analogous to the one proposed here has been used as a mechanism to control reset of short termmemory in cortical models of cognitive processes (Grossberg, 1980b). An intracellular push-pull mechanism has beenused to join spatial processing and unbiased pattern learning in networks that obey shunting equations (Grossberg,1980a).
10
12.1 Relation to Other Models
The push-pull shunting network differs from other models of retinal function in several respects. Perhaps most importantis the model’s prediction that X and Y cells can be based on the same mechanism acting in distinct parameter ranges.A unified X and Y RGC model receives indirect support in the finding that sustained and transient ganglion cell types,albeit in different forms and distributions, are ubiquitous across species and across sensory modalities.
The same building blocks used here, including shunting networks and fast-slow chemical gating, have been used byOgmen and colleagues to model certain aspects of the fly visual system, such as sustained and on-off cell responses,motion detection, and directional selectivity ( Ogmen & Gagne, 1990a,b; Ogmen, 1991, 1992a). These models areremarkably similar to the present work both in spirit and in the level of analytical detail. However, their models differfrom the push-pull network in two ways: first, they formulate two distinct models for the sustained and on-off cells.Secondly, most of their results are based on interactions between two or three cells, rather than spatially extendedreceptive field mechanisms. In a more recent paper Ogmen (1992a) suggests that the sustained and on-off modelsdeveloped for the fly visual system may also be applicable to mammalian data on X and Y ganglion cells. However, thatmodel would have to be extended in order to predict the interaction between spatial and temporal processing that wasfound here, particularly in response to modulated gratings (as in the null test).
The temporal adaptation mechanism used here was chosen because of its nonlinearity, and more specifically becauseof its asymmetry in step responses to equal size luminance increments and decrements. A linear model of temporaladaptation such as that of Richter and Ullman (1983) would lead to symmetrical step responses, and would therefore beunable to generate nonlinearities in the RGC responses (for either X or Y cells) without addition of further nonlinearypreprocessing mechanisms. In fact, the Richter and Ullman (1983) model for X cells receives signals from such a linearadaptation mechanism, and accordingly generates null responses to a modulated contrast edge, in disagreement with theresults discussed in Section 10.
12.2 Conclusions and Future Directions
The model in its present form has been able to predict some fundamental aspects of RGC function, including seeminglylinear response in X cells and phase-independent frequency doubling in the Y cells. More accurate, quantitative datafits will require a more detailed photoreceptor model, and an unlumped model of bipolar cells. This is particularlyimportant for simulations that examine the spatial and temporal frequency response of the network, as the photoreceptorand bipolar cell response characteristics may be rate-limiting.
It is unclear at this time whether the transmitter gating law should be associated exclusively with photoreceptorbehavior as was done here. From a functional perspective, the temporal adaptation should occur at the first stages ofphototransduction. As indicated earlier, an enhanced version of this law has been used to model photoreceptor dynamics(Carpenter and Grossberg, 1981), and a heuristically derived law of form (8) has been implicated in the transduction oflight signals into neural activity for the vertebrate rod (Pugh and Lamb, 1990). However, the transient overshoots andundershoots observed at the bipolar, amacrine, and RGC layers may be faster and more pronounced than those foundin the photoreceptors (see Koch et al., 1987). In order to improve response time, the same type of gated transmissionlaw with overall faster dynamics could also take place at synaptic junctions in the inner and outer plexiform layers. Forexample, Ogmen and Gagne (1990a) have suggested that this type of transmitter dynamics may be found in the synapticconnection from photoreceptors to large monopolar cells in the fly.
There are still many insights to be gained from the mathematical form of the push-pull network. It is apparentthat different choices of dynamical and morphological parameters can significantly affect model behavior. I shouldpoint out that although simulated X and Y cells were made to differ only by a single parameter, this is obviously anoversimplification. For more accurate results the center and surround amplitudes (C and S), and the shunting saturationterms (B and D) should be manipulated in conjunction with the RF center and surround widths (� C and �S) to achievea desired functional behavior. The single-parameter change is meant to emphasize the ability to affect RGC function bymeans of simple parametric changes within a single formal model.
Another unique aspect of this model is that it was not originally derived to simulate RGC data, but was instead formu-lated as a means of simultaneously achieving accurate spatial and temporal processing. This represents a complementaryapproach to models that are grounded in experimental data, and often designed explicitly to reproduce retinal behaviorby joining many detailed models of each element or layer of the retina (e.g., Freed et al., 1991; Rodieck, 1965; Siminoff,1991; Sterling et al., 1987; Werblin, 1991). While the present model purports to explain the reason for adopting acertain architecture, the experimentally derived models contain very important data on many anatomical, physiological,and pharmacological properties of individual cells in the retina. Future research combining the push-pull architecture
11

and details from such experimental models will undoubtedly yield more accurate results and a clearer understanding ofretinal function.
Acknowledgments
The author wishes to express his gratitude to Drs. E. Mingolla, M. Cohen, and S. Grossberg for useful comments and suggestedrevisions of this work in its present form and earlier versions. Thanks also to the anonimous referee who reviewed these articlesfor many suggestions and for pointing out some important references related to this work. This work was partly supported by theNational Science Foundation (NSF IRI-87-16960).
References
Barlow, H.B. (1953). Summation and inhibition in the frog retina. J. Physiol. (London), 119: 69–88.
Baylor, D.A., Hodgkin, A.L. and Lamb, T.D. (1974). Reconstruction of the electrical responses of turtle cones to flashes and steps oflight. J. Physiol. (London), 242, 759–791.
Boycott, B.B. and Wassle, H. (1974). The morphological types of ganglion cells of the domestic cat’s retina. J. Physiol. (London),240: 397–419.
Carpenter, G.A. and Grossberg, S. (1981). Adaptation and trasnsmitter gating in vertebrate photoreceptors. J. Theor. Neurobiol., 1:1-42.
Cleland, B.G. and Levick, W.R. (1974). Brisk and sluggish concentrically organized ganglion cells in the cat’s retina. J. Physiol.(London), 240: 421–456.
Dowling, J.E. (1987). The retina: an approachable part of the brain. Belknap: Cambridge, USA.
Emerson, R.C. Korenberg, M.J., and Citron, M.C. (1989). Identification of intensive nonlinearities in cascade models of visual cortexand its relation to cell classification. In Marmarelis, V.Z. (Ed.) Advancedmethods of physiological systemmodeling. New York:Plenum Press.
Enroth-Cugell, C. and Robson, J.G. (1966). The contrast sensitivity of retinal ganglion cells of the cat. J. Physiol. (London), 187:517–552.
Freed, M.A., Smith, R.G., and Sterling, P. (1991). Computational model of the On-alpha ganglion cell receptive field based on bipolarcell circuitry. Submitted for publication.
Fukuda, Y., Hsiao, C.-F., Watanabe, M., and Ito, H. (1984). Morphological correlates of physiologically identified Y, X and W cellsin the cat retina. Journal of Neurophysiology, 52: 999–1013.
Gaudiano, P. (1991). Neural network models for spatio-temporal visual processing and adaptive sensory-motor control. UnpublishedDoctoral Dissertation, Boston University.
Gaudiano, P. (1992a). A Unified Neural Network Model of Spatiotemporal Processing in X and Y Retinal Ganglion Cells. I: AnalyticalResults. Submitted.
Gaudiano, P. (1992b). Toward a unified theory of spatiotemporal processing in the retina. In Carpenter, G. and Grossberg, S. (Eds.)Neural Networks for Vision and Image Processing. Cambridge, MA: MIT Press. In press.
Grossberg, S. (1968). Some physiological and biochemical consequencesof psychological postulates. Proc. Natl. Acad. Sci. USA, 60:758–765.
Grossberg, S. (1969). On the production and release of chemical transmitters and related topics in cellular control. J. Theor. Biol., 22,325–364.
Grossberg, S. (1970). Neural Pattern Discrimination. J. Theor. Biol., 27: 291–337.
Grossberg, S. (1980a). Intracellular mechanisms of adaptation and self-regulation in self-organizing networks: the role of chemicaltransducers. Bull. Math. Biol., 42: 365–396.
Grossberg, S. (1980b). How does a brain build a cognitive code? Psych. Review, 1, 1–51.
Hochstein, S. and Shapley, R.M. (1976a). Quantitative analysis of retinal ganglion cell classifications. J. Physiol. (London), 262:237–264.
Hochstein, S. and Shapley, R.M. (1976b). Linear and nonlinear spatial subunits in Y cat retinal ganglion cells. J. Physiol. (London),262: 265–284.
Koch, C., Poggio, T., and Torre, V. (1987). Computations in the vertebrate retina: gain enhancement, differentiation and motiondiscrimination. TINS, 9 (5), 204–211.
Kuffler, S.W. (1953). Discharge patterns and functional organization of the mammalian retina. J. Physiol. (London), 16: 37–68.
Melkonian, D.S. (1990). Mathematical Theory of Chemical Synaptic Transmission. Biol. Cybern., 62, 539–548.
12

McGuire, B.A., Stevens, J.K., and Sterling, P. (1986). Micorcircuitry of beta ganglion cells in cat retina. Journal of Neuroscience, 6:907–918.
Ogmen, H. (1991a). Studies of transient behavior of some neural networks as a basis for a continuous-time theory of visual perception.University of Houston Systems and Control Computing TR No. 91-01.
Ogmen, H. (1991b). On the mechanisms underlying directional selectivity. Neural Computation. In press.
Ogmen, H., and Gagne, S. (1990a). Neural models for sustained and ON-OFF units of insect lamina. Biol. Cybern., 63: 51–60.
Ogmen, H., and Gagne, S. (1990b). Neural network architectures for motion perception and elementary motion detection in the flyvisual system. Neural Networks, 3: 487–505.
Pugh, E.N. Jr, and Cobbs, W.H. (1988). Visual transduction in vertebrate rods and cones: a tale of two transmitters, calcium andcyclic GMP. Vis. Res., 26 (10): 1613–1643.
Pugh, E.N. Jr, and Lamb, T.D. (1990). Cyclic GMP and Calcium: the internal messengers of excitation and adaptation in vertebratephotoreceptors. Vis. Res., 30 (12): 1923–1948.
Richter, J. and Ullman, S. (1983). A model for the temporal organization of X- and Y-type receptive fields in the primate retina. Biol.Cybern., 43, 127–145.
Rodieck, R.W. (1965). Quantitative analysis of cat retinal ganglion cell response to visual stimuli. Vis. Res., 5, 583–601.
Rushton, W.A.H. (1958). Kinetics of cone pigments measured objectively on the living human fovea. Ann. New York Acad. Sci., 74:291–304.
Saito, H. (1983). Morphology of physiologically identified X-, Y- and W-type retinal ganglion cells of the cat. J. Compar. Neurol.,221: 279–288.
Siminoff, R. (1991). Simulated bipolar cells in fovea of human retina. Part I. Computer Simulation. Biol. Cybern., 64, 497–504.
Sperling, G. (1970). Model of visual adaptation and contrast detection. Perception & Psychophysics, 8 (3): 143–157.
Sterling, P., Freed, M., and Smith, R.G. (1987). Microcircuitry and functional architecture of the cat retina. TINS, 9 (5), 186–192.
Werblin, F. (1991). Synaptic connections, receptive fields, and patterns of activity in the tiger slamander retina. Inv. Ophth. Vis. Sci.,32 (3), 459–483.
13
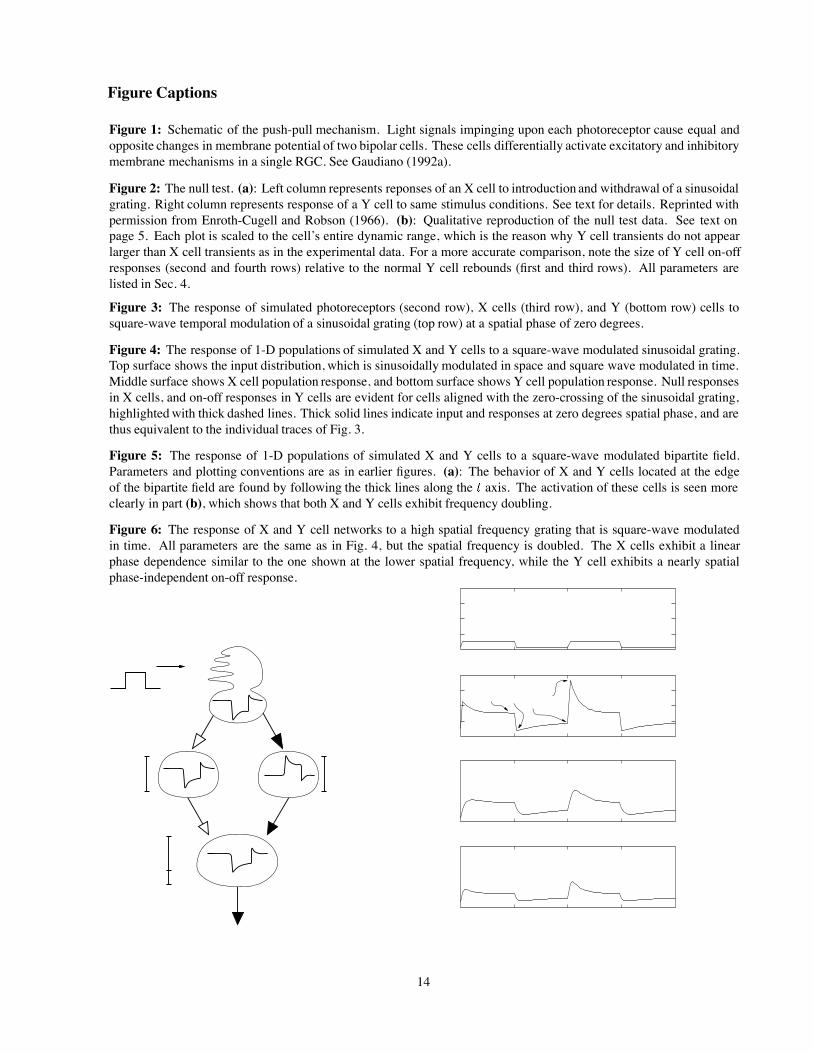
Figure Captions
Figure 1: Schematic of the push-pull mechanism. Light signals impinging upon each photoreceptor cause equal andopposite changes in membrane potential of two bipolar cells. These cells differentially activate excitatory and inhibitorymembrane mechanisms in a single RGC. See Gaudiano (1992a).
Figure 2: The null test. (a): Left column represents reponses of an X cell to introduction and withdrawal of a sinusoidalgrating. Right column represents response of a Y cell to same stimulus conditions. See text for details. Reprinted withpermission from Enroth-Cugell and Robson (1966). (b): Qualitative reproduction of the null test data. See text onpage 5. Each plot is scaled to the cell’s entire dynamic range, which is the reason why Y cell transients do not appearlarger than X cell transients as in the experimental data. For a more accurate comparison, note the size of Y cell on-offresponses (second and fourth rows) relative to the normal Y cell rebounds (first and third rows). All parameters arelisted in Sec. 4.
Figure 3: The response of simulated photoreceptors (second row), X cells (third row), and Y (bottom row) cells tosquare-wave temporal modulation of a sinusoidal grating (top row) at a spatial phase of zero degrees.
Figure 4: The response of 1-D populations of simulated X and Y cells to a square-wave modulated sinusoidal grating.Top surface shows the input distribution, which is sinusoidally modulated in space and square wave modulated in time.Middle surface shows X cell population response, and bottom surface shows Y cell population response. Null responsesin X cells, and on-off responses in Y cells are evident for cells aligned with the zero-crossing of the sinusoidal grating,highlighted with thick dashed lines. Thick solid lines indicate input and responses at zero degrees spatial phase, and arethus equivalent to the individual traces of Fig. 3.
Figure 5: The response of 1-D populations of simulated X and Y cells to a square-wave modulated bipartite field.Parameters and plotting conventions are as in earlier figures. (a): The behavior of X and Y cells located at the edgeof the bipartite field are found by following the thick lines along the t axis. The activation of these cells is seen moreclearly in part (b), which shows that both X and Y cells exhibit frequency doubling.
Figure 6: The response of X and Y cell networks to a high spatial frequency grating that is square-wave modulatedin time. All parameters are the same as in Fig. 4, but the spatial frequency is doubled. The X cells exhibit a linearphase dependence similar to the one shown at the lower spatial frequency, while the Y cell exhibits a nearly spatialphase-independent on-off response.
14
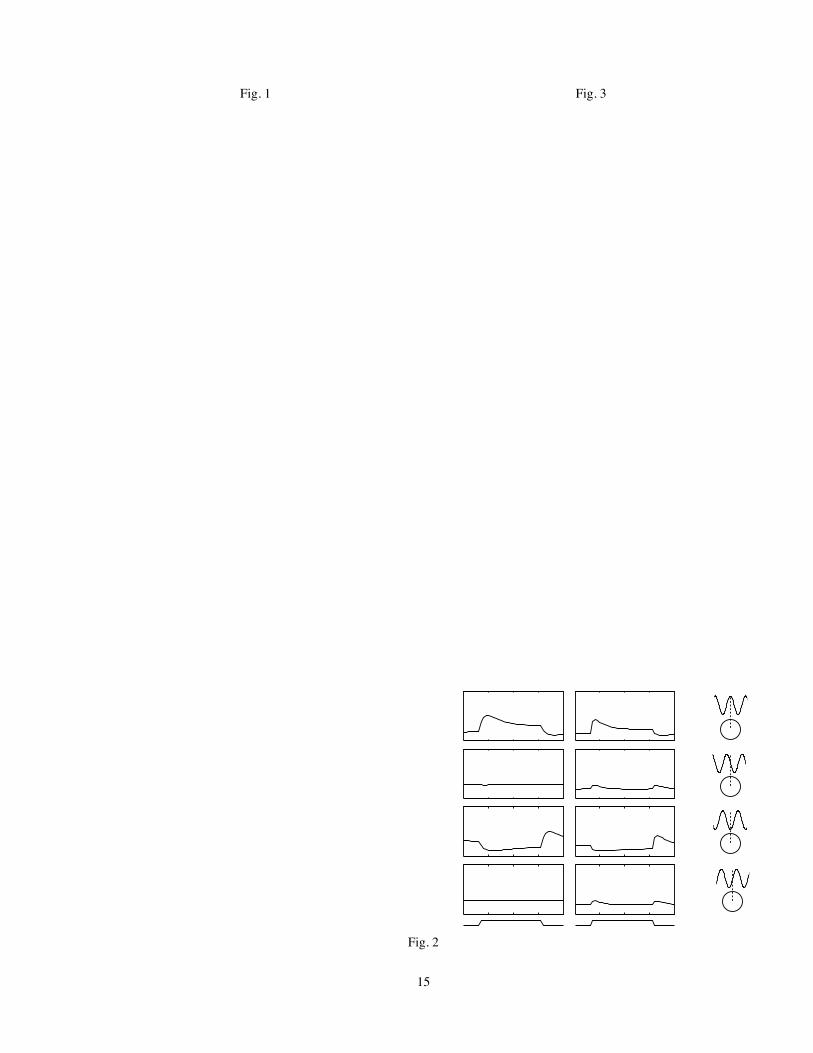
Fig. 1 Fig. 3
Fig. 2
15
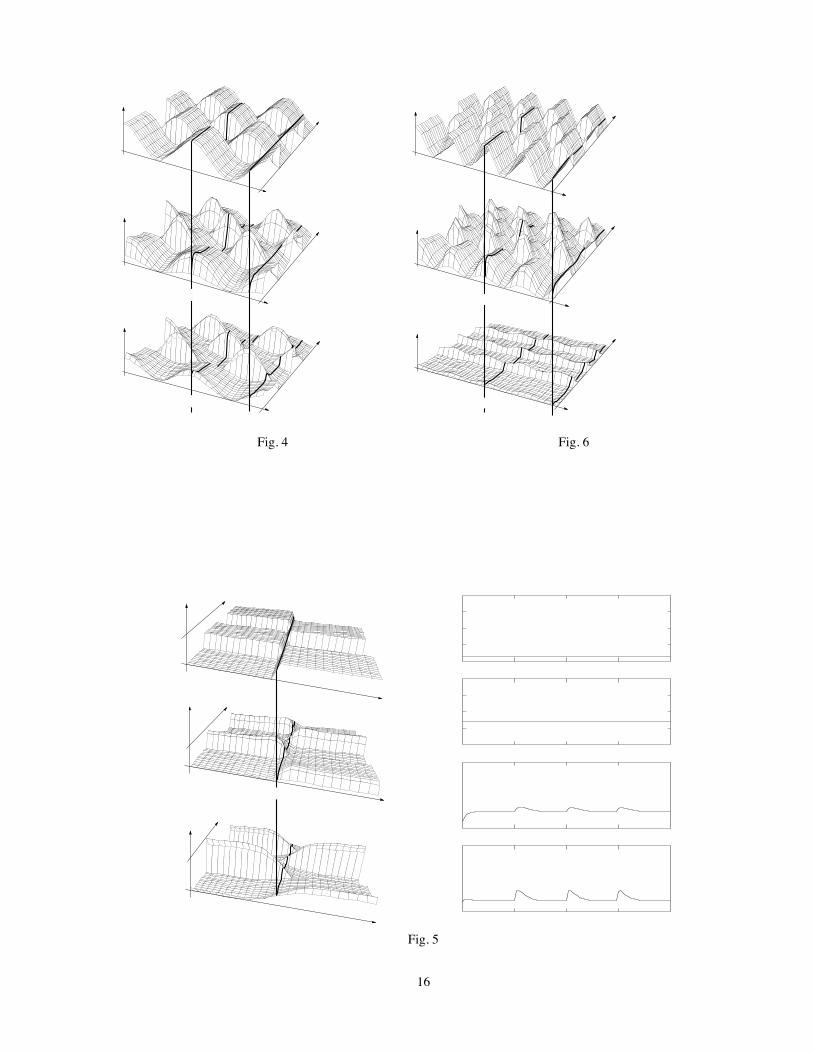
Fig. 4 Fig. 6
Fig. 5
16

Instructions for the compositor
These two manuscripts were composed with the LATEX document preparation system. An attempt was made to ensure thatall symbols are easily distinguishable, including greek letters, subscripts and superscripts, and italicized text. The onlyexception is the presence of a few uppercase script variables, which are difficult to distinguish from regular uppercasevariables in the font used. I have underlined all script letters in green, as suggested in the “Instructions to Authors.”Based on the sample fonts used in your journal I trust that there will be no confusion between the script and non-scriptletters in the finished format.
Allfigures are reproduced in final size, either 8,1 or 16,2cm wide. Marginal notes are used to indicate the approximatedesired position of the figures, and figures which should be grouped together are indicated in a single marginal note.This grouping can be modified to suit publication constraints.