
Spatio – temporal variations of urban heat island over Delhi
15
Spatio – temporal variations of urban heat island over Delhi Alok Kumar Pandey a , Sachchidanand Singh b , Shivesh Berwal a , Dinesh Kumar a , Puneeta Pandey c , Amit Prakash d , Neelesh Lodhi b , Sandeep Maithani e , Vinod Kumar Jain a , Krishan Kumar a,⇑ a School of Environmental Sciences, Jawaharlal Nehru University, New Delhi 110067, India b CSIR-National Physical Laboratory, New Delhi, India c Centre for Environmental Science & Technology, Central University of Punjab, Bathinda, Punjab, India d Department of Environmental Science, School of Science, Tezpur University, Assam, India e Indian Institute of Remote Sensing, Dehradun, Uttrakhand, India article info Article history: Received 19 November 2013 Revised 20 August 2014 Accepted 14 October 2014 Available online xxxx Keywords: UHI MODIS AOD Land-cover Thermal abstract Temporal and spatial trends of the surface urban heat island (UHI) formation over Delhi are examined with respect to aerosol load and land-cover variations. The study reveals that temperatures over Delhi are higher than those over the surrounding regions almost through-out the year during the night time. The nocturnal heat island intensity is minimum (0–2 K) during the monsoon months and maximum during the month of March (4–6 K). The UHI trends during the day-time are however, significantly different. It is observed that a day-time cool island forms over Delhi twice during the year in the months of May–June and October–December. Anal- ysis of temporal variations in urban heat island intensity (UHII) and aerosol load over Delhi reveals a significant negative correlation between UHII and aerosol optical depth (AOD). Spatial analysis of LST, land-cover and AOD for the months of March, May and November confirms the significant role of AOD along with land-cover variables such as percentage area under the classes built-up, rock, vegetation and bare soil. Comparative analysis of LST in the regions lying north, south, east and west of Delhi in relation to the prevail- ing land-cover suggests that thermal inertia is also a very important factor determining the urban-rural thermal structure. Ó 2014 Elsevier B.V. All rights reserved. http://dx.doi.org/10.1016/j.uclim.2014.10.005 2212-0955/Ó 2014 Elsevier B.V. All rights reserved. ⇑ Corresponding author. Tel.: +91 011 26704163. E-mail address: [email protected] (K. Kumar). Urban Climate xxx (2014) xxx–xxx Contents lists available at ScienceDirect Urban Climate journal homepage: www.elsevier.com/locate/uclim Please cite this article in press as: Pandey, A.K., et al. Spatio – temporal variations of urban heat island over Delhi. Urban Climate (2014), http://dx.doi.org/10.1016/j.uclim.2014.10.005
-
Upload
independent -
Category
Documents
-
view
2 -
download
0
Transcript of Spatio – temporal variations of urban heat island over Delhi
Urban Climate xxx (2014) xxx–xxx
Contents lists available at ScienceDirect
Urban Climate
journal homepage: www.elsevier.com/locate/ucl im
Spatio – temporal variations of urban heat islandover Delhi
http://dx.doi.org/10.1016/j.uclim.2014.10.0052212-0955/� 2014 Elsevier B.V. All rights reserved.
⇑ Corresponding author. Tel.: +91 011 26704163.E-mail address: [email protected] (K. Kumar).
Please cite this article in press as: Pandey, A.K., et al. Spatio – temporal variations of urban heat island oveUrban Climate (2014), http://dx.doi.org/10.1016/j.uclim.2014.10.005
Alok Kumar Pandey a, Sachchidanand Singh b, Shivesh Berwal a,Dinesh Kumar a, Puneeta Pandey c, Amit Prakash d, Neelesh Lodhi b,Sandeep Maithani e, Vinod Kumar Jain a, Krishan Kumar a,⇑a School of Environmental Sciences, Jawaharlal Nehru University, New Delhi 110067, Indiab CSIR-National Physical Laboratory, New Delhi, Indiac Centre for Environmental Science & Technology, Central University of Punjab, Bathinda, Punjab, Indiad Department of Environmental Science, School of Science, Tezpur University, Assam, Indiae Indian Institute of Remote Sensing, Dehradun, Uttrakhand, India
a r t i c l e i n f o a b s t r a c t
Article history:Received 19 November 2013Revised 20 August 2014Accepted 14 October 2014Available online xxxx
Keywords:UHIMODISAODLand-coverThermal
Temporal and spatial trends of the surface urban heat island (UHI)formation over Delhi are examined with respect to aerosol load andland-cover variations. The study reveals that temperatures overDelhi are higher than those over the surrounding regions almostthrough-out the year during the night time. The nocturnal heatisland intensity is minimum (0–2 K) during the monsoon monthsand maximum during the month of March (4–6 K). The UHI trendsduring the day-time are however, significantly different. It isobserved that a day-time cool island forms over Delhi twice duringthe year in the months of May–June and October–December. Anal-ysis of temporal variations in urban heat island intensity (UHII) andaerosol load over Delhi reveals a significant negative correlationbetween UHII and aerosol optical depth (AOD). Spatial analysis ofLST, land-cover and AOD for the months of March, May andNovember confirms the significant role of AOD along with land-covervariables such as percentage area under the classes built-up, rock,vegetation and bare soil. Comparative analysis of LST in the regionslying north, south, east and west of Delhi in relation to the prevail-ing land-cover suggests that thermal inertia is also a very importantfactor determining the urban-rural thermal structure.
� 2014 Elsevier B.V. All rights reserved.
r Delhi.
1. Introduction
2 A.K. Pandey et al. / Urban Climate xxx (2014) xxx–xxx
Urbanization brings about significant changes in the land-cover and land-use of a place. Thesechanges include replacement of soil and vegetation cover by concrete/asphalt surfaces, low rise ruralstructures being replaced by high-rise complex urban structures and predominantly agriculturalactivities in the rural areas being replaced by large-scale commercial and industrial activities inthe urban areas. This often results in reduced soil moisture, decreased evapo-transpiration, lowsky-view factors (SVF) (Oke, 1981; Svensson, 2004) and emission of large quantities of waste heatin the urban atmosphere. These changes influence the local energy budget significantly (Oke,1981; Arnfield, 1982), thus causing a modification in the local climate. Formation of urban heatisland (UHI) is one of the most obvious manifestations of these changes. Traditionally, UHI’s havebeen studied by evaluating urban and rural temperature differences obtained from ground basedmeasurements of air temperature (e.g. Oke and Maxwell, 1975; Morris, 2001; Gaffin et al., 2008;Saaroni and Ziv, 2010; Shao et al., 2011; Oswald et al., 2012). Though observations from groundbased stations are generally accurate and reliable, these are not sufficiently representative of thelarge variety of land surfaces, especially in regions where network of ground based stations is stillsparse. Thermal remote sensing is an alternative approach which overcomes this limitation. Satellitebased sensors that make use of thermal band data, provide information on land surface temperature(LST) for vast areas, enabling researchers to study the spatio-temporal trends in the formation ofSurface Urban Heat Island (e.g. Roth and Oke, 1989; Gallo et al., 1993; Owen et al., 1998;Nichole, 2005; Buyantuyev and Wu, 2010; Schwarz et al., 2011). A comprehensive discussion onthe application of thermal remote sensing in studying urban climate may be found in Voogt andOke (2003).
Due to their relevance in regional climate, human comfort/health and urban air quality, UHI’shave been studied extensively worldwide over the last few decades viz. Kuwait City (Nasrallah,1990), Johannesburg (Goldreich, 1992), Mexico City (Jauregui, 1997), Houston (Streutker, 2002),Phoenix (Hawkins et al., 2004), Singapore (Chow and Roth, 2006), Brussels (Weverberg et al.,2008), London (Jones and Lister, 2009; Bohnenstengel et al., 2011) and Shanghai (Jin et al.,2011). In the Indian context, research on the UHI formation has picked up momentum only duringthe last decade (Deosthali, 2000; Badarinath et al., 2005; Mallick et al., 2008; Pandey et al., 2012).A thorough discussion on the UHI research during the 1980s and 1990s in different parts of theworld, may be found in Arnfield (2003). However, most of the studies on UHI pertain to examin-ing the magnitude of UHI with respect to surface/land-cover parameters. Very few studies till datehave examined the role of aerosols in UHI formation. Regional studies (Kaiser and Qian, 2002;Ramanathan et al., 2005) suggest that aerosols could cause surface cooling due to dimming ofincoming solar radiation. Wang et al. (2007) argue that human activity in urban areas tends toput more aerosols in the atmosphere and report 23 W/m2 less surface solar shortwave radiationreceived in Beijing during September, 2001 as compared to the rural areas. They, however, suggestthat reduced surface albedo over urban areas results in nearly equal surface net solar radiation.But, Jin et al. (2010) report that aerosols may reduce surface insolation by 40–100 W/m2 and skintemperatures over urban areas by 1–2 K as compared to surrounding rural areas. Pandey et al.(2012) also report a reduction in the intensity of surface solar radiation over Delhi as comparedto rural areas and the formation of day time ‘cool island’ over Delhi during the months ofNovember and December. Traditionally however, the formation of day time urban cool islandshas been attributed to the large thermal inertia of urban materials and shadow effect(Carnahan and Larson, 1990; Hafner and Kidder, 1999; Nichole, 2005; Peña, 2008; Cai et al.,2008). The present study investigates the decade long temporal trends of monthly day and nighttime surface UHII obtained from MODIS satellite data in the context of Delhi along with thetrends obtained from decade long sun-photometer based measurements of AOD to examine therole of AOD and land-cover variations in the surface thermal structure over Delhi and surroundingareas in different seasons.
Please cite this article in press as: Pandey, A.K., et al. Spatio – temporal variations of urban heat island over Delhi.Urban Climate (2014), http://dx.doi.org/10.1016/j.uclim.2014.10.005

A.K. Pandey et al. / Urban Climate xxx (2014) xxx–xxx 3
2. Methodology and data description
2.1. Estimation of Urban Heat Island Intensity (UHII)
For the estimation of UHII, average monthly daytime and night time land surface temperatures overrectangular strips outside Delhi and over the central regions of Delhi (Fig. 1) were extracted for the per-iod March 2000 to November 2012 from the MODIS-TERRA monthly land surface temperature productMOD11C3.005 at 5.6 km resolution using the GIOVANNI tool of NASA. This is a monthly compositedaverage product derived from the MOD11C1 daily global product (https://lpdaac.usgs.gov/products/modis_products_table /mod11c3) and is developed by Monsoon Asia Integrated Regional Study MAIRSproject at NASA GES DISC (http://disc.sci.gsfc.nasa.gov/gesNews/modis_high_res_global_products). Toestimate the UHII, average temperature in the strip outside Delhi was subtracted from the average tem-perature of the strip located over the central regions of Delhi.
2.2. AOD measurements
The AOD measurements were made at a central Delhi site – the National Physical Laboratory(28.6�N, 77.3�E, 238 m amsl) for the period December 2001 to February 2011 using a pair of hand heldMicrotops II Sun-photometers in the wavelength range 340–1020 nm. As the AOD at 500 nm and1020 nm are more sensitive to the fine mode and coarse mode aerosols respectively (Eck et al.,2010), we have used AOD at these two wavelengths in the present study. Both the sun-photometerswere calibrated periodically (once in a year) alternately to maintain the quality of data. All calibrationswere done by sending the instruments to Mauna Loa where it was calibrated using Langley techniqueby the manufacturer, Solar Light Company Inc., USA to the NIST (National Institute of Standards andTechnology) traceable standards. The consistency and precision of the two Microtops data werechecked time to time by inter-comparison. The Microtops observations were made during the clearsky periods to avoid cloud contamination. The maximum uncertainty in the optical depth estimationsin each channel was � ±0.02. The data was taken at half an hour intervals during the day time (about
Fig. 1. Schematic diagram showing regions selected in Delhi and outside for the estimation of heat island intensity.
Please cite this article in press as: Pandey, A.K., et al. Spatio – temporal variations of urban heat island over Delhi.Urban Climate (2014), http://dx.doi.org/10.1016/j.uclim.2014.10.005

4 A.K. Pandey et al. / Urban Climate xxx (2014) xxx–xxx
09:00–16:00 h) with a minimum of three consecutive observations at a time (within a short span<20 s). Out of these three successive observations, the one with minimum AOD at 500 nm and1020 nm respectively was used for further analysis, in order to ensure better pointing of Microtopstowards the sun, as the minimum AOD will correspond to maximum pointing accuracy. The dailyaverage values were calculated only for those days which had at least six observations during theday. The monthly average was obtained with a minimum of ten days of average daily values. Furtherdetails about the measurements may be found in Singh et al., 2010 and Lodhi et al., 2013. The monthlyaverage values of AOD obtained from Microtops were compared with the monthly average day - timeUHI intensity obtained from MODIS data (Section 2.1).
2.3. LISS III data for land-cover classification
To investigate the interaction between surface temperature and land-cover, temporal remote sens-ing data acquired by LISS III sensor (spatial resolution: 23.5 m, operating in four bands, i.e., green:0.52–0.59 nm, red: 0.62–0.68 nm, near infrared: 0.77–0.86 nm, shortwave infrared: 1.55–1.77 nm)onboard Indian Remote Sensing (IRS) satellite was used. Initially satellite data for seven different dateswas procured from National Remote Sensing Centre, Hyderabad. However, out of these seven imager-ies, three imageries acquired on, March 11 2010, May 22, 2010 and November 30, 2010 were used forgeneration of land-cover maps, due to their better quality. The months of March, May and Novemberrepresent the spring, summer and post-monsoon seasons respectively. The entire area of Delhi and itssurrounding regions was classified into five broad land-cover classes namely, built-up area, vegeta-tion, bare soil, rock and water bodies. Land-cover maps of Delhi were prepared by classifying theimages using a supervised classification algorithm namely, maximum likelihood classifier (MLC). Thisclassifier is based on the decision rule that the pixels of unknown class membership are allocated tothose classes with which they have the highest likelihood of membership (Jensen, 1986). The detailedformulation of this classifier may be found in Mather (1999). A grid with a grid cell of 5 km � 5 kmcomprising of 400 grid cells was overlaid on the classified images and percentage land-cover belong-ing to different classes in each grid cell was computed. The percentage land-cover so obtained wastaken as representative of Delhi’s land-cover during that season.
2.4. Thermal and AOD mapping with MODIS data
For the purpose of investigating the relationship between surface temperature, AOD and land-coverover Delhi, MODIS satellite data was procured from the MODIS website maintained by Goddard SpaceFlight Center, NASA, USA to obtain day and night time thermal maps of the study region. The details ofsatellite data products for land cover, surface temperature and AOD are given in Table 1. It is pertinenthere to mention that attempt was made to procure the MODIS thermal and AOD data for the dateswhich were as close as possible to the dates for which LISS III data for land-cover was obtained. Whileit was possible to obtain MODIS data for dates lying close to November 30, 2010 and March 11, 2010,MODIS data corresponding to LISSIII data of May 22, 2010 could only be obtained for June 19, 2010 asthe AOD data for Delhi was missing in the intervening period from April 15, 2010 to June18, 2010. Thesurface temperatures and AOD corresponding to each of the 400 grid cells were extracted from thethermal and AOD maps in ArcGIS for further statistical analysis. Correlation analysis and stepwisemultiple linear regression analysis were performed with the spatial data on surface temperatures,AOD and percentage land cover using SPSS software.
2.5. Meteorological data
Data on surface wind speed and cloud cover over Delhi was obtained from the website www.wun-derground.com. This website provides weather data collected directly from weather stations locatedat airports in various countries. These stations are owned by government agencies and internationalairports (Weather Underground, ‘‘About our Data,’’ http://www.wunderground.com/about/data.asp).For Delhi, this data is available from two airports viz. Indira Gandhi International Airport at Palam(28.57�N, 77.12�E) and the Safdarjung Airport (28.58�N 77.2�E). Weather stations at both these
Please cite this article in press as: Pandey, A.K., et al. Spatio – temporal variations of urban heat island over Delhi.Urban Climate (2014), http://dx.doi.org/10.1016/j.uclim.2014.10.005

Table 1MODIS thermal, AOD and LISS-III data description (for spatial analysis).
Sensor LISS III (IRS) MODIS (Terra)
AOD LST day LST night
Product information MOD04_L2(daily product)
MOD07_L2(daily product)
MOD07_L2(daily product)
Spatial resolution 23.5 ⁄ 23.5 meter 10 ⁄ 10 km (at nadir) 5 ⁄ 5 km (at nadir) 5 ⁄ 5 km (at nadir)Date of images
(i) 11 March 2010 11 March 2010 11 March 2010 11 March 2010(ii) 22 May 2010 19 June 2010 19 June 2010 19 June 2010(iii) 30 November 2010 28 November 2010 28 November 2010 28 November 2010
A.K. Pandey et al. / Urban Climate xxx (2014) xxx–xxx 5
airports are part of the WMO World Weather Information Service and observations at both thesestations are taken using standards techniques and practices as laid out by WMO (Mohan and Bhati,2011). The monthly average rainfall data was obtained from the India Meteorological Department.Fig. 2 shows the monthly average plot of wind-speed, cloud-cover and rainfall during the period2001–2012. It may be noted that wind-speed in Delhi is high during the summer months and is theminimum during the post-monsoon month of November. Further, it is seen that cloud-cover andrainfall attain peak values during the monsoon months of July and August.
2.6. NDVI data
Monthly average Normalized Difference Vegetation Index (NDVI) of the strips located north, south,east and west of Delhi (as shown in Fig. 1) was extracted from the MODIS product MOD13C2.005(5.6 km spatial resolution) for the months of March, May and November, 2010, using the GIOVANNItool of NASA. This is derived from the composites of the gridded 16-day 1-kilometer MOD13A2 prod-uct (https://lpdaac.usgs.gov/products/ modis_ products_table/mod13c2) and is developed by Mon-soon Asia Integrated Regional Study MAIRS project at NASA GES DISC (http://disc.sci.gsfc.nasa.gov/gesNews/ modis_high _res_global_products).
Fig. 2. Average monthly variation of wind-speed, cloud-cover and rainfall over Delhi for the period 2001–2012.
Please cite this article in press as: Pandey, A.K., et al. Spatio – temporal variations of urban heat island over Delhi.Urban Climate (2014), http://dx.doi.org/10.1016/j.uclim.2014.10.005

6 A.K. Pandey et al. / Urban Climate xxx (2014) xxx–xxx
3. Results and discussion
To investigate the UHI dynamics over Delhi, this study comprises of two types of analysis –temporal and spatial. The temporal analysis examines the monthly variations in UHII in terms ofvariations in AOD, cloud cover and wind speed on the basis of decade long data. The spatial analysisexamines the variations in LST in relation to the variations in AOD and percentage land cover in a gridover Delhi and its surrounding region comprising of 400 grid cells (each of 5 km � 5 km).
3.1. Temporal analysis
Fig. 3a shows the variation in average monthly surface UHII over Delhi during night-time for theduration March 2000–November 2012. It may be seen that the nocturnal UHII remains positivethroughout the year though there are clear periodic variations that may be observed in the plot. Itis seen that the nocturnal UHII is the maximum (4–6 K) during the month of March every year andthe minimum (0–2 K) during the monsoon months of July–August. The minimum nocturnal UHIIoccurs during the monsoon months mainly because of the cloudy skies prevalent during the rainyseason which suppress the sky-view factor driven urban-rural differences in the radiation loss
Fig. 3. Monthly variation of surface heat island intensity over Delhi for the period March 2000–November 2012 showing (a)positive night-time UHII and (b) positive and negative daytime UHII.
Please cite this article in press as: Pandey, A.K., et al. Spatio – temporal variations of urban heat island over Delhi.Urban Climate (2014), http://dx.doi.org/10.1016/j.uclim.2014.10.005

A.K. Pandey et al. / Urban Climate xxx (2014) xxx–xxx 7
efficiencies. This is confirmed from Fig. 4 which represents the scatter plot between nocturnal UHIIand average monthly cloud cover. It is seen that a significant negative relationship (correlationcoefficient �0.677) exists between cloud cover and nocturnal UHII. Further, a comparatively weaknegative correlation coefficient (�0.216), though statistically significant (p-value 0.013), is found toexist between nocturnal UHII and wind speed. The nocturnal UHII is maximum during the monthof March because the aerosol optical depth over the Delhi-NCR region is low around this time ofthe year (Fig. 5) and the sky is clear. As a result, the radiation loss from open rural areas with highSVF around Delhi is very efficient but the radiation loss from the urban built-up areas with low SVFdoes not occur as efficiently. The seasonal variations in the nocturnal UHI in this study are found tobe similar to those for Mexico City by Cui and Foy (2012), who report maximum values of night-timeUHII during the dry season and minimum values for the wet season.
Similar periodic behaviour is also observed in the UHII during the day-time (Fig. 3b). However, it isseen that UHII does not remain positive throughout the year. While the daytime UHII is found to bepositive and maximum (2–4 K) in the months of February and March, the situation is reversed inthe months of May–June (UHII� �4 to �6 K) and October to December (UHII� �1 to �3 K). Thismeans that temperatures over the central parts of Delhi during day-time are lower than those overthe surrounding rural areas and a so called day-time ‘‘urban cool island’’ (Alonso et al., 2003; Erelland Williamson, 2007; Miao et al., 2009; Mendonca, 2009) forms over Delhi during these months.Cui and Foy (2012) also report for Mexico City, a strong seasonal signal in day-time UHII with negativevalues during the dry season and peak values during the wet season. In comparison, day-time UHII inthis study is found to be low during the wet monsoon season.
Though the spatiotemporal trends in the formation of UHI/UCI are governed mainly by the varia-tions in landuse/land-cover and soil moisture, the aerosol load appears to be playing a significant rolein the context of Delhi. In a recent study, Pandey et al. (2012) report a significant reduction (55–80W/m2) in the solar spectral irradiance over Delhi as compared to the rural site in the months of Novemberand December. A comparative examination of the monthly average plots (Fig. 5) of UHII withAOD500nm and AOD1020nm measured from sun-photometer reveals the presence of a strong negativecorrelation between UHII and AOD. It is seen that UHII attains negative values during the months
Fig. 4. Scatter plot between nocturnal UHII and average monthly cloud cover.
Please cite this article in press as: Pandey, A.K., et al. Spatio – temporal variations of urban heat island over Delhi.Urban Climate (2014), http://dx.doi.org/10.1016/j.uclim.2014.10.005

Fig. 5. Monthly average plot of UHI intensity with AOD500nm and AOD1020nm.
8 A.K. Pandey et al. / Urban Climate xxx (2014) xxx–xxx
when aerosol load over Delhi is high i.e. during summer and post monsoon. While the peak aerosolload during the summer months occurs both due to fine mode aerosols from anthropogenic localsources and the coarse mode dust particles, the peak during the post monsoon season occurs mainlydue to fine mode aerosols from local anthropogenic sources (Lodhi et al., 2013). By studying the longterm climatology of AOD and concentration weighted back trajectory analysis over Delhi, Lodhi et al.(2013) have shown that dust storms during the pre-monsoon summer months bring large amount ofdust aerosols at Delhi from the Thar desert of Rajasthan and other Southwest Asian arid regions. Thepeak in the post-monsoon season occurs mainly due to the low wind (Fig. 2) and stable meteorologicalconditions prevailing during this period, which cause accumulation of fine particulate matter from thelocal anthropogenic sources in the ambient atmosphere (Pandey et al., 2012; Bano et al., 2011). To fur-ther examine the role of aerosols in UHI formation, monthly average AOD difference and UHII wereobtained from MODIS 1� � 1� data for the period January 2001 and December 2011, and a significantnegative correlation of -0.33 was obtained between the two after removing the outliers. Thus, when-ever the AOD difference is higher, UHII tends to be negative. This indicates towards a significant roleplayed by aerosols in the urban climate of Delhi. In this context, Jin et al. (2010) have also reportedthat urban aerosols may cause reduction in surface temperatures by reducing the surface insolation.Other studies reporting the formation of day-time UCI suggest the role of thermal inertia (Hafner andKidder, 1999) and shadows on the lee-side of tall buildings (Alonso et al., 2003; Nichole, 2005).
3.2. Spatial analysis
3.2.1. Variations in land coverTo gain more insight in the UHI formation over Delhi, LISS-III data for Delhi at three different dates
of the year was used to prepare land cover maps (Figs. 6–8a) for the months March, May and Novem-ber. The maps reveal that most of the surrounding areas of Delhi are covered with vegetation (agricul-tural crops) in the month of March. By the month of May, crops are cut from most of the regionsurrounding Delhi and the land cover in the surrounding areas changes to bare soil except in theregion lying north-east of Delhi (Fig. 7a) which is a major sugarcane growing area in the floodplainsof Yamuna and Hindon rivers and is relatively high in soil moisture content. November is the
Please cite this article in press as: Pandey, A.K., et al. Spatio – temporal variations of urban heat island over Delhi.Urban Climate (2014), http://dx.doi.org/10.1016/j.uclim.2014.10.005

Fig. 6. (a) LISS-III Land cover map of Delhi and surrounding regions for March 11, 2010; (b and c) MODIS Day and night-timesurface temperatures for March 11, 2010 and (d) MODIS Aerosol optical depth for March 11, 2010.
A.K. Pandey et al. / Urban Climate xxx (2014) xxx–xxx 9
transition month for agriculture the region as Kharif crop is cut by October end and new Rabi crop issown during November. Except the region lying north-east of Delhi, the other surrounding areas havea relatively dispersed vegetation cover/bare soil (Fig. 8a) depending upon the age of the newly sowncrop.
3.2.2. Variations in land surface temperature (LST)Figs. 6–8b and c show the day and night time variations in LST over Delhi and its surrounding
regions in 2010 during the months of March, May and November. The day-time maps (Figs. 6–8b)show that Delhi is warmer than the surrounding region during March but is cooler in the monthsof May and November. The phenomenon of day-time cooling over urban areas has been witnessedin other cities as well. Georgescu et al. (2011) report that day-time cooling over Phoenix occurs pri-marily because of the soil moisture and land cover conditions existing in the surrounding areas ratherthan the ‘oasis effect’ due to irrigation of urban landscapes such as parks. Sobrino et al. (2013) ascribethis negative UHI for the city of Madrid to slow uptake of heat by the city and large shaded areas fromthe tall buildings. Cui and Foy (2012) argue in the context of Mexico city that urban cool island formswhen rural areas witness preferentially dry conditions. They also suggest that vegetation fractionplays an important role in UHI formation. Quantitative spatial information for Delhi on soil moisture,sensible heat flux and the latent heat flux would have been very useful for understanding this phe-nomenon. However, in the absence of that, we have used percentage vegetation cover as a proxyfor soil moisture. It is pertinent here to mention that agriculture is the major land use pattern in
Please cite this article in press as: Pandey, A.K., et al. Spatio – temporal variations of urban heat island over Delhi.Urban Climate (2014), http://dx.doi.org/10.1016/j.uclim.2014.10.005

Fig. 7. (a) LISS-III Land cover map of Delhi and surrounding regions for May 22, 2010; (b and c) MODIS Day and night-timesurface temperatures for June 19, 2010 and (d) MODIS Aerosol optical depth for June 19, 2010.
10 A.K. Pandey et al. / Urban Climate xxx (2014) xxx–xxx
the rural areas surrounding Delhi and the presence of crops in this region suggests enhanced soilmoisture due to irrigation. Table 2 shows the UHII and NDVI values with reference to the strips inthe surrounding region lying north, east, south and west of Delhi as obtained from the MODIS datausing the GIOVANNI tool of NASA. Chen et al. (2003) report that NDVI > 0.5 represents fully vegetatedpixels, NDVI between 0.2 and 0.5 represent mixed pixels and NDVI between 0 and 0.2 represent baresoil pixels. Thus, NDVI > 0.5 for the month of March indicates that Delhi is surrounded on all sides byvegetation. Due to the fact that thermal inertia of vegetation is greater than the built-up area(Carnahan and Larson, 1990; Sobrino and Kharraz, 1999), urban area of Delhi gets heated faster duringthe day-time in March and hence is warmer. But the situation reverses in the month of May when thevegetation cover in the regions surrounding Delhi declines significantly (NDVI < 0.3) and conditionsare extremely dry. Bare soil, having a lower thermal inertia than the built up area, warms up muchfaster during the day-time, leading to the formation of cool island over Delhi. The day-time situationin November cannot be explained with certainty on the basis of vegetation cover as NDVI values in thesurrounding regions are not very low. As the statistical analysis in the subsequent section shows, AODseems to be playing an important role in the month of November.
The night-time maps (Figs. 6–8c) show that Delhi is warmer than the surrounding regions in all thethree months. Low sky-view factors in the urban areas make the energy loss mechanism during thenight inefficient as compared to surrounding rural areas where the sky-view factor is high (Oke,1981; Svensson, 2004). This seems to be the major reason for the formation of urban heat island overDelhi during the night.
Please cite this article in press as: Pandey, A.K., et al. Spatio – temporal variations of urban heat island over Delhi.Urban Climate (2014), http://dx.doi.org/10.1016/j.uclim.2014.10.005

Fig. 8. (a) LISS-III Land cover map of Delhi and surrounding regions for November 30, 2010; (b and c) – MODIS Day and night-time surface temperatures for November 28, 2010 and (d) MODIS Aerosol optical depth for November 28, 2010.
Table 2UHII and NDVI values in 2010 for the months of March, May and November.
UHII (K) with reference to surrounding regions lying Average NDVI in the surrounding regions lying
North East South West North East South West
March 4.15 3.04 0.87 1.69 0.64 0.55 0.57 0.65May �3.64 �3.52 �6.50 �7.72 0.24 0.23 0.19 0.18November �1.10 �1.13 �2.26 �2.07 0.45 0.39 0.33 0.35
A.K. Pandey et al. / Urban Climate xxx (2014) xxx–xxx 11
3.2.3. Variations in AODFigs. 6–8d reveal that aerosol load over Delhi is higher than that over the surrounding regions on
June 19 and November 28 in 2010. Further, it may be noted that AOD levels over Delhi are greater inJune and November as compared to those in March. This is in confirmation with the trends obtainedfrom AOD measurements with sunphotometer.
3.2.4. Results of statistical analysisCorrelation among the day-time LST, night-time LST, percentage land cover variables and AOD
based on the data for 400 grid cells, is presented in Tables 3–5. It is observed that percentage coverof bare soil is positively correlated with day time LST in all the three months i.e. March, June andNovember. On the contrary, vegetation cover is found to be negatively correlated with day-time LST
Please cite this article in press as: Pandey, A.K., et al. Spatio – temporal variations of urban heat island over Delhi.Urban Climate (2014), http://dx.doi.org/10.1016/j.uclim.2014.10.005
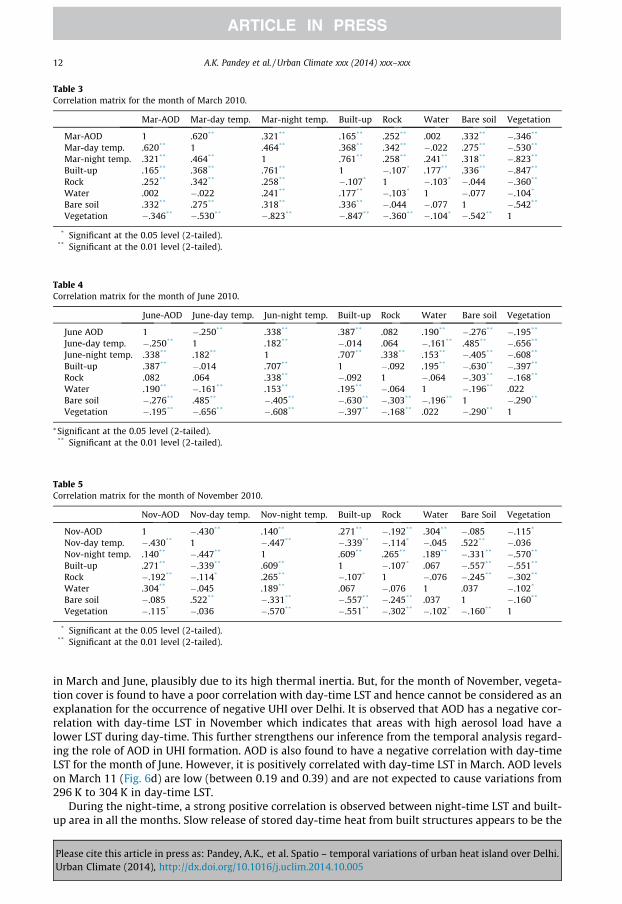
Table 3Correlation matrix for the month of March 2010.
Mar-AOD Mar-day temp. Mar-night temp. Built-up Rock Water Bare soil Vegetation
Mar-AOD 1 .620** .321** .165** .252** .002 .332** �.346**
Mar-day temp. .620** 1 .464** .368** .342** �.022 .275** �.530**
Mar-night temp. .321** .464** 1 .761** .258** .241** .318** �.823**
Built-up .165** .368** .761** 1 �.107* .177** .336** �.847**
Rock .252** .342** .258** �.107* 1 �.103* �.044 �.360**
Water .002 �.022 .241** .177** �.103* 1 �.077 �.104*
Bare soil .332** .275** .318** .336** �.044 �.077 1 �.542**
Vegetation �.346** �.530** �.823** �.847** �.360** �.104* �.542** 1
* Significant at the 0.05 level (2-tailed).** Significant at the 0.01 level (2-tailed).
Table 4Correlation matrix for the month of June 2010.
June-AOD June-day temp. Jun-night temp. Built-up Rock Water Bare soil Vegetation
June AOD 1 �.250** .338** .387** .082 .190** �.276** �.195**
June-day temp. �.250** 1 .182** �.014 .064 �.161** .485** �.656**
June-night temp. .338** .182** 1 .707** .338** .153** �.405** �.608**
Built-up .387** �.014 .707** 1 �.092 .195** �.630** �.397**
Rock .082 .064 .338** �.092 1 �.064 �.303** �.168**
Water .190** �.161** .153** .195** �.064 1 �.196** .022Bare soil �.276** .485** �.405** �.630** �.303** �.196** 1 �.290**
Vegetation �.195** �.656** �.608** �.397** �.168** .022 �.290** 1
⁄Significant at the 0.05 level (2-tailed).** Significant at the 0.01 level (2-tailed).
Table 5Correlation matrix for the month of November 2010.
Nov-AOD Nov-day temp. Nov-night temp. Built-up Rock Water Bare Soil Vegetation
Nov-AOD 1 �.430** .140** .271** �.192** .304** �.085 �.115*
Nov-day temp. �.430** 1 �.447** �.339** �.114* �.045 .522** �.036Nov-night temp. .140** �.447** 1 .609** .265** .189** �.331** �.570**
Built-up .271** �.339** .609** 1 �.107* .067 �.557** �.551**
Rock �.192** �.114* .265** �.107* 1 �.076 �.245** �.302**
Water .304** �.045 .189** .067 �.076 1 .037 �.102*
Bare soil �.085 .522** �.331** �.557** �.245** .037 1 �.160**
Vegetation �.115* �.036 �.570** �.551** �.302** �.102* �.160** 1
* Significant at the 0.05 level (2-tailed).** Significant at the 0.01 level (2-tailed).
12 A.K. Pandey et al. / Urban Climate xxx (2014) xxx–xxx
in March and June, plausibly due to its high thermal inertia. But, for the month of November, vegeta-tion cover is found to have a poor correlation with day-time LST and hence cannot be considered as anexplanation for the occurrence of negative UHI over Delhi. It is observed that AOD has a negative cor-relation with day-time LST in November which indicates that areas with high aerosol load have alower LST during day-time. This further strengthens our inference from the temporal analysis regard-ing the role of AOD in UHI formation. AOD is also found to have a negative correlation with day-timeLST for the month of June. However, it is positively correlated with day-time LST in March. AOD levelson March 11 (Fig. 6d) are low (between 0.19 and 0.39) and are not expected to cause variations from296 K to 304 K in day-time LST.
During the night-time, a strong positive correlation is observed between night-time LST and built-up area in all the months. Slow release of stored day-time heat from built structures appears to be the
Please cite this article in press as: Pandey, A.K., et al. Spatio – temporal variations of urban heat island over Delhi.Urban Climate (2014), http://dx.doi.org/10.1016/j.uclim.2014.10.005

Table 6Results of regression analysis.
S.no.
Model description Dependentvariables
Explanatoryvariables
B Std.error
t Value Sig.level
AdjustedR2
1 Regression model forNovember night temp.
Nov nighttemp.
Constant 283.765 .175 1619.775 .000 0.523Built-up .028 .002 11.967 .000Rock .025 .004 7.191 .000Water .237 .053 4.469 .000Vegetation �.011 .003 �3.789 .000
2 Regression model forNovember day temp.
Nov daytemp.
Constant 299.368 .245 1220.446 .000 0.419Bare soil .039 .003 12.705 .000AOD �5.774 .572 �10.098 .000
3 Regression model for Marchnight temp.
March nighttemp.
Constant 288.158 .510 565.238 .000 0.726Vegetation �.043 .004 �11.918 .000Water .222 .047 4.681 .000Bare Soil �.030 .007 �4.487 .000AOD 3.627 1.119 3.242 .001Built-up .013 .004 3.145 .002
4 Regression model for Marchday temp.
March daytemp.
Constant 298.987 0.155 1927.710 .000 0.304Rock 0.59 0.006 9.213 .000Bare soil 0.041 0.010 3.928 .000Built-up 0.031 .004 7.874 .000
5 Regression model for Junenight temp.
June nighttemp.
Constant 300.727 .132 2276.253 .000 0.739Built-up .049 .003 19.677 .000Rock .053 .004 12.385 .000Vegetation �.033 .003 �10.309 .000Water .229 .099 2.322 .021
6 Regression model for Juneday temp.
June daytemp.
Constant 329.669 .808 407.860 .000 0.610Vegetation �.132 .007 �18.267 .000AOD �11.785 1.313 �8.974 .000Bare Soil .031 .006 5.566 .000
A.K. Pandey et al. / Urban Climate xxx (2014) xxx–xxx 13
reason for this warming influence of built-up area (Georgescu et al., 2011). Further, the night-time LSTis negatively correlated with vegetation cover in all the months. This is possibly because the majorfraction of vegetation cover lies in the surrounding rural areas of Delhi where SVF is expected to behigh as compared to the urban areas.
Results of regression analysis (Table 6) show that bare soil has a positive regression coefficient in theday-time model for all the months which suggests a positive influence of this variable on day-time LST.It is also observed that AOD has negative regression coefficient in the day-time models for the monthsof June and November which indicates that aerosol load contributes towards reduction of day-time LSTin these months. Singh et al. (2005) report a surface negative forcing of 13.6 ± 1.4 W/m2 for Delhi per0.1 increases in AOD during the pre-monsoon period over Delhi. For the night-time models, it is seenthat built-up area and water have positive regression coefficients in all the months which suggests thatthese surfaces contribute towards warming during the night. On the contrary, vegetation is found tohave a negative regression coefficient for all the months which indicates towards a moderating roleplayed by vegetation. Further, the R2 value of 0.52, 0.72 and 0.73 for the night-time models suggeststhat they perform better than the day-time models having R2 values of 0.42, 0.30 and 0.61. This sug-gests that night-time UHI is more a function of the local land cover variables whereas day-time UHImay also be dependent on other factors such as meteorological variables.
4. Conclusions
The present study reveals that a nocturnal heat island exists over the city of Delhi almost through-out the year. The intensity of the nocturnal heat island is the maximum during the month of March(4–6 K) and the minimum during the months of July/August at the time of monsoon season. During
Please cite this article in press as: Pandey, A.K., et al. Spatio – temporal variations of urban heat island over Delhi.Urban Climate (2014), http://dx.doi.org/10.1016/j.uclim.2014.10.005

14 A.K. Pandey et al. / Urban Climate xxx (2014) xxx–xxx
the daytime, however, negative heat island intensity is observed during the months of May–June andOctober–December. A day-time surface cool island exists over Delhi during these months and temper-atures over the central regions of Delhi may be less than those in the surrounding regions by 2–4 K.Temporal plots between average monthly UHII and AOD reveal a significant negative correlationbetween them suggesting that cool island over Delhi forms when aerosol load is high. This inferenceis further strengthened by statistical analysis of spatial data which yields negative correlation betweenday-time LST and AOD in the months of June and November. Statistical analysis also reveals that landcover variables such as bare soil, vegetation and built-up area play an important role both in the day-time and night-time UHI. While the role of land cover variables in UHI formation is well established, itprobably needs more data and research efforts to conclusively evaluate the impact of AOD on UHIformation.
Acknowledgements
The authors would like to thank the Department of Science and Technology (DST), Government ofIndia for providing financial support for this study. Further, the authors would like to acknowledge theMODIS scientific and data support teams and the Giovanni online data system, developed and main-tained by the NASA GES DISC for making the data available.
References
Alonso, M.S., Labajo, J.L., Fidalgo, M.R., 2003. Characteristics of urban heat island in the city of Salamanca, Spain. Atmosfera,137–148.
Arnfield, A.J., 1982. An approach to the estimation of the surface radiative properties and radiation budgets of cities. Phys.Geogr. 3, 97–122.
Arnfield, A.J., 2003. Two decades of urban climate research: a review of turbulence, exchanges of energy and water, and theurban heat island. Int. J. Climatol. 23, 1–26.
Badarinath, K.V.S., Kiran, Chand.T.R., Madhavi, Latha.K., Raghavaswamy, V., 2005. Studies on urban heat islands using ENVISATAATSR data. J. Indian Soc. Remote Sens. 33 (4), 495–501.
Bano, T., Singh, S., Gupta, N.C., Soni, K., Tanwar, R.S., Nath, S., Arya, B.C., Gera, B.S., 2011. Variation in aerosol black carbonconcentration and its emission estimates at the mega-city Delhi. Int. J. Remote Sens. 32 (21), 6749–6764.
Bohnenstengel, S.I., Evans, S., Clark, P.A., Belcher, S.E., 2011. Simulations of the London urban heat island. Quart. J. RoyalMeteorol. Soc. 137, 1625–1640.
Buyantuyev, A., Wu, J., 2010. Urban heat islands and landscape heterogeneity: linking spatiotemporal variations in surfacetemperatures to land-cover and socioeconomic patterns. Landscape Ecol. 25, 17–33.
Cai, G., Du, M., Xue, Y., Li, S., Road, Z., 2008. Analysis Of An Urban Heat Sink Using Thermal Inertia Model From Aster Data InBeijing, China School of Geomatic and Urban Information, Beijing University of Civil Engineering and Architecture,Department of Computing, London Metropolitan University, pp. 1346–1349.
Carnahan, W.H., Larson, R.C., 1990. An analysis of an urban heat sink. Remote Sens. Environ. 33, 65–71.Chen, Y.H., Li, X.B., Shi, P.J., Dou, W., Li, X., 2003. Intra-annual vegetation change characteristics in the NDVI-Ts space:
application to farming-pastoral zone in North China. Acta Botanica Sinica 45 (10), 1139–1145.Chow, W.T.L., Roth, M., 2006. Temporal dynamics of urban heat island of Singapore. Int. J. Climatol. 26, 2243–2260.Cui, Y.Y., Foy, B.D., 2012. Seasonal variations of the urban heat island at the surface and the near-surface and reductions due to
urban vegetation in Mexico City. Am. Meteorol. Soc. http://dx.doi.org/10.1175/JAMC-D-11-0104.1.Deosthali, V., 2000. Impact of rapid urban growth on heat and moisture islands in Pune City, India. Atmos. Environ. 34, 2745–
2754.Eck, T.F. et al, 2010. Climatological aspects of the optical properties of fine/coarse mode aerosol mixtures. J. Geophys. Res. 115,
D19205. http://dx.doi.org/10.1029/2010JD014002.Erell, E., Williamson, T., 2007. Intra-urban differences in canopy layer air temperature at a mid-latitude city. Int. J. Climatol. 27,
1243–1255.Gaffin, S.R., Rosenzweig, C., Khanbilvardi, R., Parshall, L., Mahani, S., Glickman, H., Goldberg, R., Blake, R., Slosberg, R.B., Hillel, D.,
2008. Variations in New York City’s urban heat island strength over time and space. Theoret. Appl. Climatol. 94, 1–11.Gallo, K.P., McNab, A.L., Karl, T.R., Brown, J.F., Hood, J.J., Tarpley, J.D., 1993. The use of NOAA AVHRR data for assessment of the
urban heat island effect. J. Appl. Meteorol. 32, 899–908.Georgescu, M., Moustaoui, M., Mahalov, A., Dudhia, J., 2011. An alternative explanation of the semiarid urban area ‘‘oasis effect’’.
J. Geophys. Res. 116, D24113. http://dx.doi.org/10.1029/2011JD016720.Goldreich, Y., 1992. Urban climate studies in Johannesburg, a sub-tropical city located on a ridge – a review. Atmos. Environ. 26
(B), 407–420.Hafner, J., Kidder, S.Q., 1999. Urban heat island modeling in conjunction with satellite-derived surface/soil parameters. J. Appl.
Meteorol. 38 (4), 448–465.Hawkins, T.W., Brazel, A.J., Stefanov, W.L., Bigler, W., Saffel, E.M., 2004. The role of rural variability in urban heat island
determination for Phoenix, Arizona. J. Appl. Meteorol. 43, 476–486.Jauregui, E., 1997. Heat island development in Mexico City. Atmos. Environ. 31, 3821–3831.Jensen, J.R., 1986. Introductory Digital Image Processing: a Remote Sensing Perspective. Prentice Hall PTR, USA.
Please cite this article in press as: Pandey, A.K., et al. Spatio – temporal variations of urban heat island over Delhi.Urban Climate (2014), http://dx.doi.org/10.1016/j.uclim.2014.10.005

A.K. Pandey et al. / Urban Climate xxx (2014) xxx–xxx 15
Jin, M., Shepherd, J.M., Zheng, W., 2010. Urban surface temperature reduction via the urban aerosol direct effect: a remotesensing and WRF model sensitivity study. Adv. Meteorol., 1–14.
Jin, M.S., Kessomkiat, W., Pereira, G., 2011. Satellite-observed urbanization characters in Shanghai, China: aerosols, urban heatisland effect, and land-atmosphere interactions. Remote Sens. 3, 83–99.
Jones, Philip D., Lister, David H., 2009. The urban heat island in Central London and urban related warming trends in CentralLondon since 1900. Weather 64 (12), 323–327.
Kaiser, D.P., Qian, Y., 2002. Decreasing trends in sunshine duration over China for 1954–1998: indication of increased hazepollution. Geophys. Res. Lett. 29, 2042.
Lodhi, N.K., Beegum, S.N., Singh, S., Kumar, K., 2013. Aerosol climatology at Delhi in the western Indo-Gangetic Plain:microphysics, long-term trends, and source strengths. J. Geophys. Res. 118, 1–15.
Mallick, J., Kant, Y., Bharath, B.D., 2008. Estimation of land surface temperature over Delhi using Landsat-7 ETM +. J. Ind.Geophys. Union 12, 131–140.
Mather, P.M., 1999. Computer Processing of Remotely Sensed Images: an Introduction. John Wiley and Sons, Chichester.Mendonca, F., 2009. Urban Heat and Urban Cool Islands: Influences of Vegetation and Soil Surface in Some Cities, Southern
Brazil. In: The seventh International Conference on Urban Climate, 29 June–3 July 2009, Yokohama, Japan.Miao, S., Chen, F., Lemone, M.A., Tewari, M., Li, Q., Wang, Y., 2009. An observational and modeling study of characteristics of
urban heat island and boundary layer structures in Beijing. J. Appl. Meteorol. Climatol. 48, 484–501.Mohan, M., Bhati, S., 2011. Analysis of WRF model Performance over Subtropical Region of Delhi, India. Hindawi Publishing
Corporation, Advances in Meteorology, Volume 2011, Article ID 621235, 13p. http://dx.doi.org/10.1155/2011/621235.Morris, Al.E.T., 2001. Quantification of the Influences of Wind and Cloud on the Nocturnal Urban Heat Island of a Large City. Am.
Meteorol. Soc. 40, 169–182.Nasrallah, H.A., 1990. Analysis of the Kuwait City urban heat Island. Int. J. Climatol. 10, 401–405.Nichole, J., 2005. Remote sensing of urban heat islands by day and night. Photogramm. Eng. Remote Sens. 71 (5), 613–621.Oke, T.R., Maxwell, G.B., 1975. Urban heat island dynamics in Montreal and Vancouver. Atmos. Environ. 9, 191–200.Oke, T.R., 1981. Canyon geometry and the nocturnal Urban Heat Island: comparison of scale model and field observations.
J. Climatol. 1, 237–254.Oswald, E.M., Rood, R.B., Zhang, K., Gronlund, C.J., O’Neill, M.S., White-Newsome, J.L., Brines, S.J., Brown, D.G., 2012. An
investigation into the spatial variability of near-surface air temperatures in the Detroit, Michigan, Metropolitan region.J. Appl. Meteorol. Climatol. 51, 1290–1304.
Owen, T.W., Carlson, T.N., Gillies, R.R., 1998. An assessment of satellite remotely-sensed land cover parameters in quantitativelydescribing the climatic effect of urbanization. Int. J. Remote Sens. 19 (9), 1663–1681.
Pandey, P., Kumar, D., Prakash, A., Masih, J., Singh, M., Kumar, S., Jain, V.K., Kumar, K., 2012. A study of urban heat island and itsassociation with particulate matter during winter months over Delhi. Sci. Total Environ. 414, 494–507.
Peña, M.A., 2008. Relationships between remotely sensed surface parameters associated with the urban heat sink formation inSantiago, Chile. Int. J. Remote Sens. 29, 4385–4404.
Ramanathan, V., Chung, C., Kim, D., Bettge, T., Buja, L., Kiehl, J.T., Washington, W.M., Fu, Q., Sikka, D.R., Wild, M., 2005.Atmospheric brown clouds: impacts on South Asian climate and hydrological cycle. Proc. Natl. Acad. Sci. USA 102,5326–5333.
Roth, M., Oke, T.R., 1989. Satellite- derived urban heat islands from three coastal cities and the utilization of such data in urbanclimatology. Int. J. Remote Sens. 10 (11), 1699–1720.
Saaroni, H., Ziv, B., 2010. Estimating the Urban Heat Island contribution to urban and rural air temperature differences overcomplex terrain: application to an Arid City. J. Appl. Meteorol. Climatol. 49, 2159–2166.
Schwarz, N., Lautenbach, S., Seppelt, R., 2011. Exploring indicators for quantifying surface urban heat islands of European citieswith MODIS land surface temperatures. Remote Sens. Environ. 115, 3175–3186.
Shao, Q., Sun, C., Liu, J., He, J., Kuang, W., Tao, F., 2011. Impact of urban expansion on meteorological observation data andoverestimation to regional air temperature in China. J. Geog. Sci. 21, 994–1006.
Singh, S., Nath, S., Kohli, R., Singh, R., 2005. Aerosols over Delhi during pre-monsoon months: characteristics and effects onsurface radiation forcing. Geophys. Res. Lett. 32, L13808.
Singh, S., Soni, K., Bano, T., Tanwar, R.S., Nath, S., Arya, B.C., 2010. Clear-sky direct aerosol radiative forcing variations overMega-City Delhi. Ann. Geophys. 28, 1157–1166.
Sobrino, J.A., Kharraz, M.H.E., 1999. Combining afternoon and morning NOAA satellites. Algorithm and its testing withhydrologic atmospheric pilot experiment-Sahel data. J. Geophys. Res. 104, 9445–9453.
Sobrino, J.A. et al, 2013. Evaluation of the surface urban heat island effect in the city of Madrid by thermal remote sensing. Int. J.Remote Sens. 34 (9–10), 3177–3192.
Streutker, D.R., 2002. A remote sensing study of the urban heat island of Houston, Texas. Int. J. Remote Sens. 23 (13), 2595–2608.Svensson, K.M., 2004. Sky view factor analysis – implications for urban air temperature differences. Meteorol. Appl. 11,
201–211.Voogt, J., Oke, T., 2003. Thermal remote sensing of urban climates. Remote Sens. Environ. 86, 370–384.Wang, K., Wang, J., Wang, P., Sparrow, M., Yang, J., Chen, H., 2007. Influences of urbanization on surface characteristics as
derived from the moderate-resolution imaging spectroradiometer: a case study for the Beijing metropolitan area.J. Geophys. Res. 112, D22S06.
Weverberg, K.Van., Ridder, K.De., Rompaey, A.Van., 2008. Modeling the contribution of the brussels heat island to a longtemperature time series. J. Appl. Meteorol. Climatol. 47, 976–990.
Please cite this article in press as: Pandey, A.K., et al. Spatio – temporal variations of urban heat island over Delhi.Urban Climate (2014), http://dx.doi.org/10.1016/j.uclim.2014.10.005