Observation and analysis of spatio-temporal characteristics of ...
44
Mathematisch-Naturwissenschaftliche Fakultät Khadak Singh Mahata | Maheswar Rupakheti | Arnico Kumar Panday | Piyush Bhardwaj | Manish Naja | Ashish Singh | Andrea Mues | Paolo Cristofanelli | Deepak Pudasainee | Paolo Bonasoni | Mark G. Lawrence Observation and analysis of spatio-temporal characteristics of surface ozone and carbon monoxide at multiple sites in the Kathmandu Valley, Nepal Postprint archived at the Institutional Repository of the Potsdam University in: Postprints der Universität Potsdam Mathematisch-Naturwissenschaftliche Reihe ; 848 ISSN 1866-8372 https://nbn-resolving.org/urn:nbn:de:kobv:517-opus4-416626 DOI https://doi.org/10.25932/publishup-41662 Suggested citation referring to the original publication: Atmospheric Chemistry and Physics Discussions (2017) DOI https://doi.org/10.5194/acp-2017-709 ISSN (print) 1680-7367 ISSN (online) 1680-7375
-
Upload
khangminh22 -
Category
Documents
-
view
0 -
download
0
Transcript of Observation and analysis of spatio-temporal characteristics of ...
Mathematisch-Naturwissenschaftliche Fakultät
Khadak Singh Mahata | Maheswar Rupakheti | Arnico Kumar Panday | Piyush Bhardwaj | Manish Naja | Ashish Singh | Andrea Mues | Paolo Cristofanelli | Deepak Pudasainee | Paolo Bonasoni | Mark G. Lawrence
Observation and analysis of spatio-temporal characteristics of surface ozone and carbon monoxide at multiple sites in the Kathmandu Valley, Nepal
Postprint archived at the Institutional Repository of the Potsdam University in:Postprints der Universität PotsdamMathematisch-Naturwissenschaftliche Reihe ; 848ISSN 1866-8372https://nbn-resolving.org/urn:nbn:de:kobv:517-opus4-416626DOI https://doi.org/10.25932/publishup-41662
Suggested citation referring to the original publication:Atmospheric Chemistry and Physics Discussions (2017) DOI https://doi.org/10.5194/acp-2017-709ISSN (print) 1680-7367ISSN (online) 1680-7375

1
Observation and analysis of spatio-temporal characteristics of surface ozone and carbon 1
monoxide at multiple sites in the Kathmandu Valley, Nepal 2
Khadak Singh Mahata1,2, Maheswar Rupakheti1,3, Arnico Kumar Panday 4,5, Piyush Bhardwaj6, 3
Manish Naja6, Ashish Singh1, Andrea Mues1, Paolo Cristofanelli7, Deepak Pudasainee8, Paolo 4
Bonasoni7, Mark G. Lawrence1,2 5
6
1Institute for Advanced Sustainability Studies (IASS), Potsdam, Germany 7
2University of Potsdam, Potsdam, Germany 8
3Himalayan Sustainability Institute (HIMSI), Kathmandu, Nepal 9
4International Centre for Integrated Mountain Development (ICIMOD), Lalitpur, Nepal 10
5University of Virginia, Charlottesville, USA 11
6Aryabhatta Research Institute of Observational Sciences (ARIES), Nainital, India 12
7CNR-ISAC, National Research Council of Italy – Institute of Atmospheric Sciences and 13
Climate, Bologna, Italy 14 8Department of Chemical and Materials Engineering, University of Alberta, Edmonton, Canada 15
16
Correspondence to: Maheswar Rupakheti ([email protected]) and Khadak 17
Singh Mahata ([email protected]) 18
19
20
21
22
23
24
Atmos. Chem. Phys. Discuss., https://doi.org/10.5194/acp-2017-709Manuscript under review for journal Atmos. Chem. Phys.Discussion started: 18 December 2017c© Author(s) 2017. CC BY 4.0 License.
2
Abstract 25
Residents of the Kathmandu Valley experience severe particulate and gaseous air pollution 26
throughout most of the year, even during much of the rainy season. The knowledge base for 27
understanding the air pollution in the Kathmandu Valley was previously very limited, but is 28
improving rapidly due to several field measurement studies conducted in the last few years. Thus 29
far, most analyses of observations in the Kathmandu Valley have been limited to short periods of 30
time at single locations. This study extends on the past studies by examining the spatial and 31
temporal characteristics of two important gaseous air pollutant (CO and O3) based on 32
simultaneous observations over a longer period at five locations within the valley and on its rim, 33
including a supersite (at Bode in the valley center, 1345 m above sea level) and four satellite 34
sites (at Paknajol, 1380 m asl in the Kathmandu city center, at Bhimdhunga (1522 m asl), a 35
mountain pass on the valley’s western rim, at Nagarkot (1901 m asl), another mountain pass on 36
the eastern rim, and Naikhandi, near the valley’s only river outlet). CO and O3 mixing ratios 37
were monitored from January to July 2013, along with other gases and aerosol particles by 38
instruments deployed at the Bode supersite during the international air pollution measurement 39
campaign SusKat-ABC (Sustainable Atmosphere for the Kathmandu Valley – endorsed by the 40
Atmospheric Brown Clouds program of UNEP). The O3 monitoring at Bode, Paknajol and 41
Nagarkot as well as the CO monitoring at Bode were extended beyond July 2013 to investigate 42
their variability over a complete annual cycle. Higher CO mixing ratios were found at Bode than 43
at the outskirt sites (Bhimdhunga, Naikhandi and Nagarkot), and all sites except Nagarkot 44
showed distinct diurnal cycles of CO mixing ratio with morning peaks and daytime lows. 45
Seasonally, CO was higher during the pre-monsoon and winter seasons, especially due to the 46
emissions from brick kiln industries, which only operate during this period, as well as increased 47
domestic heating during winter, and regional forest fires and agro-residue burning. It was lower 48
during the monsoon due to rainfall, which reduces open burning activities within the valley and 49
in the surrounding regions, and thus reduces the sources of CO. The meteorology of the valley 50
also played a key role in determining the CO mixing ratios. Furthermore, there was evidence of 51
some influence of pollution from the greater region around the valley. A top-down estimate of 52
the CO emission flux was made by using the CO mixing ratio and mixing layer height (MLH) 53
measured at Bode. The estimated annual CO flux at Bode was 4.92 µg m-2 s-1, which is 2-14 54
Atmos. Chem. Phys. Discuss., https://doi.org/10.5194/acp-2017-709Manuscript under review for journal Atmos. Chem. Phys.Discussion started: 18 December 2017c© Author(s) 2017. CC BY 4.0 License.
3
times higher than that in widely used emission inventory databases (EDGAR HTAP, REAS and 55
INTEX-B). This difference in CO flux between Bode and other emission databases likely arises 56
from large uncertainties in both the top-down and bottom-up approaches to estimating the 57
emission flux. The O3 mixing ratio was found to be highest during the pre-monsoon season at all 58
sites, while the timing of the seasonal minimum varied across the sites. The daily maximum 8 59
hour average O3 exceeded the WHO recommended guideline of 50 ppb on more days at the 60
hilltop station of Nagarkot (159/357 days) than at the urban valley bottom sites of Paknajol 61
(132/354 days) and Bode (102/353 days), presumably due to the influence of free-tropospheric 62
air at the high-altitude site, as well as to titration of O3 by fresh NOx emissions near the urban 63
sites. More than 78% of the exceedance days were during the pre-monsoon period at all sites. 64
This was due to both favorable meteorological conditions as well as contributions of precursors 65
from regional sources such as forest fires and agro-residue burning. The high O3 mixing ratio 66
observed during the pre-monsoon period is of a high concern for human health and ecosystems, 67
including agroecosystems in the Kathmandu Valley and surrounding regions. 68
69
1. Introduction 70
Air pollution is one of the major health risks globally. It was responsible for premature loss of 71
about 7 million lives worldwide in 2012 (WHO, 2014), with about 1.7 million of these being in 72
South Asian countries (India, Pakistan, Nepal and Bangladesh) in 2013 (Forouzanfar, 2015). 73
South Asia is considered to be a major air pollution hotspot (Monks et al., 2009) and it is 74
expected to be one of the most polluted regions in the world for surface ozone (O3) and other 75
pollutants by 2030 (Dentener et al., 2006; IEA 2016; OECD 2016). Past studies have shown that 76
the air pollution from this region affects not only the region itself, but is also transported to other 77
parts of the world, including comparatively pristine regions such as the Himalayas and the 78
Tibetan plateau (Bonasoni et al., 2010; Ming, et al., 2010; Lüthi et al., 2015), as well as to other 79
distant locations such as northern Africa and the Mediterranean (Lawrence and Lelieveld, 2010). 80
The air pollution problem is particularly alarming in many urban areas of South Asia, including 81
in the city of Kathmandu and the broader Kathmandu Valley, Nepal (Chen et al., 2015; Putero et 82
al., 2015; Kim et al., 2015; Sarkar et al., 2016; Shakya et al., 2017). This is due to their rapid 83
urbanization, economic growth and the use of poor technologies in the transportation, energy and 84
Atmos. Chem. Phys. Discuss., https://doi.org/10.5194/acp-2017-709Manuscript under review for journal Atmos. Chem. Phys.Discussion started: 18 December 2017c© Author(s) 2017. CC BY 4.0 License.

4
industrial sectors. Effectively mitigating air pollutants in the regions like the Kathmandu Valley 85
requires scientific knowledge about characteristics and sources of the pollutants. To contribute to 86
this urgently-needed scientific knowledge base, in this study we focus on the analysis of 87
measurements of two important gaseous species, carbon monoxide (CO), an urban air pollution 88
tracer, and O3, at multiple sites in and around the Kathmandu Valley. This study analyzes data 89
from January 2013 to March 2014, which includes the intensive phase of an international air 90
pollution measurement campaign – SusKat-ABC (Sustainable Atmosphere for the Kathmandu 91
Valley – Atmospheric Brown Clouds) – conducted during December 2012 - June 2013 92
(Rupakheti et al., 2017, manuscript in preparation, submission anticipated in 1-2 months), with 93
measurements of O3 and CO at some sites continuing beyond the intensive campaign period 94
(Bhardwaj et al., 2017; Mahata et al., 2017). 95
CO is a useful tracer of urban air pollution as it is primarily released during incomplete 96
combustion processes. It is also toxic at high concentrations indoors, but our focus here is on 97
ambient levels. The main anthropogenic sources of CO in the Kathmandu Valley are vehicles, 98
cooking activities (using liquefied petroleum gas, kerosene, and firewood), and industries, 99
including brick kilns, especially biomass co-fired kilns with older technologies, and until 100
recently diesel power generator sets (Panday and Prinn, 2009; Kim et al, 2015; Sarkar et al., 101
2016; Mahata et al., 2017; Sarkar et al., 2017). Tropospheric ozone, which is formed by 102
photochemical reactions involving oxides of nitrogen (NOx) and volatile organic compounds 103
(VOCs), is a strong oxidizing agent in the troposphere. Because of its oxidizing nature, it is also 104
deleterious to human health and plants already at typically polluted ambient levels (Lim et al., 105
2012; Burney and Ramanathan, 2014; Feng, 2015; Monks et al., 2015). Tropospheric O3 is 106
estimated to be responsible for about 5-20 % of deaths caused by air pollution globally (Brauer et 107
al., 2012; Lim et al., 2012; Silva et al., 2013). It has also been estimated that high concentrations 108
of O3 are responsible for a global loss of crops equivalent to $ 11-18 billion annually (Avnery et 109
al., 2011; UNEP and WMO, 2011), a substantial fraction of which is associated with the loss in 110
wheat in India alone (equivalent to $ 5 billion in 2010) (Burney and Ramanathan, 2014). O3 can 111
also serve as a good indicator of the timing of the breakup of the nighttime stable boundary layer 112
(when the ozone levels increase rapidly in the morning due to downward transport from the free 113
troposphere (Panday and Prinn, 2009; Geiß et al., 2017) 114
Atmos. Chem. Phys. Discuss., https://doi.org/10.5194/acp-2017-709Manuscript under review for journal Atmos. Chem. Phys.Discussion started: 18 December 2017c© Author(s) 2017. CC BY 4.0 License.
5
Only a few past studies have measured ambient CO mixing ratios in the Kathmandu Valley. 115
Davidson et al. (1986) measured CO in the city center and found mixing ratios between 1 and 2.5 116
ppm in the winter of 1982-1983. Panday and Prinn (2009) measured similar levels of CO mixing 117
ratios during September 2004 – June 2005, although the main sources of CO shifted from 118
biofuel-dominated air pollutants from cooking activities in the 1980s to vehicle-dominated 119
pollutants in the 2000s. The growth rate in the vehicle fleet has had a substantial influence on air 120
pollution in the valley, including CO and O3. Out of 2.33 million vehicles in Nepal, ~50% of 121
them are in the Kathmandu Valley (DoTM, 2015). Shrestha et al. (2013) estimated 31 kt of 122
annual emission of CO from a fraction of the vehicle fleet in the Kathmandu Valley in 2010 by 123
using data from a field survey as input data to the International Vehicle Emission (IVE) model. 124
The model simulation considered motorcycles, buses, taxis, vans and three wheelers, but did not 125
include personal cars, trucks and non-road vehicles. The studied fleets covered ~73% of the total 126
fleet (570 145) registered in the valley in 2010, with motorcycles being the most common 127
vehicle (69%) within the total fleet. 128
Past studies have investigated the diurnal and seasonal variations of CO and O3 mixing ratios in 129
the Kathmandu Valley. Panday and Prinn (2009) observed distinct diurnal variations of CO 130
mixing ratios and particulate matter concentrations observed during September 2004 – June 2005 131
at Bouddha (about 4 km northwest of the SusKat-ABC supersite at Bode), with morning and 132
evening peaks. It was found in the Kathmandu Valley that such peaks were created by the 133
interplay between the ventilation, as determined by the local meteorology, and the timing of 134
emissions, especially traffic and cooking emissions. The morning CO peak was also associated 135
with the recirculation of the pollutants transported down from an elevated residual pollution 136
layer (Panday and Prinn, 2009). 137
O3 was observed to have lower nighttime levels in the city center than at the nearby hilltop site of 138
Nagarkot (Panday and Prinn, 2009). Pudasainee et al. (2006) studied the seasonal variations of 139
O3 mixing ratios based on the observation for a whole year (2003-2004) in Pulchowk in the 140
Lalitpur district, just south of central Kathmandu Metropolitan City (KMC) in the Kathmandu 141
Valley. They reported seasonal O3 mixing ratios to be highest during the pre-monsoon and 142
lowest in the winter. As a part of the SusKat-ABC Campaign, Putero et al. (2015) monitored O3 143
mixing ratios at Paknajol, an urban site in the center of the KMC over a full-year period 144
Atmos. Chem. Phys. Discuss., https://doi.org/10.5194/acp-2017-709Manuscript under review for journal Atmos. Chem. Phys.Discussion started: 18 December 2017c© Author(s) 2017. CC BY 4.0 License.
6
(February 2013-January 2014). They also observed similar seasonal variations in O3 mixing 145
ratios in the valley to those observed by Pudasainee et al. (2006), with highest O3 during the pre-146
monsoon season, followed by the monsoon, post-monsoon and winter seasons. They found that 147
during the pre-monsoon season, westerly winds and regional synoptic circulation transport O3 148
and its precursors from regional forest fires located outside the Kathmandu Valley. In another 149
study conducted as part of the SusKat-ABC Campaign, 37 non-methane volatile organic 150
compounds (NMVOCs) were measured at Bode, with data recording every second, during winter 151
of 2012-2013; the measurements included isoprene, an important biogenic precursor of O3 152
(Sarkar et al., 2016). They found concentrations to vary in two distinct periods. The first period 153
was marked by no brick kiln operations and was associated with high biogenic emissions of 154
isoprene. During the second period nearby brick kilns, which use coal mixed with biomass, were 155
in operation that contributed to elevated concentrations of ambient acetonitrile, benzene and 156
isocyanic acid. Furthermore, they found that oxygenated NMVOCs and isoprene combined 157
accounted for 72% and 68% of the total O3 production potential in the first period and second 158
period, respectively. 159
Prior to the SusKat-ABC campaign there were no studies that simultaneously measured ambient 160
CO and O3 mixing ratios at multiple sites in the Kathmandu Valley over extended periods of 161
time. Past studies either focused on one long-term site, or on short-term observation records at 162
various sites (Panday and Prinn, 2009), or they investigated the seasonal characteristics of single 163
pollutants such as O3 at a single site in the valley (Pudasainee et al., 2006). The most comparable 164
past study is by Putero et al. (2015), who described O3 mixing ratios at one SusKat-ABC site 165
(Paknajol) in the Kathmandu city center observed during the SusKat-ABC campaign, and 166
discussed O3 seasonal variations. There is also a companion study on regional CO and O3 167
pollution by Bhardwaj et al. (2017) which is based on O3 and CO mixing ratios monitored at the 168
SusKat-ABC supersite at Bode in the Kathmandu Valley for a limited period (January-June 169
2013) and at two sites in India (Pantnagar in Indo-Gangetic Plain and Nainital in Himalayan 170
foothill). They reported simultaneous enhancement in O3 and CO levels at these three sites in 171
spring, highlighting contribution of regional emissions, such as biomass burning in northwest 172
Indo-Gangetic Plain (IGP), and regional transport to broader regional scale pollution, including 173
in the Kathmandu Valley. In this study, we document the diurnal and seasonal (where applicable) 174
characteristics and spatial distributions of CO and O3 mixing ratios based on simultaneous 175
Atmos. Chem. Phys. Discuss., https://doi.org/10.5194/acp-2017-709Manuscript under review for journal Atmos. Chem. Phys.Discussion started: 18 December 2017c© Author(s) 2017. CC BY 4.0 License.
7
observations at several locations within the valley and on the valley rim mountains over a full 176
year, helping to characterize the pollution within the valley and the pollution plume entering and 177
exiting the valley. We also compute the first top-down estimates of CO emission fluxes for the 178
Kathmandu Valley and compare these to CO emissions fluxes in widely-used emission datasets 179
such as EDGAR HTAP (Janssens-Maenhout et al., 2000), REAS (Kurokawa et al., 2013) and 180
INTEX-B (Zhang et al., 2009). 181
182
2. Study sites and methods 183
The Kathmandu Valley, situated in the foothills of the Central Himalaya, is home to more than 3 184
million people. The valley floor has an area of about 340 km2, with an average altitude of about 185
1300 m above sea level (m asl). It is surrounded by peaks of about 1900-2800 m asl. The valley 186
has five major mountain passes on its rim: the Nagdhunga, Bhimdhunga and Mudku Bhanjhyang 187
passes in the west, and the Nala and Nagarkot passes in the east as shown in Figure 1. The passes 188
are situated at altitudes of 1480-1530 m asl. There is also one river outlet (the Bagmati River) 189
towards the southwest, which constitutes a sixth pass for air circulation in and out of the valley 190
(Regmi et al., 2003; Panday and Prinn, 2009). We selected five measurement sites, including two 191
on the valley floor (Bode and Paknajol), two on mountain ridges (Bhimdhunga and Nagarkot) 192
and one near the Bagmati River outlet (Naikhandi) to characterize the spatial and temporal 193
variabilities of CO and O3 mixing ratios in the Kathmandu Valley. A short description of the 194
measurement sites is presented here and in Table 1, and details on instruments deployed at those 195
sites for this study are presented in Table 2. Further details of the measurement sites are 196
described in the SusKat-ABC campaign overview paper (Rupakheti et al., 2017, manuscript in 197
preparation). 198
199
Bode: This was the supersite of the SusKat-ABC Campaign. Bode (27.69°N and 85.40°E, 1344 200
m asl) is located in the Madhyapur Thimi municipality in the eastern part of the valley. It is a 201
semi-urban site surrounded by scattered urban buildings and residential houses in agricultural 202
lands. There are 10 brick kilns and the Bhaktapur Industrial Estate towards the southeast 203
direction, within 4 km distance from the site (refer to Sarkar et al., 2016; Mahata et al., 2017 for 204
details). The O3 and CO instruments at Bode site were placed on the fifth floor of a 6-story 205
building, the tallest in the area. 206
Atmos. Chem. Phys. Discuss., https://doi.org/10.5194/acp-2017-709Manuscript under review for journal Atmos. Chem. Phys.Discussion started: 18 December 2017c© Author(s) 2017. CC BY 4.0 License.
8
Bhimdhunga: This site (27.73°N, 85.23°E, 1522 m asl) is located on the Bhimdhunga pass on the 207
western rim of the valley. It sits on the mountain ridge between the Kathmandu Valley to the east 208
and a valley of a tributary of the Trishuli River to the west. It is situated about 5.5 km from the 209
western edge (Sitapaila) of the KMC in a rural setting with only a few scattered rural houses 210
nearby. The CO instrument was placed on the ground floor of a small one-story building and an 211
automatic weather station, AWS (Hobo Onset, USA) was set up on the roof of another one-story 212
building at a distance of ca. 15 m from the first building. 213
214
Paknajol: This site (27.72°N, 85.30°E, 1380 m asl) is located at the city center in the KMC, near 215
the most popular touristic area (Thamel). It is in the western part of the valley and about 10 km 216
distance from the Bode supersite. The O3 and metrological instruments relevant to this study 217
were placed on the top floor and rooftop of a 6-story building, the tallest in the area (detail in 218
Putero et al., 2015; note that CO was not measured here). 219
220
Naikhandi: This site (27.60°N, 85.29°E, 1233 m asl) is located within the premises of a school 221
(Kamdhenu Madhyamik Vidhyalaya) located at the southwestern part of the valley (~7 km south 222
from the nearest point of the Ring Road). The school premise is open, surrounded by sparsely 223
scattered rural houses in agricultural lands. The nearest village (~75 houses) is about 500 m away 224
in the southwest direction. There are 5 brick kilns within 2 km distance (2 to the north and 3 to 225
the northeast) from the site. The instruments were kept in a one-story building of the school. The 226
AWS (Hobo Onset, USA) was installed on the ground near the Bagmati River, ~100 m away 227
from the main measurement site. 228
229
Nagarkot: This site is located on a mountain ridge (27.72°N, 85.52°E, 1901 m asl), ca. 13 km 230
away to the east from Bode, in the eastern part of the valley. The site faces the Kathmandu 231
Valley to the west and small rural town, Nagarkot, to the east. The instruments were set up in a 232
2-story building of the Nagarkot Health Post and the AWS (Vaisala WXT520, Finland) was set 233
up on the roof of the building. 234
235
Bhimdhunga in the west and Naikhandi near the Bagmati River outlet in the southwest are the 236
most important pass and river outlet for the valley. The Bhimdhunga and Naikhandi sites are 237
Atmos. Chem. Phys. Discuss., https://doi.org/10.5194/acp-2017-709Manuscript under review for journal Atmos. Chem. Phys.Discussion started: 18 December 2017c© Author(s) 2017. CC BY 4.0 License.
9
approximately 5.5 and 7 km away from the nearest edge of the major city, respectively. 238
Similarly, Bode is located downwind of the city centers and thus receives pollution outflow from 239
nearby city centers such as Kathmandu and Lalitpur due to strong westerly and southwesterly 240
winds (4-6 m s-1) during the day time, and emissions from the Bhaktapur area to the east and 241
southeast direction by calm easterly winds (< 1 m s-1) during the night (Sarkar et al., 2016; 242
Mahata et al., 2017). 243
244
A freshly calibrated new CO analyzer (Horiba APMA-370, Japan) was deployed for the first 245
time at Bode. It is based on the IR absorption method at 4.6 µm by CO molecules. Before field 246
deployment at Bode, it was compared with the bench model of the Horiba (APMA-370), and the 247
correlation (r) between them was 0.9 and slope was 1.09. The instrument was regularly 248
maintained by running auto-zero checks (Bhardwaj et al., 2017). Similarly, another CO analyzer 249
(Picarro G2401, USA) which is based on cavity ring-down spectroscopy technique (CRDS) was 250
also a new factory calibrated unit, and was deployed in Bode along with the Horiba APMA-370. 251
The three-month inter-comparison between the Horiba and Picarro CO measurements had a 252
correlation coefficient of 0.99 and the slope was 0.96 (Mahata et al., 2017). All other CO 253
analyzers (Thermo Scientific, 48i, USA), which are also based on IR absorption by CO 254
molecules, deployed at Bhimdhunga, Naikhandi and Nagarkot, were set up for regular automatic 255
zero checks on a daily basis. In addition, a span check was also performed during the 256
observations by using span gas of 1.99 ppm (Gts-Welco, PA, USA) on March 8, 2013 at 257
Naikhandi and Nagarkot, and on March 9 at Bhimdhunga. 258
259
For the O3 monitor (Teledyne 400E, USA) at Bode, the regular zero and span checks were 260
carried out using the built-in O3 generator and scrubber (Bhardwaj et al., 2017). This unit was 261
used in Bode from 01 January 2013 to 09 June 2013. New factory-calibrated O3 monitors 262
(Thermo Scientific, 49i, USA) were used for the rest of the measurement period (18 June 2013 to 263
31 December 2013) at Bode, and for the full year of measurements at Nagarkot. A Thermo 264
Environmental O3 analyzer (Model 49i, USA) was used at the Paknajol site (Putero et al., 2015) 265
with the same experimental set up as described in Cristofanelli et al. (2010). The working 266
principle of all of the O3 instruments is based on the attenuation of UV radiation by O3 molecules 267
at ~254 nm. 268
Atmos. Chem. Phys. Discuss., https://doi.org/10.5194/acp-2017-709Manuscript under review for journal Atmos. Chem. Phys.Discussion started: 18 December 2017c© Author(s) 2017. CC BY 4.0 License.
10
In order to characterize the observations across the seasons, we considered the following seasons 269
as defined in Shrestha et al. (1999) and used in other previous studies in the Kathmandu Valley 270
(Sharma et al., 2012; Chen et al., 2016; Mahata et al, 2017): Pre-monsoon (March, April, May); 271
Monsoon (June, July, August September); Post-monsoon (October, November); and Winter 272
(December, January, February). 273
274
3. Results and discussion 275
3.1 CO mixing ratio at multiple sites 276
Figure 2 shows the time series of the hourly average CO mixing ratios at the four sites (Bode, 277
Bhimdhunga, Naikhandi and Nagarkot). Fluctuations in CO mixing ratios were higher during the 278
winter and pre-monsoon than during the monsoon season at all sites. The monsoon rain generally 279
starts in Nepal around mid-June. In 2013, however, there were more frequent rain events in the 280
month of May than in previous years. The CO mixing ratios (measured in parts per billion by 281
volume, hereafter the unit is denoted as ppb) averaged over the total observation periods at four 282
sites were: Bode (569.9 ± 383.5) ppb during 1 January - 15 July, Bhimdhunga (321.5 ± 166.2) 283
ppb during 14 Jan - 15 July, Naikhandi (345.4 ± 147.9) ppb during 3 January - 6 June and 284
Nagarkot (235.5 ± 106.2) ppb during 13 February - 15 July (except 4 April to 7 June). Nagarkot 285
had only about 3 months of CO data (due to problem in zero tests of the instrument) during the 286
observation period. For the measurement period, the CO mixing ratio at Nagarkot (~13 km far 287
from Bode) showed small fluctuations compared with the other sites. High CO values in the 288
Kathmandu Valley during the dry season (November-May) were also reported by Panday and 289
Prinn (2009) based on their measurements during September 2004-May 2005 at Bouddha (~ 4 290
km in northwest from Bode). The simultaneous episodes of high CO observed in April (1-15) in 291
Bhimdhunga, Bode and Naikhandi indicate the influence of regional sources, in addition to local 292
sources. This is discussed further in section 3.2.3. 293
294
3.2 Diurnal and seasonal variations of CO 295
3.2.1 Diurnal pattern of CO at multiple sites 296
Figure 3 shows the diurnal cycles of CO mixing ratios at four sites (plotted for the period of 13 297
February to 3 April 2013, when the data were available from all four sites). The variation in the 298
Atmos. Chem. Phys. Discuss., https://doi.org/10.5194/acp-2017-709Manuscript under review for journal Atmos. Chem. Phys.Discussion started: 18 December 2017c© Author(s) 2017. CC BY 4.0 License.
11
mixing ratios during the day was characterized by a pronounced morning peak, a weaker evening 299
peak, and a daytime low; except at Nagarkot where peaks are less visible. Multiple sources 300
contribute to the morning and evening peaks, especially emission from vehicles, residential 301
burning (fossil fuel and biomass), brick kilns and trash burning (Kim et al., 2015; Sarkar et al., 302
2016; Mahata et al., 2017). The observed diurnal cycle of CO is similar to that reported in a 303
previous study (Panday and Prinn, 2009), and is also similar to the diurnal pattern of black 304
carbon (BC) in the Kathmandu Valley (Sharma et al., 2012; Mues et al., 2017). The diurnal 305
cycles of these primary pollutants are closely coupled with the valley’s boundary layer height, 306
which is about 1200 m during daytime, and falls to approximately 200 m at nighttime in Bode 307
(Mues et al., 2017). Nagarkot and Bhimdhunga, both on mountain ridges, are generally above the 308
valley’s boundary layer, especially at night, and thus the diurnal profile especially at Nagarkot is 309
distinct compared to other three sites, being relatively flat with small dip during 12:00-18:00. 310
311
Clear morning peaks were observed in Bode, Bhimdhunga and Naikhandi at 08:00, 09:00, and 312
10:00, respectively, i.e., the morning peak lags by 1-2 hours in Bhimdhunga and Naikhandi 313
compared to Bode. Bhimdhunga on the mountain ridge may receive the Kathmandu Valley’s 314
pollution due to upslope winds (~2 m s-1) from the southeast direction in the morning hours after 315
the dissolution of the valley’s boundary layer due to radiative heating of the mountain slopes. On 316
the other hand, Naikhandi is in close proximity to brick kilns and could be impacted by their 317
plumes carried to the site by northerly winds in the early morning (ca. 07:00-10:00, not shown). 318
The evening peak values at Bode and Bhimdhunga were less pronounced compared to their 319
morning maxima. The morning peak at Bode was influenced by nighttime accumulation of CO 320
from nearby brick kilns. Similarly, the local pollution from the nearby village and city area due 321
to upslope winds from the valley floor is expected to contribute to the morning peak at 322
Bhimdhunga. The evening peak at Naikhandi was at 21:00 and was closer to the morning values 323
in comparison to the large difference between morning and evening peaks at Bode and 324
Bhimdhunga. A nighttime build-up of various pollutants compared to the afternoon minimum 325
was typically observed in Bode during the SusKat-ABC measurement period, including the main 326
campaign period (Sarkar et al., 2016; Mahata et al., 2017; Mues et al., 2017). This is mainly 327
associated with the nocturnal decrease in height of the planetary boundary layer, along with 328
persistent emissions such as those from brick kilns, which are in close proximity to the Bode 329
Atmos. Chem. Phys. Discuss., https://doi.org/10.5194/acp-2017-709Manuscript under review for journal Atmos. Chem. Phys.Discussion started: 18 December 2017c© Author(s) 2017. CC BY 4.0 License.
12
measurement site. There appears to be less influence of nighttime polluting sources at Naikhandi 330
and Bhimdhunga than at Bode. 331
332
The low daytime CO mixing ratios observed at all sites were partly due to the evolution of 333
mixing layer and the entrainment of cleaner air from above the boundary layer after the 334
dissolution of nocturnal stable boundary layer. High wind speeds (4-6 m s-1) during daytime also 335
support turbulent vertical diffusion, as well as flushing of the pollution by less polluted air 336
masses from outside the valley, with stronger horizontal winds allowing significant transport of 337
air masses into the valley. In addition, reduced traffic and household cooking activities during 338
daytime compared to morning and evening rush hours contribute to the reduced mixing ratios. 339
340
3.2.2 CO diurnal variation across seasons 341
Due to the lack of availability of simultaneous CO data at all sites covering the entire sampling 342
period, a one-month period was selected for each season to examine the diurnal variation across 343
the seasons, and to get more insights into the mixing ratios at different times of the day, as 344
reported in Table 4. Figure 4 shows the diurnal variation of CO mixing ratios in Bode, 345
Bhimdhunga, and Naikhandi during the selected periods for the three seasons. 346
347
The diurnal cycles during each season had different characteristics. The most prominent 348
distinction was that the CO mixing ratio was low during the monsoon period over all sites 349
(Figure 4, Table 4) as a result of summer monsoon rainfall in the valley, which is 60 - 90% of the 350
1400 mm rainfall for a typical year (Nayava, 1980; Giri et al., 2006). The rainfall diminishes 351
many burning activities (forest fires, agro-residue and trash burning, and the brick kilns) within 352
the valley and surrounding region, and thus reduces CO emissions. Afternoon CO mixing ratios 353
were higher in the pre-monsoon season than in the other two seasons in Bode, Bhimdhunga and 354
Naikhandi (also see Table 4), with the most likely sources being emissions from forest fires and 355
agro-residue burning arriving from outside the valley during this season (this will be discussed 356
further in section 3.2.3). Nighttime accumulation was observed in Bode and Bhimdhunga, but 357
not at Naikhandi, where the mixing ratio decreased slightly from about 20:00 until about 04:00, 358
after which the mixing ratios increased until the morning peak. The nighttime accumulation of 359
CO in Bode during pre-monsoon and winter is apparently due to the influence of nearby brick 360
Atmos. Chem. Phys. Discuss., https://doi.org/10.5194/acp-2017-709Manuscript under review for journal Atmos. Chem. Phys.Discussion started: 18 December 2017c© Author(s) 2017. CC BY 4.0 License.
13
kilns (Mahata et al., 2017). Bhimdhunga is not near any major polluting sources such as brick 361
kilns, and it is unclear whether the nighttime CO accumulation in Bhimdhunga is primarily due 362
to ongoing local residential pollution emissions, and/or to pollution transported from remote 363
sources. The transition of the wind from westerlies during the day to easterlies during the night, 364
with moderate wind speed (~2-4 m s-1) at Bhimdhunga, may bring polluted air masses westwards 365
which were initially transported to the eastern part from the Kathmandu Valley during the 366
daytime (Regmi et al., 2003; Panday and Prinn, 2009; Panday et al., 2009). 367
368
Across the seasons, the afternoon (12:00-16:00) CO mixing ratio was higher during the pre-369
monsoon than in the winter at all three stations (p value for all sites < 0.5) (Table 4), although the 370
mixing layer was higher in the pre–monsoon season than in the winter in Bode (and presumably 371
at the other sites as well). This is not likely to be explained by local emissions in the valley, since 372
these are similar in the winter and pre-monsoon periods. Putero et al. (2015) suggested instead 373
that this reflects an influx of polluted air into the valley due to large synoptic circulation patterns 374
during the pre-monsoon season. Such regional influences are explored further in the next section. 375
376
3.2.3 Regional influence on CO in the valley 377
Recent studies have indicated the likelihood of regional long-range transport contributing to air 378
pollution in different parts of Nepal (Marinoni et al., 2013; Tripathee et al., 2014; Dhungel et al., 379
2016; Rupakheti et al., 2016; Lüthi et al., 2016; Wan et al., 2017), including the Kathmandu 380
Valley, especially during the pre-monsoon period (Panday and Prinn, 2009; Putero et al., 2015; 381
Bhardwaj et al., 2017). During the pre-monsoon season, frequent agro-residue burning and forest 382
fires are reported in the IGP region including southern Nepal and the Himalayan foothills in 383
India and Nepal (Ram and Sarin, 2010; Vadrevu et al., 2012), and in the Kathmandu Valley. This 384
season is also characterized by the strongest daytime local wind speeds (averaging 4-6 m s-1) in 385
the Kathmandu Valley (Mahata et al., 2017). Our study also observed several episodes of days 386
with both elevated CO mixing ratios (Figure 2) and O3 mixing ratios (also measured in parts per 387
billion by volume, hereafter the unit is denoted as ppb) (Figure 5) during April and May, 388
especially during the late afternoon period. The influence of regional pollutants was investigated 389
by comparing a 2-week period with normal CO levels (16–30 March (hereafter “period I”) with 390
Atmos. Chem. Phys. Discuss., https://doi.org/10.5194/acp-2017-709Manuscript under review for journal Atmos. Chem. Phys.Discussion started: 18 December 2017c© Author(s) 2017. CC BY 4.0 License.
14
an adjacent two week period (1-15 April) with episodically high CO mixing ratios (hereafter 391
“period II”), which nicely fit with the “burst” in regional fire activity presented by Putero et al. 392
(2015) in their Figure 9. The t-test of the two data means in period I and period II at Bode, 393
Bhimdhunga and Naikhandi were performed at 95% confidence level and the differences were 394
found to be statistically significant (p < 0.5). 395
Figure 5a shows the diurnal cycle of CO mixing ratios during period I (faint color) and period II 396
(dark color) at Bode, Bhimdhunga and Naikhandi. The difference between two periods was 397
calculated by subtracting the average of period I from average of period II. The average CO 398
mixing ratios during period II were elevated with respect to period I by 157 ppb at Bode, 175 399
ppb at Bhimdhunga, and 176 ppb at Naikhandi. The enhancements in mixing ratios at three sites 400
were fairly similar from hour to hour throughout the day, with the exception of the late afternoon 401
when the enhancement was generally greatest. This consistency across the sites suggests that the 402
episode was caused by a large-scale enhancement (regional contribution) being added onto the 403
prevailing local pollution levels at all the sites. A large-scale source would also be consistent 404
with the greater enhancements of CO at the outskirt sites, which would be most directly affected 405
by regional pollution, compared to the central valley site of Bode with strong local sources. The 406
enhancement during the period II is substantial (statistically significant as mentioned above), 407
representing an increase of approximately 45% at the outskirt sites of Bhimdhunga and 408
Naikhandi (which start with lower CO levels), and 23% at Bode. During both periods I and II, 409
local winds from west (the opposite direction from the brick kilns, which were mostly located to 410
the southeast of Bode) were dominant during daytime at Bode (Figure 5b, c). This suggests that 411
the elevation in CO levels was caused by additional emissions in period II in the regions to the 412
west and southwest of the Kathmandu Valley, e.g., large scale agricultural burning and forest 413
fires during this period, as also noted by Putero et al. (2015) (see their Figure 9). Far away, in 414
Lumbini in the southern part of Nepal (Rupakheti et al., 2016), and Pantnagar in northern IGP in 415
India (Bharwdwaj et al., 2017), about 220 km (aerial distance) to the southwest and 585 km to 416
the west, respectively, of the Kathmandu Valley, CO episodes were also observed during the 417
spring season of 2013, providing a strong indication that the episode in period II was indeed 418
regional in nature. 419
420
Atmos. Chem. Phys. Discuss., https://doi.org/10.5194/acp-2017-709Manuscript under review for journal Atmos. Chem. Phys.Discussion started: 18 December 2017c© Author(s) 2017. CC BY 4.0 License.
15
3.3 O3 in the Kathmandu Valley and surrounding areas 421
Figure 6 shows the hourly average and daily maximum 8-hour average of O3 mixing ratios at 422
Bode, Paknajol, and Nagarkot from measurements during the SusKat campaign and afterwards, 423
along with O3 mixing ratios from a previous study (November 2003 - October 2004; Pudasainee 424
et al., 2006) at the Pulchowk site (4 km away from Paknajol) in the Latitpur district. The daily 425
maximum 8-hour average O3 was calculated by selecting the maximum O3 mixing ratio from 8 426
hour running averages during each day. The nighttime mixing ratio of hourly O3 drops close to 427
zero in Bode, Paknajol and Pulchowk in the winter season. This is a typical characteristic of 428
many urban areas where reaction with NO at night depletes O3 from the boundary layer (e.g., 429
Talbot et al., 2005). In the pre-monsoon and monsoon months, the titration is not as strong and 430
the hourly O3 falls, but generally remains above 10 ppb. Nagarkot, in contrast, is above the 431
valley’s boundary layer and has lesser NO for titration at night at this hill station as has been 432
observed in another hill station in Himalayan foothills (Naja and Lal, 2002). Thus, the O3 level 433
remains above 25 ppb during the entire year at Nagarkot. As also shown in Table 3, at all sites, 434
the O3 mixing ratios were highest in the pre-monsoon, but the timing of the lowest seasonal 435
values varied across the sites: post-monsoon in Bode, winter in Paknajol and monsoon in 436
Nagarkot. Such differences in minimum O3 across the sites can be anticipated due to the 437
locations of the sites (e.g., urban, semi-urban, rural and hilltop sites, with differing availabilities 438
of O3 precursors from different emission sources). The seasonal variations of O3 observed at 439
Bode in this study are consistent with Putero et al. (2015) and Pudasainee et al. (2006), who also 440
observed O3 maxima during the pre-monsoon, but O3 minima during the winter season. 441
442
The daily maximum 8-hour average O3 mixing ratio (solid colored circles in Figure 6) exceeded 443
the WHO recommended guideline of 50 ppb (WHO, 2006, black dotted line in Figure 6) most 444
frequently during the pre-monsoon period and the winter. During the observation period, the 445
daily maximum 8-hour average O3 exceeded the WHO guideline on 102 out of 353 days of 446
observation (29%) at Bode, 132/354 days (37%) at Paknajol and 159/357 days (45%) at 447
Nagarkot. The higher exceedance rate at Nagarkot is because it is at higher altitude, which 448
results in (i) greater exposure to large-scale regional pollution, especially from forest fire in the 449
Himalayan foothills and agro residue burning in the IGP region, outside the valley (Sinha et al., 450
2014, Putero et al., 2015), (ii) less titration of O3 by NOx, being farther away from the main 451
Atmos. Chem. Phys. Discuss., https://doi.org/10.5194/acp-2017-709Manuscript under review for journal Atmos. Chem. Phys.Discussion started: 18 December 2017c© Author(s) 2017. CC BY 4.0 License.
16
pollution sources, and (iii) exposure to O3 rich free tropospheric air, including influences from 452
stratospheric intrusions. During the SusKat-ABC campaign in 2013 and later in 2014, passive 453
sampling of various gaseous pollutants (SO2, NOx, NH3 and O3) was also carried out at fourteen 454
sites including urban/semi-urban sites (Bode, Indrachowk, Maharajganj, Mangal Bazar, 455
Suryabinayak, Bhaisepati, Budhanilkantha, Kirtipur, and Lubhu) and rural sites (Bhimdhunga, 456
Naikhandi, Sankhu, Tinpiple, and Nagarkot) in the Kathmandu Valley (Kiros et al., 2016). 457
Similar to this study, they also observed higher O3 mixing ratios in rural areas than the 458
urban/semi-urban sites in the Kathmandu Valley. Exceedances of the WHO standard are most 459
common during the pre-monsoon season, occurring 78% (72/92 days), 88% (78/89 days) and 460
92% (85/92 days) of the time at Bode, Paknajol and Nagarkot, respectively. Thus, in the context 461
of protecting public health, crops and regional vegetation, the O3 mixing ratios in the Kathmandu 462
Valley and surrounding areas clearly indicate the urgent need for mitigation action aimed at 463
reducing emissions of its precursor gases NOx and VOCs. 464
465
The SusKat-ABC O3 data can be compared to observations made about a decade ago by 466
Pudasainee et al. (2006) at the urban site of Pulchowk, not far from Paknajol, as plotted in Figure 467
6d. The daily maximum 8-hour average O3 had exceeded the WHO guideline at Pulchowk for 468
33% (95/292 days) of days during the observation from November 2003 to October 2004. The 469
exceedance was 38% (133/354 days) of days at Paknajol during Feb 2013 - March 2014. Due to 470
inter-annual variability and differences in the seasonal observation time periods at Pulchowk and 471
Pakanajol, we cannot make any conclusions about trends over the decade between the 472
observations. However, a clear similarity between the observations is that most of the 473
exceedance took place during pre-monsoon season, during which both studies have observations 474
throughout the season (~90 days). The percentage of exceedance at Pulchowk during the pre-475
monsoon season in 2003-2004 was 70% (63/90 days) and at Pakanajol in 2013 it was 88% 476
(78/89 days). However, like for the annual fraction of exceedances, due to inter-annual 477
variability we cannot say that the 18% (or ca. 15 days) difference in the exceedances is 478
significant. A longer term O3 record would be needed to really establish if there is a trend in the 479
ozone concentrations. 480
481
482
Atmos. Chem. Phys. Discuss., https://doi.org/10.5194/acp-2017-709Manuscript under review for journal Atmos. Chem. Phys.Discussion started: 18 December 2017c© Author(s) 2017. CC BY 4.0 License.
17
3.4 O3 seasonal and diurnal variation 483
The seasonal average O3 mixing ratios at Bode, Nagarkot and Paknajol are shown in Table 3. For 484
comparison, the O3 mixing ratios measured at two sites in India, (i) Manora Peak (1958 m asl), 485
ca. 9 km from Nainital city, a site in rural mountain setting and (ii) Delhi, a highly-polluted 486
urban setting in northwest IGP are also listed in the Table, based on results from Kumar et al. 487
(2010) and Ghude et al. (2008). There is a strong similarity between the urban and semi-urban 488
sites in Nepal (i.e., Bode, Pakanajol) and India (i.e., Delhi), as well as between the rural and 489
mountain sites in Nepal (i.e., Nagarkot) and India (i.e., Manora Peak), with small differences. 490
The peak mixing ratios were in the pre-monsoon period: at the rural and mountain sites the peak 491
ozone mixing ratio values were very similar (64 and 62 ppb for Nagarkot and Manora Peak, 492
respectively) and are due to influences discussed earlier for Nagarkot; at the sub-urban and urban 493
sites the pre-monsoon values are significantly lower (ca. 40, 42, 33 ppb for Bode, Paknajol, 494
Delhi, respectively) due to fresh NOx emissions near the urban sites and the consequent titration 495
of ozone with NO. The lowest O3 seasonal values at rural and mountain sites typically occur in 496
the monsoon months while for semi-urban and urban sites, the minimum was observed during 497
post-monsoon (Bode) and winter (Paknajol). 498
Figure 7 shows the diurnal variation of O3 mixing ratios at Bode, Paknajol and Nagarkot in the 499
different seasons. The typical O3 maximum mixing ratio in the early afternoon at the urban and 500
semi-urban sites is mainly due to daytime photochemical production, as well as entrainment of 501
ozone-rich free tropospheric air into the boundary layer, which Putero et al. (2015) suggested 502
results in the broader afternoon peak of ozone during the pre-monsoon at Paknajol site, also 503
observed at Bode site (and somewhat at Nagarkot). 504
The mixing ratios are relatively constant throughout the day at Nagarkot, which, being a hilltop 505
site, is largely representative of the lower free tropospheric regional pollution values, but is also 506
affected by ozone production from precursors transported from the Kathmandu Valley. 507
508
3.5 CO emission flux estimate 509
It is possible to determine a top-down estimate of the average CO emission flux for the region 510
around the Bode site by applying an approach that was developed and used in Mues et al. (2017) 511
to estimate the emission fluxes of BC at Bode. The analysis of Mues et al. (2017) found BC 512
Atmos. Chem. Phys. Discuss., https://doi.org/10.5194/acp-2017-709Manuscript under review for journal Atmos. Chem. Phys.Discussion started: 18 December 2017c© Author(s) 2017. CC BY 4.0 License.
18
fluxes for the Kathmandu Valley that were considerably higher than the widely-used EDGAR 513
HTAP emission database (Version 2.2). Support for this top-down estimate was found by 514
considering the BC concentrations and fluxes for the Kathmandu Valley in comparison to Delhi 515
and Mumbai; although the observed BC concentrations were similar in all three locations, the 516
EDGAR HTAP V2.2 emissions of BC for the Kathmandu Valley are much lower than those for 517
Delhi and Mumbai, while the top-down emissions estimate for the Kathmandu Valley were 518
similar to the emissions from EDGAR HTAP V2.2 for Delhi and Mumbai (Mues et al., 2017). 519
520
Here we apply the same method as developed in Mues et al. (2017) to estimate the CO fluxes 521
based on the observed CO mixing ratio and ceilometer observations of the mixing layer height 522
(MLH) in Bode for the period of a year (March 2013-February 2014). It is important to note that 523
the term “mixing layer”, applied generally to ceilometer observations, is not entirely accurate, 524
since the degree of mixing in the nocturnal stable layer is drastically reduced versus daytime. 525
This adds a degree of uncertainty to the application of ceilometer observations to compute top-526
down emissions estimates, which will only be resolved once nocturnal vertical profile 527
measurements are also available in order to characterize the nocturnal boundary layer 528
characteristics and the degree to which the surface observations are representative of the mixing 529
ratios throughout the vertical column of the nocturnal stable layer. 530
531
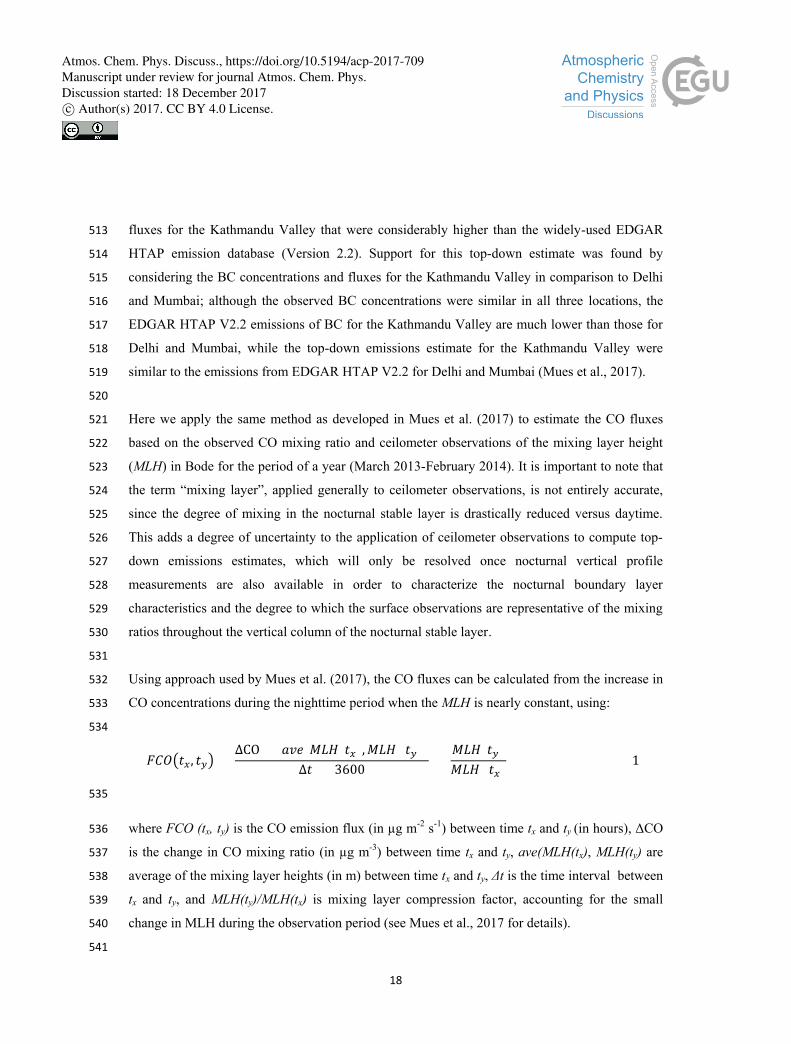
Using approach used by Mues et al. (2017), the CO fluxes can be calculated from the increase in 532
CO concentrations during the nighttime period when the MLH is nearly constant, using: 533
534
𝐹𝐹𝐹�𝑡𝑥, 𝑡𝑦� = ∆CO × 𝑎𝑎𝑎(𝑀𝑀𝑀(𝑡𝑥),𝑀𝑀𝑀 (𝑡𝑦))
∆𝑡 × 3600 ×
𝑀𝑀𝑀(𝑡𝑦)𝑀𝑀𝑀 (𝑡𝑥)
(1)
535
where FCO (tx, ty) is the CO emission flux (in µg m-2 s-1) between time tx and ty (in hours), ΔCO 536
is the change in CO mixing ratio (in µg m-3) between time tx and ty, ave(MLH(tx), MLH(ty) are 537
average of the mixing layer heights (in m) between time tx and ty, Δt is the time interval between 538
tx and ty, and MLH(ty)/MLH(tx) is mixing layer compression factor, accounting for the small 539
change in MLH during the observation period (see Mues et al., 2017 for details). 540
541
Atmos. Chem. Phys. Discuss., https://doi.org/10.5194/acp-2017-709Manuscript under review for journal Atmos. Chem. Phys.Discussion started: 18 December 2017c© Author(s) 2017. CC BY 4.0 License.

19
This method of calculating the CO emission flux is based on four main assumptions: (i) CO is 542
well-mixed horizontally and vertically within the mixed layer in the region immediately 543
surrounding the Bode site; (ii) the MLH remains fairly constant during the night so that the 544
product of the CO concentration (µg m-3) and the MLH (m) represents CO mass per unit area 545
within the column, and any change in this represents the net flux into the column; (iii) the 546
transport of air pollutants into and out of the stable nocturnal boundary layer of the valley is 547
negligible, which is supported by the calm winds (<1 m s-1) during the night and morning hours 548
at the site (Mahata et al., 2017); and (iv), the CO emissions during the daytime are similar to 549
those at night, an assumption that is viable on average for some sources like brick kilns which 550
operate day and night, but which does not apply to all sources, e.g., the technique will tend to 551
underestimate emissions due to traffic, which are typically much stronger during the day than at 552
night, while it will overestimate emissions due to waste burning, which is typically more 553
prevalent during the night and early morning (pre-sunrise) than during the daytime. Assumption 554
(iv) is made because equation 1 only works well for calculating the CO flux at night, when there 555
is a relatively constant MLH and limited vertical and horizontal mixing. It is not possible to 556
directly compute the emission flux for a full 24-hour day using this top-down method, since the 557
emissions during the day could be either greater or smaller than at night, and because the other 558
assumptions do not hold (in particular there is considerable vertical mixing with the free 559
troposphere and stronger horizontal transport during the daytime). Thus the top-down 560
computation only provides a useful indicative value. However, while it is also not possible to 561
estimate how much different the daytime emissions are, it is possible to determine an absolute 562
lower bound for the CO flux (FCOmin) by making the extreme assumption that the CO emissions 563
are non-zero only during the hours which were used in the calculation, and that they were zero 564
during the rest of the day (this provides a lower bound to the emissions since the daytime 565
emissions physically cannot be negative). This lower bound of the flux (FCOmin) is thus 566
calculated by scaling back the 24-hour flux to only applying over the calculation time interval 567
(Δt), using: 568
569
𝐹𝐹𝐹𝑚𝑚𝑚. = 𝐹𝐹𝐹 × ∆𝑡 24
(2)
570
Atmos. Chem. Phys. Discuss., https://doi.org/10.5194/acp-2017-709Manuscript under review for journal Atmos. Chem. Phys.Discussion started: 18 December 2017c© Author(s) 2017. CC BY 4.0 License.
20
Figure 8 shows the estimated monthly CO emission flux, along with its 25th and 75th percentile 571
values as an indication of the variability of the estimated flux in each month; the lower bound of 572
the CO flux based on Equation 2 is also shown. The estimated annual mean CO flux at Bode is 573
4.92 µg m-2 s-1. Seasonally, the emissions are computed to be highest during December to April 574
(3.64-8.36 µg m-2 s-1), coinciding with the brick kiln operation period, which resulted in elevated 575
concentrations of most pollutants at Bode (Kim et al., 2015; Chen et al., 2016; Sarkar et al., 576
2016; Mahata et al., 2017; Mues et al., 2017), including CO (Bhardwaj et al., 2017; Mahata et 577
al., 2017), while the emissions were generally lower during the remaining months (0.54-5.37 µg 578
m-2 s-1). The uncertainty in the top-down CO emissions estimate will be largest during June to 579
October, due to the greater diurnal and day-to-day variability with the minimum and maximum 580
CO mixing ratio values during the night and early morning used in Equation 1 often being less 581
distinct than in the other months. 582
583
Comparing the annual mean top-down estimated CO emission flux at Bode (4.92 µg m-2 s-1) with 584
available global and regional emission inventories, the top-down estimated CO flux is twice the 585
value, 2.4 µg m-2 s-1, for the Kathmandu Valley in the EDGAR HTAP V2.2 emission inventory 586
database for 2010 [note that the CO emission values for the location of Bode and averaged for 587
the valley as a whole (27.65-27.75°N, 85.25-85.40°E) were the same to two significant figures]. 588
The estimated CO flux was 6.5-8 times as high as in the REAS database (0.63-0.76 µg m-2 s-1, 589
based on the 2008 values in Kurokawa et al., 2013), and between 3 and 14 times higher than the 590
values in the INTEX-B database for 2006 (0.35-1.77 µg m-2 s-1; Zhang et al., 2009). The large 591
differences between our estimated CO emission flux and these emission databases is not likely to 592
be due to the comparison of data for different years, rather it indicates the substantial 593
uncertainties in both the top-down and bottom-up approaches to estimating the emission flux. 594
Although our approximation of the emission flux relies on several assumptions, the fact that the 595
lower bound value that we calculate is still as high as or higher than the values in some of the 596
published emission datasets likely indicates that the bottom-up emissions are missing or 597
underestimating some important sources, which will be important to examine carefully and 598
improve as a basis for interpreting future modelling studies of CO pollution in the Kathmandu 599
Valley and surrounding regions, as well as for assessing possible mitigation options. 600
601
Atmos. Chem. Phys. Discuss., https://doi.org/10.5194/acp-2017-709Manuscript under review for journal Atmos. Chem. Phys.Discussion started: 18 December 2017c© Author(s) 2017. CC BY 4.0 License.
21
4. Conclusions 602
Ambient CO and O3 mixing ratios were measured in the framework of the SusKat-ABC 603
international air pollution measurement campaign at five sites (Bode, Paknajol, Bhimdhunga, 604
Naikhandi and Nagarkot) in the Kathmandu Valley (Table 1) and its fringes, initially during 605
January to July 2013, and later extended to one year at three sites (Bode, Paknajol and Nagarkot) 606
to better understand their seasonal characteristics. The observed CO and O3 levels at all sites 607
except Nagarkot were characteristic of highly-polluted urban settings, with the particular feature 608
that the bowl-shaped valley and resulting meteorology had several effects on the pollution levels. 609
At all sites, the CO mixing ratios were higher during the early morning and late evening, 610
especially connected to the interplay between the ventilation of the boundary layer and the 611
diurnal cycles of the emission sources. Under calm wind conditions that limited mixing within, 612
into and out of the Kathmandu Valley, the morning CO peak tended to be more pronounced due 613
to the buildup of pollution at night in the shallow planetary boundary layer. This nocturnal 614
buildup was especially strong during January to April at Bode, with the mean CO mixing ratio 615
increasing by about a factor of 4 in the 12 hours from 20:00 to 08:00, especially due to operation 616
of nearby brick kilns continuing through the night. During the daytime, the wind becomes 617
stronger and the horizontal and vertical circulation dilutes and transports pollution around and 618
out of the valley. Although normally the pollution levels are presumed to be higher in the heavily 619
populated valley than in the immediate surrounding region, occasionally the synoptic circulation 620
will transport in CO and O3-rich air, especially influenced by forest fires and agro-residue 621
burning in the IGP region and Himalayan foothills, as was observed on a few episode days in the 622
pre-monsoon season. 623
The observed O3 mixing ratio was highest in the pre-monsoon season at all sites, and the daily 624
maximum 8-hour average O3 exceeded the WHO guideline of 50 ppb on about 80% of the days 625
during this season at the semi-urban/urban sites of Bode and Paknajol, while at Nagarkot (which 626
is in the free troposphere, i.e., above valley’s boundary layer most of the time, especially during 627
nighttime) it exceeded the WHO guideline on 92% of the days in pre-monsoon season. During 628
the whole observation period, the 8 hour maximum average O3 exceeded the WHO 629
recommended value on 29%, 37% and 45% of the days at Bode, Paknajol and Nagarkot, 630
respectively. The diurnal cycle showed evidence of photochemical production as well as possible 631
Atmos. Chem. Phys. Discuss., https://doi.org/10.5194/acp-2017-709Manuscript under review for journal Atmos. Chem. Phys.Discussion started: 18 December 2017c© Author(s) 2017. CC BY 4.0 License.
22
down-mixing of O3 during the daytime, with the hourly mixing ratio at the polluted site 632
increasing from typically 5-20 ppb in the morning to an early afternoon peak of 60-120 ppb. 633
These high O3 levels have deleterious effects on human health and ecosystems, including agro-634
ecosystems in the Kathmandu Valley and surrounding regions, thus justifying mitigation 635
measures to help reduce the levels of O3 (its precursors VOCs and NOx), CO and other 636
pollutants. Determining the most effective mitigation measures will be challenging due to the 637
complicated interplay of pollution and meteorology as well as local and regional pollution 638
sources. This study has provided information on current ambient levels and the diurnal/seasonal 639
variations. This will be helpful in the design of future policies, both as a baseline for evaluating 640
the effectiveness of mitigation measures, as well as giving insight into the connections between 641
various pollutant sources (e.g., brick kilns) and their impacts on seasonally elevated CO levels, 642
especially at nighttime. One particular contribution has been the development of a top-down 643
estimate of the total emission flux of CO at Bode, which was found to be 4.92 µg m-2 s-1. This is 644
several times higher (by a factor of 2-14 times) than the CO emission fluxes for the Kathmandu 645
Valley in state-of-the-art inventories such as EDGAR-HTAP, REAS, and INTEX-B. This points 646
out the need for the development of updated comprehensive emission inventory databases for 647
this region, in order to provide more accurate input to model simulations needed to assess air 648
pollution processes and mitigation options for the Kathmandu Valley and the broader 649
surrounding region. 650
While the high levels of particulate pollution in the Kathmandu Valley have caught the main 651
attention of the public and policymakers, due to their immediately visible nature, our paper 652
points out that ozone is also a serious problem here. In fact, its higher levels on the nearby 653
mountaintop location of Nagarkot, which is much more representative of regional air pollution, 654
point to an ozone problem in the wider foothills of the Himalayas that the extent of ozone 655
pollution in the large surrounding Himalayan foothills has been insufficiently recognized until 656
our study, and that needs monitoring and research to identify feasible mitigation options. 657
658
659
660
Atmos. Chem. Phys. Discuss., https://doi.org/10.5194/acp-2017-709Manuscript under review for journal Atmos. Chem. Phys.Discussion started: 18 December 2017c© Author(s) 2017. CC BY 4.0 License.
23
Acknowledgement 661
We are thankful to the funders of the IASS – the German Ministry of Education and Research 662
(BMBF) and the Brandenburg State Ministry of Science, Research and Culture (MWFK) – for 663
their generous support in making these measurements and their analysis possible. This study was 664
partially supported by core funds of ICIMOD contributed by the governments of Afghanistan, 665
Australia, Austria, Bangladesh, Bhutan, China, India, Myanmar, Nepal, Norway, Pakistan, 666
Switzerland, and the United Kingdom, as well as by funds from the Government of Sweden to 667
ICIMOD’s Atmosphere Initiative. The authors would like to thank Bhupesh Adhikary, 668
Bhogendra Kathayat, Shyam Newar, Dipesh Rupakheti, Nirjala Koirala, Ashish Bhatta, Begam 669
Roka, Sunil Babu Khatry, Giampietro Verza, and several staff members at the Kamdhenu 670
Madhyamik Vidhyalaya, Naikhandi who assisted in the field measurements, Siva Praveen 671
Puppala for initial data processing, and Pankaj Sadavarte for helping with the emission 672
databases. We are grateful to the Department of Environmental Sciences, University of Virginia, 673
USA, for making available CO and O3 instruments for the measurements. We also thank the staff 674
at Real Time Solutions (RTS), Lalitpur, Nepal for providing an automatic weather station. 675
676
References 677
Avnery, S., Mauzerall, D. L., Liu, J., and Horowitz, L. W.: Global crop yield reductions due to 678
surface ozone exposure: 1. Year 2000 crop production losses and economic damage, Atmos. 679
Environ., 45, 2284–2296, doi:10.1016/j.atmosenv.2010.11.045, 2011. 680
681 Bhardwaj, P., Naja, M., Rupakheti, M., Panday, A. K., Kumar, R., Mahata, K., Lal, S., 682
Lawrence, M. G., Chandola, H. C.: Variations in surface ozone and CO in the Kathmandu Valley 683
during SusKat-ABC international field campaign, Atmos. Chem. Phys. Discus., 684
https://doi.org/10.5194/acp-2017-306, 2017. 685
Bonasoni P., P. Laj, A. Marinoni, M. Sprenger, F. Angelini, J. Arduini, U. Bonafè, F. Calzolari, 686
T. Colombo, S. Decesari, C. Di Biagio, A. G. di Sarra, et. al.: Atmospheric brown clouds in the 687
Himalayas: first two years of continuous observations at the Nepal Climate Observatory-Pyramid 688
(5079 m). Atmos. Chem. Phys., 10, 7515-7531, 2010. 689
Atmos. Chem. Phys. Discuss., https://doi.org/10.5194/acp-2017-709Manuscript under review for journal Atmos. Chem. Phys.Discussion started: 18 December 2017c© Author(s) 2017. CC BY 4.0 License.
24
Brauer, M., Amman, M., Burnett, R. T., Cohen, A., Dentener, F., Zenati, M., Henderson, S. B., 690
Krzyzanowski, M., Martin, R. V., Van Dingenen, R., van Donkelaar, A., and Thurston, G. D.: 691
Exposure assessment for estimation of the global burden of disease attributable to outdoor air 692
pollution, Environ. Sci. Technol., 46, 652–660, doi:10.1021/es2025752, 2012. 693
Burney, J., and Ramanathan, V.: Recent climate and air pollution impacts on Indian agriculture, 694
Proceedings of the National Academy of Sciences of the United States of America, 111, 16319-695
16324, doi:10.1073/pnas.1317275111, 2014. 696
Chen, P., Kang, S., Li, C., Rupakheti, M., Yan, F., Li, Q., Ji, Z., Zhang, Q., Luo, W., Sillanpää, 697
M.: Characteristics and sources of polycyclic aromatic hydrocarbons in atmospheric aerosols in 698
the Kathmandu Valley, Nepal, Sci. Total Environ., 538, 86-92, doi: 699
10.1016/j.scitotenv.2015.08.006, 2015. 700
Cristofanelli, P., Bracci, A., Sprenger, M., Marinoni, A., Bonafè, U., Calzolari, F., Duchi, R., 701
Laj, P., Pichon, J. M., Roccato, F., Venzac, H., Vuillermoz, E., and Bonasoni, P.: Tropospheric 702
ozone variations at the Nepal Climate Observatory- Pyramid (Himalayas, 5079ma.s.l.) and 703
influence of deep stratospheric intrusion events, Atmos. Chem. Phys., 10, 6537–6549, 704
doi:10.5194/acp-10-6537-2010, 2010. 705
Dentener, F., Stevenson, D., Ellingsen, K., Van Noije, T., Schultz, M., Amann, M., Atherton, C., 706
Bell, N., Bergmann, D., and Bey, I.: The global atmospheric environment for the next 707
generation, Environ. Sci. Technol., 40, 3586-3594, 2006. 708
Davidson, C. I., Lin, S.-F., and Osborn, J. F.: Indoor and outdoor air pollution in the Himalayas, 709
Environ. Sci. Technol., 20(6), 561 – 566, doi:10.1021/es00148a003, 1986. 710
Dhungel, S., Kathayat, B., Mahata, K., and Panday, A.: Transport of regional pollutants through 711
a remote trans-Himalayan valley in Nepal, Atmos. Chem. Phys. Discuss., 2016, 1-23, 712
doi:10.5194/acp-2016-824, 2016. 713
Department of Transport Management (DoTM).: Annual report of Ministry of Labor and 714
Transport Management, Government of Nepal, 2015. 715
Atmos. Chem. Phys. Discuss., https://doi.org/10.5194/acp-2017-709Manuscript under review for journal Atmos. Chem. Phys.Discussion started: 18 December 2017c© Author(s) 2017. CC BY 4.0 License.
25
Forouzanfar, M. H., Alexander, L., Anderson, H. R., Bachman, V. F., Biryukov, S., Brauer, M., 716
Burnett, R., Casey, D., Coates, M. M., and Cohen, A.: Global, regional, and national comparative 717
risk assessment of 79 behavioural, environmental and occupational, and metabolic risks or 718
clusters of risks in 188 countries, 1990–2013: a systematic analysis for the global burden of 719
disease study 2013, Lancet, 386, 2287-2323, doi: 10.1016/S0140-6736(15)00128-2, 2015. 720
Fowler, D., Flechard, C., Cape, J. N., Storeton-West, R. L., and Coyle, M.: Measurements of 721
ozone deposition to vegetation quantifying the flux, the stomatal and nonstomatal components, 722
Water Air Soil Pollut., 130, 63–74, doi:10.1023/a:1012243317471, 2001. 723
Geiß, A., Wiegner, M., Bonn, B., Schäfer, K., Forkel, R., von Schneidemesser, E., Münkel, C., 724
Chan, K. L., and Nothard, R.: Mixing layer height as an indicator for urban air quality?, Atmos. 725
Meas. Tech. Discuss., 2017, 1-32, doi:10.5194/amt-2017-53, 2017. 726
Giri, D., Murthy, K., Adhikary, P., Khanal, S.: Ambient air quality of Kathmandu Valley as 727
reflected by atmospheric particulate matter concentrations (PM10), Int. J. Environ. Sci. Technol. 728
3, 403–410, 2006. 729
International Energy Agency (IEA).: Energy and air pollution, World Energy Outlook Special 730
Report 2016, International Energy Agency, 2016. 731
Janssens-Maenhout, G., Dentener, F., van Aardenne, J., Monni, S., Pagliari, V., Orlandini, L., 732
Klimont, Z., Kurokawa, J., Akimoto, H., Ohara, T., Wankmüller, R., Battye, B., Grano, D., 733
Zuber, A., and Keating, T.: EDGAR-HTAP: a harmonized gridded air pollution emission dataset 734
based on national inventories, Tech. Rep. JRC68434, Publications Office of the European Union, 735
doi:10.2788/14102 (online), http://publications.jrc.ec.europa.eu/repository/handle/JRC68434, 736
2000. 737
Kiros, F., Shakya, K. M., Rupakheti, M., Regmi, R. P., Maharjan, R., Byanju, R. M., Naja, M., 738
Mahata, K., Kathayat, B., and Peltier, R. E.: Variability of Anthropogenic Gases: Nitrogen 739
oxides, sulfur dioxide, ozone and ammonia in Kathmandu Valley, Nepal, Aerosol Air Qual. Res., 740
16: 3088–3101, 2016. 741
Atmos. Chem. Phys. Discuss., https://doi.org/10.5194/acp-2017-709Manuscript under review for journal Atmos. Chem. Phys.Discussion started: 18 December 2017c© Author(s) 2017. CC BY 4.0 License.
26
Kumar, R., Naja, M., Venkataramani, S., and Wild, O.: Variation in surface ozone at Nainital: A 742
high-altitude site in the central Himalayas, J. Geophys. Res., 115 (D16), 743
doi:10.1029/2009JD013715, 2010. 744
Kurokawa, J., Ohara, T., Morikawa, T., Hanayama, S., Janssens-Maenhout, G., Fukui, T., 745
Kawashima, K., and Akimoto, H.: Emissions of air pollutants and greenhouse gases over Asian 746
regions during 2000-2008: Regional emission inventory in Asia (REAS) version 2, Atmos. 747
Chem. Phys., 13, 11 019–11 058, doi:10.5194/acp-13-11019-2013, 2013. 748
Lawrence, M., and Lelieveld, J.: Atmospheric pollutant outflow from southern Asia: a review, 749
Atmos. Chem. Phys., 10, 11017-11096, 2010. 750
Lim, S. S., Vos, T., Flaxman, A. D., Danaei, G., Shibuya, K., Adair-Rohani, H., Amann, M., 751
Anderson, H. R., Andrews, K. G., Aryee, M., Atkinson, C., Bacchus, L. J., Bahalim, A. N., 752
Balakrishnan, K., Balmes, J., Barker-Collo, S., Baxter, A., Bell, M. L., Blore, J. D., Blyth, F., 753
Bonner, C., Borges, G., Bourne, R…and Ezzati, M.: A comparative risk assessment of burden of 754
disease and injury attributable to 67 risk factors and risk factor clusters in 21 regions, 1990-2010: 755
a systematic analysis for the global burden of disease study 2010, Lancet, 380, 2224–2260, 2012. 756
Lüthi, Z. L., Škerlak, B., Kim, S. W., Lauer, A., Mues, A., Rupakheti, M., and Kang, S.: 757
Atmospheric brown clouds reach the Tibetan Plateau by crossing the Himalayas, Atmos. Chem. 758
Phys. 15, 6007-6021, doi:10.5194/acp-15-6007-2015, 2015. 759
Mahata, K. S., Panday, A. K., Rupakheti, M., Singh, A., Naja, M., and Lawrence, M. G.: 760
Seasonal and diurnal variations of methane and carbon dioxide in the Kathmandu Valley in the 761
foothills of the central Himalaya, Atmos. Chem. Phys. Discuss., 2017, 1-55, doi:10.5194/acp-762
2016-1136, 2017. 763
Marinoni, A., Cristofanelli, P., Laj, P., Duchi., R., Putero, D., Calzolari, F., Landi., T. C., 764
Vuillermoz, E., Maione, M., and Bonasoni, P.: High black carbon and ozone concentrations 765
during pollution transport in the Himalayas: Five years of continuous observations at NCO-P 766
global GAW station, J. Environ. Sci., 25(8) 1618–1625, 2013. 767
Atmos. Chem. Phys. Discuss., https://doi.org/10.5194/acp-2017-709Manuscript under review for journal Atmos. Chem. Phys.Discussion started: 18 December 2017c© Author(s) 2017. CC BY 4.0 License.
27
Ming, J., Xiao, C., Sun, J., Kang, S.-C, and Bonasoni, P.: Carbonaceous particles in the 768
atmosphere and precipitation of the Nam Co region, central Tibet, J. Environ. Sci.-CHINA, 769
22(11), 1748-1756, 2010. 770
Monks, P. S., Granier, C., Fuzzi, S., Stohl, A., Williams, M. L., Akimoto, H., Amann, M., 771
Baklanov, A., Baltensperger, U., Bey, I., Blake, N., Blake, R. S., Carslaw, K., Cooper, O. R., 772
Dentener, F., Fowler, D., Fragkou, E., Frost, G. J., Generoso, S., Ginoux, P., Grewe, V., 773
Guenther, A., Hansson, H. C., Henne, S., Hjorth, J., Hofzumahaus, A., Huntrieser, H., Isaksen, I. 774
S. A., Jenkin, M. E., Kaiser, J., Kanakidou, M., Klimont, Z., Kulmala, M., Laj, P., Lawrence, M. 775
G., Lee, J. D., Liousse, C., Maione, M., McFiggans, G., Metzger, A., Mieville, A., 776
Moussiopoulos, N., Orlando, J. J., O’Dowd, C. D., Palmer, P. I., Parrish, D. D., Petzold, A., 777
Platt, U., Poeschl, U., Prevot, A. S. H., Reeves, C. E., Reimann, S., Rudich, Y., Sellegri, K., 778
Steinbrecher, R., Simpson, D., ten Brink, H., Theloke, J., van derWerf, G. R., Vautard, R., 779
Vestreng, V., Vlachokostas, C., and von Glasow, R.: Atmospheric composition change – global 780
and regional air quality, Atmos. Environ., 43, 5268–5350, doi:10.1016/j.atmosenv.2009.08.021, 781
2009. 782
Naja, M., and Lal, S.: Surface ozone and precursor gases at Gadanki (13.5°N, 79.2°E), a tropical 783
rural site in India, J. Geophys. Res. 107 (D14), ACH 8-1-ACH 8–13, doi:10.1029/2001jd000357, 784
2002. 785
Nayava, J. L.: Rainfall in Nepal, the Himalayan Rev. Nepal, Geographical Society, 12:1– 18, 786
1980. 787
Organisation for Economic Co-operation and Development (OECD): The economic 788
consequences of outdoor air pollution, OECD Publishing, 789
doi: http://dx.doi.org/10.1787/9789264257474-en, 2016. 790
Panday, A. K., and Prinn, R. G..: Diurnal cycle of air pollution in the Kathmandu Valley, Nepal: 791
Observations, J. Geophys. Res., 114 (D9), doi:10.1029/2008JD009777, 2009. 792
Panday, A. K. Prinn, R. G., and Schär, C.: Diurnal cycle of air pollution in the Kathmandu 793
Valley, Nepal: 2. Modeling results, J. Geophys. Res., 114 (D21), doi:10.1029/2008JD009808, 794
2009. 795
Atmos. Chem. Phys. Discuss., https://doi.org/10.5194/acp-2017-709Manuscript under review for journal Atmos. Chem. Phys.Discussion started: 18 December 2017c© Author(s) 2017. CC BY 4.0 License.
28
Pudasainee, D., Sapkota, B., Shrestha, M. L., Kaga, A., Kondo, A., and Inoue, Y.: Ground level 796
ozone concentrations and its association with NOx and meteorological parameters in Kathmandu 797
Valley, Nepal, Atmos. Environ., 40(40), 8081–8087, doi:10.1016/j.atmosenv.2006.07.011, 2006. 798
Putero, D., Cristofanelli, P., Marinoni, A., Adhikary, B., Duchi, R., Shrestha, S.D., Verza, G.P., 799
Landi, T.C., Calzolari, F., Busetto, M., Agrillo, G., Biancofiore, F., Di Carlo, P., Panday, A. K., 800
Rupakheti, M., and Bonasoni,P.: Seasonal variation of ozone and black carbon observed at 801
Paknajol, an urban site in the Kathmandu Valley, Nepal. Atmos. Chem. Phys., 15(24), 13957-802
13971, doi:10.5194/acp-15-13957-2015, 2015. 803
Ram, K., and Sarin, M.: Spatio-temporal variability in atmospheric abundances of EC, OC and 804
WSOC over Northern India, J. Aerosol Sci., 41, 88–98, 2010. 805
Regmi, R. P., Kitada, T., and Kurata, G.: Numerical simulation of late wintertime local flows in 806
Kathmandu Valley, Nepal: Implication for air pollution transport, J. Appl. Meteorol., 42, 389-807
403, 2003. 808
Rupakheti, M., Panday, A. K., Lawrence, M. G., Kim, S. W., Sinha, V., Kang, S. C., Naja, M., 809
Park, J. S., Hoor, P., Holben, B., Sharma, R. K., Mues, A., Mahata, K. S., Bhardwaj, P., Sarkar, 810
C., Rupakheti, D., Regmi, R. P., and Gustafsson, Ö.: Air pollution in the Himalayan foothills: 811
overview of the SusKat-ABC international air pollution measurement campaign in Nepal, 812
Atmos. Chem. Phys. Discuss., in preparation, 2017. 813
Rupakheti, D., Adhikary, B., Praveen, P. S., Rupakheti, M., Kang, S.-C., Mahata, K. S., Naja, 814
M., Zhang, Q., Panday, A. K., and Lawrence, M. G.: Pre-monsoon air quality over Lumbini, a 815
world heritage site along the Himalayan foothills, Atmos. Chem. Phys., 17, 11041-11063, 816
https://doi.org/10.5194/acp-17-11041-2017, 2017. 817
Sarkar, C., Sinha, V., Kumar, V., Rupakheti, M., Panday, A., Mahata, K.S., Rupakheti, D., 818
Kathayat, B., and Lawrence, M.G.: Overview of VOC emissions and chemistry from PTR-TOF-819
MS measurements during the SusKat-ABC campaign: high acetaldehyde, isoprene and isocyanic 820
acid in wintertime air of the Kathmandu Valley, Atmos. Chem. Phys., 16, 3979-4003, 2016. 821
Atmos. Chem. Phys. Discuss., https://doi.org/10.5194/acp-2017-709Manuscript under review for journal Atmos. Chem. Phys.Discussion started: 18 December 2017c© Author(s) 2017. CC BY 4.0 License.
29
Sarkar, C., Sinha, V., Sinha, B., Panday, A. K., Rupakheti, M., and Lawrence, M. G.: Source 822
apportionment of NMVOCs in the Kathmandu Valley during the SusKat-ABC international field 823
campaign using positive matrix factorization, Atmos. Chem. Phys., 17, 8129-8156, 2017. 824
Shakya, K. M., Rupakheti, M., Shahi, A., Maskey, R., Pradhan, B., Panday, A., Puppala, S. P., 825
Lawrence, M., and Peltier, R. E.: Near-road sampling of PM2. 5, BC, and fine-particle chemical 826
components in Kathmandu Valley, Nepal, Atmos. Chem. Phys., 17, 6503-6516, 827
https://doi.org/10.5194/acp-17-6503-2017, 2017. 828
Shrestha, A. B., Wake, C. P., Mayewski, P. A., and Dibb, J.E.: Maximum Temperature Trends in 829
the Himalaya and Its Vicinity: An Analysis Based on Temperature Records from Nepal for the 830
Period 1971–94, J. Climate, 12, 2775-2786, 1999. 831
Shrestha, S. R., Kim Oanh, N. T., Xu, Q., Rupakheti, M., and Lawrence, M. G.: Analysis of the 832
vehicle fleet in the Kathmandu Valley for estimation of environment and climate co-benefits of 833
technology intrusions, Atmos. Environ., 81, 579-590, 2013. 834
Silva, R. A., West, J. J., Zhang, Y., Anenberg, S. C., Lamarque, J.-F., Shindell, D. T., Collins, 835
W. J., Dalsoren, S., Faluvegi, G., Folberth, G., Horowitz, L. W., Nagashima, T., Naik, V., 836
Rumbold, S., Skeie, R., Sudo, K., Takemura, T., Bergmann, D., Cameron- Smith, P., Cionni, I., 837
Doherty, R. M., Eyring, V., Josse, B., MacKenzie, I. A., Plummer, D., Righi, M., Stevenson, D. 838
S., Strode, S., Szopa, S., and Zeng, G.: Global premature mortality due to anthropogenic outdoor 839
air pollution and the contribution of past climate change, Environ. Res. Lett., 8, 034005, 840
doi:10.1088/1748-9326/8/3/034005, 2013. 841
Talbot, R., Mao, H., and Sive, B.: Diurnal characteristics of surface level O3 and other important 842
trace gases in New England, J. Geophys. Res., 110 (D9), doi:10.1029/2004JD005449, 2005. 843
Tripathee, L., Kang, S.-C., Huang, J., Sharma, C., Sillanpaa, M., Guo, J., and Paudyal, R.: 844
Concentrations of trace elements in wet deposition over the central Himalayas, Nepal, Atmos. 845
Environ., 95, 231–238, 2014 846
Sinha, V., Kumar, V., and Sarkar, C.: Chemical composition of pre-monsoon air in the Indo-847
Gangetic Plain measured using a new air quality facility and PTR-MS: high surface ozone and 848
Atmos. Chem. Phys. Discuss., https://doi.org/10.5194/acp-2017-709Manuscript under review for journal Atmos. Chem. Phys.Discussion started: 18 December 2017c© Author(s) 2017. CC BY 4.0 License.
30
strong influence of biomass burning, Atmos. Chem. Phys., 14, 5921-5941, doi:10.5194/acp-14-849
5921-2014, 2014. 850
Vadrevu, K., Ellicott, E., Giglio, L., Badarinath, K., Vermote, E., Justice, C., Lau, W.: 851
Vegetation fires in the Himalayan region - aerosol load, black carbon emissions and smoke 852
plume heights, Atmos. Environ., 47, 241–251, 2012. 853
World Health Organization (WHO): WHO Air quality guidelines for particulate matter, ozone, 854
nitrogen dioxide and sulfur dioxide, Global update 2005, Summary of risk assessment, WHO 855
Press, Geneva, Switzerland, 2006. 856
World Health Organization (WHO).: 7 million premature deaths annually linked to air pollution, 857
2014 (http://www.who.int/mediacentre/news/releases/2014/air-pollution/en/) 858
Zhang, Q., Streets, D., Carmichael, G., He, K., Huo, H., Kannari, A., Klimont, Z., Park, I., 859
Reddy, S., Fu, J., Chen, D., Duan, L., Lei, Y., Wang, L., and Yao, Z.: Asian emissions in 2006 860
for the NASA INTEX-B mission, Atmos. Chem. Phys., 9, 5131–5153, 2009. 861
862
Atmos. Chem. Phys. Discuss., https://doi.org/10.5194/acp-2017-709Manuscript under review for journal Atmos. Chem. Phys.Discussion started: 18 December 2017c© Author(s) 2017. CC BY 4.0 License.
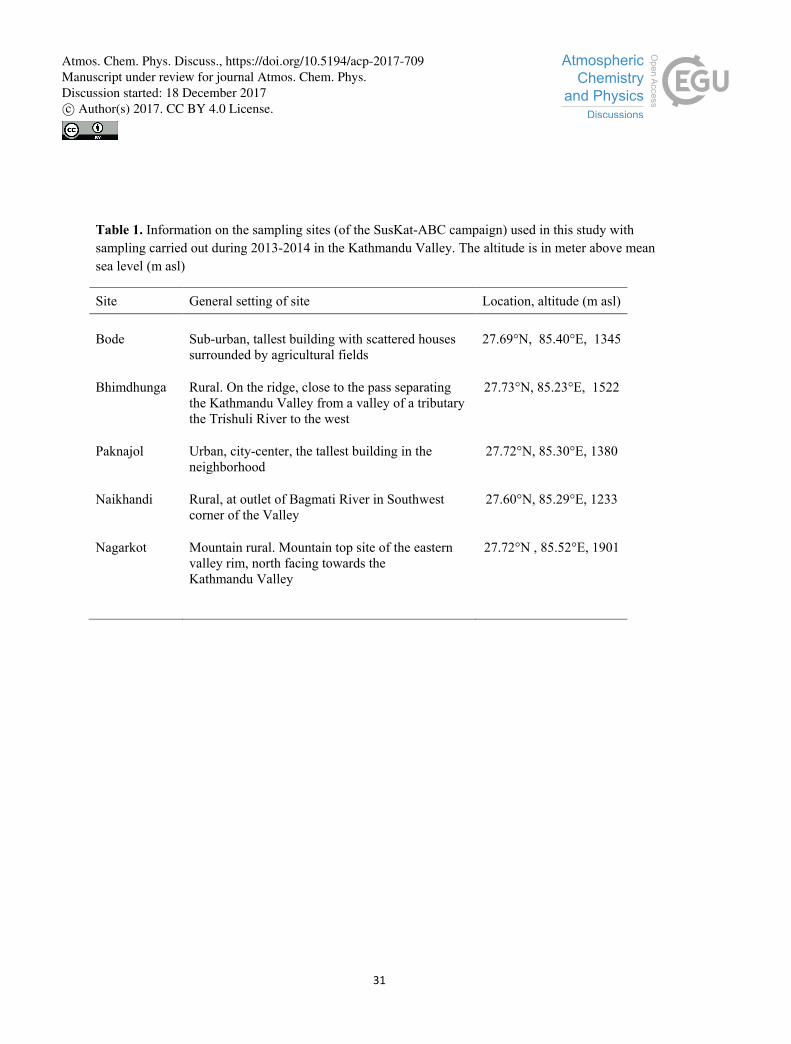
31
Table 1. Information on the sampling sites (of the SusKat-ABC campaign) used in this study with sampling carried out during 2013-2014 in the Kathmandu Valley. The altitude is in meter above mean sea level (m asl)
Site General setting of site Location, altitude (m asl)
Bode Sub-urban, tallest building with scattered houses surrounded by agricultural fields
27.69°N, 85.40°E, 1345
Bhimdhunga Rural. On the ridge, close to the pass separating the Kathmandu Valley from a valley of a tributary the Trishuli River to the west
27.73°N, 85.23°E, 1522
Paknajol Urban, city-center, the tallest building in the neighborhood
27.72°N, 85.30°E, 1380
Naikhandi Rural, at outlet of Bagmati River in Southwest corner of the Valley
27.60°N, 85.29°E, 1233
Nagarkot Mountain rural. Mountain top site of the eastern valley rim, north facing towards the Kathmandu Valley
27.72°N , 85.52°E, 1901
Atmos. Chem. Phys. Discuss., https://doi.org/10.5194/acp-2017-709Manuscript under review for journal Atmos. Chem. Phys.Discussion started: 18 December 2017c© Author(s) 2017. CC BY 4.0 License.
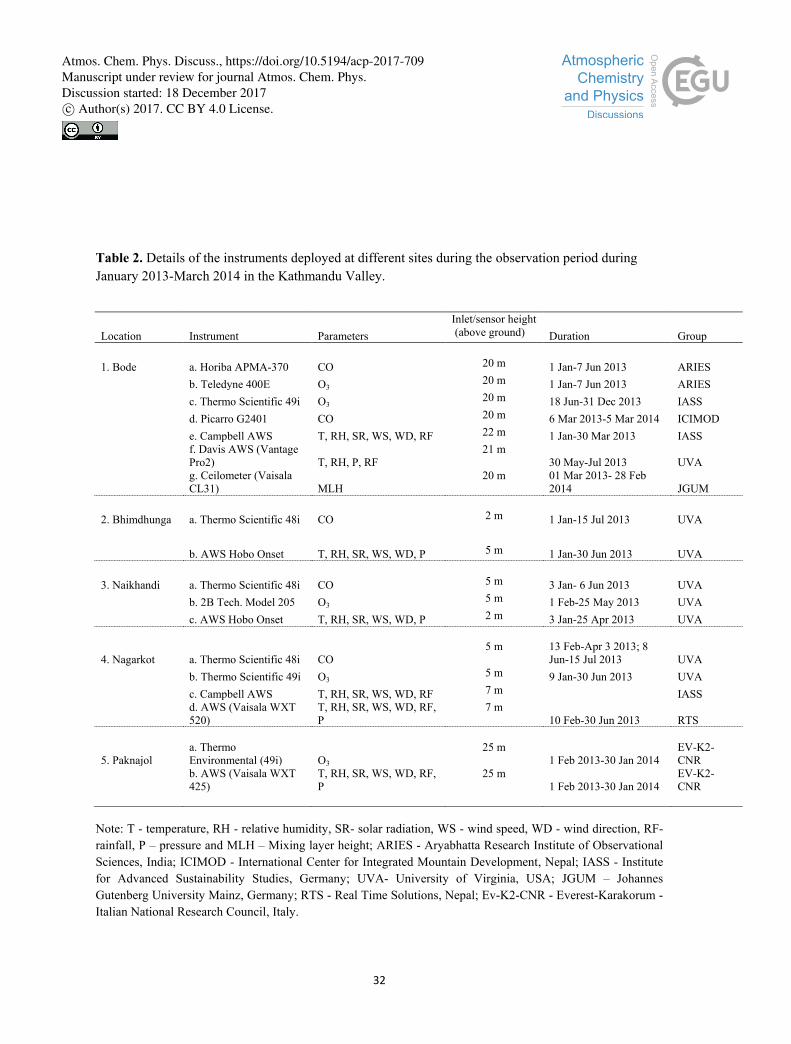
32
Table 2. Details of the instruments deployed at different sites during the observation period during January 2013-March 2014 in the Kathmandu Valley.
Location Instrument Parameters Inlet/sensor height (above ground) Duration Group
1. Bode a. Horiba APMA-370 CO 20 m 1 Jan-7 Jun 2013 ARIES
b. Teledyne 400E O3 20 m 1 Jan-7 Jun 2013 ARIES
c. Thermo Scientific 49i O3 20 m 18 Jun-31 Dec 2013 IASS d. Picarro G2401 CO 20 m 6 Mar 2013-5 Mar 2014 ICIMOD
e. Campbell AWS T, RH, SR, WS, WD, RF 22 m 1 Jan-30 Mar 2013 IASS
f. Davis AWS (Vantage Pro2) T, RH, P, RF
21 m 30 May-Jul 2013 UVA
g. Ceilometer (Vaisala CL31) MLH
20 m 01 Mar 2013- 28 Feb 2014 JGUM
2. Bhimdhunga a. Thermo Scientific 48i CO 2 m 1 Jan-15 Jul 2013 UVA
b. AWS Hobo Onset T, RH, SR, WS, WD, P 5 m 1 Jan-30 Jun 2013 UVA
3. Naikhandi a. Thermo Scientific 48i CO 5 m 3 Jan- 6 Jun 2013 UVA
b. 2B Tech. Model 205 O3 5 m 1 Feb-25 May 2013 UVA
c. AWS Hobo Onset T, RH, SR, WS, WD, P 2 m 3 Jan-25 Apr 2013 UVA
4. Nagarkot a. Thermo Scientific 48i CO
5 m 13 Feb-Apr 3 2013; 8 Jun-15 Jul 2013 UVA
b. Thermo Scientific 49i O3 5 m 9 Jan-30 Jun 2013 UVA
c. Campbell AWS T, RH, SR, WS, WD, RF 7 m
IASS
d. AWS (Vaisala WXT 520)
T, RH, SR, WS, WD, RF, P
7 m 10 Feb-30 Jun 2013 RTS
5. Paknajol
a. Thermo Environmental (49i) O3
25 m 1 Feb 2013-30 Jan 2014
EV-K2-CNR
b. AWS (Vaisala WXT 425)
T, RH, SR, WS, WD, RF, P
25 m 1 Feb 2013-30 Jan 2014
EV-K2-CNR
Note: T - temperature, RH - relative humidity, SR- solar radiation, WS - wind speed, WD - wind direction, RF- rainfall, P – pressure and MLH – Mixing layer height; ARIES - Aryabhatta Research Institute of Observational Sciences, India; ICIMOD - International Center for Integrated Mountain Development, Nepal; IASS - Institute for Advanced Sustainability Studies, Germany; UVA- University of Virginia, USA; JGUM – Johannes Gutenberg University Mainz, Germany; RTS - Real Time Solutions, Nepal; Ev-K2-CNR - Everest-Karakorum - Italian National Research Council, Italy.
Atmos. Chem. Phys. Discuss., https://doi.org/10.5194/acp-2017-709Manuscript under review for journal Atmos. Chem. Phys.Discussion started: 18 December 2017c© Author(s) 2017. CC BY 4.0 License.
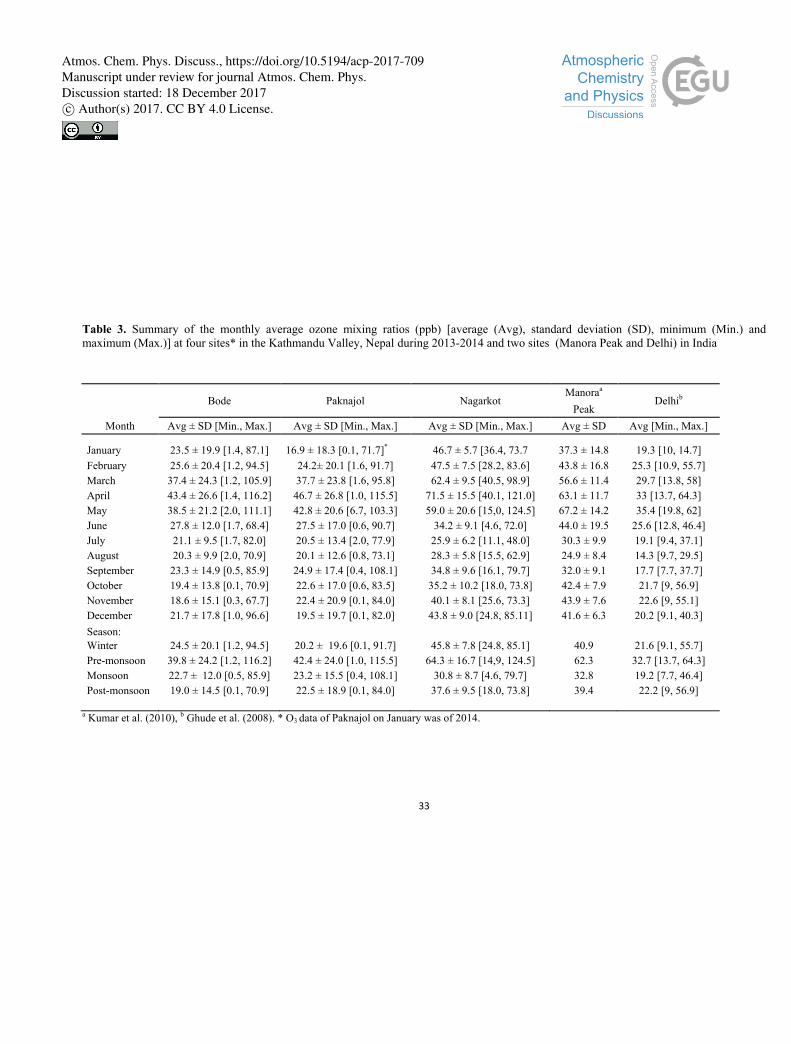
33
Table 3. Summary of the monthly average ozone mixing ratios (ppb) [average (Avg), standard deviation (SD), minimum (Min.) and maximum (Max.)] at four sites* in the Kathmandu Valley, Nepal during 2013-2014 and two sites (Manora Peak and Delhi) in India
Bode Paknajol Nagarkot Manoraa
Delhib Peak
Month Avg ± SD [Min., Max.] Avg ± SD [Min., Max.] Avg ± SD [Min., Max.] Avg ± SD Avg [Min., Max.]
January 23.5 ± 19.9 [1.4, 87.1] 16.9 ± 18.3 [0.1, 71.7]* 46.7 ± 5.7 [36.4, 73.7 37.3 ± 14.8 19.3 [10, 14.7] February 25.6 ± 20.4 [1.2, 94.5] 24.2± 20.1 [1.6, 91.7] 47.5 ± 7.5 [28.2, 83.6] 43.8 ± 16.8 25.3 [10.9, 55.7] March 37.4 ± 24.3 [1.2, 105.9] 37.7 ± 23.8 [1.6, 95.8] 62.4 ± 9.5 [40.5, 98.9] 56.6 ± 11.4 29.7 [13.8, 58] April 43.4 ± 26.6 [1.4, 116.2] 46.7 ± 26.8 [1.0, 115.5] 71.5 ± 15.5 [40.1, 121.0] 63.1 ± 11.7 33 [13.7, 64.3] May 38.5 ± 21.2 [2.0, 111.1] 42.8 ± 20.6 [6.7, 103.3] 59.0 ± 20.6 [15,0, 124.5] 67.2 ± 14.2 35.4 [19.8, 62] June 27.8 ± 12.0 [1.7, 68.4] 27.5 ± 17.0 [0.6, 90.7] 34.2 ± 9.1 [4.6, 72.0] 44.0 ± 19.5 25.6 [12.8, 46.4] July 21.1 ± 9.5 [1.7, 82.0] 20.5 ± 13.4 [2.0, 77.9] 25.9 ± 6.2 [11.1, 48.0] 30.3 ± 9.9 19.1 [9.4, 37.1] August 20.3 ± 9.9 [2.0, 70.9] 20.1 ± 12.6 [0.8, 73.1] 28.3 ± 5.8 [15.5, 62.9] 24.9 ± 8.4 14.3 [9.7, 29.5] September 23.3 ± 14.9 [0.5, 85.9] 24.9 ± 17.4 [0.4, 108.1] 34.8 ± 9.6 [16.1, 79.7] 32.0 ± 9.1 17.7 [7.7, 37.7] October 19.4 ± 13.8 [0.1, 70.9] 22.6 ± 17.0 [0.6, 83.5] 35.2 ± 10.2 [18.0, 73.8] 42.4 ± 7.9 21.7 [9, 56.9] November 18.6 ± 15.1 [0.3, 67.7] 22.4 ± 20.9 [0.1, 84.0] 40.1 ± 8.1 [25.6, 73.3] 43.9 ± 7.6 22.6 [9, 55.1] December 21.7 ± 17.8 [1.0, 96.6] 19.5 ± 19.7 [0.1, 82.0] 43.8 ± 9.0 [24.8, 85.11] 41.6 ± 6.3 20.2 [9.1, 40.3] Season:
Winter 24.5 ± 20.1 [1.2, 94.5] 20.2 ± 19.6 [0.1, 91.7] 45.8 ± 7.8 [24.8, 85.1] 40.9 21.6 [9.1, 55.7] Pre-monsoon 39.8 ± 24.2 [1.2, 116.2] 42.4 ± 24.0 [1.0, 115.5] 64.3 ± 16.7 [14,9, 124.5] 62.3 32.7 [13.7, 64.3] Monsoon 22.7 ± 12.0 [0.5, 85.9] 23.2 ± 15.5 [0.4, 108.1] 30.8 ± 8.7 [4.6, 79.7] 32.8 19.2 [7.7, 46.4] Post-monsoon 19.0 ± 14.5 [0.1, 70.9] 22.5 ± 18.9 [0.1, 84.0] 37.6 ± 9.5 [18.0, 73.8] 39.4 22.2 [9, 56.9]
a Kumar et al. (2010), b Ghude et al. (2008). * O3 data of Paknajol on January was of 2014.
Atmos. Chem. Phys. Discuss., https://doi.org/10.5194/acp-2017-709Manuscript under review for journal Atmos. Chem. Phys.Discussion started: 18 December 2017c© Author(s) 2017. CC BY 4.0 License.
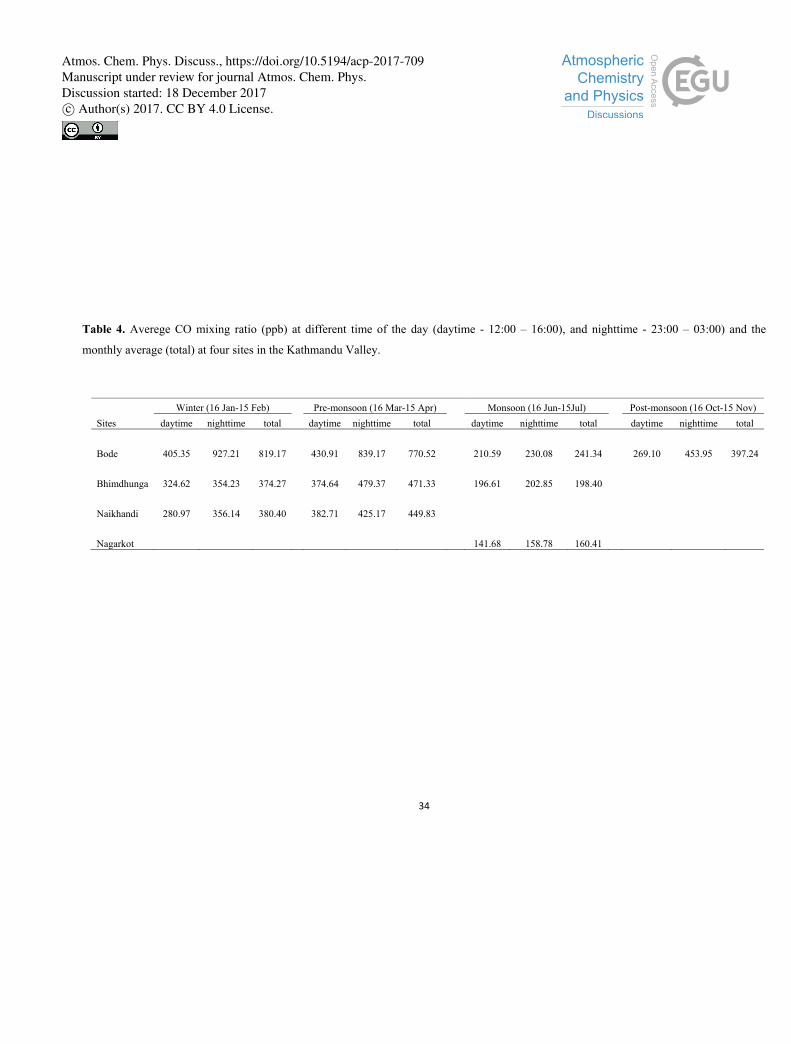
34
Table 4. Averege CO mixing ratio (ppb) at different time of the day (daytime - 12:00 – 16:00), and nighttime - 23:00 – 03:00) and the
monthly average (total) at four sites in the Kathmandu Valley.
Winter (16 Jan-15 Feb)
Pre-monsoon (16 Mar-15 Apr)
Monsoon (16 Jun-15Jul)
Post-monsoon (16 Oct-15 Nov) Sites daytime nighttime total
daytime nighttime total
daytime nighttime total
daytime nighttime total
Bode 405.35 927.21 819.17
430.91 839.17 770.52
210.59 230.08 241.34
269.10 453.95 397.24
Bhimdhunga 324.62 354.23 374.27
374.64 479.37 471.33
196.61 202.85 198.40
Naikhandi 280.97 356.14 380.40
382.71 425.17 449.83
Nagarkot
141.68 158.78 160.41
Atmos. Chem. Phys. Discuss., https://doi.org/10.5194/acp-2017-709Manuscript under review for journal Atmos. Chem. Phys.Discussion started: 18 December 2017c© Author(s) 2017. CC BY 4.0 License.
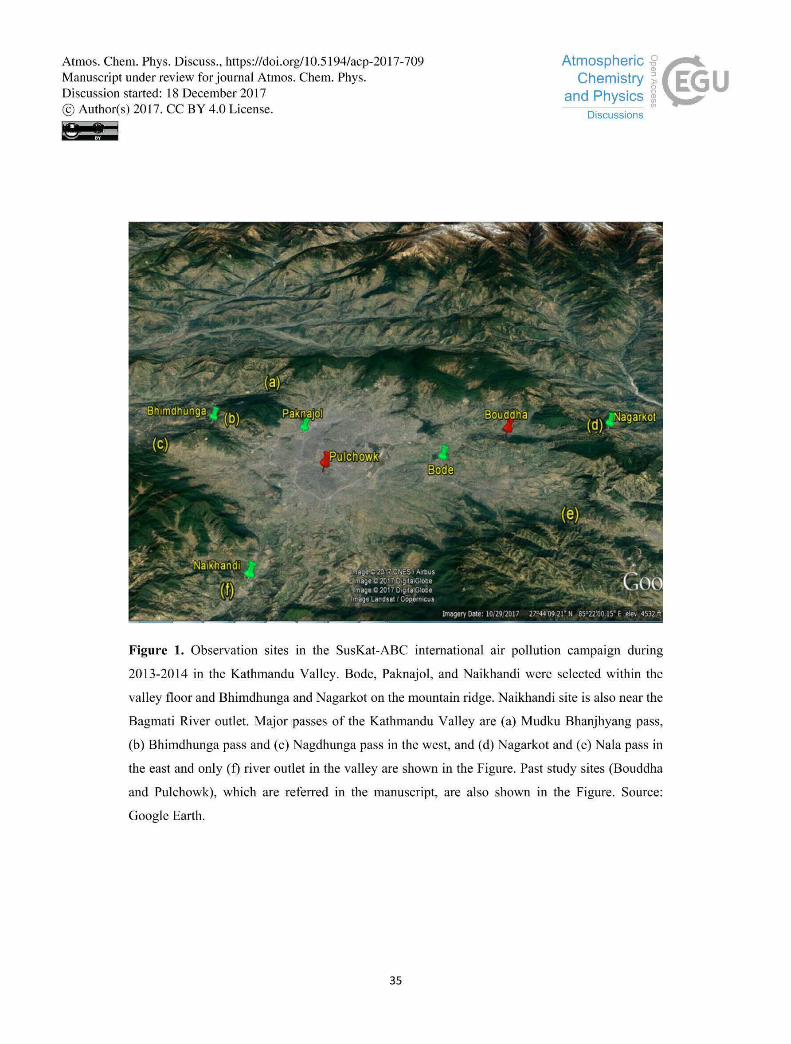
Atmos. Chem. Phys. Discuss., https://doi.org/10.5194/acp-2017-709Manuscript under review for journal Atmos. Chem. Phys.Discussion started: 18 December 2017c© Author(s) 2017. CC BY 4.0 License.
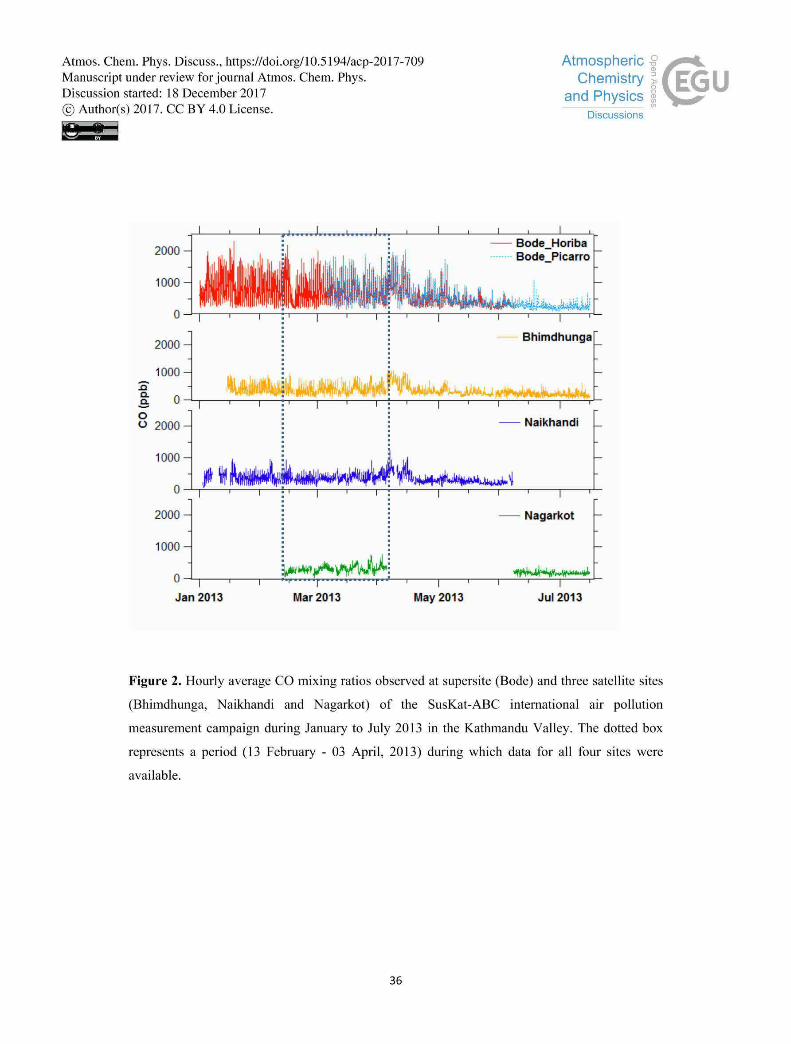
Atmos. Chem. Phys. Discuss., https://doi.org/10.5194/acp-2017-709Manuscript under review for journal Atmos. Chem. Phys.Discussion started: 18 December 2017c© Author(s) 2017. CC BY 4.0 License.
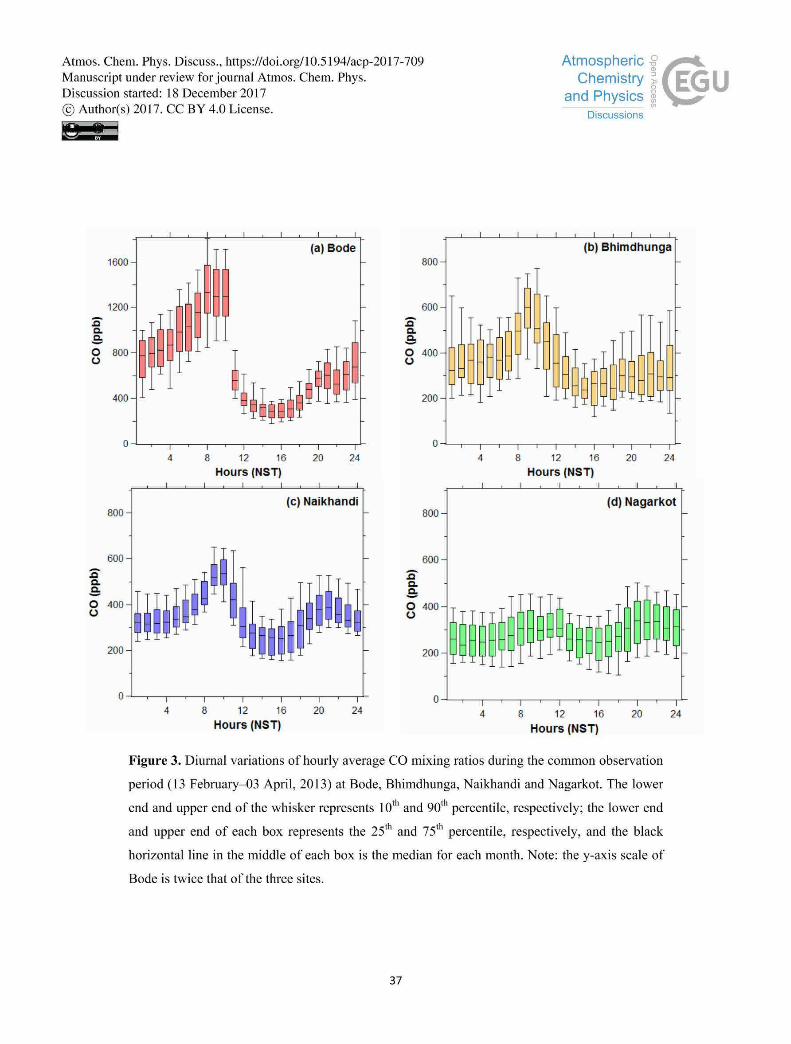
Atmos. Chem. Phys. Discuss., https://doi.org/10.5194/acp-2017-709Manuscript under review for journal Atmos. Chem. Phys.Discussion started: 18 December 2017c© Author(s) 2017. CC BY 4.0 License.
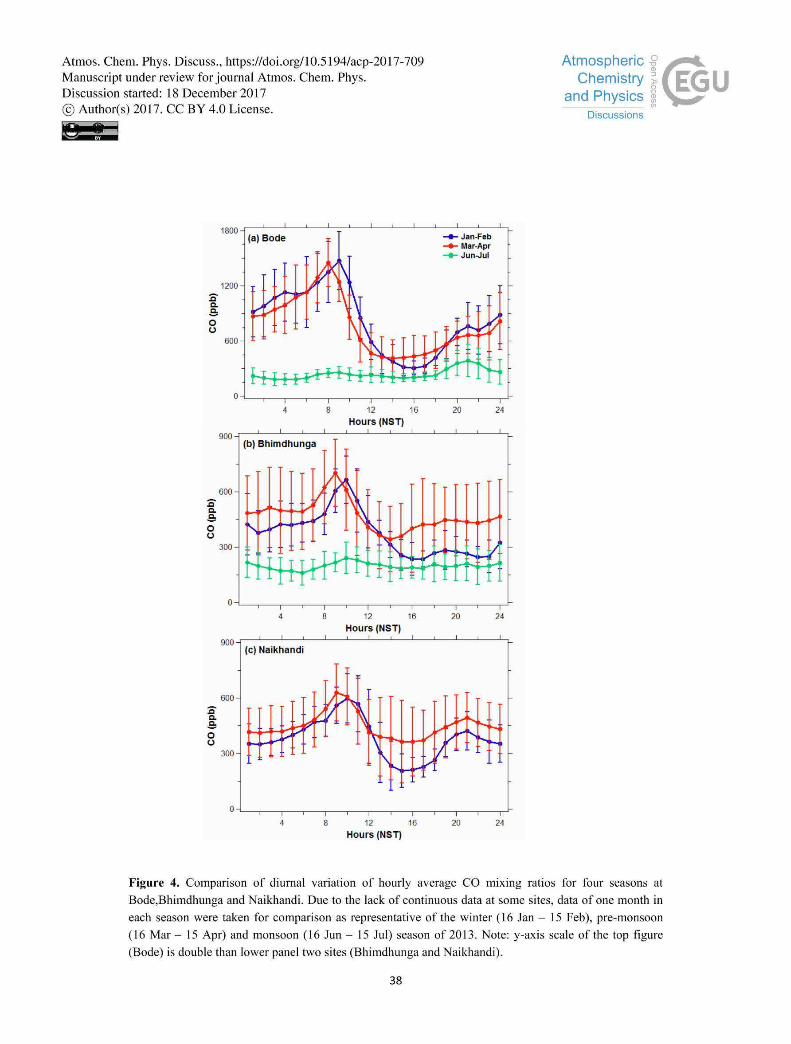
Atmos. Chem. Phys. Discuss., https://doi.org/10.5194/acp-2017-709Manuscript under review for journal Atmos. Chem. Phys.Discussion started: 18 December 2017c© Author(s) 2017. CC BY 4.0 License.
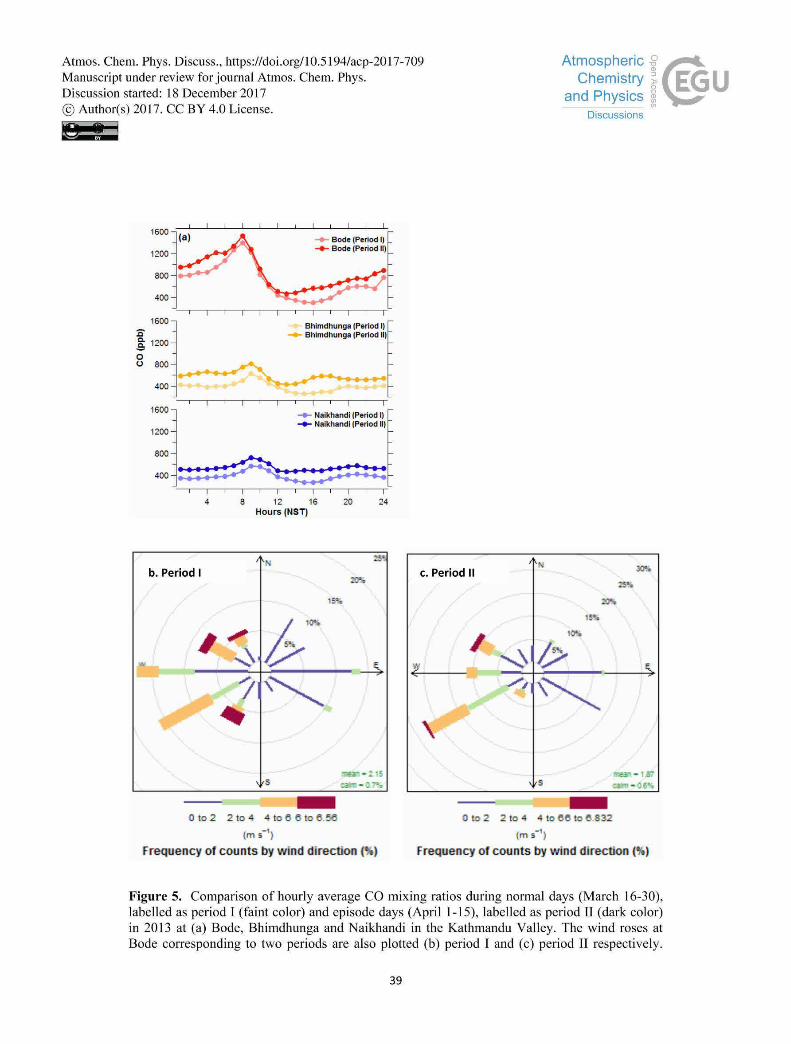
Atmos. Chem. Phys. Discuss., https://doi.org/10.5194/acp-2017-709Manuscript under review for journal Atmos. Chem. Phys.Discussion started: 18 December 2017c© Author(s) 2017. CC BY 4.0 License.
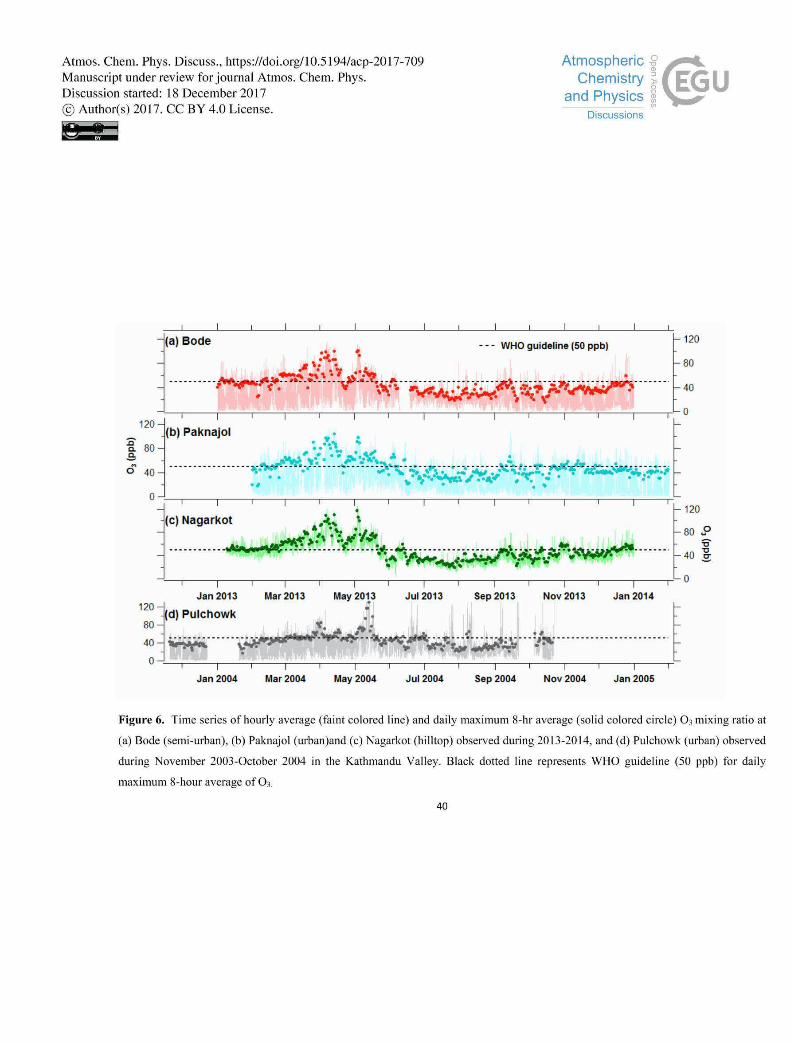
Atmos. Chem. Phys. Discuss., https://doi.org/10.5194/acp-2017-709Manuscript under review for journal Atmos. Chem. Phys.Discussion started: 18 December 2017c© Author(s) 2017. CC BY 4.0 License.
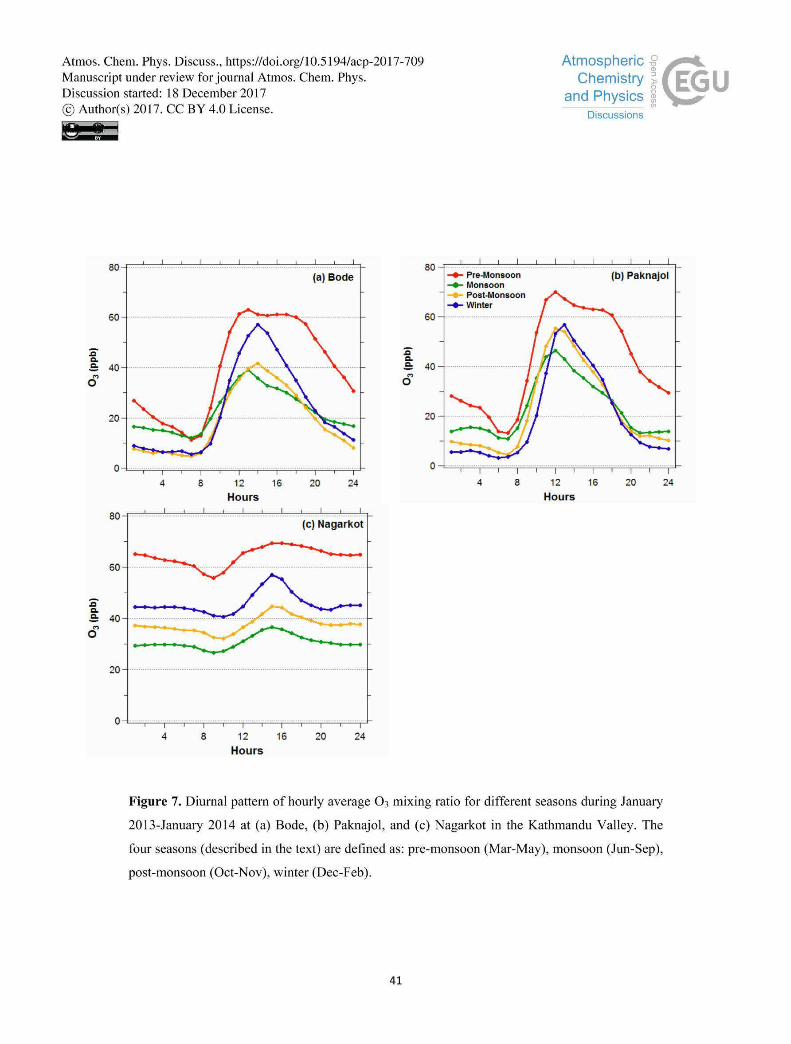
Atmos. Chem. Phys. Discuss., https://doi.org/10.5194/acp-2017-709Manuscript under review for journal Atmos. Chem. Phys.Discussion started: 18 December 2017c© Author(s) 2017. CC BY 4.0 License.
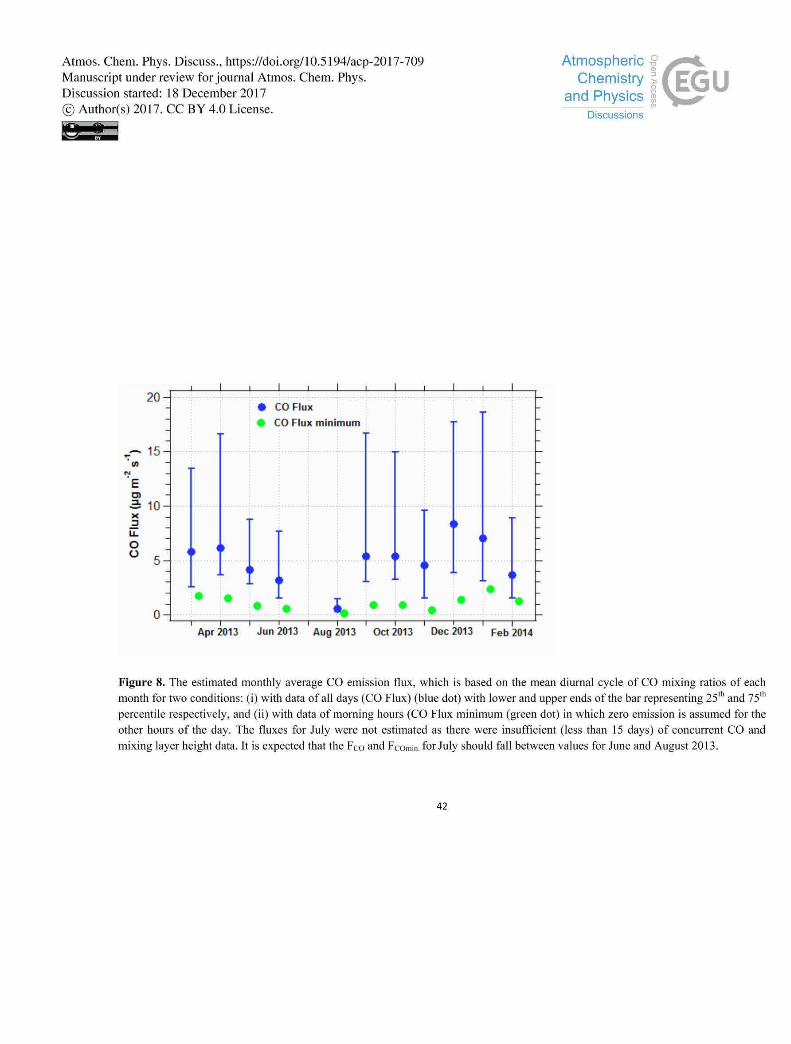
Atmos. Chem. Phys. Discuss., https://doi.org/10.5194/acp-2017-709Manuscript under review for journal Atmos. Chem. Phys.Discussion started: 18 December 2017c© Author(s) 2017. CC BY 4.0 License.