Spatio-temporal analysis of architecture and growth in ...
129
Spatio-temporal analysis of architecture and growth in bacterial colonies -Inaugural-Dissertation- zur Erlangung des Doktorgrades der Mathematisch-Naturwissenschaftlichen Fakultät der Universität zu Köln vorgelegt von Anton Welker aus Omsk
-
Upload
khangminh22 -
Category
Documents
-
view
2 -
download
0
Transcript of Spatio-temporal analysis of architecture and growth in ...

Spatio-temporal analysis of
architecture and growth in
bacterial colonies
-Inaugural-Dissertation-
zur Erlangung des Doktorgrades
der Mathematisch-Naturwissenschaftlichen Fakultät
der Universität zu Köln
vorgelegt von
Anton Welkeraus Omsk

Berichterstatter:(Gutachter)
Prof. Dr. Berenike MaierProf. Dr. Tobias Bollenbach
Tag der mündlichen Prüfung: 31.08.2021


Abbreviations
CCW Counterclockwise
CLSM Confocal laser scanning microscopy
COM Centre of mass
CW Clockwise
OD Optical density
PI Propidium iodide
RDF Radial distribution function
RNA Ribonucleic acid
MIC Minimal inhibitory concentration
SNR Signal to noise ratio
ppGpp Tetraphosphate guanosine
pppGpp Pentaphospate guanosine
T4P Type 4 pilus
wt Wild type
I

Contents
Abbreviations I
1 Abstract 1
2 Zusammenfassung 3
3 Introduction 5
3.1 Bacterial surface motility . . . . . . . . . . . . . . . . . . . . . 7
3.1.1 Bacterial surface sensing and attachment . . . . . . . . . . 73.1.2 Twitching motility . . . . . . . . . . . . . . . . . . . . . . 83.1.3 T4P machinery . . . . . . . . . . . . . . . . . . . . . . . . 9
3.2 Bacterial biofilms . . . . . . . . . . . . . . . . . . . . . . . . . . 12
3.2.1 Development of biofilms . . . . . . . . . . . . . . . . . . . 123.2.2 Structure and dynamics of biofilms . . . . . . . . . . . . . 133.2.3 Phenotypic heterogeneity and stress response in biofilms . 17
3.3 Cell and particle tracking methods . . . . . . . . . . . . . . 21
3.3.1 Image segmentation . . . . . . . . . . . . . . . . . . . . . . 213.3.2 Particle localization . . . . . . . . . . . . . . . . . . . . . . 223.3.3 Particle tracking . . . . . . . . . . . . . . . . . . . . . . . 233.3.4 Alternative particle tracking tools . . . . . . . . . . . . . . 24
4 Aims of this study 25
5 Material and Methods 27
5.1 Cultivation and Growth Media . . . . . . . . . . . . . . . . . 27
II

Contents
5.2 Bacterial Strains . . . . . . . . . . . . . . . . . . . . . . . . . . 28
5.3 Choosing the experimental design . . . . . . . . . . . . . . . 31
5.3.1 Experiments to study the colony structure . . . . . . . . . 315.3.2 Experiments to study the spatio-temporal growth dynamics 32
5.4 General tracking procedures . . . . . . . . . . . . . . . . . . . 34
5.4.1 Procedures for image segmentation . . . . . . . . . . . . . 345.4.2 Segmentation of images acquired by spinning disk confocal
microscopy . . . . . . . . . . . . . . . . . . . . . . . . . . 355.4.3 Procedures for localizing individual cells . . . . . . . . . . 385.4.4 Procedures for tracking cells . . . . . . . . . . . . . . . . . 39
5.5 E�ects of parameter variation on the RDF . . . . . . . . . 40
5.6 Implementation of particle tracking . . . . . . . . . . . . . . 42
5.7 Limitations in particle localization and tracking . . . . . . 44
5.7.1 Pixel-biasing and SNR influence particle localization . . . 445.7.2 Motility and density influence particle tracking . . . . . . . 45
5.8 Data analysis . . . . . . . . . . . . . . . . . . . . . . . . . . . . 48
5.8.1 Characterization of colony structure . . . . . . . . . . . . . 485.8.2 Growth rate determination . . . . . . . . . . . . . . . . . . 495.8.3 Determination of fraction of dead cells . . . . . . . . . . . 52
6 Results 53
6.1 Structural properties of gonococcal colonies . . . . . . . . . 54
6.1.1 Gonococcal colonies show liquid-like order . . . . . . . . . 546.1.2 Motor activity accelerates local-ordering . . . . . . . . . . 546.1.3 Gonococcal colonies show defects in their structure . . . . 60
6.2 Dynamics and growth within bacterial colonies . . . . . . . 62
6.2.1 Colony growth shows deviations from exponential growthafter two hours . . . . . . . . . . . . . . . . . . . . . . . . 62
6.2.2 Lineage tracking within gonococcal colonies reveals develop-ment of growth profiles . . . . . . . . . . . . . . . . . . . . 63
6.2.3 Increasing nutrient supply does not prevent growth inhibitionat the center of the colony . . . . . . . . . . . . . . . . . . 72
III

Contents
6.2.4 Lack of stringent response accelerates heterogeneity in spatio-temporal growth dynamics . . . . . . . . . . . . . . . . . . 74
6.2.5 E�ect of antibiotic treatment on growth and death dynamicsof gonococcal colonies . . . . . . . . . . . . . . . . . . . . 77
7 Discussion 80
7.1 Gonococcal colonies are reminiscent of non-living colloidal
systems . . . . . . . . . . . . . . . . . . . . . . . . . . . . . . . . 80
7.2 Deletion of the T4P retraction motor severely slows down
the process of local ordering . . . . . . . . . . . . . . . . . . . 81
7.3 Determining growth rates with spatial and temporal reso-
lution in spherical colonies . . . . . . . . . . . . . . . . . . . . 82
7.4 Growth rate gradients emerge within a few generations
and stringent response retards the development of spatially
heterogeneous growth rates . . . . . . . . . . . . . . . . . . . 84
7.5 Azithromycin is more e�cient against fast growing cells . 86
8 Outlook 88
9 Appendix 92
9.1 Particle tracking software . . . . . . . . . . . . . . . . . . . . 92
List of Figures 94
List of Tables 96
Bibliography 97
IV

1 Abstract
Most microorganisms prefer to live in surface associated communities called biofilms,where their lifestyle di�ers considerably compared to their planktonic counterpart.The cell shape, as well as physical interactions determine the structure of bacterialbiofilms. Due to cell growth, the size of the biofilm increases with time and thestructure changes during biofilm maturation. This work aims at characterizing thestructure and growth dynamics of dense colonies formed by gonococci.
The first part of this thesis focuses on the characterization of the spatial structureof gonococcal colonies. Image analysis tools were developed that allowed determin-ing the positions of single cells within the spherical colonies. Using the positiondata, the radial distribution function (RDF) was calculated. The RDF showedshort-ranged order but not long range order, reminiscent of liquids. Neisseriagonorrhoeae interact via their type 4 pilus (T4P) with surfaces and cells. T4P-T4P binding between adjacent cells generates attractive force that controls colonyformation. We investigated the e�ect of T4P retraction of the local and meso-scopic structure of gonococcal colonies using strains with varying T4P retractionphenotypes. Reducing speed and frequency of T4P retraction reduced cell densityand increased order in 6 h old colonies. Deleting T4P retraction results in loss oflocal order. After 24 h, density and local order increase for all strains, and largerholes inside the structures of gonococcal colonies emerged, which were independentof T4P motor activity. In conclusion, we show that gonococcal T4P active forcegeneration is not necessary for development of local order, but it accelerates theprocess of achieving higher densities and local ordering inside spherical colonies.
1

1 Abstract
In the second part of this thesis, we developed methods for measuring growthrates of colony-bound bacteria with spatial and temporal resolution. Growinggonococci generated a radial velocity field inside colonies that pointed from thecentre of mass (COM) of colonies to its periphery. Close to the colony centres,velocities were minimal and increased towards the periphery of colonies. We showedthat by characterizing the velocity field within the colony, the local growth ratescan be measured. Independently, growth rates were determined by counting theo�spring of single fluorescent cells that were distributed homogeneously insidethe colonies. Both methods complement each other, because they have di�erentadvantages and disadvantages. Unexpectedly, heterogeneous growth profiles insidesmall gonococcal colonies emerged after 2 h of growth. To assess the hypothesis thatnutrient limitation causes growth heterogeneity, we optimized the nutrient supplywith a higher flow rate. Even though gonococcal growth improved slightly, growthprofiles were still heterogeneous, indicating di�erent limitations like mechanicalconstraints. Surprisingly, colonies that could not activate the stringent responsedeveloped heterogeneity in spatial and temporal growth even earlier. We suggestthat stringent response is important for gonococcal biofilm maturation. Finally,the e�ect of azithromycin treatment on colony growth dynamics was investigated.We observed that after two generations times, growth rates dropped to low valuesthroughout the colony indicating that azithromycin di�uses quickly through thewhole colony and e�ects the majority of cells. In summary, we established toolsfor characterizing growth and death within dense spherical colonies at spatialand temporal resolution. This method will be useful to study the mechanismsof development of heterogeneity inside gonococcal colonies and their response toenvironmental changes like antimicrobial treatment.
2

2 Zusammenfassung
Die meisten Mikroorganismen bevorzugen es in an Oberflächen gebundenen Gemein-schaften zu leben, welche als Biofilme bekannt sind. Dabei unterscheidet sich ihrLebensstil wesentlich von planktonischen Zellen. Die Zellform und die physikalis-chen Wechselwirkungen bestimmen die Struktur des Biofilms. Durch Zellwachstumnimmt die Größe des Biofilms mit der Zeit zu und die Struktur des Biofilms ändertsich dabei parallel zum Entwicklungsstand des Biofilms. Diese Arbeit beschäftigtsich mit der Struktur und Wachstumsdynamik von dichten Kolonien, welche vonkugelförmigen Zellen geformt worden sind.
Der erste Teil dieser Arbeit beschäftigt sich mit der Charakterisierung derräumlichen Struktur von durch Gonokokken geformten Kolonien. Programmezur Bildauswertung wurden entwickelt, welche die Bestimmung der räumlichenPosition einzelner Zellen in den Kolonien ermöglicht. Mit den Positionskoordinatenwurde die radiale Verteilungsfunktion berechnet. In der radialen Verteilungs-funktion zeigt sich eine kurzreichweitige Ordnung der Zellen, die an die Ordnungvon Molekülen in einer Flüssigkeit erinnert. Neisseria gonorrhoeae wechselwirktmit dem Typ 4 Pilus (T4P) mit Oberflächen und anderen Zellen. T4P-T4PBindungen zwischen benachbarten Zellen erzeugt eine anziehende Kraft, welche dieKolonie-Entstehung beeinflusst. Wir haben den E�ekt der T4P Retraktion auf dielokale und mesoskopische Struktur von Kolonien untersucht, wobei wir bakterielleStämme mit unterschiedlichen T4P Retraktionseigenschaften verwendet haben.Eine reduzierte Geschwindigkeit und Häufigkeit der T4P Retraktion bewirkte einegeringere Zelldichte und eine höhere lokale Ordnung von 6 Stunden alten Kolonien.Kolonien, deren Zellen ihre T4P nicht retrahieren konnten, wiesen nach 6 Stundenkeine lokale Ordnung auf. Nach 24 Stunden, wiesen jedoch alle verwendetenStämme eine höhere Zelldichte und lokale Ordnung in den jeweiligen Kolonien
3

2 Zusammenfassung
auf. Außerdem bildeten sich Löcher in allen Kolonien, welche unabhängig von derT4P Motor Aktivität waren. Zusammenfassend, konnten wir zeigen, dass T4PRetraktion zur Entstehung von lokaler Ordnung nicht erforderlich sind, sie aber denProzess zur Entwicklung höherer Zelldichten und lokaler Ordnung beschleunigen.
Im zweiten Teil entwickelten wir Methoden zur Bestimmung von Wachstumratenfür Kolonie-gebundene Bakterien mit räumlicher und zeitlicher Auslösung. Wach-sende Gonokokken entwickelten ein radiales Geschwindigkeitsfeld, welches vomKolonie-Zentrum zur dessen Peripherie zeigte. In der Nähe des Kolonie-Zentrumswaren die Geschwindigkeiten einzelner Zellen minimal and nahmen Richtung Pe-ripherie zu. Wir zeigten, dass lokale Wachstumsraten durch Charakterisierungdes Geschwindigkeitsfeldes bestimmt werden können. Unabhängig dazu, wurdenWachstumsraten durch das Zählen der Nachkommen von einzelnen fluoreszierendenZellen bestimmt, welche innerhalb der Kolonie homogen verteilt waren. Beideverwendeten Methoden ergänzen sich, weil sie verschieden Vor- und Nachteileaufweisen. Unerwarteterweise konnten wir heterogene Wachstumsraten in kleinenKolonien nach 2 Stunden Wachstumszeit bestimmen. Um die Hypothese zu belegen,dass heterogenen Wachstumsraten durch Nährsto�mangel hervorgerufen werden,optimierten wir die Nährsto�versorgung Erhöhung der Zufuhr von Nährsto�en.Obwohl sich das Wachstum verbesserte, waren die Wachstumsraten immer nochheterogen verteilt, sodass wir andere limitierende Faktoren wir mechanische Ein-schränkungen vermuten. Überraschenderweise, zeigten Kolonien dessen Zellenkeine ‚Stringent‘Response aktivieren können, eine frühzeitige Entstehung von het-erogenen Wachstumsraten. Daher vermuten wir, dass die ‚Stringent‘Response einwichtiger Bestandteil der Biofilm-Entwicklung ist. Zusammenfassend, entwickeltenwir Methoden zur Charakterisierung von Wachstum und Tod in dichten Kolonienmit räumlicher und zeitlicher Auflösung. Diese Methoden können verwendet wer-den um die Entstehung von Heterogenität in Kolonien und deren Reaktion aufwechseln Umweltbedingungen wie Antibiotika Behandlung zu untersuchen.
4

3 Introduction
The dominant form of bacterial life was reported to be in in a surface associatedbiofilm, where many bacteria are organized in close proximity and interact mechan-ically [1]. Organization into a biofilm gives rise to di�erent physiological behaviors[2, 3] and a higher stress resistance [4, 5, 6, 7, 8], which cannot be understood bystudying planktonic bacteria [9, 10].
Recently, laser scanning microscopy (CLSM) has been used to study the ar-chitecture of fixed bacterial colonies. Using particle tracking tools from colloidalphysics, three dimensional positions of individual spherical cells inside colonies weredetermined with sub-pixel accuracy. The bacterial structure was analysed by thecell density and the radial distribution function (RDF) that gives the probability offinding bacteria at a certain distance [11]. This work revealed short-ranged orderinside colonies and reported that the environmental stress influences the colonystructure considerably. Furthermore, it was shown that rod-shaped Vibrio choleraeforms dome-shaped three dimensional colonies with a local liquid-crystalline order[12]. Its biofilm structure also responded to environmental conditions like starva-tion, shear flow and osmotic stress [12, 13]. During biofilm development, bacteriaemploy various mechanical interaction mechanisms that generate attractive andrepulsive forces by using for example extracellular appendages like type 4 pili (T4P)or secretion of extracellular matrix components [1]. Still, little is known about howphysical interactions determine the structure of bacterial biofilms. In this study,the e�ect of T4P motor activity on the colony structure is investigated.
5

3 Introduction
Availability of new fluorescent proteins like superfolder GFP and progress indesign of confocal microscopes allow to study the dynamical process of biofilmdevelopment with cellular resolution. Following single cell lineages inside biofilmsis a di�cult task due to the small size of cells (¥ 1 µm) and the limited timeresolution of approximately 10 min due to phototoxicity of the laser light. How-ever, cell velocities and growth rates were successfully determined for V. choleraebiofilms. Surprisingly, growth rates were homogeneous in time and position, andvelocities increased slightly for larger biofilms [12]. The used image segmentationand particle tracking algorithms are specialized on characterization of rod-shapedcells inside biofilms with a low density. So far, information about growth rates ofspherical-shaped cells inside dense colonies are lacking. In this study, we developnovel methods to characterize growth dynamics inside gonococcal colonies.
In the first section of this chapter, we focus on the interaction of single cellswith surfaces. In particular, we describe surface sensing and motility of cells, andintroduce the T4P system. In the second section, bacterial biofilms are described indetail. In the last section, we introduce important concepts of image segmentationand particle tracking that can be useful to study bacterial biofilms.
6

3.1 Bacterial surface motility
3.1 Bacterial surface motility
Due to their small size bacteria live in an environment, where viscous forces domi-nate the cell movement and inertial forces are negligible. Consequently, the velocityof cells depends mostly on forces that are applied at the moment and not on forcesthat have been applied previously. In order to be supplied with nutrients, bacteriado not have to be motile, because the transport of food is locally controlled bydi�usion. However, to find places with more or better nutrients, bacteria have tooutrun di�usion [14].
To this end, bacteria have evolved di�erent molecular motors that enable themto move through fluids and on surfaces. In particular, flagella enable bacterialswimming. They are long filaments that emerge from the cell body and arepowered by the flagella motor. This rotary motor converts mechanical rotation intodisplacement and spins clockwise (CW) or counterclockwise (CCW) [15]. WhileCCW rotation pushes the cell forward (run), CW rotation causes the cell to changeits course (tumble) [16]. The alternation of runs and tumbles allows movementalong nutrient gradients [14].
In the following sections, surface motility, which requires bacterial surfaceattachment, will be introduced.
3.1.1 Bacterial surface sensing and attachment
To attach to surfaces for surface motility and colonization, bacteria evolved vari-ous strategies like employing fimbriae, T4P or secreting extracellular polymericsubstances (EPS) [17]. During the first surface contact, bacteria are able to useappendages like flagella and T4P to sense surfaces. When flagella attach to asurface, rotation of the flagella motor is obstructed and the load on the motorincreases. The di�erence in the load on the motor causes structural changes of thestator complex, which can be seen as a mechanosensory property of the flagellamotor [18, 19].
In contrast, T4P are typically bound to surfaces where the first contact mediatessurface sensing. T4P are polymeric filaments that emerge from the cell body and
7

3 Introduction
mediate surface attachment [20]. This length of the pilus filament is dynamic. Itelongates by polymerization and retracts by depolymerization [21]. Looking at theintracellular level, studies of Pseudomas aerugnisoa indicate that surface sensingvia pilus occurs during pilus retraction through both, sensing of pilus tensionand detection of depolymerized pilins, which has been reincooperated inside themembrane after retraction [22, 23]. Studies of Caulobacter crescentus revealedthat cycles of pilus elongation and retraction cease after the first surface contact.Simultaneously the synthesis of an adhesive holdfast is promoted, starting thetransition to an irreversible surface attachment [24]. Interestingly, surface sensingis reported to be a heterogeneous process, allowing bacteria to attach and detachmultiple times from surfaces before they stimulate cell di�erentiation and attachirreversible by expressing EPS [25, 26].
3.1.2 Twitching motility
After surface attachment, bacteria can coordinate surface motility by a two-dimensional tug-of-war mechanism. In particular, cycles of pilus elongations,binding and retraction enable cell displacement to the direction, where the pilus isbound [27]. Forces are shared when multiple attached pili retract at the same time,causing biased movement to the direction where the majority of pili are attachedor this highest force is applied (Fig. 3.1). While many species are able to interactwith their environment via di�erent kinds of cell appendages, N. gonorrhoeaeproduces mainly T4P to mechanically interact with surfaces or other cells [27]. Incontrast to the rod-shaped bacterium P. aeruginosa, who distributes pili at oneof its poles [28, 29], spherical shaped bacteria like N. gonorrhoeae distribute pilihomogeneously on their cell surface [30], leading to a random walk on longer timescales [31]. On shorter time scales, experimental and theoretical approaches showthat two-dimensional tug-of-war mechanism mediate mediate bacterial persistentmovement. This directional memory increases the surface area that can e exploredby cells and facilitates bacterial colonization [21].
8

3.1 Bacterial surface motility
Figure 3.1: Scheme of surface motility driven by T4P. Multiple pili cooperate by atug-of-war mechanism to induce surface movement.
3.1.3 T4P machinery
T4P are dynamical extracellular filaments that many bacterial species use fortwitching motility [32], DNA uptake [33, 34] and microcolony formation [35, 36,37, 38]. In this section, we will focus on the T4P architecture of N. gonorrhoeaeand its role in microcolony formation.
T4P architecture
The main building blocks of the T4P machinery are the pilus fiber, an innermembrane platform protein, an outer membrane secretin channel and two ATPasesthat power pilus elongation and retraction [39], (Fig. 3.2). The pilus fiber is a longelastic polymer with a width of 5-8 nm and a length of several micrometers [40, 41].The polymer mainly consists of pilins, whose assembly starts at the inner membraneplatform protein. Through the secretin channel inside the outer membrane, thepilus can grow to the outside of the cell [42]. The pilus length is dynamical andpilus elongation and retraction is powered by two di�erent hexameric ATPasesthat bind to the inner membrane platform protein [43].
9

3 Introduction
Figure 3.2: Molecular model of T4P. T4P consists of a polymeric fiber that is builtmainly of the major pilins (green). It is anchored at platform protein(blue) located in the inner membrane (IM) and exits the surface of thecell though a secretin channel (orange) in the outer membrane (OM).The length of the pilus fiber is dynamic, where PilF elongates the fiberby polymerization and PilT causes retraction by depolymerization.Image adapted from [44] and reproduced with permission.
T4P dynamics
The pilus fiber actively elongate and retract, where PilF and PilT most likelyadd or remove pilins from the fibre. The current model states that they generateconformational changes in the platform complex which somehow supports assemblyand disassembly. Possibly the platform complex rotates in opposite directionswhen PilT or PilF are bound [40]. The T4P machinery is one of the strongestmolecular motors [45, 46] that generates forces up to 150 pN during pilus retraction
10

3.1 Bacterial surface motility
[45, 33, 46, 47, 48]. In order to generate those forces, the retraction ATPase PilTis essential. PilT converts chemical energy from ATP binding and hydrolysis tomechanical energy [49]. Deletion of PilT allows pilus biogenesis and colony forma-tion, but active force generation is inhibited [27]. Even though pilus retractionwas reported in the absence of PilT, the measured forces were only the order of 5 pN.
T4P activity can be fine-tuned by co-expressing functional and non-functionalpilT. When non-functional PilT is produced inside the cell, hexamers of functionaland non-functional PilT are formed that exert a negative e�ect on T4P motoractivity. While retraction velocity , the frequencies of pilus retraction and T4P-T4Pbond rupture decreased, the frequency for pilus elongation increased [44]. Therespective mutant strains will be used in chapter 6.1.2 to investigate the e�ects ofT4P dynamics on the architecture of gonococcal colonies. Besides manipulatingT4P motor activity, T4P-T4P interaction can be influenced by altering pilusdensity [50], posttranslational modifications [51] or environmental changes likeoxygen-concentrations [52] and proton motive force (PMF) [53].
11

3 Introduction
3.2 Bacterial biofilms
Bacteria are reported to be the most successful form of life on earth with respectto biomass and diversity of colonized habitats [3]. The key to this success isphenotypical plasticity [54] that allows rapid adaptation to environmental changes.Individual motile bacteria can attach to surfaces and aggregate in large communi-ties, called biofilms [55, 3]. Typically, biofilms are embedded in an extracellularmatrix that consists of extracellular polymeric substances (EPS) like extracellularDNA, polysaccharide or proteins [17]. The biofilm matrix immobilizes cells, pro-vides mechanical stability, facilitates cell-cell interactions by keeping cells in closeproximity and increases resilience against environmental stress [17, 56, 57]. Withinbiofilms, the production of extracellular matrix can be inhomogeneous distributedand for some species solely specialized cells contribute to the production [58].
3.2.1 Development of biofilms
Experimental approaches using microscopy enabled visualization of biofilm develop-ment. These observations suggest that biofilms develop in four distinct stages: (i)bacterial attachment to a surface, (ii) formation of micro-colonies, (iii) maturationof micro-colonies to colonies/ biofilms and (iv) biofilm dispersal (Fig. 3.3). Betweeneach stage, the expression level of detectable proteins changes considerably [59].
The transition from a planktonic cell to a surface associated community involvesphysiological changes of individual cells and a spatiotemporal organization [60].During surface attachment (Chap. 3.1.1), production of adhesions and extracellularmatrix components is induced [61, 62]. After a successful attachment, micro-colonies can be formed by clonal growth of the attached cells or aggregation withneighboring cells via bacterial surface motility (Chap. 3.1.2). Further bacterialgrowth and matrix production proceeds biofilm maturation. During this process,changes in biofilm size and architecture, extracellular matrix composition, and thephysiological state of cells can be observed [17, 63]. Finally, bacteria can detachfrom the mature biofilm and continue as planktonic cells until they attach againto a surface and repeat the biofilm development cycle [62].
12

3.2 Bacterial biofilms
Figure 3.3: Stages of biofilm development. (i) Planktonic cells attach to a surface.(ii) Micro-colonies are formed due to cell growth or aggregation viacell motility. (iii) Biofilms matures due to further cell growth andexpression of extracellular matrix components. (iv) Single cells candisperse from the biofilm and potentially start biofilm development ata new location.
3.2.2 Structure and dynamics of biofilms
A variety of physical parameters a�ect the structure of bacterial colonies andbiofilms on a microscopical and mesoscopical scale. In order to study the structureand dynamics of biofilms, parameters like cell growth, cell-surface interactions andcell-cell interactions are important to access. Importantly, bacteria are able toadapt their biofilm structure to environmental stresses by tuning their physicalinteractions [64, 65, 66, 67, 68]. These interaction can be of repulsive or attrac-tive nature (Fig 3.4). Attractive interactions can be mediated by extracellularappendages or molecules that rely on electrostatic attraction, polar attractionand hydrogen bonding (Fig 3.4a). Moreover, the presence of small, non-adheringextracellular matrix components inside biofilms can cause excluded volume e�ects.In order to minimize the excluded volume and maximize the entropy, bacteria tendto aggregate (Fig 3.4b). In contrast, bacteria are similar to hard objects that repeleach other (Fig 3.4a). During cell growth, bacteria generate pressure that pushestheir neighbors away. Additionally, a higher concentration of extracellular matrixcomponents increases the osmotic pressure between the biofilm and its surroundingmedium, causing biofilm swelling due to a higher medium influx (Fig 3.4d) [1].
13

3 Introduction
Figure 3.4: Repulsive and attractive interactions between bacteria. (a) Stericrepulsion. (b) Osmotic pressure. (c) Bridging attraction. (d) Depletionattraction.
The cell shape influences the structure and growth dynamics of bacterial biofilms.Recently, bacterial biofilms formed by rod-shaped bacteria were intensely investi-gated [69, 63]. At early stages of biofilm formation, E. coli and V. cholerae forma two-dimensional layer at surfaces that form patterns of nematic domains. Thesize of these nematic domains is influenced by the aspect ratio of cells and theirgrowth rate (Fig. 3.5 a) [70, 69]. After a critical aggregate size, which depends oncell-surface interaction and cell length [71], the transition from two dimensionalto three dimensional colonies occurs. To this end, the growth pressure has toovercome the cell-surface interaction [71].
For V. cholerae the growth of individual cells to a colony containing up to 10.000cells was reconstructed using time resolved three dimensional images acquiredby spinning disk confocal microscopy. Repulsive interactions in V. cholerae aremediated by osmotic pressure and steric repulsion (Fig. 3.4a,b), whereas attractiveinteractions are mediated by the adhesive protein RbmA that binds cells together[56, 72, 73, 74]. The balance between repulsive and attractive interaction and theirstrength determine the colony structure, which shows local liquid-crystalline order[12]. Reducing cell-cell interaction though deletion of RbmA increases nematicorder and space between cells [12]. Interestingly, growth rates were spatiallyhomogeneous, even though cell growth depends on nutrient availability, which isreported to be spatially heterogeneous inside colonies [12, 7] (Sec. 3.2.3). The
14

3.2 Bacterial biofilms
observed velocity of individual cells is determined by passive cell displacementduring the fountain-like biofilm expansion (Fig. 3.5 b) and is spatially homogenous.For larger biofilms, the velocity increases slightly [12].
Figure 3.5: Biofilm structure of rod-shaped cells. (a) Domain size depends ongrowth rate and cell length. Higher growth rates decrease the domainssize and a higher length increases them. (b) Fountain-like arrangementof rod-shaped cells.
In contrast to V. cholerae, the cell shape of N. gonorrhoeae is spherical. Duringgrowth, dumbbells are formed. In N. gonorrhoeae attractive interactions betweencells are mediated by T4P [40]. Similar to twitching motility, cycles of piluselongation, binding and retraction facilitates rapid three dimensional aggregationinto spherical shaped colonies. To this end, pili of adjacent cells can bind to eachother and pull the cell bodies closer together during pilus retraction. Due to thefact that the average force needed to rupture a pilus bond Frupture ¥ 50pN [44] issmaller than the force a single pilus can generate Fpilus ¥ 150pN [45, 33, 46, 47,48], it is likely that T4P-T4P bonds are transient (Fig. 3.6a). When many bacteriaare in close proximity, a pilus network emerges that holds the cells together. Thepreviously mentioned cycle of pilus elongation, binding, retraction and unbindingfacilitates cell motility and cell reorganization in dense colonies as shown in silico[75].
15

3 Introduction
Figure 3.6: T4P-T4P interactions. Bridging attraction mediated by T4P. Cycles ofT4P elongation, binding, retraction and unbinding generate T4P-T4Pinteraction patterns that facilitate motility and organization insidebacterial colonies.
Simulations computed repulsive interactions of dumbbell-shaped cells by volumeexclusion and attractive interactions by T4P mediated forces. T4P were modeledas dynamics springs that can elongate, retract, bind and unbind. Similar toexperiments, the simulated cells aggregate into spherical shaped colonies. Thecolony shape depends on the cooperation of cell-surface and cell-cell interactions.For stronger cell-surface interactions, the contact area to the surface increases.Stronger cell-surface interactions and a larger colony size increase the numberof pili that interact with the surface and consequently, decrease surface-motilityof the colony. Especially for small colonies, surface-motility enables colonies tomove at surface, approach neighboring colonies, and coalesce with them into largercolonies [76, 44]. Additionally, the simulations predicted a liquid-like behaviorof gonococcal colonies by analysing local order and coalescence dynamics of twocolonies. In order to maximize the number of interacting pili, outer cells alignedtangentially to the surface of colonies. However, cell orientations inside the colonieswere randomly distributed and did not show nematic order. The computed RDF,which is used to measure order, showed local order similar to a liquid-like structure[75].
This simulation did not implement bacterial growth and lineage tracking of
16

3.2 Bacterial biofilms
densely packed spherical cells that exceed the limit of optical resolution is compli-cated. Consequently, little is known about the spatio-temporal growth dynamicsof colonies formed by spherical bacteria and how growth and physical interactionsinfluence the structure of the colony.
3.2.3 Phenotypic heterogeneity and stress response in biofilms
Spatially heterogeneous regulation of cellular physiology maximizes the communityfitness and allows better adaptation to global environmental changes [55, 77, 78, 79,80, 81, 82]. During stress exposure, cells inside biofilms act collectively and adapttheir biofilm structure [39, 83, 84]. In the following, molecular causes underlyingphenotypical heterogeneity inside biofilms will be introduced and examples fordi�erent kinds of stress responses will be described.
Nutrient starvation and stringent response
Bacteria living in a dense community, experience time and position dependent localenvironments due to accumulation of waste products and emergence of gradientsof nutrient accessibility (Fig. 3.7) [85, 7]. Cells located close to the periphery ofbiofilms, consume oxygen and nutrients, such that a smaller fractions can di�usedeeper into the aggregate. Especially, steep oxygen gradients were reported tocause hypoxic zones [86, 87, 88, 89, 90, 91], which reduces the metabolic activityand causes the cells to di�erentiate into a state comparable to the stationary phase[87, 91, 89, 90, 91]. The reduction in metabolic activity is assumed to contributeto higher antimicrobial tolerances, because antimicrobial agents are more e�cientagainst fast growing cells compared to slow growing ones [92, 54, 93, 94, 95].This assumption is additionally supported by an experiment that shows a higherantimicrobial tolerance of biofilms under global anaerobic conditions in comparisonto the aerobic controls [89]. Additionally, bacteria in deeper layers of the biofilmare starving for carbon and nitrogen [7, 96, 97] that also reduces metabolic activity[98, 99].
Di�erent strategies evolved to enable or increase metabolic activity in the in-ner periphery. Bacillus subtilis biofilms are able to counteract against nutrient
17

3 Introduction
gradients by metabolic cooperation. They coordinate their metabolic activity toensure a better nutrient supply for cells deep inside the biofilm, where nutrientsare limited. Cells, which experience nutrient limitation, send spatially propagatingwaves of depolarization [100]. This electrical signal reduces the metabolic activityof cells in the outer periphery, such that more nutrients can di�use into deeperlayers [101, 100]. Alternatively, cell autolysis is induced and provides nutrients andimportant matrix components [102].
If the costs of sustaining a biofilm outweighs its benefits, certain species act byinitiation of a biofilm breakdown and cell dispersal [103]. Depletion of mediumcompounds like carbon, iron or oxygen were reported to be capable of inducingbiofilm dispersal [104, 81, 105, 106, 107]. To transition e�ciently from the surfaceassociated biofilm to motile individuals, cells initiate matrix degrading to accessadditional nutrients and form dispersal units that should detach from the biofilmsurface [103]. For example, Staphylococcus aureus actively triggers biofilm disper-sion through production of matrix degradation enzymes, which are triggered by acollective cell level response to a global signal via quorum sensing [108, 109]. V.cholerae responds both at the level of an individual cell and on a multicellular levelvia quorum sensing to make a robust decision regarding biofilm size and nutrientavailability to start biofilm dispersal [110].
Another strategy to deal with nutrient limitation is the stringent response,which is triggered during amino acid, carbon or iron starvation [111, 112]. relAand spoT are the key players in regulation of pentaphospate guanosine (pppGpp)and tetraphosphate guanosine (ppGpp). Both e�ector molecules can activate thestringent response [113] and are summarized to (p)ppGpp. The accumulationof (p)ppGpp supports the survival during starvation stress by downregulationof macromolecular synthesis (e.g. nucleic acid and protein synthesis) and up-regulation of survival systems (e.g. systems involved in protein degradation) [111,114]. Interestingly, independent studies show that stringent response contributesto the biofilm tolerance during antimicrobial treatment [115, 116, 116]. Nutrientsupplementation increased biofilm susceptibility to antibiotics in comparison tothe nutrient starving control [117, 116]. Additionally, a reduced antimicrobial
18

3.2 Bacterial biofilms
tolerance was obtained in P. aeruginosa biofilms formed by �relA�spoT mutants,where the stringent response was deactivated [116, 116].
Figure 3.7: Chemical heterogeneity in biofilms. (a) Reaction-di�usion interactionsleads to nutrient gradients (green). Concentrations of Oxygen or anynutrient that is consumed decreases with penetration depth into thebiofilm. (b) Waste products are more concentrated inside the biofilm(red).
Antimicrobial treatment
Even though it has been known for decades that planktonic cells are more sus-ceptible to antimicrobial treatment than genetically identical cells inside biofilms[2], the mechanisms behind the higher antimicrobial tolerance of biofilms haveto be investigated further. Generally, several mechanism can cause an increasedantibiotic tolerance that is reported to be the 1000-fold between P. aeruginosabiofilms and their planktonic counterpart [118].
The surrounding biofilm matrix was reported to be a di�usion limiting barrierthat gives protection from penetration of bacteriophages [6] and some antibioticslike oxacillin, cefotaxime and vancomycin [119, 120, 121]. Interestingly, the pro-duction of curli amyloid fibers of E. coli biofilms is limited to cells located on thebiofilm surface, but gives protection to the whole biofilm [6]. However, various an-tibiotics are able to penetrate di�erent biofilm matrices without causing significantcell death [8, 122, 123, 124, 125, 126]. The penetration of antibiotics through thebiofilm is delayed due to the matrix. For example, the delay of tetracycline reachingall cells inside E. coli biofilms was measured to be 10 min [127]. It is assumed thatthe delay of antimicrobial penetration increases the time for a phenotypic response
19

3 Introduction
and consequently increases the antibiotic tolerance [91, 128].
Nonetheless, antimicrobial treatment of maturated biofilm can cause lethaldamage. Currently, V. cholerae infections are typically treated with tetracycline[129], which inhibits protein translation and di�uses quickly into the biofilm. Prioremergence of significant cell death or a physiological response to translationalinhibition, the biofilm architecture was modified during tetracycline exposure. Onthe single cell level, cells were still metabolically active and grew in size, but theycould not divide due to missing divisome proteins [130]. On the multicellular level,attractive interaction that were mediated by an extracellular matrix compound(RbmA) were decreased during the treatment, causing a reduction in cell-packingdensity. As a result, treated biofilms showed a higher susceptibility to phages orinvasion of other species. After 6 h of biofilm growth, cell death became significant[131].
The human pathogen N. gonorrhoeae causes gonorrhea and conjunctivitis. Dueto a rapid development of antibiotic tolerances, the treatment of gonorrhea ishampered [15]. Currently, gonorrhea is treated with a combination of azithromycinand ceftriaxone [132]. Cronenberg et al. found that azithromycin treatmentincreases motility inside gonococcal colonies and the e�ciency of a sequentialceftriaxone treatment. Simultaneous treatment of both antibiotics did not showany synergistic killing e�ect [5]. Even though the sequential treatment withazithromycin and ceftriaxone seems to be promising, the first resistant isolateswith a combined resistance to azithromycin and ceftriaxone were reported in 2018[133, 134]. Despite new promising antimicrobial treatments for gonorrhea likezoliflodacin are in sight [135], the number of possible antimicrobials is limited andthe e�ciency of future antimicrobials has to be optimized or alternative treatmentshave to be found. For example, Kim et al. found that commensal Neisseria strainshave the ability to kill N. gonorrhoeae [136]. In particular, the killing e�ect ismediated when N. gonorrhoeae takes up the commensal external DNA and doesnot recognize its methylation pattern. It has been proposed that any DNA thathas a di�erent methylation pattern, homology to the pathogen genome, and canenter the pathogen, could be used as a potential microbicide [136].
20

3.3 Cell and particle tracking methods
3.3 Cell and particle tracking methods
Time resolved imaging is important to characterize bacterial growth dynamicsand biofilm maturation. Due to progress in development of fluorescent proteinsand optical microscopy technology, particle localization and tracking is possibleinside bacterial biofilms. In order to analyse the acquired datasets, sophisticatedautomated particle tracking algorithms are needed. Particle tracking algorithmshave been developed for the analysis of colloidal systems and can be adapted tolocalize single cells inside bacterial biofilms. In the following, di�erent trackingapproaches will be introduced, as well as their limitations.
In general, spinning disk confocal microcopy has proven to be useful for theanalysis of short-time motility inside biofilms [50] and growth rates on longertime scales [12]. High temporal resolution can be achieved by acquisition of twodimensional image slices [50]. For three dimensional image acquisition the timeresolution is limited to approximately 10 min [12]. In the near future light sheetmicroscopy will be a promising alternative to spinning disk confocal microscopy,allowing smaller time resolutions below 10 min due to its reduced phototoxicity andphotobleaching technology [137]. Alternatively, microfluidic cultivation chambersare promising in cultivation and imaging two dimensional bacterial layers. Due tothe restricted height, bacteria cannot grow into the third dimension. Bright-fieldimaging allows a high spatial and temporal resolution and analysis of motility andgrowth dynamics [138].
3.3.1 Image segmentation
Localization and tracking of particles in time-lapse confocal microscopy has beenused to understand mechanical properties and dynamics of colloidal model systemsof crystals [139, 140] or glass transition [141]. Later, particle tracking algorithmswere adapted to track single cells inside biofilms to analyse cell motility and spatio-temporal growth dynamics [12, 50].
J. Crocker and D. Grier pioneered particle tracking by automatically findingfeatures in two dimensional systems with sub-pixel accuracy using the programming
21

3 Introduction
language IDL [142]. Later their code was adapted for MATLAB. D. Blair and E.Dufresne simplified the original code for particle localization in two dimensions,where Y. Gao and M. Kilfoil optimized the code and implemented it also forthree dimensional particle localization and tracking [143]. Particle tracking can bestructured into four stages: image segmentation, particle localization, refinementof positions and linking time resolved positions of particles into trajectories.
The easiest way to segment colloids or cells from the background is to set amanually or automatically defined threshold that removes the background noise.This approach was applied successfully in many particle tracking algorithms [144,145, 146, 147]. Prior to threshold definition, it can be necessary to increase theimage signal to noise ratio (SNR) by image processing. To this end, J. Crockerand D. Grier used a real-space bandpass filter consisting of an boxcar average filterand a Gaussian-filter. The boxcar average filter models the background signal andthe Gaussian-filter deals with the digitization noise. Both filters can be computedin a single convolution step by the kernel K(i, j) = 1
K0
Ë1B exp
1≠ i2+j2
4
2≠ 1
(2w+1)2
È,
where K0 and B are normalization factors and w is the radius from the objectof interest [142]. Alternatively, a watershed transform can be applied to segmentthe background noise from particle intensities [148, 149, 150, 151, 152, 153, 12].The image is considered as a topographic relief, which is flooded from the localminima. As a result, the contours of objects (watersheds) are returned and thebackground noise is removed. When this algorithm is used, over-sensitivity tonoise and over-segmentation can be a problem [149].
3.3.2 Particle localization
After image segmentation, the positions of colloids or cells have to be determined.Particle localization is typically achieved by applying a local maximum operatorfollowed by a further refinement. J. Crocker and D. Grier calculated the o�set‘ between the locally brightest pixel (x, y) and the brightness-weighted centroid(x + ‘x, y + ‘y) with
A‘x
‘y
B
= 1m0
ÿ
i2+j2Æw2
Ai
j
B
A(x + i, y + j) (3.1)
22

3.3 Cell and particle tracking methods
where m0 is the integrated brightness of the particle.
3.3.3 Particle tracking
The probability of finding single Brownian particle with a self-di�usion coe�cientD that di�used a distance ” between two frames is calculated by
P (” | ·) = 14fiD·
exp
A
≠ ”2
4D·
B
. (3.2)
Consequently, the probability distribution of N identical non-interacting particlesis
P ({”i} | ·) =3 1
4fiD·
4N
exp
A
≠Nÿ
i=1
”2
4D·
B
. (3.3)
In general, particle tracking algorithms link positions of successive frames intotrajectories. They tend to find trajectory-sets that maximize the probabilitydistribution P ({”i} | t) or the sum of displacements qN
i=1 ”2i . Even though the
tracking algorithm from J. Crocker and D. Grier assumes a non-interacting system,the algorithm is suggested to work well for weak-interacting spheres [142]. In orderto limit the number of possible combinations of P ({”i} | t), only displacements thatare shorter than a given distance L are considered. As a result, the tracking networkis divided into smaller sub-networks and the number of possible combinationsreduces from O(N !) to O(M !), where M is the number of linked particles insidea sub-network. The optimal cuto� distance for L is in the range of ” < L < a/2,where a is the distance between two neighboring particles. Y. Gao and M. Kilfoiluse the base algorithm developed by J. Crocker and D. Grier [142], but they includea multipass strategy. In a homogeneous scenario, where particles have a smalldisplacement compared to their neighbor distance, all particles can be tracked byone cuto� distance. In a dynamical heterogeneous scenario, where particles havedi�erent velocities, one cuto� is not su�cient anymore. Many tracks are lost, whenthe cuto� is too small. If the cuto� is too large, tracks get unreliable. To this end,Y. Gao and M. Kilfoil use their multipass strategy [143], which is described inchapter 5.4.4.
23

3 Introduction
3.3.4 Alternative particle tracking tools
The previously described localization algorithms are written for systems withidentical spherical particles. They fail to access information about the size ofindividual particles. To address this shortcoming, Leocomach et al. developeda novel method to localize spherical particles of arbitrary sizes in either 2D or3D images [154]. They found that very small particles are expelled from crystalsand accumulated on the growth front of them [154]. This information was notaccessible with standard particle tracking tools. In order to determine the posi-tion and orientation of rod-like colloids from confocal microscopy, Besseling etal. developed a new particle tracking algorithm, which should also work for ellip-soids and dumbbells with diameters down to 300 nm. This algorithm is reportedto be also applicable for active colloids like self-proppeled particles or bacteria [155].
In contrast to the previously mentioned tools that were primarily developed toanalyse colloidal systems, the aim of COMSTAT is to characterize biofilm mor-phology. In particular, this tool can analyse quantitative parameters like biomass,roughness, surface area, volume and several more [156]. Even though this softwarewas an important tool to quantify three dimensional biofilm structures [11], itcannot analyse internal properties of biofilms with cellular resolution.
Recently, the software tool BiofilmQ was published and allows the analysis ofspatio-temporal dynamics inside biofilms with a focus on cell cytometry, dataanalysis and data visualization [157]. Hartmann et al., who developed BiofilmQ,successfully tracked single lineages of V. cholerae as they grew from a founder cellto 10.000 cells [12]. They tracked single rod-shaped cells by minimizing deviationsin cell orientation and maximizing volume overlap. Assuming a constant cellwidth and a constant cell length between birth and division, growth rates weredetermined from cell tracking by measuring the cell length.
24

4 Aims of this study
99 % of bacteria are estimated to live in surface associated biofilms and mostinfectious diseases are related to this sessile state [158, 159]. Due to high tolerancesof biofilms against disinfectants, cleaning and antimicrobial agents, new strategieshave to be developed to treat unwanted and harmful biofilms that are responsiblefor industrial problems or chronic infections e�ciently. To this end, di�erentstrategies have been developed, including prevention of biofilm formation [160],interfering or disrupting the biofilm structure to increase the sensitivity to the hostdefense system [161, 162, 163, 164] and killing biofilm cells through synergisticapproaches, where the biofilm structure is dispersed and subsequently treated withconventional antibiotics [165]. In order to develop these strategies, informationabout the cellular structure and spatio-temporal dynamics of bacterial biofilms arerequired that are largely unknown for N. gonorrhoeae. Through attractive interac-tions mediated by their type 4 pilus system (T4P), gonococci rapidly organize inspherical microcolonies that grow with time, while maintaining their colony shape.
In the first part, we hypothesized that gonococcal colonies show liquid likeproperties that are influenced by T4P motor activity. Especially the sphericalshape of gonococcal colonies and the fusion process of two adjacent colonies arereminiscent of liquid drops. The positions of single cells were determined andby calculating the radial and remoteness distribution function, the gonococcalcolony structure was analysed. Additionally, we modified the motor activity of thegonococcal T4P machinery to study the e�ect on the colony structure.
In the second part, we hypothesized that cells inside gonococcal colonies showheterogeneous growth rates depending on their position. We aimed at characterizingthe spatio-temporal growth dynamics inside gonococcal colonies.
Therefore, we combined two strategies with complementary advantages and
25

4 Aims of this study
disadvantages. The first strategy was to develop a lineage tracking method toestimate growth rates by counting the o�spring of individual cells. The secondstrategy was to use the growth-induced flow field for determining growth rates.After successful implementation of these methods, we investigated to study spatio-temporal growth dynamics at di�erent growth conditions.
26

5 Material and Methods
5.1 Cultivation and Growth Media
In this study, the gram-negative bacterium Neisseria gonorrhoeae was used as amodel organism. Cells were cultivated for approximately 15 hours at 5% CO2 and37 ¶C on GC-agar plates (table 5.1). Using a plastic loop, cells were resuspendedfrom GC-agar plates to liquid GC-medium (table 5.2). To generate bacterial stocks,cells were resuspended in Mili-Q water containing 10% milk powder (Carl Roth,GC-Freeze) and rapidly frozen in liquid nitrogen. These stocks were stored at≠80 ¶C.
NaCl (Roth) 5 g/lK2HPO4 (Roth) 4 g/lKH2PO4 (Roth) 1 g/l
Proteose Peptone No. 3 (BD) 15 g/lsoluble starch (Sigma Aldrich) 0.5 g/l
Bacto Agar (BD) 10 g/lIsovitalex 10 ml/l
Table 5.1: GC-Agar was autoclaved and cooled to 55 ¶C before 1% Isovitalex (table5.3) was added.
27

5 Material and Methods
NaCl (Roth) 5 g/lK2HPO4 (Roth) 4 g/lKH2PO4 (Roth) 1 g/l
Proteose Peptone No. 3 (BD) 15 g/lIsovitalex 10 ml/l
Table 5.2: GC-Medium was autoclaved and stored at 4 ¶C. Prior usage, 1% Isovi-talex (table 5.3) was added.
D(+)-Glucose (Roth) 100 g/lL-Glutamine (Roth) 10 g/l
L-Cystein · HCl · H2O (Roth) 28.9 g/lCocarboxylase (Thiamine Pyrophosphate) (Sigma-Aldrich) 0.1 g/l
Ferric Nitrate (Fe(NO3)3 · 9H2O) (Sigma-Aldrich) 0.02 g/lThiamine · HCl (Roth) 0.003 g/l
4-Aminobenzoic Acid (PABA) (Sigma-Aldrich) 0.013 g/l—-Nicotinamide Adenine Dinucleotide (NAD) (Roth) 0.25 g/l
Cyanocobalamin (Vitamin B12) (Sigma-Aldrich) 0.01 g/l
Table 5.3: Isovitalex aliquots were stored at ≠20 ¶C
5.2 Bacterial Strains
All N. gonorrhoeae strains used in this study (Tab. 5.4) were supplied by co-workersand are based on wt (Ng150).
wt G4 motif was deleted by replacing it with the aac gene, which confers resistanceagainst apramycin. The G4 motif is responsible for antigenic variation of themajor pilin subunit pilE [166] and may generate heterogeneity by a�ectingpilus density and rupture force. To exclude the e�ect of antigenic varaition oncolony dynamics and T4P-T4P interactions [167], the G4 motif was deleted.
wt green For the strain construction, the sfgfp gene was fused with the pilEpromoter region (PpilE). Subsequently, the fusion product PpilE-sfgfp was
28

5.2 Bacterial Strains
transformed into the wt (Ng150) strain between the lctP and aspC loci.
pilTW B1 The goal was to generate a strain with a reduced T4P retraction dynamics.To this end, pilTW B1 produces a non-functional form of the retraction proteinPilT. Due to the fact that PilT forms hexameric rings [168], we assumed toget hexameric rings with a mixture of functional and non-functional PilT,causing a negative e�ect on T4P retraction dynamics. The activity of theATPase PilT depends on the Walker A box for ATP binding and on theWalker B box for ATP hydrolysis. Non-functional pilTW B was generated byreplacing glutamate within the Walker B box by alanine. The relative levelof functional and non-functional PilT depends on the promoter strength ofthe pilTW B genes. The pilTW B1 strain expresses the pilTW B gene under thecontrol of the IPTG-inducible lac promoter.
pilTW B2 The pilTW B2 strain expresses the pilTW B gene under the control of thestrong pilE promoter.
� pilT Without the retraction ATPase pilT, pilus polymers are still formed [169],but T4P loose their ability to retract and generate forces. ChromosomalDNA from strain GT17 was transformed into wt.
�relA�spoT The goal was to generate a strain that does not respond to nutrientstarvation via stringent response, which is activated by the gene productsof �relA and �spoT . This gene products adjust the level of the alarmone(p)ppGpp [113]. The production of (p)ppGpp is suppressed by the deletionof relA. To compensate the growth rate reduction that is cause by deletionsolely relA, spoT is additionally deleted [170].
�relA�spoT green The fusion product PpilE-sfgfp was transformed into the�relA�spoT (Ng198) strain between the lctP and aspC loci.
29

5 Material and Methods
Strain Relevant genotype Source/Reference
wt (Ng150) G4::aac [171]wt green (Ng194) lctp :: PpilEsfgfpspeR :: aspC [172]
G4 :: aac
pilTW B1 (Ng171) lctp : PlacP pilTWBermC : aspC [44]G4 :: aac
pilTW B2 (Ng176) iga :: PpilEpilTWBermC [44]G4 :: aac
�pilT (Ng178) pilT :: m ≠ Tn3cm [173, 44]G4 :: aac
�relA�spoT (Ng198) relA :: nptIIspoT :: ermC [172]G4 :: aac
�relA�spoT green (Ng224) relA :: nptIIspoT :: ermC [172]lctp :: PpilEsfgfpspeR :: aspC
G4 :: aac
Table 5.4: List of used strains in this study
30

5.3 Choosing the experimental design
5.3 Choosing the experimental design
A major challenge of this project was the detection and tracking of single bacterialcells within three-dimensional colonies. While tracking methods are well establishedfor eukaryotic tissues whose cells are about ten-fold larger than bacterial cells,tracking of single bacteria remains di�cult. Here, we developed experimentalmethods and software to overcome these di�culties by taking the advantages ofCLSM and spinning disk confocal microscopy.
5.3.1 Experiments to study the colony structure
In order to study the structure of gonococcal colonies, we used a Leica TCS SP8CLSM (CECAD Imaging Facility) with a 63x, 1.4 NA, oil immersion objectivelens and an argon laser with an excitation wave length of 488 nm. The software ofthe microscope allowed to increase the laser power as a function of the acquisitionheight. This was a critical feature, because cells below the focal plane absorb thelaser light and and cause a decreasing intensity signal at larger heights. The opticalresolution was maximized by decreasing the pinhole diameter of the microscope,leading to an automatically adjusted voxel size of 35 nm in x-y-direction and 130nm in z-direction, and a total view of 59.65x59.65 µm. Due to the long imageacquisition time of about 20 min, the sample needed to be fixated. For thisexperiment, photodamage was irrelevant and bleaching e�ects were negligible. Asa result. high laser power were used that saturated the image intensity signal.Samples were prepared as follows.
Cells were grown on GC + IsoVitaleX plates over-night at 37 ¶C, 5% CO2 andre-suspended in liquid GC-medium, to an optical density of 0.01 at a wavelength of600 nm. 300 µl of cell suspension was inoculated in our flow chamber setup, whichconsisted of an ibidi µ-Slide I0.8 Luer flow chamber with a glass bottom. The outletof flow chambers was connected via Elbow luer connector (Ibidi) and silicon tubingto a waste flask and a peristaltic pump (model 205U; Watson Marlow, Falmouth,United Kingdom) for constant nutrient supply. The inlet of flow chamber wasconnected to a growth-medium reservoir via a self-build bubble trap. To build abubble trap, the lower part of an 1 ml syringe was closed with a 500 µl reaction
31

5 Material and Methods
tube lid and a hole was drilled to connect the silicon tubing. This bubble trapcontained a reservoir directly above the inlet of the flow chamber. Instead ofentering the channel of the flow chamber, bubbles moved to the top of the bubbletrap.
The flow chamber setup was filled with GC-medium and 200 µl of cell suspensionwere injected into the flow chamber using a syringe. Prior to switching the flow on,cells were left for 1 h at 37 ¶C for attachment to the glass surface. After 6 or 24 hof growth, biofilms were stained with 10 µM Syto9 (Thermo Fisher Scientific) for15 min at 37 ¶C. Subsequently, the biofilms were fixed with 4 % paraformaldehydein 1x PBS for 15 min at room temperature and washed with 1x PBS. Staining,fixation and mounting procedures were performed as following: the peristalticpump was turned o�, a silicon tubing between growth reservoir and flow chamberwas pinched o�, the lid of the bubble trap opened and the preferred solution filledinto the bubble trap. Finally, the peristaltic pump was turned on again, such thatthe solution was injected automatically into the flow chamber in a well controlledmanner. In the end, the bubble trap was closed and the clamp removed.
To prepare 30 ml of 4 % paraformaldehyde, 1.2g paraformaldehyd was added to19 ml of MQ water and heated to 60 ¶C. In a fume hood, 10 µl of 5 M NaOH wasadded. Adding NaOH to the solution was continued until the paraformaldehydwas dissolved. 10 ml of 3x PBS was added to the solution and the pH was set to7.2 by adding small aliquots of 5 M HCl. The solution was filled with MQ water tothe final volume of 30 ml. Finally, the solution was filtered through a 0.45 micronfilter and stored at ≠20 ¶C. To reduce fluctuations during image acquisition thesamples were mounted with Mowiol (Table 5.5).
5.3.2 Experiments to study the spatio-temporal growth
dynamics
In contrast to the experiments that were performed to study colony structure, thesamples used to study growth dynamics needed to be alive. To increase acquisitionspeed and reduce photodamage of individual cells an inverted microscope (Ti-E,Nikon, Minato, Japan) equipped with a spinning disc confocal unit (CSU-X1,
32

5.3 Choosing the experimental design
Mowiol 4-88 2.4 gGlycerol 6 g
MQ water 6 mL0.2 M Tris-Cl (pH 8.5) 12 mL
DABCO 2.5 %
Table 5.5: Mowiol 4-88 was mixed with Glycerol and MQ water. The solution wasmixed using a magnetic stir bar for several hours at room temperature.After adding Tris-Cl (pH 8.5) the solution was heated to 50 ¶C for 10 minwith occasional mixing. When Mowiol was dissolved, it was centrifugedat 5000 g for 15 min. The supernatant was carefully removed andDABCO was added to 2.5 % to reduce bleaching. Stocks were stored in≠20 ¶C freezer.
Yokogawa, Tokyo, Japan) and a 100x CFI Apo Tirf objective (Nikon, Minato,Japan) was used. This spinning disk confocal microscope reduced the acquisitiontime to several seconds. By minimizing the laser power and exposure time a timeresolution of 15 min between image stacks was achieved. The software of themicroscope recommended a voxel size of 80 nm in x-y-direction and 200 nm inz-direction. To reduce the photodamage by the laser further, we increased thevoxel size in z-direction to 400 nm. For each time-point, three channels wereacquired. The signal of sfgfp expressing cells was captured in green channel withthe excitation laser wavelength of 488 nm. Dead cells were stained by PI andwere fluorescent in the red channel with the excitation laser wavelength of 561nm. Information about positions and sizes of colonies could not be extractedfrom image stacks taken in the green channel, because we mixed green fluorescentand non-fluorescent cells. To this end, we captured the states of whole colonieswith bright-field images of the home-position (bottom of flow chambers). Thepreparation of samples deviates from experiments that were performed to studycolony structure. Experiments to study growth and death within bacterial colonieswere performed as follows.
Fluorescent (sfgfp) and non-fluorescent cells were grown on GC + IsoVitaleXplates over-night at 37 ¶C, 5% CO2 and re-suspended to liquid GC-medium. In 5ml GC-medium, the optical density of fluorescent and non-fluorescent cells wasset to 0.1 with a ratio of 1 to 100. To ensure a proper cell mixture, the solution
33

5 Material and Methods
was supplemented with 100 µl pure water and incubated for 30 min in the shaking-incubator at 37 ¶C, 5% CO2. Supplementation of small quantities of water inducedcolony disassembly for an unknown reason. The long incubation time allowedassembly of new aggregates. Subsequently, 500 µl of this solution was diluted with500 µl GC-medium, prior to injecting 250 µl into the flow chamber-setup.
To enable time resolved image acquisition, it was necessary to disable or reducethe motility of colonies that can be observed on glass-surfaces. For this purpose,we used tissue culture treated ibidi µ-Slides I0.8 Luer flow chambers with a polymercoverslip. In order to coat the flow chambers, they were filled with 200 µl Poly-L-lysine (Sigma, stock solution 50 µg/ml) at least one day before the experiment.After one hour Poly-L-lysine was rinsed out of the flow chamber and dried forseveral hours at room temperature.
The flow chamber setup was assembled by connecting the outlet via Elbow luerconnector (Ibidi) and silicon tubing to a waste flask. Then, the inlet was connectedvia a self-build bubble trap to a 90 ml growth-medium reservoir, containing 4 µlpropidium iodide (PI). To build the bubble trap, the lower part of a 2 ml syringewas sealed with the lid of a 2 ml reaction tube and a hole was drilled to connectthe silicon tubing. This bubble trap contained a small reservoir directly above theinlet of flow chambers. Instead of entering the channel of flow chambers, bubblesmoved to the top of the bubble trap. Fresh-GC-medium was pumped constantlyat 1 rpm by a peristaltic pump (model 205U; Watson Marlow, Falmouth, UnitedKingdom).
5.4 General tracking procedures
5.4.1 Procedures for image segmentation
The CLSM and the spinning disk confocal microscope generated very di�erent datasets in respect to image composition, SNR, resolution and size. Before particlelocalization algorithms can be applied, all image stacks have to be segmented toprovide a reliable particle localization.
34

5.4 General tracking procedures
Segmentation of images acquired by CLSM
Images acquired by a CLSM showed a low background signal. All image stacks werefiltered using a three dimensional spatial bandpass filter to reduce the pixel noiseand the background signal, while retaining the information of the characteristicfeature size. We used the bandpass filter that was written by Y. Gao and M. Kilfoi.The algorithm is based on the IDL code from J. Crocker and D. Grier (Chap.3.3.1) [142]. In order to reduce computation time, the convolutions were computedon the GPU.
Figure 5.1: E�ect of a spatial bandpass filter applied on image stacks acquiredwith a CLSM. (a) Section from original image. (b) Same image sectionafter bandpass filter application.
5.4.2 Segmentation of images acquired by spinning disk
confocal microscopy
Images acquired by a spinning disk confocal microscope showed a reduced imageSNR and resolution compared to images acquired by a CLSM. Consequently, thespatial bandpass filter was not su�cient anymore to provide a reliable particlelocalization. We developed a novel image segmentation algorithm that reducesthe background noise e�ectively (Fig. 5.2). Additionally, the algorithm enables todistinguish between the peaks of dumbbell-shaped cells. This is a crucial propertythat enables a reliable particle localization and to count the o�spring of individual
35

5 Material and Methods
cells.
Figure 5.2: Image segmentation of image stacks acquired with a spinning diskconfocal microscope. (a) Section from original image. (b) Same imagesection after applying median-filter. (c) Image section after all filterswere applied.
At first, a median-filter was applied to get rid of single very bright voxels(Fig. 5.2b). Due to a di�erent pixel resolution in z-direction compared to x-y-direction, the particles appear to be squeezed together in z-direction. To solvethis issue, the 3D-images were resized by repeating every image slice three timesin z-direction to make the particle intensity profiles spherical. To reduce thebackground noise, the mean filtered image was subtracted from the original image.Subsequently, the image contrast or the signal to noise ratio was increased bytaking each intensity value to the power of 3. 59 intensity profiles of sphericalparticles have been manually saved and a parabola f(x) = ax
2 + bx + c was fittedto the data (Fig. 5.3a). Then a 3 dimensional kernel (Fig. 5.3b) was defined withf(x) = a(x ≠ b)2 + a(y ≠ b)2 + a(z ≠ b)2 + c. The negative part of the kernel (Fig.5.3b) is important to ensure lower intensity values for voxels which are locatedbetween dumbbell peaks (Fig. 5.3c) and to reduce noise. Without the negativepart of the kernel, two peaks in close proximity with a noisy intensity profile couldnot been distinguished from each other. But the partially negative kernel showedan artifact. The distance between two peaks increased due to the negative part(Fig . 5.3d) and was consequently slightly overestimated. However, we were mainly
36

5.4 General tracking procedures
≠10 ≠5 0 5 10≠0.2
0
0.2
0.4
0.6
distance [pixel=80nm]
p
(a)
5 10 15
5
10
15
[y,z,y] [pixel=80nm][x
,x,z
][pi
xel=
80nm
]
≠0.5
0
0.5
(b)
0 10 20 30 400
0.2
0.4
0.6
0.8
1
distance [pixel=80nm]
p
(c)
0 20 40 600
0.2
0.4
0.6
0.8
1
distance [pixel=80nm]
p
(d)
Figure 5.3: (a) Intensity profile of spherical particles. Black: mean values withstandard error. Red: Parabola fit f(x) = ax
2 + bx + c. (b) 3d-matrixis generated with the parabola fit using f(x) = a(x ≠ b)2 + a(y ≠ b)2 +a(z ≠ b)2 + c. The convolution of 3d-images with this matrix shows astrong reduction in noise and increasing intensity values for particles.Due to the negative part of the kernel, it is possible to distinguishbetween close intensity peaks. (c) 1d-convolution of a dumbbell shapedintensity profile with the parabola fit. Black: Parabola without thenegative part. Red: Parabola with the negative part. (d) Dumbbellshaped intensity profile is blurred before convolution.
37

5 Material and Methods
interested in the total number of cells, such that this e�ect was irrelevant. Sowe applied a 3D-convolution of our image stacks with this kernel (Fig. 5.2c).
5.4.3 Procedures for localizing individual cells
In order to localize particles, the objects of interest have to be distinguished fromthe background noise. To this end, image segmentation has to be adapted tothe acquired image stack and is often a necessary step prior particle localization.After determining the positions of cells with pixel-accuracy via a local maximumoperator, Y. Gao and M. Kilfoil used the fractional-shifting method to improvethe localization accuracy for three dimensional features [143]. The fracshift-kernelis calculated for the first iteration step by:
Q
ccca
‘x
‘y
‘z
R
dddb = 1M
ÿ
i2+j2+k2Æw2
Q
ccca
i
j
k
R
dddb I(m + i, n + j, p + k) (5.1)
I = I1 ú (1 ≠ |‘x|) ú (1 ≠ |‘y|) + I2 ú |‘x| ú (1 ≠ |‘y|)
+I3 ú (1 ≠ |‘x|) ú |‘y| + I4 ú |‘x| ú |‘y|(5.2)
I =
Y]
[Iq ú |‘z| + Iq+1 ú (1 ≠ |‘z|), q = p if ‘z Ø 0
Iq ú (1 ≠ |‘z|) + Iq+1 ú |‘z|, q = p ≠ 1 if ‘z < 0(5.3)
where M is the integrated intensity and w is the radius of the mask. For the firststep, the pixels of the kernel are in registry with those in the image. When thecentre is updated to (m + ‘x, n + ‘y, p + ‘z), the intensity I is calculated by a linearinterpolation of the involved voxels in the image, based on their volume contribution.In three dimensions, the intensity contribution of 8 voxels are involved, when avoxel is shifted to (m + ‘x, n + ‘y, p + ‘z). These 8 voxels are composed of 4 voxelsfrom the image plane p and 4 voxels from the upper image plane p+1. To reducepixel biasing for three dimensional particle localization, 20 iteration steps areneeded and in two dimensions one iteration step is su�cient [143].
38

5.4 General tracking procedures
5.4.4 Procedures for tracking cells
The localized objects have to be linked from frame to frame. In order to track allparticles with 100 % fidelity, Y. Gao and M. Kilfoil developed a multipass strategythat is superior to other particle tracking program in handling heterogeneousdynamics [143]. They start with a small cuto� to get trajectories with the smallestdisplacement and subsequently delete the corresponding positions. The cuto�value is increased and the procedure repeated until the maximal displacement isreached. The goal is to obtain as many long trajectories as possible. Hence, theparameter good, which defines the minimal length of trajectories, is also variable.In the first step, good is set to the longest trajectory, which is the number of framesacquired. Starting from the smallest cuto�, all cuto�s are tested and successfultracked positions deleted. Then, good is set to the second longest trajectory andso on until the minimal trajectory length is reached. Thus, the longest trajectorieswith the smallest displacement are tracked first and shorter trajectories with largerdisplacements later.
39

5 Material and Methods
5.5 E�ects of parameter variation on the RDF
The particle localization algorithm from Y. Gao and M. Kilfoi [143] was usedto determine three dimensional positions of cells after image segmentation. Thebacterial diameter and the minimal separation distance between two cells has tobe set manually. Variation of these parameters was analyzed with the RDF for allpositions determined from the CLSM.
The RDF is typically used to analyse hard-sphere fluids at di�erent densities.It computes the probability of finding two particles with a distance r apart,normalized with the probability of finding the same distance in an ideal gas at thesame density (Eq. 5.5), [174]. All distances n(b) between pairs of particles aredetermined and sorted into bins b with the width dr in the intervals [r, r+dr ]. Thedensity fl has to be determined from the distribution of particles to compute thedistribution of distances nid(b) in an ideal gas (eq. 5.4). To estimate the particledensity, the distribution of distances in an ideal nid(b) (eq. 5.4) was fitted to thedistribution of distances between two particles n(b). Thus, we guaranteed that theRDF converges to 1 for larger distances without explicitly determining the densityfl.
nid(b) = 4fifl
3 [(r + dr)3 ≠ r3] (5.4)
g(r + 12dr) = n(b)/nid(b) (5.5)
We noticed that variation of the main input parameters for the particle lo-calization algorithm influence the RDF. Variation of the Gaussian-width of thebandpass-filter kernel did not influence the RDF considerably (Fig 5.4a). Whenwe increased the bacterial diameter parameter, we observed slightly lower RDFvalues for small distances r (Fig 5.4b). We set the bacterial diameter to 0.7 µm,because this distance was in good agreement with electron microscopy images [31].Reducing the minimal separation distance showed the largest e�ect on the RDF(Fig 5.4c), causing a larger amount of small distances r around 0.5 µm. Overlapof particle intensity profiles in z-direction due to the point spread function of themicroscope could cause an unwanted peak between these particles, which could
40

5.5 E�ects of parameter variation on the RDF
have been localized by the a smaller minimal separation distance. However, it ismore likely that the lower minimal separation distance registered two separatepeaks of growing cells that showed a dumbbell shape prior cell division. We decidedto use a minimal separation distance of 70 % of the cell diameter (0.49 µm), becausethe main RDF peak was the highest at this value.
Figure 5.4: E�ect of parameter variation for coordinate determination on radialdistribution function g(r). wt (Ng150) colonies were analyzed after 6h; error bars: standard deviation of 15 colonies from 3 independentexperiments. g(r) for (a) varying width of the Gaussian filter, (b)bacterial diameter, and (c) separation between the bacteria and themask around the bacterial positions. Image adapted from [44].
41

5 Material and Methods
5.6 Implementation of particle tracking
Prior applying the particle tracking algorithm from Y. Gao and M. Kilfoi [143],positions of cells needed to be corrected in respect to the centre of mass (COM)of colonies. To this end, bright-field images (Fig. 5.5a) were analyzed to getinformation about positions of colonies. In order to determine the colony contour,the goal was to process the images in a way that a threshold can be used todistinguish between the signal of the colony and the background noise.
Image contrast was increased by taking every pixel to the power of 2 and amedian filter was applied. The signal distribution inside the colony showed peaksand troughs with a characteristic width d. Two di�erent filters were applied, whichreplaced the intensity of every pixel by the maximal (I1) or minimal (I2) value oftheir d/2 proximity. By inverting I2 and multiplication with I1, the resulting image(I3) showed a smoothed intensity distribution a high contrast to the backgroundnoise. A gaussian-filter was applied on the image I3. Through a threshold, thecolony area was determined (Fig. 5.5c). A circle was fitted to the colony contour(Fig. 5.5d). Subsequently, the goodness of the fit was determined by the meandeviation of colony contour and the fitted circle. Estimates from bad fits werediscarded. Additionally, estimates at time t that deviated to much from theestimates determined at time t ≠ 1 and t + 1 were also discarded. In order to fillthe resulting data gaps at time t, they were replaced by the mean value from t ≠ 1and t + 1. Finally, the estimated radii were corrected by a factor of 1.2.
The particle tracking algorithm fails for high cell densities. In order to reducethe density of fluorescent cells further, single cells with a maximal distance of 2µm from each other apart were assigned into clusters. The mean position of allcells inside clusters at a certain time t represents the coordinates of clusters. Theparticle tracking algorithm tracked the positions of clusters and generated a matrixcontaining the three dimensional cluster coordinates, the corresponding number offeatures, time, distance to the origin and cluster identification numbers.
42

5.6 Implementation of particle tracking
(a) (b) (c)
(d)
Figure 5.5: (a) Bright-field image of an early wt colony. (b) Self-written filterwas applied. (c) Setting a threshold gives the corresponding binaryimage. (d) Time-series of an wt colony with dt = 1.25h. Bright-fieldimages were registered, such that the COM of colonies was located inthe image centre. White lines: Contour of binary image. Red circles:Estimated colony edge by fitting a circle to the colony-contour andmultiplying this value by a factor of 1.2 to get the real radius r.
From the cluster trajectories, we were able to optimize the estimation of the
43

5 Material and Methods
height hcolony of the COM of the colony. We observed that hcolony depends onthe colony radius. The larger the colony radius was, the higher was the COMof the colony. Hence, we tested di�erent ratios of radii of colonies to estimatehcolony. We searched manually for a ratio, where the displacements of clusters weresymmetrical to the origin to estimate hcolony = 0.85 ú rcolony .
5.7 Limitations in particle localization and tracking
5.7.1 Pixel-biasing and SNR influence particle localization
Optical limitations of typical confocal microscopes reduce the maximal imageresolution to 200- 300 nm in the lateral and 500- 700 nm in the z-direction [175,176]. Due to the point-spread-function of the microscope, which is caused mainlyby di�raction from the objective [177], the cell body elongates in z-direction.When cells are aligned along the z-axis, their intensity signal can overlap andlead to an overestimation of particle size and errors in localization [154]. Giventhat the bacterial cell body is approximately 1 µm in diameter, its size exceedsthe resolution of confocal microscopy only 2-3 fold. Consequently, pixel-biasing,which influences the accuracy of cell-localization, confers a problem. In general,pixel-biasing describes the phenomenon, where the localized sub-pixel position of aparticle is biased towards the centre of a pixel/ voxel. Using the fracshift methodfrom Y. Gao and M. Kilfoil, one iteration step is su�cient to suppress pixel-biasingin two dimensions, but for three dimensional particle localization 20 iteration stepsare needed, because the x-y-data su�ers from the worse z-resolution [143].
Moreover, the SNR was reported to be the critical factor for localization algo-rithms [178, 179]. The SNR strongly depends on the particle density, acquisitionheight, laser power and on the used fluorophor. A high laser power and expo-sure times increases the image SNR, but potentially causes lethal photodamageand photobleaching of single bacterial cells. Free radicals emerge from bleachedfluorophores due to illumination, which are toxic to cells [180]. Consequently, abalance has to be found between an acceptable photodamage of the specimen,a su�cient image quality and spatio-temporal resolution. The choice of thesecoupled parameters and the experimental design strongly depends on the goal and
44

5.7 Limitations in particle localization and tracking
the bacterial species of interest.
Even though high laser powers were used during image acquisition of fixatedsamples with a CLSM, the SNR was the limiting factor for particle localization(Fig 5.6a). Close to the surface, the background noise was very small and low laserpowers could be used to distinguish between fluorescent cells and background noise(Fig 5.6b). As a function of penetration depth into the fluorescent colony relativeto the surface, the SNR decreased. At a height of 25 µm the signal was barelydistinguishable from noise and higher laser powers could not increase the SNR. Toensure reliable particle localization and reduce boundary e�ects, we limited ouranalysis to particles with a height from 8 µm to 22 µm and, which were at leastone particle diameter from the colony edge apart 5.6c).
In contrast, particle localization of image stacks acquired with a spinning diskconfocal microscope allowed particle localization up to a height of approximately 8µm. This reduced height can be caused by the larger pinhole size of the spinningdisk unit. However, when fluorescent and non-fluorescent cells were mixed, thebackground noise inside the colonies decreased, allowing particle position detectionup to a height of 25 µm.
5.7.2 Motility and density influence particle tracking
The successful application of particle tracking algorithms strongly depends onthe displacement and the density of particles that should be tracked. In general,particle tracking algorithms link positions of successive frames into trajectoriesby minimizing the total displacement of the positions. A high particle densitycombined with a large maximal displacement leads to a very high number ofpossible combination that are computationally too expensive to calculate. In orderto reduce the number of calculations, there are di�erent options.
The first option is to keep the particle displacement low by having a hightemporal resolution. This solution is limited by the toxicity of the laser light tobacterial cells during fluorescence microscopy. Phototoxicity can be reduced bydecreasing the laser power or the exposure time, where the minimal exposure timeis obtained by acquisition of a single image slice. Three dimensional images consist
45

5 Material and Methods
Figure 5.6: Determination of analysed segment. (a) Cross section of an examplestack of a whole wt colony after 24 h. Scale bar: 10 µm (b) Theintensity of signal (black) and background noise (red) depends on theacquisition height. Mean and standard deviation of signal and noise.Signal and noise were determined separately for each layer from theexample stack. The image signal was defined with a mask aroundthe tracked bacterial centroids and the noise was defined as the signalbetween the bacterial bodies. (c) Tracked bacterial position fromexample stack are illustrated with white spheres (diameter = 0.7 µm).Selected bacterial positions for analysis are color coded in red. Imageadapted from [44].
typically of several image slices and consequently require a higher exposure time
46

5.7 Limitations in particle localization and tracking
depending on their height or their number of image slices. The second option isto keep the particle density low. This solution can be also successfully appliedto two dimensional particle tracking, where only neighbors in the focal plane areconsidered. Alternatively, fluorescent and non-fluorescent cells can be mixed toreduce the density of the fluorescent cells.
47

5 Material and Methods
5.8 Data analysis
5.8.1 Characterization of colony structure
The colony structure was characterized by both the RDF and the remotenessdistribution function. Every experimental condition was performed three timesand for each experiment 20 image stacks of di�erent colonies were acquired. Theobtained RDFs, g(r), were reminiscent of RDFs from Monte Carlo simulationsof hard spheres with Lennard-Jones interactions [181, 182]. Since, analyticalexpressions for the RDF of Lennard-Jones fluids exist, we applied the formulaproposed by Matteoli and Mansoori [182],
g(r > r0) = 1+y≠m[g(r0≠1≠⁄)]+(y ≠ 1 + ⁄
y))úexp[≠–(y≠1)]cos[—(y≠1)] (5.6)
where r0 is the nearest neighbor distance, y = rr0
is a normalized variable, andm, ⁄, – and — are adjustable parameters. Using equation 5.6, we determined thenearest neighbor distance r0 and the corresponding height, which is a measure fororder.
The RDF does not provide information about local irregularities inside thecolony structure. To address the question whether holes are present within thecolony, we implemented the remoteness distribution function [183] that gives theprobability of finding a voxel inside the colony and a centroid of a particle adistance r apart. It was computed to measure the size of defects or inhomogeneityinside our bacterial colonies. At first, we distinguished between colony volumeand background by thresholding all image stacks to obtain binary image stacks.Thus, the colony volume was one and the background and holes inside the colonywere zero. Subsequently, we extruded 4.2 µm from the colony edge to removeany artifacts and filled the holes inside all binary images. The next step wascomputationally very intensive, because we calculated the distance between everycolony voxel to the closest particle. As a result, voxels located in previouslymentioned ’hole’, show larger distances compared to other positions.
48

5.8 Data analysis
5.8.2 Growth rate determination
To determine time-resolved growth rates, we tracked the coordinates of clustersin 1.5 h intervals [t, t + 1.5h] with t œ [0h : 0.25h : 3h]. Additionally, we sortedthem into position intervals [re, re + 2µm] relative to their mean distance to theedge of colonies re within 1 µm steps. In the following, two di�erent methodswill be introduced that can be used to calculate spatio-temporal growth ratesinside gonococcal colonies. Please note, that the cell counting method measuresgrowth rates relative to the distance to the colonies edge re, but the growth ratesderived from the velocity field are relative to the COM of colonies rc. For a bettercomparison between these methods, we discarded colonies at time t, which showeda larger or smaller radius than the standard deviation from the mean colony radiusat time t.
Determination of growth rate with cell counting (CC method)
Sfgfp-expressing cells were mixed with non-fluorescent cells in a ratio of 1:100. Thesefluorescent cells were homogeneously mixed inside non-fluorescent cell dominatedgonococcal colonies and formed with progressing time, fluorescent clusters. Thepositions of clusters were tracked using the particle tracking program writtenby Y. Gao and M. Kilfoi [143]. The number of cells inside clusters at a specifictime interval and mean distance to the edge of colonies were normalized bytheir initial number of cells Ncluster(t + ·)/Ncluster(t) and averaged. When atleast 5 or 10 clusters fulfilled the conditions, we fitted an exponential functionNcluster(t + ·)/Ncluster(t) = exp(⁄·) to the averaged and normalized number ofcells to obtain growth rates ⁄(re, t).
Determination of growth rate from velocity fields (VF method)
Here, we aim at measuring growth rates based on the flow profile within colonies.At first, the velocity field had to be obtained from trajectories of clusters. Onlythe radial component relative to the COM of colonies was of interest. Hence, eachtrajectory was projected to spherical coordinates to obtain the radial distancerc = rcer, which gives directly the distance between the COM of colonies and thepositions of clusters (Fig 5.8).
49

5 Material and Methods
0 0.5 1 1.51
1.5
2
2.5
t [h]
N(t
)/N
(0)
re œ [1, 3]µm
0 0.5 1 1.51
1.5
2
2.5
t [h]N
(t)/
N(0
)
re œ [3, 5]µm
0 0.5 1 1.51
1.2
1.4
1.6
1.8
t [h]
N(t
)/N
(0)
re œ [5, 7]µm
0 0.5 1 1.51
1.5
2
2.5
3
t [h]
N(t
)/N
(0)
re œ [7, 9]µm
Figure 5.7: Examples of various exponential fits to the normalized number ofcells. Red dotted line: exponential fit, black squares: mean normalizednumber of cells at a given distance from the edge of colonies.
For each time interval [t, t + 1.5h] with t œ [0h : 0.25h : 3h], the velocity ofclusters vcluster was determined by a linear fit rc(·) = vcluster ú · + rc(0) to theradial distances. The position of clusters was calculated by averaging the corre-sponding radial distances and sorting them into position intervals [rc, rc + 2µm]within 1 µm steps. In order to calculate growth rates from the velocity fields, thecontinuity equation fl = ≠Ò · (vfl) + ⁄fl was solved by Marc Hennes assuming aconstant density fl. The velocity fields were determined relative to the COM ofcolonies rc, whereas growth rates determined by the velocity field were plotted
50

5.8 Data analysis
relative to the mean radius of colonies for a better comparison with the CC method.
Figure 5.8: Illustration of distance to the edge or COM of colonies. The blue circlehas the distance rc to the COM of the colony and the distance re tothe edge of the colony. Red dot: COM of the colony, black: edge ofthe colony.
To confirm a constant density inside colonies, we generated colonies that con-tained solely sfgfp fluorescent cells (Fig. 5.9a). Using the spinning disk confocalmicroscope, we could access only bacterial positions below an acquisition height of8 µm inside colonies. Optimally, the density had to be determined relative to theCOM of colonies. But due to the height restriction, the amount of data neededto determine the density decreased rapidly for larger distances from the edge ofcolonies. This issue was solved by using both spherical and cylindrical coordinates.On the one hand, spherical coordinates gave the spatial density distribution upto a distance of 4 µm from the edge of colonies. On the other hand, cylindricalcoordinates allowed density determination up to a distance of 16 µm from the edgerelative to the z-axis of the COM of colonies. Both methods yielded a comparableresults indicating a homogeneous density distribution throughout the colony. At adistance of rc < 3 cm from the edge of the colony, the density decreased (Fig. 5.9b).This inhomogeneity of cell density has to be take into account when determininglocal growth rates.
51

5 Material and Methods
(a) (b)
Figure 5.9: a) Typical orthogonal view of wt green (Ng 194) colonies formed after1 h. Scale bar 10 µm. b) Cell density profile through colony. Blackcircles: cylindric coordinates, red triangles: spherical coordinates.Image adapted from [172].
5.8.3 Determination of fraction of dead cells
Here, we aimed to determine the fractions of dead cells locally. To visualizedead cells, we used a DNA intercalating dye that penetrates the cell envelope ofdead but not of living cells. To this end, we stained all colonies with PI, whichwas supplemented to the growth medium and constantly supplied into our flowchambers. The positions of dead cells inside colonies were located using the samemethod, which was used to locate living cells (Chap. 5.4.3). The number ofdead cells were binned to 2 µm intervals relative to the edge of the colony anddivided by the total number of cells located in the corresponding volume section”
ú(r) = ”(r)fl(r)V (r) , where ”(r) was the number of dead cells inside the volume section
V (r) and fl(r) was the total cell density. The cell density was assumed to beconstant. This assumption was false for distances smaller than 3 µm away fromthe edge of colonies. Thus, the fraction of dead cell was underestimated there. Fora better comparison between the fraction of dead cells and the growth profilesobtained by CC and VF method, we averaged the fraction of dead cells inside timeintervals of [t, t + 1.5h].
52

6 Results
In this thesis, we investigated the architecture and growth in gonococcal colonies inspace and time. In the first section, we characterize the structure of fixed colonies.In particular, we are interested in how T4P motor activity a�ects the local celldensity and local order of colonies. We generated di�erent mutant strains andcharacterized their T4P motor activity and T4P-T4P interactions. Subsequently,we investigated structures of colonies formed by mutants strains via RDF andremoteness distribution function after 6 h and 24 h of growth.
In the second section, we developed novel methods that enable us to determinespatio-temporal growth rates of living gonococcal colonies via counting the o�springof individual cells or characterizing the velocity field. Both methods have theiradvantages and disadvantages that can be combined and utilized for a robustgrowth rate characterization. In order to to study how the system responds toperturbations, we applied di�erent stresses and interfered with a stress responsesystem.
53

6 Results
6.1 Structural properties of gonococcal colonies
Using laser scanning confocal microscopy, we were able to characterize the structureof fixed gonococcal colonies with the RDF and the remoteness distribution function.Considering that gonococcal colonies are spherical and fuse upon contact, wehypothesized that they may have properties of liquids. To assess this hypothesis,we investigated the local order of the colonies. Furthermore, we addressed thequestion whether the T4P motor properties a�ect the materials properties of thecolonies.
6.1.1 Gonococcal colonies show liquid-like order
We hypothesized that the gonococcal T4P machinery supports local ordering andgenerates a liquid like colony structure. Gonococci were allowed to grow intocolonies for 6 h and 24 h, respectively, before they were fixed and imaged asdescribed in the methods. To investigate local order, we determined the RDF.For liquids, we expect short-ranged order, for solids long-ranged order, and forgas, we expect a flat RDF. For distances larger than 2.5 µm, which correspondsto approximately three cellular diameters, the RDF determined from coloniesformed by the wt (Fig. 6.1a,b) converged to one (Fig. 6.1c). However, for lowerdistances, we observed two peaks. The first peak, which can be interpreted asthe nearest neighbor distance, is higher compared to the second peak, which canbe consequently interpreted as the second nearest neighbor distance. The higherthe amplitude of the first peak g(r0), the higher is the order and vise versa. Wefound that the nearest neighbor distance decreased from r
6h0 = (1.18 ± 0.02)µm to
r24h0 = (1.14±0.01)µm and the amplitude increased from g(r0)6h = (1.23±0.02)µm
to g(r0)24h = (1.46 ± 0.02)µm as a function of time. In summary, local order anddensity increase with time for gonococcal colonies.
6.1.2 Motor activity accelerates local-ordering
T4P are important for regulation of structure and dynamics of biofilms [36, 184,37, 185]. To address the question, which role T4P retraction plays for the structureof gonococcal colonies, we generated mutant strains with modified T4P motor
54

6.1 Structural properties of gonococcal colonies
Figure 6.1: Liquid-like order of gonococcal wt colonies. Confocal section of wtcolonies after (a) 6 h and (b) 24 h of growth. Scale bar: 4 µm. RDF after6 h (black) and 24 h (red). Shaded lines: RDF of individual colonies,full lines: fit to equation 5.6. Error bars contain mean values andstandard deviations of 15 colonies from three independent experiments.Image adapted from [44] and reproduced with permission.
activity. Our assumption was that cells inside colonies form a T4P network, wherepili bind to each other, followed by retraction events that cause their bonds torupture (Fig. 6.2). This tug of war mechanism would allow cell motility andreorganization of cells within colonies.
55

6 Results
Figure 6.2: Sketch of how T4P interaction between adjacent cells mediate cellre-organization. The pilus of the red cell binds to a close cell aggregateand minimizes the distance of both aggregates through pilus retraction.
To investigate how intermediate phenotypes between full T4P retraction activityand low T4P retraction activity a�ect colony structure, we generated two �pilTW B
mutant strains, which express both functional and non-functional PilT. PilT formshexamers prior to binding to the T4P complex to induce pilus retraction [49]. Forthis project, I teamed up with Tom Cronenberg and Robert Zöllner to correlate T4Pmotor activity, T4P-mediated attractive interactions and local structure of colonies.
By expressing both functional and non-functional PilT at di�erent ratios, mostlikely heterohexamers are formed. Tom Cronenberg characterized the e�ect of�pilTW B expression on T4P motor activity. The presence of non-functional PilTinduced lower retraction velocities and a higher probability of finding pili in thestate of pilus elongation or pausing. Next to the e�ect on motor properties, itwas important to characterize the e�ect of �pilTW B expression on attractive inter-actions between gonococci. Robert Zöllner used a double-laser trap to measureT4P-mediated attractive interactions. Interestingly, the presence of non-functionalPilT did not influence the rupture force of T4P-T4P binding, but the transitionfrequency at di�erent states like retraction, elongation and pausing changed. Inparticular, the T4P-T4P bond rupture and retraction frequency decreased for�pilTW B strains, while elongation and pausing frequencies increased. As a result,the probability that two cells are attached to each other increases for �pilTW B1
strains and even more for �pilTW B2 [44].
56

6.1 Structural properties of gonococcal colonies
Additionally, we generated the �pilT mutant strain lacking the T4P retractionATPase PilT. In the absence of PilT, slow retraction velocities were reportedindicating that PilT is not essential for pilus retraction. However, retractionvelocities and force generation without the retraction ATPase were too low tosupport twitching motility or fluidization of colonies [27]. Typically, gonococcalcolonies are spherically shaped (Fig. 6.3a,d). While the presence of non-functionalPilT still supports the spherical shape of colonies (Fig. 6.3b,e), the �pilT mutantstrain does not form spherical colonies [186, 185] (Fig. 6.3c,e), indicating thatactive force generation is important for colony organization.
Figure 6.3: Orthogonal views of image stacks of gonococcal colonies with di�erentT4P motor properties. Typical colonies of (a) wt , (b) �pilTW B2 and(c) �pilT formed after 6 h and (d,e,f) 24 h ). Image adapted from [44]and reproduced with permission.
To access the e�ect of T4P motor activity on the local order of gonococcal
57

6 Results
colonies we computed the local cell density and RDFs. A higher pilus motoractivity supports a higher local cell density on shorter time scales (Fig. 6.4g,h,i).For all strains, densities increase with time (Fig. 6.4) and converge to a maximaldensity of 0.55 cells/µm3. Solely colonies formed by the �pilT mutant strain showa lower cell density after 24 h, indicating that active force generation is necessaryto reach high cell densities.
Figure 6.4: Reconstruction of bacterial coordinates of colonies formed by (a) wt, (b)�pilTW B2 and (c) �pilT after 6 h and (d,e,f) 24 h. The colors encodethe number of nearest neighbors n. Local cell density of colonies formedby (g) wt, (h) �pilTW B2 and (i) �pilT after 6 h and 24 h. Error bars:standard errors of 15 colonies from three independent experiments.Image adapted from [44] and reproduced with permission.
58

6.1 Structural properties of gonococcal colonies
The RDF of colonies formed by the �pilTW B2 strain show a short-ranged ordersimilar to the wt (Fig. 6.5a), but the nearest neighbor distance (Fig. 6.5c) andthe amplitude of the first RDF peak (Fig. 6.5d) are higher, confirming the lowerlocal cell density (Fig. 6.4g,h) and indicating more local order. After 24 h,RDF of colonies formed by the �pilTW B2 strain shows a neighbor distance ofr
W B2,24h0 = (1.13 ± 0.01)µm and an amplitude of g(r0)W B2,24h = (1.48 ± 0.02)µm,
which is comparable with the RDF obtained from wt colonies. �pilT coloniesdo not show maxima in their RDF, indicating a gas-like arrangement after 6 hof colony growth (Fig. 6.5 b). After 24 h, local order emerged and the nearestneighbor distance decreased. Probably, cells were able to generate forces during
Figure 6.5: Comparison of RDFs of colonies formed by (a) �pilTW B2 and (b) �pilT
after 6 h (black) and 24 h (red). Shaded lines: RDF of individualcolonies, full lines: fit to equation 5.6. Error bars contain meanvalues and standard deviations of 15 colonies from three independentexperiments. (c) Contact distance r0 and (d) value of RDF at r0obtained from fit to Eq. 5.6. Image adapted from [44] and reproducedwith permission.
59

6 Results
growth through volume exclusion or simply filled the free space through growth.Additionally, low force generation can be su�cient for bacterial rearrangements atlong time scales. In conclusion, T4P force generation is not essential for emergenceof local order, but it accelerates the process, causing higher cell densities at earlierstages.
6.1.3 Gonococcal colonies show defects in their structure
After 24 h, we observed holes in the structure of wt and �pilTW B2 mutant coloniesstained by SYTO9 (Fig. 6.3d,e), which have not been there after 6 h (Fig. 6.3a,b).We characterized the holes inside wt colonies by the remoteness distribution [183].The remoteness distribution gives the probability of finding the shortest distance r
between a voxel located inside a colony and a position of a cell. Thus, by definition,the maximum of the remoteness distribution (Fig. 6.6) corresponds to half thenearest neighbor distance determined by the RDF (Fig.6.5a,b). We observedthat the remoteness distribution shifted to higher values for 24 h old colonies(Fig. 6.6a,b), which confirmed our observation of more holes inside colonies after24 h compared to 6 h. The size of holes inside wt and �pilTW B2 colonies aresimilar (Fig.6.5a,b), indicating that motor activity does not influence defects inthe structure of gonococcal colonies.
We assumed that these holes were caused by dead cells that still occupied thespace, but staining dead cells with PI did not work together with cell fixation.Later, image stacks of wt green colonies were acquired with a spinning disk con-focal microscope without cell fixation. Indeed we observed again holes in thecolony structure. PI staining confirmed that dead cells were located inside wtgreen colonies, causing areas without fluorescence. Theoretically, SYTO9 stainsboth living and dead cells, where the intensity from dead cells should be weakercompared to living cells.
In contrast to spherically shaped colonies, colonies formed by the �pilT strainshow large holes on short time scales (Fig. 6.3c). After 24 h, the size of holes inside�pilT colonies decreases (Fig. 6.6c), but the holes are still larger in comparison
60

6.1 Structural properties of gonococcal colonies
to holes inside wt and �pilTW B2 colonies. In conclusion, high forces during pilusretraction are necessary to allow cell rearrangement and reduce the size of holesinside gonococcal colonies.
Figure 6.6: Remoteness distribution of colonies formed by (a) wt, (b) �pilTW B2and (c) �pilT after 6 h (black) and 24 h (red). Error bars contain meanvalues and standard deviations of 15 colonies from three independentexperiments. Image adapted from [44] and reproduced with permission.
61

6 Results
6.2 Dynamics and growth within bacterial colonies
Growth of bacteria has been characterized at the single cell level for planktonicbacteria and at the colony level for bacteria residing within colonies. Measuringgrowth rates at spatial and temporal resolution within colonies remains challenging.Here, we use spinning disk confocal microscopy to characterize spatio-temporalgrowth and death dynamics within gonococcal colonies. First, we measured themean growth rate inside gonococcal colonies by estimating the total number of cellsfrom radii of colonies. Subsequently, growth rates were determined with single cellresolution by cell counting (CC method) and from the velocity field (VF method).Since, all methods generated consistent growth rates, we investigated the e�ectof environmental and chemical changes on the spatio-temporal growth and deathdynamics. To this end, we varied the nutrient supply, inhibited stringent responseor treated gonococcal colonies with azithromycin.
6.2.1 Colony growth shows deviations from exponential growth
after two hours
At first, we analyzed the growth of wt colonies by monitoring the radius R(t) ofgonococcal colonies for several hours in our flow chamber setup under constantnutrient supply. The cubed colony radius is proportional to the number of cellsinside a colony Ncol(t) = flV = 4/3flfiR(t)3. Due to fluctuations of the initialcolony size, we normalized Ncol(t) to the initial number of cells Ncol(0). Assuming aconstant density, we get (R(t)/R(0))3 = Ncol(t)/Ncol(0). By fitting an exponentialfunction Ncol(t)/Ncol(0) =exp(⁄colt) to the first 2 hours, we were able to calculatethe mean colony growth rate ⁄col = (0.56 ± 0.01)h≠1. Afterwards, Ncol(t)/Ncol(0)deviated from exponential growth, indicating a transition from homogeneous toheterogeneous growth inside gonococcal colonies (Fig. (6.7)).
In the next step, we repeated the procedure for sfgfp expressing bacteria (wt green)to check for growth rate di�erences. Indeed, the sfgfp expression under the strongpilE promoter caused a lower mean colony growth rate ⁄
greencol = (0.42 ± 0.01)h≠1
(Fig. 6.7). In summary, both strains showed the transition from exponential growth
62

6.2 Dynamics and growth within bacterial colonies
to sub-exponential growth at the same age. We suggest, that growth rates becameinhomogeneous at this point of time. Our hypothesis will be addressed in thefollowing chapters.
0 1 2 3 4 51
2
345678910
t [h]
Nco
l(t)/
Nco
l(0)
wt*wt* green
Figure 6.7: Expression of sfgfp reduces growth rate. Mean number of cells withincolony Ncol(t) normalized by the number of cells in the colony att = 0, Ncol(0) for wt (Ng150, black) and wt green (Ng194, grey).Full lines: exponential fits with (Ncol(t))/(Ncol(0)) = exp(⁄colonyt).⁄(colony,wt) = (0.563 ± 0.003)h≠1 and ⁄colony,wtgreen = (0.42 ± 0.01)h≠1.(mean ± se, > 40 colonies for each data point). Image adapted from[172].
6.2.2 Lineage tracking within gonococcal colonies reveals
development of growth profiles
We developed a method to track lineages inside gonococcal colonies. At first, wetried to track all cells inside our colonies, but we observed a low penetration depthof only 8 µm due to background noise. Furthermore, whole colonies as well as singlecells within colonies were motile. As a result, the particle tracking program fromY. Gao and M. Kilfoil failed to track all cells inside our densely packed colonies.Setting a low maximal displacement in the particle tracking program gave only afraction of single cell trajectories, because some cells had a larger displacement.
63

6 Results
Figure 6.8: Lineage tracking in gonococcal colonies. wt (Ng150) mixed with wtgreen (Ng194). a) Typical confocal plane (h = 3 µm) through a colonyat di�erent time points. Overlay between brightfield (grey), sfGFPfluorescence (green), and PI fluorescence (red). b) 3D reconstruction ofpositions of fluorescent cells. The blue frame denotes the plane shownin a). �h between black circles: 1 µm. c) Cluster dynamics in growingcolony. Green circles: Positions of wt green gonococci. 3D projectionsof all wt green cells are shown. Black circle: Circumference of singlecluster. Blue line: Trajectory of centre of mass of cluster. White line:Edge of colony. Red circle: Circle depicting radius of colony. Scalebars: 10 µm. Image adapted from [172]
Increasing the maximal displacement value lead to failure of the particle trackingprogram as a consequence of too many possible combinations. Theoretically, wecould have increased the time resolution to minimize the displacement of cells
64

6.2 Dynamics and growth within bacterial colonies
between to successive image stacks, but this was prohibited by the toxicity of thelaser light to our sample, which limited our time resolution to 15 min. Unfortu-nately, the division plane of gonococci switches every generation [187] and due tothe low spatio-temporal resolution monitoring growth from gonococci to diplococciwas not possible.
In order to reduce the density of fluorescent cells, we successfully mixed fluores-cent and non-fluorescent cells at a ratio of 1 : 100. In freshly assembled colonies weobserved that the small sub-population of single fluorescent cells were surroundedby non-fluorescent neighbors. Later, the fluorescent cells divided and formed largerfluorescent clusters, which were defined as clusters (Fig. 6.8). In the followingtwo sections, two di�erent methods will be described that were used to calculatespatio-temporal growth rates from the cluster tracking. In the first method wecount the number of cells associated with a specific cluster and fit an exponentialfunction to calculate the growth rate. The second method takes the displacementof clusters into account. Growing cells within dense colonies generate pressure ontheir neighbors, leading to a velocity field that points from the center of mass ofa colony to its edge. Thus, the velocity field gives information about the growthdynamics of cells inside a spherical colony (Fig. 6.13c), where faster growing cellsgenerate steeper velocity gradients and vice versa.
Cell counting (CC) method reveals heterogeneous growth profiles
The CC method determines the e�ective growth rate of the fluorescent wt greencells inside a colony consisting mainly of non-fluorescent wt cells. Young coloniestypically contained only a few fluorescent cells that were surrounded with non-fluorescent neighbors. These cells and their o�spring were assigned to clusters(Fig. 6.9a). By tracking the COM of clusters, we were able to count the numberof cells inside each corresponding cluster with a temporal resolution of 15 min.Clusters that started with a single cell showed almost discrete time steps with ageneration time of around 1.5 h (Fig. 6.9b). The almost simultaneous cell divisionsoccurred, because the o�spring resided within the same stage of the cell cycle. Incontrast, when a cluster was initiated by multiple cells, their cell cycles were not
65

6 Results
synchronized. Consequently, cell divisions occurred not correlated in time.
Figure 6.9: a) Example of single growing cluster highlighted in Fig. 6.8. b) Numberof cells N(t) within the cluster shown in a). Image adapted from [172]
In general, cells divide with a growth rate ⁄ and die with a death rate ”. Theyfollow the di�erential equation N = dN
dt = (⁄ ≠ ”)N , where x is the number ofcells. The corresponding solution is an exponential function N(t)/N0 = e
⁄eff t with⁄eff = ⁄ ≠ ” and an initial cell number of N0.
By splitting the data into 1.5 h long time intervals [t, t + 1.5] and sorting themrelative to the colony edge in position intervals [re, re + 2], we assigned spatio-temporal growth rates to each cluster by fitting an exponential function (Eq. 6.1)to each time and position interval (Fig. 6.10a). Additionally, the fraction of deadcells in the corresponding position and time intervals were determined (Fig. 6.10b).
N(t + ·)/N(t) = exp(⁄ ú ·) (6.1)
During the initial 2 h, we observed a homogeneous growth profile throughoutthe colony with a growth rate of ⁄wt = (0.42 ± 0.03)h≠1 (Fig. 6.10c). Afterwards,growth rates decreased towards the colony COM. This observation is consistentwith the transition from exponential to sub-exponential growth, calculated fromthe radii of colonies. The fraction of dead cells was maximal around the COM
66

6.2 Dynamics and growth within bacterial colonies
1 2 3 40
5
10
15
20
25
t [h]
r c[µ
m]
0 0.2 0.4 0.6Growth rate [h≠1]
(a)
1 2 3 40
5
10
15
20
25
t [h]
r c[µ
m]
0 1 2 3 4·10≠2fdead
(b)
0 0.5 1 1.51
1.2
1.4
1.6
1.8
2
t [h]
Ncl
uste
r(t)
/Ncl
uste
r(0)
re œ [0, 15] µm
(c)
0 2 4 6 8 10 120
0.1
0.2
0.3
0.4
0.5
re [µm]
⁄[h
≠1 ]
(0-1.5)h(1-2.5)h(2-3.5)h(3-4.5)h
(d)
Figure 6.10: Spatio-temporal dynamics of growth of wt green (Ng194) mixed withwt (Ng150) obtained by CC method. a) Growth rate ⁄ (colour coded)as a function of distance from centre of colony (rc) and time t. b)Fraction of dead cells fdead (color coded) as a function of distance fromcentre of colony (rc) and time t. Red: Mean colony radius (± standarddeviation) as a function of time. c) Example of an exponential fit (reddotted) ⁄green = 0.42 ± 0.03 to the averaged normalized number ofcells N(t + ·)/N(t) inside clusters during the first 1.5 h and distancefrom the colony edge re (± se). Number of analysed clusterswas 662. d) Mean growth rate ⁄ as a function of the distancere (mean ± se, 10-285 clusters for each data point).
67

6 Results
of colonies and decreased towards the edges, where the growth rates were thehighest. The calculation of the fraction of dead cells depends on density, whichwas assumed to be constant. Since the density decreases towards the colony edgeat a distance of 3 µm (Fig. 5.9 b), the fraction of dead cells closer than 3 µm wasoverestimated.
Using the cell counting method, we determined the e�ective growth rate, whichis the di�erence between growth rate and death rate. Cells that were initiallyfluorescent could have died and lost their fluorescence. As a result, less cells percluster would have been counted. However, the fraction of dead cells for eachposition and time point was smaller than 5 % (Fig. 6.10b) and, therefore, we willneglect the death rate. In the following and our e�ective growth rate is similar tothe growth rate.
It is unclear how growth rates of individual clusters evolve with time. To assessthis question, we plotted the distribution of growth rates obtained from singleclusters. During the first 1.5 h, growth rates are distributed around a maximum of⁄single ¥ 0.5h
≠1. This growth rate is higher than the growth rate determined by asingle exponential fit to the average number of cells inside clusters obtained duringthe first 1.5 h ⁄green = 0.42 ± 0.03 (Fig. 6.10c). The di�erence in growth rates canbe explained by the discrete peak at ⁄single = 0h
≠1 (Fig. 6.11a). Later the averagegrowth rate of ⁄single shifts to lower values as a function of time (Fig. 6.11b,c,d)and the discrete peak at ⁄single = 0h
≠1 is persevered. Growth rates contributing tothe discrete peak are calculated when the number of cells per cluster in the giventime interval does not change. This is the case when cells do not divide, becausetheir e�ective generation time is larger than 1.5 h or when the death rate is similarto the growth rate. The first scenario is likely to happen in the early biofilm stageswhere the number of cells per cluster is low (Fig. 6.11a,b). Additionally, cells thatreside in a lag phase do not grow in the beginning. The second scenario is likelyto happen in older biofilm stages where the fraction of dead cells increases (Fig.6.11c,d).
68

6.2 Dynamics and growth within bacterial colonies
Figure 6.11: E�ect of data averaging and fitting on determination of growth ratesfor wt green (Ng194) mixed withwt (Ng150). Histogram of growth ratesobtained from single clusters by fitting over di�erent time intervalsof 1.5 h length as described in the methods section. Image adaptedfrom [172]
.
Growth profiles can be determined by the radial displacement with velocity
field (VF) method
Inside bacterial biofilms the space is limited. In order to grow and divide, cellshave to push their neighbors towards the biofilm periphery (Fig. 6.12). Given aconstant density, this e�ect generates a velocity field, where cells located close tothe periphery of colonies show a higher velocity compared to cells that are furtheraway (Fig. 6.13a). In the case of gonococcal colonies, a spherical symmetry isgiven. Thus, the velocity depends solely on the distance to the COM of coloniesand can be used to determine the growth profile throughout colonies. To this end,
69

6 Results
Figure 6.12: Trajectories of individual clusters moving within one colony acquiredover 3 h. Clusters residing at di�erent heights within the colony areprojected into one plane. Red circles: Start of trajectory, black lines:trajectories, grey lines: outlines of colony at 0 h and 3 h, respectively.Image adapted from [172].
we calculated the radial velocities from our trajectories of clusters v(rc) = v ú er,which were projected on the unit vector er and pointed from the COM of coloniesaway. Velocities were determined by a linear fit rc(t) = vradial ú t + rc(0) within 1.5h time intervals.
For colonies younger than 2 h, the velocity was close to zero at the colony COMand increased linearly as a function of rc with v(rc) = rc ú (0.17 ± 0.01)h≠1 (Fig.6.13c). This confirms the initial homogeneous, exponential growth in the first twohours obtained by the colony radius method (Fig. 6.7). Later, the velocity fieldv(rc) became non-linear. In order to calculate growth rates from our velocity fields,we solved the continuity equation fl = ≠Ò · (vfl) + ⁄fl numerically by assuming aconstant cell density. We showed that the density was homogeneous in gonococcalcolonies (Fig. 5.9b) except for distances closer than 3 µm away from the edgeof colonies. In this range the the density decreased and thus did not fulfill ourassumptions to solve the continuity equation. Hence, distances closer than 3 µmaway from the edge of colonies were disregarded.
70

6.2 Dynamics and growth within bacterial colonies
1 2 3 40
5
10
15
20
25
t [h]
r c[µ
m]
0.5 1 1.5 2 2.5Velocity [µm/h]
(a)
1 2 3 40
5
10
15
20
25
t [h]
r c[µ
m]
0.2 0.4 0.6Growth rate [h≠1]
(b)
0 5 10 15 200
1
2
3
rc [µm]
v[µ
m/h
]
(c)
0 5 10 150
0.2
0.4
0.6
re [µm]
⁄[h
≠1 ]
(0-1.5)h(1-2.5)h(2-3.5)h(3-4.5)h
(d)
Figure 6.13: Growth rate determined from velocity field of clusters (VF method)of wt green mixed with wt. a) Radial velocities v of clusters as afunction of distance to colony COM (rc) and time t. b) Growth rates⁄ color coded) derived from velocity field. Red line: Mean colonyradius (± standard deviation), black dotted line: denotes area inwhich reduced cell density introduces a systematic error to ⁄. c)Velocity of clusters v(rc). Red dotted line: Linear fit to v(rc) for (1 -2.5) h with ⁄wt = 0.57 ± 0.01. d) Growth rates derived from velocityfield. Error bars: mean ± se, 10 - 212 clusters. 71

6 Results
Using spherical coordinates and assuming a constant density, the continuityequation simplifies to ˆr(r2
vr) = r2⁄. Growth rates were calculated consequently
by ⁄ = div(v) = 2 vrc
+ dvdrc
. A linear velocity field simplifies this equation to⁄ = 3 ú vcluster/r and gives a growth rate of ⁄wt = 0.57 ± 0.01 during the first 2 h(Fig. 6.13c). This value agrees well with the value obtained by the colony radiusmethod (Chap. 6.2.1). For colonies older than 2 h, the simplified equation did nothold anymore due to a non-linear velocity field, consistent with a inhomogeneousgrowth profile for colonies older than 2 h. Hence, growth profiles were determinedby ⁄(r) = 2 v(r)
rc(r) + v(r≠1µm)≠v(r+1µm)2µm . The resulting growth profiles confirmed
homogeneous growth in the first 2 h and decreasing growth rates towards the COMof colonies (Fig. 6.13b,d) consistent with the results from the CC method (Fig.6.10d).
6.2.3 Increasing nutrient supply does not prevent growth
inhibition at the center of the colony
To investigate the e�ect of nutrient supply on spatio-temporal growth and deathdynamics, we improved the nutrient supply by increasing the flow rate of ourperistaltic pump, which is connected to our flow chamber setup, 5 fold. Additionally,we limited the nutrient supply by diluting the growth medium. In general, ourexperiments were performed in GC medium, an undefined rich medium. For theexperiment that addressed nutrient limitation, we supplemented PBS with 10 %GC medium. All three conditions showed exponential growth (Fig. 6.14a) andhomogeneous growth profiles (Fig. 6.14b) in the first 2 h. After 2 h, inhomogeneousgrowth profiles were observed (Fig. 6.14c,d). The improved nutrient supply dueto a higher flow rate showed slightly higher growth rates, but did not preventdecreasing growth rates towards the COM of colonies. Hence, we assume thatnutrient limitation was not the only reason for the inhomogeneous growth dynamics.Unexpectedly, growth rates close to the edge of colonies decreased after 2 h forthe PBS diluted condition, causing a peak in the growth profile around 7 to 8 µmaway from the edge of colonies after 2.5 h (Fig. 6.14d) . The profile of fractions ofdead cells showed similar behavior (Fig. 6.15b).
72

6.2 Dynamics and growth within bacterial colonies
0 1 2 3 4 5100
101
t [h]
Nco
l(t)/
Nco
l(0)
wt*wt* PBSwt* 5x flowrate
(a)
0 2 4 6 8 10 120
0.2
0.4
0.6
re [µm]⁄
[h≠
1 ]
(1-2.5)h
(b)
0 2 4 6 8 10 120
0.2
0.4
0.6
re [µm]
⁄[h
≠1 ]
(2-3.5)h
(c)
0 2 4 6 8 10 120
0.2
0.4
0.6
re [µm]
⁄[h
≠1 ]
(2.5-4)h
(d)
Figure 6.14: E�ect of nutrients supply on growth rates. Comparison of growthprofiles between wt at standard conditions (black), 5 fold flow rate(red) and PBS diluted growth medium (blue). a) Averaged andnormalized number of cells within colony Ncol(t)/Ncol(0) (mean ±se). Full lines: exponential fit with Ncol(t)/Ncol(0) = exp(⁄t) gives⁄wt = 0.563±0.003, ⁄wt,P BS = 0.595±0.013 and ⁄wt,5x = 0.662±0.005.b-d) Mean growth rates as a function of distance to the colony edgere (mean ± se) derived by CC method. N > 10 clusters for each datapoint.
73

6 Results
Interestingly, nutrient limitation due to growth medium dilution played animportant role in the distribution of the fraction of dead cells, causing an almost 7times higher fraction of dead cells 12 µm away from the colony edge after 2.5 h(Fig. 6.15b), while the improved nutrient supply caused a much smaller fraction ofdead cells in the corresponding region. In summary, the nutrient supply plays animport role for spatio-temporal growth and death dynamics, but it is not solelyresponsible for our observed inhomogeneous growth profiles.
0 2 4 6 8 10 120
2
4
6
8
·10≠2
re [µm]
fdea
d
(1-2.5)h
(a)
0 2 4 6 8 10 120
2
4
6
8
·10≠2
re [µm]
fdea
d
(2.5-4)h
(b)
Figure 6.15: E�ect of nutrients supply on bacterial death. Comparison of deathprofiles between wt at standard conditions (black), 5 fold flow rate(red) and PBS diluted growth medium (blue). a-b) Averaged fractionof dead cells fdead (mean ± se) within corresponding time interval asa function of distance to the colony edge re.
6.2.4 Lack of stringent response accelerates heterogeneity in
spatio-temporal growth dynamics
In the previous section, we found that nutrient availability a�ects the spatio-temporal dynamics of growth and death. Here, we investigate the e�ect of aregulator which is activated as a result of nutrient limitation. We generated astrain lacking the �relA�spoT genes, which is not able to trigger stringent
74

6.2 Dynamics and growth within bacterial colonies
0 1 2 3 4 51
2
345678910
time [h]
Nco
l(t)/
Nco
l(0)
wt*relA spoT
(a)
0 2 4 6 8 10 120
0.2
0.4
0.6
re [µm]⁄
[h≠
1 ]
(1-2.5)h
(b)
0 2 4 6 8 10 120
0.2
0.4
0.6
re [µm]
⁄[h
≠1 ]
(1.75-3.25)h
(c)
0 2 4 6 8 10 120
0.2
0.4
0.6
re [µm]
⁄[h
≠1 ]
(2.5-4)h
(d)
Figure 6.16: E�ect of stringed response on growth rates. Comparison of growthprofiles between wt (black) and �relA�spoT (grey) strains. a) Av-eraged and normalized number of cells within colony Ncol(t)/Ncol(0)(mean ± se). Full lines: exponential fit with Ncol(t)/Ncol(0) = exp(⁄t)gives ⁄wt = 0.563 ± 0.003 and ⁄�relA�spoT = 0.66 ± 0.01. b-d) Meangrowth rates as a function of distance to the colony edge re (mean ±se) derived by CC method. N > 5 clusters for each data point.
75
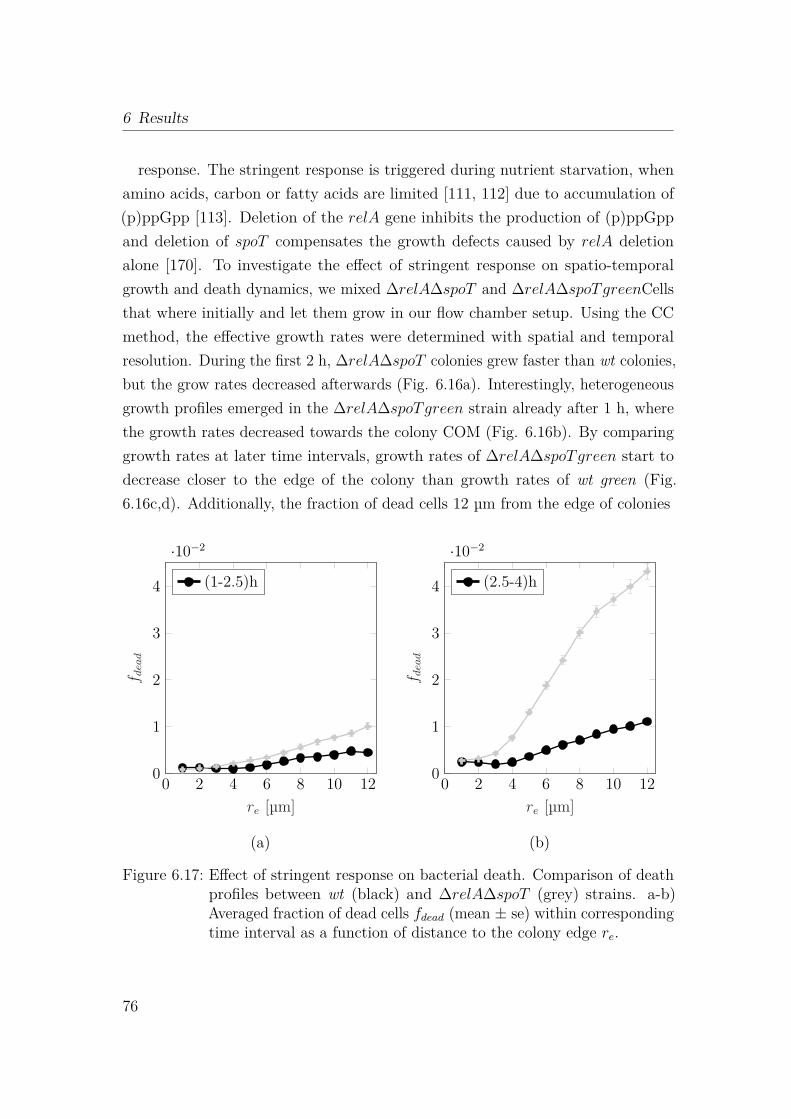
6 Results
response. The stringent response is triggered during nutrient starvation, whenamino acids, carbon or fatty acids are limited [111, 112] due to accumulation of(p)ppGpp [113]. Deletion of the relA gene inhibits the production of (p)ppGppand deletion of spoT compensates the growth defects caused by relA deletionalone [170]. To investigate the e�ect of stringent response on spatio-temporalgrowth and death dynamics, we mixed �relA�spoT and �relA�spoTgreenCellsthat where initially and let them grow in our flow chamber setup. Using the CCmethod, the e�ective growth rates were determined with spatial and temporalresolution. During the first 2 h, �relA�spoT colonies grew faster than wt colonies,but the grow rates decreased afterwards (Fig. 6.16a). Interestingly, heterogeneousgrowth profiles emerged in the �relA�spoTgreen strain already after 1 h, wherethe growth rates decreased towards the colony COM (Fig. 6.16b). By comparinggrowth rates at later time intervals, growth rates of �relA�spoTgreen start todecrease closer to the edge of the colony than growth rates of wt green (Fig.6.16c,d). Additionally, the fraction of dead cells 12 µm from the edge of colonies
0 2 4 6 8 10 120
1
2
3
4
·10≠2
re [µm]
fdea
d
(1-2.5)h
(a)
0 2 4 6 8 10 120
1
2
3
4
·10≠2
re [µm]
fdea
d
(2.5-4)h
(b)
Figure 6.17: E�ect of stringent response on bacterial death. Comparison of deathprofiles between wt (black) and �relA�spoT (grey) strains. a-b)Averaged fraction of dead cells fdead (mean ± se) within correspondingtime interval as a function of distance to the colony edge re.
76

6.2 Dynamics and growth within bacterial colonies
was four times larger (Fig. 6.17), indicating that the stringent response plays animportant role in the adaptation to environmental changes.
6.2.5 E�ect of antibiotic treatment on growth and death
dynamics of gonococcal colonies
We studied the e�ect of antibiotic treatment on growth and death dynamics ofgonococcal colonies, which were constantly treated by supplementing the growthmedium with the 2.5x MIC of azithromycin (0.064 µmg/ml) for 4.5 h. Azithromycinprevents protein synthesis [188] and is currently recommended for treating infec-tions caused by N. gonorrhoeae together with ceftriaxone [132]. Initially, growthrates of treated and non-treated colonies were very similar to each other (Fig.6.18a,b).
After 2 h, we observed a negative e�ect of the azithromycin treatment on growth,where growth rates decreased close to the edge of colonies (Fig. 6.18c). Halfan hour later, we could not detect su�cient sfGFP signal for cell localizationat distances closer than 5 µm from the colony edge (Fig. 6.18d), indicating areduced expression of sfgfp. The fraction of dead cells 12 µm away from the edgeof colonies increased two-fold after 2.5 hours of azithromycin treatment (Fig. 6.19).In conclusion, we are able to measure the e�ect of azithromycin treatment ongrowth and death of individual cells inside colonies. The applied method can bealso used to study the e�ect of other antimicrobial substances.
77

6 Results
0 1 2 3 4 51
2
345678910
time [h]
Nco
l(t)/
Nco
l(0)
wt*wt* 2.5 fold MIC Azi
(a)
0 2 4 6 8 10 120
0.2
0.4
0.6
re [µm]⁄
[h≠
1 ]
(1-2.5)h
(b)
0 2 4 6 8 10 120
0.2
0.4
0.6
re [µm]
⁄[h
≠1 ]
(2-3.5)h
(c)
0 2 4 6 8 10 120
0.2
0.4
0.6
re [µm]
⁄[h
≠1 ]
(2.5-4)h
(d)
Figure 6.18: E�ect of azithromycin treatment on growth rates. Comparison ofgrowth profiles between wt (black) and wt treated with 2.5 fold MICof azithromycin (grey). a) Averaged and normalized number of cellswithin colony Ncol(t)/Ncol(0) (mean ± se). Full lines: exponentialfit with Ncol(t)/Ncol(0) = exp(⁄t) gives ⁄wt = 0.563 ± 0.003 and⁄wtazi = 0.55 ± 0.01. b-d) Mean growth rates as a function of distanceto the colony edge re (mean ± se) derived by CC method. N > 5clusters for each data point.
78

6.2 Dynamics and growth within bacterial colonies
0 2 4 6 8 10 120
0.5
1
1.5
2
2.5·10≠2
re [µm]
fdea
d
(1-2.5)h
(a)
0 2 4 6 8 10 120
0.5
1
1.5
2
2.5·10≠2
re [µm]f
dea
d
(2.5-4)h
(b)
Figure 6.19: E�ect of azithromycin treatment on bacterial death. Comparison ofdeath profiles between wt (black) and wt treated with 2.5 fold MIC ofazithromycin (grey). a-b) Averaged fraction of dead cells fdead (mean± se) within corresponding time interval as a function of distance tothe colony edge re.
79

7 Discussion
7.1 Gonococcal colonies are reminiscent of non-living
colloidal systems
Gonococcal cells are similar to colloidal systems in some aspects. They can beconsidered as hard spheres that sterically repulse each other. T4P generate at-tractive force between neighboring cells. These properties are reminiscent of 1µm-sized latex beads which are functionalized in a way that they attract eachother. Attractive interactions for colloidal particles can be mediated for exampleby decorating colloids with DNA [189] or proteins [190]. When the interactionbetween colloidal particles is mediated through DNA hybridization, di�usion-limited self-assembly of aggregates can be triggered by temperature change. Afterapproximately 50 h, these colloidal aggregates show crystal-like structures [189].Alternatively, self-assembly can be triggered by light stimulation. When colloidalparticles are functionalized with photoswitchable proteins like VVDHigh or Cph1,blue or red light emission triggers self-assembly. When these aggregates are placedin the dark, they start to disperse [189].
In contrast to colloidal particles that form small aggregates with crystalline order[189], gonococci form large aggregates with short-ranged order similar to liquids.Aggregates of colloidal particles are typically assembled by identical particles, butgonococcal colonies consist of spherical and dumbbell-shaped cells. Initially, cellsare spherically shaped and grow into dumbbells prior cell division. The mixture ofspherical and dumbbell-shaped cells causes polydispersity and a symmetry breakthat is likely to inhibit the formation of long-ranged order. However, in-siliciocolonies that consist solely of dumbbells do not show polydispersity, but their
80

7.2 Deletion of the T4P retraction motor severely slows down the process of local
ordering
structure shows also a short-ranged order [191]. While the assembly of colloidalaggregates is typically di�usion limited [189], gonococci form their colonies activelyvia T4P interactions. Consequently, it is likely that the dynamic rearrangementcaused by T4P dynamics and growth of bacteria within the colony inhibits theformation of crystalline order.
7.2 Deletion of the T4P retraction motor severely
slows down the process of local ordering
Gonococci form spherically shaped colonies, which show similarities to waterdroplets. Two micro-colonies in close proximity minimize their surface area by fusingto a larger spherical colony in the order of minutes [44, 50]. The fusion dynamicssuggests that gonococcal micro-colonies can be described as a liquid phase withan e�ective surface tension. In computer simulations their architecture [191, 192]and temporal dynamics [75] were confirmed to be liquid-like. In order to study theimportance of the T4P retraction motor PilT experimentally, strains with di�erentT4P motor properties were characterized by investigating shape relaxations of twocoalescing micro-colonies [44]. Subsequently, the shape relaxation data was usedto estimate the viscosity of micro-colonies. Micro-colonies formed by the wt andpilTW B1 (Table 5.2) showed a viscosity of ÷wt ¥ 350Nsm
≠2 and ÷wt ¥ 2000Nsm≠2.
Formation of local order requires dynamic rearrangement of bacteria within thecolony. Liquid-like colony dynamics enable these rearrangements.
Surprisingly, colonies formed by pilTW B2 show a higher order and a lower celldensity than wt colonies at 6 h. This e�ect could be explained by the higherpilus motor activity and the lower viscosity of wt colonies that facilitates cellreorganization inside colonies allowing higher cell densities but causes less localorder. Computer simulations investigated the e�ect of T4P-T4P interaction onthe structure of colonies. They show that lower pilus retraction velocities increasethe local order of in-silicio colonies [192]. Indeed, lower retraction velocities weremeasured for the pilTW B2 mutant strain [44] highlighting the pilus retractionvelocity as an important parameter that determines local order inside fluid-likecolonies.
81

7 Discussion
Deletion of pilT induces a transition of fluid-like to solid-like behavior of thecolony. A strain in which the gene encoding for the T4P retraction ATPase pilT isdeleted, assembles more pili [193]. The RDF of the �pilT strain deviated froma fluid-like structure by showing no local order for 6 h old gonococcal colonies.Interestingly, local order emerged after 24 h. We suggest that repulsive interactiondue to bacterial growth causes gonococcal re-organization on a much longer timescale compared to active T4P force generation. Another reason for slow orderingcould be T4P retraction in the absence of PilT. Surprisingly, pilus retractionwas observed in the absence of PilT [194], but important functions like twitchingmotility and colony fluidization were not supported due to the strongly reducedpilus force generation. Despite slower and weaker T4P dynamics of the �pilT
strain, pilus retraction possibly contributes to the bacterial ordering on longer timescales. For the closely related pathogen N. meningitidis, deletion of pilT causedthe same e�ect. Meningococcal �pilT colonies were not spherical and did notflow into the pipette during the micropipette aspiration assay, confirming the lackof fluid-like properties [50]. In conclusion, T4P motor activity accelerates localordering and PilT is crucial for fluid-like properties of bacterial colonies.
7.3 Determining growth rates with spatial and
temporal resolution in spherical colonies
Typically, growth rates are determined by measuring the optical density (OD600)to determine bacterial concentration in a solution. Subsequently, an exponentialfunction can be fitted to the estimated number of cells inside the solution. Themain problem with this approach is that aggregation and surface attachment ofcells influence the optical density, leading to inaccurate results [195]. To avoid thisproblem, the number of cells inside colonies can be estimated by measuring thecolony radius. However, this approach gives solely the mean growth rate. In orderto study growth rates with spatial and temporal resolution in spherical colonies,we developed two novel methods that have advantages and disadvantage.
Conceptually most straight forward but technically challenging way to char-
82

7.3 Determining growth rates with spatial and temporal resolution in spherical
colonies
acterize growth rates would be to start with a single founder cell and track itso�spring. This method was successfully implemented for the rod-shaped bacteriumV. cholerae [12], but cannot be applied for N. gonorrhoeae. For V. cholerae growthrates were determined by measuring the length of cells that increases prior celldivision. Our cell localization approach does not access shape deformations orvolume increase of cells. Consequently, we cannot obtain growth states of singlecells or estimate orientations of dumbbells. In order to track the o�spring of singlecells, we need to apply particle tracking algorithms. These algorithms are not ableto compute all possible combinations of trajectories, because the cell density insidegonococcal colonies is too high. Gonococci show a volume fraction of approximately0.5 in their colonies, which is higher than the estimated volume fraction of 0.2within V. cholerae colonies. Using spinning disk confocal microscopy, we were ableto localize cells up to a height of 8 µm, when all cells were fluorescent. For higherimage planes the SNR was drastically reduced, inhibiting localization of singlecells. Hence, we mixed fluorescent and non-fluorescent cells to increase the SNRfor higher image planes. This allowed localization and tracking of cell clustersat heights of 25 µm relative to the bottom. The number of cells per cluster (CCmethod) and their displacement (VF method) were used to calculate growth rates.The main disadvantage of mixing fluorescent and non-fluorescent cells was that weneeded to start experiments with a high concentration of cells in the flow chamber.We assume that the high concentration of cells caused deficiencies in nutrientavailability after 2 h. At that time, we observed development of heterogeneousgrowth rate distributions. In order to determine positions of single cells, we neededa strong fluorescent signal. Using the strong pilE promoter to express sfgfp, weobserved a 25 % drop in growth rate of compared to the wt strain. Thus, growthrates of the non-fluorescent wt strain can be determined only indirectly from thewt green strain that shows a reduced growth rate.
In contrast to the CC method, growth rates derived using the VF method arebased on the velocity field generated by non-fluorescent wt strain. As a result,growth rates determined by the VF methods are dominated by wt cells and wt greencells serve as fluorescent markers for characterizing the velocity field. Between 1 and2.5 h, the CC method gives a spatial mean growth rate of ⁄wtgreen = (0.42±0.03)h≠1
83

7 Discussion
and the VF method ⁄wt = (0.57 ± 0.01)h≠1. From the colony radii, growth rates⁄
úwtgreen = (0.42 ± 0.003)h≠1 and ⁄
úwt = (0.563 ± 0.003)h≠1 were estimated, fitting
very well to the growth rates determined by the CC and VF method. The appli-cation of the VF method method is limited to colonies with a constant densityand cell packaging or cell size. We observed a decreasing density towards thegonococcal periphery of colonies, where the VF method cannot be applied. In thecase of azithromycin treatment of gonococcal colonies, we observed cell swelling,which would influence the velocity field, leading to calculation of higher growthrates [5]. Additionally, the VF method depends strongly on the correct positionof the COM of colonies. Especially, the COM height is hard to estimate, becauseit changes within time, limiting the accuracy of this method. In conclusion, theCC and the VF method have both their own advantages and disadvantages. Bycombining these two complementary approaches, they characterize growth profilesin gonococcal colonies robustly.
7.4 Growth rate gradients emerge within a few
generations and stringent response retards the
development of spatially heterogeneous growth
rates
When N. gonorrhoeae is incubated in flow chambers as described in the methods(Chap. 5.3.2), the time that cells reside in spherical colonies is approximately 8 h.During the first 2 h, growth rates were spatially homogenous. Between 2 and 5 hgrowth rates became spatially heterogeneous. Within 3 µm away from the surfaceof colonies, growth rates were constant. Interestingly, we measured in this areaa reduced cell density. For larger distances from the colony edge, growth ratesdecreased proportional to colony age. Later, the fraction of dead cells increasedand colony breakdown occurred. In the following discussion, we will focus us on theintermediate time range, where spatially heterogeneous growth rates were observedand cell death can be neglected.
84

7.4 Growth rate gradients emerge within a few generations and stringent response
retards the development of spatially heterogeneous growth rates
In order to test the e�ect of nutrient supply on the development of growth rategradients, we increased the flow rate. Even though the decreasing growth ratestowards the colony core were not prevented, the rapid drop of growth rates occurredat a larger distance around 10 µm from the surface of colonies (Fig. 6.14 d). Incomparison, the control showed its drop at a similar time between 2.5 and 4 haround 6 µm. We conclude that a higher flow rate increases the nutrient availabilityfor deeper layers, but due to the fact that cells closer to the periphery of coloniesconsume nutrients, the di�usion of nutrients decreases for larger distances from thesurface of colonies. In a di�erent approach, we diluted the nutrient concentration.Surprisingly, we observed that growth rates decreased at the surface of coloniesand cell death became relevant. Growth rates between 2.5 and 4 h showed apeak around 7-8 µm away from the surface of colonies (Fig. 6.14 d). We assumethat dead cells or cells with less active T4P are sorted towards the periphery ofcolonies. The strongly increased fraction of dead cells for larger distances from thesurface of colonies indicate that nutrient availability is important for cell survival.Besides nutrient availability, spatially heterogeneous growth rates can be caused bymechanical constraints [196, 197, 198]. During colony maturation, an extracellularmatrix is generated that probably increases the pressure inside colonies and a�ectsgrowth rates negatively.
The stringent response is activated during limitations of various nutrients. Ourfirst assumption was that the absence of the stringent response would deceler-ate development of heterogeneity, but we observed that growth rate gradientsoccurred earlier in �relA�spoT mutant colonies compared to wt colonies. The�relA�spoT strain does not activate the stringent response and showed highergrowth rates during the first 2 h of colony growth. This growth rate di�erencebetween the �relA�spoT strain and the control indicates that the stringent re-sponse is activated prior the development of heterogeneity. Consequently, thestringent response would be an early alert system that tries to maintain homo-geneous growth and the absence of stringent response would cause emergence ofgrowth rate gradients at an earlier time. In conclusion, the stringent responseis an important feedback mechanism that optimizes the distribution of available
85

7 Discussion
nutrients and is important for adaptation to changing local environments duringcolony maturation [116].
7.5 Azithromycin is more e�cient against fast
growing cells
Typically, minimal inhibitory concentrations (MIC) are determined to test bac-terial susceptibility to specific antibiotics. Even though the MIC measurementsare considered to be the ’gold standard’ [199], bacterial biofilms show a highertolerance against antimicrobial treatment than their planktonic counterpart [118].Since the majority of clinical infections are based on biofilms, the minimum biofilmeradication concentration was established, which defines the minimal concentrationof a drug required to kill a biofilm by removing biofilms from the substrate andobserve the number of living cells on agar plates [200]. Neither of these methodsaccesses the time needed until the antimicrobial treatment e�ects the cell growth.
In this study, we determined spatio-temporal growth rates inside gonococcalcolonies with and without azithromycin treatment. Before cell death becamerelevant, reduced growth rates were observed, when gonococcal colonies weretreated with the 2.5 MIC of azithromycin. We currently do not know whethergrowth slows down because the concentration of proteins is a�ected or because astress response has been launched. After approximately 3 h of colony growth, wecould not localize fluorescent cell at distances closer than 5 µm to the colony edge.Interestingly, growth rates were maximal in this range in our control. Fluorescentcells with a larger distance from the colony edge were successfully tracked and usedto estimate growth rates. These growth rates were slightly smaller in comparisonto the control. By treating sfGFP as a marker for protein synthesis, we canconclude that fast growing cells close to the colony surface are a�ected the mostfrom the azithromycin treatment and that they express less proteins after 3 hof treatment. This hypothesis is confirmed by experiments that show higher an-timicrobial tolerances for cells with a reduced metabolic activity [92, 54, 93, 94, 95].
86

7.5 Azithromycin is more e�cient against fast growing cells
Currently, gonorrhea is treated with a combination of azithromycin and ceftriax-one [132]. Interestingly, the tolerance of gonococcal colonies to the combinationof these drugs strongly depends on the time o�set, when each drug is applied.Cronenberg et al. showed that a sequential treatment with a time o�set of 3 hincreases the e�ciency of the therapy in comparison to a simultaneous treatment[5]. Thus, the timing of sequential antimicrobial treatments besides absolute con-centration values plays an important role. Assuming that ceftriaxone treatment ismore e�cient against cells with a high metabolic activity, the sequential ceftriaxonetreatment should be initiated when growth rates of gonococcal colonies treatedwith azithromycin are high. We conclude that sequential treatment of azithromycinand ceftriaxone with a time o�set slightly less than 3 h would be probably moree�cient, because cells are more metabolically active.
87

8 Outlook
In this study, we determined spatio-temporal growth rates and the distribution ofdead cells inside gonococcal colonies. To this end, we used two di�erent approaches,each one having its own advantages and disadvantages. Sfgfp fluorescent bacterialclusters were tracked inside non-fluorescent cell dominated colonies and velocityfields of these clusters were determined. The spatio-temporal velocity fields wereused to calculate gonococcal growth rates. Especially, fluorescent cells show re-duced growth rates and are more sensitive to laser light. To solve this problem, wecould try to track dead cells. To improve the signal to noise ratio, we could useSYTOX staining instead of PI for staining cells. Additionally, we could probablyincrease the time resolution without e�ecting the growth of non-fluorescent cells,because they seem to be less sensitive to laser light. If dead cells follow simplythe velocity field, which is generated by growing cells, spatio-temporal velocitiescould be used directly to calculate the corresponding growth rates with the VFmethod. Apart from simply following the velocity field, it seems quite likely thatdead cells would be sorted to the periphery of colonies due to a reduced neighborinteraction. Thus, the comparison of spatio-temporal velocity fields obtained byliving fluorescent cell clusters with the velocity fields of dead cells would give evi-dence whether cell sorting of living and dead cells occurs inside gonococcal colonies.
We observed the emergence of heterogeneous growth profiles inside gonococcalcolonies, where growth rates dropped towards the COM of colonies. Our firstassumption was that nutrient limitation causes heterogeneity in growth rates. Toassess this hypothesis, we increased the flow rate 5 fold inside our flow chambersetup, but the improved nutrient supply did not prevent emergence of heteroge-neous growth profiles. Besides mechanical constrains, limitations of oxygen orCO2 supply could influence bacterial growth dynamics. To test this assumption,
88

5 mM sodium bicarbonate and 100 µM sodium nitrite could be added to thegrowth medium. These supplements were added to the growth medium in previousexperiments [166], but it was assumed that exclusion of this supplements does note�ect growth of gonococcal colonies. However, spatio-temporal growth dynamicsat cellular resolution could not have been analysed at this time. Consequently, itis likely that the previously mentioned supplements indeed influence gonococcalgrowth.
Next, we treated gonococcal colonies continuously with azithromycin during thewhole experiment and obtained an early negative e�ect on growth rates. In futureexperiments it would be interesting to see how di�erent concentrations of di�erentantimicrobials e�ect bacterial spatio-temporal growth dynamics. Additionally, itwould be interesting to measure how young freshly assembled bacterial coloniesreact to antimicrobial treatment in comparison to matured heterogeneous ones.To this end, we could start the treatment directly after injection of cells into ourflow chamber setup or with a temporal shift to allow emergence of heterogeneousgrowth dynamics, which is the case after 2 h according to our results. Alternativelyto antimicrobial treatment, DNA from commensal Neisseria strains was reportedto act as a killing agent for pathogenic Neisseria strains [136]. Hereby, DNA with aforeign DNA methylation pattern needs to enter the pathogen and be recombinedinto its genome. Even though preliminary experiments indicate that NeisseriaElongata inhibits growth of N. gonorrhoeae and even leads to its extinction, theseresults could not have been properly evaluated and need to be repeated for thispurpose.
In the course of this project, we aimed to find an alternative method to determinegrowth rates of spherical shaped bacteria that is independent of fluorescencelabeling and confocal microscopy. For this purpose, Prof. Dr. Kohlheyer providedus with self-build microfluidic flow chambers. Microfluidic cultivation allows tostudy spatio-temporal growth dynamics at single cell resolution with bright-fieldmicrocopy. Growth rates of E.coli and C. glutamicum were successfully determinedwith this method [201]. One of his designs allowed us to grow two dimensionalgonococcal colonies by placing separated containers with a limiting height of 1 µm
89

8 Outlook
inside a flow channel. Even though we achieved in placing a few gonococci insidethese growth containers, we observed that the flow channels were often blocked bystrongly attached cells. In a few experiments, we managed to keep the flow channelcell-free while having a few cells inside growth containers. By manually countingthe number of cells inside one growth container, we were able to estimate a growthrate by fitting an exponential function to the number of cells N(t)/N0 = exp(⁄t).The estimated growth rate was ⁄ = 0.32 ± 0.01h
≠1. In the future, clogging of themain channel of microfluidic flow chambers can be avoided by supplementing thegrowth medium for a short time period with water.
90

(a)
0 2 4 6100
100.2
100.4
100.6
t [h]
N(t
)/N
(0)
(b)
Figure 8.1: Growth of two dimensional gonococcal colonies. (a) Bright-field imagesof a growth container with a time resolution of 1h. Circles markshow manually determined positions of cells. (b) Exponential functionN(t)/N0 = exp(⁄t) is fitted to the normalized number of cells N(t)/N0to estimate a growth rate ⁄ = 0.32 ± 0.01h
≠1.
91

9 Appendix
9.1 Particle tracking software
The particle tracking software is available as a MATLAB script. All image stacksshould have a time resolution of 15 min and contain three channels, where thefirst channel should consist of a single bright-field image and the following twochannels should be image stacks with an x-y-resolution of 80 nm and 400 nm inthe z-direction.
After setting the path to the location of the nd2-file that contains all imagestacks, the COM of colonies and their radii are determined from the bright-fieldimages and saved as c.mat. The first two columns of c.mat contain the x-y-positionsin pixels of the COM of colonies, the third column gives the radius of colonies inpixels, followed by time in frames and a parameter that describes the goodness offitted cycles to the contours of colonies. Furthermore, three dimensional positionsof cells are determined from the confocal image stacks of dead and living cells withsub-pixel resolution and saved as rD.mat and rL.mat. Both arrays contain sevencolumns with the following entries: x-, y- and z- positions in µm, the integratedbrightness, squared radii of gyration and peak height of each cell, time in frames.
In the second part, the determined positions are linked into trajectories. At first,c.mat is corrected by comparing the radii and positions of successive frames. Thenthe height of the COM of colonies is estimated. This data is saved as COM.mat,which contains in its first columns the three dimensional positions of the COM ofcolonies in µm and in the last column the corresponding time. Using COM.mat,the positions of rL.mat and rD.mat are corrected in respect to the COM of colonies.Subsequently, the particle tracking algorithm is applied, giving dataCell.mat and
92

9.1 Particle tracking software
dataDead.mat. dataCell.mat consists of N columns, where N depends on the totalnumber of analysed clusters. In the first seven rows dataCell.mat contains thenumber of cells inside each cluster. The eighth row gives the time and the lasttwo rows contain the distance of clusters to the edge of colonies and the radiusof the colony. Additionally, a second array is included in dataCell.mat that givesinformation about cluster displacement relative to the COM of colonies. Here, thefirst seven entries in each column are replaced by the distance of each cluster to thecolony COM in µm. dataDead.mat is constructed di�erently. Each row containsthe fraction of dead cells at di�erent distances to the COM of colonies. The firstentry of each row gives the fraction of dead cells at the COM of colonies with abinning of 2 µm. The next entry gives the fraction of dead cells 1 µm away andso on. The last entry of each row contains the corresponding time. Finally, theMATLAB script computes growth rates from the radii of colonies, cell countingand velocity fields.
93

List of Figures
3.1 Scheme of surface motility driven by T4P . . . . . . . . . . . . . . 93.2 Molecular model of T4P . . . . . . . . . . . . . . . . . . . . . . . 103.3 Stages of biofilm development . . . . . . . . . . . . . . . . . . . . 133.4 Repulsive and attractive interactions between bacteria . . . . . . 143.5 Biofilm structure of rod-shaped cells . . . . . . . . . . . . . . . . 153.6 T4P-T4P interactions . . . . . . . . . . . . . . . . . . . . . . . . . 163.7 Chemical heterogeneity in biofilms . . . . . . . . . . . . . . . . . . 19
5.1 E�ect of a spatial bandpass filter on image stacks acquired with aCLSM . . . . . . . . . . . . . . . . . . . . . . . . . . . . . . . . . 35
5.2 Image segmentation of image stacks acquired with a spinning diskconfocal microscope . . . . . . . . . . . . . . . . . . . . . . . . . . 36
5.3 Kernel used to filter confocal image stacks for single particle tracking 375.4 E�ect of parameter variation for coordinate determination on RDF 415.5 Radius and COM detection from Bright-field images . . . . . . . . 435.6 Signal to noise ration for di�erent confocal image slices . . . . . . 465.7 Examples of various exponential fits to the normalized number of cells 505.8 Illustration of distance to the edge or COM of colonies . . . . . . 515.9 Cell density profile through colony . . . . . . . . . . . . . . . . . . 52
6.1 Liquid-like order of gonococcal wt colonies . . . . . . . . . . . . . 556.2 Sketch of how T4P interaction between adjacent cells mediate cell
re-organization . . . . . . . . . . . . . . . . . . . . . . . . . . . . 566.3 Orthogonal views of image stacks of gonococcal colonies with di�er-
ent T4P motor properties . . . . . . . . . . . . . . . . . . . . . . 576.4 Local cell density of gonococcal colonies . . . . . . . . . . . . . . 58
94

List of Figures
6.5 Comparison of RDFs of colonies formed by strains with di�erentT4P motor activity . . . . . . . . . . . . . . . . . . . . . . . . . . 59
6.6 Remoteness distribution . . . . . . . . . . . . . . . . . . . . . . . 616.7 Expression of sfgfp reduces growth rate . . . . . . . . . . . . . . . 636.8 Lineage tracking in gonococcal colonies . . . . . . . . . . . . . . . 646.9 Example of single growing cluster . . . . . . . . . . . . . . . . . . 666.10 Spatio-temporal dynamics of growth obtained by CC method . . . 676.11 Histogram of growth rates obtained from single clusters . . . . . . 696.12 Trajectories of individual clusters . . . . . . . . . . . . . . . . . . 706.13 Growth rate determined from velocity field of clusters (VF method) 716.14 E�ect of nutrients supply on growth rates . . . . . . . . . . . . . 736.15 E�ect of nutrients supply on bacterial death . . . . . . . . . . . . 746.16 E�ect of stringent response on growth rates . . . . . . . . . . . . 756.17 E�ect of stringent response on bacterial death . . . . . . . . . . . 766.18 E�ect of azithromycin treatment on growth rates . . . . . . . . . 786.19 E�ect of azithromycin treatment on bacterial death . . . . . . . . 79
8.1 Growth of two dimensional gonococcal colonies . . . . . . . . . . . 91
95

List of Tables
5.1 Ingredients for GC-Agar . . . . . . . . . . . . . . . . . . . . . . . 275.2 Ingredients for GC-Medium . . . . . . . . . . . . . . . . . . . . . 285.3 Ingredients for Isovitalex . . . . . . . . . . . . . . . . . . . . . . . 285.4 List of used strains in this study . . . . . . . . . . . . . . . . . . . 305.5 Ingredients for Mowiol . . . . . . . . . . . . . . . . . . . . . . . . 33
96

Bibliography
[1] Berenike Maier. “How Physical Interactions Shape Bacterial Biofilms”.In: Annual Review of Biophysics (2021). issn: 1936-122X. doi: 10.1146/
annurev-biophys-062920-063646.
[2] J. W. Costerton et al. Bacterial biofilms in nature and disease. 1987. doi:10.1146/annurev.mi.41.100187.002251.
[3] J. W. Costerton. “Overview of microbial biofilms”. In: Journal of IndustrialMicrobiology (1995). issn: 01694146. doi: 10.1007/BF01569816.
[4] C. A. Fux et al. Survival strategies of infectious biofilms. 2005. doi: 10.
1016/j.tim.2004.11.010.
[5] Tom Cronenberg et al. “Antibiotics modulate attractive interactions inbacterial colonies a�ecting survivability under combined treatment”. In:PLOS Pathogens (2021). doi: 10.1371/journal.ppat.1009251.
[6] Lucia Vidakovic et al. “Dynamic biofilm architecture confers individual andcollective mechanisms of viral protection”. In: Nature Microbiology (2017).issn: 20585276. doi: 10.1038/s41564-017-0050-1.
[7] Hans Curt Flemming et al. Biofilms: An emergent form of bacterial life.2016. doi: 10.1038/nrmicro.2016.94.
[8] Clayton W. Hall and Thien Fah Mah. Molecular mechanisms of biofilm-based antibiotic resistance and tolerance in pathogenic bacteria. 2017. doi:10.1093/femsre/fux010.
[9] Allan Konopka. “What is microbial community ecology”. In: ISME Journal(2009). issn: 17517362. doi: 10.1038/ismej.2009.88.
97

Bibliography
[10] Sudani Abdul Rani et al. “Spatial patterns of DNA replication, proteinsynthesis, and oxygen concentration within bacterial biofilms reveal diversephysiological states”. In: Journal of Bacteriology (2007). issn: 00219193.doi: 10.1128/JB.00107-07.
[11] Elizabeth J. Stewart et al. “Role of environmental and antibiotic stress onStaphylococcus epidermidis biofilm microstructure”. In: Langmuir (2013).issn: 07437463. doi: 10.1021/la401322k.
[12] Raimo Hartmann et al. Emergence of three-dimensional order and structurein growing biofilms. 2019. doi: 10.1038/s41567-018-0356-9.
[13] Philip Pearce et al. “Flow-Induced Symmetry Breaking in Growing BacterialBiofilms”. In: Physical Review Letters (2019). issn: 10797114. doi: 10.1103/
PhysRevLett.123.258101.
[14] E. M. Purcell. “Life at low Reynolds number”. In: American Journal ofPhysics (1977). issn: 0002-9505. doi: 10.1119/1.10903.
[15] Howard C. Berg and Douglas A. Brown. “Chemotaxis in Escherichia colianalysed by three-dimensional tracking”. In: Nature (1972). issn: 00280836.doi: 10.1038/239500a0.
[16] Steven H. Larsen et al. “Change in direction of flagellar rotation is the basisof the chemotactic response in Escherichia coli”. In: Nature (1974). issn:00280836. doi: 10.1038/249074a0.
[17] Hans Curt Flemming and Jost Wingender. The biofilm matrix. 2010. doi:10.1038/nrmicro2415.
[18] Robert Belas. Biofilms, flagella, and mechanosensing of surfaces by bacteria.2014. doi: 10.1016/j.tim.2014.05.002.
[19] Pushkar P. Lele, Basarab G. Hosu, and Howard C. Berg. “Dynamics ofmechanosensing in the bacterial flagellar motor”. In: Proceedings of theNational Academy of Sciences of the United States of America (2013). issn:00278424. doi: 10.1073/pnas.1305885110.
[20] Berenike Maier and Gerard C.L. Wong. How Bacteria Use Type IV PiliMachinery on Surfaces. 2015. doi: 10.1016/j.tim.2015.09.002.
98

Bibliography
[21] Je�rey M. Skerker and Howard C. Berg. “Direct observation of extensionand retraction of type IV pili”. In: Proceedings of the National Academyof Sciences of the United States of America (2001). issn: 00278424. doi:10.1073/pnas.121171698.
[22] Lorenzo Talà et al. Pseudomonas aeruginosa orchestrates twitching motilityby sequential control of type IV pili movements. 2019. doi: 10.1038/s41564-
019-0378-9.
[23] Alexandre Persat et al. “Type IV pili mechanochemically regulate viru-lence factors in Pseudomonas aeruginosa”. In: Proceedings of the NationalAcademy of Sciences of the United States of America (2015). issn: 10916490.doi: 10.1073/pnas.1502025112.
[24] Courtney K. Ellison et al. “Obstruction of pilus retraction stimulates bac-terial surface sensing”. In: Science (2017). issn: 10959203. doi: 10.1126/
science.aan5706.
[25] Rhett A. Snyder et al. “Surface sensing stimulates cellular di�erentiationin Caulobacter crescentus”. In: Proceedings of the National Academy ofSciences of the United States of America (2020). issn: 10916490. doi:10.1073/pnas.1920291117.
[26] Diane Bodenmiller, Evelyn Toh, and Yves V. Brun. “Development of SurfaceAdhesion in Caulobacter crescentus”. In: Journal of Bacteriology (2004).issn: 00219193. doi: 10.1128/JB.186.5.1438-1447.2004.
[27] Alexey J. Merz, Magdalene So, and Michael P. Sheetz. “Pilus retractionpowers bacterial twitching motility”. In: Nature (2000). issn: 00280836. doi:10.1038/35024105.
[28] Maxsim L. Gibiansky et al. Bacteria use type IV pili to walk upright anddetach from surfaces. 2010. doi: 10.1126/science.1194238.
[29] Jacinta C. Conrad et al. “Flagella and pili-mediated near-surface single-cellmotility mechanisms in P. aeruginosa”. In: Biophysical Journal (2011). issn:15420086. doi: 10.1016/j.bpj.2011.02.020.
99

Bibliography
[30] Jens Eriksson et al. “Characterization of motility and piliation in pathogenicNeisseria”. In: BMC Microbiology (2015). doi: 10.1186/s12866-015-0424-
6.
[31] Claudia Holz et al. “Multiple pilus motors cooperate for persistent bacterialmovement in two dimensions”. In: Physical Review Letters (2010). issn:10797114. doi: 10.1103/PhysRevLett.104.178104.
[32] Daniel Wall and Dale Kaiser. Type IV pili and cell motility. 1999. doi:10.1046/j.1365-2958.1999.01339.x.
[33] Courtney K. Ellison et al. “Retraction of DNA-bound type IV competencepili initiates DNA uptake during natural transformation in Vibrio cholerae”.In: Nature Microbiology (2018). issn: 20585276. doi: 10.1038/s41564-
018-0174-y.
[34] Cynthia D. Long et al. “Low-Level Pilin Expression Allows for SubstantialDNA Transformation Competence in Neisseria gonorrhoeae”. In: Infectionand Immunity (2003). issn: 00199567. doi: 10.1128/IAI.71.11.6279-
6291.2003.
[35] David Bieber et al. Type IV pili, transient bacterial aggregates, and virulenceof enteropathogenic escherichia coli. 1998. doi: 10.1126/science.280.
5372.2114.
[36] Mikkel Klausen et al. “Involvement of bacterial migration in the developmentof complex multicellular structures in Pseudomonas aeruginosa biofilms”.In: Molecular Microbiology (2003). issn: 0950382X. doi: 10.1046/j.1365-
2958.2003.03677.x.
[37] Enno R. Oldewurtel et al. “Di�erential interaction forces govern bacterialsorting in early biofilms”. In: eLife (2015). issn: 2050084X. doi: 10.7554/
eLife.10811.
[38] Lisa Craig, Michael E. Pique, and John A. Tainer. Type IV pilus structureand bacterial pathogenicity. 2004. doi: 10.1038/nrmicro885.
[39] Melissa Ayers, P. Lynne Howell, and Lori L. Burrows. Architecture of the typeII secretion and type IV pilus machineries. 2010. doi: 10.2217/fmb.10.76.
100

Bibliography
[40] Lisa Craig, Katrina T. Forest, and Berenike Maier. Type IV pili: dynamics,biophysics and functional consequences. 2019. doi: 10.1038/s41579-019-
0195-4.
[41] Lisa Craig and Juliana Li. Type IV pili: paradoxes in form and function.2008. doi: 10.1016/j.sbi.2007.12.009.
[42] Yi Wei Chang et al. “Architecture of the type IVa pilus machine”. In:Science (2016). issn: 10959203. doi: 10.1126/science.aad2001.
[43] Kenneth A. Satyshur et al. “Crystal Structures of the Pilus RetractionMotor PilT Suggest Large Domain Movements and Subunit CooperationDrive Motility”. In: Structure (2007). issn: 09692126. doi: 10.1016/j.str.
2007.01.018.
[44] Anton Welker et al. “Molecular Motors Govern Liquidlike Ordering andFusion Dynamics of Bacterial Colonies”. In: Physical Review Letters (2018).issn: 10797114. doi: 10.1103/PhysRevLett.121.118102.
[45] Martin Clausen et al. “High-force generation is a conserved property oftype IV pilus systems”. In: Journal of Bacteriology (2009). issn: 00219193.doi: 10.1128/JB.00396-09.
[46] Berenike Maier et al. “Single pilus motor forces exceed 100 pN”. In: Proceed-ings of the National Academy of Sciences of the United States of America(2002). issn: 00278424. doi: 10.1073/pnas.242523299.
[47] Dixon Ng et al. “The Vibrio cholerae Minor Pilin TcpB Initiates Assemblyand Retraction of the Toxin-Coregulated Pilus”. In: PLoS Pathogens (2016).issn: 15537374. doi: 10.1371/journal.ppat.1006109.
[48] Jan Ribbe et al. “Role of cyclic di-GMP and exopolysaccharide in type IVpilus dynamics”. In: Journal of Bacteriology (2017). issn: 10985530. doi:10.1128/JB.00859-16.
[49] Ana M. Misic, Kenneth A. Satyshur, and Katrina T. Forest. “P. aeruginosaPilT Structures with and without Nucleotide Reveal a Dynamic Type IVPilus Retraction Motor”. In: Journal of Molecular Biology (2010). issn:00222836. doi: 10.1016/j.jmb.2010.05.066.
101

Bibliography
[50] Daria Bonazzi et al. “Intermittent Pili-Mediated Forces Fluidize Neisseriameningitidis Aggregates Promoting Vascular Colonization”. In: Cell (2018).issn: 10974172. doi: 10.1016/j.cell.2018.04.010.
[51] Robert Zöllner et al. “Type IV Pilin Post-Translational ModificationsModulate Material Properties of Bacterial Colonies”. In: Biophysical Journal(2019). issn: 15420086. doi: 10.1016/j.bpj.2019.01.020.
[52] Rainer Kurre and Berenike Maier. “Oxygen depletion triggers switchingbetween discrete speed modes of gonococcal type IV pili”. In: BiophysicalJournal (2012). issn: 00063495. doi: 10.1016/j.bpj.2012.04.020.
[53] Rainer Kurre et al. “Speed Switching of Gonococcal Surface Motility Corre-lates with Proton Motive Force”. In: PLoS ONE (2013). issn: 19326203.doi: 10.1371/journal.pone.0067718.
[54] Michael R.W. Brown, David G. Allison, and Peter Gilbert. “Resistance ofbacterial biofilms to antibiotics a growth-rate related e�ect?” In: Journalof Antimicrobial Chemotherapy (1988). issn: 03057453. doi: 10.1093/jac/
22.6.777.
[55] Luanne Hall-Stoodley, J. William Costerton, and Paul Stoodley. Bacterialbiofilms: From the natural environment to infectious diseases. 2004. doi:10.1038/nrmicro821.
[56] Veysel Berk et al. “Molecular Architecture and Assembly Principles ofVibrio Cholerae Biofilms”. In: Biophysical Journal (2012). issn: 00063495.doi: 10.1016/j.bpj.2011.11.3364.
[57] Su Chuen Chew et al. “Dynamic remodeling of microbial biofilms by func-tionally distinct exopolysaccharides”. In: mBio (2014). issn: 21507511. doi:10.1128/mBio.01536-14.
[58] Anna Dragoö et al. “Division of Labor during Biofilm Matrix Production”. In:Current Biology (2018). issn: 09609822. doi: 10.1016/j.cub.2018.04.046.
[59] Karin Sauer et al. “Pseudomonas aeruginosa displays multiple phenotypesduring development as a biofilm”. In: Journal of Bacteriology (2002). issn:00219193. doi: 10.1128/jb.184.4.1140-1154.2002.
102

Bibliography
[60] Russell D. Monds and George A. O’Toole. The developmental model ofmicrobial biofilms: ten years of a paradigm up for review. 2009. doi: 10.
1016/j.tim.2008.11.001.
[61] J. H. Pringle and M. Fletcher. “Influence of substratum hydration andadsorbed macromolecules on bacterial attachment to surfaces”. In: Appliedand Environmental Microbiology (1986). issn: 00992240. doi: 10.1128/aem.
51.6.1321-1325.1986.
[62] G. O’Toole, H. B. Kaplan, and R. Kolter. Biofilm formation as microbialdevelopment. 2000. doi: 10.1146/annurev.micro.54.1.49.
[63] Knut Drescher et al. “Architectural transitions in Vibrio cholerae biofilms atsingle-cell resolution”. In: Proceedings of the National Academy of Sciencesof the United States of America (2016). issn: 10916490. doi: 10.1073/pnas.
1601702113.
[64] Je�rey B. Kaplan et al. “Low levels of —-Lactam antibiotics induce extra-cellular DNA release and biofilm formation in Staphylococcus aureus”. In:mBio (2012). issn: 21507511. doi: 10.1128/mBio.00198-12.
[65] Wook Kim et al. “Importance of positioning for microbial evolution”. In:Proceedings of the National Academy of Sciences of the United States ofAmerica (2014). issn: 10916490. doi: 10.1073/pnas.1323632111.
[66] Carsten Matz et al. “Microcolonies, quorum sensing and cytotoxicity de-termine the survival of Pseudomonas aeruginosa biofilms exposed to proto-zoan grazing”. In: Environmental Microbiology (2004). issn: 14622912. doi:10.1111/j.1462-2920.2004.00556.x.
[67] Susanne Müller et al. “Predation by Myxococcus xanthus induces Bacillussubtilis to form spore-filled megastructures”. In: Applied and EnvironmentalMicrobiology (2015). issn: 10985336. doi: 10.1128/AEM.02448-14.
[68] Xin Wang, Howard A. Stone, and Ramin Golestanian. “Shape of the growingfront of biofilms”. In: New Journal of Physics (2017). issn: 13672630. doi:10.1088/1367-2630/aa983f. arXiv: 1706.02372.
103

Bibliography
[69] D. Dell’Arciprete et al. “A growing bacterial colony in two dimensions as anactive nematic”. In: Nature Communications (2018). issn: 20411723. doi:10.1038/s41467-018-06370-3.
[70] Zhihong You et al. “Geometry and Mechanics of Microdomains in GrowingBacterial Colonies”. In: Physical Review X (2018). issn: 21603308. doi:10.1103/PhysRevX.8.031065. arXiv: 1703.04504.
[71] Farzan Beroz et al. “Verticalization of bacterial biofilms”. In: Nature Physics(2018). issn: 17452481. doi: 10.1038/s41567-018-0170-4. arXiv: 1801.
03064.
[72] Jiunn Cn Fong et al. “Structural dynamics of RbmA governs plasticity ofVibrio cholerae biofilms”. In: eLife (2017). issn: 2050084X. doi: 10.7554/
eLife.26163.
[73] Manuel Maestre-Reyna, Wen Jin Wu, and Andrew H.J. Wang. “Structuralinsights into RbmA, a biofilm sca�olding protein of V. cholerae”. In: PLoSONE (2013). issn: 19326203. doi: 10.1371/journal.pone.0082458.
[74] Jiunn C.N. Fong et al. “Identification and characterization of RbmA, anovel protein required for the development of rugose colony morphologyand biofilm structure in Vibrio cholerae”. In: Journal of Bacteriology (2006).issn: 00219193. doi: 10.1128/JB.188.3.1049-1059.2006.
[75] Wolfram Pönisch et al. “Multiscale modeling of bacterial colonies: Howpili mediate the dynamics of single cells and cellular aggregates”. In: NewJournal of Physics (2017). issn: 13672630. doi: 10.1088/1367- 2630/
aa5483.
[76] Lena Dewenter, Thorsten E. Volkmann, and Berenike Maier. “Oxygengoverns gonococcal microcolony stability by enhancing the interaction forcebetween type IV pili”. In: Integrative Biology (United Kingdom) (2015).issn: 17579708. doi: 10.1039/c5ib00018a.
[77] Nuno M. Oliveira et al. Correction: Biofilm Formation As a Response toEcological Competition (PLoS Biol, 2015). 2015. doi: 10.1371/journal.
pbio.1002232.
104

Bibliography
[78] Janus A.J. Haagensen et al. “Di�erentiation and distribution of colistin- andsodium dodecyl sulfate-tolerant cells in Pseudomonas aeruginosa biofilms”.In: Journal of Bacteriology (2007). issn: 00219193. doi: 10.1128/JB.00720-
06.
[79] Sünje Johanna Pamp et al. “Tolerance to the antimicrobial peptide colistin inPseudomonas aeruginosa biofilms is linked to metabolically active cells, anddepends on the pmr and mexAB-oprM genes”. In: Molecular Microbiology(2008). issn: 0950382X. doi: 10.1111/j.1365-2958.2008.06152.x.
[80] Thomas Bjarnsholt et al. “Pseudomonas aeruginosa tolerance to tobramycin,hydrogen peroxide and polymorphonuclear leukocytes is quorum-sensingdependent”. In: Microbiology (2005). issn: 13500872. doi: 10.1099/mic.0.
27463-0.
[81] Ehud Banin, Keith M. Brady, and E. Peter Greenberg. “Chelator-induceddispersal and killing of Pseudomonas aeruginosa cells in a biofilm”. In:Applied and Environmental Microbiology (2006). issn: 00992240. doi: 10.
1128/AEM.72.3.2064-2069.2006.
[82] Terry Brissac et al. “The meningococcal minor pilin PilX is responsible fortype IV pilus conformational changes associated with signaling to endothelialcells”. In: Infection and Immunity (2012). issn: 00199567. doi: 10.1128/
IAI.00369-12.
[83] Annegret Wilde and Conrad W. Mullineaux. Light-controlled motility inprokaryotes and the problem of directional light perception. 2017. doi: 10.
1093/femsre/fux045.
[84] Daniel K.H. Rode, Praveen K. Singh, and Knut Drescher. Multicellular andunicellular responses of microbial biofilms to stress. 2020. doi: 10.1515/hsz-
2020-0213.
[85] Alexandre Persat et al. The mechanical world of bacteria. 2015. doi: 10.
1016/j.cell.2015.05.005.
[86] Dirk de Beer et al. “E�ects of biofilm structures on oxygen distributionand mass transport”. In: Biotechnology and Bioengineering (1994). issn:10970290. doi: 10.1002/bit.260431118.
105

Bibliography
[87] Je� N. Anderl et al. “Role of nutrient limitation and stationary-phaseexistence in Klebsiella pneumoniae biofilm resistance to ampicillin andciprofloxacin”. In: Antimicrobial Agents and Chemotherapy (2003). issn:00664804. doi: 10.1128/AAC.47.4.1251-1256.2003.
[88] Marshall C. Walters et al. “Contributions of antibiotic penetration, oxygenlimitation, and low metabolic activity to tolerance of Pseudomonas aerugi-nosa biofilms to ciprofloxacin and tobramycin”. In: Antimicrobial Agentsand Chemotherapy (2003). issn: 00664804. doi: 10.1128/AAC.47.1.317-
323.2003.
[89] Giorgia Borriello et al. “Oxygen limitation contributes to antibiotic toleranceof Pseudomonas aeruginosa in biofilms”. In: Antimicrobial Agents andChemotherapy (2004). issn: 00664804. doi: 10.1128/AAC.48.7.2659-
2664.2004.
[90] Erin Werner et al. “Stratified growth in Pseudomonas aeruginosa biofilms”.In: Applied and Environmental Microbiology (2004). issn: 00992240. doi:10.1128/AEM.70.10.6188-6196.2004.
[91] Philip S. Stewart et al. “Reaction-di�usion theory explains hypoxia andheterogeneous growth within microbial biofilms associated with chronicinfections”. In: npj Biofilms and Microbiomes (2016). issn: 20555008. doi:10.1038/npjbiofilms.2016.12.
[92] E. Tuomanen et al. “The rate of killing of Escherichia coli by —-lactamantibiotics is strictly proportional to the rate of bacterial growth”. In:Journal of General Microbiology (1986). issn: 00221287. doi: 10.1099/
00221287-132-5-1297.
[93] R. H.K. Eng et al. “Bactericidal e�ects of antibiotics on slowly growing andnongrowing bacteria”. In: Antimicrobial Agents and Chemotherapy (1991).issn: 00664804. doi: 10.1128/AAC.35.9.1824.
[94] D. J. Evans et al. “Susceptibility of pseudomonas aeruginosa and escherichiacoli biofilms towards ciprofloxacin: E�ect of specific growth rate”. In: Journalof Antimicrobial Chemotherapy (1991). issn: 03057453. doi: 10.1093/jac/
27.2.177.
106

Bibliography
[95] Z. Zheng and P. S. Stewart. “Growth limitation of Staphylococcus epider-midis in biofilms contributes to rifampin tolerance”. In: Biofilms (2004).issn: 1479-0505. doi: 10.1017/s1479050503001042.
[96] Philip S. Stewart and Michael J. Franklin. Physiological heterogeneity inbiofilms. 2008. doi: 10.1038/nrmicro1838.
[97] Laurent A. Lardon et al. “iDynoMiCS: Next-generation individual-basedmodelling of biofilms”. In: Environmental Microbiology (2011). issn: 14622912.doi: 10.1111/j.1462-2920.2011.02414.x.
[98] John A. Cole et al. “Spatially-resolved metabolic cooperativity within densebacterial colonies”. In: BMC Systems Biology (2015). issn: 17520509. doi:10.1186/s12918-015-0155-1.
[99] Alma Dal Co, Simon Van Vliet, and Martin Ackermann. “Emergent mi-croscale gradients give rise to metabolic cross-feeding and antibiotic tol-erance in clonal bacterial populations”. In: Philosophical Transactionsof the Royal Society B: Biological Sciences (2019). issn: 14712970. doi:10.1098/rstb.2019.0080.
[100] Arthur Prindle et al. “Ion channels enable electrical communication inbacterial communities”. In: Nature (2015). issn: 14764687. doi: 10.1038/
nature15709.
[101] Jintao Liu et al. “Metabolic co-dependence gives rise to collective oscilla-tions within biofilms”. In: Nature (2015). issn: 14764687. doi: 10.1038/
nature14660.
[102] Erin S. Gloag et al. “Self-organization of bacterial biofilms is facilitated byextracellular DNA”. In: Proceedings of the National Academy of Sciences ofthe United States of America (2013). issn: 00278424. doi: 10.1073/pnas.
1218898110.
[103] Matthew Ghannoum, Mahmoud Parsek, Marvin Whiteley, and Pranab K.Mukherjee. MICROBIAL BIOFILMS. 2015, p. 404.
107

Bibliography
[104] Shuwen An, Ji’en Wu, and Lian Hui Zhang. “Modulation of pseudomonasaeruginosa biofilm dispersal by a cyclic-di-gmp phosphodiesterase with a pu-tative hypoxia-sensing domain”. In: Applied and Environmental Microbiology(2010). issn: 00992240. doi: 10.1128/AEM.01233-10.
[105] Tran T. Huynh et al. “Glucose starvation-induced dispersal of pseudomonasaeruginosa biofilms is camp and energy dependent”. In: PLoS ONE (2012).issn: 19326203. doi: 10.1371/journal.pone.0042874.
[106] Olga E. Petrova and Karin Sauer. Escaping the biofilm in more than oneway: Desorption, detachment or dispersion. 2016. doi: 10.1016/j.mib.
2016.01.004.
[107] Nicolas Barraud et al. “Involvement of nitric oxide in biofilm dispersalof Pseudomonas aeruginosa”. In: Journal of Bacteriology (2006). issn:00219193. doi: 10.1128/JB.00779-06.
[108] Jessica L. Lister and Alexander R. Horswill. “Staphylococcus aureus biofilms:Recent developments in biofilm dispersal”. In: Frontiers in Cellular andInfection Microbiology (2014). issn: 22352988. doi: 10.3389/fcimb.2014.
00178.
[109] Blaise R. Boles and Alexander R. Horswill. “agr-mediated dispersal ofStaphylococcus aureus biofilms”. In: PLoS Pathogens (2008). issn: 15537366.doi: 10.1371/journal.ppat.1000052.
[110] Praveen K. Singh et al. “Vibrio cholerae Combines Individual and CollectiveSensing to Trigger Biofilm Dispersal”. In: Current Biology (2017). issn:09609822. doi: 10.1016/j.cub.2017.09.041.
[111] Vasili Hauryliuk et al. Recent functional insights into the role of (p)ppGppin bacterial physiology. 2015. doi: 10.1038/nrmicro3448.
[112] Juana María Navarro Llorens, Antonio Tormo, and Esteban Martínez-García.Stationary phase in gram-negative bacteria. 2010. doi: 10.1111/j.1574-
6976.2010.00213.x.
[113] Lisa U. Magnusson, Anne Farewell, and Thomas Nyström. ppGpp: A globalregulator in Escherichia coli. 2005. doi: 10.1016/j.tim.2005.03.008.
108

Bibliography
[114] Ian Booth. “Escherichia coli and Salmonella typhimurium; Cellular andMolecular Biology, Vol. 1 (of2)”. In: Trends in Biochemical Sciences (1988).issn: 09680004. doi: 10.1016/0968-0004(88)90241-1.
[115] Anaïs Soares, Kévin Alexandre, and Manuel Etienne. Tolerance and Per-sistence of Pseudomonas aeruginosa in Biofilms Exposed to Antibiotics:Molecular Mechanisms, Antibiotic Strategies and Therapeutic Perspectives.2020. doi: 10.3389/fmicb.2020.02057.
[116] Dao Nguyen et al. “Active starvation responses mediate antibiotic tolerancein biofilms and nutrient-limited bacteria”. In: Science (2011). issn: 10959203.doi: 10.1126/science.1211037.
[117] Oscar G. Gomez-Duarte et al. “Genetic diversity of the gene cluster encodingLongus, a type IV pilus of enterotoxigenic Escherichia coli”. In: Journal ofBacteriology (2007). issn: 00219193. doi: 10.1128/JB.00722-07.
[118] Paul A. Manning. “The tcp gene cluster of Vibrio cholerae”. In: Gene. 1997.doi: 10.1016/S0378-1119(97)00036-X.
[119] Kimberly K. Je�erson, Donald A. Goldmann, and Gerald B. Pier. “Useof confocal microscopy to analyze the rate of vancomycin penetrationthrough Staphylococcus aureus biofilms”. In: Antimicrobial Agents andChemotherapy (2005). issn: 00664804. doi: 10.1128/AAC.49.6.2467-
2473.2005.
[120] Rachna Singh et al. “Penetration barrier contributes to bacterial biofilm-associated resistance against only select antibiotics, and exhibits genus-,strain- and antibiotic-specific di�erences”. In: Pathogens and Disease (2016).issn: 2049632X. doi: 10.1093/femspd/ftw056.
[121] Rachna Singh et al. “Penetration of antibiotics through Staphylococcus au-reus and Staphylococcus epidermidis biofilms”. In: Journal of AntimicrobialChemotherapy (2010). issn: 03057453. doi: 10.1093/jac/dkq257.
[122] W. M. Dunne, E. O. Mason, and S. L. Kaplan. “Di�usion of rifampin andvancomycin through a Staphylococcus epidermidis biofilm”. In: Antimicro-bial Agents and Chemotherapy (1993). issn: 00664804. doi: 10.1128/AAC.
37.12.2522.
109

Bibliography
[123] Zhilan Zheng and Philip S. Stewart. “Penetration of rifampin throughStaphylococcus epidermidis biofilms”. In: Antimicrobial Agents and Chemother-apy (2002). issn: 00664804. doi: 10.1128/AAC.46.3.900-903.2002.
[124] Philip S. Stewart, William M. Davison, and Judith N. Steenbergen. “Dapto-mycin rapidly penetrates a Staphylococcus epidermidis biofilm”. In: Antimi-crobial Agents and Chemotherapy (2009). issn: 00664804. doi: 10.1128/
AAC.01728-08.
[125] Richard F. Collins et al. “Three-dimensional structure of the Neisseriameningitidis secretin PilQ determined from negative-stain transmissionelectron microscopy”. In: Journal of Bacteriology (2003). issn: 00219193.doi: 10.1128/JB.185.8.2611-2617.2003.
[126] Rym Boudjemaa et al. “New insight into daptomycin bioavailability andlocalization in Staphylococcus aureus biofilms by dynamic fluorescence imag-ing”. In: Antimicrobial Agents and Chemotherapy (2016). issn: 10986596.doi: 10.1128/AAC.00735-16.
[127] G. Stone et al. “Tetracycline rapidly reaches all the constituent cells ofuropathogenic Escherichia coli biofilms”. In: Antimicrobial Agents andChemotherapy (2002). issn: 00664804. doi: 10.1128/AAC.46.8.2458-
2461.2002.
[128] Boo Shan Tseng et al. “The extracellular matrix protects Pseudomonasaeruginosa biofilms by limiting the penetration of tobramycin”. In: En-vironmental Microbiology (2013). issn: 14622912. doi: 10.1111/1462-
2920.12155.
[129] Kam Cheong Wong et al. “Antibiotic use for Vibrio infections: importantinsights from surveillance data”. In: BMC Infectious Diseases (2015). issn:14712334. doi: 10.1186/s12879-015-0959-z.
[130] David W. Adams and Je� Errington. Bacterial cell division: Assembly, main-tenance and disassembly of the Z ring. 2009. doi: 10.1038/nrmicro2198.
[131] Francisco Díaz-Pascual et al. Breakdown of Vibrio cholerae biofilm architec-ture induced by antibiotics disrupts community barrier function. 2019. doi:10.1038/s41564-019-0579-2.
110

Bibliography
[132] Tâm Mignot et al. “Evidence that focal adhesion complexes power bacterialgliding motility”. In: Science (2007). issn: 00368075. doi: 10.1126/science.
1137223.
[133] Helen Fifer et al. “Failure of Dual Antimicrobial Therapy in Treatment ofGonorrhea”. In: New England Journal of Medicine (2016). issn: 0028-4793.doi: 10.1056/nejmc1512757.
[134] David W. Eyre et al. “Gonorrhoea treatment failure caused by a Neisseriagonorrhoeae strain with combined ceftriaxone and high-level azithromycinresistance, England, February 2018”. In: Eurosurveillance (2018). issn:15607917. doi: 10.2807/1560-7917.ES.2018.23.27.1800323.
[135] Magnus Unemo et al. Sexually transmitted infections: challenges ahead.2017. doi: 10.1016/S1473-3099(17)30310-9.
[136] Won Jong Kim et al. “Commensal Neisseria Kill Neisseria gonorrhoeaethrough a DNA-Dependent Mechanism”. In: Cell Host and Microbe (2019).issn: 19346069. doi: 10.1016/j.chom.2019.07.003.
[137] Philipp J. Keller et al. “Reconstruction of zebrafish early embryonic de-velopment by scanned light sheet microscopy”. In: Science (2008). issn:00368075. doi: 10.1126/science.1162493.
[138] Raphael Hornung et al. “Quantitative modelling of nutrient-limited growthof bacterial colonies in microfluidic cultivation”. In: Journal of the RoyalSociety Interface (2018). issn: 17425662. doi: 10.1098/rsif.2017.0713.arXiv: 1802.05858.
[139] A. M. Alsayed et al. “Chemistry: Premelting at defects within bulk colloidalcrystals”. In: Science (2005). issn: 00368075. doi: 10 . 1126 / science .
1112399.
[140] Volkert W.A. De Villeneuve et al. “Chemistry: Colloidal hard-sphere crystalgrowth frustrated by large spherical impurities”. In: Science (2005). issn:00368075. doi: 10.1126/science.1113207.
[141] Eric R. Weeks et al. “Three-dimensional direct imaging of structural relax-ation near the colloidal glass transition”. In: Science (2000). issn: 00368075.doi: 10.1126/science.287.5453.627.
111

Bibliography
[142] John C. Crocker and David G. Grier. “Methods of digital video microscopyfor colloidal studies”. In: Journal of Colloid and Interface Science (1996).issn: 00219797. doi: 10.1006/jcis.1996.0217.
[143] Yongxiang Gao and Maria L. Kilfoil. “Accurate detection and completetracking of large populations of features in three dimensions”. In: OpticsExpress (2009). issn: 1094-4087. doi: 10.1364/oe.17.004685.
[144] Zoe N. Demou and Larry V. McIntire. “Fully automated three-dimensionaltracking of cancer cells in collagen gels: Determination of motility phenotypesat the cellular level”. In: Cancer Research (2002). issn: 00085472.
[145] Frank P. Ferrie, Martin D. Levine, and Steven W. Zucke. “Cell Tracking: AModeling and Minimization Approach”. In: IEEE Transactions on PatternAnalysis and Machine Intelligence (1982). issn: 01628828. doi: 10.1109/
TPAMI.1982.4767244.
[146] Martin D. Levine et al. “QUANTIFICATION OF BLOOD CELL MOTIONBY A METHOD OF AUTOMATIC DIGITAL PICTURE PROCESSING.”In: IEEE Transactions on Pattern Analysis and Machine Intelligence (1980).issn: 01628828. doi: 10.1109/TPAMI.1980.6592365.
[147] S. T. Young et al. Real-time tracing of spermatozoa. 1996. doi: 10.1109/
51.544519.
[148] Luc Vincent, Luc Vincent, and Pierre Soille. “Watersheds in Digital Spaces:An E�cient Algorithm Based on Immersion Simulations”. In: IEEE Transac-tions on Pattern Analysis and Machine Intelligence (1991). issn: 01628828.doi: 10.1109/34.87344.
[149] V. Grau et al. “Improved watershed transform for medical image segmenta-tion using prior information”. In: IEEE Transactions on Medical Imaging(2004). issn: 02780062. doi: 10.1109/TMI.2004.824224.
[150] Hakan Ancin et al. “Advances in automated 3-D image analysis of cellpopulations imaged by confocal microscopy”. In: Cytometry (1996). issn:01964763. doi: 10.1002/(SICI)1097-0320(19961101)25:3<221::AID-
CYTO3>3.0.CO;2-I.
112

Bibliography
[151] Christophe De Hauwer et al. “In vitro motility evaluation of aggregatedcancer cells by means of automatic image processing”. In: Cytometry (1999).issn: 01964763. doi: 10.1002/(SICI)1097-0320(19990501)36:1<1::
AID-CYTO1>3.0.CO;2-P.
[152] Gang Lin et al. “A Hybrid 3D Watershed Algorithm Incorporating GradientCues and Object Models for Automatic Segmentation of Nuclei in ConfocalImage Stacks”. In: Cytometry Part A (2003). issn: 15524922. doi: 10.1002/
cyto.a.10079.
[153] Norberto Malpica et al. “Applying watershed algorithms to the segmentationof clustered nuclei”. In: Cytometry (1997). issn: 01964763. doi: 10.1002/
(SICI)1097-0320(19970801)28:4<289::AID-CYTO3>3.0.CO;2-7.
[154] Mathieu Leocmach and Hajime Tanaka. “A novel particle tracking methodwith individual particle size measurement and its application to ordering inglassy hard sphere colloids”. In: Soft Matter (2013). issn: 1744683X. doi:10.1039/c2sm27107a.
[155] Philip Ball. “Colloids get active”. In: Nature Materials (2013). issn: 1476-1122. doi: 10.1038/nmat3720.
[156] Martin Vorregaard. “Comstat2 - a modern 3D image analysis environmentfor biofilms”. PhD thesis. 2008.
[157] Raimo Hartmann et al. “Quantitative image analysis of microbial commu-nities with BiofilmQ”. In: Nature Microbiology (2021). issn: 20585276. doi:10.1038/s41564-020-00817-4.
[158] C. Potera. Studying slime. 1998. doi: 10.1289/ehp.98106a604.
[159] C. Potera. Forging a link between biofilms and disease. 1999. doi: 10.1126/
science.283.5409.1837.
[160] Xue Zhong et al. “Titanium surface priming with phase-transited lysozymeto establish a silver nanoparticle-loaded chitosan/hyaluronic acid antibac-terial multilayer via layer-by-layer self-assembly”. In: PLoS ONE (2016).issn: 19326203. doi: 10.1371/journal.pone.0146957.
113

Bibliography
[161] Thomas Bjarnsholt et al. Applying insights from biofilm biology to drugdevelopment-can a new approach be developed? 2013. doi: 10 . 1038 /
nrd4000.
[162] Morten Alhede et al. “Phenotypes of non-attached pseudomonas aeruginosaaggregates resemble surface attached biofilm”. In: PLoS ONE (2011). issn:19326203. doi: 10.1371/journal.pone.0027943.
[163] Robert C. Shields et al. “E�cacy of a Marine Bacterial Nuclease againstBiofilm Forming Microorganisms Isolated from Chronic Rhinosinusitis”. In:PLoS ONE (2013). issn: 19326203. doi: 10.1371/journal.pone.0055339.
[164] E. A. Izano et al. “Detachment and killing of Aggregatibacter actino-mycetemcomitans biofilms by dispersin B and SDS”. In: Journal of DentalResearch (2007). issn: 00220345. doi: 10.1177/154405910708600707.
[165] Steven A. Rogers et al. “Synergistic e�ects between conventional antibioticsand 2-aminoimidazole-derived antibiofilm agents”. In: Antimicrobial Agentsand Chemotherapy (2010). issn: 00664804. doi: 10.1128/AAC.01418-09.
[166] Nadzeya Kouzel, Enno R. Oldewurtel, and Berenike Maier. “Gene transfere�ciency in gonococcal biofilms: Role of biofilm age, architecture, and pilinantigenic variation”. In: Journal of Bacteriology (2015). issn: 10985530.doi: 10.1128/JB.00171-15.
[167] Ella Rotman and H. Steven Seifert. “The genetics of Neisseria species”. In:Annual Review of Genetics (2014). issn: 15452948. doi: 10.1146/annurev-
genet-120213-092007.
[168] Rainer Kurre et al. “PilT2 enhances the speed of gonococcal type IV pilusretraction and of twitching motility”. In: Molecular Microbiology (2012).issn: 0950382X. doi: 10.1111/mmi.12022.
[169] Laty A. Cahoon and H. Steven Seifert. “An alternative DNA structure isnecessary for pilin antigenic variation in Neisseria gonorrhoeae”. In: Science(2009). issn: 00368075. doi: 10.1126/science.1175653.
114

Bibliography
[170] Scott D. Fisher et al. “RelA alone appears essential for (p)ppGpp produc-tion when Neisseria gonorrhoeae encounters nutritional stress”. In: FEMSMicrobiology Letters (2005). issn: 03781097. doi: 10.1016/j.femsle.2005.
05.014.
[171] Robert Zöllner et al. “Phase and antigenic variation govern competitiondynamics through positioning in bacterial colonies”. In: Scientific Reports(2017). issn: 20452322. doi: 10.1038/s41598-017-12472-7.
[172] Anton Welker et al. “Spatio-temporal dynamics of growth and death withinspherical bacterial colonies”. In: Biophys. J. in press (2021).
[173] Bente Børud et al. “Genetic, structural, and antigenic analyses of glycandiversity in the O-linked protein glycosylation systems of human Neisseriaspecies”. In: Journal of Bacteriology (2010). issn: 00219193. doi: 10.1128/
JB.00101-10.
[174] R. Scott, M. P. Allen, and D. J. Tildesley. “Computer Simulation of Liquids.”In: Mathematics of Computation (1991). issn: 00255718. doi: 10.2307/
2938686.
[175] T. H. Besseling et al. “Determination of the positions and orientations ofconcentrated rod-like colloids from 3D microscopy data”. In: Journal ofPhysics Condensed Matter. 2015. doi: 10.1088/0953-8984/27/19/194109.arXiv: 1406.4985.
[176] S. J. Hewlett and T. Wilson. “Resolution enhancement in three-dimensionalconfocal microscopy”. In: Machine Vision and Applications (1991). issn:09328092. doi: 10.1007/BF01815300.
[177] Karole L. Blythe, Eric J. Titus, and Katherine A. Willets. “Objective-Induced Point Spread Function Aberrations and Their Impact on Super-Resolution Microscopy”. In: Analytical Chemistry (2015). issn: 15206882.doi: 10.1021/acs.analchem.5b01848.
[178] Brian C. Carter, George T. Shubeita, and Steven P. Gross. “Tracking singleparticles: A user-friendly quantitative evaluation”. In: Physical Biology(2005). issn: 14783975. doi: 10.1088/1478-3967/2/1/008.
115

Bibliography
[179] Michael K. Cheezum, William F. Walker, and William H. Guilford. “Quan-titative comparison of algorithms for tracking single fluorescent particles”.In: Biophysical Journal (2001). issn: 00063495. doi: 10.1016/S0006-
3495(01)75884-5.
[180] David J. Stephens and Victoria J. Allan. Light microscopy techniques forlive cell imaging. 2003. doi: 10.1126/science.1082160.
[181] M. Bamdad et al. “A new expression for radial distribution function andinfinite shear modulus of Lennard-Jones fluids”. In: Chemical Physics (2006).issn: 03010104. doi: 10.1016/j.chemphys.2006.02.001.
[182] Enrico Matteoli and G. Ali Mansoori. “A simple expression for radialdistribution functions of pure fluids and mixtures”. In: The Journal ofChemical Physics (1995). issn: 00219606. doi: 10.1063/1.470654.
[183] J. Hendricks et al. “Di�erent mechanisms for dynamical arrest in largelyasymmetric binary mixtures”. In: Physical Review E - Statistical, Nonlinear,and Soft Matter Physics (2015). issn: 15502376. doi: 10.1103/PhysRevE.
91.032308.
[184] Morgen E. Anyan et al. “Type IV pili interactions promote intercellularassociation and moderate swarming of Pseudomonas aeruginosa”. In: Pro-ceedings of the National Academy of Sciences of the United States of America(2014). issn: 10916490. doi: 10.1073/pnas.1414661111.
[185] Alyson M. Hockenberry et al. “Attenuation of the type IV pilus retractionmotor influences Neisseria gonorrhoeae social and infection behavior”. In:mBio (2016). issn: 21507511. doi: 10.1128/mBio.01994-16.
[186] Dustin L. Higashi et al. “Dynamics of Neisseria gonorrhoeae attachment:Microcolony development, cortical plaque formation, and cytoprotection”. In:Infection and Immunity (2007). issn: 00199567. doi: 10.1128/IAI.00687-
07.
[187] Bruno M. Saraiva et al. “Reassessment of the distinctive geometry ofStaphylococcus aureus cell division”. In: Nature Communications (2020).issn: 20411723. doi: 10.1038/s41467-020-17940-9.
116

Bibliography
[188] Garima Kapoor, Saurabh Saigal, and Ashok Elongavan. Action and re-sistance mechanisms of antibiotics: A guide for clinicians. 2017. doi: 10.
4103/joacp.JOACP_349_15.
[189] Paul L. Biancaniello, Anthony J. Kim, and John C. Crocker. “Colloidal in-teractions and self-assembly using DNA hybridization”. In: Physical ReviewLetters (2005). issn: 00319007. doi: 10.1103/PhysRevLett.94.058302.
[190] Oya Ilke Sentürk et al. “Independent Blue and Red Light Triggered Narcis-sistic Self-Sorting Self-Assembly of Colloidal Particles”. In: Small (2019).issn: 16136829. doi: 10.1002/smll.201901801.
[191] Wolfram Pönisch et al. “Pili mediated intercellular forces shape hetero-geneous bacterial microcolonies prior to multicellular di�erentiation”. In:Scientific Reports (2018). issn: 20452322. doi: 10.1038/s41598- 018-
34754-4.
[192] Kai Zhou et al. “Non-equilibrium Dynamics of Growing Bacterial Colonies”.In: (2021).
[193] Manuela Dietrich et al. “Pilin regulation in the pilT mutant of Neisseriagonorrhoeae strain MS11”. In: FEMS Microbiology Letters (2009). issn:03781097. doi: 10.1111/j.1574-6968.2009.01647.x.
[194] Robert Zöllner, Tom Cronenberg, and Berenike Maier. “Motor propertiesof pilt-independent type 4 pilus retraction in gonococci”. In: Journal ofBacteriology. 2019. doi: 10.1128/JB.00778-18.
[195] Etienne Carbonnelle et al. “A systematic genetic analysis in Neisseriameningitidis defines the Pil proteins required for assembly, functionality,stabilization and export of type IV pili”. In: Molecular Microbiology (2006).issn: 0950382X. doi: 10.1111/j.1365-2958.2006.05341.x.
[196] Mya R. Warren et al. “Spatiotemporal establishment of dense bacterialcolonies growing on hard agar”. In: eLife (2019). issn: 2050084X. doi:10.7554/eLife.41093.
[197] Morgan Delarue et al. “Self-driven jamming in growing microbial popula-tions”. In: Nature Physics (2016). issn: 17452481. doi: 10.1038/nphys3741.
117

Bibliography
[198] Hannah H. Tuson et al. “Measuring the sti�ness of bacterial cells fromgrowth rates in hydrogels of tunable elasticity”. In: Molecular Microbiology(2012). issn: 0950382X. doi: 10.1111/j.1365-2958.2012.08063.x.
[199] J. M. Andrews. “Determination of minimum inhibitory concentrations”.In: Journal of Antimicrobial Chemotherapy (2001). issn: 03057453. doi:10.1093/jac/48.suppl_1.5.
[200] Joe J. Harrison et al. “Microtiter susceptibility testing of microbes growingon peg lids: A miniaturized biofilm model for high-throughput screening”.In: Nature Protocols (2010). issn: 17502799. doi: 10.1038/nprot.2010.71.
[201] A. Grünberger et al. “High-Throughput Growth Rate Determination ofBacteria Microcolonies on Single Cell Level”. In: Chemie Ingenieur Technik(2012). doi: 10.1002/cite.201250342.
118

Danksagung
Hiermit möchte ich mich bei allen bedanken, die mich während dieser Arbeitbegleitet und unterstützt haben.
An erster Stelle bedanke ich mich besonders bei Prof. Dr. Berenike Maier fürdie tatkräftige Unterstützung während meiner Projekte und die Möglichkeit mirdiese frei auswählen du dürfen. Du hast dir für mich immer Zeit genommen, wennich Hilfe brauchte und hattest gute Ratschläge parat. Außerdem danke ich für dieMöglichkeit meine Ergebnisse auf Konferenzen presäntieren zu dürfen.
Zusätzlich bedanke ich mich bei Prof. Dr. Tobias Bollenbach und Prof. Dr.Ines Neundorf für das Interesse an meiner Arbeit und die Teilnahme in meinerPrüfungskommission als zweiter Gutachter und als Vorsitzende.
Ich danke der AG Maier für das angenehme Arbeitsklima und die großartigeUnterstützung während der Corona-Zeit. Ganz besonders bedanke ich mich beiTom, Marc und Niklas für ihre Hilfsbereitschaft und Expertise. Weiterhin bedankeich mich bei Thorsten Volkmann für seine brillianten technischen Ideen beim Bauvon Inkubatoren.
Darüber hinaus bedanke ich mich bei Thorsten Auth für die Organisation undKoordination von Biosoft.
Zum Schluss bedanke ich mich bei meiner Familie für das zahlreiche Babysitten.Besonderer Dank geht an Ines, Finn und Lina, die immer für mich da sind.
119

Erklärung
Hiermit versichere ich an Eides statt, dass ich die vorliegende Dissertation selb-stständig und ohne die Benutzung anderer als der angegebenen Hilfsmittel undLiteratur angefertigt habe. Alle Stellen, die wörtlich oder sinngemaäß aus veröf-fentlichten und nicht veroö�entlichten Werken dem Wortlaut oder dem Sinn nachentnommen wurden, sind als solche kenntlich gemacht. Ich versichere an Eidesstatt, dass diese Dissertation noch keiner anderen Fakultaät oder Universität zurPrüfung vorgelegen hat; dass sie - abgesehen von unten angegebenen Teilpublika-tionen und eingebundenen Artikeln und Manuskripten - noch nicht verö�entlichtworden ist sowie, dass ich eine Verö�entlichung der Dissertation vor Abschluss derPromotion nicht ohne Genehmigung des Promotionsausschusses vornehmen werde.Die Bestimmungen dieser Ordnung sind mir bekannt. Darüber hinaus erkläre ichhiermit, dass ich die Ordnung zur Sicherung guter wissenschaftlicher Praxis undzum Umgang mit wissenschaftlichem Fehlverhalten der Universität zu Köln gelesenund sie bei der Durchführung der Dissertation zugrundeliegenden Arbeiten undder schriftlich verfassten Dissertation beachtet habe und verpflichte mich hiermit,die dort genannten Vorgaben bei allen wissenschaftlichen Tätigkeiten zu beachtenund umzusetzen. Ich versichere, dass die eingereichte elektronische Fassung dereingereichten Druckfassung vollständig entspricht.
Teilpublikationen:
• Welker, A.*, Cronenberg, T.*, Zöllner, R.*, Meel, C., Siewering, K., Bender,N., Hennes, M., Oldewurtel, E.R., Maier, B., Molecular motors governliquidlike ordering and fusion dynamics of bacterial colonies, Phys. Rev.Lett., 121, 118102 (2018)
120

Bibliography
• Zöllner, R.*, Cronenberg, T.*, Kouzel, N., Welker, A., Koomey, M., Maier,B., Type IV pilin post-translational modifications modulate materials prop-erties of bacterial colonies, Biophys. J., 116(5), 938 (2019)
• Welker, A.*, Hennes, M,*, Bender, N., Cronenberg, T., Schneider, G.,Maier, B., Spatio-temporal dynamics of growth and death within sphericalbacterial colonies, Biophys. J. in press (2021)
Köln, 03.09.2021 Anton Welker
121