
Dynamic temporal interpretation contexts for temporal abstraction
Upload
khangminh22Category
view
0download
0
HAL Id: tel-00726306https://tel.archives-ouvertes.fr/tel-00726306
Submitted on 29 Aug 2012
HAL is a multi-disciplinary open accessarchive for the deposit and dissemination of sci-entific research documents, whether they are pub-lished or not. The documents may come fromteaching and research institutions in France orabroad, or from public or private research centers.
L’archive ouverte pluridisciplinaire HAL, estdestinée au dépôt et à la diffusion de documentsscientifiques de niveau recherche, publiés ou non,émanant des établissements d’enseignement et derecherche français ou étrangers, des laboratoirespublics ou privés.
A prefrontal–temporal network underlying state changesbetween Stimulus-Driven and Stimulus-Independent
CognitionTomas Ossandon Valdes
To cite this version:Tomas Ossandon Valdes. A prefrontal–temporal network underlying state changes between Stimulus-Driven and Stimulus-Independent Cognition. Human health and pathology. Université ClaudeBernard - Lyon I, 2010. English. �NNT : 2010LYO10316�. �tel-00726306�

1
A prefrontal – temporal network underlying state changes between Stimulus-Driven and Stimulus-
Independent Cognition
THESE
préesenté et soutenue publiquement le 14 Decembre 2010 pour l’obtention du grade de
Docteur en Neurosciences Cognitives de l’Université Claude Bernard – Lyon I
(arrété du 7 août 2006)
par
Tomas OSSANDON
Composition du jury Directeurs de thèse : LACHAUX Jean-Philippe BERTRAND Olivier Rapporteurs : LUTZ Antoine LE VAN QUYEN Michel Jury : LACHAUX Jean-Philippe BERTRAND Olivier LUTZ Antoine GERVAIS Rémi LE VAN QUYEN Michel
Laboratoire Inserm ”Dynamique Cérébrale et Cognition” — U821

2
ABSTRACT: The brain displays moment-to-moment activity fluctuations that reflect various levels of engagement with the outside world. Processing external stimuli is not only associated with increased brain metabolism but also with prominent deactivation in specific structures, collectively known as the default-mode network (DMN). The role of the DMN remains enigmatic partly because its electrophysiological correlates and temporal dynamics are still poorly understood. Using unprecedented wide-spread depth recordings in epileptic patients, undergoing intracranial EEG during pre-surgical evaluation, we reveal that DMN neural populations display task-related suppressions of gamma (60-140 Hz) power and, critically, we show how millisecond temporal profile and amplitude of gamma deactivation tightly correlate with task demands and subject performance. The results show also that during an attentional task, sustained activations in the gamma band power are presented across large cortical networks, while transient activations are mostly specific to occipital and temporal regions. Our findings reveal a pivotal role for broadband gamma modulations in the interplay between activation and deactivation networks mediating efficient goal-directed behavior. Key words: Default-mode network, intracranial EEG, gamma-band activity, gamma-band suppression, goal-directed behavior, attention, visual search, and epilepsy. RÉSUME Le cerveau présente des fluctuations de son activité qui reflètent différents niveaux d’engagement avec le monde extérieur. Le traitement des stimuli externes n’est pas seulement associé avec une augmentation du métabolisme cérébrale, mais également avec une désactivation importante dans un ensemble des structures spécifiques connus sous le nom de ‘Default-Mode Network’ (DMN, réseau par défaut). Le rôle du DMN reste énigmatique en partie parce que ses corrélats électrophysiologiques et sa dynamique temporelle sont encore mal compris. En utilisant des enregistrements éléctrophysiologiques intracrânien chez le patient épileptique, nous démontrons que la population neuronale de ce réseau montre des suppressions de l’activité gamma (60-140 Hz). Plus important, nous montrons de quelle manière le profil temporale (en millisecondes) et l’amplitude de cette désactivation sont étroitement corrélés avec la difficulté de la tâche et la performance individuelle. Les résultats mettent également en évidence que pendant une tâche attentionnelle, une activation soutenue dans le temps de la bande gamma est présente dans un large réseau, alors que des activations transitoires sont spécifiques aux régions temporale et occipitale. Nos résultats révèlent ainsi un rôle essentiel des mécanismes d’activation et de désactivation des oscillations large bande gamma dans l’exécution d’un comportement orienté vers un but. Mots clés : Default Mode Network, électroencéphalographie intracrânien, oscillation gamma, désactivation gamma, épilepsie, attention, et recherche visuel.

3
Contents
Chapter 1
Electrophysiological correlates of the Default-Mode Network
1.1.1 Introduction …………………………..……….………………………..9
1.2 A brief history of the DMN………………….………………………….…..13
1.2.1 Regional task non-specific deactivations during goal-directed activity ………...15
1.2.2 Coherence and functional connectivity within the DMN ………………………..17
1.2.3 DMN characterized by low frequency BOLD signal ………………………........18
1.2.4 Anti-correlated task-positive and task-negative resting network….………....20
1.3 A new view of the brain function…………………………………………..21
1.3.1 Functional role of the Default-Mode Network………………………..………….21
1.3.2 Anatomic considerations about the DMN……………………………..………24
1.3.2.a Posterior Cingulate Cortex/ Precuneus……………………………...…25
1.3.2.b Medial prefrontal cortex (MPFC)……………...…...……………….…25
a) Ventral MPFC……………………………………………………………26
b) Dorsal MPFC…………………………………………………………… 27
1.3.2.c Posterior lateral cortices…………………………………………………..27
1.3.2.d Rostral prefrontal cortex (BA 10, 47, 12)……..…..………………………29
Chapter 2
Neurophysiological basis of the fMRI signals
2.1 Introduction…………………………………….………………………………31
a) General overview…………………………….……………………………….31
4
b) Functional MRI …………………………….…………..…………………..…32
2.2 Electrophysiological correlates of BOLD, invasive studies……….……….…33
2.3 Electrophysiological correlates of BOLD, non-invasive methods …………..36
2.4 Electrophysiological correlate of BOLD deactivation ………………….……38
Chapter 3
Attention and electrophysiology: broadband gamma band activity as a neuronal
marker
3 Introduction: Attention and electrophysiology……………………………...41
3.1 Mechanisms of selective visual attention……………………………….…….41
3.2 On the functional importance of neural synchronization…………….…….44
3.3 Human studies on neuronal synchronization…………………...….…...…...49
3.4 Gamma band responses in humans…………………………..…..............…..50
3.4.1 Eye-movements artifacts……………………………………..………...…...…..52
3.5 Intracerebral EEG studies in humans………………….………………...…..52
3.5.1 Invasive recordings in epileptic patients……………….….………………..…...53
3.5.2 Dynamic spectral imaging………………………………..…………….….……54
3.6 Gamma band synchrony and attention: insights from human ICE
studies……………………………………………….……………………………….…..……57
3.6.1 Attention and visual perception…………………………………………...…….57
3.6.2 Attention and reading…………………………………………………...…...…..58
3.6.3 Attention and memory………………………………………………...………....59
3.7 Broadband activity reflects synchrony?............................................................61
3.7.1 Asynchronous neuronal populations can explain narrowband oscillations……...61
3.7.2 Broadband spectral gamma: synchrony or neural correlate of population firing

5
rate?...................................................................................................................................62
3.8 Perspectives………………..…………………………………….……………...64
3.8.1 Long distance synchrony…………………..………………….…………………64
3.8.2 Other frequency bands……………………..………………………………….....65
3.8.3 Scalp recordings………………..………………………………………………...66
Chapter 4
Material and Methods
4.1 Subjects…………………………………………………………………...….....68
4.2 Stimuli and experimental design…………………………………………..….69
4.3 Data Acquisition……………………….………………………….….…..........70
4.3.1 Electrode implantation………………….……………………….……..….…….70
4.3.2 SEEG recordings……………………….………………………....…..…..……..71
4.3.3 Specificity of SEEG compared to ECoG……….……………............…...……..71
4.4 Data analysis………………………………………….………….….….….......72
4.4.1 Time-Frequency Maps (Wavelet analysis)……………….………….….............72
4.4.2 Estimation of gamma power profiles (Hilbert transform)…….………..…….…73
4.5 Mapping intracranial EEG data to standard MNI brain…..……..……...…74
4.6 Definition of anatomo-functional clusters…………………..………..….…...75
4.7 Computing deactivation onset and duration………………….………....…...75
4.8 Evaluating the relationship between GBD and performance……..………...76
a) Cluster-level approach……………………………………………..…….........76
b) Single-trial analysis……………………………………………..……..……...76
6
4.9 Gamma-band large-scale correlation and anti-correlation analysis………...77
Chapter 5, Results
First study: Electrophysiological correlates of the default mode network
5.1 Hypothesis and Comments about the study…………………………….…….79
5.2 Article: Transient suppressions of broadband gamma power in the default-
mode network is correlated with task complexity and subject
performance………………………………………………….………………..….……..83
5.3 Supplementary information……………………………………...………..……...93
Chapter 6, Results
Second study: Efficient ‘pop-out’ visual search elicits sustained broadband gamma
activity in the dorsal attention network
6.1 Hypothesis and Comments about the study…………………….…….……..95
6.2 Article…………………………………….…………………………….………97
Chapter 7 Discussion
7.1 General Discussion……………………..…………………………….……….125
7.2 Electrophysiological correlate of the Default Mode Network……………...126
7.3 Clinical implications of our first study…………………………………........129
7.4 Transient and sustained gamma band responses………………….....................131
7.5 Conclusions……………………………………………………………….……137

7
Bibliography………………………………………………………………….……...…139
Annexes ………………………………………………………………………………..153

8
Acknowledgment
I am sincerely grateful to my advisor, Jean-Philippe Lachaux, for the support and
guidance he showed me throughout my PhD. I owe sincere and earnest thankfulness to
Jean-Philippe Lachaux, Karim Jerbi, Juan Vidal and Olivier Bertrand by their helpful
discussions. I would like to show my gratitude to all the members of the laboratory
INSERM 1028.
Finally, I would like to thank Tamara Olivero for her contribution and patience, and
MIDEPLAN, Chile, by the fellowship Presidente de la Republica.

9
1.1 Introduction
At the beginning of the last century took place a conspicuous debate around the brain
function, in which two main views emerged (Raichle, 2009). Sir Charles Sherrington
(Sherrington, 1906), postulated that the brain is primarily reflexive, driven by the
momentary demands of the environment. Thomas Graham Brown put forth a competing
hypothesis that the brain’s operations are mainly intrinsic, involving the acquisition and
maintenance of information for interpreting, responding to, and even predicting
environmental demands (Brown, 1911).
Figure 1: Portraits of Sir
Charles Scott Sherrington (left) and Thomas Graham Brown.
In the seminal paper, ‘On the nature of the fundamental activity of the nervous centres;
together with an analysis on the conditioning rhythmic activity in progression, and a
theory of the evolution of function in the nervous systems’, Brown criticizes Sherrington’s
views of the reflex systems (T. G. Brown, 1911). According to Sherrington’s
interpretation, the reflex arc principally compensates the activity between an afferent and
efferent limb. The arc that mediates this relation from periphery to periphery through is
called the ‘reflex arc’. That arc itself is usually regarded as built up of various subsidiary
morphological units: the receptive organ, the afferent neuron, one or more interposed
neurons, the efferent neuron, and the effectors organ (T. G. Brown, 1911; Sherrington,
1906). However, this vision is not valid for Brown for two principal reasons:
10
a) The first reason is that “every afferent path tends, in its activity, to activate
many efferent paths; and every path is activated by many afferent paths”, or in other
words, the systems is more than a ‘reflex arc’ (T. G. Brown, 1911).
b) The phenomenon of ‘narcosis progression’. In this phenomenon walking, running, or
galloping movements may occur in all four limbs in cats under the influence of a general
anesthetic. In other words, we can observe a rhythmical movement in the cat when the
spinal reflexes are abolished (T. G. Brown, 1911).
In this sense, according to the Brown’s view, the nervous system is composed by an
intrinsic activity, with a rhythmicity that is disturbed by the reflex system.
A primarily reflexive brain has motivated most neuroscience research, principally
because experiments designed to measure brain responses to controlled stimuli and
carefully designed tasks can be rigorously controlled (D. Y. Zhang & Raichle, 2010). In
fact, the tasks used in my thesis adopt this model. It does not surprise us the fact that
several cognitive functions have been associated with specific patterns of activation in
some brain regions.
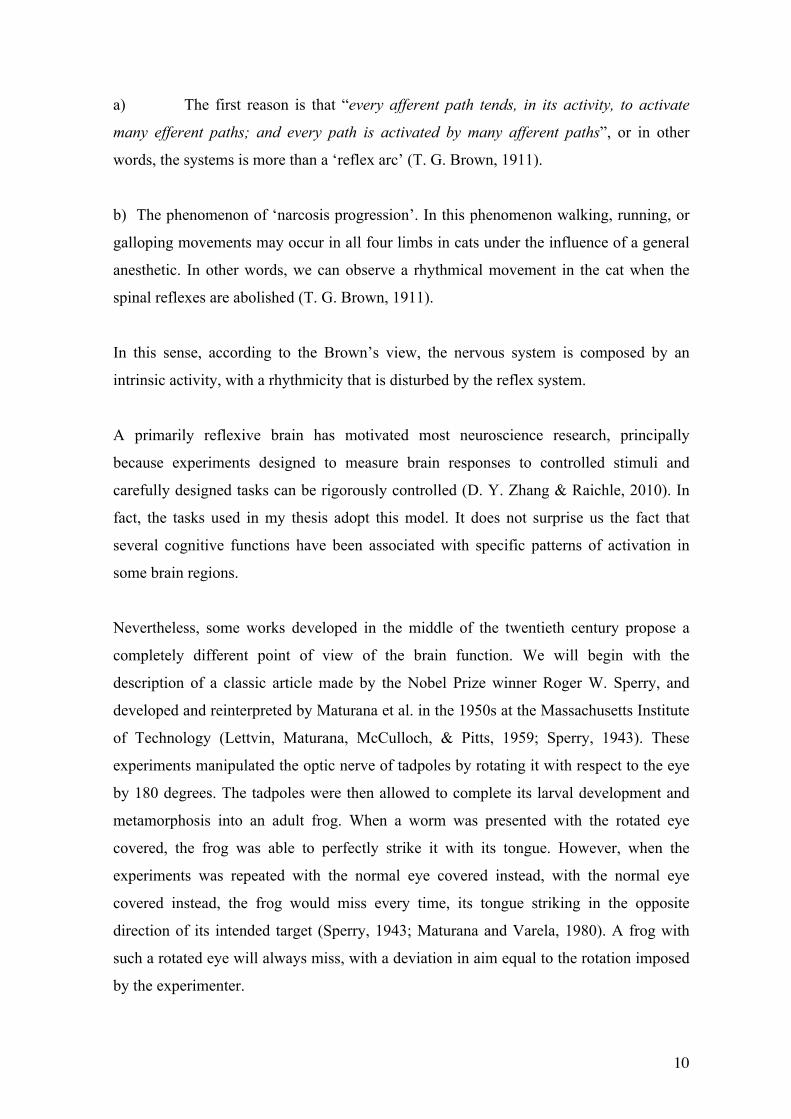
Nevertheless, some works developed in the middle of the twentieth century propose a
completely different point of view of the brain function. We will begin with the
description of a classic article made by the Nobel Prize winner Roger W. Sperry, and
developed and reinterpreted by Maturana et al. in the 1950s at the Massachusetts Institute
of Technology (Lettvin, Maturana, McCulloch, & Pitts, 1959; Sperry, 1943). These
experiments manipulated the optic nerve of tadpoles by rotating it with respect to the eye
by 180 degrees. The tadpoles were then allowed to complete its larval development and
metamorphosis into an adult frog. When a worm was presented with the rotated eye
covered, the frog was able to perfectly strike it with its tongue. However, when the
experiments was repeated with the normal eye covered instead, with the normal eye
covered instead, the frog would miss every time, its tongue striking in the opposite
direction of its intended target (Sperry, 1943; Maturana and Varela, 1980). A frog with
such a rotated eye will always miss, with a deviation in aim equal to the rotation imposed
by the experimenter.

11
Figure 2. When the eye is rotated 180° the frog’s prey catching behavior is inverted (From Sperry, 1943).
For Varela and Maturana this experiment “reveals in a dramatic way that for the animal
there is no such thing as up and down, front and back, in reference to an outside world,
as it exists for the observer doing the experiment. There is only an internal correlation
between the place where the retina receives a given perturbation and the muscular
contractions that move the tongue, the mouth, the neck, and, in fact, the frog’s entire
body” (Maturana and Varela, 1980).
According to these authors, as well as other experiments done since the 1950s, this
finding can be direct evidence that the operation of the nervous systems is an expression
of its connectivity and that behavior arises because of the nervous system’s internal
relations of activity (Maturana & Varela, 1970, 1980). Or, in other words, perception is
not the precise reconstruction of an external world, because such properties depend on
sensory motor coupling. Although the frog's action is indeed a reflex, its response is a
reflex of its internal sensory-motor coupling.
Some years after the Sperry’s experiment, Sokoloff and colleagues published an article
that reinforces the notion that the nervous system is not only primarily reflexive
(Sokoloff, Mangold, Wechsler, Kenney, & Kety, 1955). This group used the Kety-
Schmidt nitrous oxide technique1 to ask whether cerebral metabolism changes globally
1 A method for measuring organ blood flow first applied to the brain in 1944 by C. F. Schmidt and S. S. Kety. A chemically inert indicator gas (in this case N2O) is equilibrated with the tissue of the organ of interest and the rate of disappearance from the organ is measured. Blood flow is calculated on the

12
when goes from a quiet rest state to performing a difficult arithmetic problem. To their
surprise, metabolism remained constant in this task that demands focused cognitive effort.
While their initial conclusion, the unchanged global rate of metabolism suggests that the
rest state contains persistent brain activity that is as vigorous as that when individuals
solve externally administrated math problems (Buckner & Carroll, 2007). This paper was
the first to show that there are not large differences between the brain activity during
undirected mentation and demanding cognitive task. We know today that, depending to
the approach used, it is estimated that 60% to 80 % of the brain’s enormous energy
budget is used to support communication among neurons, functional activity by definition
(Raichle & Snyder, 2007). The additional energy burden associated with momentary
demands of the environment may be as little as 0.5% to 1% of the total energy budget
(Raichle & Mintun, 2006; Raichle, 2010). This cost-based analysis alone implies that
intrinsic activity may be at least as important as evoked activity in understanding overall
brain function (Raichle & Snyder, 2007; Raichle, 2010). The experiments explained
before really were exceptions in the exponential development of the neuroscience during
the past century. In the third chapter of this thesis I develop the history of a sub-area, the
visual attention.
Figure 3: Scheme of the apparatus used by Sokoloff and colleagues (From (Sokoloff et al., 1955).
assumption that the tissue and venous blood concentrations of the indicator gas are in diffusion equilibrium at all blood flow rates and that the rate of disappearance of the indicator from the tissue is a function of how much is in the tissue at any time (it is assumed to be an exponential disappearance).

13
1.2. A brief history of the DMN
Two decades later to the Solokoff’s results, the Swedish physiologist Davis Ingvar
aggregate imaging findings from the rest task states and note the importance of consistent,
regionally specific activity patterns, using the xenon 133 inhalation technique2 to measure
regional cerebral blood flown (rCBF). Ingvar and his colleagues observed a frontal
activity that showed high levels during rest states. Ingvar proposed, to explain this
unexpected phenomenon, that the hyperfrontal pattern of activity corresponded to
undirected, spontaneous, conscious mentation, or in other words, “the brain work which
we carry out when left alone undisturbed” (Buckner, Andrews-Hanna, & Schacter, 2008;
Ingvar, 1979).
Despite the background information provided by Solokoff and Ingvar, the study related to
the neural correlate of unconstrained states was neglected during several decades.
However, this phenomenon drastically changed by an accidental discovery. The evidence
began accumulating when researchers first measured brain activity during undirected
mental states (Binder et al., 1999; Buckner et al., 2008; Raichle & Snyder, 2007;
Shulman, Fiez et al., 1997). Even though no early studies were explicitly designed to
explore unconstrained states, relevant data were nonetheless acquired because of the
common practice of using rest or other types of passive conditions as an experimental
control. These studies revealed that the activity in specific brain regions increased during
passive control states as compared to most goal-directed tasks (Binder et al., 1999;
Buckner & Carroll, 2007; Shulman, Fiez et al., 1997). In almost all cases, the exploration
of activity during the control states occurred as an afterthought-as a part of reviews and
meta-analyses performed subsequent to the original reports, which focused on the goal-
directed tasks.
2 Gamma emission from the radioisotope 133Xe of xenon can be used to image the heart, lungs, and brain, for example, by means of single photon emission computed tomography (SPECT).
14
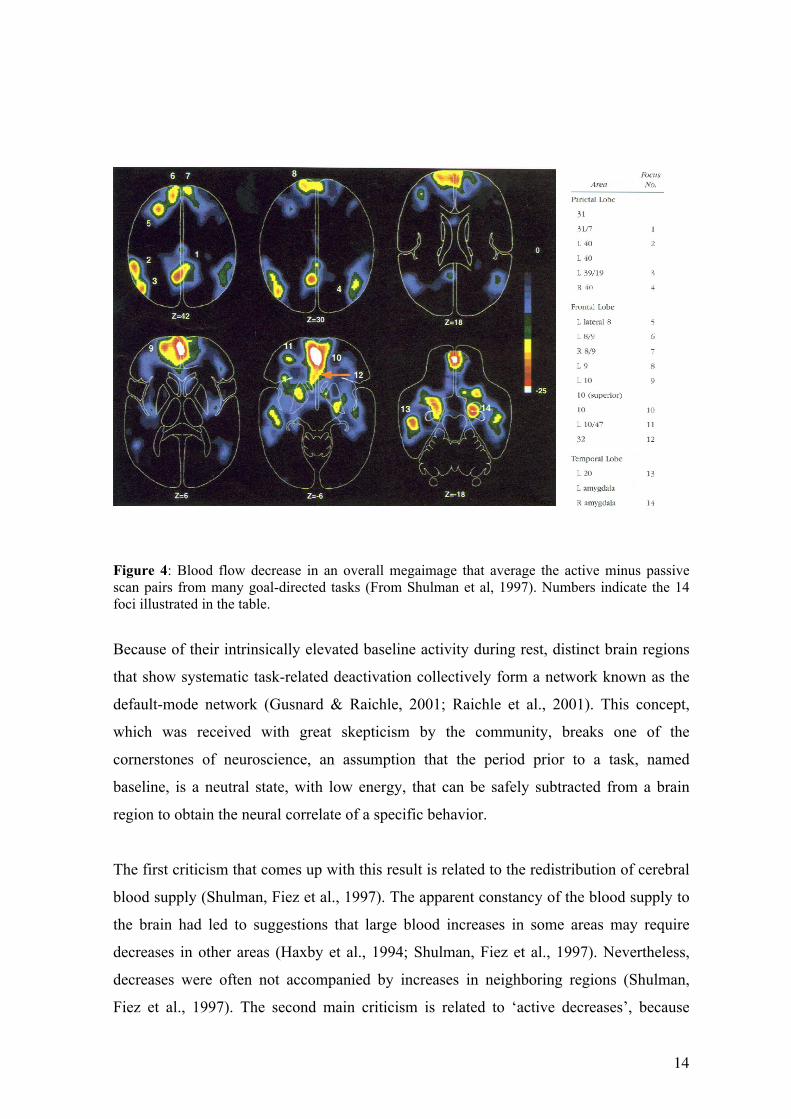
Figure 4: Blood flow decrease in an overall megaimage that average the active minus passive scan pairs from many goal-directed tasks (From Shulman et al, 1997). Numbers indicate the 14 foci illustrated in the table.
Because of their intrinsically elevated baseline activity during rest, distinct brain regions
that show systematic task-related deactivation collectively form a network known as the
default-mode network (Gusnard & Raichle, 2001; Raichle et al., 2001). This concept,
which was received with great skepticism by the community, breaks one of the
cornerstones of neuroscience, an assumption that the period prior to a task, named
baseline, is a neutral state, with low energy, that can be safely subtracted from a brain
region to obtain the neural correlate of a specific behavior.
The first criticism that comes up with this result is related to the redistribution of cerebral
blood supply (Shulman, Fiez et al., 1997). The apparent constancy of the blood supply to
the brain had led to suggestions that large blood increases in some areas may require
decreases in other areas (Haxby et al., 1994; Shulman, Fiez et al., 1997). Nevertheless,
decreases were often not accompanied by increases in neighboring regions (Shulman,
Fiez et al., 1997). The second main criticism is related to ‘active decreases’, because
15
active tasks may produce decreases in neural activity within an area that is tonically
active. i.e. the tonic activity of neurons in the substantia nigra pars reticulata is decreased
during a saccade (Hikosaka & Wurtz, 1983; Shulman, Fiez et al., 1997). Similarly, an
active task may inhibit a primary area that would normally respond in the task
environment. For instance, performance of a difficult visual discrimination in the
presence of distracting auditory transient might produce inhibition of ongoing activity in
auditory areas (Haxby et al., 1994; Shulman, Fiez et al., 1997).
In these examples, different tasks decreased neural activity in different areas. However,
and how we will develop later, deactivations in the default mode network during a goal-
directed behavior are largely tasks-independent.
The default mode network (DMN) concept although only first introduced into the
published literature in 2001 (Raichle et al., 2001) has rapidly become a central theme in
contemporary cognitive and clinical neurosciences (Andrews-Hanna, Reidler, Huang, &
Buckner; Broyd et al., 2009; Castellanos et al., 2008; Gujar, Yoo, Hu, & Walker; Raichle,
2010; van Eimeren, Monchi, Ballanger, & Strafella, 2009). After a decade of studies, we
can summarize the principal characteristics of the DMN as follows (adapted from
Broyd et al., 2009):
1. During goal-directed activity some regions of the brain show task-non-specific
deactivations (this is the origin of the concept “task-negative network”).
2. The energy of this network varies in a coherent manner at rest (coherence and
functional connectivity within the DMN).
3. This energy fluctuation is characterized by low frequency BOLD signal.
4. There is an anti-correlation between this task-negative and the task-positive
networks at rest.
These four points are detailed below:
1.2.1 Regional task non-specific deactivations during goal-directed activity
Converging neuroimaging evidence supports the view that attention-demanding goal-
directed behavior is mediated not only by distributed patterns of cerebral activation but,

16
remarkably, also by concurrent suppression of activity in specific brain regions (Shulman
et al., 1997; Raichle et al., 2001), even when the control state consists of lying quietly
with the eyes closed or passively viewing a stimulus (Raichle et al., 2001). As we have
mentioned, whereas cortical increases in activity have been shown to be task specific and,
therefore, vary in location depending of the task demands, many decreases appear to be
largely task-independent (Raichle et al, 2001). This task-negative networks comprise the
posterior cingulate cortex (PCC) / Precuneus (PrCC), medial prefrontal cortex (MPFC),
lateral temporal cortex (LTC), and temporal parietal junction (TPJ)3. As we can see in the
next figure, the brain regions that show a goal-directed deactivation are the regions that
consume more oxygen during the rest. From these results (Raichle et al., 2001), the
authors suggested the existence of an organized, baseline default mode of the brain
function that is suspended during specific goal-directed behaviors.
Figure 5: Regions of the brain regularly observed to decrease their activity during attention demanding cognitive tasks shows in sagittal projection (Upper) as compared with the blood flow of the brain while the subject rest quietly but awake with eyes closed (Lower). From Raichle et al., 2001.
1.2.2 Coherence and functional connectivity within the DMN
How are different brain regions functionally connected? This question has become one of
the most widely explored topics in the last decade. To introduce this subject, we shall
summarize some basic principles of functional connectivity. Principles of functional
3 At the end of this chapter these regions are detailed.

17
magnetic resonance imaging (fMRI) and the blood oxygen level dependent (BOLD)
signal will be presented in the second chapter.
Functional connectivity simply refers to the temporal correlation between fluctuations in
the BOLD signal of discrete anatomical regions4 (M. D. Fox et al., 2005). Or, more
technically, the functional connectivity search patterns of statistical dependence between
often-remote neural units or brain regions (Friston, Frith, Liddle, & Frackowiak, 1993;
Sporns & Tononi, 2008). With the purpose of simplification of this concept we can think
of the functional connectivity as a statistical concept that captures deviations from
statistical independence (measuring correlation or covariance) between distributed brain
regions across the time. In its most general form, statistical dependence is expressed as an
estimate of mutual information (Sporns & Tononi, 2008). Unlike correlation, which is a
linear measure of association, mutual information captures all linear or nonlinear
relationships between variables.
One of the most robust characteristics of the DMN is the high level of functional
connectivity during the rest (B. B. Biswal et al., 2010; Castellanos et al., 2008; Greicius,
Krasnow, Reiss, & Menon, 2003). In the next figure we show one of the classical results
in the DMN literature, that compares the connectivity across this network during a visual
processing task and rest (Greicius et al., 2003).
Figure 6: Comparison of the Posterior Cingulate Cortex (PCC) connectivity patterns during the visual processing task (Upper) and the resting-state (Lower). (From Greicius et al., 2003). We can see in this figure that resting PCC connectivity patterns remain constant during the visual processing.
4 We can also study functional connectivity with PET, MEG, EEG and intracranial EEG.
18
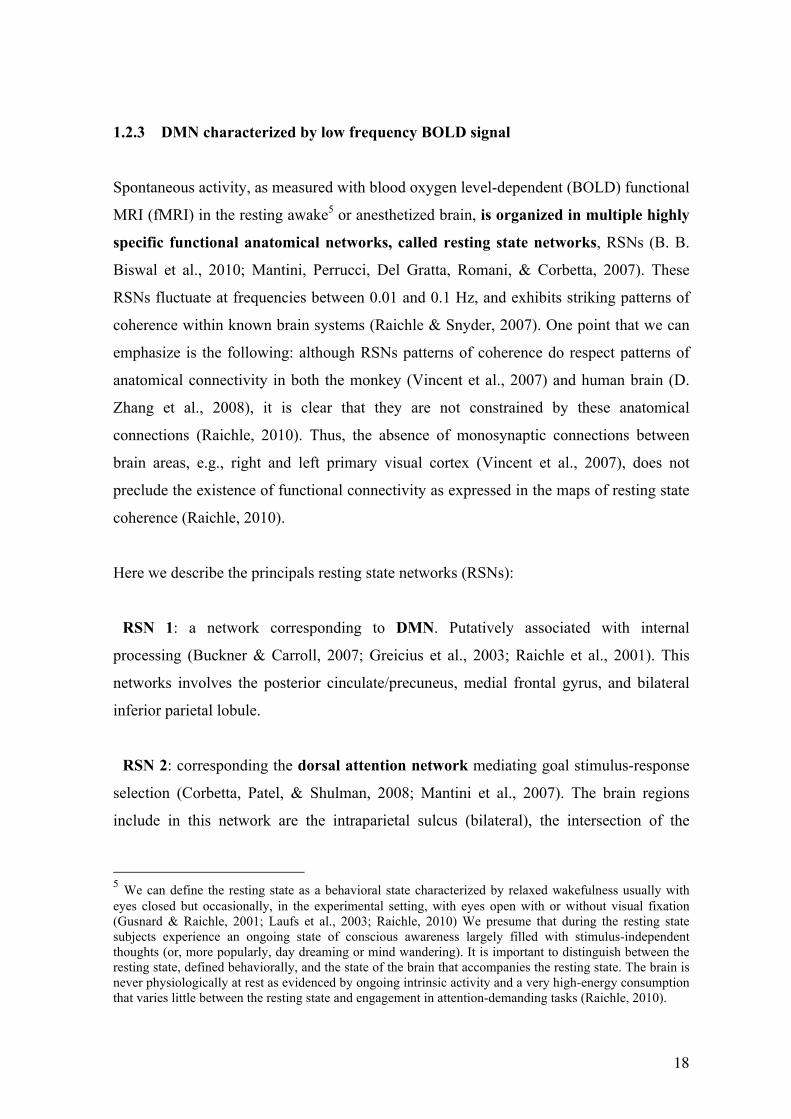
1.2.3 DMN characterized by low frequency BOLD signal
Spontaneous activity, as measured with blood oxygen level-dependent (BOLD) functional
MRI (fMRI) in the resting awake5 or anesthetized brain, is organized in multiple highly
specific functional anatomical networks, called resting state networks, RSNs (B. B.
Biswal et al., 2010; Mantini, Perrucci, Del Gratta, Romani, & Corbetta, 2007). These
RSNs fluctuate at frequencies between 0.01 and 0.1 Hz, and exhibits striking patterns of
coherence within known brain systems (Raichle & Snyder, 2007). One point that we can
emphasize is the following: although RSNs patterns of coherence do respect patterns of
anatomical connectivity in both the monkey (Vincent et al., 2007) and human brain (D.
Zhang et al., 2008), it is clear that they are not constrained by these anatomical
connections (Raichle, 2010). Thus, the absence of monosynaptic connections between
brain areas, e.g., right and left primary visual cortex (Vincent et al., 2007), does not
preclude the existence of functional connectivity as expressed in the maps of resting state
coherence (Raichle, 2010).
Here we describe the principals resting state networks (RSNs):
RSN 1: a network corresponding to DMN. Putatively associated with internal
processing (Buckner & Carroll, 2007; Greicius et al., 2003; Raichle et al., 2001). This
networks involves the posterior cinculate/precuneus, medial frontal gyrus, and bilateral
inferior parietal lobule.
RSN 2: corresponding the dorsal attention network mediating goal stimulus-response
selection (Corbetta, Patel, & Shulman, 2008; Mantini et al., 2007). The brain regions
include in this network are the intraparietal sulcus (bilateral), the intersection of the
5 We can define the resting state as a behavioral state characterized by relaxed wakefulness usually with eyes closed but occasionally, in the experimental setting, with eyes open with or without visual fixation (Gusnard & Raichle, 2001; Laufs et al., 2003; Raichle, 2010) We presume that during the resting state subjects experience an ongoing state of conscious awareness largely filled with stimulus-independent thoughts (or, more popularly, day dreaming or mind wandering). It is important to distinguish between the resting state, defined behaviorally, and the state of the brain that accompanies the resting state. The brain is never physiologically at rest as evidenced by ongoing intrinsic activity and a very high-energy consumption that varies little between the resting state and engagement in attention-demanding tasks (Raichle, 2010).

19
precentral and superior frontal sulcus (near the human frontal eye field), and the middle
frontal gyrus (dorsolateral prefrontal cortex, DLPFC).
RSN 3: a visual posterior network, involving the retinotopic occipital cortex and the
temporal-parietal regions including human MT (Lowe, Mock, & Sorenson, 1998; Mantini
et al., 2007).
RSN 4: corresponding to the auditory-phonological system, and including the bilateral
superior temporal cortex (Biswal et al., 1997).
RSN 5: a motor network, including the precentral, postcentral, and medial frontal gyri,
the primary sensory-motor cortex and the supplementary motor area (B. Biswal, Yetkin,
Haughton, & Hyde, 1995; Mantini et al., 2007).
RSN 6: network related to self-referential mental activity (D'Argembeau et al., 2005),
including the medial-ventral prefrontal cortex, the pregenual anterior cingulate, the
hypothalamus, and the cerebellum.
Figure 7: Cortical representation of the six RSNs. From Mantini et al., 2001
20
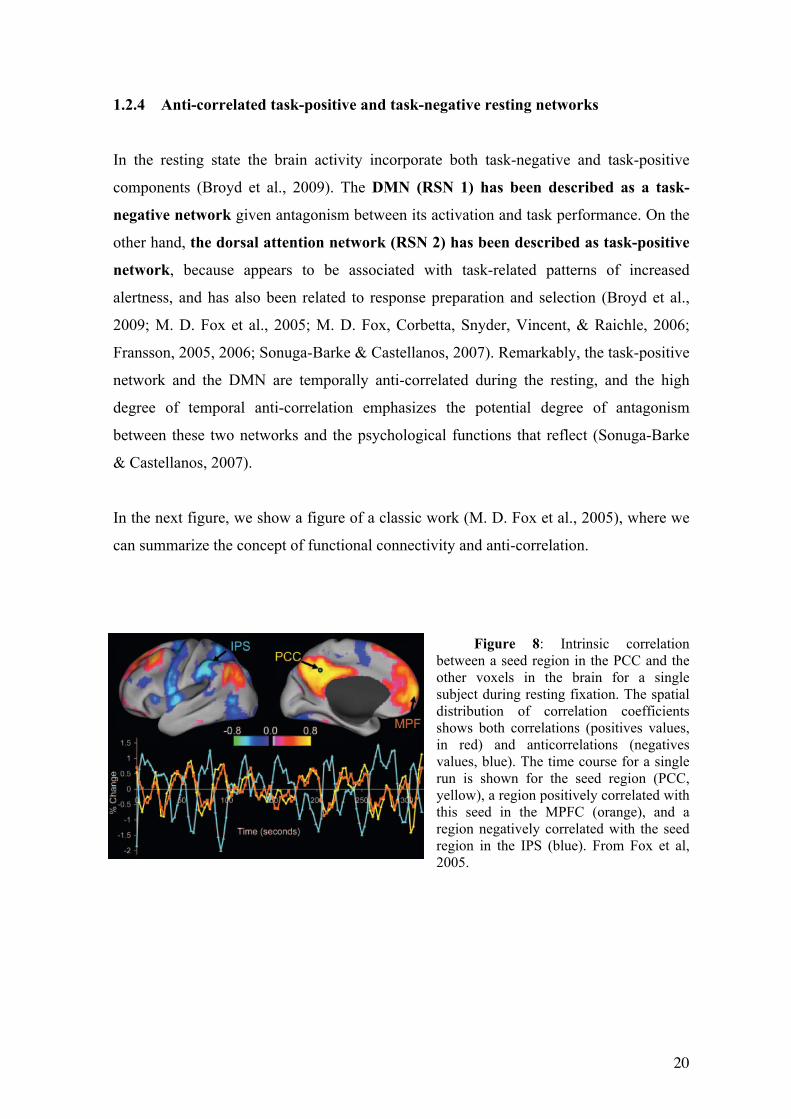
1.2.4 Anti-correlated task-positive and task-negative resting networks
In the resting state the brain activity incorporate both task-negative and task-positive
components (Broyd et al., 2009). The DMN (RSN 1) has been described as a task-
negative network given antagonism between its activation and task performance. On the
other hand, the dorsal attention network (RSN 2) has been described as task-positive
network, because appears to be associated with task-related patterns of increased
alertness, and has also been related to response preparation and selection (Broyd et al.,
2009; M. D. Fox et al., 2005; M. D. Fox, Corbetta, Snyder, Vincent, & Raichle, 2006;
Fransson, 2005, 2006; Sonuga-Barke & Castellanos, 2007). Remarkably, the task-positive
network and the DMN are temporally anti-correlated during the resting, and the high
degree of temporal anti-correlation emphasizes the potential degree of antagonism
between these two networks and the psychological functions that reflect (Sonuga-Barke
& Castellanos, 2007).
In the next figure, we show a figure of a classic work (M. D. Fox et al., 2005), where we
can summarize the concept of functional connectivity and anti-correlation.
Figure 8: Intrinsic correlation
between a seed region in the PCC and the other voxels in the brain for a single subject during resting fixation. The spatial distribution of correlation coefficients shows both correlations (positives values, in red) and anticorrelations (negatives values, blue). The time course for a single run is shown for the seed region (PCC, yellow), a region positively correlated with this seed in the MPFC (orange), and a region negatively correlated with the seed region in the IPS (blue). From Fox et al, 2005.

21
1.3 A new view of the brain function
As we mentioned in the first paragraph of this thesis, we can return to the old discussion
of the brain function. Nevertheless, thanks to the advance of the imaging techniques, and
especial to the discovery and robustness of the resting state networks, we can reformulate
almost all the questions that have been developed in the field, from what are the neural
correlates of a particular behavior, to, how is intrinsic activity modulated by particular
behavior?
1.3.1 Functional role of the Default Mode Network
We have seen throughout this chapter that spontaneous activity (measured with BOLD) in
the resting brain is organized in multiple functional networks (RSNs). In order to develop
this thesis, we need to emphasize the role and characteristics of one of these, the DMN, or
task-negative network, that is deactivated during task performances, and shows a high
oxygen consumption during the rest with a high degree of functional connectivity
(Raichle et al., 2001; Broyd et al., 2009). To understand the functional role of the DMN,
we can develop two ideas:
a) First, the relation between the pattern of deactivation in the DMN and the degree of
attention demanding. Recent articles deepen this issue. McKiernan and colleagues
manipulated cognitive load using an auditory working-memory task and detected an
increasing magnitude of deactivation in the DMN with increasing task difficulty. In other
words, the more demanding the task the stronger, the deactivation appears to be in
the DMN (McKiernan, Kaufman, Kucera-Thompson, & Binder, 2003; McKiernan,
D'Angelo, Kaufman, & Binder, 2006; Singh & Fawcett, 2008). In the next figure we
illustrate this important point:
22
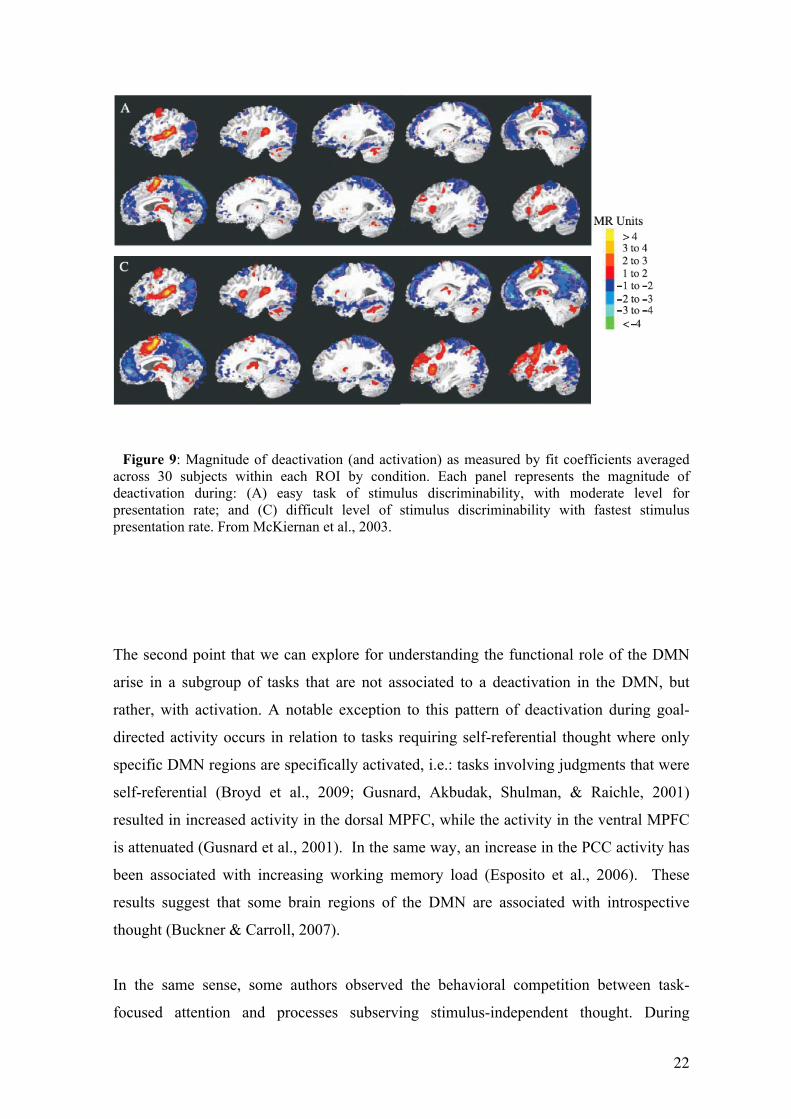
Figure 9: Magnitude of deactivation (and activation) as measured by fit coefficients averaged
across 30 subjects within each ROI by condition. Each panel represents the magnitude of deactivation during: (A) easy task of stimulus discriminability, with moderate level for presentation rate; and (C) difficult level of stimulus discriminability with fastest stimulus presentation rate. From McKiernan et al., 2003.
The second point that we can explore for understanding the functional role of the DMN
arise in a subgroup of tasks that are not associated to a deactivation in the DMN, but
rather, with activation. A notable exception to this pattern of deactivation during goal-
directed activity occurs in relation to tasks requiring self-referential thought where only
specific DMN regions are specifically activated, i.e.: tasks involving judgments that were
self-referential (Broyd et al., 2009; Gusnard, Akbudak, Shulman, & Raichle, 2001)
resulted in increased activity in the dorsal MPFC, while the activity in the ventral MPFC
is attenuated (Gusnard et al., 2001). In the same way, an increase in the PCC activity has
been associated with increasing working memory load (Esposito et al., 2006). These
results suggest that some brain regions of the DMN are associated with introspective
thought (Buckner & Carroll, 2007).
In the same sense, some authors observed the behavioral competition between task-
focused attention and processes subserving stimulus-independent thought. During
23
performance of cognitive tasks, thoughts occasionally emerge unrelated to the task or
goal (M. D. Fox et al., 2005; Simpson, Snyder, Gusnard, & Raichle, 2001). The more
stimulus-independent thoughts that occur during a task session, the worse the subject's
performance (M. D. Fox et al., 2005). Conversely, increasing the difficulty and attentional
demand of the task results in fewer stimulus-independent thoughts (M. D. Fox et al.,
2005). Given this and other evidence, the principal functional interpretation that we done
to DMN denote in the control of a state in which an individual is awake and alert, but not
actively involved in an attention demanding or goal-directed task.
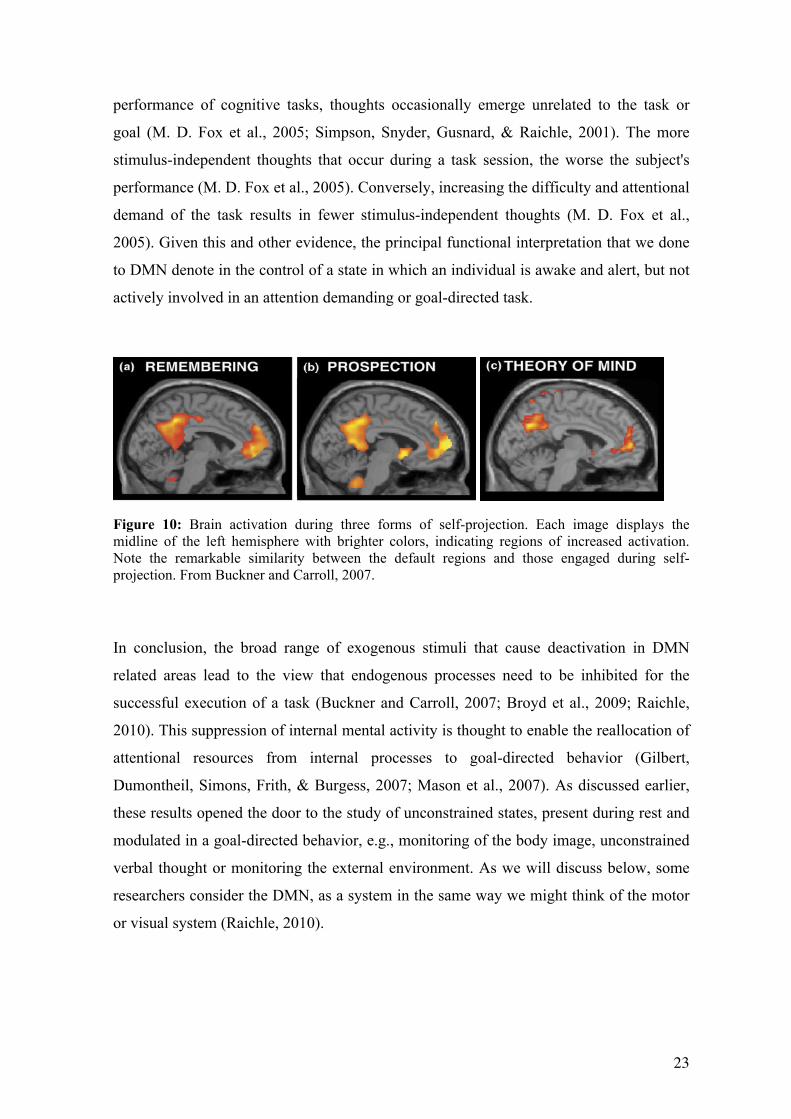
Figure 10: Brain activation during three forms of self-projection. Each image displays the midline of the left hemisphere with brighter colors, indicating regions of increased activation. Note the remarkable similarity between the default regions and those engaged during self-projection. From Buckner and Carroll, 2007.
In conclusion, the broad range of exogenous stimuli that cause deactivation in DMN
related areas lead to the view that endogenous processes need to be inhibited for the
successful execution of a task (Buckner and Carroll, 2007; Broyd et al., 2009; Raichle,
2010). This suppression of internal mental activity is thought to enable the reallocation of
attentional resources from internal processes to goal-directed behavior (Gilbert,
Dumontheil, Simons, Frith, & Burgess, 2007; Mason et al., 2007). As discussed earlier,
these results opened the door to the study of unconstrained states, present during rest and
modulated in a goal-directed behavior, e.g., monitoring of the body image, unconstrained
verbal thought or monitoring the external environment. As we will discuss below, some
researchers consider the DMN, as a system in the same way we might think of the motor
or visual system (Raichle, 2010).
24
1.3.2 Anatomic considerations about the DMN
We had mentioned that the regions that make up the DMN comprise principally the
posterior cingulated cortex (and the adjacent precuneus), the medial prefrontal cortex, and
the posterior lateral cortex. Then, we summarize in anatomical and physiological terms
the main characteristics of these regions. In order to facilitate the description, we illustrate
the Brodmann Areas in the Human Brain.
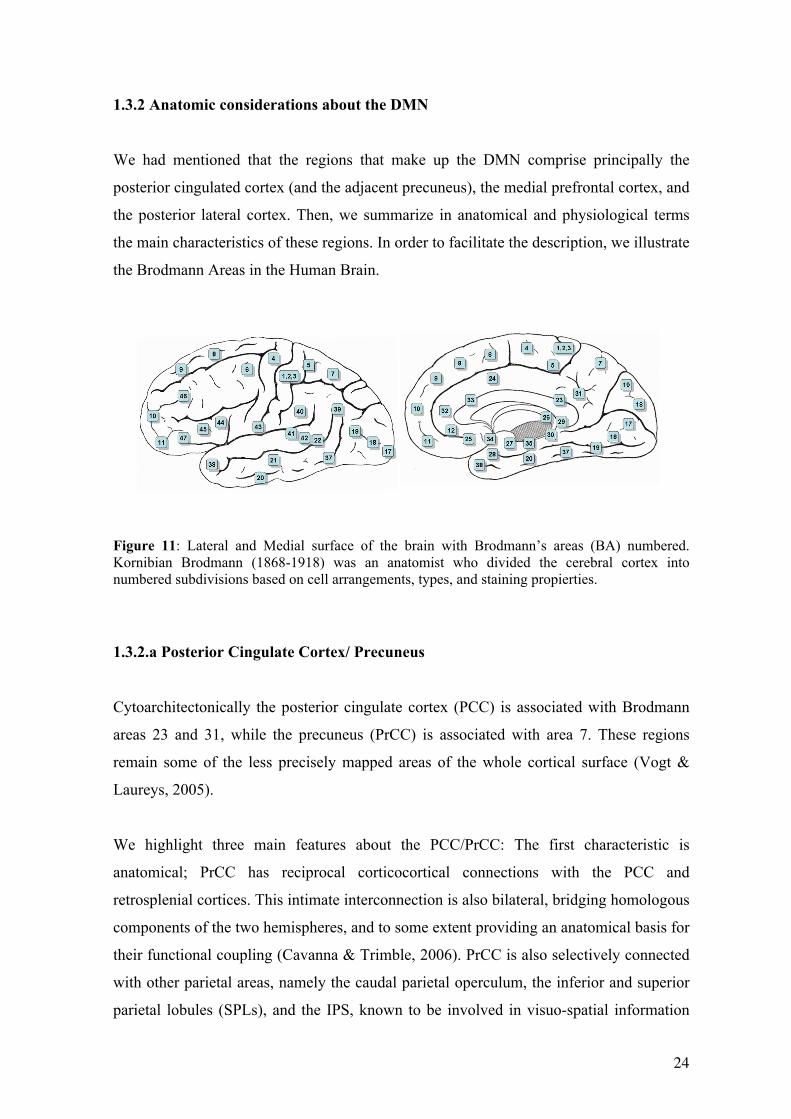
Figure 11: Lateral and Medial surface of the brain with Brodmann’s areas (BA) numbered. Kornibian Brodmann (1868-1918) was an anatomist who divided the cerebral cortex into numbered subdivisions based on cell arrangements, types, and staining propierties.
1.3.2.a Posterior Cingulate Cortex/ Precuneus
Cytoarchitectonically the posterior cingulate cortex (PCC) is associated with Brodmann
areas 23 and 31, while the precuneus (PrCC) is associated with area 7. These regions
remain some of the less precisely mapped areas of the whole cortical surface (Vogt &
Laureys, 2005).
We highlight three main features about the PCC/PrCC: The first characteristic is
anatomical; PrCC has reciprocal corticocortical connections with the PCC and
retrosplenial cortices. This intimate interconnection is also bilateral, bridging homologous
components of the two hemispheres, and to some extent providing an anatomical basis for
their functional coupling (Cavanna & Trimble, 2006). PrCC is also selectively connected
with other parietal areas, namely the caudal parietal operculum, the inferior and superior
parietal lobules (SPLs), and the IPS, known to be involved in visuo-spatial information

25
processing (Cavada & Goldman-Rakic, 1989; Cavanna & Trimble, 2006; Leichnetz,
2001; Selemon & Goldman-Rakic, 1988). As we illustrated in Figure 12, the PrCC has
cortical and subcortical connections, most of which are bidirectional.
Figure 12: Summary of the cortical (left) and subcortical (right) connections of the precuneus. Bidirectional arrows indicate reciprocal projections; unidirectional arrows indicate afferent/efferent projections. From Cavanna and Trimble, 2006.
The second main characteristic of these regions is their particular metabolism. The
PCC/PrCC has the highest level of metabolism in human brain (Andreasen et al., 1995;
Maquet, 1997; Minoshima et al., 1997; Vogt & Laureys, 2005). Finally, the third main
feature is behavioral. PrCC and PCC are involved in episodic memory retrieval
(D'Argembeau et al., 2010; Greicius, Supekar, Menon, & Dougherty, 2009; Ries et al.,
2006; Shannon & Buckner, 2004; Szpunar, Chan, & McDermott, 2009), self-processing
(D'Argembeau et al., 2010; J. M. Moran, Lee, & Gabrieli, 2010; Ries et al., 2006),
consciousness (Cavanna & Trimble, 2006; Vogt & Laureys, 2005), and visuo-spatial
imagery6. These studies suggest that the precuneneus and the posterior cingulated cortex
play an important role in a diverse array of highly integrated functions that can no longer
6 Some experiments have shown that the PrCC is more responsive during motor imagery than during real execution of joystick and finger movements (Stephan et al., 2005; Cavanna, 2006).

26
be regarded as a simple extension of the visual-spatial processes subserved by the lateral
parietal cortices (Cavanna & Trimble, 2006).
1.3.2.b Medial prefrontal cortex (MPFC):
a) Ventral MPFC
Among the areas most prominently exhibiting a deactivation during a goal-directed
behavior is medial prefrontal cortex (MPFC) (Gusnard et al., 2001). The MPFC areas
involved often include elements of both its dorsal and ventral aspect. Dorsally, when
decreases are observed, they tend to spare the cingulated cortex, which usually exhibits an
increase activity during attention-demanding tasks (Gusnard & Raichle, 2001).
The ventromedial prefrontal cortex has been described as equivalent to Brodmann area
10. Sometimes, the term is saved for the area above the medial orbitofrontal cortex, while
at other times, 'ventromedial prefrontal cortex' is used to describe a broad area in the
lower (ventral) central (medial) region of the prefrontal cortex, of which the medial
orbitofrontal cortex constitutes the lowermost part. The orbitofrontal cortex (OFC) is
composed of cytoarchitectonically discrete areas that receive a range of sensory
information from the body and external environment (Gusnard & Raichle, 2001). This
information is relayed to the ventral MPFC through a complex set of interconnections.
Ventral MPFC also heavily connect to limbic structures, such the amygdala, ventral
striatum, hypothalamus, and brainstem autonomic nuclei (Doron & Moulding, 2009;
Sheline, Price, Yan, & Mintun, 2010; Shu, Wu, Bao, & Leonard, 2003). Because these
anatomical data implicate ventral MPFC in aspects of emotional processing, it has been
suggested that decreases in this area during focused attention might reflect a dynamic
interplay between continuous cognitive and emotional processes, as shown in many
functional imaging studies (Gusnard & Raichle, 2001; Shulman, Fiez et al., 1997).

27
b) Dorsal MPFC
The dorsal MPFC often decreases its activity together with the ventral MPFC during
goal-directed activities (Gusnard & Raichle, 2001); however, both activities can
sometimes be dissociated. In some occasions, dorsal MPFC (BA 8, 9 and 10) present an
increase above baseline in its activity. The cognitive processes that are covered fall into
two general categories. The first involves monitoring or reporting one’s own mental
states, such as self-generated thoughts (Gusnard & Raichle, 2001; McGuire, Paulesu,
Frackowiak, & Frith, 1996; Pardo, Pardo, & Raichle, 1993), intended speech and
emotions (Frith & Frith, 1999; Gusnard & Raichle, 2001; Pardo et al., 1993). A second
category of experiments that engage this region involves attributing mental states to
others, or explicit representations of states of self (Frith & Frith, 1999).
Similar mental activity arises spontaneously when subjects are not actively engaged in
goal-directed behaviors, i.e., stimulus-independent thoughts (or daydreams) (Burgess,
Dumontheil, & Gilbert, 2007) and task-unrelated imagery and thought (Giambra, 1995).
1.3.2.c Posterior lateral cortices
Task-independent decreases in the posterior lateral cortex occur bilaterally in BA 40 and
39 (parietal lobe), and in BA 22 (temporal lobe) and 19 (occipital lobe) (Gusnard &
Raichle, 2001; Raichle et al., 2001; Shulman, Fiez et al., 1997). In order to describe these
regions, we need necessarily to make a differentiation between the DMN and the ventral
attention network (VAN). Corbetta and collaborators have developed a detailed work
about this network, that comprise the supramarginal gyrus, the superior temporal gyrus
(or temporal parietal junction, TPJ), and middle and inferior prefrontal cortex (Corbetta &
Shulman, 2002a; Corbetta et al., 2008). As with the DMN, we can observe a sustained
deactivation in VAN when we focus the attention in an object. In contrast to the DMN,
when an unexpected but important event evokes a reorienting of attention these region are
transiently activated (Corbetta et al., 2008). In the next figure we illustrate this point.
28
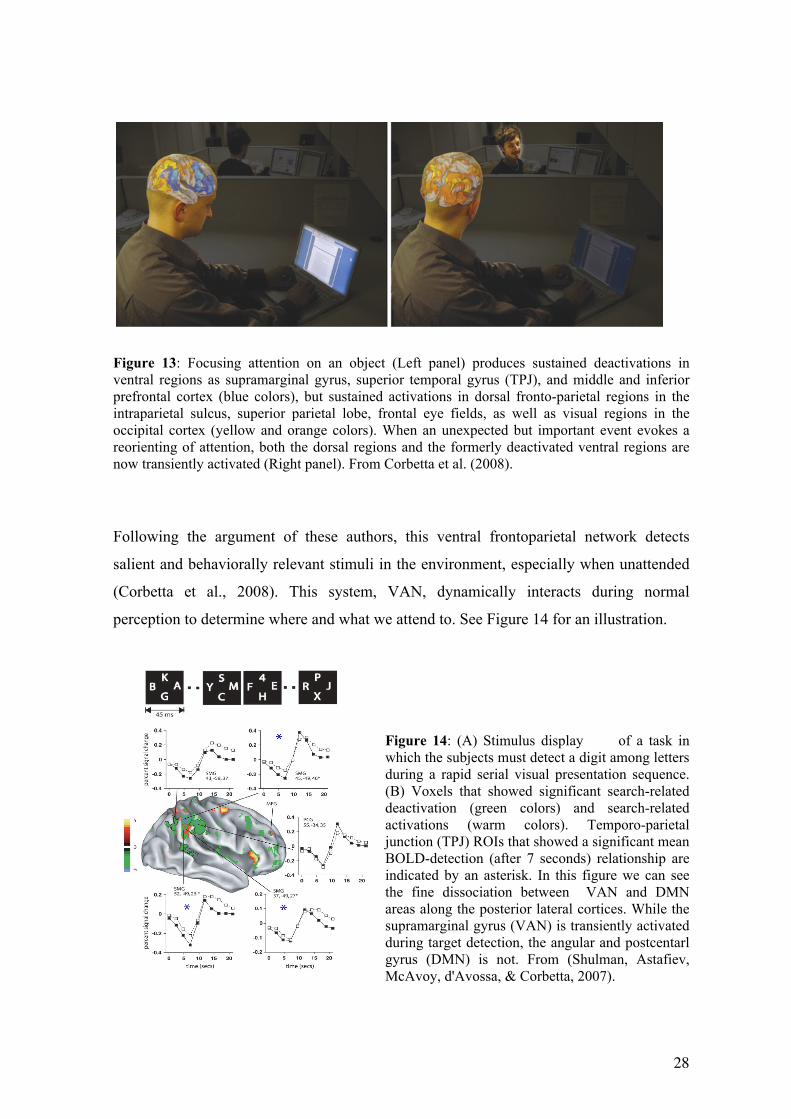
Figure 13: Focusing attention on an object (Left panel) produces sustained deactivations in ventral regions as supramarginal gyrus, superior temporal gyrus (TPJ), and middle and inferior prefrontal cortex (blue colors), but sustained activations in dorsal fronto-parietal regions in the intraparietal sulcus, superior parietal lobe, frontal eye fields, as well as visual regions in the occipital cortex (yellow and orange colors). When an unexpected but important event evokes a reorienting of attention, both the dorsal regions and the formerly deactivated ventral regions are now transiently activated (Right panel). From Corbetta et al. (2008).
Following the argument of these authors, this ventral frontoparietal network detects
salient and behaviorally relevant stimuli in the environment, especially when unattended
(Corbetta et al., 2008). This system, VAN, dynamically interacts during normal
perception to determine where and what we attend to. See Figure 14 for an illustration.
Figure 14: (A) Stimulus display of a task in which the subjects must detect a digit among letters during a rapid serial visual presentation sequence. (B) Voxels that showed significant search-related deactivation (green colors) and search-related activations (warm colors). Temporo-parietal junction (TPJ) ROIs that showed a significant mean BOLD-detection (after 7 seconds) relationship are indicated by an asterisk. In this figure we can see the fine dissociation between VAN and DMN areas along the posterior lateral cortices. While the supramarginal gyrus (VAN) is transiently activated during target detection, the angular and postcentarl gyrus (DMN) is not. From (Shulman, Astafiev, McAvoy, d'Avossa, & Corbetta, 2007).

29
1.3.2.d Rostral prefrontal cortex (BA 10, 47, 12)
The study of the functions of rostral prefrontal cortex presents one of the greatest
scientific puzzles to cognitive neuroscience (Burgess et al., 2007). An interesting
hypothesis, ‘the gateway hypothesis’, has been developed by Sam Gilbert and Paul
Burgess. According these authors, the rostral prefrontal (lateral and medial) cortex plays a
crucial role in the switch between stimulus-oriented and stimulus-independent thought.
Nevertheless, a key to this puzzle is the role of the ventral lateral prefrontal cortex
(VLPFC), which is unfortunately difficult to record with imaging techniques due to slow
signal-to-noise ratio (G. G. Brown & Eyler, 2006; Burdette, Durden, Elster, & Yen, 2001;
Robinson & Milanfar, 2004)7.
Finally, it would be good to emphasize that methodologically; most of the results
described above rely on human imaging and more specifically on fMRI. However,
because the BOLD response in fMRI is rather sluggish, clear-cut experimental separation
between RSNs and stimulus-induced activity changes can be difficult (Northoff, Qin, &
Nakao, 2010). Hence, techniques other than fMRI could be more suitable or RSNs
studies: for instance, the background noise in EEG or MEG recordings is not as extensive
as in fMRI. Finally, one can discuss the functional correlates of RSNs. Do high RSNs
merely reflect suspension of functional activity, or do they instead represent some
specific functions that are continuously operating in the background? This shall be the
main question developed in this dissertation.
7 The different physiological compartments of the head—brain, cerebrospinal fluid, bone, and air—are characterized by different magnetizabilities, i.e., by different magnetic susceptibilities (Elster & Burdette 2001). Boundaries involving the air and brain compartments, in particular, will be sites of broad magnetic field gradients that will offset the precessing frequency from the target frequency and dephase spins, reducing the MR signal. This dephasing causes signal dropout, especially in the orbitofrontal and anterior medial temporal regions, adjacent to nasal sinuses, or lateral temporal regions adjacent to the auditory canal. In all of these regions, the air-brain boundaries cause relatively strong magnetic gradients across large portions of the head. These strong magnetic gradients diminish in areas of signal dropout and greatly reduce the signal-to-noise ratio (Robinson et al., 2004; Brown & Eyler, 2006).

30

31
2. Neurophysiological basis of the fMRI signals
As we have seen in the first chapter, spontaneous slow fluctuations in the blood-oxygen-
level-dependence (BOLD) signals of fMRI appear to reflect a fundamental aspect of brain
organization (B. Biswal et al., 1995; He, Snyder, Zempel, Smyth, & Raichle, 2008;
Vincent et al., 2007). These fluctuations temporally covary within large-scale functional
brain networks, i.e. attention (M. D. Fox et al., 2006), sensorimotor (B. Biswal et al.,
1995) and DMN (B. B. Biswal et al., 2010; Castellanos et al., 2008; Greicius et al., 2003).
But, unlike the BOLD response, the electrophysiological correlate of these spontaneous
covariant BOLD fluctuations (or resting state networks, RSNs) is relatively unknown (He
et al., 2008; Laufs et al., 2003). Then, throughout this chapter we will try to answer the
following question: How might the integrative and signaling aspects of neuronal activity
individually contribute to the BOLD signal? Let us begin with a general overview of
brain imaging techniques.
2.1.a General overview
Brain imaging includes the use of various techniques to either directly or indirectly image
the brain and falls into two broad categories: structural imaging and functional imaging.
Structural imaging is used to measure brain volume or the volume of sub regions, or to
look at diffuse changes in grey or white matter or to assess localized lesions. Functional
imaging detects changes in regional cerebral blood flow or metabolism as an indirect
measure of neural activity. This can be used to map patterns of brain activity that
corresponds to various mental operations (Huettel, Song, & McCarthy, 2008).
Common techniques used for structural imaging are computed tomography (CT) or
magnetic resonance imaging (MRI). For functional brain imaging there are several
techniques; usually, the choice is based on weather high temporal versus high spatial
resolution is of main interest.

32
In contrast, the hemodynamic techniques, positron emission tomography (PET) and
functional magnetic resonance imaging (fMRI), measure neuronal activity indirectly
through the associated changes in metabolism or blood flow. They provide a relatively
high spatial resolution (1-10 mm) but rather low temporal resolution (hundreds of
milliseconds for fMRI, several seconds for PET), being limited by the rate of the much
slower homodynamic changes that accompany neuronal activation.
Figure 15: Spatio-temporal
resolution of the major brain imaging techniques. IEEG combines the temporal resolution of MEG and EEG with a spatial resolution close to that of fMRI and PET (from (Lachaux, Rudrauf, & Kahane, 2003a).
2.1.b Functional MRI:
fMRI detects changes in regional cerebral blood flow (rCBF) as an indirect measure of
neuronal activity. The basis for this inference is an assumption of a roughly linear
coupling between neural activity, metabolic activity, and rCBF (Logothetis, Pauls,
Augath, Trinath, & Oeltermann, 2001; Scannell & Young, 1999). In other words,
increases in neural activity in a given brain region will increase the energy consumption,
which in turns implies increased blood flow in order to supply the neurons with glucose
and oxygen. However, for unknown reasons, the increased supply of oxygenated blood
exceeds oxygen utilization (P. T. Fox & Raichle, 1986). As a consequence, the ratio of
oxygenated to deoxygenated blood will be higher than normal in areas of increased
metabolism. Oxygenated hemoglobin is diamagnetic (essentially nonmagnetic) whereas
deoxygenated hemoglobin is paramagnetic, meaning that deoxyhemoglobin disturbs the
33
applied magnetic field more than oxyhaemoglobin does. Thus, as a relative amount of
deoxyhemoglobin decreases in activated brain areas – due to disproportionate increases in
blood flow – the MR signal increases. This effect is termed the BOLD (blood-oxygen-
level-dependent) effect (Ogawa et al., 1992) and is the major source of contrast in most
fMRI experiments (Huettel et al., 2008).
The basis for the BOLD measures is an assumption of a roughly linear coupling between
neural activity and metabolic activity increases. However, one of the most controversial
details regarding this assumption is the temporal resolution; while the basic unit of neural
activity, action potential firing, occurs on the millisecond scale, the changes detected in
BOLD take place over seconds. But, as mentioned in Figure 15, electrophysiological
methods can provide near real-time temporal accuracy (on the millisecond scale) for the
recorded neuronal activity by measuring either the electric field change
(electroencephalography, EEG) or magnetic field change (magnetoencephalography,
MEG).
2.2 Electrophysiological correlates of BOLD, invasive studies
Few studies have directly compared electrophysiological and BOLD fMRI measurement
(Huettel et al., 2008). A seminal article that partially resolves this dilemma was published
a decade ago by Logotethis and colleagues (Logothetis et al., 2001). To study the neural
origin of the BOLD signal, the authors examined the degree of correlation of the
hemodynamic response to three types of electrophysiological activity: single units (firing
of an individual neuron close to the electrode), multi-unit (the collective firing rate of
neurons, in a few hundred microns), and local field potentials (LFP, synchronous charges
in integrative activity from cells within a few millimeters). The authors recorded
simultaneously the BOLD and the intracranial responses elicited by a visual stimulus in
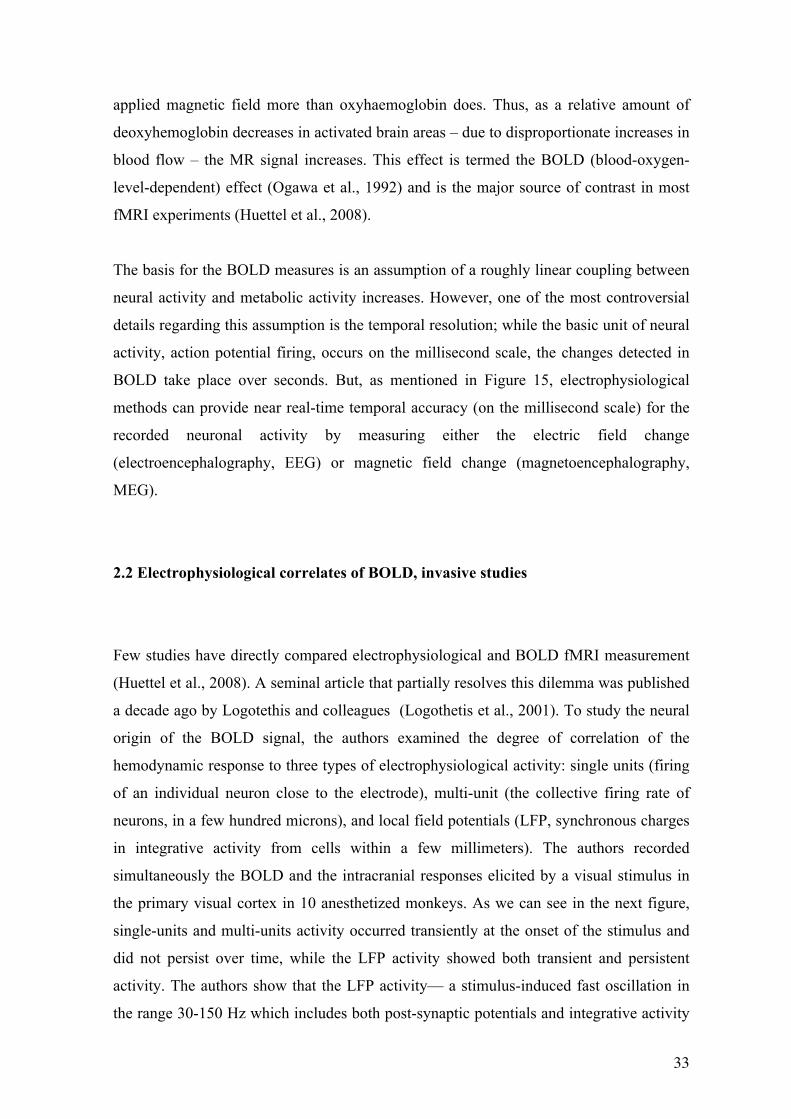
the primary visual cortex in 10 anesthetized monkeys. As we can see in the next figure,
single-units and multi-units activity occurred transiently at the onset of the stimulus and
did not persist over time, while the LFP activity showed both transient and persistent
activity. The authors show that the LFP activity— a stimulus-induced fast oscillation in
the range 30-150 Hz which includes both post-synaptic potentials and integrative activity
34
occurring at the soma— better predicted the BOLD signal change than the multi-unit (see
Figure 16).
Figure 16: The relationship between BOLD activation and neural activity. Simultaneous electrophysiological and fMRI data were recorded in monkeys during the presentation of visual stimuli. The time course of BOLD activation evoked by the visual stimulation is shown as a solid red histogram, while the time course of multi-units activity (MUA) is shown in green, the time course of single-unit is shown in blue, and the time course of local field potentials (LFP) is shown in black. The duration of visual stimulation, indicated by vertical black bars, varied from 24 to 12 to 4 s, shown in the top, middle and bottom panels, respectively. Note that the BOLD activation and the LFP activity are extended in time throughout stimulus presentation, while the single-and multi-units activities rapidly return to baseline. From Logothetis et al. (2001).
In summary, Logothetis et al. (2001) presents three principal findings: first, the BOLD
contrast mechanism directly reflects the neural response elicited by stimulus; second,
neural signals are characterized by considerably higher signal-to-noise ration than the
hemodynamic response; and finally, as the hemodynamic response seems to be better
correlated with the LFPs; then they would reflect the incoming input and the local
processing in a given area rather than the spiking activity (or output activity) (Logothetis
et al., 2001)(Logothetis et al, 2001). This result was reinforced by an article published in
2005 (Niessing et al., 2005), that shows a strong correlation between the BOLD and the
LFP in the gamma range (30_70 Hz) in cat visual cortex. This article adds the notion of
correlation between hemodynamic responses and neuronal synchronization.
In the same year, the group of Rafael Malach published for the first time the correlation
between the hemodynamic response and neural activity in the human cortex, thanks to a

35
very simple protocol: record single unit activity and LFP in auditory cortex of two
neurosurgical patients and compared them with the fMRI signals of 11 healthy subjects
during presentation of an identical movie segment (Mukamel et al., 2005). The spiking
activity of these neurons in each patient was summed and converted into a predicted
fMRI BOLD response (spike predictor) by convolution with a standard hemodynamic
response function. This measure was extremely correlated with the fMRI activity (r =
0.75). Thus, this work strengthens the idea that fMRI signals can provide a reliable
measure of the firing rate of human cortical neurons. In the next figure, we represent the
principal results of this work.
Figure 17: Correlation between the spike predictor with measured fMRI activation. fMRI BOLD activations in Helschl’s gyrus of each subjects were sampled by using the spike predictor of each patient (for this figure the patient 1). Bottom graph depicts the average measured BOLD activation of all subjects (orange traces).
Following with the same view, but using a method developed by Leopold (Leopold,
Murayama, & Logothetis, 2003), that consists principally in smooth the filtered LFP (a
new time in the gamma range) after a Hilbert transformation (see materials and methods
for a exhaustive explanation of this method), Nir and colleagues found that the coupling
between the gamma LFP and the BOLD fMRI is related to interneuronal correlations (Nir
et al., 2007). To end the idea of the close correlation between the BOLD fMRI and the
gamma-LFP we must mention a paper that has gone of our laboratory, that reveal a close
spatial correspondence between regions of fMRI activations and recording sites showing
EEG energy modulations in the gamma range (Lachaux, Fonlupt et al., 2007). In this
study were combined fMRI and intra-cranial EEG recordings of the same epileptic
patients during a semantic decision task. These and others results have led to a simple
conclusion: The BOLD contrast mechanism reflects primarily the input and
36
intracortical processing in a given area, that which we have characterized as the
integrative aspect of neuronal processing, rather than the output reflected in action
potential firing (Huettel et al., 2008).
2.3 Electrophysiological correlates of BOLD, non-invasive methods
Despite the great signal to noise ratio of the intra-cerebral electroencephalography (ICE),
this technique must be complemented in the study of the spontaneous slow fluctuations of
the resting state networks with non-invasive methods. As the principal objective of ICE is
to find the epileptic foci (the location in the brain where the seizures originate), the
electrodes normally are concentrated in a specific region, i.e. the temporal lobe. And as
we have said repeatedly, these networks are scattered in remote areas, i.e. the posterior
cingulated and the medial prefrontal cortex in the RSN 1, or DMN. For the same reason,
several groups have tried to find the electroencephalographic signatures of these brain
networks (Laufs et al., 2003; Mantini et al., 2007).
Before the description of the more relevant results found in this domain with scalp-EEG,
we need to emphasized two technical difficulties. First, as we have recently read, the best
candidate for neural correlate of BOLD-fMRI is the gamma-LFP, and several recent
articles have shown the difficulty of capturing high frequencies with this technique,
principally due to motors artifacts (Yuval-Greenberg, Tomer, Keren, Nelken, & Deouell,
2008). The second reason is topographic, in the DMN, for example, two of the core
regions, PCC and MPFC, are located in the central x-axe (in Tailarach coordinates).
Because voltage fields fall off with the square of the distance, activity from deep sources
is more difficult to detect than currents near the skull (Dandekar, Ales, Carney, & Klein,
2007).
An interesting work published in 2003 (Laufs et al., 2003) explores the neuroanatomical
patterns of resting state fluctuations of human brain activity by simultaneously applying
two neurophysiological techniques, the fMRI and the EEG (Laufs et al., 2003). The
principal findings of this work was found positive correlation between the BOLD signal
and a sub-group of the beta band (17-23 Hz) in several areas, namely the posterior
cingulated and the adjacent precuneus as well the temporo-parietal junction (TPJ) and
37
dorsal medial prefrontal cortex, the major brain regions of the DMN (Castellanos et al.,
2008; Greicius et al., 2003; Raichle et al., 2001). Unfortunately, the authors only analyzed
low frequencies (<30 Hz).
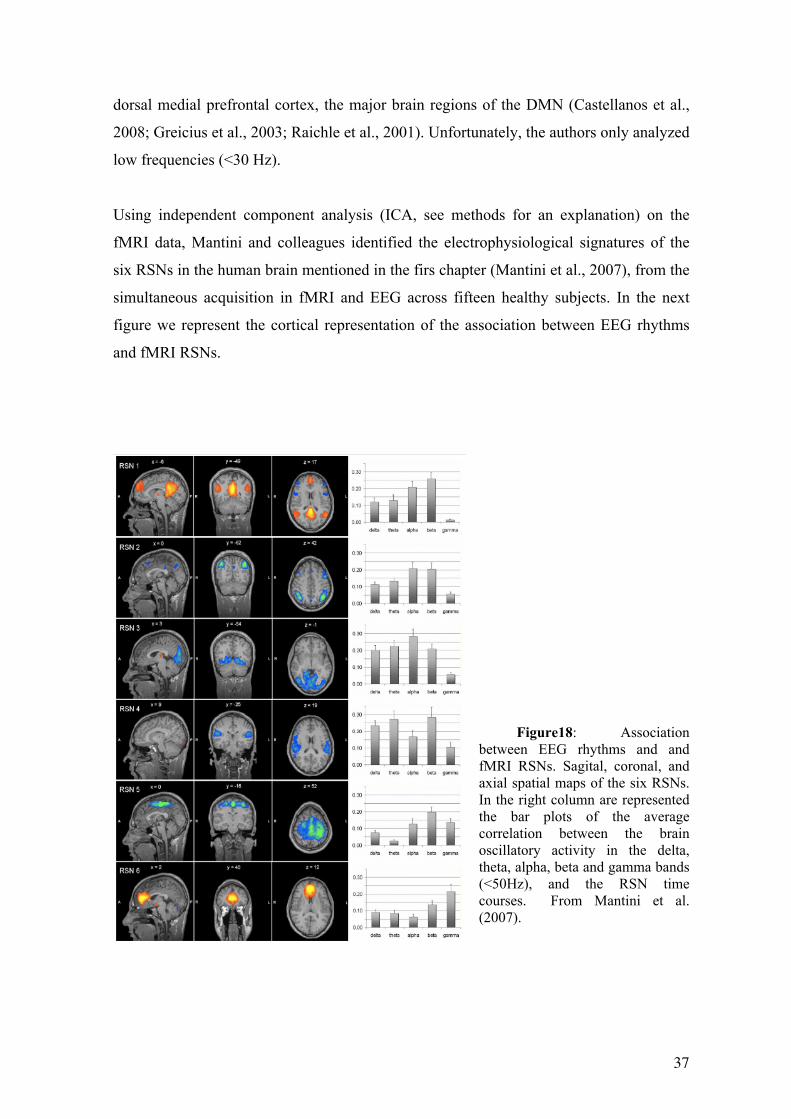
Using independent component analysis (ICA, see methods for an explanation) on the
fMRI data, Mantini and colleagues identified the electrophysiological signatures of the
six RSNs in the human brain mentioned in the firs chapter (Mantini et al., 2007), from the
simultaneous acquisition in fMRI and EEG across fifteen healthy subjects. In the next
figure we represent the cortical representation of the association between EEG rhythms
and fMRI RSNs.
Figure18: Association
between EEG rhythms and and fMRI RSNs. Sagital, coronal, and axial spatial maps of the six RSNs. In the right column are represented the bar plots of the average correlation between the brain oscillatory activity in the delta, theta, alpha, beta and gamma bands (<50Hz), and the RSN time courses. From Mantini et al. (2007).

38
We must not forget that the main objective in this thesis was to find the neural correlate
of the default mode network, and as mentioned in the first chapter, one of the principal
characteristics of this network is that it shows task non-specific deactivations during goal-
directed activity. In the same way, the logical question that follows is: such us the
neuronal correlate of a BOLD fMRI activation is the gamma-LFP activity, will be the
gamma-LFP deactivation the neuronal correlate of the BOLD deactivation?
2.4 Electrophysiological correlate of BOLD deactivation To date, the origin of the BOLD deactivation (or negative BOLD response, NBR)
remains controversial. The first article that focuses this issue was publish by Amir
Shmuel and collaborators in 2006 (Shmuel, Augath, Oeltermann, & Logothetis, 2006). To
address this question, the authors applied electrical recordings simultaneously with fMRI
in anesthetized macaque monkeys. As we can see in the next figure, the negative BOLD
response beyond the stimulated regions of visual cerebral area V1 was found to be
associated with-and couple to-decreases in neuronal activity below spontaneous baseline
activity (Shmuel et al., 2006).
Figure 19: BOLD response to stimulation of part of the visual field. (a,b) Patterns of response to central (3.5°-6.1°) and peripheral (8.5°-14.7°) visual field stimulus. One oblique anatomical slice is shown, whit the fMRI response superimposed on it. Green arrows represent the location of the recording electrode within visual area V1. We can observe activation in both measures, LFP and BOLD, when the visual field stimulus is central (c). In contrast, when the stimulus is peripheral, both measures show a deactivation (we can observe a BOLD activation in central V1 in this condition). From Shmuel et al, 2006.
39
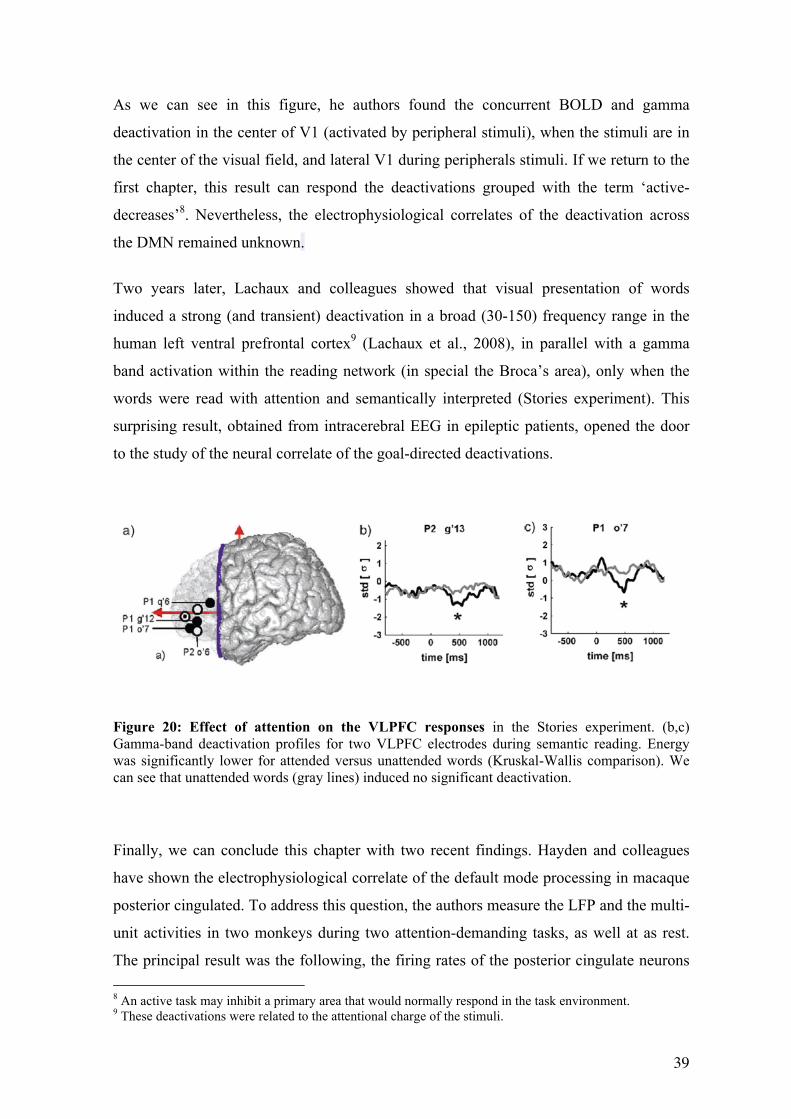
As we can see in this figure, he authors found the concurrent BOLD and gamma
deactivation in the center of V1 (activated by peripheral stimuli), when the stimuli are in
the center of the visual field, and lateral V1 during peripherals stimuli. If we return to the
first chapter, this result can respond the deactivations grouped with the term ‘active-
decreases’8. Nevertheless, the electrophysiological correlates of the deactivation across
the DMN remained unknown.
Two years later, Lachaux and colleagues showed that visual presentation of words
induced a strong (and transient) deactivation in a broad (30-150) frequency range in the
human left ventral prefrontal cortex9 (Lachaux et al., 2008), in parallel with a gamma
band activation within the reading network (in special the Broca’s area), only when the
words were read with attention and semantically interpreted (Stories experiment). This
surprising result, obtained from intracerebral EEG in epileptic patients, opened the door
to the study of the neural correlate of the goal-directed deactivations.
Figure 20: Effect of attention on the VLPFC responses in the Stories experiment. (b,c) Gamma-band deactivation profiles for two VLPFC electrodes during semantic reading. Energy was significantly lower for attended versus unattended words (Kruskal-Wallis comparison). We can see that unattended words (gray lines) induced no significant deactivation.
Finally, we can conclude this chapter with two recent findings. Hayden and colleagues
have shown the electrophysiological correlate of the default mode processing in macaque
posterior cingulated. To address this question, the authors measure the LFP and the multi-
unit activities in two monkeys during two attention-demanding tasks, as well at as rest.
The principal result was the following, the firing rates of the posterior cingulate neurons 8 An active task may inhibit a primary area that would normally respond in the task environment. 9 These deactivations were related to the attentional charge of the stimuli.

40
(CGp) were elevated at rest and suppressed during task performance (also the LFP in the
gamma range, see figure 21), and the spontaneous firing rates predicted behavioral
indices of task engagement on a trial-by-trial basis- whit higher rates associated with
poorer performance (Hayden, Smith, & Platt, 2009).
Figure 21: Attentive vigilance suppresses activity of CGp neurons. (a) Peristimulus histograms show average firing rates of single cGp neurons during attentive task (blue line), working memory task (red line) and no task condition (black line). Responses are aligned to cue fixation. (b) Differential power spectra of LFPs for attentive task minus control condition. Power in the gamma band was suppressed relative to ITI, whereas power in lower frequency bands was enhanced. (c) Neuronal activity in CGp covaries with exteroceptive vigilance. Bar graph showing average normalized firing rate of a single example of CGp neurons. From Hayden et al, 2009.
In the same year Miller and colleagues address the same question, to find the neural
correlate of the DMN (Miller, Weaver, & Ojemann, 2009). In difference to Hayden,
these authors performed a set of task in three epileptic patients, implanted with
intracerebral EEG by medical reasons. Miller shows that amplitude in the very high
gamma band frequency (70-200 Hz) drops, respect to the rest, in some electrodes placed
in the DMN (in PCC and MPFC) in a visual target detection task.
Summarizing, we have today a set of different studies that point to the same address. The
best neural candidate that correlates with BOLD deactivation is a broadband
suppression in the gamma-band power (Karim Jerbi et al., 2010).
41
3. Attention and electrophysiology10
Attention has been arguably one of the main topics of interest of cognitive neuroscience
for the last thirty years, especially since the recent boom of functional neuroimaging.
The progress of Positron Emission Tomography (PET) and, in special, the functional
Magnetic Resonance Imaging (fMRI), has led to a precise delineation of the major
neural networks underlying the various types of attention in the human brain (Corbetta
& Shulman, 2002a; Corbetta et al., 2008; Kanwisher & Wojciulik, 2000b). Yet, our
understanding of the precise neural mechanisms underlying attention within those
networks is still fragmentary, mainly because the same imaging techniques used to
describe the functional organization of the human brain, fMRI and PET, measure only
metabolic changes induced by neural activity, with low temporal resolution, and not the
actual, fast-changing, behavior of the neural networks themselves. Electro and Magneto-
encephalography (EEG and MEG) have been used to record this behavior in humans,
however, those techniques measure the average activity of hundreds of millions of
neurons and do not possess the spatial precision to required to access the fine neural
mechanisms of attention. To date, the only data sufficiently precise to reveal those
mechanisms have been obtained in animals, with invasive intracranial micro-electrodes
recording from groups of individual neurons.
Recent animal studies have revealed a mechanism for attention based on neural
synchronization (Fries, Reynolds, Rorie, & Desimone, 2001; Steinmetz et al., 2000).
The purpose of this chapter is to introduce this mechanism and discuss its validity in
humans, based on results obtained in patients with intracerebral EEG electrodes, at a
level of precision intermediate between animal micro-electrodes studies and traditional
human non invasive recordings. We will support the view that this neural mechanism of
synchronization and desynchronization may indeed be widely at play during attentional
processes in the human brain (K. Jerbi et al., 2009; Lachaux & Ossandon, 2008).
Finally, we explain why we chose a visual search task for to investigate the role of
broadband gamma modulations in the interplay between activation and
deactivation networks mediating efficient goal-directed behavior.
10 It is needless to say that this chapter is an adaptation of a book-chapter published in 2009 (Lachaux and Ossandón, 2009).

42
3.1 Mechanisms of selective visual attention Most of what we know about the neural mechanisms underlying attentional selection
has been learned from experiments manipulating space-based visual attention in awake
behaving monkeys, with micro-electrode recordings from the visual cortex (J. Moran &
Desimone, 1985). In such experimental set-ups, experimenters can record the activity of
neurons stimulated by visual items presented in their receptive field, and compare this
activity when the animal allocates or not attention to that spatial location. Results
converge to show that attention acts as a contrast gain control mechanism used to
increase the firing rate of neurons whose receptive field is being attended, exactly as if
the contrast of the attended object had been increased (Reynolds & Chelazzi, 2004).
This mechanism is particularly effective when the animal is confronted with two stimuli
shown at different locations, in which case the neural response to the attended stimulus
is enhanced relative to the unattended stimulus, hence the attentional selection. This
mechanism has now been well-established and observed directly throughout the visual
system (reviewed in Reynolds & Chelazzi, 2004). This effect is in fact so strong that it
can be measured in humans at the scalp surface with electroencephalography (EEG), as
visual stimuli generate a stronger evoked-potential over the visual cortex when they
appear within the scope of visual attention (Mangun, Buonocore, Girelli, & Jha, 1998).
This relatively simple and elegant mechanism seemed perfectly adequate and somewhat
sufficient to explain the mechanism of attention, at least in sensory cortices. This
situation lasted until two puzzling studies found evidence for a complementary
mechanism: Steinmetz et al. (Steinmetz et al., 2000) in the somatosensory cortex, and
Fries et al (Fries et al., 2001) in the visual cortex of awake behaving monkeys, reported
a phenomenon of synchronization linking together in a transient manner, those neurons
responding to attended stimuli. As we will see in the forthcoming section, those results,
however surprising at first, had in fact been anticipated. To understand why, we will
now briefly review some important research on neural synchronization indicating that
this phenomenon may be a cornerstone of neural processing.

43
We cannot follow in this discussion without make ah historical parenthesis about
attention. The classic work of Anne Treisman ‘A Feature-Integration Theory of
Attention’(A. M. Treisman & Gelade, 1980) begins with the following problem: ‘when
we open our eyes on a familiar scene, we form an immediate impression of recognizable
objects, organized coherently in a spatial framework. Analysis of our experience into
more elementary sensations is difficult, and appears subjectively to require an unusual
type of perceptual activity. In contrast, the physiological evidence suggests that the
visual scene is analyzed at an early stage by specialized populations of receptors that
respond selectively to such properties as orientation, color, spatial frequency, or
movement, and map these properties in different areas of the brain’. This remark
introduces the necessity for a mechanism to integrate, or bind together, those elementary
responses to form a unified coherent representation of the perceived object. This
mechanism is now referred to as the ‘visual binding mechanism’.
In most of their studies, Treisman and colleagues have investigated visual processes
with a simple paradigm called Visual Search, which precisely highlights the need for,
and properties of, a visual binding mechanism. In the Visual Search paradigm,
participants are presented with arrays of objects and are asked to find as quickly as
possible one of them, different from the others along individual features, such as color
or shape, or defined as a unique combination of such features. This defines a situation
very similar to, for instance, looking for a particular face in a crowd, of for a pair of
socks in a drawer. Figure 22 illustrates this paradigm: in the left panel, participants are
asked to find the item shown on top, which happens to be the only one with a red circle;
in the right panel, however, finding the same item requires more effort, because the
specificity of the target item now relies in a precise spatial arrangement of colors. In the
same way, finding a red pair of socks becomes difficult when we have many red socks,
as other factors, such as length or shape must be taken into account simultaneously.
Psychophysics experiments have confirmed this, the visual search of basic features
(such as colour, size, motion and orientation), as in the left panel, occur in a single step
and in parallel way across most of (or all) the visual field: that is, the duration of the
search, quantified by the reaction times (RTs) of participants, is independent of the
number of items displayed (Wolfe, 2003). On the other hand, search for a particular
combination of features, as in the right panel, (the target is the only configuration of its
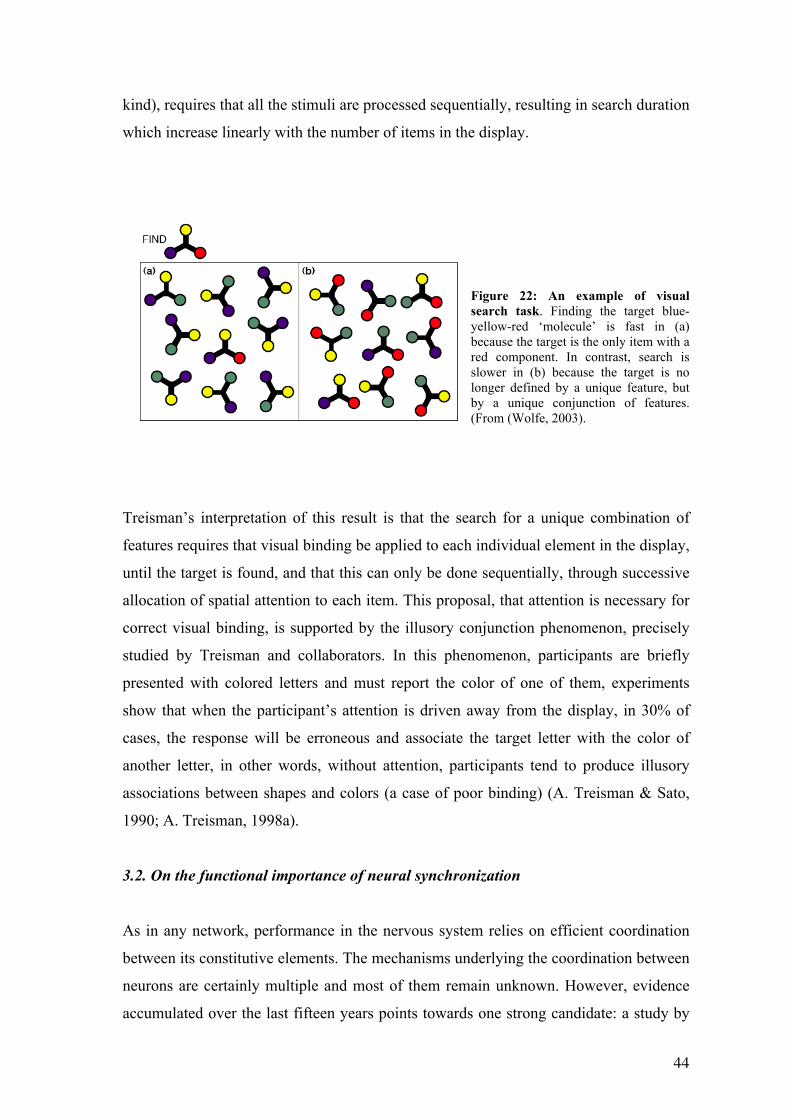
44
kind), requires that all the stimuli are processed sequentially, resulting in search duration
which increase linearly with the number of items in the display.
Figure 22: An example of visual search task. Finding the target blue-yellow-red ‘molecule’ is fast in (a) because the target is the only item with a red component. In contrast, search is slower in (b) because the target is no longer defined by a unique feature, but by a unique conjunction of features. (From (Wolfe, 2003).
Treisman’s interpretation of this result is that the search for a unique combination of
features requires that visual binding be applied to each individual element in the display,
until the target is found, and that this can only be done sequentially, through successive
allocation of spatial attention to each item. This proposal, that attention is necessary for
correct visual binding, is supported by the illusory conjunction phenomenon, precisely
studied by Treisman and collaborators. In this phenomenon, participants are briefly
presented with colored letters and must report the color of one of them, experiments
show that when the participant’s attention is driven away from the display, in 30% of
cases, the response will be erroneous and associate the target letter with the color of
another letter, in other words, without attention, participants tend to produce illusory
associations between shapes and colors (a case of poor binding) (A. Treisman & Sato,
1990; A. Treisman, 1998a).
3.2. On the functional importance of neural synchronization
As in any network, performance in the nervous system relies on efficient coordination
between its constitutive elements. The mechanisms underlying the coordination between
neurons are certainly multiple and most of them remain unknown. However, evidence
accumulated over the last fifteen years points towards one strong candidate: a study by

45
Gray and Singer (Gray, Konig, Engel, & Singer, 1989) in the primary visual cortex of
anesthetized cats showed that neurons had a tendency to fire rhythmically and
synchronously at a frequency around 40 Hz (called gamma band) when stimulated by a
single coherent moving object; in contrast, they would fire independently of each other
when stimulated by multiple, unrelated, visual stimuli. This mechanism allowed for the
creation of transient ‘resonant’ cell assemblies (F. J. Varela, 1995), characterized by
synchronous gamma band rhythmic activities, binding together the multiple neural
responses to each portion of contour of complex geometrical shapes.
Because of this property, gamma band synchronization was first proposed as a solution
to the visual ‘binding problem’. The binding problem refers to the problem of how
visual objects are ‘represented’ within the visual system (Roskies, 1999). As we know,
visual objects are essentially collections of visual features distributed in space (shapes,
colors, etc.), which activate selective, specific, but large and widespread populations of
neurons throughout the visual system. When, as in most visual scenes, the visual system
is confronted with several, possibly overlapping, objects; a visual binding mechanism is
necessary to mark neural activities triggered by the same object and enable scene
segmentation, object identification and proper behavior. Because it could be used to
create labile neural assemblies, that is, to establish transient relationships between
neurons, the synchronization mechanism observed by Gray and Singer was quickly
proclaimed as a possible solution to the binding problem (Engel, Roelfsema, Fries,
Brecht, & Singer, 1997).
Interestingly, this hypothesis established a strong link between gamma band synchrony
and visual attention, because of previous work by Treisman, among others, showing the
importance of attention for binding (A. Treisman, 1996, 1998b). Treisman referred to an
effect called ‘illusory conjunction’, which can be described as a failure to bind together
the shape and color of an object presented outside the attentional focus: this situation
occurs experimentally when participants are instructed to focus their attention on the
periphery of a computer screen (while fixating on its center), before colored letters are
flashed in the center (say, a red O and a blue X). When asked to report what they have
seen, participants often report false associations (or ‘illusory conjunctions’) between
shape and color (a blue O and a red X). This phenomenon illustrated the existence of a
visual binding mechanism, its occasional failure, and its dependence on attention. The
46
necessity of attention for visual binding was also demonstrated by visual search
experiments in which participants were asked to search for a specific item embedded in
an array of distractors. As I will describe in the method’s chapter, I used during my
thesis an adaptation of a Treisman’s task.
In short, visual binding has been shown to require visual attention. Considering the
stream of results initiated by the Singer group, this was enough to build a strong case for
a tight connection between attention and gamma band synchrony, one facilitating the
other or vice-versa. From a theoretical point of view, neural synchronization also
provided an interesting property for attentional selection, in the context of the classic
hierarchical model of the visual system. In this model, neurons in early visual areas,
such as V1, V2 or V4 project to and activate neurons in higher order visual areas such as
the infero-temporal cortex. In this framework, attention facilitation is thought as a
mechanism which facilitates the propagation of neural activity, from early to late visual
areas within neurons responding to the attended stimulus. Synchrony among neurons
responding to the attended object at a given level of the hierarchy would produce the
strongest possible impact on neurons responding to the same object at the next level,
because the latter would receive simultaneous spikes whose effects add up
constructively, as already proposed by others (Fries et al., 2001). Reciprocally, the
activity of neurons responding to unattended objects would not propagate so effectively
across the hierarchy because they are not synchronous.
For all the previous reasons, the notion that gamma band synchrony and attention were
somehow related was ‘in the air’ even before the two studies mentioned above (Fries et
al., 2001; Steinmetz et al., 2000) were published. What was still missing was clear
evidence at the neural level.
The first study (Steinmetz et al., 2000) measured the effect in the somatosensory cortex
of a shift of attention between the somatosensory and visual modalities. Shifting
attention towards somatosensory stimuli produced a clear synchrony increase in the
gamma band among neurons of the corresponding sensory cortex, while shifting
attention towards visual stimuli had, among those neurons, the opposite effect. In the
second study, Fries et al. (Fries et al., 2001) recorded neurons from V4 in monkeys
attending to one of two visual stimuli. The effect of attention was also an increase in
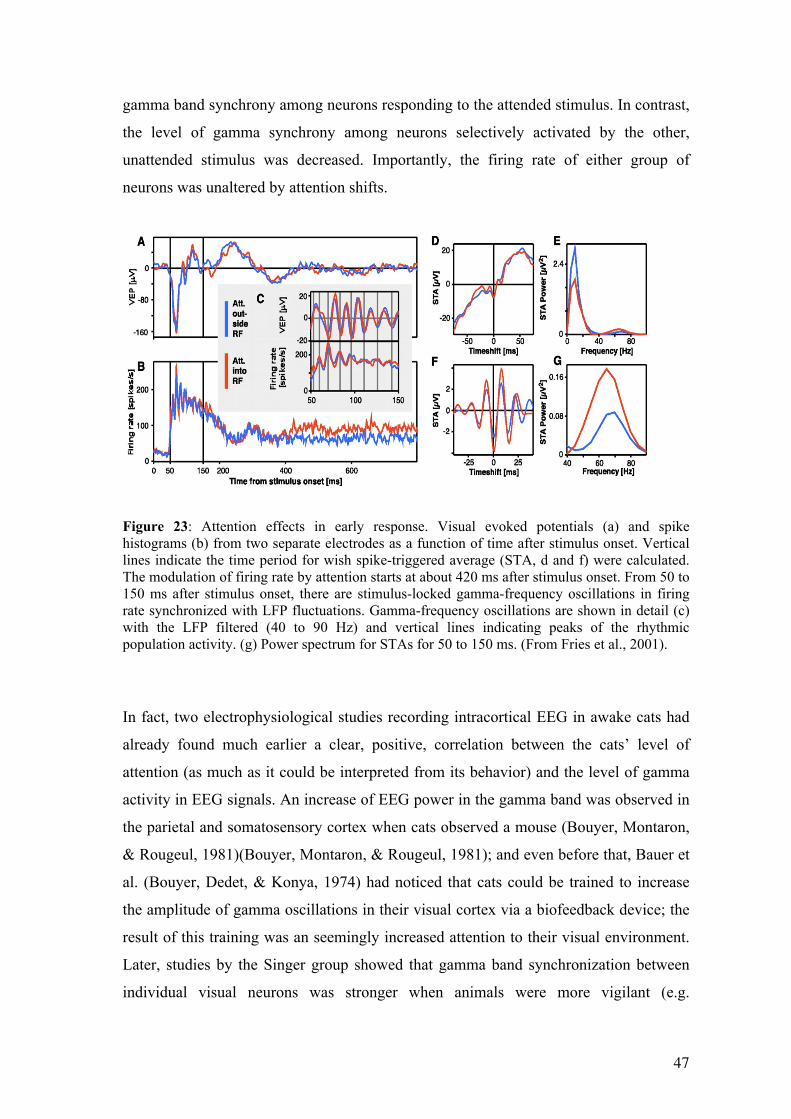
47
gamma band synchrony among neurons responding to the attended stimulus. In contrast,
the level of gamma synchrony among neurons selectively activated by the other,
unattended stimulus was decreased. Importantly, the firing rate of either group of
neurons was unaltered by attention shifts.
Figure 23: Attention effects in early response. Visual evoked potentials (a) and spike histograms (b) from two separate electrodes as a function of time after stimulus onset. Vertical lines indicate the time period for wish spike-triggered average (STA, d and f) were calculated. The modulation of firing rate by attention starts at about 420 ms after stimulus onset. From 50 to 150 ms after stimulus onset, there are stimulus-locked gamma-frequency oscillations in firing rate synchronized with LFP fluctuations. Gamma-frequency oscillations are shown in detail (c) with the LFP filtered (40 to 90 Hz) and vertical lines indicating peaks of the rhythmic population activity. (g) Power spectrum for STAs for 50 to 150 ms. (From Fries et al., 2001). In fact, two electrophysiological studies recording intracortical EEG in awake cats had
already found much earlier a clear, positive, correlation between the cats’ level of
attention (as much as it could be interpreted from its behavior) and the level of gamma
activity in EEG signals. An increase of EEG power in the gamma band was observed in
the parietal and somatosensory cortex when cats observed a mouse (Bouyer, Montaron,
& Rougeul, 1981)(Bouyer, Montaron, & Rougeul, 1981); and even before that, Bauer et
al. (Bouyer, Dedet, & Konya, 1974) had noticed that cats could be trained to increase
the amplitude of gamma oscillations in their visual cortex via a biofeedback device; the
result of this training was an seemingly increased attention to their visual environment.
Later, studies by the Singer group showed that gamma band synchronization between
individual visual neurons was stronger when animals were more vigilant (e.g.
48
(Herculano-Houzel, Munk, Neuenschwander, & Singer, 1999). Further, an experiment
by the same group established a strong link between gamma synchronization and visual
awareness (Fries, Roelfsema, Engel, Konig, & Singer, 1997). The study was done in
amblyopic cats, stimulated with two simultaneous, contradictory, visual stimuli.
Because the cats were amblyopic, and because of the experimental design, cats would
perceive at every moment only one of the two stimuli, with a spontaneous alternance
between the two. Fries and col. were able to record from a group of neurons responding
selectively to one of the two patterns possibly perceived and found an increase of
synchrony within this group when the corresponding pattern was actually perceived by
the animals.
Those two studies (Fries et al., 2001; Steinmetz et al., 2000) were in agreement with a
very active research stream confirming the generality of the synchronization mechanism
in a variety of animal species anesthetized or awake. Their particular merit has been to
establish more specifically the link with selective attention, and the fact that gamma
synchronization could bias competition between sensory stimuli. Since those two
studies, several new experiments in awake behaving monkeys have further supported
that same mechanism (Bichot, Rossi, & Desimone, 2005; Bichot & Desimone, 2006;
Taylor, Mandon, Freiwald, & Kreiter, 2005), and it has even been shown that high
levels of synchrony in the gamma band before the stimulus onset are predictive of faster
reaction times when monkeys have to respond as fast as possible to the stimulus
presentation (Womelsdorf, Fries, Mitra, & Desimone, 2006). This is especially
interesting since a shorter reaction time is one of the psychophysical effects defining a
high level of attention at the behavioral level (Fan, McCandliss, Fossella, Flombaum, &
Posner, 2005). In summary, the manipulation of synchrony to implement attentional bias
seems now like a plausible mechanism to complement the gain control mechanism
based on firing rate modulation (Jensen, Kaiser, & Lachaux, 2007). As we have seen,
even if gamma oscillation does not solve the issue of binding, oscillations in the gamma-
frequency range remain a compelling timing/selection mechanism for neuronal
communication (Buzsaki, 2006).

49
3.3. Humans studies on neural synchronization
The existence of large-scale oscillations in the human brain was discovered in the late
20’s, as soon as it became possible to record human EEG by Hans Berger (Berger,
1929). It became soon evident that the electrophysiological activity of the human brain,
revealed by EEG, was the sum of slow and fast oscillations, ranging approximately, in
the waking state, from the delta band (1 to 4 Hz), the theta band (4 to 7 Hz), the alpha
band (7 to 14 Hz), the beta band (15 to 30 Hz) and the gamma band (above 30 Hz).
Early writers (Adrian, 1941; Berger, 1929) quickly formulated the hypothesis that each
frequency band was associated with distinct functional and behavioral correlates, and
was the result of synchronization mechanisms between neurons at different spatial
scales. But more than seventy years after their discovery, the precise functional role of
those oscillations had remained elusive, mainly because their precise understanding
required the conjunction of mathematical tools and computer power which has become
available only recently.
In the late 90’s, the progressive accumulation of evidence of neural synchronization in
animals motivated the search for a similar phenomenon in humans, with the current
technology to record electrophysiological activity in people, that is scalp EEG.
Considering the large differences in spatial resolution between the recording techniques
used in humans and animals, the objective was obviously not to observe neural
synchronization directly, but to find modulations of the EEG signal, triggered by
cognitive tasks, compatible with the effects likely to occur when synchronization
emerges within the large populations of neurons producing EEG signals. As we know,
with very few exceptions, human electrophysiological recordings do not record the
activity of individual neurons. They rather record the average activity of hundreds of
millions of them, usually from the scalp surface with scalp EEG electrodes. Still, there is
a suspected relationship between neural synchronization in the gamma range and energy
modulations in the same frequency range in EEG signals: when a group of neurons
establishes synchronization around 40 Hz, an EEG electrode recording the average
activity of that population should detect a transient oscillation at the same frequency.
Such oscillations can be detected with the application of time frequency analysis
techniques to EEG signals. These analyses belong to a family of mathematical
transforms which can measure the instantaneous variations of the power spectrum of a

50
signal. Since the mid 1990’s, a variety of techniques, more or less equivalent, have been
used for this purpose, such as the Morlet wavelet decomposition, Wigner Transform,
Short-Term Fourier analysis and the Matching Pursuit.
At the end of last century, fueled by the progress of computers and mathematical
analysis, several groups started to look for gamma oscillations, and for their relation to
cognition in humans, using scalp EEG (e.g. (Gruber, Muller, Keil, & Elbert, 1999;
Rodriguez et al., 1999; TallonBaudry, Bertrand, Delpuech, & Pernier, 1997). Over the
last ten years, human and animal research developed mostly in parallel, to study the
mechanisms and functional role of gamma synchronization at two very different spatial
scales. Human studies have investigated complex cognitive functions sometimes unique
to humans, while animal studies have used much simpler functions, but with
incomparably higher spatial resolution.
3.4 Gamma band responses in humans
Since their beginning, the principle of EEG studies on gamma oscillations has remained
the same: to evaluate statistically the probability that a cognitive, or motor, event is
associated with an increase in gamma band power in the EEG. This involves
reproducing the same event many times, for instance the perception of a face in a
complex image, and performing statistical analysis on the EEG signals recorded after
such events (TallonBaudry et al., 1997). Take the example of a study designed to test
whether the perception of a face, embedded in a complex visual stimulus, is associated
with gamma band energy increase in the EEG: in such a design, the experimenter shows
the subject a series of one hundred pictures (or more), and records the EEG signal in
response to each image. The pictures are designed in such as way that the face is hard to
detect, so that the experimenter can compare the EEG response when a face is actually
detected and when it is not. Time-frequency analysis of each of the hundred EEG
signals, for each picture presentation, provides a measure of the EEG spectral energy, at
each frequency band, from say 1 to 200 Hz, as a function of the time elapsed since the
stimulus was shown. For each time and frequency, it is then possible to compare
statistically the hundred energy values measured for each stimulus presentation, with the
hundred energy values measured at the same frequency before stimulus presentation
(during what is called the baseline level, that is in the absence of the cognitive event of
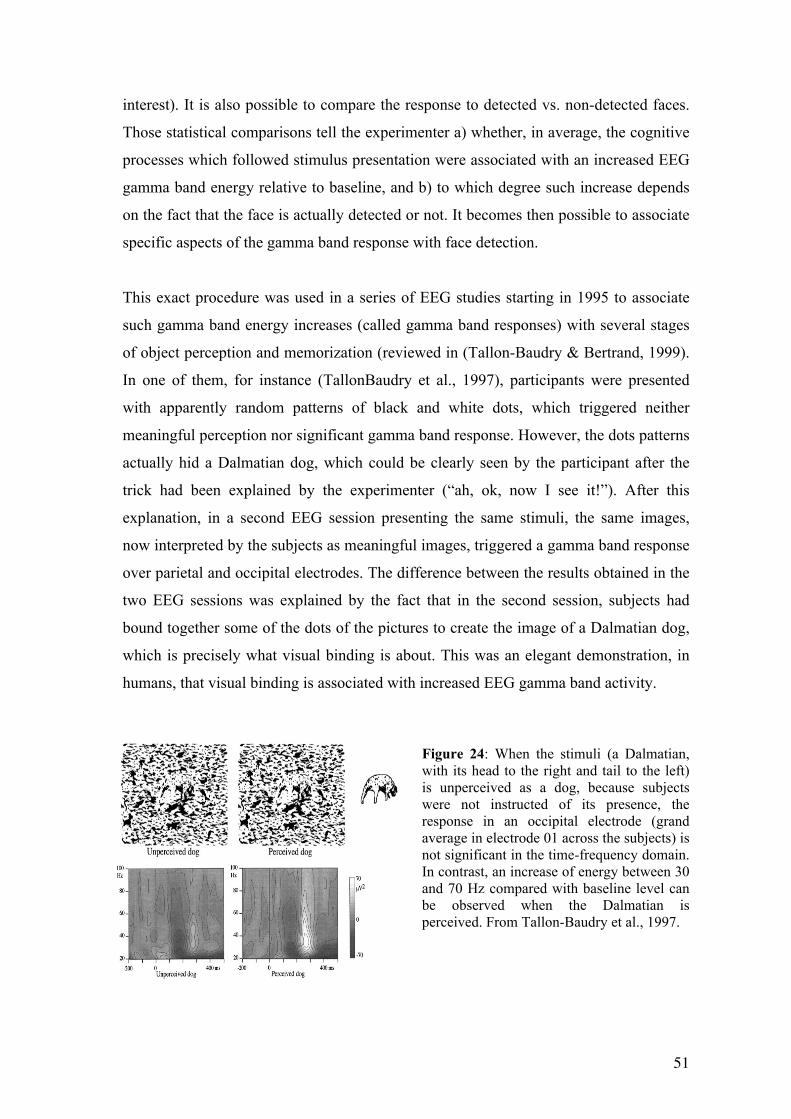
51
interest). It is also possible to compare the response to detected vs. non-detected faces.
Those statistical comparisons tell the experimenter a) whether, in average, the cognitive
processes which followed stimulus presentation were associated with an increased EEG
gamma band energy relative to baseline, and b) to which degree such increase depends
on the fact that the face is actually detected or not. It becomes then possible to associate
specific aspects of the gamma band response with face detection.
This exact procedure was used in a series of EEG studies starting in 1995 to associate
such gamma band energy increases (called gamma band responses) with several stages
of object perception and memorization (reviewed in (Tallon-Baudry & Bertrand, 1999).
In one of them, for instance (TallonBaudry et al., 1997), participants were presented
with apparently random patterns of black and white dots, which triggered neither
meaningful perception nor significant gamma band response. However, the dots patterns
actually hid a Dalmatian dog, which could be clearly seen by the participant after the
trick had been explained by the experimenter (“ah, ok, now I see it!”). After this
explanation, in a second EEG session presenting the same stimuli, the same images,
now interpreted by the subjects as meaningful images, triggered a gamma band response
over parietal and occipital electrodes. The difference between the results obtained in the
two EEG sessions was explained by the fact that in the second session, subjects had
bound together some of the dots of the pictures to create the image of a Dalmatian dog,
which is precisely what visual binding is about. This was an elegant demonstration, in
humans, that visual binding is associated with increased EEG gamma band activity.
Figure 24: When the stimuli (a Dalmatian, with its head to the right and tail to the left) is unperceived as a dog, because subjects were not instructed of its presence, the response in an occipital electrode (grand average in electrode 01 across the subjects) is not significant in the time-frequency domain. In contrast, an increase of energy between 30 and 70 Hz compared with baseline level can be observed when the Dalmatian is perceived. From Tallon-Baudry et al., 1997.

52
The same procedure was then used to show EEG gamma band energy increases
associated with very diverse cognitive or motor events, including language, memory,
and their modulation by attention. Of particular interest for our present topic, several
studies showed that EEG gamma band responses were modulated by attention, and
always stronger for stimuli attended by the subjects (Gruber et al., 1999; Muller, Gruber,
& Keil, 2000), in line with animal data on neural synchronization.
3.4.1. Eye-movements artifacts
Artifectual scalp muscle activity and electromagnetic interference in the high gamma
frequency range have further complicated studies with MEG and EEG. Indeed, a recent
study may introduce some additional concerns; Yuval-Greenberg and colleagues (2008)
showed that during a visual EEG experiment, broadband gamma activity might appear
to arise from occipital regions when in fact they are direct manifestations of mini-
saccade transients. These authors show that an ocular myoelectric signal, the saccadic
spike potential, can be seriously confounded previous EEG studies of induced gamma-
band responses (iGBRs) (Yuval-Greenberg et al., 2008; Yuval-Greenberg & Deouell,
2009). The temporal and frequential characteristics of this phenomena, a peak between
150 and 350 ms with a frequency band of 20–90 Hz, has opened a prolific discussion in
the interpretation of GBRs measured in sclap-EEG (Yuval-Greenberg et al., 2008;
Yuval-Greenberg & Deouell, 2009). It is unclear if this phenomenon extends to MEG,
since it may be a consequence of EEG reference electrode placement.
3.5 Intracerebral EEG studies in humans
In very recent years, starting around 2000, research on gamma band synchronization in
humans was considerably boosted by new studies using high-resolution intracerebral
EEG (‘ICE’) recordings in humans. Conventional—non invasive—EEG, using
electrodes placed on the scalp surface, suffers from some limitations due to weak spatial
resolution. In particular, the precise anatomical sources of the effects measured on the
scalp surface are unknown, and several distant sources can combine to produce an effect
visible at the surface. Also, the neural phenomena observed in scalp EEG in the gamma
band are measured at a spatial scale so different from neuron-to-neuron synchronization,
53
as observed in animal’s micro-recordings, that it is not clear how, or even whether, the
two are related. In addition, EEG signals are often contaminated by electromyographic
activity, mainly from neck and face muscles which produce a strong signal component
above 20 Hz. For this reason, the ratio between true gamma band activity of cerebral
origin and this noise is often quite low, which complicated the detection of task-induced
gamma band synchrony in scalp EEG.
3.5.1 Invasive recordings in epileptic patients
For this reason, several groups initiated collaborations with clinical groups specialized
in the treatment of severe epilepsy, to study brain oscillations in humans with invasive,
ICE electrodes. Recordings were performed in patients suffering from drug resistant
epilepsy, where the only efficient therapy is the surgical resection of brain tissues
critically involved in the generation of epileptic seizures. This complex procedure
requires in most cases a careful identification of the epileptogenic cortical tissues, which
can only be performed with ICE electrodes, positioned under the skull or directly inside
the cortex. Compared to scalp EEG, ICE recordings are an order of magnitude more
precise, with a spatial resolution on the order of half a centimeter. Therefore, in this
range, brain structures generating ICE signals can be identified readily and with no
ambiguity. This resolution is in fact comparable to that of fMRI, with the additional
millisecond temporal precision of EEG. Also, a very important feature for the study of
gamma band synchrony is that ICE signals are not contaminated by electromyographic
activity.
The process of identifying the future site of cortical resection takes about two weeks of
continuous ICE monitoring, in the patients hospital room. During this time, patients are
free to participate in cognitive tasks designed to understand the functional organization
of their brain, and of the brain in general. The information that can be derived from such
experiments is used to delineate functionally important brain structures that should be
sparred by the surgery. This is also a rare opportunity to observe working human brains
with a high spatio-temporal precision. Provided that certain precautions are taken to sort
between healthy and pathological brain activity, conclusions can be drawn, across
several patients, on neural mechanisms underlying human cognition in general
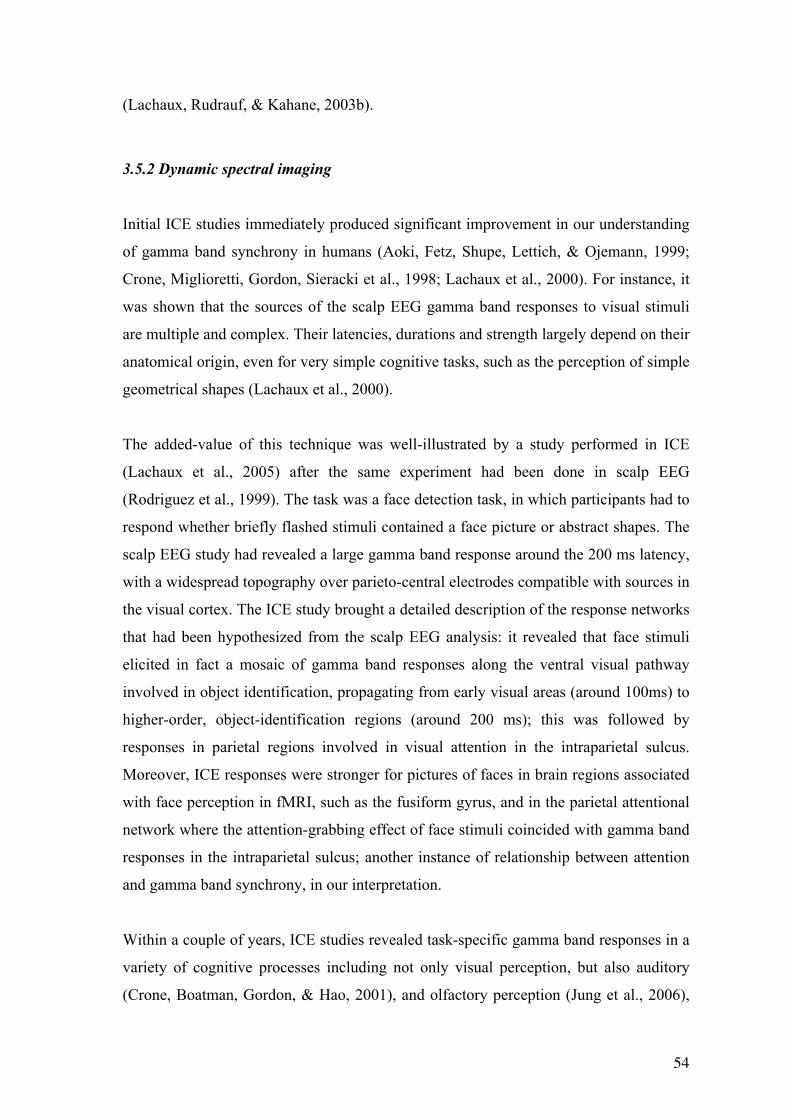
54
(Lachaux, Rudrauf, & Kahane, 2003b).
3.5.2 Dynamic spectral imaging
Initial ICE studies immediately produced significant improvement in our understanding
of gamma band synchrony in humans (Aoki, Fetz, Shupe, Lettich, & Ojemann, 1999;
Crone, Miglioretti, Gordon, Sieracki et al., 1998; Lachaux et al., 2000). For instance, it
was shown that the sources of the scalp EEG gamma band responses to visual stimuli
are multiple and complex. Their latencies, durations and strength largely depend on their
anatomical origin, even for very simple cognitive tasks, such as the perception of simple
geometrical shapes (Lachaux et al., 2000).
The added-value of this technique was well-illustrated by a study performed in ICE
(Lachaux et al., 2005) after the same experiment had been done in scalp EEG
(Rodriguez et al., 1999). The task was a face detection task, in which participants had to
respond whether briefly flashed stimuli contained a face picture or abstract shapes. The
scalp EEG study had revealed a large gamma band response around the 200 ms latency,
with a widespread topography over parieto-central electrodes compatible with sources in
the visual cortex. The ICE study brought a detailed description of the response networks
that had been hypothesized from the scalp EEG analysis: it revealed that face stimuli
elicited in fact a mosaic of gamma band responses along the ventral visual pathway
involved in object identification, propagating from early visual areas (around 100ms) to
higher-order, object-identification regions (around 200 ms); this was followed by
responses in parietal regions involved in visual attention in the intraparietal sulcus.
Moreover, ICE responses were stronger for pictures of faces in brain regions associated
with face perception in fMRI, such as the fusiform gyrus, and in the parietal attentional
network where the attention-grabbing effect of face stimuli coincided with gamma band
responses in the intraparietal sulcus; another instance of relationship between attention
and gamma band synchrony, in our interpretation.
Within a couple of years, ICE studies revealed task-specific gamma band responses in a
variety of cognitive processes including not only visual perception, but also auditory
(Crone, Boatman, Gordon, & Hao, 2001), and olfactory perception (Jung et al., 2006),
55
short- and long-term memory (Mainy, Kahane et al., 2007; Sederberg, Kahana, Howard,
Donner, & Madsen, 2003; Sederberg et al., 2007) language perception and production
(Crone, Hao et al., 2001; Jung et al., 2008; Mainy, Jung et al., 2007) and motor
preparation and execution (Aoki et al., 1999; Brovelli, Lachaux, Kahane, & Boussaoud,
2005; Crone, Miglioretti, Gordon, & Lesser, 1998; Lachaux, Hoffmann, Minotti,
Berthoz, & Kahane, 2006). The observation of gamma band responses in cognitive tasks
is now so common, that, at first glance, it may even seem that such responses are just
general reactions of the active brain, with no functional specificity. This view is
erroneous though, as the networks of gamma band responses induced by a cognitive task
have always been extremely sensitive to the task, both in terms of anatomical and
temporal organization. Moreover, it turns out that the networks of gamma band
responses triggered by cognitive tasks are very similar to those found with fMRI
(Lachaux, Fonlupt et al., 2007). It should also be noted that gamma band activity can be
also recorded in the deepest stages of sleep (Le Van Quyen et al.).
The results obtained so far support the models proposed by Singer (Singer, 1999) and
Fries (Fries, 2005), which assert that gamma band synchrony is a general mechanism for
local communication between nearby neurons. As such, it would be indispensable for
cognition: the recruitment of any local population of neurons, specialized in a precise
cognitive process, would necessarily involve the establishment of transient but intense
communication between those neurons, based on neural synchronization in the gamma
band. According to this view, the detection of gamma band synchrony in ICE signals
would provide an efficient marker of the spatio-temporal dynamics of the neural
networks underlying cognition, with a high spatial, frequency and temporal resolution.
For this reason, we called this technique ‘dynamical spectral imaging’ (DSI).
To illustrate the advantages of DSI, let’s consider two recent studies from our group.
Recently, we asked whether reading was associated with gamma band synchronization
and, if yes, whether it would be possible to associate the various subcomponents of
reading, such as grapho-phonological conversion or semantic analysis, with specific
gamma band responses. We recorded from ten patients in three experimental conditions
(Mainy, Jung et al., 2007): a simple orthographic task in which they were shown
consonant strings and had to decide whether those strings contained twice the same
letter or not, a phonological task in which they had to mentally pronounce visually
56
presented pseudowords, and a semantic task in which they had to decide whether
visually presented words were living entities or not. Across the ten patients, we had the
opportunity to record from most of the temporo-parieto-frontal network associated with
reading as revealed by previous fMRI studies (Price, 2000). Our study showed that
indeed, visual stimuli elicited a widely distributed network of gamma band responses
throughout the reading network including early visual areas, the word form area in the
fusiform gyrus, the superior temporal gyrus and Broca’s area. In addition, the degree to
which these brain regions produced gamma band responses varied across experimental
conditions, matching the functional specificity known within this network. For instance,
we found a functional dissociation within Broca’s area: while the strongest gamma band
response in the most anterior part was associated with semantic processing, that elicited
in the posterior part correlated with phonological processing.
Figure 26: Anatomical and task-sensitivity of gamma-band responses. We can see that electrode q’6, located in the anterior part of Broca’s area respond only in the semantic condition, while the electrode r’7, located 2 cm more posterior, respond more strongly in the phonological condition. (From Mainy et al., 2007).
In a second study (Mainy, Kahane et al., 2007), our group investigated whether verbal
working memory was also associated with gamma band synchronization. Ten patients
were recorded during a classic Sternberg task asking them to memorize a series of five
letters, presented one by one in succession. We found that each letter in a series induced
gamma band responses in a network comprising both temporal and frontal structures.
More interestingly, in some regions like the inferior frontal gyrus, the amplitude of those
responses increased linearly with the number of letters stored in working memory, with
a weaker response for the first letters in a series and stronger responses for the last ones.
57
Those results provided a direct neural implementation of the classic model of
phonological loop proposed by Baddeley to model verbal working memory (Baddeley,
2003).
3.6 Gamma band synchrony and attention: insights from human ICE studies
The previous results laid the ground for complementary studies and analysis investigating
the role of gamma band synchrony in attentional processes in humans. What happens to
the gamma band responses observed in humans with ICE, when attention is manipulated?
We now have elements to answer that ICE gamma band responses are very sensitive to
attention. Let us illustrate this point with three examples, drawn from the studies just
reviewed on visual perception, reading and verbal working memory.
3.6.1 Attention and visual perception
As we know now, the presentation of visual items triggers a chain of gamma band
responses in the visual system; but how does the duration of those responses vary with the
time actually spent by the subjects paying attention to the scene and extracting visual
information? If gamma band synchrony is involved in visual attention, then we might
expect that a longer search would trigger a longer gamma band response. This can be
hypothesized considering a classic result of the psychophysiological literature (A.
Treisman, 1998b): when you search for a complex object among many distractors, like a
face in a crowd at the train station, there is no other strategy than to shift visual attention
in space from face to face, until you eventually find your target. This is generally the case
except if the face has a very distinctive feature, like a large mustache, for example, in
which case the target pop-out, as previously mentioned. In other words, the search for a
specific item in an array of distracters is usually serial, with duration proportional to the
number of distracters. Visual search is thus an ideal situation to study the effect of search
duration on the timing of gamma band responses. If visual attention requires gamma band
synchrony, then we would expect longer gamma band responses to arrays that require
longer search. This is precisely what we observed in a recent study (Ossandon et al. in
preparation): patients were shown arrays of letters, containing one ‘T’ and 35 ‘L’’s. The
58
‘T’ was always gray, and was the target to be found in each display. ‘L’s were either gray
or black, so that the duration of the search could be manipulated by varying the
proportion of ‘L’ with the same color as the target. The results of this study will be shown
and discuss in the chapter Results.
3.6.2 Attention and reading
What happens when our attention fluctuates during reading, when we read certain
portions of a text attentively, but shift to a forgetful mode for others? We had the
opportunity to answer this question in the patients mentioned above, in whom networks of
gamma band responses had been identified for several subcomponents of reading (Jung et
al., 2008). These patients volunteered to perform an additional reading task, in which they
simply had to look at stories, shown word by word on a computer screen. The critical
experimental manipulation of the task was that two stories were intermingled, with the
words of the first story written in one color, and the words of the other story in another
color. Patients had to read only one of the two stories, say, the green story, and ignore the
other. However, because words were flashed on screen for only 100 ms, and because
patients had no way to guess the color of the upcoming word, each word was actually
processed visually in the same way, irrespective of its color, at least at the early stages of
the visual system. The only difference was that once a word had been identified as part of
the attended story, most likely because of its color, or because of its congruence with that
story, it would capture further attentional resources and be processed fully, while words
of the non-target story would not. The analysis of the ICE signals in response to attended
words showed that they triggered a chain of gamma band responses throughout the
reading network which was very similar to what had been observed in the semantic
condition of the earlier reading task, (as discussed previously, see Mainly, Jung et al.,
2007). This was expected in some sense, as comparably to that previous task, words also
benefited from the patients’ attention. But the most striking result was that gamma band
responses for unattended words were strongly attenuated compared to attended words.
Furthermore, this attenuation, which was quantified by the ratio between the global
energy of the ‘unattended’ gamma band response divided by the global energy of the
attended response, was stronger for frontal sites than for posterior sites, as if there was a
gradient of attenuation from posterior to anterior brain structures. In some high-level

59
structures such as Broca’s area, the gamma band response for unattended words was close
to zero, as if the words had not been presented at all. In contrast, the attenuation was weak
in visual regions such as the fusiform gyrus.
3.6.3 Attention and memory
Another effect of attention is that it facilitates memorization: it is a well-known fact to
every student that we memorize items and facts better when we are attentive. The study
on verbal working memory summarized above, which asked subjects to memorize series
of letters, investigated this effect. This was done with an experimental condition asking
the subjects to pay attention to certain letters only (Mainy, Kahane et al., 2007). In that
condition, each letter in a series was presented after a visual cue, a green or red dot,
informing the patient that the associated letter was important and had to be attended and
remembered. We could then compare the gamma band response to letters tagged as
important or unimportant and found an effect similar to the one observed in the attentive
reading study: in frontal regions, like the inferior frontal gyrus, gamma band responses
followed only attended, and later remembered letters. This showed that the positive effect
of attention on memorization manifested itself, at the neural level, as an increase in
gamma band synchronization; because only letters which received the full attention of the
patient, for the clear purpose of memorizing them, triggered gamma band responses.
The three studies discussed above converge to show amplification by attention of gamma
band responses associated with cognitive processing. In other words, when a process is
done attentively, the gamma band responses associated with this process are amplified.
This was further demonstrated in premotor cortex during a spatial attention task (Brovelli
et al., 2005), and in the ventral visual stream during object-based attention (Tallon-
Baudry, Bertrand, Henaff, Isnard, & Fischer, 2005). Altogether, the results obtained on
attention and gamma band synchrony in ICE studies have extended into high-level
cognitive tasks and associative cortical areas the validity of observations made in animals
in simple tasks and lower level sensory cortices. They fit the general view that attention
and gamma band synchrony go “hand in hand”.
What we have learned too, is that this relationship is always limited to very specific brain
60
structures, completely determined by the task which is being attended. Our general
experience is that an average of 10% of the cortical sites we record from generate gamma
band responses during a given task, a subset of which are modulated by attention. This
was clearly illustrated by the visual search experiment in which the correlation between
the duration of the gamma band responses and the time spent scanning the display
attentively, was true in early visual areas but not in higher order areas along the ventral
visual pathway.
The future will certainly add complexity to this apparently straightforward relationship.
To launch the discussion, let us end this section with a thought provoking result: in both
the visual search experiment and the attentive experiment, we observed negative gamma
band responses to the stimulus presentation (Lachaux et al., 2008); they were found in the
ventral lateral prefrontal cortex and had timing similar to the other, positive, gamma band
responses found in other cortical sites. The only difference was that they corresponded to
decrease in gamma band activity. The question that surge in this point is the following,
this decrease in gamma band activity possibly reflecting desynchronization? This is a
central point that will be developed in the Discussion of this thesis. In fact, this decrease
even brought the gamma band energy below the level measured at rest, before the
experiment started. Further, this phenomenon was strongly amplified by attention. The
same effect of deactivation was found in the lateral prefrontal cortex in the visual search
experiment (‘T’ and ‘L’) described above: the duration of this deactivation increased with
the duration of the search. As we will observe in the first article of my thesis (Ossandon
et al. submitted), this deactivation not only happen in VLPFC, but in the entire DMN,
describe above. This suggests that in some brain structures, attention may act not by
increasing gamma band activity, but by decreasing it. This does not necessarily contradict
the earlier conclusions, since our knowledge of the ventral lateral prefrontal cortex
(VLPFC) tells us that it could interfere with reading or visual search processes (Lachaux
et al., 2008). Therefore, the negative gamma band response may in fact correspond to the
interruption of processes which could interfere with the task at hand, such as constant
monitoring for occasional external events with possible general behavioral relevance, as
the VLPFC has been suggested to participate in this function (Corbetta & Shulman,
2002). One way to think about this effect is that the relationship between attention and
gamma band synchrony may have more degrees of freedom than previously thought, and
that attentional bias may take the form of a balance between regional synchronizations

61
and desynchronizations phenomena in the gamma band.
3.7 Broadband activity reflects synchrony?
3.7.1 Asynchronous neuronal populations can explain narrowband oscillations
As we have seen throughout this chapter, neuronal synchronization has been considered a
fundamental step in sensory, motor, and cognitive processing (Buzsaki & Draguhn, 2004;
F. Varela, Lachaux, Rodriguez, & Martinerie, 2001). In fact, neural synchronization was
detected by explicit cross-correlation between spike trains in several systems (Gray et al.,
1989; Marin, Mpodozis, Sentis, Ossandon, & Letelier, 2005; Singer, 1994).
Furthermore, neural synchronization was also inferred by existence of narrowband
oscillations in recorded local field potentials (LFPs) (Engel, Fries, & Singer, 2001; F.
Varela et al., 2001). This identification is based in the assumption that narrowband
oscillations must necessarily reflect the constructive summation of synchronous
oscillators. In a recent article, Javier Diaz and colleagues (Diaz, Razeto-Barry, Letelier,
Caprio, & Bacigalupo, 2007) study the origin of a beta band oscillation (called Peripheral
Wave, PWs11), recorded in the olfactory epithelium of catfish. The dominant theoretical
notion was that PWs represent intermittent synchronous activity of groups of olfactory
receptors neurons (ORNs); however, because there are no established neural connections
between ORNs (i.e. interneurons, Gap junctions, or an afferent pathway of fibers) the
mechanism for this peripheral synchrony remained unclear. But, according to these
authors, properties of this wave can be explained as the superposition of asynchronous
oscillators. To reach this conclusion, the authors relied on two main evidences: the pattern
of discharge of ORNs is constant in response to the odorants (in the next figure we can
see a trace of a single neuron response); and second, each time that the stimulus is
applied, the amplitude modulation in PWs is different (random pattern of amplitude-
modulated). Using Rayling fading, an interference phenomenon well known in physics,
the authors characterized neural signals generated by addition of random phase
11 A classic case of neural oscillations found in the olfactory epithelium of the vertebrate (Ottoson, 1955).
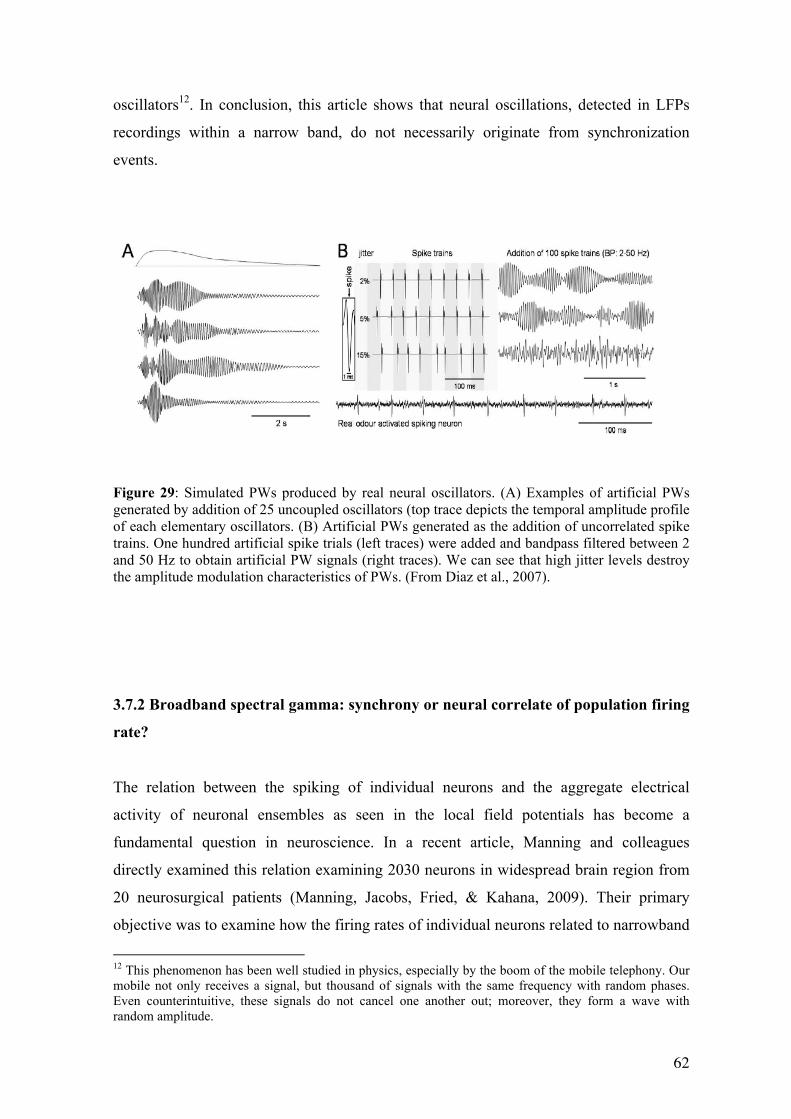
62
oscillators12. In conclusion, this article shows that neural oscillations, detected in LFPs
recordings within a narrow band, do not necessarily originate from synchronization
events.
Figure 29: Simulated PWs produced by real neural oscillators. (A) Examples of artificial PWs generated by addition of 25 uncoupled oscillators (top trace depicts the temporal amplitude profile of each elementary oscillators. (B) Artificial PWs generated as the addition of uncorrelated spike trains. One hundred artificial spike trials (left traces) were added and bandpass filtered between 2 and 50 Hz to obtain artificial PW signals (right traces). We can see that high jitter levels destroy the amplitude modulation characteristics of PWs. (From Diaz et al., 2007).
3.7.2 Broadband spectral gamma: synchrony or neural correlate of population firing
rate?
The relation between the spiking of individual neurons and the aggregate electrical
activity of neuronal ensembles as seen in the local field potentials has become a
fundamental question in neuroscience. In a recent article, Manning and colleagues
directly examined this relation examining 2030 neurons in widespread brain region from
20 neurosurgical patients (Manning, Jacobs, Fried, & Kahana, 2009). Their primary
objective was to examine how the firing rates of individual neurons related to narrowband
12 This phenomenon has been well studied in physics, especially by the boom of the mobile telephony. Our mobile not only receives a signal, but thousand of signals with the same frequency with random phases. Even counterintuitive, these signals do not cancel one another out; moreover, they form a wave with random amplitude.

63
changes (i.e., oscillations) and broadband changes in the LFP (see Figure 30). For many
of the neurons recorded, narrowband oscillations correlated significantly with the firing
rate, especially in the gamma band (30-150 Hz). Nevertheless, the principal finding of
these authors is that neuronal spiking is positively correlated with broadband LFP power
across all the frequencies. Because this broadband (and also the gamma 30-150) spectra
change is correlated with the action potential rate at the LFPs scale, broadband would
then dictate the size of neuronal population that the firing rate is being averaged over
(Manning et al., 2009; Miller, 2010).
Figure 30: LFP power and neuronal firing rate time series. Each box details the activity in one 500 ms epoch. (a) This panel illustrates how various features of the LFP change over time. In each epoch, the black lines indicate the overall LFP power spectrum, brown lines indicate robust-fit lines, and the horizontal red lines indicate mean broadband powers. (b) Changes in the neuronal firing rate concurrent with changes in the LFP power spectrum. (From Manning et al., 2009).
Beginning with Crone and colleagues (1998), several studies described ICE and ECoG
power increases at 50-150 Hz, called high gamma13(Fries, 2009), when a brain region is
active (Jacobs & Kahana, 2010; Manning et al., 2009). The use of the term high gamma
implied that this faster signal reflected a true rhythmic oscillation (Jacobs et al., 2010). As
we have seen, gamma oscillations can be difficult to distinguish from broadband
fluctuations because both phenomena appear at overlapping frequency bands; both
exhibits phase-amplitude coupling with theta (4-8 Hz) oscillations; and both correlate
with neuronal spiking (Canolty et al., 2006; Jacobs, Kahana, Ekstrom, & Fried, 2007;
13 This pattern was called ‘high gamma’ because it appeared to be a faster version of the gamma oscillation, which generally appears as a rhythmic signal at +- 40Hz (Fries, 2009; Jacobs & Kahana, 2010).

64
Jacobs & Kahana, 2010; Manning et al., 2009). In conclusion, we need be carefully when
we talk about gamma oscillation. It is important to distinguish true oscillations from
broadband fluctuations because the two phenomena imply distinct underlying
physiological processes (Jacobs & Kahana, 2010; Miller, 2010).
3.8 Perspectives
Given that the application of ICE to understand the functional role of gamma band
synchrony in attentional processes is relatively new, we will end up this chapter
discussing its future, rather than its past. There are several major avenues for future ICE
research which can be highlighted.
3.8.1 Long distance synchrony
In this chapter, we have been essentially dealing with one type of synchronization, called
local, which binds together neurons belonging to a single, homogeneous, functional
structure such a the primary visual cortex, or the posterior part of Broca’s area. However,
another type of synchronization, linking together widespread neural activities over the
whole brain has been evidenced in the recent years, as part of a mechanism of large-scale
integration indispensable for cognition. In short, the need for integration mechanisms,
which was first described in the visual system to solve the binding problem, is in fact
general. Most cognitive acts involve the integration of processes carried out by distinct
functional systems, sensory, motor, emotional or cognitive, most of them anatomically
widespread. All such aspects must be integrated to produce coherent experience of the
world and adapted behavior. This constraint has led to the idea that synchrony, as an
integration mechanism, may well be used outside the context of ‘simple’ sensory
integration, as in visual binding, to achieve this large-scale integration across functional
systems (F. Varela et al., 2001). Shortly after their first observations of synchrony in cat’s
area 18, Singer and col. showed that synchrony could occur between neurons in
functionally segregated areas (area 18 and 19) (Gray et al., 1989) or between hemispheres
(Konig, Engel, & Singer, 1995), providing the first examples of ‘non-local’ synchrony.
65
Since then, several studies have found instances of long-distance synchrony in relation to
behavior, for instance between parietal and motor cortices in cats involved in a sensory
motor discrimination task, or in humans during face perception. It must be said, however,
that in most instances long-distance synchrony was found at lower frequencies than local
gamma band synchrony—in the alpha and beta range, typically. It remains to be
demonstrated, especially with the high anatomical precision of intracranial EEG, that
attention facilitates the emergence of large-scale synchronization. We know of no
convincing intracranial EEG evidence of large-scale synchrony in the gamma range
facilitated by attention; this is the kind of research to watch for carefully in the future.
3.8.2. Other frequency bands
As said earlier, large-scale synchrony has often been found in frequency bands lower than
the gamma range, between 8 and 30 Hz. For instance, Tallon-Baudry et al. (Tallon-
Baudry, Bertrand, & Fischer, 2001) have found in ICE recordings from the visual system,
that the maintenance of abstract shapes in working memory, over a couple of seconds,
involves the synchronization of the lateral occipital sulcus with the fusiform gyrus around
20 Hz. Since that study, similar large-scale synchrony, in the same frequency range, has
also been found between the ventral and dorsal visual pathways in the ICE study on face
perception described above (Lachaux et al., 2005). This clearly indicates that gamma
band synchronization is not the whole story. This is also true for local synchrony, as the
theta, alpha and beta bands are known to be modulated by cognitive activity: theta
oscillations have been shown to be enhanced in the hippocampus mostly during spatial
navigation, and across widespread cortical locations during memory tasks (Caplan,
Madsen, Raghavachari, & Kahana, 2001; Kahana, Seelig, & Madsen, 2001). The
reactivity of the alpha and beta bands has been repeatedly shown to be anti-correlated
with the gamma band: in most cognitive situations studied so far, gamma band energy
increases have been simultaneous with alpha and beta energy decreases, suggesting the
hypothesis that the three phenomena are in fact ‘three sides’ of the same coin (Lachaux et
al., 2005). This possible claim should be qualified by the additional observation that the
anatomical specificity of alpha and beta decreases is not as precise as for gamma
increases. This was perfectly illustrated in a study by Crone et al. (Crone, Miglioretti,
66
Gordon, & Lesser, 1998), where they localize the alpha, beta and gamma band energy
variations induced in the sensorimotor cortex by movements of various body parts: the
homunculus drawn from movement-induced gamma band energy increases matched
precisely the classic motor homunculus which characterizes the functional organization of
the motor cortex. The distribution of alpha and beta decreases, in contrast, was by far less
refined spatially, providing only a blurred version of the motor homunculus. Still, alpha,
beta, and theta band activities have the advantage over gamma band activities of being
much easier to detect at the scalp surface because they involve larger neural populations;
for this reason, they provide valuable electrophysiological markers of a number of
cognitive processes or states, including attentional states, which can be easily measured
non-invasively with scalp EEG and MEG (Jokisch & Jensen, 2007).
3.8.3 Scalp recordings
As precise as they can be, ICE recordings will never replace non invasive EEG/MEG
recordings. Because ICE is limited to patients and a handful of clinical centers, this type
of recording is bound to remain a minor path of investigation of the human brain.
Electrophysiological research in humans across large and healthy populations will rely on
scalp EEG and MEG. Therefore, one can reasonably wonder how such non-invasive
techniques can benefit from ICE research. There are several possible answers to this
question. The first one is that ICE records neural activity at a level of resolution
intermediate between micro-recordings in animals and EEG/MEG, therefore constituting
a missing link between the two extreme levels. Moreover, ICE studies provide the
simplest way to associate EEG/MEG signal components, such as gamma band energy
increases, with neural mechanisms observed directly at the neural level in animals. The
second contribution of ICE is to reveal the sources of the signals recorded with EEG and
MEG at the scalp surface. As we know, an entire field of research has developed to
design mathematical techniques to enhance the spatial resolution of EEG and MEG
(Sereno, 1998). Most of these techniques aim at reconstructing the cortical sources of
EEG and MEG signals, and suffer from the fact that any given set of EEG/MEG signals
can be generated by a potentially infinite number of different source configurations.
Solutions to the so-called source reconstruction problem require a-priori knowledge about
the actual sources, and this is exactly what ICE provides.
67
We believe that the future of attention research in humans, at least in electrophysiology,
should involve studies combining ICE and EEG/MEG. Practically, this means EEG/MEG
studies in normal subjects, using attention tasks extensively studied in patients, so that the
networks active during those tasks have been previously identified with ICE. EEG/MEG
would then be used to validate those results in healthy subjects, refining our
understanding of the parameters controlling those networks, with longer versions of the
tasks and more control conditions than acceptable in patients. The combination of ICE
and EEG/MEG should be particularly fruitful for the development of attention-training
paradigms based on real-time EEG analysis, such as BrainTV (Lachaux, Jerbi et al.,
2007). With BrainTV, ICE is already providing electrophysiological indexes, with very
well-defined anatomical origin and temporality, which correlate tightly with certain
dimensions of attention. EEG/MEG research should focus on the specific traces of such
indexed at the scalp surface to provide an ensemble of non-invasive attentional markers
which could then be used for training aspects of attention in healthy individuals.

68
4. MATERIAL AND METHODS
4.1. Subjects Intracranial recordings were obtained from fourteen patients with intractable epilepsy (11
women, mean age: 32 ± 10 years) that were candidates for surgery at the Epilepsy
Department of the Grenoble Neurological Hospital (Grenoble, France). All patients were
stereotactically implanted with multi-lead EEG depth electrodes (SEEG) simultaneously
sampling lateral, intermediate and medial wall structures. Electrode implantation was
performed according to routine procedures and all target structures for the presurgical
evaluation were selected strictly according to clinical considerations with no reference to
the current study. All electrode data exhibiting pathological waveforms were discarded
from the present study. All participants provided written informed consent and the
experimental procedures were approved by the Institutional Review Board and by the
National French Science Ethical Committee (CPPRB). All participants had normal or
corrected to normal vision. Patient specific clinical details are provided in Table 1.
Table 1. Participant description: age, gender and description of epileptogenic focus as determined by the clinical staff (Grenoble Neurological Hospital, France).
69
Furthermore, for the purpose of additional analysis and comparison, additional data was
also obtained from a second pool of 11 patients (6 women, mean age 33 ± 9.5 years) who
were implanted using the same procedure at the Lyon Neurological Hospital (Lyon,
France). Informed consent and review board approvals were also obtained for this group.
4.2. Stimuli and Experimental Design
The stimuli used in this study are an adaptation of a classical visual search test developed
by Treisman and Gelade (1980). Each stimulus consisted of an array of 36 letters (6 x 6
square array with 35 ‘L’s and one ‘T’ randomly arranged). Participants were instructed to
find the 'T' as fast as possible via a response button. To dissociate correct from wrong
responses the subjects were required to indicate whether the target was located in the
upper or lower half of the display by pressing one of two response buttons on a control
pad located under their right index or middle finger. The spatial configuration of the
buttons in the control pad was such that the target button for upper field targets was above
the target button for lower field targets, ruling out any complex spatial remapping
processes between visual target and button position. Response latencies for each trial
were stored to disc for subsequent offline analysis of reaction time and behavioral
performances. In the present study two main experimental conditions were contrasted: an
easy search condition and a difficult search condition. The task was always to find a
target (the letter ‘T’) presented among 35 distracters (the letter ‘L’). In the EASY
condition, the target was gray while all distracters were black. In the DIFFICULT
condition, both distracters and target were gray. The difficult and easy condition stimuli
were presented randomly for a fixed duration of 3 seconds and with an inter-stimulus
interval (ISI) of 1 second. The stimuli were displayed on a 19’’ computer screen located
at 60 cm away from the subject. Only data trials with correct target detection were
analyzed. Each experiment consisted of 6 runs of 5 minutes recording blocks.

70
Figure 31: Visual search task description. Subjects were instructed to find the only grey ‘T’ in an array of ‘L’s. In the easy condition, all ‘L’s (the distracters) were black. This made the ‘T’ easy to spot. In the difficult condition, all ‘L’s were grey. The conditions were randomly interleaved. Subjects were asked to detect the target as fast as possible via a button press and reaction times (RTs) were stored for offline analysis. The subjects pressed one of two buttons to indicate whether the target was in the upper or lower half of the screen. Each search array was presented for three seconds irrespective of the reaction times of the subjects. The inter-trial interval was one second. 4.3. Data Acquisition
4.3.1. Electrode implantation. Eleven to fifteen semi-rigid multi-lead electrodes were
stereotactically implanted in each patient. The stereotactic-EEG (SEEG) electrodes used
have a diameter of 0.8 mm and, depending on the target structure, consist of 10 to 15
contact leads 2 mm wide and 1.5 mm apart (DIXI Medical, Besançon, France). All
electrode contacts were identified on the patient’s individual stereotactic implantation
scheme, and were subsequently anatomically localized using Talairach and Tournoux’s
proportional atlas (2). In addition, computer-assisted matching between a post
implantation CT-scan and a pre-implantation 3-D MRI data set (VOXIM R, IVS,
Solutions, Germany) allowed for direct visualization of the electrode contacts on the
patient’s brain anatomy using the ACTIVIS (Software for visualization and analysis of

71
multi-modal medical images, joint development between INSERM U821, CERMEP and
UMR 5230).
4.3.2. SEEG recordings. Intracerebral recordings were conducted using a video-SEEG
monitoring system (Micromed, Treviso, Italy), which allowed the simultaneous data
recording from 128 depth-EEG electrode sites. The data were bandpass-filtered online
from 0.1 to 200 Hz and sampled at 512 Hz in twelve patients (Data from the other two
patients were digitized at 1024 Hz). At the time of acquisition the data is recorded using a
reference electrode located in white matter, each electrode trace is re-referenced with
respect to its direct neighbor (bipolar derivations). This bipolar montage has a number of
advantages over common referencing. It helps eliminate signal artifacts common to
adjacent electrode contacts (such as the 50 Hz power supply artifact or distant
physiological artifacts) and achieves a high local specificity by canceling out effects of
distant sources that equally spread to both adjacent sites through volume conduction. The
spatial resolution achieved by the bipolar SEEG is on the order of 3mm (Lachaux et al.,
2003b). Eye movements were monitored by recording the electrooculogram (EOG) in all
sessions.
4.3.3. Specificity of SEEG compared to ECoG
The use of stereotactic EEG (SEEG) is less wide-spread than that of Electrocorticography
(ECoG) in the clinical setting of drug-resistance epilepsy treatment. To date, some
important differences between these two intracranial EEG techniques remain unknown to
the broader community. Some SEEG specificities are crucial with regards to the present
study. First of all, by contrast to ECoG which consists of placing grid electrodes (or
strips) directly on the cortical surface, SEEG consists of implanting several semi-rigid
multi-lead depth electrodes inside the brain. This is achieved via a stereotactic approach
developed by Talairach and Bancaud (Talairach & Tounoux, 1993). As a result, SEEG
provides direct recordings from deep structures and allows for a sampling of brain
activity all the way from the lateral surface to medial wall structures. SEEG electrodes
can also records from neural populations located deep within the sulci. Such spatial
sampling cannot be achieved with ECoG and represents a major asset for the extensive
investigation of distributed brain networks, such as the default-mode network.

72
Furthermore, the small SEEG inter-electrode distance (1.5 to 4.5 mm inter-electrode
distance, compared to 1 cm in standard subdural ECoG grids) in combinations with
bipolar derivations guarantees a high spatial specificity and more robustness with respect
to signal artifacts.
4.4. DATA ANALYSIS
4.4.1. Time-Frequency Maps (Wavelet analysis)
To quantify signal power modulations across time and frequency we used standard time-
frequency (TF) wavelet decomposition (6). The signal s(t) is convoluted with a complex
Morlet wavelet ( , ) 0 w t f , which has Gaussian shape in time ( t s ) and frequency ( f s )
around a central frequency 0 f and defined by: ( , ) exp ( /2 ) exp (2 ) 0 2 t 2 0 w t f = A -t s
ipf t , with f t s = 1/ 2ps and a normalization factor 2 / 1 ) ( - = p s t A . Throughout this
study we used a wavelet family with cycle number set to 7 (i.e. / 7 0 = f f s ). The square
norm of the convolution results in a time-varying representation of spectral power, given
by: 2 0 0 P(t, f ) = w(t, f ) ´ s(t) .
TF maps for each electrode were then computed by averaging TF power maps across
trials (and, in the case of cluster-level TF maps, across all electrodes of the cluster). The
frequency range extended from 1 to 200 Hz and a pre-stimulus baseline interval was set
to be between -400 and -100 ms prior to visual array presentation. All TF maps presented
here are given in Z values, as a result of the Wilcoxon signed rank test for emergence (i.e.
task-related increases or decreases of power in poststimulus period compared to baseline
power values at each frequency). All wavelet-based TF map computations were
performed with an in-house software package for electrophysiological signal analysis
(ELAN-Pack) developed at INSERM U821 Brain Dynamics & Cognition Lab (Lyon,
France).
73
4.4.2. Estimation of gamma power profiles (Hilbert transform)
In addition to the use of wavelet-based analysis, we also examined the time course of
frequency specific amplitude modulations using the Hilbert transform. Applying the
Hilbert transform to the continuous recordings splits the data into instantaneous amplitude
(i.e. envelope) and phase components in a given frequency interval. In addition to being a
convenient measure of instantaneous amplitude modulations in a frequency range of
interest, performing spectral analysis using the Hilbert transform was also used to confirm
the TF results obtained independently by wavelet analysis. These comparisons provided
an additional level of confidence in the results of spectral analysis reported throughout
this study. For a comparison of Wavelet decomposition and Hilbert transform see Le Van
Quyen et al. (Le Van Quyen et al., 2001).
In the following, we describe the straight-forward procedure followed here to compute
task-related amplitude modulations in the high gamma band (60-140 Hz). The same
method was used for calculations in other frequency bands.
Step 1 Estimating gamma-band envelope (i.e. time-course of gamma-band power) Continuous SEEG signals were first band-pass filtered in multiple successive 10Hz-wide
frequency bands (e.g. 8 bands from [60 - 70 Hz] to [130 - 140 Hz]). Next, for each band-
pass filtered signal we computed the envelope using standard Hilbert transform. The
obtained envelope has a time resolution of 64 Hz (time bins every 15,625 ms). Again for
each band, this envelope signal (i.e. time-varying amplitude) was divided by its mean
across the entire recording session and multiplied by 100. This yields instantaneous
envelope values expressed in percent (%) of the mean. Finally, the envelope signals
computed for each consecutive frequency bands (e.g. 8 bands of 10-Hz intervals between
60- 140 Hz) were averaged together, to provide one single time-series (the high gamma-
band envelope) across the entire session. By construction, the mean value of that time-
series across the recording session is equal to 100.
Step 2 Computing task-related time course of % gamma power
As for the wavelet-based TF analysis, we also computed task-related ‘emergence’ (i.e.
stimulus related or response-related increases or decreases in the amplitude of the
gamma-band envelope). These modulations were computed by contrasting gamma-band
74
amplitude during visual search to values obtained during the pre-stimulus baseline period
(-400 -100). To test for significant increases or decreases we used paired-sample
Wilcoxon signed rank test, followed by false discovery rate (FDR) correction across all
time samples. The FDR approach yields a corrected threshold for significance (Genovese,
Lazar, & Nichols, 2002). Note that for visualization purposes, all power profiles are
baseline corrected. Moreover, cluster-level gamma-band time courses were obtained by
event-locked time-domain averaging across trials and electrodes of the cluster. Note that
strictly speaking, Hilbert transform yields amplitude of a signal envelope, while the
waveletbased analysis provides power values. However, given that signal power here is
the square of signal amplitude, our findings and their interpretations hold true for power
and amplitude and the two concepts are used here interchangeably.
4.5. Mapping intracranial EEG data to standard MNI brain To obtain an anatomical representation of all significant power modulations for a given
frequency band, we mapped pooled data from all subjects onto a standard Montreal
Neurological Institute (MNI) brain. The value assigned to each node of the MNI brain
represents the average of data from all recording sites located within a distance of
maximum 15 mm from the node (For this purpose, all electrode coordinates were
transformed from Talairach to common MNI space). The individual data averaged in thus
study represent Z values (Wilcoxon test, FDR corrected) for each subject, thereby they
represent statistically significant task-related increases or decreases of signal power in a
given frequency band (compared to a baseline period, as described above). This data
mapping procedure provides, above all, a convenient way to pool and visualize
intracerebral EEG data from all subjects on a common MNI brain and is used to identify
anatomo-functional regions of interest for more precise analysis at the individual level.
Most importantly, all statistical analysis provided throughout this study are based on
single electrode or cluster-level statistical analysis based on the estimated band-specific
time series at each electrode of each subject (power envelopes obtained with Hilbert
transform). In other words, we do not use the interpolated and averaged data represented
on the MNI maps for subsequent statistical analysis.
75
4.6. Definition of anatomo-functional clusters
Mapping significant task-related power increases or decreases to standard MNI brain (as
described in previous section) allows for the identification of anatomo-functional clusters
of interest. For instance, what we refer to in this study as “deactivation clusters” was
obtained by mapping all significant gamma band deactivation (GBD) data from all
subjects to the common MNI brain. The result (Fig 2A) represents in blue all brain
regions that show a statistically significant suppression of high gamma power (60-140
Hz) during active search compared to the pre-stimulus baseline level (data pooled across
all subjects). Using statistical significance of gamma deactivation as functional criterion
and its spatial distribution as anatomical criterion the following major anatomo-functional
deactivation clusters were obtained: Posterior Cingulate Cortex-Precuneus (PCC), Medial
Prefrontal Cortex (MPFC), L and R Ventrolateral Prefrontal Cortex (VLPFC), Temporal
Parietal junction (TPJ), Lateral Temporal Cortex (LTC) and Middle Frontal Gyrus
(MFG). Table S3 lists all electrodes that define the gamma-band “deactivation cluster” as
well as their coordinates and anatomical location (Broadmann areas).
4.7. Computing deactivation onset and duration:
We used signed rank Wilcoxon tests, followed by FDR correction across time samples to
assess the statistical significance (p<0.05) of event-related increases or decreases in the
time course of gamma band power. Gamma-band deactivation (GBD) onset latency and
duration were determined on the basis of statistical criteria: The onset of GBD was
defined as occurring at the time bin at which the deactivation exceeded the statistical
threshold (p<0.05, FDR) for the first time and if at least values for 2 consecutive time
bins remain below the threshold. We tested for significant differences between GBD
onset across clusters using t-test for independent samples (p<0.01). The results (as shown
in Fig. 2C for example) include pooled data from both the easy and difficult condition
since no statistical differences were found between the GBD onset across conditions. As
for GBD duration, it was defined as the total duration of statistically significant GBD
(FDR, p<0.05) occurring in the total time window between deactivation onset and 3000
ms (i.e. end of visual array presentation). We tested for differences in GBD duration
between easy and difficult search conditions for each cluster using paired t-test (p<0.01).
Note that the estimation of onset and duration were performed for task-related power
76
modulations in other frequency bands (e.g. beta band) in the exact same way as described
above for the gamma band.
4.8. Evaluating the relationship between GBD and performance
The link between GBD strength and speed of target detection was examined at two levels:
(a) group level analysis across all electrodes of each cluster, and (b) using trial-by-trial
correlation analysis in individual subject data.
a) Cluster-level approach
For a given condition (e.g. difficult search), we sorted the trials into two groups: 50 %
fastest response trials (short RTs) and 50% slowest response trials (long RTs) trials. We
computed mean GBD power separately for each group of trials using data from all
electrodes of the deactivation cluster. Note that mean GBD power was obtained by taking
the mean of the amplitude over a fixed time window during visual search: [200 700] ms
for stimulus-locked analysis (time zero at search array onset) and [-900 -200] for
response-locked analysis (time zero at button press). Criteria for GBD time window
selection: For stimulus-locked averaging we set the lower bound to 200 ms as this
corresponds approximately to the earliest GBD onset across all electrodes and subjects.
The upper bound was set to 700 ms, which corresponds to a latency at which no response
had yet occurred in 95 % of all trials. The time window for response-locked analysis was
set between -900 and -200 ms prior to response (so as not to include data immediately
preceding the button-press). In addition, we found that results reported with these
windows did not change by shifting the bounds by ±100 ms. Finally, we tested for
differences in GBD for the two groups of trials (50 % fastest vs 50% slowest) using
paired t-test (p<0.01). (e.g. Fig 3A and figure S4 of the firs article).
b) Single-trial analysis
Using single-trial electrode data, we computed the correlation between instantaneous
77
gamma power and the reaction times of the corresponding trials. This was performed for
at each time bin of single trial power envelope resulting in a time-series of correlation
coefficients. Scatter plots were then used to illustrate the relationship between reaction
times and single-trial gamma power at tmax, the time bin of peak correlation.
4.9. Gamma-band large-scale correlation & anticorrelation analysis
We examined temporal correlations among gamma power envelopes from all recording
sites located in task positive (TPN) and task-negative networks (TNN) in each subject.
TPN and TNN consist of electrode clusters with significant stimulus-induced gamma-
band activation and deactivation respectively (see table S4 for anatomical details). For
each pair of electrodes the correlation was computed as follows: For each electrode site a
time series was obtained by concatenating multiple 1-s segments of gamma power
envelope, one from each trial (from 0 to 1000 ms following stimulus onset). For instance,
a data set with 100 trials would yield a 100 s time series of raw gamma power envelope
obtained during active task periods. Next, we calculated the cross-correlation between the
two signals at various time lags (within +/- 156 ms range) to identify the maximum
correlation value (i.e. maximum in terms of absolute value).
Next, we computed correlations obtained with surrogate data sets obtained by
recomposing one of the two signals via random shuffling of the trial order within the
time-series. This was carried out 99 times for each electrode pair, yielding 99 correlation
values. If the original correlation between the two time series is higher (in absolute value)
than the 99 surrogates, the correlation between the gamma envelopes at the two sites was
considered to be statistically significant at p<0.01. Note that the sign of the significant
correlation value indicates whether the correlation is positive (“correlated”) or negative
(i.e. “anti-correlated”).
After computing all possible correlations between all relevant electrode pairs within each
subject, we evaluated the number of significant correlations as a function of the type of
electrode-pair group they belong to: intra-network correlation (i.e. TPN-TPN and TNA-

78
TNA electrode pairs), or inter-network correlation (i.e. TPN-TNA electrode pairs). The
total number of significant positive and negative correlations and their ratio with respect
to non-significant correlation was computed as a function of correlation type (inter-
network or intra-network correlation). Finally, we used paired t-test across subjects to test
whether the negative or rather the positive correlations were predominant in each
correlation group (inter-network correlations and intra network correlations). Such
analysis allowed us for instance to show that TPN-TNA electrode pairs (inter-network
correlation) predominantly exhibit more negative correlations than positive correlations
(The inverse was true for the intra-network correlations, where positive correlations were
more prominent than negative correlation).

79
RESULTS
5. First study: Electrophysiological correlates of the default
mode network
5.1. Hypothesis and Comments about the study
Our ability to quickly perceive and react to events in the outside world depends on our
level of vigilance. Our state of alertness and thus our performance can fluctuate over the
course of a day or even over the time span of a few seconds. To date, the neural
mechanisms that facilitate or hinder efficient task-engagement are still poorly understood.
As we have seen in the first chapter, converging neuroimaging evidence supports the
view that attention-demanding goal-direted behavior is mediated not only by distributed
patterns of cerebral activation but, remarkably, also by concurrent suppression of activity
in distinct set of brain regions (see Figure 32, Shulman et al. 1997; Corbetta and Shulman,
2002; Fox et al. 2005). Brain regions that show systematic deactivations during task
performance collectively form a network known as the default-mode network (DMN)
(Raichle et al. 2001; Raichle and Mintun, 2006). Metabolic deactivations in this network
during goal-directed behaviors are only the trace of neural mechanisms still unknown.
Figure 32: Regions positively correlated with the default mode network (orange). The areas shown in blue are negatively correlated with the DMN and may be described as a goal-directed network. (From Carhart-Harris et al., 2008)
As seen in the previous figure, while task-related activations often involve frontoparietal
circuits such as the dorsal attention network, task-negative networks comprise medial and
lateral core regions of the DMN, including posterior cingulated cortex (PCC), medial
prefrontal cortex (MPFC), lateral temporal cortex (LTC), and temporal parietal junction

80
(TPJ). Whereas the precise spatial characteristics of the DMN are amenable to imaging
studies, its fine-scale temporal properties and its relationship with behavior remain
elusive, limiting severely the prospect of fully unraveling the functional role of DMN
deactivation.
In this study we address this gap by determining the electrophysiology of the deactivation
phenomenon at the population level across the human brain.
Human intracranial recordings were obtained from depth electrodes implanted in epileptic
drugs-resistant patients of Grenoble’s Hospital, following a standard clinical procedure
motivated only by therapeutical considerations, aiming surgical interference with the
epileptogenic network (Lachaux et al., 2003a). The spatio-temporal resolution of such
recordings is excellent: the temporal resolution of sEEG is on the order of milliseconds
(sampling rate of 512 Hz), while the spatial resolution is on the order of a couple of
millimetres (see Figure 15), allowing to extract the activity of functionally homogeneous
cortical structures. We obtained an unprecedented dense sampling of the human brain by
acquiring stereotactic-electroencephalography (SEEG) data from over 1730 intracerebral
recording sites in 14 patients.
The stimuli used in this work are an adaptation of classical of visual search test developed
by Anne Treisman (A. M. Treisman & Gelade, 1980). Six different stimuli were
presented in random order for each patient (figure 5). The stimuli were arrays of 36 letters
(6 x 6, 35 ‘L’s and 1 ‘T’) randomly arranged. Participants had to find the grey T to report
its position in the display (upper or lower part), as fast as possible, by pressing one of two
response buttons on a joystick (located under their right index or middle finger). The
spatial configuration of the buttons on the joystick was such that the target button for
upper field targets was above the target button for lower field targets, avoiding any
necessity for spatial remapping between target and button position. Reaction times for
each trial were calculated offline on the PC used for data analysis. There were six
different types of display, corresponding to six different conditions, as illustrated in figure
5, and the task was always to find the grey ‘T’, distractors were always ‘L’s. In the ONE
condition (EASY), all distractors were black, in the TOP condition, 18 black distractors
were in the down half of the screen, while 17 grey distractors (and the grey ‘T’) were in
the upper half of the screen. The LEFT and RIGHT conditions were similar to TOP
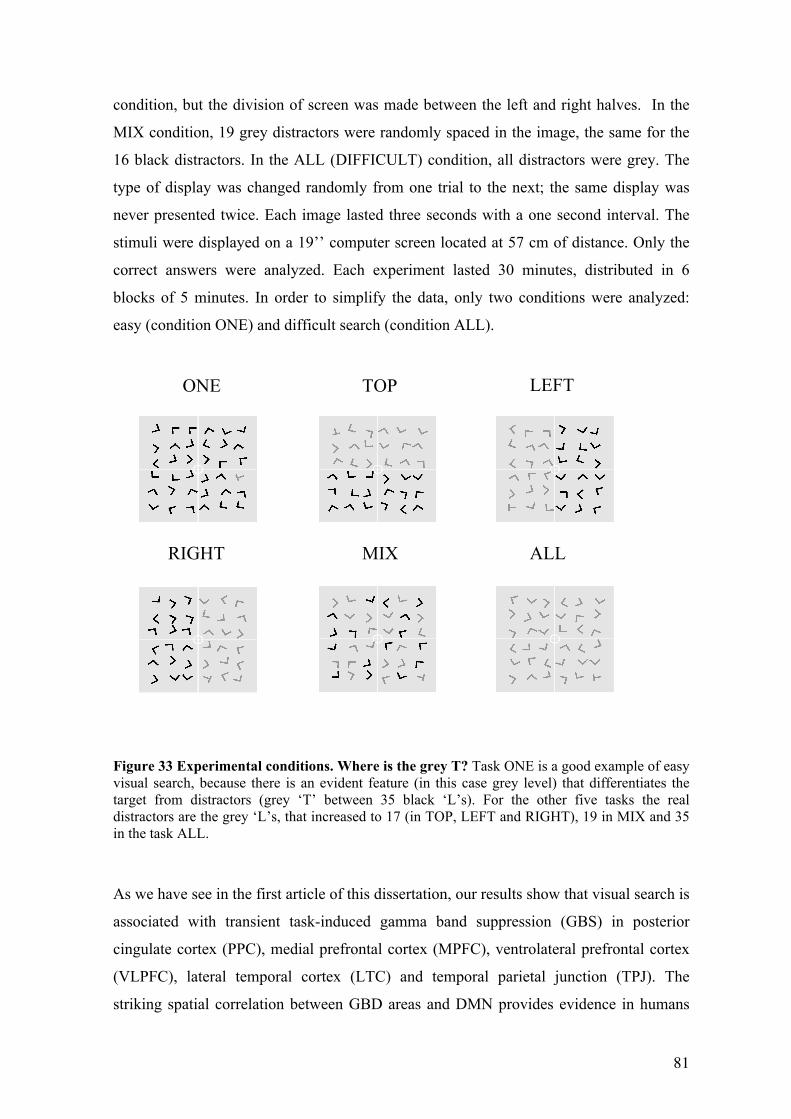
81
ONE TOP LEFT
RIGHT MIX ALL
condition, but the division of screen was made between the left and right halves. In the
MIX condition, 19 grey distractors were randomly spaced in the image, the same for the
16 black distractors. In the ALL (DIFFICULT) condition, all distractors were grey. The
type of display was changed randomly from one trial to the next; the same display was
never presented twice. Each image lasted three seconds with a one second interval. The
stimuli were displayed on a 19’’ computer screen located at 57 cm of distance. Only the
correct answers were analyzed. Each experiment lasted 30 minutes, distributed in 6
blocks of 5 minutes. In order to simplify the data, only two conditions were analyzed:
easy (condition ONE) and difficult search (condition ALL).
Figure 33 Experimental conditions. Where is the grey T? Task ONE is a good example of easy visual search, because there is an evident feature (in this case grey level) that differentiates the target from distractors (grey ‘T’ between 35 black ‘L’s). For the other five tasks the real distractors are the grey ‘L’s, that increased to 17 (in TOP, LEFT and RIGHT), 19 in MIX and 35 in the task ALL.
As we have see in the first article of this dissertation, our results show that visual search is
associated with transient task-induced gamma band suppression (GBS) in posterior
cingulate cortex (PPC), medial prefrontal cortex (MPFC), ventrolateral prefrontal cortex
(VLPFC), lateral temporal cortex (LTC) and temporal parietal junction (TPJ). The
striking spatial correlation between GBD areas and DMN provides evidence in humans

82
for a direct link between GBS and task-related deactivation as measured with fMRI. Most
importantly, our GBS analysis shows that the duration and intensity of gamma
suppression is modulated by task complexity. In addition this observation was also found
in a second study (Fig. 3) investigating processing of facial expression. Our data
provide novel insights into the electrophysiological correlates of intrinsic brain
networks and significantly advance our understanding of the default mode network.
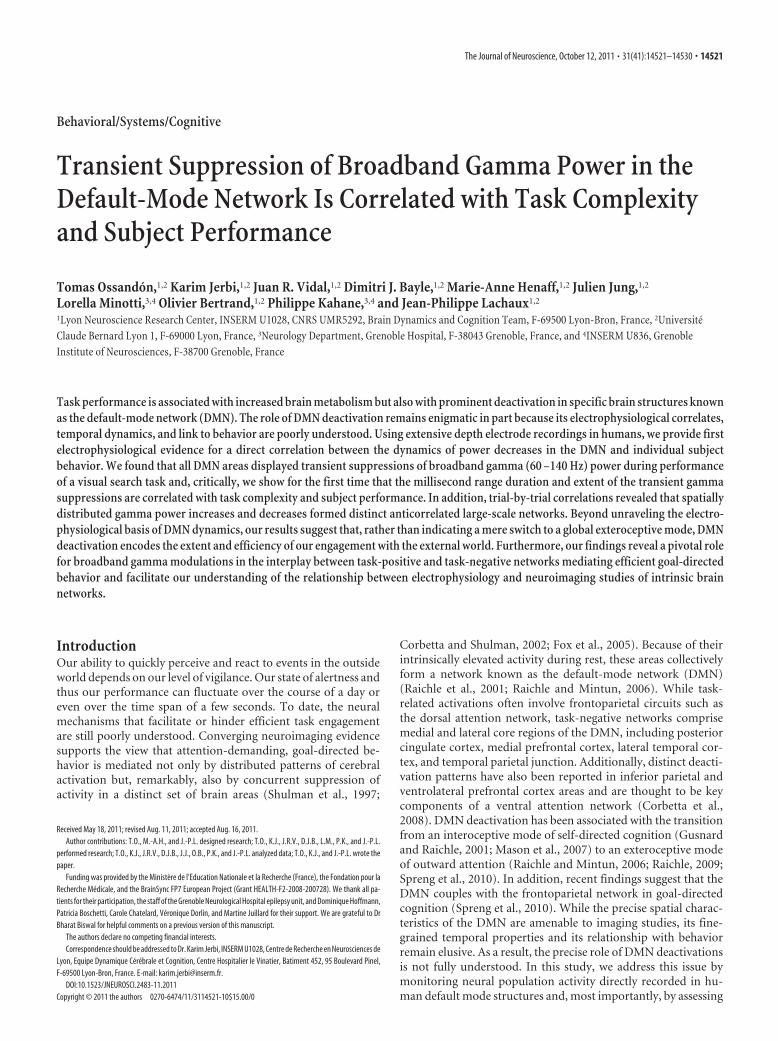
Behavioral/Systems/Cognitive
Transient Suppression of Broadband Gamma Power in theDefault-Mode Network Is Correlated with Task Complexityand Subject Performance
Tomas Ossandon,1,2 Karim Jerbi,1,2 Juan R. Vidal,1,2 Dimitri J. Bayle,1,2 Marie-Anne Henaff,1,2 Julien Jung,1,2
Lorella Minotti,3,4 Olivier Bertrand,1,2 Philippe Kahane,3,4 and Jean-Philippe Lachaux1,2
1Lyon Neuroscience Research Center, INSERM U1028, CNRS UMR5292, Brain Dynamics and Cognition Team, F-69500 Lyon-Bron, France, 2UniversiteClaude Bernard Lyon 1, F-69000 Lyon, France, 3Neurology Department, Grenoble Hospital, F-38043 Grenoble, France, and 4INSERM U836, GrenobleInstitute of Neurosciences, F-38700 Grenoble, France
Task performance is associated with increased brain metabolism but also with prominent deactivation in specific brain structures knownas the default-mode network (DMN). The role of DMN deactivation remains enigmatic in part because its electrophysiological correlates,temporal dynamics, and link to behavior are poorly understood. Using extensive depth electrode recordings in humans, we provide firstelectrophysiological evidence for a direct correlation between the dynamics of power decreases in the DMN and individual subjectbehavior. We found that all DMN areas displayed transient suppressions of broadband gamma (60 –140 Hz) power during performanceof a visual search task and, critically, we show for the first time that the millisecond range duration and extent of the transient gammasuppressions are correlated with task complexity and subject performance. In addition, trial-by-trial correlations revealed that spatiallydistributed gamma power increases and decreases formed distinct anticorrelated large-scale networks. Beyond unraveling the electro-physiological basis of DMN dynamics, our results suggest that, rather than indicating a mere switch to a global exteroceptive mode, DMNdeactivation encodes the extent and efficiency of our engagement with the external world. Furthermore, our findings reveal a pivotal rolefor broadband gamma modulations in the interplay between task-positive and task-negative networks mediating efficient goal-directedbehavior and facilitate our understanding of the relationship between electrophysiology and neuroimaging studies of intrinsic brainnetworks.
IntroductionOur ability to quickly perceive and react to events in the outsideworld depends on our level of vigilance. Our state of alertness andthus our performance can fluctuate over the course of a day oreven over the time span of a few seconds. To date, the neuralmechanisms that facilitate or hinder efficient task engagementare still poorly understood. Converging neuroimaging evidencesupports the view that attention-demanding, goal-directed be-havior is mediated not only by distributed patterns of cerebralactivation but, remarkably, also by concurrent suppression ofactivity in a distinct set of brain areas (Shulman et al., 1997;
Corbetta and Shulman, 2002; Fox et al., 2005). Because of theirintrinsically elevated activity during rest, these areas collectivelyform a network known as the default-mode network (DMN)(Raichle et al., 2001; Raichle and Mintun, 2006). While task-related activations often involve frontoparietal circuits such asthe dorsal attention network, task-negative networks comprisemedial and lateral core regions of the DMN, including posteriorcingulate cortex, medial prefrontal cortex, lateral temporal cor-tex, and temporal parietal junction. Additionally, distinct deacti-vation patterns have also been reported in inferior parietal andventrolateral prefrontal cortex areas and are thought to be keycomponents of a ventral attention network (Corbetta et al.,2008). DMN deactivation has been associated with the transitionfrom an interoceptive mode of self-directed cognition (Gusnardand Raichle, 2001; Mason et al., 2007) to an exteroceptive modeof outward attention (Raichle and Mintun, 2006; Raichle, 2009;Spreng et al., 2010). In addition, recent findings suggest that theDMN couples with the frontoparietal network in goal-directedcognition (Spreng et al., 2010). While the precise spatial charac-teristics of the DMN are amenable to imaging studies, its fine-grained temporal properties and its relationship with behaviorremain elusive. As a result, the precise role of DMN deactivationsis not fully understood. In this study, we address this issue bymonitoring neural population activity directly recorded in hu-man default mode structures and, most importantly, by assessing
Received May 18, 2011; revised Aug. 11, 2011; accepted Aug. 16, 2011.Author contributions: T.O., M.-A.H., and J.-P.L. designed research; T.O., K.J., J.R.V., D.J.B., L.M., P.K., and J.-P.L.
performed research; T.O., K.J., J.R.V., D.J.B., J.J., O.B., P.K., and J.-P.L. analyzed data; T.O., K.J., and J.-P.L. wrote thepaper.
Funding was provided by the Ministere de l’Education Nationale et la Recherche (France), the Fondation pour laRecherche Medicale, and the BrainSync FP7 European Project (Grant HEALTH-F2-2008-200728). We thank all pa-tients for their participation, the staff of the Grenoble Neurological Hospital epilepsy unit, and Dominique Hoffmann,Patricia Boschetti, Carole Chatelard, Veronique Dorlin, and Martine Juillard for their support. We are grateful to DrBharat Biswal for helpful comments on a previous version of this manuscript.
The authors declare no competing financial interests.Correspondence should be addressed to Dr. Karim Jerbi, INSERM U1028, Centre de Recherche en Neurosciences de
Lyon, Equipe Dynamique Cerebrale et Cognition, Centre Hospitalier le Vinatier, Batiment 452, 95 Boulevard Pinel,F-69500 Lyon-Bron, France. E-mail: [email protected].
DOI:10.1523/JNEUROSCI.2483-11.2011Copyright © 2011 the authors 0270-6474/11/3114521-10$15.00/0
The Journal of Neuroscience, October 12, 2011 • 31(41):14521–14530 • 14521

its modulation as a function of task engagement and perfor-mance. Using extensive brain-wide, intracerebral depth record-ings in surgical epilepsy patients performing a visual search task,we found that DMN neural populations display task-related,high-frequency power suppressions in the high gamma range(60 –140 Hz). Above all, we reveal for the first time that thefine-scale temporal dynamics of such broadband gammapower suppression in DMN regions are tightly correlated withtask demands and subject performance on a trial-by-trial ba-sis. Our findings further suggest that efficient goal-directedbehavior is mediated by an intricate interplay between anti-correlated networks of distributed broadband gamma powerincreases and decreases.
Materials and MethodsStimuli and experimental designThe stimuli used in this study are an adaptation of a classical visual searchtest developed by Treisman and Gelade (1980). Each stimulus consistedof an array of 36 letters (6 � 6 square array with 35 Ls and one T ran-domly arranged). Participants were instructed to search as fast as possiblefor the “T” and press a response button as soon as they found it. Twomain experimental conditions were contrasted: an easy search conditionand a difficult search condition (see Fig. 1 B). In the EASY condition, thetarget was gray while all distracters were black. To dissociate correct fromwrong responses the subjects were required to indicate whether the targetwas located in the upper or lower half of the display by pressing one oftwo response buttons. In the DIFFICULT condition, both distracters andtarget were gray. The difficult and easy condition stimuli were presentedrandomly for a fixed duration of 3 s and with an interstimulus interval of1 s. The stimuli were displayed on a 19 inch computer screen located 60cm away from the subject. Each experiment consisted of 6 runs of 5 minrecording blocks.
ParticipantsIntracranial recordings were obtained from 14 neurosurgical patientswith intractable epilepsy (11 women, mean age: 32 � 10 years) at theEpilepsy Department of the Grenoble Neurological Hospital (Grenoble,France). All patients were stereotactically implanted with multi-lead EEGdepth electrodes. All electrode data exhibiting pathological waveformswere discarded from the present study. This was achieved in collabora-tion with the medical staff and was based on visual inspection of therecordings and by systematically excluding data from any electrode sitethat was a posteriori found to be located within the seizure onset zone. Allparticipants provided written informed consent, and the experimentalprocedures were approved by the Institutional Review Board and by theNational French Science Ethical Committee. Patient-specific clinical de-tails are provided in Table 1.
Electrode implantationEleven to fifteen semi-rigid, multi-lead electrodes were stereotactically im-planted in each patient. The stereotactic electroencephalography (SEEG)electrodes used have a diameter of 0.8 mm and, depending on the targetstructure, consist of 10 to 15 contact leads 2 mm wide and 1.5 mm apart(DIXI Medical Instruments). All electrode contacts were identified on eachpatient’s individual stereotactic implantation scheme and were subsequentlylocalized anatomically using Talairach and Tournoux’s proportional at-las (Talairach and Tounoux, 1993). In addition, computer-assistedmatching between a post-implantation CT scan and a preimplantation3-D MRI dataset (VoXim R, IVS Solutions) allowed for direct visual-ization of the electrode contacts on the patients brain anatomy usingACTIVIS (developed by INSERM U1028, CERMEP, and UMR 5230).Whenever available, we also used a post-implantation MRI to verifyelectrode localization. Visual inspection of the electrodes superposedon each subject’s individual MRI was used to check whether eachSEEG electrode was located in gray or white matter.
SEEG recordingsIntracerebral recordings were conducted using a video-SEEG monitor-ing system (Micromed), which allowed the simultaneous data recording
from 128 depth-EEG electrode sites. The data were bandpass filteredonline from 0.1 to 200 Hz and sampled at 512 Hz in 12 patients (datafrom the other two patients were digitized at 1024 Hz). At the time ofacquisition the data are recorded using a reference electrode located inwhite matter, and each electrode trace is subsequently re-referenced withrespect to its direct neighbor (bipolar derivations). This bipolar montagehas a number of advantages over common referencing. It helps eliminatesignal artifacts common to adjacent electrode contacts (such as the 50 Hzmains artifact or distant physiological artifacts) and achieves a high localspecificity by cancelling out effects of distant sources that spread equallyto both adjacent sites through volume conduction. The spatial resolutionachieved by the bipolar SEEG is on the order of 3 mm (Lachaux et al.,2003; Kahane et al., 2006; Jerbi et al., 2009). Both spatial resolution andspatial sampling achieved with SEEG differ slightly from that obtainedwith subdural grid electrocorticography (Jerbi et al., 2009).
Time–frequency analysis, gamma power, and envelopecomputationsTask-induced modulations of power across time and frequency wereobtained by standard time–frequency (TF) analysis using wavelets(Tallon-Baudry et al., 1997), and instantaneous signal amplitude profileswere computed using the Hilbert transform (Le Van Quyen et al., 2001).All wavelet-based TF map computations were performed with in-housesoftware package for electrophysiological signal analysis (ELAN) devel-oped at INSERM U1028, Lyon, France (Aguera et al., 2011). In additionto the use of wavelet-based analysis, we also examined the time course offrequency-specific signal envelope modulations using the Hilbert trans-form. Applying the Hilbert transform to the continuous recordings splitsthe data into instantaneous amplitude (i.e., envelope) and phase compo-nents in a given frequency interval. In addition to being a convenientmeasure of instantaneous amplitude modulations in a frequency range ofinterest, performing spectral analysis using the Hilbert transform wasalso used to confirm the TF results obtained independently by waveletanalysis. These comparisons provided an additional level of confidencein the results of spectral analysis reported throughout this study. For acomparison of wavelet decomposition and Hilbert transform, see Le VanQuyen et al. (2001). In the following, we describe the standard procedureused to compute task-related power modulations in the high gammaband (60 –140 Hz). The same method was used for calculations in otherfrequency bands.
Step 1: estimating gamma-band envelope (i.e., time course of gamma-band amplitude). Continuous SEEG signals were first bandpass filtered inmultiple successive 10 Hz wide frequency bands (e.g., 8 bands from[60 –70 Hz] to [130 –140 Hz]) using a zero phase shift noncausal finiteimpulse filter with 0.5 Hz roll-off. Next, for each bandpass filtered signalwe computed the envelope using standard Hilbert transform. The ob-tained envelope has a sampling rate of 64 Hz (i.e., one time sample every15,625 ms). Again, for each band this envelope signal (i.e., time-varyingamplitude) was divided by its mean across the entire recording session
Table 1. Participant description: age, gender, and description of epileptogenicfocus as determined by the clinical staff of Grenoble Neurological Hospital,Grenoble, France
Patient Age Gender Epileptogenic zone
S1 46 M Right temporal (anteromesial)S2 42 F Left temporal (anterior)S3 22 F Left frontal (operculum)S4 21 F Right frontal (prefrontal)S5 39 F Bi-frontalS6 35 F Right temporoparietalS7 45 F Right temporooccipitalS8 26 F Right frontal (premotor)S9 37 F Right frontal (premotor)S10 25 F Right centralS11 32 F Bi-temporalS12 19 F Right temporal (posterobasal)S13 17 M Left occipitalS14 47 M Left fronto (orbital)-insular
14522 • J. Neurosci., October 12, 2011 • 31(41):14521–14530 Ossandon et al. • Gamma Power Suppression in DMN and Link to Behavior

and multiplied by 100. This yields instantaneous envelope values ex-pressed in percentage (%) of the mean. Finally, the envelope signalscomputed for each consecutive frequency bands (e.g., 8 bands of 10 Hzintervals between 60 and 140 Hz) were averaged together to provide onesingle time series (the high gamma-band envelope) across the entiresession. By construction, the mean value of that time series across therecording session is equal to 100. Note that computing the Hilbert enve-lopes in 10 Hz sub-bands and normalizing them individually beforeaveraging over the broadband interval allows us to account for a biastoward the lower frequencies of the interval that would otherwise occurdue to the �1/f drop-off in amplitude.
Step 2: computing task-related time course of percentage gamma powermodulations. As for the wavelet-based TF analysis, we also computedtask-related “emergence” (i.e., stimulus-related or response-related in-creases or decreases in the amplitude of the gamma-band envelope).These modulations were computed by contrasting gamma-band ampli-tude during visual search to values obtained during the prestimulus base-line period (�400 to �100 ms). To test for significant increases ordecreases, we used a paired-sample Wilcoxon signed rank test followedby false discovery rate (FDR) correction across all time samples. The FDRapproach yields a corrected threshold for significance (Genovese et al.,2002) (e.g., Fig. 3). Note that for visualization purposes, all power pro-files are baseline corrected. Moreover, cluster-level gamma-band timecourses were obtained by event-locked time domain averaging acrosstrials and electrodes of the cluster (see Table 3 for cluster details).
Mapping intracranial EEG data to standard MNI brainTo obtain an anatomical representation of all significant power modula-tions for a given frequency band, we mapped pooled data from all sub-jects onto a standard Montreal Neurological Institute (MNI) brain. Thevalue assigned to each node of the MNI brain represents the average ofdata from all recording sites located within a maximum distance of 15mm from the node (for this purpose, all electrode coordinates weretransformed from Talairach to common MNI space). The individualdata averaged in this study represent Z values (Wilcoxon test, FDR cor-rected) for each subject; thereby they represent statistically significanttask-related increases or decreases of signal power in a given frequencyband (compared to a baseline period, as described above). This datamapping procedure provides, above all, a convenient way to pool andvisualize intracerebral EEG data from all subjects on a common MNIbrain and is used to identify anatomo-functional regions of interest formore precise analysis at the individual level. Using statistical significanceof gamma power suppression as functional criterion and its spatialdistribution as anatomical criterion the following major anatomo-functional deactivation clusters were obtained: posterior cingulate cortex(PCC), medial prefrontal cortex (MPFC), left and right ventrolateralprefrontal cortex (VLPFC), temporal parietal junction (TPJ), lateral tem-poral cortex (LTC), and middle frontal gyrus (MFG). Table 3 lists theelectrodes that define the gamma-band power increase and decreaseclusters as well as the coordinates of these ROIs and their anatomicallocation (Brodmann areas). Most importantly, all statistical analysis pro-vided throughout this study are based on single electrode or cluster-levelstatistical analysis using the estimated band-specific time series at eachelectrode of each subject (power envelopes obtained with Hilbert trans-form). In other words, the interpolated and averaged data represented onthe MNI brain maps are used for visualization purposes and not forstatistical analysis.
Computing onset and duration of gamma-bandpower suppressionsWe used signed rank Wilcoxon tests, followed by FDR correction (Geno-vese et al., 2002), across time samples to assess the statistical significance(p � 0.05) of event-related increases or decreases in the time course ofgamma-band power. Gamma-band power decrease (GBD), onset la-tency, and duration (see Table 2) were determined from gamma-powerenvelopes on the basis of statistical criteria (FDR; p � 0.05 for the laten-cies and t tests, p � 0.01 for the cluster-level inference).
Evaluating the relationship between GBD and performanceThe link between GBD strength and speed of target detection was exam-ined at two levels, cluster approach and single-trial analysis.
Cluster approach. For a given condition (e.g., difficult search), wesorted the trials into two groups: 50% fastest response trials (short reac-tion times) and 50% slowest response trials (long reaction times). Wecomputed mean GBD power separately for each group of trials using datafrom all electrodes of the power suppression cluster (task-negative clus-ter). Note that mean GBD was obtained by taking the mean of the am-plitude over a fixed time window during visual search: [from 200 to 700]ms for stimulus-locked analysis and [from �900 to �200] for response-locked analysis. We tested for differences in GBD for the two groups oftrials (50% fastest vs 50% slowest) using a paired t test (p � 0.01).
Single-trial analysis. Using single-trial electrode data, we computed thecorrelation between instantaneous gamma power and the reaction timesof the corresponding trials. This was performed for each time bin of asingle trial power envelope, resulting in a time series of correlation coef-ficients. Scatter plots were then used to illustrate the relationship betweenreaction times and single-trial gamma power at tmax, the time bin of peakcorrelation (e.g., Fig. 4 D).
Gamma-band large-scale correlation and anticorrelation analysisWe examined temporal correlations among gamma power envelopesfrom all recording sites located in task-positive networks (TPNs) andtask-negative networks (TNNs) in each subject. TPN and TNN consist ofelectrode clusters with significant stimulus induced gamma-band powerincreases and decreases respectively (see Table 3 for anatomical details).For each pair of electrodes the correlation was computed as follows. Foreach electrode site a time series was obtained by concatenating multiple1 s segments of gamma power envelope, one from each trial (from 0 to1000 ms following stimulus onset). For instance, a dataset with 100 trialswould yield a 100 s time series of raw gamma power envelope obtainedduring active task periods. Next, we calculated the cross-correlation be-tween the two signals at various time lags (within � 156 ms range) toidentify the maximum correlation value (i.e., maximum in terms of ab-solute value). Next, we computed correlations obtained with surrogatedatasets obtained by recomposing one of the two signals via randomshuffling of the trial order within the time series. This was carried out 99times for each electrode pair, yielding 99 correlation values. If the originalcorrelation between the two time series is higher (in absolute value) thanthe 99 surrogates, the correlation between the gamma envelopes at thetwo sites was considered to be statistically significant at p � 0.01. Aftercomputing all possible correlations between all relevant electrode pairswithin each subject, we evaluated the number of significant correlationsas a function of the type of electrode pair group to which they belong:intranetwork correlation (i.e., TPN-TPN and TNA-TNA electrode pairs)or internetwork correlation (i.e., TPN-TNA electrode pairs). The totalnumber of significant positive and negative correlations and their ratiowith respect to nonsignificant correlation was computed as a function ofcorrelation type (internetwork or intranetwork correlation). Finally, weused paired t test across subjects to test whether the negative or rather thepositive correlations were predominant in each correlation group (inter-network correlations and intranetwork correlations).
Table 2. Mean duration of significant gamma power suppression in the twoexperimental conditions (easy and difficult search) computed for all electrodes ofeach cluster across all 14 participants
Duration of GBD (ms)
LTC VLPFC TPJ PCC MPFC
Easy search (E) 135 (� 74) 387 (�56) 310 (�114) 178 (�84) 384 (�63)Difficult search (D) 470 (�72) 689 (�115) 383 (�149) 560 (�117) 1005 (�142)p value (E vs D) 0.0072225 0.0054465 0.235342 0.006786 0.0003145
The difference between GBD duration in easy and difficult search conditions is statistically significant (paired t test,p � 0.0001) for all clusters except the TPJ cluster.
Ossandon et al. • Gamma Power Suppression in DMN and Link to Behavior J. Neurosci., October 12, 2011 • 31(41):14521–14530 • 14523

ResultsTransient gamma power suppressionsin DMN areas during task performanceWe obtained a spatially dense sampling ofthe human brain by acquiring SEEG datafrom 1730 intracerebral recording sites in14 patients who underwent neurosurgicaltreatment for epilepsy (Fig. 1A). Partici-pants were presented with a search arrayand were instructed to detect a target (a Tamong the Ls) as fast as possible. We com-puted task-related spectral power modu-lations across time and frequency at allrecording sites in two experimental con-ditions: (1) an easy search; and (2) a diffi-cult search (Fig. 1B). Remarkably, duringvisual search a subset of recording sitesdisplayed strong power suppressions inthe high-gamma range (60 –140 Hz) thatwas occasionally associated with powerincreases at lower (�30 Hz) frequencies,as illustrated in Figure 1C. To evaluate thespatial distribution of such broadbandgamma power suppressions during visualsearch across the entire brain, we mappedall statistically significant task-relatedgamma-band decreases, GBDs, from allindividuals onto a normalized commonbrain (see Materials and Methods). Theresults in Figure 2 A show that the ana-tomical distribution of GBD bears astriking similarity with the classical DMN areas (Raichle et al.,2001). In addition to PCC, MPFC, and TPJ, we also observedstatistically significant suppressions bilaterally in VLPFC,LTC, and in right MFG.
Correlation between subject behavior and gammapower suppressionAnalysis of the behavioral data showed that correct target detec-tions (achieved within the fixed 3 s time window) dropped from91% hits in the easy search to 77% hits in the difficult search.Mean subject reaction times were significantly faster in the easy
search (1009 � 59 ms) than the difficult search (1678 � 79 ms)conditions (t � 34.24, p � 0.0001), suggesting longer task en-gagement during the difficult search. Remarkably, the direct elec-trophysiological recordings in all the GBD clusters reveal a longerlasting suppression of gamma power in the difficult search con-dition compared to the easy search condition (see Fig. 2B,D forcluster results and Fig. 3 for individual electrode data). In otherwords, the gamma suppression phenomenon lasted longer withhigher task complexity and longer task engagement. Further-more, mean onset times of significant gamma suppression ineach cluster were found to indicate that the earliest power de-
Figure 1. High-density depth electrode recordings during visual search. A, Left, Top and right side views of implanted electrodelocations represented on a 3-D reconstruction of a standard (MNI) brain. Blue dots represent the Talairach coordinates for allcontacts on all SEEG electrodes for all 14 subjects (total � 1730 recording sites). B, Example of visual search arrays for easy (blue)and difficult (red) conditions (subjects were asked to find the T among the Ls). C, Strong power suppression in broad-band gamma(60 –140 Hz) in right VLPFC during visual search. High gamma suppression also coincides with power increases in lower (�30 Hz)frequency range. The illustrative time–frequency map represent increases and decreases in spectral power compared to a pre-stimulus baseline level (baseline, [from �400 to �100] ms, Wilcoxon Z value).
Table 3. Anatomical details of the task positive network and the task negative network
Cluster Brodmann area(s) No. of electrode pairs No. of patients (of 14) ROI center (right hemisphere) ROI center (left hemisphere)
TNN PCC 31 11 5 (�4, �53, 30) (�4, �53, 30)TNN VLPFC 45/47 26 6 (50, 34, 6) (�49, 37, 6)TNN MPFC 32/10 12 5 (10, 45, 4) (10, 45, 4)TNN TPJ 40 7 4 (53, �31, 43) (�57, 27, 52)TNN LTC 21 12 5 (61, �31, �7) (�61, �34, �4)TNN MFG 9 6 3 (43, 8, 40) (�39, 47, 25)
TPN DLPFC 46 12 4 (43, 34, 26) (�50, 11, 16)TPN IPS 7 5 2 (23, �50, 49) n.a.TPN IPL 7/40 8 3 (40, �41, 41) n.a.TPN FEF 6 12 3 (12, �10, 56) (�18, �5, 49)TPN SMA/Pre-SMA 6 6 3 (6, �3, 54) (�10, 4, 49)TPN Inf prec gyrus 6/32 35 3 (38, �6, 56) (�38, �4, 40)TPN MT 19/37 51 7 (45, �61, 0) (�42, �58, �3)TPN Orbital gyrus 19/18/23 22 4 (37, �76, 11) (�24, �72, 0)
Electrodes that show statistically significant decrease or increase in gamma-band power (compared to prestimulus baseline levels) were assigned to the TNN or TPN group respectively (compare Fig. 6). Electrodes within the TNN and TPNwere grouped into multiple anatomical clusters. Given the combination of functional (i.e. statistically significant gamma power modulation, Wilcoxon test, p � 0.05, FDR correction) and anatomical criteria, the individual clusters within TNNand TPN represent anatomofunctional regions of interest (ROIs). The center of each cluster is obtained by computing the centroid of the Talairach coordinates of all recording sites it includes. Note that the coordinates of PCC, MPFC, and TPJROIs are consistent with the coordinates of these DMN structures as reported in the fMRI literature (e.g., Fox et al., 2005). DLPFC, Dorsolateral prefrontal cortex; FEF, frontal eye field; Inf prec gyrus, inferior precentral gyrus; IPL, inferior parietallobule; IPS intraparietal sulcus; MT, middle temporal cortex; SMA, supplementary motor area.
14524 • J. Neurosci., October 12, 2011 • 31(41):14521–14530 Ossandon et al. • Gamma Power Suppression in DMN and Link to Behavior

creases occurred in LTC and VLPFC clusters, followed by TPJ,PCC, and eventually MPFC [Fig. 2C, group effect F(4,98) � 6.817,p � 0.0001; Tukey’s honestly significant difference (HSD) test,p � 0.05]. Interestingly, the chronology of gamma power sup-pression in these clusters was the same regardless of task diffi-culty. Next, we addressed the link between the task-relatedgamma power decrease and behavioral performance by assessingthe putative relationship between the strength of gamma sup-pression and target detection speed. First, when splitting the datarecorded in all anatomical clusters into two subgroups of trials,50% shortest versus 50% longest reaction times, we foundquicker target detection to be associated with stronger gammasuppression in MPFC and VLPFC clusters (Fig. 4A). The corre-lation between GBD amplitude and performance (target detec-tion speed) was thus not as ubiquitous across the task-negativenetwork as the correlation between GBD duration and task com-plexity. Furthermore, the relationship between power suppressionand reaction time was also investigated in individual electrodedata (e.g., Fig. 4B–E). Remarkably, single-trial power analysis inindividual electrodes revealed statistically significant correlationbetween gamma suppression and target detection speed on atrial-by-trial basis (cf. illustrative example in Fig. 2C-E, correla-tion peak rho � 0.34968 at t � 736 ms, p � 0.001, Spearman’scorrelation test).
Functional specificity of broadband gammapower suppressionFurthermore, we also computed brain-wide, task-related powermodulations across theta (4 –7 Hz), alpha (8 –12 Hz), beta (13–30Hz) and low gamma (30 – 60 Hz) bands. Compared to lowerfrequencies, task-related (low and high) gamma suppression pat-
terns displayed the closest anatomical match with typical DMNdeactivation networks (Fig. 5). Note that power suppressionswere also observed in the beta-band in some DMN areas (e.g.,PCC). However, by contrast to GBD, beta-band decreases wereneither correlated with task complexity nor with subject perfor-mance (correlations did not achieve statistical significance, p �0.05). Furthermore, beta-band power suppression was not restrictedto DMN structures (see Fig. 5). Modulations of low-gamma (30–60Hz) power suppression showed statistically longer lasting decreasesin MPFC in the difficult compared to the easy search condition aswell as stronger reductions in LTC in association with faster re-sponses (p � 0.01, t test, both t � 2.73) (data not shown). Neverthe-less, low-gamma modulations failed to achieve the level ofsignificance and consistency across the full DMN network that wasobserved in the high gamma range (60–140 Hz).
Relationship between task-positive and task-negative gammamodulation networksIn addition to identifying the dynamics of GBD and its relation-ship with behavior, we also investigated task-related gamma bandactivation (GBA) and the putative interplay between task-relatednegative and positive gamma power modulations during visualsearch. Figure 6A depicts the brain-wide spatial distribution oftask-related GBD and GBA forming the task-negative networkand the task-positive network, respectively. Furthermore, wecomputed exhaustive pairwise correlation analysis between thetime courses of gamma power modulation across both networks.The global correlation results (Fig. 6B,C) indicate that TPN andTNN are predominantly negatively correlated (i.e., anticorre-lated), whereas TNN-TNN and TPN-TPN pairs of sites are pre-dominantly positively correlated (see Materials and Methods for
Figure 2. Brain-wide dynamics of gamma-band power decrease, GBD, during visual search. A, Anatomical distribution of statistically significant broad-band gamma (60 –140 Hz) suppressionobtained by mapping depth electrode data in all subjects (n � 14) to a standard brain. The spatial properties of GBD bear a striking resemblance to DMN maps previously reported with fMRI. Datasnapshot at t � 640 ms following search array presentation (only power decreases are shown here; see Fig. 5 for power increases and decreases and Materials and Methods for details) B, GBDtemporal profile during easy (blue) and difficult (red) search for four illustrative clusters: PCC, MPFC, LTC, and VLPFC left (L). Time t � 0 ms indicates onset of search array display. C, Mean GBD onsetfor each cluster. Values represent mean onset latency, i.e., time sample at which deactivation reached statistical significance (group effect F(4,98) � 6.817, p � 0.0001; Tukey’s HSD Test (*) indicatesp � 0.05). D, Duration of GBD for easy (blue) and difficult (red) visual search conditions. Values represent mean duration of significant deactivation across all electrodes of each cluster (t test (*)indicates t � 2.76, p � 0.01). See Table 2 for the details of task-related GBD duration and associated p values and Table 3 for GBD cluster details.
Ossandon et al. • Gamma Power Suppression in DMN and Link to Behavior J. Neurosci., October 12, 2011 • 31(41):14521–14530 • 14525
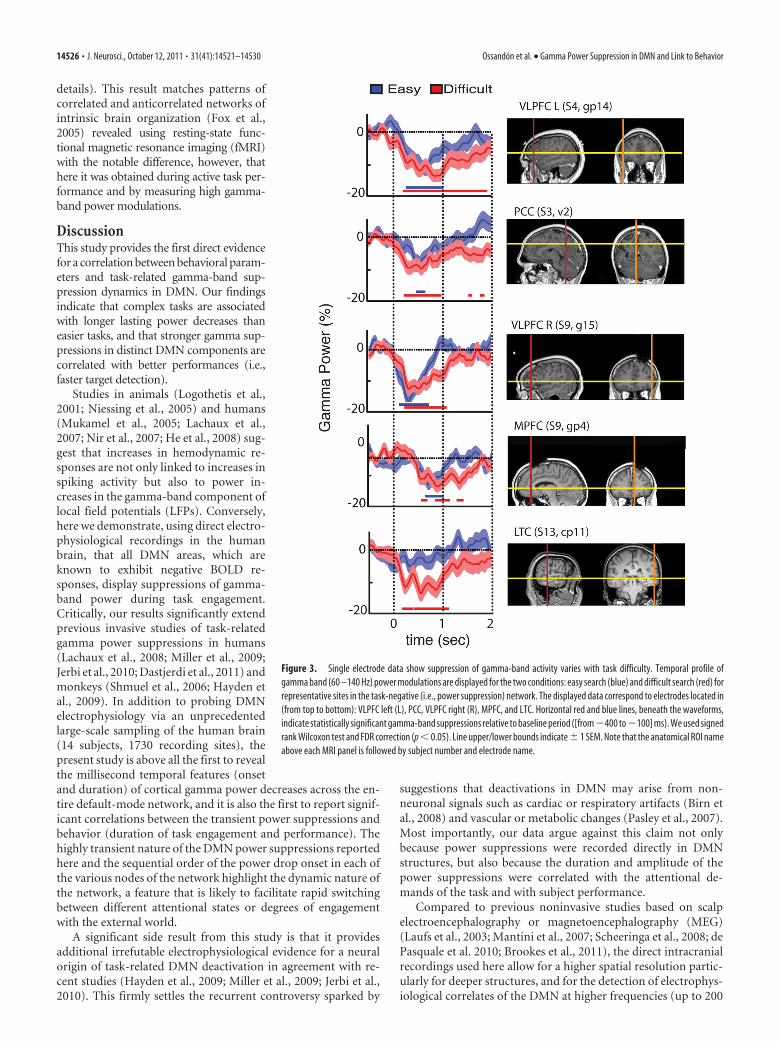
details). This result matches patterns ofcorrelated and anticorrelated networks ofintrinsic brain organization (Fox et al.,2005) revealed using resting-state func-tional magnetic resonance imaging (fMRI)with the notable difference, however, thathere it was obtained during active task per-formance and by measuring high gamma-band power modulations.
DiscussionThis study provides the first direct evidencefor a correlation between behavioral param-eters and task-related gamma-band sup-pression dynamics in DMN. Our findingsindicate that complex tasks are associatedwith longer lasting power decreases thaneasier tasks, and that stronger gamma sup-pressions in distinct DMN components arecorrelated with better performances (i.e.,faster target detection).
Studies in animals (Logothetis et al.,2001; Niessing et al., 2005) and humans(Mukamel et al., 2005; Lachaux et al.,2007; Nir et al., 2007; He et al., 2008) sug-gest that increases in hemodynamic re-sponses are not only linked to increases inspiking activity but also to power in-creases in the gamma-band component oflocal field potentials (LFPs). Conversely,here we demonstrate, using direct electro-physiological recordings in the humanbrain, that all DMN areas, which areknown to exhibit negative BOLD re-sponses, display suppressions of gamma-band power during task engagement.Critically, our results significantly extendprevious invasive studies of task-relatedgamma power suppressions in humans(Lachaux et al., 2008; Miller et al., 2009;Jerbi et al., 2010; Dastjerdi et al., 2011) andmonkeys (Shmuel et al., 2006; Hayden etal., 2009). In addition to probing DMNelectrophysiology via an unprecedentedlarge-scale sampling of the human brain(14 subjects, 1730 recording sites), thepresent study is above all the first to revealthe millisecond temporal features (onsetand duration) of cortical gamma power decreases across the en-tire default-mode network, and it is also the first to report signif-icant correlations between the transient power suppressions andbehavior (duration of task engagement and performance). Thehighly transient nature of the DMN power suppressions reportedhere and the sequential order of the power drop onset in each ofthe various nodes of the network highlight the dynamic nature ofthe network, a feature that is likely to facilitate rapid switchingbetween different attentional states or degrees of engagementwith the external world.
A significant side result from this study is that it providesadditional irrefutable electrophysiological evidence for a neuralorigin of task-related DMN deactivation in agreement with re-cent studies (Hayden et al., 2009; Miller et al., 2009; Jerbi et al.,2010). This firmly settles the recurrent controversy sparked by
suggestions that deactivations in DMN may arise from non-neuronal signals such as cardiac or respiratory artifacts (Birn etal., 2008) and vascular or metabolic changes (Pasley et al., 2007).Most importantly, our data argue against this claim not onlybecause power suppressions were recorded directly in DMNstructures, but also because the duration and amplitude of thepower suppressions were correlated with the attentional de-mands of the task and with subject performance.
Compared to previous noninvasive studies based on scalpelectroencephalography or magnetoencephalography (MEG)(Laufs et al., 2003; Mantini et al., 2007; Scheeringa et al., 2008; dePasquale et al. 2010; Brookes et al., 2011), the direct intracranialrecordings used here allow for a higher spatial resolution partic-ularly for deeper structures, and for the detection of electrophys-iological correlates of the DMN at higher frequencies (up to 200
Figure 3. Single electrode data show suppression of gamma-band activity varies with task difficulty. Temporal profile ofgamma band (60 –140 Hz) power modulations are displayed for the two conditions: easy search (blue) and difficult search (red) forrepresentative sites in the task-negative (i.e., power suppression) network. The displayed data correspond to electrodes located in(from top to bottom): VLPFC left (L), PCC, VLPFC right (R), MPFC, and LTC. Horizontal red and blue lines, beneath the waveforms,indicate statistically significant gamma-band suppressions relative to baseline period ([from�400 to�100] ms). We used signedrank Wilcoxon test and FDR correction (p � 0.05). Line upper/lower bounds indicate � 1 SEM. Note that the anatomical ROI nameabove each MRI panel is followed by subject number and electrode name.
14526 • J. Neurosci., October 12, 2011 • 31(41):14521–14530 Ossandon et al. • Gamma Power Suppression in DMN and Link to Behavior
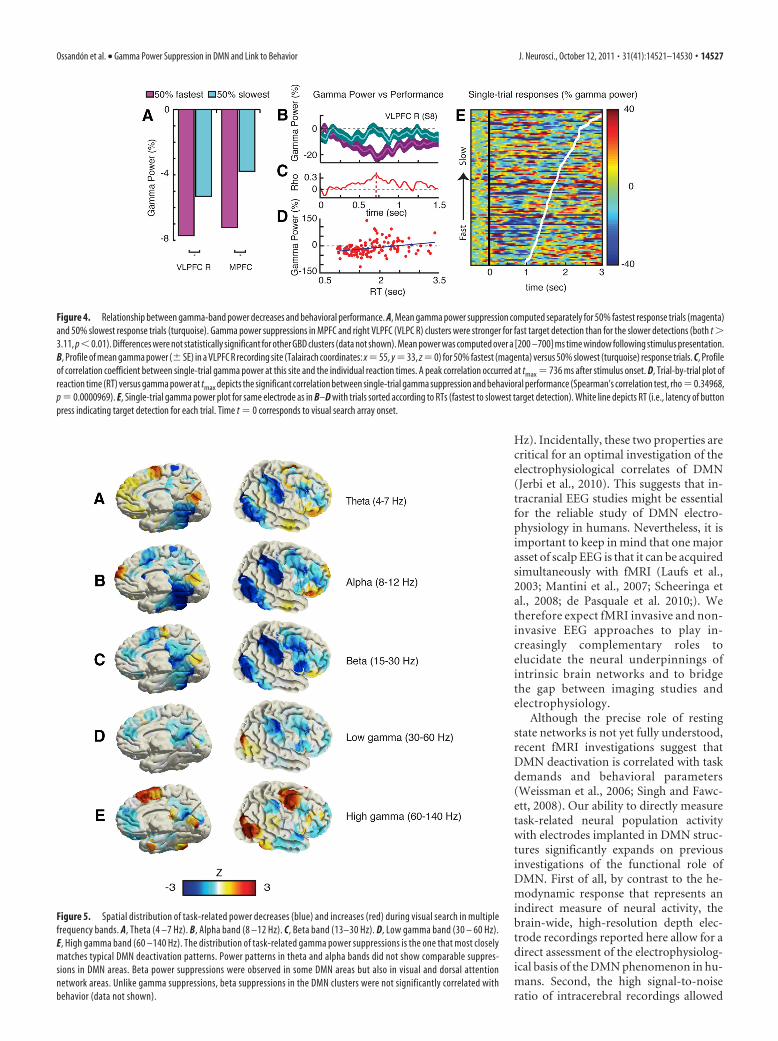
Hz). Incidentally, these two properties arecritical for an optimal investigation of theelectrophysiological correlates of DMN(Jerbi et al., 2010). This suggests that in-tracranial EEG studies might be essentialfor the reliable study of DMN electro-physiology in humans. Nevertheless, it isimportant to keep in mind that one majorasset of scalp EEG is that it can be acquiredsimultaneously with fMRI (Laufs et al.,2003; Mantini et al., 2007; Scheeringa etal., 2008; de Pasquale et al. 2010;). Wetherefore expect fMRI invasive and non-invasive EEG approaches to play in-creasingly complementary roles toelucidate the neural underpinnings ofintrinsic brain networks and to bridgethe gap between imaging studies andelectrophysiology.
Although the precise role of restingstate networks is not yet fully understood,recent fMRI investigations suggest thatDMN deactivation is correlated with taskdemands and behavioral parameters(Weissman et al., 2006; Singh and Fawc-ett, 2008). Our ability to directly measuretask-related neural population activitywith electrodes implanted in DMN struc-tures significantly expands on previousinvestigations of the functional role ofDMN. First of all, by contrast to the he-modynamic response that represents anindirect measure of neural activity, thebrain-wide, high-resolution depth elec-trode recordings reported here allow for adirect assessment of the electrophysiolog-ical basis of the DMN phenomenon in hu-mans. Second, the high signal-to-noiseratio of intracerebral recordings allowed
Figure 4. Relationship between gamma-band power decreases and behavioral performance. A, Mean gamma power suppression computed separately for 50% fastest response trials (magenta)and 50% slowest response trials (turquoise). Gamma power suppressions in MPFC and right VLPFC (VLPC R) clusters were stronger for fast target detection than for the slower detections (both t �3.11, p�0.01). Differences were not statistically significant for other GBD clusters (data not shown). Mean power was computed over a [200 –700] ms time window following stimulus presentation.B, Profile of mean gamma power (�SE) in a VLPFC R recording site (Talairach coordinates: x �55, y �33, z �0) for 50% fastest (magenta) versus 50% slowest (turquoise) response trials. C, Profileof correlation coefficient between single-trial gamma power at this site and the individual reaction times. A peak correlation occurred at tmax � 736 ms after stimulus onset. D, Trial-by-trial plot ofreaction time (RT) versus gamma power at tmax depicts the significant correlation between single-trial gamma suppression and behavioral performance (Spearman’s correlation test, rho�0.34968,p � 0.0000969). E, Single-trial gamma power plot for same electrode as in B–D with trials sorted according to RTs (fastest to slowest target detection). White line depicts RT (i.e., latency of buttonpress indicating target detection for each trial. Time t � 0 corresponds to visual search array onset.
Figure 5. Spatial distribution of task-related power decreases (blue) and increases (red) during visual search in multiplefrequency bands. A, Theta (4 –7 Hz). B, Alpha band (8 –12 Hz). C, Beta band (13–30 Hz). D, Low gamma band (30 – 60 Hz).E, High gamma band (60 –140 Hz). The distribution of task-related gamma power suppressions is the one that most closelymatches typical DMN deactivation patterns. Power patterns in theta and alpha bands did not show comparable suppres-sions in DMN areas. Beta power suppressions were observed in some DMN areas but also in visual and dorsal attentionnetwork areas. Unlike gamma suppressions, beta suppressions in the DMN clusters were not significantly correlated withbehavior (data not shown).
Ossandon et al. • Gamma Power Suppression in DMN and Link to Behavior J. Neurosci., October 12, 2011 • 31(41):14521–14530 • 14527

us to perform trial-by trial data analysis revealing, for the firsttime, a significant correlation between an electrophysiologicalfeature of DMN dynamics and subject performance on a trial-by-trial basis. Third, our study unravels the profile of DMN powersuppression with a temporal resolution, allowing us to preciselydetermine the onset times and duration of the power decreaseacross the full DMN network. Remarkably, this fine-grained eval-uation of DMN temporal dynamics as a function of task com-plexity unraveled the strikingly transient nature of the reductionin DMN gamma power. In fact, the high temporal resolution ofintracerebral EEG may be key to fine-tuning the functional dis-sociation between the DMN and the ventral frontoparietal net-work structures in goal-directed behavior (Corbetta et al., 2008;Spreng et al., 2010). As a matter of fact, our finding that taskengagement induced neural power suppression first in LTC,VLPFC, and TPJ structures before it occurred in PCC and MPFC.This observation could be taken as an indication that the ventralattention network is deactivated before the canonical DMNstructures in this visual search task. Whether this fine temporaldissociation between the two networks holds true for otherattention-demanding tasks is an exciting question for future in-tracranial EEG studies.
Moreover, accumulating evidence supports a direct relation-ship between broadband gamma and spiking activity (Nir et al.,2007; Ray et al., 2008; Manning et al., 2009; Ray and Maunsell,2011). Remarkably, electrophysiological recordings in the ma-caque have shown that gamma-band suppression in LFP signalsis associated with a decrease in neuronal firing (Shmuel et al.,
2006; Hayden et al., 2009). Taken in conjunction with these re-ports, our results suggest that DMN deactivation in humans isalso likely to coincide with transient task-related drops in neuro-nal firing. Beyond uncovering a key role for broadband gammaactivity in the electrophysiological mechanisms underlying DMNpower suppression, our results have direct implications on thefunctional interpretation of task-related neural deactivation. Thecorrelation we found between the decrease in DMN power andsubject behavior suggests that beyond indicating a switch from aninattentive or introspective state to an attentive exteroceptivemode, the extent and duration of DMN suppression actually en-code the quality of this transition, i.e., the efficiency and extent ofour engagement with the external world. Critically, the remark-ably transient nature of broadband gamma suppression in thedefault mode and ventral attention networks indicates that task-related reduction in cortical power is followed by a rapid returnto baseline levels immediately after completion of task process-ing. As shown in Table 2, the mean duration of task-relatedgamma suppression was as short as 135 ms in LTC (easy search)and could last up to 1005 ms in MPFC (difficult search).
Additionally, our results point toward a prominent role forthe network interplay between task-specific gamma increases andtask-unspecific gamma decreases in mediating goal-directed be-havior. Incorporating these findings in future research will fur-ther narrow the gap between fMRI studies and electrophysiologyand will advance our knowledge of large-scale neural synchroni-zation in the gamma band (Varela et al., 2001; Lakatos et al. 2008;Fries, 2009; Luo et al., 2010). In particular, our findings suggestthat modulations of broadband gamma activity can be observedlocally by task-related enhancement or suppression of power, butalso through task-related, long-range, amplitude–amplitude cor-relations and anticorrelations in the same frequency range. Ourunderstanding of the functional architecture of the human brainis being reshaped by resting-state fMRI studies that show howmultiple brain areas form distinct, large-scale, coherent networks(Biswal et al., 1995, 2010). Investigating the electrophysiologicalcorrelates of spontaneous coherent fluctuations with the tech-niques used in this study will provide critical insights into theneural mechanisms mediating fMRI functional connectivity. Inparticular, applying coupling measures to direct electrophysio-logical recordings obtained simultaneously from multiple DMNnodes will be critical to unravel the frequency characteristics anddirectionality of large-scale slow correlated oscillations and theirputative relationship with broadband gamma amplitude fluctu-ations (Jensen and Colgin, 2007; Lakatos et al. 2008; Dalal et al.,2011).
Because we did not have the possibility to acquire functionalMRI data from the patients we examined here, we cannot com-pletely rule out that the properties of the DMN in some of thesesubjects might have been directly or indirectly affected by epi-lepsy. Indeed, previous studies have reported possible alterationsof the DMN in some epilepsy patients (e.g., Broyd et al., 2009,Laufs et al., 2007; Sakurai et al., 2010, Zhang et al., 2010). Futurestudies that combine fMRI and intracranial EEG exploration ofthe DMN in the same population will be key to distinguishing thephysiological and pathological aspects of the electrophysiologicalunderpinnings of the DMN. In the present study, we minimizethe effect of epilepsy-related activity by excluding data from anyelectrode site that showed epileptic discharges or that was iden-tified as being part of the seizure onset zone.
Finally, our data suggest that broadband gamma modulationscould prove to be an efficient electrophysiological biomarker,complementing resting-state fMRI approaches, to investigate the
Figure 6. Correlated and anticorrelated gamma-band task networks. A, Spatial distributionof task-related gamma decreases (blue) and increases (red) during visual search, representing atask negative network and a task positive network, respectively. While TNN closely matchesDMN and ventral attention network areas, TPN depicts concurrent activations in visual anddorsal attention network areas (data represent a snapshot of gamma power modulation at t �640 ms as compared to baseline level). B, Anticorrelated gamma networks. These measurecorrelation among TPN-TNN by assessing correlation between single-trial data from all elec-trodes of TPN ROIs and TNN ROIs. C, Correlated gamma networks. These are the same as in B, butelectrode pairs for the correlation analysis were always from the same type of network i.e.,TPN-TPN and TNN-TNN correlations (TPN and TNN anatomical regions and electrode details areprovided in Table 3).
14528 • J. Neurosci., October 12, 2011 • 31(41):14521–14530 Ossandon et al. • Gamma Power Suppression in DMN and Link to Behavior

pathophysiology of neurological diseases that involve DMN dys-function. These include attention deficit hyperactivity disorders,autism, depression, Alzheimer’s disease, and schizophrenia (Gre-icius et al., 2004; Garrity et al., 2007; Castellanos et al., 2008;Broyd et al., 2009; Uhlhaas and Singer, 2010). For such a perspec-tive to become clinical routine, the challenge remains to localizebroadband gamma brain signals using noninvasive methods(e.g., MEG or EEG) with sufficiently high spatial and temporalresolution (Jerbi et al., 2009) to warrant the type of DMN assess-ment achieved here with intracerebral recordings.
ReferencesAguera PE, Jerbi K, Caclin A, Bertrand O (2011) ELAN: a software package
for analysis and visualization of MEG, EEG, and LFP signals. ComputIntell Neurosci 2011:158970.
Birn RM, Murphy K, Bandettini PA (2008) The effect of respiration varia-tions on independent component analysis results of resting state func-tional connectivity. Hum Brain Mapp 29:740 –750.
Biswal BB, Mennes M, Zuo XN, Gohel S, Kelly C, Smith SM, Beckmann CF,Adelstein JS, Buckner RL, Colcombe S, Dogonowski AM, Ernst M, Fair D,Hampson M, Hoptman MJ, Hyde JS, Kiviniemi VJ, Kotter R, Li SJ, LinCP, et al. (2010) Toward discovery science of human brain function.Proc Natl Acad Sci U S A 107:4734 – 4739.
Biswal B, Yetkin FZ, Haughton VM, Hyde JS (1995) Functional connectiv-ity in the motor cortex of resting human brain using echo-planar MRI.Magn Reson Med 34:537–541.
Brookes MJ, Wood JR, Stevenson CM, Zumer JM, White TP, Liddle PF,Morris PG (2011) Changes in brain network activity during workingmemory tasks: a magnetoencephalography study. Neuroimage55:1804 –1815.
Broyd SJ, Demanuele C, Debener S, Helps SK, James CJ, Sonuga-Barke EJ(2009) Default-mode brain dysfunction in mental disorders: a systematicreview. Neurosci Biobehav Rev 33:279 –296.
Castellanos FX, Margulies DS, Kelly C, Uddin LQ, Ghaffari M, Kirsch A, ShawD, Shehzad Z, Di Martino A, Biswal B, Sonuga-Barke EJ, Rotrosen J, AdlerLA, Milham MP (2008) Cingulate-precuneus interactions: A new locusof dysfunction in adult attention-deficit/hyperactivity disorder. Biol Psy-chiatry 63:332–337.
Corbetta M, Shulman GL (2002) Control of goal-directed and stimulus-driven attention in the brain. Nat Rev Neurosci 3:201–215.
Corbetta M, Patel G, Shulman GL (2008) The reorienting system of thehuman brain: From environment to theory of mind. Neuron 58:306 –324.
Dalal SS, Vidal JR, Hamame CM, Ossandon T, Bertrand O, Lachaux JP, JerbiK (2011) Spanning the rich spectrum of the human brain: slow waves togamma and beyond. Brain Struct Funct 216:77– 84.
Dastjerdi M, Foster BL, Nasrullah S, Rauschecker AM, Dougherty RF,Townsend JD, Chang C, Greicius MD, Menon V, Kennedy DP, Parvizi J(2011) Differential electrophysiological response during rest, self-referential, and non-self-referential tasks in human posteromedial cortex.Proc Natl Acad Sci U S A 108:3023–3028.
de Pasquale F, Della Penna S, Snyder AZ, Lewis C, Mantini D, Marzetti L,Belardinelli P, Ciancetta L, Pizzella V, Romani GL, Corbetta M (2010)Temporal dynamics of spontaneous MEG activity in brain networks. ProcNatl Acad Sci U S A 107:6040 – 6045.
Fox MD, Snyder AZ, Vincent JL, Corbetta M, Van Essen DC, Raichle ME(2005) The human brain is intrinsically organized into dynamic, anticor-related functional networks. Proc Natl Acad Sci U S A 102:9673–9678.
Fries P (2009) Neuronal gamma-band synchronization as a fundamentalprocess in cortical computation. Annu Rev Neurosci 32:209 –224.
Garrity AG, Pearlson GD, McKiernan K, Lloyd D, Kiehl KA, Calhoun VD(2007) Aberrant “default mode” functional connectivity in schizophre-nia. Am J Psychiat 164:450 – 457.
Genovese CR, Lazar NA, Nichols T (2002) Thresholding of statistical mapsin functional neuroimaging using the false discovery rate. Neuroimage15:870 – 878.
Greicius MD, Srivastava G, Reiss AL, Menon V (2004) Default-mode net-work activity distinguishes Alzheimer’s disease from healthy aging: evi-dence from functional MRI. Proc Natl Acad Sci U S A 101:4637– 4642.
Gusnard DA, Raichle ME (2001) Searching for a baseline: functional imag-ing and the resting human brain. Nat Rev Neurosci 2:685– 694.
Hayden BY, Smith DV, Platt ML (2009) Electrophysiological correlates of
default-mode processing in macaque posterior cingulate cortex. ProcNatl Acad Sci U S A 106:5948 –5953.
He BJ, Snyder AZ, Zempel JM, Smyth MD, Raichle ME (2008) Electrophys-iological correlates of the brain’s intrinsic large-scale functional architec-ture. Proc Natl Acad Sci U S A 105:16039 –16044.
Jensen O, Colgin LL (2007) Cross-frequency coupling between neuronaloscillations. Trends Cogn Sci 11:267–269.
Jerbi K, Ossandon T, Hamame CM, Senova S, Dalal SS, Jung J, Minotti L,Bertrand O, Berthoz A, Kahane P, Lachaux JP (2009) Task-relatedgamma-band dynamics from an intracerebral perspective: review andimplications for surface EEG and MEG. Hum Brain Mapp 30:1758 –1771.
Jerbi K, Vidal JR, Ossandon T, Dalal SS, Jung J, Hoffmann D, Minotti L,Bertrand O, Kahane P, Lachaux JP (2010) Exploring the electrophysio-logical correlates of the default-mode network with intracerebral EEG.Front Syst Neurosci 4:27.
Kahane P, Landre E, Minotti L, Francione S, Ryvlin P (2006) The Bancaudand Talairach view on the epileptogenic zone: a working hypothesis. Ep-ileptic Disord 8 [Suppl 2]:S16 –S26.
Lachaux JP, Rudrauf D, Kahane P (2003) Intracranial EEG and humanbrain mapping. J Physiol Paris 97:613– 628.
Lachaux JP, Fonlupt P, Kahane P, Minotti L, Hoffmann D, Bertrand O, BaciuM (2007) Relationship between task-related gamma oscillations andBOLD signal: New digits from combined fMRI and intracranial EEG.Hum Brain Mapp 28:1368 –1375.
Lachaux JP, Jung J, Mainy N, Dreher JC, Bertrand O, Baciu M, Minotti L,Hoffmann D, Kahane P (2008) Silence is golden: transient neural deac-tivation in the prefrontal cortex during attentive reading. Cereb Cortex18:443– 450.
Lakatos P, Karmos G, Mehta AD, Ulbert I, Schroeder CE (2008) Entrain-ment of neuronal oscillations as a mechanism of attentional selection.Science 320:110 –113.
Laufs H, Krakow K, Sterzer P, Eger E, Beyerle A, Salek-Haddadi A, Klein-schmidt A (2003) Electroencephalographic signatures of attentionaland cognitive default modes in spontaneous brain activity fluctuations atrest. Proc Natl Acad Sci U S A 100:11053–11058.
Laufs H, Hamandi K, Salek-Haddadi A, Kleinschmidt AK, Duncan JS,Lemieux L (2007) Temporal lobe interictal epileptic discharges affectcerebral activity in “Default mode” brain regions. Hum Brain Mapp28:1023–1032.
Le Van Quyen M, Foucher J, Lachaux J, Rodriguez E, Lutz A, Martinerie J,Varela FJ (2001) Comparison of Hilbert transform and wavelet methodsfor the analysis of neuronal synchrony. J Neurosci Methods 111:83–98.
Logothetis NK, Pauls J, Augath M, Trinath T, Oeltermann A (2001) Neuro-physiological investigation of the basis of the fMRI signal. Nature412:150 –157.
Luo L, Rodriguez E, Jerbi K, Lachaux JP, Martinerie J, Corbetta M, ShulmanGL, Piomelli D, Turrigiano GG, Nelson SB, Joels M, de Kloet ER, Hols-boer F, Amodio DM, Frith CD, Block ML, Zecca L, Hong JS, Dantzer R,Kelley KW, Craig AD (2010) Ten years of Nature Reviews Neuroscience:insights from the highly cited. Nat Rev Neurosci 11:718 –726.
Manning JR, Jacobs J, Fried I, Kahana MJ (2009) Broadband shifts in localfield potential power spectra are correlated with single-neuron spiking inhumans. J Neurosci 29:13613–13620.
Mantini D, Perrucci MG, Del Gratta C, Romani GL, Corbetta M (2007)Electrophysiological signatures of resting state networks in the humanbrain. Proc Natl Acad Sci U S A 104:13170 –13175.
Mason MF, Norton MI, Van Horn JD, Wegner DM, Grafton ST, Macrae CN(2007) Wandering minds: the default network and stimulus-inde-pendent thought. Science 315:393–395.
Miller KJ, Weaver KE, Ojemann JG (2009) Direct electrophysiological mea-surement of human default network areas. Proc Natl Acad Sci U S A106:12174 –12177.
Mukamel R, Gelbard H, Arieli A, Hasson U, Fried I, Malach R (2005) Cou-pling between neuronal firing, field potentials, and FMRI in human au-ditory cortex. Science 309:951–954.
Niessing J, Ebisch B, Schmidt KE, Niessing M, Singer W, Galuske RA (2005)Hemodynamic signals correlate tightly with synchronized gamma oscil-lations. Science 309:948 –951.
Nir Y, Fisch L, Mukamel R, Gelbard-Sagiv H, Arieli A, Fried I, Malach R(2007) Coupling between neuronal firing rate, gamma LFP, and BOLDfMRI is related to interneuronal correlations. Curr Biol 17:1275–1285.
Pasley BN, Inglis BA, Freeman RD (2007) Analysis of oxygen metabolism
Ossandon et al. • Gamma Power Suppression in DMN and Link to Behavior J. Neurosci., October 12, 2011 • 31(41):14521–14530 • 14529

implies a neural origin for the negative BOLD response in human visualcortex. Neuroimage 36:269 –276.
Raichle ME (2009) A paradigm shift in functional brain imaging. J Neurosci29:12729 –12734.
Raichle ME, Mintun MA (2006) Brain work and brain imaging. Annu RevNeurosci 29:449 – 476.
Raichle ME, MacLeod AM, Snyder AZ, Powers WJ, Gusnard DA, ShulmanGL (2001) A default mode of brain function. Proc Natl Acad Sci U S A98:676 – 682.
Ray S, Maunsell JH (2011) Different origins of gamma rhythm and high-gamma activity in macaque visual cortex. PLoS biology 9:e1000610.
Ray S, Crone NE, Niebur E, Franaszczuk PJ, Hsiao SS (2008) Neural corre-lates of high-gamma oscillations (60 –200 Hz) in macaque local field po-tentials and their potential implications in electrocorticography.J Neurosci 28:11526 –11536.
Sakurai K, Takeda Y, Tanaka N, Kurita T, Shiraishi H, Takeuchi F, Nakane S,Sueda K, Koyama T (2010) Generalized spike-wave discharges involve adefault mode network in patients with juvenile absence epilepsy: a MEGstudy. Epilepsy Res 89:176 –184.
Scheeringa R, Bastiaansen MC, Petersson KM, Oostenveld R, Norris DG,Hagoort P (2008) Frontal theta EEG activity correlates negatively withthe default mode network in resting state. Int J Psychophysiol 67:242–251.
Shmuel A, Augath M, Oeltermann A, Logothetis NK (2006) Negative func-tional MRI response correlates with decreases in neuronal activity inmonkey visual area V1. Nat Neurosci 9:569 –577.
Shulman GL, Fiez JA, Corbetta M, Buckner RL, Miezin FM, Raichle ME,
Petersen SE (1997) Common blood flow changes across visual tasks. II.Decreases in cerebral cortex. J Cogn Neurosci 9:648 – 663.
Singh KD, Fawcett IP (2008) Transient and linearly graded deactivation ofthe human default-mode network by a visual detection task. Neuroimage41:100 –112.
Spreng RN, Stevens WD, Chamberlain JP, Gilmore AW, Schacter DL (2010)Default network activity, coupled with the frontoparietal control net-work, supports goal-directed cognition. Neuroimage 53:303–317.
Talairach J, Tounoux P (1993) Referentially oriented cerebral MRI anat-omy: an atlas of stereotaxic anatomical correlations for gray and whitematter. New York: Thieme.
Tallon-Baudry C, Bertrand O, Delpuech C, Permier J (1997) Oscillatorygamma-band (30 –70 Hz) activity induced by a visual search task in hu-mans. J Neurosci 17:722–734.
Treisman AM, Gelade G (1980) Feature-integration theory of attention.Cogn Psychol 12:97–136.
Uhlhaas PJ, Singer W (2010) Abnormal neural oscillations and synchronyin schizophrenia. Nat Rev Neurosci 11:100 –113.
Varela F, Lachaux JP, Rodriguez E, Martinerie J (2001) The brainweb: phase syn-chronization and large-scale integration. Nat Rev Neurosci 2:229–239.
Weissman DH, Roberts KC, Visscher KM, Woldorff MG (2006) The neuralbases of momentary lapses in attention. Nat Neurosci 9:971–978.
Zhang Z, Lu G, Zhong Y, Tan Q, Liao W, Wang Z, Wang Z, Li K, Chen H, LiuY (2010) Altered spontaneous neuronal activity of the default-modenetwork in mesial temporal lobe epilepsy. Brain Res 1323:152–160.
14530 • J. Neurosci., October 12, 2011 • 31(41):14521–14530 Ossandon et al. • Gamma Power Suppression in DMN and Link to Behavior

93 93
SUPPLEMENTARY NOTES Note on the specificity of SEEG compared to ECoG. The use of stereotactic EEG (SEEG) is less wide-spread than that of Electrocorticography
(ECoG) in the clinical setting of drug-resistance epilepsy treatment. To date, some important
differences between these two intracranial EEG techniques remain unknown to the broader
community. Some SEEG specificities are crucial with regards to the present study. First of all,
by contrast to ECoG which consists of placing grid electrodes (or strips) directly on the
cortical surface, SEEG consists of implanting several semi-rigid multi-lead depth electrodes
inside the brain. This is achieved via a stereotactic approach developed by Talairach and
Bancaud35. As a result, SEEG provides direct recordings from deep structures and allows for
a sampling of brain activity all the way from the lateral surface to medial wall structures.
SEEG electrodes can also records from neural populations located deep within the sulci. Such
spatial sampling cannot be achieved with ECoG and represents a major asset for the extensive
investigation of distributed brain networks, such as the default-mode network. Furthermore,
the small SEEG inter-electrode distance (1.5 to 4.5 mm inter-electrode distance, compared to
1 cm in standard subdural ECoG grids) in combinations with bipolar derivations guarantees a
high spatial specificity and more robustness with respect to signal artifacts34.
Note on the definition of anatomo-functional clusters.
Mapping significant task-related power increases or decreases to standard MNI brain (as
described in previous section) allows for the identification of anatomo-functional clusters of
interest. For instance, what we refer to in this study as “deactivation clusters” was obtained by
mapping all significant gamma band deactivation (GBD) data from all subjects to the
common MNI brain. The result (Fig 2a) represents in blue all brain regions that show a
statistically significant suppression of high gamma power (60-140 Hz) during active search
compared to the pre-stimulus baseline level (data pooled across all subjects).
Using statistical significance of gamma deactivation as functional criterion and its spatial
distribution as anatomical criterion the following major anatomo-functional deactivation
clusters were obtained: Posterior Cingulate Cortex (PCC), Medial Prefrontal Cortex (MPFC),

94 94
L and R Ventrolateral Prefrontal Cortex (VLPFC), Temporal Parietal junction (TPJ), Lateral
Temporal Cortex (LTC) and Middle Frontal Gyrus (MFG). Supplementary Table 3 lists all
electrodes that define the gamma-band “deactivation cluster” as well as their coordinates and
anatomical location (Brodmann areas).
Note on excluding epilepsy-related data from the study.
We followed our routine procedures to ensure that all the analysis in this paper was performed
using recordings that originate from healthy cortical tissue and that the interpretations of the
data are not biased by pathological traces related to epileptic activity. This is achieved using
several procedures. First, we use automatic identification of electrodes that contain epileptic
spikes based on straight-forward amplitude thresholds. In addition, we visually scan all the
data obtained in each subject in search for artefactual and pathological traces, assisted by
expertise from the neurologists. All electrodes that contain pathological traces are excluded
from the study even if the abnormal activity was present on a small segment of the recordings.
Furthermore, after surgery is performed in order to remove the identified focus of the seizure,
we double-check that none of the sites kept for our analysis were part of the resected area.
Finally, any effects of residual isolated pathological events is further systematically
minimized by the type of data analysis we use: First, the task-related nature of our cross-trial
averaging analysis cancels out any effects that are not induced or evoked by the stimulus.
Second, outliers such as a particularly strong interictal events may show up on the averaged
map across trials but would not achieve statistical significance across trials. Finally, single-
trial analysis (e.g. single-trial gamma-band plots used in this study) shows the robustness and
consistency of the data across trials.

95 95
6.1. Context of the second article: Neuroscience and psychology have been converging on the idea that cognitive tasks,
including attention, that are carried out by networks of neural areas extending over much of
the brain, but involve localized computation involved in the task (Varela et al, 2001; Corbetta
et al, 2008). Findings from neuroimaging that cognitive tasks involve a number of different
anatomical areas has led to an emphasis on tracing the time dynamics of these areas. Because
shifts of attention can be so rapid, it is difficult to follow them with hemodynamic imaging.
To fill this role, different algorithms have been developed to relate the scalp distribution of
brain electrical activity, recorded from high-density electrical or magnetic sensors on or near
the skull, to brain areas active during hemodynamic imaging. This combination between
spatial localization with hemodynamic imaging and temporal precision from electrical or
magnetic skill recordings has provided an approach to measure the networks underlying goal
directed behaviors. Nevertheless, our understanding of the precise neural mechanisms
underlying attention within these networks remains fragmented, primarily because the
imaging techniques used to describe the functional organization of the human brain, fMRI and
PET, measure only metabolic changes induced by neural activity, with low temporal
resolution, and not the actual, fast-changing behavior of the neural networks themselves.
To date, the only data sufficiently precise to reveal these mechanisms have been obtained in
animals, with invasive intracranial microelectrodes recording from groups of individual
neurons. Results converge to show that attention acts as a ‘contrast gain control mechanism’
used to increase the firing rate of neurons whose receptive field is being attended, exactly as if
the contrast of the attended object had been increased (Reynolds & Chelazzi, 2004). On the
other hand, data obtained principally from event-related electrical brain potentials in humans
suggest that voluntary attentional orienting is initiated by medial portions of frontal cortex,
which then recruit medial parietal areas. Together, these areas sensitise the region-specific
visual-sensory cortex to facilitate the processing of upcoming stimuli (Grent-t-Jong &
Woldorff., 2007). These and other studies have substantiated the notion of top-down
processes (Sarter et al., 2001) by demonstrating sequential activation of frontal-parietal-
sensory regions, including decreases in task-irrelevant sensory regions, and the modulation of
neuronal activity in sensory and sensory-associational areas (Desimone and Duncan, 1995;
Hopfinger et al., 2000; kastner et al., 2000; Grent-t-Jong and Woldorff, 2007).

96 96
To solve this problem of the gap between local and large scale measures, one can use an
intermediate level of recording, the local field potential, which includes both post-synaptic
potentials and integrative activity occurring at the soma. This is constituted principally by a
stimulus-induced fast oscillation in the range 30-150 Hz, (Logothetis et al, 2001). Increasing
evidence suggest that gamma-band response (GBR, >40 Hz) might be a particularly efficient
marker of functional mapping. A recent series of intracranial EEG studies showing that
broadband energy increase of neural signals (50–150 Hz, the so-called gamma-band)
constitutes a precise marker identifying neural recruitment during cognitive processing
(Jensen et al., 2007; Jerbi et al., 2009; Lachaux et al., 2003). Such gamma-band responses
(GBRs) have been used to map the large-scale cortical networks underlying several major
cognitive functions, including language processing (Jung et al., 2008; Mainy et al., 2008),
attention (Jensen et al., 2007), and top–down processes (Engel et al., 2001; Kahana, 2006).
Those results are in line with a possible role of gamma-band neural synchronization in local
and large-scale neural communication (Fries et al., 2007; Lee, 2003; Singer, 1999; Varela et
al., 2001). Further, recent studies combining electrophysiological and BOLD measures using
fMRI have found a strong correlation between GBRs and the BOLD signal (Lachaux et al.,
2007; Logothetis et al., 2001; Mukamel et al., 2005).
Beginning with Crone and colleagues (1998), several studies describe transient intracranial
and ECoG power increases at 50-150 Hz (tGBRs), related to stimuli processing (Crone et al,
1998, Jacobs & Kahana, 2010; Manning et al., 2009; Lachaux et al., 2005). In contrast to the
transient GBRs, observed principally in primary sensory cortices, power increases in the
gamma band can be sustained when they are modulated by intrinsic sources (Engel et al,
2001). These top-down influences include the activity of systems involved in goal definition,
action planning, working memory or selective attention (Corbetta et al, 2002; Varela et al,
2001).
The main objective of this article is to distinguish transient neural responses elicited by
stimuli properties, from sustained responses elicited by intrinsic modulations. To test this
prediction in the most direct fashion, we used unprecedented brain-wide intracerebral depth recordings in 19 surgical patients performing a visual search task.

97 97
Second Article
Efficient ‘Pop-Out’ Visual Search Elicits Sustained Broadband Gamma Activity in the Dorsal
Attention Network
Tomas Ossandón*1, Juan R Vidal*1, Carolina Ciumas4,5, Karim Jerbi1, Carlos M. Hamamé1,
Sarang S. Dalal1,3, Olivier Bertrand1, Lorella Minotti2, Philippe Kahane2 and Jean-Philippe
Lachaux1.
1 INSERM U1028 - CNRS UMR5292, Brain Dynamics and Cognition Team, Lyon
Neuroscience Research Center; University Claude Bernard, Lyon 1, France
2 CHU Grenoble and Dept. Neurology, INSERM U704, Grenoble, France
3 Zukunftskolleg and Department of Psychology, University of Konstanz, Germany
4 Translational and Integrative Group in Epilepsy Research (TIGER), Lyon, France
5 Institute for Child and Adolescent with Epilepsy (IDEE), Lyon, France
*these authors contributed equally to this work
Running Title: Sustained broadband gamma reflects top-down processing Corresponding authors: Tomas Ossandon or Juan R. Vidal
E-mail: [email protected] or [email protected]
Tel: 00 33 4 72 13 89 00
Fax: 00 33 4 72 13 89 01
Keywords: ECoG, broadband gamma activity, visual search, top-down, bottom-up, attention,
epilepsy
98 98
Conflict of interest statement
The authors declare no competing financial interests.
Acknowledgements
We thank all patients for their participation; the staff of the Grenoble Neurological Hospital
epilepsy unit; Dominique Hoffmann, Patricia Boschetti, Carole Chatelard, Véronique Dorlin
and Martine Juillard for their support. Funding was provided by the Fondation pour la
Recherche Médicale (FRM) and by the BrainSync FP7 European Project (Grant HEALTH-
F2-2008-200728).

99
Abstract
An object that differs markedly from its surrounding – for example, a red cherry
among green leaves – seems to pop out effortlessly in our visual experience. The
rapid detection of salient targets, independently of the number of other items in the
scene, is thought to be mediated by efficient search brain mechanisms. It is not clear,
however, whether efficient search is actually an ‘effortless’ bottom-up process or if it
also involves regions of the prefrontal cortex generally associated with top-down
sustained attention. We addressed this question with a combined fMRI/intracerebral
EEG study designed to identify brain regions underlying a classic visual search task in
healthy subjects (fMRi) and correlate neural activity with target detection latencies on
a trial-by-trial basis with high temporal precision recordings of these regions in
epileptic patients (iEEG). The spatio-temporal dynamics of single-trial spectral
analysis of iEEG recordings revealed sustained energy increases in a broad gamma
band (50-150 Hz) throughout the duration of the search process in the entire dorsal
attention network both in efficient and inefficient search conditions. By contrast to
extensive theoretical and experimental indications that efficient search relies
exclusively on transient bottom-up processes in visual areas, we found that efficient
search is mediated by sustained gamma activity in the dorsal lateral prefrontal cortex
and the anterior cingulate cortex, alongside the superior parietal cortex and the frontal
eye field. Our findings support the hypothesis that active visual search systematically
involves the frontal-parietal attention network and therefore, executive attention
resources, irrespective of target saliency.

100
Introduction
When searching for a specific object in a crowded visual scene, search duration
depends on the dissimilarity between that object and its surroundings. Current
theories distinguish between efficient search, when the target spontaneously captures
attention because it differs from its background along a simple dimension (e.g., a red
cherry ‘pops out’ among green leaves) and inefficient search, when the search
requires attention to be shifted serially across the entire display to recognize the target
(Wolfe, 2003; Wolfe et al., 2011). A frontal-parietal network, comprising the frontal
eye fields (FEF) and the superior parietal lobule (SPL), drive those attentional shifts
exerting a continuous top-down influence on the visual cortex (Bisley and Goldberg,
2003; Moore and Armstrong, 2003; Buschman and Miller, 2007; Bressler et al., 2008;
Bisley and Goldberg, 2010). Both regions contain priority maps that guide attention
towards task-relevant and/or salient items (Shulman et al., 2002; Bichot et al., 2005;
Buschman and Miller, 2007; Kalla et al., 2008; Zhou and Desimone, 2011). The
action of the FEF and SPL is guided by the dorsal lateral prefrontal cortex (DLPFC)
and the dorsal anterior cingulate cortex (dACC). The DLPFC is actively involved in
executive aspects of working memory, attention and decision making (Barcelo et al.,
2000; Rowe et al., 2000; Procyk and Goldman-Rakic, 2006; Heekeren et al., 2008;
Kalla et al., 2009), which are crucial to identify and discard non-relevant distractors
when compared to the memorized target template (Duncan and Humphreys, 1989).
The dACC is thought to control the general engagement of attention in the task until
the target has been found (Cole and Schneider, 2007). However, while those four
regions have been identified to participate of inefficient search, their role during
efficient 'pop-out' search remains controversial. Predominant views suggest that the
capture of attention by targets that ‘pop-out’ is mainly a bottom-up process (Treisman

101
and Gelade, 1980; Desimone and Duncan, 1995; Corbetta and Shulman, 2002) with
little or no involvement of the aforementioned network. Indeed, theories on saliency
maps have provided efficient and purely bottom-up models solving efficient search
(Itti and Koch, 2001). However, alternative models suggest the need for top-down
processes to guide attention towards the target and perform categorical decision-
making, even during efficient search (Joseph et al., 1997; Cole and Schneider, 2007).
Therefore, current theories suggest two alternatives scenarios: (i) efficient search
might rely exclusively on transient bottom-up processes mediating the capture of
attention by salient targets, with no top-down contributions from frontal cortical areas,
or (ii) efficient and inefficient search would both require the continuous action of the
same fronto-parietal attentional network, presumably facilitated by bottom-up capture
processes during efficient search. To dissociate between those two scenarios, we
compared the timing of neural activation with search duration on a trial-by-trial basis
during efficient vs. inefficient search in key structures of the human fronto-parietal
network defined by a parallel fMRI study: FEF, SPL, DLPFC and dACC.
In line with previous visual attention studies in primates and humans (Fries et al.,
2001; Vidal et al., 2006; Buschman and Miller, 2007; Wyart and Tallon-Baudry,
2008), we found that deployment of visual attention is concomitant with sustained
energy increase of local field potentials in the high-frequency band (50 - 150 Hz):
broadband gamma activity was observed in the DLPFC, FEF, SPL and dACC and
were sustained throughout the search process at the single-trial level, during both
efficient and inefficient search. Altogether, our results support the view that both
efficient and inefficient search require active top-down processes from frontal
executive regions.

102
Materials and Methods
Stimuli and Experimental Design. Stimuli and paradigm were adapted from
Treisman and Gelade (1980). Each stimulus consisted of an array of 36 letters (6 x 6
square array with 35 distractors ‘L’s and one target ‘T’ randomly arranged) and
participants were instructed to find a target (present in all trials) as fast as possible
(Figure 1A). To dissociate correct from incorrect responses, subjects indicated
whether the target was located in the upper or lower half of the display by pressing on
a control pad, with their right index (upper button) or middle finger (lower button)
respectively. The initial experimental design consisted of 6 conditions with varying
distractor layout (contrast and quantity) in the displays. 11 out of 24 subjects
performed this experiment, while the remaining 13 subjects performed a simplified
design consisting of only two of the six conditions. In this study we focus on two
conditions, efficient and inefficient visual search, defined as follows: in the efficient
condition a gray target was presented among black distractors while in the inefficient
condition, all letters were gray (Figure 1A). Both conditions were presented randomly
for a fixed duration of 3 seconds and with an inter-stimulus interval (ISI) of 1 second.
The stimuli were displayed on a 19’’ computer screen located at 60 cm away from the
subject. Only data from trials with correct target detection were analyzed. Each
experimental block lasted 5 minutes, interleaved with short inter-block pauses.
Participants. Intracranial recordings were obtained from 24 neurosurgical patients
with intractable epilepsy (16 women, mean age: 34 ± 12 years) at the Epilepsy
Department of the Grenoble University Hospital. All subjects were stereotactically
103
implanted with multi-lead EEG depth electrodes simultaneously sampling lateral,
intermediate and medial wall structures. Electrode implantation was performed
according to routine procedures and all target structures for the presurgical evaluation
were selected strictly according to clinical considerations with no reference to the
current study. All recorded electrophysiological data exhibiting pathological activity
were discarded from the present study. All participants provided written informed
consent and the experimental procedures were approved by the Institutional Review
Board and by the National French Science Ethical Committee (CPPRB). All
participants had normal or corrected to normal vision.
Electrode implantation. Eleven to fifteen semi-rigid multi-lead electrodes were
stereotactically implanted in the brain of each patient. These stereotactic-EEG
electrodes have a diameter of 0.8 mm and, depending on the target structure, consist
of 10 to 15 contact leads 2 mm wide and 1.5 mm apart (DIXI Medical, Besançon,
France). Electrode contacts were identified on the patient’s individual stereotactic
implantation scheme, and were anatomically localized using Talairach and
Tournoux’s proportional atlas (Talairach and Tounoux, 1993). Computer-assisted
matching between a post-implantation CT-scan and a pre-implantation 3-D MRI data
set (VOXIM R, IVS, Solutions, Germany) allowed for direct visualization of the
electrode contacts on the patient’s brain anatomy using the ACTIVIS (Aguera et al.,
2011).
iEEG recordings. Intracerebral recordings were conducted using a video-iEEG
monitoring system (Micromed, Treviso, Italy), which allowed the simultaneous data
recording from 128 depth-EEG electrode sites. The data was bandpass-filtered online

104
from 0.1 to 200 Hz and sampled at 512 Hz in 22 subjects and 1024 Hz in the
remaining two. During the acquisition the data was recorded using a reference
electrode located in white matter. For subsequent analyses, each electrode trace was
referenced with respect to its direct neighbor by bipolar derivation. This final
electrode montage eliminates signal artifacts common to adjacent recording sites
(such as the 50 Hz power supply artifact or distant physiological artifacts) and
achieves a high local specificity by canceling out effects of distant sources that
equally spread to both adjacent sites through volume conduction (Lachaux et al.,
2003; Jerbi et al., 2009a,b). The spatial resolution achieved by this bipolar iEEG
montage is on the order of 3 mm. Eye movements were monitored by recording the
electro-oculogram (EOG) in all sessions.
Intracranial recordings: Spectral analysis and statistical measures. We used two
analysis techniques to assess spectral responses from neural recordings. Initially, we
computed a standard time-frequency (TF) wavelet decomposition, which allows
identifying major TF components of interest across all trials at each recording site.
This was carried out with the software package for electrophysiological analysis
(ELAN-pack) developed at the laboratory INSERM U1028 (Aguera et al., 2011). The
frequency range extended from 1 to 200 Hz and the time interval included a 300 ms
pre-stimulus baseline, from -400 ms to -100 ms, and lasted until stimulus offset (3000
ms). We estimated significant power responses compared to average baseline with the
Wilcoxon signed rank test (see Figure 1.C). Based on these results we determined a
frequency range of interest which was used to compute the Hilbert transform, to
evaluate the significance of this neural response with a lower degree of complexity
and thus with a higher statistical power. Applying the Hilbert transform to the
105
continuous recordings splits the data into instantaneous amplitude (i.e., envelope) and
phase components in a given frequency interval (Le Van Quyen et al., 2001). In
addition to being a convenient measure of instantaneous amplitude modulations in a
frequency range of interest, performing spectral analysis using the Hilbert transform
was also used to confirm the TF results obtained independently by wavelet analysis.
These comparisons provided an additional level of confidence in the results of
spectral analysis reported throughout this study. Hilbert transform and subsequent
envelope calculations were done with Matlab software (Mathworks Inc. Natick, MA,
USA).
Continuous iEEG signals were first band-pass filtered in multiple successive 10 Hz-
wide frequency bands (e.g., 10 bands, beginning with 50-60 Hz up to 140-150 Hz).
Next, for each band-pass filtered signal we computed the envelope using standard
Hilbert transform. The obtained envelope had a time resolution of 15.625 ms. Again,
for each band, this envelope signal (i.e., time-varying amplitude) was divided by its
mean across the entire recording session and multiplied by 100. This yields
instantaneous envelope values expressed in percent of the mean. Finally, the envelope
signals computed for each consecutive frequency bands (e.g., 10 bands of 10-Hz
intervals between 50-150 Hz) were averaged together, to provide one single time-
series (the high gamma-band envelope) across the entire session. By construction, the
mean value of that time-series across the recording session is equal to 100.
To estimate the significance of the amplitude responses across time (post-stimulus)
we compared each post-stimulus time-bin (0 ms to 3000ms) to an average pre-
stimulus baseline amplitude value (-400ms to -100ms) with a Wilcoxon signed rank
test followed by false discovery rate (FDR) correction (Genovese et al., 2002) across

106
all time samples. We used a non-parametric Kruskal-Wallis test to compare baseline-
corrected post-stimulus amplitude responses between efficient and inefficient search
followed by false discovery rate (FDR) correction across all time samples.
Mapping intracranial EEG data to standard MNI brain.
The anatomical representation of all significant amplitude modulations for a given
frequency band were obtained by pooling data from all subjects and mapping it onto a
standard Montreal Neurological Institute (MNI) brain based on the localization of
each electrode. The value assigned to each node of the MNI brain represents the
average of data from all recording sites located within a distance maximum 15 mm
from the node. The individual data averaged in this study represents the change in
amplitude (in %) compared to pre-stimulus baseline period (more detailed methods in
Ossandon et al, in press; Vidal et al., 2010). This data mapping procedure allows
visualizing intracerebral EEG data from all subjects on a common MNI brain and is
used to identify anatomo-functional regions of interest for further detailed analyses.
fMRI recordings
13 healthy controls (5 female subjects; mean age 31 years) were recorded in the same
visual search paradigm in a parallel fMRI experiment to define Regions of Interest
(ROIs) for the iEEG analysis.
fMRI Data Acquisition
107
MRI was performed on a 3-Tesla unit (Philips Achieva, Netherlands), equipped with
an 8-channel head coil. fMRI data were acquired using a whole-brain blood oxygen
level-dependent (BOLD) echo-planar imaging sequence, with repetition time 2.5 s,
echo time 30 ms, field of view (FOV) 92 x 90 mm, 0.4 mm adjacent transverse slices,
and 124 volumes per acquisition. For anatomic reference, a T1-weighted three-
dimensional (3D) turbo field echo was acquired with the following parameters: TR
6.9 ms, TE 3.1 ms, flip angle 8°, voxel size 1.10 × 1.10 × 1.20 mm, duration 10.53
ms.
1. Experimental Design
The experiment consisted of 3 blocks of each of the two stimulus types. Each block
consisted of presentations of 10 consecutive images, each of 2.5 s duration, giving
resulting in a total block length of 25 s. We used the same images described for the
iEEG recordings (efficient and inefficient visual search) with the target being located
in the left or right hemi field of the array. Subjects were instructed to press the button
on the left or right depending on the visual hemi field where the target letter appeared.
Block presentation was randomized, so that no two consecutive blocks contained the
same stimulus type. Each block was followed by a rest period of 25 s to allow
recovery of the hemodynamic response during which the subjects were looking at a
fixation cross.
2. fMRI Data Analysis
fMRI data analysis was carried out using statistical parametric mapping (SPM 5,
Wellcome Department of Cognitive Neurology, London, UK), implemented in
108
Matlab. The first 4 volumes were discarded to allow for T1 equilibration effects. All
images underwent slice timing, realignment across all two runs, spatial normalization
to the MNI template using a 4th Degree B-spline interpolation, and smoothing using
an isotropic 8-mm3 Full-Width-Half maximum kernel. Each individual data set was
then carefully screened for data quality via inspection for image artifacts and
excessive head motion (> 3 mm head motion or 2° head rotation). fMRI responses
were modeled using the General Linear Model (GLM) across all two runs modeled as
separate blocks with a canonical hemodynamic response function (HRF) convolved
for the length of each block, normalized to the global signal across the whole brain
across the entire session, and high-pass filtered (less than 128 s).
Second level random-effects analyses were performed using one-sample t-tests to
explore the main effect of each task condition during the experimental phase (between
task performance and baseline and between efficient and inefficient visual search
task). Statistical thresholds for one-sample t-tests were set at p < 0.05, with false
discovery rate (FDR).
Results
Behavioral results
Reaction times (RTs) in patients were shorter and performance higher during efficient
compared with inefficient search (RT: efficient: 1003 ms ± 70 s.e.m., inefficient:
1705 ms ± 138 s.e.m.; t = 17.05, p<0.001, see Figure 1B; performance: efficient: 95.3
%correct, inefficient 84.3 %correct; t=5.66, p<0.001). Similar results were obtained in
healthy control subjects during the fMRI session (efficient: 1006 ms ± 96 s.e.m.,
inefficient: 1415 ms ± 81 s.e.m.; t=5.53, p<0.001; efficient: 98.4%, inefficient 92.2%

109
of correct responses; t=2.78, p<0.01). Healthy controls had better performance on the
inefficient search condition (t = 2.04, p < 0.05), but both groups performed the
efficient search equally well.
Three distinct temporal profiles in the gamma band
iEEG data were collected from a total of 2413 intracerebral recording sites across 24
patients. TF statistical analysis revealed a significant post-stimulus spectral power
increase in a broad frequency range covering the low and high gamma-bands (50 –
150 Hz) in 352 sites (14.6% of all sites). This frequency range of interest (50 – 150
Hz) was used to compute the Hilbert transform (see Methods for details; Wilcoxon
test vs. baseline after Hilbert transformation, p<0.05, corrected for multiple
comparisons).
Among the significant sites, the post-stimulus broadband gamma activity (BGA)
amplitude was significant either for (i) the efficient search (16 sites), (ii) the
inefficient search (25 sites), or for both conditions (309 sites, see Figure 1B). Visual
inspection of those broadband gamma responses revealed a dissociation between short
transient responses time-locked to stimulus onset (type I), sustained energy increases
lasting the entire search process (type II) and late energy increases time-locked to the
motor response (type III) (Figure 2B). Our main question was whether type II
responses could be observed during efficient search and if so, in which brain
structures. To address this question, we defined this response type more precisely as
follows: any significant post-stimulus energy increase between 50 Hz and 150 Hz
which duration was correlated with reaction time on a single-trial basis; p < 0.05,
Spearman correlation, corrected). The duration of the increase was defined as the
110
number of samples during the 3 seconds following stimulus onset (the time of the
stimuli presentation) with an energy value higher than baseline (p<0.05, Wilcoxon
test, corrected). Trials in which responses occurred after 3 seconds were not analyzed
(less than 1% of trials). Such type II responses, called task-related BGA thereafter,
were found in 112 sites overall, mostly located in the frontal lobes (see Figure 2B). Of
the remaining 240 responsive sites, 72 had responses time-locked to the motor
response (i.e., a significant correlation between the latency of the response maximum
and the reaction time on a single-trial basis, Spearman correlation, corrected p<0.01;
see Figure 2B) located principally along the precentral and postcentral gyrus.
Finally, 123 sites had transient responses time-locked to stimulus onset, in which the
duration of BGA was completely independent of reaction times across the trials (90 of
which were located in the temporal lobes). 45 additional sites (13% overall) were
responsive but could not categorized as type I, II or III.
ROI identification with fMRI
Our strategy was to compare the strength and timing of type II responses during
efficient vs. inefficient search in the fronto-parietal network supporting visual search.
In order to achieve a spatial identification of the involved networks, in line with
previous neuroimaging studies, we also conducted an fMRI study in 13 healthy
participants during the same visual search conditions. As shown in figure 2A,
inefficient search elicited bilateral activation in the DLPFC, premotor cortex, inferior
frontal gyri (including Broca’s area), an extended parietal activation including the
superior parietal lobule, occipital and anterior cingulate gyrus. Efficient search
111
activated a smaller network, comprising only the occipital gyri, and in the left inferior
parietal lobule. See Figure 2A for comparison of fMRI and iEEG activation maps in
the inefficient vs. efficient search conditions.
Based on the fMRI study, the analysis of iEEG responses focused on four anatomical
ROIs (Figure 2A): DLPFC (bilateral, center coordinates: [43, 39, 22] and [-39, 28,
25], Talairach space), dACC (center coordinate: [-4, 16, 44]), SPL (bilateral, center
coordinates: [32, -50, 46] and [-36, -56, 45]) – and right and left intersection line
between precentral sulcus and middle frontal gyrus (PrCS/MFG, center coordinates
[44, -1, 39] and [-42, -2, 43]), including the proposed location of the human FEF
(Blanke et al., 2000; Lobel et al., 2001).
Task effects
63 of the 112 task-related BGA (type II) were located in one of these four ROIs
(Figure 3A). 19 in the DLPFC (7 patients), 20 in the PrCS/MFG (7 patients), 12 in the
SPL (6 patients), 12 in the dACC (4 patients). In all four ROIs, the majority of BGA
responses (85%) had no significant amplitude difference between the efficient and
inefficient search conditions (see Figure 3B, time windows: 100 to 600 ms after
stimulus presentation; p> 0.05, Kruskal-Wallis test, FDR corrected) (DLPFC: 17/19;
PrCS/MFG: 14/20; SPL: 11/12; dACC: 11/12).
The overall energy of the BGA was higher in the inefficient than in the efficient
search condition, but mostly because of longer reaction times, yielding longer
responses in the former condition (3 seconds, see Figure 1C and 3A). When
considering only trials with equivalent reaction time distributions (i.e., shortest
112
inefficient search vs. longest efficient search trials), we found that most (53 out of 63)
recording sites produced BGA responses with equivalent energy (Kruskal-Wallis test,
FDR corrected, p>0.05. At least 27 trials by condition were compared). In half of the
10 remaining sites, the energy of the average response over trials with matched
duration was higher in the efficient search condition. Overall, all four ROIs were
characterized by increases in broadband gamma activity that were sustained
throughout the duration of each trial, from stimulus onset to target detection. Most
importantly this was observed both for the pop-out (efficient search) and the more
complex (inefficient search) tasks with no significant difference in mean energy
between the two conditions.
Discussion
To the best of our knowledge, this study is the first to reveal a significant trial-by-trial
correlation between neuronal activity and behavioral paremeters during a visual
search task in humans. Significant correlations between reaction times and the
duration of sustained gamma-band responses provide clear evidence that the dorsal
attention network provide clear evidence that the dorsal attention network supported
by the dorsal ACC and the DLPFC in the frontal lobe, and by the SPL is equally
active during efficient and inefficient visual search. Differences in search duration
across the two conditions accounted for longer neural responses during inefficient
search, but onset latencies and response amplitudes were similar in both types of
search in the majority of frontal and parietal recording sites.
Sustained frontal activation during efficient visual search
113
Our results support the view that efficient and inefficient visual search rely on the
same network, despite previous models showing that salient targets can be detected by
purely bottom-up processes in the visual cortex (Treisman and Gelade, 1980; Itti and
Koch, 2001). In fact, the temporal dynamics of sustained broadband gamma activity
(BGA) increases accompanying efficient search is more compatible with top-down
influences than with bottom-up processes, which are usually characterized by early
and transient neural responses following stimulus onset.
The findings we report here need to be considered and incorporated into a previous
literature that supports the view that prefrontal areas, and especially the DLPFC, are
not necessary for efficient search. For instance, in an fMRI study, Leonards et al.
(2000) found that although the networks underlying efficient and inefficient search
overlapped almost completely, the DLPFC was active only during inefficient search.
This was later confirmed by Anderson et al. (2007), who reported no fMRI activation
in the DLPFC when participants searched for singletons – a typical efficient search
condition. One possible explanation might be that search durations are too short in the
efficient condition to elicit a BOLD response in the DLPFC that is sufficiently long to
be detected with fMRI. This would amount to a simple technical limitation of fMRI,
which is its low temporal resolution compared to electrophysiological recordings such
intracranial EEG, an interpretation which is compatible with the absence of
significant prefrontal activation in our own fMRI study during the efficient search
condition. However, the failure to detect prefrontal activations during efficient search
is not unique to fMRI studies. Kalla et al. (2009) reached similar conclusions with
Transcranial Magnetic Stimulation: TMS pulses delivered to the DLPFC did not
114
impair the participants’ ability to detect the presence of singletons in a crowded
display. This led them to conclude that this region is not necessary for efficient search
(Kalla et al., 2009). As recently summarized, and in fact questioned by Wardak et al.
(2010) in a monkey study, the classical view remains that efficient search involves
solely, or mainly, low-level preattentive processes.
Yet, there are reasons to believe that the DLPFC should be active during any kind of
visual search, be it efficient or inefficient. Several functions have been attributed to
the DLPFC: not only the guidance, control and monitoring of spatial attention but also
decision-making and response selection processes (Heekeren et al., 2004; Heekeren et
al., 2008), and working-memory, including the maintenance of a memory trace of the
task-set and the attention-set which define the task-at-hand (Corbetta and Shulman,
2002; Sakai, 2008). In direct contradiction with the previously mentioned fMRI and
TMS studies, our results support the view that at least a subset of those processes also
occurs during efficient search, in parallel with low-level detection processes. This
finding might be explained by the fact that our ‘efficient search’ condition required
that participants actually find the target and identify its spatial location, which clearly
involves decision-making and a working memory component, to maintain the
attention-set which defines the target.
In the three studies previously mentioned (Leonards et al., 2000; Anderson et al.,
2007; Kalla et al., 2009), participants simply had to report whether a singleton was
present or absent in the visual display. This might constitute an exceptionally easy
task for the visual system, which can be performed without any memory requirement.
The perceptual decision might amount to a simple low-level categorical scene
115
interpretation (Hochstein and Ahissar, 2002) discriminating between two general
configurations of displays: spatially homogeneous vs. inhomogeneous. Therefore,
their task would not necessarily require an actual search process per se, that is, the
localization of a pre-identified item embedded within a crowded visual environment,
but simply the detection that ‘the display looks odd and inhomogeneous’. When the
search is, indeed, a search, we argue that the prefrontal cortex is actively involved
even when the target is a salient target. This view is reminiscent of earlier claims by
Joseph et al. (1997) that even simple search tasks, including searching for simple
features, require central attentional resources and are disrupted when attention is
diverted away by a secondary task.
We propose that, during efficient search, bottom-up influences act in parallel with
top-down search processes to orient attention to the salient target and terminate the
search early. During the search process, sustained neural activity in the DLPFC, the
FEF and the SPL might reflect top-down influences from frontal areas to continuously
update saliency/priority maps in the parietal lobe (Bisley and Goldberg, 2010). We
further propose that top-down influences guide attention deployment as soon as
participants search for a pre-specified target, be it salient or not. In addition, the dorsal
ACC would drive and sustain the attentional effort until task-completion, again
independently of search condition (Dosenbach et al., 2006).
Gamma-band activity in the DLPFC, dACC and to a lesser extent the FEF would
therefore be characteristic of ‘active vision’: the search for task-relevant information
in a visual scene (Henderson, 2003). Therefore, we suggest that any search condition
necessarily activates the frontal executive system, as soon as search instructions
define that some items are ‘task-relevant’, which must then be maintained in an
116
attention-set and searched for. In other words, ‘searching’ inevitably contains an
active component that would be indissociable from active top-down frontal control, in
direct agreement with recent models of visual search (Wolfe, 2003). Purely bottom-up
attentional capture – free of frontal influences - would only occur in passive viewing
conditions, with no pre-specified target or when participants make an explicit effort to
adopt a passive cognitive strategy and let the target pop-out. In fact, a recent eye-
tracking study (Watson et al., 2010) showed that during an easy visual search,
participants had the natural tendency to react to the display onset with an immediate
and active visual exploration. However, it was possible to instruct participants to hold
their exploratory behavior and let the target pop-out, before making their first
saccade. This more passive strategy proved to be a more efficient extraction of visual
information. The study by Watson et al. (2010) is not in contradiction with the results
we report here. It rather indicates that ‘active search’ – involving the dorsal attention
network – might be just one option during efficient search, the most natural but not
necessarily the most efficient one, and another example that participants do not
spontaneously use the most efficient attentional strategy to perform easy tasks, as
suggested by several recent studies (Slagter et al., 2007; Slagter et al., 2009).
Sustained gamma-band responses during attentive search
That BGA increases during ’active vision‘ is an observation reminiscent of earlier
proposals that neural synchronization in the gamma-band might mediate attentional
selection (Murthy and Fetz, 1996; Fries, 2005, 2009). However, the frequency
bandwidth of the iEEG gamma band responses reported here extends well beyond the
narrow frequency band found in monkey studies (Fries et al., 2001; Buschman and

117
Miller, 2007) and might therefore correspond to a different mechanism. An
alternative, and possibly non-exclusive, interpretation, is that broadband gamma
responses reflect a global enhancement of the firing rate of the underlying neural
population, observed as a "spike bleed-through" in the field power spectra (Manning
et al., 2009; Ray and Maunsell, 2011). Indeed, recent studies combining multi-unit
recordings with iEEG in humans (Manning et al., 2009) or LFP in macaque monkeys
(Ray and Maunsell, 2011) have clearly demonstrated strong positive correlations
between BGA and co-occurring spike rates at the population level. Based on those
studies, we support the view that BGA can, at least, be understood as a proxy of the
global discharge rate – and therefore activity level – of the neural populations
recorded with iEEG, which is consistent with the tight relationship between BGA and
the BOLD signals measured with fMRI (Logothetis et al., 2001; Mukamel et al.,
2005; Niessing et al., 2005; Lachaux et al., 2007; Nir et al., 2007; Conner et al.,
2011).
A comparison of BOLD and BGA responses during visual search
The strong correlation reported in the litterature between BGA and BOLD signals
must then be reconciled with the fact that our fMRI study did not reveal significant
frontal activations during efficient search (Leonards et al., 2000; Nobre et al., 2003).
As mentioned earlier, one possibility might be that frontal haemodynamic responses
are too short-lived to be detected with fMRI, in contrast with the more sustained
responses characteristic of the inefficient search condition. However, fMRI detected
equally short responses in the visual cortex, in the easy search condition, maybe

118
because their amplitude was stronger. Future studies, combining simultaneous fMRI
and iEEG recordings, will be needed to resolve that issue (Vulliemoz et al., 2011).
References
Aguera PE, Jerbi K, Caclin A, Bertrand O (2011) ELAN: A Software Package for Analysis and Visualization of MEG, EEG, and LFP Signals. Computational Intelligence and Neuroscience 2011:11.
Anderson EJ, Mannan SK, Husain M, Rees G, Sumner P, Mort DJ, McRobbie D, Kennard C (2007) Involvement of prefrontal cortex in visual search. Exp Brain Res 180:289-302.
Barcelo F, Suwazono S, Knight RT (2000) Prefrontal modulation of visual processing in humans. Nat Neurosci 3:399-403.
Bichot NP, Rossi AF, Desimone R (2005) Parallel and serial neural mechanisms for visual search in macaque area V4. Science 308:529-534.
Bisley JW, Goldberg ME (2003) Neuronal activity in the lateral intraparietal area and spatial attention. Science 299:81-86.
Bisley JW, Goldberg ME (2010) Attention, intention, and priority in the parietal lobe. Annu Rev Neurosci 33:1-21.
Blanke O, Spinelli L, Thut G, Michel CM, Perrig S, Landis T, Seeck M (2000) Location of the human frontal eye field as defined by electrical cortical stimulation: anatomical, functional and electrophysiological characteristics. Neuroreport 11:1907-1913.
Bressler SL, Tang W, Sylvester CM, Shulman GL, Corbetta M (2008) Top-down control of human visual cortex by frontal and parietal cortex in anticipatory visual spatial attention. J Neurosci 28:10056-10061.
Buschman TJ, Miller EK (2007) Top-down versus bottom-up control of attention in the prefrontal and posterior parietal cortices. Science 315:1860-1862.
Cole MW, Schneider W (2007) The cognitive control network: Integrated cortical regions with dissociable functions. Neuroimage 37:343-360.
Conner CR, Ellmore TM, Pieters TA, Disano MA, Tandon N (2011) Variability of the Relationship between Electrophysiology and BOLD-fMRI across Cortical Regions in Humans. J Neurosci 31:12855-12865.
Corbetta M, Shulman GL (2002) Control of goal-directed and stimulus-driven attention in the brain. Nat Rev Neurosci 3:201-215.
Desimone R, Duncan J (1995) Neural mechanisms of selective visual attention. Annu Rev Neurosci 18:193-222.
Dosenbach NU, Visscher KM, Palmer ED, Miezin FM, Wenger KK, Kang HC, Burgund ED, Grimes AL, Schlaggar BL, Petersen SE (2006) A core system for the implementation of task sets. Neuron 50:799-812.
Duncan J, Humphreys GW (1989) Visual search and stimulus similarity. Psychol Rev 96:433-458.
Fries P (2005) A mechanism for cognitive dynamics: neuronal communication through neuronal coherence. Trends Cogn Sci 9:474-480.
Fries P (2009) Neuronal Gamma-Band Synchronization as a Fundamental Process in Cortical Computation. Annual Review of Neuroscience 32:209-224.
Fries P, Reynolds JH, Rorie AE, Desimone R (2001) Modulation of oscillatory neuronal synchronization by selective visual attention. Science 291:1560-1563.
119
Genovese CR, Lazar NA, Nichols T (2002) Thresholding of statistical maps in functional neuroimaging using the false discovery rate. Neuroimage 15:870-878.
Heekeren HR, Marrett S, Ungerleider LG (2008) The neural systems that mediate human perceptual decision making. Nat Rev Neurosci 9:467-479.
Heekeren HR, Marrett S, Bandettini PA, Ungerleider LG (2004) A general mechanism for perceptual decision-making in the human brain. Nature 431:859-862.
Henderson JM (2003) Human gaze control during real-world scene perception. Trends Cogn Sci 7:498-504.
Hochstein S, Ahissar M (2002) View from the top: hierarchies and reverse hierarchies in the visual system. Neuron 36:791-804.
Itti L, Koch C (2001) Computational modelling of visual attention. Nat Rev Neurosci 2:194-203.
Jerbi K, Ossandon T, Hamame CM, Senova S, Dalal SS, Jung J, Minotti L, Bertrand O, Berthoz A, Kahane P, Lachaux JP (2009a) Task-related gamma-band dynamics from an intracerebral perspective: review and implications for surface EEG and MEG. Hum Brain Mapp 30:1758-1771.
Jerbi K, Freyermuth S, Dalal S, Kahane P, Bertrand O, Berthoz A, Lachaux JP (2009b) Saccade related gamma-band activity in intracerebral EEG: dissociating neural from ocular muscle activity. Brain Topogr 22:18-23.
Joseph JS, Chun MM, Nakayama K (1997) Attentional requirements in a 'preattentive' feature search task. Nature 387:805-807.
Kalla R, Muggleton NG, Cowey A, Walsh V (2009) Human dorsolateral prefrontal cortex is involved in visual search for conjunctions but not features: a theta TMS study. Cortex 45:1085-1090.
Kalla R, Muggleton NG, Juan CH, Cowey A, Walsh V (2008) The timing of the involvement of the frontal eye fields and posterior parietal cortex in visual search. Neuroreport 19:1067-1071.
Lachaux JP, Rudrauf D, Kahane P (2003) Intracranial EEG and human brain mapping. Journal of Physiology-Paris 97:613-628.
Lachaux JP, Fonlupt P, Kahane P, Minotti L, Hoffmann D, Bertrand O, Baciu M (2007) Relationship between task-related gamma oscillations and BOLD signal: New digits from combined fMRI and intracranial EEG. Human Brain Mapping 28:1368-1375.
Le Van Quyen M, Foucher J, Lachaux JP, Rodriguez E, Lutz A, Martinerie J, Varela FJ (2001) Comparison of Hilbert transform and wavelet methods for the analysis of neuronal synchrony. Journal of Neuroscience Methods 111:83-98.
Leonards U, Sunaert S, Van Hecke P, Orban GA (2000) Attention mechanisms in visual search -- an fMRI study. J Cogn Neurosci 12 Suppl 2:61-75.
Lobel E, Kahane P, Leonards U, Grosbras M, Lehericy S, Le Bihan D, Berthoz A (2001) Localization of human frontal eye fields: anatomical and functional findings of functional magnetic resonance imaging and intracerebral electrical stimulation. J Neurosurg 95:804-815.
Logothetis NK, Pauls J, Augath M, Trinath T, Oeltermann A (2001) Neurophysiological investigation of the basis of the fMRI signal. Nature 412:150-157.
Manning JR, Jacobs J, Fried I, Kahana MJ (2009) Broadband Shifts in Local Field Potential Power Spectra Are Correlated with Single-Neuron Spiking in Humans. J Neurosci 29:13613-13620.
Moore T, Armstrong KM (2003) Selective gating of visual signals by microstimulation of frontal cortex. Nature 421:370-373.
Mukamel R, Gelbard H, Arieli A, Hasson U, Fried I, Malach R (2005) Coupling between neuronal firing, field potentials, and FMRI in human auditory cortex. Science 309:951-954.
120
Murthy VN, Fetz EE (1996) Synchronization of neurons during local field potential oscillations in sensorimotor cortex of awake monkeys. J Neurophysiol 76:3968-3982.
Niessing J, Ebisch B, Schmidt KE, Niessing M, Singer W, Galuske RA (2005) Hemodynamic signals correlate tightly with synchronized gamma oscillations. Science 309:948-951.
Nir Y, Fisch L, Mukamel R, Gelbard-Sagiv H, Arieli A, Fried I, Malach R (2007) Coupling between neuronal firing rate, gamma LFP, and BOLD fMRI is related to interneuronal correlations. Curr Biol 17:1275-1285.
Nobre AC, Coull JT, Walsh V, Frith CD (2003) Brain activations during visual search: contributions of search efficiency versus feature binding. Neuroimage 18:91-103.
Ossandón T, Jerbi K, Vidal JR, Bayle DJ, Henaff MA, Jung J, Minotti L, Bertrand O, Kahane P, Lachaux JP. (2011) Transient Suppression of Broadband Gamma Power in the Default-Mode Network Is Correlated with Task Complexity and Subject Performance. J Neurosci, In Press
Procyk E, Goldman-Rakic PS (2006) Modulation of dorsolateral prefrontal delay activity during self-organized behavior. J Neurosci 26:11313-11323.
Ray S, Maunsell JH (2011) Different origins of gamma rhythm and high-gamma activity in macaque visual cortex. PLoS Biol 9:e1000610.
Rowe JB, Toni I, Josephs O, Frackowiak RS, Passingham RE (2000) The prefrontal cortex: response selection or maintenance within working memory? Science 288:1656-1660.
Sakai K (2008) Task set and prefrontal cortex. Annu Rev Neurosci 31:219-245. Shulman GL, Tansy AP, Kincade M, Petersen SE, McAvoy MP, Corbetta M (2002)
Reactivation of networks involved in preparatory states. Cereb Cortex 12:590-600.
Slagter HA, Lutz A, Greischar LL, Nieuwenhuis S, Davidson RJ (2009) Theta phase synchrony and conscious target perception: impact of intensive mental training. J Cogn Neurosci 21:1536-1549.
Slagter HA, Lutz A, Greischar LL, Francis AD, Nieuwenhuis S, Davis JM, Davidson RJ (2007) Mental training affects distribution of limited brain resources. PLoS Biol 5:e138.
Talairach J, Tounoux P (1993) Referentially Oriented Cerebral MRI Anatomy: An Atlas of Stereotaxic Anatomical Correlations for Gray and White Matter: Thieme Medical Publishers, New York.
Treisman AM, Gelade G (1980) Feature-Integration Theory of Attention. Cognitive Psychology 12:97-136.
Vidal JR, Chaumon M, O'Regan JK, Tallon-Baudry C (2006) Visual grouping and the focusing of attention induce gamma-band oscillations at different frequencies in human magnetoencephalogram signals. J Cogn Neurosci 18:1850-1862.
Vidal JR, Ossandon T, Jerbi K, Dalal SS, Minotti L, Ryvlin P, Kahane P, Lachaux JP (2010) Category-Specific Visual Responses: An Intracranial Study Comparing Gamma, Beta, Alpha, and ERP Response Selectivity. Front Hum Neurosci 4:195.
Vulliemoz S, Carmichael DW, Rosenkranz K, Diehl B, Rodionov R, Walker MC, McEvoy AW, Lemieux L (2011) Simultaneous intracranial EEG and fMRI of interictal epileptic discharges in humans. Neuroimage 54:182-190.
Wardak C, Vanduffel W, Orban GA (2010) Searching for a salient target involves frontal regions. Cereb Cortex 20:2464-2477.
Watson MR, Brennan AA, Kingstone A, Enns JT (2010) Looking versus seeing: Strategies alter eye movements during visual search. Psychon Bull Rev 17:543-549.
Wolfe JM (2003) Moving towards solutions to some enduring controversies in visual search. Trends Cogn Sci 7:70-76.

121
Wolfe JM, Vo ML, Evans KK, Greene MR (2011) Visual search in scenes involves selective and nonselective pathways. Trends Cogn Sci 15:77-84.
Wyart V, Tallon-Baudry C (2008) Neural dissociation between visual awareness and spatial attention. J Neurosci 28:2667-2679.
Zhou H, Desimone R (2011) Feature-Based Attention in the Frontal Eye Field and Area V4 during Visual Search. Neuron 70:1205-1217.

122
Figures
Figure 1.
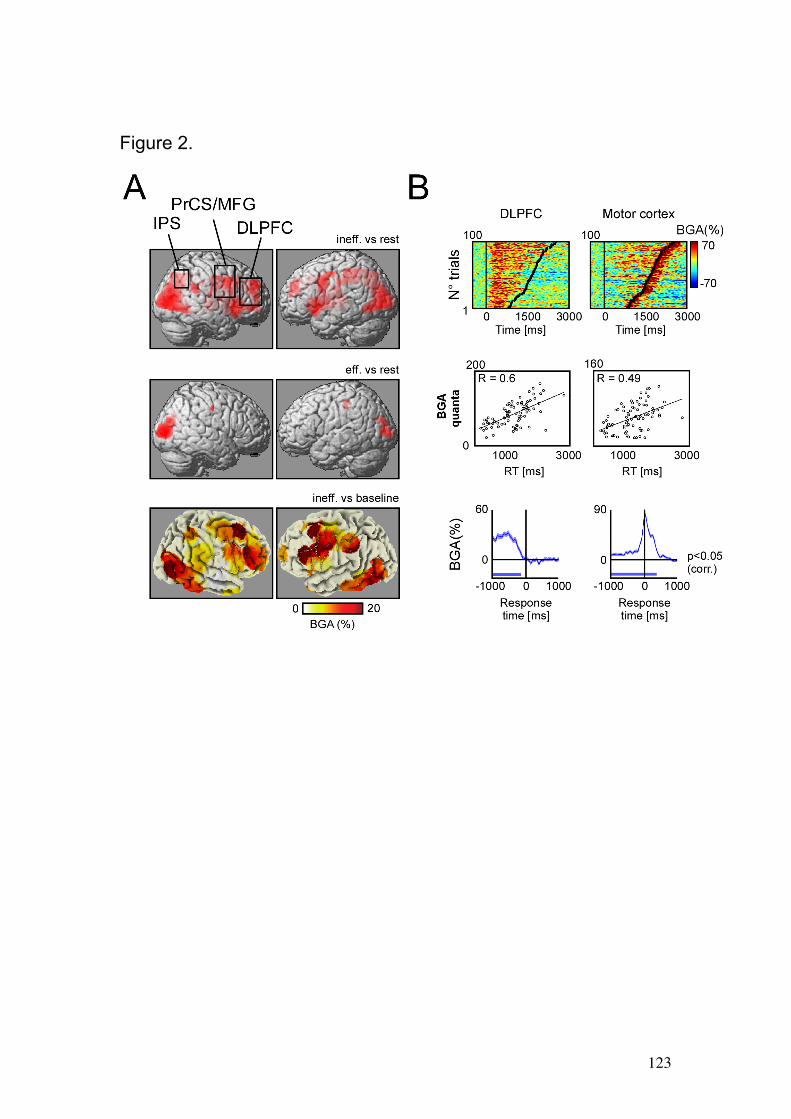
123
Figure 2.

124
Figure 3.

125
Figure Legends
Figure 1. Experimental conditions, behaviour and time-frequency responses. A, The
experimental design. After 1000 ms ISI a visual array is presented for 3000 ms. When
the target is detected, subjects press a button to indicate in which quadrant of the array
(upper or lower) it is located. In the inefficient search condition (in red), target and
distractors have the same color. In the efficient search condition (in blue), the target
has a different contrast than the distractors. B, Reaction time distribution for efficient
(blue) and inefficient visual search (red). C, Statistical time-frequency maps
(Wilcoxon Z, FDR corrected) for efficient (left panel) and inefficient (right panel)
visual search from a recording site (patient 10; Talairach coordinates: [-43 -3 34]),
located in dorsolateral prefrontal cortex.
Figure 2. BOLD response contrasts and broadband gamma activity response patterns
during visual search. A, Upper panel, BOLD response contrast between inefficient
search and rest conditions. Middle panel, BOLD response contrast between efficient
search and rest conditions. Lower panel, broadband gamma response topography
across all recording sites and all patients, plotted on a “glass brain” in MNI
coordinates. B, Upper panel, single-trial BGA responses recorded from DLPFC (left,
Talairach coordinates [-37 17 27]) and primary motor cortex (right, Talairach
coordinates: [-57 -28 48]) from patient 23 in the inefficient search condition. Middle
panel, scatterplot of single-trial BGA quanta versus reaction times. A BGA quantum
is a significant time-sample of BGA response versus baseline power evaluated
between stimulus onset and offset (Wilcoxon test, FDR corrected). Left and right

126
panels correspond to upper panel BGA responses. C, Average BGA responses aligned
to the response (button-press). Left and right panel correspond to upper panel BGA
responses.
Figure 3. Single-trial gamma-band responses to efficient and inefficient visual search
from frontal-parietal recording sites. A, Recording sites located in glass brain
(Talairach). B, Four illustrative examples (MRI, right panels) of single-trial gamma-
band responses to efficient (eff) and inefficient (ineff) visual search (left panels)
recorded within 4 regions of interest of the frontal-parietal network: DLPFC (patient
5, Talairach coordinates [-58 -1 34]), dACC (patient 10, Talairach coordinates [-12 11
47]), PrCS/MFG putative FEF (patient 10, Talairach coordinates [-46 -2 34]) and IPS
(patient 23, Talairach coordinates [-52 -42 46]).

127
7. Discussion
7.1 General discussion
Imagine sitting on a hammock, watching the stars, and lost in your own thoughts.
While you are in this state, a shooting star crosses the horizon. As you might have
experienced, your attention suddenly becomes focused on the shooting star; yet some
seconds later your thoughts return to their previous state. What was going on in your
brain after the shooting star? And what was going on just before? Many
neuroscientists have long assumed that much of the neural activity at rest matches
your subdued, somnolent mood (Raichle, 2010). In this view, the activity in the
resting brain represents nothing more than random noise, similar to the snowy pattern
on the television screen when a station is not broadcasting (Raichle, 2010).
Nevertheless, recent analysis produced by neuroimaging techniques has revealed
something quite remarkable: a great deal of meaningful activity is occurring in the
brain when a person is sitting back and doing nothing at all.
As we have seen throughout this work, neuroscience has traditionally been dominated
by an empiricist approach that partly stems from the influential work of Sherrington
(Raichle, 2009; Yuste, MacLean, Smith, & Lansner, 2005). In an extreme empiricist
view, the nervous system is considered to remain inactive until it is engaged by
sensory input, at which point it would process the sensory information and generate
an appropriate output (Yuste et al., 2005). This reflexive view of the brain has proven
to be a very useful model and has greatly improved our understanding of neural
circuits, not only in sensory regions, but also more generally with respect to overall
brain function (Yuste et al., 2005; Raichle, 2010). It has also inspired fundamental
concepts such as receptive field.
Nevertheless, a fundamental observation reported by Barath Biswal and colleagues in
1995 regarding the metabolic patterns of brain activity was able to change several
assumptions about the brain at rest. These authors showed that even while a subject
remained motionless, the baseline activity in the left precentral gyrus, specifically in
the homunculus activated with right hand movement, fluctuating in unison with

128
similar activity in the area on the opposite side of the brain associated with left hand
movement (Biswal et al., 1995). As we have seen before, similar characteristics have
been found in multiple highly specific functional anatomical networks, known as
Resting State Networks (RSNs), coming to the conclusion that spontaneous slow
fluctuations appear to reflect a fundamental aspect of brain organization.
One of these networks, the Default Mode Network (DMN), has taken an important
place in our field, principally because it has been associated to higher level cognitive
functions in humans, that by definition are difficult to access, like episodic and
prospective memory, self-projection, propioception, social cognition, and the
prospective thought (Buckner and Carroll, 2007). At the moment, the DMN is defined
only from metabolic data obtained by neuroimaging methods. Therefore, the
metabolic deactivations in this network during goal-directed behaviors are the only
potential trace of neural mechanisms still poorly understood. The first objective of my
dissertation was to answer this question in the human brain.
In this dissertation, we have used an adaptation of a classical visual search task,
developed by Triesmann and Gelade in 1980. The use of this task was not haphazard.
Using this task, we can control easily the level of difficulty. The brain regions
implicated have been well studied, and principally, we can compare two models of
visual search, contrasting essentially the parallel search for a single and salient feature
with a sequential visual search. Our goal was two-fold. The first main objective was
to find the neural correlate of the task-related deactivation across the DMN and its
relation with several markers of task engagement, such as performance. The second
main objective was to study with a high temporal and spatial resolution the bottom-up
and top-down components of a visual search, using unprecedented brain-wide
intracerebral depth recordings in surgical patients.
7.2. Electrophysiological correlate of the Default Mode Network
As we have said, one of the main problems in neuroimaging techniques, is the poorly
temporal resolution. For the same reason, several characteristics of the DMN are still
unknown. While we know the brain regions that participate in this network, the
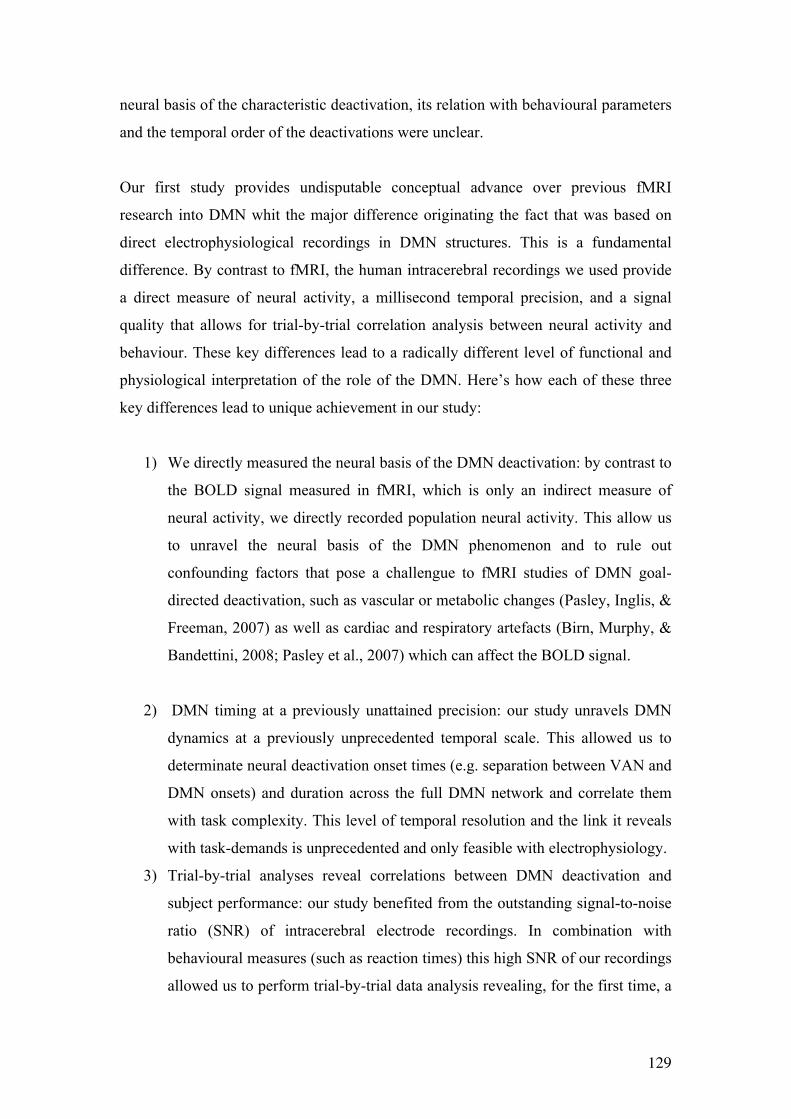
129
neural basis of the characteristic deactivation, its relation with behavioural parameters
and the temporal order of the deactivations were unclear.
Our first study provides undisputable conceptual advance over previous fMRI
research into DMN whit the major difference originating the fact that was based on
direct electrophysiological recordings in DMN structures. This is a fundamental
difference. By contrast to fMRI, the human intracerebral recordings we used provide
a direct measure of neural activity, a millisecond temporal precision, and a signal
quality that allows for trial-by-trial correlation analysis between neural activity and
behaviour. These key differences lead to a radically different level of functional and
physiological interpretation of the role of the DMN. Here’s how each of these three
key differences lead to unique achievement in our study:
1) We directly measured the neural basis of the DMN deactivation: by contrast to
the BOLD signal measured in fMRI, which is only an indirect measure of
neural activity, we directly recorded population neural activity. This allow us
to unravel the neural basis of the DMN phenomenon and to rule out
confounding factors that pose a challengue to fMRI studies of DMN goal-
directed deactivation, such as vascular or metabolic changes (Pasley, Inglis, &
Freeman, 2007) as well as cardiac and respiratory artefacts (Birn, Murphy, &
Bandettini, 2008; Pasley et al., 2007) which can affect the BOLD signal.
2) DMN timing at a previously unattained precision: our study unravels DMN
dynamics at a previously unprecedented temporal scale. This allowed us to
determinate neural deactivation onset times (e.g. separation between VAN and
DMN onsets) and duration across the full DMN network and correlate them
with task complexity. This level of temporal resolution and the link it reveals
with task-demands is unprecedented and only feasible with electrophysiology.
3) Trial-by-trial analyses reveal correlations between DMN deactivation and
subject performance: our study benefited from the outstanding signal-to-noise
ratio (SNR) of intracerebral electrode recordings. In combination with
behavioural measures (such as reaction times) this high SNR of our recordings
allowed us to perform trial-by-trial data analysis revealing, for the first time, a
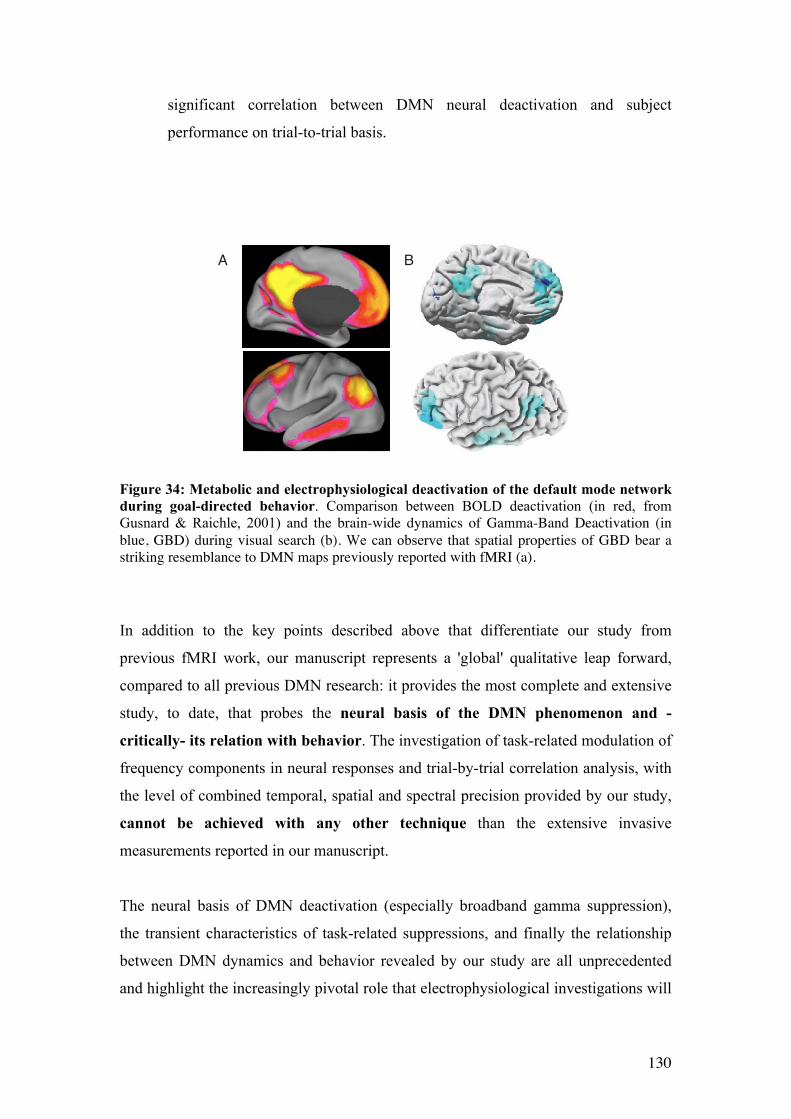
130
significant correlation between DMN neural deactivation and subject
performance on trial-to-trial basis.
Figure 34: Metabolic and electrophysiological deactivation of the default mode network during goal-directed behavior. Comparison between BOLD deactivation (in red, from Gusnard & Raichle, 2001) and the brain-wide dynamics of Gamma-Band Deactivation (in blue, GBD) during visual search (b). We can observe that spatial properties of GBD bear a striking resemblance to DMN maps previously reported with fMRI (a).
In addition to the key points described above that differentiate our study from
previous fMRI work, our manuscript represents a 'global' qualitative leap forward,
compared to all previous DMN research: it provides the most complete and extensive
study, to date, that probes the neural basis of the DMN phenomenon and -
critically- its relation with behavior. The investigation of task-related modulation of
frequency components in neural responses and trial-by-trial correlation analysis, with
the level of combined temporal, spatial and spectral precision provided by our study,
cannot be achieved with any other technique than the extensive invasive
measurements reported in our manuscript.
The neural basis of DMN deactivation (especially broadband gamma suppression),
the transient characteristics of task-related suppressions, and finally the relationship
between DMN dynamics and behavior revealed by our study are all unprecedented
and highlight the increasingly pivotal role that electrophysiological investigations will
A B

131
play in understanding the function (and alteration by disease) of the DMN and more
generally all so-called intrinsic or resting state networks.
In a very recent review by Northoff et al. published in Trends in Neurosciences
(Northoff et al., 2010), entitled “Rest-stimulus interaction in the brain: a review”, the
authors end the review with the following statement: “Methodologically, most of the
results described above (i.e. ‘Rest-Stimulus and stimulus-rest interaction in the brain')
rely on human imaging and more specifically on fMRI. However, because the BOLD
response in fMRI is rather sluggish, clear-cut experimental separation between RSA
and stimulus-induced activity changes can be difficult. Hence, techniques other than
fMRI could be more suitable for RSA studies" (Northoff et al, TINS, 33, 277-284,
2010).”
The view expressed here by Northoff and colleagues in this recent review and shared
by many scientists in the field is that a lot has been learned about resting state
networks (including the default-mode) via fMRI studies, but that we have now come
to a point where the next major advances in the field will need novel insights from
electrophysiological assessments of these networks in order to fully elucidate their
functional role and physiological basis.
7.3. Clinical implications of our first study
It should be noted that this work is framed in a clinical context, and the implantation
of the electrodes has as principal objective to find the origin of the epileptic activity.
In this sense, we think that the study of the DMN could be important for the
understanding and the treatment of the epilepsy for three reasons:
a) Many patients report that their seizures often occur at the precise moment
when attention is relaxed at the end of a demanding activity, such as
driving or any form of intellectual work. The facts that this moment
coincides with a sudden increase in the activity of the DMN (i.e. when the
patients found the target) suggest a possible link between this network and
the onset of crises, at least in some cases. This relationship has hardly

132
ever been studied until now (Laufs, Walker, & Lund, 2007), principally by
our lack of understanding of the neural phenomena that occur in the DMN.
b) Second, because several neuroimaging studies have established a clear link
between the activation of DMN and a state of ‘decoupling’ between the
brain and its environment, called ‘Mind Wandering’ (Zacks, Speer,
Swallow, Braver, & Reynolds, 2007), during which attention is no longer
available to process the information from the outside world. Again, these
phases of distraction are often observed in patients with epilepsy,
especially in children. A disorganization of the DMN in some forms of
epilepsy, even the influence of drugs on the network can be advanced. But
again, only the study of neural activity within the DMN may allow
progress in this line of research.
c) Finally, surgery for drug-resistant epilepsy is always preceded by a phase
tracking to both, identify the epileptogenic network and to locate the near
brain regions, still functional, that must be saved by surgery. This decision
is now, in most cases, based in a procedure of intracerebral electrical
stimulation, whose principle is to trigger behavioural manifestations,
positive or negative, such as a temporary stopping of the speech (Afif,
Minotti, Kahane, & Hoffmann, 2010). This procedure is not suitable to
identify regions of the DMN, which by definition are silent. Then, the risk
to include parts of this network still healthy in the surgical resection is
high. Several studies have shown that a disruption of the DMN may lead
to serious neurological and psychiatric disorders, ranging from depression
to schizophrenia (Broyd et al., 2009). It is therefore desirable, even
imperative to have a technique of anatomical tracing of the DMN, in the
pre-surgical phase of epileptic patients.
In conclusion, the work done has allowed us to determine an experimental setting
which can identify regions of the DMN in the pre-surgical phase with few constraints.
We have shown that activity decreases in the DMN are sometimes fast (about 500
ms), and not always visible in fMRI. Therefore, we will adapt this framework to
define a procedure faster and accurate to inform the clinical team the location of
133
DMN in each patient. This information would then tailor the surgery to limit its
impact on the DMN.
7.4. Transient and sustained gamma bans responses
As stated in the third chapter, visual search (Treinsman and Gelade, 1980) has been a
model task for investigating the operations of selective attention in crowded and
unpredictable environments (Nobre et al, 2002). The mechanisms for selection targets
during visual search remain under intensive discussion. According to one influential
model (Treisman and Gelade, 1980), the visual search of basic features (such as
colour, size, motion and orientation), occur in a single step and in parallel way across
most of (or all) the visual field: that is, the duration of the search, quantified by the
reaction times (RTs) of participants, is independent of the number of items displayed
(Wolfe, 2003). On the other hand, search for a particular combination of features,
requires that all the stimuli are processed sequentially, resulting in search duration
which increase linearly with the number of items in the display.
The mechanisms for selecting targets with a particular combination of features
(search) remain under intensive discussion. According to Treisman, serial deployment
of attention to spatial locations is required to integrate components features of stimuli.
Others have argued that the sloped RT functions during search do not necessary imply
a serial mechanism. Instead, target detection may proceed via parallel neural
computations that take longer to resolve with interference from increasing number of
distractor stimuli (Duncan and Humphreys, 1989; Nobre et al, 2002). Finally, some
have suggested that a combination of parallel and serial mechanisms is required for
selecting targets from interfering displays (Wolfe, 1993, 2003).
A novel lecture of neural mechanisms of visual attention (Desimone & Duncan,
1995a) proposes that both visual pop-out tasks and active search tasks would involve
bottom-up and top-down neural mechanisms, and that these mechanisms would
enable to differentiate the target from a background made of the distractors.
This model of attention, named Biased Competition theory (BC, Desimone and
134
Duncan, 1995), suggests that neuronal responses are determined by competitive
interactions. A central assumption of the BC account is that visual input elicits
activity, in parallel, in several areas of the brain, each of which is specialized for the
analysis of different stimulus attributes, e.g. shape, color or motion. Selection for
further processing of a certain object is achieved by the integration of competitive
activity across multiple areas. This selection is, however, not achieved by competition
of independent objects. Rather, features of the same object reinforce each other while
suppressing activations of other objects, thus forming a stable state of activations
belonging to one object over a time course of several hundred milliseconds.
Concerning selection mechanisms in visual search, the biased competition account
proposes two main sources of attentional control: stimulus-driven (’bottom-up’)
information from stimuli presented in the scene and ’top-down’ feedback mechanisms
that arise from current behavioral goals (Desimone & Duncan, 1995). The latter gain
influence by (a) increasing the maintained activity of visual cortical neurons or by (b)
an increase in sensory-evoked responses. Further, competition of object features can
be modulated independent of spatial constraints: Processing can be biased in favor of
stimuli possessing a specific characteristic (e.g., colour, shape, etc.) in parallel
throughout the visual field as well as occupying a specific spatial location (e.g. made
relevant by task instruction, in our case searching for a gray letter ‘T’ amongst gray or
black ‘L’s). However, competition between two stimuli is assumed to be strongest
when the two stimuli are at the same location and, thus, activate cells in the same
local region of cortex (Desimone, 1998). The biased competition approach has been
influential particularly with regard to mechanisms that might underlie neglect or other
neuropsychological deficits of attention (Mahn, 2005).
In short, this theory has these assumptions: given the limits of our ability to process
several stimuli simultaneously, visual objects compete for representational resources,
and only one or a small number of stimuli can be represented at one time. As the
neural representations of visual stimuli are highly distributed, competitive processing
occurs in many of the brain areas sensitive to visual inputs. Second, the competition
would integrate across several areas, such that the neural populations that represent
different aspects of a single object interact in a mutually facilitatory fashion. The gain
in response to the selected object is accompanied by a suppression of the processes in
the neural populations representing features of competing objects. Therefore, as a
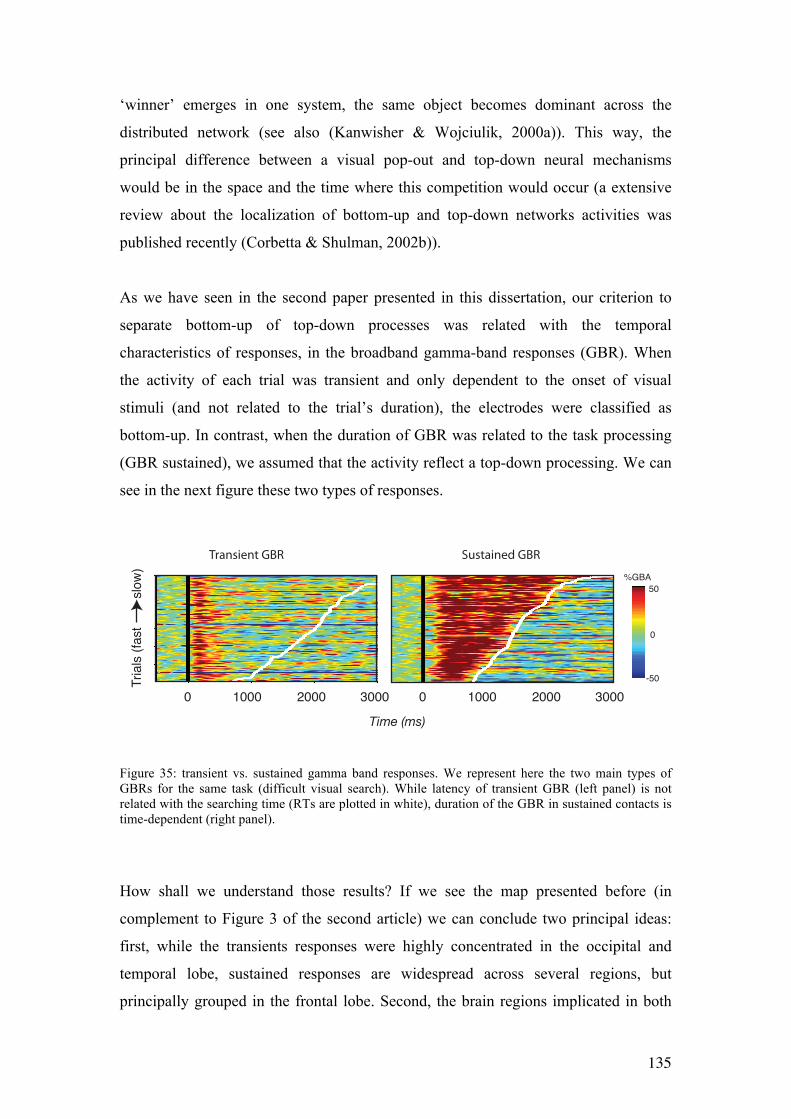
135
‘winner’ emerges in one system, the same object becomes dominant across the
distributed network (see also (Kanwisher & Wojciulik, 2000a)). This way, the
principal difference between a visual pop-out and top-down neural mechanisms
would be in the space and the time where this competition would occur (a extensive
review about the localization of bottom-up and top-down networks activities was
published recently (Corbetta & Shulman, 2002b)).
As we have seen in the second paper presented in this dissertation, our criterion to
separate bottom-up of top-down processes was related with the temporal
characteristics of responses, in the broadband gamma-band responses (GBR). When
the activity of each trial was transient and only dependent to the onset of visual
stimuli (and not related to the trial’s duration), the electrodes were classified as
bottom-up. In contrast, when the duration of GBR was related to the task processing
(GBR sustained), we assumed that the activity reflect a top-down processing. We can
see in the next figure these two types of responses.
Figure 35: transient vs. sustained gamma band responses. We represent here the two main types of GBRs for the same task (difficult visual search). While latency of transient GBR (left panel) is not related with the searching time (RTs are plotted in white), duration of the GBR in sustained contacts is time-dependent (right panel).
How shall we understand those results? If we see the map presented before (in
complement to Figure 3 of the second article) we can conclude two principal ideas:
first, while the transients responses were highly concentrated in the occipital and
temporal lobe, sustained responses are widespread across several regions, but
principally grouped in the frontal lobe. Second, the brain regions implicated in both
Trials
(fa
st s
low
)
Transient GBR Sustained GBR
0
-50
50
%GBA
0 1000 2000 3000 0 1000 2000
Time (ms)
3000

136
pop-out and visual search condition are practically the same. This result is consistent
with Desimone and Duncan’s theory, in the sense that both visual pop-out and active
search tasks would involve bottom-up and top-down neural mechanism1 (Desimone
and Duncan, 1995). Several studies revealed an extensive overlap in the brain areas
involved in both visual searches, in special posterior parietal and visual areas.
Nevertheless, active visual search would activate parietal and visual areas more
strongly than visual pop-out search (Leonards et al., 2000). Our results are in accord
with the first assumption (overlap in the brain areas involved in both visual searches).
In contrast, and as we can see in Figure 2 and 3 of the second paper, the pop-out
condition elicit a strongly activation in parietal areas related to search condition. We
can see the same effect in the some contacts located in the occipital and temporal
lobe. Our interpretation of these results is that normally, and principally by
methodological constraints, we take a grand average across large neuronal
populations, with multiple types of responses (i.e. EEG and ECoG recordings). Then,
if a subgroup of neurons responds in a sustained form (as we can see in figure 2, there
are some contacts with this type of GBR in the occipital lobe, especially located in V3
and V4), the difference in favour of the second type of visual search will be only the
reflex of this subgroup. Interestingly, left intra-parietal sulcus was the only brain
regions where the GBR is only specific for the pop-out condition. This result is
according with literature, in the sense of that spatial orientation becomes more
relevant for this condition (the question in the task was: Where is the gray letter ‘T’?)
(Pessoa et al, 2009 Brain Res; Kristjánsson, 2007 C Cortex). In contrast, this process
of spatial orientation becomes relevant only after finding the target in the second
condition (active search). For this reasons, activation can be spread over time in this
region.
On the other side, our results about the sites with sustained GBRs were consistent
with the existing literature on the role of prefrontal cortex in attention. Task –related
sites (GBR sustained) in both experimental conditions are spread out through several
1 We use the terms bottom up and top down to refer to the perspectives in which dynamics of visual processing is task independent or task dependent, respectively. Bottom up simply implies that processing is guided from the outside world, and top down implies that processing is guided from higher cortical regions.
137
frontal regions: Anterior cingulate cortex, midline frontal cortex, dorsolateral
prefrontal cortex, as well as supplementary motor area. According with Posner and
Peterson (1990), these areas could form the ‘anterior attention system’, known to be
particularly involved in target detection.
Another implication that reinforces our results is that parietal and frontal cortex are
evidently involved in pop-out searches. Within psychology and the behavioral
literature, processing of pop-out stimuli was traditionally thought to be strictly
‘preattentive’ (e.g. Treisman & Gelade, 1980), rather than to involve attentional
mechanisms as indicated here. More recent behavioral work had suggested possible
attentional involvement in pop-out (see, for example discussion in Nakayama &
Joseph, 1998), though some controversies still exist concerning this (e.g. Donner et al.
2005). Our findings provide unequivocal new evidence that the neural substrates
underlying modulation of visual search for pop-out targets by repetition do in fact
involve some of the parietal and frontal areas long implicated in attention control.
Finally, to elucidate if the difference between activities in both task was not related
simply to the time of processing, we compare the GBRs for trials with the same
reaction times of the two experimental conditions. Surprisingly, in most of the trials
(90%) GBR does not allow differentiating between both conditions. Interestingly, in
one of the exceptions, the left and right DLPFC, the pattern of GBR is bimodal. GBR
is related is stimulus-related in the pop-out condition, while is task-related for the
search condition, as shown in the next figure.

138
Figure 36: Bimodal GBR in DLPFC. While GBR is transient for the pop-out condition, GBR is task-related in the search condition in an electrode located in the left DLPFC of patient 3.
Summarizing, our results show that is possible to differentiate two types of responses
during a goal directed task: a transient and sustained. These responses could reflect a
marker of the two major ways of neural processing, bottom-up and top-down. As we
have said repeatedly, these processing pathways have been studied mainly in two
scales. While the microscale reflect the activity of a small neuronal population, the
macroscale reflect: the metabolic activity of a brain region with high-spatial and low-
temporal resolution (PET and fMRI) or the electric or magnetic (EEG and MEG)
fields reflected the temporal evolution of a collective response from millions of
neurons on a millisecond scale (low spatial resolution). The intermediate level of
recording (LFP) used during this work, could explain the gap between the two scales.
Finally, our results suggest that new models of attention may be required, based on
temporally coherent or in the temporal dynamics of neural activity rather than neural
amplification (Niebur et al., 2002). Is difficult to explain this results using standard
models of attention that rely solely on gain-based changes, or even on gain/spectral-
sensitivity hybrid models (Okamoto et al., 2007). Alternatively, a more arguable
theory of neural mechanisms underlying the role of top-down attention in the buildup
of perceptual streams would involve top-down projections acting in conjunction with
the physical stimulus as regulators or clocks for the firing patterns of neuronal
Trials
(fa
st s
low
)DLPFC GBR (Pop-out) DLPFC GBR (Search)
0
-50
50
%GBA
0 1000 2000 3000 0 1000 2000
Time (ms)
3000

139
populations in visual cortex that present sustained responses (Elhieali, 2009). The
neural support of this bottom-up/top-down interaction are likely to mediate changes in
the response profiles of cortical neurons, via mechanisms of synaptic and receptive
field plasticity which have been shown to be gated by attention; whereby attention
plays a crucial role in shifting cortical circuits from one state to another depending on
behavioral demands (Fritz, Elhilali, & Shamma, 2005). We speculate that temporal
patterns of neuronal firings are crucial in any goal-directed task to resolve the
competition between attended and unattended objects, hence, delimiting the cognitive
border between different streams.
7.5. Conclusion:
During this dissertation, our goal was two-fold. The first main objective was to find
the neural correlate of the task-related deactivation across the default-mode network
(DMN) and its relation with several markers of task engagement, such as
performance. The second main objective was to study with a high temporal and
spatial resolution the bottom-up and top-down components of a visual search, using
unprecedented brain-wide intracerebral depth recordings in surgical patients.
The role of DMN deactivation remains enigmatic because its electrophysiological
correlates, temporal dynamics and link to behavior are poorly understood. Using
extensive depth electrode recordings in humans, we provide electrophysiological
evidence for a direct correlation between DMN neural deactivation dynamics and
individual subject behavior. We found that all DMN areas displayed transient
suppressions of gamma (60-140 Hz) power during task performance and, critically,
the duration and extent of this broadband suppression were correlated with task
complexity and subject performance. Furthermore, trial-by-trial correlations revealed
that spatially distributed gamma activations and deactivations formed distinct
anticorrelated networks. These findings facilitate our understanding of the
relationship between electrophysiology and neuroimaging studies in humans and
indicate that neural deactivations encode the duration and efficiency of our
engagement with the external world.

140
By the other hand, findings from neuroimaging that cognitive tasks involve a number
of different anatomical areas has led to an emphasis on tracing the time dynamics of
these areas. Because shifts of attention can be so rapid, it is difficult to follow them
with hemodynamic imaging. For this reason, the principal objective of the second
article was to distinguish transient neural responses elicited by stimuli properties
(bottom-up), from sustained responses elicited by intrinsic modulations (top-down).
While the transient responses were highly focalized in the occipital and temporal lobe,
sustained responses are widespread across several regions, but primarily localized in
the frontal lobe. During this dissertation, we have used an adaptation of a classical
visual search task, developed by Triesmann and Gelade in 1980. As we have said, the
use of this task was not haphazard. Using this task, we can control easily the level of
difficulty, the brain regions implicated have been well studied, and principally, we
can compare two models of visual search, contrasting essentially the parallel search
for a single and salient feature with a sequential visual search. The brain regions
implicated in both pop-out and visual search condition are practically the same.
Several studies revealed an extensive overlap in the brain areas involved in both
visual searches, in special posterior parietal and visual areas. Together, these findings
support a view of a tightly coupled interaction between the lower-level neural
representation and the higher-level cognitive representation of visual objects (Elihaly
et al., 2009). Finalizing, the findings revealed during this dissertation reinforces the idea of the
pivotal role for broadband gamma modulations in the interplay between activation
and deactivation networks mediating efficient goal-directed behavior. In this sense,
the next logical step is to investigate the interaction between these two phenomena.

141
Bibliography
Adrian ED: Afferent discharges to the cerebral cortex from peripheral sense organs. J
Physiol 100:159-191, 1941.
Afif A, Minotti L, Kahane P, et al.: Middle short gyrus of the insula implicated in
speech production: intracerebral electric stimulation of patients with epilepsy.
Epilepsia 51:206-213, 2010.
Andreasen NC, O'Leary DS, Cizadlo T, et al.: Remembering the past: two facets of
episodic memory explored with positron emission tomography. Am J
Psychiatry 152:1576-1585, 1995.
Andrews-Hanna JR, Reidler JS, Huang C, et al.: Evidence for the default network's
role in spontaneous cognition. J Neurophysiol 104:322-335.
Aoki F, Fetz EE, Shupe L, et al.: Increased gamma-range activity in human
sensorimotor cortex during performance of visuomotor tasks. Clin
Neurophysiol 110:524-537, 1999.
Baddeley A: Working memory: looking back and looking forward. Nat Rev Neurosci
4:829-839, 2003.
Berger H: Über das Elektrenkephalogramm des Menschen. Arch. Psychiatr. Nervenkr
87:527–570, 1929.
Bichot NP, Rossi AF, Desimone R: Parallel and serial neural mechanisms for visual
search in macaque area V4. Science 308:529-534, 2005.
Bichot NP, Desimone R: Finding a face in the crowd: parallel and serial neural
mechanisms of visual selection. Prog Brain Res 155:147-156, 2006.
Binder JR, Frost JA, Hammeke TA, et al.: Conceptual processing during the
conscious resting state. A functional MRI study. J Cogn Neurosci 11:80-95,
1999.
Birn RM, Murphy K, Bandettini PA: The effect of respiration variations on
independent component analysis results of resting state functional
connectivity. Human Brain Mapping 29:740-750, 2008.
Biswal B, Yetkin FZ, Haughton VM, et al.: Functional connectivity in the motor
cortex of resting human brain using echo-planar MRI. Magn Reson Med
34:537-541, 1995.
142
Biswal BB, Mennes M, Zuo XN, et al.: Toward discovery science of human brain
function. Proceedings of the National Academy of Sciences of the United
States of America 107:4734-4739, 2010.
Bouyer JJ, Dedet L, Konya A: [Convergence of 3 thalamo-cortical rhythmic systems
on the somesthetic area in the normal cat and baboon]. Rev
Electroencephalogr Neurophysiol Clin 4:397-406, 1974.
Bouyer JJ, Montaron MF, Rougeul A: Fast fronto-parietal rhythms during combined
focused attentive behaviour and immobility in cat: cortical and thalamic
localizations. Electroencephalogr Clin Neurophysiol 51:244-252, 1981.
Brovelli A, Lachaux JP, Kahane P, et al.: High gamma frequency oscillatory activity
dissociates attention from intention in the human premotor cortex.
Neuroimage 28:154-164, 2005.
Brown GG, Eyler LT: Methodological and conceptual issues in functional magnetic
resonance imaging: applications to schizophrenia research. Annu Rev Clin
Psychol 2:51-81, 2006.
Brown TG: On the nature of the fundamental activity of the nervous centres; together
with an analysis on the conditioning rhythmic activity in progression, and a
theory of the evolution of function in the nervous systems. Proc. Amer. Phil.
Soc. L:19-44, 1911.
Broyd SJ, Demanuele C, Debener S, et al.: Default-mode brain dysfunction in mental
disorders: a systematic review. Neurosci Biobehav Rev 33:279-296, 2009.
Buckner RL, Carroll DC: Self-projection and the brain. Trends Cogn Sci 11:49-57,
2007.
Buckner RL, Andrews-Hanna JR, Schacter DL: The brain's default network: anatomy,
function, and relevance to disease. Ann N Y Acad Sci 1124:1-38, 2008.
Burdette JH, Durden DD, Elster AD, et al.: High b-value diffusion-weighted MRI of
normal brain. J Comput Assist Tomogr 25:515-519, 2001.
Burgess PW, Dumontheil I, Gilbert SJ: The gateway hypothesis of rostral prefrontal
cortex (area 10) function. Trends Cogn Sci 11:290-298, 2007.
Buzsaki G, Draguhn A: Neuronal oscillations in cortical networks. Science 304:1926-
1929, 2004.
Canolty RT, Edwards E, Dalal SS, et al.: High gamma power is phase-locked to theta
oscillations in human neocortex. Science 313:1626-1628, 2006.
143
Castellanos FX, Margulies DS, Kelly C, et al.: Cingulate-precuneus interactions: A
new locus of dysfunction in adult attention-deficit/hyperactivity disorder.
Biological Psychiatry 63:332-337, 2008.
Cavada C, Goldman-Rakic PS: Posterior parietal cortex in rhesus monkey: II.
Evidence for segregated corticocortical networks linking sensory and limbic
areas with the frontal lobe. J Comp Neurol 287:422-445, 1989.
Cavanna AE, Trimble MR: The precuneus: a review of its functional anatomy and
behavioural correlates. Brain 129:564-583, 2006.
Corbetta M, Shulman GL: Control of goal-directed and stimulus-driven attention in
the brain. Nat Rev Neurosci 3:201-215, 2002a.
Corbetta M, Shulman GL: Control of goal-directed and stimulus-driven attention in
the brain. Nature Reviews Neuroscience 3:201-215, 2002b.
Corbetta M, Patel G, Shulman GL: The reorienting system of the human brain: From
environment to theory of mind. Neuron 58:306-324, 2008.
Crone NE, Miglioretti DL, Gordon B, et al.: Functional mapping of human
sensorimotor cortex with electrocorticographic spectral analysis. II. Event-
related synchronization in the gamma band. Brain 121 ( Pt 12):2301-2315,
1998.
Crone NE, Miglioretti DL, Gordon B, et al.: Functional mapping of human
sensorimotor cortex with electrocorticographic spectral analysis. I. Alpha and
beta event-related desynchronization. Brain 121 ( Pt 12):2271-2299, 1998.
Crone NE: Functional mapping with ECoG spectral analysis. Adv Neurol 84:343-351,
2000.
Crone NE, Boatman D, Gordon B, et al.: Induced electrocorticographic gamma
activity during auditory perception. Brazier Award-winning article, 2001. Clin
Neurophysiol 112:565-582, 2001.
Crone NE, Hao L, Hart J, Jr., et al.: Electrocorticographic gamma activity during
word production in spoken and sign language. Neurology 57:2045-2053,
2001.
Crone NE, Sinai A, Korzeniewska A: High-frequency gamma oscillations and human
brain mapping with electrocorticography. Prog Brain Res 159:275-295, 2006.
D'Argembeau A, Collette F, Van der Linden M, et al.: Self-referential reflective
activity and its relationship with rest: a PET study. Neuroimage 25:616-624,
2005.

144
D'Argembeau A, Stawarczyk D, Majerus S, et al.: The neural basis of personal goal
processing when envisioning future events. J Cogn Neurosci 22:1701-1713,
2010.
Dandekar S, Ales J, Carney T, et al.: Methods for quantifying intra- and inter-subject
variability of evoked potential data applied to the multifocal visual evoked
potential. J Neurosci Methods 165:270-286, 2007.
Desimone R, Duncan J: Neural Mechanisms of Selective Visual-Attention. Annual
Review of Neuroscience 18:193-222, 1995a.
Desimone R, Duncan J: Neural mechanisms of selective visual attention. Annu Rev
Neurosci 18:193-222, 1995b.
Diaz J, Razeto-Barry P, Letelier JC, et al.: Amplitude modulation patterns of local
field potentials reveal asynchronous neuronal populations. J Neurosci
27:9238-9245, 2007.
Doron G, Moulding R: Cognitive behavioral treatment of obsessive compulsive
disorder: a broader framework. Isr J Psychiatry Relat Sci 46:257-263, 2009.
Egeth HE, Yantis S: Visual attention: control, representation, and time course. Annu
Rev Psychol 48:269-297, 1997.
Elhilali M, Xiang J, Shamma SA, et al.: Interaction between attention and bottom-up
saliency mediates the representation of foreground and background in an
auditory scene. PLoS Biol 7:e1000129, 2009.
Engel AK, Roelfsema PR, Fries P, et al.: Role of the temporal domain for response
selection and perceptual binding. Cereb Cortex 7:571-582, 1997.
Engel AK, Fries P, Singer W: Dynamic predictions: oscillations and synchrony in
top-down processing. Nat Rev Neurosci 2:704-716, 2001.
Engell AD, McCarthy G: Selective attention modulates face-specific induced gamma
oscillations recorded from ventral occipitotemporal cortex. J Neurosci
30:8780-8786, 2010.
Esposito F, Bertolino A, Scarabino T, et al.: Independent component model of the
default-mode brain function: Assessing the impact of active thinking. Brain
Res Bull 70:263-269, 2006.
Fan J, McCandliss BD, Fossella J, et al.: The activation of attentional networks.
Neuroimage 26:471-479, 2005.
145
Fox MD, Snyder AZ, Vincent JL, et al.: The human brain is intrinsically organized
into dynamic, anticorrelated functional networks. Proc Natl Acad Sci U S A
102:9673-9678, 2005.
Fox MD, Corbetta M, Snyder AZ, et al.: Spontaneous neuronal activity distinguishes
human dorsal and ventral attention systems. Proc Natl Acad Sci U S A
103:10046-10051, 2006.
Fox PT, Raichle ME: Focal physiological uncoupling of cerebral blood flow and
oxidative metabolism during somatosensory stimulation in human subjects.
Proc Natl Acad Sci U S A 83:1140-1144, 1986.
Fransson P: Spontaneous low-frequency BOLD signal fluctuations: an fMRI
investigation of the resting-state default mode of brain function hypothesis.
Hum Brain Mapp 26:15-29, 2005.
Fransson P: How default is the default mode of brain function? Further evidence from
intrinsic BOLD signal fluctuations. Neuropsychologia 44:2836-2845, 2006.
Fries P, Roelfsema PR, Engel AK, et al.: Synchronization of oscillatory responses in
visual cortex correlates with perception in interocular rivalry. Proc Natl Acad
Sci U S A 94:12699-12704, 1997.
Fries P, Reynolds JH, Rorie AE, et al.: Modulation of oscillatory neuronal
synchronization by selective visual attention. Science 291:1560-1563, 2001.
Fries P: A mechanism for cognitive dynamics: neuronal communication through
neuronal coherence. Trends Cogn Sci 9:474-480, 2005.
Fries P: Neuronal Gamma-Band Synchronization as a Fundamental Process in
Cortical Computation. Annual Review of Neuroscience 32:209-224, 2009.
Friston KJ, Frith CD, Liddle PF, et al.: Functional connectivity: the principal-
component analysis of large (PET) data sets. J Cereb Blood Flow Metab 13:5-
14, 1993.
Frith CD, Frith U: Interacting minds--a biological basis. Science 286:1692-1695,
1999.
Fritz JB, Elhilali M, Shamma SA: Differential dynamic plasticity of A1 receptive
fields during multiple spectral tasks. J Neurosci 25:7623-7635, 2005.
Genovese CR, Lazar NA, Nichols T: Thresholding of statistical maps in functional
neuroimaging using the false discovery rate. Neuroimage 15:870-878, 2002.
Giambra LM: A laboratory method for investigating influences on switching attention
to task-unrelated imagery and thought. Conscious Cogn 4:1-21, 1995.

146
Gilbert SJ, Dumontheil I, Simons JS, et al.: Comment on "Wandering minds: the
default network and stimulus-independent thought". Science 317:43; author
reply 43, 2007.
Gray CM, Konig P, Engel AK, et al.: Oscillatory responses in cat visual cortex exhibit
inter-columnar synchronization which reflects global stimulus properties.
Nature 338:334-337, 1989.
Greicius MD, Krasnow B, Reiss AL, et al.: Functional connectivity in the resting
brain: a network analysis of the default mode hypothesis. Proc Natl Acad Sci
U S A 100:253-258, 2003.
Greicius MD, Supekar K, Menon V, et al.: Resting-state functional connectivity
reflects structural connectivity in the default mode network. Cereb Cortex
19:72-78, 2009.
Gruber T, Muller MM, Keil A, et al.: Selective visual-spatial attention alters induced
gamma band responses in the human EEG. Clin Neurophysiol 110:2074-2085,
1999.
Gujar N, Yoo SS, Hu P, et al.: The unrested resting brain: sleep deprivation alters
activity within the default-mode network. J Cogn Neurosci 22:1637-1648.
Gusnard DA, Akbudak E, Shulman GL, et al.: Medial prefrontal cortex and self-
referential mental activity: relation to a default mode of brain function. Proc
Natl Acad Sci U S A 98:4259-4264, 2001.
Gusnard DA, Raichle ME: Searching for a baseline: functional imaging and the
resting human brain. Nat Rev Neurosci 2:685-694, 2001.
Haxby JV, Horwitz B, Ungerleider LG, et al.: The functional organization of human
extrastriate cortex: a PET-rCBF study of selective attention to faces and
locations. J Neurosci 14:6336-6353, 1994.
Hayden BY, Smith DV, Platt ML: Electrophysiological correlates of default-mode
processing in macaque posterior cingulate cortex. Proc Natl Acad Sci U S A
106:5948-5953, 2009.
He BJ, Snyder AZ, Zempel JM, et al.: Electrophysiological correlates of the brain's
intrinsic large-scale functional architecture. Proc Natl Acad Sci U S A
105:16039-16044, 2008.
Herculano-Houzel S, Munk MH, Neuenschwander S, et al.: Precisely synchronized
oscillatory firing patterns require electroencephalographic activation. J
Neurosci 19:3992-4010, 1999.
147
Hikosaka O, Wurtz RH: Visual and oculomotor functions of monkey substantia nigra
pars reticulata. I. Relation of visual and auditory responses to saccades. J
Neurophysiol 49:1230-1253, 1983.
Howard MW, Rizzuto DS, Caplan JB, et al.: Gamma oscillations correlate with
working memory load in humans. Cereb Cortex 13:1369-1374, 2003.
Huettel SA, Song AW, McCarthy G: Functional Magnetic Resonance Imaging:
Sinauer Associates, 2008.
Ingvar DH: "Hyperfrontal" distribution of the cerebral grey matter flow in resting
wakefulness; on the functional anatomy of the conscious state. Acta Neurol
Scand 60:12-25, 1979.
Jacobs J, Kahana MJ, Ekstrom AD, et al.: Brain oscillations control timing of single-
neuron activity in humans. J Neurosci 27:3839-3844, 2007.
Jacobs J, Kahana MJ: Direct brain recordings fuel advances in cognitive
electrophysiology. Trends Cogn Sci 14:162-171, 2010.
Jensen O, Kaiser J, Lachaux JP: Human gamma-frequency oscillations associated
with attention and memory. Trends Neurosci 30:317-324, 2007.
Jerbi K, Ossandon T, Hamame CM, et al.: Task-related gamma-band dynamics from
an intracerebral perspective: review and implications for surface EEG and
MEG. Hum Brain Mapp 30:1758-1771, 2009.
Jerbi K, Vidal JR, Ossandon T, et al.: Exploring the electrophysiological correlates of
the default-mode network with intracerebral EEG. Frontiers in Systems
Neuroscience 4:5, 2010.
Jung J, Hudry J, Ryvlin P, et al.: Functional significance of olfactory-induced
oscillations in the human amygdala. Cereb Cortex 16:1-8, 2006.
Jung J, Mainy N, Kahane P, et al.: The neural bases of attentive reading. Hum Brain
Mapp 29:1193-1206, 2008.
Kanwisher N, Wojciulik E: Visual attention: Insights from brain imaging. Nature
Reviews Neuroscience 1:91-100, 2000a.
Kanwisher N, Wojciulik E: Visual attention: insights from brain imaging. Nat Rev
Neurosci 1:91-100, 2000b.
Konig P, Engel AK, Singer W: Relation between oscillatory activity and long-range
synchronization in cat visual cortex. Proc Natl Acad Sci U S A 92:290-294,
1995.
148
Lachaux JP, Rodriguez E, Martinerie J, et al.: A quantitative study of gamma-band
activity in human intracranial recordings triggered by visual stimuli. Eur J
Neurosci 12:2608-2622, 2000.
Lachaux JP, Rudrauf D, Kahane P: Intracranial EEG and human brain mapping.
Journal of Physiology-Paris 97:613-628, 2003a.
Lachaux JP, Rudrauf D, Kahane P: Intracranial EEG and human brain mapping. J
Physiol Paris 97:613-628, 2003b.
Lachaux JP, George N, Tallon-Baudry C, et al.: The many faces of the gamma band
response to complex visual stimuli. Neuroimage 25:491-501, 2005.
Lachaux JP, Hoffmann D, Minotti L, et al.: Intracerebral dynamics of saccade
generation in the human frontal eye field and supplementary eye field.
Neuroimage 30:1302-1312, 2006.
Lachaux JP, Fonlupt P, Kahane P, et al.: Relationship between task-related gamma
oscillations and BOLD signal: New digits from combined fMRI and
intracranial EEG. Human Brain Mapping 28:1368-1375, 2007.
Lachaux JP, Jerbi K, Bertrand O, et al.: A blueprint for real-time functional mapping
via human intracranial recordings. PLoS ONE 2:e1094, 2007.
Lachaux JP, Jung J, Mainy N, et al.: Silence is golden: transient neural deactivation in
the prefrontal cortex during attentive reading. Cereb Cortex 18:443-450, 2008.
Lachaux JP, Ossandon T: Intracortical recordings during attentional tasks, in From
attention to goal-directed behavior: neurodynamical, methodological and
clinical trends. Edited by Aboitiz F, Cosmelli D. Berlin, Springer, 2008, pp.
29-49.
Lachaux JP, Ossandon T: Intracortical recordings during attentional tasks, in From
attention to goal-directed behavior: neurodynamical, methodological and
clinical trends. Edited by Aboitiz F, Cosmelli D. Berlin, Springer, 2009, pp.
29-49.
Laufs H, Krakow K, Sterzer P, et al.: Electroencephalographic signatures of
attentional and cognitive default modes in spontaneous brain activity
fluctuations at rest. Proc Natl Acad Sci U S A 100:11053-11058, 2003.
Laufs H, Walker MC, Lund TE: 'Brain activation and hypothalamic functional
connectivity during human non-rapid eye movement sleep: an EEG/fMRI
study'--its limitations and an alternative approach. Brain 130:e75; author reply
e76, 2007.

149
Le Van Quyen M, Staba R, Bragin A, et al.: Large-scale microelectrode recordings of
high-frequency gamma oscillations in human cortex during sleep. J Neurosci
30:7770-7782.
Le Van Quyen M, Foucher J, Lachaux JP, et al.: Comparison of Hilbert transform and
wavelet methods for the analysis of neuronal synchrony. Journal of
Neuroscience Methods 111:83-98, 2001.
Leichnetz GR: Connections of the medial posterior parietal cortex (area 7m) in the
monkey. Anat Rec 263:215-236, 2001.
Leonards U, Singer W: Conjunctions of colour, luminance and orientation: the role of
colour and luminance contrast on saliency and proximity grouping in texture
segregation. Spat Vis 13:87-105, 2000.
Leopold DA, Murayama Y, Logothetis NK: Very slow activity fluctuations in
monkey visual cortex: implications for functional brain imaging. Cereb Cortex
13:422-433, 2003.
Lettvin JY, Maturana HR, McCulloch WS, et al.: What the frog's eye tells the frog's
brain. Proc. Inst. Radio Engr 47:140-1951, 1959.
Logothetis NK, Pauls J, Augath M, et al.: Neurophysiological investigation of the
basis of the fMRI signal. Nature 412:150-157, 2001.
Lowe MJ, Mock BJ, Sorenson JA: Functional connectivity in single and multislice
echoplanar imaging using resting-state fluctuations. Neuroimage 7:119-132,
1998.
Mainy N, Jung J, Baciu M, et al.: Cortical dynamics of word recognition. Hum Brain
Mapp, 2007.
Mainy N, Kahane P, Minotti L, et al.: Neural correlates of consolidation in working
memory. Hum Brain Mapp 28:183-193, 2007.
Mangun GR, Buonocore MH, Girelli M, et al.: ERP and fMRI measures of visual
spatial selective attention. Hum Brain Mapp 6:383-389, 1998.
Manning JR, Jacobs J, Fried I, et al.: Broadband Shifts in Local Field Potential Power
Spectra Are Correlated with Single-Neuron Spiking in Humans. Journal of
Neuroscience 29:13613-13620, 2009.
Mantini D, Perrucci MG, Del Gratta C, et al.: Electrophysiological signatures of
resting state networks in the human brain. Proc Natl Acad Sci U S A
104:13170-13175, 2007.

150
Maquet P: Positron emission tomography studies of sleep and sleep disorders. J
Neurol 244:S23-28, 1997.
Marin G, Mpodozis J, Sentis E, et al.: Oscillatory bursts in the optic tectum of birds
represent re-entrant signals from the nucleus isthmi pars parvocellularis. J
Neurosci 25:7081-7089, 2005.
Mason MF, Norton MI, Van Horn JD, et al.: Wandering minds: the default network
and stimulus-independent thought. Science 315:393-395, 2007.
McGuire PK, Paulesu E, Frackowiak RS, et al.: Brain activity during stimulus
independent thought. Neuroreport 7:2095-2099, 1996.
McKiernan KA, Kaufman JN, Kucera-Thompson J, et al.: A parametric manipulation
of factors affecting task-induced deactivation in functional neuroimaging. J
Cogn Neurosci 15:394-408, 2003.
McKiernan KA, D'Angelo BR, Kaufman JN, et al.: Interrupting the "stream of
consciousness": an fMRI investigation. Neuroimage 29:1185-1191, 2006.
Miller KJ, Weaver KE, Ojemann JG: Direct electrophysiological measurement of
human default network areas. Proc Natl Acad Sci U S A 106:12174-12177,
2009.
Miller KJ: Broadband spectral change: evidence for a macroscale correlate of
population firing rate? J Neurosci 30:6477-6479, 2010.
Minoshima S, Giordani B, Berent S, et al.: Metabolic reduction in the posterior
cingulate cortex in very early Alzheimer's disease. Ann Neurol 42:85-94,
1997.
Moran J, Desimone R: Selective attention gates visual processing in the extrastriate
cortex. Science 229:782-784, 1985.
Moran JM, Lee SM, Gabrieli JD: Dissociable Neural Systems Supporting Knowledge
about Human Character and Appearance in Ourselves and Others. J Cogn
Neurosci, 2010.
Mukamel R, Gelbard H, Arieli A, et al.: Coupling between neuronal firing, field
potentials, and FMRI in human auditory cortex. Science 309:951-954, 2005.
Muller MM, Gruber T, Keil A: Modulation of induced gamma band activity in the
human EEG by attention and visual information processing. Int J
Psychophysiol 38:283-299, 2000.
Niebur E, Hsiao SS, Johnson KO: Synchrony: a neuronal mechanism for attentional
selection? Curr Opin Neurobiol 12:190-194, 2002.

151
Niessing J, Ebisch B, Schmidt KE, et al.: Hemodynamic signals correlate tightly with
synchronized gamma oscillations. Science 309:948-951, 2005.
Nir Y, Fisch L, Mukamel R, et al.: Coupling between neuronal firing rate, gamma
LFP, and BOLD fMRI is related to interneuronal correlations. Curr Biol
17:1275-1285, 2007.
Northoff G, Qin P, Nakao T: Rest-stimulus interaction in the brain: a review. Trends
Neurosci 33:277-284, 2010.
Ogawa S, Tank DW, Menon R, et al.: Intrinsic signal changes accompanying sensory
stimulation: functional brain mapping with magnetic resonance imaging. Proc
Natl Acad Sci U S A 89:5951-5955, 1992.
Okamoto H, Stracke H, Wolters CH, et al.: Attention improves population-level
frequency tuning in human auditory cortex. J Neurosci 27:10383-10390, 2007.
Ottoson D: Analysis of the electrical activity of the olfactory epithelium. Acta Physiol
Scand Suppl 35:1-83, 1955.
Pardo JV, Pardo PJ, Raichle ME: Neural correlates of self-induced dysphoria. Am J
Psychiatry 150:713-719, 1993.
Pasley BN, Inglis BA, Freeman RD: Analysis of oxygen metabolism implies a neural
origin for the negative BOLD response in human visual cortex. Neuroimage
36:269-276, 2007.
Posner MI, Petersen SE: The attention system of the human brain. Annu Rev
Neurosci 13:25-42, 1990.
Price CJ: The anatomy of language: contributions from functional neuroimaging. J
Anat 197 Pt 3:335-359, 2000.
Raichle ME, MacLeod AM, Snyder AZ, et al.: A default mode of brain function. Proc
Natl Acad Sci U S A 98:676-682, 2001.
Raichle ME, Mintun MA: Brain work and brain imaging. Annual Review of
Neuroscience 29:449-476, 2006.
Raichle ME, Snyder AZ: A default mode of brain function: a brief history of an
evolving idea. Neuroimage 37:1083-1090; discussion 1097-1089, 2007.
Raichle ME: A Paradigm Shift in Functional Brain Imaging. Journal of Neuroscience
29:12729-12734, 2009.
Raichle ME: Two views of brain function. Trends Cogn Sci 14:180-190, 2010.
Reynolds JH, Chelazzi L: Attentional modulation of visual processing. Annu Rev
Neurosci 27:611-647, 2004.

152
Ries ML, Schmitz TW, Kawahara TN, et al.: Task-dependent posterior cingulate
activation in mild cognitive impairment. Neuroimage 29:485-492, 2006.
Robinson D, Milanfar P: Fundamental performance limits in image registration. IEEE
Trans Image Process 13:1185-1199, 2004.
Rodriguez E, George N, Lachaux JP, et al.: Perception's shadow: long-distance
synchronization of human brain activity. Nature 397:430-433, 1999.
Roskies AL: The binding problem. Neuron 24:7-9, 111-125, 1999.
Scannell JW, Young MP: Neuronal population activity and functional imaging. Proc
Biol Sci 266:875-881, 1999.
Sederberg PB, Kahana MJ, Howard MW, et al.: Theta and gamma oscillations during
encoding predict subsequent recall. J Neurosci 23:10809-10814, 2003.
Sederberg PB, Schulze-Bonhage A, Madsen JR, et al.: Hippocampal and neocortical
gamma oscillations predict memory formation in humans. Cereb Cortex
17:1190-1196, 2007.
Selemon LD, Goldman-Rakic PS: Common cortical and subcortical targets of the
dorsolateral prefrontal and posterior parietal cortices in the rhesus monkey:
evidence for a distributed neural network subserving spatially guided
behavior. J Neurosci 8:4049-4068, 1988.
Sereno MI: Brain mapping in animals and humans. Curr Opin Neurobiol 8:188-194,
1998.
Shannon BJ, Buckner RL: Functional-anatomic correlates of memory retrieval that
suggest nontraditional processing roles for multiple distinct regions within
posterior parietal cortex. J Neurosci 24:10084-10092, 2004.
Sheline YI, Price JL, Yan Z, et al.: Resting-state functional MRI in depression
unmasks increased connectivity between networks via the dorsal nexus. Proc
Natl Acad Sci U S A 107:11020-11025, 2010.
Sherrington C: The integrative action of the nervous system. New Haven, CT: Yale
University Press;, 1906.
Shmuel A, Augath M, Oeltermann A, et al.: Negative functional MRI response
correlates with decreases in neuronal activity in monkey visual area V1. Nat
Neurosci 9:569-577, 2006.
Shu SY, Wu YM, Bao XM, et al.: Interactions among memory-related centers in the
brain. J Neurosci Res 71:609-616, 2003.

153
Shulman GL, Corbetta M, Buckner RL, et al.: Top-down modulation of early sensory
cortex. Cereb Cortex 7:193-206, 1997.
Shulman GL, Fiez JA, Corbetta M, et al.: Common blood flow changes across visual
tasks .2. Decreases in cerebral cortex. Journal of Cognitive Neuroscience
9:648-663, 1997.
Shulman GL, Astafiev SV, McAvoy MP, et al.: Right TPJ deactivation during visual
search: functional significance and support for a filter hypothesis. Cereb
Cortex 17:2625-2633, 2007.
Simpson JR, Jr., Snyder AZ, Gusnard DA, et al.: Emotion-induced changes in human
medial prefrontal cortex: I. During cognitive task performance. Proc Natl
Acad Sci U S A 98:683-687, 2001.
Singer W: Coherence as an organizing principle of cortical functions. Int Rev
Neurobiol 37:153-183; discussion 203-157, 1994.
Singer W: Neuronal synchrony: a versatile code for the definition of relations?
Neuron 24:49-65, 111-125, 1999.
Singh KD, Fawcett IP: Transient and linearly graded deactivation of the human
default-mode network by a visual detection task. Neuroimage 41:100-112,
2008.
Sokoloff L, Mangold R, Wechsler RL, et al.: The effect of mental arithmetic on
cerebral circulation and metabolism. J Clin Invest 34:1101-1108, 1955.
Sonuga-Barke EJ, Castellanos FX: Spontaneous attentional fluctuations in impaired
states and pathological conditions: a neurobiological hypothesis. Neurosci
Biobehav Rev 31:977-986, 2007.
Sperry RW: Effecr of 180 degree rotation of the retinal field on visuomotor
coordination. The Journal of Experimental Zoology 92:263-279, 1943.
Sporns O, Tononi J: Structural determinants of functional brain dynamics, in
Handbook of Brain Activity, Vol. Complexity. Edited by Jirsa VK, McIntosh
AR, Springer, 2008.
Steinmetz PN, Roy A, Fitzgerald PJ, et al.: Attention modulates synchronized
neuronal firing in primate somatosensory cortex. Nature 404:187-190, 2000.
Szpunar KK, Chan JC, McDermott KB: Contextual processing in episodic future
thought. Cereb Cortex 19:1539-1548, 2009.

154
Talairach J, Tounoux P: Referentially Oriented Cerebral MRI Anatomy: An Atlas of
Stereotaxic Anatomical Correlations for Gray and White Matter: Thieme
Medical Publishers, New York, 1993.
Tallon-Baudry C, Bertrand O: Oscillatory gamma activity in humans and its role in
object representation. Trends Cogn Sci 3:151-162, 1999.
Tallon-Baudry C, Bertrand O, Henaff MA, et al.: Attention Modulates Gamma-band
Oscillations Differently in the Human Lateral Occipital Cortex and Fusiform
Gyrus. Cereb Cortex 15:654-662, 2005.
TallonBaudry C, Bertrand O, Delpuech C, et al.: Oscillatory gamma-band (30-70 Hz)
activity induced by a visual search task in humans. Journal of Neuroscience
17:722-734, 1997.
Taylor K, Mandon S, Freiwald WA, et al.: Coherent oscillatory activity in monkey
area v4 predicts successful allocation of attention. Cereb Cortex 15:1424-
1437, 2005.
Treisman A, Sato S: Conjunction Search Revisited. Journal of Experimental
Psychology-Human Perception and Performance 16:459-478, 1990.
Treisman A: The binding problem. Curr Opin Neurobiol 6:171-178, 1996.
Treisman A: Feature binding, attention and object perception. Philosophical
Transactions of the Royal Society of London Series B-Biological Sciences
353:1295-1306, 1998a.
Treisman A: Feature binding, attention and object perception. Philos Trans R Soc
Lond B Biol Sci 353:1295-1306, 1998b.
Treisman AM, Gelade G: Feature-Integration Theory of Attention. Cognitive
Psychology 12:97-136, 1980.
van Eimeren T, Monchi O, Ballanger B, et al.: Dysfunction of the default mode
network in Parkinson disease: a functional magnetic resonance imaging study.
Arch Neurol 66:877-883, 2009.
Varela F, Lachaux JP, Rodriguez E, et al.: The brainweb: phase synchronization and
large-scale integration. Nat Rev Neurosci 2:229-239, 2001.
Varela FJ: Resonant cell assemblies: a new approach to cognitive functions and
neuronal synchrony. Biol Res 28:81-95, 1995.
Vincent JL, Patel GH, Fox MD, et al.: Intrinsic functional architecture in the
anaesthetized monkey brain. Nature 447:83-86, 2007.
155
Vogt BA, Laureys S: Posterior cingulate, precuneal and retrosplenial cortices:
cytology and components of the neural network correlates of consciousness.
Prog Brain Res 150:205-217, 2005.
Wolfe JM: Moving towards solutions to some enduring controversies in visual search.
Trends in Cognitive Sciences 7:70-76, 2003.
Womelsdorf T, Fries P, Mitra PP, et al.: Gamma-band synchronization in visual
cortex predicts speed of change detection. Nature 439:733-736, 2006.
Yuste R, MacLean JN, Smith J, et al.: The cortex as a central pattern generator. Nat
Rev Neurosci 6:477-483, 2005.
Yuval-Greenberg S, Tomer O, Keren AS, et al.: Transient induced gamma-band
response in EEG as a manifestation of miniature saccades. Neuron 58:429-
441, 2008.
Yuval-Greenberg S, Deouell LY: The broadband-transient induced gamma-band
response in scalp EEG reflects the execution of saccades. Brain Topogr 22:3-
6, 2009.
Zacks JM, Speer NK, Swallow KM, et al.: Event perception: a mind-brain
perspective. Psychol Bull 133:273-293, 2007.
Zhang D, Snyder AZ, Fox MD, et al.: Intrinsic functional relations between human
cerebral cortex and thalamus. J Neurophysiol 100:1740-1748, 2008.
Zhang DY, Raichle ME: Disease and the brain's dark energy. Nature Reviews
Neurology 6:15-28, 2010.
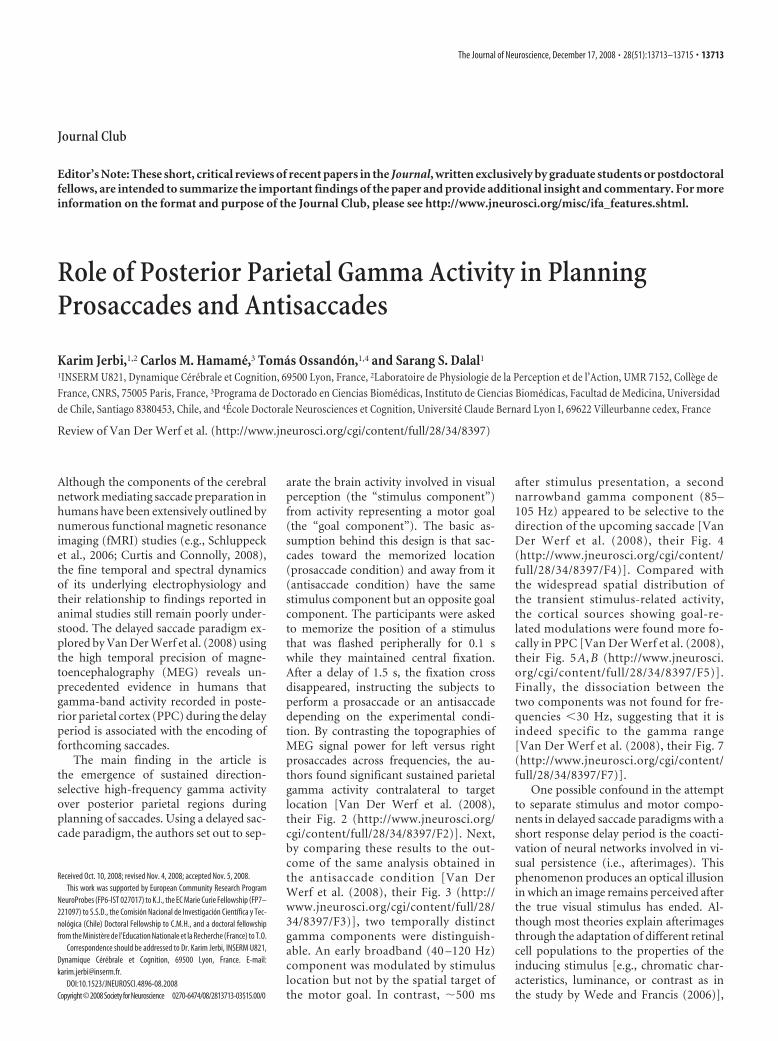
Journal Club
Editor’s Note: These short, critical reviews of recent papers in the Journal, written exclusively by graduate students or postdoctoralfellows, are intended to summarize the important findings of the paper and provide additional insight and commentary. For moreinformation on the format and purpose of the Journal Club, please see http://www.jneurosci.org/misc/ifa_features.shtml.
Role of Posterior Parietal Gamma Activity in PlanningProsaccades and Antisaccades
Karim Jerbi,1,2 Carlos M. Hamame,3 Tomas Ossandon,1,4 and Sarang S. Dalal1
1INSERM U821, Dynamique Cerebrale et Cognition, 69500 Lyon, France, 2Laboratoire de Physiologie de la Perception et de l’Action, UMR 7152, College deFrance, CNRS, 75005 Paris, France, 3Programa de Doctorado en Ciencias Biomedicas, Instituto de Ciencias Biomedicas, Facultad de Medicina, Universidadde Chile, Santiago 8380453, Chile, and 4Ecole Doctorale Neurosciences et Cognition, Universite Claude Bernard Lyon I, 69622 Villeurbanne cedex, France
Review of Van Der Werf et al. (http://www.jneurosci.org/cgi/content/full/28/34/8397)
Although the components of the cerebralnetwork mediating saccade preparation inhumans have been extensively outlined bynumerous functional magnetic resonanceimaging (fMRI) studies (e.g., Schluppecket al., 2006; Curtis and Connolly, 2008),the fine temporal and spectral dynamicsof its underlying electrophysiology andtheir relationship to findings reported inanimal studies still remain poorly under-stood. The delayed saccade paradigm ex-plored by Van Der Werf et al. (2008) usingthe high temporal precision of magne-toencephalography (MEG) reveals un-precedented evidence in humans thatgamma-band activity recorded in poste-rior parietal cortex (PPC) during the delayperiod is associated with the encoding offorthcoming saccades.
The main finding in the article isthe emergence of sustained direction-selective high-frequency gamma activityover posterior parietal regions duringplanning of saccades. Using a delayed sac-cade paradigm, the authors set out to sep-
arate the brain activity involved in visualperception (the “stimulus component”)from activity representing a motor goal(the “goal component”). The basic as-sumption behind this design is that sac-cades toward the memorized location(prosaccade condition) and away from it(antisaccade condition) have the samestimulus component but an opposite goalcomponent. The participants were askedto memorize the position of a stimulusthat was flashed peripherally for 0.1 swhile they maintained central fixation.After a delay of 1.5 s, the fixation crossdisappeared, instructing the subjects toperform a prosaccade or an antisaccadedepending on the experimental condi-tion. By contrasting the topographies ofMEG signal power for left versus rightprosaccades across frequencies, the au-thors found significant sustained parietalgamma activity contralateral to targetlocation [Van Der Werf et al. (2008),their Fig. 2 (http://www.jneurosci.org/cgi/content/full/28/34/8397/F2)]. Next,by comparing these results to the out-come of the same analysis obtained inthe antisaccade condition [Van DerWerf et al. (2008), their Fig. 3 (http://www.jneurosci.org/cgi/content/full/28/34/8397/F3)], two temporally distinctgamma components were distinguish-able. An early broadband (40 –120 Hz)component was modulated by stimuluslocation but not by the spatial target ofthe motor goal. In contrast, �500 ms
after stimulus presentation, a secondnarrowband gamma component (85–105 Hz) appeared to be selective to thedirection of the upcoming saccade [VanDer Werf et al. (2008), their Fig. 4(http://www.jneurosci.org/cgi/content/full/28/34/8397/F4)]. Compared withthe widespread spatial distribution ofthe transient stimulus-related activity,the cortical sources showing goal-re-lated modulations were found more fo-cally in PPC [Van Der Werf et al. (2008),their Fig. 5 A, B (http://www.jneurosci.org/cgi/content/full/28/34/8397/F5)].Finally, the dissociation between thetwo components was not found for fre-quencies �30 Hz, suggesting that it isindeed specific to the gamma range[Van Der Werf et al. (2008), their Fig. 7(http://www.jneurosci.org/cgi/content/full/28/34/8397/F7)].
One possible confound in the attemptto separate stimulus and motor compo-nents in delayed saccade paradigms with ashort response delay period is the coacti-vation of neural networks involved in vi-sual persistence (i.e., afterimages). Thisphenomenon produces an optical illusionin which an image remains perceived afterthe true visual stimulus has ended. Al-though most theories explain afterimagesthrough the adaptation of different retinalcell populations to the properties of theinducing stimulus [e.g., chromatic char-acteristics, luminance, or contrast as inthe study by Wede and Francis (2006)],
Received Oct. 10, 2008; revised Nov. 4, 2008; accepted Nov. 5, 2008.This work was supported by European Community Research Program
NeuroProbes (FP6-IST 027017) to K.J., the EC Marie Curie Fellowship (FP7–221097) to S.S.D., the Comision Nacional de Investigacion Cientıfica y Tec-nologica (Chile) Doctoral Fellowship to C.M.H., and a doctoral fellowshipfrom the Ministere de l’Education Nationale et la Recherche (France) to T.O.
Correspondence should be addressed to Dr. Karim Jerbi, INSERM U821,Dynamique Cerebrale et Cognition, 69500 Lyon, France. E-mail:[email protected].
DOI:10.1523/JNEUROSCI.4896-08.2008Copyright©2008SocietyforNeuroscience 0270-6474/08/2813713-03$15.00/0
The Journal of Neuroscience, December 17, 2008 • 28(51):13713–13715 • 13713
they also recognize an important role ofcortical structures. Afterimage-related ac-tivity has been observed as occipital andtemporal scalp event-related potentials(Kobayashi et al., 2002) as well as gammaoscillations over occipital and parietalsensors using MEG (Tikhonov et al.,2007). So can the persistent parietalgamma activity identified by the authorsafter the offset of the peripheral stimulusbe interpreted as a neural correlate of vi-sual persistence of the stimulus? The in-version of hemispheric bias that wasfound for the late-gamma component(�500 ms) between prosaccade and anti-saccades [Van Der Werf et al. (2008), theirFig. 2 (http://www.jneurosci.org/cgi/content/full/28/34/8397/F2) and Fig. 3(http://www.jneurosci.org/cgi/content/full/28/34/8397/F3)] argues against this. Fur-thermore, results of a previous MEG studyby the same group with a delayed double-step saccade task only show high parietalgamma enhancement preceding the saccade“go” signal but not after the first cue(Medendorp et al., 2007). An explanation ofthe sustained gamma solely on the accountof afterimages can therefore be ruled out.
Another critical factor that might re-quire additional investigation is the puta-tive link between the reported gamma ac-tivity and visuospatial attention orienting.Clearly, subjects planning a saccade at-tend to the target location during the de-lay. In the case of a prosaccade, this is thesame location as the stimulus, but for anantisaccade, subjects likely shift andmaintain their attention to the oppositeside of the screen. The authors note thatthis explanation is unlikely given the ten-dency of the sustained gamma activity toincrease closer toward saccade execution.It is conceivable, however, that purely at-tentional neural processes might also beenhanced closer toward the onset of aplanned movement and thereby accountat least partially for the observed increase.This question is worth pursuing in futurestudies using a modified delayed saccadeparadigm that explicitly controls for spa-tial attention. Most importantly, the en-deavor to elucidate whether high-gammaactivity in human PPC is specifically re-lated to intention or to attention is part ofa longstanding debate on the separabilityof neural representations of motor goalsand spatial attention (preceding move-ment execution). Indeed, saccade plan-ning and the allocation of spatial attentionhave been shown to be mediated by over-lapping neural substrates (Kowler et al.,1995). This is an intuitively appealing ideagiven that visual attention and saccades
both mediate the selection of a portion ofthe visual scene. Nevertheless, severalstudies have also provided evidence in fa-vor of a putative segregation between goalrepresentation and spatial attentionacross parietal and frontal areas (Colbyand Goldberg, 1999; Juan et al., 2004;Quian Quiroga et al., 2006). Clearly, theattempt to fully dissociate the neural cor-relates of the two processes carries the in-herent risk of misrepresenting the intri-cate interaction between them. However,recent findings, including the presentstudy by Van Der Werf et al. (2008), sug-gest that the fine-scale spatial and tempo-ral resolution of gamma-band activitymight be particularly helpful in linkingthe findings of animal and human studiesexploring the overlap and segregation be-tween attention and intention (Pesaran etal., 2002; Brovelli et al., 2005).
Many variants of the delayed saccadetask have been reported in the literature.As described above, the paradigm imple-mented by Van Der Werf et al. (2008) re-quires visuospatial processing and mem-orization of a flashed stimulus position(or its mirror location) in addition to mo-tor planning. One way to probe the neuralprocesses underlying oculomotor inten-tion while minimizing the effect of targetlocation is to place the visual stimulus in-structing saccade direction at the center ofthe screen, e.g., as an arrow pointing leftor right toward targets that remain visiblethroughout the experiment (Khonsari etal., 2007; Milea et al., 2007). Such delayedsaccade paradigms significantly reducelateralized perceptual and visuospatialmemory demands because the instructionis provided centrally, and the peripheraltargets are not flashed but remain present(cf. Curtis and Connolly, 2008). Thisplaces the emphasis during the delay onthe motor goal and visuomotor transfor-mation rather than the visual stimulus lo-cation. Whether such a paradigm revealsgamma patterns comparable with thosereported by Van Der Werf et al. (2008)still remains to be shown.
A further important issue which couldimpact the interpretation of the findingsreported by Van Der Werf et al. (2008) isthe fact that scalp muscle activity and elec-tromagnetic interference can contami-nate MEG and EEG data yielding artifac-tual activity in the high-gamma frequencyrange. Indeed, a recent study may intro-duce some additional concerns; Yuval-Greenberg et al. (2008) showed that with avisual EEG experiment, broadbandgamma activity may appear to arise fromoccipital regions when in fact they are di-
rect manifestations of miniature saccadetransients. Therefore, given that micro-saccades have been shown to be modu-lated by shifts of spatial attention (Engbertand Kliegl, 2003), it is important to ruleout that the gamma-band activity de-tected by Van Der Werf et al. (2008) is ofartifactual origin. Such an explanation isunlikely for several reasons: First, it is un-clear if the miniature saccade artifact phe-nomenon extends to MEG. In EEG re-cordings, such an artifact may be aconsequence of reference electrode place-ment (Yuval-Greenberg et al., 2008); incontrast, MEG may not be susceptible tothis problem because it is inherentlyreference-free. Additionally, the beam-forming source reconstruction methodprovides a degree of protection from arti-facts arising from outside the brain.Beamforming estimates either the timecourse or power modulations of neuralactivity over the brain volume using adap-tive spatial filters (Van Veen et al., 1997).This method does not require a priori as-sumptions about the location or numberof sources and so does not assume sourcesare restricted to the brain. Sources of ocu-lar origin would therefore be localizednear the eyes rather than projected to dis-tant parts of the brain (Bardouille et al.,2006). A third argument in favor of a cor-tical origin of the reported gamma activityfindings is that they are in agreement withresults from direct recordings in monkeysat several levels. For instance, the reportedhemisphere-specific contralateral selec-tivity of spectral power for an upcomingsaccade is in line with findings obtainedwith gamma-range components of localfield potentials recorded in monkey PPC(Pesaran et al., 2002). Furthermore, thetiming of gamma power modulation shiftfrom stimulus processing to goal encod-ing appears to coincide with the averageinversion time of lateral intraparietal neu-rons remapping from stimulus location togoal encoding as reported in a memory-delayed saccade task in monkeys (Zhangand Barash, 2004). Finally, the signifi-cance of the parietal high-gamma findingsis further enhanced by a growing body ofevidence linking population-level gammaactivity to the blood oxygenation level-dependent signal recorded in fMRI, bothin monkeys (Logothetis et al., 2001) andin humans (Lachaux et al., 2007).
The authors propose that parietalgamma-band activity reflects visuomotorencoding mechanisms that determine thesaccade goal. Given that the neural net-work involved in oculomotor planningand execution spreads across multiple ce-
13714 • J. Neurosci., December 17, 2008 • 28(51):13713–13715 Jerbi et al. • Journal Club

rebral areas, including parietal and frontalregions, one might have expected to alsofind comodulations of gamma activity infrontal areas, including dorsolateral pre-frontal cortex or frontal and supplemen-tary eye fields (Lachaux et al., 2006). Theabsence of such findings in this studycould either be attributable to the experi-mental design used (trial number, delaylatency, etc.), or to important differencesin amplitude between parietal and frontalgamma activity, or alternatively to the de-pendency of MEG source estimation onvarious properties of the underlying gen-erators such as the orientation and size ofthe activated patch of cortex.
To conclude, although much stillneeds to be done to fully disentangle theneural correlates of visuomotor process-ing, spatial attention and motor goal en-coding in PPC, the study by Van Der Werfet al. (2008) brings us one step closer to-ward elucidating the role of high-gammaactivity in these processes and providesfundamental findings that help bridge thegap between electrophysiological record-ings in monkeys and humans during visu-ally guided motor behavior.
ReferencesBardouille T, Picton TW, Ross B (2006) Corre-
lates of eye blinking as determined by syn-thetic aperture magnetometry. Clin Neuro-physiol 117:952–958.
Brovelli A, Lachaux JP, Kahane P, Boussaoud D(2005) High gamma frequency oscillatory ac-tivity dissociates attention from intention inthe human premotor cortex. Neuroimage28:154 –164.
Colby CL, Goldberg ME (1999) Space and atten-tion in parietal cortex. Annu Rev Neurosci22:319 –349.
Curtis CE, Connolly JD (2008) Saccade prepara-tion signals in the human frontal and parietalcortices. J Neurophysiol 99:133–145.
Engbert R, Kliegl R (2003) Microsaccades un-cover the orientation of covert attention. Vi-sion Res 43:1035–1045.
Juan CH, Shorter-Jacobi SM, Schall JD (2004)Dissociation of spatial attention and saccadepreparation. Proc Natl Acad Sci U S A101:15541–15544.
Khonsari RH, Lobel E, Milea D, Lehericy S,Pierrot-Deseilligny C, Berthoz A (2007) Lat-eralized parietal activity during decision andpreparation of saccades. Neuroreport18:1797–1800.
Kobayashi Y, Yoshino A, Ogasawara T, Nomura S(2002) Topography of evoked potentials as-sociated with illusory motion perception as amotion aftereffect. Brain Res Cogn Brain Res13:75– 84.
Kowler E, Anderson E, Dosher B, Blaser E (1995)The role of attention in the programming ofsaccades. Vision Res 35:1897–1916.
Lachaux JP, Hoffmann D, Minotti L, Berthoz A,Kahane P (2006) Intracerebral dynamics ofsaccade generation in the human frontal eyefield and supplementary eye field. Neuroim-age 30:1302–1312.
Lachaux JP, Fonlupt P, Kahane P, Minotti L,Hoffmann D, Bertrand O, Baciu M (2007)Relationship between task-related gamma os-cillations and BOLD signal: new insights fromcombined fMRI and intracranial EEG. HumBrain Mapp 28:1368 –1375.
Logothetis NK, Pauls J, Augath M, Trinath T, Oel-termann A (2001) Neurophysiological in-vestigation of the basis of the fMRI signal. Na-ture 412:150 –157.
Medendorp WP, Kramer GF, Jensen O, Oosten-veld R, Schoffelen JM, Fries P (2007) Oscil-latory activity in human parietal and occipitalcortex shows hemispheric lateralization andmemory effects in a delayed double-step sac-cade task. Cereb Cortex 17:2364 –2374.
Milea D, Lobel E, Lehericy S, Leboucher P, Po-chon JB, Pierrot-Deseilligny C, Berthoz A
(2007) Prefrontal cortex is involved in inter-nal decision of forthcoming saccades. Neuro-report 18:1221–1224.
Pesaran B, Pezaris JS, Sahani M, Mitra PP,Andersen RA (2002) Temporal structure inneuronal activity during working memory inmacaque parietal cortex. Nat Neurosci5:805– 811.
Quian Quiroga R, Snyder LH, Batista AP, Cui H,Andersen RA (2006) Movement intention isbetter predicted than attention in the poste-rior parietal cortex. J Neurosci 26:3615–3620.
Schluppeck D, Curtis CE, Glimcher PW, HeegerDJ (2006) Sustained activity in topographicareas of human posterior parietal cortex dur-ing memory-guided saccades. J Neurosci26:5098 –5108.
Tikhonov A, Handel B, Haarmeier T, Lutzen-berger W, Thier P (2007) Gamma oscilla-tions underlying the visual motion aftereffect.Neuroimage 38:708 –719.
Van Der Werf J, Jensen O, Fries P, MedendorpWP (2008) Gamma-band activity in humanposterior parietal cortex encodes the motorgoal during delayed prosaccades and antisac-cades. J Neurosci 28:8397– 8405.
Van Veen BD, van Drongelen W, Yuchtman M,Suzuki A (1997) Localization of brain elec-trical activity via linearly constrained mini-mum variance spatial filtering. IEEE TransBiomed Eng 44:867– 880.
Wede J, Francis G (2006) The time course of vi-sual afterimages: data and theory. Perception35:1155–1170.
Yuval-Greenberg S, Tomer O, Keren AS, Nelken I,Deouell LY (2008) Transient inducedgamma-band response in EEG as a manifesta-tion of miniature saccades. Neuron58:429 – 441.
Zhang M, Barash S (2004) Persistent LIP activityin memory antisaccades: working memory fora sensorimotor transformation. J Neuro-physiol 91:1424 –1441.
Jerbi et al. • Journal Club J. Neurosci., December 17, 2008 • 28(51):13713–13715 • 13715
MINI-REVIEW
Task-Related Gamma-Band Dynamics From anIntracerebral Perspective: Review and Implications
for Surface EEG and MEG
Karim Jerbi,1,2 Tomas Ossandon,1 Carlos M. Hamame,3 S. Senova,1,2
Sarang S. Dalal,1 Julien Jung,1 Lorella Minotti,4 Olivier Bertrand,1
Alain Berthoz,2 Philippe Kahane,4 and Jean-Philippe Lachaux1*
1INSERM, U821, Brain Dynamics and Cognition; Universite Claude Bernard, Lyon 1, Lyon, France2CNRS, UMR 7152, Physiology of Perception and Action Laboratory, College de France, Paris, France
3Instituto de Ciencias Biomedicas, Universidad de Chile, Santiago, Chile4Neurology Department, Grenoble Hospital, Grenoble, France
Abstract: Although non-invasive techniques provide functional activation maps at ever-growing spatio-temporal precision, invasive recordings offer a unique opportunity for direct investigations of the fine-scale properties of neural mechanisms in focal neuronal populations. In this review we provide anoverview of the field of intracranial Electroencephalography (iEEG) and discuss its strengths and limi-tations and its relationship to non-invasive brain mapping techniques. We discuss the characteristics ofinvasive data acquired from implanted epilepsy patients using stereotactic-electroencephalography(SEEG) and electrocorticography (ECoG) and the use of spectral analysis to reveal task-related modula-tions in multiple frequency components. Increasing evidence suggests that gamma-band activity (>40Hz) might be a particularly efficient index for functional mapping. Moreover, the detection of highgamma activity may play a crucial role in bridging the gap between electrophysiology and functionalimaging studies as well as in linking animal and human data. The present review also describes recentadvances in real-time invasive detection of oscillatory modulations (including gamma activity) inhumans. Furthermore, the implications of intracerebral findings on future non-invasive studies are dis-cussed. Hum Brain Mapp 00:000–000, 2009. VVC 2009 Wiley-Liss, Inc.
Key words: stereotactic electroencephalography (SEEG); electrocorticography (ECoG); oscillations;gamma-band activity; real-time electrophysiology; functional mapping; invasive humanrecordings; epilepsy
INTRODUCTION
Shortly after Berger [1929] reported the first electroence-phalography (EEG) measurements in humans using elec-trodes placed on the scalp the technique was adapted byneurosurgeons to directly acquire intracerebral signalsfrom patients. Such recordings proved to be of great inter-est for pre-surgical brain mapping allowing for clinicalassessments with an unprecedented spatial precision[Jasper and Penfield, 1949; Ward and Thomas, 1955]. Theseearly studies marked the birth of a new field that would
Additional Supporting Information may be found in the onlineversion of this article.
*Correspondence to: Jean-Philippe Lachaux, INSERM – U821,Brain Dynamics and Cognition, Centre Hospitalier Le Vinatier,Batiment 452, 95 Boulevard Pinel, 69500 Bron, France.E-mail: [email protected]
Received for publication 13 November 2008; Revised 19 January2009; Accepted 20 January 2009
DOI: 10.1002/hbm.20750Published online in Wiley InterScience (www.interscience.wiley.com).
VVC 2009 Wiley-Liss, Inc.
r Human Brain Mapping 00:000–000 (2009) r
expand beyond its clinical application to the field of brainresearch. Indeed, more than fifty years later, intracranialelectroencephalography (iEEG) has become an essentialcomponent of the pre-surgical routine procedures for awide range of neurological diseases including drug-resist-ant epilepsy, Parkinson disease, essential tremor, braintumors, while providing unique insights into brain func-tion [Engel et al., 2005]. Early observations that changes iniEEG recordings were correlated with the patient’s envi-ronment or behavior [Jasper and Penfield, 1949] graduallylaid the foundations for a new research field bringingtogether clinicians and neuroscientists and advancing ourunderstanding of the neural mechanisms underlyinghuman cognition. Despite a number of restrictions inherentto the therapeutic context of its application, iEEG hasgrown into a field of its own, yielding a steady stream ofseminal observations ranging from the functional organiza-tion of the human visual system [Allison et al., 1999;Halgren et al., 1994] to response properties of individualneurons during mental imagery in the anterior temporallobe [Kreiman et al., 2000] to name but a few examples ofiEEG’s important input to neuroscience.In this review, we provide a short overview of iEEG and
discuss its advantages and its limitations for cognitive neu-roscience as well as its relationship to non-invasive brainmapping techniques. A comprehensive review of invasiverecordings in a range of clinical conditions includingmovement disorders such as Parkinson’s disease can befound in Engel et al. [2005]. Here, we restrict the discus-sion to invasive recordings acquired from implanted epi-lepsy patients either with stereotactic-electroencephalogra-phy (SEEG) or electrocorticography (ECoG) and focus oncurrent topics in invasive functional mapping based on thedetection of task-related modulations of cortical oscilla-tions. In particular, we discuss the efficiency of detectinggamma-band activity (>40 Hz) using offline and onlineanalysis for invasive functional mapping [Crone et al.2006; Jensen et al. 2007], and its putative role in bridgingthe gap between electrophysiology and functional imagingstudies as well as linking animal and human data. In addi-tion, we aim to dispel certain misconceptions about thesignificance and interpretability of human invasive record-ings by outlining their unique advantages and explicitlydescribing their inherent limitations. Finally, we alsoaddress the relationship and complementarities betweeniEEG and non-invasive electrophysiological studies.
INVASIVE RECORDINGS IN EPILEPSY
Intracerebral recordings in humans are performed usinga wide range of techniques tailored to the neurological dis-order and therapeutic strategy at hand. Depth recordingsare for instance used during positioning of a deep brainstimulation (DBS) electrode in Parkinson’s disease[Benazzouz et al., 2002; Engel et al., 2005]. Furthermore,invasive recordings are used in patients with intractable
epilepsy in order to simultaneously and chronically probethe neural activity in multiple brain structures during apre-surgical evaluation period.
The Clinical Setting
In patients with pharmacologically resistant epilepsy,iEEG is used to identify cortical regions critical for seizureonset and identify others that need to be spared at thetime of surgery [e.g., Kahane et al., 2004]. The intracerebralelectrodes sometimes stay in place for more than twoweeks in order to localize the origin of fast electrophysio-logical rhythms that precede seizure onset and that are atthe core of the epileptogenic network. Surgical resection ofthe focus of the seizure has been shown to yield up to 70%success rates for drug-resistant temporal lobe epilepsy[Engel, 1996]. Intracranial EEG is used to test one or sev-eral hypothesis regarding the anatomical organization ofthe epileptogenic network. This sometimes implies thatintra-cerebral electrodes are positioned in widely distrib-uted brain regions that might include pathological but alsohealthy tissue. Therefore, such a clinical context can alsoprovide a unique opportunity to study fundamental ques-tions about neural coding and cognition. The rest of thisreview is dedicated to iEEG data acquired in the clinicalcontext of epilepsy.
Stereotactic-EEG and Electrocorticography:Two Intracranial Recording Techniques
Although microelectrodes have been used in humans toacquire single-neuron spiking data [Fried et al., 1997; Heitet al., 1988; Ojemann et al., 2002; Ward and Thomas, 1955],clinical recordings in epilepsy patients are generally per-formed using macroelectrodes that measure coherent activ-ity of local neuronal populations in the vicinity of therecording site. The most common choice in the clinicalroutine is to use either stereotactic-electroencephalography(SEEG) or electrocorticography (ECoG) which acquireintracranial data using multilead depth electrodes orsubdural grid electrodes respectively (see Fig. 1). Subduralgrids consist of 2D arrays (or sometimes one-dimensionalstrips) of electrodes positioned directly on the lateral sur-face of the brain, with a typical inter-electrode distance of1 cm [Engel et al., 2005]. In contrast, depth electrodes aresemi-flexible one-dimensional linear arrays, shaped as nar-row needles that penetrate deep into the brain. Such depthelectrode implantations are often referred to as StereotacticEEG because a stereotactic technique developed byTalairach and Bancaud is used to localize the electrodes[Kahane et al., 2006]. While subdural grids provide wide-spread cortical coverage and cortical maps of gyral activ-ity, the multilead depth electrodes record from both sulciand gyri and go beneath the cortical surface to probe deepcortical structures, such as the cingulate gyrus, and occa-sionally subcortical structures, such as the lateral genicu-late nucleus [Krolak-Salmon et al., 2003] or the nucleus
r Jerbi et al. r
r 2 r

acumbens [Munte et al., 2008]. A further differencebetween SEEG and ECoG is that while depth electrodesrequire small burr holes for implantation the implantationof two-dimensional subdural grids involves a largercraniotomy.Converging evidence suggests that both grid [Menon
et al., 1996] and depth-electrodes recordings [Lachauxet al., 2003] provide sufficient spatial resolution to localizeneural activity at the gyral level, a precision that is asgood as, if not better, than what is achieved with fMRI. Inaddition, the spatial precision of the analysis also dependson the accuracy of electrode localization [Dalal et al.,2008a] and choice of reference electrode. In SEEG data, thelocal precision is highest when each recording site is refer-enced to its nearest neighbor (bipolar montage) than when
one remote site is used as reference for all channels(common reference) [Lachaux et al., 2003].Unless otherwise stated in the manuscript, the experi-
ments performed by our group that are reported in thisreview were carried out using multi-channel video-EEGacquisition and monitoring system (Micromed, Treviso,Italy) that simultaneously records the intracerebral activityfrom up to 128 depth-EEG electrodes (up to 1024 Hz sam-pling rate and a 0.1–200 Hz bandpass filter). As a generalrule, twelve to fourteen semi-rigid multi-lead electrodesare stereotactically implanted in each patient. The stereo-tactic-EEG (SEEG) electrodes used have a diameter of 0.8mm and, depending on the target structure, consist of 5–18contact leads 2 mm wide and 1.5 mm apart (Alcys,Besancon, France).
Strengths and Limitations of iEEG Research
At first sight, iEEG can be seen as combining the best oftwo worlds: the spatial resolution of fMRI and the tempo-ral accuracy of MEG/EEG. In addition, given that therecording sites are within the brain, iEEG signals areimmune to a large range of external artifacts (e.g., eyeblinks, face and neck muscles contractions). However, it isimportant to bear in mind two significant limitations: first,the data acquired report on patients with epileptic disor-ders and, second, the invasive electrodes only provide alimited coverage of the brain.Indeed, in recent years, iEEG research has begun to
establish a set of methods and specific practices to limit therisk of making physiological interpretations based on phe-nomena that actually reflect the pathological condition of thepatients. It is common iEEG practice to discard signalepochs that show any type of epileptiform activity. Further-more, most iEEG studies include post-surgical informationabout the spatial organization of the epileptogenic networkand do not report on task-related responses within that net-work. Also, when possible, an additional caution is to onlyreport observations that are reproducible across severalpatients with different types of epileptogenic networks andanticonvulsant medication [Fell et al., 2002; Halgren et al.,1994]. Nevertheless, an important body of iEEG researchprovides evidence that such issues can indeed be overcometo an extent that warrants the physiological significance ofthe physiological insights and novel hypotheses drawn fromthe data [Axmacher et al., 2008b; Brovelli et al., 2005; Can-olty et al., 2006; Crone et al., 1998a, 2006; Fell et al., 2002;Jung et al., 2008; Lachaux et al., 2003, 2005, 2006a; Lakatoset al., 2008; Mainy et al., 2007].The second limitation of many iEEG investigations is the
fact that the electrode implantation scheme only providesa restricted sampling of selected cerebral structures. Acomplete 3D coverage of the brain with a spatial resolutionof 3.5 mm has been estimated to require about 10,000recording sites [Halgren et al., 1998], that is roughly 100times more than the number of sites we actually record(approx. 100). A more comprehensive view of the large-
Figure 1.Subdural grids vs. depth electrodes. (a) Representation of elec-trocorticographic (ECoG) subdural grid electrodes. Open circlesindicate recording sites on a 8-by-8 matrix covering the lateralsurface of the somatosensory cortex. (b) Example of implanta-tion with stereotactic encephalography (SEEG) electrodes. Blackdots represent the entry points of ten depth electrodes. Eachelectrode consists of 5–15 contact sites (green squares). In mostcases, SEEG electrodes are inserted orthogonal to the inter-hemispheric plane as shown on coronal MRI slice.
r Intracerebral EEG and Functional Brain Mapping r
r 3 r

scale networks involved in various cognitive tasks wouldtherefore require combining data from multiple subjectswith both overlapping and complementary electrode posi-tions. In practice, collecting data from comparable anatom-ical origin across several patients is of non-negligible diffi-culty since the target structures for intracerebral electrodesplacement is determined in each patient individually andindependently of research objectives. The standards ofinvasive and non-invasive research are thus inherently dif-ferent. Furthermore, to a certain extent, iEEG studies sharesome common aspects with monkey electrophysiologystudies. The latter report in most cases on two or three ani-mals with recordings in comparable regions and with aparticularly high signal-to-noise ratio. In addition, the lim-ited extent of probed cerebral structures (spatial coverage)and the question of generalization to the healthy humanbrain are undoubtedly two issues that are also relevant tofindings reported invasively in monkey studies. Animalstudies provide valuable observations and hypotheses thatultimately need to be explored and validated in humans.Similarly, the results of iEEG studies in human patientsmay be further validated in healthy subject by non-inva-sive techniques such as MEG and EEG.
SPECTRAL COMPONENTS OF iEEG DATA
Oscillatory brain responses are not perfectly phase-locked with respect to experimental stimuli and are thusdiscarded by the time-domain averaging of the data typi-cally used to compute event-related potentials (ERPs).Therefore, with the advent of enhanced computing power,novel time-frequency domain approaches were applied toassess such activations, described as induced responses, bycontrast to the phase-locked activations known as evokedresponses [Tallon-Baudry and Bertrand, 1999]. As an exam-ple, using time-frequency analysis intracranial data inhumans have reported that motor behavior is associatedwith spatially focal increases in high frequency (>40 Hz)activity and widespread decreases in lower frequencies (8–30 Hz) in the motor cortex [Aoki et al., 1999; Crone et al.,1998a; Lachaux et al., 2006a; Mehring et al., 2004; Pfurtsch-eller et al., 2003; Pistohl et al., 2008; Szurhaj et al., 2005].
Gamma-Band Activity Modulations: A RobustCorrelate of Local Neural Activation
Several early animal microelectrode studies pointedtowards the putative functional importance of synchron-ized neural oscillations at high frequencies (>40 Hz), i.e.,within the gamma band [Eckhorn et al., 1988; Freeman,1978; Gray et al., 1989; Rougeul-Buser et al., 1975]. Neuralsynchronization in the gamma band has been proposed asa fundamental mechanism for neural communicationunderlying both perceptual and motor processes [Murthyand Fetz, 1992; Singer and Gray, 1995]. In addition, severalscalp EEG studies reported task-related responses in the
gamma band in a variety of visual paradigms [Gruberet al., 1999; Tallon-Baudry et al., 1996] suggesting a link tothe neural synchronization phenomenon recorded inva-sively in animals.Forty years after Chatrian’s seminal report [Chatrian
et al., 1960], task-related gamma band increases wereobserved in direct recordings of the human brain usingtightly controlled experimental paradigms and advancedsignal processing analysis [Crone et al., 1998a; Lachauxet al., 2000]. Ever since, an increasing number of iEEGstudies in humans (epilepsy patients for the large part)report gamma-range activations in various brain structuresand in various experimental conditions. Interestingly,although research into the functional significance ofgamma activity is still in its early days, converging find-ings from these studies point to a number of properties ofgamma-band responses (GBRs) that appear to be repro-ducible across a variety of brain structures and in variousexperimental conditions. Previous work including numer-ous ECoG and SEEG studies by our group and otherssuggest that these common characteristics could be tenta-tively summarized as follows:
1. Broad frequency extent: gamma-band responses(GBR) consist of spectral power increases (or suppres-sions) that are time-locked to sensory or motorevents, in a broad range of frequencies (40– 200 Hz).Note also that task-related gamma-band suppressions(GBS) have recently been reported with iEEG[Lachaux et al., 2008].
2. Functional specificity: the fine spatial organization ofGBRs strongly depends on the cognitive process athand. For example, Figure 2 illustrates this specificitywithin Broca’s area during a word recognition task(semantic versus phonological processing). Similarly,we have also reported using SEEG in an implantedsubject performing an auditory experiment, thatswitching the auditory stimulus from speech to musiccauses a seven millimeters shift in the focus of theGBR locus in the Superior temporal gyrus [Lachauxet al., 2007a].
3. Spatial specificity: Although sources of GBRs havebeen found across distributed brain areas, each GBRsource per se generally shows spatially focal activa-tion. This contrasts with the wider spatial distributionof power modulations in lower frequency bands suchas the alpha (8–13 Hz) or beta (15–30 Hz) bands. Thisgeneral observation has been shown to be particularlyclear in the sensorimotor cortex [Crone et al., 1998b],but is also visible during visual search tasks forinstance (cf. Fig. 3).
4. Generalization: large-scale networks exhibiting GBRshave been found in a large variety of cognitive tasksinvolving working memory [Axmacher et al., 2008b;Howard et al., 2003; Mainy et al., 2008], declarativememory [Axmacher et al., 2008a; Fell et al., 2001,2002, 2008; Sederberg et al., 2007], reading [Mainy
r Jerbi et al. r
r 4 r

et al., 2008], speech perception and production [Croneet al., 2001b], attention [Brovelli et al., 2005; Jensenet al., 2007; Jung et al., 2008; Ray et al., 2008], visual[Lachaux et al., 2005; Tanji et al., 2005], auditory[Bidet-Caulet and Bertrand, 2005; Crone et al., 2001a;Edwards et al., 2005], somatosensory [Aoki et al., 1999]and olfactory perception [Jung et al., 2006], motorprocesses [Crone et al., 1998a; Lachaux et al., 2006].
Although the above properties should by no means con-vey the impression that GBRs provide by themselves acomprehensive view of task-related neural dynamics, theydo highlight, in our opinion, the importance of exploringthe functional significance of gamma range activity.Whether GBRs represent a phenomenon that is intrinsic tocognition is still debated. A theoretical framework whichdraws upon single-unit recordings in animal studies sug-gests that gamma-band synchronization facilitates neuralcommunication [Fries, 2005; Singer, 1999]. Compared to aresting baseline level, gamma-band activity recordedwithin a neural population would increase when its neu-rons are recruited by a cognitive process, and conversely,gamma power might be expected to decrease when thepopulation is no longer necessary or when its activity isinhibited [Lachaux et al., 2008]. The view that engagementin a cognitive act triggers a large-scale network of distrib-uted and spatially focal enhancements and suppressions(i.e., positive and negative modulations) of gamma-bandresponses compared to the resting state provides an attrac-tive framework for comparison with fMRI studies. Indeed,recent studies both in animals and in humans reportprominent spatial overlap between the networks ofgamma-band activations and those of the BOLD signalsuggesting a direct relationship between the two [Kayseret al., 2004; Lachaux et al., 2007b; Logothetis et al., 2001;Niessing et al., 2005; Nishida et al., 2008].
Oscillatory Modulations in Lower Frequency Bands
In addition to GBRs, time-frequency analysis of iEEGdata has also revealed robust task-related response pat-terns in lower frequency bands, mostly in the theta (4–7 Hz), alpha (7–14 Hz) and beta (15–30 Hz) bands. Resultsobtained with iEEG are largely in line with reports fromscalp recordings, and often reveal alpha and beta powersuppressions during the task compared to the baseline pe-riod. For instance, such findings were reported in thesensori-motor cortex and described as event-related muand beta desynchronization [Crone et al., 1998b; Pfurtsch-eller et al., 2003] as well as in the parieto-occipital cortex[e.g., Adrian, 1941]. Furthermore, alpha and beta suppres-sions often occur simultaneously with GBRs. Althoughthere has been, to our knowledge, no extensive iEEG datameta-analysis that specifically explores this relationship, it hasoften been reported in humans with iEEG studies [Croneet al., 1998a,b; Lachaux et al., 2005] and MEG recordings [deLange et al., 2008] as well as in animal studies [e.g., Rickert
Figure 2.Illustration of the functional specificity of gamma-band activity ina word recognition task. Patients had to perform either ananimacy decision on written words (Semantic task) or rhymedetection on visually presented pseudo-words (Phonologicaltask). Time-frequency (TF) representations show energy in-creases and decreases relative to pre-stimulus baseline acrossthe two conditions in three distinct regions: Broca pars triangu-laris (‘T’), Broca pars opercularis (‘O’) and Ventral Lateral Pre-frontal Cortex (‘V’) (response is shown for 2 seconds after stim-ulus onset). Energy increases above 50 Hz clearly differentiatebetween task conditions in Broca (‘T’ and ‘O’). Enhancedgamma-band responses in Broca coincide with gamma-band sup-pression in the VLPFC (V). TF maps also display a clear Brocapower suppression in all conditions below 30 Hz, i.e., in thealpha and beta bands.
r Intracerebral EEG and Functional Brain Mapping r
r 5 r
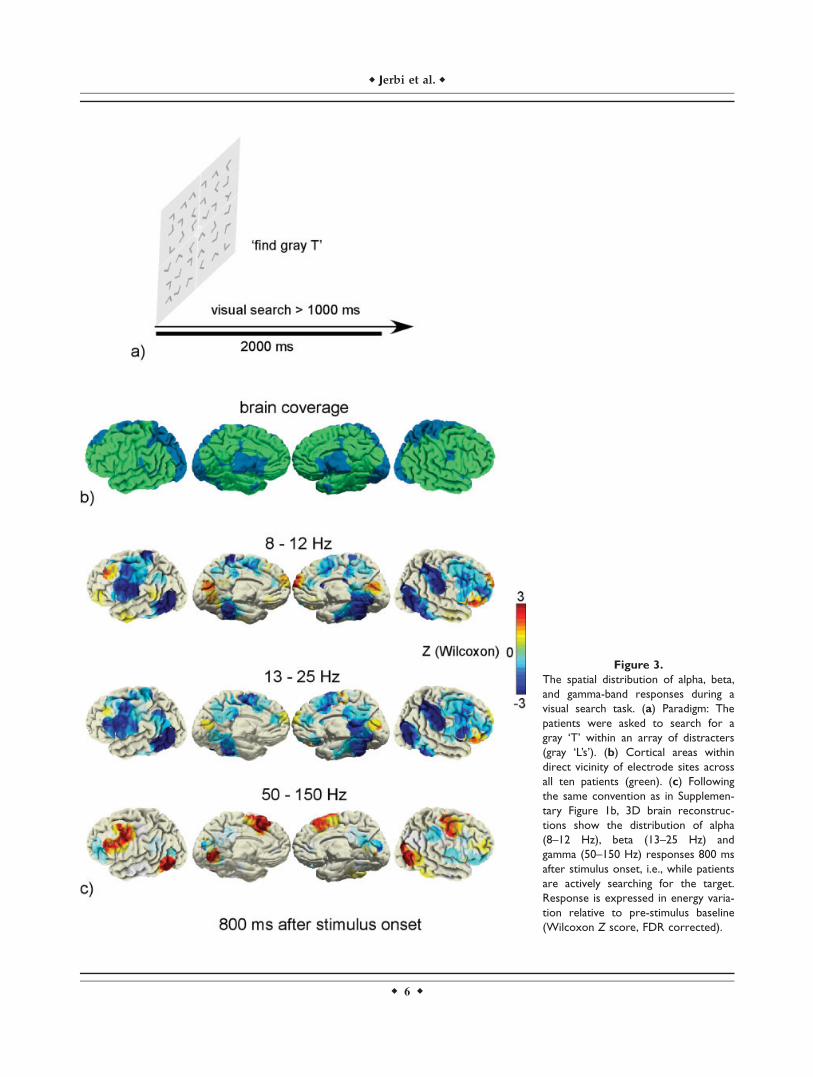
Figure 3.The spatial distribution of alpha, beta,and gamma-band responses during avisual search task. (a) Paradigm: Thepatients were asked to search for agray ‘T’ within an array of distracters(gray ‘L’s’). (b) Cortical areas withindirect vicinity of electrode sites acrossall ten patients (green). (c) Followingthe same convention as in Supplemen-tary Figure 1b, 3D brain reconstruc-tions show the distribution of alpha(8–12 Hz), beta (13–25 Hz) andgamma (50–150 Hz) responses 800 msafter stimulus onset, i.e., while patientsare actively searching for the target.Response is expressed in energy varia-tion relative to pre-stimulus baseline(Wilcoxon Z score, FDR corrected).
r Jerbi et al. r
r 6 r
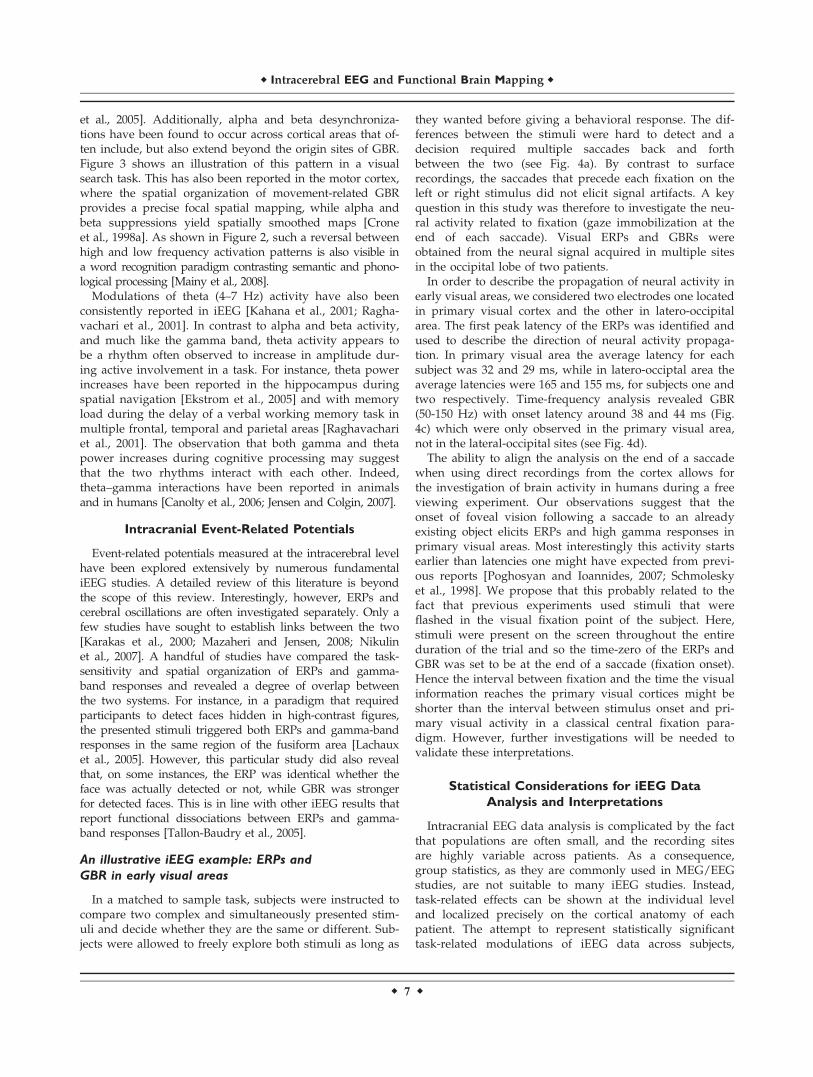
et al., 2005]. Additionally, alpha and beta desynchroniza-tions have been found to occur across cortical areas that of-ten include, but also extend beyond the origin sites of GBR.Figure 3 shows an illustration of this pattern in a visualsearch task. This has also been reported in the motor cortex,where the spatial organization of movement-related GBRprovides a precise focal spatial mapping, while alpha andbeta suppressions yield spatially smoothed maps [Croneet al., 1998a]. As shown in Figure 2, such a reversal betweenhigh and low frequency activation patterns is also visible ina word recognition paradigm contrasting semantic and phono-logical processing [Mainy et al., 2008].Modulations of theta (4–7 Hz) activity have also been
consistently reported in iEEG [Kahana et al., 2001; Ragha-vachari et al., 2001]. In contrast to alpha and beta activity,and much like the gamma band, theta activity appears tobe a rhythm often observed to increase in amplitude dur-ing active involvement in a task. For instance, theta powerincreases have been reported in the hippocampus duringspatial navigation [Ekstrom et al., 2005] and with memoryload during the delay of a verbal working memory task inmultiple frontal, temporal and parietal areas [Raghavachariet al., 2001]. The observation that both gamma and thetapower increases during cognitive processing may suggestthat the two rhythms interact with each other. Indeed,theta–gamma interactions have been reported in animalsand in humans [Canolty et al., 2006; Jensen and Colgin, 2007].
Intracranial Event-Related Potentials
Event-related potentials measured at the intracerebral levelhave been explored extensively by numerous fundamentaliEEG studies. A detailed review of this literature is beyondthe scope of this review. Interestingly, however, ERPs andcerebral oscillations are often investigated separately. Only afew studies have sought to establish links between the two[Karakas et al., 2000; Mazaheri and Jensen, 2008; Nikulinet al., 2007]. A handful of studies have compared the task-sensitivity and spatial organization of ERPs and gamma-band responses and revealed a degree of overlap betweenthe two systems. For instance, in a paradigm that requiredparticipants to detect faces hidden in high-contrast figures,the presented stimuli triggered both ERPs and gamma-bandresponses in the same region of the fusiform area [Lachauxet al., 2005]. However, this particular study did also revealthat, on some instances, the ERP was identical whether theface was actually detected or not, while GBR was strongerfor detected faces. This is in line with other iEEG results thatreport functional dissociations between ERPs and gamma-band responses [Tallon-Baudry et al., 2005].
An illustrative iEEG example: ERPs andGBR in early visual areas
In a matched to sample task, subjects were instructed tocompare two complex and simultaneously presented stim-uli and decide whether they are the same or different. Sub-jects were allowed to freely explore both stimuli as long as
they wanted before giving a behavioral response. The dif-ferences between the stimuli were hard to detect and adecision required multiple saccades back and forthbetween the two (see Fig. 4a). By contrast to surfacerecordings, the saccades that precede each fixation on theleft or right stimulus did not elicit signal artifacts. A keyquestion in this study was therefore to investigate the neu-ral activity related to fixation (gaze immobilization at theend of each saccade). Visual ERPs and GBRs wereobtained from the neural signal acquired in multiple sitesin the occipital lobe of two patients.In order to describe the propagation of neural activity in
early visual areas, we considered two electrodes one locatedin primary visual cortex and the other in latero-occipitalarea. The first peak latency of the ERPs was identified andused to describe the direction of neural activity propaga-tion. In primary visual area the average latency for eachsubject was 32 and 29 ms, while in latero-occiptal area theaverage latencies were 165 and 155 ms, for subjects one andtwo respectively. Time-frequency analysis revealed GBR(50-150 Hz) with onset latency around 38 and 44 ms (Fig.4c) which were only observed in the primary visual area,not in the lateral-occipital sites (see Fig. 4d).The ability to align the analysis on the end of a saccade
when using direct recordings from the cortex allows forthe investigation of brain activity in humans during a freeviewing experiment. Our observations suggest that theonset of foveal vision following a saccade to an alreadyexisting object elicits ERPs and high gamma responses inprimary visual areas. Most interestingly this activity startsearlier than latencies one might have expected from previ-ous reports [Poghosyan and Ioannides, 2007; Schmoleskyet al., 1998]. We propose that this probably related to thefact that previous experiments used stimuli that wereflashed in the visual fixation point of the subject. Here,stimuli were present on the screen throughout the entireduration of the trial and so the time-zero of the ERPs andGBR was set to be at the end of a saccade (fixation onset).Hence the interval between fixation and the time the visualinformation reaches the primary visual cortices might beshorter than the interval between stimulus onset and pri-mary visual activity in a classical central fixation para-digm. However, further investigations will be needed tovalidate these interpretations.
Statistical Considerations for iEEG DataAnalysis and Interpretations
Intracranial EEG data analysis is complicated by the factthat populations are often small, and the recording sitesare highly variable across patients. As a consequence,group statistics, as they are commonly used in MEG/EEGstudies, are not suitable to many iEEG studies. Instead,task-related effects can be shown at the individual leveland localized precisely on the cortical anatomy of eachpatient. The attempt to represent statistically significanttask-related modulations of iEEG data across subjects,
r Intracerebral EEG and Functional Brain Mapping r
r 7 r
Figure 4.Example study. Free viewing in humanearly visual areas. (a) Schematic repre-sentation of the behavioral task. Stim-uli were separated from each other by10 degrees, centered on the middle ofthe screen, and had a diameter of 1degree. Both stimuli were present dur-ing the entire trial, which was endedby a behavioral response of ‘‘same’’ or‘‘different’’ made through a computermouse. (b) Electroculogram (EOG)recording showing the method used todetermine the end of a saccade (fixa-tion onset). (c) ERPs and (d) GBRs asrecorded in two electrodes for twopatients. Black and gray traces repre-sents the activation recorded from pri-mary visual and latero-occipital areas.Left and right panels correspond topatient one and two. (e) Magnetic res-onance images of a horizontal cutfrom brains of each patient. Red andmagenta dots show the location of theelectrode contacts.
r Jerbi et al. r
r 8 r

time, space and frequency is in itself quite a unique neuro-imaging challenge. One approach used in our group todeal with this complexity consists of the following three-step procedure: First, a statistical comparison is performedbetween experimental conditions at the individual level,on each recording site, to identify regions of interest withtask-related neural responses. This includes a correctionfor multiple comparisons and may involve either a directcomparison between two conditions or a comparisonbetween the task and a pre-stimulus resting baseline. Thesecond step is the identification of brain regions of interestwhich show similar effects across several patients. Thethird step is to display the individual data for each regionof interest, displaying the task-related effect on eachpatient’s anatomical MRI. The above steps are illustratedin Supporting Information Figure 1. Such a procedure hasproven to be particularly well-suited for analyzing depth-electrode recordings in populations of ten to twentypatients [Jung et al., 2008; Mainy et al., 2007].
ONLINE MONITORING OF INTRACRANIALOSCILLATORY ACTIVITY (BRAIN TV)
In a recent implementation, we proposed an iEEG real-time system that computes and displays the variations ofongoing alpha, beta and gamma-band activations at each re-cording site [Lachaux et al., 2007a]. The system, dubbedBrain TV, allows the experimenter, clinical staff as well asthe patient to visualize the immediate effect of his behavioron brain oscillations. As an example, while monitoring iEEGactivity in the superior temporal gyrus in one patient withthe real-time system, a selective reactivity of the gamma ac-tivity to certain aspects of speech perception was suspected(such as perceiving a change of speaker). The hypothesiswas then confirmed and fine-tuned using follow-up experi-ments tailor-designed to probe the observed phenomenon[Lachaux et al., 2007a]. A similar approach has also beenused to map the motor cortex [Miller et al., 2007]. Moreimportantly, the Brain TV set-up holds the potential ofrevealing previously unsuspected correlations between vari-ous mental events and the online display of oscillatory activ-ity. Such events may also be covert cognitive operations andpart of the patient’s subjective experience.Figure 5 shows an illustrative example of the application
of the Brain TV platform. While monitoring the power ofongoing alpha oscillations measured by one specific elec-trode, the patient reported that a decrease in the displayedactivity appeared to be associated with vision, in particularto focused vision. The monitored electrode position turnedout to be in the superior parietal lobule (SPL, BA 7) andwhen cued to switch between a visual attention state andan auditory attention state systematic alternations betweenalpha suppression and enhancement were visible on theBrain TV set-up (Fig. 5b). These qualitative online observa-tions provide single-trial evidence that alpha modulationsin the SPL are modulated by visual attention.
Figure 5.Online measurements of visual attention with Brain TV. (a) TheBrain TV set-up allows patients to visualize ongoing alpha, betaor gamma-band activity measured in real-time in specific regionsof their brain. (b) Using the set-up, one patient was able toachieve online control of the activity recorded in her superiorparietal lobe within the 10-16 Hz frequency range. She reportedher ability to modulate the activity by focusing her attention ondistant visual objects. The subject was then cued to switchbetween auditory and visual attention. The graph depicts theonline variations of the activity as she shifted her attention backand forth between vision (in gray) and audition (in white). Theseonline observations of alpha ERD during visual attention areinline with previous offline studies.
r Intracerebral EEG and Functional Brain Mapping r
r 9 r

Beyond investigating the functional role of neural oscil-lations, the online system also has immediate applicationsas a clinical tool for pre-surgical mapping (as a comple-ment to electrocortical stimulation) [Lachaux et al., 2007a]and can be directly used in explorative investigations forthe development of novel brain computer interface (BCI)strategies [Jerbi et al., 2007, in press].
IMPLICATIONS FOR MEG AND EEG
Invasive EEG recordings are restricted to a number ofclinical conditions that require the surgical implantation ofintracerebral recordings. Therefore, while it is fortunatethat access to such data is sometimes possible for researchpurposes, it is clearly an exceptional setting. It is thereforeimportant to ask whether the findings obtained via accessto such fine-scale recordings in humans has implicationson investigations based on non-invasive electrophysiologi-cal techniques such as MEG and scalp-EEG. Indeed, find-ings of iEEG would almost invariably benefit from a vali-dation in a large population of healthy subjects. Of course,this assumes that the phenomena reported invasively canalso be detected using non-invasive techniques. In particu-lar, it is unclear to which extent the growing body of evi-dence on high gamma activity (60–200 Hz) reported withiEEG can be replicated using EEG and MEG. The detectionof gamma-band activity in EEG and MEG signals is com-plicated by several factors related in one way or another toa low SNR at this high frequency range. EEG and MEGsensors inherently measure the summed activity from mul-tiple neural populations. While the skull is assumed tohave similar impedance at both low and high frequencies,active patches of cortex can exhibit large phase variability,and the resulting polyphasic summation effectively resultsin lowpass filtering [Pfurtscheller and Cooper, 1975]. Asdiscussed above, the spatial extent of oscillatory powermodulations in the high gamma range is generally morefocal than in the lower alpha and beta frequencies [Croneet al. 1998a; Edwards et al. 2005], which implies less signalreaches the scalp since the active patch may be relativelysmall. A further issue that limits the detectability of highgamma activity is the presence of artifacts. EEG and MEGsignals can be contaminated by EMG signals from oculo-motor and head muscles with spectral characteristicssimilar to that of physiological gamma-band activity[Yuval-Greenberg et al., 2008].Despite these limitations, several studies have reported
gamma-band activity using MEG or EEG in a variety ofexperimental conditions, including motor [Ball et al., 2008;Cheyne et al., 2008; Dalal et al., 2008b; de Lange et al.,2008; Gonzalez et al., 2006; Pfurtscheller et al., 1993;Salenius et al., 1996], oculomotor [Jerbi et al., 2008; Meden-dorp et al., 2007; Van der Werf et al., 2008], sensory[Hoogenboom et al., 2006; Tecchio et al., 2008], visual[Chaumon et al., 2008; Muthukumaraswamy and Singh,2008a; Rodriguez et al., 1999; Tanji et al., 2005] behavioras well as in decision making [Guggisberg et al., 2007]
pain [Gross et al., 2007] and attention [Schurger et al.,2008; Vidal et al., 2006] processes.In general, the increasing number of reports of widely
distributed networks of high gamma activity detected withiEEG in various experiments and across numerous struc-tures suggests that increasing sensitivity to high frequencyoscillations might be a priority for future research withnon-invasive techniques. This may be achieved by optimiz-ing three distinct aspects of non-invasive studies: (1)Adapted experimental design: one way to compensate forthe low SNR of high gamma activity is to ensure a largenumber of trials (e.g., 200 trials or more) per condition. Inaddition, the design should be carefully adapted to thesource estimation procedure that will be subsequentlyused. This might involve ensuring sufficiently long epochsto improve the estimation of signal and noise covariance.Furthermore, block design experiments, if suitable to theinvestigated question, might help drive the neural net-works into a sustained activation state, which could posi-tively affect the SNR, compared to that associated withtransient neural phenomena. (2) Improving artifact detec-tion and rejection: As discussed above, disambiguatingphysiological and artifactual gamma range activity is anon-negligible concern. This can be enhanced by system-atic and accurate monitoring of the possible source of arti-fact. Electromyograms and electrooculograms (EOG)should be used systematically and the respective tracesshould be used both for visual inspection and automaticor semi-automatic artifact detection. Independent compo-nent analysis may also be used for artifact removal. Fur-thermore, in the light of recent concerns linking miniaturesaccades and gamma components of the EEG [Yuval-Greenberg et al., 2008], accurate monitoring of eye move-ments using dedicated eye-tracking systems might becomecritical for future studies. Note however, that although thisissue might be of direct relevance to scalp-EEG studies, itmay be less critical issue for MEG which is reference-free.Indeed the artifact was shown to be prominent for nose-referenced EEG data which re-injects the microsaccadic ac-tivity into distant occipital electrodes. Nevertheless, thesusceptibility of MEG to contamination by microsaccadeartifacts requires further investigation. As a matter of fact,we have recently shown that even iEEG, which is predom-inantly immune to saccade artefacts, can display artifactualgamma power increases at depth electrodes located closeto the extra-ocular eye muscles [Jerbi et al., 2009]. (3) Usingsource reconstructions: source reconstruction techniquesmay potentially prove to be crucial for the detection oftask-related high gamma activity that is not readily detect-able at the sensor level. Source estimation based on mini-mum norm solutions or on beamforming have successfullybeen used in the past to detect high gamma (>60 Hz) ac-tivity in MEG data [Cheyne et al., 2008; Dalal et al., 2008b;Van Der Werf et al., 2008]. Insights into optimizing sourceestimation techniques to increase sensitivity to highgamma activity will definitely benefit from recent studiesof simultaneous acquisitions of iEEG and MEG recordings
r Jerbi et al. r
r 10 r

in the same patient (Dalal et al., in press; Lachaux et al.,2007c]. Moreover, source estimation of such high fre-quency activity may also be improved by the use of datafrom iEEG as a source of a priori constraints for EEG/MEG source analysis. Additionally, granted that futurestudies firmly establish that BOLD and gamma-band activ-ity are indeed tightly linked, then fMRI studies could alsobe used to provide a priori knowledge of the origin ofgamma-band responses and be used for EEG/MEG sourcelocalization. Finally, investigating the correspondencebetween lower frequency findings in invasive and non-invasive recordings is equally crucial. For instance, the dis-crepancy between the spatial and functional specificity ofalpha versus beta motor rhythms reported in MEG [Sal-melin et al., 1995] and the lack thereof in some iEEG stud-ies will have to be resolved.
CONCLUSION
Albeit being sometimes faced with a fair share of skepti-cism or, at times, with excessive fascinations, intracranialrecordings in humans has grown into a field of its own pro-viding a steady stream of novel observations that haveadvanced our understanding of brain function. Intracerebralrecordings, especially of gamma activity, may play a pivotalrole in providing a means to better understand the links todata reported in animal electrophysiology and to findings ofneuroimaging studies. In addition, advances in non-invasiveelectrophysiological recordings will be key to validating andpossibly extending findings of invasive studies. Futuretrends include increased direct sampling of single-unit neu-ral activity in the human brain via various microelectroderecording techniques [Neves and Ruther, 2007; Ulbert et al.,2001]. Combining microelectrode data and population levelrecordings will be crucial in order to elucidate the neuralmechanisms that encode information processing and com-munication within local and large-scale cerebral networks.This said, the increasing scientific appeal of invasive humanrecordings will also have to be associated with enhancedvigilance to questions of ethics and patient safety.
ACKNOWLEDGMENTS
Support provided in part by the EC research programNeuroProbes (FP6-IST 027017) to K.J., the EC Marie CurieFellowship (FP7-221097) to S.S.D., the CONICYT (Chile)doctoral fellowship to C.M.H., and a doctoral fellowshipfrom the Ministere de l’Education Nationale et la Recher-che (France) to T.O. is acknowledged.
REFERENCES
Adrian ED (1941): Afferent discharges to the cerebral cortex fromperipheral sense organs. J Physiol 100:159–191.
Allison T, Puce A, Spencer DD, McCarthy G (1999): Electrophysio-logical studies of human face perception. I. Potentials gener-ated in occipitotemporal cortex by face and non-face stimuli.Cereb Cortex 9:415–430.
Aoki F, Fetz EE, Shupe L, Lettich E, Ojemann GA (1999): Increasedgamma-range activity in human sensorimotor cortex during per-formance of visuomotor tasks. Clin Neurophysiol 110:524–537.
Axmacher N, Elger CE, Fell J (2008a): Ripples in the medial tem-poral lobe are relevant for human memory consolidation. Brain131:1806–1817.
Axmacher N, Schmitz DP, Wagner T, Elger CE, Fell J (2008b):Interactions between medial temporal lobe, prefrontal cortex,and inferior temporal regions during visual working memory:A combined intracranial EEG and functional magnetic reso-nance imaging study. J Neurosci 28:7304–7312.
Ball T, Demandt E, Mutschler I, Neitzel E, Mehring C, Vogt K, AertsenA, Schulze-Bonhage A (2008): Movement related activity in thehigh gamma range of the human EEG. Neuroimage 41:302–310.
Benazzouz A, Breit S, Koudsie A, Pollak P, Krack P, Benabid AL(2002): Intraoperative microrecordings of the subthalamic nucleusin Parkinson’s disease. Mov Disord 17 (Suppl 3):S145–S149.
Berger H (1929): Uber das Elektrenkephalogramm des Menschen.Arch Psychiatr Nervenkr 87:527–570.
Bidet-Caulet A, Bertrand O (2005): Dynamics of a temporo-fronto-parietal network during sustained spatial or spectral auditoryprocessing. J Cogn Neurosci 17:1691–1703.
Brovelli A, Lachaux JP, Kahane P, Boussaoud D (2005): High gammafrequency oscillatory activity dissociates attention from intentionin the human premotor cortex. Neuroimage 28:154–164.
Canolty RT, Edwards E, Dalal SS, Soltani M, Nagarajan SS, KirschHE, Berger MS, Barbaro NM, Knight RT (2006): High gammapower is phase-locked to theta oscillations in human neocortex.Science 313:1626–1628.
Chatrian GE, Bickford RG, Uihlein A (1960): Depth electrographicstudy of a fast rhythm evoked from the human calcarineregion by steady illumination. Electroencephalogr Clin Neuro-physiol 12:167–176.
Chaumon M, Schwartz D, Tallon-Baudry C (2008): Unconsciouslearning versus visual perception: Dissociable roles for gammaoscillations revealed in MEG. J Cogn Neurosci. (in press).
Cheyne D, Bells S, Ferrari P, Gaetz W, Bostan AC (2008): Self-paced movements induce high-frequency gamma oscillationsin primary motor cortex. Neuroimage 42:332–342.
Crone NE, Sinai A, Korzeniewska A (2006): High-frequencygamma oscillations and human brain mapping with electrocor-ticography. Prog Brain Res 159:275–295.
Crone NE, Miglioretti DL, Gordon B, Lesser RP (1998a): Func-tional mapping of human sensorimotor cortex with electrocorti-cographic spectral analysis. II. Event-related synchronization inthe gamma band. Brain 121 (Part 12):2301–2315.
Crone NE, Boatman D, Gordon B, Hao L (2001a): Induced electro-corticographic gamma activity during auditory perception. Bra-zier Award-winning article, 2001. Clin Neurophysiol 112:565–582.
Crone NE, Miglioretti DL, Gordon B, Sieracki JM, Wilson MT,Uematsu S, Lesser RP (1998b): Functional mapping of humansensorimotor cortex with electrocorticographic spectral analy-sis. I. Alpha and beta event-related desynchronization. Brain121 (Part 12):2271–2299.
Crone NE, Hao L, Hart J Jr, Boatman D, Lesser RP, Irizarry R,Gordon B (2001b): Electrocorticographic gamma activity duringword production in spoken and sign language. Neurology57:2045–2053.
Dalal SS, Edwards E, Kirsch HE, Barbaro NM, Knight RT, Nagara-jan SS (2008a): Localization of neurosurgically implanted elec-trodes via photograph-MRI-radiograph coregistration. J Neuro-sci Methods 174:106–115.
r Intracerebral EEG and Functional Brain Mapping r
r 11 r
Dalal SS, Guggisberg AG, Edwards E, Sekihara K, Findlay AM,Canolty RT, Berger MS, Knight RT, Barbaro NM, Kirsch HE,Nagarajan SS (2008b): Five-dimensional neuroimaging: Local-ization of the time-frequency dynamics of cortical activity.Neuroimage 40:1686–1700.
Dalal SS, Baillet S, Adam C, Ducorps A, Jerbi K, Bertrand O, Gar-nero L, Martinerie J, Lachaux J-P: Simultaneous MEG and in-tracranial EEG recordings during attentive reading. Neuro-Image (in press).
de Lange FP, Jensen O, Bauer M, Toni I (2008): Interactionsbetween posterior gamma and frontal alpha/beta oscillationsduring imagined actions. Front Hum Neurosci 2:7.
Eckhorn R, Bauer R, Jordan W, Brosch M, Kruse W, Munk M,Reitboeck HJ (1988): Coherent oscillations: A mechanism of fea-ture linking in the visual cortex? Multiple electrode and corre-lation analyses in the cat. Biol Cybern 60:121–130.
Edwards E, Soltani M, Deouell LY, Berger MS, Knight RT (2005): Highgamma activity in response to deviant auditory stimuli recordeddirectly fromhuman cortex. J Neurophysiol 94:4269–4280.
Ekstrom AD, Caplan JB, Ho E, Shattuck K, Fried I, Kahana MJ(2005): Human hippocampal theta activity during virtual navi-gation. Hippocampus 15:881–889.
Engel AK, Moll CK, Fried I, Ojemann GA (2005): Invasive record-ings from the human brain: Clinical insights and beyond. NatRev Neurosci 6:35–47.
Engel J (1996): Surgery for seizures. N Engl J Med 334:647–652.Fell J, Klaver P, Elger CE, Fernandez G (2002): The interaction of
rhinal cortex and hippocampus in human declarative memoryformation. Rev Neurosci 13:299–312.
Fell J, Ludowig E, Rosburg T, Axmacher N, Elger CE (2008):Phase-locking within human mediotemporal lobe predictsmemory formation. Neuroimage 43:410–419.
Fell J, Klaver P, Lehnertz K, Grunwald T, Schaller C, Elger CE,Fernandez G (2001): Human memory formation is accompa-nied by rhinal-hippocampal coupling and decoupling. NatNeurosci 4:1259–1264.
Freeman WJ (1978): Spatial properties of an EEG event in the ol-factory bulb and cortex. Electroencephalogr Clin Neurophysiol44:586–605.
Fried I, MacDonald KA, Wilson CL (1997): Single neuron activityin human hippocampus and amygdala during recognition offaces and objects. Neuron 18:753–765.
Fries P (2005): A mechanism for cognitive dynamics: Neuronalcommunication through neuronal coherence. Trends Cogn Sci9:474–480.
Gonzalez SL, Grave de Peralta R, Thut G, Millan Jdel R, Morier P,Landis T (2006): Very high frequency oscillations (VHFO) as apredictor of movement intentions. Neuroimage 32:170–179.
Gray CM, Konig P, Engel AK, Singer W (1989): Oscillatory responsesin cat visual cortex exhibit inter-columnar synchronization whichreflects global stimulus properties. Nature 338:334–337.
Gross J, Schnitzler A, Timmermann L, Ploner M (2007): Gammaoscillations in human primary somatosensory cortex reflectpain perception. PLoS Biol 5:e133.
Gruber T, Muller MM, Keil A, Elbert T (1999): Selective visual–spatial attention alters induced gamma band responses in thehuman EEG. Clin Neurophysiol 110:2074–2085.
Guggisberg AG, Dalal SS, Findlay AM, Nagarajan SS (2007): High-frequency oscillations in distributed neural networks reveal thedynamics of human decision making. Front HumNeurosci 1:14.
Halgren E, Marinkovic K, Chauvel P (1998): Generators of the latecognitive potentials in auditory and visual oddball tasks. Elec-troencephalogr Clin Neurophysiol 106:156–164.
Halgren E, Baudena P, Heit G, Clarke JM, Marinkovic K,Clarke M (1994): Spatio-temporal stages in face and wordprocessing. I. Depth-recorded potentials in the human occi-pital, temporal and parietal lobes [corrected]. J Physiol Paris88:1–50.
Heit G, Smith ME, Halgren E (1988): Neural encoding of individ-ual words and faces by the human hippocampus and amyg-dala. Nature 333:773–775.
Hoogenboom N, Schoffelen JM, Oostenveld R, Parkes LM,Fries P (2006): Localizing human visual gamma-band activ-ity in frequency, time and space. Neuroimage 29:764–773.
Jasper H, Penfield W (1949): Electrocorticograms in man: Effect ofvoluntary movement upon the electrical activity of the precen-tral gyrus. Arch Psychiatr Nervenkr 183:162–174.
Jensen O, Colgin LL (2007): Cross-frequency coupling betweenneuronal oscillations. Trends Cogn Sci 11:267–269.
Jensen O, Kaiser J, Lachaux JP (2007): Human gamma-frequencyoscillations associated with attention and memory. TrendsNeurosci 30:317–324.
Jerbi K, Freyermuth S, Minotti L, Kahane P, Berthoz A, LachauxJP: Watching brain TV and playing brain ball: Exploring novelBCI strategies using real-time analysis of human intracranialdata. Int Rev Neurobiol (in press).
Jerbi K, Bertrand O, Schoendorff B, Hoffmann D, Minotti L,Kahane P, Berthoz A, Lachaux JP (2007): Online detection ofgamma oscillations in ongoing intracerebral recordings: Fromfunctional mapping to brain computer interfaces. In: JointMeeting of the 6th International Symposium on NoninvasiveFunctional Source Imaging of the Brain and Heart and theInternational Conference on Functional Biomedical Imaging,2007. NFSI-ICFBI 2007, Hangzhou. pp 330–333.
Jerbi K, Freyermuth S, Dalal SS, Kahane P, Bertrand O, Berthoz A,Lachaux JP (2009): Saccade related gamma-band activity inintracerebral EEG: Dissociating neural from ocular muscle ac-tivity. Brain Topogr (in press).
Jerbi K, Hamame CM, Ossandon T, Dalal SS (2008): Role of poste-rior parietal gamma activity in planning prosaccades and anti-saccades. J Neurosci 28:13713–13715.
Jung J, Hudry J, Ryvlin P, Royet JP, Bertrand O, Lachaux JP(2006): Functional significance of olfactory-induced oscillationsin the human amygdala. Cereb Cortex 16:1–8.
Jung J, Mainy N, Kahane P, Minotti L, Hoffmann D, Bertrand O,Lachaux JP (2008): The neural bases of attentive reading. HumBrain Mapp 29:1193–1206.
Kahana MJ, Seelig D, Madsen JR (2001): Theta returns. Curr OpinNeurobiol 11:739–744.
Kahane P, Minotti L, Hoffmann D, Lachaux J, Ryvlin P (2004):Invasive EEG in the definition of the seizure onset zone: Depthelectrodes. In: Rosenow F, Luders HO, editors. Handbookof Clinical Neurophysiology. Pre-Surgical Assessment of theEpilepsies With Clinical Neurophysiology and FunctionalNeuroimaging. Amsterdam; Boston: Elsevier Science.
Kahane P, Landre E, Minotti L, Francione S, Ryvlin P (2006):The Bancaud and Talairach view on the epileptogeniczone: A working hypothesis. Epileptic Disord 8 Suppl 2:S16–S26.
Karakas S, Erzengin OU, Basar E (2000): The genesis of humanevent-related responses explained through the theory of oscilla-tory neural assemblies. Neurosci Lett 285:45–48.
Kayser C, Kim M, Ugurbil K, Kim DS, Konig P (2004): A compari-son of hemodynamic and neural responses in cat visual cortexusing complex stimuli. Cereb Cortex 14:881–891.
r Jerbi et al. r
r 12 r
Kreiman G, Koch C, Fried I (2000): Imagery neurons in the humanbrain. Nature 408:357–361.
Krolak-Salmon P, Henaff MA, Tallon-Baudry C, Yvert B, GuenotM, Vighetto A, Mauguiere F, Bertrand O (2003): Human lateralgeniculate nucleus and visual cortex respond to screen flicker.Ann Neurol 53:73–80.
Lachaux JP, Rudrauf D, Kahane P (2003): Intracranial EEG andhuman brain mapping. J Physiol Paris 97:613–628.
Lachaux JP, Hoffmann D, Minotti L, Berthoz A, Kahane P (2006a):Intracerebral dynamics of saccade generation in the humanfrontal eye field and supplementary eye field. Neuroimage30:1302–1312.
Lachaux JP, Rodriguez E, Martinerie J, Adam C, Hasboun D,Varela FJ (2000): A quantitative study of gamma-band activityin human intracranial recordings triggered by visual stimuli.Eur J Neurosci 12:2608–2622.
Lachaux JP, Jerbi K, Bertrand O,Minotti L, HoffmannD, SchoendorffB, Kahane P (2007a): A blueprint for real-time functionalmappingvia human intracranial recordings. PLoSONE 2: e1094.
Lachaux JP, Fonlupt P, Kahane P, Minotti L, Hoffmann D, Bertrand O,Baciu M (2007b): Relationship between task-related gamma oscilla-tions and BOLD signal: New insights from combined fMRI and in-tracranial EEG. Hum BrainMapp 28:1368–1375.
Lachaux JP, George N, Tallon-Baudry C, Martinerie J, HuguevilleL, Minotti L, Kahane P, Renault B (2005): The many faces ofthe gamma band response to complex visual stimuli. Neuro-image 25:491–501.
Lachaux JP, Baillet S, Adam C, Ducorps A, Jerbi K, Bertrand O,Garnero L, Martinerie J (2007c): A simultaneous MEG and in-tracranial EEG study of task-related brain oscillations. In: NewFrontiers in Biomagnetism. Proceedings of the 15th Interna-tional Conference on Biomagnetism, Vancouver, BC, Canada,August 21–25, 2006. International Congress Series, Elsevier.1300:421–424.
Lachaux JP, Jung J, Mainy N, Dreher JC, Bertrand O, Baciu M,Minotti L, Hoffmann D, Kahane P (2008): Silence is golden:Transient neural deactivation in the prefrontal cortex duringattentive reading. Cereb Cortex 18:443–450.
Lakatos P, Karmos G, Mehta AD, Ulbert I, Schroeder CE (2008):Entrainment of neuronal oscillations as a mechanism of atten-tional selection. Science 320:110–113.
Logothetis NK, Pauls J, Augath M, Trinath T, Oeltermann A(2001): Neurophysiological investigation of the basis of thefMRI signal. Nature 412:150–157.
Mainy N, Kahane P, Minotti L, Hoffmann D, Bertrand O, LachauxJP (2007a): Neural correlates of consolidation in working mem-ory. Hum Brain Mapp 28:183–193.
Mainy N, Jung J, Baciu M, Kahane P, Schoendorff B, Minotti L,Hoffmann D, Bertrand O, Lachaux JP (2008): Cortical dynamicsof word recognition. Hum Brain Mapp 29:1215–1230.
Mazaheri A, Jensen O (2008): Asymmetric amplitude modulationsof brain oscillations generate slow evoked responses. J Neuro-sci 28:7781–7787.
Medendorp WP, Kramer GF, Jensen O, Oostenveld R, SchoffelenJM, Fries P (2007): Oscillatory activity in human parietal andoccipital cortex shows hemispheric lateralization and memoryeffects in a delayed double-step saccade task. Cereb Cortex17:2364–2374.
Mehring C, Nawrot MP, de Oliveira SC, Vaadia E, Schulze-Bonh-age A, Aertsen A, Ball T (2004): Comparing information aboutarm movement direction in single channels of local and epi-cortical field potentials from monkey and human motor cortex.J Physiol Paris 98:498–506.
Menon V, Freeman WJ, Cutillo BA, Desmond JE, Ward MF,Bressler SL, Laxer KD, Barbaro N, Gevins AS (1996): Spa-tio-temporal correlations in human gamma band electro-corticograms. Electroencephalogr Clin Neurophysiol 98:89–102.
Miller KJ, denNijs M, Shenoy P, Miller JW, Rao RP, Ojemann JG(2007): Real-time functional brain mapping using electrocorti-cography. Neuroimage 37:504–507.
Munte TF, Heldmann M, Hinrichs H, Marco-Pallares J, KramerUM, Sturm V, Heinze H (2008): Nucleus accumbens isinvolved in human action monitoring: Evidence from invasiveelectrophysiological recordings. Front Hum Neurosci 1:11.
Murthy VN, Fetz EE (1992): Coherent 25- to 35-Hz oscillations inthe sensorimotor cortex of awake behaving monkeys. Proc NatlAcad Sci USA 89:5670–5674.
Muthukumaraswamy SD, Singh KD (2008a): Functional decou-pling of BOLD and gamma-band amplitudes in human pri-mary visual cortex. Hum Brain Mapp.
Muthukumaraswamy SD, Singh KD (2008b): Spatiotemporal fre-quency tuning of BOLD and gamma band MEG responsescompared in primary visual cortex. Neuroimage 40:1552–1560.
Neves HP, Ruther P (2007): The NeuroProbes Project. Conf ProcIEEE Eng Med Biol Soc 2007:6443–6445.
Niessing J, Ebisch B, Schmidt KE, Niessing M, Singer W, GaluskeRA (2005): Hemodynamic signals correlate tightly withsynchronized gamma oscillations. Science 309:948–951.
Nikulin VV, Linkenkaer-Hansen K, Nolte G, Lemm S, Muller KR,Ilmoniemi RJ, Curio G (2007): A novel mechanism for evokedresponses in the human brain. Eur J Neurosci 25:3146–3154.
Nishida M, Juhasz C, Sood S, Chugani HT, Asano E (2008): Corti-cal glucose metabolism positively correlates with gamma-oscil-lations in nonlesional focal epilepsy. Neuroimage 42:1275–1284.
Ojemann GA, Schoenfield-McNeill J, Corina DP (2002): Anatomicsubdivisions in human temporal cortical neuronal activityrelated to recent verbal memory. Nat Neurosci 5:64–71.
Pfurtscheller G, Cooper R (1975): Frequency dependence of thetransmission of the EEG from cortex to scalp. Electroencepha-logr Clin Neurophysiol 38:93–96.
Pfurtscheller G, Neuper C, Kalcher J (1993): 40-Hz oscillations dur-ing motor behavior in man. Neurosci Lett 164:179–182.
Pfurtscheller G, Graimann B, Huggins JE, Levine SP, Schuh LA(2003): Spatiotemporal patterns of beta desynchronization andgamma synchronization in corticographic data during self-paced movement. Clin Neurophysiol 114:1226–1236.
Pistohl T, Ball T, Schulze-Bonhage A, Aertsen A, Mehring C(2008): Prediction of arm movement trajectories from ECoG-recordings in humans. J Neurosci Methods 167:105–114.
Poghosyan V, Ioannides AA (2007): Precise mapping of early vis-ual responses in space and time. Neuroimage 35:759–770.
Raghavachari S, Kahana MJ, Rizzuto DS, Caplan JB, Kirschen MP,Bourgeois B, Madsen JR, Lisman JE (2001): Gating of humantheta oscillations by a working memory task. J Neurosci21:3175–3183.
Ray S, Niebur E, Hsiao SS, Sinai A, Crone NE (2008): High-frequency gamma activity (80–150 Hz) is increased in humancortex during selective attention. Clin Neurophysiol 119:116–133.
Rickert J, Oliveira SC, Vaadia E, Aertsen A, Rotter S, Mehring C (2005):Encoding of movement direction in different frequency ranges ofmotor cortical local field potentials. J Neurosci 25:8815–8824.
Rodriguez E, George N, Lachaux JP, Martinerie J, Renault B, Var-ela FJ (1999): Perception’s shadow: Long-distance synchroniza-tion of human brain activity. Nature 397:430–433.
r Intracerebral EEG and Functional Brain Mapping r
r 13 r

Rougeul-Buser A, Bouyer JJ, Buser P (1975): From attentiveness tosleep. A topographical analysis of localized ‘‘synchronized’’activities on the cortex of normal cat and monkey. Acta Neuro-biol Exp (Wars) 35:805–819.
Salenius S, Salmelin R, Neuper C, Pfurtscheller G, Hari R (1996):Human cortical 40 Hz rhythm is closely related to EMG rhyth-micity. Neurosci Lett 213:75–78.
Salmelin R, Hamalainen M, Kajola M, Hari R (1995): Functionalsegregation of movement-related rhythmic activity in thehuman brain. Neuroimage 2:237–243.
Schmolesky MT, Wang Y, Hanes DP, Thompson KG, Leutgeb S,Schall JD, Leventhal AG (1998): Signal timing across the maca-que visual system. J Neurophysiol 79:3272–3278.
Schurger A, Cowey A, Cohen JD, Treisman A, Tallon-Baudry C (2008):Distinct and independent correlates of attention and awareness ina hemianopic patient. Neuropsychologia 46:2189–2197.
Sederberg PB, Schulze-Bonhage A, Madsen JR, Bromfield EB,McCarthy DC, Brandt A, Tully MS, Kahana MJ (2007): Hippo-campal and neocortical gamma oscillations predict memoryformation in humans. Cereb Cortex 17:1190–1196.
Singer W (1999): Neuronal synchrony: A versatile code for the def-inition of relations? Neuron 24:49–65. See also pp. 111–125.
Singer W, Gray CM (1995): Visual feature integration and the tem-poral correlation hypothesis. Annu Rev Neurosci 18:555–586.
Szurhaj W, Bourriez JL, Kahane P, Chauvel P, Mauguiere F, Deram-bure P (2005): Intracerebral study of gamma rhythm reactivity inthe sensorimotor cortex. Eur J Neurosci 21:1223–1235.
Tallon-Baudry C, Bertrand O (1999): Oscillatory gamma activity inhumans and its role in object representation. Trends Cogn Sci3:151–162.
Tallon-Baudry C, Bertrand O, Delpuech C, Pernier J (1996):Stimulus specificity of phase-locked and non-phase-locked
40 Hz visual responses in human. J Neurosci 16:4240–4249.
Tallon-Baudry C, Bertrand O, Henaff MA, Isnard J, Fischer C(2005): Attention modulates gamma-band oscillations differ-ently in the human lateral occipital cortex and fusiform gyrus.Cereb Cortex 15:654–662.
Tanji K, Suzuki K, Delorme A, Shamoto H, Nakasato N (2005):High-frequency gamma-band activity in the basal temporalcortex during picture-naming and lexical-decision tasks. J Neu-rosci 25:3287–3293.
Tecchio F, Zappasodi F, Porcaro C, Barbati G, Assenza G, SalustriC, Rossini PM (2008): High-gamma band activity of primaryhand cortical areas: A sensorimotor feedback efficiency index.Neuroimage 40:256–264.
Ulbert I, Halgren E, Heit G, Karmos G (2001): Multiple microelec-trode-recording system for human intracortical applications.J Neurosci Methods 106:69–79.
Van Der Werf J, Jensen O, Fries P, Medendorp WP (2008):Gamma-band activity in human posterior parietal cortex enco-des the motor goal during delayed prosaccades and antisac-cades. J Neurosci 28:8397–8405.
Vidal JR, Chaumon M, O’Regan JK, Tallon-Baudry C (2006):Visual grouping and the focusing of attention inducegamma-band oscillations at different frequencies in humanmagnetoencephalogram signals. J Cogn Neurosci 18:1850–1862.
Ward AA, Thomas LB (1955): The electrical activity of single unitsin the cerebral cortex of man. Electroencephalogr Clin Neuro-physiol 7:135–136.
Yuval-Greenberg S, Tomer O, Keren AS, Nelken I, Deouell LY(2008): Transient induced gamma-band response in EEG as amanifestation of miniature saccades. Neuron 58:429–441.
r Jerbi et al. r
r 14 r
r Human Brain Mapping 00:000–000 (2010) r
Brain Responses to Success and Failure: DirectRecordings from Human Cerebral Cortex
Julien Jung,1,2* Karim Jerbi,1,3 Tomas Ossandon,1 Philippe Ryvlin,1,2
Jean Isnard,1,4 Olivier Bertrand,1 Marc Guenot,4,5 Francois Mauguiere,2,4
and Jean-Philippe Lachaux1
1Brain Dynamics and Cognition, INSERM U821, Lyon, France2Department of Epileptology and Functional Neurology, Neurological Hospital, Lyon, France
3Physiology of Perception and Action Laboratory, CNRS, UMR 7152, College de France, Paris, France4Sensory Integration of Pain, INSERM U879, Lyon, France
5Department of Neurosurgery, Neurological Hospital, Lyon, France
r r
Abstract: Evaluating the outcome of our own actions is a fundamental process by which we adapt our behav-ior in our interaction with the external world. fMRI and electrophysiological studies in monkeys have foundfeedback-specific responses in several brain regions, unveiling facets of a large-scale network predominantlydistributed in the frontal lobes. However, a consensus has yet to be reached regarding the exact contributionof each region. The present study benefited from intracerebral EEG recordings in epileptic patients to recorddirectly the neural activity in each of those frontal structures in response to positive and negative feedback.Both types of feedback induced a sequence of high-frequency responses (>40 Hz) in a widespread networkinvolving medial frontal cortex, dorsolateral prefrontal cortex (DLPFC), orbitofrontal cortex (OFC), and insularcortex. The pre-supplementary motor area (pre-SMA), DLPFC, and lateral OFC showed higher activation inresponse to negative feedback, while medial OFC and dorsal anterior cingulate cortex (dACC) were more re-sponsive to positive feedback. Responses in the medial prefrontal cortex (pre-SMA and dACC) were sustained(lasting more than 1,000 ms), while responses in the DLPFC, insula, and the OFC were short lasting (less than800 ms). Taken together, our findings show that evaluating the outcome of our actions triggers c-range activitymodulations in several frontal and insular regions. Moreover, we found that the timing and amplitude ofthose c-band responses reveal fine-scale dissociations between the neural dynamics of positive versus nega-tive feedback processing.Hum Brain Mapp 00:000–000, 2010. VC 2010Wiley-Liss, Inc.
Keywords: �-band oscillations; intracranial EEG; performance monitoring; epilepsy; executive functions
r r
INTRODUCTION
‘‘ : : : We regret to inform you that we cannot recom-mend your manuscript for publication : : : ’’. Whether youare a researcher reading such a notification or an NBA
player witnessing the fraction of a second your ball boun-ces backwards off the rim of the basketball, your interac-tion with the outside world is a constant source offeedback evaluating your actions on multiple time scales.
Additional Supporting Information may be found in the onlineversion of this article.
Contract grant sponsor: NeuroProbes (EU Research Program);Contract grant number: FP6-IST 027017 (to KJ); Contract grantsponsor: NeuroBotics (EU Research Program); Contract grantnumber: FET FP6-IST-001917 (to KJ).
*Correspondence to: Julien Jung, MD, PhD, Brain Dynamics andCognition, INSERM - Unite 821, Centre Hospitalier Le Vinatier,
Batiment 452, 95 Boulevard Pinel, 69500 Bron, France. E-mail:[email protected]
Received for publication 9 January 2009; Revised 28 July 2009;Accepted 28 September 2009
DOI: 10.1002/hbm.20930Published online in Wiley InterScience (www.interscience.wiley.com).
VC 2010 Wiley-Liss, Inc.
Our ability to use this feedback to adapt our behavior iscritical in all aspects of our life. Lesion studies and theeffect of pathologies have shown that this capacitydepends critically on the frontal cortex (Alexander et al.,2007; Polli et al., 2008; Thakkar et al., 2008)
In the last 15 years, electrophysiological and neuroimag-ing studies have provided a more detailed understandingof how the frontal cortex respond to negative (or positive)feedback. Human event-related potential (ERP) studieshave shown that negative feedback signals generate anenhanced negative component, as compared to positivefeedback, peaking over frontocentral electrodes with a la-tency of 300 ms (Miltner et al., 1997) and referred to as‘‘feedback-related negativity (FRN)’’ [but see Holroyd et al.(2008) for alternative interpretation]. Several EEG studiesusing Source localization have identified the anterior cin-gulate cortex (dACC) as the most likely generator of theFRN (Gehring and Willoughby, 2002; Luu et al., 2003;Miltner et al., 1997; Ruchsow et al., 2002). In accordance,several fMRI studies have shown increased dACC activa-tion when subjects receive negative feedback (Holroydet al., 2004; Ullsperger and von Cramon, 2003) despitesome discrepancies across studies (Cools et al., 2002; Nieu-wenhuis et al., 2005; van Veen et al., 2004).
Moreover, fMRI studies have shown that feedback eval-uation activates not only the dACC but also several brainregions including medial prefrontal cortex (Ullsperger andvon Cramon, 2003), dorsolateral prefrontal cortex (DLPFC)(Zanolie et al., 2008), orbitofrontal cortex (OFC) (Waltonet al., 2004; Zanolie et al., 2008), and insula (Zanolie et al.,2008), depending on the studies.
Single-cell recordings in nonhuman primates indicatethat feedback evaluation leads to modulations of neuronalfiring in several structures within that frontal networkincluding the dACC (Ito et al., 2003; Michelet et al., 2007;Quilodran et al., 2008), the DLPFC (Matsumoto et al.,2007), and the OFC (Wallis, 2007).
Clearly, feedback stimuli elicit distributed neuralresponses in a brain network that seems to be more com-plex than what was initially suggested by source localiza-tion of the FRN in human ERP studies. fMRI studies,backed up by monkey electrophysiology, have shown thatthis network might involve not only the medial frontalcortex including the dACC and pre-supplementary motorarea (pre-SMA), but also the DLPFC, the OFC, and theinsula. However, to our knowledge, all previous studieshave reported only piecewise activations of that network,the exact extent of which remains undetermined. More-over, the timing of activation of those structures duringfeedback evaluation remains largely unknown.
The objective of the present study was to clarify the neu-ral bases of feedback evaluation by recording the responseto feedback stimuli in all previous structures in humans,with direct neural recordings. Direct electrophysiologicalrecordings can be achieved in epileptic patients with intra-cerebral electrodes implanted for therapeutic purposes(Lachaux et al., 2003), to record neural activity with a spa-
tial resolution comparable to fMRI, and millisecond tem-poral resolution. In particular, stereo-encephalography(SEEG), using linear-electrode areas recording from bothlateral and mesial structures, from both gyri and sulci,provides a unique opportunity to investigate all regionsassumed to participate in feedback monitoring, such as theDLPFC and the dACC.
The present work was triggered by a recent series of in-tracranial EEG studies showing that broadband energyincrease of neural signals (50–150 Hz, the so-calledc-band) constitutes a precise marker identifying neuralrecruitment during cognitive processing (Jensen et al.,2007; Jerbi et al., 2009; Lachaux et al., 2003). Such c-bandresponses (GBRs) have been used to map the large-scalecortical networks underlying several major cognitive func-tions, including language processing (Jung et al., 2008;Mainy et al., 2008), memory (Mainy et al., 2007), attention(Jensen et al., 2007), and top–down processes (Engel et al.,2001; Kahana, 2006). Those results are in line with a possi-ble role of c-band neural synchronization in local andlarge-scale neural communication (Fries et al., 2007; Lee,2003; Singer, 1999; Varela et al., 2001). Further, recent stud-ies combining electrophysiological and BOLD measuresusing fMRI have found a strong correlation between GBRsand the BOLD signal (Lachaux et al., 2007; Logothetiset al., 2001; Mukamel et al., 2005). Based on those results,we predicted that feedback stimuli would trigger GBRs inseveral brain structures activated during fMRI studies,including the medial frontal wall, the DLPFC, the OFC,and the insula. Moreover, we anticipated that possible dif-ferences in timing would help delineate functional dissoci-ations within that network.
MATERIALS AND METHODS
Participants
Nine subjects (six females and three males, aged 19–56years, mean ¼ 36 years) participated in this study. Theyall suffered from drug-resistant partial epilepsy and werecandidates for surgery. They had normal or corrected-to-normal vision and were not colorblind. Because the loca-tion of the epileptic focus could not be identified usingnoninvasive methods, the patients underwent intracerebralEEG recordings by means of stereotactically implantedmultilead depth electrodes (SEEG) [for a complete descrip-tion of the rationale of electrode implantation, see Isnardet al. (2000)]. The selection of the sites to implant wasmade entirely for clinical purposes with no reference tothe present experimental protocol. Patients who took partin this study were selected, because their implantationincluded various regions of the frontal lobe or insular cor-tex. The activated sites reported in the Results sectionwere always outside of the seizure onset zone of thepatients. The patients performed the task 2 days after theimplantation of the electrodes. In agreement with Frenchregulations relative to invasive investigations with a direct
r Jung et al. r
r 2 r

individual benefit, patients were fully informed about elec-trode implantation, stereotactic EEG (SEEG), evokedpotential recordings, and cortical stimulation proceduresused to localize the epileptogenic and eloquent corticalareas, and the patients gave their informed consent.
Electrode Implantation and Coregistration
The electrodes used consisted of one-dimensional arraysimplanted orthogonal to the interhemispheric plane usingthe Talairach’s stereotactic grid. Brain activity wasrecorded in 5–15 contact sites along each electrode. Spac-ing between consecutive sites was 3.5 mm (center-to-cen-ter), which correspond to the estimated spatial resolutionof the recordings (Lachaux et al., 2003). The electrodeswere left chronically in place for up to 15 days. The elec-trode positions were reconstructed onto individual MRIthrough the superposition of the computed tomographyscan images showing the electrodes, the angiography, andthe patient’s structural MRI slices (using the software Acti-vis package, Lyon, France).
To compare electrode position and summarize brainactivations across patients, electrode coordinates were alsoconverted from the individual Talairach space to the nor-malized Talairach space (Talairach and Tournoux, 1988).Coordinates provided in this study are in the normalizedTalairach space. In addition, those coordinates were fur-ther converted into the Montreal Neurological Institute(MNI) standard brain space for visualization purpose onto3D renderings of the single-subject MNI brain. Corticalsurface segmentations were performed with the BrainVisapackage (CEA, France).
Spatial Sampling
Across the nine patients, we recorded from a total of 59one-dimensional depth electrodes in the frontal and insularcortex (see Supporting Information Fig. 1 showing allrecording sites in the frontal lobes). The total number ofrecording contacts was 917, distributed in both gray andwhite matter. For clarity, sites found active in the presentparadigm were grouped into distinct anatomical clusters(see Tables I and II for a list of those clusters). Because of theinterindividual anatomical variability, the cluster definition
was not based on proximity in the Talairach space. Rather,sites were pooled into the same cluster if they belonged tothe same anatomical structure, defined on the individualMRI by anatomical (gyri and sulci) or functional landmarkswell established in the literature [e.g., the distinctionbetween SMA and pre-SMA (Picard and Strick, 1996)].
Experiment
All participants performed two distinct tasks onthe same day. The main experiment consisted of a time-estimation task involving performance monitoring (PM)via visual feedback. This experiment was preceded by asimple visual oddball task, which was used as a controlcondition [control task (CT)].
PM task
We implemented a paradigm very similar to the oneused by Miltner et al. (1997) in a seminal EEG studyreporting feedback-related potentials. Participants played aclassic time-estimation game in which the aim was topress twice on a button with an interval of exactly 1 s (seeFig. 1). Each trial started with the presentation of a whitefixation cross at the center of a black screen. After 500 ms,the color of the cross switched to blue to instruct the par-ticipant to play (GO signal). When ready, the participantwould press the same joystick button twice to produce a1-s interval. The performance for this trial was defined asthe absolute difference between the actual duration of thatinterval and the target duration (1,000 ms). Three secondsafter the second button press, the central fixation crosswas replaced with a small square (FEEDBACK signal) thecolor of which indicated ‘‘success’’ or ‘‘failure.’’ A greensquare indicated that the performance was below the toler-ated margin of error (positive feedback), while a redsquare indicated that the performance was above the mar-gin (negative feedback). Three seconds after the feedbacksignal, the actual quantitative performance was displayed(e.g. ‘‘�236 ms’’) for 1 s to allow behavioral adjustment inthe next trial. Finally, each trial ended with a 1-s displayof the overall score obtained by the participant; starting at0 at the beginning of a block, the score increased by stepsof 1 or 2 with each successful trial, depending on
TABLE I. Overview of anatomical regions exhibiting significant GBRs induced by feedback stimuli
Pre-SMA dACC DLPFC Mesial OFC Lateral OFC Insula
No. of sites recorded 9 11 15 9 9 10No. of significant GBRs (% sites) 5 (55) 2 (18) 4 (27) 4 (44) 2 (22) 6 (60)No. of nonspecific GBRs (% significant GBRs) 0 (0) 0 (0) 1 (25) 0 (0) 0 (0) 0 (0)No. of positive feedback (% significant GBRs) 0 (0) 2 (100) 0 (0) 4 (100) 0 (0) 1 (17)No. of negative feedback (% significant GBRs) 5 (100) 0 (0) 3 (75) 0 (0) 2 (100) 5 (83)
Feedback stimuli induced statistically significant GBRs clustered in a well-defined set of anatomical structures across patients. For eachcluster, the total number of recording sites and the number and the percentage of sites with significant GBRs is provided. The numberand percentage of sites with a feedback preference to error (negative), correct (positive), or nonspecific for each cluster is given.
r Brain Dynamics of Performance Monitoring r
r 3 r
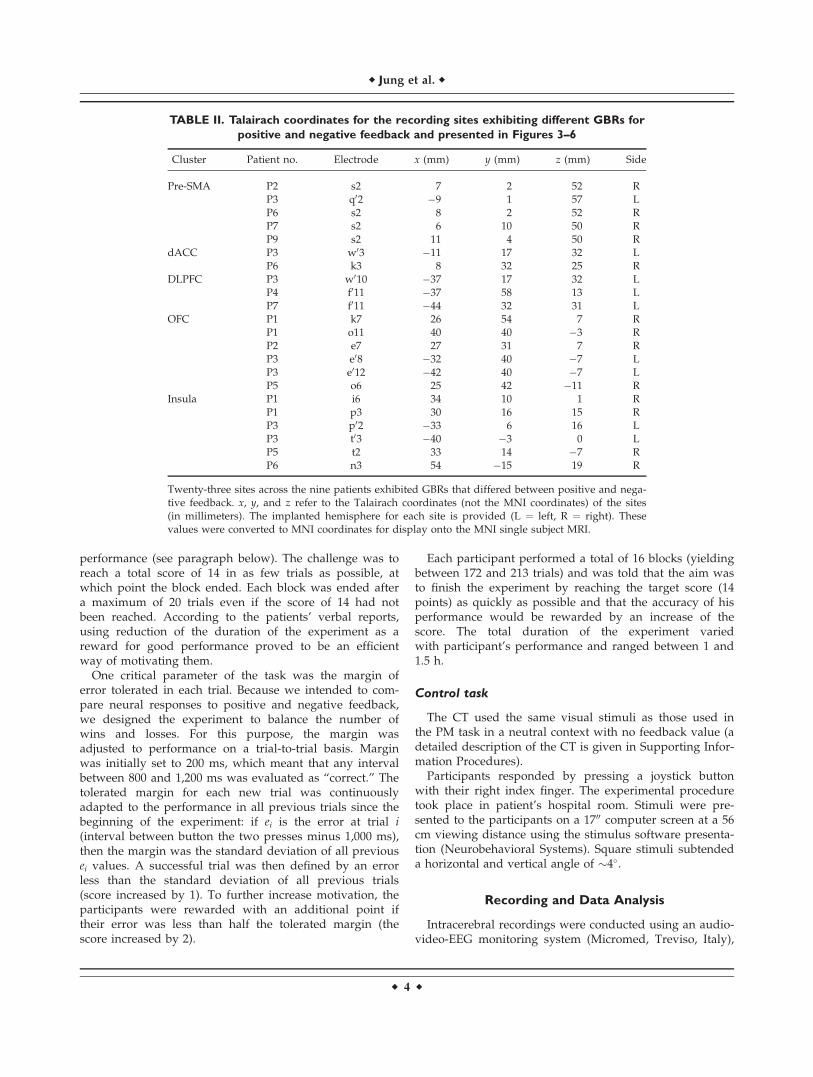
performance (see paragraph below). The challenge was toreach a total score of 14 in as few trials as possible, atwhich point the block ended. Each block was ended aftera maximum of 20 trials even if the score of 14 had notbeen reached. According to the patients’ verbal reports,using reduction of the duration of the experiment as areward for good performance proved to be an efficientway of motivating them.
One critical parameter of the task was the margin oferror tolerated in each trial. Because we intended to com-pare neural responses to positive and negative feedback,we designed the experiment to balance the number ofwins and losses. For this purpose, the margin wasadjusted to performance on a trial-to-trial basis. Marginwas initially set to 200 ms, which meant that any intervalbetween 800 and 1,200 ms was evaluated as ‘‘correct.’’ Thetolerated margin for each new trial was continuouslyadapted to the performance in all previous trials since thebeginning of the experiment: if ei is the error at trial i(interval between button the two presses minus 1,000 ms),then the margin was the standard deviation of all previousei values. A successful trial was then defined by an errorless than the standard deviation of all previous trials(score increased by 1). To further increase motivation, theparticipants were rewarded with an additional point iftheir error was less than half the tolerated margin (thescore increased by 2).
Each participant performed a total of 16 blocks (yieldingbetween 172 and 213 trials) and was told that the aim wasto finish the experiment by reaching the target score (14points) as quickly as possible and that the accuracy of hisperformance would be rewarded by an increase of thescore. The total duration of the experiment variedwith participant’s performance and ranged between 1 and1.5 h.
Control task
The CT used the same visual stimuli as those used inthe PM task in a neutral context with no feedback value (adetailed description of the CT is given in Supporting Infor-mation Procedures).
Participants responded by pressing a joystick buttonwith their right index finger. The experimental proceduretook place in patient’s hospital room. Stimuli were pre-sented to the participants on a 1700 computer screen at a 56cm viewing distance using the stimulus software presenta-tion (Neurobehavioral Systems). Square stimuli subtendeda horizontal and vertical angle of �4�.
Recording and Data Analysis
Intracerebral recordings were conducted using an audio-video-EEG monitoring system (Micromed, Treviso, Italy),
TABLE II. Talairach coordinates for the recording sites exhibiting different GBRs for
positive and negative feedback and presented in Figures 3–6
Cluster Patient no. Electrode x (mm) y (mm) z (mm) Side
Pre-SMA P2 s2 7 2 52 RP3 q02 �9 1 57 LP6 s2 8 2 52 RP7 s2 6 10 50 RP9 s2 11 4 50 R
dACC P3 w03 �11 17 32 LP6 k3 8 32 25 R
DLPFC P3 w010 �37 17 32 LP4 f011 �37 58 13 LP7 f011 �44 32 31 L
OFC P1 k7 26 54 7 RP1 o11 40 40 �3 RP2 e7 27 31 7 RP3 e08 �32 40 �7 LP3 e012 �42 40 �7 LP5 o6 25 42 �11 R
Insula P1 i6 34 10 1 RP1 p3 30 16 15 RP3 p02 �33 6 16 LP3 t03 �40 �3 0 LP5 t2 33 14 �7 RP6 n3 54 �15 19 R
Twenty-three sites across the nine patients exhibited GBRs that differed between positive and nega-tive feedback. x, y, and z refer to the Talairach coordinates (not the MNI coordinates) of the sites(in millimeters). The implanted hemisphere for each site is provided (L ¼ left, R ¼ right). Thesevalues were converted to MNI coordinates for display onto the MNI single subject MRI.
r Jung et al. r
r 4 r

which allowed for simultaneous acquisition of data fromupto 128 depth-EEG channels sampled at 512 Hz (0.1–200Hz bandwidth) during the experimental paradigm. All sig-nals were rereferenced to their nearest neighbor on thesame electrode, 3.5 mm away before analysis (bipolar mon-tage). Recording sites showing epileptiform activities wereexcluded from the analysis, and among the remaining sites,bipolar data were systematically inspected, and any trialshowing epileptic spikes in any of those traces was dis-carded. All signals analyzed in this study were recordedfrom sites far from the a posteriori revealed seizure focus.
Data Analysis
We analyzed the acquired data in time–frequency (TF)domain to address three specific questions: First, are thereany feedback-induced neural power modulations com-pared to a prestimulus baseline period? Second, are suchactivations (if any exist) distinguishable from responseselicited by the mere presentation of the same stimuli inthe control condition (irrespective of feedback context)?Third, are those neural responses differentially modulatedby the valence of the feedback (positive vs. negative)?
For each stimulus category (‘‘positive’’ or ‘‘correct’’ vs.‘‘negative’’ or ‘‘error’’), the data were segmented into win-dows extending from 3,000 ms before stimulus onset to3,000 ms after stimulus onset. Next, individual data seg-ments were transformed into TF power representations,following our routine procedure (Jung et al., 2006): foreach single trial, bipolar derivations computed betweenadjacent electrode contacts were analyzed in the TF do-main by convolution with complex Gaussian Morlet’swavelet (Tallon-Baudry et al., 1997) thus providing a TFpower map P(t,f) ¼ |w(t,f)*s(t)|2, where w(t,f) was for eachtime t and frequency f; a complex Morlet’s waveletw(t,f) ¼ A exp(�t2/2r2
t )exp(2ip ft), with A ¼ rffiffiffi
ppð Þ�1=2
,rt ¼ 1/(2prf), and rf a function of the frequency f: rf ¼f/7. The result of this procedure is a TF map for each re-cording site and for each epoch presenting the signalpower as a function of time (from �3,000 to 3,000 ms rela-tive to stimulus onset) and frequency (from 1 to 150 Hz).See Supporting Information Figure 2 for an overview ofthe TF analysis. Additionally, to determine whether oscilla-tory responses were phase-locked to the stimulus, we com-puted TF maps of the phase-locking factor (Tallon-Baudryet al., 1997) and compared the values obtained after thestimulation with the values during the baseline.
The effect of the stimulus on TF power can then be eval-uated at each frequency by comparing statistically pre-and post-stimulus power values. This comparison wasdone with Wilcoxon nonparametric tests that comparedacross epochs, the total power in a given TF tile, with thatof a tile of similar frequency extent, but covering a [�500:0ms] prestimulus baseline period. For each recording site,we performed 2,280 Wilcoxon tests to cover a set of [100ms � 4 Hz] TF tiles covering a [�3,000:3,000 ms] � [1:150Hz] TF domain. Statistical threshold was set to P < 0.05,
corrected for multiple comparisons across tiles and record-ing sites with the false discovery rate method (Genoveseet al., 2002). This procedure was used to identify sites withsignificant feedback-related power changes in the PM taskand with no significant response to the same stimuli in theCT. In such sites, characterized by responses related andspecific to feedback, TF power was compared betweenpositive and negative feedback. This comparison was doneon the power measured in a global TF domain coveringthe significant responses to feedback stimuli. More pre-cisely, for each type of feedback, and for each site, the TFextent of the response could be defined as the collection ofall contiguous TF tiles with significantly higher or lowerpower than baseline (using Wilcoxon test). The global TFdomain used for this comparison was the smallest TF do-main that covers the TF response to both positive and neg-ative feedbacks. The statistical test used a Mann–WhitneyU test to compare across epochs the average power valuemeasured in that TF domain between positive and nega-tive feedbacks. Note that P values were corrected for mul-tiple comparisons with the Bonferroni method.
Note that Figure 2 displays the envelope of c-bandenergy in response to feedback signals, averaged acrosstrials and recording sites for each cluster. That is, allepochs recorded within a cluster (and corresponding todifferent sites and patients) were considered as if recordedfrom one single recording site in a single patient. Raw sig-nals were band-pass-filtered in ten consecutive frequencybands [from (50–60 Hz) to (140–150 Hz), by steps of 10Hz], and for each band, the envelope of the band-pass-fil-tered signal was computed with a Hilbert transform. Foreach band, this envelope signal was divided by its meanvalue across the entire recording session and multiplied by100 so that envelope values are expressed in percent of thatmean value. Finally, the envelope signals computed foreach of the ten frequency bands were averaged together, toprovide one single time-series (the c-band envelope) for theentire session. By construction, the mean value of that time-series across the recording session is equal to 100. Figure 2displays the average and standard error of the mean of thatc-band envelope, across trials, expressed in percent ofincrease or decrease relative to 100. For each type of feed-back and each cluster, the mean peak amplitude (�standarderror of the mean) and mean peak latency of the GBRswere measured on those c-band envelopes.
Note that that visualization has the advantage of sum-marizing the most prominent responses, but does not fullycapture the intersubject variability of the responses. Itshould thus be qualified by results shown at the individ-ual level, shown in the remaining figures.
ERP Analysis
ERPs were measured by averaging data segments acrossepochs in the time domain. Comparison between ERPs topositive and negative feedback were done with a nonpara-metric Mann–Whitney U test on consecutive 20 ms
r Brain Dynamics of Performance Monitoring r
r 5 r

overlapping windows (1 ms step). All EEG signals wereevaluated with the software package for electrophysiologicalanalysis (ELAN-Pack) developed in the INSERM U821 Labo-ratory and with custom MATLAB (The MathWorks) code.
RESULTS
Behavioral Results
Overall, the intervals measured differed from theintended duration by 265 ms (�191 ms). But since the tol-erated error margin was adjusted during the course of theexperiment (see Materials and Methods for details), therewas no significant difference between the number of cor-rect (87 � 31) and incorrect trials (89 � 31) (Mann–Whit-ney U test, P > 0.05). Subject performance improved overtime, suggesting that the participants did indeed use thefeedback information to adapt their behavior. A statisticalanalysis showed that estimation errors were larger in thefirst third of the experiment (first 33% trials) than inthe last third (384 > 181 ms, Wilcoxon signed rank test,P < 0.001).
Figure 2.
Overview of the dynamics of the high-frequency responses
induced by feedback stimuli. Six anatomical clusters exhibit signifi-
cant GBRs in response to feedback stimuli. For each cluster, the
envelope of GBRs (with standard error of the mean) was averaged
across patients and the average response is presented for ‘‘error’’
(i.e., negative feedback, black line) and ‘‘correct’’ (i.e., positive
feedback, gray line). Time 0 is the onset of visual feedback. [Color
figure can be viewed in the online issue, which is available at
www.interscience.wiley.com.]
Figure 1.
PM paradigm. Each trial started with the presentation of a white
central fixation cross at the center of a black screen. The cross
turned blue 500 ms later (GO signal) instructing the participants
to generate a 1-s duration via two consecutive joystick button
presses. A colored square was displayed as feedback on per-
formance 3,000 ms after the second button press. The square
was either green (correct/postive feedback) or red (error/nega-
tive feedback) and remained visible for 3,000 ms. This qualitative
feedback was then followed by a quantitative feedback (millisec-
ond estimation error, e.g., ‘‘�86 ms’’) presented for 1,000 ms
and followed by an overall score update. Task difficulty was
adapted on-line to balance the number of positive and negative
feedback stimuli (see Materials and Methods). [Color figure can
be viewed in the online issue, which is available at www.
interscience.wiley.com.]
r Jung et al. r
r 6 r

The Neural Bases of PM: Frontoinsular Neural
Network Generating GBRs to Feedback Stimuli
A full-band TF analysis of neural responses to feedbackwas performed for all recording sites, and it revealed thatthe most reproducible responses across individuals werein the high-frequency c-band (>40 Hz) (see however Sup-porting Information Fig. 3 for examples of TF responses inother frequency bands).
During the PM task, 88 bipolar derivations (out of 917in nine patients) had a significant energy modulationabove 40 Hz after feedback stimuli (Wilcoxon comparisonwith prestimulus baseline, corrected P < 0.05). When sev-eral contiguous active bipolar derivations explored thesame anatomical structure in the same patient (for exam-ple, four sites exploring the dACC), they were further con-sidered as exploring one single site [explaining the totalnumber of active sites (23) shown in Tables I and II].
Those GBRs were induced, and not evoked, by the stim-ulus; in other words, they were not phase-locked to thestimulus (as indicated by a phase-locking factor analysis).
As responses to feedback in the PM task could theoreti-cally be simply related to visual processing of the stimuli,a CT was performed by all patients. The CT used thesame stimuli in a neutral context with no feedback value(a detailed description of the CT is given in Supporting In-formation Procedures). The CT and the PM task use thesame stimuli, but with a different meaning. The compari-son between the responses triggered by red/green squaresin the PM task and the CT reveals which response compo-nents are associated with the particular meaning of thosestimuli, as performance feedback. Supporting InformationFigure 4 illustrates the striking difference in brain activa-tion induced by meaning alone: as soon as 300 ms afterstimulus presentation, the visual stimuli ignite the frontalcortex only in the PM condition, that is, only when theycontain meaningful information about feedback. The com-parison between the CT and PM task was therefore a wayto isolate feedback-specific responses: in the remaining sec-tion, any frontal site that also responded to the red/greensquares in this neutral control context (example in Sup-porting Information Fig. 5) was considered nonspecificallyfeedback-related and was therefore excluded from theanalysis and discussions below.
Although the overall spatial coverage of the frontal lobeacross the nine patients was extensive, high-frequencyresponses were found only in spatially restricted anatomi-cal clusters (see Tables I and II for a list of anatomicalclusters). Feedback-related GBRs were detected in fiveregions: (a) the pre-SMA of the frontal medial cortex[Brodmann’s area (BA) 6 , superior frontal gyrus rostral tothe VAC plane, defined as the vertical plane passingthrough the anterior commissure, with 0 < y < 20 mm],(b) the dACC (BA 24/32/33), (c) the middle and inferiorfrontal gyrus exploring the DLPFC (BA 9/46), (d) the OFC(BA 11/12/13/14), and (e) in the anterior (ventral or dor-sal) part of the insula.
The time course of the GBRs varied across the variousanatomical structures. Figure 2 provides a summary of thetime course of GBRs with respect to the presentation offeedback stimuli by pooling results from electrode sitesbelonging to the same anatomical cluster across all partici-pants. Compared to positive feedback, negative feedbackon performance triggered GBRs that were stronger in thepre-SMA, DLPFC, lateral OFC, and insula. The shortestlatencies of activation were found in the DLPFC (peak ofthe response around 300 ms), followed by insula (peak la-tency around 500 ms), and lateral OFC (peak latencyaround 700 ms). In these three clusters, the duration of theresponses lasted less than 1,000 ms. By contrast, theresponses of the pre-SMA were sustained and lastedalmost 2,000 ms. Positive feedback triggered GBRs in themedial OFC and dACC. In the medial OFC, the peak la-tency of the responses was around 500 ms and activationlasted less than 1,000 ms, while dACC activation was moregradual and sustained more than 1,000 ms. These findingsprovide an overview of the spatiotemporal properties ofthe positive versus negative feedback processing network.We will now describe the detected responses in moredetail for each anatomical component of the network.
Pre-supplementary motor area
We observed GBRs to feedback stimuli in the pre-SMA offive patients (see Fig. 3). Those responses were found in spa-tially tightly confined regions (7 < abs(x) < 11; 2 < y < 10;50 < z < 54 in Talairach space), in both right (four sites) andleft (one site) hemispheres. On the individual MRI, all siteswere located rostral to the VCA line and thus precisely inthe pre-SMA (Picard and Strick, 1996). Although GBRs alsooccurred in response to positive feedback, the responseswere significantly stronger for negative feedback (P < 0.05for each site, Mann–Whitney U test). The time profile of theresponses consisted of a sustained energy increase between500 and 2,000 ms or more. The peak amplitude of GBRs inthe pre-SMA was 13.0 � 1 (SEM) for negative feedback and9.1 (�0.8) for positive feedback. The peak latency of GBRs inthe pre-SMA was 860 ms for negative feedback and 840 msfor positive feedback.
Anterior cingulate cortex (BA 24/32/33)
Among electrodes present in dACC, two sites responded tofeedback in the dACC (two patients, Fig. 3). Both were locatedin the dorsal portion of the anterior cingulate gyrus (17 < y <32, Talaraich space) and had enhanced high-frequencyresponses to positive feedback (P < 0.05 for each site, Mann–Whitney U test), although negative feedback also triggered ahigh-frequency response. Both responses were gradual energyincreases peaking around 800 ms and lasting 1,500 ms. Thepeak amplitude of GBRs in the dACC was 5.4 � 0.7 for nega-tive feedback and 11.7� 0.8 for positive feedback. The peak la-tency of GBRs in the dACC was 1,064 ms for negativefeedback and 640 ms for positive feedback.
r Brain Dynamics of Performance Monitoring r
r 7 r
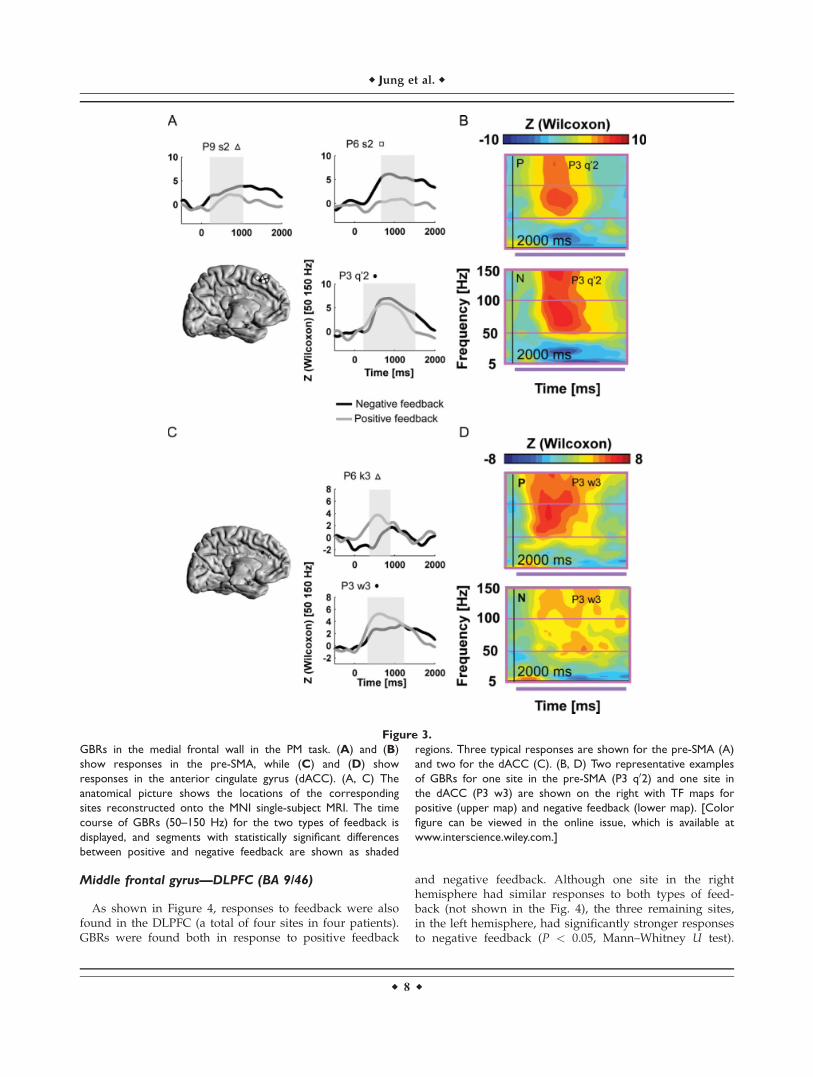
Middle frontal gyrus—DLPFC (BA 9/46)
As shown in Figure 4, responses to feedback were alsofound in the DLPFC (a total of four sites in four patients).GBRs were found both in response to positive feedback
and negative feedback. Although one site in the righthemisphere had similar responses to both types of feed-back (not shown in the Fig. 4), the three remaining sites,in the left hemisphere, had significantly stronger responsesto negative feedback (P < 0.05, Mann–Whitney U test).
Figure 3.
GBRs in the medial frontal wall in the PM task. (A) and (B)
show responses in the pre-SMA, while (C) and (D) show
responses in the anterior cingulate gyrus (dACC). (A, C) The
anatomical picture shows the locations of the corresponding
sites reconstructed onto the MNI single-subject MRI. The time
course of GBRs (50–150 Hz) for the two types of feedback is
displayed, and segments with statistically significant differences
between positive and negative feedback are shown as shaded
regions. Three typical responses are shown for the pre-SMA (A)
and two for the dACC (C). (B, D) Two representative examples
of GBRs for one site in the pre-SMA (P3 q02) and one site in
the dACC (P3 w3) are shown on the right with TF maps for
positive (upper map) and negative feedback (lower map). [Color
figure can be viewed in the online issue, which is available at
www.interscience.wiley.com.]
r Jung et al. r
r 8 r

The three left hemispheric responses were all characterizedby a sudden short-lasting (less than 600 ms) energyincrease in the first 300 ms following feedbackpresentation.
The peak amplitude of GBRs in the DLPFC was 11.0 �1.4 for negative feedback and 5 � 1.5 for positive feedback.The peak latency of GBRs in the DLPFC was 281 ms fornegative feedback and 281 ms for positive feedback.
Orbitofrontal cortex (BA 10/11/12/13/14)
Two anatomically and functionally distinct clusters inthe OFC were found to generate feedback-specific c-rangeactivity (see Fig. 5). In a first, medial cluster (four sites),GBRs were stronger for positive feedback (P < 0.05,Mann–Whitney U test), while in a second, lateral cluster,responses were stronger for negative feedback (two sites).The two groups were well-separated anatomically: medialresponses were all located in the medial OFC, more pre-cisely in-between the lateral orbital sulcus and the gyrusrectus (25 < abs(x) < 32, Talairach space), while lateralsites were more lateral than the lateral orbital sulcus (40 <abs(x) < 42). In the medial OFC, the response was mostlya progressive energy increase within 400 ms and a gradualreturn to baseline after 1,000 ms (P1 k7, P3 e08, P2 e7),although one site (P5 o6) had faster dynamics. LateralOFC responses were shorter than 1,000 ms, with a sharpenergy increase in the first 500 ms.
The peak amplitude of GBRs in the medial OFC was 6.5� 1.1 for negative feedback and 10.6 � 0.9 for positive
feedback. The peak latency of GBRs in the medial was 281ms for negative feedback and 312 ms for positive feed-back. The peak amplitude of GBRs in the lateral OFC was13.3 � 2.0 for negative feedback and 1.8 � 1.0 for positivefeedback. The peak latency of GBRs in the lateral OFC was640 ms for negative feedback and 750 ms for positivefeedback.
Insular c-range activity during feedback processing
The remaining cluster was in the insula (see Fig. 6),where both types of feedback elicited c-band energyincrease in six sites (across four patients). In the anteriorpart of the insula (four sites), the response was fast, short,and stronger for negative feedback (within the first 1,000ms with a peak around 500 ms). In the two remainingsites, located in the posterior part of insula for one siteand in the ventral part of the insula for the other, theresponse was more gradual. One site in the ventral sitehad stronger response for positive feedback (P3 t03). Thepeak amplitude of GBRs in the insula was 13.4 � 0.7 fornegative feedback and 7.9 � 0.6 for positive feedback. Thepeak latency of GBRs in the insula was 437 ms for nega-tive feedback and 359 ms for positive feedback.
c Deactivations Induced by Feedback
Stimuli in the PM Task
In addition to the poststimulus power increases reportedabove, we also observed that feedback induced powerdecreases in the same frequency range (high c-band) alongthe medial frontal wall (12 sites in eight patients). c-bandenergy suppressions were all located in the medial frontalcortex rostral to the pre-SMA or in the gyrus rectus (mostmedial part of the OFC) (see Fig. 7). Most suppression pat-terns (eight sites) were comparable for positive and nega-tive feedback, but in four sites, the suppression occurredonly in response to one type of feedback: either positive(two sites, P9 f2 and P9 w3) or negative (two sites, P2 f2and P3 e02). The time profile of deactivation was fairlyreproducible across sites and participants and consisted ofa sharp decrease of energy in the first 500 ms followed bya gradual return to baseline level within 1,000–1,500 ms.
Evoked Potentials and y-Band Activity
in the Anterior Cingulate in Response to
Feedback Stimuli
Both negative and positive feedback generated ERPs ina large number of frontal sites. However, the ERPs werecomplex, with multiple positive and negative peaks, andextremely variable from site to site, and from patient topatient, even within the same region. We could not extractreproducible patterns and meaningful information fromthe ERPs. For this reason, we chose to keep the focus ofthis report on the robust and consistent GBRs rather than
Figure 4.
GBRs in the DLPFC in the PM task. Anatomical locations of
DLPFC sites are shown for three participants onto the MNI sin-
gle-subject 3D MRI reconstruction. The time course of GBRs
(50–150 Hz) for the two types of feedback is displayed, and seg-
ments with statistically significant differences between positive
and negative feedback are shown as shaded regions.
r Brain Dynamics of Performance Monitoring r
r 9 r

to perform a detailed description of ERPs generated by thefeedback stimuli. However, since noninvasive EEG studiesin humans have consistently reported generators of a spe-cific ERP, the FRN, in the anterior cingulate gyrus, weinvestigated ERPs specifically in that region. Out of 11sites in the dorsal dACC, we found ERPs to feedback stim-uli in six sites (see Fig. 8) around 300 ms, out of whichfour differed between types of feedback: a larger ampli-tude for negative feedback (P < 0.05, Kruskal–Wallis test)was found at those four sites at specific latency ranges (P3k02 between 620 and 940 ms, P3 w03 between 400 and 640ms, P8 i2 between 500 and 600 ms, and P9 z2 between 300and 620 ms) (P < 0.05, Kruskal–Wallis test). Our ERPresults are therefore consistent with the hypothesis thatthe dACC generates a response to negative feedback in alate-latency window after 300 ms. This late component,peaking later than the typical scalp latency of the FRN,might possibly constitute an intracranial correlate of thescalp P300 or Pe (Herrmann et al., 2004; Polich, 2007). Wedid not find any evidence of a specific response to negativefeedback between 200 and 300 ms, that is in the latencyrange of the scalp FRN. Lastly, since recent work suggeststhat the FRN may be considered as a y-band (4–7 Hz) oscil-lation (Luu et al., 2003), we looked for task-related y-band
activity modulations in the dACC. Out of 11 sites exploringthe dACC, only two sites generated short-lasting (<600 ms)y-band activity modulations in response to feedback stimuli(P3 w03 and P6 k3). An example of feedback-induced y-band activity modulation is shown in Supporting Informa-tion Figure 6. Note that those two sites also generated GBRsin response to feedback stimuli.
DISCUSSION
The present study is, to our knowledge, the first toassess the large-scale neural dynamics of PM using directneural recordings of high c-range neural activity inhumans. By combining an unprecedented spatiotemporalresolution with single-trial TF analysis, the present studyextends our knowledge about the neural substrates offeedback processing. First of all, we found that feedbackstimuli activate a large-scale network of frontoinsularbrain regions indexed by widely distributed high c (>50Hz) power modulations. This network includes the dorsalanterior cingulate gyrus (dACC) and the pre-SMA in thefrontal medial cortex, the DLPFC, the OFC, and the ante-rior insula. This frontoinsular network responds to
Figure 5.
GBRs in the OFC in the PM task. Ana-
tomical locations of OFC sites are
shown for six participants onto the
standard MNI single-subject 3D MRI
reconstruction. (A) For the four sites
in the medial OFC, GBRs were stron-
ger for positive feedback than negative
feedback. The time course of GBRs
(50–150 Hz) for the two types of
feedback is displayed, and segments
with statistically significant differences
between positive and negative feed-
back are shown as shaded regions. (B)
By contrast, for the two sites in the
lateral OFC, GBRs were stronger for
negative feedback than positive feed-
back. The time course of GBRs (50–
150 Hz) for the two types of feedback
is displayed, and segments with statisti-
cally significant differences between
positive and negative feedback are
shown as shaded regions. Note that
for a particular patient, a stringent dis-
sociation between lateral and medial
OFC responses was found (medial P3
e08 and lateral P3 e012) and the ana-
tomical locations of those two sites
are displayed on the patient’s MRI.
[Color figure can be viewed in the
online issue, which is available at
www.interscience.wiley.com.]
r Jung et al. r
r 10 r
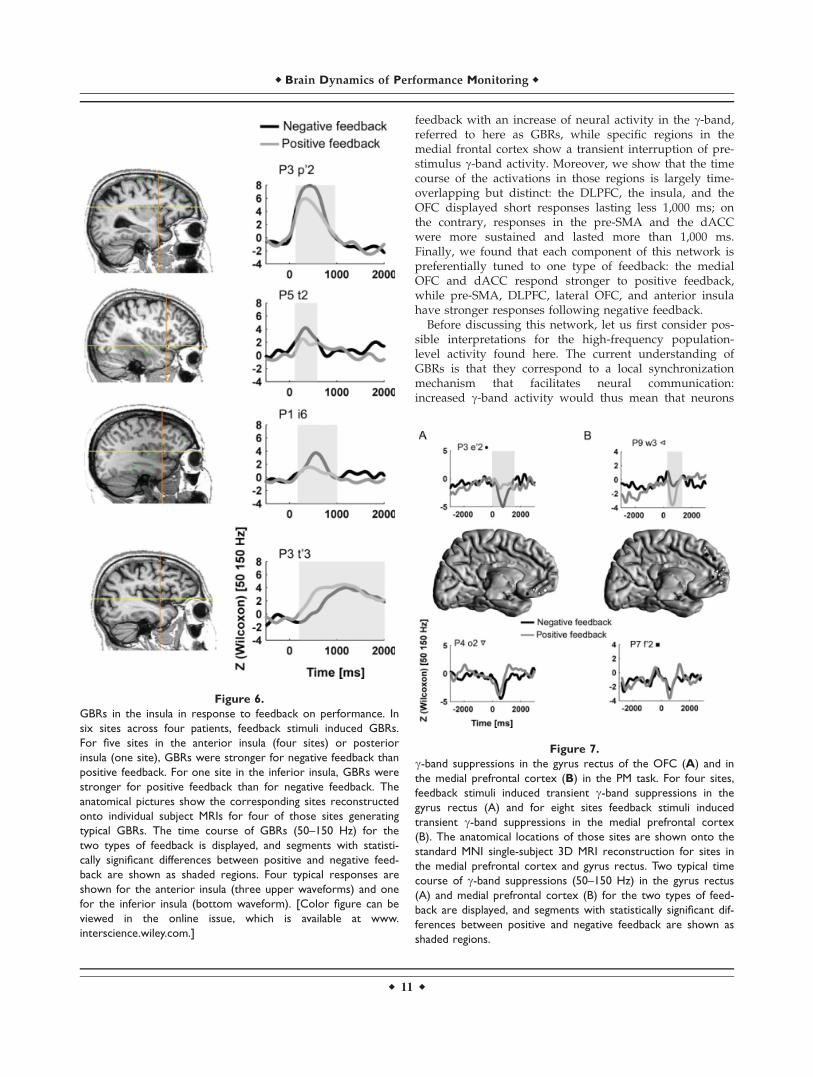
feedback with an increase of neural activity in the c-band,referred to here as GBRs, while specific regions in themedial frontal cortex show a transient interruption of pre-stimulus c-band activity. Moreover, we show that the timecourse of the activations in those regions is largely time-overlapping but distinct: the DLPFC, the insula, and theOFC displayed short responses lasting less 1,000 ms; onthe contrary, responses in the pre-SMA and the dACCwere more sustained and lasted more than 1,000 ms.Finally, we found that each component of this network ispreferentially tuned to one type of feedback: the medialOFC and dACC respond stronger to positive feedback,while pre-SMA, DLPFC, lateral OFC, and anterior insulahave stronger responses following negative feedback.
Before discussing this network, let us first consider pos-sible interpretations for the high-frequency population-level activity found here. The current understanding ofGBRs is that they correspond to a local synchronizationmechanism that facilitates neural communication:increased c-band activity would thus mean that neurons
Figure 6.
GBRs in the insula in response to feedback on performance. In
six sites across four patients, feedback stimuli induced GBRs.
For five sites in the anterior insula (four sites) or posterior
insula (one site), GBRs were stronger for negative feedback than
positive feedback. For one site in the inferior insula, GBRs were
stronger for positive feedback than for negative feedback. The
anatomical pictures show the corresponding sites reconstructed
onto individual subject MRIs for four of those sites generating
typical GBRs. The time course of GBRs (50–150 Hz) for the
two types of feedback is displayed, and segments with statisti-
cally significant differences between positive and negative feed-
back are shown as shaded regions. Four typical responses are
shown for the anterior insula (three upper waveforms) and one
for the inferior insula (bottom waveform). [Color figure can be
viewed in the online issue, which is available at www.
interscience.wiley.com.]
Figure 7.
c-band suppressions in the gyrus rectus of the OFC (A) and in
the medial prefrontal cortex (B) in the PM task. For four sites,
feedback stimuli induced transient c-band suppressions in the
gyrus rectus (A) and for eight sites feedback stimuli induced
transient c-band suppressions in the medial prefrontal cortex
(B). The anatomical locations of those sites are shown onto the
standard MNI single-subject 3D MRI reconstruction for sites in
the medial prefrontal cortex and gyrus rectus. Two typical time
course of c-band suppressions (50–150 Hz) in the gyrus rectus
(A) and medial prefrontal cortex (B) for the two types of feed-
back are displayed, and segments with statistically significant dif-
ferences between positive and negative feedback are shown as
shaded regions.
r Brain Dynamics of Performance Monitoring r
r 11 r
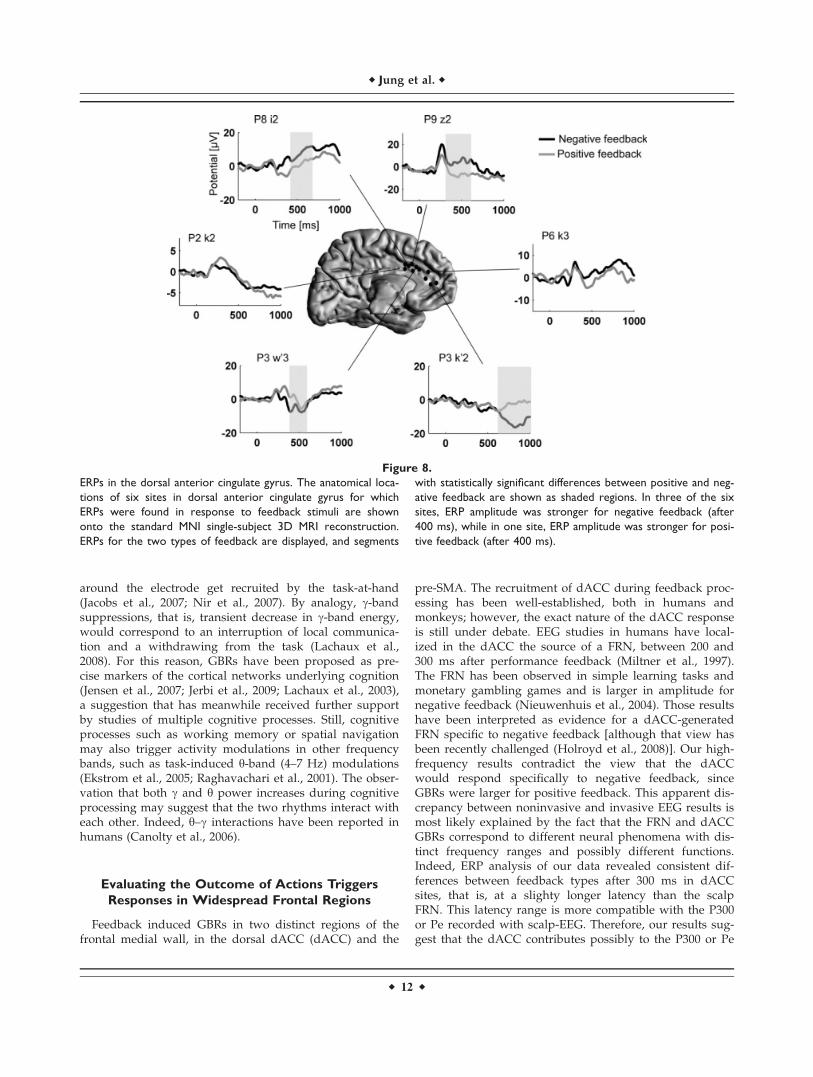
around the electrode get recruited by the task-at-hand(Jacobs et al., 2007; Nir et al., 2007). By analogy, c-bandsuppressions, that is, transient decrease in c-band energy,would correspond to an interruption of local communica-tion and a withdrawing from the task (Lachaux et al.,2008). For this reason, GBRs have been proposed as pre-cise markers of the cortical networks underlying cognition(Jensen et al., 2007; Jerbi et al., 2009; Lachaux et al., 2003),a suggestion that has meanwhile received further supportby studies of multiple cognitive processes. Still, cognitiveprocesses such as working memory or spatial navigationmay also trigger activity modulations in other frequencybands, such as task-induced y-band (4–7 Hz) modulations(Ekstrom et al., 2005; Raghavachari et al., 2001). The obser-vation that both c and y power increases during cognitiveprocessing may suggest that the two rhythms interact witheach other. Indeed, y–c interactions have been reported inhumans (Canolty et al., 2006).
Evaluating the Outcome of Actions Triggers
Responses in Widespread Frontal Regions
Feedback induced GBRs in two distinct regions of thefrontal medial wall, in the dorsal dACC (dACC) and the
pre-SMA. The recruitment of dACC during feedback proc-essing has been well-established, both in humans andmonkeys; however, the exact nature of the dACC responseis still under debate. EEG studies in humans have local-ized in the dACC the source of a FRN, between 200 and300 ms after performance feedback (Miltner et al., 1997).The FRN has been observed in simple learning tasks andmonetary gambling games and is larger in amplitude fornegative feedback (Nieuwenhuis et al., 2004). Those resultshave been interpreted as evidence for a dACC-generatedFRN specific to negative feedback [although that view hasbeen recently challenged (Holroyd et al., 2008)]. Our high-frequency results contradict the view that the dACCwould respond specifically to negative feedback, sinceGBRs were larger for positive feedback. This apparent dis-crepancy between noninvasive and invasive EEG results ismost likely explained by the fact that the FRN and dACCGBRs correspond to different neural phenomena with dis-tinct frequency ranges and possibly different functions.Indeed, ERP analysis of our data revealed consistent dif-ferences between feedback types after 300 ms in dACCsites, that is, at a slighty longer latency than the scalpFRN. This latency range is more compatible with the P300or Pe recorded with scalp-EEG. Therefore, our results sug-gest that the dACC contributes possibly to the P300 or Pe
Figure 8.
ERPs in the dorsal anterior cingulate gyrus. The anatomical loca-
tions of six sites in dorsal anterior cingulate gyrus for which
ERPs were found in response to feedback stimuli are shown
onto the standard MNI single-subject 3D MRI reconstruction.
ERPs for the two types of feedback are displayed, and segments
with statistically significant differences between positive and neg-
ative feedback are shown as shaded regions. In three of the six
sites, ERP amplitude was stronger for negative feedback (after
400 ms), while in one site, ERP amplitude was stronger for posi-
tive feedback (after 400 ms).
r Jung et al. r
r 12 r
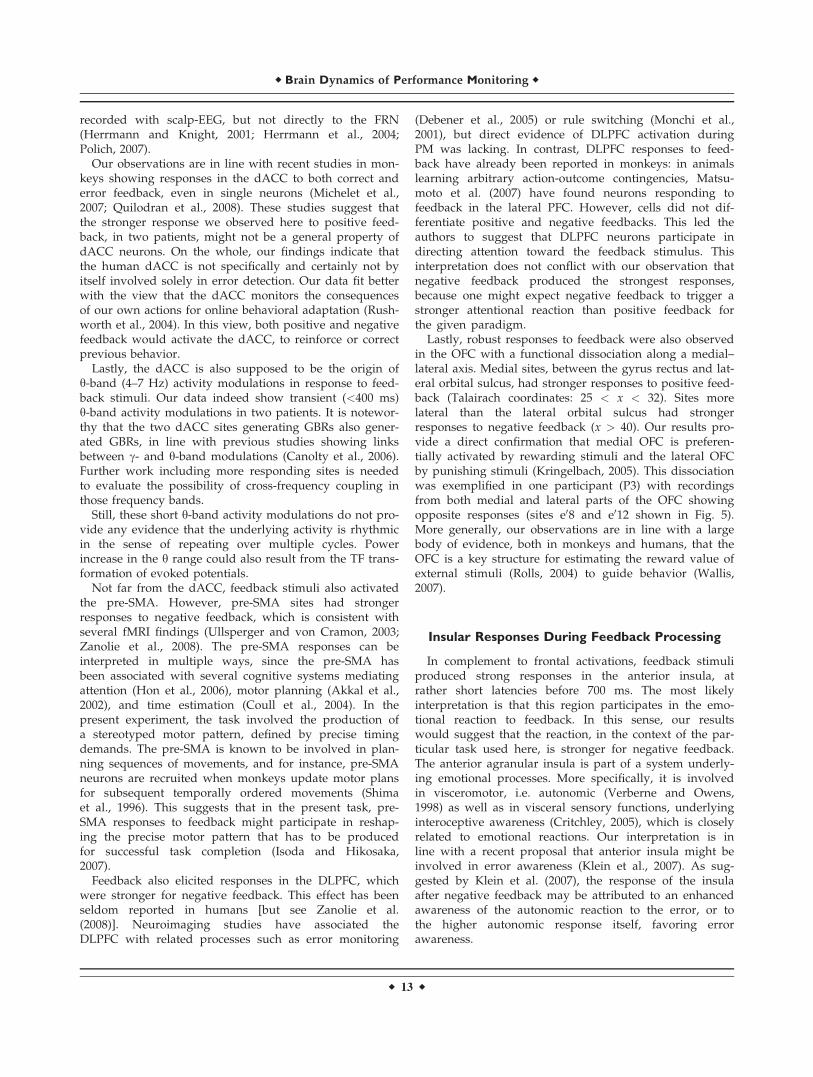
recorded with scalp-EEG, but not directly to the FRN(Herrmann and Knight, 2001; Herrmann et al., 2004;Polich, 2007).
Our observations are in line with recent studies in mon-keys showing responses in the dACC to both correct anderror feedback, even in single neurons (Michelet et al.,2007; Quilodran et al., 2008). These studies suggest thatthe stronger response we observed here to positive feed-back, in two patients, might not be a general property ofdACC neurons. On the whole, our findings indicate thatthe human dACC is not specifically and certainly not byitself involved solely in error detection. Our data fit betterwith the view that the dACC monitors the consequencesof our own actions for online behavioral adaptation (Rush-worth et al., 2004). In this view, both positive and negativefeedback would activate the dACC, to reinforce or correctprevious behavior.
Lastly, the dACC is also supposed to be the origin ofy-band (4–7 Hz) activity modulations in response to feed-back stimuli. Our data indeed show transient (<400 ms)y-band activity modulations in two patients. It is notewor-thy that the two dACC sites generating GBRs also gener-ated GBRs, in line with previous studies showing linksbetween c- and y-band modulations (Canolty et al., 2006).Further work including more responding sites is neededto evaluate the possibility of cross-frequency coupling inthose frequency bands.
Still, these short y-band activity modulations do not pro-vide any evidence that the underlying activity is rhythmicin the sense of repeating over multiple cycles. Powerincrease in the y range could also result from the TF trans-formation of evoked potentials.
Not far from the dACC, feedback stimuli also activatedthe pre-SMA. However, pre-SMA sites had strongerresponses to negative feedback, which is consistent withseveral fMRI findings (Ullsperger and von Cramon, 2003;Zanolie et al., 2008). The pre-SMA responses can beinterpreted in multiple ways, since the pre-SMA hasbeen associated with several cognitive systems mediatingattention (Hon et al., 2006), motor planning (Akkal et al.,2002), and time estimation (Coull et al., 2004). In thepresent experiment, the task involved the production ofa stereotyped motor pattern, defined by precise timingdemands. The pre-SMA is known to be involved in plan-ning sequences of movements, and for instance, pre-SMAneurons are recruited when monkeys update motor plansfor subsequent temporally ordered movements (Shimaet al., 1996). This suggests that in the present task, pre-SMA responses to feedback might participate in reshap-ing the precise motor pattern that has to be producedfor successful task completion (Isoda and Hikosaka,2007).
Feedback also elicited responses in the DLPFC, whichwere stronger for negative feedback. This effect has beenseldom reported in humans [but see Zanolie et al.(2008)]. Neuroimaging studies have associated theDLPFC with related processes such as error monitoring
(Debener et al., 2005) or rule switching (Monchi et al.,2001), but direct evidence of DLPFC activation duringPM was lacking. In contrast, DLPFC responses to feed-back have already been reported in monkeys: in animalslearning arbitrary action-outcome contingencies, Matsu-moto et al. (2007) have found neurons responding tofeedback in the lateral PFC. However, cells did not dif-ferentiate positive and negative feedbacks. This led theauthors to suggest that DLPFC neurons participate indirecting attention toward the feedback stimulus. Thisinterpretation does not conflict with our observation thatnegative feedback produced the strongest responses,because one might expect negative feedback to trigger astronger attentional reaction than positive feedback forthe given paradigm.
Lastly, robust responses to feedback were also observedin the OFC with a functional dissociation along a medial–lateral axis. Medial sites, between the gyrus rectus and lat-eral orbital sulcus, had stronger responses to positive feed-back (Talairach coordinates: 25 < x < 32). Sites morelateral than the lateral orbital sulcus had strongerresponses to negative feedback (x > 40). Our results pro-vide a direct confirmation that medial OFC is preferen-tially activated by rewarding stimuli and the lateral OFCby punishing stimuli (Kringelbach, 2005). This dissociationwas exemplified in one participant (P3) with recordingsfrom both medial and lateral parts of the OFC showingopposite responses (sites e08 and e012 shown in Fig. 5).More generally, our observations are in line with a largebody of evidence, both in monkeys and humans, that theOFC is a key structure for estimating the reward value ofexternal stimuli (Rolls, 2004) to guide behavior (Wallis,2007).
Insular Responses During Feedback Processing
In complement to frontal activations, feedback stimuliproduced strong responses in the anterior insula, atrather short latencies before 700 ms. The most likelyinterpretation is that this region participates in the emo-tional reaction to feedback. In this sense, our resultswould suggest that the reaction, in the context of the par-ticular task used here, is stronger for negative feedback.The anterior agranular insula is part of a system underly-ing emotional processes. More specifically, it is involvedin visceromotor, i.e. autonomic (Verberne and Owens,1998) as well as in visceral sensory functions, underlyinginteroceptive awareness (Critchley, 2005), which is closelyrelated to emotional reactions. Our interpretation is inline with a recent proposal that anterior insula might beinvolved in error awareness (Klein et al., 2007). As sug-gested by Klein et al. (2007), the response of the insulaafter negative feedback may be attributed to an enhancedawareness of the autonomic reaction to the error, or tothe higher autonomic response itself, favoring errorawareness.
r Brain Dynamics of Performance Monitoring r
r 13 r
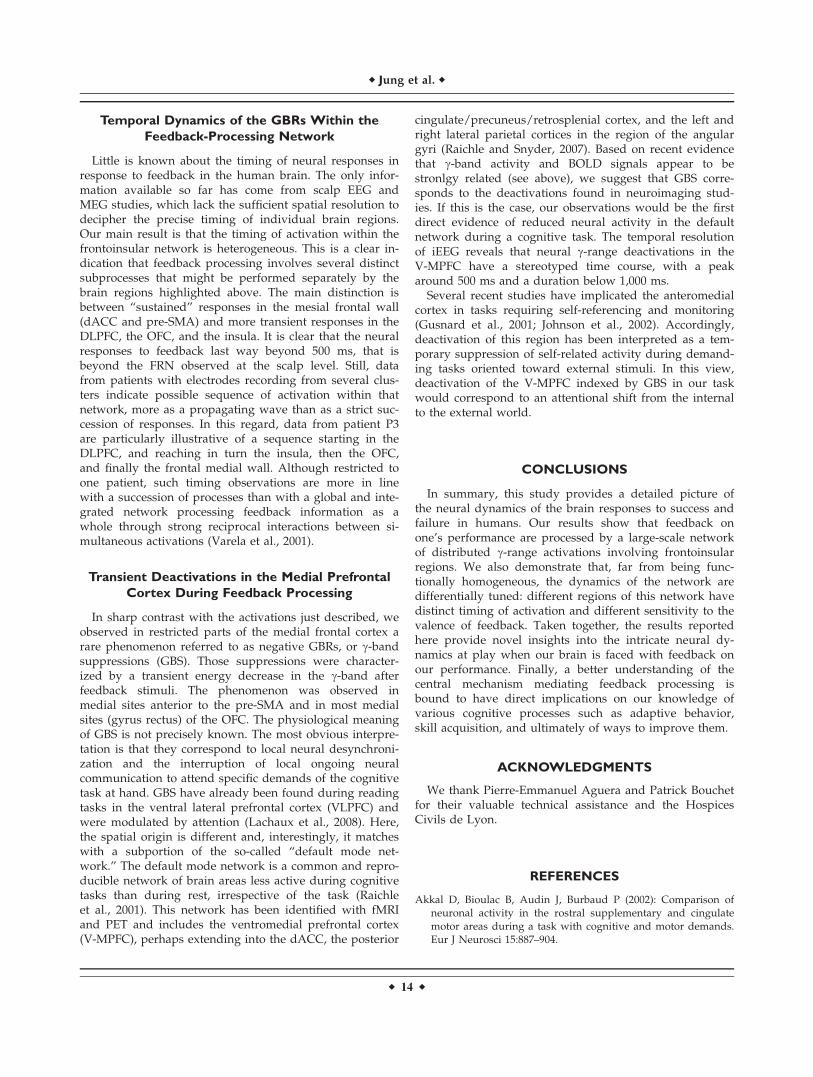
Temporal Dynamics of the GBRs Within the
Feedback-Processing Network
Little is known about the timing of neural responses inresponse to feedback in the human brain. The only infor-mation available so far has come from scalp EEG andMEG studies, which lack the sufficient spatial resolution todecipher the precise timing of individual brain regions.Our main result is that the timing of activation within thefrontoinsular network is heterogeneous. This is a clear in-dication that feedback processing involves several distinctsubprocesses that might be performed separately by thebrain regions highlighted above. The main distinction isbetween ‘‘sustained’’ responses in the mesial frontal wall(dACC and pre-SMA) and more transient responses in theDLPFC, the OFC, and the insula. It is clear that the neuralresponses to feedback last way beyond 500 ms, that isbeyond the FRN observed at the scalp level. Still, datafrom patients with electrodes recording from several clus-ters indicate possible sequence of activation within thatnetwork, more as a propagating wave than as a strict suc-cession of responses. In this regard, data from patient P3are particularly illustrative of a sequence starting in theDLPFC, and reaching in turn the insula, then the OFC,and finally the frontal medial wall. Although restricted toone patient, such timing observations are more in linewith a succession of processes than with a global and inte-grated network processing feedback information as awhole through strong reciprocal interactions between si-multaneous activations (Varela et al., 2001).
Transient Deactivations in the Medial Prefrontal
Cortex During Feedback Processing
In sharp contrast with the activations just described, weobserved in restricted parts of the medial frontal cortex arare phenomenon referred to as negative GBRs, or c-bandsuppressions (GBS). Those suppressions were character-ized by a transient energy decrease in the c-band afterfeedback stimuli. The phenomenon was observed inmedial sites anterior to the pre-SMA and in most medialsites (gyrus rectus) of the OFC. The physiological meaningof GBS is not precisely known. The most obvious interpre-tation is that they correspond to local neural desynchroni-zation and the interruption of local ongoing neuralcommunication to attend specific demands of the cognitivetask at hand. GBS have already been found during readingtasks in the ventral lateral prefrontal cortex (VLPFC) andwere modulated by attention (Lachaux et al., 2008). Here,the spatial origin is different and, interestingly, it matcheswith a subportion of the so-called ‘‘default mode net-work.’’ The default mode network is a common and repro-ducible network of brain areas less active during cognitivetasks than during rest, irrespective of the task (Raichleet al., 2001). This network has been identified with fMRIand PET and includes the ventromedial prefrontal cortex(V-MPFC), perhaps extending into the dACC, the posterior
cingulate/precuneus/retrosplenial cortex, and the left andright lateral parietal cortices in the region of the angulargyri (Raichle and Snyder, 2007). Based on recent evidencethat c-band activity and BOLD signals appear to bestronlgy related (see above), we suggest that GBS corre-sponds to the deactivations found in neuroimaging stud-ies. If this is the case, our observations would be the firstdirect evidence of reduced neural activity in the defaultnetwork during a cognitive task. The temporal resolutionof iEEG reveals that neural c-range deactivations in theV-MPFC have a stereotyped time course, with a peakaround 500 ms and a duration below 1,000 ms.
Several recent studies have implicated the anteromedialcortex in tasks requiring self-referencing and monitoring(Gusnard et al., 2001; Johnson et al., 2002). Accordingly,deactivation of this region has been interpreted as a tem-porary suppression of self-related activity during demand-ing tasks oriented toward external stimuli. In this view,deactivation of the V-MPFC indexed by GBS in our taskwould correspond to an attentional shift from the internalto the external world.
CONCLUSIONS
In summary, this study provides a detailed picture ofthe neural dynamics of the brain responses to success andfailure in humans. Our results show that feedback onone’s performance are processed by a large-scale networkof distributed c-range activations involving frontoinsularregions. We also demonstrate that, far from being func-tionally homogeneous, the dynamics of the network aredifferentially tuned: different regions of this network havedistinct timing of activation and different sensitivity to thevalence of feedback. Taken together, the results reportedhere provide novel insights into the intricate neural dy-namics at play when our brain is faced with feedback onour performance. Finally, a better understanding of thecentral mechanism mediating feedback processing isbound to have direct implications on our knowledge ofvarious cognitive processes such as adaptive behavior,skill acquisition, and ultimately of ways to improve them.
ACKNOWLEDGMENTS
We thank Pierre-Emmanuel Aguera and Patrick Bouchetfor their valuable technical assistance and the HospicesCivils de Lyon.
REFERENCES
Akkal D, Bioulac B, Audin J, Burbaud P (2002): Comparison ofneuronal activity in the rostral supplementary and cingulatemotor areas during a task with cognitive and motor demands.Eur J Neurosci 15:887–904.
r Jung et al. r
r 14 r
Alexander MP, Stuss DT, Picton T, Shallice T, Gillingham S(2007): Regional frontal injuries cause distinct impairments incognitive control. Neurology 68:1515–1523.
Canolty RT, Edwards E, Dalal SS, Soltani M, Nagarajan SS, KirschHE, Berger MS, Barbaro NM, Knight RT (2006): High gammapower is phase-locked to theta oscillations in human neocor-tex. Science 313:1626–1628.
Cools R, Clark L, Owen AM, Robbins TW (2002): Defining theneural mechanisms of probabilistic reversal learning usingevent-related functional magnetic resonance imaging. J Neuro-sci 22:4563–4567.
Coull JT, Vidal F, Nazarian B, Macar F (2004): Functional anatomyof the attentional modulation of time estimation. Science303:1506–1508.
Critchley HD (2005): Neural mechanisms of autonomic, affective,and cognitive integration. J Comp Neurol 493:154–166.
Debener S, Ullsperger M, Siegel M, Fiehler K, von Cramon DY,Engel AK (2005): Trial-by-trial coupling of concurrent electro-encephalogram and functional magnetic resonance imagingidentifies the dynamics of performance monitoring. J Neurosci25:11730–11737.
Ekstrom AD, Caplan JB, Ho E, Shattuck K, Fried I, Kahana MJ(2005): Human hippocampal theta activity during virtual navi-gation. Hippocampus 15:881–889.
Engel AK, Fries P, Singer W (2001): Dynamic predictions: Oscilla-tions and synchrony in top–down processing. Nat Rev Neuro-sci 2:704–716.
Fries P, Nikolic D, Singer W (2007): The gamma cycle. TrendsNeurosci 30:309–316.
Gehring WJ, Willoughby AR (2002): The medial frontal cortex andthe rapid processing of monetary gains and losses. Science295:2279–2282.
Genovese CR, Lazar NA, Nichols T (2002): Thresholding of statis-tical maps in functional neuroimaging using the false discov-ery rate. Neuroimage 15:870–878.
Gusnard DA, Akbudak E, Shulman GL, Raichle ME (2001): Medialprefrontal cortex and self-referential mental activity: Relationto a default mode of brain function. Proc Natl Acad Sci USA98:4259–4264.
Herrmann CS, Knight RT (2001): Mechanisms of human attention:Event-related potentials and oscillations. Neurosci BiobehavRev 25:465–476.
Herrmann MJ, Rommler J, Ehlis AC, Heidrich A, Fallgatter AJ(2004): Source localization (LORETA) of the error-related-nega-tivity (ERN/Ne) and positivity (Pe). Brain Res Cogn Brain Res20:294–299.
Holroyd CB, Nieuwenhuis S, Yeung N, Nystrom L, Mars RB,Coles MG, Cohen JD (2004): Dorsal anterior cingulate cortexshows fMRI response to internal and external error signals.Nat Neurosci 7:497–498.
Holroyd CB, Pakzad-Vaezi KL, Krigolson OE (2008): The feedbackcorrect-related positivity: Sensitivity of the event-related brainpotential to unexpected positive feedback. Psychophysiology45:688–697.
Hon N, Epstein RA, Owen AM, Duncan J (2006): Frontoparietal activ-ity with minimal decision and control. J Neurosci 26:9805–9809.
Isnard J, Guenot M, Ostrowsky K, Sindou M, Mauguiere F (2000):The role of the insular cortex in temporal lobe epilepsy. AnnNeurol 48:614–623.
Isoda M, Hikosaka O (2007): Switching from automatic to con-trolled action by monkey medial frontal cortex. Nat Neurosci10:240–248.
Ito S, Stuphorn V, Brown JW, Schall JD (2003): Performance moni-toring by the anterior cingulate cortex during saccade counter-manding. Science 302:120–122.
Jacobs J, Kahana MJ, Ekstrom AD, Fried I (2007): Brain oscillationscontrol timing of single-neuron activity in humans. J Neurosci27:3839–3844.
Jensen O, Kaiser J, Lachaux JP (2007): Human gamma-frequencyoscillations associated with attention and memory. TrendsNeurosci 30:317–324.
Jerbi K, Ossandon T, Hamame C, Senova S, Dalal S, Jung J, Min-otti L, Bertrand O, Berthoz A, Kahane P, Lachaux JP (2009):Task-related gamma-band dynamics from an intracerebral per-spective: Review and implications for surface EEG and MEG.Hum Brain Mapp 30:1758–1771.
Johnson SC, Baxter LC, Wilder LS, Pipe JG, Heiserman JE, Priga-tano GP (2002): Neural correlates of self-reflection. Brain 125(Pt8):1808–1814.
Jung J, Hudry J, Ryvlin P, Royet JP, Bertrand O, Lachaux JP(2006): Functional significance of olfactory-induced oscillationsin the human amygdala. Cereb Cortex 16:1–8.
Jung J, Mainy N, Kahane P, Minotti L, Hoffmann D, Bertrand O,Lachaux JP (2008): The neural bases of attentive reading. HumBrain Mapp 29:1193–1206.
Kahana MJ (2006): The cognitive correlates of human brain oscilla-tions. J Neurosci 26:1669–1672.
Klein TA, Endrass T, Kathmann N, Neumann J, von Cramon DY,Ullsperger M (2007): Neural correlates of error awareness.Neuroimage 34:1774–1781.
Kringelbach ML (2005): The human orbitofrontal cortex: Linkingreward to hedonic experience. Nat Rev Neurosci 6:691–702.
Lachaux JP, Rudrauf D, Kahane P (2003): Intracranial EEG andhuman brain mapping. J Physiol Paris 97(4–6):613–628.
Lachaux JP, Fonlupt P, Kahane P, Minotti L, Hoffmann D, Ber-trand O, Baciu M (2007): Relationship between task-relatedgamma oscillations and BOLD signal: New insights from com-bined fMRI and intracranial EEG. Hum Brain Mapp 28:1368–1375.
Lachaux JP, Jung J, Mainy N, Dreher JC, Bertrand O, Baciu M,Minotti L, Hoffmann D, Kahane P (2008): Silence is golden:Transient neural deactivation in the prefrontal cortex duringattentive reading. Cereb Cortex 18:443–450.
Lee D (2003): Coherent oscillations in neuronal activity of the sup-plementary motor area during a visuomotor task. J Neurosci23:6798–6809.
Logothetis NK, Pauls J, Augath M, Trinath T, Oeltermann A(2001): Neurophysiological investigation of the basis of thefMRI signal. Nature 412:150–157.
Luu P, Tucker DM, Derryberry D, Reed M, Poulsen C (2003): Elec-trophysiological responses to errors and feedback in the pro-cess of action regulation. Psychol Sci 14:47–53.
Mainy N, Kahane P, Minotti L, Hoffmann D, Bertrand O, LachauxJP (2007): Neural correlates of consolidation in working mem-ory. Hum Brain Mapp 28:183–193.
Mainy N, Jung J, Baciu M, Kahane P, Schoendorff B, Minotti L,Hoffmann D, Bertrand O, Lachaux JP (2008): Cortical dynamicsof word recognition. Hum Brain Mapp 29:1215–1230.
Matsumoto M, Matsumoto K, Abe H, Tanaka K (2007): Medialprefrontal cell activity signaling prediction errors of action val-ues. Nat Neurosci 10:647–656.
Michelet T, Bioulac B, Guehl D, Escola L, Burbaud P (2007):Impact of commitment on performance evaluation in the ros-tral cingulate motor area. J Neurosci 27:7482–7489.
r Brain Dynamics of Performance Monitoring r
r 15 r

Miltner WHR, Braun CH, Coles MGH (1997): Event-related brainpotentials following incorrect feedback in a time-estimationtask: Evidence for a ‘generic’ neural system for error detection.J Cogn Neurosci 9:788–798.
Monchi O, Petrides M, Petre V, Worsley K, Dagher A (2001): Wis-consin Card Sorting revisited: Distinct neural circuits partici-pating in different stages of the task identified by event-relatedfunctional magnetic resonance imaging. J Neurosci 21:7733–7741.
Mukamel R, Gelbard H, Arieli A, Hasson U, Fried I, Malach R(2005): Coupling between neuronal firing, field potentials, andFMRI in human auditory cortex. Science 309:951–954.
Nieuwenhuis S, Holroyd CB, Mol N, Coles MG (2004): Reinforce-ment-related brain potentials from medial frontal cortex: Ori-gins and functional significance. Neurosci Biobehav Rev28:441–448.
Nieuwenhuis S, Slagter HA, von Geusau NJ, Heslenfeld DJ, Hol-royd CB (2005): Knowing good from bad: Differential activa-tion of human cortical areas by positive and negativeoutcomes. Eur J Neurosci 21:3161–3168.
Nir Y, Fisch L, Mukamel R, Gelbard-Sagiv H, Arieli A, Fried I,Malach R (2007): Coupling between neuronal firing rate,gamma LFP, and BOLD fMRI is related to interneuronal corre-lations. Curr Biol 17:1275–1285.
Picard N, Strick PL (1996): Motor areas of the medial wall: Areview of their location and functional activation. Cereb Cortex6:342–353.
Polich J (2007): Updating P300: An integrative theory of P3a andP3b. Clin Neurophysiol 118:2128–2148.
Polli FE, Barton JJ, Thakkar KN, Greve DN, Goff DC, Rauch SL,Manoach DS (2008): Reduced error-related activation in twoanterior cingulate circuits is related to impaired performancein schizophrenia. Brain 131(Pt 4):971–986.
Quilodran R, Rothe M, Procyk E (2008): Behavioral shifts andaction valuation in the anterior cingulate cortex. Neuron57:314–325.
Raghavachari S, Kahana MJ, Rizzuto DS, Caplan JB, Kirschen MP,Bourgeois B, Madsen JR, Lisman JE (2001): Gating of humantheta oscillations by a working memory task. J Neurosci21:3175–3183.
Raichle ME, Snyder AZ (2007): A default mode of brain function:A brief history of an evolving idea. Neuroimage 37:1083–1090;discussion 1097–1099.
Raichle ME, MacLeod AM, Snyder AZ, Powers WJ, Gusnard DA,Shulman GL (2001): A default mode of brain function. ProcNatl Acad Sci USA 98:676–682.
Rolls ET (2004): The functions of the orbitofrontal cortex. BrainCogn 55:11–29.
Ruchsow M, Grothe J, Spitzer M, Kiefer M (2002): Human anteriorcingulate cortex is activated by negative feedback: Evidencefrom event-related potentials in a guessing task. Neurosci Lett325:203–206.
Rushworth MF, Walton ME, Kennerley SW, Bannerman DM(2004): Action sets and decisions in the medial frontal cortex.Trends Cogn Sci 8:410–417.
Shima K, Mushiake H, Saito N, Tanji J (1996): Role for cells in thepresupplementary motor area in updating motor plans. ProcNatl Acad Sci USA 93:8694–8698.
Singer W (1999): Neuronal synchrony: A versatile code for thedefinition of relations? Neuron 24:49–65, 111–125.
Talairach J, Tournoux P (1988): Co-planar Stereotaxic Atlas of theHuman Brain. 3-Dimensional Proportional System: AnApproach to Cerebral Imaging. Stuttgart: Thieme.
Tallon-Baudry C, Bertrand O, Delpuech C, Pernier J (1997): Oscil-latory gamma-band (30–70 Hz) activity induced by a visualsearch task in humans. J Neurosci 17:722–734.
Thakkar KN, Polli FE, Joseph RM, Tuch DS, Hadjikhani N, BartonJJ, Manoach DS. (2008): Response monitoring, repetitive behav-iour and anterior cingulate abnormalities in autism spectrumdisorders (ASD). Brain 131(Pt 9):2464–2478.
Ullsperger M, von Cramon DY (2003): Error monitoring usingexternal feedback: Specific roles of the habenular complex, thereward system, and the cingulate motor area revealed byfunctional magnetic resonance imaging. J Neurosci 23:4308–4314.
van Veen V, Holroyd CB, Cohen JD, Stenger VA, Carter CS(2004): Errors without conflict: Implications for performancemonitoring theories of anterior cingulate cortex. Brain Cogn56:267–276.
Varela F, Lachaux JP, Rodriguez E, Martinerie J (2001): The brain-web: Phase synchronization and large-scale integration. NatRev Neurosci 2:229–239.
Verberne AJ, Owens NC (1998): Cortical modulation of the cardio-vascular system. Prog Neurobiol 54:149–168.
Wallis JD (2007): Orbitofrontal cortex and its contribution to deci-sion-making. Annu Rev Neurosci 30:31–56.
Walton ME, Devlin JT, Rushworth MF (2004): Interactionsbetween decision making and performance monitoring withinprefrontal cortex. Nat Neurosci 7:1259–1265.
Zanolie K, Van Leijenhorst L, Rombouts SA, Crone EA (2008):Separable neural mechanisms contribute to feedback process-ing in a rule-learning task. Neuropsychologia 46:117–126.
r Jung et al. r
r 16 r
Copyright © 2022 FDOKUMEN