Modeling Temporal Interaction Dynamics in Organizational ...
20
ORIGINAL PAPER Modeling Temporal Interaction Dynamics in Organizational Settings Nale Lehmann-Willenbrock 1 & Joseph A. Allen 2 Published online: 26 August 2017 # The Author(s) 2017. This article is an open access publication Abstract Most workplace phenomena take place in dynamic social settings and emerge over time, and scholars have re- peatedly called for more research into the temporal dynamics of organizational behavior. One reason for this persistent re- search gap could be that organizational scholars are not aware of the methodological advances that are available today for modeling temporal interactions and detecting behavioral pat- terns that emerge over time. To facilitate such awareness, this Methods Corner contribution provides a hands-on tutorial for capturing and quantifying temporal behavioral patterns and for leveraging rich interaction data in organizational settings. We provide an overview of different approaches and method- ologies for examining temporal interaction patterns, along with detailed information about the type of data that needs to be gathered in order to apply each method as well as the analytical steps (and available software options) involved in each method. Specifically, we discuss and illustrate lag se- quential analysis, pattern analysis, statistical discourse analy- sis, and visualization methods for identifying temporal pat- terns in interaction data. We also provide key takeaways for integrating these methods more firmly in the field of organi- zational research and for moving interaction analytical re- search forward. Keywords Behavioral observations . Interaction analysis . Temporal patterns . Pattern analysis . Software options This is the tenth paper in the Methods Corner series of the Journal of Business and Psychology . Previous works in this series have focused on a range of methodological issues and applications in business and managerial psychology, includ- ing tests of mediation (MacKinnon, Coxe, & Baraldi, 2012), the implementation of structural equation modeling for meta- analysis (Landis, 2013), the use of moderator models and analysis (Dawson, 2014), the analysis of historical data in organizational research (Zickar, 2015), the use of latent vari- able confirmatory factor analysis for addressing common method variance (Williams & McGonagle, 2016), and most recently, the precision and utility of mixed-effects models (Bliese, Maltarich, & Hendricks, 2017). The current paper adds a new perspective to the series by highlighting different ways to study and model temporal interaction dynamics in organizational settings. Organizational scholars increasingly appreciate the value of focusing on behavior and modeling temporal behavioral contingencies, as indicated by several conceptual and theoret- ical works in the team process as well as the leadership liter- ature (e.g., Cronin, Weingart, & Todorova, 2011; DeRue, 2011; Dinh, Lord, Gardner, Meuser, Liden, & Hu, 2014; Herndon & Lewis, 2015 ; Leenders, Contractor, & DeChurch, 2016; Waller, Okhuysen, & Saghafian, 2016). Yet, empirical efforts at addressing the calls that are put forth in these conceptual papers remain sparse. One reason could be that organizational scholars are not aware of the methodolog- ical advances that are available today for modeling social dy- namics in behavioral interactions. To address this gap, this Methods Corner paper highlights social interaction analysis as a rich temporal behavioral approach for studying workplace phenomena such as team process dynamics and leader- follower interactions. Rather than studying (single or multiple) snapshots of be- havior, research on actual interactions as they unfold over time * Nale Lehmann-Willenbrock [email protected] 1 University of Amsterdam, Work and Organizational Psychology, P.O. Box 15919, 1001 NK Amsterdam, The Netherlands 2 University of Nebraska at Omaha, Omaha, USA J Bus Psychol (2018) 33:325–344 DOI 10.1007/s10869-017-9506-9
-
Upload
khangminh22 -
Category
Documents
-
view
2 -
download
0
Transcript of Modeling Temporal Interaction Dynamics in Organizational ...
ORIGINAL PAPER
Modeling Temporal Interaction Dynamicsin Organizational Settings
Nale Lehmann-Willenbrock1& Joseph A. Allen2
Published online: 26 August 2017# The Author(s) 2017. This article is an open access publication
Abstract Most workplace phenomena take place in dynamicsocial settings and emerge over time, and scholars have re-peatedly called for more research into the temporal dynamicsof organizational behavior. One reason for this persistent re-search gap could be that organizational scholars are not awareof the methodological advances that are available today formodeling temporal interactions and detecting behavioral pat-terns that emerge over time. To facilitate such awareness, thisMethods Corner contribution provides a hands-on tutorial forcapturing and quantifying temporal behavioral patterns andfor leveraging rich interaction data in organizational settings.We provide an overview of different approaches and method-ologies for examining temporal interaction patterns, alongwith detailed information about the type of data that needs tobe gathered in order to apply each method as well as theanalytical steps (and available software options) involved ineach method. Specifically, we discuss and illustrate lag se-quential analysis, pattern analysis, statistical discourse analy-sis, and visualization methods for identifying temporal pat-terns in interaction data. We also provide key takeaways forintegrating these methods more firmly in the field of organi-zational research and for moving interaction analytical re-search forward.
Keywords Behavioral observations . Interaction analysis .
Temporal patterns . Pattern analysis . Software options
This is the tenth paper in the Methods Corner series of theJournal of Business and Psychology. Previous works in thisseries have focused on a range of methodological issues andapplications in business and managerial psychology, includ-ing tests of mediation (MacKinnon, Coxe, & Baraldi, 2012),the implementation of structural equation modeling for meta-analysis (Landis, 2013), the use of moderator models andanalysis (Dawson, 2014), the analysis of historical data inorganizational research (Zickar, 2015), the use of latent vari-able confirmatory factor analysis for addressing commonmethod variance (Williams & McGonagle, 2016), and mostrecently, the precision and utility of mixed-effects models(Bliese, Maltarich, & Hendricks, 2017). The current paperadds a new perspective to the series by highlighting differentways to study and model temporal interaction dynamics inorganizational settings.
Organizational scholars increasingly appreciate the valueof focusing on behavior and modeling temporal behavioralcontingencies, as indicated by several conceptual and theoret-ical works in the team process as well as the leadership liter-ature (e.g., Cronin, Weingart, & Todorova, 2011; DeRue,2011; Dinh, Lord, Gardner, Meuser, Liden, & Hu, 2014;Herndon & Lewis, 2015; Leenders, Contractor, &DeChurch, 2016; Waller, Okhuysen, & Saghafian, 2016).Yet, empirical efforts at addressing the calls that are put forthin these conceptual papers remain sparse. One reason could bethat organizational scholars are not aware of the methodolog-ical advances that are available today for modeling social dy-namics in behavioral interactions. To address this gap, thisMethods Corner paper highlights social interaction analysisas a rich temporal behavioral approach for studying workplacephenomena such as team process dynamics and leader-follower interactions.
Rather than studying (single or multiple) snapshots of be-havior, research on actual interactions as they unfold over time
* Nale [email protected]
1 University of Amsterdam, Work and Organizational Psychology,P.O. Box 15919, 1001 NK Amsterdam, The Netherlands
2 University of Nebraska at Omaha, Omaha, USA
J Bus Psychol (2018) 33:325–344DOI 10.1007/s10869-017-9506-9
can generate insights into the complex social dynamics at thecore of many organizational phenomena, as most employeebehaviors are embedded in dynamic social contexts (e.g.,Johns, 2006; Mehra, Kilduff, & Brass, 2001; Porath,Spreitzer, Gibson, & Garnett, 2012; Spreitzer, Sutcliffe,Dutton, Sonenshein, & Grant, 2005). The goal is to get closerto the phenomena of interest, to investigate the actual behav-iors that we are trying to explain, and to understand the tem-poral dynamics that surround them. For example, instead ofstatic descriptions of a leader’s overall style, behavioral inter-action research can yield much more specific answers aboutwhat, when, and how a leader needs to communicate in orderto motivate their team toward a particular goal.
Providing some answers to the repeated calls for more dy-namic research on team processes (e.g., Kozlowski, 2015) andon leader-follower interactions (e.g., Dinh et al., 2014), a num-ber of recent studies have adopted a temporal approach andbegun to study actual behavioral interactions in the workplace(e.g., Meinecke, Lehmann-Willenbrock, & Kauffeld, 2017;Paletz, Chan, & Schunn, 2016; Zijlstra, Waller, & Phillips,2012). In particular, a small but growing research base inves-tigates actual behaviors and behavioral patterns embedded inworkplace interactions. We highlight a number of these ad-vances in the literature as exemplary applications of patternanalytical methods. In keeping with the emphasis of our paper,focus on those studies that have provided insights into sociallyembedded behaviors or interaction patterns, rather thanLikert-type frequency scales or static counts of behavior (forexamples of the latter, see Detert & Burris, 2007; Hirst, vanKnippenberg, & Zhou, 2009; Madrid, Totterdell, & Niven,2016; Totterdell, 2000; among many others, including someof our own work). Moreover, we highlight only those studiesthat have offered insights based on actual workplace popula-tions, rather than undergraduate or MBA students and their adhoc interactions in the laboratory (among a multitude of ex-amples, see Aggarwal &Woolley, 2013; Hambley, O’Neill, &Kline, 2007; Nahrgang, DeRue, Hollenbeck, Spitzmuller,Jundt, & Ilgen, 2013).
In the form of a detailed methodological tutorial, we brieflyreview the basic approach to observing and analyzing socialinteractions in the workplace and then point out different an-alytical strategies for exploring temporal dynamics in detail.We provide an overview of available methodologies for quan-tifying temporal interaction patterns and discuss the type ofresearch questions that can be addressed by each method aswell as available software options. Specifically, we discuss lagsequential analysis, pattern analysis, and statistical discourseanalysis for quantifying emergent behavioral patterns and test-ing hypotheses at the behavioral event level. Moreover, wealso highlight a number of more exploratory visualizationmethods for investigating temporal interaction patterns. Wehope that this paper will inspire future research to take a moredynamic stance when studying interactions at work. Our aim
here is to lay the groundwork for much needed empiricaladvances in terms of understanding social dynamics in in theworkplace.
Conceptualizing Behavior as Actual Behavior
In 2011, Cronin et al. stated, BWe hope that a review of thegroup dynamics literature in 2021 will celebrate our comingempirical accomplishments rather than lament a lack of them^(p. 571). Their largest concern was the lack of progress inanalyzing social dynamics in teams as behavior unfolds overtime. The hope was that increased research effort, technolog-ical advances, statistical methodological discoveries, and theincorporation of time in research questions and design wouldhelp bring the modeling of temporal interaction dynamics for-ward. A key consideration in modeling behavior through timeis conceptualizing and capturing behavioral phenomena asactual behavior, rather than relying on post hoc perceptionsof behavior (e.g., surveys) or the filtered interpretations ofsuch behavior (e.g., anecdotal observations by researchers;Baumeister, Vohs, & Funder, 2007).
Actual behavior concerns the observable movements, in-teractions, communications, and so forth that individuals andgroups actually engage in (e.g., Baumeister et al., 2007). Forexample, when a leader seeks to motivate their team, knowingthe actual communicative behaviors they should engage inwithin the interaction stream (i.e., which actual behaviorshould be executed at which particular point in time) seemsessential and more practical than just knowing the post hocperceptions of a leader’s overall behavior. The benefit ofstudying actual behavioral markers of phenomena such asteam coordination and problem solving or social influencebetween leaders and followers is that the obtained behavioraldata are closer to the phenomena of interest, both conceptuallyand methodologically (e.g., Baumeister et al., 2007). For ex-ample, when studying humor in group or team interactions,humor and laughter occurrences are key behavioral markers(Lehmann-Willenbrock & Allen, 2014). Thus, a statementintended to be humorous (and often followed by laughter) isa behavioral marker that is conceptually and temporally closerto the phenomenon of humor than the post-interaction surveyresponse that the interaction was humorous.
More specifically, Baumeister et al., (2007) articulate andlament the fact that much of psychological science focuses onBself-reports and finger movements^ rather than actual behav-ior. With industrial/organizational psychology and other orga-nizational sciences interested in the behavior of people, it isremarkable that so much of the recent work in this area con-tinues to rely on surveys where researchers get the filtered,interpreted reflection of previous behavior rather than actuallyobserving behavior as it happens in real time (Agnew,Carlston, Graziano, & Kelly, 2009). According to Agnew
326 J Bus Psychol (2018) 33:325–344
et al., psychological science investigates inter-individual (e.g.,social cognition and individual differences) and intra-individual (e.g., social relationships and group dynamics) pro-cesses, that should not be divorced from or devoid of behaviorand observation. Yet, so much of modern psychological sci-ence continues to depend upon interpretation, absent of be-havioral referent.
Frankly, this returns, to some extent, to the classic debatebetween behaviorism (e.g., Skinner, 1974) and cognitivism(Gardner, 2008). In an oversimplified statement, behaviorismasserts that researchers should focus only on the external be-haviors of individuals while cognitivism asserts that theyshould focus only on individuals’ internal processing andthought. Both are essential and both have a long history ofresearch, investigation, and monumental discovery. For exam-ple, the discovery of operant conditioning (Skinner, Skinner,Psychologue, Skinner, & Skinner, 1972) is a result of a behav-ioral approach, whereas Premack’s Theory of Mind (Premack& Woodruff, 1978) is directly a function of a transition to thecognitive approach.
Given what we have stated, one might start to believe thatwe are advocating for a closer look at behavior at the expenseof cognition or interpretation and so forth. To the contrary, weadvocate investigating temporal interaction from an inclusiveperspective that includes both behavior and cognition. Forexample, Lehmann-Willenbrock, Meyers, Kauffeld,Neininger, and Henschel (2011) investigated verbal interac-tion sequences in relation to group mood. Group mood isinherently an internal affective process that has behavioralmanifestations. Thus, the investigation of temporal group dy-namics may and often does include both behavior and internalcognitive processes. In many cases, however, when we wantto understand interactions between individuals or withingroups, behavioral data is often better and more appropriatethan the post-interaction interpretations reported on a survey.Thus, without taking away the need or appropriateness ofsurveys or other methods, we focus on the need and the callby others (e.g., Baumeister et al., 2007) to study actual behav-ior in groups and among individuals in dynamic socialinteraction.
Tutorial: How to Investigate Dynamic TemporalInteractions
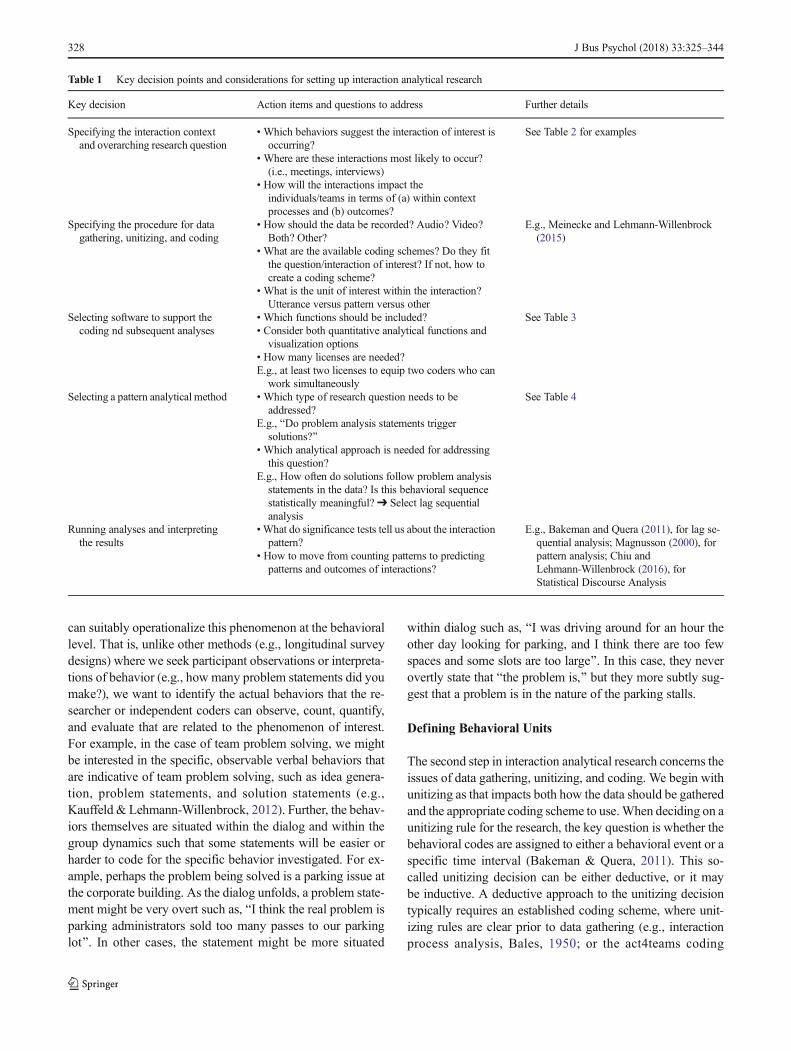
When considering the use of methods for observing and ana-lyzing temporal interaction patterns, scholars need to makeseveral key decisions. We summarize these steps in Table 1,and the remainder of this paper will follow this structure ac-cordingly. Specifically, the table summarizes the five majorsteps to doing dynamic temporal interaction research. First,specifying the interaction context and overarching researchquestion. Second, specifying the procedure for data gathering,
unitizing, and coding. Third, selecting software to support thecoding and subsequent analyses. Fourth, selecting a patternanalytical method for understanding the interaction observed.Fifth, running analyses appropriate for the research questionand interpreting the results. With each of these steps, we pro-vide key action items/questions in the table and provide inter-pretation as well as additional details in this text. We alsorecommend additional resources, including possible softwareapplications, for interested researchers.
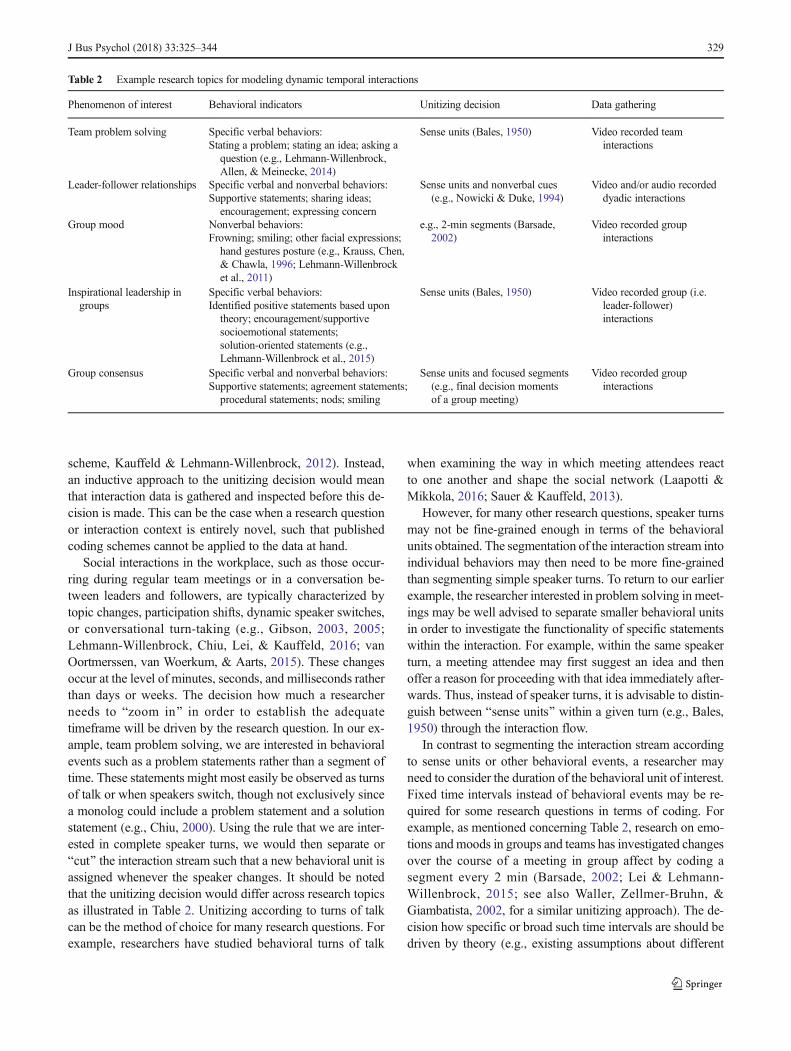
For the first step, previous research, particularly in thegroups literature, emphasizes the importance of studying com-municative behaviors in order to understand what actuallyhappens in groups (e.g., Bonito & Sanders, 2011; Gouran,1999; Gouran & Hirokawa, 1996; Jarboe, 1999; Meyers &Brashers, 1999; Pavitt, 1993, 1999; Poole, 1999). In this tuto-rial, we focus on one example, team problem solving, andwalk through the steps in the process to analyze dynamictemporal interactions. There are, however, many researchquestions both related to groups and teams as well as leader-ship, among other contexts, for which this type of analysis canbe used. A few examples are provided in Table 2. Specifically,Table 2 provides an overview of specific research topics orphenomena, potential verbal/nonverbal behaviors of interestin the context of each phenomenon, the respective unitizingdecision, and a suggested method for data gathering.
For example, a researcher who studies group mood mightbe interested in understanding the nonverbal behaviors thatindicate changes in group mood. From a theoretical stance,group mood develops because team members respond to oneanother’s affective expressions (for an overview, see Barsade& Knight, 2015). Hence, to pinpoint the phenomenon ofgroup mood, we need to study group members’ visible behav-ioral expressions of affect. These would be indexed by observ-ing and coding group members’ instances of smiling,frowning, other facial expressions, hand gestures, posture,and so forth. However, because group mood is a dynamicprocess that may change from moment to moment withinthe group interaction, the stream of interaction may be seg-mented into temporal units (e.g., 2-min segments; Barsade,2002) and comparisons made across segments. In order todo this, video-recorded group interaction would likely be es-sential. The table provides several additional examples similarto group mood just described here. For additional detail onunitizing decisions and the coding process, as well as helpfuladditional examples, see Meinecke & Lehmann-Willenbrock,2015; Chiu & Lehmann-Willenbrock, 2016.
Identifying Relevant Behaviors
As mentioned, we will use the example of team problem solv-ing. Our research question is Bhow does team problem solvingunfold within team interactions?^. With this research questiondefined, we must decide on the variable or set of variables that
J Bus Psychol (2018) 33:325–344 327
can suitably operationalize this phenomenon at the behaviorallevel. That is, unlike other methods (e.g., longitudinal surveydesigns) where we seek participant observations or interpreta-tions of behavior (e.g., how many problem statements did youmake?), we want to identify the actual behaviors that the re-searcher or independent coders can observe, count, quantify,and evaluate that are related to the phenomenon of interest.For example, in the case of team problem solving, we mightbe interested in the specific, observable verbal behaviors thatare indicative of team problem solving, such as idea genera-tion, problem statements, and solution statements (e.g.,Kauffeld & Lehmann-Willenbrock, 2012). Further, the behav-iors themselves are situated within the dialog and within thegroup dynamics such that some statements will be easier orharder to code for the specific behavior investigated. For ex-ample, perhaps the problem being solved is a parking issue atthe corporate building. As the dialog unfolds, a problem state-ment might be very overt such as, BI think the real problem isparking administrators sold too many passes to our parkinglot^. In other cases, the statement might be more situated
within dialog such as, BI was driving around for an hour theother day looking for parking, and I think there are too fewspaces and some slots are too large^. In this case, they neverovertly state that Bthe problem is,^ but they more subtly sug-gest that a problem is in the nature of the parking stalls.
Defining Behavioral Units
The second step in interaction analytical research concerns theissues of data gathering, unitizing, and coding. We begin withunitizing as that impacts both how the data should be gatheredand the appropriate coding scheme to use.When deciding on aunitizing rule for the research, the key question is whether thebehavioral codes are assigned to either a behavioral event or aspecific time interval (Bakeman & Quera, 2011). This so-called unitizing decision can be either deductive, or it maybe inductive. A deductive approach to the unitizing decisiontypically requires an established coding scheme, where unit-izing rules are clear prior to data gathering (e.g., interactionprocess analysis, Bales, 1950; or the act4teams coding
Table 1 Key decision points and considerations for setting up interaction analytical research
Key decision Action items and questions to address Further details
Specifying the interaction contextand overarching research question
• Which behaviors suggest the interaction of interest isoccurring?
• Where are these interactions most likely to occur?(i.e., meetings, interviews)
• How will the interactions impact theindividuals/teams in terms of (a) within contextprocesses and (b) outcomes?
See Table 2 for examples
Specifying the procedure for datagathering, unitizing, and coding
• How should the data be recorded? Audio? Video?Both? Other?
• What are the available coding schemes? Do they fitthe question/interaction of interest? If not, how tocreate a coding scheme?
• What is the unit of interest within the interaction?Utterance versus pattern versus other
E.g., Meinecke and Lehmann-Willenbrock(2015)
Selecting software to support thecoding nd subsequent analyses
• Which functions should be included?• Consider both quantitative analytical functions and
visualization options• How many licenses are needed?E.g., at least two licenses to equip two coders who can
work simultaneously
See Table 3
Selecting a pattern analytical method • Which type of research question needs to beaddressed?
E.g., BDo problem analysis statements triggersolutions?^
• Which analytical approach is needed for addressingthis question?
E.g., How often do solutions follow problem analysisstatements in the data? Is this behavioral sequencestatistically meaningful? ➔ Select lag sequentialanalysis
See Table 4
Running analyses and interpretingthe results
•What do significance tests tell us about the interactionpattern?
• How to move from counting patterns to predictingpatterns and outcomes of interactions?
E.g., Bakeman and Quera (2011), for lag se-quential analysis; Magnusson (2000), forpattern analysis; Chiu andLehmann-Willenbrock (2016), forStatistical Discourse Analysis
328 J Bus Psychol (2018) 33:325–344
scheme, Kauffeld & Lehmann-Willenbrock, 2012). Instead,an inductive approach to the unitizing decision would meanthat interaction data is gathered and inspected before this de-cision is made. This can be the case when a research questionor interaction context is entirely novel, such that publishedcoding schemes cannot be applied to the data at hand.
Social interactions in the workplace, such as those occur-ring during regular team meetings or in a conversation be-tween leaders and followers, are typically characterized bytopic changes, participation shifts, dynamic speaker switches,or conversational turn-taking (e.g., Gibson, 2003, 2005;Lehmann-Willenbrock, Chiu, Lei, & Kauffeld, 2016; vanOortmerssen, van Woerkum, & Aarts, 2015). These changesoccur at the level of minutes, seconds, and milliseconds ratherthan days or weeks. The decision how much a researcherneeds to Bzoom in^ in order to establish the adequatetimeframe will be driven by the research question. In our ex-ample, team problem solving, we are interested in behavioralevents such as a problem statements rather than a segment oftime. These statements might most easily be observed as turnsof talk or when speakers switch, though not exclusively sincea monolog could include a problem statement and a solutionstatement (e.g., Chiu, 2000). Using the rule that we are inter-ested in complete speaker turns, we would then separate orBcut^ the interaction stream such that a new behavioral unit isassigned whenever the speaker changes. It should be notedthat the unitizing decision would differ across research topicsas illustrated in Table 2. Unitizing according to turns of talkcan be the method of choice for many research questions. Forexample, researchers have studied behavioral turns of talk
when examining the way in which meeting attendees reactto one another and shape the social network (Laapotti &Mikkola, 2016; Sauer & Kauffeld, 2013).
However, for many other research questions, speaker turnsmay not be fine-grained enough in terms of the behavioralunits obtained. The segmentation of the interaction stream intoindividual behaviors may then need to be more fine-grainedthan segmenting simple speaker turns. To return to our earlierexample, the researcher interested in problem solving in meet-ings may be well advised to separate smaller behavioral unitsin order to investigate the functionality of specific statementswithin the interaction. For example, within the same speakerturn, a meeting attendee may first suggest an idea and thenoffer a reason for proceeding with that idea immediately after-wards. Thus, instead of speaker turns, it is advisable to distin-guish between Bsense units^ within a given turn (e.g., Bales,1950) through the interaction flow.
In contrast to segmenting the interaction stream accordingto sense units or other behavioral events, a researcher mayneed to consider the duration of the behavioral unit of interest.Fixed time intervals instead of behavioral events may be re-quired for some research questions in terms of coding. Forexample, as mentioned concerning Table 2, research on emo-tions and moods in groups and teams has investigated changesover the course of a meeting in group affect by coding asegment every 2 min (Barsade, 2002; Lei & Lehmann-Willenbrock, 2015; see also Waller, Zellmer-Bruhn, &Giambatista, 2002, for a similar unitizing approach). The de-cision how specific or broad such time intervals are should bedriven by theory (e.g., existing assumptions about different
Table 2 Example research topics for modeling dynamic temporal interactions
Phenomenon of interest Behavioral indicators Unitizing decision Data gathering
Team problem solving Specific verbal behaviors:Stating a problem; stating an idea; asking a
question (e.g., Lehmann-Willenbrock,Allen, & Meinecke, 2014)
Sense units (Bales, 1950) Video recorded teaminteractions
Leader-follower relationships Specific verbal and nonverbal behaviors:Supportive statements; sharing ideas;
encouragement; expressing concern
Sense units and nonverbal cues(e.g., Nowicki & Duke, 1994)
Video and/or audio recordeddyadic interactions
Group mood Nonverbal behaviors:Frowning; smiling; other facial expressions;
hand gestures posture (e.g., Krauss, Chen,& Chawla, 1996; Lehmann-Willenbrocket al., 2011)
e.g., 2-min segments (Barsade,2002)
Video recorded groupinteractions
Inspirational leadership ingroups
Specific verbal behaviors:Identified positive statements based upon
theory; encouragement/supportivesocioemotional statements;solution-oriented statements (e.g.,Lehmann-Willenbrock et al., 2015)
Sense units (Bales, 1950) Video recorded group (i.e.leader-follower)interactions
Group consensus Specific verbal and nonverbal behaviors:Supportive statements; agreement statements;
procedural statements; nods; smiling
Sense units and focused segments(e.g., final decision momentsof a group meeting)
Video recorded groupinteractions
J Bus Psychol (2018) 33:325–344 329
team or leader behaviors in broader team phases; e.g.,Morgeson, DeRue, & Karam, 2010) as well as empirical con-siderations. The latter may include initial observations fromthe recorded interaction data, such as how frequently teamstypically change topic. For examples and additional discus-sion of unitizing decisions and time frames, see Bakeman &Quera, 2011.
Coding Behavior
Once the unitizing rule is chosen, the researcher must decidehow to code the behavioral units. BCoding^ in this contextmeans that every behavioral unit will be assigned to a behav-ioral category. Note that sometimes this is called Bannotating^rather than Bcoding.^ For our example, we have already iden-tified three potential categories under which we would want tocode the observed behaviors including idea statement (i.e.,idea generation), solution statements, and problem statements.Due to these statements being embedded within a largerstream of interaction, it is advisable that the coding schemeis exhaustive thereby avoiding room for interpretation thatwill likely pose a threat to inter-rater reliability and to easethe coding procedure (Bakeman & Quera, 2011). In otherwords, a coder should be able to assign any unit that is selectedor cut from the meeting interaction flow to a behavioral codewithin the coding scheme. For example, returning to our teamproblem solving concerning parking, in addition to making aproblem statement (e.g., BI think the real problem is parkingadministrators sold too many passes to our parking lot^), ateam member may say Byeah, I agree!^—an agreement state-ment which is not specific to our research question. Or some-one on the team may say, BI agree, the process for purchasingpermits does not consider the number of purchasers^, whichboth agrees with the problem statement and elaborates uponthe problem. As such, even for our specific research question,it is appropriate and recommended to select or create a codingscheme that would code every behavioral unit, even if it doesnot necessarily pertain to the research question at hand.Leaving units uncoded can be problematic later in the researchprocess, depending upon the analysis strategy chosen. Ratherthan leave them uncoded, behaviors that really do not fit anyof the categories in a coding scheme might be coded as Bnofit^ or Bother .̂
Gathering Behavioral Interaction Data
Once a decision is made about the phenomenon of interest,then determining the best method for capturing the interac-tions where the phenomenon occurs comes next. For our cur-rent research question and for those listed in Table 2, we de-cided to focus on video and audio recording for capturing theinteractions. Of note, there are other modalities for behavioralobservations, namely wearable sensors and other unobtrusive
behavioral measures. Extracting and meaningfullyinterpreting such sensor data typically require the expertiseof computer scientists. For an overview of possible ap-proaches and interdisciplinary research opportunities, seeLehmann-Willenbrock, Hung, and Keyton (forthcoming).Yet, in terms of behavioral team interaction processes, muchof the previous work relied on videotapedmeeting interactions(e.g., Kauffeld & Lehmann-Willenbrock, 2012; Kauffeld &Meyers, 2009). Videos are particularly useful when analyzinggroup data because there are multiple people and tracking whois speaking when is essential for coding the interaction. Aswith our question, someone may make a problem statement,another person may elaborate on the problem, another maypresent a potential solution, followed by another proposing anew idea. In this case, video-recorded interactions is probablythe easiest way to observe the movement from person to per-son, though some audio recording setups will allow for cap-turing this information (see also Dent, Brown, Dowsett,Tattersall, & Butow, 2005; Nicolai, Demmel, & Farsch,2010). Note that one concern of research in this manner ishow the video camera may change behavior, simply by beingin the room. Previous research, however, shows that partici-pants who are advised to ignore the camera fall into theirregular routine, as indicated by behaviors such as telling jokes,or criticizing absent supervisors (e.g., Lehmann-Willenbrock& Kauffeld, 2010; see also Coleman, 2000; Herzmark, 1985;Penner, Orom, Albrecht, Franks, Foster, & Ruckdeschel,2007). The positioning of the camera as well as the qualityof the video/audio should also be considered when makingdecisions on how to best capture the interactions.
Software Options
The third step in the process of doing temporal interactionresearch is selecting the appropriate software support. Itshould be noted that coding and analyzing interaction datadoes not necessarily have to be software-assisted. However,we highly recommend using professional software whenworking with video or audio data. This recommendation holdsfor our current example of studying team problem solvingbecause of the complexity and volume of data to be coded.There are several software options available on the market,such as The Observer XT software (Noldus, Trienes,Hendriksen, Jansen, & Jansen, 2000) or INTERACTsoftware(Mangold, 2010). Essentially, these software packages helpsegment a stream of behavior in a video or audio file intoindividual behavioral units, which can then be assigned a be-havioral code. Hence, a major benefit of this software-assistedcoding is the fact that it is no longer necessary to transcribe theverbal content of each person’s behavior on the video (oraudio) file. Instead, researchers can directly assign a behavior-al code such as Bproblem,^ Bsolution,^ or Bquestion^ to each
330 J Bus Psychol (2018) 33:325–344
behavior when it is cut out from the video stream. This facil-itates the quantification of qualitative content data, while pre-serving the temporal embeddedness of each behavior withinthe interaction flow. Note that this unitizing functionality ofsoftware such as INTERACT or The Observer XT is not anautomated process and a human coder is still required to hitthe Bstart^ and Bstop^ button and tell the software where to cutout each behavior from the video or audio file. In other words,the unitizing process is still largely dependent on human effort(a notable exception concerns cases where behavioral data canbe automatically annotated; we will return to such cases in ouroutlook section).
One more point needs to be made regarding inter-rater re-liability when using software to code live video. In this case,units are marked according to time rather than words. Thesmallest time units are usually frames per seconds; thus, it isnearly impossible for two coders to cut the video at the exactsame time. A common procedure here is to construct clearunitizing rules and to employ just one trained unitizer to iden-tify the units. Subsequently, other trained coders assign theseidentified units to a behavioral code from the coding scheme.Although this is an acceptable and useful procedure, there aretimes when unitizing and time segments are of interest to aresearch question. For example, one might be interested in themoment when a team’s atmosphere or general mood switched.
In this case, the timing of the units could be of interest indetermining at one point an independent rater indicates whenthe mood changed. Further, a flaw of this approach is theassumption that the trained unitizer is correct in the way thatthey unitize the data. At a minimum, a second trained unitizershould review the work of the other to ensure that the unitizingwas done effectively. Though it is impossible to get agreementin the truest statistical sense, a second unitizer can verify thatno behavioral units are inadvertently combined through slop-py unitizing or simply not hearing a statement by a quiet groupmember in the interaction stream.
Additionally, there are also newer and more advanced mea-sures to calculate inter-rater reliability so that, for example,coders can simultaneously unitize (i.e., cut into segments)and code streams of behavior (see Bakeman, Quera, &Gnisci, 2009, for an example). Bakeman et al. (2009) devel-oped the GSEQ software system (see Table 3) that allows thecalculation of agreement between raters when they both unit-ize and code independently. Thus, it is possible to get bothagreement in terms of unitizing as well as the coded behavior.However, it is possible in some cases to have agreement oncoded behavior and not on the unitizing. In this case, one mustinvestigate the source of the lack of agreement. Is it a functionof different unitizing strategies or simply an accumulation oftiny frames-per-second differences? Further, if coded behavior
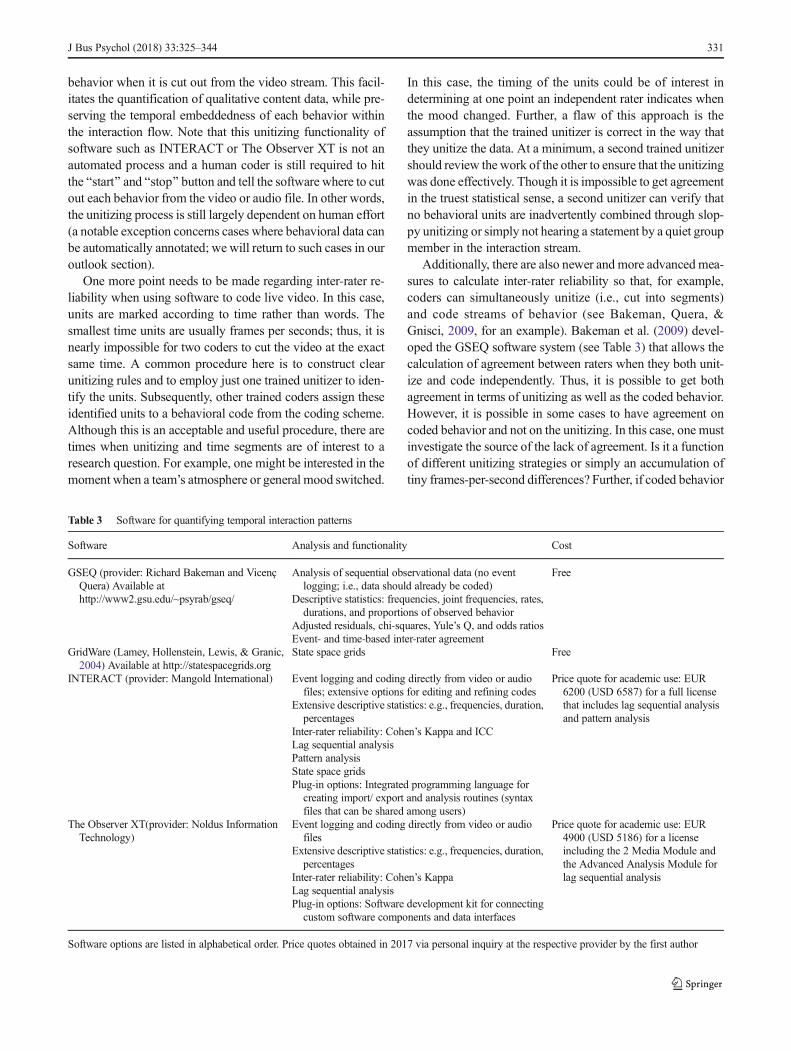
Table 3 Software for quantifying temporal interaction patterns
Software Analysis and functionality Cost
GSEQ (provider: Richard Bakeman and VicençQuera) Available athttp://www2.gsu.edu/~psyrab/gseq/
Analysis of sequential observational data (no eventlogging; i.e., data should already be coded)
Descriptive statistics: frequencies, joint frequencies, rates,durations, and proportions of observed behavior
Adjusted residuals, chi-squares, Yule’s Q, and odds ratiosEvent- and time-based inter-rater agreement
Free
GridWare (Lamey, Hollenstein, Lewis, & Granic,2004) Available at http://statespacegrids.org
State space grids Free
INTERACT (provider: Mangold International) Event logging and coding directly from video or audiofiles; extensive options for editing and refining codes
Extensive descriptive statistics: e.g., frequencies, duration,percentages
Inter-rater reliability: Cohen’s Kappa and ICCLag sequential analysisPattern analysisState space gridsPlug-in options: Integrated programming language for
creating import/ export and analysis routines (syntaxfiles that can be shared among users)
Price quote for academic use: EUR6200 (USD 6587) for a full licensethat includes lag sequential analysisand pattern analysis
The Observer XT(provider: Noldus InformationTechnology)
Event logging and coding directly from video or audiofiles
Extensive descriptive statistics: e.g., frequencies, duration,percentages
Inter-rater reliability: Cohen’s KappaLag sequential analysisPlug-in options: Software development kit for connecting
custom software components and data interfaces
Price quote for academic use: EUR4900 (USD 5186) for a licenseincluding the 2 Media Module andthe Advanced Analysis Module forlag sequential analysis
Software options are listed in alphabetical order. Price quotes obtained in 2017 via personal inquiry at the respective provider by the first author
J Bus Psychol (2018) 33:325–344 331
agreement is not achieved, standard categorical analysis pro-cedures for training and retraining coders should be followed(Krippendorff, 2004).
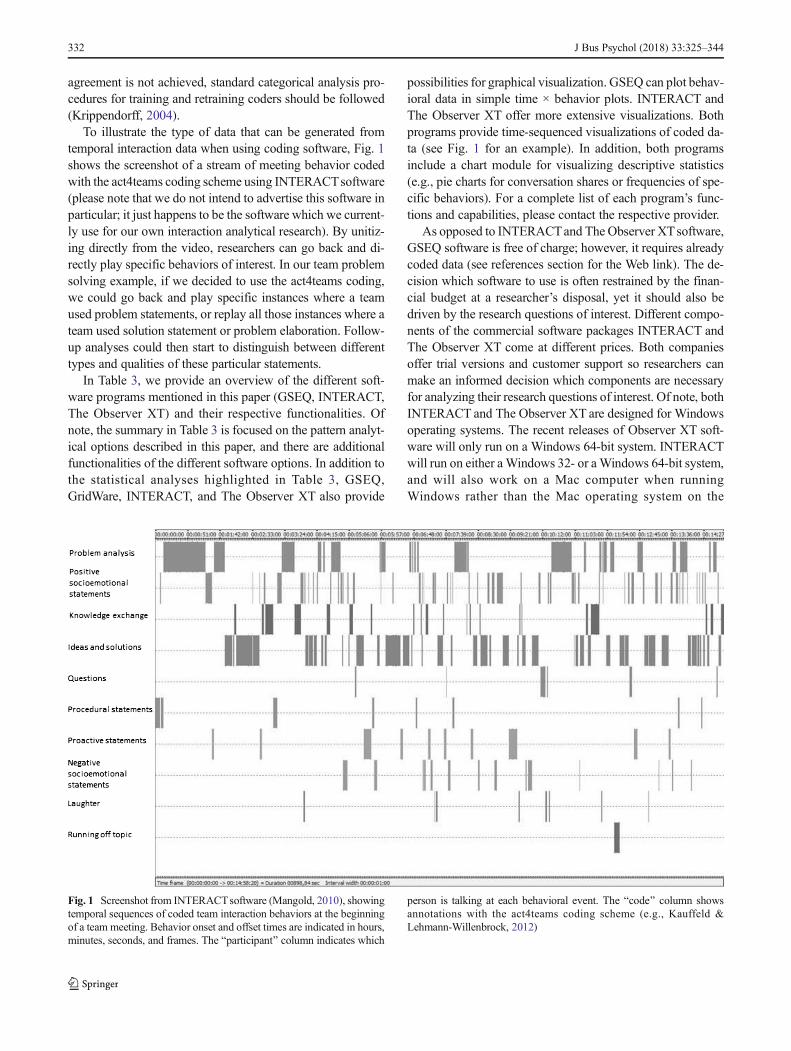
To illustrate the type of data that can be generated fromtemporal interaction data when using coding software, Fig. 1shows the screenshot of a stream of meeting behavior codedwith the act4teams coding scheme using INTERACTsoftware(please note that we do not intend to advertise this software inparticular; it just happens to be the software which we current-ly use for our own interaction analytical research). By unitiz-ing directly from the video, researchers can go back and di-rectly play specific behaviors of interest. In our team problemsolving example, if we decided to use the act4teams coding,we could go back and play specific instances where a teamused problem statements, or replay all those instances where ateam used solution statement or problem elaboration. Follow-up analyses could then start to distinguish between differenttypes and qualities of these particular statements.
In Table 3, we provide an overview of the different soft-ware programs mentioned in this paper (GSEQ, INTERACT,The Observer XT) and their respective functionalities. Ofnote, the summary in Table 3 is focused on the pattern analyt-ical options described in this paper, and there are additionalfunctionalities of the different software options. In addition tothe statistical analyses highlighted in Table 3, GSEQ,GridWare, INTERACT, and The Observer XT also provide
possibilities for graphical visualization. GSEQ can plot behav-ioral data in simple time × behavior plots. INTERACT andThe Observer XT offer more extensive visualizations. Bothprograms provide time-sequenced visualizations of coded da-ta (see Fig. 1 for an example). In addition, both programsinclude a chart module for visualizing descriptive statistics(e.g., pie charts for conversation shares or frequencies of spe-cific behaviors). For a complete list of each program’s func-tions and capabilities, please contact the respective provider.
As opposed to INTERACTand The Observer XTsoftware,GSEQ software is free of charge; however, it requires alreadycoded data (see references section for the Web link). The de-cision which software to use is often restrained by the finan-cial budget at a researcher’s disposal, yet it should also bedriven by the research questions of interest. Different compo-nents of the commercial software packages INTERACT andThe Observer XT come at different prices. Both companiesoffer trial versions and customer support so researchers canmake an informed decision which components are necessaryfor analyzing their research questions of interest. Of note, bothINTERACT and The Observer XT are designed for Windowsoperating systems. The recent releases of Observer XT soft-ware will only run on a Windows 64-bit system. INTERACTwill run on either aWindows 32- or aWindows 64-bit system,and will also work on a Mac computer when runningWindows rather than the Mac operating system on the
Fig. 1 Screenshot from INTERACTsoftware (Mangold, 2010), showingtemporal sequences of coded team interaction behaviors at the beginningof a team meeting. Behavior onset and offset times are indicated in hours,minutes, seconds, and frames. The Bparticipant^ column indicates which
person is talking at each behavioral event. The Bcode^ column showsannotations with the act4teams coding scheme (e.g., Kauffeld &Lehmann-Willenbrock, 2012)
332 J Bus Psychol (2018) 33:325–344
computer. Potential issues can be ruled out by obtaining ad-vice from the provider and making use of a free trial versionprior to deciding on a software solution.
Detecting Patterns of Behavior in TemporalInteractions
The fourth step of the process is to select a pattern analyticalmethod. That step begins by completing the coding and thendeciding how best to quantify the desired temporal patterns inthe data. We highlight three particular options here that haveincreasingly been applied in recent years: lag sequential anal-ysis, pattern analysis, and statistical discourse analysis.Importantly, each of these methods leads to quantitative out-put regarding emergent interaction patterns in social interac-tion data. This differentiates them from more descriptive,qualitative methods for analyzing interaction patterns suchas microethnography (e.g., Liu & Maitlis, 2014) or interpre-tive approaches (e.g., van Oortmerssen et al., 2015). In addi-tion, we discuss visualization techniques that are suitable forexploring interaction data, for example prior to selecting oneof the quantitative analytical methods for identifying interac-tion patterns. As we will elaborate below, the decision whichmethod to choose depends on the complexity of the interac-tion data at hand, as well as the study hypotheses or researchquestions of interest, respectively.
Data Complexity
Depending on the unitizing decisions when studying interac-tion processes as actual behaviors (see Table 2 for differentexamples), researchers tend to have very large data sets ontheir hands. This concerns both the dimensionality of the data(e.g., considering 44 types of team problem solving behaviors;Kauffeld & Lehmann-Willenbrock, 2012) and the number ofbehavioral events (e.g., 43,139 verbal behaviors in a sample ofteam meetings; Lehmann-Willenbrock et al., 2016). For oursample research question introduced earlier, we would likelywant 30 or so group interactions (e.g., teammeetings), in orderto pool data at the team level later, and in order to code using acomprehensive team decision-making coding scheme. Itshould be noted that we are essentially working with a multi-level model with individual behaviors being potentiallymapped onto group level interactive processes. Thus, recom-mendations for multilevel models apply (i.e., rules of thumbfor sample size; e.g., Maas & Hox, 2005).
Using a fine-grained coding scheme, observing a 1-h meet-ing of a single team and focusing on verbal behaviors (e.g., theact4teams coding scheme; Kauffeld & Lehmann-Willenbrock, 2012) typically already yields over a thousandbehaviors. At the team level, researchers easily have tens ofthousands of data points on their hands (e.g., Lehmann-
Willenbrock, Meinecke, Rowold, & Kauffeld, 2015). Evenmore data points result when researchers combine observa-tional methods such as coding the verbal communication withother observational tools, such as sensor badges for automat-ically detecting multimodal behavior (e.g., voice frequency,posture shifts, or gesture movements; for a discussion on com-bining such approaches, see Lehmann-Willenbrock et al.,forthcoming; Lewis, Zamith, & Hermida, 2013). Thus, whenchoosing how to analyze the data and which method to choosefor identifying possible interaction patterns, both the nestednature of the data and the sheer volume of data in the samplemust be considered.
Choosing an appropriate method for quantifyinginteraction patterns
As step four (i.e., selecting a pattern analytical method) un-folds, steps four and five merge a bit as the decision of theanalytical method leads directly to the running of analyses andinterpreting the results. We highlight three prominent methodsfor quantifying interaction patterns in social interaction datahere. The choice for each method should be guided by theresearch questions or hypotheses that a researcher wishes toexamine in the observed interaction data. Not all methods aresuitable for all research questions. Hence, guided by the re-search question(s), researchers need to consider which typesof interaction patterns they are interested in, which methodwould allow them to investigate these, and to what extent theirdata is suitable for the respective method. We provide exam-ples for each method as well as key decision points for eachmethod in the sections that follow. Table 4 summarizes thedifferent methods and indicates the types of research questionsthat can be addressed by each method. For a detailed critiqueof the benefits and shortcomings of various methods for iden-tifying temporal patterns in interaction data, we recommendChiu and Khoo (2005), Herndon and Lewis (2015), or Wallerand Kaplan (2016).
Lag Sequential Analysis
We begin our overview of available methods for quantifyingemergent interaction patterns with lag sequential analysis,which is perhaps the most intuitive approach to testing howbehaviors within an interaction stream influence one another.As summarized in Table 4, lag sequential analysis is suitablefor testing hypotheses about which specific behaviors triggerwhich other specific behaviors in the data. To do so, lag se-quential analysis provides information about whether ob-served behavioral sequences in the data are statisticallymeaningful.
For example, for the types of team interactions illustratedearlier in Fig. 1, we might test the hypothesis whether ques-tions trigger novel ideas within the temporal flow of team
J Bus Psychol (2018) 33:325–344 333
interactions. Lag sequential analysis (e.g., Bakeman & Quera,2011) determines whether a sequence of behavior that occursin an interaction data set is meaningful (i.e., above chance). Todo so, researchers first need to create a matrix that contains thefrequencies of all interaction sequences in the data (e.g., howmany times was the behavior Bquestion^ followed by Bnewidea^ overall in our data set). So-called first-order transitionsoccur where one statement directly follows the previous one(Lag1); second-order transitions occur when a statement isfollowed by the next-but-one statement (Lag2); and so forth.Separate matrices need to be created for each Lag. Next, wecan compute transition probabilities by dividing the cell fre-quencies by the cell sums. These probabilities indicate thelikelihood that a specific behavior (e.g., Bnew idea^) is trig-gered by a given behavior (e.g., Bquestion^) in the data.
Importantly, because transition probabilities are confound-ed with the base rates of the events that follow, a high transi-tion probability does not necessarily indicate an above chancetransition frequency. Moreover, some behaviors are typicallymuch more frequent than others, which means that a substan-tial number of coded events are typically required in order tomeaningfully interpret sequential analysis findings. The min-imum number of behavioral events depends on the number oflags under investigation as well as the number of observation-al codes contained in the coding scheme (see Bakeman &Gottman, 1986, p. 149, for a formula to calculate theminimum number of events).
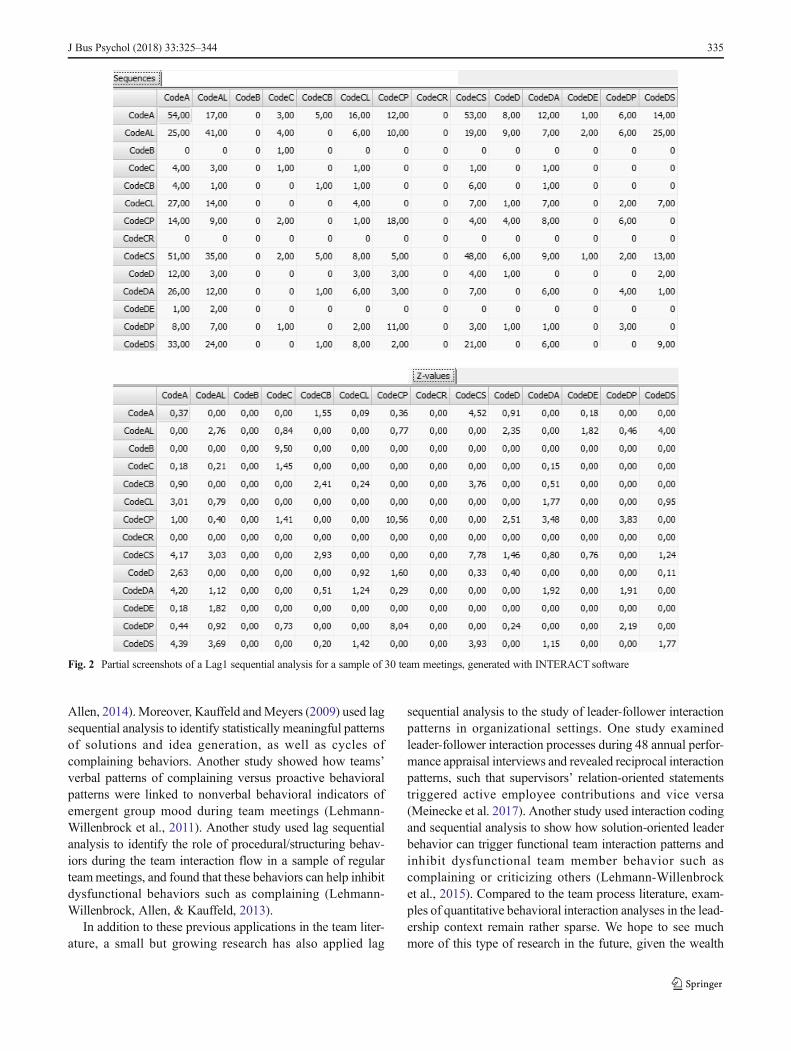
To examine whether the observed transition probabilities arestatistically meaningful, researchers can use the z-statistic as astatistical check (Bakeman & Gottman, 1997). Because this sta-tistic is based on the normal distribution, values higher than 1.96(or lower than −1.96) are statistically significant. Lag sequentialanalysis can be obtained as a component of INTERACT soft-ware or with The Observer XT. However, lag sequential analysiscan also be performed using the freely available software GSEQ(Bakeman & Quera, 2011). Data coded in INTERACT or TheObserver XT software can easily be converted into a GSEQ-compatible format (Bakeman & Quera, 2007). Figure 2 showsan example of a lag sequential analysis for a sample of 30 teammeetings (sampled from Lehmann-Willenbrock & Allen, 2014).The upper section shows the number of behavioral transitionsobserved for each pair of behavior in the data set (e.g.,BCodeCS^ is followed by BCodeA^ 51 times). The lower sec-tion shows the z values for each behavioral sequence. Any zvalue larger than 1.96 indicates statistical significance (e.g., thesequence BCodeCS^-BCodeA^ is a statistically significant se-quence; z = 4.17).
With a focus on specific behavioral linkages rather thangeneral pattern complexity or duration, several studies haveused lag sequential analysis to gain insights into team tempo-ral dynamics. For example, we showed that temporal patternsof humor and laughter in real organizational team meetingswere linked to higher team performance, both cross-sectionally and longitudinally (Lehmann-Willenbrock &
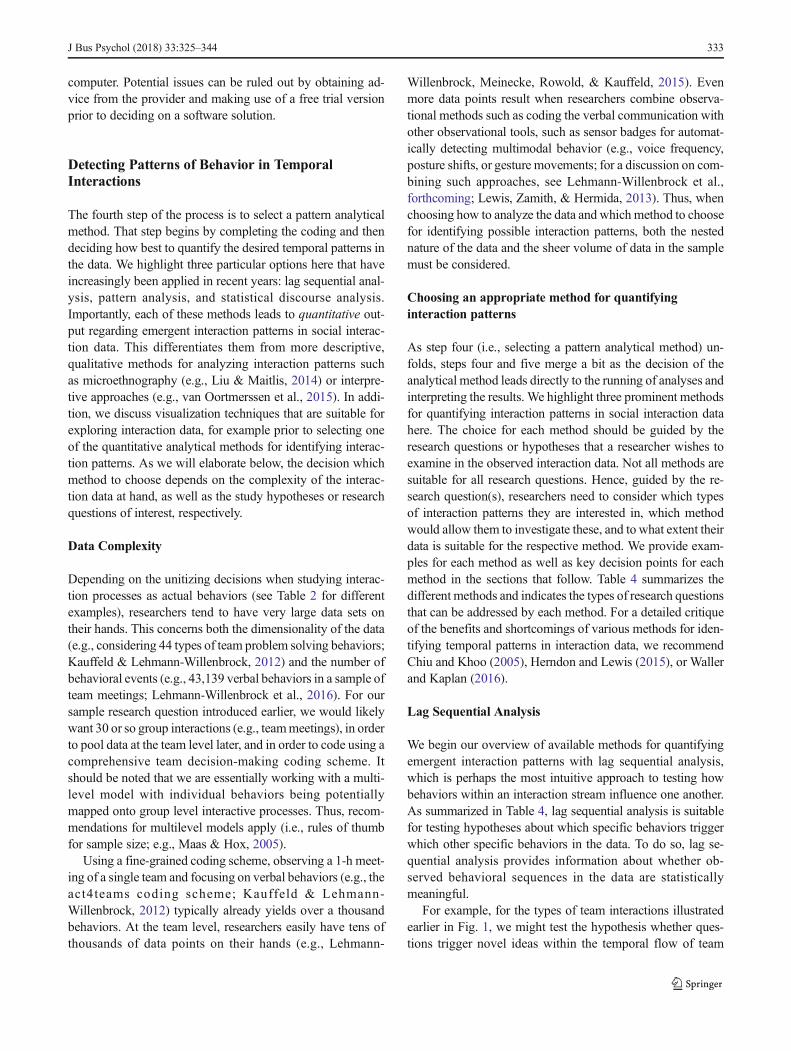
Table 4 Quantitative methods for analyzing temporal patterns in interaction data
Method Approach Types of research questions
Lag sequential analysis(e.g., Bakeman &
Quera, 2011)
Tests whether observed transitions between specificbehaviors in the data are statistically meaningful
Does behavior A trigger behavior B, C, or D?Which behaviors A, B, or C increase the likelihood for
behavior D?Which behaviors A, B, or C can inhibit behavior D?How do patterns or cycles of behaviors A, B, and C emerge in
the data?Who responds to whom?How does social influence emerge, based on speakers’
reactions to one another?
Pattern analysis(e.g., Magnusson,
2000)
Detects non-obvious or hidden temporal patterns among be-haviors
Which behaviors are temporally related to one another (that donot necessarily follow one another immediately in time)?
Which clusters of temporally connected behaviors emerge fromthe data?
How complex are the detected interaction patterns?
Statistical discourseanalysis
(e.g., Chiu &Lehmann-Willenbro-ck, 2016)
Dynamic multilevel, time-series modeling of (1) pivotal ac-tions that create breakpoints, (2) effects of previous actionson target actions, and (3) influences at multiple levels(conversation turn, time period, individual, group,organization, etc.)
Which behaviors radically change subsequent interactionprocesses, creating breakpoints and different time periods inthe observed interaction data?
How do recent behaviors affect the likelihoods of specificactions at each given turn of talk (or utterance or episode,etc.)?
How do multilevel explanatory variables (e.g., individualdispositions and attitudes or team context variables) affectthe likelihoods of specific behaviors? How does the strengthof these explanatory links change over time?
334 J Bus Psychol (2018) 33:325–344
Allen, 2014). Moreover, Kauffeld andMeyers (2009) used lagsequential analysis to identify statistically meaningful patternsof solutions and idea generation, as well as cycles ofcomplaining behaviors. Another study showed how teams’verbal patterns of complaining versus proactive behavioralpatterns were linked to nonverbal behavioral indicators ofemergent group mood during team meetings (Lehmann-Willenbrock et al., 2011). Another study used lag sequentialanalysis to identify the role of procedural/structuring behav-iors during the team interaction flow in a sample of regularteammeetings, and found that these behaviors can help inhibitdysfunctional behaviors such as complaining (Lehmann-Willenbrock, Allen, & Kauffeld, 2013).
In addition to these previous applications in the team liter-ature, a small but growing research has also applied lag
sequential analysis to the study of leader-follower interactionpatterns in organizational settings. One study examinedleader-follower interaction processes during 48 annual perfor-mance appraisal interviews and revealed reciprocal interactionpatterns, such that supervisors’ relation-oriented statementstriggered active employee contributions and vice versa(Meinecke et al. 2017). Another study used interaction codingand sequential analysis to show how solution-oriented leaderbehavior can trigger functional team interaction patterns andinhibit dysfunctional team member behavior such ascomplaining or criticizing others (Lehmann-Willenbrocket al., 2015). Compared to the team process literature, exam-ples of quantitative behavioral interaction analyses in the lead-ership context remain rather sparse. We hope to see muchmore of this type of research in the future, given the wealth
Fig. 2 Partial screenshots of a Lag1 sequential analysis for a sample of 30 team meetings, generated with INTERACT software
J Bus Psychol (2018) 33:325–344 335
of opportunities inherent in such analyses, and the relativelyeasy interpretation of lag sequential analysis in terms of im-mediate behavioral triggers and/or inhibitors.
Pattern Analysis
Pattern analysis is essentially a data mining technique that canidentify Bhidden^ behavioral patterns, and as such is particu-larly suitable when researchers do not have a priori hypothesesabout which specific behaviors will follow which other spe-cific behaviors. As summarized in Table 4, pattern analysis issuitable for investigating exploratory research questions aboutnon-obvious or hidden temporal patterns among behaviors.Whereas lag sequential analysis is suitable for testing hypoth-eses about specific behavioral linkages, pattern analysis takesa more holistic view and searches for patterns that are notobvious by merely looking at the data (Aldenderfer &Blashfield, 1984; Romesburg, 1984). As such, pattern analy-sis is a helpful exploratory method for detecting temporalpatterns of behavior that are less Bclean^ than the immediatesequences of behavior that are typically examined by meansof lag sequential analysis (seeMagnusson, 2004, for a detaileddiscussion of the distinction between obvious versus hiddenpatterns). In other words, pattern analysis may reveal mean-ingful temporal connections between behaviors that areinterrupted by (sometimes multiple) other behaviors. Thiswould not be possible with the typical lag sequential ap-proach, which looks for connections between behaviors thatare adjacent (lag1) or at least close (lag2, lag3, etc.) to oneanother within the interaction stream.
Researchers can choose to set several parameters in orderto guide the overall pattern detection process. For example,previous research using pattern analysis has focused only onthose patterns that occur at least three times within an interac-tion, or to only highlight a pattern if the probability that itoccurred above chance in the data is at least 95% (e.g.,Sohrab, 2014). Such decisions can be necessary when pattern
analysis would otherwise yield too many patterns to allowmeaningful interpretation of the data.
In terms of current and up-to date software, pattern analysiscan also be conducted using the p.a.t.t.e.r.n component inINTERACT software (Mangold, 2010; see Meinecke &Lehmann-Willenbrock, 2015, for a detailed application exam-ple). Similar to Magnusson’s (2000) earlier work, this methodaccounts for the temporal order, duration, and relative positionof behavioral events. The underlying algorithm is based onWard’s cluster analysis method (e.g., Aldenderfer &Blashfield, 1984; Romesburg, 1984). Starting with each typeof behavior in its own cluster, the algorithm continues tomerge clusters until it reaches one cluster that contains allcoded behaviors. The first cluster is based on cases with thelowest squared Euclidean distance. While gradually addingcases to each cluster, the algorithm tracks the average similar-ity of the emerging cluster, first merging cases that increasethe sum of squared deviations within a cluster. The emergedclusters are ordered according to the relation strength of eachbehavioral pattern.
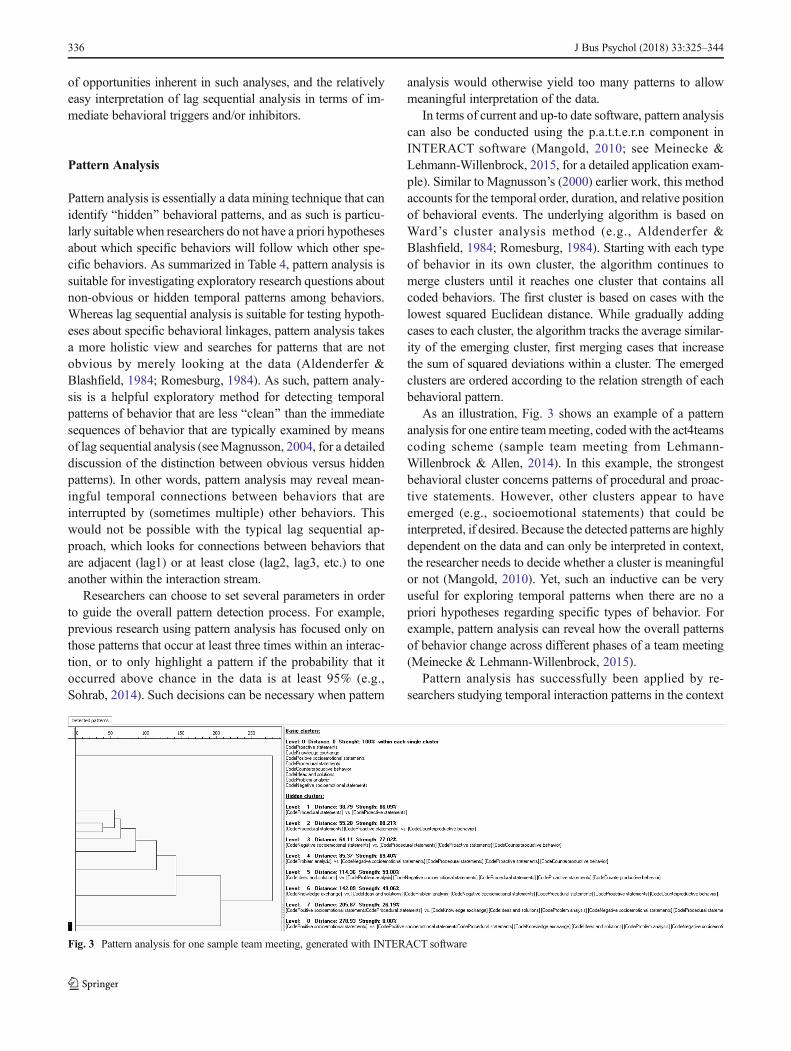
As an illustration, Fig. 3 shows an example of a patternanalysis for one entire teammeeting, codedwith the act4teamscoding scheme (sample team meeting from Lehmann-Willenbrock & Allen, 2014). In this example, the strongestbehavioral cluster concerns patterns of procedural and proac-tive statements. However, other clusters appear to haveemerged (e.g., socioemotional statements) that could beinterpreted, if desired. Because the detected patterns are highlydependent on the data and can only be interpreted in context,the researcher needs to decide whether a cluster is meaningfulor not (Mangold, 2010). Yet, such an inductive can be veryuseful for exploring temporal patterns when there are no apriori hypotheses regarding specific types of behavior. Forexample, pattern analysis can reveal how the overall patternsof behavior change across different phases of a team meeting(Meinecke & Lehmann-Willenbrock, 2015).
Pattern analysis has successfully been applied by re-searchers studying temporal interaction patterns in the context
Fig. 3 Pattern analysis for one sample team meeting, generated with INTERACT software
336 J Bus Psychol (2018) 33:325–344
of team performance. In particular, Zijlstra et al. examined theinteraction of swift-starting aviation teams in a flight simulatorand found that early interaction patterns were linked to teameffectiveness (Zijlstra et al., 2012). Teams who showed higherperformance had temporal patterns that were more reciprocal,more stable in duration, and more stable in complexity thanthose of the less effective teams. Hence, for the context ofswift-starting teams, their findings point to the relevance ofthe first moments of interaction. Similarly, findings from nu-clear plant teams during a crisis simulation showed distinctdifferences in the temporal interaction patterns of high versuslow performing teams (Stachowski, Kaplan, & Waller, 2009).Moreover, a recent study on airline crews in a flight simulatorhighlights the role of different interaction patterns for teamperformance during routine versus non-routine work situa-tions, such that successful teams show more in-process plan-ning behavior patterns during routine versus non-routine situ-ations (but only up to a point, i.e., U-shaped relationship be-tween planning behavior patterns and performance; Lei,Waller, Hagen, & Kaplan, 2016).
Statistical Discourse Analysis
Lag sequential analysis and pattern analysis detect linkagesbetween behaviors, and consider previous behaviors withinthe interaction stream as predictors for future behaviors.However, the occurrence of a particular behavior at any givenpoint in an interaction can also be due to other explanatoryfactors, such as individual speaker characteristics or charac-teristics of the social context in which the interaction occurs.As summarized in Table 4, statistical discourse analysis (SDA;e.g., Chiu, 2008; Chiu & Lehmann-Willenbrock, 2016) is aninnovative method for quantifying these different types ofinfluences on behavior within interactions. For example,imagine that in addition to the team interaction data illustratedin Fig. 1, you have also gathered survey data on differentcharacteristics of the team members (e.g., demographic data,a personality measure, and a team climate survey).Hypotheses regarding the likelihood of contributing a newidea might now become more complex. In addition to previ-ous behaviors within the interaction stream (e.g., questions),idea occurrences could also depend on the organizational ten-ure of the speaker, on the speaker’s level of extraversion, andon the climate for innovation at the team level. Moreover,there may be several effects of time, such that (1) ideas aregenerally more likely in later phases of the conversation, (2)the explanatory value of personality for idea occurrences isstronger in earlier phases of the conversation, and (3) the effectof preceding questions is significant at Lag3 prior to the ideaoccurrence, but not at Lags 1 and 2. Such complex explana-tory models require sophisticated statistical models that canincorporate time-series analysis and multilevel modeling.
SDA can address this need as well as overcome a numberof shortcomings of earlier methods such as lag sequentialanalysis. Yet, it is not always the preferred method; rather, aswith the previously discussed methods, the decision for oragainst SDA should be guided by the research question(s).SDA should be considered when a research question aboutinteraction patterns requires the inclusion of predictors notonly at the behavioral event level (i.e., lag sequential or patternanalysis), but also at multiple other levels.
SDA deals with challenges involving data, dependent var-iables, and explanatory variables and has been applied to anumber of different interaction contexts (for an overview,see Chiu & Lehmann-Willenbrock, 2016). Rather thanpredicting behavior only by preceding behavior at differentlags (cf. lag sequential analysis or pattern analysis), SDAcan simultaneously model the influence of multilevel explan-atory variables on behavior. For example, when predicting thelikelihood of positivity behavior in team interactions, thismethod can simultaneously model the effects of prior problemand solution statements, prior positivity statements, turn-taking behavior, interaction effects between these differentvariables, the overall discussion share of each individual,and the company to which each observed team belonged(Lehmann-Willenbrock et al., 2016). A way to think of thismethod is to imagine that each coded behavior is accompaniedby all of the variables that are attached to each speaker (e.g.,surrounding time period; individual demographics, personali-ty, work attitudes; team level characteristics such as team size;or organization-level characteristics). Hence, each behavioralsequence (i.e., what behavior B follows a given behavior A?)can be predicted by the preceding behavior A (at differentlags) and/or by explanatory variables at higher levels (e.g.,time period, individual, team, organization).
In addition to painting a more comprehensive picture ofdifferent influences on behavior within temporal interactions,SDA also shows how much variance is explained at eachlevel. For example, in the study on positivity in team interac-tions, individual characteristics and the surrounding organiza-tion only accounted for 8% of the variance in observed posi-tivity (Lehmann-Willenbrock et al., 2016), which again un-derscores the need to move away from static individual-levelresearch and toward temporal behavioral processes. Due tospace limitations, we will not elaborate on the statistical de-tails of this method here, but we strongly encourage organiza-tional researchers who are interested in combining explanato-ry variables at the behavioral interaction level with explanato-ry variables obtained from individual, dyad, or team surveyvariables to consider this approach.
In sum, the choice of method for modeling temporal pat-terns of behavior (e.g., lag sequential analysis, pattern analy-sis, or SDA) should always be driven by the research questionat hand. SDA has a number of advantages and allows simul-taneous modeling of multilevel influences on behavior within
J Bus Psychol (2018) 33:325–344 337
an interaction stream. Yet, this method also requires substan-tial computational effort. For simpler hypotheses regardingpatterns of behavior and influences of prior behaviors ratherthan individual/team/other context characteristics, simplermethods are suitable and often easier to implement.
Visualization Techniques
In addition to the quantitative methods outlined above, thereare a number of techniques for visualizing interaction patterns.These can be helpful for exploring trends in the data prior toconducting quantitative hypothesis testing, and often also in-clude possibilities to quantify the visual information. With afocus on tools for facilitating pattern recognition, we highlighttwo visualization techniques here. First, recurrence plots illus-trate those points in time where a system revisits an earlierstate (Marwan, 2008; Marwan, Romano, Thiel, & Kurths,2007).When applied to temporal interaction data, a recurrenceplot is a graphic representation of the square matrix of thosetimes when a behavioral state reoccurred in the interaction(e.g., once a problem statement occurred, when does the in-teraction move to another problem statement). The columnsand rows in the matrix represent a specific pair of behaviors(e.g., problem–problem).
The hidden patterns and nonlinearities that can be detectedusing recurrence plots can also be quantified (i.e., recurrencequantification analysis; for different quantification optionsand measures, see Marwan, 2016). A discussion of recurrencequantification in the context of social interaction data can befound in Gorman, Cooke, Amazeen, and Fouse (2012) as wellas Knight, Kennedy, and McComb (2016). There is freelyavailable software for conducting this type of analysis on cod-ed temporal interaction data (e.g., Belaire-Franch, Contreras,& Tordera-Lledó, 2002; for an overview of freely availableand commercial software options, see Marwan, 2016).Moreover, the basic principle of mapping recurrent behaviorscan also be applied to recurrent behavioral sequences (e.g.,problem–solution) rather than recurrences of singular behav-iors (Quera, 2008).
A second option for visualizing interaction patterns con-cerns state space grids. This method visualizes the relation-ship between two behaviors that are synchronized in time(Lewis, Lamey, & Douglas, 1999). State space grids can begenerated using an analysis package in INTERACT softwareor by means of GridWare, which is freely available for down-load (Lamey et al., 2004) and also compatible with Noldus’The Observer software.
In the context of social interactions, state space grids are ahelpful tool for visualizing dependencies among simulta-neously coded data. Simultaneous coding means that a behav-ior is associated with several codes. For instance, this wouldbe the case when considering co-occurrences of specificspeakers and specific behaviors, such as the dependency of
the behavior BQuestion^ on speaker BA^ in our earlier exam-ple shown in Fig. 1.
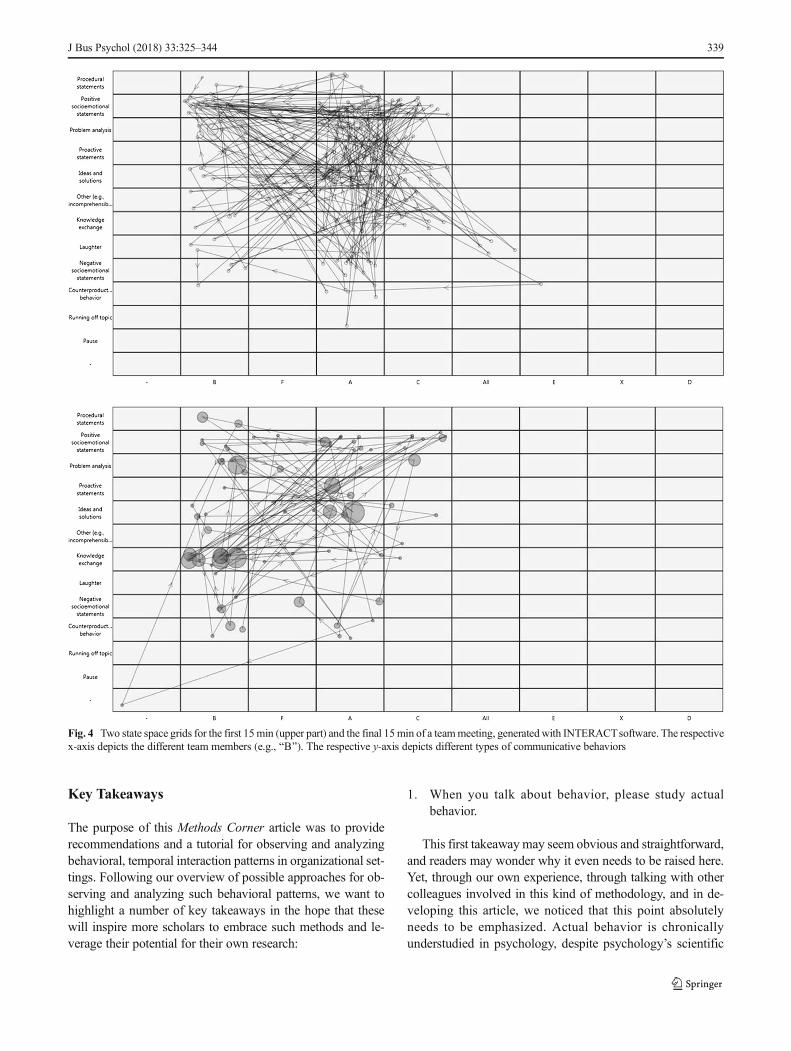
To illustrate what such a state space grid might look like,we provide an example generated from one team meeting inFig. 4 which was coded with the act4teams coding scheme(sample taken from an earlier data set, Lehmann-Willenbrock & Allen, 2014). The upper section of Fig. 4plots the interaction behavior exhibited by each team mem-ber (e.g., BB^) during the first 15 min of this meeting. Thelower section of Fig. 4 shows the interaction behavior byeach team member during the last 15 min of the same meet-ing. As illustrated by these two state space grids, the inter-action behavior of this team changed considerably over thecourse of their meeting. For example, whereas team memberB showed a range of behaviors with a focus on problemanalysis statements early in the meaning, he spends mostof his conversation shares on knowledge exchange later onin the meeting. Moreover, the different state space grids forthe different time periods within the meeting showcase howconversation shares as well as the overall behavioral config-uration in this team shifted over time.
The trajectories plotted on state space grids can also bequantified for hypothesis testing (Hollenstein, 2013). For ex-ample, one study used state space grids to examine coach-athlete interactions and found significant differences in inter-action variability, behavioral patterns, and the sequencing ofcoach behaviors in high- versus low-performing sports teams(Erickson, Côté, Hollenstein, & Deakin, 2011). We can onlyspeculate what such applications might look like in organiza-tional settings at this point. However, future research on inter-actions in organizational teams might utilize state space gridsto visualize the interaction dynamics in high- versus low-performing teams. Moreover, state space grids can be usedto visualize lagged events, which can facilitate interpretationof other pattern detection approaches such as lag sequentialanalysis (see also Meinecke & Kauffeld, 2016).
Exploratory visualization methods such as recurrence plotsor state space grids can be very helpful for tackling theBbigness^ of interaction analytical data, which we elaboratedon earlier. They can provide ways to explore this rich data innon-intuitive ways that would otherwise not be accessible tothe human eye. In the ideal case, such visualization methodscan then pave the way for novel research questions, whichreflects an inductive research paradigm (for a discussion ofthe benefits of inductive research, see Spector, Rogelberg,Ryan, Schmitt, & Zedeck, 2014). Insights from this inductivephase that are channeled into a priori hypotheses can later betested deductively with quantitative pattern analyticalmethods (such as pattern analysis, lag sequential analysis, orSDA). Combining these different approaches means reapingthe benefits of both inductive and deductive research, with thegoal of maximizing research insights obtained from temporalinteraction data.
338 J Bus Psychol (2018) 33:325–344
Key Takeaways
The purpose of this Methods Corner article was to providerecommendations and a tutorial for observing and analyzingbehavioral, temporal interaction patterns in organizational set-tings. Following our overview of possible approaches for ob-serving and analyzing such behavioral patterns, we want tohighlight a number of key takeaways in the hope that thesewill inspire more scholars to embrace such methods and le-verage their potential for their own research:
1. When you talk about behavior, please study actualbehavior.
This first takeawaymay seem obvious and straightforward,and readers may wonder why it even needs to be raised here.Yet, through our own experience, through talking with othercolleagues involved in this kind of methodology, and in de-veloping this article, we noticed that this point absolutelyneeds to be emphasized. Actual behavior is chronicallyunderstudied in psychology, despite psychology’s scientific
Fig. 4 Two state space grids for the first 15min (upper part) and the final 15min of a teammeeting, generatedwith INTERACTsoftware. The respectivex-axis depicts the different team members (e.g., BB^). The respective y-axis depicts different types of communicative behaviors
J Bus Psychol (2018) 33:325–344 339
aim to explain human behavior (for a detailed critique, seeBaumeister et al., 2007). As we searched for examples toinclude in our paper, we were surprised to find an abundanceof paper titles and abstracts indicating the study of Bfieldsamples,^ Bactual behavior,^ and Btemporal interaction data^that nevertheless relied on student samples, reports of behav-ior, and static rather than temporal measures. Although thereare some great examples of rigorous temporal interaction dataand analysis, we recommend caution when searching the fieldfor examples to follow and consider the criteria put forth inthis methods corner when proceeding to engage in this type ofresearch.
Organizational psychology is no exception to the generalcriticism of lacking behavioral research (Baumeister et al.,2007), as the vast majority of empirical work continues to relyon survey methodology that captures proxies of employeebehavior, rather than observing actual behavior (e.g.,Carpenter, Berry, & Houston, 2014; Fida, Paciello,Tramontano, Fontaine, Barbaranelli, & Farnese, 2015;Kehoe & Wright, 2013; Petrou, Demerouti, & Schaufeli,2016). Although proxies or interpretations of employee be-havior are important and an entire epistemology within psy-chology and the organizational sciences relies upon these ap-proaches (i.e., survey studies and the cognitive psychologytradition; Gardner, 2008), in many cases, the visible/audiblebehavior is closer to the phenomenon of interest (Baumeisteret al., 2007).
For example, when studying participation in decision-mak-ing, the observed behavior (i.e., frequency of statements in agroup context) may vary greatly from the post hoc feeling ofsuch behavior (i.e., retrospective perceptions of participationof decision-making). Additionally, rather than relying on asingle individual’s interpretation, the approaches describedhere require multiple raters to rate the actual behavior and thatthose raters agree. Yet, the field is clearly moving towardembracing more behavioral research and accounting for thetemporal dynamics that characterize many interaction phe-nomena in the workplace. The outlook for modeling temporalinteraction dynamics in organizational settings is bright, butseveral issues must be considered in order for scholars tomove forward from the continued calls for such research(e.g., Kozlowski, 2015).
2. Start embracing available methods rather than(repeatedly) calling for future research endeavors for in-vestigating interaction patterns.
Second, scholars should acknowledge and build upon thealready existing studies that use the methods and toolsdiscussed in this methods corner. A number of researchersand scholars have been using dynamic social interactionanalysis techniques for quite a few years, particularly inresearch on team processes but increasingly also when
considering leader-follower dynamics in organizations (e.g.,Kolbe et al., 2014; Lei et al., 2016; Meinecke et al., 2017).These studies provide a nice base from which researchersnew to these methods can draw considerable methodologicaladvice and guidance as they study new areas using similarmethods. Yet, scholars need to take active steps in thisregard.
Today’s graduate students are tomorrow’s methodo-logical innovators. One way to embrace availablemethods for observing and analyzing interaction patternsthen concerns finding ways to include such methods ingraduate student curricula. For example, many graduateprograms in the organizational sciences offer a groupdynamics class, either as a requirement or as an option-al seminar course. Including temporal dynamic interac-tion analysis and processes as part of that course seemsa meaningful place to initiate interest among graduatestudents. Additionally, as graduate students increasetheir interest in studying groups/teams, encouragingthem to consider dynamic temporal interactions willhelp introduce the methodology to them and others in-volved with their projects. Further, for researchers al-ready studying groups and teams, simply adding a cam-era, strategically placed in the lab or team meetingroom, will provide an easy way to get the very dataneeded by students to begin doing temporal dynamicresearch. Further, it should be noted that the Societyfor Industrial and Organizational Psychology’s recentguidelines update included BGroups and Teams^ as acore content domain thereby encouraging the trainingof future organizational scientists who have a level ofcompetence in this domain. Thus, including methodolo-gies at the forefront of the study of groups and teamswill help students prepare for their future careers.
3. Observe and analyze interaction patterns among em-ployees in the field.
Third, many current research efforts using temporal inter-action data and analyses rely on laboratory or simulation data.Although lab settings are excellent contexts for capturing thiskind of data in a controlled context, field research in lesscontrolled contexts is needed. For example, lab research onleadership in team meetings using students ultimately cannotmove beyond proxies for the actual organizational context ofinterest where more high-stakes decisions and interactions oc-cur. We acknowledge that field research is complicated andthat only increases when seeking to gather more comprehen-sive data, like audio or video. However, we see the benefits asgreatly outweighing the effort and hope that scholars will con-tinue advance the science by building partnerships with orga-nizations that will allow such field research (see also Rosen,Wildman, Salas, & Rayne, 2012).
340 J Bus Psychol (2018) 33:325–344
4. As a journal editor or reviewer, be open to novelmethodologies.
Fourth, a pragmatic issue associated with this type of re-search is encouraging journal reviewers and editors to be moreopen to methods that they are not personally familiar with andallow for such methods to push the field forward. Naturally,this point is not limited to the use of behavioral observationmethods and pattern analytical methodology but rather appliesmore broadly. Although researchers are beginning to investi-gate phenomena with temporal interaction data and analyses,many editors and reviewers are not familiar with these proce-dures, making the review process particularly difficult. Timeand persistence on the part of the researchers to push theirresearch using behavioral micro-processes in organizationswill help to resolve this, but a greater empathy and consider-ation toward these types of methods would certainly assist inadvancing the science.
5. Seek out interdisciplinary collaborations.
In addition to these issues, researchers aiming tomodel temporal interaction processes in organizationsshould really embrace interdisciplinary collaborations tomove the methods and their own field of inquiry for-ward. For example, organizational psychologists shouldtalk to communication scholars, who are experts at de-fining and studying phenomena at the micro-level and atobserving real interactions (for an overview, see Keyton,2017). Statisticians who are experts in connecting tem-poral interaction data to more static individual or teamlevel variables are needed, particularly those who canhandle big data sets and the associated multilevelmodels. Finally, looking beyond the traditional socialsciences (e.g., psychology, communication, management,and sociology) and seeking out active collaborationpartnerships with computer scientists who are expertsat automatized behavior detection is where the fieldneeds to push next (see also Lehmann-Willenbrock,Hung, & Keyton, in press; Waller & Kaplan, 2016).
In sum, our hope is that more researchers studyinggroups, teams, and leadership in organizations will be in-spired to investigate phenomena of interest as they emergethrough dynamic temporal and social interaction wherereal observed behavior is captured. The methods describedhere are powerful tools for truly leveraging such data.
Open Access This article is distributed under the terms of the CreativeCommons At t r ibut ion 4 .0 In te rna t ional License (h t tp : / /creativecommons.org/licenses/by/4.0/), which permits unrestricted use,distribution, and reproduction in any medium, provided you give appro-priate credit to the original author(s) and the source, provide a link to theCreative Commons license, and indicate if changes were made.
References
Aggarwal, I., &Woolley, A.W. (2013). Do you see what I see? The effectof members’ cognitive styles on team processes and errors in taskexecution. Organizational Behavior and Human DecisionProcesses, 122, 92–99. doi:10.1016/j.obhdp.2013.04.003.
Agnew, C. R., Carlston, D. E., Graziano, W. G., & Kelly, J. R. (2009).Then a miracle occurs: Focusing on behavior in social psycholog-ical theory and research. New York: Oxford University Press.
Aldenderfer, M. S., & Blashfield, R. K. (1984). Cluster analysis. BeverlyHills, CA: Sage Press.
Bakeman, R., & Gottman, J. M. (1986). Observing interaction: An intro-duction to sequential analysis (1st ed.). New York: CambridgeUniversity Press.
Bakeman, R., & Gottman, J. M. (1997). Observing interaction: An intro-duction to sequential analysis (2nd ed.). New York: CambridgeUniversity Press.
Bakeman, R., & Quera, V. (2008). ActSds and OdfSds: Programs forconverting INTERACT and the observer data files into SDIStimed-event sequential data files. Behavior Research Methods, 40,869–872. doi:10.3758/BRM.40.3.869.
Bakeman, R., & Quera, V. (2011). Sequential analysis and observationalmethods for the behavioral sciences. New York, NY: CambridgeUniversity Press.
Bakeman, R., Quera, V., & Gnisci, A. (2009). Observer agreement fortimed-event sequential data: A comparison of time-based and event-based algorithms. Behavior Research Methods, 41, 137–147.
Bales, R. F. (1950). Interaction process analysis: A method for the studyof small groups. Chicago, IL: University of Chicago Press.
Barsade, S. G. (2002). The ripple effect: Emotional contagion and itsinfluence on group behavior. Administrative Science Quarterly, 47,644–675. doi:10.2307/3094912.
Barsade, S. G., & Knight, A. P. (2015). Group affect. Annual Review ofOrganizational Psychology and Organizational Behavior, 2, 21–46.doi:10.1146/annurev-orgpsych-032414-111316.
Baumeister, R. F., Vohs, K. D., & Funder, D. C. (2007). Psychology as thescience of self-reports and finger movements: Whatever happenedto actual behavior? Perspectives on Psychological Science, 2, 396–403. doi:10.1111/j.1745-6916.2007.00051.x.
Belaire-Franch, J., Contreras, D., & Tordera-Lledó, L. (2002). Assessingnonlinear structures in real exchange rates using recurrence plotstrategies. Physica D: Nonlinear Phenomena, 171, 249–264. doi:10.1016/S0167-2789(02)00625-5.
Bliese, P. D., Maltarich, M. A., & Hendricks, J. L. (2017). Back to basicswith mixed-effects models: Nine take-away points. Journal ofBusiness and Psychology. Advance online publication. doi:10.1007/s10869-017-9491-z.
Bonito, J. A., & Sanders, R. E. (2011). The existential center of smallgroups: Members' conduct and interaction. Small Group Research,42, 343–358. doi:10.1177/1046496410385472.
Carpenter, N. C., Berry, C. M., & Houston, L. (2014). A meta-analyticcomparison of self-reported and other-reported organizational citi-zenship behavior. Journal of Organizational Behavior, 35, 547–574.doi:10.1002/job.1909.
Chiu, M. M. (2000). Group problem solving processes: Social interac-tions and individual actions. Journal for the Theory of SocialBehavior, 30, 27–50. doi:10.1111/1468-5914.00118.
Chiu, M. M. (2008). Flowing toward correct contributions during groupproblem solving: A statistical discourse analysis. The Journal of theLearning Sciences, 17, 415–463. doi:10.1080/10508400802224830.
Chiu, M. M., & Khoo, L. (2005). A new method for analyzing sequentialprocesses: Dynamic multilevel analysis. Small Group Research, 36,600–631. doi:10.1177/104649405279309.
Chiu, M. M., & Lehmann-Willenbrock, N. (2016). Statistical discourseanalysis: Modeling sequences of individual behaviors during group
J Bus Psychol (2018) 33:325–344 341
interactions across time. Group Dynamics: Theory, Research, andPractice, 20, 242–258. doi:10.1037/gdn0000048.
Coleman, T. (2000). Using video-recorded consultations for research inprimary care: Advantages and limitations.Family Practice, 17, 422–427. doi:10.1093/fampra/17.5.422.
Cronin, M. A., Weingart, L. R., & Todorova, G. (2011). Dynamics ingroups: Are we there yet? The Academy of Management Annals, 5,571–612. doi:10.1080/19416520.2011.590297.
Dawson, J. F. (2014). Moderation in management research: What, why,when, and how. Journal of Business and Psychology, 29, 1–19. doi:10.1007/s10869-013-9308-7.
Dent, E., Brown, R., Dowsett, S., Tattersall, M., & Butow, P. (2005). TheCancode interaction analysis system in the oncological setting:Reliability and validity of video and audio tape coding. PatientEducation and Counseling, 56, 35–44. doi:10.1016/j.pec.2003.11.010.
DeRue, D. S. (2011). Adaptive leadership theory: Leading and followingas a complex adaptive process. Research in OrganizationalBehavior, 31, 125–150. doi:10.1016/j.riob.2011.09.007.
Detert, J. R., & Burris, E. R. (2007). Leadership behavior and employeevoice: Is the door really open? Academy of Management Journal,50, 869–884. doi:10.5465/AMJ.2007.26279183.
Dinh, J. E., Lord, R. G., Gardner, W. L., Meuser, J. D., Liden, R. C., &Hu, J. (2014). Leadership theory and research in the new millenni-um: Current theoretical trends and changing perspectives. TheLeadership Quarterly, 25, 36–62. doi:10.1016/j.leaqua.2013.11.005.
Erickson, K., Côté, J., Hollenstein, T., & Deakin, J. (2011). Examiningcoach–athlete interactions using state space grids: An observationalanalysis in competitive youth sport. Psychology of Sport andExercise, 12, 645–654. doi:10.1016/j.psychsport.2011.06.006.
Fida, R., Paciello, M., Tramontano, C., Fontaine, R. G., Barbaranelli, C.,& Farnese, M. L. (2015). An integrative approach to understandingcounterproductive work behavior: The roles of stressors, negativeemotions, and moral disengagement. Journal of Business Ethics,130, 131–144. doi:10.1007/s10551-014-2209-5.
Gardner, H. (2008). The mind's new science: A history of the cognitiverevolution. New York, NY: Basic books.
Gibson, D. R. (2003). Participation shifts: Order and differentiation ingroup conversation. Social Forces, 81, 1335–1381. doi:10.1353/sof.2003.0055.
Gibson, D. R. (2005). Taking turns and talking ties: Network structureand conversational sequences. American Journal of Sociology, 110,1561–1597. doi:10.1086/428689.
Gorman, J. C., Cooke, N. J., Amazeen, P. G., & Fouse, S. (2012).Measuring patterns in team interaction sequences using a discreterecurrence approach. Human Factors, 54, 503–517. doi:10.1177/0018720811426140.
Gouran, D. S. (1999). Communication in groups: The emergence andevolution of a field study. In L. R. Frey, D. S. Gouran, & M. S.Poole (Eds.), The handbook of group communication theory andresearch (pp. 3–36). Thousand Oaks, CA: Sage Publications.
Gouran, D. S., & Hirokawa, R. Y. (1996). Functional theory and commu-nication in decision-making and problem-solving groups: An ex-panded view. In R. Y. Hirokawa & M. S. Poole (Eds.),Communication and group decision-making (2nd ed., pp. 55–80).Thousand Oaks, CA: Sage Publications.
Hambley, L. A., O’Neill, T. A., & Kline, T. J. (2007). Virtual team lead-ership: The effects of leadership style and communication mediumon team interaction styles and outcomes. Organizational Behaviorand Human Decision Processes, 103, 1–20. doi:10.1016/j.obhdp.2006.09.004.
Herndon, B., & Lewis, K. (2015). Applying sequence methods to thestudy of team temporal dynamics. Organizational PsychologyReview, 5, 318–332. doi:10.1177/2041386614538276.
Herzmark, G. (1985). Reactions of patients to video recording of consul-tations in general practice. British Medical Journal, 291, 315–318.
Hirst, G., Van Knippenberg, D., & Zhou, J. (2009). A cross-level per-spective on employee creativity: Goal orientation, team learningbehavior, and individual creativity. Academy of ManagementJournal, 52, 280–293. doi:10.5465/AMJ.2009.37308035.
Hollenstein, T. (2013). State space grids: Depicting dynamics acrossdevelopment. New York, NY: Springer.
Jarboe, S. (1999). Group communication and creativity processes. In L.R. Frey, D. S. Gouran, &M. S. Poole (Eds.), The handbook of groupcommunication theory and research (pp. 335–368). ThousandOaks,CA: Sage Publications.
Johns, G. (2006). The essential impact of context on organizational be-havior.Academy ofManagement Review, 31, 386–408. doi:10.5465/AMR.2006.20208687.
Kauffeld, S., & Lehmann-Willenbrock, N. (2012). Meetings matter: Effectsof team meetings on team and organizational success. Small GroupResearch, 43, 130–158. doi:10.1177/1046496411429599.
Kauffeld, S., & Meyers, R. A. (2009). Complaint and solution-orientedcircles: Interaction patterns in work group discussions. EuropeanJournal of Work and Organizational Psychology, 18, 267–294.doi:10.1080/13594320701693209.
Kehoe, R. R., & Wright, P. M. (2013). The impact of high-performancehuman resource practices on employees’ attitudes and behaviors.Journal of Management , 39 , 366–391. doi :10 .1177/0149206310365901.
Keyton, J. (2017). Communication in organizations. Annual Review ofOrganizational Psychology and Organizational Behavior, 4, 501–526. doi:10.1146/annurev-orgpsych-032516-113341.
Knight, A., Kennedy, D. M., &McComb, S. A. (2016). Using recurrenceanalysis to examine group dynamics. Group Dynamics: Theory,Research, and Practice, 20, 223–241. doi:10.1037/gdn0000046.
Kolbe, M., Grote, G., Waller, M. J., Wacker, J., Grande, B., Burtscher, M.J., & Spahn, D. R. (2014). Monitoring and talking to the room:Autochthonous coordination patterns in team interaction and perfor-mance. Journal of Applied Psychology, 99, 1254–1267. doi:10.1037/a0037877.
Kozlowski, S. W. (2015). Advancing research on team process dynamicstheoretical, methodological, and measurement considerations.Organizational Psychology Review, 5, 270–299. doi:10.1177/2041386614533586.
Krauss, R. M., Chen, Y., & Chawla, P. (1996). Nonverbal behavior andnonverbal communication: What do conversational hand gesturestell us? Advances in Experimental Social Psychology, 28, 389–450. doi:10.1016/S0065-2601(08)60241-5.
Krippendorff, K. (2004). Content analysis: An introduction to itsmethodology. Thousand Oaks, CA: Sage.
Laapotti, T., & Mikkola, L. (2016). Social interaction in managementgroup meetings: A case study of Finnish hospital. Journal ofHealth Organization and Management, 30, 613–629. doi:10.1108/JHOM-02-2015-0040.
Lamey, A., Hollenstein, T., Lewis, M.D., & Granic, I. (2004). GridWare(Version 1.1). [Computer software]. Retrieved from http://statespacegrids.org
Landis, R. S. (2013). Successfully combining meta-analysis and structur-al equation modeling: Recommendations and strategies. Journal ofBusiness and Psychology, 28, 251–261. doi:10.1007/s10869-013-9285-x.
Lehmann-Willenbrock, N., & Allen, J. A. (2014). How fun are yourmeetings? Investigating the relationship between humor patterns inteam interactions and team performance. Journal of AppliedPsychology, 99, 1278–1287. doi:10.1037/a0038083.
Lehmann-Willenbrock, N., Allen, J. A., &Kauffeld, S. (2013). A sequen-tial analysis of procedural meeting communication: How teams fa-cilitate their meetings. Journal of Applied CommunicationResearch, 41, 365–388. doi:10.1080/00909882.2013.844847.
342 J Bus Psychol (2018) 33:325–344
Lehmann-Willenbrock, N., Allen, J. A., & Meinecke, A. L. (2014).Observing culture: Differences in U.S.-American and German teammeeting behaviors. Group Processes & Intergroup Relations, 17,252–271. doi:10.1177/1368430213497066.
Lehmann-Willenbrock, N., Chiu, M. M., Lei, Z., & Kauffeld, S. (2016).Positivity as a dynamic team phenomenon: A statistical discourseanalysis. Group & Organization Management, advance onlinepublication. doi:10.1177/1059601116628720.
Lehmann-Willenbrock, N., Hung, H., & Keyton, J. (forthcoming). Newfrontiers in analyzing dynamic group interactions: Bridging socialand computer science. Small Group Research. doi:10.1177/1046496417718941.
Lehmann-Willenbrock, N., Hung, H., & Keyton, J. (in press). New fron-tiers in analyzing dynamic group interactions: Bridging social andcomputer science. Small Group Research.
Lehmann-Willenbrock, N., & Kauffeld, S. (2010). The downside of com-munication: Complaining circles in group discussions. In S.Schuman (Ed.), The handbook for working with difficult groups:How they are difficult, why they are difficult, what you can do (pp.33–54). San Francisco, CA: Jossey-Bass/Wiley.
Lehmann-Willenbrock, N., Meinecke, A. L., Rowold, J., & Kauffeld, S.(2015). How transformational leadership works during team inter-actions: A behavioral process analysis. The Leadership Quarterly,26, 1017–1033. doi:10.1016/j.leaqua.2015.07.003.
Lehmann-Willenbrock, N., Meyers, R. A., Kauffeld, S., Neininger, A., &Henschel, A. (2011). Verbal interaction sequences and group moodexploring the role of team planning communication. Small GroupResearch, 42, 639–668. doi:10.1177/1046496411398397.
Leenders, R. T. A., Contractor, N. S., & DeChurch, L. A. (2016). Onceupon a time: Understanding team processes as relational event net-works. Organizational Psychology Review, 6, 92–115. doi:10.1177/2041386615578312.
Lei, Z., & Lehmann-Willenbrock, N. (2015). Affect in meetings: Aninterpersonal construct in dynamic interaction processes. In J. A.Allen, N. Lehmann-Willenbrock, & S. G. Rogelberg (Eds.), TheCambridge handbook of meeting science (pp. 456–482). NewYork, NY: Cambridge University Press.
Lei, Z., Waller, M. J., Hagen, J., & Kaplan, S. (2016). Team adaptivenessin dynamic contexts: Contextualizing the roles of interaction pat-terns and in-process planning. Group & OrganizationManagement, 41, 491–525. doi:10.1177/1059601115615246.
Lewis, M. D., Lamey, A. V., & Douglas, L. (1999). A new dynamicsystems method for the analysis of early socioemotional develop-ment. Developmental Science, 2, 457–475. doi:10.1111/1467-7687.00090.
Lewis, S. C., Zamith, R., & Hermida, A. (2013). Content analysis in anera of big data: A hybrid approach to computational and manualmethods. Journal of Broadcasting & Electronic Media, 57, 34–52.doi:10.1080/08838151.2012.761702.
Liu, F., & Maitlis, S. (2014). Emotional dynamics and strategizing pro-cesses: A study of strategic conversations in top team meetings.Journal of Management Studies, 51, 202–234. doi:10.1111/j.1467-6486.2012.01087.x.
Maas, C. J., & Hox, J. J. (2005). Sufficient sample sizes for multilevelmodeling. Methodology, 1, 86–92. doi:10.1027/1614-1881.1.3.86.
MacKinnon, D. P., Coxe, S., & Baraldi, A. N. (2012). Guidelines for theinvestigation of mediating variables in business research. Journal ofBusiness and Psychology, 27, 1–14. doi:10.1007/s10869-011-9248-z.
Madrid, H. P., Totterdell, P., & Niven, K. (2016, May 12). Does leaderaffective presence influence communication of creative ideas withinwork teams? Emotion, advance online publication. doi:10.1037/emo0000183.
Magnusson, M. S. (2000). Discovering hidden time patterns in behavior:T-patterns and their detection. Behavior Research Methods,Instruments & Computers, 32, 93–110. doi:10.3758/BF03200792.
Magnusson, M. S. (2004). Repeated patterns in behavior and other bio-logical phenomena. In D. K. Oller & U. Griebel (Eds.), Evolution ofcommunication systems: A comparative approach (pp. 111–128).Cambridge, MA: The MIT Press.
Mangold. (2010). INTERACT quick start manual V2.4 (MangoldInternational GmbH, Ed.). Retrieved from www.mangold-international.com
Marwan, N. (2008). A historical review of recurrence plots. TheEuropean Physical Journal Special Topics, 164, 3–12. doi:10.1140/epjst/e2008-00829-1.
Marwan, N. (2016). Recurrence plots and cross-recurrence plots: soft-ware/programmes. Retrieved from http://www.recurrence-plot.tk/programmes.php
Marwan, N., Romano, M. C., Thiel, M., & Kurths, J. (2007). Recurrenceplots for the analysis of complex systems. Physics Reports, 438,237–329. doi:10.1016/j.physrep.2006.11.001.
Mehra, A., Kilduff, M., & Brass, D. J. (2001). The social networks ofhigh and low self-monitors: Implications for workplace perfor-mance. Administrative Science Quarterly, 46, 121–146. doi:10.2307/2667127.
Meinecke, A. L., & Kauffeld, S. (2016, July). Using state space grids formodelling temporal team dynamics. Helsinki: Paper presented at the11th Annual INGRoup Conference.
Meinecke, A. L., & Lehmann-Willenbrock, N. (2015). Social dynamics atwork: Meetings as a gateway. In J. A. Allen, N. Lehmann-Willenbrock, & S. G. Rogelberg (Eds.), The Cambridge handbookof meeting science (pp. 325–356). New York, NY: CambridgeUniversity Press.
Meinecke, A. L., Lehmann-Willenbrock, N., &Kauffeld, S. (2017).Whathappens during annual appraisal interviews? How leader-followerinteractions unfold and impact interview outcomes. Journal ofApplied Psychology. Advance online publication. doi:10.1037/apl0000219.
Meyers, R. A., & Brashers, D. E. (1999). Influence processes in groupinteraction. In L. R. Frey, D. S. Gouran, & M. S. Poole (Eds.), Thehandbook of group communication theory and research (pp. 288–312). Thousand Oaks, CA: Sage Publications.
Morgeson, F. P., DeRue, D. S., & Karam, E. P. (2010). Leadership inteams: A functional approach to understanding leadership structuresand processes. Journal of Management, 36, 5–39. doi:10.1177/0149206309347376.
Nahrgang, J. D., DeRue, D. S., Hollenbeck, J. R., Spitzmuller, M., Jundt,D. K., & Ilgen, D. R. (2013). Goal setting in teams: The impact oflearning and performance goals on process and performance.Organizational Behavior and Human Decision Processes, 122,12–21. doi:10.1016/j.obhdp.2013.03.008.
Nicolai, J., Demmel, R., & Farsch, K. (2010). Effects of mode of presen-tation on ratings of empathic communication in medical interviews.Patient Education and Counseling, 80, 76–79. doi:10.1016/j.pec.2009.10.014.
Noldus, L. P. J. J., Trienes, R. J. H., Hendriksen, A. H. M., Jansen, H., &Jansen, R. G. (2000). The observer video-pro: New software for thecollection, management, and presentation of time-structured datafrom videotapes and digital media files. Behavior ResearchMethods, Instruments, & Computers, 32, 197–206. doi:10.3758/BF03200802.
Nowicki, S., & Duke, M. P. (1994). Individual differences in the nonver-bal communication of affect: The diagnostic analysis of nonverbalaccuracy scale. Journal of Nonverbal Behavior, 18, 9–35. doi:10.1007/BF02169077.
Paletz, S. B., Chan, J., & Schunn, C. D. (2016). Uncovering uncertaintythrough disagreement. Applied Cognitive Psychology, 30, 387–400.doi:10.1016/j.cognition.2012.07.020.
Pavitt, C. (1993). What (little) we know about formal group discussionprocesses: A review of relevant research. Small Group Research, 24,217–235. doi:10.1177/1046496493242004.
J Bus Psychol (2018) 33:325–344 343
Pavitt, C. (1999). Theorizing about the group communication-leadershiprelationship: Input-process-output and functional models. In L. R.Frey, D. S. Gouran, & M. S. Poole (Eds.), The handbook of groupcommunication theory and research (pp. 313–334). ThousandOaks,CA: Sage Publications.
Penner, L. A., Orom, H., Albrecht, T. L., Franks, M. M., Foster, T. S., &Ruckdeschel, J. C. (2007). Camera-related behaviors during videorecorded medical interactions. Jornal of Nonverbal Behavior, 31,99–117. doi:10.1007/s10919-007-0024-8.
Petrou, P., Demerouti, E., & Schaufeli, W. B. (2016). Crafting the change:The role of employee job crafting behaviors for successful organi-zational change. Journal of Management, advance onlinepublication. doi:10.1177/0149206315624961.
Poole, M. S. (1999). Group communication theory. In L. R. Frey, D. S.Gouran, & M. S. Poole (Eds.), The handbook of group communica-tion theory and research (pp. 37–70). Thousand Oaks, CA: SagePublications.
Porath, C., Spreitzer, G., Gibson, C., & Garnett, F. G. (2012). Thriving atwork: Toward its measurement, construct validation, and theoreticalrefinement. Journal of Organizational Behavior, 33, 250–275. doi:10.1002/job.756.
Premack, D. G., & Woodruff, G. (1978). Does the chimpanzee have atheory of mind? Behavioral and Brain Sciences., 1, 515–526. doi:10.1017/S0140525X00076512.
Quera, V. (2008). RAP: A computer program for exploring similarities inbehavior sequences using random projections. Behavior ResearchMethods, 40, 21–32. doi:10.3758/BRM.40.1.21.
Romesburg, H. C. (1984).Cluster analysis for researchers. Belmont, CA:Lifetime Learning Publications.
Rosen, M. A., Wildman, J. L., Salas, E., & Rayne, S. (2012). Measuringteam dynamics in the wild. In A. B. Hollingshead & M. S. Poole(Eds.), Research methods for studying groups and teams (pp. 386–417). New York, NY: Routledge.
Sauer, N. C., & Kauffeld, S. (2013). Meetings as networks: Applyingsocial network analysis to team interaction. CommunicationMethods & Measures, 7, 26–47. doi:10.1080/19312458.2012.760729.
Skinner, B. F. (1974). About behaviorism. New York, NY: Vintage.Skinner, B. F., Skinner, B. F., Psychologue, E. U., Skinner, B. F., &
Skinner, B. F. (1972). Beyond freedom and dignity (p. 22). NewYork, NY: Bantam Books.
Sohrab, G. (2014). Patterns of team interaction under asymmetric infor-mation distribution conditions. Doctoral dissertation: YorkUniversity Toronto.
Spector, P. E., Rogelberg, S. G., Ryan, A. M., Schmitt, N., & Zedeck, S.(2014). Moving the pendulum back to the middle: Reflections onand introduction to the inductive research special issue of journal ofbusiness and psychology. Journal of Business and Psychology, 29,499–502. doi:10.1007/s10869-014-9372-7.
Spreitzer, G., Sutcliffe, K., Dutton, J., Sonenshein, S., & Grant, A. M.(2005). A socially embedded model of thriving at work.Organization Science, 16, 537–549. doi:10.1287/orsc.1050.0153.
Stachowski, A. A., Kaplan, S. A., &Waller, M. J. (2009). The benefits offlexible team interaction during crises. Journal of AppliedPsychology, 94, 1536–1543. doi:10.1037/a0016903.
Totterdell, P. (2000). Catching moods and hitting runs: Mood linkage andsubjective performance in professional sport teams. Journal ofApplied Psychology, 85, 848–859. doi:10.1037/0021-9010.85.6.848.
van Oortmerssen, L. A., van Woerkum, C. M., & Aarts, N. (2015). Wheninteraction flows: an exploration of collective creative processes ona collaborative governance board. Group & OrganizationManagement, 40, 500–528. doi:10.1177/1059601114560586.
Waller, M. J., & Kaplan, S. A. (2016). Systematic behavioral observationfor emergent team phenomena: Key considerations for quantitativevideo-based approaches. Organizational Research Methods, ad-vance online publication. doi:10.1177/1094428116647785.
Waller, M. J., Okhuysen, G. A., & Saghafian,M. (2016). Conceptualizingemergent states: A strategy to advance the study of group dynamics.The Academy of Management Annals, advance online publication.doi:10.1080/19416520.2016.1120958.
Waller, M. J., Zellmer-Bruhn, M. E., & Giambatista, R. C. (2002).Watching the clock: Group pacing behavior under dynamic dead-lines. Academy of Management Journal, 45, 1046–1055. doi:10.2307/3069329.
Williams, L. J., &McGonagle, A. K. (2016). Four research designs and acomprehensive analysis strategy for investigating common methodvariance with self-report measures using latent variables. Journal ofBusiness and Psychology, 31, 339–359. doi:10.1007/s10869-015-9422-9.
Zickar, M. J. (2015). Digging through dust: Historiography for the orga-nizational sciences. Journal of Business and Psychology, 30, 1–14.doi:10.1007/s10869-013-9339-0.
Zijlstra, F. R., Waller, M. J., & Phillips, S. I. (2012). Setting the tone:Early interaction patterns in swift-starting teams as a predictor ofeffectiveness. European Journal of Work and OrganizationalPsychology, 21, 749–777. doi:10.1080/1359432X.2012.690399.
344 J Bus Psychol (2018) 33:325–344