Temporal dynamics of spontaneous MEG activity in brain networks
6
Temporal dynamics of spontaneous MEG activity in brain networks Francesco de Pasquale a,b,1 , Stefania Della Penna a,b , Abraham Z. Snyder c,d , Christopher Lewis a,b , Dante Mantini a,b,2 , Laura Marzetti a,b , Paolo Belardinelli a,b , Luca Ciancetta a,b , Vittorio Pizzella a,b , Gian Luca Romani a,b , and Maurizio Corbetta a,b,c,d a Institute for Advanced Biomedical Technologies, G. D’Annunzio University Foundation, G. D’Annunzio University, 66100 Chieti, Italy; b Department of Clinical Sciences and Bio-imaging, G. D’Annunzio University, 66100 Chieti, Italy; c Department of Neurology, Washington University, St. Louis, MO 63110; and d Department of Radiology, Washington University, St. Louis, MO 63110 Edited by Marcus E. Raichle, Washington University, St. Louis, MO, and approved January 29, 2010 (received for review December 3, 2009) Functional MRI (fMRI) studies have shown that low-frequency (<0.1 Hz) spontaneous fluctuations of the blood oxygenation level de- pendent (BOLD) signal during restful wakefulness are coherent with- in distributed large-scale cortical and subcortical networks (resting state networks, RSNs). The neuronal mechanisms underlying RSNs remain poorly understood. Here, we describe magnetoencephalo- graphic correspondents of two well-characterized RSNs: the dorsal attention and the default mode networks. Seed-based correlation mapping was performed using time-dependent MEG power recon- structed at each voxel within the brain. The topography of RSNs com- puted on the basis of extended (5 min) epochs was similar to that observed with fMRI but confined to the same hemisphere as the seed region. Analyses taking into account the nonstationarity of MEG activity showed transient formation of more complete RSNs, includ- ing nodes in the contralateral hemisphere. Spectral analysis indicated that RSNs manifest in MEG as synchronous modulation of band- limited power primarily within the theta, alpha, and beta bands—that is, in frequencies slower than those associated with the local electro- physiological correlates of event-related BOLD responses. resting state networks | default mode network | dorsal attention network | functional MRI T he existence of resting state networks (RSNs) is now a well- established fMRI phenomenon (1). The basic finding is that in awake, quietly resting humans, spontaneous, slow (<0.1 Hz) fluc- tuations of the blood oxygen level dependent (BOLD) signal are temporally coherent within widely distributed functional networks closely resembling those evoked by sensory, motor, and cognitive paradigms (2). Interindividual differences in RSN properties may correlate with cognitive abilities both in health (2) and disease (3). Thus, correlated spontaneous neural activity in distributed brain networks represents a fundamental aspect of brain physiology and psychology. Though there is significant evidence linking stimulus- evoked BOLD responses, activations and deactivations both (4), and changes in local field potential (LFP) power, especially in the gamma (40-160 Hz) band, data bearing on the electrophysiological correlates of RSNs are scarce. Recent electrocorticography (ECoG) recordings in human subjects have shown a relationship between the topography of a sensory-motor RSN and slow cortical potentials (5). Slow (∼0.1 Hz) fluctuations of the band-limited gamma power have been also reported as an electrophysiological correlate of BOLD signal fluctuations between brain areas within (5, 6) and across hemispheres in both humans (7) and monkeys (8). Though invasive recordings of electrophysiological activity in animals (8) or humans undergoing surgical management of epilepsy (5, 7) pro- vide high spatial and temporal resolution and specificity, they are not ideal for the study of large-scale RSN in healthy volunteers. Not only are these methods invasive, but recordings through grids or elec- trodes grids typically cover only a small fraction of the cortical sur- face. Here we explore magnetoencephalography (MEG) to study the electrophysiological correlates of RSNs. MEG noninvasively records from outside the scalp the magnetic field variations induced by synaptic currents, which is the same physiology underlying LFPs (9). Although the MEG spatial resolution is limited (on the order of several millimeters), and the method has a low signal to noise, it does offer millisecond-scale temporal resolution and, most importantly for RSN studies, whole-head coverage (9). We focus on the dorsal attention network (DAN) and the default mode network (DMN), two of the most robust and well-studied RSNs that have been associated opposed functionality (externally vs. internally oriented cognition, respectively) (10). Results Stationary fMRI and MEG Resting State Networks. Seed-based resting- state fMRI correlation maps of the DAN and DMN were generated as in ref. 11 by computing the conjunction voxel-wise of temporal correlation maps calculated using different seed regions (Table S1 and SI Text). Main regions of the DAN bilaterally include anterior and posterior intraparietal sulcus (pIPS), the intersection of pre- central and superior frontal sulcus (human FEF), and the middle temporal area (MT; Fig. 1, fMRI). The main regions of the DMN include left and right angular gyrus (LAG, RAG), left precuneus/ posterior cingulate (LPCC), anterior temporal, and left and right medial prefrontal cortex (L/R MPFC; Fig. 2, fMRI). The two net- works are anticorrelated after removal of a global signal before seed- based correlation mapping (12). For the MEG analyses, we used a similar approach, computing correlation maps using source-space, wide-band (1-150 Hz) power time series. MEG correlation seeds were selected on the basis of fMRI (see Materials and Methods and SI Text). For the DAN, we observed significant local correla- tion near the seed (LpIPS) and distant correlation with other regions in the DAN of the same hemisphere, but not with regions in the opposite hemisphere or outside of the DAN. ANOVA of the Pearson’s r over multiple regions of the DAN, localized by fMRI correlation mapping, showed statistically significant correlation only with left FEF (P < 0.0001) and left ventral IPS (LvIPS; P < 0.000001; Fig. 1, Stationary MEG). When the analysis was repeated with right pIPS as the seed, we obtained a similar topography with significant correlation in right FEF and right vIPS, but no correlation in the DAN left hemisphere or elsewhere in the brain (Fig. S1A). Inter- estingly, there was no evidence of negative correlation between DAN and DMN as seen in fMRI (13) (see discussion in SI Text). Author contributions: F.d.P., S.D.P., A.Z.S., P.B., L.C., V.P., G.L.R., and M.C. designed re- search; S.D.P., A.Z.S., C.L., D.M., L.M., and M.C. performed research; F.d.P., S.D.P., A.Z.S., and M.C. contributed new reagents/analytic tools; F.d.P., S.D.P., and M.C. analyzed data; and F.d.P., S.D.P., and M.C. wrote the paper. The authors declare no conflict of interest. This article is a PNAS Direct Submission. 1 To whom correspondence should be addressed. E-mail: [email protected]. 2 Present address: Laboratory for Neuro-psychophysiology, K.U. Leuven Medical School, 3000 Louvain, Belgium. This article contains supporting information online at www.pnas.org/cgi/content/full/ 0913863107/DCSupplemental. 6040–6045 | PNAS | March 30, 2010 | vol. 107 | no. 13 www.pnas.org/cgi/doi/10.1073/pnas.0913863107
-
Upload
independent -
Category
Documents
-
view
0 -
download
0
Transcript of Temporal dynamics of spontaneous MEG activity in brain networks
Temporal dynamics of spontaneous MEG activity inbrain networksFrancesco de Pasqualea,b,1, Stefania Della Pennaa,b, Abraham Z. Snyderc,d, Christopher Lewisa,b, Dante Mantinia,b,2,Laura Marzettia,b, Paolo Belardinellia,b, Luca Ciancettaa,b, Vittorio Pizzellaa,b, Gian Luca Romania,b,and Maurizio Corbettaa,b,c,d
aInstitute for Advanced Biomedical Technologies, G. D’Annunzio University Foundation, G. D’Annunzio University, 66100 Chieti, Italy; bDepartment of ClinicalSciences and Bio-imaging, G. D’Annunzio University, 66100 Chieti, Italy; cDepartment of Neurology, Washington University, St. Louis, MO 63110; anddDepartment of Radiology, Washington University, St. Louis, MO 63110
Edited by Marcus E. Raichle, Washington University, St. Louis, MO, and approved January 29, 2010 (received for review December 3, 2009)
Functional MRI (fMRI) studies have shown that low-frequency (<0.1Hz) spontaneous fluctuations of the blood oxygenation level de-pendent (BOLD) signal during restfulwakefulness are coherentwith-in distributed large-scale cortical and subcortical networks (restingstate networks, RSNs). The neuronal mechanisms underlying RSNsremain poorly understood. Here, we describe magnetoencephalo-graphic correspondents of two well-characterized RSNs: the dorsalattention and the default mode networks. Seed-based correlationmapping was performed using time-dependent MEG power recon-structed at each voxelwithin thebrain. The topography ofRSNs com-puted on the basis of extended (5 min) epochs was similar to thatobservedwith fMRI but confined to the samehemisphere as the seedregion. Analyses taking into account the nonstationarity of MEGactivity showed transient formation of more complete RSNs, includ-ingnodes in the contralateral hemisphere. Spectral analysis indicatedthat RSNs manifest in MEG as synchronous modulation of band-limitedpowerprimarilywithin thetheta, alpha,andbetabands—thatis, in frequencies slower than those associatedwith the local electro-physiological correlates of event-related BOLD responses.
resting state networks | default mode network | dorsal attentionnetwork | functional MRI
The existence of resting state networks (RSNs) is now a well-established fMRI phenomenon (1). The basic finding is that in
awake, quietly resting humans, spontaneous, slow (<0.1 Hz) fluc-tuations of the blood oxygen level dependent (BOLD) signal aretemporally coherent within widely distributed functional networksclosely resembling those evoked by sensory, motor, and cognitiveparadigms (2). Interindividual differences in RSN properties maycorrelate with cognitive abilities both in health (2) and disease (3).Thus, correlated spontaneous neural activity in distributed brainnetworks represents a fundamental aspect of brain physiology andpsychology. Though there is significant evidence linking stimulus-evoked BOLD responses, activations and deactivations both (4),and changes in local field potential (LFP) power, especially in thegamma (40-160 Hz) band, data bearing on the electrophysiologicalcorrelates ofRSNs are scarce.Recent electrocorticography (ECoG)recordings in human subjects have shown a relationship betweenthe topography of a sensory-motorRSNand slow cortical potentials(5). Slow (∼0.1 Hz) fluctuations of the band-limited gamma powerhave been also reported as an electrophysiological correlate ofBOLD signal fluctuations between brain areas within (5, 6) andacross hemispheres in both humans (7) and monkeys (8). Thoughinvasive recordings of electrophysiological activity in animals (8)or humans undergoing surgical management of epilepsy (5, 7) pro-videhigh spatial and temporal resolution andspecificity, they arenotideal for the studyof large-scaleRSN inhealthy volunteers.Not onlyare these methods invasive, but recordings through grids or elec-trodes grids typically cover only a small fraction of the cortical sur-face. Here we explore magnetoencephalography (MEG) to studythe electrophysiological correlates of RSNs. MEG noninvasivelyrecords from outside the scalp the magnetic field variations induced
by synaptic currents, which is the same physiology underlying LFPs(9). Although theMEG spatial resolution is limited (on the order ofseveralmillimeters), and themethodhasa low signal to noise, it doesoffer millisecond-scale temporal resolution and, most importantlyfor RSN studies, whole-head coverage (9). We focus on the dorsalattention network (DAN) and the default mode network (DMN),two of the most robust and well-studied RSNs that have beenassociated opposed functionality (externally vs. internally orientedcognition, respectively) (10).
ResultsStationary fMRI and MEG Resting State Networks. Seed-based resting-state fMRI correlationmaps of theDANandDMNwere generatedas in ref. 11 by computing the conjunction voxel-wise of temporalcorrelation maps calculated using different seed regions (Table S1and SI Text). Main regions of the DAN bilaterally include anteriorand posterior intraparietal sulcus (pIPS), the intersection of pre-central and superior frontal sulcus (human FEF), and the middletemporal area (MT; Fig. 1, fMRI). The main regions of the DMNinclude left and right angular gyrus (LAG, RAG), left precuneus/posterior cingulate (LPCC), anterior temporal, and left and rightmedial prefrontal cortex (L/R MPFC; Fig. 2, fMRI). The two net-worksareanticorrelatedafter removal of a global signal before seed-based correlation mapping (12). For the MEG analyses, we used asimilar approach, computing correlation maps using source-space,wide-band (1-150 Hz) power time series. MEG correlation seedswere selected on the basis of fMRI (see Materials and Methodsand SI Text). For the DAN, we observed significant local correla-tionnear the seed (LpIPS) anddistant correlationwithother regionsin the DAN of the same hemisphere, but not with regions in theopposite hemisphere or outside of the DAN. ANOVA of thePearson’s r over multiple regions of the DAN, localized by fMRIcorrelationmapping, showed statistically significant correlationonlywith left FEF (P< 0.0001) and left ventral IPS (LvIPS;P< 0.000001;Fig. 1, StationaryMEG).When the analysis was repeated with rightpIPS as the seed, we obtained a similar topography with significantcorrelation in right FEF and right vIPS, but no correlation in theDAN left hemisphere or elsewhere in the brain (Fig. S1A). Inter-estingly, there was no evidence of negative correlation betweenDAN and DMN as seen in fMRI (13) (see discussion in SI Text).
Author contributions: F.d.P., S.D.P., A.Z.S., P.B., L.C., V.P., G.L.R., and M.C. designed re-search; S.D.P., A.Z.S., C.L., D.M., L.M., and M.C. performed research; F.d.P., S.D.P., A.Z.S.,and M.C. contributed new reagents/analytic tools; F.d.P., S.D.P., and M.C. analyzed data;and F.d.P., S.D.P., and M.C. wrote the paper.
The authors declare no conflict of interest.
This article is a PNAS Direct Submission.1To whom correspondence should be addressed. E-mail: [email protected] address: Laboratory for Neuro-psychophysiology, K.U. Leuven Medical School,3000 Louvain, Belgium.
This article contains supporting information online at www.pnas.org/cgi/content/full/0913863107/DCSupplemental.
6040–6045 | PNAS | March 30, 2010 | vol. 107 | no. 13 www.pnas.org/cgi/doi/10.1073/pnas.0913863107
This pattern of intrahemispheric correlation cannot be explainedby local blurring of signal due to volume conduction. First, althoughLvIPS is close to LpIPS [vector distance (VD) = 19 mm], FEF isfarther away (VD = 55 mm), well within the spatial resolution ofMEG. Second, we directly measured correlation along a trajectoryconnecting LpIPS to LFEF and found local minimum near thecentral sulcus (Fig. 1 and Fig. S1B).We carried out a similar analysis for theDMNusing LAGas the
seed. Again we found significant correlation with other regions inthe same hemisphere: left superior frontal sulcus (LSFS; P <0.05), left posterior cingulate (LPCC; P < 0.001), and left retro-splenial cortex (LRS; P< 0.001), but not with homologous regionsin the right hemisphere, or other regions outside theDMN (Fig. 2,Stationary MEG). Most of the regions of the DMN showingcorrelation with LAG were distant (LSFS, VD = 84 mm; LPCC,VD = 45 mm; RS, VD = 52 mm).In summary, the topography of interregional MEG power cor-
relation obtained under the assumption of temporal stationaritywas similar to fMRI correlation maps in the hemisphere ipsilateralto the seed. However, robust interhemispheric correlation between
homologous regions, as typically observed in resting state fMRI(14), was not observed in the MEG data. This discrepancy cannotbe attributed to differences in temporal frequency content of thetime series used for the correlation analyses. Convolution of theMEG power time series with a canonical hemodynamic responsefunction (HRF) (15, 16) generated only a spatially blurred versionof the original results (Fig. S1C).
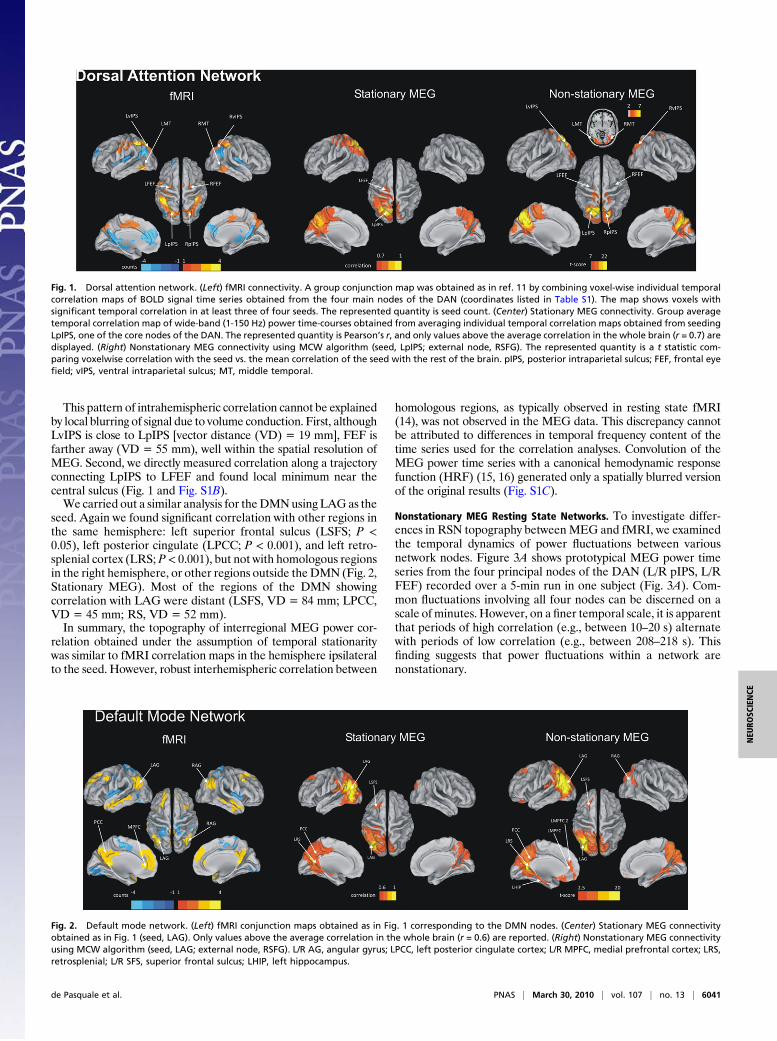
Nonstationary MEG Resting State Networks. To investigate differ-ences in RSN topography between MEG and fMRI, we examinedthe temporal dynamics of power fluctuations between variousnetwork nodes. Figure 3A shows prototypical MEG power timeseries from the four principal nodes of the DAN (L/R pIPS, L/RFEF) recorded over a 5-min run in one subject (Fig. 3A). Com-mon fluctuations involving all four nodes can be discerned on ascale of minutes. However, on a finer temporal scale, it is apparentthat periods of high correlation (e.g., between 10–20 s) alternatewith periods of low correlation (e.g., between 208–218 s). Thisfinding suggests that power fluctuations within a network arenonstationary.
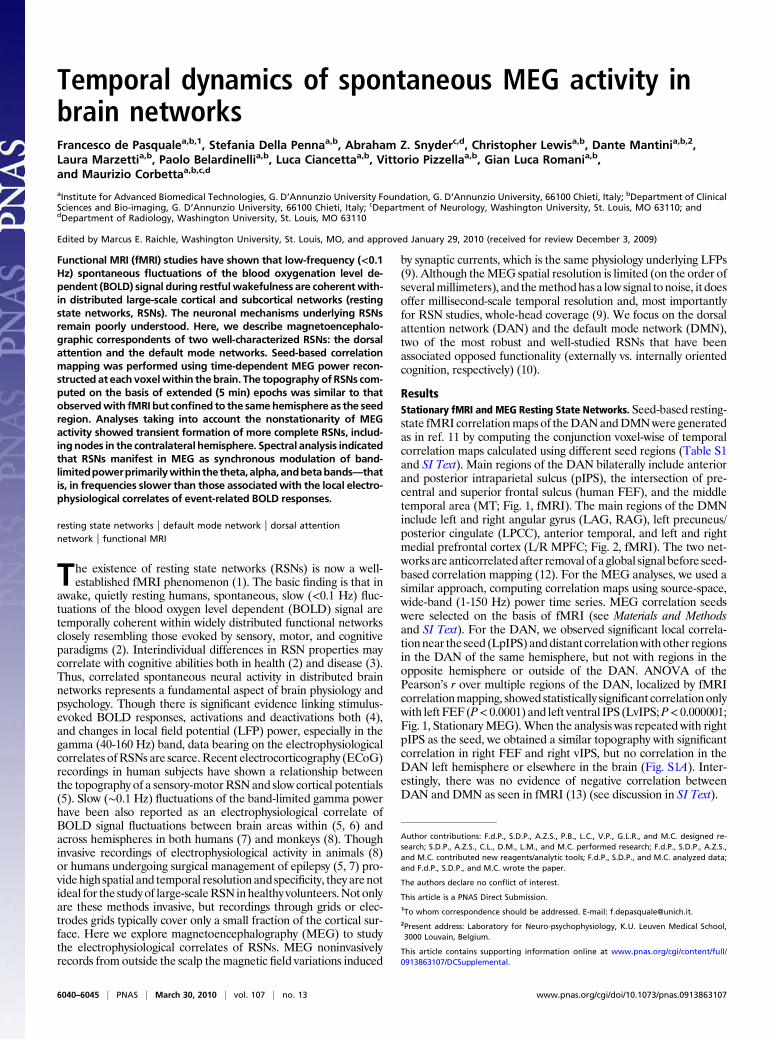
Fig. 1. Dorsal attention network. (Left) fMRI connectivity. A group conjunction map was obtained as in ref. 11 by combining voxel-wise individual temporalcorrelation maps of BOLD signal time series obtained from the four main nodes of the DAN (coordinates listed in Table S1). The map shows voxels withsignificant temporal correlation in at least three of four seeds. The represented quantity is seed count. (Center) Stationary MEG connectivity. Group averagetemporal correlation map of wide-band (1-150 Hz) power time-courses obtained from averaging individual temporal correlation maps obtained from seedingLpIPS, one of the core nodes of the DAN. The represented quantity is Pearson’s r, and only values above the average correlation in the whole brain (r = 0.7) aredisplayed. (Right) Nonstationary MEG connectivity using MCW algorithm (seed, LpIPS; external node, RSFG). The represented quantity is a t statistic com-paring voxelwise correlation with the seed vs. the mean correlation of the seed with the rest of the brain. pIPS, posterior intraparietal sulcus; FEF, frontal eyefield; vIPS, ventral intraparietal sulcus; MT, middle temporal.
Fig. 2. Default mode network. (Left) fMRI conjunction maps obtained as in Fig. 1 corresponding to the DMN nodes. (Center) Stationary MEG connectivityobtained as in Fig. 1 (seed, LAG). Only values above the average correlation in the whole brain (r = 0.6) are reported. (Right) Nonstationary MEG connectivityusing MCW algorithm (seed, LAG; external node, RSFG). L/R AG, angular gyrus; LPCC, left posterior cingulate cortex; L/R MPFC, medial prefrontal cortex; LRS,retrosplenial; L/R SFS, superior frontal sulcus; LHIP, left hippocampus.
de Pasquale et al. PNAS | March 30, 2010 | vol. 107 | no. 13 | 6041
NEU
ROSC
IENCE
Figure 3B shows interregional correlation time series evaluatedover a sliding 10-s window. An LpIPS seed is paired with othernodes within the DAN (RpIPS, L/R FEF), as well as with a regionoutside the DAN (right superior frontal gyrus, RSFG; Table S1).Regions within the DAN generally show stronger correlation thanwhen LpIPS is paired with the external region. Again, intrahemi-spheric correlation (e.g., LpIPS-LFEF) is generally stronger thaninterhemispheric correlation (LpIPS-RFEF or LpIPS-RpIPS), aspreviously shown in the group-average correlation maps (Fig. 1). Acritical feature evident in Fig. 3B is that MEG power time seriesinterregional correlations fluctuate on a time scale on the order oftens of seconds, unlike BOLD interregional correlations, which aremore stationary.Based on these observations, we reasoned that nonstationarity
may be responsible for the restricted intrahemispheric topographyobserved in MEG correlation maps, and thus more completebilateral MEG networks will be observed on selected temporalepochs. To test this hypothesis, we examined the spectral propertiesof interregional correlations. Autospectra (Fig. 3C) and total in-terdependence, a measure of the internodal coherence (Fig. 3D,ref. 17, and SI Text), were computed for each subject on the prin-cipal nodes of theDAN (L/R pIPS; L/R FEF) andDMN (L/RAG;LPCC;LMPFC), and then averaged across subjects. Bothmeasures
displayed a 1/f-like spectral distribution, with the interdependenceshowing a moderate peak around 0.1 Hz for both DAN and DMN.Accordingly, 10 s (the reciprocal of 0.1 Hz) was chosen as thewindow duration for computing interregional power correlation (SIText). To this aim, we developed the maximal correlation window(MCW) algorithm, which iteratively locates epochs in which thecorrelation between a seed region (e.g., LpIPS) and a subset ofnetwork nodes is high while, concurrently, the correlation with aregion outside of the network is minimal (Materials and Methodsand SI Text). An example of such temporal window is highlighted inyellow in Fig. 3B. The hypothesis is that other nodes within a net-work will be more coherent in temporal windows in which some ofthe component nodes show strong correlation. This procedure wasapplied to all 30 runs recorded in all 13 subjects. For each MCW, awhole-brain temporal correlation map was computed with the seedregion. In each subject, maps derived from all MCWs were aver-aged, and a random effects statistical test assessed significanceacross subjects (SI Text).The MEG power correlation map for the DAN computed using
epochs selected by the MCW algorithm (seed, LpIPS; within-RSNnodes presented to the MCW algorithm, {RpIPS, LFEF, RFEF};external node, RSFG) is shown in Fig. 1, Nonstationary MEG.Significant correlation was observed not only near the seed and
Fig. 3. (A) Wide-band MEG power time series (Eq. 2) for the main nodes in the DAN (LpIPS, RpIPS, LFEF, and RFEF). (B) Correlation time series pairing LpIPSwith other nodes in the DAN and one region outside of the DAN (RSFG). The represented quantity is rsjðtÞ (Eq. 3; Tr ¼ 10sec) evaluated at time increments of0.2 s. (C) Power spectral densities (PSD) of wide-band power (Eq. 2) in DAN and DMN nodes averaged across sessions and subjects. (D) Total interdependencemeasure (SI Text) for DAN and DMN on a semilog scale.
6042 | www.pnas.org/cgi/doi/10.1073/pnas.0913863107 de Pasquale et al.
other nodes supplied to the MCW procedure, but also with severalbilateral DAN regions (LMT, RMT, LvIPS, RvIPS) that were notused for epoch selection (Table S2, Dorsal Attention Network 1).The same regions also showed significant correlation when a dif-ferent external node (LMPFC2) was used as control, hence when adifferent set of temporal windows was selected by the MCW al-gorithm (Fig. S2A and Table S2, Dorsal Attention Network 2).A similar analysis assuming nonstationarity was conducted for
the DMN (seed, LAG; within-network nodes presented to theMCW algorithm, {RAG, LPCC, LMPFC}; external node, RSFGor RFEF). Significant correlation was observed bilaterally in manyDMN regions not used for epoch selection: left and right retro-splenial cortex (RS), left superior frontal sulcus (LSFS), rightmedial prefrontal cortex (RMPFC), left inferior temporal gyrus,and left hippocampus (LHIP) (Fig. 2, Nonstationary MEG; Fig.S2B; and Table S2, Default Mode Network 1 and 2). In general,MCW-selected epochs yieldedMEGpower time series correlationsthat were more bilateral and more similar to fMRI RSNs.To assess the spatial similarity of MEG and fMRI results, a
nonparametric test based on Spearman rank correlation as in ref. 5compared covariance structures obtained by both methods. Thistest was applied to selected slices of the brain containing the prin-cipal nodes of each RSN (see SI Text for details). Significant cor-respondence (P < 0.05) was obtained in all subjects for each of theselected slices (for a representative result, see Fig. S3). Additionalcontrol analyses examined the variability of the nonstationary cor-relation within a network (Fig. S4A), the spatial specificity of theMCW maps (Fig. S4B), and verified that the MCW procedure didnot artificially build RSNs (SI Text and Table S3).
Index of Network Correlation. The demonstration of nonstationaryRSNs raises questions concerning network dynamics. As a pre-liminary analysis of this issue, the prevalence of within-networkcorrelation was contrasted with the prevalence of across-networkcorrelation. Thus, for a selected seed region, the index of networkcorrelation quantified the fraction of epochs in which within-network correlation was significantly greater than the correlationwith the external node (Materials and Methods and SI Text). Thenodes were the same as those used in the MCW analysis. In boththe DAN and the DMN (Fig. S4C), the seed was rarely (<10%of the time) more correlated with the external node than witheach of the network nodes. In the DAN, significant correlationoccurred the most frequently intrahemispherically (LpIPS-LFEF;index = 0.71); next, interhemispherically between homologousregion pairs (LpIPS-RpIPS; index = 0.67); finally, least fre-quently, interhemispherically between nonhomologous regions(LpIPS-RFEF; index = 0.38). In other words, and notwith-standing nonstationarity, within-network correlation generally isgreater than cross-network correlation. Thus, networks are alwaysat least partially engaged. Within a network, intrahemisphericcorrelation is greater than interhemispheric correlation.
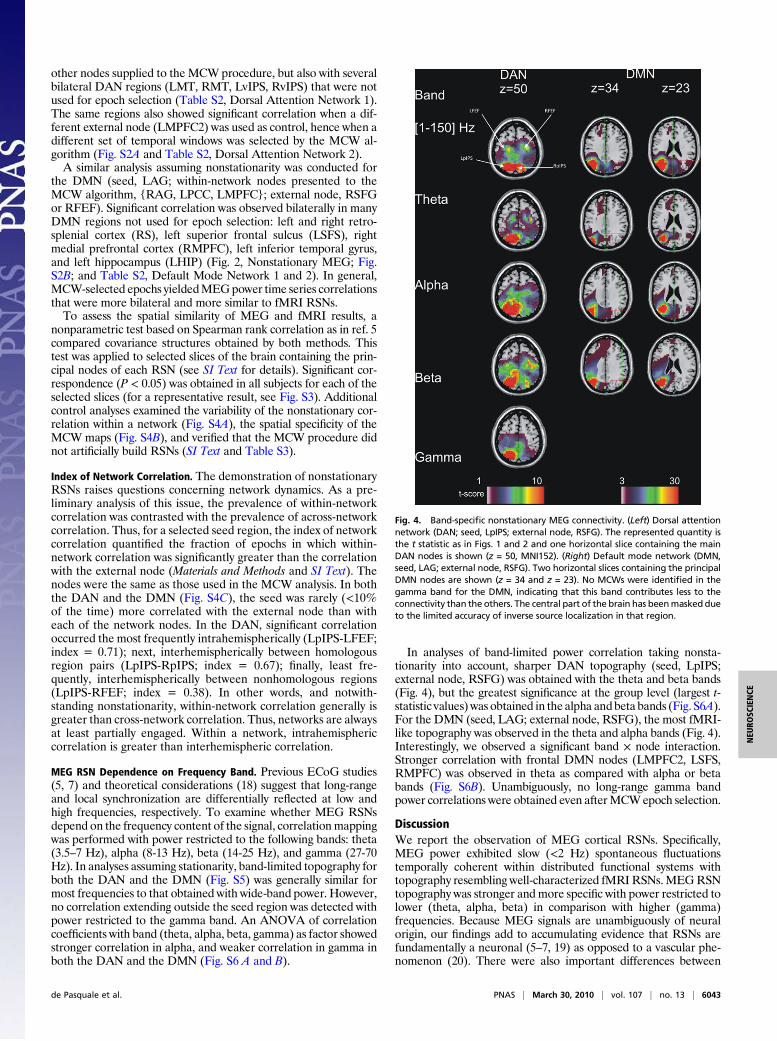
MEG RSN Dependence on Frequency Band. Previous ECoG studies(5, 7) and theoretical considerations (18) suggest that long-rangeand local synchronization are differentially reflected at low andhigh frequencies, respectively. To examine whether MEG RSNsdepend on the frequency content of the signal, correlationmappingwas performed with power restricted to the following bands: theta(3.5–7 Hz), alpha (8-13 Hz), beta (14-25 Hz), and gamma (27-70Hz). In analyses assuming stationarity, band-limited topography forboth the DAN and the DMN (Fig. S5) was generally similar formost frequencies to that obtained with wide-band power. However,no correlation extending outside the seed region was detected withpower restricted to the gamma band. An ANOVA of correlationcoefficients with band (theta, alpha, beta, gamma) as factor showedstronger correlation in alpha, and weaker correlation in gamma inboth the DAN and the DMN (Fig. S6 A and B).
In analyses of band-limited power correlation taking nonsta-tionarity into account, sharper DAN topography (seed, LpIPS;external node, RSFG) was obtained with the theta and beta bands(Fig. 4), but the greatest significance at the group level (largest t-statistic values) was obtained in the alpha andbeta bands (Fig. S6A).For the DMN (seed, LAG; external node, RSFG), the most fMRI-like topography was observed in the theta and alpha bands (Fig. 4).Interestingly, we observed a significant band × node interaction.Stronger correlation with frontal DMN nodes (LMPFC2, LSFS,RMPFC) was observed in theta as compared with alpha or betabands (Fig. S6B). Unambiguously, no long-range gamma bandpower correlations were obtained even afterMCWepoch selection.
DiscussionWe report the observation of MEG cortical RSNs. Specifically,MEG power exhibited slow (<2 Hz) spontaneous fluctuationstemporally coherent within distributed functional systems withtopography resembling well-characterized fMRIRSNs.MEGRSNtopography was stronger andmore specific with power restricted tolower (theta, alpha, beta) in comparison with higher (gamma)frequencies. Because MEG signals are unambiguously of neuralorigin, our findings add to accumulating evidence that RSNs arefundamentally a neuronal (5–7, 19) as opposed to a vascular phe-nomenon (20). There were also important differences between
Fig. 4. Band-specific nonstationary MEG connectivity. (Left) Dorsal attentionnetwork (DAN; seed, LpIPS; external node, RSFG). The represented quantity isthe t statistic as in Figs. 1 and 2 and one horizontal slice containing the mainDAN nodes is shown (z = 50, MNI152). (Right) Default mode network (DMN,seed, LAG; external node, RSFG). Two horizontal slices containing the principalDMN nodes are shown (z = 34 and z = 23). No MCWs were identified in thegamma band for the DMN, indicating that this band contributes less to theconnectivity than the others. The central part of the brain has beenmasked dueto the limited accuracy of inverse source localization in that region.
de Pasquale et al. PNAS | March 30, 2010 | vol. 107 | no. 13 | 6043
NEU
ROSC
IENCE
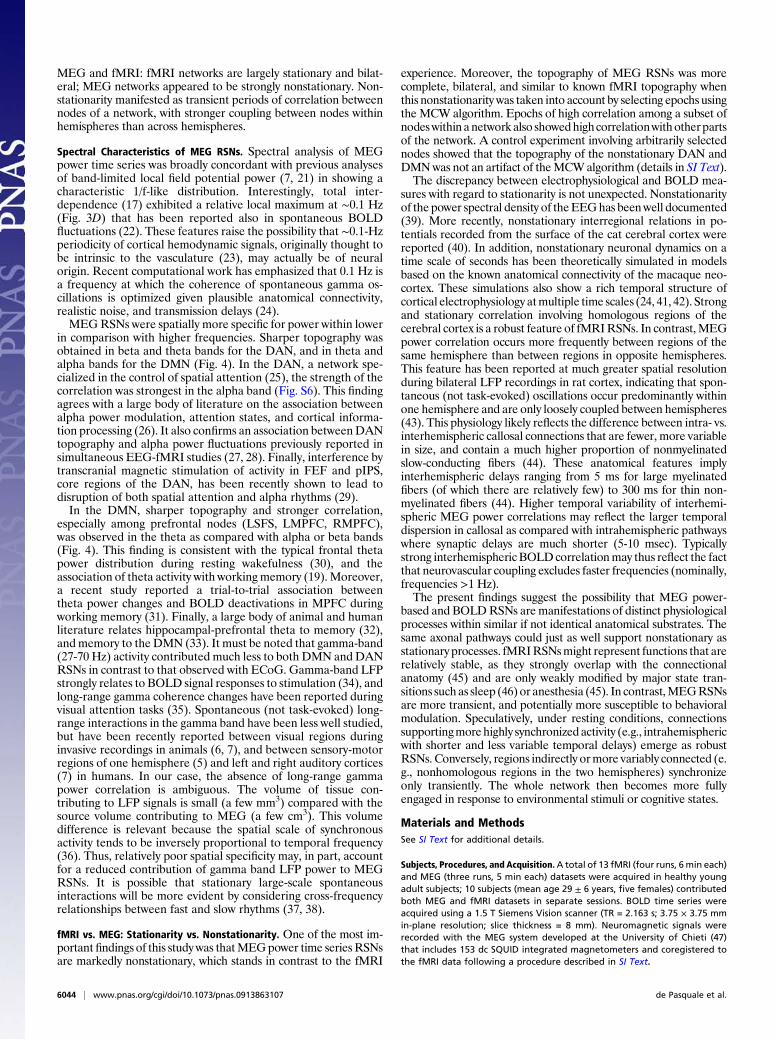
MEG and fMRI: fMRI networks are largely stationary and bilat-eral; MEG networks appeared to be strongly nonstationary. Non-stationarity manifested as transient periods of correlation betweennodes of a network, with stronger coupling between nodes withinhemispheres than across hemispheres.
Spectral Characteristics of MEG RSNs. Spectral analysis of MEGpower time series was broadly concordant with previous analysesof band-limited local field potential power (7, 21) in showing acharacteristic 1/f-like distribution. Interestingly, total inter-dependence (17) exhibited a relative local maximum at ∼0.1 Hz(Fig. 3D) that has been reported also in spontaneous BOLDfluctuations (22). These features raise the possibility that ∼0.1-Hzperiodicity of cortical hemodynamic signals, originally thought tobe intrinsic to the vasculature (23), may actually be of neuralorigin. Recent computational work has emphasized that 0.1 Hz isa frequency at which the coherence of spontaneous gamma os-cillations is optimized given plausible anatomical connectivity,realistic noise, and transmission delays (24).MEGRSNs were spatially more specific for power within lower
in comparison with higher frequencies. Sharper topography wasobtained in beta and theta bands for the DAN, and in theta andalpha bands for the DMN (Fig. 4). In the DAN, a network spe-cialized in the control of spatial attention (25), the strength of thecorrelation was strongest in the alpha band (Fig. S6). This findingagrees with a large body of literature on the association betweenalpha power modulation, attention states, and cortical informa-tion processing (26). It also confirms an association betweenDANtopography and alpha power fluctuations previously reported insimultaneous EEG-fMRI studies (27, 28). Finally, interference bytranscranial magnetic stimulation of activity in FEF and pIPS,core regions of the DAN, has been recently shown to lead todisruption of both spatial attention and alpha rhythms (29).In the DMN, sharper topography and stronger correlation,
especially among prefrontal nodes (LSFS, LMPFC, RMPFC),was observed in the theta as compared with alpha or beta bands(Fig. 4). This finding is consistent with the typical frontal thetapower distribution during resting wakefulness (30), and theassociation of theta activity with working memory (19). Moreover,a recent study reported a trial-to-trial association betweentheta power changes and BOLD deactivations in MPFC duringworking memory (31). Finally, a large body of animal and humanliterature relates hippocampal-prefrontal theta to memory (32),and memory to the DMN (33). It must be noted that gamma-band(27-70 Hz) activity contributed much less to both DMN and DANRSNs in contrast to that observed with ECoG. Gamma-band LFPstrongly relates to BOLD signal responses to stimulation (34), andlong-range gamma coherence changes have been reported duringvisual attention tasks (35). Spontaneous (not task-evoked) long-range interactions in the gamma band have been less well studied,but have been recently reported between visual regions duringinvasive recordings in animals (6, 7), and between sensory-motorregions of one hemisphere (5) and left and right auditory cortices(7) in humans. In our case, the absence of long-range gammapower correlation is ambiguous. The volume of tissue con-tributing to LFP signals is small (a few mm3) compared with thesource volume contributing to MEG (a few cm3). This volumedifference is relevant because the spatial scale of synchronousactivity tends to be inversely proportional to temporal frequency(36). Thus, relatively poor spatial specificity may, in part, accountfor a reduced contribution of gamma band LFP power to MEGRSNs. It is possible that stationary large-scale spontaneousinteractions will be more evident by considering cross-frequencyrelationships between fast and slow rhythms (37, 38).
fMRI vs. MEG: Stationarity vs. Nonstationarity. One of the most im-portant findings of this studywas thatMEGpower time seriesRSNsare markedly nonstationary, which stands in contrast to the fMRI
experience. Moreover, the topography of MEG RSNs was morecomplete, bilateral, and similar to known fMRI topography whenthis nonstationarity was taken into account by selecting epochs usingthe MCW algorithm. Epochs of high correlation among a subset ofnodeswithin anetwork also showedhighcorrelationwithotherpartsof the network. A control experiment involving arbitrarily selectednodes showed that the topography of the nonstationary DAN andDMNwas not an artifact of theMCWalgorithm (details in SI Text).The discrepancy between electrophysiological and BOLD mea-
sures with regard to stationarity is not unexpected. Nonstationarityof the power spectral density of theEEGhas beenwell documented(39). More recently, nonstationary interregional relations in po-tentials recorded from the surface of the cat cerebral cortex werereported (40). In addition, nonstationary neuronal dynamics on atime scale of seconds has been theoretically simulated in modelsbased on the known anatomical connectivity of the macaque neo-cortex. These simulations also show a rich temporal structure ofcortical electrophysiology atmultiple time scales (24, 41, 42). Strongand stationary correlation involving homologous regions of thecerebral cortex is a robust feature of fMRIRSNs. In contrast,MEGpower correlation occurs more frequently between regions of thesame hemisphere than between regions in opposite hemispheres.This feature has been reported at much greater spatial resolutionduring bilateral LFP recordings in rat cortex, indicating that spon-taneous (not task-evoked) oscillations occur predominantly withinone hemisphere and are only loosely coupled between hemispheres(43). This physiology likely reflects the difference between intra- vs.interhemispheric callosal connections that are fewer, more variablein size, and contain a much higher proportion of nonmyelinatedslow-conducting fibers (44). These anatomical features implyinterhemispheric delays ranging from 5 ms for large myelinatedfibers (of which there are relatively few) to 300 ms for thin non-myelinated fibers (44). Higher temporal variability of interhemi-spheric MEG power correlations may reflect the larger temporaldispersion in callosal as compared with intrahemispheric pathwayswhere synaptic delays are much shorter (5-10 msec). Typicallystrong interhemisphericBOLDcorrelationmay thus reflect the factthat neurovascular coupling excludes faster frequencies (nominally,frequencies >1 Hz).The present findings suggest the possibility that MEG power-
based and BOLDRSNs are manifestations of distinct physiologicalprocesses within similar if not identical anatomical substrates. Thesame axonal pathways could just as well support nonstationary asstationary processes. fMRIRSNsmight represent functions that arerelatively stable, as they strongly overlap with the connectionalanatomy (45) and are only weakly modified by major state tran-sitions such as sleep (46) or anesthesia (45). In contrast,MEGRSNsare more transient, and potentially more susceptible to behavioralmodulation. Speculatively, under resting conditions, connectionssupportingmorehighly synchronized activity (e.g., intrahemisphericwith shorter and less variable temporal delays) emerge as robustRSNs. Conversely, regions indirectly ormore variably connected (e.g., nonhomologous regions in the two hemispheres) synchronizeonly transiently. The whole network then becomes more fullyengaged in response to environmental stimuli or cognitive states.
Materials and MethodsSee SI Text for additional details.
Subjects, Procedures, and Acquisition.A total of 13 fMRI (four runs, 6min each)and MEG (three runs, 5 min each) datasets were acquired in healthy youngadult subjects; 10 subjects (mean age 29 ± 6 years, five females) contributedboth MEG and fMRI datasets in separate sessions. BOLD time series wereacquired using a 1.5 T Siemens Vision scanner (TR = 2.163 s; 3.75 × 3.75 mmin-plane resolution; slice thickness = 8 mm). Neuromagnetic signals wererecorded with the MEG system developed at the University of Chieti (47)that includes 153 dc SQUID integrated magnetometers and coregistered tothe fMRI data following a procedure described in SI Text.
6044 | www.pnas.org/cgi/doi/10.1073/pnas.0913863107 de Pasquale et al.
fMRI Analysis. fMRI correlation maps were generated using the pipelinedeveloped at Washington University (3, 11, 13).
MEG Analysis. An extension of the Independent Component Analysis (ICA)algorithm described in ref. 48 was employed to automatically classify andremove artifactual MEG components. Artifact-free MEG signals were recon-stituted from the remaining ICs, and source-space current was reconstructedby a weighted minimum-norm least squares (WMNLS) procedure imple-mented in Curry 6.0 (Neuroscan). This step yielded
q jðtÞ ¼ ½ qjxðtÞ q jyðtÞ qjzðtÞ �′; [1]
the source-space current density vector at voxel j at time t. Power time seriesat voxel j was computed as
pjðtÞ ¼ ð1=TpÞðtþTp
t
jqjðτÞj2dτ; [2]
where Tp ¼ 400ms. Power time series were reconstructed from wide-band(1-150 Hz) MEG signals and on the basis of qjðtÞ (see [1]) restricted to thetheta (3.5–7 Hz), alpha (8-13 Hz), beta (14-25 Hz) and gamma (27-70 Hz)bands. Correlation time series between voxels j and s (the seed) were com-puted using the Pearson product moment formula. Thus,
rsjðtÞ ¼
ÐtþTr
t½psðtÞ− �ps�½pjðtþ τÞ− �pj�dτffiffiffiffiffiffiffiffiffiffiffiffiffiffiffiffiffiffiffiffiffiffiffiffiffiffiffiffiffiffiffiffiffiffiffiffiffiffiffiffiffiffiffiffiffiffiffiffiffiffiffiffiffiffiffiffiffiffiffiffiffiffiffiffiffiffiffiffiffiffiffiÐtþTr
t½psðτÞ− �ps�2dτ
ÐtþTr
t½pjðτÞ− �pj�2dτ
s;
[3]
where Tr is the epoch duration and overbars denote the mean over theappropriate interval. In analyses assuming stationarity, rsj was evaluated andaveraged over eight nonoverlapping segments ðTr ≈ 37secÞwithin 5-min runs.In analyses taking nonstationarity into account, the maximal correlationwindow (MCW) algorithm identified epochs of high within-network corre-lation on which to evaluate rsjðtÞ ðTr ¼ 10secÞ.
The MCW algorithm accepts as input power time series from four nodes(one ofwhich is the seed) belonging to an fMRI-defined RSN plus one externalnode. The objective of this algorithm is to identify epochs in which the leastwithin-network correlation is above a threshold, whereas the correlationbetween the seed and one external node is minimal (49).
ACKNOWLEDGMENTS. Funding for this research was provided by theEuropean Community’s Seventh Framework Programme (FP7/2007-2013)Grant HEALTH-F2-2008-200728, BrainSynch, and National Institutes ofHealth Grants NS06833 and MH7192006.
1. Biswal B, Yetkin FZ, Haughton VM, Hyde JS (1995) Functional connectivity in the motorcortex of resting human brain using echo-planar MRI. Magn Reson Med 34:537–541.
2. Fox MD, Snyder AZ, Vincent JL, Raichle ME (2007) Intrinsic fluctuations within corticalsystems account for intertrial variability in human behavior. Neuron 56:171–184.
3. He BJ, et al. (2007) Breakdown of functional connectivity in frontoparietal networksunderlies behavioral deficits in spatial neglect. Neuron 53:905–918.
4. Logothetis NK, Pauls J, Augath M, Trinath T, Oeltermann A (2001) Neurophysiologicalinvestigation of the basis of the fMRI signal. Nature 412:150–157.
5. He BJ, Snyder AZ, Zempel JM, Smyth MD, Raichle ME (2008) Electrophysiologicalcorrelates of the brain’s intrinsic large-scale functional architecture. Proc Natl Acad SciUSA 105:16039–16044.
6. Shmuel A, Leopold DA (2008) Neuronal correlates of spontaneous fluctuations in fMRIsignals in monkey visual cortex: Implications for functional connectivity at rest. HumBrain Mapp 29:751–761.
7. Nir Y, et al. (2008) Interhemispheric correlations of slow spontaneous neuronalfluctuations revealed in human sensory cortex. Nat Neurosci 11:1100–1108.
8. Shmuel A, Augath M, Oeltermann A, Logothetis NK (2006) Negative functional MRIresponse correlates with decreases in neuronal activity in monkey visual area V1. NatNeurosci 9:569–577.
9. Hamalainen M, Hari R, Llomniemi RJ, Knuutila J, Lounasmaa OV (1993) Magneto-encephalography, theory, instrumentation, and applications to noninvasive studies ofthe working brain. Rev Mod Phys 65:413–497.
10. Shulman GL, et al. (1997) Common blood flow changes across visual tasks: II.Decreases in cerebral cortex. J Cogn Neurosci 9:648–663.
11. Fox MD, et al. (2005) The human brain is intrinsically organized into dynamic,anticorrelated functional networks. Proc Natl Acad Sci USA 102:9673–9678.
12. Fox MD, Zhang D, Snyder AZ, Raichle ME (2009) The global signal and observedanticorrelated resting state brain networks. J Neurophysiol 101:3270–3283.
13. Fox MD, Corbetta M, Snyder AZ, Vincent JL, Raichle ME (2006) Spontaneous neuronalactivity distinguishes human dorsal and ventral attention systems. Proc Natl Acad SciUSA 103:10046–10051.
14. Johnston JM, et al. (2008) Loss of resting interhemispheric functional connectivityafter complete section of the corpus callosum. J Neurosci 28:6453–6458.
15. Friston KJ, et al. (1998) Event-related fMRI: Characterizing differential responses.Neuroimage 7:30–40.
16. Glover GH (1999) Deconvolution of impulse response in event-related BOLD fMRI.Neuroimage 9:416–429.
17. Schelter B, Winterhalder M, Timmer J (2006) Handbook of Time Series Analysis:Recent Theoretical Developments and Applications (Wiley-VCH, Berlin).
18. Buzsáki G, Draguhn A (2004) Neuronal oscillations in cortical networks. Science 304:1926–1929.
19. Meltzer JA, Negishi M, Mayes LC, Constable RT (2007) Individual differences in EEGtheta and alpha dynamics during working memory correlate with fMRI responsesacross subjects. Clin Neurophysiol 118:2419–2436.
20. Shmueli K, et al. (2007) Low-frequency fluctuations in the cardiac rate as a source ofvariance in the resting-state fMRI BOLD signal. Neuroimage 38:306–320.
21. LeopoldDA,MurayamaY, Logothetis NK (2003) Very slowactivityfluctuations inmonkeyvisual cortex: Implications for functional brain imaging. Cereb Cortex 13:422–433.
22. Purdon PL, Weisskoff RM (1998) Effect of temporal autocorrelation due tophysiological noise and stimulus paradigm on voxel-level false-positive rates in fMRI.Hum Brain Mapp 6:239–249.
23. Mayhew JE, et al. (1996) Cerebral vasomotion: A 0.1-Hz oscillation in reflected lightimaging of neural activity. Neuroimage 4:183–193.
24. Deco G, Jirsa V, Mcintosh AR, Sporns O, Kotter R (2009) Key role of coupling, delay,and noise in resting brain fluctuations. Proc Natl Acad Sci USA 106:10302–10307.
25. Corbetta M, Shulman GL (2002) Control of goal-directed and stimulus-drivenattention in the brain. Nat Rev Neurosci 3:201–215.
26. Nunez P (1995) Neocortical Dynamics and Human EEG Rhythms (Oxford Univ Press,New York).
27. Laufs H, et al. (2003) Electroencephalographic signatures of attentional and cognitivedefault modes in spontaneous brain activity fluctuations at rest. Proc Natl Acad SciUSA 100:11053–11058.
28. Mantini D, Perrucci MG, Del Gratta C, Romani GL, Corbetta M (2007) Electro-physiological signatures of resting state networks in the human brain. Proc Natl AcadSci USA 104:13170–13175.
29. CapotostoP, Babiloni C, RomaniGL, CorbettaM (2009) Frontoparietal cortex controls spatialattention through modulation of anticipatory alpha rhythms. J Neurosci 29:5863–5872.
30. Srinivasan R, Winter WR, Nunez PL (2006) Source analysis of EEG oscillations usinghigh-resolution EEG and MEG. Prog Brain Res 159:29–42.
31. Scheeringa R, et al. (2009) Trial-by-trial coupling between EEG and BOLD identifiesnetworks related to alpha and theta EEG power increases during working memorymaintenance. Neuroimage 44:1224–1238.
32. Hasselmo ME, Eichenbaum H (2005) Hippocampal mechanisms for the context-dependent retrieval of episodes. Neural Netw 18:1172–1190.
33. Buckner RL, Andrews-Hanna JR, Schacter DL (2008) The brain’s default network:Anatomy, function, and relevance to disease. Ann N Y Acad Sci 1124:1–38.
34. Goense JB, Logothetis NK (2008) Neurophysiology of the BOLD fMRI signal in awakemonkeys. Curr Biol 18:631–640.
35. Gregorious G, Gotts S, Zhou H, Desimone R (2009) High-frequency, long-range couplingbetween prefrontal and visual cortex during attention. Science 29:1207–1210.
36. Bullock TH, et al. (1995) Temporal fluctuations in coherence of brain waves. Proc NatlAcad Sci USA 92:11568–11572.
37. Mazaheri A, Nieuwenhuis IL, van Dijk H, Jensen O (2009) Prestimulus alpha and muactivity predicts failure to inhibit motor responses. Hum Brain Mapp 30:1791–1800.
38. de Lange FP, Jensen O, Bauer M, Toni I (2008) Interactions between posterior gammaand frontal alpha beta oscillations during imagined actions. Front Hum Neurosci 2:7.
39. Zhan Y, Halliday D, Jiang P, Liu X, Feng J (2006) Detecting time-dependent coherencebetween non-stationary electrophysiological signals—a combined statistical andtime-frequency approach. J Neurosci Methods 156:322–332.
40. Popa D, Popescu AT, Paré D (2009) Contrasting activity profile of two distributedcortical networks as a function of attentional demands. J Neurosci 29:1191–1201.
41. Honey CJ, Kötter R, Breakspear M, Sporns O (2007) Network structure of cerebralcortex shapes functional connectivity on multiple time scales. Proc Natl Acad Sci USA104:10240–10245.
42. Ghosh A, Rho Y, McIntosh AR, Kötter R, Jirsa VK (2008) Noise during rest enables theexploration of the brain’s dynamic repertoire. PLOS Comput Biol 4:e1000196.
43. MacDonald KD, Brett B, Barth DS (1996) Inter- and intra-hemispheric spatiotemporalorganization of spontaneous electrocortical oscillations. J Neurophysiol 76:423–437.
44. Ringo JL, Doty RW, Demeter S, Simard PY (1994) Time is of the essence: A conjecturethat hemispheric specialization arises from interhemispheric conduction delay. CerebCortex 4:331–343.
45. Vincent JL, et al. (2007) Intrinsic functional architecture in the anaesthetized monkeybrain. Nature 447:83–86.
46. Horovitz SG, et al. (2008) Low frequency BOLD fluctuations during resting wakefulnessand light sleep: A simultaneous EEG-fMRI study. Hum Brain Mapp 29:671–682.
47. Della PennaS, et al. (2000) Biomagnetic systems for clinical use.PhilosMagB 80:937–948.48. Hironaga N, Ioannides AA (2007) Localization of individual area neuronal activity.
Neuroimage 34:1519–1534.49. Hu TC, Kahng AB, Tsao CWA (1995) Old bachelor acceptance: A new class of non-
monotone threshold accepting methods. ORSA Journal on Computing 7:417–425.
de Pasquale et al. PNAS | March 30, 2010 | vol. 107 | no. 13 | 6045
NEU
ROSC
IENCE