Technologies supporting visual pattern recognition in large datasets (an overview)
12
1 | Page Technologies Supporting Visual Pattern Recognition in Large Datasets (An Overview) (Technical Report UL-CSIS-2014-1) Eimhear O’Brien Department of CSIS, University of Limerick, Ireland [email protected] Nikola S. Nikolov Department of CSIS, and Lero (the Irish Software Engineering Research Centre), University of Limerick, Ireland [email protected] Abstract The aim of this report is to review existing technologies in the area of big data and information visualisation with a view to narrowing the focus of the author’s research project. The preliminary concept of this project is to investigate whether it is possible to define an effective way for people to search for patterns in a large dataset as well as to develop a mechanism for pattern definition. The project centres on the idea of taking a big data dataset of unstructured or structured data, and mining that dataset with a predefined pattern or set of criteria that would produce a subset of data which can then be processed more effectively than the entire dataset. The use of big data as part of the project means that an alternative to the traditional relational database model will have to be implemented. In this case the use of a non-relational NoSQL database model would be highly advantageous. There will also be a requirement to have some form of visualisation of the subsets of data. 1. Introduction This report discusses topics relevant to the author’s research project, the goal of which is to develop a method for efficiently identifying probabilistic matches with the help of a dictionary of predefined patterns.
Transcript of Technologies supporting visual pattern recognition in large datasets (an overview)

1 | P a g e
Technologies Supporting Visual Pattern
Recognition in Large Datasets
(An Overview)
(Technical Report UL-CSIS-2014-1)
Eimhear O’Brien
Department of CSIS, University of Limerick, Ireland
Nikola S. Nikolov
Department of CSIS, and Lero (the Irish Software Engineering Research Centre), University of Limerick,
Ireland
Abstract
The aim of this report is to review existing technologies in the area of big data and information visualisation
with a view to narrowing the focus of the author’s research project. The preliminary concept of this project
is to investigate whether it is possible to define an effective way for people to search for patterns in a large
dataset as well as to develop a mechanism for pattern definition. The project centres on the idea of taking a
big data dataset of unstructured or structured data, and mining that dataset with a predefined pattern or set
of criteria that would produce a subset of data which can then be processed more effectively than the entire
dataset. The use of big data as part of the project means that an alternative to the traditional relational
database model will have to be implemented. In this case the use of a non-relational NoSQL database model
would be highly advantageous. There will also be a requirement to have some form of visualisation of the
subsets of data.
1. Introduction
This report discusses topics relevant to the author’s research project, the goal of which is to develop a
method for efficiently identifying probabilistic matches with the help of a dictionary of predefined patterns.

2 | P a g e
On a larger scale, we see our method employed within a system which retrieves data from a big data source
or store and allows a user to understand it in a visual manner. Application domains include, for example,
medical diagnosis or detection of areas of archaeological significance, or of geographical interest.
Increasing volumes of big data become available every day from government sources, private organisations
and institutions. Big data is the term used to describe any data which is, as the name implies, large in
quantity, it is so large, in fact, that it cannot be stored on one server or computer (Dumbill, 2012, pp. 4-7).
There are 2.5 quintillion bytes of data collected daily throughout the internet (IBM, 2013). According to
some sources, out of all of the data that we have now, 90% of it was produced in the last 2 years (IBM, 2013,
Davis and Patterson, 2012, p. 5). The exponential growth of the data collected globally at present is
unprecedented and thus creates the opportunity as well as the necessity for research and development of
new solutions for analysing, interpreting and making sense of this data. The solutions that are currently
being used to deal with data are increasingly insufficient or unsuitable (Dumbill, 2012, p. 5). The problem of
efficient processing of big data is one of global importance and significance. Traditional data storage
technologies such as relational/SQL databases are becoming ineffective and inefficient for storing and
retrieving big data as they do not scale well. In recent years, the introduction of the NoSQL paradigm has
attempted to accommodate for the shortfall in speed of accessing big data. NoSQL stands for “Not only SQL”
and it refers to a set of new technologies employed for storage of data. While the relational database
systems have some advantages (such as efficient transaction management), the NoSQL technologies allow
for faster retrieval of data compared to them (Sadalage and Fowler, 2012, pp. 10-11).
There are a range of situations where it would be useful for people to be able to search big data stores for
specific types of patterns of data or events. For example, in the fields of archaeology and geography you can
use LIDAR data (LIght Detection And Ranging) and satellite imagery to manually scan small geographical
areas of data using graphical representations of the data in the form of 3D maps (ArcGIS Resources, 2013).
The maps may be used to assess areas for signs of certain types of geographical or archaeological features
that have known parameters. Similarly, in the medical field you can take a scan of the body which is then
assessed for signs of disease or cancer by a medical professional (Jinga, et al, 2013, p. 2029). In these fields,
as in others, it would be extremely helpful to be able to process the increasingly large volumes of data
efficiently and extrapolate the datasets relevant to a given search criteria without all the additional
irrelevant data. This could increase the ability of medical professionals, for example, to detect signs of
disease. A generalised solution would allow people to look for patterns in any data area, and to process
larger volumes of the data more effectively and efficiently.

3 | P a g e
It is assumed that a pattern is not fixed, i.e. it could be a range and, therefore, it should not be expected that
a pattern recognition algorithm would make an exact judgement. Visualisation and visual exploration of a
large dataset may further aid the user in the process of pattern recognition. Furthermore, motivated by the
information explosion in recent years, we would like to consider the case of very large datasets which
require efficient big data management.
2. What is Big Data?
We introduce the concept of big data based on the point of view taken by Dumbill (2012). As briefly
mentioned in the introductory section, big data refers to data that has a significantly large volume. Big data
also refers to data that has a requirement to be processed at a high velocity, or data that comprises a variety
of types and formats. The current methods of processing big data depend on the dataset itself, where it is
stored, and the requirements of the company the data belongs to. The storage options for big data are cloud
storage, data warehousing, in-house data storage or hybrid solutions. The use of cloud storage makes big
data highly accessible to smaller companies. This means that big data technologies could be very attractive
to all companies.
To date the giants of big data have been Google (Google Cloud Platform, 2014), Amazon (amazon web
services, 2014), Yahoo (Yahoo Finance, 2014) and Facebook (Facebook Newsroom, 2014). This is not that
surprising when you consider the generally unstructured datasets that these companies must deal with on a
constant basis, not to mention the volume of data they deal with daily. The issues with big data are not
confined to storage alone. Big data is generally too big to use conventional processing methods of a
relational database solution. Big data also exceeds the processing capacity and speeds of traditional
relational data base models. Processing big data requires new and alternative methods along the lines of
NoSQL technologies and databases to ensure timely processing of data. Processing big data to date is done
either with parallel processing using a data warehouse solution or an Apache Hadoop-based solution
generally on a NoSQL database like MongoDB (Dumbill, 2012, p. 11).
The state of the art in big data is the Apache Hadoop framework and the MapReduce algorithm. “Hadoop
brings the ability to cheaply process large amounts of data, regardless of its structure” (Dumbill, 2012, p. 10).
Hadoop also allows data that is unstructured to be processed in a timely fashion. MapReduce was created by
Google in an effort to speed up web search processing. MapReduce is not just associated with the database
solution offered by Apache Hadoop; it can also be used with other NoSQL databases such as MongoDB.
MapReduce (shown in Fig. 1 and 2) works by splitting a single database query into smaller sub queries which
are then sent out to a distributed database system in order to retrieve the parts of the query in parallel.

4 | P a g e
This speeds up the process of information retrieval. This method also allows for data storage on a distributed
database system which is made up of many smaller, more cost effective servers rather than one large
database.
Fig. 1. MapReduce (Google Developers, 2013) Fig. 2. MapReduce (RWTHAACHEN University,
2013)
This project centres on the idea of taking a big data dataset of unstructured or structured data, and mining
that dataset with a predefined pattern or set of criteria that would produce a subset of data. This subset of
data can then be processed more effectively than the entire dataset. The dataset that we would like to
initially use is a geographical dataset from a geographic information system like ArcGIS. An example of this
would be LIDAR data or Satellite Data. We would like to enhance the processing power of existing
Geographic Information Systems (GIS) to enable users to process larger datasets at greatly increased speeds.
In this case the dataset for an entire province or country would be ideal. The author’s would like to research
and develop a novel optimised technique or algorithm and a framework for the mining of the original
dataset, and the visualisation of the resulting subset of data. For this we feel that big data techniques are an
excellent starting point for our research and are highly relevant to the research topic.
3. Overview of NoSQL Technologies
NoSQL is an umbrella term for a set of database technologies that are not based on the traditional relational
model. Some sources suggest that the term NoSQL refers to “Not only SQL”. While it is true that NoSQL
databases do not use SQL, it is by no means the entire story (Sadalage and Fowler, 2012, pp. 10-11).
Sadalage and Fowler (2012, p. 11) suggest “don’t worry about what the term stands for, but rather about
what it means”. The use of aggregate data models in NoSQL databases makes them easier to distribute over
clusters, than a relational database. Aggregate database models use a group of related data or objects that is
5 | P a g e
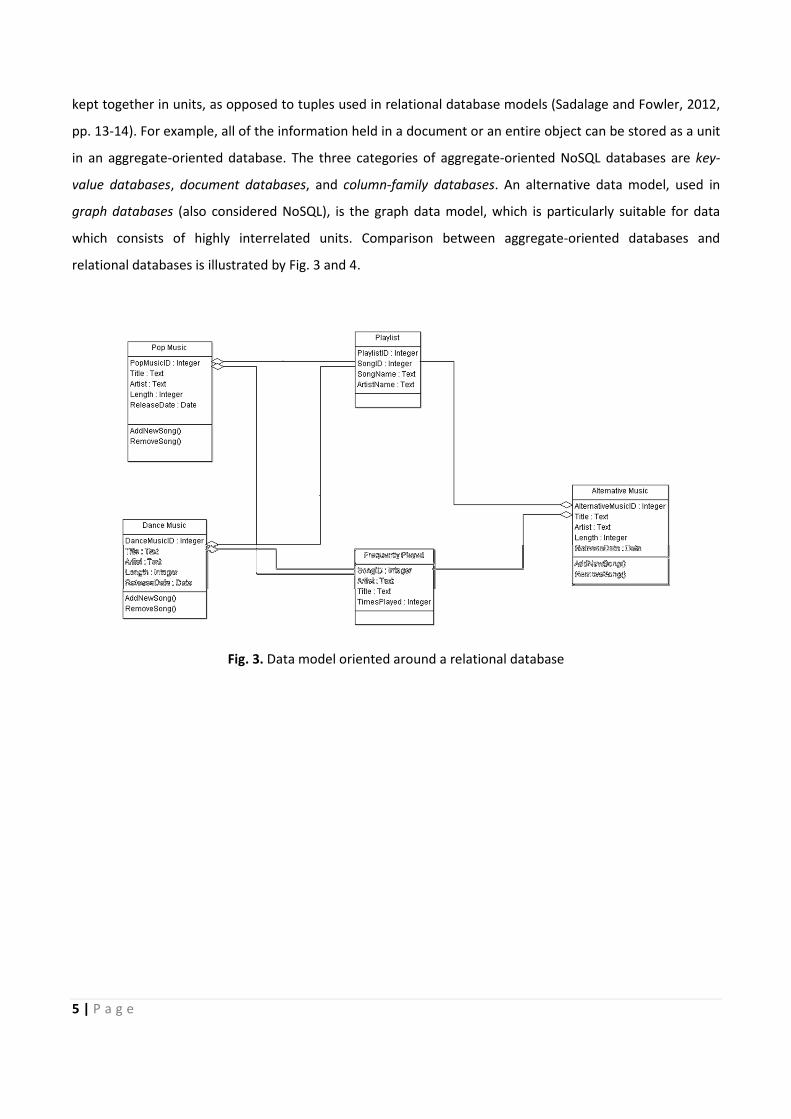
kept together in units, as opposed to tuples used in relational database models (Sadalage and Fowler, 2012,
pp. 13-14). For example, all of the information held in a document or an entire object can be stored as a unit
in an aggregate-oriented database. The three categories of aggregate-oriented NoSQL databases are key-
value databases, document databases, and column-family databases. An alternative data model, used in
graph databases (also considered NoSQL), is the graph data model, which is particularly suitable for data
which consists of highly interrelated units. Comparison between aggregate-oriented databases and
relational databases is illustrated by Fig. 3 and 4.
Fig. 3. Data model oriented around a relational database

6 | P a g e
Fig. 4. An aggregate data model which has embedded all the objects for music.
Relational databases rely on ACID (atomicity-consistency-isolation-durability) transactions to ensure
consistency of the stored data, whereas according to Sadalage and Fowler (2012, pp19-20), aggregate-
oriented databases rely only on atomic transactions on each aggregate unit at different time. When
modelling aggregate-oriented databases, a consideration for the use of the data is important in deciding on
the aggregate units. This is not a consideration when modelling a traditional relational database, which can
be viewed as “aggregate-ignorant”. The main point about aggregate-oriented database models is that the
data is grouped together according to how it is used (Sadalage and Fowler, 2012, p. 25).
3.1 Aggregate Database Systems
Column-family database models are one of the aggregate-oriented data models. Examples of column-family
database systems are Cassandra (Cassandra, 2014), HBase (Apache HBase, 2014) and Google’s BigTable
(Chang et al, 2006). Column-family databases store groups of columns together for all of the rows in a table
as the basic storage unit (or aggregate unit) called a family (Sadalage and Fowler, 2012, pp. 19-20). This is
illustrated in Fig. 5.

7 | P a g e
Fig. 5. Column-Family database.
The basic storage unit in key-value databases is a pair of a key and a value (Sadalage and Fowler, 2012, p.
20). Essentially, any structure of the data stored as a value in such a pair is invisible to the database system,
and the key is used to simply locate it. Thus, a key-value database can store anything as the value in a key-
value pair. Examples of key-value databases are Riak (basho, 2014), Redis (redis, 2014) and Amazon
DynamoDB (amazon web services, 2014).
Document Databases are also aggregate-oriented, examples include MongoDB (mongoDB, 2014), CouchDB
(Apache CouchDB, 2014), OrientDB (OrienTechnologies, 2014) and RavenDB (RavenDB, 2014). The basic
storage unit is a document (usually in the form of an XML or JSON document) which contains an identifier. In
this they are similar to key-value databases; however the structure of the stored document is not invisible to
the database system. (Sadalage and Fowler, 2012, p. 90).
3.2 Graph Database Systems
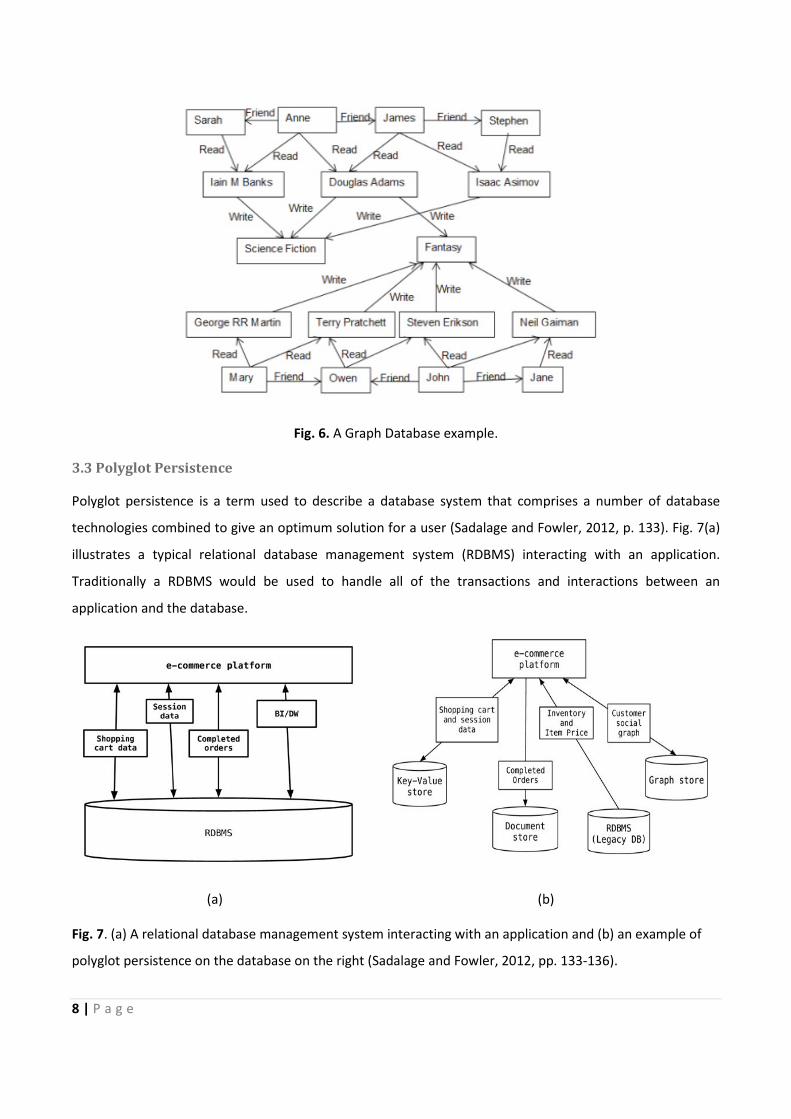
Graph databases are non-aggregate oriented NoSQL databases. Their data model can be viewed as a
relational data model with extra connections (graph edges) between the data nodes (see Fig. 6). Intrinsically,
they are very useful where the connections between the data items are highly complex and the data item
nodes are not usefully grouped into aggregate units. Examples of graph databases are Neo4J (Neo4J, 2014),
and InfiniteGraph (Objectivity, 2014). Unlike aggregate-oriented NoSQL databases, graph databases are
ACID-compliant (Sadalage and Fowler, 2012, p. 114).
8 | P a g e
Fig. 6. A Graph Database example.
3.3 Polyglot Persistence
Polyglot persistence is a term used to describe a database system that comprises a number of database
technologies combined to give an optimum solution for a user (Sadalage and Fowler, 2012, p. 133). Fig. 7(a)
illustrates a typical relational database management system (RDBMS) interacting with an application.
Traditionally a RDBMS would be used to handle all of the transactions and interactions between an
application and the database.
(a) (b)
Fig. 7. (a) A relational database management system interacting with an application and (b) an example of
polyglot persistence on the database on the right (Sadalage and Fowler, 2012, pp. 133-136).

9 | P a g e
With the emergence of NoSQL databases, it has become possible to use different types of databases
combined together to provide the optimum database management solution to users. An example of how
this can be done (with the same data as in Fig. 7(a)) is shown in Fig. 7(b).
The use of big data as part of the author’s project means that an alternative to the traditional relational
database model will have to be implemented. As discussed above a traditional relational database model
would be inadequate when dealing with an extremely big data dataset (measured in petabyte) (Sadalage and
Fowler, 2012, p. 10). In this case, the use of a NoSQL database model would be highly advantageous. It is
possible that polyglot persistence may also be useful; as discussed above, it can be very beneficial in allowing
various database technologies to be utilised in combination to provide an optimum solution to a database
requirement. This will be particularly relevant when we undertake developing a generalised solution to the
research problem.
4. The Role of Visualisation
Visualisation is any technique employed to allow a user to visually explore and analyse data. Visual analytics
finds applications in geographical information systems (GIS), in system biology, in social network analysis, to
name a few. Visualisation techniques enable a user to explore data in a visual manner that typically makes
sense to the user. 3D and 2D visualisation of data can allow users to see patterns in the data as they are
exploring it. Often this is an involved and time consuming process. An example of this is the use of GIS in
identifying areas of archaeological or geographical significance in 3D map data models (digital terrain
models). The use of visualisation of geographical networks (i.e. roads and traffic movements) can help
identify the areas of high use and aid in directing road improvement projects for county councils (Wolff,
2013, pp. 697-698). Visualisation can also be used to map movements of people in terms of migration
patterns (Wolff, 2013, pp. 709-711). Essentially any type of network whether it social, road, underground or
the water table network can be visualised with an appropriate visual model (Wolff, 2013, pp. 697-736).
As part of the author’s project there will be a requirement to have some form of visualisation of the data. It
will require further research to find out what method of visualisation should be used. Visualization will also
be useful from the perspective of presenting the findings of the author’s project to a user in an
understandable way. This will be the last part of the project to be implemented. We aim to generalise the
project so that the results can be applicable to other application domains besides GIS.

10 | P a g e
5. Conclusions
This report reviews existing technologies in the area of big data and information visualisation with a view to
narrowing the focus of the author’s research project. The report outlines the relevance of big data to the
project in the context of management and processing of a big data dataset. We also discussed the currently
available and popular NoSQL technologies and evaluate their relevance to the research project. The four
types of NoSQL databases that have been reviewed include aggregate and non-aggregate models. NoSQL
databases are an alternative to the traditional relational databases and are not intended to be used as a
replacement for them. The polyglot persistence approach promotes the idea of a big data management
system comprised of various database technologies, including NoSQL and relational databases. This is also a
useful concept for upgrading legacy systems which need to handle increasingly larger amounts of data.
Finally, we briefly touched on the subject of visual analytics, which involves techniques for visual exploration
of data. The research project shall develop a novel framework which uses visualisation techniques to
visually explore the subsets of data extrapolated from big data datasets. The project will also make use of
data mining algorithms adapted to the requirements for efficient management of very large datasets

11 | P a g e
References
• Amazon web services (2014) “Amazon DynamoDB” [online], http://aws.amazon.com/dynamodb/,
[accessed 19th
Feb. 2014].
• Amazon web services (2014) “Big Data” [online], http://aws.amazon.com/big-data/, [accessed 19th
Feb.
2014].
• Apache CouchDB (2014) “A Database for the Web” [online], http://couchdb.apache.org/, [accessed 19th
Feb. 2014].
• Apache HBase (2014) “Welcome to Apache HBase” [online], https://hbase.apache.org/, [accessed 19th
Feb. 2014].
• ArcGIS Resources (2013) “The architecture of a geodatabase” [online],
http://resources.arcgis.com/en/help/main/10.1/index.html#/The_architecture_of_a_geodatabase/003n
000000r4000000/, [accessed 21st
Nov. 2013].
• Basho (2014) “riak” [online], http://basho.com/riak/, [accessed 19th
Feb. 2014].
• Cassandra (2014) “Welcome to Apache Cassandra” [online], http://cassandra.apache.org/, [accessed
19th
Feb. 2014].
• Chang, F., Dean, J., Ghemawat, S., Hsieh, W.C., Wallach, D.A., Burrows, M., Chandra, T., Fikes, A., and
Gruber, R.E. (2006) “Bigtable: A Distributed Storage System for Structured Data”, OSDI'06: Seventh
Symposium on Operating System Design and Implementation, Seattle, WA.
• Davis, K. and Patterson, D. (2012) Ethics of Big Data, Cambridge: O’Reilly Media.
• Dumbill, E. (2012) “What Is Big Data?” in Slocum, M. (2012) Big Data Now: 2012 Edition, O'Reilly Media,
pp. 3-10.
• Dumbill, E. (2012) “Why Big Data Is Big: The Digital Nervous System” in Slocum, M. (2012) Big Data Now:
2012 Edition, O'Reilly Media, pp. 15-17.
• Facebook Newsroom (2014) “Infrastructure – Our Scale” [online],
http://newsroom.fb.com/Infrastructure, [accessed 19th
Feb. 2014].
• Google Developers (2013) “MapReduce Python Overview” [online],
https://developers.google.com/appengine/docs/python/dataprocessing, [accessed 21st
Nov. 2013].
• Healy, P. and Nikolov, N.S. (2013) “Hierarchial Drawing Algorithms” in Tamassia, R. ed. Handbook of
Graph Drawing and Visualization, Chapman and Hall/CRC, 409-454.
• Howard, J., Zwemer, M. and Loukides, M. (2012) “Designing Great Data Products” in Slocum, M. (2012)
Big Data Now: 2012 Edition, O'Reilly Media, pp. 19-35.
• IBM (October 2013) “What is big data?”[online], http://www-01.ibm.com/software/data/bigdata/what-
is-big-data.html, [accessed 10th
Oct. 2013].

12 | P a g e
• Jinga, H., Lia, F., Zhuangb, H., Wanga, Z., Tiana, J., Xingc, X., Jind, J., Zhonge, D., Zhang, J. (2013) “Effective
detection of the tumors causing osteomalacia using [Tc-99m]-HYNIC-octreotide (99mTc-HYNIC-TOC)
whole body”, European Journal of Radiology, 82, (2013), pp. 2028-2034.
• mongoDB (2014) “Agile and Scalable” [online], http://www.mongodb.org/, [accessed 19th
Feb. 2014].
• Neo4J (2014) “Get Neo4J, your graph database” [online], http://www.neo4j.org/, [accessed 19th
Feb.
2014].
• Objectivity (2014) “InfiniteGraph 3.1 Overview” [online],
http://www.objectivity.com/infinitegraph#.UwSHg4V4lp0, [accessed 19th
Feb. 2014].
• O'Reilly Radar Team (2011) Big Data Now: Current Perspectives from O'Reilly Radar, O'Reilly Media.
• OrienTechnologies (2014) “What is OrientDB” [online], http://www.orientechnologies.com/orientdb/,
[accessed 19th
Feb. 2014].
• RavenDB (2014) “Features” [online], http://ravendb.net/features, [accessed 19th
Feb. 2014].
• Redis (2014) “Introduction to Redis” [online], http://redis.io/topics/introduction, [accessed 19th
Feb.
2014].
• Robinson, I., Webber, J. and Eifrem, E. (2013) Graph Databases, Cambridge: O’Reilly Media.
• RWTHAACHEN University, (2013), “MapReduce” [online], http://dme.rwth-
aachen.de/de/research/projects/mapreduce, [accessed 21st
Nov. 2013]
• Slocum, M. (2012) “Stories over Spreadsheets” in Slocum, M. (2012) Big Data Now: 2012 Edition, O'Reilly
Media, pp. 41-43.
• Sadalage, P.J. and Fowler, M. (2012) NoSQL Distilled: A Brief Guide to the Emerging World of Polyglot
Persistence, London: Addison-Wesley.
• Wolff, A. (2013) “Graph Drawing and Cartography” in Tamassia, R. ed. Handbook of Graph Drawing and
Visualization, Chapman and Hall/CRC, 697-736.
• Yahoo Finance (2014) “Big Data Download – CNBC | Yahoo Finance” [online],
http://finance.yahoo.com/blogs/big-data-download/, [accessed 19th
Feb. 2014].