Technical Reliability Assessment of the Actigraph GT1M Accelerometer
14
PLEASE SCROLL DOWN FOR ARTICLE This article was downloaded by: [B-on Consortium - 2007] On: 16 April 2010 Access details: Access Details: [subscription number 919435511] Publisher Routledge Informa Ltd Registered in England and Wales Registered Number: 1072954 Registered office: Mortimer House, 37- 41 Mortimer Street, London W1T 3JH, UK Measurement in Physical Education and Exercise Science Publication details, including instructions for authors and subscription information: http://www.informaworld.com/smpp/title~content=t775653683 Technical Reliability Assessment of the Actigraph GT1M Accelerometer Pedro Silva a ; Jorge Mota a ; Dale Esliger b ;Gregory Welk c a Research Centre in Physical Activity, Health and Leisure, University of Porto, Porto, Portugal b School of Sport and Health Sciences, University of Exeter, Exeter, UK c Kinesiology Department, Iowa State University, Ames, Iowa Online publication date: 16 April 2010 To cite this Article Silva, Pedro , Mota, Jorge , Esliger, Dale andWelk, Gregory(2010) 'Technical Reliability Assessment of the Actigraph GT1M Accelerometer', Measurement in Physical Education and Exercise Science, 14: 2, 79 — 91 To link to this Article: DOI: 10.1080/10913671003715524 URL: http://dx.doi.org/10.1080/10913671003715524 Full terms and conditions of use: http://www.informaworld.com/terms-and-conditions-of-access.pdf This article may be used for research, teaching and private study purposes. Any substantial or systematic reproduction, re-distribution, re-selling, loan or sub-licensing, systematic supply or distribution in any form to anyone is expressly forbidden. The publisher does not give any warranty express or implied or make any representation that the contents will be complete or accurate or up to date. The accuracy of any instructions, formulae and drug doses should be independently verified with primary sources. The publisher shall not be liable for any loss, actions, claims, proceedings, demand or costs or damages whatsoever or howsoever caused arising directly or indirectly in connection with or arising out of the use of this material.
-
Upload
independent -
Category
Documents
-
view
0 -
download
0
Transcript of Technical Reliability Assessment of the Actigraph GT1M Accelerometer
PLEASE SCROLL DOWN FOR ARTICLE
This article was downloaded by: [B-on Consortium - 2007]On: 16 April 2010Access details: Access Details: [subscription number 919435511]Publisher RoutledgeInforma Ltd Registered in England and Wales Registered Number: 1072954 Registered office: Mortimer House, 37-41 Mortimer Street, London W1T 3JH, UK
Measurement in Physical Education and Exercise SciencePublication details, including instructions for authors and subscription information:http://www.informaworld.com/smpp/title~content=t775653683
Technical Reliability Assessment of the Actigraph GT1M AccelerometerPedro Silva a; Jorge Mota a; Dale Esliger b;Gregory Welk c
a Research Centre in Physical Activity, Health and Leisure, University of Porto, Porto, Portugal b
School of Sport and Health Sciences, University of Exeter, Exeter, UK c Kinesiology Department, IowaState University, Ames, Iowa
Online publication date: 16 April 2010
To cite this Article Silva, Pedro , Mota, Jorge , Esliger, Dale andWelk, Gregory(2010) 'Technical Reliability Assessment ofthe Actigraph GT1M Accelerometer', Measurement in Physical Education and Exercise Science, 14: 2, 79 — 91To link to this Article: DOI: 10.1080/10913671003715524URL: http://dx.doi.org/10.1080/10913671003715524
Full terms and conditions of use: http://www.informaworld.com/terms-and-conditions-of-access.pdf
This article may be used for research, teaching and private study purposes. Any substantial orsystematic reproduction, re-distribution, re-selling, loan or sub-licensing, systematic supply ordistribution in any form to anyone is expressly forbidden.
The publisher does not give any warranty express or implied or make any representation that the contentswill be complete or accurate or up to date. The accuracy of any instructions, formulae and drug dosesshould be independently verified with primary sources. The publisher shall not be liable for any loss,actions, claims, proceedings, demand or costs or damages whatsoever or howsoever caused arising directlyor indirectly in connection with or arising out of the use of this material.
Measurement in Physical Education and Exercise Science, 14: 79–91, 2010Copyright © Taylor & Francis Group, LLCISSN: 1091-367X print / 1532-7841 onlineDOI: 10.1080/10913671003715524
Technical Reliability Assessment of the ActigraphGT1M Accelerometer
Pedro Silva and Jorge Mota
Research Centre in Physical Activity, Health and Leisure, University of Porto, Porto, Portugal
Dale EsligerSchool of Sport and Health Sciences, University of Exeter, Exeter, UK
Gregory WelkKinesiology Department, Iowa State University, Ames, Iowa
The purpose of this study was to determine the reliability of the Actigraph GT1M (Pensacola, FL,USA) accelerometer activity count and step functions. Fifty GT1M accelerometers were initializedto collect simultaneous acceleration counts and steps data using 15-sec epochs. All reliability testingwas completed using a mechanical shaker plate to perform six different test conditions in Experiment1 and 18 test conditions in Experiment 2. The overall intra- and inter-instrument reliability of theGT1M was CVintra = 2.9% and CVinter = 3.5% for counts and CVintra = 1.1% and CVinter = 1.2%for steps. No batch effects were evident in the 50 GT1Ms. The Actigraph GT1M accelerometerdemonstrated good reliability for measuring both counts and steps. However, the ability of the GT1Mto consistently detect acceleration at a given acceleration and frequency condition varied widely.Future studies clarifying the filtering limitations and the threshold necessary to detect the occurrenceof movement are warranted.
Key words: frequency, pedometer, filter, acceleration
INTRODUCTION
Researchers have many options for assessing physical activity. The choice of assessment tooltypically requires a trade-off between feasibility and validity. Accelerometers have gained accep-tance as an effective option because they are objective, easy to use, and provide reasonably validindicators of activity. The acceptance has led accelerometers to be used even in large studies(Riddoch et al., 2004; Troiano, Berrigan, Dodd, Masse, Tilert, & McDowell, 2008; Tudor-Locke,
Correspondence should be sent to Mr. Pedro Silva, Research Centre in Physical Activity, Health and Leisure,University of Porto, Rua Dr. Plácido Costa 91, Porto, 4200-450, Portugal. E-mail: [email protected]
Downloaded By: [B-on Consortium - 2007] At: 16:11 16 April 2010
80 SILVA ET AL.
Ainsworth, Adair, & Popkin, 2003). Best practice guidelines and research recommendations forusing accelerometers in the physical activity assessment have been produced (Ward, Evenson,Vaughn, Rodgers, & Troiano, 2005), and recommendations for optimizing and standardizing theuse of accelerometer data have also been developed (Esliger, Copeland, Barnes, & Tremblay,2005; Esliger & Tremblay, 2007). Although progress has been made, there are many unansweredquestions. One fundamental issue that affects all research with accelerometers is the techni-cal reliability of measured acceleration data. Since researchers make use of large numbers ofaccelerometers, it is important to understand how much variability exists between units and howvariable responses may be over time (Welk, Schaben, & Morrow, 2004).
The reliability of the original CSA/MTI 7164 accelerometer has been evaluated in laboratorysettings (Patterson, Krantz, Montgomery, Deuster, Hedges, & Nebel, 1993; Westerterp, 1999),free-living settings (McClain, Sisson, & Tudor-Locke, 2007; Plasqui & Westerterp, 2007; Sirard,Melanson, Li, & Freedson, 2000), both laboratorial and field conditions (Bassett, Ainsworth,Swartz, Strath, O’Brien, & King, 2000; Nichols, Morgan, Chabot, Sallis, & Calfas, 2000; Puyau,Adolph, Vohra, & Butte, 2002; Welk, Blair, Wood, Jones, & Thompson, 2000), controlledmechanical settings (Brage, Brage, Wedderkopp, & Froberg, 2003; Esliger & Tremblay, 2006;Metcalf, Curnow, Evans, Voss, & Wilkin, 2002), and also within different populations (Freedson,Pober, & Janz, 2005; Janz, 1994; Mattocks et al., 2008; McClain et al., 2007; Storti, Pettee,Brach, Talkowski, Richardson, & Kriska, 2008; Toschke, von Kries, Rosenfeld, & Toschke,2007). Results have been viewed as acceptable for most research applications; however, thecompany recently released a newer version (GT1M) with updated software and hardware config-urations. The GT1M monitor was developed with solid state accelerometer circuitry and digitalfiltering to improve the reliability and repeatability of the measurements. The company reportsthat each unit is calibrated as part of Actigraph, LLC’s standard manufacturing process, andthat calibration holds through the life of the product (Actigraph, 2008a). The company tookspecific steps to try to ensure that the new model would operate similarly to the old model(to ensure backward compatibility), but recent studies suggest that the GT1M count varies sig-nificantly from the original and that the bias varies with intensity (Corder, Brage, Ramachandran,Snehalatha, Wareham, & Ekelund, 2007).
Since the appearance of this new Actigraph model, some studies have started to examinereliability issues and to make comparisons with the earlier versions (Brage, van Hees, & Brage,2009; Rothney, Apker, Song, & Chen, 2008). However, to the authors’ knowledge, there havebeen no studies reporting on the reliability of the GT1M accelerometer for assessing activitycounts and steps. Likewise, little information is available that describes the threshold detectionlevels of the Actigraph. Therefore, the purpose of this study was (a) to determine the intra-instrument and inter-instrument reliability of the GT1M and (b) to determine its accelerationthreshold detection levels using a controlled mechanical setup.
METHODS
Separated into two experiments, the GT1M accelerometers were exposed to 24 different con-ditions (varying in acceleration and/or frequency) to ensure that each unit performed withintolerable variability limits and to indentify the threshold for counts detection.
Downloaded By: [B-on Consortium - 2007] At: 16:11 16 April 2010
RELIABILITY OF THE ACTIGRAPH GT1M ACCELEROMETER 81
GT1M ACCELEROMETER
The Actigraph GT1M accelerometer has the following characteristics: dimensions—L 38 ×W 37 × H 18 (mm), weight—27 g, solid state sensor—micro-electro-mechanical systems(MEMS), dynamic range—.05–2.5 g, and frequency range—.25–2.5 (Hz) (Actigraph, 2008b).The manufacturer states that the GT1M series of products have swapped out the piezoelectricbeam used in the original Actigraph with a highly accurate solid state accelerometer. The newMEMS accelerometer undergoes a precise batch manufacturing process to ensure high repeata-bility. The filter is now implemented within the software of the GT1M, effectively removingunit-to-unit variability due to this source, leaving only the accelerometer vendor’s initial tol-erance specification on sensitivity as the primary source of error. The accelerometer vendormanufactures the device to ensure that the initial tolerance specification on sensitivity only variesby ± 10% (Actigraph, 2008a).
MECHANICAL SETUP
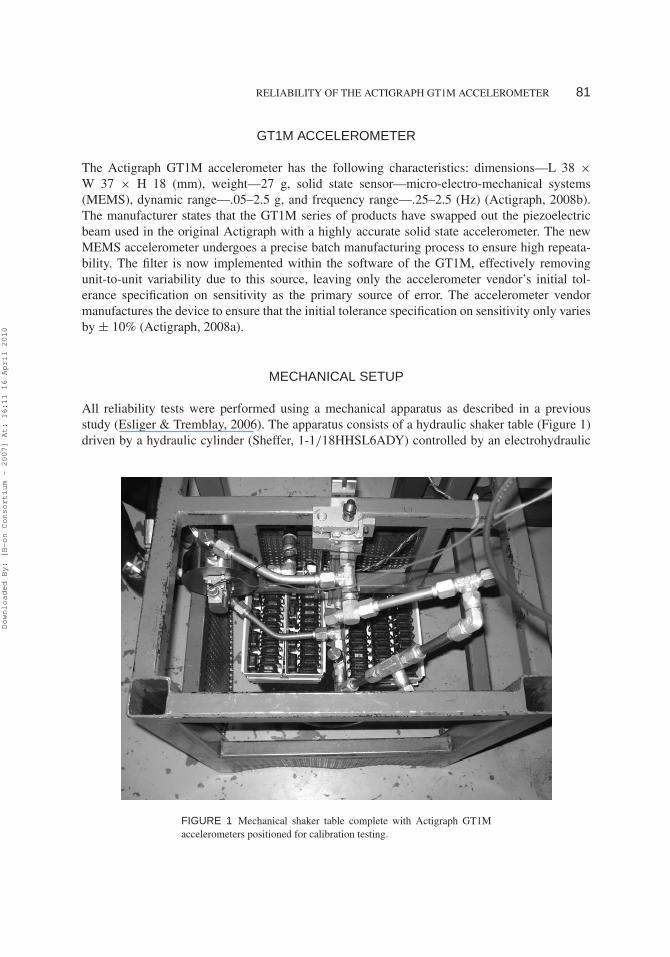
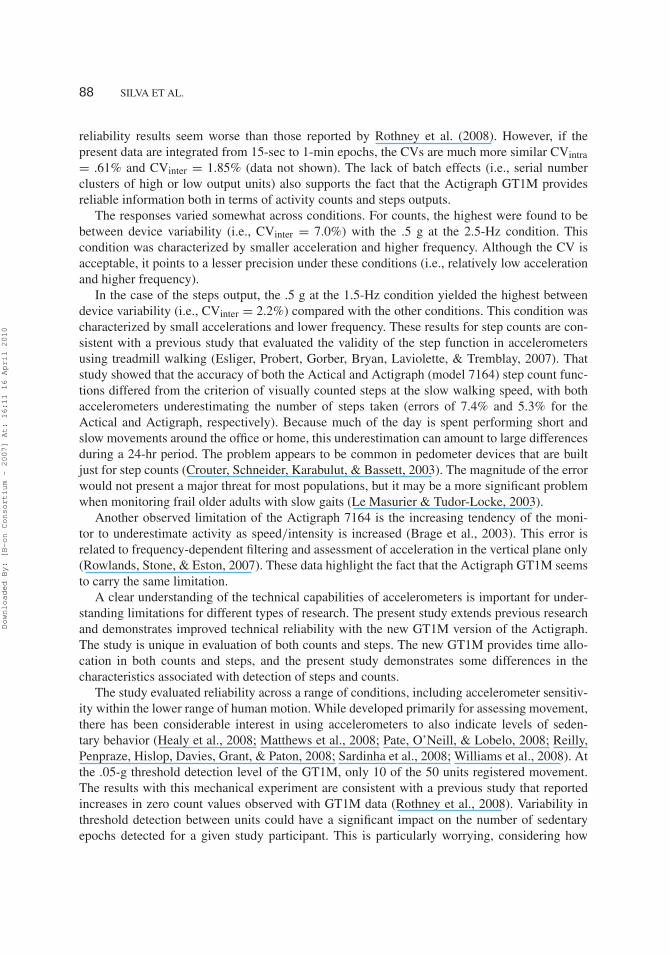
All reliability tests were performed using a mechanical apparatus as described in a previousstudy (Esliger & Tremblay, 2006). The apparatus consists of a hydraulic shaker table (Figure 1)driven by a hydraulic cylinder (Sheffer, 1-1/18HHSL6ADY) controlled by an electrohydraulic
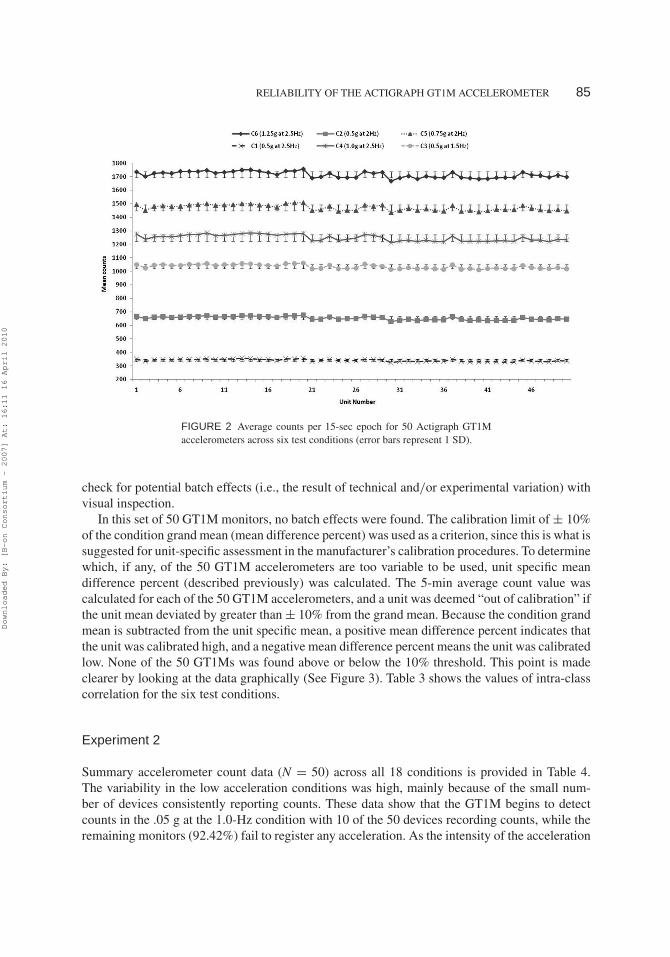
FIGURE 1 Mechanical shaker table complete with Actigraph GT1Maccelerometers positioned for calibration testing.
Downloaded By: [B-on Consortium - 2007] At: 16:11 16 April 2010
82 SILVA ET AL.
servo valve with cylinder position feedback. A position transducer (Lucas 5000, DC-E) wasused to measure position of the table, and a high grade control accelerometer (calibrated at98.1 mV·g−1 ± 3.6%) (B&K model 4371) was attached to the table to measure vertical accel-eration. The acceleration signal was transmitted to a charge amplifier (B&K model 2635) andband-passed filtered at 3 KHz. The amplifier input was provided by a function generator, whichwas programmed to accurately and reliably oscillate the platform at the various testing conditionsusing a sinusoidal oscillation procedure. The separation of the hydraulic power supply from theshaker table helped to minimize the vibration in the mechanical setup.
PROCEDURES
Experiment 1
Fifty GT1M accelerometers were initialized to collect simultaneous acceleration count and stepdata using 15-sec epochs. The computerized initialization function of the GT1M made time syn-chronization easy to attain. The accelerometers were mounted to the surface of the shaker plate(surface area approximately 1,500 cm2) using industrial quality hook-and-loop material. Carewas taken to ensure that the monitors were secured firmly and were positioned vertically alongtheir sensitive axis in order to maximize and standardize the output of the sensor.
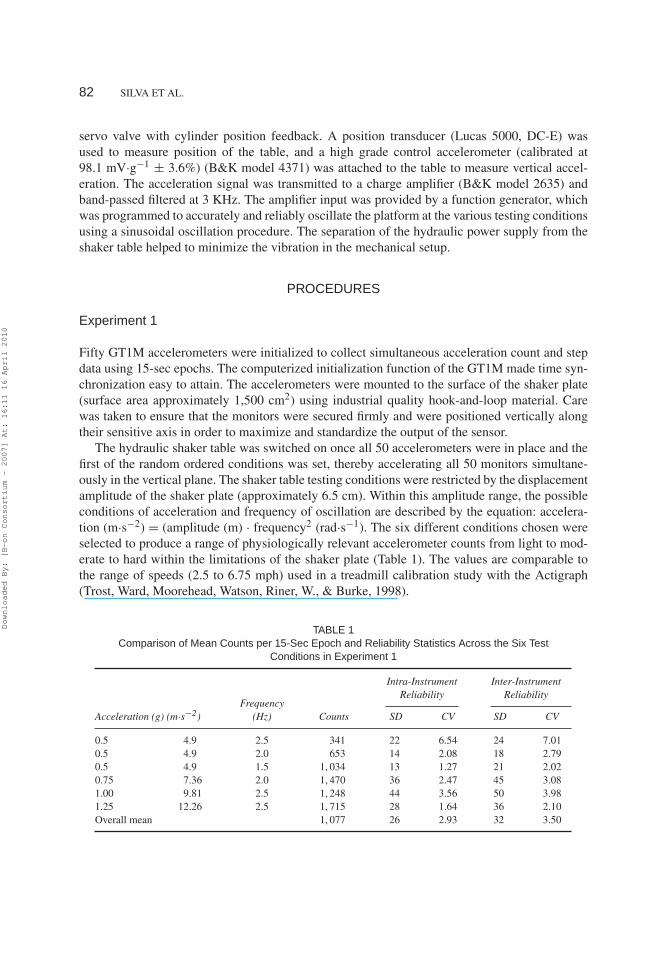
The hydraulic shaker table was switched on once all 50 accelerometers were in place and thefirst of the random ordered conditions was set, thereby accelerating all 50 monitors simultane-ously in the vertical plane. The shaker table testing conditions were restricted by the displacementamplitude of the shaker plate (approximately 6.5 cm). Within this amplitude range, the possibleconditions of acceleration and frequency of oscillation are described by the equation: accelera-tion (m·s−2) = (amplitude (m) · frequency2 (rad·s−1). The six different conditions chosen wereselected to produce a range of physiologically relevant accelerometer counts from light to mod-erate to hard within the limitations of the shaker plate (Table 1). The values are comparable tothe range of speeds (2.5 to 6.75 mph) used in a treadmill calibration study with the Actigraph(Trost, Ward, Moorehead, Watson, Riner, W., & Burke, 1998).
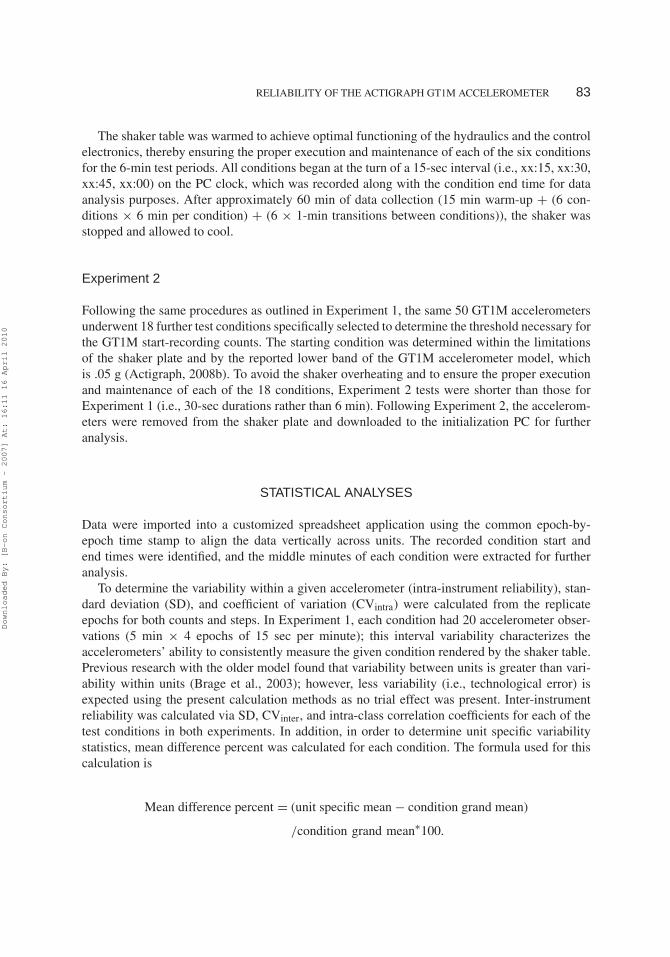
TABLE 1Comparison of Mean Counts per 15-Sec Epoch and Reliability Statistics Across the Six Test
Conditions in Experiment 1
Intra-InstrumentReliability
Inter-InstrumentReliability
Acceleration (g) (m·s−2)Frequency
(Hz) Counts SD CV SD CV
0.5 4.9 2.5 341 22 6.54 24 7.010.5 4.9 2.0 653 14 2.08 18 2.790.5 4.9 1.5 1, 034 13 1.27 21 2.020.75 7.36 2.0 1, 470 36 2.47 45 3.081.00 9.81 2.5 1, 248 44 3.56 50 3.981.25 12.26 2.5 1, 715 28 1.64 36 2.10Overall mean 1, 077 26 2.93 32 3.50
Downloaded By: [B-on Consortium - 2007] At: 16:11 16 April 2010
RELIABILITY OF THE ACTIGRAPH GT1M ACCELEROMETER 83
The shaker table was warmed to achieve optimal functioning of the hydraulics and the controlelectronics, thereby ensuring the proper execution and maintenance of each of the six conditionsfor the 6-min test periods. All conditions began at the turn of a 15-sec interval (i.e., xx:15, xx:30,xx:45, xx:00) on the PC clock, which was recorded along with the condition end time for dataanalysis purposes. After approximately 60 min of data collection (15 min warm-up + (6 con-ditions × 6 min per condition) + (6 × 1-min transitions between conditions)), the shaker wasstopped and allowed to cool.
Experiment 2
Following the same procedures as outlined in Experiment 1, the same 50 GT1M accelerometersunderwent 18 further test conditions specifically selected to determine the threshold necessary forthe GT1M start-recording counts. The starting condition was determined within the limitationsof the shaker plate and by the reported lower band of the GT1M accelerometer model, whichis .05 g (Actigraph, 2008b). To avoid the shaker overheating and to ensure the proper executionand maintenance of each of the 18 conditions, Experiment 2 tests were shorter than those forExperiment 1 (i.e., 30-sec durations rather than 6 min). Following Experiment 2, the accelerom-eters were removed from the shaker plate and downloaded to the initialization PC for furtheranalysis.
STATISTICAL ANALYSES
Data were imported into a customized spreadsheet application using the common epoch-by-epoch time stamp to align the data vertically across units. The recorded condition start andend times were identified, and the middle minutes of each condition were extracted for furtheranalysis.
To determine the variability within a given accelerometer (intra-instrument reliability), stan-dard deviation (SD), and coefficient of variation (CVintra) were calculated from the replicateepochs for both counts and steps. In Experiment 1, each condition had 20 accelerometer obser-vations (5 min × 4 epochs of 15 sec per minute); this interval variability characterizes theaccelerometers’ ability to consistently measure the given condition rendered by the shaker table.Previous research with the older model found that variability between units is greater than vari-ability within units (Brage et al., 2003); however, less variability (i.e., technological error) isexpected using the present calculation methods as no trial effect was present. Inter-instrumentreliability was calculated via SD, CVinter, and intra-class correlation coefficients for each of thetest conditions in both experiments. In addition, in order to determine unit specific variabilitystatistics, mean difference percent was calculated for each condition. The formula used for thiscalculation is
Mean difference percent = (unit specific mean − condition grand mean)
/condition grand mean∗100.
Downloaded By: [B-on Consortium - 2007] At: 16:11 16 April 2010
84 SILVA ET AL.
RESULTS
Experiment 1
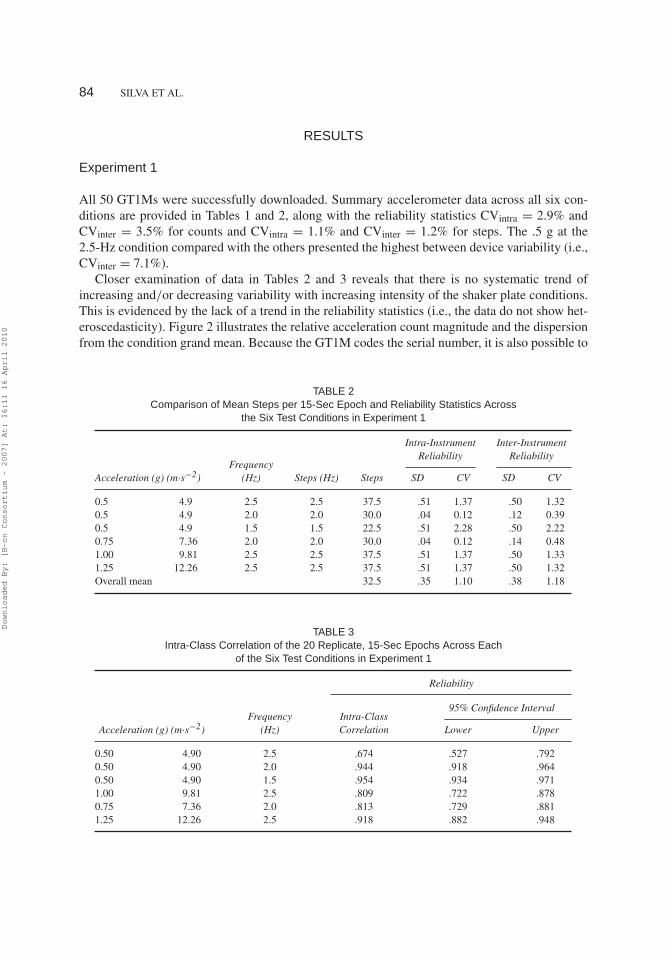
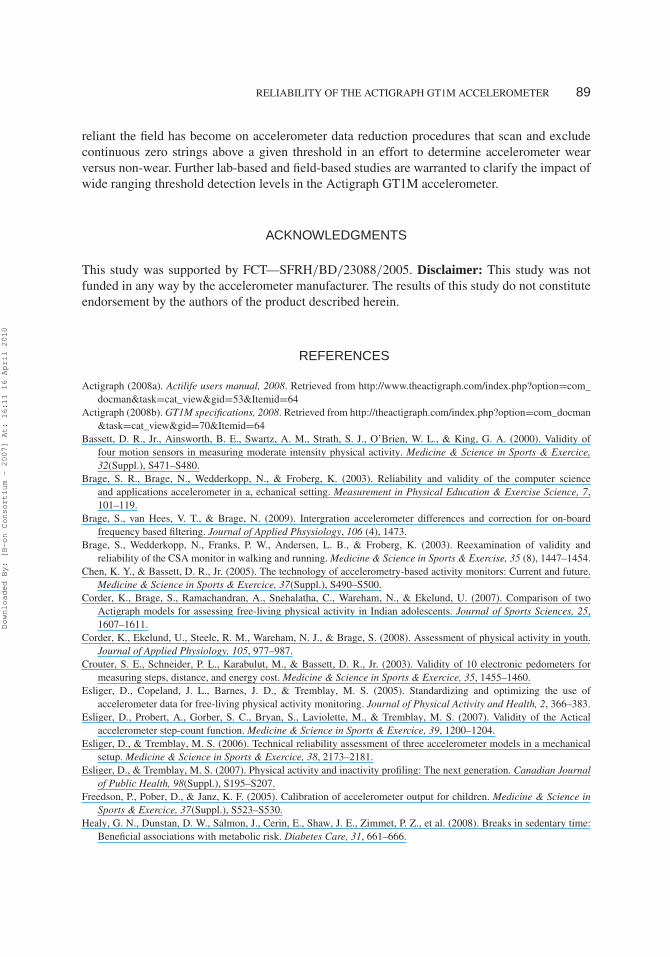
All 50 GT1Ms were successfully downloaded. Summary accelerometer data across all six con-ditions are provided in Tables 1 and 2, along with the reliability statistics CVintra = 2.9% andCVinter = 3.5% for counts and CVintra = 1.1% and CVinter = 1.2% for steps. The .5 g at the2.5-Hz condition compared with the others presented the highest between device variability (i.e.,CVinter = 7.1%).
Closer examination of data in Tables 2 and 3 reveals that there is no systematic trend ofincreasing and/or decreasing variability with increasing intensity of the shaker plate conditions.This is evidenced by the lack of a trend in the reliability statistics (i.e., the data do not show het-eroscedasticity). Figure 2 illustrates the relative acceleration count magnitude and the dispersionfrom the condition grand mean. Because the GT1M codes the serial number, it is also possible to
TABLE 2Comparison of Mean Steps per 15-Sec Epoch and Reliability Statistics Across
the Six Test Conditions in Experiment 1
Intra-InstrumentReliability
Inter-InstrumentReliability
Acceleration (g) (m·s−2)Frequency
(Hz) Steps (Hz) Steps SD CV SD CV
0.5 4.9 2.5 2.5 37.5 .51 1.37 .50 1.320.5 4.9 2.0 2.0 30.0 .04 0.12 .12 0.390.5 4.9 1.5 1.5 22.5 .51 2.28 .50 2.220.75 7.36 2.0 2.0 30.0 .04 0.12 .14 0.481.00 9.81 2.5 2.5 37.5 .51 1.37 .50 1.331.25 12.26 2.5 2.5 37.5 .51 1.37 .50 1.32Overall mean 32.5 .35 1.10 .38 1.18
TABLE 3Intra-Class Correlation of the 20 Replicate, 15-Sec Epochs Across Each
of the Six Test Conditions in Experiment 1
Reliability
95% Confidence Interval
Acceleration (g) (m·s−2)Frequency
(Hz)Intra-ClassCorrelation Lower Upper
0.50 4.90 2.5 .674 .527 .7920.50 4.90 2.0 .944 .918 .9640.50 4.90 1.5 .954 .934 .9711.00 9.81 2.5 .809 .722 .8780.75 7.36 2.0 .813 .729 .8811.25 12.26 2.5 .918 .882 .948
Downloaded By: [B-on Consortium - 2007] At: 16:11 16 April 2010
RELIABILITY OF THE ACTIGRAPH GT1M ACCELEROMETER 85
FIGURE 2 Average counts per 15-sec epoch for 50 Actigraph GT1Maccelerometers across six test conditions (error bars represent 1 SD).
check for potential batch effects (i.e., the result of technical and/or experimental variation) withvisual inspection.
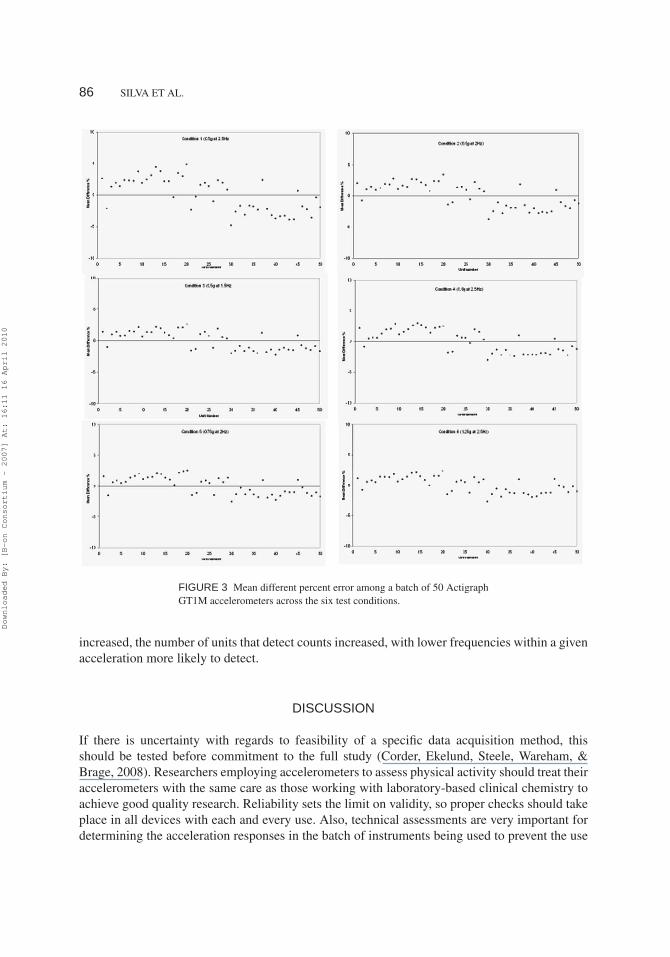
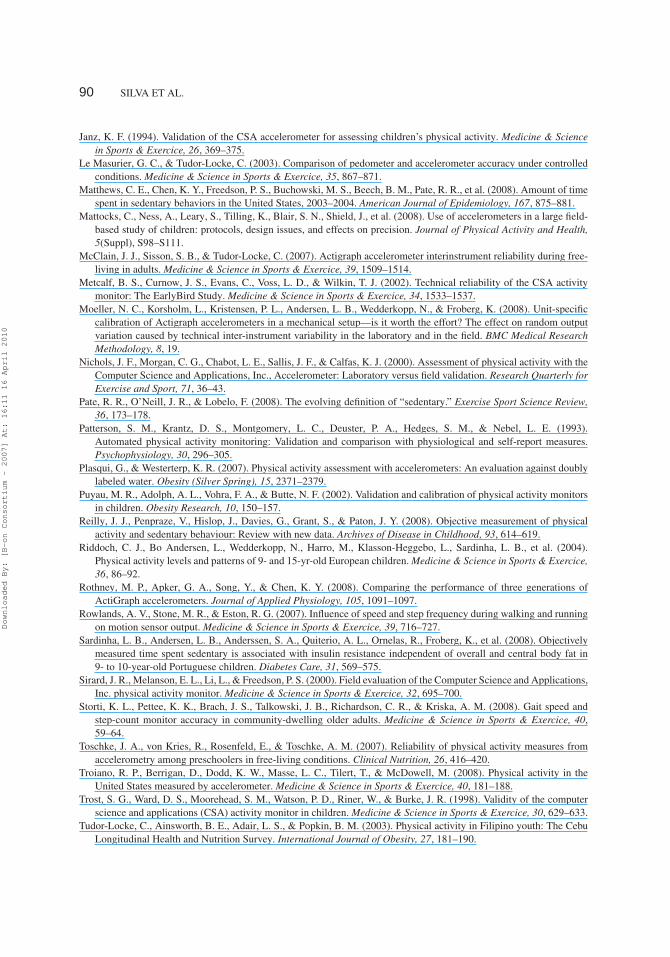
In this set of 50 GT1M monitors, no batch effects were found. The calibration limit of ± 10%of the condition grand mean (mean difference percent) was used as a criterion, since this is what issuggested for unit-specific assessment in the manufacturer’s calibration procedures. To determinewhich, if any, of the 50 GT1M accelerometers are too variable to be used, unit specific meandifference percent (described previously) was calculated. The 5-min average count value wascalculated for each of the 50 GT1M accelerometers, and a unit was deemed “out of calibration” ifthe unit mean deviated by greater than ± 10% from the grand mean. Because the condition grandmean is subtracted from the unit specific mean, a positive mean difference percent indicates thatthe unit was calibrated high, and a negative mean difference percent means the unit was calibratedlow. None of the 50 GT1Ms was found above or below the 10% threshold. This point is madeclearer by looking at the data graphically (See Figure 3). Table 3 shows the values of intra-classcorrelation for the six test conditions.
Experiment 2
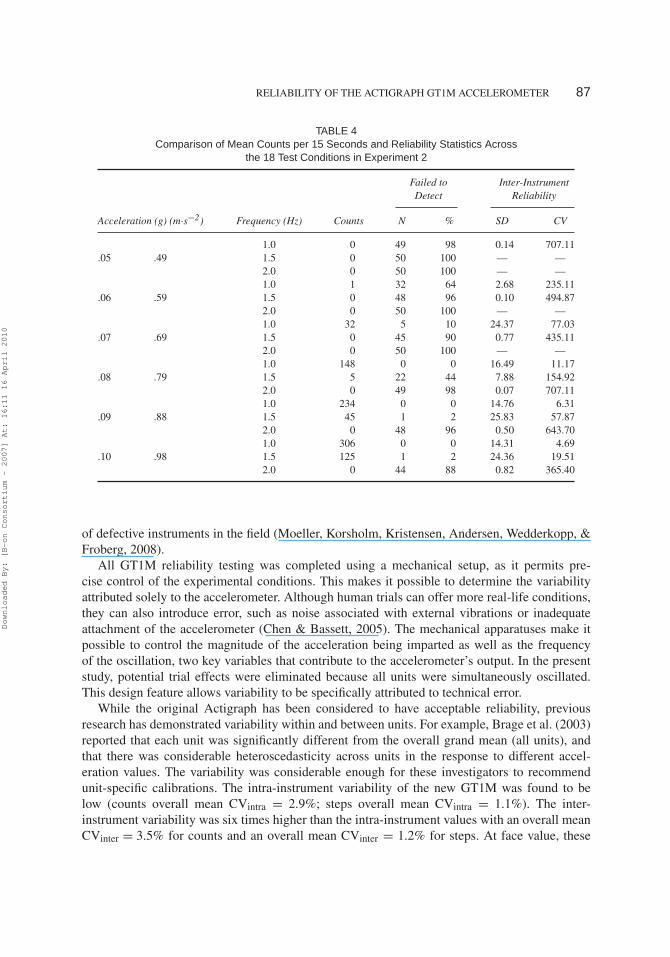
Summary accelerometer count data (N = 50) across all 18 conditions is provided in Table 4.The variability in the low acceleration conditions was high, mainly because of the small num-ber of devices consistently reporting counts. These data show that the GT1M begins to detectcounts in the .05 g at the 1.0-Hz condition with 10 of the 50 devices recording counts, while theremaining monitors (92.42%) fail to register any acceleration. As the intensity of the acceleration
Downloaded By: [B-on Consortium - 2007] At: 16:11 16 April 2010
86 SILVA ET AL.
FIGURE 3 Mean different percent error among a batch of 50 ActigraphGT1M accelerometers across the six test conditions.
increased, the number of units that detect counts increased, with lower frequencies within a givenacceleration more likely to detect.
DISCUSSION
If there is uncertainty with regards to feasibility of a specific data acquisition method, thisshould be tested before commitment to the full study (Corder, Ekelund, Steele, Wareham, &Brage, 2008). Researchers employing accelerometers to assess physical activity should treat theiraccelerometers with the same care as those working with laboratory-based clinical chemistry toachieve good quality research. Reliability sets the limit on validity, so proper checks should takeplace in all devices with each and every use. Also, technical assessments are very important fordetermining the acceleration responses in the batch of instruments being used to prevent the use
Downloaded By: [B-on Consortium - 2007] At: 16:11 16 April 2010
RELIABILITY OF THE ACTIGRAPH GT1M ACCELEROMETER 87
TABLE 4Comparison of Mean Counts per 15 Seconds and Reliability Statistics Across
the 18 Test Conditions in Experiment 2
Failed toDetect
Inter-InstrumentReliability
Acceleration (g) (m·s−2) Frequency (Hz) Counts N % SD CV
1.0 0 49 98 0.14 707.11.05 .49 1.5 0 50 100 — —
2.0 0 50 100 — —1.0 1 32 64 2.68 235.11
.06 .59 1.5 0 48 96 0.10 494.872.0 0 50 100 — —1.0 32 5 10 24.37 77.03
.07 .69 1.5 0 45 90 0.77 435.112.0 0 50 100 — —1.0 148 0 0 16.49 11.17
.08 .79 1.5 5 22 44 7.88 154.922.0 0 49 98 0.07 707.111.0 234 0 0 14.76 6.31
.09 .88 1.5 45 1 2 25.83 57.872.0 0 48 96 0.50 643.701.0 306 0 0 14.31 4.69
.10 .98 1.5 125 1 2 24.36 19.512.0 0 44 88 0.82 365.40
of defective instruments in the field (Moeller, Korsholm, Kristensen, Andersen, Wedderkopp, &Froberg, 2008).
All GT1M reliability testing was completed using a mechanical setup, as it permits pre-cise control of the experimental conditions. This makes it possible to determine the variabilityattributed solely to the accelerometer. Although human trials can offer more real-life conditions,they can also introduce error, such as noise associated with external vibrations or inadequateattachment of the accelerometer (Chen & Bassett, 2005). The mechanical apparatuses make itpossible to control the magnitude of the acceleration being imparted as well as the frequencyof the oscillation, two key variables that contribute to the accelerometer’s output. In the presentstudy, potential trial effects were eliminated because all units were simultaneously oscillated.This design feature allows variability to be specifically attributed to technical error.
While the original Actigraph has been considered to have acceptable reliability, previousresearch has demonstrated variability within and between units. For example, Brage et al. (2003)reported that each unit was significantly different from the overall grand mean (all units), andthat there was considerable heteroscedasticity across units in the response to different accel-eration values. The variability was considerable enough for these investigators to recommendunit-specific calibrations. The intra-instrument variability of the new GT1M was found to below (counts overall mean CVintra = 2.9%; steps overall mean CVintra = 1.1%). The inter-instrument variability was six times higher than the intra-instrument values with an overall meanCVinter = 3.5% for counts and an overall mean CVinter = 1.2% for steps. At face value, these
Downloaded By: [B-on Consortium - 2007] At: 16:11 16 April 2010
88 SILVA ET AL.
reliability results seem worse than those reported by Rothney et al. (2008). However, if thepresent data are integrated from 15-sec to 1-min epochs, the CVs are much more similar CVintra= .61% and CVinter = 1.85% (data not shown). The lack of batch effects (i.e., serial numberclusters of high or low output units) also supports the fact that the Actigraph GT1M providesreliable information both in terms of activity counts and steps outputs.
The responses varied somewhat across conditions. For counts, the highest were found to bebetween device variability (i.e., CVinter = 7.0%) with the .5 g at the 2.5-Hz condition. Thiscondition was characterized by smaller acceleration and higher frequency. Although the CV isacceptable, it points to a lesser precision under these conditions (i.e., relatively low accelerationand higher frequency).
In the case of the steps output, the .5 g at the 1.5-Hz condition yielded the highest betweendevice variability (i.e., CVinter = 2.2%) compared with the other conditions. This condition wascharacterized by small accelerations and lower frequency. These results for step counts are con-sistent with a previous study that evaluated the validity of the step function in accelerometersusing treadmill walking (Esliger, Probert, Gorber, Bryan, Laviolette, & Tremblay, 2007). Thatstudy showed that the accuracy of both the Actical and Actigraph (model 7164) step count func-tions differed from the criterion of visually counted steps at the slow walking speed, with bothaccelerometers underestimating the number of steps taken (errors of 7.4% and 5.3% for theActical and Actigraph, respectively). Because much of the day is spent performing short andslow movements around the office or home, this underestimation can amount to large differencesduring a 24-hr period. The problem appears to be common in pedometer devices that are builtjust for step counts (Crouter, Schneider, Karabulut, & Bassett, 2003). The magnitude of the errorwould not present a major threat for most populations, but it may be a more significant problemwhen monitoring frail older adults with slow gaits (Le Masurier & Tudor-Locke, 2003).
Another observed limitation of the Actigraph 7164 is the increasing tendency of the moni-tor to underestimate activity as speed/intensity is increased (Brage et al., 2003). This error isrelated to frequency-dependent filtering and assessment of acceleration in the vertical plane only(Rowlands, Stone, & Eston, 2007). These data highlight the fact that the Actigraph GT1M seemsto carry the same limitation.
A clear understanding of the technical capabilities of accelerometers is important for under-standing limitations for different types of research. The present study extends previous researchand demonstrates improved technical reliability with the new GT1M version of the Actigraph.The study is unique in evaluation of both counts and steps. The new GT1M provides time allo-cation in both counts and steps, and the present study demonstrates some differences in thecharacteristics associated with detection of steps and counts.
The study evaluated reliability across a range of conditions, including accelerometer sensitiv-ity within the lower range of human motion. While developed primarily for assessing movement,there has been considerable interest in using accelerometers to also indicate levels of seden-tary behavior (Healy et al., 2008; Matthews et al., 2008; Pate, O’Neill, & Lobelo, 2008; Reilly,Penpraze, Hislop, Davies, Grant, & Paton, 2008; Sardinha et al., 2008; Williams et al., 2008). Atthe .05-g threshold detection level of the GT1M, only 10 of the 50 units registered movement.The results with this mechanical experiment are consistent with a previous study that reportedincreases in zero count values observed with GT1M data (Rothney et al., 2008). Variability inthreshold detection between units could have a significant impact on the number of sedentaryepochs detected for a given study participant. This is particularly worrying, considering how
Downloaded By: [B-on Consortium - 2007] At: 16:11 16 April 2010
RELIABILITY OF THE ACTIGRAPH GT1M ACCELEROMETER 89
reliant the field has become on accelerometer data reduction procedures that scan and excludecontinuous zero strings above a given threshold in an effort to determine accelerometer wearversus non-wear. Further lab-based and field-based studies are warranted to clarify the impact ofwide ranging threshold detection levels in the Actigraph GT1M accelerometer.
ACKNOWLEDGMENTS
This study was supported by FCT—SFRH/BD/23088/2005. Disclaimer: This study was notfunded in any way by the accelerometer manufacturer. The results of this study do not constituteendorsement by the authors of the product described herein.
REFERENCES
Actigraph (2008a). Actilife users manual, 2008. Retrieved from http://www.theactigraph.com/index.php?option=com_docman&task=cat_view&gid=53&Itemid=64
Actigraph (2008b). GT1M specifications, 2008. Retrieved from http://theactigraph.com/index.php?option=com_docman&task=cat_view&gid=70&Itemid=64
Bassett, D. R., Jr., Ainsworth, B. E., Swartz, A. M., Strath, S. J., O’Brien, W. L., & King, G. A. (2000). Validity offour motion sensors in measuring moderate intensity physical activity. Medicine & Science in Sports & Exercice,32(Suppl.), S471–S480.
Brage, S. R., Brage, N., Wedderkopp, N., & Froberg, K. (2003). Reliability and validity of the computer scienceand applications accelerometer in a, echanical setting. Measurement in Physical Education & Exercise Science, 7,101–119.
Brage, S., van Hees, V. T., & Brage, N. (2009). Intergration accelerometer differences and correction for on-boardfrequency based filtering. Journal of Applied Phsysiology, 106 (4), 1473.
Brage, S., Wedderkopp, N., Franks, P. W., Andersen, L. B., & Froberg, K. (2003). Reexamination of validity andreliability of the CSA monitor in walking and running. Medicine & Science in Sports & Exercise, 35 (8), 1447–1454.
Chen, K. Y., & Bassett, D. R., Jr. (2005). The technology of accelerometry-based activity monitors: Current and future.Medicine & Science in Sports & Exercice, 37(Suppl.), S490–S500.
Corder, K., Brage, S., Ramachandran, A., Snehalatha, C., Wareham, N., & Ekelund, U. (2007). Comparison of twoActigraph models for assessing free-living physical activity in Indian adolescents. Journal of Sports Sciences, 25,1607–1611.
Corder, K., Ekelund, U., Steele, R. M., Wareham, N. J., & Brage, S. (2008). Assessment of physical activity in youth.Journal of Applied Physiology, 105, 977–987.
Crouter, S. E., Schneider, P. L., Karabulut, M., & Bassett, D. R., Jr. (2003). Validity of 10 electronic pedometers formeasuring steps, distance, and energy cost. Medicine & Science in Sports & Exercice, 35, 1455–1460.
Esliger, D., Copeland, J. L., Barnes, J. D., & Tremblay, M. S. (2005). Standardizing and optimizing the use ofaccelerometer data for free-living physical activity monitoring. Journal of Physical Activity and Health, 2, 366–383.
Esliger, D., Probert, A., Gorber, S. C., Bryan, S., Laviolette, M., & Tremblay, M. S. (2007). Validity of the Acticalaccelerometer step-count function. Medicine & Science in Sports & Exercice, 39, 1200–1204.
Esliger, D., & Tremblay, M. S. (2006). Technical reliability assessment of three accelerometer models in a mechanicalsetup. Medicine & Science in Sports & Exercice, 38, 2173–2181.
Esliger, D., & Tremblay, M. S. (2007). Physical activity and inactivity profiling: The next generation. Canadian Journalof Public Health, 98(Suppl.), S195–S207.
Freedson, P., Pober, D., & Janz, K. F. (2005). Calibration of accelerometer output for children. Medicine & Science inSports & Exercice, 37(Suppl.), S523–S530.
Healy, G. N., Dunstan, D. W., Salmon, J., Cerin, E., Shaw, J. E., Zimmet, P. Z., et al. (2008). Breaks in sedentary time:Beneficial associations with metabolic risk. Diabetes Care, 31, 661–666.
Downloaded By: [B-on Consortium - 2007] At: 16:11 16 April 2010
90 SILVA ET AL.
Janz, K. F. (1994). Validation of the CSA accelerometer for assessing children’s physical activity. Medicine & Sciencein Sports & Exercice, 26, 369–375.
Le Masurier, G. C., & Tudor-Locke, C. (2003). Comparison of pedometer and accelerometer accuracy under controlledconditions. Medicine & Science in Sports & Exercice, 35, 867–871.
Matthews, C. E., Chen, K. Y., Freedson, P. S., Buchowski, M. S., Beech, B. M., Pate, R. R., et al. (2008). Amount of timespent in sedentary behaviors in the United States, 2003–2004. American Journal of Epidemiology, 167, 875–881.
Mattocks, C., Ness, A., Leary, S., Tilling, K., Blair, S. N., Shield, J., et al. (2008). Use of accelerometers in a large field-based study of children: protocols, design issues, and effects on precision. Journal of Physical Activity and Health,5(Suppl), S98–S111.
McClain, J. J., Sisson, S. B., & Tudor-Locke, C. (2007). Actigraph accelerometer interinstrument reliability during free-living in adults. Medicine & Science in Sports & Exercice, 39, 1509–1514.
Metcalf, B. S., Curnow, J. S., Evans, C., Voss, L. D., & Wilkin, T. J. (2002). Technical reliability of the CSA activitymonitor: The EarlyBird Study. Medicine & Science in Sports & Exercice, 34, 1533–1537.
Moeller, N. C., Korsholm, L., Kristensen, P. L., Andersen, L. B., Wedderkopp, N., & Froberg, K. (2008). Unit-specificcalibration of Actigraph accelerometers in a mechanical setup—is it worth the effort? The effect on random outputvariation caused by technical inter-instrument variability in the laboratory and in the field. BMC Medical ResearchMethodology, 8, 19.
Nichols, J. F., Morgan, C. G., Chabot, L. E., Sallis, J. F., & Calfas, K. J. (2000). Assessment of physical activity with theComputer Science and Applications, Inc., Accelerometer: Laboratory versus field validation. Research Quarterly forExercise and Sport, 71, 36–43.
Pate, R. R., O’Neill, J. R., & Lobelo, F. (2008). The evolving definition of “sedentary.” Exercise Sport Science Review,36, 173–178.
Patterson, S. M., Krantz, D. S., Montgomery, L. C., Deuster, P. A., Hedges, S. M., & Nebel, L. E. (1993).Automated physical activity monitoring: Validation and comparison with physiological and self-report measures.Psychophysiology, 30, 296–305.
Plasqui, G., & Westerterp, K. R. (2007). Physical activity assessment with accelerometers: An evaluation against doublylabeled water. Obesity (Silver Spring), 15, 2371–2379.
Puyau, M. R., Adolph, A. L., Vohra, F. A., & Butte, N. F. (2002). Validation and calibration of physical activity monitorsin children. Obesity Research, 10, 150–157.
Reilly, J. J., Penpraze, V., Hislop, J., Davies, G., Grant, S., & Paton, J. Y. (2008). Objective measurement of physicalactivity and sedentary behaviour: Review with new data. Archives of Disease in Childhood, 93, 614–619.
Riddoch, C. J., Bo Andersen, L., Wedderkopp, N., Harro, M., Klasson-Heggebo, L., Sardinha, L. B., et al. (2004).Physical activity levels and patterns of 9- and 15-yr-old European children. Medicine & Science in Sports & Exercice,36, 86–92.
Rothney, M. P., Apker, G. A., Song, Y., & Chen, K. Y. (2008). Comparing the performance of three generations ofActiGraph accelerometers. Journal of Applied Physiology, 105, 1091–1097.
Rowlands, A. V., Stone, M. R., & Eston, R. G. (2007). Influence of speed and step frequency during walking and runningon motion sensor output. Medicine & Science in Sports & Exercice, 39, 716–727.
Sardinha, L. B., Andersen, L. B., Anderssen, S. A., Quiterio, A. L., Ornelas, R., Froberg, K., et al. (2008). Objectivelymeasured time spent sedentary is associated with insulin resistance independent of overall and central body fat in9- to 10-year-old Portuguese children. Diabetes Care, 31, 569–575.
Sirard, J. R., Melanson, E. L., Li, L., & Freedson, P. S. (2000). Field evaluation of the Computer Science and Applications,Inc. physical activity monitor. Medicine & Science in Sports & Exercice, 32, 695–700.
Storti, K. L., Pettee, K. K., Brach, J. S., Talkowski, J. B., Richardson, C. R., & Kriska, A. M. (2008). Gait speed andstep-count monitor accuracy in community-dwelling older adults. Medicine & Science in Sports & Exercice, 40,59–64.
Toschke, J. A., von Kries, R., Rosenfeld, E., & Toschke, A. M. (2007). Reliability of physical activity measures fromaccelerometry among preschoolers in free-living conditions. Clinical Nutrition, 26, 416–420.
Troiano, R. P., Berrigan, D., Dodd, K. W., Masse, L. C., Tilert, T., & McDowell, M. (2008). Physical activity in theUnited States measured by accelerometer. Medicine & Science in Sports & Exercice, 40, 181–188.
Trost, S. G., Ward, D. S., Moorehead, S. M., Watson, P. D., Riner, W., & Burke, J. R. (1998). Validity of the computerscience and applications (CSA) activity monitor in children. Medicine & Science in Sports & Exercice, 30, 629–633.
Tudor-Locke, C., Ainsworth, B. E., Adair, L. S., & Popkin, B. M. (2003). Physical activity in Filipino youth: The CebuLongitudinal Health and Nutrition Survey. International Journal of Obesity, 27, 181–190.
Downloaded By: [B-on Consortium - 2007] At: 16:11 16 April 2010
RELIABILITY OF THE ACTIGRAPH GT1M ACCELEROMETER 91
Ward, D. S., Evenson, K. R., Vaughn, A., Rodgers, A. B., & Troiano, R. P. (2005). Accelerometer use in physical activity:Best practices and research recommendations. Medicine & Science in Sports & Exercice, 37(Suppl.), S582–S588.
Welk, G. J., Blair, S. N., Wood, K., Jones, S., & Thompson, R. W. (2000). A comparative evaluation of threeaccelerometry-based physical activity monitors. Medicine & Science in Sports & Exercice, 32(Suppl.), S489–S497.
Welk, G. J., Schaben, J. A., & Morrow, J. R., Jr. (2004). Reliability of accelerometry-based activity monitors: Ageneralizability study. Medicine & Science in Sports & Exercice, 36, 1637–1645.
Westerterp, K. R. (1999). Physical activity assessment with accelerometers. International Journal of Obesity and RelatedMetabolic Disorders, 23(Suppl.), S45–S49.
Williams, H. G., Pfeiffer, K. A., O’Neill, J. R., Dowda, M., McIver, K. L., Brown, W. H., et al. (2008). Motor skillperformance and physical activity in preschool children. Obesity (Silver Spring), 16, 1421–1426.
Downloaded By: [B-on Consortium - 2007] At: 16:11 16 April 2010