Table S1. The effect of age of mice within a 6-12 week ... - PLOS
25
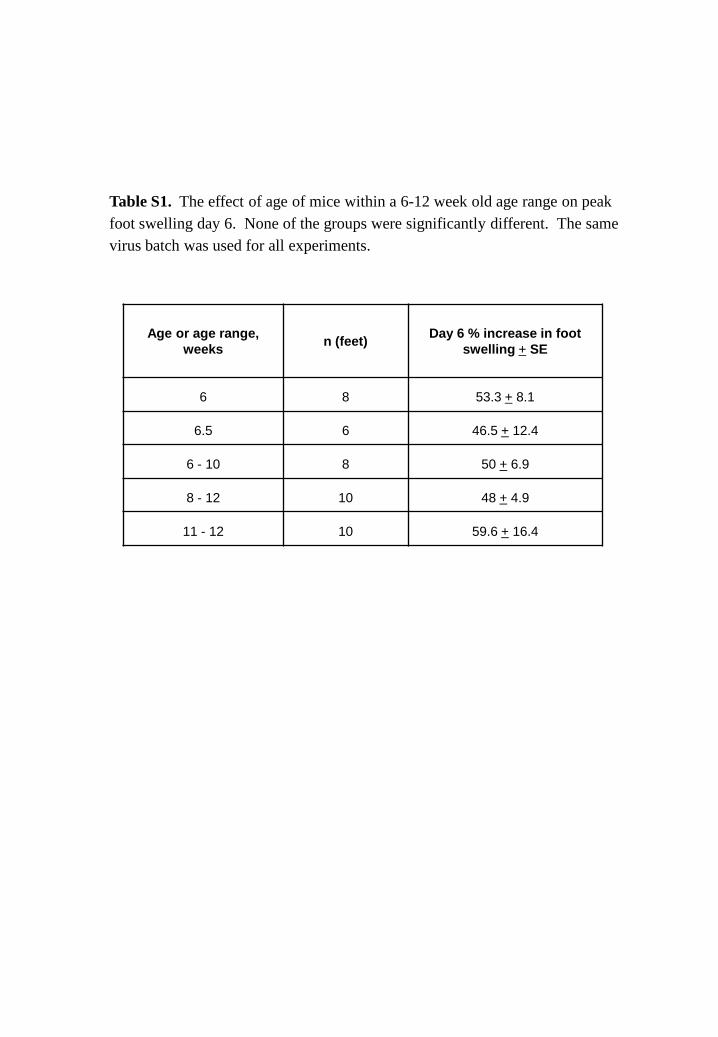
Age or age range, weeks n (feet) Day 6 % increase in foot swelling + SE 6 8 53.3 + 8.1 6.5 6 46.5 + 12.4 6 - 10 8 50 + 6.9 8 - 12 10 48 + 4.9 11 - 12 10 59.6 + 16.4 Table S1. The effect of age of mice within a 6-12 week old age range on peak foot swelling day 6. None of the groups were significantly different. The same virus batch was used for all experiments.
-
Upload
khangminh22 -
Category
Documents
-
view
0 -
download
0
Transcript of Table S1. The effect of age of mice within a 6-12 week ... - PLOS
Age or age range, weeks n (feet) Day 6 % increase in foot
swelling + SE
6 8 53.3 + 8.1
6.5 6 46.5 + 12.4
6 - 10 8 50 + 6.9
8 - 12 10 48 + 4.9
11 - 12 10 59.6 + 16.4
Table S1. The effect of age of mice within a 6-12 week old age range on peak foot swelling day 6. None of the groups were significantly different. The same virus batch was used for all experiments.
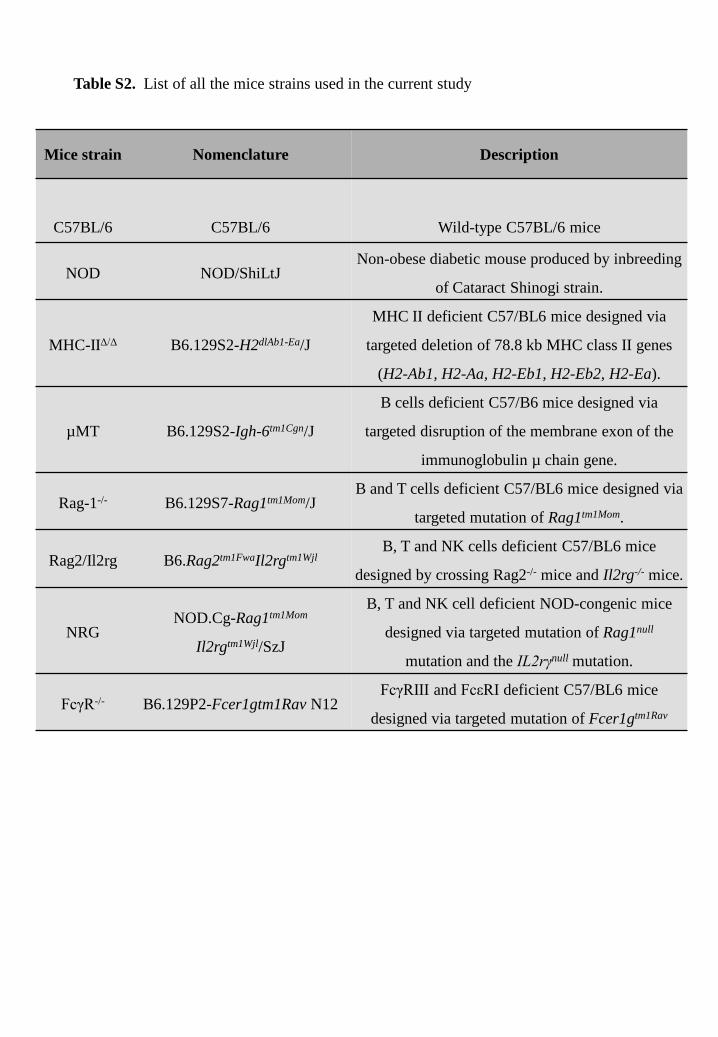
Table S2. List of all the mice strains used in the current study
Mice strain Nomenclature Description
C57BL/6
C57BL/6
Wild-type C57BL/6 mice
NOD NOD/ShiLtJ Non-obese diabetic mouse produced by inbreeding
of Cataract Shinogi strain.
MHC-IIΔ/Δ B6.129S2-H2dlAb1-Ea/J
MHC II deficient C57/BL6 mice designed via
targeted deletion of 78.8 kb MHC class II genes
(H2-Ab1, H2-Aa, H2-Eb1, H2-Eb2, H2-Ea).
µMT B6.129S2-Igh-6tm1Cgn/J
B cells deficient C57/B6 mice designed via
targeted disruption of the membrane exon of the
immunoglobulin µ chain gene.
Rag-1-/- B6.129S7-Rag1tm1Mom/J B and T cells deficient C57/BL6 mice designed via
targeted mutation of Rag1tm1Mom.
Rag2/Il2rg B6.Rag2tm1FwaIl2rgtm1Wjl B, T and NK cells deficient C57/BL6 mice
designed by crossing Rag2-/- mice and Il2rg-/- mice.
NRG NOD.Cg-Rag1tm1Mom
Il2rgtm1Wjl/SzJ
B, T and NK cell deficient NOD-congenic mice
designed via targeted mutation of Rag1null
mutation and the IL2rγnull mutation.
FcγR-/- B6.129P2-Fcer1gtm1Rav N12 FcγRIII and FcεRI deficient C57/BL6 mice
designed via targeted mutation of Fcer1gtm1Rav
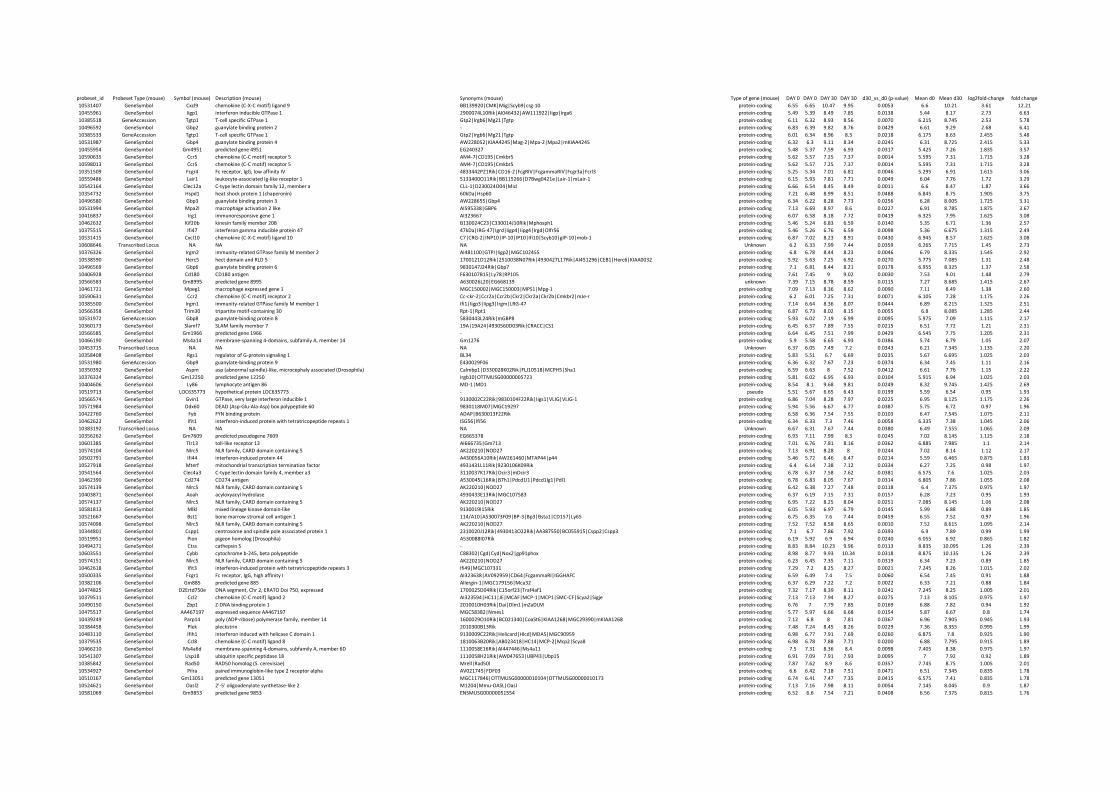
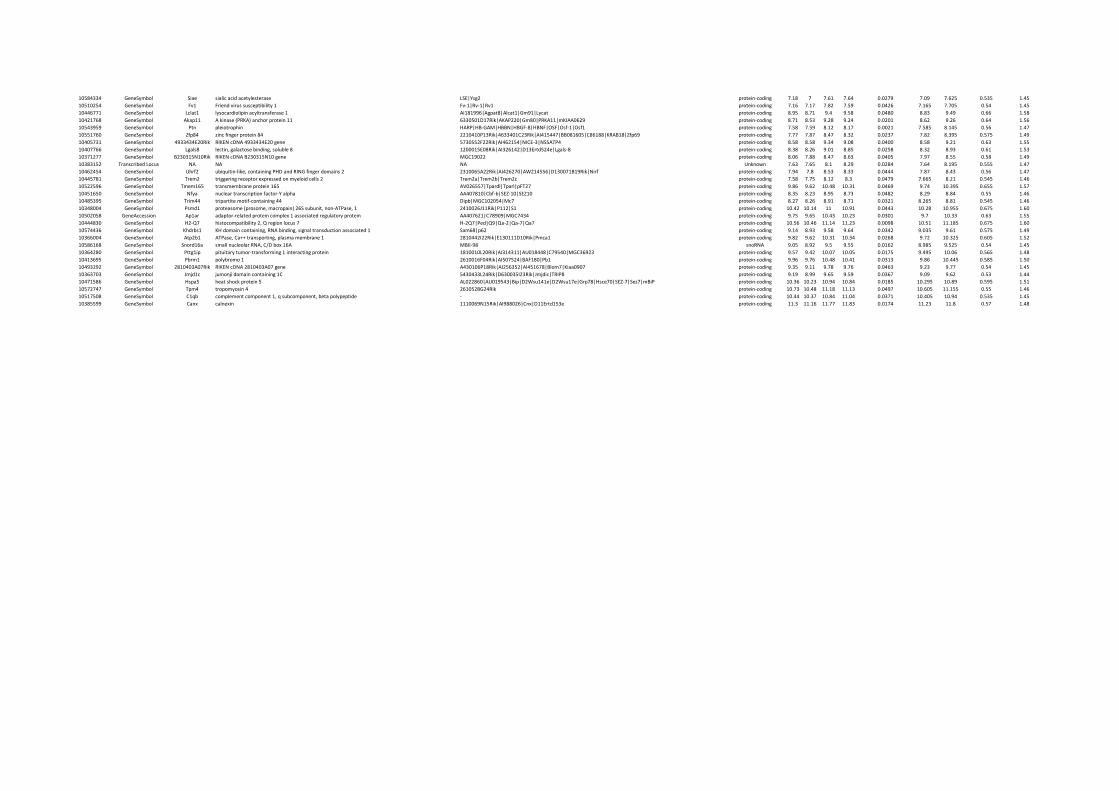
probeset_id Probeset Type (mouse) Symbol (mouse) Description (mouse) Synonyms (mouse) Type of gene (mouse) DAY 0 DAY 0 DAY 30 DAY 30 d30_vs_d0 (p-value) Mean d0 Mean d30 log2fold-change fold change10531407 GeneSymbol Cxcl9 chemokine (C-X-C motif) ligand 9 BB139920|CMK|Mig|Scyb9|crg-10 protein-coding 6.55 6.65 10.47 9.95 0.0053 6.6 10.21 3.61 12.2110455961 GeneSymbol Iigp1 interferon inducible GTPase 1 2900074L10Rik|AI046432|AW111922|Iigp|Irga6 protein-coding 5.49 5.39 8.49 7.85 0.0138 5.44 8.17 2.73 6.6310385518 GeneAccession Tgtp1 T-cell specific GTPase 1 Gtp2|Irgb6|Mg21|Tgtp protein-coding 6.11 6.32 8.93 8.56 0.0070 6.215 8.745 2.53 5.7810496592 GeneSymbol Gbp2 guanylate binding protein 2 - protein-coding 6.83 6.39 9.82 8.76 0.0429 6.61 9.29 2.68 6.4110385533 GeneAccession Tgtp1 T-cell specific GTPase 1 Gtp2|Irgb6|Mg21|Tgtp protein-coding 6.01 6.34 8.96 8.3 0.0218 6.175 8.63 2.455 5.4810531987 GeneSymbol Gbp4 guanylate binding protein 4 AW228052|KIAA4245|Mag-2|Mpa-2|Mpa2|mKIAA4245 protein-coding 6.32 6.3 9.11 8.34 0.0245 6.31 8.725 2.415 5.3310455954 GeneSymbol Gm4951 predicted gene 4951 EG240327 protein-coding 5.48 5.37 7.59 6.93 0.0317 5.425 7.26 1.835 3.5710590635 GeneSymbol Ccr5 chemokine (C-C motif) receptor 5 AM4-7|CD195|Cmkbr5 protein-coding 5.62 5.57 7.25 7.37 0.0014 5.595 7.31 1.715 3.2810598013 GeneSymbol Ccr5 chemokine (C-C motif) receptor 5 AM4-7|CD195|Cmkbr5 protein-coding 5.62 5.57 7.25 7.37 0.0014 5.595 7.31 1.715 3.2810351509 GeneSymbol Fcgr4 Fc receptor, IgG, low affinity IV 4833442P21Rik|CD16-2|FcgRIV|FcgammaRIV|Fcgr3a|Fcrl3 protein-coding 5.25 5.34 7.01 6.81 0.0046 5.295 6.91 1.615 3.0610559486 GeneSymbol Lair1 leukocyte-associated Ig-like receptor 1 5133400O11Rik|BB115266|D7Bwg0421e|Lair-1|mLair-1 protein-coding 6.15 5.93 7.81 7.71 0.0049 6.04 7.76 1.72 3.2910542164 GeneSymbol Clec12a C-type lectin domain family 12, member a CLL-1|D230024O04|Micl protein-coding 6.66 6.54 8.45 8.49 0.0011 6.6 8.47 1.87 3.6610354732 GeneSymbol Hspd1 heat shock protein 1 (chaperonin) 60kDa|Hsp60 protein-coding 7.21 6.48 8.99 8.51 0.0488 6.845 8.75 1.905 3.7510496580 GeneSymbol Gbp3 guanylate binding protein 3 AW228655|Gbp4 protein-coding 6.34 6.22 8.28 7.73 0.0256 6.28 8.005 1.725 3.3110531994 GeneSymbol Mpa2l macrophage activation 2 like AI595338|GBP6 protein-coding 7.13 6.69 8.97 8.6 0.0227 6.91 8.785 1.875 3.6710416837 GeneSymbol Irg1 immunoresponsive gene 1 AI323667 protein-coding 6.07 6.58 8.18 7.72 0.0419 6.325 7.95 1.625 3.0810462632 GeneSymbol Kif20b kinesin family member 20B B130024C23|C330014J10Rik|Mphosph1 protein-coding 5.46 5.24 6.83 6.59 0.0140 5.35 6.71 1.36 2.5710375515 GeneSymbol Ifi47 interferon gamma inducible protein 47 47kDa|IRG-47|Igrd|Iigp4|Iipg4|Irgd|Olfr56 protein-coding 5.46 5.26 6.76 6.59 0.0098 5.36 6.675 1.315 2.4910531415 GeneSymbol Cxcl10 chemokine (C-X-C motif) ligand 10 C7|CRG-2|INP10|IP-10|IP10|Ifi10|Scyb10|gIP-10|mob-1 protein-coding 6.87 7.02 8.23 8.91 0.0430 6.945 8.57 1.625 3.0810608646 Transcribed Locus NA NA NA Unknown 6.2 6.33 7.99 7.44 0.0359 6.265 7.715 1.45 2.7310376326 GeneSymbol Irgm2 immunity-related GTPase family M member 2 AI481100|GTPI|Iigp2|MGC102455 protein-coding 6.8 6.78 8.44 8.23 0.0046 6.79 8.335 1.545 2.9210538590 GeneSymbol Herc5 hect domain and RLD 5 1700121D12Rik|2510038N07Rik|4930427L17Rik|AI451296|CEB1|Herc6|KIAA0032 protein-coding 5.92 5.63 7.25 6.92 0.0270 5.775 7.085 1.31 2.4810496569 GeneSymbol Gbp6 guanylate binding protein 6 9830147J24Rik|Gbp7 protein-coding 7.1 6.81 8.44 8.21 0.0178 6.955 8.325 1.37 2.5810406928 GeneSymbol Cd180 CD180 antigen F630107B15|Ly78|RP105 protein-coding 7.61 7.45 9 9.02 0.0030 7.53 9.01 1.48 2.7910566583 GeneSymbol Gm8995 predicted gene 8995 A630026L20|EG668139 unknown 7.39 7.15 8.78 8.59 0.0115 7.27 8.685 1.415 2.6710461721 GeneSymbol Mpeg1 macrophage expressed gene 1 MGC150002|MGC150003|MPS1|Mpg-1 protein-coding 7.09 7.13 8.36 8.62 0.0090 7.11 8.49 1.38 2.6010590631 GeneSymbol Ccr2 chemokine (C-C motif) receptor 2 Cc-ckr-2|Ccr2a|Ccr2b|Ckr2|Ckr2a|Ckr2b|Cmkbr2|mJe-r protein-coding 6.2 6.01 7.25 7.31 0.0071 6.105 7.28 1.175 2.2610385500 GeneSymbol Irgm1 immunity-related GTPase family M member 1 Ifi1|Iigp3|Iipg3|Irgm|LRG-47 protein-coding 7.14 6.64 8.36 8.07 0.0444 6.89 8.215 1.325 2.5110566358 GeneSymbol Trim30 tripartite motif-containing 30 Rpt-1|Rpt1 protein-coding 6.87 6.73 8.02 8.15 0.0055 6.8 8.085 1.285 2.4410531972 GeneAccession Gbp8 guanylate-binding protein 8 5830443L24Rik|mGBP8 protein-coding 5.93 6.02 7.19 6.99 0.0095 5.975 7.09 1.115 2.1710360173 GeneSymbol Slamf7 SLAM family member 7 19A|19A24|4930560D03Rik|CRACC|CS1 protein-coding 6.45 6.57 7.89 7.55 0.0215 6.51 7.72 1.21 2.3110566585 GeneSymbol Gm1966 predicted gene 1966 - protein-coding 6.64 6.45 7.51 7.99 0.0429 6.545 7.75 1.205 2.3110466190 GeneSymbol Ms4a14 membrane-spanning 4-domains, subfamily A, member 14 Gm1276 protein-coding 5.9 5.58 6.65 6.93 0.0386 5.74 6.79 1.05 2.0710453715 Transcribed Locus NA NA NA Unknown 6.37 6.05 7.49 7.2 0.0343 6.21 7.345 1.135 2.2010358408 GeneSymbol Rgs1 regulator of G-protein signaling 1 BL34 protein-coding 5.83 5.51 6.7 6.69 0.0235 5.67 6.695 1.025 2.0310531980 GeneAccession Gbp9 guanylate-binding protein 9 E430029F06 protein-coding 6.36 6.32 7.67 7.23 0.0374 6.34 7.45 1.11 2.1610350392 GeneSymbol Aspm asp (abnormal spindle)-like, microcephaly associated (Drosophila) Calmbp1|D330028K02Rik|FLJ10518|MCPH5|Sha1 protein-coding 6.59 6.63 8 7.52 0.0412 6.61 7.76 1.15 2.2210376324 GeneSymbol Gm12250 predicted gene 12250 Irgb10|OTTMUSG00000005723 protein-coding 5.81 6.02 6.95 6.93 0.0104 5.915 6.94 1.025 2.0310404606 GeneSymbol Ly86 lymphocyte antigen 86 MD-1|MD1 protein-coding 8.54 8.1 9.68 9.81 0.0249 8.32 9.745 1.425 2.6910519713 GeneSymbol LOC635773 hypothetical protein LOC635773 - pseudo 5.51 5.67 6.65 6.43 0.0199 5.59 6.54 0.95 1.9310566574 GeneSymbol Gvin1 GTPase, very large interferon inducible 1 9130002C22Rik|9830104F22Rik|Iigs1|VLIG|VLIG-1 protein-coding 6.86 7.04 8.28 7.97 0.0225 6.95 8.125 1.175 2.2610571984 GeneSymbol Ddx60 DEAD (Asp-Glu-Ala-Asp) box polypeptide 60 9830118M07|MGC19297 protein-coding 5.94 5.56 6.67 6.77 0.0387 5.75 6.72 0.97 1.9610422760 GeneSymbol Fyb FYN binding protein ADAP|B630013F22Rik protein-coding 6.58 6.36 7.54 7.55 0.0103 6.47 7.545 1.075 2.1110462623 GeneSymbol Ifit1 interferon-induced protein with tetratricopeptide repeats 1 ISG56|Ifi56 protein-coding 6.34 6.33 7.3 7.46 0.0058 6.335 7.38 1.045 2.0610383192 Transcribed Locus NA NA NA Unknown 6.67 6.31 7.67 7.44 0.0380 6.49 7.555 1.065 2.0910356262 GeneSymbol Gm7609 predicted pseudogene 7609 EG665378 protein-coding 6.93 7.11 7.99 8.3 0.0245 7.02 8.145 1.125 2.1810601385 GeneSymbol Tlr13 toll-like receptor 13 AI666735|Gm713 protein-coding 7.01 6.76 7.81 8.16 0.0362 6.885 7.985 1.1 2.1410574104 GeneSymbol Nlrc5 NLR family, CARD domain containing 5 AK220210|NOD27 protein-coding 7.13 6.91 8.28 8 0.0244 7.02 8.14 1.12 2.1710502791 GeneSymbol Ifi44 interferon-induced protein 44 A430056A10Rik|AW261460|MTAP44|p44 protein-coding 5.46 5.72 6.46 6.47 0.0214 5.59 6.465 0.875 1.8310527918 GeneSymbol Mterf mitochondrial transcription termination factor 4931431L11Rik|9230106K09Rik protein-coding 6.4 6.14 7.38 7.12 0.0334 6.27 7.25 0.98 1.9710541564 GeneSymbol Clec4a3 C-type lectin domain family 4, member a3 3110037K17Rik|Dcir3|mDcir3 protein-coding 6.78 6.37 7.58 7.62 0.0381 6.575 7.6 1.025 2.0310462390 GeneSymbol Cd274 CD274 antigen A530045L16Rik|B7h1|Pdcd1l1|Pdcd1lg1|Pdl1 protein-coding 6.78 6.83 8.05 7.67 0.0314 6.805 7.86 1.055 2.0810574139 GeneSymbol Nlrc5 NLR family, CARD domain containing 5 AK220210|NOD27 protein-coding 6.42 6.38 7.27 7.48 0.0118 6.4 7.375 0.975 1.9710403871 GeneSymbol Aoah acyloxyacyl hydrolase 4930433E13Rik|MGC107583 protein-coding 6.37 6.19 7.15 7.31 0.0157 6.28 7.23 0.95 1.9310574137 GeneSymbol Nlrc5 NLR family, CARD domain containing 5 AK220210|NOD27 protein-coding 6.95 7.22 8.25 8.04 0.0251 7.085 8.145 1.06 2.0810581813 GeneSymbol Mlkl mixed lineage kinase domain-like 9130019I15Rik protein-coding 6.05 5.93 6.97 6.79 0.0145 5.99 6.88 0.89 1.8510521667 GeneSymbol Bst1 bone marrow stromal cell antigen 1 114/A10|A530073F09|BP-3|Bp3|Bsta1|CD157|Ly65 protein-coding 6.75 6.35 7.6 7.44 0.0459 6.55 7.52 0.97 1.9610574098 GeneSymbol Nlrc5 NLR family, CARD domain containing 5 AK220210|NOD27 protein-coding 7.52 7.52 8.58 8.65 0.0010 7.52 8.615 1.095 2.1410344801 GeneSymbol Cspp1 centrosome and spindle pole associated protein 1 2310020J12Rik|4930413O22Rik|AA387550|BC055915|Cspp2|Cspp3 protein-coding 7.1 6.7 7.86 7.92 0.0393 6.9 7.89 0.99 1.9910519951 GeneSymbol Pion pigeon homolog (Drosophila) A530088I07Rik protein-coding 6.19 5.92 6.9 6.94 0.0240 6.055 6.92 0.865 1.8210494271 GeneSymbol Ctss cathepsin S - protein-coding 8.83 8.84 10.23 9.96 0.0113 8.835 10.095 1.26 2.3910603551 GeneSymbol Cybb cytochrome b-245, beta polypeptide C88302|Cgd|Cyd|Nox2|gp91phox protein-coding 8.98 8.77 9.93 10.34 0.0318 8.875 10.135 1.26 2.3910574151 GeneSymbol Nlrc5 NLR family, CARD domain containing 5 AK220210|NOD27 protein-coding 6.23 6.45 7.35 7.11 0.0319 6.34 7.23 0.89 1.8510462618 GeneSymbol Ifit3 interferon-induced protein with tetratricopeptide repeats 3 Ifi49|MGC107331 protein-coding 7.29 7.2 8.25 8.27 0.0021 7.245 8.26 1.015 2.0210500335 GeneSymbol Fcgr1 Fc receptor, IgG, high affinity I AI323638|AV092959|CD64|FcgammaRI|IGGHAFC protein-coding 6.59 6.49 7.4 7.5 0.0060 6.54 7.45 0.91 1.8810382106 GeneSymbol Gm885 predicted gene 885 Allergin-1|MGC179156|Mca32 protein-coding 6.37 6.29 7.22 7.2 0.0022 6.33 7.21 0.88 1.8410474825 GeneSymbol D2Ertd750e DNA segment, Chr 2, ERATO Doi 750, expressed 1700025D04Rik|C15orf23|Traf4af1 protein-coding 7.32 7.17 8.39 8.11 0.0241 7.245 8.25 1.005 2.0110379511 GeneSymbol Ccl2 chemokine (C-C motif) ligand 2 AI323594|HC11|JE|MCAF|MCP-1|MCP1|SMC-CF|Scya2|Sigje protein-coding 7.13 7.13 7.94 8.27 0.0275 7.13 8.105 0.975 1.9710490150 GeneSymbol Zbp1 Z-DNA binding protein 1 2010010H03Rik|Dai|Dlm1|mZaDLM protein-coding 6.76 7 7.79 7.85 0.0169 6.88 7.82 0.94 1.9210475517 GeneSymbol AA467197 expressed sequence AA467197 MGC58382|Nmes1 protein-coding 5.77 5.97 6.66 6.68 0.0154 5.87 6.67 0.8 1.7410439249 GeneSymbol Parp14 poly (ADP-ribose) polymerase family, member 14 1600029O10Rik|BC021340|CoaSt6|KIAA1268|MGC29390|mKIAA1268 protein-coding 7.12 6.8 8 7.81 0.0367 6.96 7.905 0.945 1.9310384458 GeneSymbol Plek pleckstrin 2010300B13Rik protein-coding 7.48 7.24 8.45 8.26 0.0229 7.36 8.355 0.995 1.9910483110 GeneSymbol Ifih1 interferon induced with helicase C domain 1 9130009C22Rik|Helicard|Hlcd|MDA5|MGC90959 protein-coding 6.98 6.77 7.91 7.69 0.0260 6.875 7.8 0.925 1.9010379535 GeneSymbol Ccl8 chemokine (C-C motif) ligand 8 1810063B20Rik|AB023418|HC14|MCP-2|Mcp2|Scya8 protein-coding 6.98 6.78 7.88 7.71 0.0200 6.88 7.795 0.915 1.8910466210 GeneSymbol Ms4a6d membrane-spanning 4-domains, subfamily A, member 6D 1110058E16Rik|AI447446|Ms4a11 protein-coding 7.5 7.31 8.36 8.4 0.0098 7.405 8.38 0.975 1.9710541307 GeneSymbol Usp18 ubiquitin specific peptidase 18 1110058H21Rik|AW047653|UBP43|Ubp15 protein-coding 6.91 7.09 7.91 7.93 0.0095 7 7.92 0.92 1.8910385842 GeneSymbol Rad50 RAD50 homolog (S. cerevisiae) Mrell|Rad50l protein-coding 7.87 7.62 8.9 8.6 0.0357 7.745 8.75 1.005 2.0110534927 GeneSymbol Pilra paired immunoglobin-like type 2 receptor alpha AV021745|FDF03 protein-coding 6.6 6.42 7.18 7.51 0.0471 6.51 7.345 0.835 1.7810510167 GeneSymbol Gm13051 predicted gene 13051 MGC117846|OTTMUSG00000010104|OTTMUSG00000010173 protein-coding 6.74 6.41 7.47 7.35 0.0415 6.575 7.41 0.835 1.7810524621 GeneSymbol Oasl2 2'-5' oligoadenylate synthetase-like 2 M1204|Mmu-OASL|Oasl protein-coding 7.13 7.16 7.98 8.11 0.0054 7.145 8.045 0.9 1.8710581069 GeneSymbol Gm9853 predicted gene 9853 ENSMUSG00000051554 protein-coding 6.52 6.6 7.54 7.21 0.0408 6.56 7.375 0.815 1.76
andreasS
Typewritten Text
Table S3
andreasS
Typewritten Text

10372410 GeneSymbol Glipr1 GLI pathogenesis-related 1 (glioma) 2410114O14Rik|RTVP-1|RTVP1|mRTVP-1 protein-coding 6.59 6.38 7.28 7.27 0.0172 6.485 7.275 0.79 1.7310547274 GeneSymbol Zfp248 zinc finger protein 248 2810037F07Rik|E130106N01Rik|MGC100019 protein-coding 6.22 6.13 7.06 6.74 0.0487 6.175 6.9 0.725 1.6510435457 GeneSymbol Parp9 poly (ADP-ribose) polymerase family, member 9 AW214463|BC003281|Bagl|Bal|MGC7868 protein-coding 7.56 7.2 8.31 8.18 0.0456 7.38 8.245 0.865 1.8210538832 GeneSymbol Mad2l1 MAD2 mitotic arrest deficient-like 1 (yeast) AA673185|MAD2|MGC113763 protein-coding 7.72 7.39 8.55 8.33 0.0467 7.555 8.44 0.885 1.8510503170 GeneSymbol Chd7 chromodomain helicase DNA binding protein 7 A730019I05Rik|Cycn|Cyn|Dz|Edy|Flo|Lda|Mt|Obt|Todo|WBE1|Whi protein-coding 9 8.94 10.21 9.83 0.0320 8.97 10.02 1.05 2.0710346191 GeneSymbol Stat1 signal transducer and activator of transcription 1 2010005J02Rik|AA408197 protein-coding 7.85 7.69 8.81 8.54 0.0288 7.77 8.675 0.905 1.8710423941 GeneSymbol Ttc35 tetratricopeptide repeat domain 35 4921531G14Rik|AV060620|AW209495 protein-coding 10.29 9.89 11.41 11.11 0.0428 10.09 11.26 1.17 2.2510530145 GeneSymbol Tlr1 toll-like receptor 1 - protein-coding 5.74 5.79 6.37 6.47 0.0072 5.765 6.42 0.655 1.5710385526 GeneAccession 9930111J21Rik2 RIKEN cDNA 9930111J21 gene 2 9930111J21Rik|Irgb5|OTTMUSG00000005540|RP23-54N20.1 protein-coding 7.15 7.03 7.8 7.98 0.0178 7.09 7.89 0.8 1.7410574163 GeneSymbol Nlrc5 NLR family, CARD domain containing 5 AK220210|NOD27 protein-coding 6.38 6.47 7.24 7.05 0.0207 6.425 7.145 0.72 1.6510351792 GeneSymbol Slamf9 SLAM family member 9 2310026I04Rik|AI462096|CD2F-10|CD84-H1|Cd2f10|SF2001 protein-coding 7.19 7.01 7.88 7.89 0.0129 7.1 7.885 0.785 1.7210531579 GeneSymbol Hmgb1 high mobility group box 1 DEF|HMG-1|Hmg1|MGC103168|MGC103169|MGC117896|MGC117897|SBP-1|amphoterin|p30 protein-coding 9.86 9.54 10.92 10.61 0.0411 9.7 10.765 1.065 2.0910607868 GeneSymbol Tlr8 toll-like receptor 8 - protein-coding 6.6 6.4 7.25 7.17 0.0222 6.5 7.21 0.71 1.6410385513 GeneAccession 9930111J21Rik2 RIKEN cDNA 9930111J21 gene 2 9930111J21Rik|Irgb5|OTTMUSG00000005540|RP23-54N20.1 protein-coding 7.2 7.04 7.75 8.03 0.0412 7.12 7.89 0.77 1.7110504470 GeneSymbol Melk maternal embryonic leucine zipper kinase AI327312|MPK38|mKIAA0175 protein-coding 6.76 6.65 7.44 7.41 0.0062 6.705 7.425 0.72 1.6510541555 GeneSymbol Clec4a1 C-type lectin domain family 4, member a1 BC049354|Dcir4|MGC56880|mDcir4 protein-coding 7.23 6.93 7.8 7.87 0.0392 7.08 7.835 0.755 1.6910458782 GeneSymbol Pggt1b protein geranylgeranyltransferase type I, beta subunit 2010207C17Rik|2610100E13|AI451237|AI551093|BGG1|GGT1 protein-coding 6.94 7.06 7.69 7.8 0.0117 7 7.745 0.745 1.6810420426 GeneSymbol F630043A04Rik RIKEN cDNA F630043A04 gene Ska3 protein-coding 6.47 6.36 7.24 6.95 0.0483 6.415 7.095 0.68 1.6010606376 GeneSymbol 2610002M06Rik RIKEN cDNA 2610002M06 gene 8430408J07Rik|AI876413|Chmp1b2 protein-coding 6.43 6.19 7.07 6.88 0.0491 6.31 6.975 0.665 1.5910473125 GeneSymbol Itga4 integrin alpha 4 CD49D protein-coding 7.46 7.45 8.15 8.33 0.0129 7.455 8.24 0.785 1.7210458938 GeneSymbol Gm8594 predicted gene 8594 EG667360 pseudo 6.76 6.6 7.31 7.45 0.0223 6.68 7.38 0.7 1.6210591881 GeneSymbol Hmgb1 high mobility group box 1 DEF|HMG-1|Hmg1|MGC103168|MGC103169|MGC117896|MGC117897|SBP-1|amphoterin|p30 protein-coding 10.17 9.99 11.29 10.98 0.0277 10.08 11.135 1.055 2.0810383212 Transcribed Locus NA NA NA Unknown 7.75 7.6 8.41 8.51 0.0129 7.675 8.46 0.785 1.7210383214 GeneSymbol Rnf213 ring finger protein 213 6030403J01|D11Ertd759e|KIAA1554|mKIAA1554 protein-coding 7.52 7.36 8.09 8.31 0.0306 7.44 8.2 0.76 1.6910344895 GeneSymbol Gm7560 predicted gene 7560 EG665262 pseudo 6.41 6.15 6.9 6.94 0.0397 6.28 6.92 0.64 1.5610512067 GeneSymbol Ddx58 DEAD (Asp-Glu-Ala-Asp) box polypeptide 58 6430573D20Rik|C330021E21|RIG-I protein-coding 7.75 7.51 8.39 8.39 0.0240 7.63 8.39 0.76 1.6910368222 GeneSymbol 4930444G20Rik RIKEN cDNA 4930444G20 gene - protein-coding 6.43 6.34 6.97 7.06 0.0101 6.385 7.015 0.63 1.5510389627 GeneSymbol Rad51c RAD51 homolog c (S. cerevisiae) Rad51l2 protein-coding 6.19 6.08 6.86 6.62 0.0445 6.135 6.74 0.605 1.5210374842 GeneSymbol Ccdc88a coiled coil domain containing 88A A430106J12Rik|AI848406|Ape|C130096N06Rik|C330012F17Rik|D130005J21Rik|Girdin|Giv|Hkrp1 protein-coding 6.38 6.18 6.91 6.88 0.0260 6.28 6.895 0.615 1.5310502029 GeneSymbol Larp7 La ribonucleoprotein domain family, member 7 C330027G06Rik|D3Wsu161e protein-coding 7.88 7.69 8.64 8.45 0.0299 7.785 8.545 0.76 1.6910439268 GeneSymbol Dtx3l deltex 3-like (Drosophila) AU042200|BC023741|MGC103262 protein-coding 7.35 7.1 7.9 7.96 0.0317 7.225 7.93 0.705 1.6310594774 GeneSymbol Ccnb2 cyclin B2 CycB2 protein-coding 8.99 8.86 9.87 9.71 0.0139 8.925 9.79 0.865 1.8210443980 GeneSymbol Myo1f myosin IF C330006B10Rik protein-coding 6.95 7.05 7.56 7.79 0.0328 7 7.675 0.675 1.6010397543 GeneAccession Gm5662 predicted gene 5662 EG435337 protein-coding 7.6 7.28 8.16 8.15 0.0466 7.44 8.155 0.715 1.6410424221 GeneSymbol Wdr67 WD repeat domain 67 4B3|D330013L20Rik|Gm85|MGC76603 protein-coding 7.36 7.21 7.97 8 0.0117 7.285 7.985 0.7 1.6210401829 GeneAccession Gm5662 predicted gene 5662 EG435337 protein-coding 7.38 7.1 7.93 7.94 0.0383 7.24 7.935 0.695 1.6210487208 GeneSymbol Atp8b4 ATPase, class I, type 8B, member 4 A530043E15|Im|MGC161341 protein-coding 5.91 6.11 6.5 6.67 0.0484 6.01 6.585 0.575 1.4910547088 GeneSymbol Mbd4 methyl-CpG binding domain protein 4 Med1 protein-coding 6.33 6.53 7.1 6.99 0.0328 6.43 7.045 0.615 1.5310574143 GeneSymbol Nlrc5 NLR family, CARD domain containing 5 AK220210|NOD27 protein-coding 6.08 6.14 6.68 6.7 0.0030 6.11 6.69 0.58 1.4910492888 Transcribed Locus NA NA NA Unknown 7.64 7.43 8.34 8.16 0.0354 7.535 8.25 0.715 1.6410376060 GeneSymbol Irf1 interferon regulatory factor 1 AU020929|Irf-1 protein-coding 6.85 6.8 7.47 7.47 0.0015 6.825 7.47 0.645 1.5610503107 GeneSymbol 6330407A03Rik RIKEN cDNA 6330407A03 gene - miscRNA 5.98 6.12 6.58 6.65 0.0187 6.05 6.615 0.565 1.4810392808 GeneSymbol Cd300ld CD300 molecule-like family member d 4732429D16Rik|CLM5|LMIR4|MAIR-IV|clm-5 protein-coding 6.47 6.53 7.15 7.06 0.0079 6.5 7.105 0.605 1.5210353475 GeneSymbol Eif3m eukaryotic translation initiation factor 3, subunit M Ga17|MGC118449|Pcid1 protein-coding 7.87 7.93 8.75 8.5 0.0300 7.9 8.625 0.725 1.6510372648 GeneSymbol Lyz2 lysozyme 2 AI326280|Lys|Lyzs|Lzm|Lzm-s1|Lzp protein-coding 11.15 10.74 11.94 11.95 0.0396 10.945 11.945 1 2.0010358224 GeneSymbol Ptprc protein tyrosine phosphatase, receptor type, C B220|CD45R|Cd45|Ly-5|Lyt-4|T200|loc protein-coding 7.94 7.75 8.46 8.65 0.0340 7.845 8.555 0.71 1.6410477649 GeneSymbol Acss2 acyl-CoA synthetase short-chain family member 2 1110017C11Rik|ACAS|Acas1|Acas2|AceCS1|Acs1 protein-coding 7.84 7.58 8.45 8.35 0.0384 7.71 8.4 0.69 1.6110462613 GeneSymbol Ifit2 interferon-induced protein with tetratricopeptide repeats 2 AV302338|Ifi54 protein-coding 6.49 6.26 6.91 6.98 0.0417 6.375 6.945 0.57 1.4810496771 GeneSymbol Mcoln2 mucolipin 2 3300002C04Rik|AI549968|C86638|TRPML2 protein-coding 6.23 6.39 6.77 6.96 0.0466 6.31 6.865 0.555 1.4710382104 Transcribed Locus NA NA NA Unknown 10.96 11.26 12.21 11.95 0.0394 11.11 12.08 0.97 1.9610363265 GeneSymbol Lims1 LIM and senescent cell antigen-like domains 1 2310016J22Rik|4921524A02Rik|AI507642|AU021743|AW551584|C430041B13Rik|Lims1l|PINCH|PINCH1 protein-coding 8.61 8.36 9.33 9.12 0.0454 8.485 9.225 0.74 1.6710569890 GeneSymbol Aida axin interactor, dorsalization associated 2610208M17Rik|BC004835|MGC101949|MGC6869 protein-coding 8.84 8.53 9.49 9.39 0.0435 8.685 9.44 0.755 1.6910477250 GeneSymbol Hck hemopoietic cell kinase AI849071|Bmk|MGC18625 protein-coding 7 6.92 7.58 7.55 0.0049 6.96 7.565 0.605 1.5210475648 GeneSymbol Dtwd1 DTW domain containing 1 1810033A06Rik protein-coding 7.43 7.29 8.04 7.95 0.0167 7.36 7.995 0.635 1.5510542738 GeneSymbol Rassf8 Ras association (RalGDS/AF-6) domain family (N-terminal) member 8 5133400D11Rik|AA815821|AW123240|Hoj1|MGC144731|MGC144732|mHoj-1 protein-coding 8.16 7.87 8.69 8.72 0.0419 8.015 8.705 0.69 1.6110581434 GeneSymbol Dpep2 dipeptidase 2 F630103D06Rik|MBD-2 protein-coding 7.98 7.87 8.5 8.7 0.0274 7.925 8.6 0.675 1.6010358589 GeneSymbol Hmcn1 hemicentin 1 EG545370|Gm201 protein-coding 7.65 7.5 8.24 8.2 0.0142 7.575 8.22 0.645 1.5610505630 GeneSymbol Snapc3 small nuclear RNA activating complex, polypeptide 3 1810020H02Rik|4930558A07Rik|5031401C21Rik|AI414457|E030018J20Rik protein-coding 9.61 9.42 10.29 10.35 0.0150 9.515 10.32 0.805 1.7510344799 GeneSymbol Cspp1 centrosome and spindle pole associated protein 1 2310020J12Rik|4930413O22Rik|AA387550|BC055915|Cspp2|Cspp3 protein-coding 7.82 7.8 8.45 8.49 0.0011 7.81 8.47 0.66 1.5810376144 GeneSymbol Fnip1 folliculin interacting protein 1 A730024A03Rik|AI838773|AW557298|KIAA1961|MGC100017 protein-coding 8.39 8.2 8.91 9.07 0.0305 8.295 8.99 0.695 1.6210383233 GeneSymbol Rnf213 ring finger protein 213 6030403J01|D11Ertd759e|KIAA1554|mKIAA1554 protein-coding 8.06 7.95 8.54 8.8 0.0422 8.005 8.67 0.665 1.5910427918 GeneSymbol Fam105a family with sequence similarity 105, member A 9830126M18|MGC59004 protein-coding 6.76 6.54 7.2 7.2 0.0377 6.65 7.2 0.55 1.4610401841 GeneSymbol Dio2 deiodinase, iodothyronine, type II 5DII|AI324267|DIOII protein-coding 6.88 6.86 7.36 7.51 0.0175 6.87 7.435 0.565 1.4810445119 GeneSymbol H2-M3 histocompatibility 2, M region locus 3 H-2M3|Hmt|M3a|R4B2 protein-coding 6.77 6.85 7.42 7.32 0.0128 6.81 7.37 0.56 1.4710502240 GeneSymbol Npnt nephronectin 1110009H02Rik|AA682063|AI314031|Nctn|POEM protein-coding 8.09 8 8.59 8.79 0.0277 8.045 8.69 0.645 1.5610413059 GeneSymbol Vcl vinculin 9430097D22|AA571387|AI462105|AW545629 protein-coding 8.78 8.51 9.4 9.27 0.0441 8.645 9.335 0.69 1.6110446282 GeneSymbol Emr1 EGF-like module containing, mucin-like, hormone receptor-like sequence 1 DD7A5-7|EGF-TM7|F4/80|Gpf480|Ly71|TM7LN3 protein-coding 8.16 8.02 8.68 8.78 0.0176 8.09 8.73 0.64 1.5610410560 GeneSymbol Trip13 thyroid hormone receptor interactor 13 2410002G23Rik|D13Ertd328e protein-coding 6.83 6.87 7.51 7.27 0.0472 6.85 7.39 0.54 1.4510544732 GeneSymbol Skap2 src family associated phosphoprotein 2 2610021A10Rik|AA960083|BB137539|RA70|SKAP-HOM|Saps|Scap2|mSKAP55R protein-coding 7.29 7.18 7.8 7.81 0.0093 7.235 7.805 0.57 1.4810397085 GeneSymbol Rbm25 RNA binding motif protein 25 2600011C06Rik|2610015J01Rik|A130095G20Rik|AI159652|AL023075|AU043498|RNPC7 protein-coding 9.49 9.2 10.09 10.07 0.0370 9.345 10.08 0.735 1.6610444258 GeneSymbol Psmb8 proteasome (prosome, macropain) subunit, beta type 8 (large multifunctional peptidase 7) Lmp-7|Lmp7 protein-coding 6.94 7.05 7.47 7.62 0.0274 6.995 7.545 0.55 1.4610574102 GeneSymbol Nlrc5 NLR family, CARD domain containing 5 AK220210|NOD27 protein-coding 7.84 7.7 8.47 8.29 0.0332 7.77 8.38 0.61 1.5310418004 GeneSymbol Ap3m1 adaptor-related protein complex 3, mu 1 subunit 1200013D09Rik|C78982|R75378 protein-coding 8.34 8.33 8.99 8.98 0.0001 8.335 8.985 0.65 1.5710565589 GeneSymbol Hmgb1 high mobility group box 1 DEF|HMG-1|Hmg1|MGC103168|MGC103169|MGC117896|MGC117897|SBP-1|amphoterin|p30 protein-coding 10.43 10.15 11.18 11 0.0407 10.29 11.09 0.8 1.7410383206 Transcribed Locus NA NA NA Unknown 7.31 7.27 7.75 7.96 0.0340 7.29 7.855 0.565 1.4810478678 GeneSymbol Cd40 CD40 antigen AI326936|Bp50|GP39|HIGM1|IGM|IMD3|T-BAM|TRAP|Tnfrsf5|p50 protein-coding 7.19 7.39 7.84 7.87 0.0306 7.29 7.855 0.565 1.4810444780 GeneSymbol H2-D1 histocompatibility 2, D region locus 1 H-2D|H2-D protein-coding 10.39 10.3 11.17 11.12 0.0041 10.345 11.145 0.8 1.7410507273 GeneSymbol Pik3r3 phosphatidylinositol 3 kinase, regulatory subunit, polypeptide 3 (p55) AA414954|p55pik protein-coding 6.98 6.86 7.39 7.52 0.0263 6.92 7.455 0.535 1.4510580582 GeneSymbol 4933436C20Rik RIKEN cDNA 4933436C20 gene - miscRNA 7.71 7.46 8.16 8.18 0.0430 7.585 8.17 0.585 1.5010501661 GeneAccession Srsf3 serine/arginine-rich splicing factor 3 AL024116|Sfrs3|X16 protein-coding 10.06 9.9 10.85 10.64 0.0285 9.98 10.745 0.765 1.7010494662 GeneSymbol Ywhah tyrosine 3-monooxygenase/tryptophan 5-monooxygenase activation protein, eta polypeptide - protein-coding 10.06 9.85 10.73 10.7 0.0189 9.955 10.715 0.76 1.6910539773 GeneSymbol Gfpt1 glutamine fructose-6-phosphate transaminase 1 2810423A18Rik|AI324119|AI449986|GFA|GFAT|GFAT1|GFAT1m|Gfpt protein-coding 7.2 7.07 7.72 7.63 0.0208 7.135 7.675 0.54 1.45
10584334 GeneSymbol Siae sialic acid acetylesterase LSE|Ysg2 protein-coding 7.18 7 7.61 7.64 0.0279 7.09 7.625 0.535 1.4510510254 GeneSymbol Fv1 Friend virus susceptibility 1 Fv-1|Rv-1|Rv1 protein-coding 7.16 7.17 7.82 7.59 0.0426 7.165 7.705 0.54 1.4510446771 GeneSymbol Lclat1 lysocardiolipin acyltransferase 1 AI181996|Agpat8|Alcat1|Gm91|Lycat protein-coding 8.95 8.71 9.4 9.58 0.0480 8.83 9.49 0.66 1.5810421768 GeneSymbol Akap11 A kinase (PRKA) anchor protein 11 6330501D17Rik|AKAP220|Gm80|PRKA11|mKIAA0629 protein-coding 8.71 8.53 9.28 9.24 0.0201 8.62 9.26 0.64 1.5610543959 GeneSymbol Ptn pleiotrophin HARP|HB-GAM|HBBN|HBGF-8|HBNF|OSF|Osf-1|Osf1 protein-coding 7.58 7.59 8.12 8.17 0.0021 7.585 8.145 0.56 1.4710551760 GeneSymbol Zfp84 zinc finger protein 84 2210410P13Rik|4633401C23Rik|AI415447|BB081605|C86188|KRAB18|Zfp69 protein-coding 7.77 7.87 8.47 8.32 0.0237 7.82 8.395 0.575 1.4910405731 GeneSymbol 4933434E20Rik RIKEN cDNA 4933434E20 gene 5730552F22Rik|AI462154|NICE-3|NS5ATP4 protein-coding 8.58 8.58 9.34 9.08 0.0400 8.58 9.21 0.63 1.5510407766 GeneSymbol Lgals8 lectin, galactose binding, soluble 8 1200015E08Rik|AI326142|D13Ertd524e|Lgals-8 protein-coding 8.38 8.26 9.01 8.85 0.0258 8.32 8.93 0.61 1.5310371277 GeneSymbol B230315N10Rik RIKEN cDNA B230315N10 gene MGC19022 protein-coding 8.06 7.88 8.47 8.63 0.0405 7.97 8.55 0.58 1.4910383152 Transcribed Locus NA NA NA Unknown 7.63 7.65 8.1 8.29 0.0284 7.64 8.195 0.555 1.4710462454 GeneSymbol Uhrf2 ubiquitin-like, containing PHD and RING finger domains 2 2310065A22Rik|AI426270|AW214556|D130071B19Rik|Nirf protein-coding 7.94 7.8 8.53 8.33 0.0444 7.87 8.43 0.56 1.4710445781 GeneSymbol Trem2 triggering receptor expressed on myeloid cells 2 Trem2a|Trem2b|Trem2c protein-coding 7.58 7.75 8.12 8.3 0.0479 7.665 8.21 0.545 1.4610522596 GeneSymbol Tmem165 transmembrane protein 165 AV026557|Tpardl|Tparl|pFT27 protein-coding 9.86 9.62 10.48 10.31 0.0469 9.74 10.395 0.655 1.5710451650 GeneSymbol Nfya nuclear transcription factor-Y alpha AA407810|Cbf-b|SEZ-10|SEZ10 protein-coding 8.35 8.23 8.95 8.73 0.0482 8.29 8.84 0.55 1.4610485395 GeneSymbol Trim44 tripartite motif-containing 44 Dipb|MGC102054|Mc7 protein-coding 8.27 8.26 8.91 8.71 0.0321 8.265 8.81 0.545 1.4610348004 GeneSymbol Psmd1 proteasome (prosome, macropain) 26S subunit, non-ATPase, 1 2410026J11Rik|P112|S1 protein-coding 10.42 10.14 11 10.91 0.0443 10.28 10.955 0.675 1.6010502058 GeneAccession Ap1ar adaptor-related protein complex 1 associated regulatory protein AA407621|C78909|MGC7434 protein-coding 9.75 9.65 10.43 10.23 0.0301 9.7 10.33 0.63 1.5510444830 GeneSymbol H2-Q7 histocompatibility 2, Q region locus 7 H-2Q7|Ped|Q9|Qa-2|Qa-7|Qa7 protein-coding 10.56 10.46 11.14 11.23 0.0098 10.51 11.185 0.675 1.6010574436 GeneSymbol Khdrbs1 KH domain containing, RNA binding, signal transduction associated 1 Sam68|p62 protein-coding 9.14 8.93 9.58 9.64 0.0342 9.035 9.61 0.575 1.4910366004 GeneSymbol Atp2b1 ATPase, Ca++ transporting, plasma membrane 1 2810442I22Rik|E130111D10Rik|Pmca1 protein-coding 9.82 9.62 10.31 10.34 0.0268 9.72 10.325 0.605 1.5210586168 GeneSymbol Snord16a small nucleolar RNA, C/D box 16A MBII-98 snoRNA 9.05 8.92 9.5 9.55 0.0162 8.985 9.525 0.54 1.4510364280 GeneSymbol Pttg1ip pituitary tumor-transforming 1 interacting protein 1810010L20Rik|AI314311|AU018448|C79540|MGC36923 protein-coding 9.57 9.42 10.07 10.05 0.0175 9.495 10.06 0.565 1.4810413695 GeneSymbol Pbrm1 polybromo 1 2610016F04Rik|AI507524|BAF180|Pb1 protein-coding 9.96 9.76 10.48 10.41 0.0313 9.86 10.445 0.585 1.5010493292 GeneSymbol 2810403A07Rik RIKEN cDNA 2810403A07 gene A430106P18Rik|AI256352|AI451678|Blom7|Kiaa0907 protein-coding 9.35 9.11 9.78 9.76 0.0463 9.23 9.77 0.54 1.4510363703 GeneSymbol Jmjd1c jumonji domain containing 1C 5430433L24Rik|D630035I23Rik|Jmjdic|TRIP8 protein-coding 9.19 8.99 9.65 9.59 0.0367 9.09 9.62 0.53 1.4410471586 GeneSymbol Hspa5 heat shock protein 5 AL022860|AU019543|Bip|D2Wsu141e|D2Wsu17e|Grp78|Hsce70|SEZ-7|Sez7|mBiP protein-coding 10.36 10.23 10.94 10.84 0.0185 10.295 10.89 0.595 1.5110572747 GeneSymbol Tpm4 tropomyosin 4 2610528G24Rik protein-coding 10.73 10.48 11.18 11.13 0.0497 10.605 11.155 0.55 1.4610517508 GeneSymbol C1qb complement component 1, q subcomponent, beta polypeptide - protein-coding 10.44 10.37 10.84 11.04 0.0371 10.405 10.94 0.535 1.4510385599 GeneSymbol Canx calnexin 1110069N15Rik|AI988026|Cnx|D11Ertd153e protein-coding 11.3 11.16 11.77 11.83 0.0174 11.23 11.8 0.57 1.48
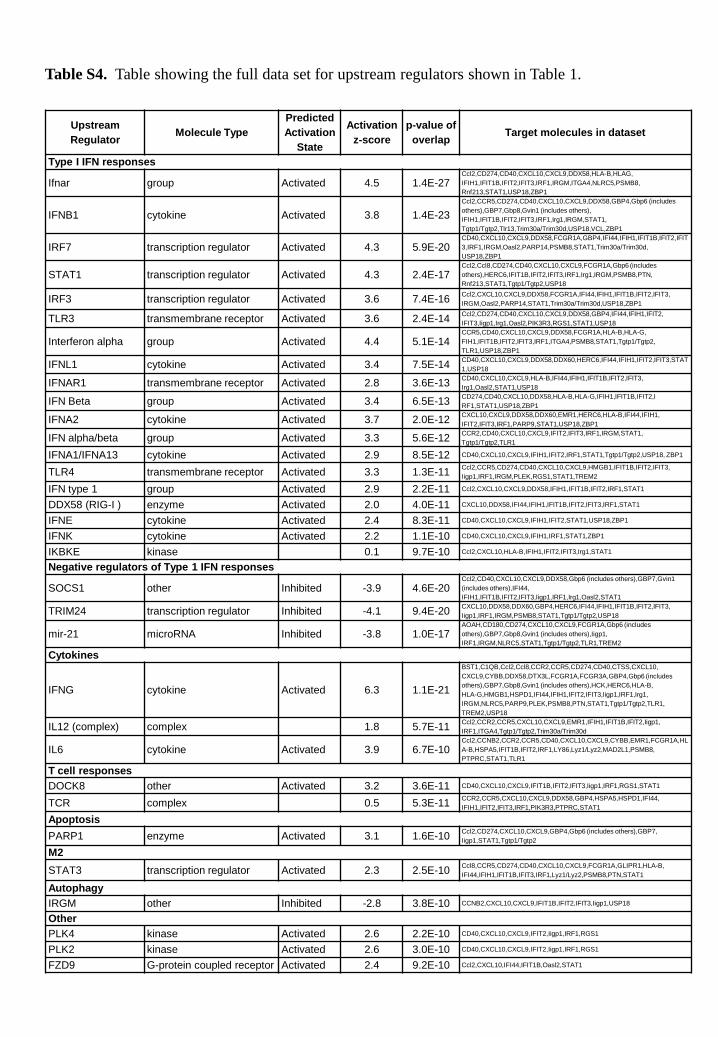
Table S4. Table showing the full data set for upstream regulators shown in Table 1.
Upstream Regulator
Molecule Type Predicted Activation
State
Activation z-score
p-value of overlap
Target molecules in dataset
Type I IFN responses
Ifnar group Activated 4.5 1.4E-27 Ccl2,CD274,CD40,CXCL10,CXCL9,DDX58,HLA-B,HLAG, IFIH1,IFIT1B,IFIT2,IFIT3,IRF1,IRGM,ITGA4,NLRC5,PSMB8, Rnf213,STAT1,USP18,ZBP1
IFNB1 cytokine Activated 3.8 1.4E-23 Ccl2,CCR5,CD274,CD40,CXCL10,CXCL9,DDX58,GBP4,Gbp6 (includes others),GBP7,Gbp8,Gvin1 (includes others), IFIH1,IFIT1B,IFIT2,IFIT3,IRF1,Irg1,IRGM,STAT1, Tgtp1/Tgtp2,Tlr13,Trim30a/Trim30d,USP18,VCL,ZBP1
IRF7 transcription regulator Activated 4.3 5.9E-20 CD40,CXCL10,CXCL9,DDX58,FCGR1A,GBP4,IFI44,IFIH1,IFIT1B,IFIT2,IFIT3,IRF1,IRGM,Oasl2,PARP14,PSMB8,STAT1,Trim30a/Trim30d, USP18,ZBP1
STAT1 transcription regulator Activated 4.3 2.4E-17 Ccl2,Ccl8,CD274,CD40,CXCL10,CXCL9,FCGR1A,Gbp6 (includes others),HERC6,IFIT1B,IFIT2,IFIT3,IRF1,Irg1,IRGM,PSMB8,PTN, Rnf213,STAT1,Tgtp1/Tgtp2,USP18
IRF3 transcription regulator Activated 3.6 7.4E-16 Ccl2,CXCL10,CXCL9,DDX58,FCGR1A,IFI44,IFIH1,IFIT1B,IFIT2,IFIT3, IRGM,Oasl2,PARP14,STAT1,Trim30a/Trim30d,USP18,ZBP1
TLR3 transmembrane receptor Activated 3.6 2.4E-14 Ccl2,CD274,CD40,CXCL10,CXCL9,DDX58,GBP4,IFI44,IFIH1,IFIT2, IFIT3,Iigp1,Irg1,Oasl2,PIK3R3,RGS1,STAT1,USP18
Interferon alpha group Activated 4.4 5.1E-14 CCR5,CD40,CXCL10,CXCL9,DDX58,FCGR1A,HLA-B,HLA-G, FIH1,IFIT1B,IFIT2,IFIT3,IRF1,ITGA4,PSMB8,STAT1,Tgtp1/Tgtp2, TLR1,USP18,ZBP1
IFNL1 cytokine Activated 3.4 7.5E-14 CD40,CXCL10,CXCL9,DDX58,DDX60,HERC6,IFI44,IFIH1,IFIT2,IFIT3,STAT1,USP18
IFNAR1 transmembrane receptor Activated 2.8 3.6E-13 CD40,CXCL10,CXCL9,HLA-B,IFI44,IFIH1,IFIT1B,IFIT2,IFIT3, Irg1,Oasl2,STAT1,USP18
IFN Beta group Activated 3.4 6.5E-13 CD274,CD40,CXCL10,DDX58,HLA-B,HLA-G,IFIH1,IFIT1B,IFIT2,I RF1,STAT1,USP18,ZBP1
IFNA2 cytokine Activated 3.7 2.0E-12 CXCL10,CXCL9,DDX58,DDX60,EMR1,HERC6,HLA-B,IFI44,IFIH1, IFIT2,IFIT3,IRF1,PARP9,STAT1,USP18,ZBP1
IFN alpha/beta group Activated 3.3 5.6E-12 CCR2,CD40,CXCL10,CXCL9,IFIT2,IFIT3,IRF1,IRGM,STAT1, Tgtp1/Tgtp2,TLR1
IFNA1/IFNA13 cytokine Activated 2.9 8.5E-12 CD40,CXCL10,CXCL9,IFIH1,IFIT2,IRF1,STAT1,Tgtp1/Tgtp2,USP18, ZBP1
TLR4 transmembrane receptor Activated 3.3 1.3E-11 Ccl2,CCR5,CD274,CD40,CXCL10,CXCL9,HMGB1,IFIT1B,IFIT2,IFIT3, Iigp1,IRF1,IRGM,PLEK,RGS1,STAT1,TREM2
IFN type 1 group Activated 2.9 2.2E-11 Ccl2,CXCL10,CXCL9,DDX58,IFIH1,IFIT1B,IFIT2,IRF1,STAT1
DDX58 (RIG-I ) enzyme Activated 2.0 4.0E-11 CXCL10,DDX58,IFI44,IFIH1,IFIT1B,IFIT2,IFIT3,IRF1,STAT1
IFNE cytokine Activated 2.4 8.3E-11 CD40,CXCL10,CXCL9,IFIH1,IFIT2,STAT1,USP18,ZBP1
IFNK cytokine Activated 2.2 1.1E-10 CD40,CXCL10,CXCL9,IFIH1,IRF1,STAT1,ZBP1
IKBKE kinase 0.1 9.7E-10 Ccl2,CXCL10,HLA-B,IFIH1,IFIT2,IFIT3,Irg1,STAT1
Negative regulators of Type 1 IFN responses
SOCS1 other Inhibited -3.9 4.6E-20 Ccl2,CD40,CXCL10,CXCL9,DDX58,Gbp6 (includes others),GBP7,Gvin1 (includes others),IFI44, IFIH1,IFIT1B,IFIT2,IFIT3,Iigp1,IRF1,Irg1,Oasl2,STAT1
TRIM24 transcription regulator Inhibited -4.1 9.4E-20 CXCL10,DDX58,DDX60,GBP4,HERC6,IFI44,IFIH1,IFIT1B,IFIT2,IFIT3, Iigp1,IRF1,IRGM,PSMB8,STAT1,Tgtp1/Tgtp2,USP18
mir-21 microRNA Inhibited -3.8 1.0E-17 AOAH,CD180,CD274,CXCL10,CXCL9,FCGR1A,Gbp6 (includes others),GBP7,Gbp8,Gvin1 (includes others),Iigp1, IRF1,IRGM,NLRC5,STAT1,Tgtp1/Tgtp2,TLR1,TREM2
Cytokines
IFNG cytokine Activated 6.3 1.1E-21
BST1,C1QB,Ccl2,Ccl8,CCR2,CCR5,CD274,CD40,CTSS,CXCL10, CXCL9,CYBB,DDX58,DTX3L,FCGR1A,FCGR3A,GBP4,Gbp6 (includes others),GBP7,Gbp8,Gvin1 (includes others),HCK,HERC6,HLA-B, HLA-G,HMGB1,HSPD1,IFI44,IFIH1,IFIT2,IFIT3,Iigp1,IRF1,Irg1, IRGM,NLRC5,PARP9,PLEK,PSMB8,PTN,STAT1,Tgtp1/Tgtp2,TLR1, TREM2,USP18
IL12 (complex) complex 1.8 5.7E-11 Ccl2,CCR2,CCR5,CXCL10,CXCL9,EMR1,IFIH1,IFIT1B,IFIT2,Iigp1, IRF1,ITGA4,Tgtp1/Tgtp2,Trim30a/Trim30d
IL6 cytokine Activated 3.9 6.7E-10 Ccl2,CCNB2,CCR2,CCR5,CD40,CXCL10,CXCL9,CYBB,EMR1,FCGR1A,HLA-B,HSPA5,IFIT1B,IFIT2,IRF1,LY86,Lyz1/Lyz2,MAD2L1,PSMB8, PTPRC,STAT1,TLR1
T cell responses DOCK8 other Activated 3.2 3.6E-11 CD40,CXCL10,CXCL9,IFIT1B,IFIT2,IFIT3,Iigp1,IRF1,RGS1,STAT1
TCR complex 0.5 5.3E-11 CCR2,CCR5,CXCL10,CXCL9,DDX58,GBP4,HSPA5,HSPD1,IFI44, IFIH1,IFIT2,IFIT3,IRF1,PIK3R3,PTPRC,STAT1
Apoptosis PARP1 enzyme Activated 3.1 1.6E-10 Ccl2,CD274,CXCL10,CXCL9,GBP4,Gbp6 (includes others),GBP7,
Iigp1,STAT1,Tgtp1/Tgtp2
M2
STAT3 transcription regulator Activated 2.3 2.5E-10 Ccl8,CCR5,CD274,CD40,CXCL10,CXCL9,FCGR1A,GLIPR1,HLA-B, IFI44,IFIH1,IFIT1B,IFIT3,IRF1,Lyz1/Lyz2,PSMB8,PTN,STAT1
Autophagy IRGM other Inhibited -2.8 3.8E-10 CCNB2,CXCL10,CXCL9,IFIT1B,IFIT2,IFIT3,Iigp1,USP18
Other PLK4 kinase Activated 2.6 2.2E-10 CD40,CXCL10,CXCL9,IFIT2,Iigp1,IRF1,RGS1
PLK2 kinase Activated 2.6 3.0E-10 CD40,CXCL10,CXCL9,IFIT2,Iigp1,IRF1,RGS1
FZD9 G-protein coupled receptor Activated 2.4 9.2E-10 Ccl2,CXCL10,IFI44,IFIT1B,Oasl2,STAT1
Isolation method Amplification
method Detection assay Outcome
Macerated foot tissue C6/36 Vero CPE Negative
Cells from collagenase digested macerated foot tissues
C6/36 Vero CPE Negative*
Macerated and freeze thawed foot tissue
C6/36 Vero CPE Negative
Supernatant from homogenised foot tissue
i.p. into IRF3/7-/- mice
Disease (Rudd et al., 2012)
Negative
Cells from macerated foot tissue
i.p. into IRF3/7-/- mice
Disease Negative
Supernatant from homogenised foot tissue
i.p. into Rag1-/- mice
Viraemia Negative
Cells from macerated foot tissue
i.p. into Rag1-/- mice
Viraemia Negative
RNA isolated from foot tissues
Transfection of BHK cells
C6/36/Vero CPE Negative
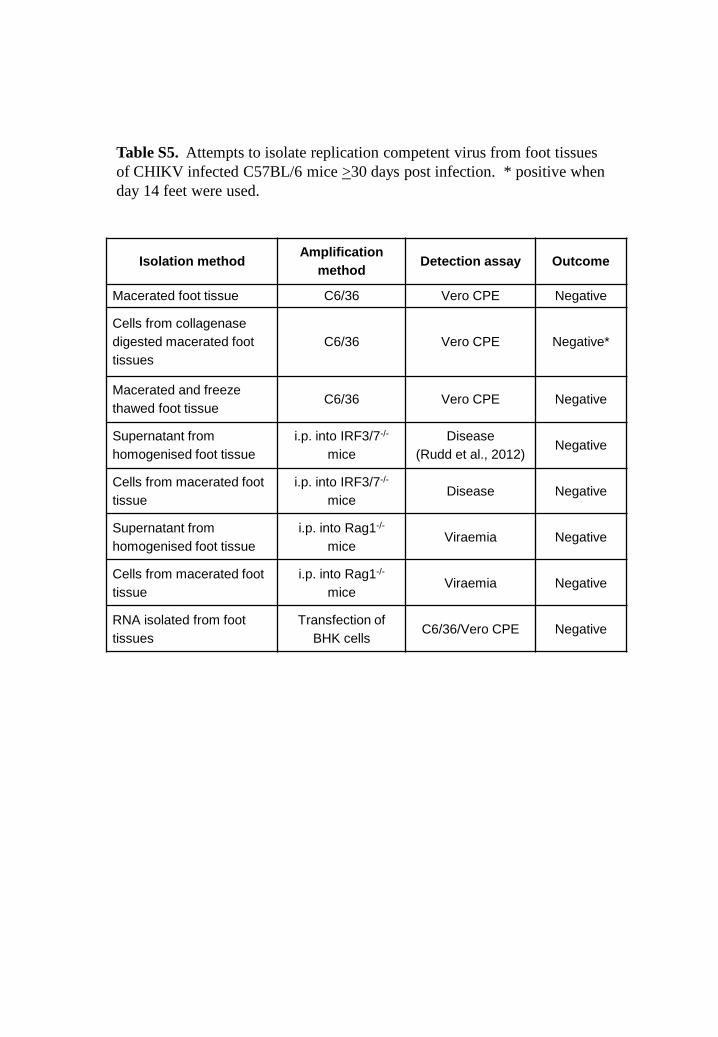
Table S5. Attempts to isolate replication competent virus from foot tissues of CHIKV infected C57BL/6 mice >30 days post infection. * positive when day 14 feet were used.
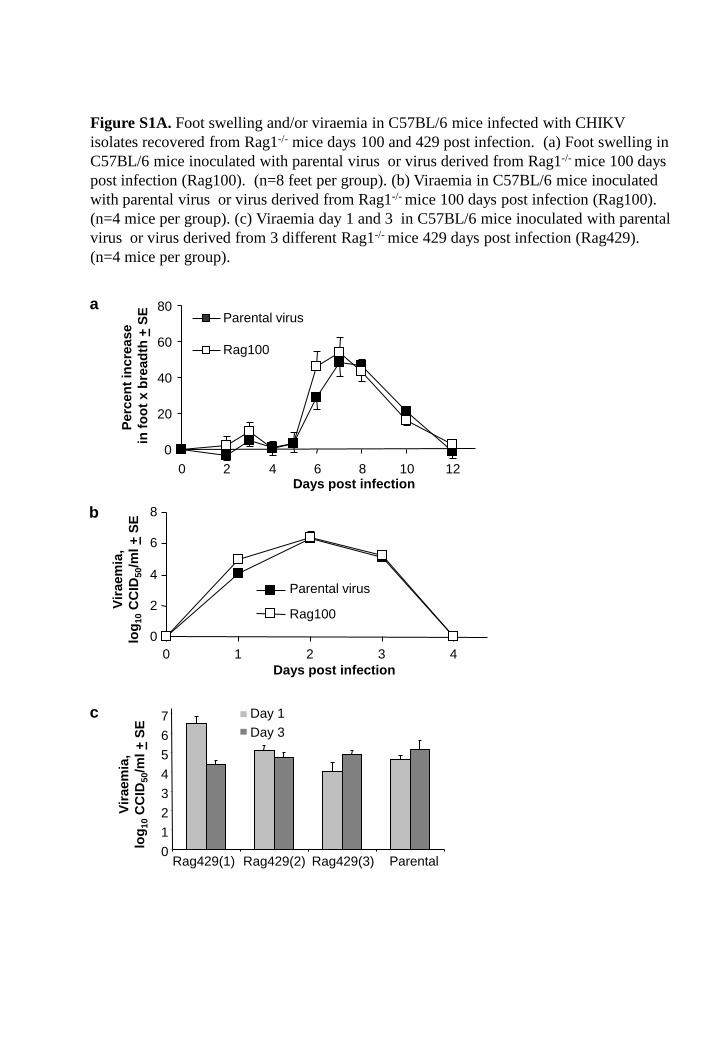
Figure S1A. Foot swelling and/or viraemia in C57BL/6 mice infected with CHIKV isolates recovered from Rag1-/- mice days 100 and 429 post infection. (a) Foot swelling in C57BL/6 mice inoculated with parental virus or virus derived from Rag1-/- mice 100 days post infection (Rag100). (n=8 feet per group). (b) Viraemia in C57BL/6 mice inoculated with parental virus or virus derived from Rag1-/- mice 100 days post infection (Rag100). (n=4 mice per group). (c) Viraemia day 1 and 3 in C57BL/6 mice inoculated with parental virus or virus derived from 3 different Rag1-/- mice 429 days post infection (Rag429). (n=4 mice per group).
0
20
40
60
80
0 2 4 6 8 10 12 Days post infection
Parental virus
Rag100
Perc
ent i
ncre
ase
in
foot
x b
read
th +
SE
Vira
emia
, lo
g 10 C
CID
50/m
l + S
E
0 1 2 3 4 5 6 7
Rag429(1) Parental
Day 1 Day 3
Rag429(2) Rag429(3)
a
0
2
4
6
8
0 1 2 3 4 Days post infection
Parental virus
Rag100
Vira
emia
, lo
g 10 C
CID
50/m
l + S
E b
c
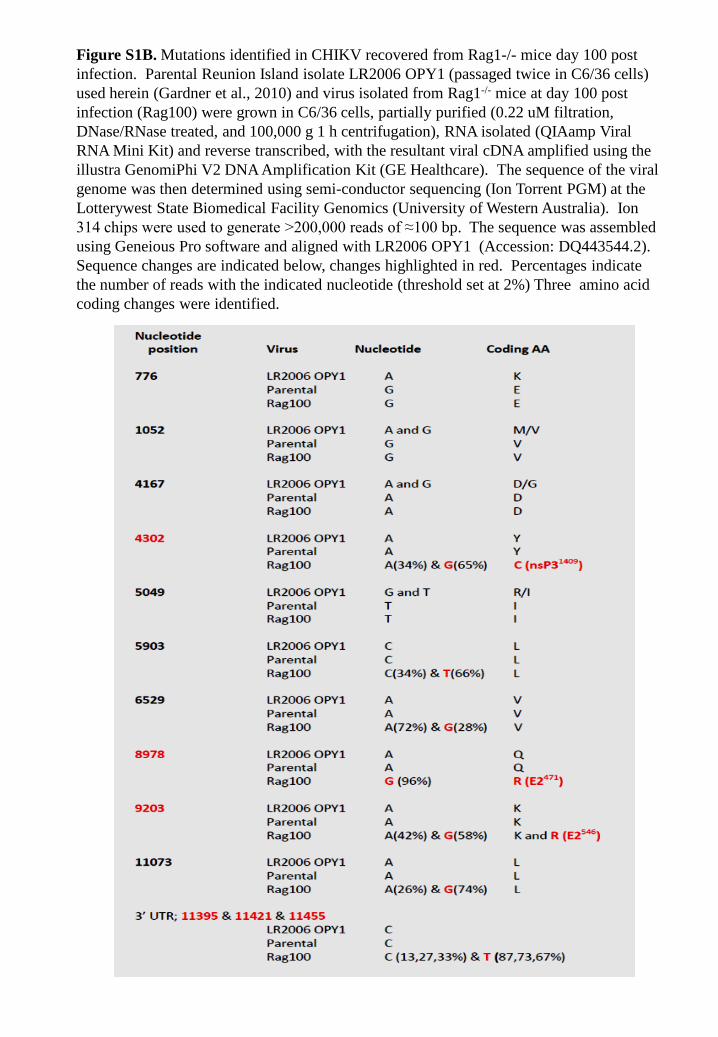
Figure S1B. Mutations identified in CHIKV recovered from Rag1-/- mice day 100 post infection. Parental Reunion Island isolate LR2006 OPY1 (passaged twice in C6/36 cells) used herein (Gardner et al., 2010) and virus isolated from Rag1-/- mice at day 100 post infection (Rag100) were grown in C6/36 cells, partially purified (0.22 uM filtration, DNase/RNase treated, and 100,000 g 1 h centrifugation), RNA isolated (QIAamp Viral RNA Mini Kit) and reverse transcribed, with the resultant viral cDNA amplified using the illustra GenomiPhi V2 DNA Amplification Kit (GE Healthcare). The sequence of the viral genome was then determined using semi-conductor sequencing (Ion Torrent PGM) at the Lotterywest State Biomedical Facility Genomics (University of Western Australia). Ion 314 chips were used to generate >200,000 reads of ≈100 bp. The sequence was assembled using Geneious Pro software and aligned with LR2006 OPY1 (Accession: DQ443544.2). Sequence changes are indicated below, changes highlighted in red. Percentages indicate the number of reads with the indicated nucleotide (threshold set at 2%) Three amino acid coding changes were identified.
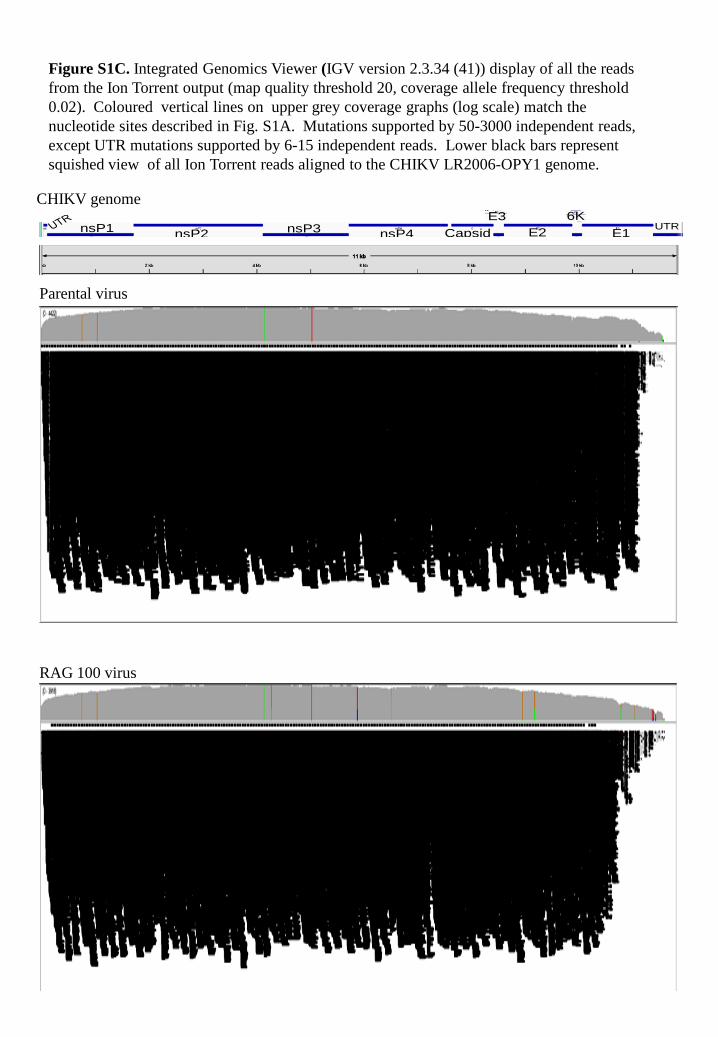
Figure S1C. Integrated Genomics Viewer (IGV version 2.3.34 (41)) display of all the reads from the Ion Torrent output (map quality threshold 20, coverage allele frequency threshold 0.02). Coloured vertical lines on upper grey coverage graphs (log scale) match the nucleotide sites described in Fig. S1A. Mutations supported by 50-3000 independent reads, except UTR mutations supported by 6-15 independent reads. Lower black bars represent squished view of all Ion Torrent reads aligned to the CHIKV LR2006-OPY1 genome.
CHIKV genome
Parental virus
RAG 100 virus
UTR
nsP4nsP3 E2 E1nsP2nsP16K
Capsid
E3d
6K
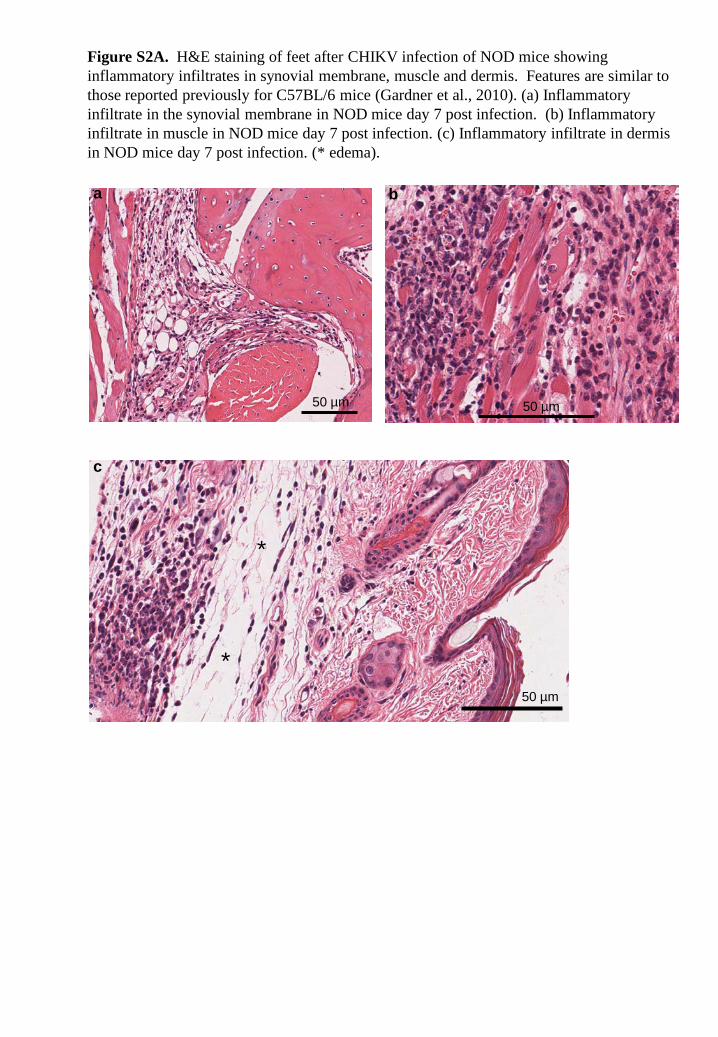
Figure S2A. H&E staining of feet after CHIKV infection of NOD mice showing inflammatory infiltrates in synovial membrane, muscle and dermis. Features are similar to those reported previously for C57BL/6 mice (Gardner et al., 2010). (a) Inflammatory infiltrate in the synovial membrane in NOD mice day 7 post infection. (b) Inflammatory infiltrate in muscle in NOD mice day 7 post infection. (c) Inflammatory infiltrate in dermis in NOD mice day 7 post infection. (* edema).
50 µm
a
50 µm
b
50 µm
*
*
c
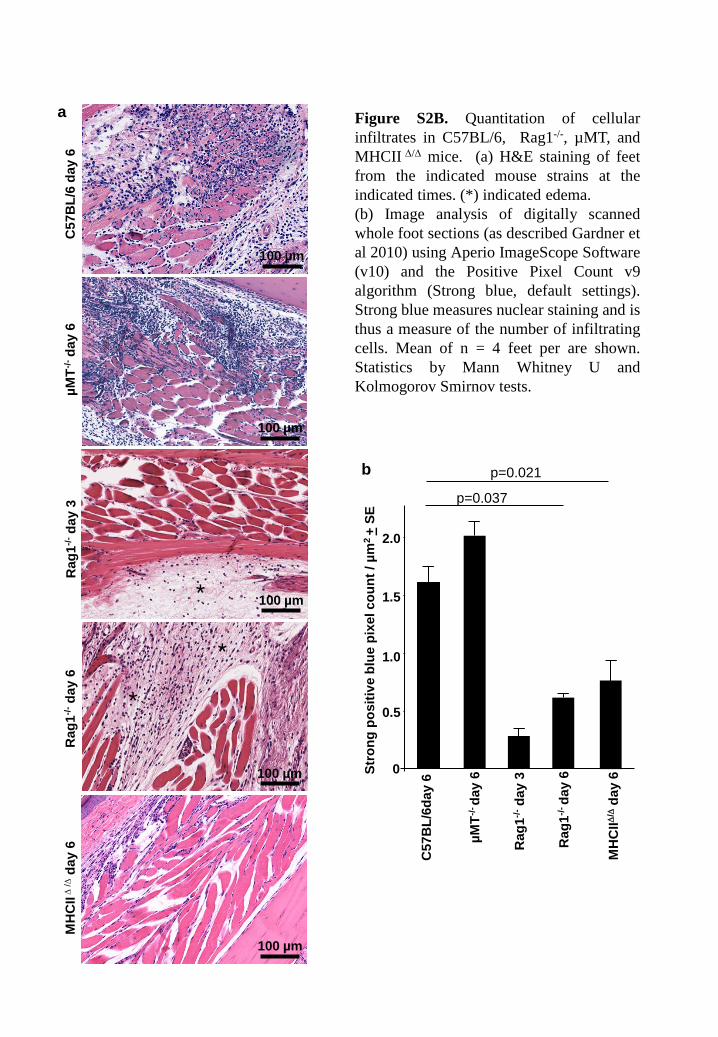
Figure S2B. Quantitation of cellular infiltrates in C57BL/6, Rag1-/-, µMT, and MHCII ∆/∆ mice. (a) H&E staining of feet from the indicated mouse strains at the indicated times. (*) indicated edema. (b) Image analysis of digitally scanned whole foot sections (as described Gardner et al 2010) using Aperio ImageScope Software (v10) and the Positive Pixel Count v9 algorithm (Strong blue, default settings). Strong blue measures nuclear staining and is thus a measure of the number of infiltrating cells. Mean of n = 4 feet per are shown. Statistics by Mann Whitney U and Kolmogorov Smirnov tests.
a
100 µm
100 µm
100 µm
100 µm
100 µm *
*
µMT-/-
day
6
C57
BL/
6 da
y 6
Rag
1-/- d
ay 6
M
HC
II ∆ /∆
day
6
Rag
1-/- d
ay 3
Stro
ng p
ositi
ve b
lue
pixe
l cou
nt /
µm2
+ SE
µMT-/-
day
6
C57
BL/
6day
6
Rag
1-/- d
ay 6
MH
CII∆
/∆ d
ay 6
0
0.5
1.0
1.5
2.0 R
ag1-/-
day
3
p=0.037
p=0.021 b
*
Days post infection
0
50
100
150
200
250
0 5 10 15 20 25 30 35 Rec
ipro
cal n
eutr
alis
atio
n tit
re +
SE
60 150
b
0
1
2
3
4
5
6
7
8
0 1 2 3 4 5 6 7 8 9 10 11 12 13 14
µMT C57BL/6 Rag1-/-
Rag2/Il2rg
Days post infection
Vira
emia
, lo
g 10 C
CID
50/m
l + S
E
a
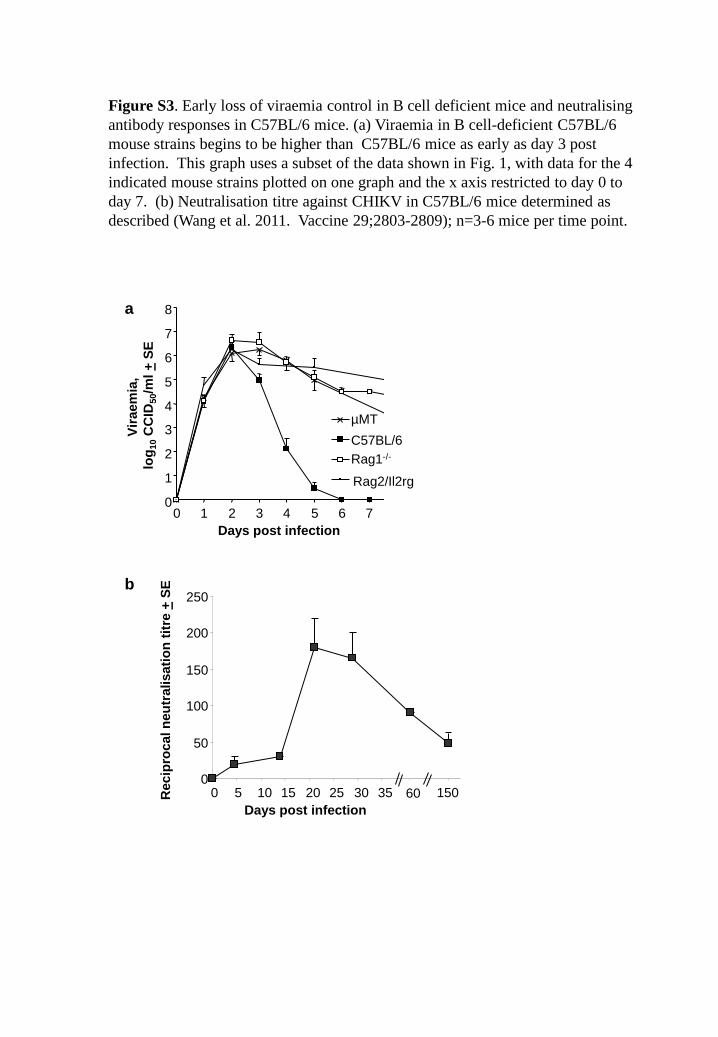
Figure S3. Early loss of viraemia control in B cell deficient mice and neutralising antibody responses in C57BL/6 mice. (a) Viraemia in B cell-deficient C57BL/6 mouse strains begins to be higher than C57BL/6 mice as early as day 3 post infection. This graph uses a subset of the data shown in Fig. 1, with data for the 4 indicated mouse strains plotted on one graph and the x axis restricted to day 0 to day 7. (b) Neutralisation titre against CHIKV in C57BL/6 mice determined as described (Wang et al. 2011. Vaccine 29;2803-2809); n=3-6 mice per time point.
0 1 2 3 4 5 6
0 2 4 6 Days post infection
Vira
emia
, lo
g 10 C
CID
50/m
l + S
E
FcγR-/-
0
20
40
60
80
100
0 2 4 6 8 10 12 14 16 18 20 Days post infection
Perc
ent i
ncre
ase
in
foot
x b
read
th +
SE
FcγR-/-
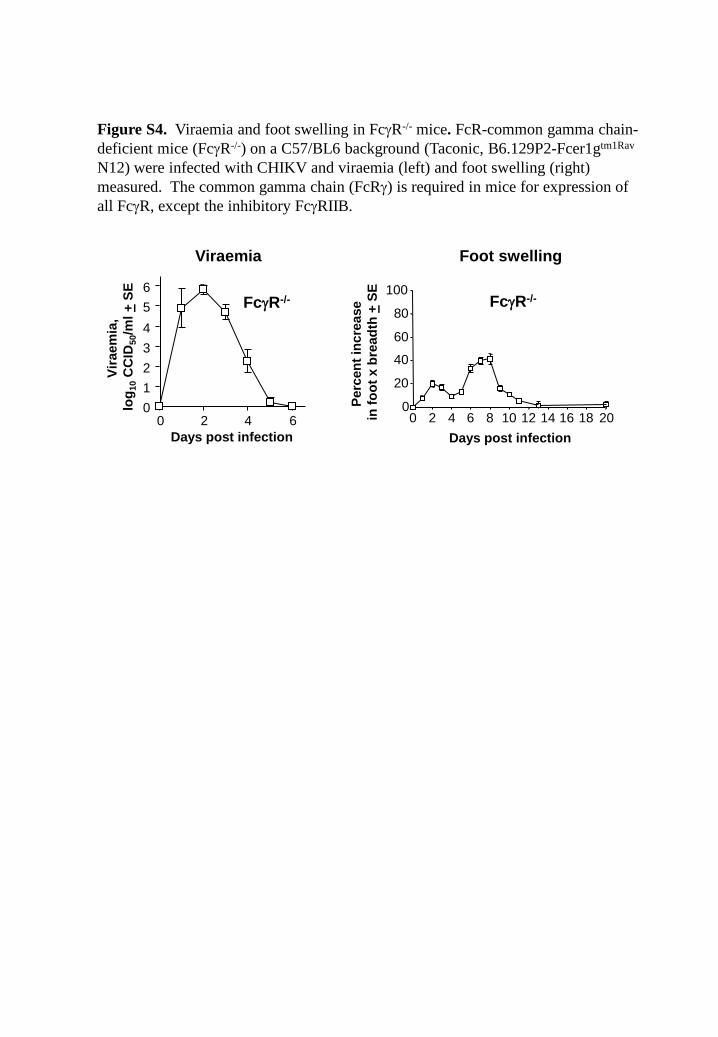
Figure S4. Viraemia and foot swelling in FcγR-/- mice. FcR-common gamma chain-deficient mice (FcγR-/-) on a C57/BL6 background (Taconic, B6.129P2-Fcer1gtm1Rav N12) were infected with CHIKV and viraemia (left) and foot swelling (right) measured. The common gamma chain (FcRγ) is required in mice for expression of all FcγR, except the inhibitory FcγRIIB.
Viraemia Foot swelling
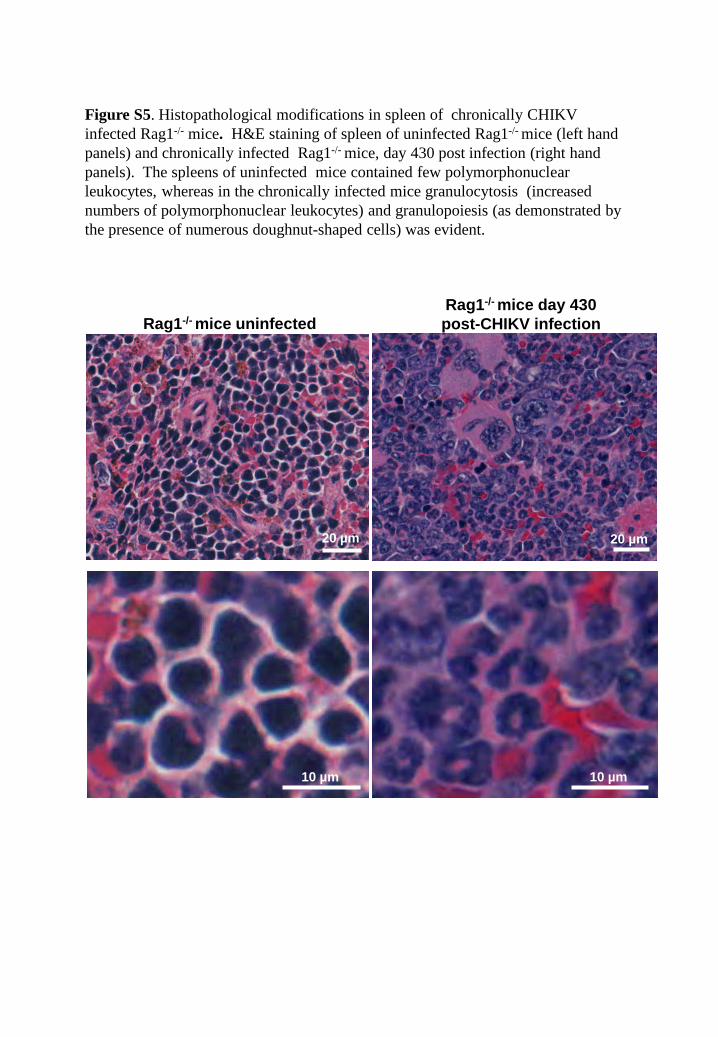
Figure S5. Histopathological modifications in spleen of chronically CHIKV infected Rag1-/- mice. H&E staining of spleen of uninfected Rag1-/- mice (left hand panels) and chronically infected Rag1-/- mice, day 430 post infection (right hand panels). The spleens of uninfected mice contained few polymorphonuclear leukocytes, whereas in the chronically infected mice granulocytosis (increased numbers of polymorphonuclear leukocytes) and granulopoiesis (as demonstrated by the presence of numerous doughnut-shaped cells) was evident.
Rag1-/- mice uninfected Rag1-/- mice day 430 post-CHIKV infection
20 µm 20 µm
5 µm 5 µm 10 µm 10 µm
0
20
40
60
80
100
0 50 100 150 200 250 300 350 400 Days post infection
Perc
ent s
urvi
ving
CHIKV infected
Control
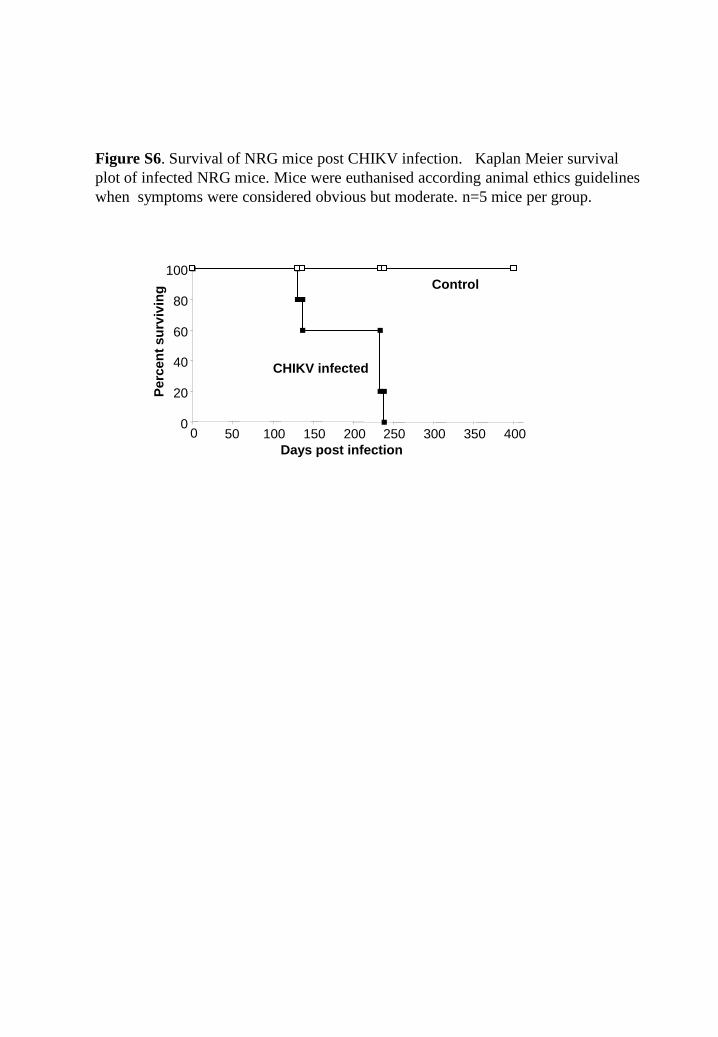
Figure S6. Survival of NRG mice post CHIKV infection. Kaplan Meier survival plot of infected NRG mice. Mice were euthanised according animal ethics guidelines when symptoms were considered obvious but moderate. n=5 mice per group.

Figure S7A. Brain lesions in NRG mice with neurological symptoms requiring euthanasia. (a) Low magnification H&E staining of the brain of NRG mouse with CHIKV-induced neurological symptoms requiring the animals to be euthanasized. Arrows indicate pale foci near ventricles (corpus callosum, striatum), in the thalamus, and in Ammon’s horn. (No additional lesions were seen with Luxol Fast Blue staining: there was no evidence of demyelination). (b) High magnification of a pale foci, showing the foci correspond to areas of vacuolisation and edema. The cell density depicted here is illustrative of diffuse reactive gliosis. (c) In or near the vacuolated foci gemistocytic astrocytes, with abundant hyalin eosinophilic cytoplasm and large clear nucleus, were evident (black arrowhead). Some activated microglial cells were also present (arrows). Dark staining neurons within the damaged parenchyma (suggestive of cell death) were also seen (open arrowhead).
500 µm
70 µm
a
100 µm
b
c
.
100 µm
a
100 µm
b
100 µm
d
100 µm
c
10
100
1000
10,000
Anti-
caps
id, N
RG
d
ay 2
33
Isot
ype
cont
rol,
NR
G
day
233
Anti-
caps
id, C
57BL
/6,
day
3
Stro
ng p
ositi
ve re
d pi
xels
p
er n
m2 +
SE
f
100 µm
e
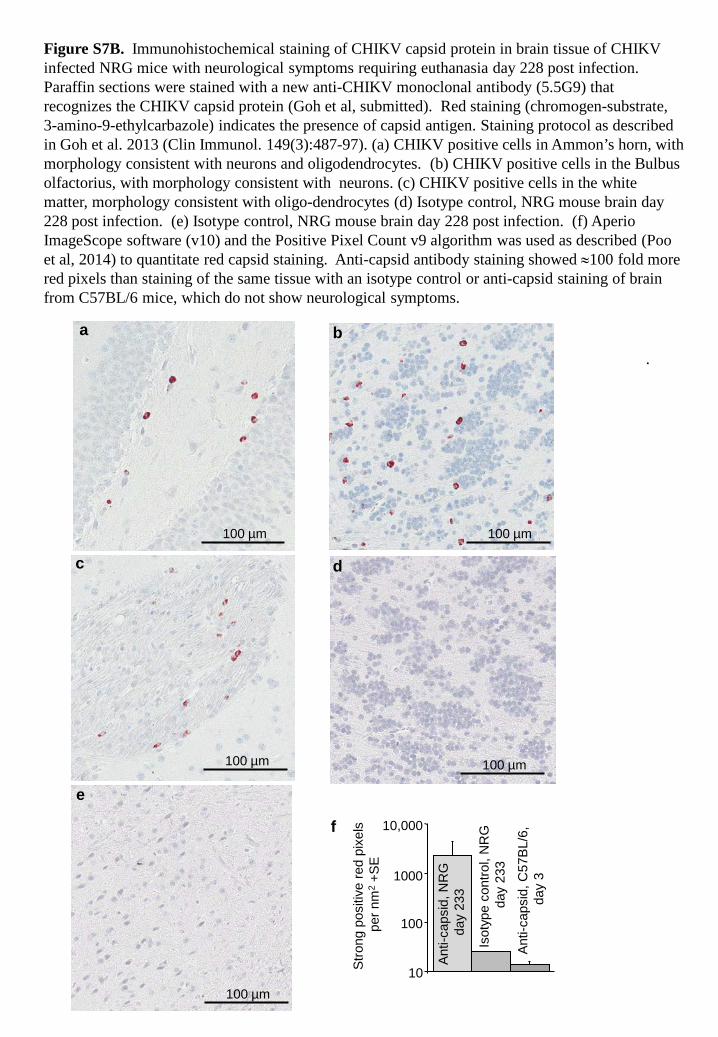
Figure S7B. Immunohistochemical staining of CHIKV capsid protein in brain tissue of CHIKV infected NRG mice with neurological symptoms requiring euthanasia day 228 post infection. Paraffin sections were stained with a new anti-CHIKV monoclonal antibody (5.5G9) that recognizes the CHIKV capsid protein (Goh et al, submitted). Red staining (chromogen-substrate, 3-amino-9-ethylcarbazole) indicates the presence of capsid antigen. Staining protocol as described in Goh et al. 2013 (Clin Immunol. 149(3):487-97). (a) CHIKV positive cells in Ammon’s horn, with morphology consistent with neurons and oligodendrocytes. (b) CHIKV positive cells in the Bulbus olfactorius, with morphology consistent with neurons. (c) CHIKV positive cells in the white matter, morphology consistent with oligo-dendrocytes (d) Isotype control, NRG mouse brain day 228 post infection. (e) Isotype control, NRG mouse brain day 228 post infection. (f) Aperio ImageScope software (v10) and the Positive Pixel Count v9 algorithm was used as described (Poo et al, 2014) to quantitate red capsid staining. Anti-capsid antibody staining showed ≈100 fold more red pixels than staining of the same tissue with an isotype control or anti-capsid staining of brain from C57BL/6 mice, which do not show neurological symptoms.
0
0.005
0.01
0.015
0.02
0.025
0 14 21 60
vRN
A +
SE
Days post infection
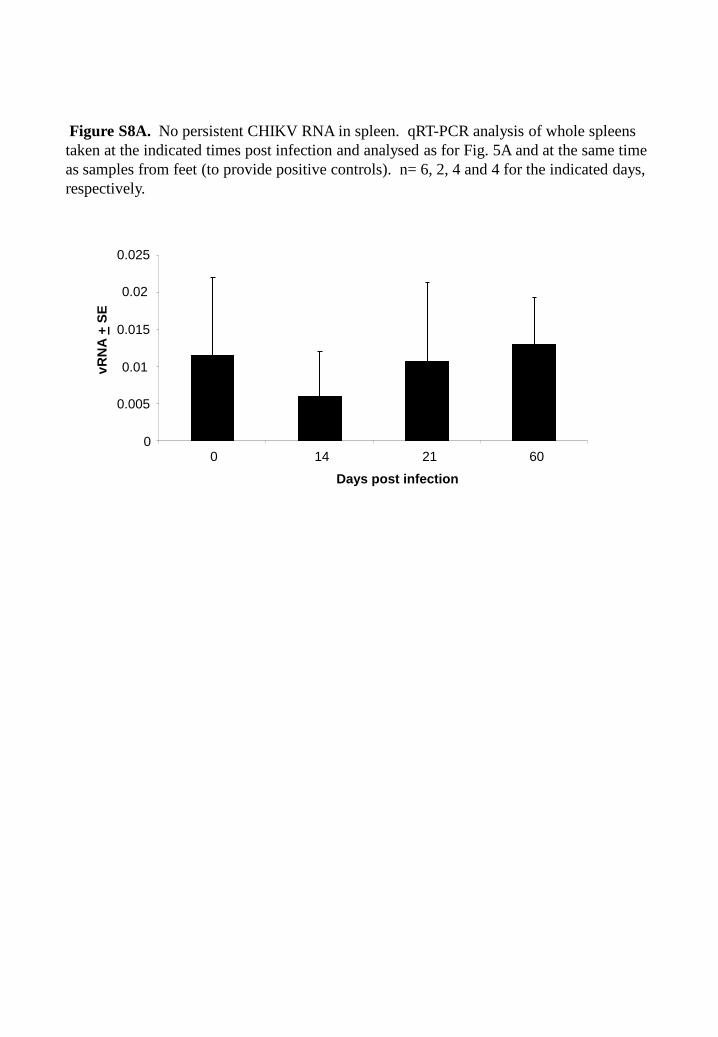
Figure S8A. No persistent CHIKV RNA in spleen. qRT-PCR analysis of whole spleens taken at the indicated times post infection and analysed as for Fig. 5A and at the same time as samples from feet (to provide positive controls). n= 6, 2, 4 and 4 for the indicated days, respectively.
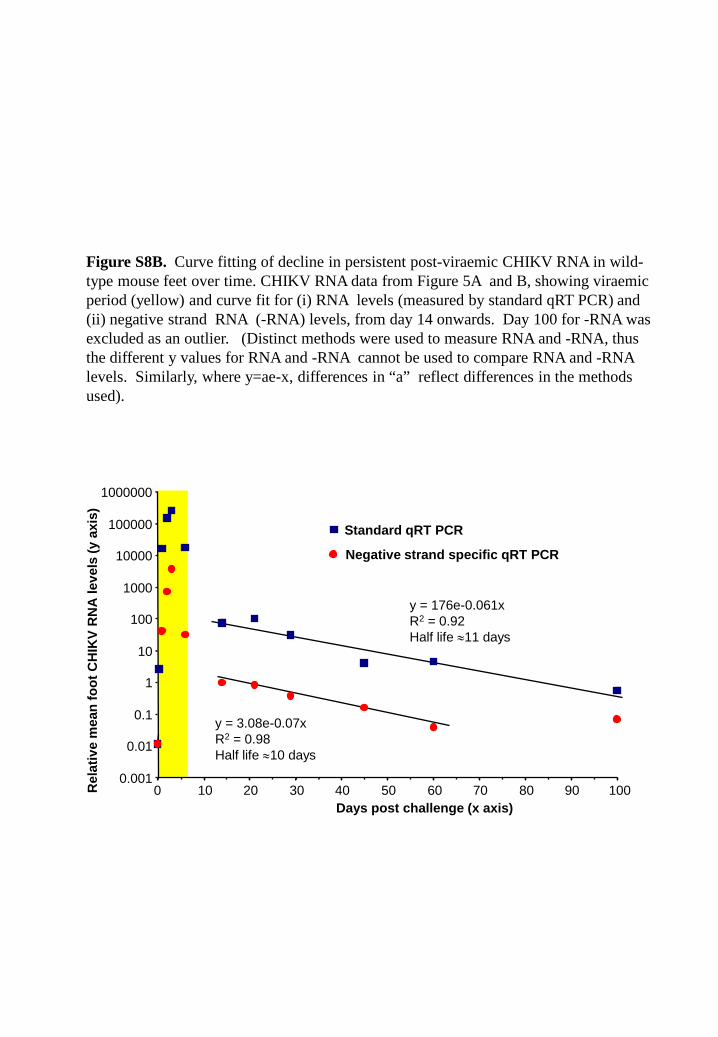
Figure S8B. Curve fitting of decline in persistent post-viraemic CHIKV RNA in wild-type mouse feet over time. CHIKV RNA data from Figure 5A and B, showing viraemic period (yellow) and curve fit for (i) RNA levels (measured by standard qRT PCR) and (ii) negative strand RNA (-RNA) levels, from day 14 onwards. Day 100 for -RNA was excluded as an outlier. (Distinct methods were used to measure RNA and -RNA, thus the different y values for RNA and -RNA cannot be used to compare RNA and -RNA levels. Similarly, where y=ae-x, differences in “a” reflect differences in the methods used).
y = 3.08e-0.07x R2 = 0.98 Half life ≈10 days
y = 176e-0.061x R2 = 0.92 Half life ≈11 days
0.001
0.01
0.1
1
10
100
1000
10000
100000
1000000
0 10 20 30 40 50 60 70 80 90 100 Days post challenge (x axis)
Rel
ativ
e m
ean
foot
CH
IKV
RN
A le
vels
(y a
xis)
Standard qRT PCR
Negative strand specific qRT PCR
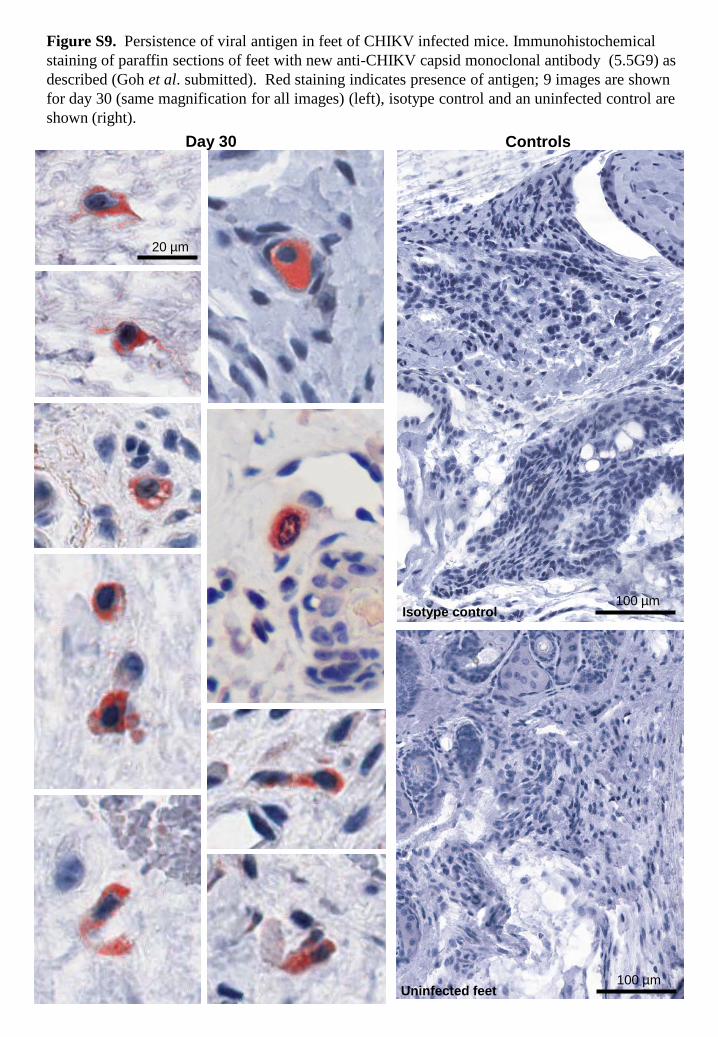
Figure S9. Persistence of viral antigen in feet of CHIKV infected mice. Immunohistochemical staining of paraffin sections of feet with new anti-CHIKV capsid monoclonal antibody (5.5G9) as described (Goh et al. submitted). Red staining indicates presence of antigen; 9 images are shown for day 30 (same magnification for all images) (left), isotype control and an uninfected control are shown (right).
20 µm
100 µm
100 µm Isotype control
Uninfected feet
Day 30 Controls
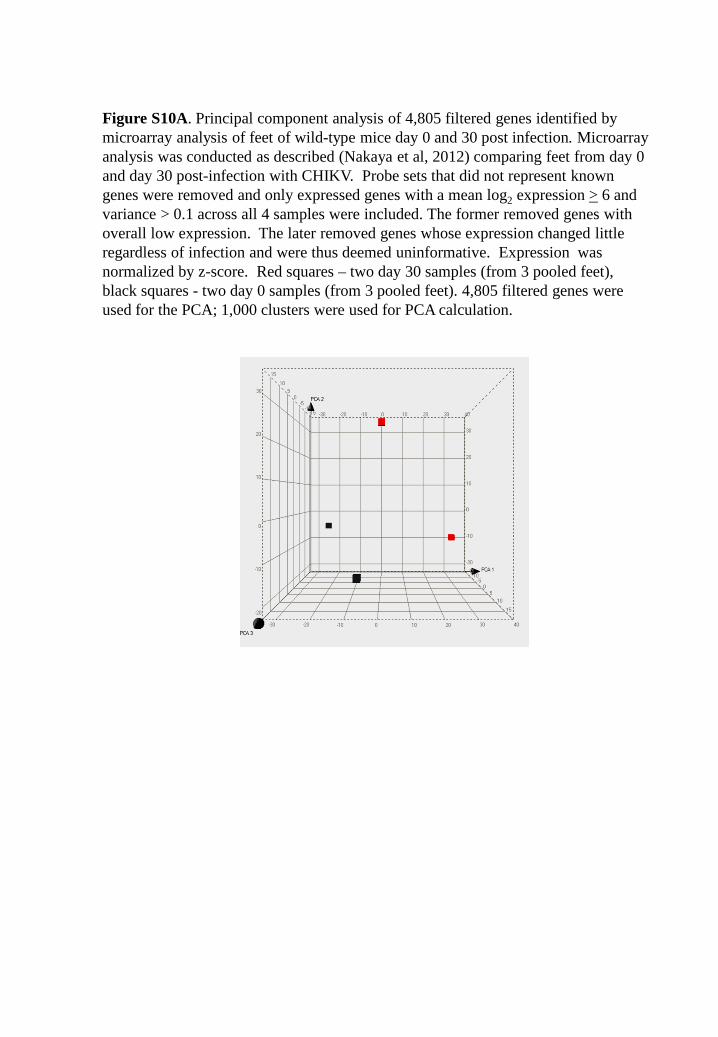
Figure S10A. Principal component analysis of 4,805 filtered genes identified by microarray analysis of feet of wild-type mice day 0 and 30 post infection. Microarray analysis was conducted as described (Nakaya et al, 2012) comparing feet from day 0 and day 30 post-infection with CHIKV. Probe sets that did not represent known genes were removed and only expressed genes with a mean log2 expression > 6 and variance > 0.1 across all 4 samples were included. The former removed genes with overall low expression. The later removed genes whose expression changed little regardless of infection and were thus deemed uninformative. Expression was normalized by z-score. Red squares – two day 30 samples (from 3 pooled feet), black squares - two day 0 samples (from 3 pooled feet). 4,805 filtered genes were used for the PCA; 1,000 clusters were used for PCA calculation.
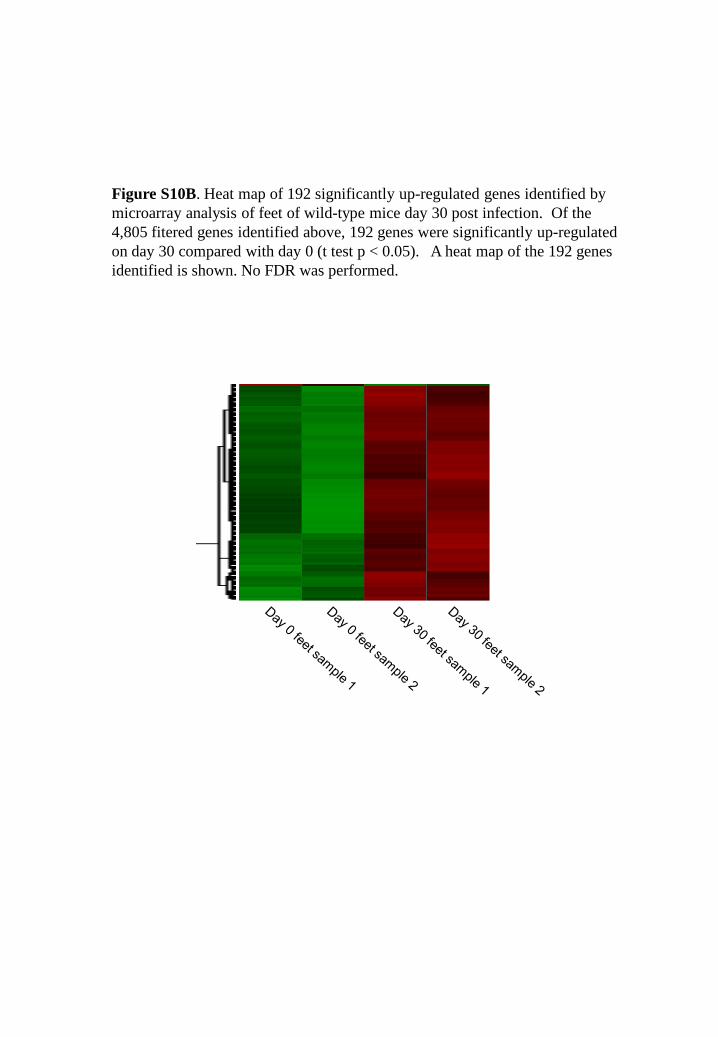
Figure S10B. Heat map of 192 significantly up-regulated genes identified by microarray analysis of feet of wild-type mice day 30 post infection. Of the 4,805 fitered genes identified above, 192 genes were significantly up-regulated on day 30 compared with day 0 (t test p < 0.05). A heat map of the 192 genes identified is shown. No FDR was performed.
1
10
100
1000
10000
0 7 30 0 7 30
p=0.037
FcγR4
Day post infection
Granzyme B
mR
NA
leve
ls
norm
alis
ed to
RPL
13A
+ SE
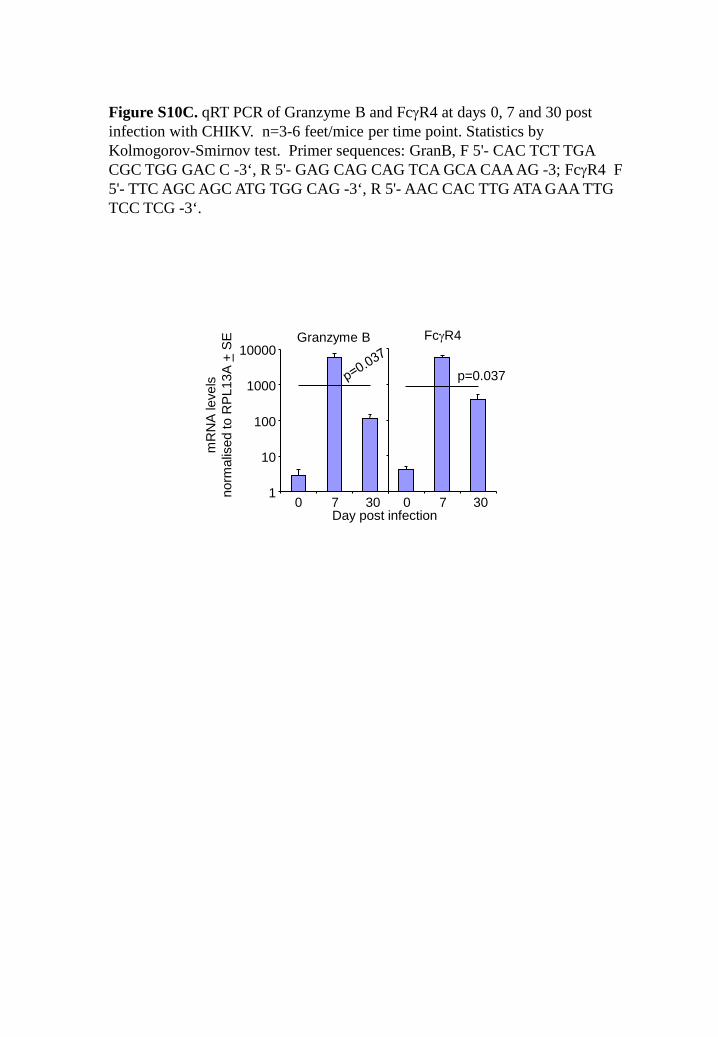
Figure S10C. qRT PCR of Granzyme B and FcγR4 at days 0, 7 and 30 post infection with CHIKV. n=3-6 feet/mice per time point. Statistics by Kolmogorov-Smirnov test. Primer sequences: GranB, F 5'- CAC TCT TGA CGC TGG GAC C -3‘, R 5'- GAG CAG CAG TCA GCA CAA AG -3; FcγR4 F 5'- TTC AGC AGC ATG TGG CAG -3‘, R 5'- AAC CAC TTG ATA GAA TTG TCC TCG -3‘.
0 1 2 3 4 5 6
-l o g (p v a l u e )
T cells
A u to i m m u n i ty
A n ti g e n p r e s e n ta ti o n
NK cell
I n n a te s e n s i n g
Mo n o c y te s macrophages
A p o p to s i s
C y to k i n e s
O th e r
Al l o g ra f t R e j e ct i o n Si g n a l i n g C yt o t o xi c T L ymp h o cyt e -me d i a t e d Ap o p t o si s o f T a rg e t C e l l s O X4 0 Si g n a l i n g Pa t h w a y
T yp e I D i a b e t e s Me l l i t u s Si g n a l i n g Syst e mi c L u p u s Eryt h e ma t o su s Si g n a l i n g
Au t o i mmu n e T h yro i d D i se a se Si g n a l i n g Al t e re d T C e l l a n d B C e l l Si g n a l i n g i n R h e u ma t o i d Art h ri t i s
An t i g e n Pre se n t a t i o n Pa t h w a y C o mmu n i ca t i o n b e t w e e n I n n a t e & Ad a p t i ve I mmu n e C e l l s
D e n d ri t i c C e l l Ma t u ra t i o n
C ro sst a l k b e t w e e n D e n d ri t i c C e l l s a n d N a t u ra l Ki l l e r C e l l s
Act i va t i o n o f I R F b y C yt o so l i c PR R R o l e o f PR R i n R e co g n i t i o n o f Ba ct e ri a a n d V i ru se s
R o l e o f PKR i n I n t e rf e ro n I n d u ct i o n a n d An t i vi ra l R e sp o n se PI 3 K/ AKT Si g n a l i n g
F c γ R e ce p t o r-me d i a t e d Ph a g o cyt o si s i n M Φ & Mo n o cyt e s T R EM1 Si g n a l i n g
Ag ra n u l o cyt e Ad h e si o n a n d D i a p e d e si s I L -1 2 Si g n a l i n g a n d Pro d u ct i o n i n Ma cro p h a g e s
R e t i n o i c a ci d Me d i a t e d Ap o p t o si s Si g n a l i n g
I n t e rf e ro n Si g n a l i n g G M-C SF Si g n a l i n g
N e u ro p ro t e ct i ve R o l e o f T H O P1 i n Al zh e i me r' s D i se a se
U V A-I n d u ce d MAPK Si g n a l i n g G ra n u l o cyt e Ad h e si o n a n d D i a p e d e si s Pro t e i n U b i q u i t i n a t i o n Pa t h w a y
R e e l i n Si g n a l i n g i n N e u ro n s
G l u co co rt i co i d R e ce p t o r Si g n a l i n g
(IFNα/β signaling)
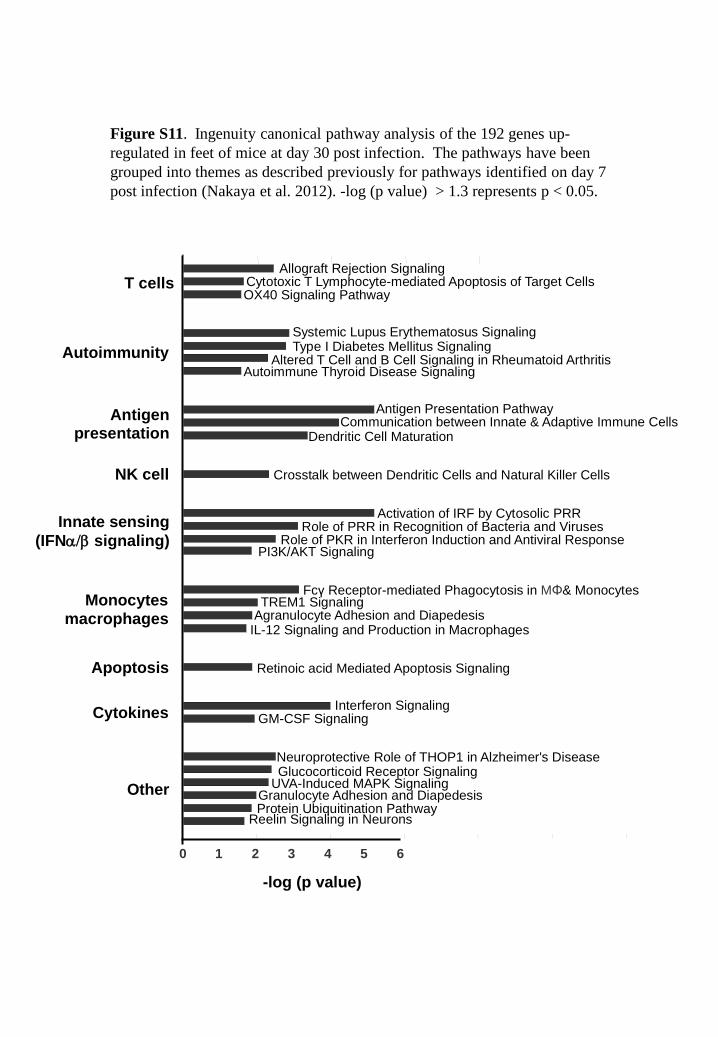
Figure S11. Ingenuity canonical pathway analysis of the 192 genes up-regulated in feet of mice at day 30 post infection. The pathways have been grouped into themes as described previously for pathways identified on day 7 post infection (Nakaya et al. 2012). -log (p value) > 1.3 represents p < 0.05.