19FIPS - PLOS
23
RESEARCH ARTICLE Development and validation of a scale to evaluate students’ future impact perception related to the coronavirus pandemic (C- 19FIPS) Giuseppina Maria Cardella ID *, Brizeida Raquel Herna ´ ndez-Sa ´ nchez, Jose ´ Carlos Sa ´ nchez-Garcı ´a ID Department of Social Psychology and Anthropology, University of Salamanca, Salamanca, Spain * [email protected] Abstract During the outbreak of the novel COVID-19 pandemic, economies around the world under- went unprecedented changes, which negatively limited young people’s perceptions of their future. The study aims to describe the development and validation of the 10-item COVID-19 Future Impact Perception Scale (C-19FIPS), a measurement tool to assess future impact perception related to COVID-19, among university students. Inductive and deductive approaches were used at the phase of the scale development process. Exploratory Factor Analysis (EFA), Confirmatory Factor Analysis (CFA) applying two different SEM based ana- lytical methods, covariance-based SEM (CB-SEM) and variance based SEM (PLS-SEM) were used to explore and predict the data. The EFA output generated two dimensions with 10 items. The dimensions are Personal Perception (C-19 PF) and Country Perception (C-19 CF) that reflects the notion of Future Impact Perception related to COVID-19. The result of the CFA confirmed the EFA result. Based on the reliability and validity check results, it is apparent that the scale demonstrates good psychometric properties. Evidence was also provided for convergent and discriminant validity. The study provided a short, valid and reli- able measure to assess the impact of the COVID-19 pandemic on college students’ future perceptions. Knowing how external situations influence the world of young people is useful for the development of targeted interventions that favor their well-being and that can support them in situations perceived as uncertain and risky. Limitations and future lines are discussed. Introduction The changes that occurred following the coronavirus pandemic, due to severe acute respiratory syndrome (SARS-CoV-2) in December 2019 in Wuhan, China, deeply affected the social, political and economic structure of the world [1], with negative repercussions on the expecta- tions of the future, especially of the younger ones. PLOS ONE PLOS ONE | https://doi.org/10.1371/journal.pone.0260248 November 19, 2021 1 / 23 a1111111111 a1111111111 a1111111111 a1111111111 a1111111111 OPEN ACCESS Citation: Cardella GM, Herna ´ndez-Sa ´nchez BR, Sa ´nchez-Garcı ´a JC (2021) Development and validation of a scale to evaluate students’ future impact perception related to the coronavirus pandemic (C-19FIPS). PLoS ONE 16(11): e0260248. https://doi.org/10.1371/journal. pone.0260248 Editor: Frantisek Sudzina, Aalborg University, DENMARK Received: June 3, 2021 Accepted: November 5, 2021 Published: November 19, 2021 Copyright: © 2021 Cardella et al. This is an open access article distributed under the terms of the Creative Commons Attribution License, which permits unrestricted use, distribution, and reproduction in any medium, provided the original author and source are credited. Data Availability Statement: All relevant data are within the manuscript and its Supporting Information files. Funding: This research was funded by Consejerı ´a de Educacio ´n, Junta de Castilla y Leo ´n, grant number J424. The funders had no role in study design, data collection and analysis, decision to publish, or preparation of the manuscript. Competing interests: The authors have declared that no competing interests exist.
-
Upload
khangminh22 -
Category
Documents
-
view
0 -
download
0
Transcript of 19FIPS - PLOS
RESEARCH ARTICLE
Development and validation of a scale to
evaluate students’ future impact perception
related to the coronavirus pandemic (C-
19FIPS)
Giuseppina Maria CardellaID*, Brizeida Raquel Hernandez-Sanchez, Jose
Carlos Sanchez-GarcıaID
Department of Social Psychology and Anthropology, University of Salamanca, Salamanca, Spain
Abstract
During the outbreak of the novel COVID-19 pandemic, economies around the world under-
went unprecedented changes, which negatively limited young people’s perceptions of their
future. The study aims to describe the development and validation of the 10-item COVID-19
Future Impact Perception Scale (C-19FIPS), a measurement tool to assess future impact
perception related to COVID-19, among university students. Inductive and deductive
approaches were used at the phase of the scale development process. Exploratory Factor
Analysis (EFA), Confirmatory Factor Analysis (CFA) applying two different SEM based ana-
lytical methods, covariance-based SEM (CB-SEM) and variance based SEM (PLS-SEM)
were used to explore and predict the data. The EFA output generated two dimensions with
10 items. The dimensions are Personal Perception (C-19 PF) and Country Perception (C-19
CF) that reflects the notion of Future Impact Perception related to COVID-19. The result of
the CFA confirmed the EFA result. Based on the reliability and validity check results, it is
apparent that the scale demonstrates good psychometric properties. Evidence was also
provided for convergent and discriminant validity. The study provided a short, valid and reli-
able measure to assess the impact of the COVID-19 pandemic on college students’ future
perceptions. Knowing how external situations influence the world of young people is useful
for the development of targeted interventions that favor their well-being and that can support
them in situations perceived as uncertain and risky. Limitations and future lines are
discussed.
Introduction
The changes that occurred following the coronavirus pandemic, due to severe acute respiratory
syndrome (SARS-CoV-2) in December 2019 in Wuhan, China, deeply affected the social,
political and economic structure of the world [1], with negative repercussions on the expecta-
tions of the future, especially of the younger ones.
PLOS ONE
PLOS ONE | https://doi.org/10.1371/journal.pone.0260248 November 19, 2021 1 / 23
a1111111111
a1111111111
a1111111111
a1111111111
a1111111111
OPEN ACCESS
Citation: Cardella GM, Hernandez-Sanchez BR,
Sanchez-Garcıa JC (2021) Development and
validation of a scale to evaluate students’ future
impact perception related to the coronavirus
pandemic (C-19FIPS). PLoS ONE 16(11):
e0260248. https://doi.org/10.1371/journal.
pone.0260248
Editor: Frantisek Sudzina, Aalborg University,
DENMARK
Received: June 3, 2021
Accepted: November 5, 2021
Published: November 19, 2021
Copyright: © 2021 Cardella et al. This is an open
access article distributed under the terms of the
Creative Commons Attribution License, which
permits unrestricted use, distribution, and
reproduction in any medium, provided the original
author and source are credited.
Data Availability Statement: All relevant data are
within the manuscript and its Supporting
Information files.
Funding: This research was funded by Consejerıa
de Educacion, Junta de Castilla y Leon, grant
number J424. The funders had no role in study
design, data collection and analysis, decision to
publish, or preparation of the manuscript.
Competing interests: The authors have declared
that no competing interests exist.
Although other negative global events have hit the world over the centuries with serious
health and economic consequences, for example, Ebola disease which caused a loss of $53 bil-
lion in the United States [2] and over 11,300 deaths worldwide [3] or SARS which depreciated
1% of China’s GDP causing economic damage of $54 billion worldwide [4], according to
many authors, the COVID-19 pandemic has a disastrous scope, causing an unprecedented
financial collapse [5–7].
Containment measures taken by governments to limit the spread of the COVID-19 pan-
demic, for example, social distancing, smart-working, lockdowns and travel restrictions [8]
have put enormous pressure on much of the world economy, leading to the reduction of the
workforce in all sectors, and the loss of many jobs [9] that severely affected the financial mar-
kets by reducing the value of the stock index by up to 10% in 1 day [10].
Although these events can be interpreted as "opportunities", in terms of sustainable econ-
omy or green economy (see for example, Oncioiu et al., [11]), the blockade resulting from the
COVID-19 pandemic marks the current situation as an acute crisis [12].
Furthermore, the financial markets suffered a sharp decline. According to the study by
Shehzad, Xiaoxing and Kazouz [13], in March 2020, United States, United Kingdom, Spain
and China recorded a decline of 12.1% to 25.1%. This situation appears even more worrying in
a future perspective, especially for the most fragile social groups and for those who enter the
world of work for the first time, for example young people.
Some studies have shown the impact that social, cultural and economic changes have on
the perception of students’ work [14], negatively distorting young people’s expectations about
their future.
This line includes, for example, the results of a report conducted in 112 countries in August
2020, by the International Labor Organization (ILO), which showed that over 70% of young
people (aged 18–29 years) were negatively affected by the closure of schools and universities.
According to the report, 38% of students are uncertain about their future career prospects,
convinced that the crisis will create further obstacles to their work and extend the transition
period from school to work. In addition, among students who combined study and work, one
in six young people lost their jobs due to the coronavirus pandemic, while 42% suffered a
reduction in income [15].
Historically, the perception of the future has been extensively studied in the field of psychol-
ogy [16–19], in particular with reference to university students [20–23], and has been analyzed
separately in the areas of cognition [17, 18], behavior or motivation [24] and emotion [25],
emphasizing the multidimensional nature of the construct [26].
In recent decades, the definition of future time perception has been related to the Social
Cognitive Theory (SCT), a learning theory that emphasizes the interaction between personal
characteristics, behavior and environment [27] while acknowledging the active role of individ-
uals [28]. Specifically, individual behavior in a certain learning situation influences and is
influenced by environmental (or situational) and cognitive/personal factors. Social-cognitive
theory explains how people acquire and maintain certain behaviors, also providing the basis
for intervention strategies. According to Lewin [29], one of the first exponents in the study of
the future time perspective (FTP), we define the perception of future as “the totality of the indi-
vidual’s views of his psychological future and psychological past existing at a given time”
(p. 75), and he stated that the change in FTP is one of the most important facts of development,
which regulate behavior and shape the identity of the individual. From this perspective, FTP is
closely linked to the experiences that the subject lives in the social and cultural context, as well
as to the stage of development in which he finds himself [30].
Corroborating this view, Nurmi [31] defined the FTP as a "motivational space" for individu-
als, consisting of three fundamental processes, namely, motivation, planning and evaluation.
PLOS ONE Development and validation of C-19FIP scale
PLOS ONE | https://doi.org/10.1371/journal.pone.0260248 November 19, 2021 2 / 23
Motivation refers to interests in the future, planning refers to how individuals plan the realiza-
tion of their interests, and valuation refers to the extent to which individuals expect their inter-
ests to be fulfilled.
Although in the literature the perspective of the future time has been associated with the
notion of motivation, it should be noted that the FTP construct differs from other motivational
constructs. For example, Atkinson’s theory of achievement orientation [32] views a high
instrumental value as advantageous for achieving goals in the immediate future, but not for
the distant future; furthermore, Malka and Covington [20] provided evidence that students’
FTP is conceptually and empirically separable from perceptions of instrumentality: FTP was a
better predictor of school investment than perceived instrumentality. Similarly, FTP and delay
of gratification, i.e. the ability to resist a smaller and immediate reward in favor of the larger
but later reward, are different constructs [22] with FTP characterized by activity rather than
passivity [19]. Finally, FTP theory differs from goal setting theory [33] in that the latter theory
lacks the time perspective.
Since the second half of the last century, the notion of the future as "the building site of con-
structive behavior and human progress" [17] (p. 40) has stimulated research on the FTP con-
struct in the domains of education and work [19, 34–36] as an important predictor of
behaviors and attitudes in all ages and culture. Researchers in education have explored the
relationships between FTP and educational outcomes such as learning attitudes, academic
engagement, and outcomes [37]. In the field of work, researchers linked FTP to decision mak-
ing and career planning, career choice satisfaction and professional maturity [38]. In general,
these studies indicate that individuals differ in the extent to which they think and feel the
future and in the amount of effort they make to achieve their future goals.
Empirical evidence has underlined the influence of university students’ future perceptions
on their university career, e.g. academic motivation [20, 39] and academic achievements [40].
For example, Shell and Husman [41], examined the relationships between students’ beliefs
about the future and their academic performance. The results indicate that beliefs about the
future play an important role in motivating students’ achievement and study.
In particular, individuals have difficulty forming beliefs about the future following impor-
tant rare events [42, 43]. Furthermore, when beliefs are formed, individuals attribute dispro-
portionate weight to more recent events [44], especially when these events are particularly
salient [45–47].
These studies highlighted the influence of several factors, such as psychological and person-
ality traits, and socio-cultural factors in shaping the future goals of people in situations of
uncertainty [48]. For example, Morselli [49] stressed the importance of social conditions, such
as economic crises, in configuring the future as a threat. The results of a study conducted by
Ritchie, Cervone and Sharpe [50] with 161 participants from 13 different countries, showed
the negative impact of the pandemic on the belief that they can achieve their future goals.
According to the approach of social-cognitive theory [27], the surrounding environment
influences the behavior of the individual through personal perceptions. Not all people perceive
the same situation with the same degree of severity. Taking these differences into account and
understanding them is important to analyze behavioral responses, especially in adverse
situations.
From a literature analysis, two fundamental gaps emerged: 1- Current treatment of
COVID-19 around the world has focused primarily on infection control, effective vaccines,
and treatment cure rate [51, 52], while the psychosocial aspect remains in part strongly under-
developed; 2- most of the initiatives implemented to support the economies during the
COVID-19 crisis seem to affect the current consolidated companies and the existing industrial
PLOS ONE Development and validation of C-19FIP scale
PLOS ONE | https://doi.org/10.1371/journal.pone.0260248 November 19, 2021 3 / 23

sectors, little has been done to protect employment and the continuation of the necessary eco-
nomic activity. Currently, the goal is to protect the present while the future remains uncertain.
The main aim of the current study was to develop a measure of future perceptions related
to COVID-19 pandemic consistent with social-cognitive theory [26]. Furthermore, our goal
was to take a first step in developing an assessment tool that would be useful in both research
and psychological settings. A comprehensive measure of the future impact perception would
be useful for informing support planning and assessing the psychosocial effects of Covid-19
pandemic over time. As the research showed that exposure to uncertain and perceived adverse
situations has a stronger impact especially among young people [14], the present study used
samples of university students to develop the measure of future perceptions related to
COVID-19 pandemic across the final phases of the study.
Understanding the perception that people have towards their future, in working and eco-
nomic terms and trying to contain negative perceptions following the current economic crisis,
appears essential both from a scientific and practical point of view, in particular, taking into
account recent empirical evidence demonstrating that perceptions and expectations on the
macroeconomic environment substantially shape the decisions of the individual [53–57], with
repercussions also on psychophysical health [58–62].
We believe that knowing and understanding what people think of the current economic cri-
sis can help political institutions around the world to plan economic recovery programs that
look to the future, but also educators and figures in the welfare sector to implement programs
to support those who have a more negative perception, with repercussions on psycho-physical
health.
The profound and disproportionate impacts that the pandemic is generating on young peo-
ple give rise to an urgent call for public policy makers to take measures to contain them. It is
essential to promote successful career paths through actions such as incentives for hiring
young people, training of skills in line with the new realities of the labor market. The time to
act is now, otherwise an entire generation representing the nation’s future will be severely
affected simply by the misfortune of starting their working life in the midst of the COVID-19
pandemic.
Materials and methods
Phase 1: Item generation
According to Churchill [63], a mixed method approach (deductive and inductive methods)
was used in the scale development process. In the first step, a literature review was carried out
to generated the items, through two widely known databases, Web of Science and Scopus. Key-
words used to search for the articles included “COVID-19”, “Coronavirus” AND “Economic�
Cris�”, “Financial� Cris�” AND “Future Perspective”, “Future Perception” for the first review
and the keywords "COVID-19", "Coronavirus" And "Scala", "Questionnaire" for the second
review. The search result yielded 546 documents and 118 documents respectively.
After eliminating duplicate articles between the two databases, to contain any attribution
errors, the following inclusion criteria were identified: (i) scientific articles published in peer-
reviewed journals, including printed articles, as scientifically valid sources of knowledge (ii)
where it was possible to demonstrate studies on the impact of COVID-19 in the economic sec-
tor and in a future perspective (first review) or the existence of tools to analyze the coronavirus
phenomenon (second review) through the inclusion of words in the titles, in the abstract and/
or the author’s keywords, (iii) written in English or Spanish. From our analysis we therefore
excluded chapters of books, books, conference proceedings, notes, etc., written in a language
PLOS ONE Development and validation of C-19FIP scale
PLOS ONE | https://doi.org/10.1371/journal.pone.0260248 November 19, 2021 4 / 23
other than English and Spanish. This step led to the final result of 65 articles deemed most rele-
vant (42 first revision articles and 23 second revision articles).
From a cross-analysis between the two reviews it emerged that research on the effects of the
coronavirus from a socio-economic point of view is still strongly underdeveloped. In fact, sev-
eral studies pay more attention to the physical and/or psychological consequences related to
COVID-19. It should also be noted that the analysis of the literature shows that the few articles
that analyzed the impact of the pandemic on the economic sphere were mostly of a conceptual
type studies. This result is important because it underlines, at present, the lack of an empirical
correspondence, probably because a useful tool is missing to measure the impact of the coro-
navirus in the future perception linked to the economic sphere.
In our review, some scales measure the psychological consequences of Covid-19 in terms of
fears (FCV-19S, see for example Ahorsu et al., [64]), anxiety (Cas, for example Lee [65]), stress
(COVID Stress Scales [66]), Risk Appraisal (CORAS, see Jaspal et al., [67]), and worry for con-
tagion (Pre-Covid-19 Scale, [68]).
Therefore, the COVID-19 Future Impact Perception Scale (C-19FIPS) differs from previous
ones for two main reasons: 1- most of the measures considered the psychological or physical
aspect of the consequences of COVID-19; 2- most of the above scales are one-dimensional,
while the scale used in this study features two dimensions (personal and country level), show-
ing its bidimensional character.
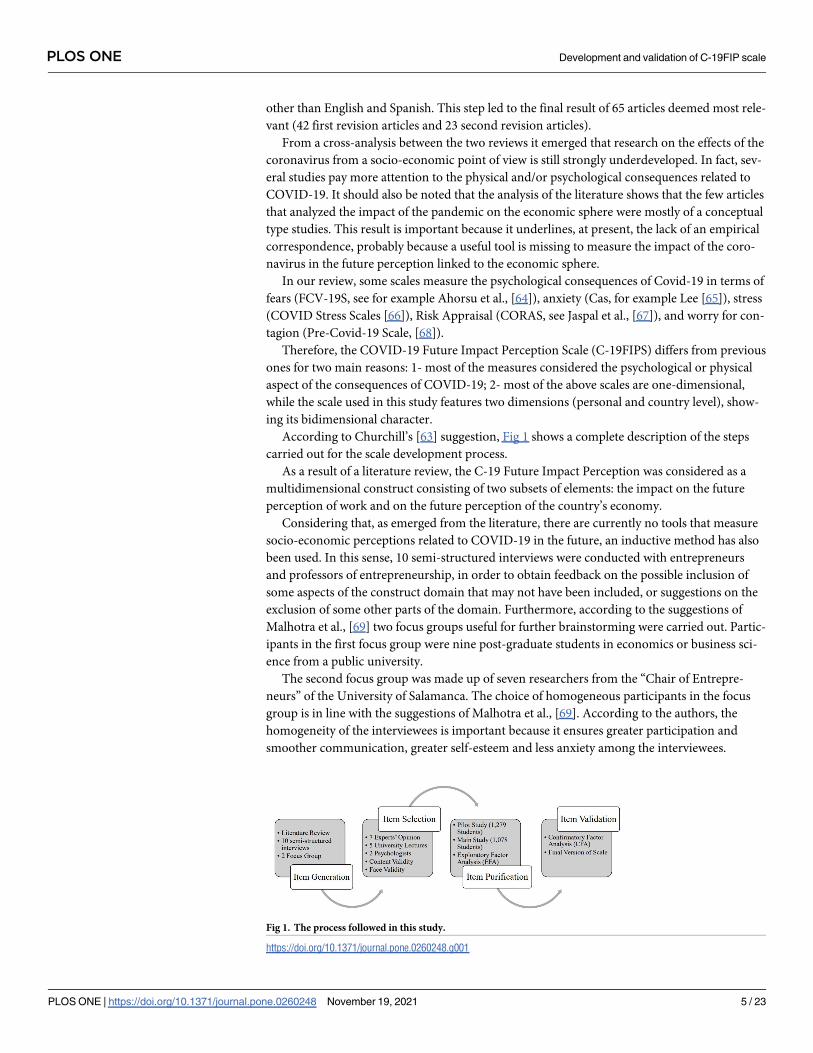
According to Churchill’s [63] suggestion, Fig 1 shows a complete description of the steps
carried out for the scale development process.
As a result of a literature review, the C-19 Future Impact Perception was considered as a
multidimensional construct consisting of two subsets of elements: the impact on the future
perception of work and on the future perception of the country’s economy.
Considering that, as emerged from the literature, there are currently no tools that measure
socio-economic perceptions related to COVID-19 in the future, an inductive method has also
been used. In this sense, 10 semi-structured interviews were conducted with entrepreneurs
and professors of entrepreneurship, in order to obtain feedback on the possible inclusion of
some aspects of the construct domain that may not have been included, or suggestions on the
exclusion of some other parts of the domain. Furthermore, according to the suggestions of
Malhotra et al., [69] two focus groups useful for further brainstorming were carried out. Partic-
ipants in the first focus group were nine post-graduate students in economics or business sci-
ence from a public university.
The second focus group was made up of seven researchers from the “Chair of Entrepre-
neurs” of the University of Salamanca. The choice of homogeneous participants in the focus
group is in line with the suggestions of Malhotra et al., [69]. According to the authors, the
homogeneity of the interviewees is important because it ensures greater participation and
smoother communication, greater self-esteem and less anxiety among the interviewees.
Fig 1. The process followed in this study.
https://doi.org/10.1371/journal.pone.0260248.g001
PLOS ONE Development and validation of C-19FIP scale
PLOS ONE | https://doi.org/10.1371/journal.pone.0260248 November 19, 2021 5 / 23
Furthermore, homogeneous respondents allow the researcher to make a more accurate theo-
retical prediction.
With the consent of the respondents, all interviews were recorded and subsequently tran-
scribed. To ascertain the reliability of the information collected, the participants reviewed all
transcripts. Before moving on to the next step, a thorough review was carried out to finalize
the elements based on the transcripts. The initially created C-19FIPS is a two-dimensional,
24-item, 5-response choice frequency scale.
Phase 2: Item selection
In the next stage, content validity was performed to understand whether the initial pool of
items accurately reflected the C-19 Future Impact Perception construct [70]. In this regard,
seven experts were chosen due to their expertise in the subject matter. Five experts were uni-
versity lecturers specialized in psychometrics and two social psychologists and who were not
involved in the study.
In particular, the experts were asked to rate each item on a 3-point Likert scale (e.g.: 1-
"essential", 2- "useful but not essential", and 3- "not necessary").
Ten items that did not produce a minimum of a rather representative average value among
all the experts were eliminated and 14 items that met the criteria were retained. As suggested
by Churchill [63], the expert judges’ recommendations are relevant for the wording reviews,
thus helping to establish the validity of the content for the initial C-19FIP Scale.
After the content validity was assured, face validity was assessed by distributing the prelimi-
nary questionnaire to 15 post-graduate students. The purpose was to check the questionnaire
for timing, clarity of wording, comprehension, layout and style, completeness and flow of con-
trol. In addition, respondents were asked to provide their feedback regarding the content,
structure and formatting of the questionnaire. Minor suggestions from respondents were con-
sidered, which helped to improve the clarity and readability of the questionnaire.
Participants and procedure
An important issue in the scale development and validation process is the sample size [71, 72].
In the literature, the best and most common rule concerns a ratio of respondents to elements
of 10:1, i.e. 10 participants for each element of the scale [73]. However, other authors have sug-
gested sample sizes independent of the number of items. For example, according to Guadag-
noli and Velicer [74] the minimum number of participants required for the generalizability of
the results is 300–450. Comrey and Lee [75] suggested a graduated sample size scale:
100 = poor, 200 = fair, 300 = good, 500 = very good,�1,000 = excellent.
In the present study we used two different sample of undergraduate students (Study 1:
n = 1,279; Study 2: n = 1,078)
The demographic characteristics of two sample (Phase 3 and Phase 4) are shown in Table 1.
Participants come from different fields of knowledge and from different Spanish universi-
ties. The selection of different degree courses and universities was made on the basis of
completely random samplings and the students participated in the development of the
research anonymously.
The online survey data was collected through an internet platform between September/
December 2020 with Spanish university students. This period corresponded to the second
wave of the COVID-19 pandemic in Spain and students were suffering the psychological con-
sequences of the pandemic, with enormous social restrictions.
Participants were provided with full information on the purposes of the study and the con-
fidentiality of the data assuring them that it would be used for research purposes only. Their
PLOS ONE Development and validation of C-19FIP scale
PLOS ONE | https://doi.org/10.1371/journal.pone.0260248 November 19, 2021 6 / 23

participation was on a voluntary basis and any refusal to participate would not affect their cur-
rent or future course of study. Students completed the questionnaire in approximately 10 min.
and received no credit for participating in the research.
The study was performed in accordance with the 1964 Helsinki Declaration and its subse-
quent amendments, or with comparable ethical standards. Written informed consent was
obtained from each student prior to participating in the study. Ethical review and approval
was not required for the study on human participants in accordance with the local legislation
and institutional requirements, as no intervention was carried out.
Every precaution has been taken to protect the privacy of the research subjects and the con-
fidentiality of their personal information.
Instruments
The questionnaire included a section for demographic information (i.e., gender, age, degree
program, university) and the Future Time Perspective Scale administered to analyze the
nomological network and predictive validity of the C-19 Future Impact Perception Scale.
The Future Time Perspective Scale [76] is a 12-item questionnaire assessed on a five-point
Likert scale (1 = strongly disagree, 5 = strongly agree). It measures three perspectives of the
future: Future as Open (4 items), Future as Limited (4 items) and Future as Ambiguous (4
items). Cronbach’s alpha for the three dimensions in the current study was 0.85, 0.74, and
0.80, respectively.
Examples of Future Time Perspective Scale are: "I look forward to the future with hope and
enthusiasm" (Future as Open), " Increasingly I feel like time is against me" (Future as Limited)
and “I do not focus on the future because it is so uncertain to me anyway” (Future as
Ambiguous).
Statistical analysis
Descriptive statistics were used to understand participants’ demographic characteristics.
To extract the dimensions of the C-19FIP Scale, Exploratory Factor Analysis (EFA) was
used. All the descriptive analysis and EFA were conducted using IBM SPSS 24.0.
Table 1. Demographics characteristics.
Characteristics Sample Phase 3 (n = 1,279) Sample Phase 4 (n = 1,078)
Gender—n (%)
Male 631 (49.3%) 590 (54.7%)
Female 648 (50.7%) 488 (45.3%)
Age–mean (SD) 22.54 (4.53) 20.54 (2.47)
Academic Course–n (%)
First-year course 165 (12.9%) 250 (23.2%)
Second-year course 227 (17.7%) 169 (15.7%)
Third-year course 646 (50.5%) 490 (45.5%)
Fourth-year course 209 (16.3%) 138 (12.8%)
Fifth-year course 32 (2.5%) 31 (2.9%)
Type of study–n (%)
Social Sciences 328 (25.6%) 269 (25.0%)
Health sciences 308 (24.1%) 213 (19.8%)
Humanities 476 (37.2%) 356 (33.0%)
Economics and Business science 167 (13.1%) 240 (22.3%)
https://doi.org/10.1371/journal.pone.0260248.t001
PLOS ONE Development and validation of C-19FIP scale
PLOS ONE | https://doi.org/10.1371/journal.pone.0260248 November 19, 2021 7 / 23
In this study the general validity of the model was carried out using the structural equation
modeling approach (SEM) and applying the CFA method of comparing two models: a first
order model (measurement model) and a second order (structural model).
In the first order model, we applied two different analytical methods based on structural
equation models, covariance-based analysis (CB-SEM) and variance-based analysis, know as
partial least squares (PLS-SEM), using two different software: Amos 23.0 and SmartPLS 3.0
[77].
Specifically, we used the variance-based method (PLS-SEM) as it focuses on optimizing the
prediction of endogenous constructs and the covariance-based (CB-SEM) method for model
fitting [78, 79]. For this reason, the choice to use both methods (CB and PLS) must be consid-
ered complementary rather than competitive.
Furthermore, the PLS-SEM path modeling was carried out at the structural level to estimate
and evaluate the structural properties of the research model, following the procedures sug-
gested by Hair et al. [80].
This choice was made for several reasons. First, in this study, the measurement model that
reflects the relationship between the subscales and the respective indicators, and between the
second-order construct and the two subscales, was identified as reflective-formative model
(Type II).
In particular, at the first order, the direction of causality can be seen from the subscale to
the indicators. The indicators are in fact interchangeable and correlated, so the release of an
element does not affect the meaning of the subscale. At the second order, the two subscales (C-
19 PF and C-19 CF) are distinct constructs because they possess different conceptualizations.
Furthermore, these constructs are not highly correlated or interchangeable. Furthermore, a
modification of one of these constructs would modify the meaning attributed to the higher-
order variable (C-19 Future Impact Perception) [81, 82].
When a structural equation model includes formative variables, the variance-based method
(PLS-SEM) provides more accurate estimates than the covariance-based methods (CB-SEM).
In agreement with many empirical evidences [83, 84], the failure to use the PLS method for the
evaluation of an SEM that includes a formative measurement model can distort the estimates.
Furthermore, PLS-SEM provides a more reliable estimate of a relatively complex model
that has reflective (e.g. C-19 PF and C-19 CF) and formative (e.g. C-19 Future perception)
measurement models [84, 85].
Finally, PLS-SEM is a non-parametric statistical approach, so it does not require data to be
normally distributed [83]. However, it should be noted that although it does not require that
the data have a normal distribution, it is necessary to verify that the data is not excessively
non-normal, as, in general, this type of data is problematic in evaluating parameters. It is
important to specify that the asymmetry and kurtosis values between -2 and +2 are considered
acceptable [86].
Results
Phase 3: Item purification
Exploratory Factor Analysis (EFA) using principal component analysis with varimax and the
Kaiser normalization and rotational method [87] was carried out to investigate the dimen-
sional structure of the questionnaire.
The assessment of factorability showed that the Kaiser–Meyer–Olkin measure was 0.883
and Bartlett’s test of sphericity was significant (x2 = 7210,581; df = 45, p< 0.001) indicating
that the data were adequate for the factor analysis. The results confirmed the existence of two
factors associated with the proposed theoretical arguments of this study. The selection of the
PLOS ONE Development and validation of C-19FIP scale
PLOS ONE | https://doi.org/10.1371/journal.pone.0260248 November 19, 2021 8 / 23

extracted factors was decided on the basis of two different criteria: only factors with an eigen-
value greater than 1 and elements that had a factor loading greater than 0.70 [88].
For this reason, items CovidC6 “Covid-19 will negatively affect entrepreneurs in my coun-
try” (factor loading = 0.658), CovidC7 “Covid-19 will prevent the creation of new businesses
in my country” (factor loading = 0.430), CovidC8 “COVID-19 will diminish labor opportuni-
ties in my country” (factor loading = 0.586) and CovidP6 “COVID-19 has discouraged me to
become an entrepreneur” (factor loading = 0.557) have been eliminated.
The two-component solution explained a variance of 69.779% from a total of 10 items
(Table 2).
The first component (5 items, explained variance = 36.459%) was loaded by items referring
to the perception of Covid-19 linked to relationships with one’s future work (C-19 PF).
The second component (5 items, explained variance = 33.320%) was loaded by items related
to the perception of Covid-19 in the economic sphere of one’s country (C-19 CF).
Phase 4: Item validation
First-order measurement model. To assess the convergent validity of the first-order con-
structs, a PLS algorithm with factor weighting scheme and 300 iterations were run to generate
the values of factor loadings, composite reliability (CR), and average variance extract (AVE).
According to Hair et al. [78], the factor loading of each items on the respective construct
should be greater than 0.70. Loadings between 0.40 and 0.70 can be removed if they lead to an
improvement in the model.
Furthermore, if the values of CR and AVE of each factor are higher than 0.70 and 0.50,
respectively, the questionnaire is considered as having a satisfactory convergent validity [89,
90].
Composite reliability (CR), Cronbach’s alpha (CA) and coefficient Dijkstra-Henseler
Rho_A are the measures of internal consistency reliability and refer to the extent to which a
construct is measured by its relevant indicators [90]. As shown in Table 3, the factor loadings
of all observed variables exceeded the threshold value of 0.70. Moreover, the CR, CA and Dijk-
stra-Henseler reliability for latent variables surpassed the cut-off value of 0.70. Thus, the reli-
ability of all measures was assured at the item and construct level.
The assessment of construct validity was confirmed based on convergent validity and dis-
criminant validity [91]. Convergent validity refers to the extent to which a set of indicators
Table 2. Results of Exploratory Factor Analysis (EFA) (sample n = 1.279).
Items Factor 1 Factor 2 Communalities
CovidP1 0.857 0.742
CovidP2 0.844 0.734
CovidP3 0.766 0.616
CovidP4 0.865 0.754
CovidP5 0.867 0.759
CovidC1 0.823 0.678
CovidC2 0.861 0.751
CovidC3 0.851 0.737
CovidC4 0.756 0.584
CovidC5 0.738 0.622
Eigenvalue 3.646 3.332
Variance 36.459% 33.320%
https://doi.org/10.1371/journal.pone.0260248.t002
PLOS ONE Development and validation of C-19FIP scale
PLOS ONE | https://doi.org/10.1371/journal.pone.0260248 November 19, 2021 9 / 23

that measure the same construct are positively correlated. The dominant measure of conver-
gent validity is the AVE [89].
An AVE value greater than 0.50 is considered as acceptable [89]. As demonstrated in
Table 3, AVE values for constructs transcended the advised value of 0.50. Thus, convergent
validity was assured.
Discriminant validity refers to the extent to which a construct is empirically distinct from
other constructs in the model. Fornell and Larcker [89] proposed the traditional metric and
suggested that each construct’s AVE should be compared to the squared inter-construct corre-
lation of that same construct and all other reflectively measured constructs in the structural
model. The shared variance for all model constructs should not be larger than their AVE val-
ues. Recent research indicates, however, that this metric is not suitable for discriminant valid-
ity assessment. For example, Henseler et al. [92] show that the Fornell-Larcker criterion does
not perform well, particularly when the indicator loadings on a construct differ only slightly.
As a replacement, Henseler et al. [92] proposed the Heterotrait-Monotrait ratio of the correla-
tions (HTMT). The HTMT is defined as the mean value of the item correlations across con-
structs relative to the mean of the average correlations for the items measuring the same
construct. An HTMT value above 0.90 would suggest that discriminant validity is not present.
In addition, bootstrapping can be applied to test whether the HTMT value is significantly dif-
ferent from 1.00 [92] or a lower threshold value such as 0.85 or 0.90, which should be defined
based on the study context [93]. More specifically, the researcher can examine if the upper
bound of the 95 per cent confidence interval of HTMT is lower than 0.90 or 0.85.
According to the first criteria, the square root of AVE should be higher than the correlation
with all other variables in the model. Table 4 revealed that the square root of AVE values (C-
19PF AVE = 0.834; C-19CF AVE = 0.805) are higher than the correlation values (correlation
between county and personal dimension: r = 0.256, p< 0.001).
Table 3. First-order measurement model.
Dimensions Items Factor Loadings Cronbach’s Alpha >0.70 rho_A >0.70 Composite Reliability >0.70 AVE >0.50
CovidP1 0.839
CovidP2 0.853
C-19 PF CovidP3 0.759 0.891 0.893 0.920 0.699
CovidP4 0.866
CovidP5 0.857
CovidC1 0.784
CovidC2 0.848
C-19 CF CovidC3 0.850 0.872 0.876 0.907 0.662
CovidC4 0.771
CovidC5 0.811
https://doi.org/10.1371/journal.pone.0260248.t003
Table 4. Fornell–Larcker criterion.
C-19 PF C-19 CF
C-19 PF (0.836)
C-19 CF 0.225 (0.814)
Note: The elements on the diagonal values in parentheses represent the square root of the variance extracted (AVE)
and the values outside the diagonal represent the correlations between the factors.
https://doi.org/10.1371/journal.pone.0260248.t004
PLOS ONE Development and validation of C-19FIP scale
PLOS ONE | https://doi.org/10.1371/journal.pone.0260248 November 19, 2021 10 / 23
On the other hand, the second criteria estimate, the Heterotrait-Monotrait ratio of Correla-
tions (HTMT) values should be less 0.90, as recommended by Henseler et al. [92]. In addition,
the bootstrapping procedure with 5000 samples is performed to demonstrate additional evi-
dence that HTMT value is significantly different from 0.90. In our study the confidence inter-
val of HTMT does not include 1 (HTMT = 0.247; C.I. [0.176–0.310]). Overall, discriminant
validity can be accepted for this measurement model.
To test the model fit, the Standardized Root Mean Square Residual (SRMR) [94] was used:
a value of 0 for SRMR would indicate perfect fit and, in general, an SRMR value less than or
equal to 0.05 indicates an acceptable fit [95]. A recent simulation study shows that a specified
correct model implies SRMR values greater than 0.06 [96]. In this study, the SRMR was 0.07,
indicating a good fit of the model.
A replication of the confirmatory analysis was performed based on the covariance-based
SEM (CB-SEM) approach and maximum likelihood estimation, using the AMOS 23.0
software.
The most common fit indices were used to fit the model. Goodness of fit indices were used
when the ratio between the chi-squared value and the degree of freedom was lower than 3 (X2/
df), the comparative fit index (CFI) and Tucker–Lewis index (TLI) (acceptable fit:� 0.95), the
Root Mean Square Error of Approximation (RMSEA) was also included as a goodness of fit
index and it must be lower than 0.05 or assumes a maximum value of 0.08 [97].
The two-factor model demonstrated a good fit: X2 = 249,749 (85), p< 0.001, CFI = 0.962,
TLI = 0.950 and RMSEA = 0.07. Furthermore, as Fabrigar et al. [98] recommend, the correla-
tion between the two dimensions is less than 0.70 (r = 0.224), supporting the good fit of the
measurement model.
However, as Table 4 shows Confirmatory Factor Analysis (CB-SEM) revealed valid scores
of the factor loadings, but with lower values than the factor loadings generated by the
PLS-SEM analysis. In this sense, according to Afthanorhan [99], we consider the PLS-SEM
approach as a more accurate and precise method. As the author explains, in fact, the modeling
of the PLS-SEM pathway is more appropriate to perform the most reliable and valid CFA,
since it maximizes the explained variance of the endogenous latent constructs (dependent
variable).
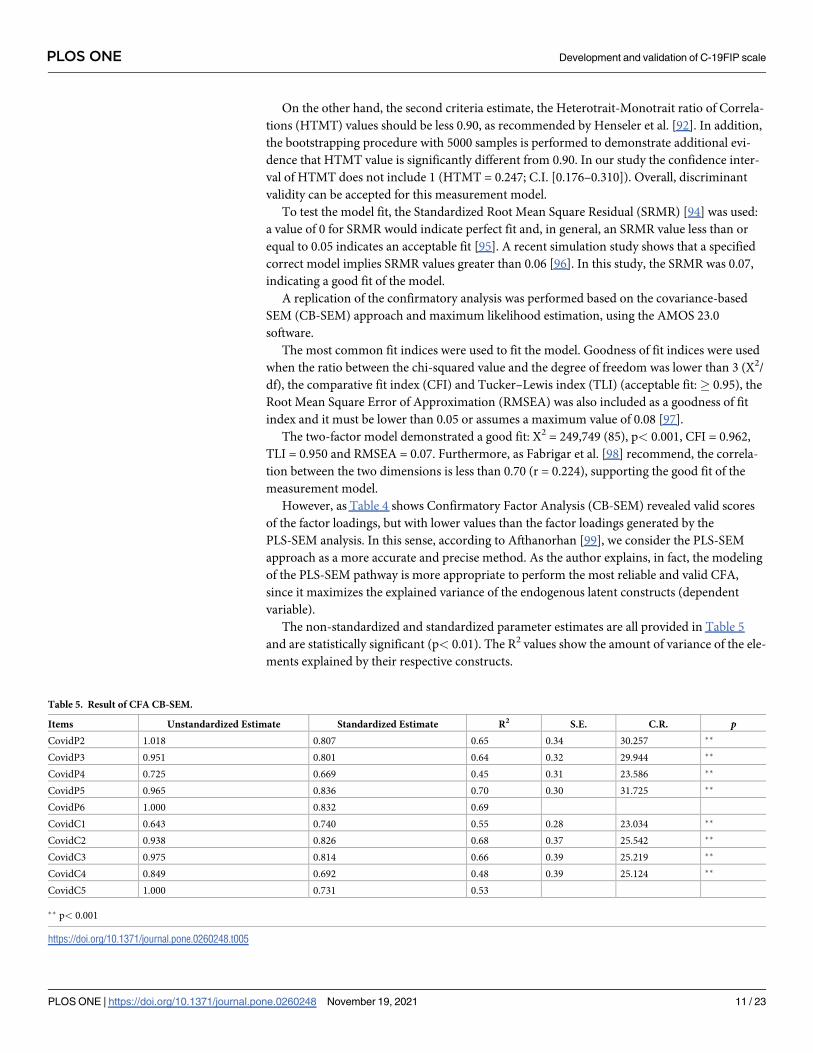
The non-standardized and standardized parameter estimates are all provided in Table 5
and are statistically significant (p< 0.01). The R2 values show the amount of variance of the ele-
ments explained by their respective constructs.
Table 5. Result of CFA CB-SEM.
Items Unstandardized Estimate Standardized Estimate R2 S.E. C.R. pCovidP2 1.018 0.807 0.65 0.34 30.257 ��
CovidP3 0.951 0.801 0.64 0.32 29.944 ��
CovidP4 0.725 0.669 0.45 0.31 23.586 ��
CovidP5 0.965 0.836 0.70 0.30 31.725 ��
CovidP6 1.000 0.832 0.69
CovidC1 0.643 0.740 0.55 0.28 23.034 ��
CovidC2 0.938 0.826 0.68 0.37 25.542 ��
CovidC3 0.975 0.814 0.66 0.39 25.219 ��
CovidC4 0.849 0.692 0.48 0.39 25.124 ��
CovidC5 1.000 0.731 0.53
�� p< 0.001
https://doi.org/10.1371/journal.pone.0260248.t005
PLOS ONE Development and validation of C-19FIP scale
PLOS ONE | https://doi.org/10.1371/journal.pone.0260248 November 19, 2021 11 / 23
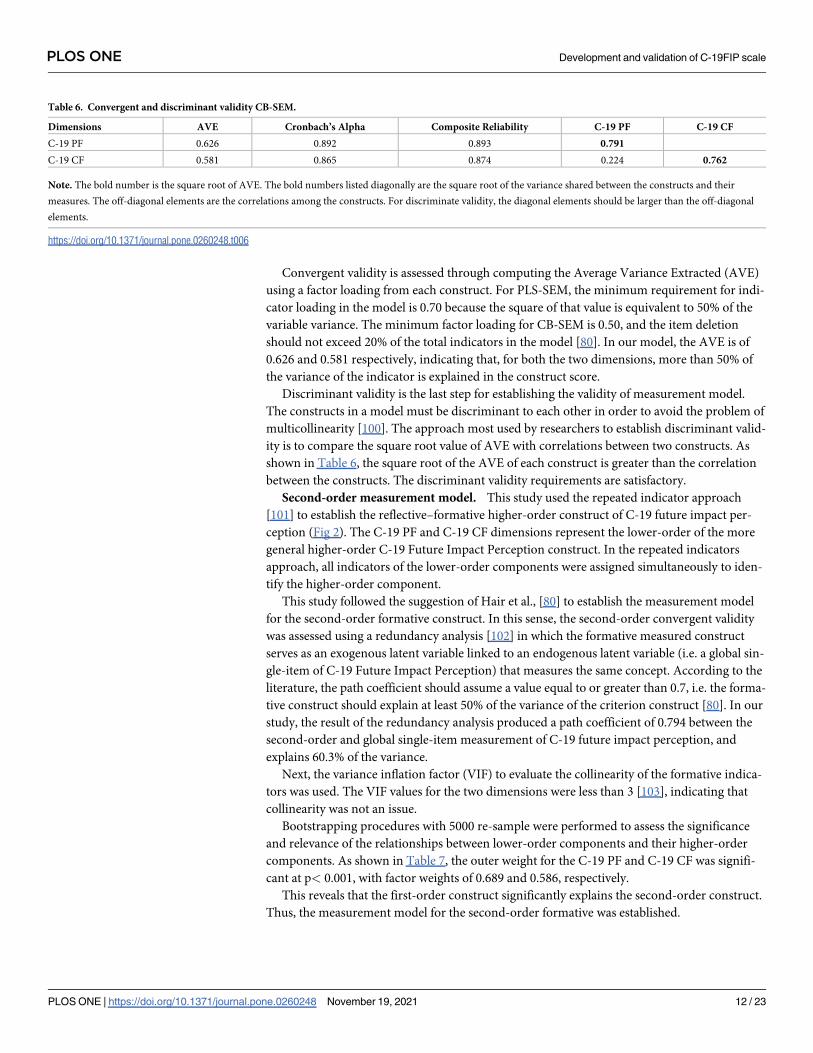
Convergent validity is assessed through computing the Average Variance Extracted (AVE)
using a factor loading from each construct. For PLS-SEM, the minimum requirement for indi-
cator loading in the model is 0.70 because the square of that value is equivalent to 50% of the
variable variance. The minimum factor loading for CB-SEM is 0.50, and the item deletion
should not exceed 20% of the total indicators in the model [80]. In our model, the AVE is of
0.626 and 0.581 respectively, indicating that, for both the two dimensions, more than 50% of
the variance of the indicator is explained in the construct score.
Discriminant validity is the last step for establishing the validity of measurement model.
The constructs in a model must be discriminant to each other in order to avoid the problem of
multicollinearity [100]. The approach most used by researchers to establish discriminant valid-
ity is to compare the square root value of AVE with correlations between two constructs. As
shown in Table 6, the square root of the AVE of each construct is greater than the correlation
between the constructs. The discriminant validity requirements are satisfactory.
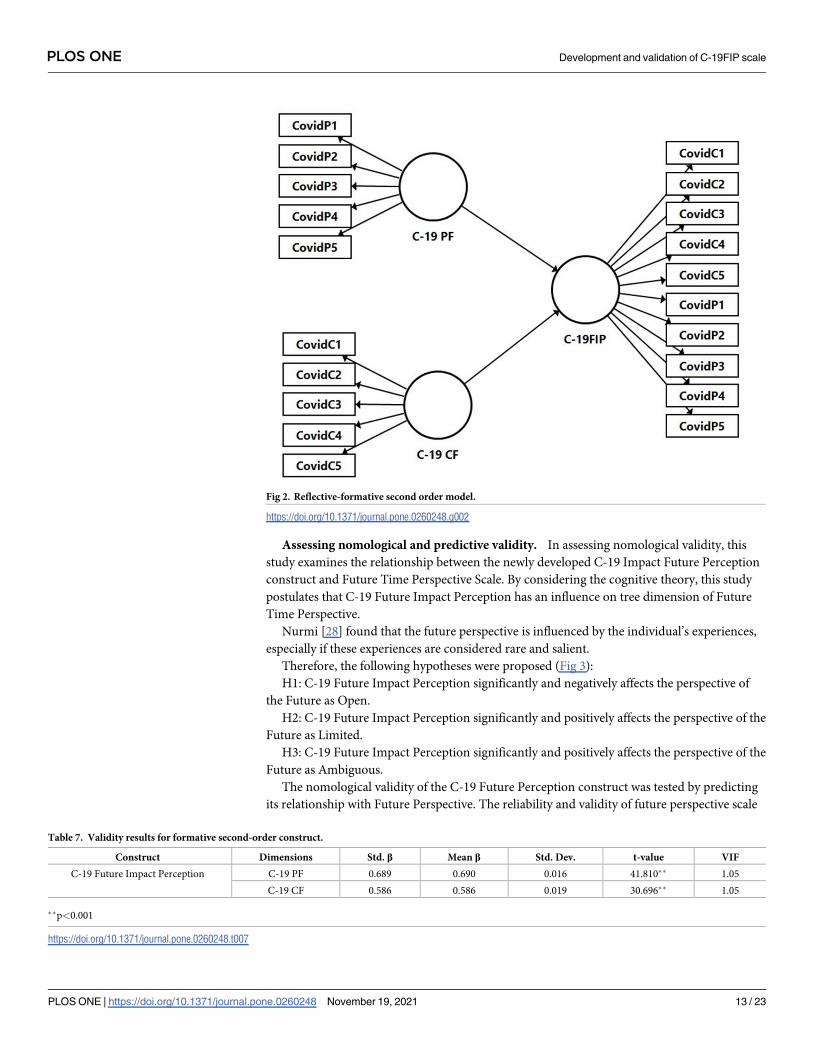
Second-order measurement model. This study used the repeated indicator approach
[101] to establish the reflective–formative higher-order construct of C-19 future impact per-
ception (Fig 2). The C-19 PF and C-19 CF dimensions represent the lower-order of the more
general higher-order C-19 Future Impact Perception construct. In the repeated indicators
approach, all indicators of the lower-order components were assigned simultaneously to iden-
tify the higher-order component.
This study followed the suggestion of Hair et al., [80] to establish the measurement model
for the second-order formative construct. In this sense, the second-order convergent validity
was assessed using a redundancy analysis [102] in which the formative measured construct
serves as an exogenous latent variable linked to an endogenous latent variable (i.e. a global sin-
gle-item of C-19 Future Impact Perception) that measures the same concept. According to the
literature, the path coefficient should assume a value equal to or greater than 0.7, i.e. the forma-
tive construct should explain at least 50% of the variance of the criterion construct [80]. In our
study, the result of the redundancy analysis produced a path coefficient of 0.794 between the
second-order and global single-item measurement of C-19 future impact perception, and
explains 60.3% of the variance.
Next, the variance inflation factor (VIF) to evaluate the collinearity of the formative indica-
tors was used. The VIF values for the two dimensions were less than 3 [103], indicating that
collinearity was not an issue.
Bootstrapping procedures with 5000 re-sample were performed to assess the significance
and relevance of the relationships between lower-order components and their higher-order
components. As shown in Table 7, the outer weight for the C-19 PF and C-19 CF was signifi-
cant at p< 0.001, with factor weights of 0.689 and 0.586, respectively.
This reveals that the first-order construct significantly explains the second-order construct.
Thus, the measurement model for the second-order formative was established.
Table 6. Convergent and discriminant validity CB-SEM.
Dimensions AVE Cronbach’s Alpha Composite Reliability C-19 PF C-19 CF
C-19 PF 0.626 0.892 0.893 0.791
C-19 CF 0.581 0.865 0.874 0.224 0.762
Note. The bold number is the square root of AVE. The bold numbers listed diagonally are the square root of the variance shared between the constructs and their
measures. The off-diagonal elements are the correlations among the constructs. For discriminate validity, the diagonal elements should be larger than the off-diagonal
elements.
https://doi.org/10.1371/journal.pone.0260248.t006
PLOS ONE Development and validation of C-19FIP scale
PLOS ONE | https://doi.org/10.1371/journal.pone.0260248 November 19, 2021 12 / 23
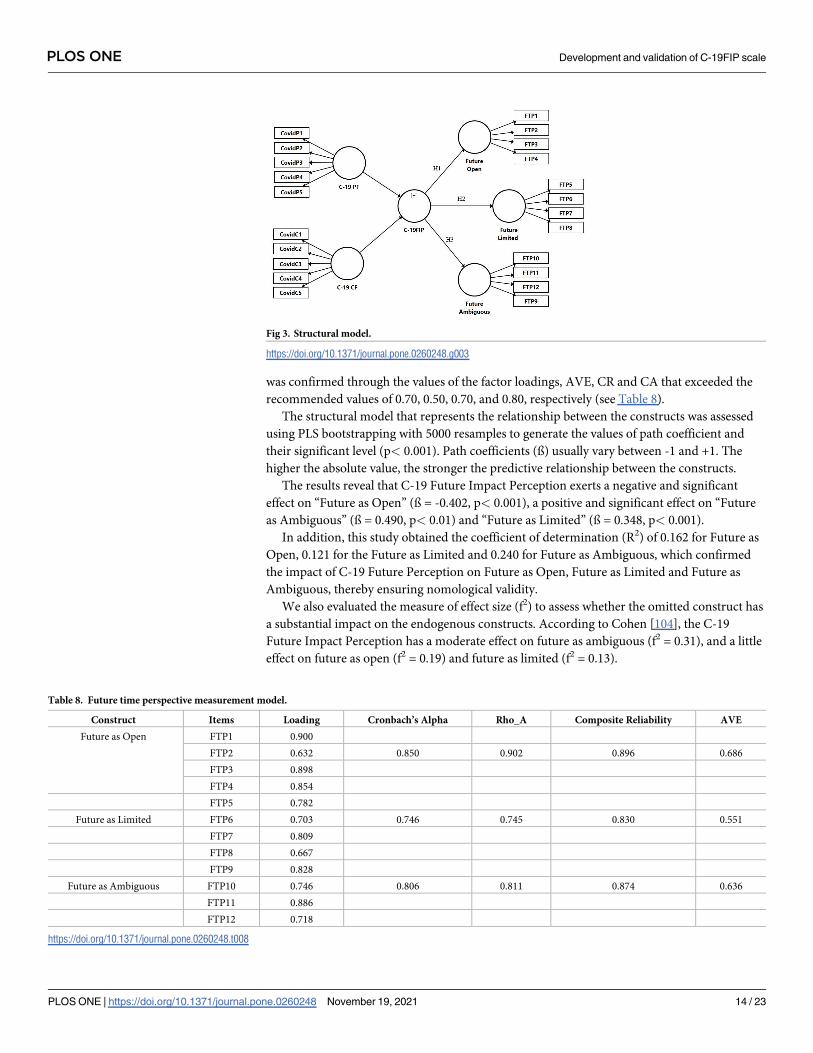
Assessing nomological and predictive validity. In assessing nomological validity, this
study examines the relationship between the newly developed C-19 Impact Future Perception
construct and Future Time Perspective Scale. By considering the cognitive theory, this study
postulates that C-19 Future Impact Perception has an influence on tree dimension of Future
Time Perspective.
Nurmi [28] found that the future perspective is influenced by the individual’s experiences,
especially if these experiences are considered rare and salient.
Therefore, the following hypotheses were proposed (Fig 3):
H1: C-19 Future Impact Perception significantly and negatively affects the perspective of
the Future as Open.
H2: C-19 Future Impact Perception significantly and positively affects the perspective of the
Future as Limited.
H3: C-19 Future Impact Perception significantly and positively affects the perspective of the
Future as Ambiguous.
The nomological validity of the C-19 Future Perception construct was tested by predicting
its relationship with Future Perspective. The reliability and validity of future perspective scale
Fig 2. Reflective-formative second order model.
https://doi.org/10.1371/journal.pone.0260248.g002
Table 7. Validity results for formative second-order construct.
Construct Dimensions Std. β Mean β Std. Dev. t-value VIF
C-19 Future Impact Perception C-19 PF 0.689 0.690 0.016 41.810�� 1.05
C-19 CF 0.586 0.586 0.019 30.696�� 1.05
��p<0.001
https://doi.org/10.1371/journal.pone.0260248.t007
PLOS ONE Development and validation of C-19FIP scale
PLOS ONE | https://doi.org/10.1371/journal.pone.0260248 November 19, 2021 13 / 23
was confirmed through the values of the factor loadings, AVE, CR and CA that exceeded the
recommended values of 0.70, 0.50, 0.70, and 0.80, respectively (see Table 8).
The structural model that represents the relationship between the constructs was assessed
using PLS bootstrapping with 5000 resamples to generate the values of path coefficient and
their significant level (p< 0.001). Path coefficients (ß) usually vary between -1 and +1. The
higher the absolute value, the stronger the predictive relationship between the constructs.
The results reveal that C-19 Future Impact Perception exerts a negative and significant
effect on “Future as Open” (ß = -0.402, p< 0.001), a positive and significant effect on “Future
as Ambiguous” (ß = 0.490, p< 0.01) and “Future as Limited” (ß = 0.348, p< 0.001).
In addition, this study obtained the coefficient of determination (R2) of 0.162 for Future as
Open, 0.121 for the Future as Limited and 0.240 for Future as Ambiguous, which confirmed
the impact of C-19 Future Perception on Future as Open, Future as Limited and Future as
Ambiguous, thereby ensuring nomological validity.
We also evaluated the measure of effect size (f2) to assess whether the omitted construct has
a substantial impact on the endogenous constructs. According to Cohen [104], the C-19
Future Impact Perception has a moderate effect on future as ambiguous (f2 = 0.31), and a little
effect on future as open (f2 = 0.19) and future as limited (f2 = 0.13).
Fig 3. Structural model.
https://doi.org/10.1371/journal.pone.0260248.g003
Table 8. Future time perspective measurement model.
Construct Items Loading Cronbach’s Alpha Rho_A Composite Reliability AVE
Future as Open FTP1 0.900
FTP2 0.632 0.850 0.902 0.896 0.686
FTP3 0.898
FTP4 0.854
FTP5 0.782
Future as Limited FTP6 0.703 0.746 0.745 0.830 0.551
FTP7 0.809
FTP8 0.667
FTP9 0.828
Future as Ambiguous FTP10 0.746 0.806 0.811 0.874 0.636
FTP11 0.886
FTP12 0.718
https://doi.org/10.1371/journal.pone.0260248.t008
PLOS ONE Development and validation of C-19FIP scale
PLOS ONE | https://doi.org/10.1371/journal.pone.0260248 November 19, 2021 14 / 23
Finally, the structural model was tested for predictive relevance through the Stone–Geisser’s
Q2 values [105, 106], using the blindfolding procedure [92]. The omission distance value
should be a prime integer ranging from 5 to 10 [107] with D = 7 recommended in the
literature.
According to Chin [108] Q2 > 0 reflect the presence of predictive relevance, while Q2 < 0
represents the lack of predictive relevance. The predictive relevance for endogenous variables
are above zero.
Using the cross-validated redundancy approach, this study obtained Q2 of 0.236 for Future
as Ambiguous, Q2 of 0.155 for Future as Open and Q2 of 0.116 for Future as Limited. These
results supported the predictive validity of the higher-order C-19 Future Impact Perception
scale.
Discussion
The aim of this research was to develop and validate a measure to assess the impact of the
COVID-19 pandemic on university students’ perceptions of their future and the country’s
economy. The scale was developed using a mixed approach (inductive and deductive method)
and a rigorous systematic procedure, following the recommendations of Churchill [63].
According to socio-cognitive theory [26], the environment influences the perceptions that
an individual has of himself and the world, generating different behavioral responses. In this
theoretical framework, particular emphasis has been given to Future Perception, especially fol-
lowing adverse events or perceived as uncertain. The measure developed in this study follows
this theoretical approach with the aim of contributing to knowledge of the field and under-
standing how different factors contribute to shaping the future perceptions of university stu-
dents in crisis situations.
The present study included two different samples of undergraduate students in distinct
phases: Study 1 (n = 1,279), to extract the factorial structure (EFA), and Study 2 (n = 1,078), to
validate the purified scale (CFA).
The results of study 1 (phase 3) showed a two-factor structure. Furthermore, the two factors
indicated that the total variance of the scale was 69.77%. This result shows that both factors are
representative and, therefore, the new measure has good constructive validity, indicating that
C-19PIFS can be used to assess future perceptions related to COVID-19.
The first factor (C-19 PF) consists of 5 items and is related to students’ perception of the
future impact of Covid-19 on work (for example: "COVID 19 will reduce my chances of find-
ing a job").
The second factor (C-19 CF) consists of 5 items and analyzes the perceptions of the impact
of Covid-19 on the economic future of the country where students live (for example: "COVID-
19 will negatively affect my country’s economy"). In addition, five items were eliminated at
this stage because they did not achieve a factor loading of 0.7.
This change led to the final version of the measure. The C-19 Future Impact Perception is a
two-dimensional construct with 10 items and 5 response choices (from 1: “Strongly disagree”
to 5: “Strongly agree”).
In the second study (phase 4) Hair’s et al. [80] recommendations were performed. At the
first-order model, two different methods were used: Partial Least Square Structural Equation
Modeling (PLS-SEM) and Covariance-Based Structural Equation Modeling (CB-SEM). The
results show that the CB-SEM approach, while producing slightly lower values of the factor
loadings than the PLS-SEM method, nevertheless generated a satisfactory fit of the two-factor
model (x2 = 249,749 (85), p< 0.001, CFI = 0.962, TLI = 0.950 and RMSEA = 0.07). These
results are in agreement with previous studies [99, 109].
PLOS ONE Development and validation of C-19FIP scale
PLOS ONE | https://doi.org/10.1371/journal.pone.0260248 November 19, 2021 15 / 23

In general, the two subscales (C-19 PF and C-19 CF) reached a satisfactory level in terms of
Cronbach’s alpha (PLS-SEM: C-19 PF α = 0.891; C-19 CF α = 0.872; CB-SEM: C-19 PF α =
0.892; C-19 CF α = 0.865) composite reliability (PLS-SEM: CR C-19 PF = 0.920; CR C-19
CF = 0.907; CB-SEM: CR C-19 PF = 0.893; CR C-19 CF = 0.874), factor loads, AVE (PLS-SEM:
AVE C-19 PF = 0.699; AVE C-19 CF = 0.662; CB-SEM: AVE C-19 PF = 0.626; AVE C-19
CF = 0.581) and Heterotrait-Montrait Ratio (HTMT = 0.247; CI [0.176–0.310]) values, con-
firming the authenticity of the reflective model.
The second-order model, implemented via PLS-SEM, also obtained acceptable values for
VIF and significant values for the factorial weight (C-19 PF–C19FIPS = 0.689; t = 41.810;
p<0.01; C-19 CF–C19FIPS = 0.586; t = 30.696; p<0.001), thus approving the second order for-
mative model. Consequently, the theoretical and empirical evidence supports the arguments
presented in this study, i.e. future perception is a higher-order multidimensional latent con-
struct in the form of a reflective-formative type II model.
This study also confirms the nomological network and predictive validity of the superior
model by showing an effect of the C-19 Future Impact Perception with the Future Time Per-
spective (FTP).
The multidisciplinary nature of the FTP has been emphasized in the literature [17, 36]. In
the present study we have referred to three dimensions of the future time, in line with study of
Brothers et al., [76]: the dimension of the “future as open”, “future as limited”, and “future as
ambiguous”. Consistent with the hypotheses implemented in the present study, the effect was
negative in the case of the future as open (H1: ß = -0.402, p< 0.001), while it was positive
effects in the case of the future as limited (H2: ß = 0.348, p< 0.001), and ambiguous (H3: ß =
0.490, p< 0.001).
These results are in line with previous studies that have demonstrated the impact of changes
and social transformations on the daily life of young people and on how they see the future
[110–112], also with regard to the conviction of maintaining a job or getting the desired job
(see for example, Vanhercke et al. [113]).
This appears very important considering the weight that the future assumes for the youn-
gest. Several studies have shown that major concerns are related to the sphere of the future
rather than to other domains, such as academic success [114, 115], with repercussions on men-
tal and physical health [58–62].
Furthermore, although the current pandemic situation affects the whole world, perceptions
about the future can differ profoundly between countries, based on specific conditions, such as
the unemployment rate [116, 117]. Some studies have shown that there are differences in dif-
ferent European countries [114, 115].
For example, according to the survey conducted by Kantar [118] in October-November
2020 on the effects of the COVID-19 pandemic, 39% of European respondents said that the
COVID-19 crisis has already impacted their personal income and a further 27% are expect an
impact in the future.
Furthermore, although most citizens say they are uncertain about the future, citizens of
Germany and Great Britain perceive less uncertainty than those living in France and Italy.
For these reasons, we have placed emphasis not only on perceptions of the future on a per-
sonal level, but also on contextual attributes (macro-level factors), recognizing the complex
interaction between environment, individual and future orientation.
In general, in situations perceived as safe, when a result is particularly satisfying, personal
factors exert a greater influence, while in the case of non-salient goals, context and extrinsic
experiences have a greater impact in shaping the perception of the likelihood of an event
occurring. Currently, little is known about how these dynamics come into play in situations
perceived as uncertain and risky.
PLOS ONE Development and validation of C-19FIP scale
PLOS ONE | https://doi.org/10.1371/journal.pone.0260248 November 19, 2021 16 / 23

To answer this gap in the literature, we considered it appropriate to build a useful tool to
foster knowledge in the field of psychological research on the "future orientation", through the
analysis of the personal dimension and the nation context in situations of uncertainty (or per-
ceived as such), as is the current pandemic. The theoretical reference model, in line with socio-
cognitive theory, considers individuals and the environment as having mutually influential
relationships. These evidences justify the two-dimensional nature of the new C-19FIPS
measurement.
Although our article contributes to future orientation research by presenting a two-dimen-
sional scale reliable, replicable, and theoretically informed, the present study is not without
limitations that could be explored in future research. An important limitation of this study was
the homogeneity of the sample which limits the generalizability of the results. The sample of
the present research were university students; it would be important to evaluate the instrument
with more representative samples to better understand how the scale works with subjects that
have different characteristics. In addition, to explore the generalizability of the scale it might
be useful to examine the role of cultural context through Hofstede’s cultural dimensions [119].
For example, the literature has shown that, in situations perceived as safe, individualistic cul-
tures would have a higher FTP than collectivist cultures [120]: in individualistic countries it is
expected that individuals take care of themselves and tend to worry about achieving their
goals; in contrast, individuals in countries that have a lower individualism score expect their
family members or members of a particular group to care for them in the future, devoting less
personal effort to obtain the own benefits. What happens in situations perceived as adverse?
Transnational and intercultural approaches could further clarify the issue.
Furthermore, this study uses a cross-sectional method for data collection. Future research
should include the longitudinal evaluation of the C-19FIPS to understand how the dimensions
of the C-19FIPS change and improve the assessment of the impact of COVID-19 at different
points in time and solve the problem of causality.
Conclusions
The 10-item C-19 Future Impact Perception Scale (C-19FIPS) has proven to be an acceptable
and reliable tool for assessing the impact of the Covid-19 pandemic on Spanish university stu-
dents’ perceptions of their future work and the economy of the country.
The scale has been subjected to numerous analyzes to confirm its reliability and validity,
and is therefore suitable for use in future studies on the impact of COVID-19 in decision-mak-
ing processes, especially in the Spanish context. This questionnaire can help researchers who
wish to have a better overview of the impact of the pandemic in the future, but also as a useful
tool for analyzing the complex relationship between psychological and environmental factors.
It should also be a tool that helps the government and institutions to improve current support
programs, particularly by taking young people into consideration. We believe that knowledge
increases collective awareness, contributing to community decision making.
Supporting information
S1 Appendix. C-19 future perception scale.
(DOC)
S2 Appendix. Dataset study 1.
(CSV)
S3 Appendix. Dataset study 2.
(CSV)
PLOS ONE Development and validation of C-19FIP scale
PLOS ONE | https://doi.org/10.1371/journal.pone.0260248 November 19, 2021 17 / 23

Author Contributions
Conceptualization: Giuseppina Maria Cardella, Jose Carlos Sanchez-Garcıa.
Data curation: Giuseppina Maria Cardella, Brizeida Raquel Hernandez-Sanchez.
Formal analysis: Giuseppina Maria Cardella.
Funding acquisition: Jose Carlos Sanchez-Garcıa.
Investigation: Giuseppina Maria Cardella, Brizeida Raquel Hernandez-Sanchez, Jose Carlos
Sanchez-Garcıa.
Methodology: Giuseppina Maria Cardella, Brizeida Raquel Hernandez-Sanchez.
Project administration: Jose Carlos Sanchez-Garcıa.
Resources: Giuseppina Maria Cardella, Brizeida Raquel Hernandez-Sanchez, Jose Carlos San-
chez-Garcıa.
Software: Giuseppina Maria Cardella.
Supervision: Jose Carlos Sanchez-Garcıa.
Validation: Giuseppina Maria Cardella.
Writing – original draft: Giuseppina Maria Cardella, Brizeida Raquel Hernandez-Sanchez,
Jose Carlos Sanchez-Garcıa.
Writing – review & editing: Giuseppina Maria Cardella, Brizeida Raquel Hernandez-Sanchez,
Jose Carlos Sanchez-Garcıa.
References1. Garofali A. International economic outlook in times of Covid-19 –A SWOT analysis. In: Gardini GL, edi-
tor. The world before and after Covid-19. Intellectual reflections on politics, diplomacy and international
relations. Sweden: European Institute of International Studies Press; 2020. pp. 57–60. https://doi.org/
10.4081/monaldi.2020.1085 PMID: 32431134
2. Fernandes N. Economic effects of coronavirus outbreak (Covid-19) on the world economy. 2020.
Available from: https://papers.ssrn.com/sol3/papers.cfm?abstract_id=3557504
3. Hai W, Zhao Z, Wang J, Hou Z-G. The Short-Term Impact of SARS on the Chinese Economy. Asian
Econ Pap. 2004; 3: 57–61. https://doi.org/10.1162/1535351041747905
4. Peiris JS, Chu CM, Cheng VCC, Chan KS, Hung IF, Poon LL. Clinical progression and viral load in a
community outbreak of a coronavirus-associated SARS pneumonia: a prospective study. Lancet
2003; 361: 1767–1772. https://doi.org/10.1016/s0140-6736(03)13412-5 PMID: 12781535
5. Borio C. The Covid-19 economic crisis: dangerously unique. Bus Econ. 2020; 55: 181–190. https://doi.
org/10.1057/s11369-020-00184-2 PMID: 32989332
6. Goodell JW. COVID-19 and finance: Agendas for future research. Finance Res Lett. 2020; 35:
101512. https://doi.org/10.1016/j.frl.2020.101512 PMID: 32562472
7. Szczygielski JJ, Bwanya PR, Charteris A, Brzeszczyńskia J. The only certainty is uncertainty: An anal-
ysis of the impact of COVID-19 uncertainty on regional stock markets. Finance Res Lett. 2021; 26:
101945. https://doi.org/10.1016/j.frl.2021.101945 PMID: 33519309
8. Council of Europe (COE). Democratic Governance and Covid-19. Strasbourg: Council of Europe
Publishing; 2020. Available from: https://rm.coe.int/cddg-2020-20e-final-
reportdemocraticgovernancecovid19-for-publication-/1680a0beed
9. Zhang D, Hu M, Ji Q. Financial markets under the global pandemic of COVID-19. Finance Res Lett.
2020; 36: 101528. https://doi.org/10.1016/j.frl.2020.101528 PMID: 32837360
10. Daube CH. Covid-19 third Wave—Impact on Financial Markets and Economy. ZBW—Leibniz Infor-
mation Centre for Economics, Kiel, Hamburg 2020. Available from: https://www.econstor.eu/
bitstream/10419/232980/1/Covid-19-third-wave-impacts-on-financial-markets-and-economy.pdf
PLOS ONE Development and validation of C-19FIP scale
PLOS ONE | https://doi.org/10.1371/journal.pone.0260248 November 19, 2021 18 / 23
https://rm.coe.int/cddg-2020-20e-final-reportdemocraticgovernancecovid19-for-publication-/1680a0beed
11. Oncioiu I, Duca I, Postole MA, Georgescu GC, Gherghina R, Grecu RA. Transforming the COVID-19
Threat into an Opportunity: The Pandemic as a Stage to the Sustainable Economy. Sustainability.
2021; 13: 2088. https://doi.org/10.3390/su13042088
12. Leduc S, Liu Z. The Uncertainty Channel of the Coronavirus. Economic Letter 2020–07. Available
from https://www.frbsf.org/economic-research/publications/economic-letter/2020/march/uncertainty-
channel-of-coronavirus/
13. Shehzad K, Xiaoxing L, Kazouz H. COVID-19’s disasters are perilous than Global Financial Crisis: A
rumor or fact? Finance Res Lett. 2020; 36: 101669. https://doi.org/10.1016/j.frl.2020.101669 PMID:
32837374
14. Miranda A, Corica A. Las transformaciones en el mercado de trabajo en la Argentina de los ultimos 10
años: desigualdad y precariedad entre los jovenes. Proceeding Paper at the III Congreso de la Asocia-
cion Latinoamericana de Poblacion (ALAP) Cordoba, 24–26 September, 2008.
15. International Labor Organization (ILO). Youth & COVID-19: Impacts on jobs, education, rights and
mental well-being. Report 2020. Available from: https://www.ilo.org/global/topics/youth-employment/
publications/WCMS_753026/lang—en/index.htm
16. McInerney DM. A Discussion of Future Time Perspective. Educational Psychology Review 2004; 16:
141–151. https://doi.org/10.1023/B:EDPR.0000026610.18125.a3
17. Nuttin J, Lens W. Future time perspective and motivation: Theory and research method. Leuven: Leu-
ven University Press & Erlbaum; 1985.
18. Seginer R. Adolescent Future Orientation: An Integrated Cultural and Ecological Perspective. Online
Read Psychol Cult. 2003; 6(1): 1–13. https://doi.org/10.9707/2307-0919.1056
19. Seginer R, Lens W. The Motivational Properties of Future Time Perspective Future Orientation: Differ-
ent Approaches, Different Cultures. In: Stolarski M, Fieulaine N, van Beek W, editors. Time Perspec-
tive Theory; Review, Research and Application. Cham: Springer; 2015. pp. 287–304.
20. Malka A, Covington MV. Perceiving school performance as instrumental to future goal attainment:
Effects on graded performance. Contemp Educ Psychol. 2005; 30(1): 60–80. https://doi.org/10.1016/j.
cedpsych.2004.04.001
21. Sheldon KM, Vansteenkiste M. Personal goals and time travel: How are future places visited, and is it
worth it? In: Strathman A, Joireman J, editors. Understanding behavior in the context of time: Theory,
research, and application. Mahwah, NJ: Lawrence Erlbaum Associates Publishers; 2005. pp. 143–
163.
22. Bembenutty H, Karabenick SA. Inherent association between academic delay of gratification, future
time perspective, and self-regulated learning. Educ Psychol Rev. 2004; 16: 35–57. https://doi.org/10.
1023/B:EDPR.0000012344.34008.5c
23. Vansteenkiste M, Simons J, Soenens B, Lens W. How to become a persevering exerciser? Providing
a clear, future intrinsic goal in an autonomy-supportive way. J Sport Exerc Psychol. 2004; 26(2): 232–
249. https://doi.org/10.1123/jsep.26.2.232
24. Zimbardo PG, Boyd JN. Putting time in perspective: A valid, reliable individual-differences metric. J
Pers Soc Psychol. 1999; 77(6): 1271–1288. https://doi.org/10.1037/0022-3514.77.6.1271
25. Lv HC. Research on Adolescents’ Time Perspective. Beijing, China: Science Press; 2014.
26. Andre L, van Vianen AEM, Peetsma TTD, Oort FJ. Motivational power of future time perspective:
Meta-analyses in education, work, and health. PLoS ONE 2018; 13(1): e0190492. https://doi.org/10.
1371/journal.pone.0190492 PMID: 29364917
27. Bandura A. Social Foundations of Thought and Action: A Social Cognitive Theory. Englewood Cliffs:
Prentice-Hall; 1986.
28. Bandura A. Social Cognitive Theory: An agentic perspective. Annu Rev Psichol. 2001; 52:1–26.
https://doi.org/10.1146/annurev.psych.52.1.1 PMID: 11148297
29. Lewin K. Field Theory and Learning in Social Sciences. In Cartwright D, editor. Field Theory in Social
Science, Selected Theoretical Papers. Washington: American Psychological Association; 1942. pp.
212–230.
30. Henry H, Zacher H, Desmette D. Future Time Perspective in the Work Context: A Systematic Review
of Quantitative Studies. Front Psychol. 2017; 8: 413. https://doi.org/10.3389/fpsyg.2017.00413 PMID:
28400741
31. Nurmi JE. How do adolescents see their future? A review of the development of future orientation and
planning. Dev Rev. 1991; 11(1): 1–59. https://doi.org/10.1016/0273-2297(91)90002-6
32. Atkinson JW, Feather NT. A theory of achievement motivation. New York NY: Wiley; 1966.
33. Locke EA, Latham GP. What Should We Do about Motivation Theory? Six recommendations for the
Twenty-First Century. Acad Manag Rev. 2004; 29(3):388–403. https://doi.org/10.2307/20159050
PLOS ONE Development and validation of C-19FIP scale
PLOS ONE | https://doi.org/10.1371/journal.pone.0260248 November 19, 2021 19 / 23

34. Lens W, Paixão MP, Herrera D, Grobler A. Future time perspective as a motivational variable: Content
and extension of future goals affect the quantity and quality of motivation. Jpn Psychol Res. 2012; 54
(3):321–333. https://doi.org/10.1111/j.1468-5884.2012.00520.x
35. Peetsma T, van der Veen I. Relations between the development of future time perspective in three life
domains, investment in learning, and academic achievement. Learn Instr. 2011; 21(3):481–494.
https://doi.org/10.1016/j.learninstruc.2010.08.001
36. Zimbardo PG, Boyd JN. The Time Paradox. New York, NY: Free Press; 2008.
37. Peetsma T, Schuitema J, Van Der Veen I. A longitudinal study on time perspectives: Relations with
academic delay of gratification and learning environment. Jpn Psychol Res. 2012; 54(3):241–252.
https://doi.org/10.1111/j.1468-5884.2012.00526.x
38. Ferrari L, Nota L, Soresi S. Time perspective and indecision in young and older adolescents. Br J Guid
Counc. 2010; 38(1):61–82. https://doi.org/10.1080/03069880903408612
39. Pizzolato JE. Achieving college student possible selves: Navigating the space between commitment
and achievement of long-term identity goals. Cult Divers Ethn Minor Psychol. 2006; 12(1): 57–69.
https://doi.org/10.1037/1099-9809.12.1.57 PMID: 16594855
40. Simons J, Vansteenkiste M, Lens W, Lacante M. Placing motivation and future time perspective theory
in a temporal perspective. Educ Psychol Rev. 2004; 16: 121–139. https://doi.org/10.1023/B:EDPR.
0000026609.94841.2f
41. Shell DF, Husman J. The multivariate dimensionality of per-sonal control and future time perspective
in achievement and studying. Contemp Educ Psychol. 2001; 26: 481–506. https://doi.org/10.1006/
ceps.2000.1073 PMID: 11681829
42. Gallagher J. Learning about an Infrequent Event: Evidence from Flood Insurance Take-Up in the
United States. Am Econ J Appl Econ. 2014; 6(3): 206–233. https://doi.org/10.1257/app.6.3.206
43. Hertwig R, Barron G, Weber EU, Erev I. Decisions from Experience and the Effect of Rare Events in
Risky Choice. Psychol Sci. 2004; 15(8): 534–549. https://doi.org/10.1111/j.0956-7976.2004.00715.x
PMID: 15270998
44. Malmendier U, Nagel S. Depression Babies: Do Macroeconomic Experiences Affect Risk-Taking?
Working Paper 2011. Available from: https://www.nber.org/papers/w14813
45. Adams SP, De Kock F. The role of salient beliefs in graduates’ intention to apply. SA J Ind Psychol.
2015; 41(1): 1223. https://doi.org/10.4102/sajip.v41i1.1223
46. Bordalo P, Gennaioli N, Shleifer A. Salience Theory of Choice Under Risk. Q J Econ. 2010; 127(3): 1–
48. https://doi.org/10.2307/23251985
47. Tversky A, Kahneman D. Availability: A heuristic for judging frequency and probability. Cogn Psychol.
1973; 5(2): 207–232. https://doi.org/10.1016/0010-0285(73)90033-9
48. Melamed D, Savage SV, Munn C. Uncertainty and Social Influence. Socius: Sociological Research for
a Dynamic World 2019; 5: 1–9. https://doi.org/10.1177/2378023119866971
49. Morselli D. The olive tree effect: Future time perspective when the future is uncertain. Cult Psychol.
2013; 19(3): 305–322. https://doi.org/10.1177/1354067X13489319
50. Ritchie L, Cervone D, Sharpe BT. Goals and Self-Efficacy Beliefs During the Initial COVID-19 Lock-
down: A Mixed Methods Analysis. Front Psychol. 2021; 11: 559114. https://doi.org/10.3389/fpsyg.
2020.559114 PMID: 33510663
51. Dong Y, Mo X, Hu Y, Qi X, Jiang F, Jiang Z, et al. Epidemiology of COVID-19 Among Children in
China. Pediatrics 2020; 145(6): e20200702. https://doi.org/10.1542/peds.2020-0702 PMID: 32179660
52. Wang W, Xu Y, Gao R, Lu R, Han K, Wu G, et al. Detection of SARS-CoV-2 in Different Types of Clini-
cal Specimens. JAMA 2020; 323(18): 1843–1844. https://doi.org/10.1001/jama.2020.3786 PMID:
32159775
53. Bailey M, Davila E, Kuchler T, Stroebel J. House Price Beliefs and Mortgage Leverage Choice. Rev
Econ Stud. 2019; 86(6): 2403–2452. https://doi.org/10.3386/w24091
54. Coibon O, Gorodnichenko Y, Ropele T. Inflation Expectations and Firm Decisions: New Causal Evi-
dence. Q J Econ. 2020; 135(1): 165–219. https://doi.org/10.1093/qje/qjz029
55. D’Acunto F, Hoang D, Weber M. Managing Households’ Expectations with Salient Economic Policies.
CESifo Working Paper No. 7793, Center for Economic Studies and ifo Institute (CESifo), Munich;
2019. Available from: https://www.econstor.eu/bitstream/10419/207184/1/cesifo1_wp7793.pdf
56. Prinz S, Grunder G, Hilgers RD, Holtemoller O, Vernaleken I. Impact of personal economic environ-
ment and personality factors on individual financial decision making. Front Psychol. 2014; 5: 158.
https://doi.org/10.3389/fpsyg.2014.00158 PMID: 24624100
57. Kuchler T, Zafar B. Personal Experiences and Expectations about Aggregate Outcomes. J Financ.
2019; 74(5): 2491–2542. https://doi.org/10.1111/jofi.12819
PLOS ONE Development and validation of C-19FIP scale
PLOS ONE | https://doi.org/10.1371/journal.pone.0260248 November 19, 2021 20 / 23
58. Mucci N, Giorgi G, Roncaioli M, Perez FJ, Arcangeli G. The correlation between stress and economic
crisis: a systematic review. Neuropsychiatr Dis Treat. 2016; 12: 983–993. https://doi.org/10.2147/
NDT.S98525 PMID: 27143898
59. Mattei G, Ferrari S, Pingani L, Rigatelli M. Short-term effects of the 2008 Great Recession on the
health of the Italian population: an ecological study. Soc Psychiatry Psychiatr Epidemiol. 2014; 49:
851–858. https://doi.org/10.1007/s00127-014-0818-z PMID: 24445578
60. Evans-Lacko S, Knapp M, McCrone P, Thornicroft G, Mojtabai R. The mental health consequences of
the recession: economic hardship and employment of people with mental health problems in 27 Euro-
pean countries. PLoS One. 2013; 8(7): e69792. https://doi.org/10.1371/journal.pone.0069792 PMID:
23922801
61. Astell-Burt T, Feng X. Health and the 2008 economic recession: evidence from the United Kingdom.
PLoS One. 2013; 8(2): e56674. https://doi.org/10.1371/journal.pone.0056674 PMID: 23437208
62. Gili M, Roca M, Basu S, McKee M, Stuckler D. The mental health risks of economic crisis in Spain: evi-
dence from primary care centres, 2006 and 2010. Eur J Public Health. 2012; 23(1): 103–108. https://
doi.org/10.1093/eurpub/cks035 PMID: 23132877
63. Churchill GA. Paradigm for Developing Better Measures of Marketing Constructs. J Mark Res. 1979;
16(1): 64–73. https://doi.org/10.1177/002224377901600110
64. Ahorsu DK, Lin CY, Imani V, Saffari M, Griffiths MD, Pakpour AH. The Fear of COVID-19 Scale: Devel-
opment and Initial Validation. Int J Ment Health Addiction 2020; 27: 1–9. https://doi.org/10.1007/
s11469-020-00270-8 PMID: 32226353
65. Lee SA. Coronavirus Anxiety Scale: A brief mental health screener for COVID-19 related anxiety.
Death Stud. 2020; 44: 393–401. https://doi.org/10.1080/07481187.2020.1748481 PMID: 32299304
66. Taylor S, Landry CA, Paluszek MM, Fergus TA, McKay D, Asmundson GJG. Development and initial
validation of the COVID Stress Scales. J Anxiety Disord. 2020; 72: 102232. https://doi.org/10.1016/j.
janxdis.2020.102232 PMID: 32408047
67. Jaspal R, Fino E, Breakwell GM. The COVID-19 Own Risk Appraisal Scale (CORAS): Development
and validation in two samples from the United Kingdom. J Health Psychol. 2020, 1–15. https://doi.org/
10.1177/1359105320967429 PMID: 33111594
68. Caycho-Rodrıguez T, Ventura-Leon J, Barboza-Palomino M. Design and validation of a scale to mea-
sure worry for contagion of the COVID-19 (PRE-COVID-19). Enferm Clin. 2020; 31(3): 175–183.
69. Malhotra NK, Hall J, Shaw M, Oppenheim P. Marketing Research: An Applied Orientation. Sydney:
Prentice Hall, Pearson Education Frenchs Forest; 2002.
70. Cavana R, Delahaye B, Sekaran U. Applied Business Research: Qualitative and Quantitative Meth-
ods. 3rd ed. Australia: John Wiley & Sons; 2001.
71. Boateng GO, Neilands TB, Frongillo EA, Melgar-Quiñonez HR, Young SL. Best Practices for Develop-
ing and Validating Scales for Health, Social, and Behavioral Research: A Primer. Front Public Health.
2018; 6: 149. https://doi.org/10.3389/fpubh.2018.00149 PMID: 29942800
72. Morgado FFR, Meireles JFF, Neves CM, Amaral ACS, Ferreira MEC. Scale development: ten main
limitations and recommendations to improve future research practices. Psicol Refl Crıt. 2018; 30(3):
1–20. https://doi.org/10.1186/s41155-016-0057-1 PMID: 32025957
73. Nunnally JC. Psychometric theory. 2nd ed. New York: McGraw-Hill; 1978.
74. Guadagnoli E, Velicer WF. Relation of sample size to the stability of component patterns. Psychol Bull.
1988; 103(2): 265–275. https://doi.org/10.1037/0033-2909.103.2.265 PMID: 3363047
75. Comrey AL, Lee HB. A first course in factor analysis. 2nd ed. Mahwah: Lawrence Erlbaum Associ-
ates Inc.; 1992. PMID: 11639968
76. Brothers A, Chui H, Diehl M. Measuring future time perspective across adulthood: development and
evaluation of a brief multidimensional questionnaire. Gerontologist 2014; 54(6): 1075–1088. https://
doi.org/10.1093/geront/gnu076 PMID: 25063938
77. Ringle CM, Wende S, Becker JM. SmartPLS 3. Boenningstedt: SmartPLS GmbH. 2015. Available
from: www.smartpls.com
78. Hair JF, Sarstedt M, Ringle CM. Rethinking some of the rethinking of partial least squares. Eur J Mark.
2019; 53(4): 558–566. https://doi.org/10.1108/EJM-10-2018-0665
79. Rigdon E, Sarstedt M, Ringle CM. On Comparing Results from CB-SEM and PLS-SEM: Five Perspec-
tives and Five Recommendations. Marketing ZFP 2017; 39(3): 4–16. https://doi.org/10.15358/0344-
1369-2017-3-4
80. Hair JF, Hult GTM, Ringle CM, Sarstedt M. A Primer on Partial Least Squares Structural Equation
Modeling (PLS-SEM). 2nd ed. Los Angeles: Sage Publication; 2017.
PLOS ONE Development and validation of C-19FIP scale
PLOS ONE | https://doi.org/10.1371/journal.pone.0260248 November 19, 2021 21 / 23

81. Diamantopoulos A, Winklhofer H. Index construction with formative indicators: An alternative to scale
development. J Mark Res. 2001; 38(2): 269–277. https://doi.org/10.1509/jmkr.38.2.269.18845
82. Valdivieso C. Comparacion de los modelos formativo, reflexivo y de antecedentes de evaluacion estu-
diantil del servicio de la docencia. Revista de Metodos Cuantitativos para la Economıa y la Empresa.
2013; 16: 95–120.
83. Hair JF, Risher J, Sarstedt M, Ringle CM. When to use and how to report the results of PLS-SEM. Eur
Bus Rev. 2019; 31(1): 2–24.
84. Sarstedt M, Hair JF, Ringle CM, Thiele K, Gudergan S. Estimation Issues with PLS and CBSEM:
Where the Bias Lies! J Bus Res. 2016; 69(10): 3998–4010. https://doi.org/10.1016/j.jbusres.2016.06.
007
85. Ali F, Rasoolimanesh SM, Sarstedt M, Ringle CM, Ryu K. An assessment of the use of partial least
squares structural equation modeling (PLS-SEM) in hospitality research. Int J Contemp Hosp Manag.
2018; 30(1): 514–538. https://doi.org/10.1108/IJCHM-10-2016-0568
86. George D, Mallery M. SPSS for Windows step by step: A simple study guide and reference, 17.0
update. 10th ed. Boston, MA: Allyn & Bacon; 2010.
87. Pallant J. SPSS survival manual: A step by step guide to data analysis using the SPSS program. 4th
ed. Australia: Allen & Unwin; 2011.
88. Hair JF, Black WC, Babin BJ, Anderson RE. Multivariate Data Analysis. 7th ed. Upper Saddle River,
New Jersey: Prentice Hall; 2010.
89. Fornell C, Larcker DF. Evaluating structural equation models with unobservable variables and mea-
surement error. J Mark Res. 1981; 18(1): 39–50. https://doi.org/10.2307/3151312
90. Dijkstra TK, Henseler J. Consistent and asymptotically normal PLS estimators for linear structural
equations. Comput. Stat. Data Anal. 2015; 81: 10–23. https://doi.org/10.1016/j.csda.2014.07.008
91. Henseler J. Bridging design and behavioral research with variance-based structural equation model-
ling. J. Advert. 2017; 46: 178–192. https://doi.org/10.1080/00913367.2017.1281780
92. Henseler J, Ringle CM, Sarstedt M. A new criterion for assessing discriminant validity in variance-
based structural equation modeling. J Acad Mark Sci. 2015; 43: 115–135. https://doi.org/10.1007/
s11747-014-0403-8
93. Franke G, Sarstedt M. Heuristics versus statistics in discriminant validity testing: a comparison of four
procedures. Internet Res. 2019; 29(3): 430–447. https://doi.org/10.1108/IntR-12-2017-0515
94. Hu LT, Bentler PM. Cutoff criteria for fit indexes in covariance structure analysis: Conventional criteria
versus new alternatives. Struct Equ Model 1999; 6: 1–55. https://doi.org/10.1080/
10705519909540118
95. Byrne BM. Structural equation modeling with AMOS: Basic concepts, applications and programming.
Mahwah: Erlbaum; 2001.
96. Henseler J, Hubona G, Ray P. Using PLS path modeling new technology research: updated guide-
lines. Ind Manag Data Syst. 2016; 116(1): 2–20. https://doi.org/10.1108/IMDS-09-2015-0382
97. Schermelleh-Engel K, Moosbrugger H, Muller H. Evaluating the Fit of Structural Equation Models:
Tests of Significance and Descriptive Goodness-of-Fit Measures. Methods Psychol Res. 2003; 8(2):
23–74.
98. Fabrigar LR, Wegener DT, MacCallum RC, Strahan EJ. Evaluating the use of exploratory factor analy-
sis in psychological research. Psychol. Methods 1999; 4(3): 272–299. https://doi.org/10.1037/1082-
989X.4.3.272
99. Afthanorhan WMA. A Comparison of Partial Least Square Structural Equation Modeling (PLS-SEM)
and Covariance Based Structural Equation Modeling (CB-SEM) for Confirmatory Factor Analysis. Int J
Eng Sci Innov Technol. 2013; 2(5): 198–205.
100. Allen MP. The problem of multicollinearity. In: Allen MP, editor. Understanding Regression Analysis.
Boston, MA: Springer; 1997. pp. 176–180.
101. Becker JM, Klein K, Wetzels M. Hierarchical latent variable models in PLS-SEM: Guidelines for using
reflective-formative type models. Long Range Plann. 2012; 45, 359–394. https://doi.org/10.1016/j.lrp.
2012.10.001
102. Chin WW. The partial least squares approach for structural equation modeling. In: Marcoulides GA,
editor. Modern Methods for Business Research. Mahwah, NJ: Lawrence ErlbaumAssociates;
1998. pp. 295–358.
103. Becker JM, Ringle CM, Sarstedt M, Volckner F. How collinearity affects mixture regression results.
Mark Lett. 2015; 26: 643–659. https://doi.org/10.1007/s11002-014-9299-9
104. Cohen J. Statistical power analysis for the behavioral sciences. 2nd ed. Hillside, NJ: Lawrence Erl-
baum Associates; 1988.
PLOS ONE Development and validation of C-19FIP scale
PLOS ONE | https://doi.org/10.1371/journal.pone.0260248 November 19, 2021 22 / 23
105. Geisser S. The Predictive Sample Reuse Method with Applications. J Am Stat Assoc. 1975; 70(350):
320–328. https://doi.org/10.2307/2285815
106. Stone M. Cross validatory choice and assessment of statistical predictions. J R Stat Soc. 1974; 36(2):
111–147. https://doi.org/10.1111/j.2517-6161.1974.tb00994.x
107. Chin W. Issues and opinion on structural equation modeling. MIS Q. 1998; 22(1): 7–16.
108. Chin W. How to Write Up and Report PLS Analyses. In: Esposito Vinzi V, Chin WW, Henseler J, Wang
H, editors. Handbook of Partial Least Squares: Concepts, Methods and Applications. London, New
York: Springer; 2010. pp. 655–690.
109. Lowry PB, Gaskin J. Partial Least Squares (PLS) Structural Equation Modeling (SEM) for Building and
Testing Behavioral Causal Theory: When to Choose It and How to Use It. IEEE Transaction on Profes-
sional Communication. 2014; 57(2): 123–146.
110. Huntsinger CS, Shaboyan T, Karapetyan AM. The Influence of Globalization on Adolescents’ Concep-
tions of Self and Future Self in Rural and Urban Armenia. New Dir Child Adolesc Dev. 2019; 164:67–
82. https://doi.org/10.1002/cad.20280 PMID: 30891946
111. Schachter EP. Context and Identity Formation. J Adolesc Res. 2016; 20(3): 375–395. https://doi.org/
10.1177/0743558405275172
112. Larson RW. Globalization, Societal Change, and New Technologies: What They Mean for the Future
of Adolescence. J Res Adolesc. 2002; 12(1): 1–30. https://doi.org/10.1111/1532-7795.00023
113. Vanhercke D, Kirves K, De Cuyper N, Verbruggen M, Forrier A, De Witte H. Perceived employability
and psychological functioning framed by gain and loss cycles. Career Dev Int. 2015; 20(2): 179–198.
https://doi.org/10.1108/CDI-12-2014-0160
114. Gelhaar T, Seiffge-Krenke I, Borge AIH, Cicognani E, Cunha M, LončarićD, et al. Adolescent coping
with everyday stressors: A seven-nation study of youth from Central, Eastern, Southern, and Northern
Europe. Eur J Dev Psychol. 2007; 4(2): 129–156. https://doi.org/10.1080/17405620600831564
115. Seiffge-Krenke I, Beyers W. Coping Trajectories from Adolescence to Young Adulthood: Links to
Attachment State of Mind. J Res Adolesc. 2008; 15(4): 561–582. https://doi.org/10.1111/j.1532-7795.
2005.00111.x
116. Pinquart M, Silbereisen RK. Human development in times of social change: Theoretical considerations
and research needs. Int J Behav Dev. 2004; 28(4): 289–298. https://doi.org/10.1080/
01650250344000406
117. Trommsdorff G. Effects of Social Change on Individual Development: The Role of Social and Personal
Factors and the Timing of Events. In: Crockett L, Silbereisen RK, editors. Negotiating Adolescence in
Times of Social Change. Cambridge: Cambridge University Press; 2000. pp. 58–68.
118. Kantar. Public Opinion in the EU in time of Coronavirus crisis 3. 2020. Available from: https://www.
europarl.europa.eu
119. Hofstede G. Dimensionalizing cultures: The Hofstede model in context. Online Readings in Psychol-
ogy and Culture. 2011; 2(1):2–26.
120. Shirai T, Beresneviciene D. Future orientation in culture and socio-economic changes: Lithuanian ado-
lescents in comparison with Belgian and Japanese. Balt J Psychol. 2005; 6(1):21–31.
PLOS ONE Development and validation of C-19FIP scale
PLOS ONE | https://doi.org/10.1371/journal.pone.0260248 November 19, 2021 23 / 23