Phylogenomic Reconstruction Indicates Mitochondrial ... - PLOS
Upload
khangminh22Category
view
4download
0
RESEARCH ARTICLE
High TB burden and low notification rates in
the Philippines: The 2016 national TB
prevalence survey
Mary Ann D. LansangID1,2*, Marissa M. AlejandriaID
1,2, Irwin Law3, Noel R. Juban1, Maria
Lourdes E. Amarillo1, Olivia T. Sison4, Jose Rene B. Cruz5,6, Concepcion F. AngID7,
Joseph Adrian L. BuensalidoID2, Johanna Patricia A. CañalID
8,9, Nina T. Castillo-
Carandang1,4, Cynthia P. Cordero1, Donna Mae G. Gaviola10, Mary Ann J. Ladia4, Jacinto
Blas V. Mantaring, III1,5, Myrna T. Mendoza2,7, Maria Sonia S. Salamat2, Hilton Y. Lam1,11,
Marina Tadolini12,13, Anna Marie Celina G. Garfin10, Philippine NTPS 2016 Group¶
1 Department of Clinical Epidemiology, College of Medicine, University of the Philippines, Manila, Philippines,
2 Division of Infectious Diseases, Department of Medicine, College of Medicine, University of the Philippines–
Philippine General Hospital, Manila, Philippines, 3 Global Tuberculosis Programme, World Health
Organization, Geneva, Switzerland, 4 Institute of Clinical Epidemiology, National Institutes of Health,
University of the Philippines, Manila, Philippines, 5 Foundation for the Advancement of Clinical Epidemiology,
Manila, Philippines, 6 Social Innovation in Health Initiative, University of the Philippines, Manila, Philippines,
7 Foundation for the Control of Infectious Diseases, Taft Avenue, Manila, Philippines, 8 Department of
Radiology, University of the Philippines College of Medicine, University of the Philippines, Manila, Philippines,
9 Philippine College of Radiology, Quezon City, Philippines, 10 Department of Health, National TB Control
Program, Manila, Philippines, 11 Institute of Health Policy and Development Studies, University of the
Philippines, Manila, Philippines, 12 Infectious Diseases Unit, IRCCS Azienda Ospedaliero-Universitaria di
Bologna, Policlinico di Sant’Orsola, Bologna, Italy, 13 Department of Medical and Surgical Sciences, Alma
Mater Studiorum University of Bologna, Bologna, Italy
¶ Membership of the Philippine NTPS 2016 Group is provided in the Acknowledgments.
Abstract
Setting
The 3rd national tuberculosis (TB) survey in the Philippines in 2007 reported a significant
decline in the prevalence of TB. Since then, more significant investments for TB control
have been made, yet TB burden estimates from routine surveillance data remain relatively
stable.
Objective
To estimate the prevalence of bacteriologically confirmed pulmonary TB in the Philippines
amongst individuals aged�15 years in 2016.
Design
In March–December 2016, we conducted a population-based survey with stratified, multi-
stage cluster sampling of residents in 106 clusters aged�15 years. Survey participants
were screened for TB by symptom-based interview and digital chest X-ray. Those with
cough�2 weeks and/or haemoptysis and/or chest X-ray suggestive of TB were requested
to submit 2 sputum specimens for Xpert MTB/RIF, direct sputum smear microscopy using
PLOS ONE
PLOS ONE | https://doi.org/10.1371/journal.pone.0252240 June 4, 2021 1 / 16
a1111111111
a1111111111
a1111111111
a1111111111
a1111111111
OPEN ACCESS
Citation: Lansang MAD, Alejandria MM, Law I,
Juban NR, Amarillo MLE, Sison OT, et al. (2021)
High TB burden and low notification rates in the
Philippines: The 2016 national TB prevalence
survey. PLoS ONE 16(6): e0252240. https://doi.
org/10.1371/journal.pone.0252240
Editor: Frederick Quinn, The University of Georgia,
UNITED STATES
Received: January 13, 2021
Accepted: May 11, 2021
Published: June 4, 2021
Copyright: © 2021 Lansang et al. This is an open
access article distributed under the terms of the
Creative Commons Attribution License, which
permits unrestricted use, distribution, and
reproduction in any medium, provided the original
author and source are credited.
Data Availability Statement: All relevant data are
within the manuscript and its Supporting
Information files.
Funding: The 2016 NTPS was supported by the
Philippines’ Department of Health (https://doh.gov.
ph/) through a research grant from the Department
of Science and Technology – Philippine Council for
Health Research and Development (http://pchrd.
dost.gov.ph/), as covered by a Memorandum of
Understanding dated 11 December 2015. The
Department of Health and the Philippine Council for

LED fluorescent microscopy, and mycobacterial solid culture (Ogawa method). Bacteriologi-
cally confirmed pulmonary TB was defined as MTB culture positive and/or Xpert positive.
Results
There were 46,689 individuals interviewed, and 41,444 (88.8%) consented to a chest X-ray.
There were 18,597 (39.8%) eligible for sputum examination and 16,242 (87.3%) submitted
at least one specimen. Out of 16,058 sputum-eligible participants, 183 (1.1%) were smear-
positive. There were 466 bacteriologically confirmed TB cases: 238 (51.1%) Xpert positive,
69 (14.8%) culture positive, and 159 (34.1%) positive by both Xpert and culture. The esti-
mated TB prevalence per 100,000 population aged�15 years was 434 (95% CI: 350−518)
for smear-positive TB, and 1,159 (95% CI: 1,016−1,301) for bacteriologically confirmed TB.
Conclusion
This nationally representative survey found that the TB burden in the Philippines in 2016
was higher than estimated from routine TB surveillance data. There was no evidence of a
decline in smear and culture positive TB from the 2007 survey despite significant invest-
ments in TB control. New strategies for case-finding and patient-centered care must be
intensified and expanded.
Introduction
Globally, tuberculosis (TB) ranked 10th amongst the leading causes of death worldwide and is
the leading cause from a single infectious agent with an estimated 1.2 million TB deaths
amongst HIV-negative people and 10 million new cases of TB in 2019 [1]. Globally, the Philip-
pines remains one of the highest TB burden countries and continues to bear the health and
socioeconomic consequences of TB. In 2015, TB ranked 4th amongst the leading causes of
mortality in the country and 9th in terms of disability-adjusted life years [2]. The estimated
incidence of TB was 322 per 100,000, while the estimated number of multi-drug resistant TB
cases amongst notified pulmonary TB cases was 15,000 for 2015 [3].
National TB prevalence surveys were conducted in 1981–83, 1997, and 2007 [4–6]. The
2007 survey reported a 31% reduction in bacteriologically positive TB and 27% reduction of
smear-positive TB prevalence compared to the 1997 survey, attributed mainly to the imple-
mentation, and roll out of the Directly Observed Treatment, Short course (DOTS) program in
the late 1990s and early 2000s, complemented by strategic public-private partnerships. The
2007 survey concluded that TB was still a major public health problem in the Philippines, with
a prevalence of 2.6 per 1,000 smear-positive TB and 6.6 per 1,000 bacteriologically confirmed
TB amongst those aged� 10 years [6]. Subsequently, the Government of the Philippines devel-
oped a strategic framework for TB control, the Philippine Plan of Action to Control Tubercu-
losis (2010–2016), as part of its health sector agenda. The implementation of the national
strategy involved an increased budget for the National TB Control Program (NTP), expansion
of NTP priorities from smear-positive TB cases to all forms of TB, engagement of village health
workers and communities in case detection and treatment activities, expansion of private sec-
tor and public hospital engagement in DOTS programs, and leveraging funding from the
Global Fund to Fight AIDS, Tuberculosis and Malaria to expand treatment centers for multi-
drug-resistant TB (MDR-TB) [7].
PLOS ONE National TB prevalence survey of the Philippines, 2016
PLOS ONE | https://doi.org/10.1371/journal.pone.0252240 June 4, 2021 2 / 16
Health Research and Development were involved in
the overall design of the survey and the decision to
publish the survey results. Anna Marie Celina
Garfin, programme manager of the National TB
Control Programme of the Department of Health, is
a co-author of the paper.
Competing interests: The authors have declared
that no competing interests exist. The authors
alone are responsible for the views expressed in
this article and they do not necessarily represent
the views, decisions or policies of the institutions
with which they are affiliated.

The NTP of the Philippines’ Department of Health (DOH) needed to reassess the TB bur-
den and identify the gaps and challenges whilst shifting the TB target of the Millennium Devel-
opment Goals −a decline in TB incidence by 2015 − to that of the Sustainable Development
Goals − 80 per cent reduction in TB incidence compared to 2015 [8]. Hence, we conducted the
2016 National TB Prevalence Survey to provide the NTP with accurate and updated informa-
tion on TB burden as the Philippines segues into its 2017−2022 strategic plan to eliminate TB.
The primary objectives of the survey were to estimate the prevalence of bacteriologically
confirmed pulmonary TB (PTB) amongst the population in the Philippines�15 years during
2016, and to assess the trends of smear-positive and bacteriologically confirmed PTB preva-
lence, compared with the results of the 2007 survey.
Study population and methods
Study design, sample size and sampling procedure
We conducted a population-based, cross-sectional survey from March to December 2016
across 57 provinces from 17 regions of the Philippines. We designed the survey in accordance
with the WHO Global Task Force on TB Impact Measurement [9].
The sample size was calculated using the following assumptions: (1) a maximum 20%
reduction in smear-positive TB since 2007, therefore prevalence of smear-positive TB was
assumed to be 2.6 per 1,000 individuals aged�15 years in 2016; (2) cluster size of 500 individu-
als eligible to attend the survey; (3) coefficient of between-cluster variation of 0.8 with a corre-
sponding design effect of 1.83; (4) 25% relative precision; and (5) 85% minimum participation
rate. The estimated sample size was 51,000 eligible individuals from 102 clusters. Six clusters
were added to round off allocations to strata and to account for the cancellation of clusters due
to security reasons and/or inaccessible areas, to give a final sample size of 54,000.
Using stratified, multi-stage cluster sampling, 108 clusters were randomly sampled
across 4 strata, allocated proportionately to population size as follows: 41 clusters for stratum
1 − National Capital Region, Central Luzon region, and Calabarzon region; 20 for stratum
2 − rest of Luzon island; 21 for stratum 3 − Visayas region; and 26 for stratum 4 − Mindanao
region (Fig 1).
Survey procedure
Four survey teams were deployed simultaneously to cover each stratum. Individuals aged�15
years old and residing in the cluster for at least 2 weeks before the survey who provided
informed consent were interviewed using a structured questionnaire with the following com-
ponents: (1) TB symptoms screening (cough and duration, sputum production, haemoptysis,
fever, weight loss, night sweats); (2) past and/or current TB diagnosis and treatment; (3)
health-care seeking behavior of those reporting symptoms; and (4) a history of diabetes melli-
tus and smoking. After the interview, all participants who consented underwent chest X-ray
using a mobile digital machine (MinXray HF 120/60H PowerplusTM), except for pregnant
women, those with physical disabilities that precluded upright chest X-ray, a recent chest
X-ray, and, in a few instances, X-ray machine malfunction. A trained physician (i.e., field team
leader) further interviewed and examined the participants, then interpreted their chest X-rays
at the survey site. The digital images were then sent to an off-site radiologist within the day.
The off-site radiologists used the following classification, adapted from the WHO TB preva-
lence survey handbook [8]: (1) normal chest X-ray; (2) abnormality detected–not TB; (3) pul-
monary abnormality detected–not TB; and (4) pulmonary abnormality detected–suspicious
for TB.
PLOS ONE National TB prevalence survey of the Philippines, 2016
PLOS ONE | https://doi.org/10.1371/journal.pone.0252240 June 4, 2021 3 / 16

Eligibility for sputum examination
Participants with screening symptoms of cough�2 weeks and/or haemoptysis, and/or radio-
graphic abnormalities suggestive of TB based on the reading of the field team leader were
Fig 1. Distribution of the survey clusters across the Philippines, NTPS 2016 (N = 106 clusters). Orange dots–
stratum 1 (National Capital Region; blue dots–stratum 2 (rest of Luzon island); green dots–stratum 3 (Visayas region);
red dots–stratum 4 (Mindanao region); cross marks (+) − sampled clusters that were dropped.
https://doi.org/10.1371/journal.pone.0252240.g001
PLOS ONE National TB prevalence survey of the Philippines, 2016
PLOS ONE | https://doi.org/10.1371/journal.pone.0252240 June 4, 2021 4 / 16

requested to submit 2 sputum specimens: (1) a spot specimen at the survey site, and (2) an
early morning specimen collected the next day. Those who did not have a chest X-ray were
also instructed to submit sputum, irrespective of screening symptoms. If the volume of the
sputum specimens was <3 ml, a third specimen was collected. Participants with discordant
readings of their chest X-rays, i.e., normal reading by the field reader and suggestive of TB by
the offsite radiologist, were recalled to submit sputum.
Laboratory procedures
The sputum specimens from the field sites were in tightly sealed containers and packaged in
insulated ice boxes at 2–8˚C with temperature monitor, and transported at least twice a week
to the designated six reference laboratories located in the three major island groups of the Phil-
ippines. Xpert MTB/RIF version G4 assay (Xpert1) was done on the spot sputum specimens
while direct sputum smear microscopy (DSSM) using light emitting diode fluorescence micro-
scope (LED-FM) and mycobacterial culture on Ogawa solid media (one tube) were performed,
preferably on the morning specimens, and incubated and observed for growth up to 8 weeks.
Tubes with colony growth were sampled, smeared, and stained by Ziehl Neelsen stain, and
acid-fast bacilli (AFB) subjected to the MPT64 rapid test for MTB species confirmation.
LED-FM readings of sputum smears were reported using the NTP Manual of Procedures scale
for AFB microscopy [10], ranging from 0 (no acid-fast bacilli), scanty, 1+, 2+, and 3+ (>250
AFB in one field on average at 200x magnification or >60 AFB at 400x magnification). Isolates
from MTB culture were forwarded to the Research Institute for Tropical Medicine–National
TB Reference Laboratory of the Philippine Department of Health for drug sensitivity testing
(DST), using the proportion method in 92% and line probe assay in 8% of the isolates.
Survey case definitions
Bacteriologically confirmed TB (BCTB) cases were defined as screen-positive participants with
sputum samples positive for MTB on culture and/or Xpert MTB/RIF positive. The Diagnostic
and Medical Panel, composed of pulmonologists, infectious disease specialists, a senior radiol-
ogist, the laboratory coordinator, one data manager, and the deputy director of the Central
Technical Unit, deliberated on the survey classification of all participants with any positive
results either on DSSM, Xpert, or culture (S1 Table).
Quality management procedures
The quality management unit monitored the field teams and participating laboratories to
ensure that survey and laboratory processes adhered to the project standard operating proce-
dures. Senior radiologists at the central level reviewed all chest X-rays of participants with posi-
tive laboratory results, all abnormal chest X-rays, and chest X-rays with discordant readings
between the field team leader and the off-site radiologist, and a random sample of 5% of nor-
mal chest X-rays. External technical assistance was provided by members of the WHO Global
Task Force on TB Impact Measurement, the WHO Country Office, and the WHO Regional
Office.
Data management and analysis
Survey teams captured data via tablet computers. Barcodes were used to identify survey partic-
ipants, including their sputum specimens and laboratory results, stored in a non-relational
database management system. Data entry and data checking programmes were developed
using Epi InfoTM versions 3.5.4 and 7.1 [11]. The central data management unit cleaned,
PLOS ONE National TB prevalence survey of the Philippines, 2016
PLOS ONE | https://doi.org/10.1371/journal.pone.0252240 June 4, 2021 5 / 16

validated, and merged all electronic databases from the field teams, reference laboratories, off-
site radiologists, and central radiologists.
STATA1 version 14 was used for data analysis (StataCorp, Texas, USA). We used the best-
practice analytical methods recommended by the WHO Global Task Force on prevalence sur-
veys to estimate TB prevalence to account for cluster sampling, non-participation, and missing
data [9, 12]. Three logistic regression models were conducted: (1) cluster-level analysis, (2)
individual-level analysis, and (3) estimation with inverse probability weighting and with multi-
ple value imputation. Only model 3 is presented in this article. To determine possible risk fac-
tors for TB, multiple logistic regression analysis with inverse probability weight and backward
elimination strategy was done.
As an approximate indicator of case detection [13], we also estimated the prevalence to case
notification ratios (P:N) by comparing the age- and sex-specific BCTB prevalence rates to TB
case notification rates for smear-positive PTB for the same age groups and sex as reported in the
national TB registry for 2016. Lastly, we compared estimated prevalence rates for smear-positive
and culture-positive TB in the 2007 and 2016 national TB prevalence surveys (NTPS). Recog-
nizing that there were fundamental differences between the two surveys in the sampling design,
age groups covered, screening procedures, chest X-ray imaging interpretation, diagnostic tests
used, and TB case definition, we restricted our comparison of the two surveys to the following
common parameters: age eligibility, screening outcomes defined by chest X-ray only, and PTB
cases defined by Ogawa culture only. This allowed estimations of adjusted prevalence rates for
2007 and 2016 for culture-positive TB cases as well as smear-positive/culture-positive TB.
Ethics statement
On January 19, 2016, the National Ethics Committee approved the survey protocol, standard
operating procedures, data collection forms, and consent forms in English and four Philippine
languages. The study was done in accordance with the National Ethical Guidelines for Health
and Health Related Research and the Data Privacy Act of 2012. The written informed consent
forms were supplemented with an individually administered video information using a tablet
computer, outlining the survey procedures as well as the risks and benefits of participation.
Minors (below 18 years) provided written assent, but their parent or guardian also provided
written informed consent. A two-item quiz was administered to document competence and
comprehension of the participants.
The city/municipal health officer and the NTP coordinator per cluster were informed of
participants who were classified as TB cases in their respective areas via password-protected
email communications. Clinical recommendations on management for each TB case including
the x-ray and laboratory results were also provided to the health officers by the Diagnostic and
Medical Panel.
Results
Survey participants
There were 89,663 individuals enumerated in106 clusters of the 108 original clusters in the
sampling frame. Two clusters were eventually dropped–one due to safety issues in a conflict-
affected area and the other due to an inability to do household enumeration and community
mobilization due to restrictions imposed by the village officers. Compared with the 2010 Phil-
ippine census, the age and sex distributions of the population in the clusters were similar in
the survey-eligible population, except for slightly higher proportions (1.5–1.6%) in the age
groups aged�55 years in the 2016 NTPS enumeration, for which we did not make popula-
tion-adjusted estimates. Of the total enumerated, 28,197 (31.4%) were not eligible to
PLOS ONE National TB prevalence survey of the Philippines, 2016
PLOS ONE | https://doi.org/10.1371/journal.pone.0252240 June 4, 2021 6 / 16

participate due to age or residence criteria. Of those eligible to participate, 46,689 (76.0%)
attended the survey, resulting in an average of 440 participants per cluster (range: 149–572).
Participation was significantly higher amongst women (82.2%) than men (69.5%); individuals
aged�65 years (90.1%) than those aged�25 years (70.0%); and amongst those in rural clusters
(80.2%) than in the urban clusters (71.5%) (all P<0.001) (Fig 2).
Screening
Amongst participants, 46,689 (100%) were screened for symptoms and 41,444 (88.8%) under-
went chest X-ray. There were 18,597 (39.8%) who were assessed as eligible for sputum collec-
tion, out of whom 10,702 (57.5%) had chest X-ray abnormalities suggestive of TB alone; while
1,457 (7.8%) had screening symptoms alone and 1,358 (7.3%) were positive on both chest X-
ray and screening symptoms. Another 5,080 (27.3%) who did not report symptoms refused or
were unable to undergo chest X-ray (Fig 2).
Fig 2. Flow diagram of procedures in the 2016 TB prevalence survey in the Philippines (n = 106 clusters). (1) CXR:
Chest X-ray; FTF: Field tracking form; DSSM: Direct sputum smear microscopy. (2) One sputum: no laboratory result
(error on two Xpert runs; no DSSM and MTB culture).
https://doi.org/10.1371/journal.pone.0252240.g002
PLOS ONE National TB prevalence survey of the Philippines, 2016
PLOS ONE | https://doi.org/10.1371/journal.pone.0252240 June 4, 2021 7 / 16

Laboratory results
Of the 18,597 eligible for sputum specimen collection, 16,242 (87.3%) submitted at least one
sputum sample, while 15,547 (83.6%) submitted two samples. Laboratory results were available
for 16,241 (99.9%) samples. A total of 16,058 (98.9%) had a valid DSSM, out of which 183
(1.1%) were smear-positive. There were 16,200 (99.7%) with valid Xpert results, out of which
397 (2.4%) were Xpert-positive. Valid culture results were available for 15,776 (97.1%), out of
which 232 (1.5%) were MTB-positive (Fig 2). Of the 232 MTB-positive samples, there were 4
weakly positive samples (�9 colonies) that were both smear-negative and Xpert-negative.
Survey TB cases
There were 466 bacteriologically confirmed pulmonary TB cases, only 173 (37.1%) of whom
were smear-positive. Based on the survey case definition using Xpert and/or MTB culture, 238
(51.1%) were Xpert-positive only, 69 (14.8%) were culture-positive only, and 159 (34.1%) were
both Xpert and culture-positive (Fig 3).
Regarding the extent of TB recurrence among the 466 survey TB cases, 77 (16.5%) reported
previous TB treatment at some point in the past five years and 30 (6.4%) stated they were on
treatment at the time of the survey. Thus, 359 (77%) were considered new cases. Amongst the
238 survey TB cases who were positive by Xpert alone, 71 (29.8%) had current or previous his-
tory of TB treatment, compared to 36 out of 228 (15.8%) who were positive by culture alone or
Xpert with culture. Rifampicin resistance was detected in 29 (7.3%) of the 397 Xpert-positive
cases, with a significantly higher proportion seen among those with previous TB treatment (15
out of 81, 18.5%) compared to the treatment-naive cases (14 out of 385, 3.6%). Three of the 29
rifampicin-resistant specimens detected by Xpert were rifampicin-susceptible by DST. Overall,
rifampicin resistance was 5.7% by DST (13 isolates). Out of 229 available MTB isolates, resis-
tance to one or more anti-TB drugs were as follows: isoniazid alone − 5.7% (13 isolates); strepto-
mycin alone − 3.0% (7 isolates); isoniazid and streptomycin– 2.6% (6 isolates); rifampicin and
isoniazid (MDR-TB), with or without other first-line or second-line drugs −3.9% (9 isolates).
Only 150 (32.1%) of the BCTB cases reported screening symptoms, with symptoms being
more frequent among smear-positive TB cases (88 out of 173, 50.9%) compared to smear-neg-
ative TB cases. On the other hand, the frequency of screening symptoms among the sputum-
eligible participants who were non-cases was much lower (2,537 out of 15,775, 16.1%).
Fig 3. Classification of bacteriologically confirmed TB cases by smear, (n = 466). Green bars − culture-positive and
Xpert-positive; orange bars − culture-negative and Xpert-positive; blue bars − culture-positive and Xpert negative.
BCTB: bacteriologically confirmed TB.
https://doi.org/10.1371/journal.pone.0252240.g003
PLOS ONE National TB prevalence survey of the Philippines, 2016
PLOS ONE | https://doi.org/10.1371/journal.pone.0252240 June 4, 2021 8 / 16

Among BCTB cases with screening symptoms, cough of�2 weeks duration was the most
frequently reported symptom among the BCTB cases (n = 117, 25.1%), followed by both
cough of�2 weeks and haemoptysis (n = 22, 4.7%), while haemoptysis alone was present in
only 5 cases (1.1%). The proportion of BCTB cases reporting cough of�2 weeks was signifi-
cantly higher than among non-cases (P<0.001) (Table 1).
With regard to chest X-ray screening, 409 out of 438 (93.4%) BCTB cases who underwent
chest imaging had radiologic findings suggestive of TB, a yield higher than symptom screen-
ing. Notably, two-thirds of cases with X-ray findings were asymptomatic, and these X-ray find-
ings tended to be extensive. Bilateral lung involvement was seen in 275 (67.2%) cases. Ground
glass or reticular densities were found in 396 (90.4%) cases–with or without cavities, nodulari-
ties, or calcifications. Another 6 had only cavity formation and no other findings.
Prevalence of TB
The weighted and adjusted prevalence of bacteriologically confirmed pulmonary TB was 1,159
per 100,000 population aged�15 years (95% CI: 1,016–1,301) and 434 (95% CI: 350–518) per
100,000 population for smear-positive pulmonary TB. The estimated prevalence rate for cul-
ture-positive pulmonary TB was 587 per 100,000 (95% CI: 488 −687). Men were 2.5 times
more likely to have pulmonary TB compared to women. The estimated prevalence increased
with age, peaking at 45–54 years (1,714 per 100,000 [95% CI: 1,364–2,064]) (Table 2).
Within the age group 15 − 24 years, the weighted prevalence rates for smear-positive TB
and BCTB in the 15–19 year old population were 151 per 100,000 (95% CI: 48–254) and 613
(95% CI: 403–822), respectively, suggesting a significant TB burden even among adolescents.
There was no significant difference in the estimated prevalence rates among the four geo-
graphic strata, but the highest prevalence rate of BCTB was seen in Stratum 1 (1,358 per
100,000 [95% CI: 1,103–1,612]), which has the highest population density in the country at
20,785 persons per square kilometer [14] and includes large settlements of urban slum
dwellings.
The estimated prevalence-to-notification (P:N) ratio across all age groups was 3.1, and was
higher in men than women. The highest ratio of 4.2 was found in the age group 15–24 years
but consistently high throughout (Table 3).
Table 1. Comparison of self-reported symptoms in survey cases and non-cases among the sputum-eligible survey
participants, 2016 NTPS, Philippines (n = 16,241).
Symptoms Survey cases (n = 466) No. (%) Non-casesa (n = 15,775) No. (%)
With screening symptoms 150 (32.2) 2,543 (16.1)
Cough�14 days only 117 (25.1) 2,036 (12.9)
Haemoptysis only 5 (1.1) 188 (1.2)
Cough�14 days & haemoptysis 22 (4.7) 176 (1.1)
Cough <14 days & haemoptysis 6 (1.3) 137 (0.9)
With screening symptoms, unspecified 0 (0.0) 6 (0.0)
Other symptoms 195 (41.8) 5,636 (35.7)
Cough <14 daysb 124 (26.6) 2,802 (17.8)
Other non-specific symptomsc 71 (15.2) 2,834 (18.0)
No symptoms 121 (26.0) 7,596 (48.1)
a Non-cases among those sputum-eligible participants.b With or without symptoms of weight loss, fever, and/or night sweats.c Symptoms may include weight loss, fever, and/or night sweats.
https://doi.org/10.1371/journal.pone.0252240.t001
PLOS ONE National TB prevalence survey of the Philippines, 2016
PLOS ONE | https://doi.org/10.1371/journal.pone.0252240 June 4, 2021 9 / 16

In the restricted analysis on common survey parameters for 2007 and 2016, the estimated
adjusted prevalence rates for culture-positive TB in the adult population were: 463 per 100,000
(95% range: 333−592) and 512 per 100,000 (95% range: 420−603), respectively. For smear-pos-
itive culture-positive TB, the estimated adjusted prevalence rates were: 193 per 100,000 (95%
range: 117−269) and 286 per 100,000 (95% range: 223−349) for the 2007 and 2016 surveys,
respectively.
Table 2. Estimated prevalence of smear-positive, and bacteriologically confirmed pulmonary TB among individuals aged�15 years, by sex and age group, 2016
NTPS, Philippines (N = 46,689).
Smear-positive PTBa Bacteriologically confirmed PTBa
(N = 173) (N = 466)
No. Prevalence estimate per 100,000b 95% CI No. Prevalence estimate per 100,000a 95% CI
National 173 434 350–518 466 1,159 1,016–1,301
Sex
Male 125 673 528–819 322 1,713 1,482–1,943
Female 48 205 141–270 144 627 516–739
Age group (in years)
15–24 30 330 197–463 72 799 586–1,011
25–34 24 326 195–458 68 900 677–1,123
35–44 32 470 298–641 76 1,126 821–1,430
45–54 40 665 438–891 103 1,714 1,364–2,064
55–64 24 488 285–691 73 1,504 1,104–1,903
�65 23 503 310–696 74 1,659 1,261–2,058
Stratum
1 81 599 451−747 187 1,358 1,103−1,612
2 19 258 138−378 77 1,038 787−1,288
3 44 471 261−680 111 1,234 873−1,594
4 29 268 173−364 91 856 686−1,026
a PTB: pulmonary TB.b Computed using method 3 (multiple value imputation and inverse probability weighting).
https://doi.org/10.1371/journal.pone.0252240.t002
Table 3. Prevalence-to-case notification (P:N) ratios, 2016 NTPS, Philippinesa.
Category TB case notification rates per
100,000
Estimated prevalence rates per 100,000, 2016
NTPS
P:N ratio
Total�15
years
142 434 3.1
Sex
Male 203 673 3.3
Female 82 205 2.5
Age group (in years)
15−24 78 330 4.2
25−34 116 326 2.8
35−44 155 470 3.0
45−54 204 665 3.3
55−64 232 488 2.1
�65 209 503 2.4
a Notification rates were estimated using smear-positive pulmonary TB notifications (2016) obtained from the
National TB Control Programme, and population estimates from the UN Population Division (2015 revision).
https://doi.org/10.1371/journal.pone.0252240.t003
PLOS ONE National TB prevalence survey of the Philippines, 2016
PLOS ONE | https://doi.org/10.1371/journal.pone.0252240 June 4, 2021 10 / 16

Health-care seeking behaviour of symptomatic participants
Of the 46,689 survey participants, only 2,815 (6.0%) reported having screening symptoms. Of
these, only 534 (19.0%) consulted a healthcare worker, with more women (271/1,162, 23.3%)
seeking care compared to men (263/1,653, 15.9%) (p<0.001). The proportion of participants
aged�65 years seeking care was significantly higher (164/591, 27.7%, p<0.001) compared to
other age groups. No statistically significant difference was seen in the proportion seeking care
between the urban (225/1,272, 17.7%) and rural areas (309/1,543, 20%). Amongst those who
sought formal care, there were twice more who went to public facilities (359, 12.8%) compared
to private providers (166, 5.9%); while only a few went to traditional healers (10, 0.4%). The rest
of the participants either did not take any action (1,143, 40.6%) or self-medicated (1,130, 40.1%).
Amongst 1,653 men and 1,162 women with screening symptoms, more women (502, 43.2%)
self-medicated compared to men (628, 38.0%) (p = 0.005), while more men (759, 45.9%) than
women (384, 33.0%) (p<0.001) did not take action. Out of 2,273 survey participants who pro-
vided�1 reason/s for non-consultation, perceived triviality of symptoms (937, 41.2%), access
issues like cost of travel and distance to the health facility (875, 38.5%), and concern about miss-
ing school or work (169, 7.4%) were the main reasons for not seeking formal health care.
Fig 4 shows the risk factors independently associated with BCTB on multivariable analysis.
Age groups�45 years were at risk for BCTB, with those�65 years old having 2.8 times higher
risk. Other factors significantly associated with TB were: previous TB treatment, self-report of
diabetes mellitus, and residing in an urban setting. Smoking and sex were analyzed as interact-
ing variables, showing that men with more than five pack-years smoking history were 3.5
times more at risk (aOR = 3.5, 95% CI: 1.9−6.3) while women smokers had twice risk than
non-smokers. Surrogate indicators for lower socioeconomic status, such as recipients of the
Philippine government’s conditional cash transfer program for the poorest of the poor (called
Pantawid Pamilyang Pilipino Program, or 4Ps) and absence of health insurance coverage, were
1.6–1.8 times more likely to have TB. Related surrogate indicators, which were analyzed as
interacting variables, showed that households without a refrigerator had 1.7 times the risk of
TB, irrespective of household size.
Fig 4. Risk factors for pulmonary TB among survey participants (N = 46,689)a. aAdjusted odds ratios (aOR) were estimated using survey logistic regression with
stratified cluster design and adjusted for inverse probability weights. 4Ps: Pantawid Pamilyang Pilipino Program, a cash transfer program for the poor.
https://doi.org/10.1371/journal.pone.0252240.g004
PLOS ONE National TB prevalence survey of the Philippines, 2016
PLOS ONE | https://doi.org/10.1371/journal.pone.0252240 June 4, 2021 11 / 16
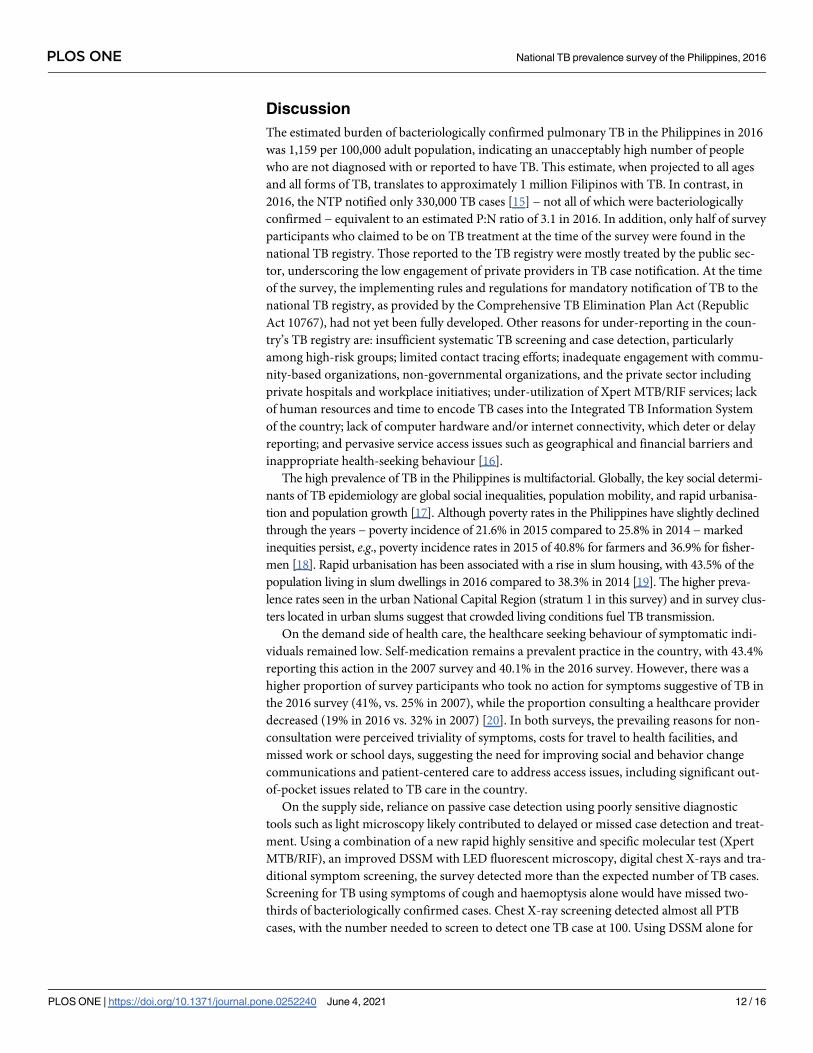
Discussion
The estimated burden of bacteriologically confirmed pulmonary TB in the Philippines in 2016
was 1,159 per 100,000 adult population, indicating an unacceptably high number of people
who are not diagnosed with or reported to have TB. This estimate, when projected to all ages
and all forms of TB, translates to approximately 1 million Filipinos with TB. In contrast, in
2016, the NTP notified only 330,000 TB cases [15] − not all of which were bacteriologically
confirmed − equivalent to an estimated P:N ratio of 3.1 in 2016. In addition, only half of survey
participants who claimed to be on TB treatment at the time of the survey were found in the
national TB registry. Those reported to the TB registry were mostly treated by the public sec-
tor, underscoring the low engagement of private providers in TB case notification. At the time
of the survey, the implementing rules and regulations for mandatory notification of TB to the
national TB registry, as provided by the Comprehensive TB Elimination Plan Act (Republic
Act 10767), had not yet been fully developed. Other reasons for under-reporting in the coun-
try’s TB registry are: insufficient systematic TB screening and case detection, particularly
among high-risk groups; limited contact tracing efforts; inadequate engagement with commu-
nity-based organizations, non-governmental organizations, and the private sector including
private hospitals and workplace initiatives; under-utilization of Xpert MTB/RIF services; lack
of human resources and time to encode TB cases into the Integrated TB Information System
of the country; lack of computer hardware and/or internet connectivity, which deter or delay
reporting; and pervasive service access issues such as geographical and financial barriers and
inappropriate health-seeking behaviour [16].
The high prevalence of TB in the Philippines is multifactorial. Globally, the key social determi-
nants of TB epidemiology are global social inequalities, population mobility, and rapid urbanisa-
tion and population growth [17]. Although poverty rates in the Philippines have slightly declined
through the years − poverty incidence of 21.6% in 2015 compared to 25.8% in 2014 − marked
inequities persist, e.g., poverty incidence rates in 2015 of 40.8% for farmers and 36.9% for fisher-
men [18]. Rapid urbanisation has been associated with a rise in slum housing, with 43.5% of the
population living in slum dwellings in 2016 compared to 38.3% in 2014 [19]. The higher preva-
lence rates seen in the urban National Capital Region (stratum 1 in this survey) and in survey clus-
ters located in urban slums suggest that crowded living conditions fuel TB transmission.
On the demand side of health care, the healthcare seeking behaviour of symptomatic indi-
viduals remained low. Self-medication remains a prevalent practice in the country, with 43.4%
reporting this action in the 2007 survey and 40.1% in the 2016 survey. However, there was a
higher proportion of survey participants who took no action for symptoms suggestive of TB in
the 2016 survey (41%, vs. 25% in 2007), while the proportion consulting a healthcare provider
decreased (19% in 2016 vs. 32% in 2007) [20]. In both surveys, the prevailing reasons for non-
consultation were perceived triviality of symptoms, costs for travel to health facilities, and
missed work or school days, suggesting the need for improving social and behavior change
communications and patient-centered care to address access issues, including significant out-
of-pocket issues related to TB care in the country.
On the supply side, reliance on passive case detection using poorly sensitive diagnostic
tools such as light microscopy likely contributed to delayed or missed case detection and treat-
ment. Using a combination of a new rapid highly sensitive and specific molecular test (Xpert
MTB/RIF), an improved DSSM with LED fluorescent microscopy, digital chest X-rays and tra-
ditional symptom screening, the survey detected more than the expected number of TB cases.
Screening for TB using symptoms of cough and haemoptysis alone would have missed two-
thirds of bacteriologically confirmed cases. Chest X-ray screening detected almost all PTB
cases, with the number needed to screen to detect one TB case at 100. Using DSSM alone for
PLOS ONE National TB prevalence survey of the Philippines, 2016
PLOS ONE | https://doi.org/10.1371/journal.pone.0252240 June 4, 2021 12 / 16

diagnosis missed two-thirds of bacteriologically confirmed cases. Although culture remains
the reference standard for TB diagnosis, Xpert MTB/RIF detected 1.7 times more TB cases
than culture under field survey conditions. This suggests that a combination of community-
based active case detection and intensive case finding among high-risk groups (e.g., particu-
larly male smokers, those with diabetes mellitus, the elderly, poor households, and urban
dwellers) and healthcare settings such as hospitals and private clinics with chest X-ray, screen-
ing for TB symptoms, and fairly rapid molecular diagnostic tests such as Xpert MTB/RIF
could significantly ramp up case finding and treatment. These expanded case-finding and
treatment efforts should be coupled with mandatory notification of TB cases, patient-centered
treatment and support, and contact tracing.
Overall, the 2016 NTPS survey provided nationally representative, precise, and reliable esti-
mates of the prevalence of TB in the country. Multiple layers of external monitoring by the
WHO team, a steering committee led by the NTP that regularly monitored survey operations,
and internal quality management procedures of the project team ensured that the survey was
conducted according to internationally accepted standards. On the other hand, amongst the
limitations of the survey were the 76% participation rate (vs. the target of 85%) as well as the
relatively low rates of chest X-ray participation (88%) and sputum submission (87%). The
lower-than-expected participation rate was due to a number of factors: the campaign period in
the run-up to the local elections in May 2016, work or school priorities of the eligible popula-
tion, several tropical cyclones, and immunization campaigns prioritized by the Department of
Health. To address some of the challenges, we extended survey hours to the evenings and
weekends and/or surveys days in several clusters. Moreover, missing data were accounted for
in the estimation of prevalence through multiple imputation analysis.
Despite the lower-than-expected sputum submission rate, the high volume of sputum speci-
mens submitted to only six reference laboratories led to heavy workloads in the laboratories.
The paucibacillary nature of specimens, logistics and cold storage during specimen transporta-
tion, and laboratory workload may have impacted on culture performance, but laboratory per-
formance quality indicators suggest overall acceptable performance (4.1% contamination rate
and 89.0%% culture-positive among smear-positive samples).
The addition of Xpert MTB/RIF to the 2016 NTPS strengthened the detection of prevalent
TB cases. However, it should be noted that there were 238 BCTB cases who were positive by
Xpert alone. After the survey was completed, a 2017 study of the accuracy of Xpert MTB/RIF
showed that its specificity was lower at 92.7% (95% CI: 82.4−98.0%) for those who reported TB
in the past two or less years [21]. Given that 71 (29.8%) of the 238 reported a history of TB of
�5 years, it is possible that there was some over-diagnosis of TB, with 35 (49.3%) of the 71 hav-
ing a ‘very low’ Xpert semi-quantitative result. On the other hand, amongst the 222 of the 238
who also had a chest X-ray, the vast majority (204, 91.9%) had findings highly suggestive of TB
as confirmed by the Diagnostic and Medical Panel.
Lastly, another limitation was the exclusion of HIV serostatus in the survey. In 2015, during
survey protocol preparation, the reported incidence rate of TB/HIV was 4.3 per 100,000 [3]. At
this level, the sample size and sampling requirements as well as the logistics of HIV pre-test
counseling and testing exceeded the available funds and scope of the 2016 NTPS.
Conclusion and recommendations
The 2016 nationally representative survey showed that TB remains a significant health burden
in the Philippines with no evidence of decline in smear and culture positive TB compared to
the 2007 survey. Reasons for the high TB burden are multifactorial, hence eliminating TB
must be a national and multi-sectoral priority.
PLOS ONE National TB prevalence survey of the Philippines, 2016
PLOS ONE | https://doi.org/10.1371/journal.pone.0252240 June 4, 2021 13 / 16

In alignment with the latest WHO guidance [22], systematic screening of subpopulations
with structural risk factors using Xpert MTB/RIF should be prioritized specifically amongst
men, older age groups, the poor and urban dwellers, those previously treated for TB, smokers,
and those with diabetes mellitus. Engagement with communities, non-governmental organiza-
tions, and the private establishments and work places, will be critical in ramping up active and
intensive case finding efforts. While TB culture remains the reference standard for diagnosis
and is required for drug susceptibility testing, the rapid turnaround of results and accuracy of
Xpert MTB/RIF can potentially decrease pre-treatment loss to follow-up, allow timely initia-
tion of treatment, almost triple the TB cases detected compared to DSSM, and identify
MDR-TB cases early. To ramp up case finding and treatment, laboratory capacity for Xpert
testing should be expanded and decentralized and the supply chain management system
should be strengthened to ensure a steady supply of Xpert cartridges and anti-TB drugs.
Addressing behavioural barriers to healthcare-seeking is central to finding undiagnosed
people with TB, through improved social and behavior change interventions and patient-cen-
tered care. Innovations and implementation research are needed to strengthen behavior
change technology and to support access to care strategies. Social and financial risk protection
should also be priorities as the Philippine government moves towards implementation of the
Universal Health Care Law.
Low notification rates of TB cases by private providers may be addressed by developing
user-friendly applications for reporting to the national registry, creating social contracts with
the private sector and/or civil society groups for upscaling case detection and care services,
and exploring approaches to overcome barriers such as stigma and lack of confidence in the
public sector. Overall, eliminating TB will require comprehensive and sustained poverty allevi-
ation efforts and multi-sectoral partnership at the national and local levels.
Supporting information
S1 Table. Case definition algorithm used by the Diagnostic and Medical Panel.
(DOCX)
Acknowledgments
The following members of the Philippine NTPS 2016 Group are authors of this report: Mary
Ann D. Lansang, Marissa M. Alejandria, Irwin Law, Noel R. Juban, Maria Lourdes E. Amarillo,
Olivia T. Sison, Jose Rene B. Cruz, Concepcion F. Ang, Joseph Adrian L. Buensalido, Johanna
Patricia A. Cañal, Nina T. Castillo-Carandang, Cynthia P. Cordero, Donna Mae G. Gaviola,
Mary Ann J. Ladia, Hilton Y. Lam, Jacinto Blas V. Mantaring III, Myrna T. Mendoza, Maria
Sonia S. Salamat, Marina Tadolini, Anna Marie Celina G. Garfin.
We gratefully acknowledge the overall project management support provided by the Foun-
dation for the Advancement of Clinical Epidemiology, Inc; the dedicated and efficient conduct
of the survey by all survey team members; the participation of the Foundation for the Control
of Infectious Diseases and the Philippine College of Radiology in key workstreams of the sur-
vey; the overall supervision and guidance of the NTPS Steering Committee and the Technical
Working Group; and the expert contributions of the Diagnostic and Medical Panel members.
We also express our gratitude to the Philippines’ Department of Health for the overall coordi-
nation, the survey joint secretariat of the Department of Health and the Philippine Council for
Health Research and Development, the local government units for graciously facilitating the
logistics of the survey, and the University of the Philippines Manila for administrative support.
Special thanks are due to members of the WHO Global Task Force on Impact Measurement,
PLOS ONE National TB prevalence survey of the Philippines, 2016
PLOS ONE | https://doi.org/10.1371/journal.pone.0252240 June 4, 2021 14 / 16

the WHO Country Office, and the WHO Western Pacific Regional Office for providing expert
technical assistance.
This paper is dedicated to the memory of Dr. Thelma Tupasi†— project leader of the Philip-
pine 1997 and 2007 national TB prevalence surveys, staunch TB advocate and leader in the
Philippines and internationally, and trailblazer in person-centered MDR-TB care.
Author Contributions
Conceptualization: Mary Ann D. Lansang, Marissa M. Alejandria, Irwin Law, Noel R. Juban,
Anna Marie Celina G. Garfin.
Data curation: Maria Lourdes E. Amarillo, Olivia T. Sison, Cynthia P. Cordero.
Formal analysis: Mary Ann D. Lansang, Marissa M. Alejandria, Irwin Law, Noel R. Juban,
Maria Lourdes E. Amarillo, Olivia T. Sison, Jose Rene B. Cruz, Joseph Adrian L. Buensalido,
Johanna Patricia A. Cañal, Nina T. Castillo-Carandang, Donna Mae G. Gaviola, Mary Ann
J. Ladia, Myrna T. Mendoza, Maria Sonia S. Salamat.
Funding acquisition: Mary Ann D. Lansang, Jacinto Blas V. Mantaring, III, Hilton Y. Lam,
Anna Marie Celina G. Garfin.
Investigation: Mary Ann D. Lansang, Marissa M. Alejandria, Noel R. Juban, Maria Lourdes E.
Amarillo, Olivia T. Sison, Jose Rene B. Cruz, Concepcion F. Ang, Joseph Adrian L. Buensa-
lido, Johanna Patricia A. Cañal, Nina T. Castillo-Carandang, Mary Ann J. Ladia, Myrna T.
Mendoza, Maria Sonia S. Salamat.
Methodology: Mary Ann D. Lansang, Marissa M. Alejandria, Irwin Law, Noel R. Juban, Maria
Lourdes E. Amarillo, Olivia T. Sison, Concepcion F. Ang, Nina T. Castillo-Carandang, Cyn-
thia P. Cordero, Mary Ann J. Ladia, Myrna T. Mendoza, Anna Marie Celina G. Garfin.
Project administration: Mary Ann D. Lansang, Jacinto Blas V. Mantaring, III, Hilton Y. Lam.
Resources: Mary Ann D. Lansang, Jacinto Blas V. Mantaring, III, Hilton Y. Lam, Anna Marie
Celina G. Garfin.
Software: Maria Lourdes E. Amarillo, Olivia T. Sison.
Supervision: Mary Ann D. Lansang, Marissa M. Alejandria, Noel R. Juban, Maria Sonia S.
Salamat.
Validation: Irwin Law, Cynthia P. Cordero, Marina Tadolini.
Visualization: Maria Lourdes E. Amarillo, Olivia T. Sison, Jose Rene B. Cruz.
Writing – original draft: Mary Ann D. Lansang, Marissa M. Alejandria, Irwin Law.
Writing – review & editing: Mary Ann D. Lansang, Irwin Law, Noel R. Juban, Maria Lourdes
E. Amarillo, Olivia T. Sison, Jose Rene B. Cruz, Concepcion F. Ang, Joseph Adrian L. Buen-
salido, Johanna Patricia A. Cañal, Nina T. Castillo-Carandang, Cynthia P. Cordero, Donna
Mae G. Gaviola, Mary Ann J. Ladia, Jacinto Blas V. Mantaring, III, Myrna T. Mendoza,
Maria Sonia S. Salamat, Hilton Y. Lam, Marina Tadolini, Anna Marie Celina G. Garfin.
References1. World Health Organization. Global tuberculosis report 2020. Geneva: World Health Organization;
2020. Available from: https://apps.who.int/iris/bitstream/handle/10665/336069/9789240013131-eng.
PLOS ONE National TB prevalence survey of the Philippines, 2016
PLOS ONE | https://doi.org/10.1371/journal.pone.0252240 June 4, 2021 15 / 16

2. GBD Tuberculosis Collaborators. The burden of tuberculosis: results from the Global Burden of Disease
Study 2015. Lancet Infect Dis. 2018. 18:261–84. https://doi.org/10.1016/S1473-3099(17)30703-X
PMID: 29223583
3. World Health Organization. Global tuberculosis report 2016. Geneva: World Health Organization;
2016. Available from: https://apps.who.int/iris/bitstream/handle/10665/250441/9789241565394-eng.
pdf?sequence=1
4. National Institute of Tuberculosis, Philippines. Report on a national tuberculosis prevalence survey in
the Republic of the Philippines (1981–1984). National Institute of Tuberculosis, Philippines. 1984.
5. Tupasi TE, Radhakrishna S, Rivera AB, Pascual ML, Quelapio MI, Co VM, et al. The 1997 nationwide
tuberculosis prevalence survey in the Philippines. Int J Tuberc Lung Dis. 1999; 3:471–7. PMID:
10383058
6. Tupasi TE, Radhakrishna S, Chua JA, Mangubat NV, Guilatco R, Galipot M, et al. Significant decline in
the tuberculosis burden in the Philippines ten years after initiating DOTS. Int J Tuberc Lung Dis. 2009;
13:1224–30. PMID: 19793426
7. Department of Health, Philippines. Joint Tuberculosis Program Review, Philippines, 2013. National TB
Control Program, Department of Health, Manila, Philippines. 2014. Available from: http://www.ntp.doh.
gov.ph/downloads/publications/assessment_reports/JPR_2013.pdf
8. World Health Organization. Health in 2015: from MDGs, Millennium Development Goals to SDGs, Sus-
tainable Development Goals. Geneva: World Health Organization; 2015. Available from: https://apps.
who.int/iris/handle/10665/200009
9. World Health Organization. Tuberculosis prevalence surveys: a handbook. Geneva: World Health
Organization; 2011. Available from: https://apps.who.int/iris/bitstream/handle/10665/44481/
9789241548168_eng.pdf?sequence=1
10. Department of Health Philippines. National Tuberculosis Control Program manual of procedures. 5th
ed. Manila, Department of Health. 2014.
11. Dean AG, Arner TG, Sunki GG, Friedman R, Lanting M, Sangam S. et al. Epi InfoTM, a database and
statistics program for public health professionals. Atlanta, GA: Centers for Disease Control. 2011.
12. Floyd S, Sismanidis C, Yamada N, Daniel R, Lagahid J, Mecatti F, et al. Analysis of tuberculosis preva-
lence surveys: new guidance on best-practice methods. Emerging Themes in Epidemiology. 2013;
10:10. https://doi.org/10.1186/1742-7622-10-10 PMID: 24074436
13. Borgdorff MW. New measurable indicator for tuberculosis case detection. Emerg Infect Dis. 2004;
10:1523−1528. https://doi.org/10.3201/eid1009.040349 PMID: 15498151
14. Philippine Statistics Authority. Philippine population density (based on the 2015 census of population).
Reference No. 2016–130. Manila, Philippines. September 1, 2016. Available from: https://psa.gov.ph/
content/philippine-population-density-based-2015-census-population
15. Garfin C, Mantala M, Yadav R, Hanson CL, Osberg M, Hymoff A, et al. Using patient pathway analysis
to design patient-centered referral networks for diagnosis and treatment of tuberculosis: the case of the
Philippines. J Infect Dis. 2017; 216(S7):S740−7. https://doi.org/10.1093/infdis/jix391 PMID: 29117352
16. Department of Health, Philippines. Joint Tuberculosis Program Review, Philippines, 2016. National TB
Control Program, Department of Health, Manila, Philippines. 2017. Available from: http://www.ntp.doh.
gov.ph/downloads/publications/assessment_reports/JPR_2016.pdf
17. Hargreaves JR, Boccia D, Evans CA, Adato M, Petticrew M, Porter JDH. The social determinants of
tuberculosis: from evidence to action. Am J Public Health. 2011; 101:654–662. https://doi.org/10.2105/
AJPH.2010.199505 PMID: 21330583
18. Philippine Statistics Authority. Farmers, fisherfolks, individuals residing in rural areas and children
posted the highest poverty incidences among the basic sectors in 2018. Reference No. 2020–092.
Manila, Philippines. June 3, 2020. Available from: https://psa.gov.ph/poverty-press-releases/nid/
162541
19. The World Bank. World Development Indicator: Sustainable Development Goals dashboard, Philip-
pines. Available from: https://datatopics.worldbank.org/sdgs/SDG-selected-indicators.html
20. Tropical Disease Foundation and Department of Health. Nationwide tuberculosis prevalence survey
2007. Navotas City, Philippines: Tropical Disease Foundation and Department of Health, 2008.
21. Dorman SE, Schumacher SG, Alland D, Nabeta P, Armstrong DT, King B, et al. Xpert MTB/RIF Ultra
for detection of Mycobacterium tuberculosis and rifampicin resistance: a prospective multicentre diag-
nostic accuracy study. Lancet Infect Dis. 2018; 18:76−84. https://doi.org/10.1016/S1473-3099(17)
30691-6 PMID: 29198911
22. World Health Organization. WHO consolidated guidelines on tuberculosis. Module 2: screening − sys-
tematic screening for tuberculosis disease. Geneva: World Health Organization; 2021. Available from:
https://reliefweb.int/sites/reliefweb.int/files/resources/9789240022676-eng.pdf
PLOS ONE National TB prevalence survey of the Philippines, 2016
PLOS ONE | https://doi.org/10.1371/journal.pone.0252240 June 4, 2021 16 / 16
Copyright © 2022 FDOKUMEN