Systemic multicompartmental effects of the gut microbiome on mouse metabolic phenotypes
14
Systemic multicompartmental effects of the gut microbiome on mouse metabolic phenotypes Sandrine P Claus 1 , Tsz M Tsang 1 , Yulan Wang 2 , Olivier Cloarec 1 , Eleni Skordi 1 , Franc ¸ ois-Pierre Martin 3 , Serge Rezzi 3 , Alastair Ross 3 , Sunil Kochhar 3 , Elaine Holmes 1 and Jeremy K Nicholson 1, * 1 SORA Division, Department of Biomolecular Medicine, Imperial College London, London, UK, 2 State Key Laboratory of Magnetic Resonance and Atomic and Molecular Physics, Wuhan Centre for Magnetic Resonance, Wuhan Institute of Physics and Mathematics, The Chinese Academy of Sciences, Wuhan, PR China and 3 BioAnalytical Science Department, Nestle ´ Research Center, Lausanne, Switzerland * Corresponding author. SORA Division, Department of Biomolecular Medicine, Imperial College London, Sir Alexander Fleming Building, South Kensington, London SW7 2AZ, UK. Tel.: þ 44 (0)207 594 3195; Fax: þ 44 (0)207 594 3221; E-mail: [email protected] Received 24.4.08; revised 15.7.08 To characterize the impact of gut microbiota on host metabolism, we investigated the multi- compartmental metabolic profiles of a conventional mouse strain (C3H/HeJ) (n¼5) and its germ- free (GF) equivalent (n¼5). We confirm that the microbiome strongly impacts on the metabolism of bile acids through the enterohepatic cycle and gut metabolism (higher levels of phosphocholine and glycine in GF liver and marked higher levels of bile acids in three gut compartments). Furthermore we demonstrate that (1) well-defined metabolic differences exist in all examined compartments between the metabotypes of GF and conventional mice: bacterial co-metabolic products such as hippurate (urine) and 5-aminovalerate (colon epithelium) were found at reduced concentrations, whereas raffinose was only detected in GF colonic profiles. (2) The microbiome also influences kidney homeostasis with elevated levels of key cell volume regulators (betaine, choline, myo- inositol and so on) observed in GF kidneys. (3) Gut microbiota modulate metabotype expression at both local (gut) and global (biofluids, kidney, liver) system levels and hence influence the responses to a variety of dietary modulation and drug exposures relevant to personalized health-care investigations. Molecular Systems Biology 14 October 2008; doi:10.1038/msb.2008.56 Subject Categories: metabolic and regulatory networks; microbiology and pathogens Keywords: germ-free; gut microbiota; metabolism; metabonomics This is an open-access article distributed under the terms of the Creative Commons Attribution Licence, which permits distribution and reproduction in any medium, provided the original author and source are credited. Creation of derivative works is permitted but the resulting work may be distributed only under the same or similar licence to this one. This licence does not permit commercial exploitation without specific permission. Introduction The gut microbiota (microbiome) form a complex and dynamic ecosystem that constantly interacts with host metabolism (Dunne, 2001; Hooper and Gordon, 2001; Bour- lioux et al, 2003). The microbiome provides trophic (Hooper and Gordon, 2001) and protective (Umesaki and Setoyama, 2000) functions and impact on the host’s energy metabolism (Savage, 1986), facilitating the absorption of complex carbo- hydrates (fiber breakdown) and influencing the homeostasis of amino acids (Hooper et al, 2002). For example in humans, 1–20% of the circulating plasma lysine and threonine are derived from gut bacterial synthesis (Metges, 2000). The microbiota also synthesize essential vitamins such as vitamin K (Hooper et al, 2002) and group B vitamins (Burkholder and McVeigh, 1942). These close symbiotic relationships are the result of co-evolutionary processes, through which natural selection has promoted the host genotypes that provide well- adapted adhesion sites for specific microorganisms (Ba ¨ckhed et al, 2005). In total, the mammalian symbiotic superorganism can contain significantly more active DNA in the fan of genes from the microbiome than in the host genome (Nicholson et al, 2005). Indeed, the symbiotic microbiotal speciation of some invertebrates (e.g. plataspid insects) has been shown to be closely connected with host evolution and take control of many metabolic functions resulting in host genome reduction (Hosokawa et al, 2006). The indigenous microbiota of mammals also strongly influences the metabolism of many drugs and nutrients, modifying both their bioavailability and metabolic fate (Nicholson et al, 2005). For example, phytoes- trogens are metabolized into active compounds by gut microbiota (Setchell, 1998; Atkinson et al, 2005). But despite their evident important contribution to host biology and function, some bacterial species contained in the gut also have the potential to generate carcinogens or can be the source of opportunistic infections (Berg, 1996). For instance, & 2008 EMBO and Macmillan Publishers Limited Molecular Systems Biology 2008 1 Molecular Systems Biology 4; Article number 219; doi:10.1038/msb.2008.56 Citation: Molecular Systems Biology 4:219 & 2008 EMBO and Macmillan Publishers Limited All rights reserved 1744-4292/08 www.molecularsystemsbiology.com
Transcript of Systemic multicompartmental effects of the gut microbiome on mouse metabolic phenotypes

Systemic multicompartmental effects of the gutmicrobiome on mouse metabolic phenotypes
Sandrine P Claus1, Tsz M Tsang1, Yulan Wang2, Olivier Cloarec1, Eleni Skordi1, Francois-Pierre Martin3, Serge Rezzi3, Alastair Ross3,Sunil Kochhar3, Elaine Holmes1 and Jeremy K Nicholson1,*
1 SORA Division, Department of Biomolecular Medicine, Imperial College London, London, UK, 2 State Key Laboratory of Magnetic Resonance and Atomic andMolecular Physics, Wuhan Centre for Magnetic Resonance, Wuhan Institute of Physics and Mathematics, The Chinese Academy of Sciences, Wuhan, PR China and3 BioAnalytical Science Department, Nestle Research Center, Lausanne, Switzerland* Corresponding author. SORA Division, Department of Biomolecular Medicine, Imperial College London, Sir Alexander Fleming Building, South Kensington, LondonSW7 2AZ, UK. Tel.: þ 44 (0)207 594 3195; Fax: þ 44 (0)207 594 3221; E-mail: [email protected]
Received 24.4.08; revised 15.7.08
To characterize the impact of gut microbiota on host metabolism, we investigated the multi-compartmental metabolic profiles of a conventional mouse strain (C3H/HeJ) (n¼5) and its germ-free (GF) equivalent (n¼5). We confirm that the microbiome strongly impacts on the metabolism ofbile acids through the enterohepatic cycle and gut metabolism (higher levels of phosphocholine andglycine in GF liver and marked higher levels of bile acids in three gut compartments). Furthermorewe demonstrate that (1) well-defined metabolic differences exist in all examined compartmentsbetween the metabotypes of GF and conventional mice: bacterial co-metabolic products such ashippurate (urine) and 5-aminovalerate (colon epithelium) were found at reduced concentrations,whereas raffinose was only detected in GF colonic profiles. (2) The microbiome also influenceskidney homeostasis with elevated levels of key cell volume regulators (betaine, choline, myo-inositol and so on) observed in GF kidneys. (3) Gut microbiota modulate metabotype expression atboth local (gut) and global (biofluids, kidney, liver) system levels and hence influence the responsesto a variety of dietary modulation and drug exposures relevant to personalized health-careinvestigations.Molecular Systems Biology 14 October 2008; doi:10.1038/msb.2008.56Subject Categories: metabolic and regulatory networks; microbiology and pathogensKeywords: germ-free; gut microbiota; metabolism; metabonomics
This is an open-access article distributed under the terms of the Creative Commons Attribution Licence,which permits distribution and reproduction in any medium, provided the original author and source arecredited. Creation of derivative works is permitted but the resulting work may be distributed only under thesame or similar licence to this one. This licence does not permit commercial exploitation without specificpermission.
Introduction
The gut microbiota (microbiome) form a complex anddynamic ecosystem that constantly interacts with hostmetabolism (Dunne, 2001; Hooper and Gordon, 2001; Bour-lioux et al, 2003). The microbiome provides trophic (Hooperand Gordon, 2001) and protective (Umesaki and Setoyama,2000) functions and impact on the host’s energy metabolism(Savage, 1986), facilitating the absorption of complex carbo-hydrates (fiber breakdown) and influencing the homeostasisof amino acids (Hooper et al, 2002). For example in humans,1–20% of the circulating plasma lysine and threonine arederived from gut bacterial synthesis (Metges, 2000). Themicrobiota also synthesize essential vitamins such as vitaminK (Hooper et al, 2002) and group B vitamins (Burkholder andMcVeigh, 1942). These close symbiotic relationships are theresult of co-evolutionary processes, through which naturalselection has promoted the host genotypes that provide well-
adapted adhesion sites for specific microorganisms (Backhedet al, 2005). In total, the mammalian symbiotic superorganismcan contain significantly more active DNA in the fan of genesfrom the microbiome than in the host genome (Nicholson et al,2005). Indeed, the symbiotic microbiotal speciation of someinvertebrates (e.g. plataspid insects) has been shown to beclosely connected with host evolution and take control ofmany metabolic functions resulting in host genome reduction(Hosokawa et al, 2006). The indigenous microbiota ofmammals also strongly influences the metabolism of manydrugs and nutrients, modifying both their bioavailability andmetabolic fate (Nicholson et al, 2005). For example, phytoes-trogens are metabolized into active compounds by gutmicrobiota (Setchell, 1998; Atkinson et al, 2005). Butdespite their evident important contribution to host biologyand function, some bacterial species contained in the gut alsohave the potential to generate carcinogens or can be thesource of opportunistic infections (Berg, 1996). For instance,
& 2008 EMBO and Macmillan Publishers Limited Molecular Systems Biology 2008 1
Molecular Systems Biology 4; Article number 219; doi:10.1038/msb.2008.56Citation: Molecular Systems Biology 4:219& 2008 EMBO and Macmillan Publishers Limited All rights reserved 1744-4292/08www.molecularsystemsbiology.com

Helicobacter pylori is well known to be part of the commensalflora of the stomach that can cause gastritis, gastriculcers and, in some cases, gastric cancer (Amieva andEl-Omar, 2008).
We have recently demonstrated a close relationship betweenthe metabolism of gut microbiota and the susceptibility ofrodents to insulin resistance in high-fat diet studies (Dumaset al, 2006a). In this context, recent works have shown thateven subtle changes in the gut microbiota have an impact onthe host phenotype (Holmes and Nicholson, 2005; Roboskyet al, 2005; Rohde et al, 2007). Other investigations havedemonstrated the close link between obesity and gut micro-biota in human and mice (Backhed et al, 2004, 2007; Ley et al,2006; Turnbaugh et al, 2006).
Germ-free (GF) animal studies have been widely used as asource of knowledge on the gut microbiota contributions tohost homeostatic controls (Wostmann, 1981). GF mice displayunusual gut morphology, i.e. larger cecum, thinner intestinalvilli, when compared with conventional animals as well asphysiological and immunological abnormalities, i.e. lowerperistalsis, decreased inflammatory responses (Berg, 1996).GF animals have also been used to observe the developmentalmechanisms of the gastrointestinal tract in interaction with thegut microbiota (Bates et al, 2006). However, despite theextensive use of GF models, the exact mechanisms involved inthe morphologic, physiologic and immunologic modificationsin GF animals remain unclear. The characterization of themetabolic differences between conventional and GF mice is,therefore, an essential step toward better understanding theinteraction between host and gut microbiota.
Metabonomic approaches combining spectroscopic profil-ing techniques with pattern recognition analysis have proveduseful in the assessment of the systemic metabolic responsesof organisms to drugs or nutrients (Nicholson et al, 2002;Lindon et al, 2004; Dumas et al, 2006b; Rezzi et al, 2007). Thisapproach has been successfully applied on biofluids and intactintestinal tissues in rodents to demonstrate the involvement ofmicrobiota in the mammalian metabolism (Nicholls et al,2003; Wang et al, 2005; Martin et al, 2006). In addition,metabonomic approaches have been recently used to demon-strate that hippurate excretion, a marker of gut microbiotalactivity in protein catabolism to benzoate, varies betweennormal and obese rats (Williams et al, 2005) and the close linkbetween gut microbiota and fatty liver phenotype in insulin-resistant mice (Dumas et al, 2006a).
In the current study, we employed a high-resolution 1H NMRspectroscopic approach to investigate the metabolic pheno-type, or metabotype (Gavaghan et al, 2000), of GF mice fromurine and tissues (gut, liver and kidney) and to determine thebiochemical consequences of the absent microbiome on thesebiological matrices.
Results
Spectra from biofluids and tissue aqueous extracts containprominent signals from metabolites representing numerousmajor metabolic pathways. For each analyzed biologicalmatrix, a typical spectrum obtained from a conventional anda GF mouse is displayed (Figures 1A and B, 2A and B, 3A and B,
4A and B, and 5A and B) and Table I shows the NMRassignment and corresponding resonance multiplicity. Thesummaries of all statistical models are shown in Table II. Themain metabolic differences in GF group were summarized forall biological matrices in Table III.
Urine
The urine profile was characterized by high levels of taurine, 2-oxoglutarate, trimethylamine (TMA), citrate and succinate aspreviously reported (Bollard et al, 2005) (Figure 1A and B).The urinary profile of GF mice was characterized by low levelsof hippurate, phenylacetylglycine (PAG), phenolic metabo-lites, 4-hydroxypropionic acid (4-HPP), 3-hydroxycinnamicacid (3-HCA) and N-acetylated glycoprotein signal and amarked high level of creatinine (Figure 1C).
Liver
Glucose resonances (d 3.25–3.84) were predominant in theliver profile, which was also dominated by high levels oftaurine and trimethylamine-N-oxide (TMAO) (Figure 2A andB). The oxidized glutathione (GSSG) pattern was readilyidentified in the one-dimensional (1D) spectrum. It is possibleto differentiate between the reduced (GSH) and the oxidized(GSSG) forms of glutathione by 2D NMR because theresonances of the magnetically non-equivalent protons of thecysteine b-CH2 residue in GSH (d 2.95) shift to high frequencyin GSSG (d 3.29 and 2.95) (Koga et al, 1986). The statisticalmodel built from all liver spectra displayed an outlier in the GFgroup (data not shown). This highly dilute sample wasremoved from the subsequent analysis and the model wasrecalculated with four individuals in the GF group against fiveindividuals in the conventional group. The metabolite profileof the liver from GF mice exhibited significant higher levels ofTMAO and phosphocholine. Not significant higher levels oftauro-conjugated bile acids and glycine were noted in the GFmouse profile (Figure 2C). In addition, a lower level of GSSGtogether with a higher level of hypotaurine was observed in theliver of two GF animals.
Kidney
The kidney 1H NMR profiles were dominated by osmoprotec-tant compounds such as myo-inositol, glycine, betaine, cholineand taurine (Yancey, 2005) (Figure 3A and B). The metaboliteprofile of the kidney from GF mice was characterized by higherlevels of betaine, choline, myo-inositol, scyllo-inositol, etha-nolamine, inosine and an unknown compound (U1) in thearomatic region of the spectra (d 7.14 (d) and d 7.30 (d))(Figure 3C).
Gut compartments
Duodenum, jejunum and ileum were all characterized by highlevels of tyrosine when compared with the other tissue extracts(Figure 4A, B; Supplementary Figures S1A and B, and S2A andB) together with creatine and taurine, a feature shared with thecolon (Figure 5A and B). The colonic metabolite profile wascharacterized by high levels of myo-inositol and scyllo-inositol,
Gut microbiota and host metabolismSP Claus et al
2 Molecular Systems Biology 2008 & 2008 EMBO and Macmillan Publishers Limited

as previously described (Martin et al, 2007b) (Figure 5A).Globally, these gut profiles also displayed similar patterns tothose observed in human biopsies (Wang et al, 2007). Tauro-conjugated bile acids were observed only in duodenum, ileumand jejunum profiles.
Aqueous extract profiles of gut tissues from GF mice weremarkedly different to those from conventional mice (Figures4C and 5C; Supplementary Figures S1C and S2C). Themetabolite profile of the duodenum from GF mice was mainlycharacterized by higher levels of tauro-conjugated bile acidsand alanine and lower levels of glycerophosphocholine (GPC)when compared with conventional mice (Supplementary
Figure S1C). Two highly diluted samples in the jejunumprofiles of the GF group were outliers and hence orthogonalprojection on latent structures (O-PLS-DA) correlation coeffi-cients (r2) were not significant (Supplementary Figure S2C).However, the GF group had higher levels of creatine and tauro-conjugated bile acids and lower levels of tyrosine in the jejunaltissue (Supplementary Figure S2C). The ileum of GF mice wasalso characterized by a higher level of tauro-conjugated bileacids and lower levels of glutamate, fumarate, lactate,phosphocholine and alanine when compared with the ileumfrom conventional mice (Figure 4C). Finally, when comparedwith conventional mice, the metabolite profile of the colon
1951
53
18
17
Conventional
Germ free
8.5 8.0 7.5 7.0 6.5 4.0 3.5 3.0 2.5 2.0 1.5 1.0
20
30
55
Mixedamino acids
-CHs
2120
32
303145 5 5
4
47
502
1518
52
2
16
42
1/36/37
36
842 1
Nac
1/36/37
47
50
2
52
36
1817
Mixedamino acid
-CHs
19 16 2
53
27
42 8
7
21
1
15
Nac
42
18
Glucose
17
17Germ free
22
320
0.1
0.2
0.3
0.4
0.5
0.6
0.7
0.8
0.9r 2
5152
Conventional
455
4 5 Nac
7.5 7 4 3 2 1
δ1H (p.p.m.)
δ1H (p.p.m.)
Figure 1 1H NMR spectra (600 MHz) of urine samples from germ-free (GF) (A) and conventional (B) mice. The aromatic region (d 6.5–9.0) has been verticallyexpanded � 4. (C) Plot of O-PLS-DA coefficients related to the discrimination between 1H NMR spectra of urine from GF (top) and conventional (bottom) mice.For identification of the peak numbers, refer to codes in Table II.
Gut microbiota and host metabolismSP Claus et al
& 2008 EMBO and Macmillan Publishers Limited Molecular Systems Biology 2008 3

from GF mice revealed a higher level in a complex carbo-hydrate identified as raffinose (Supplementary Figure S3), andlower levels of lactate, creatine, 5-aminovalerate, propionate,glutamine, myo-inositol, scyllo-inositol (Moreno and Arus,1996), GPC, phosphocholine, choline, formate, uracil andfumarate (Figure 5C).
Discussion
In this study, the metabotypes derived from different biologicalmatrices from GF and conventional mice were characterized(Nicholson et al, 2002; Lindon et al, 2004) and it was showedthat the metabolic impact of the microbiota extended beyondthe intestinal tissue and biofluids to major organs such as theliver and kidney.
Evidence of gut microbiota re-processingof dietary metabolites
A major source of the intestinal metabolites is produced fromdietary nutrients by both the intestinal cells and the gutmicrobiota. This production occurs mainly in the first 25% ofthe small intestine for amino acids, and in cecum and colon forfatty acids (Hooper et al, 2002). Here, metabolic variations inresponse to gut microbial activity are observed in thebiochemical profiles of intestinal tissue extracts with increas-ing effect along the continuous gastrointestinal tract. Morespecifically, it was observed that duodenum and jejunumdisplayed fewer metabolic differences between GF andconventional mice, whereas ileum and particularly colon werethe most affected (Table III). This reflects the higher microbialloads found in ileum and colon (Dunne, 2001). In particular,
Conventional
35
35
29
22
43
46
2143
58
55/58954
33
35/9
57
3355/58
9
Glucose
38
51
53
50
38
10 5936/39
3826 2525
2614
Germ free
29
22
46
43
9
35 35/9
43
57
3355/58
54
3321
9
58
55/58
35
38
Glucose51
53
14
26
34
34
26 25 50
26 25 8
5910
38
36/393
6.07.08.0 1.01.52.02.53.03.54.09.0 5.0
δ 1H (p.p.m.)
δ 1H (p.p.m.)
Germ free
Conventional
53
34
27
44
34
44
13
26
12340
0.1
0.2
0.3
0.4
0.5
0.6
0.7
0.8
0.9r 2
Figure 2 1H NMR spectra (600 MHz) of liver aqueous extracts of germ-free (GF) (A) and conventional (B) mice. The aromatic region (d 6.5–9.0) has been verticallyexpanded � 4. (C) Plot of O-PLS-DA coefficients related to the discrimination between 1H NMR spectra of urine from GF (top) and conventional (bottom) mice.For identification of the peak numbers, refer to codes in Table II.
Gut microbiota and host metabolismSP Claus et al
4 Molecular Systems Biology 2008 & 2008 EMBO and Macmillan Publishers Limited

5-aminovalerate was not observed in colon aqueous extractprofiles of GF animals, which is consistent with its reportedcharacterization as a product of protein degradation by severalanaerobic bacteria, particularly clostridial strains (Figure 5C)(Barker, 1981; Barker et al, 1987). 5-Aminovalerate is degradedto acetate, ammonia and propionate. A higher concentration ofpropionate also observed in colon profile of conventional miceis consistent with the higher concentration of 5-aminovalerate.
More evidence of the crucial role of gut bacteria in thedigestion of dietary nutrients is seen in the lower urinary levelof several microbial co-metabolites (hippurate, 4-HPP and 3-HCA) in GF mice (Figure 1C). Indeed, it has been reported thatgut microbiota are able to metabolize polyphenols, such aschlorogenic acids, into more absorbable compounds such as 4-HPP, 3-HCA and benzoic acid (Goodwin et al, 1994; Manachet al, 2004). Benzoic acid is then detoxified through conjuga-tion with glycine in the liver and the kidney to form hippurate(benzoylglycine), a more hydrophilic metabolite that is thensecreted by the renal tubular cells and excreted in the urine
(Goodwin et al, 1994; Williams et al, 2002; Nicholls et al,2003). Another microbial co-metabolite, PAG, was also foundin lower concentration in the urinary profile of GF animals(Figure 1C), illustrating that microorganisms are crucial actorsin the production of these urinary metabolites through themodulation of food processing.
Evidence of the host–gut bacterial metabolicinteraction: bile acid co-metabolism
The metabolism and synthesis of the major bile acids areanother example of mammalian–microbiotal co-metabolismthat has been reported recently as crucial in determining thehost phenotype (Martin et al, 2007a). In the present study, themetabolite profiles of duodenum, jejunum and ileum(Figure 4C) were all characterized by a higher concentrationof tauro-conjugated bile acids in GF mice, which is notapparent in the colon profile (Figure 5C). In conventional animals,tauro- and glycine-conjugated bile acids are deconjugated by
Germ free
22
38
41
123558
43439
35
54
3321
33
57 22
4151
Mixedamino acids
-CHs
44
49
46
Conventional14
16 11
50
24/25
2425
840
38
5936/39
12
4059
36/39
38
108
5024/25
242534
1116
1444
19
5141
22
12
41
Mixedamino acids
-CHs
38
2257
2135
43
5446
58
43
33
339
35
6.07.08.0 1.01.52.02.53.03.54.0
δ 1H (p.p.m.)
δ 1H (p.p.m.)
12
0
0.1
0.2
0.3
0.4
0.5
0.6
0.7
0.8
0.935
U1 35
41
12
14
1941
Germ free
1238 7 6 4
Conventional
10
49
19
r 2
Figure 3 1H NMR spectra (600 MHz) of kidney aqueous extracts of germ-free (GF) (A) and conventional (B) mice. The aromatic region (d 6.5–9.0) has been verticallyexpanded � 4. (C) Plot of O-PLS-DA coefficients related to the discrimination between 1H NMR spectra of urine from GF (top) and conventional (bottom) mice.For identification of the peak numbers, refer to codes in Table II.
Gut microbiota and host metabolismSP Claus et al
& 2008 EMBO and Macmillan Publishers Limited Molecular Systems Biology 2008 5
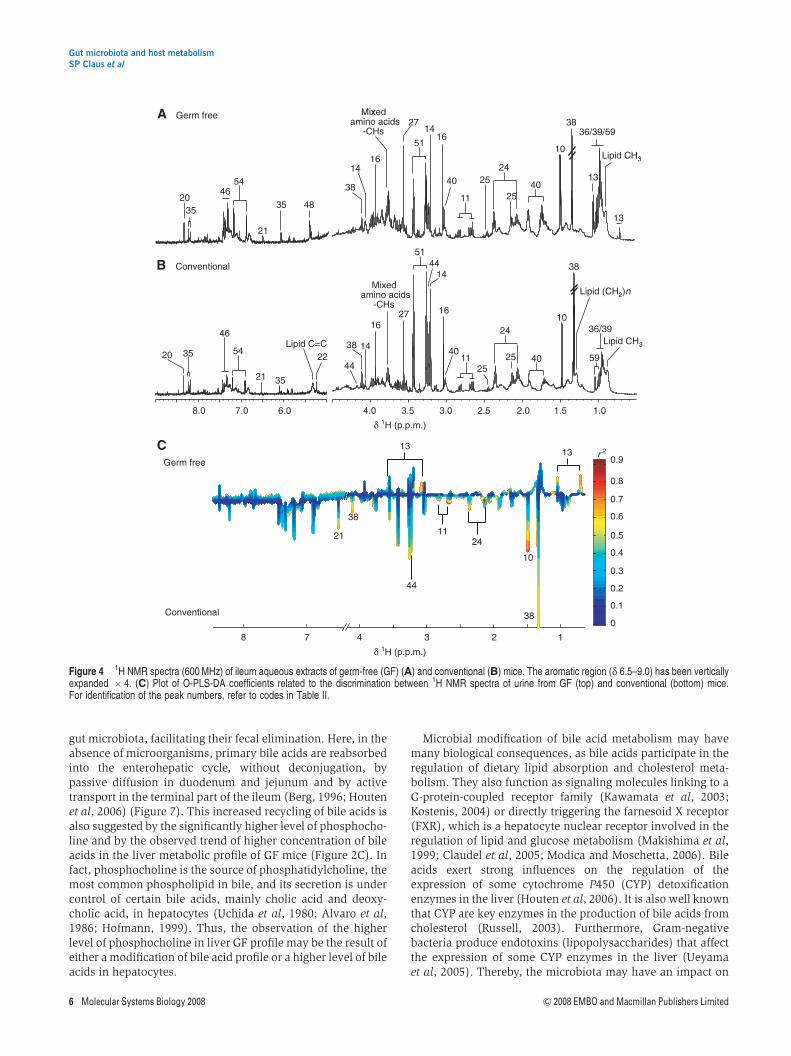
gut microbiota, facilitating their fecal elimination. Here, in theabsence of microorganisms, primary bile acids are reabsorbedinto the enterohepatic cycle, without deconjugation, bypassive diffusion in duodenum and jejunum and by activetransport in the terminal part of the ileum (Berg, 1996; Houtenet al, 2006) (Figure 7). This increased recycling of bile acids isalso suggested by the significantly higher level of phosphocho-line and by the observed trend of higher concentration of bileacids in the liver metabolic profile of GF mice (Figure 2C). Infact, phosphocholine is the source of phosphatidylcholine, themost common phospholipid in bile, and its secretion is undercontrol of certain bile acids, mainly cholic acid and deoxy-cholic acid, in hepatocytes (Uchida et al, 1980; Alvaro et al,1986; Hofmann, 1999). Thus, the observation of the higherlevel of phosphocholine in liver GF profile may be the result ofeither a modification of bile acid profile or a higher level of bileacids in hepatocytes.
Microbial modification of bile acid metabolism may havemany biological consequences, as bile acids participate in theregulation of dietary lipid absorption and cholesterol meta-bolism. They also function as signaling molecules linking to aG-protein-coupled receptor family (Kawamata et al, 2003;Kostenis, 2004) or directly triggering the farnesoid X receptor(FXR), which is a hepatocyte nuclear receptor involved in theregulation of lipid and glucose metabolism (Makishima et al,1999; Claudel et al, 2005; Modica and Moschetta, 2006). Bileacids exert strong influences on the regulation of theexpression of some cytochrome P450 (CYP) detoxificationenzymes in the liver (Houten et al, 2006). It is also well knownthat CYP are key enzymes in the production of bile acids fromcholesterol (Russell, 2003). Furthermore, Gram-negativebacteria produce endotoxins (lipopolysaccharides) that affectthe expression of some CYP enzymes in the liver (Ueyamaet al, 2005). Thereby, the microbiota may have an impact on
38
1016
1627
20
21
Conventional
35
40
44
444025
24
1125
51
14Mixed
amino acids-CHs
38 1422
Lipid C=C35 54
46Lipid CH3
59
36/39
Lipid (CH2)n
16
Mixedamino acids
-CHs27
2524
25
10
38
40
51
38
14
1416
40
11
36/39/59
13
Lipid CH3
13
6.07.08.0 1.02.0 1.52.53.03.54.0
21
2035
54
35
4648
Germ free
δ 1H (p.p.m.)
δ 1H (p.p.m.)
0
0.1
0.2
0.3
0.4
0.5
0.6
0.7
0.8
0.913
13
38
10
24
44
38
21
Germ free
Conventional
11
8 7 4 3 2 1
r 2
Figure 4 1H NMR spectra (600 MHz) of ileum aqueous extracts of germ-free (GF) (A) and conventional (B) mice. The aromatic region (d 6.5–9.0) has been verticallyexpanded � 4. (C) Plot of O-PLS-DA coefficients related to the discrimination between 1H NMR spectra of urine from GF (top) and conventional (bottom) mice.For identification of the peak numbers, refer to codes in Table II.
Gut microbiota and host metabolismSP Claus et al
6 Molecular Systems Biology 2008 & 2008 EMBO and Macmillan Publishers Limited

host energy homeostasis by participating, directly or indir-ectly, in the control of bile acid metabolism.
Evidence of the modulation of host cell pathwaysand physiology by gut microbiota
The colonic metabolite profile in GF mice was characterized bylower levels of choline and its phosphorylated derivatives,GPC and phosphocholine. This is likely due to the disturbanceof the membrane of colonocytes in GF animals. The observedaccumulation of raffinose in these cells is probably also aconsequence of this disruption. Raffinose is an oligosaccharidethat is only digested by the gut microbiota, as monogastricanimals do not express pancreatic a-galactosidase (LeBlancet al, 2004). In GF animals, it seems that this trisaccharide isable to cross the epithelial membrane and accumulates incolonocytes where it induces a rise in osmotic pressure. Thisphenomenon provokes a well-described signaling cascade that
leads to the release of the mobile osmolytes, GPC, myo-inositoland scyllo-inositol (Wehner, 2003; Alfieri, 2007) (Figure 6).Interestingly, lower levels of these metabolites have previouslybeen associated with human colon adenocarcinoma (Morenoand Arus, 1996), and have also been observed in the brain ofpatients with hepatic encephalopathy (Lien et al, 1994;Albrecht and Jones, 1999) or associated with osmoregulatoryfunction in the brain in response to atrophy (Tsang et al, 2006).These physiological changes were correlated with significantlylower creatine concentrations that can be associated withlower energy demands and with a lower peristalsis due to animpaired function of the smooth muscle layer in GF mice(Berg, 1996). Furthermore, a number of metabolites involveddirectly (e.g. fumarate) or indirectly (e.g. glutamate, aspartate,alanine and lactate) in energy pathways were present at lowerlevels in the ilial and colonic epithelium. Aspartate andfumarate are also key metabolites in the metabolism of ureaassociated with the citric acid cycle, a pathway that enables the
Conventional
5446
20 35 66
16
2449
16
38
35
2125
2425
4428
144428Mixed
amino acids-CHs
4114/41
1122
Lipid C=C
38
10
86
Lipid CH3
59
36/39
Lipid (CH2)n
Lipid CH3
38
102524
25
16
Mixedamino acids
-CHs
48
40
51
22
Lipid C=C
59
36/39
11
Lipid (CH2)n
40
14
27
16
38
14
6.07.08.0
46
21
35
5420
35
Germ free
48
Germ free
5656
1.02.0 1.52.53.5 3.04.0
480.9
38
6
6
16
28/44
41
16
38
5621
5620
1234678
Conventional0
0.1
0.2
0.3
0.4
0.5
0.6
0.7
0.822
49
δ 1H (p.p.m.)
δ 1H (p.p.m.)
r 2
Figure 5 1H NMR spectra (600 MHz) of colon aqueous extracts of germ-free (GF) (A) and conventional (B) mice. The aromatic region (d 6.5–9.0) has been verticallyexpanded � 4. (C) Plot of O-PLS-DA coefficients related to the discrimination between 1H NMR spectra of urine from GF (top) and conventional (bottom) mice.For identification of the peak numbers, refer to codes in Table II.
Gut microbiota and host metabolismSP Claus et al
& 2008 EMBO and Macmillan Publishers Limited Molecular Systems Biology 2008 7

Table I Full 1H NMR chemical shift data for discriminating metabolites assigned in urine and tissue samples (note that signals for unassigned or non-significantlydiscriminating metabolites are not reported)
Code Metabolite d 1H (multiplicity) group Compartmentsobserved
1 2-Oxoisocaproate 0.94 (d) CH3, 2.18 (m) CH, 2.64 (d) CH2 U2 2-Oxoglutarate 2.47 (t) gCH2, 3.03 (t) bCH2 U3 D-3-Hydroxybutyrate 1.20 (d) CH3, 2.31 (dd) 1
2 aCH2, 2.41 (dd) 12 aCH2, 4.16 (dt) CH L
4 3-Hydroxycinnamate 6.49 (d) aCH, 6.92 (d) H2, 7.09 (s) H6, 7.17 (d) H4, 7.33 (m) H3/b-CH U5 4-Hydroxyphenylpropionate 2.52 (t) aCH, 2.91 (t) bCH, 6.92 (d) H2/H6, 7.22 (d) H3/H5 U6 5-Aminovalerate 1.64 (m) b/gCH2, 2.25 (t) aCH2, 3.02 (t) dCH2 C7 5-Hydroxytryptophan 3.23 (dd) 1
2 bCH2, 3.41 (dd) 12 bCH2, 4.02 CHNH2, 6.88 H6, 7.14 H2, 7.28, 7.41 H7 U
8 Acetate 1.92 (s) CH3 U, L, K, D, J, I, C9 Adenosine diphosphate 4.20 (dd) 1
2 CH2, 4.23 (dd) 12 CH2, 4.27 (dt) H5, 4.50 (m) H4, 4.77 (m) H3, 6.12 (d) H2, 8.18 (s) H7,
8.50 (s) H12, 8.55 (s) H12L, K
10 Alanine 1.48 (d) bCH3, 3.79 (m) CH L, K, D, J, I, C11 Aspartate 2.68 (AB of ABX) 1
2 bCH2, 2.82 (AB of ABX) 12 bCH2, 3.91 (X of ABX) aCH K, D, J, I, C
12 Betaine 3.27 (s) CH3, 3.90 (s) CH2 K13 Bile acids (mixed) 0.70 (s) CH3, 1.05 (s) CH3 L, D, J, I14 Choline 3.20 (s) N-(CH3)3, 3.51 (t) bCH2, 4.05 (t) aCH2 L, K, D; J, I, C15 Citrate 2.69 (AB) 1
2 CH2, 2.55 (AB) 12 CH2 U
16 Creatine 3.03 (s) N-CH3, 3.94 (s) CH2 U, K, D, J, I, C17 Creatinine 3.06 (s) N-CH3, 4.05 (s) CH2 U18 Dimethylamine 2.72 (s) CH3 U19 Ethanolamine 3.13 (t) NH-CH2, 3.83 (t) HO-CH2 K20 Formate 8.46 (s) CH U, D, J, I, C21 Fumarate 6.52 (s) CH U, L, K, D, J, I, C22 a-Glucose 3.42 (t) H4, 3.54 (dd) H2, 3.71 (t) H3, 3.72 (m) 1
2 CH2-C6, 3.76 (m) 12 CH2-C6, 3.83 (ddd) H5, 5.23 (d) H1 L, K, D, J, I, C
23 b-Glucose 3.24 (dd) H2, 3.40 (t) H4, 3.47 (ddd) H5, 3.48 (t) H3, 3.84 (m) 12 CH2-C6, 3.90 (dd) 1
2 CH2-C6, 4.64 (d) H1 L24 Glutamate 2.08 (m) bCH2, 2.34 (m) gCH2, 3.75 (m) aCH K, D, J, I, C25 Glutamine 2.15 (m) bCH2, 2.46 (m) gCH2, 3.77 (m) aCH L, K, D, J, I, C26 Glutathione (oxidized) 2.17 (m) bCH2 Glu, 2.55 (m) gCH2 Glu, 2.98 (AB of ABX, broad) and 3.30 (AB of ABX, broad) bCH2 Cys,
3.78, aCH2 Gly, 4.75 (X of ABX, broad) aCH CysL
27 Glycine 3.56 (s) aCH U, D, J, I28 Glycerophosphocholine 3.23 (s) N-(CH3)3, 4.32 (m broad) CH D, J, C29 Glycogen 3.83 (m broad), 5.41 (m broad) L30 Guanine 7.72 (s) CH U31 Guanosine 3.86 (m) CH2, 4.24 (m) H5, 4.41 (t) H40, 5.91 (d) H20, 8.00 (s) H8 U, D, J32 Hippurate 3.97 (d) CH2, 7.56 (t) m-CH, 7.65 (t) p-CH, 7.84 (d) aCH U33 Histidine 3.14 1
2 bCH2 (AB of ABX), 3.25 12 bCH2 (AB of ABX), 3.99 aCH (X of ABX), 7.08 (s) H5, 7.83 (s) H3 L, K
34 Hypotaurine 2.64 (t) CH2-NH2, 3.37 (t) CH2-SO3 L35 Inosine 3.85 1
2 CH2 (AB of ABX), 3.92 12 CH2 (AB of ABX), 4.28 H50 (X of ABX), 6.10 (d) H20, 8.24 (s) H8, 8.34 (s) H2 L, K, D, J, I, C
36 Isoleucine 0.95 (t) dCH3, 1.01 (d) bCH3, 1.26 (m) 12 gCH2, 1.48 (m) 1
2 gCH2, 1.98 (m) bCH 3.68 (d) aCH U, L, K, D, J, I, C37 Isovaleric acid 0.92 (d) CH3, 1.94 (m) CH, 2.05 (d) CH2 U38 Lactate 1.33 (d) bCH3, 4.12 (q) aCH L, K, D, J, I, C39 Leucine 0.96 (d) dCH3, 1.71 (m) gCH, 3.73 (t) aCH L, K, D, J, I, C40 Lysine 1.48 (m) gCH2, 1.73 (m) dCH2, 1.91 (m) bCH2, 3.03 (t) eCH2, 3.76 (t) aCH K, D, J, I, C41 myo-Inositol 3.29 (t) H5, 3.53 (dd) H1/H3, 3.63 (t) H4/H6, 4.06 (t) H2 K, D, J, C42 N-Acetylcysteine 2.08 (s) CH3, 2.94 (m) CH2, 4.39 (m) CH U43 Nicotinurate 3.99 (s) CH2, 7.6 (dd) H5, 8.25 (d) H4, 8.71 (d) H6, 8.94 (s) H2 L, K44 Phosphocholine 3.22 (s) N-(CH3)3, 3.62 (t) bCH2, 4.23 (m) aCH2 L, I, C45 Phenylacetylglycine 3.67 (s) dCH2, 3.75 (d) aCH2, 7.35 (m) H2/H6, 7.37 (t) H4, 7.42 (m) H3/H5 U46 Phenylalanine 3.13 1
2 bCH2 (AB of ABX), 3.28 12 bCH2 (AB of ABX), 4.00 aCH (X of ABX), 7.33 (m) H2/H6, 7.39 (t) H4,
7.43 (m) H3/H5L, K, D, J, I, C
47 Putrescine 1.80 (m broad) bCH2, 3.05 (m broad) aCH2 U48 Raffinose 3.53 (s), 3.55–3.59 (m), 3.68 (s), 3.70–3.92 (m), 3.96 (t), 4.00–4.07 (m), 4.23 (d) H3 (fructose),
5.00 (d) H21 (galactose), 5.43 (d) H7 (glucose)C
49 scyllo-Inositol 3.35 (s) CH C50 Succinate 2.41 (s) CH3 U, L, K51 Taurine 3.27 (t) CH2-SO3, 3.43 (t) CH2-NH U, L, K, D, J, I, C52 Trimethylamine 2.86 (s) CH3 U53 Trimethylamine N-oxide 3.27 (s) (CH3)3 U, L54 Tyrosine 3.06 1
2 bCH2 (AB of ABX), 3.16 12 bCH2 (AB of ABX), 3.94 aCH (X of ABX), 6.87 (d) H2/H6, 7.18 (d) H3/H5 L, K, D, J, I, C
55 Uridine diphosphate 4.21 (dd) 12 CH2, 4.25 (dd) 1
2 CH2, 4.37 (dt) H5, 4.39 (dd) H4, 4.43 H3, 5.96 (m) H2, 5.98 (d) H10,7.98 (d) H11
U, L
56 Uracil 5.78 (d) CH, 7.52 (d) CH I, C57 Uridine 3.81 (dd) 1
2 CH2, 3.92 (dd) 12 CH2, 4.12 (dt) H5, 4.24 (dd) H4, 4.36 (dd) H3, 5.88 (d) H10, 5.92 (m) H2,
7.88 (d) H11L, K, D, J
58 Uridine triphosphate 4.25 (dd) 12 CH2, 4.28 (dd) 1
2 CH2, 4.39 (dt) H5, 4.40 (dd) H4, 4.45(dd) H3, 5.90 (d) H10, 5.98 (m) H2,7.98 (d) H11
L
59 Valine 0.99 (d) gCH3, 1.05 (d) g0CH3, 2.28 (m) bCH, 3.62 (d) aCH L, K, D, J, I, C
The numbering/nomenclature of compounds follows the IUPAC system.Key: s, singlet; d, doublet, dd, doublet of doublets; t, triplet; m, multiplet; ABX refers to second-order spin system usually of the form CH2CH where all three protons arenon-equivalent; C, colon; D, duodenum; I, ileum; J, jejunum; K, kidney; L, liver; U, urine.
Gut microbiota and host metabolismSP Claus et al
8 Molecular Systems Biology 2008 & 2008 EMBO and Macmillan Publishers Limited

elimination of ammonia produced endogenously from thecatabolism of amino acids, and exogenously from thedegradation of proteins by gut microflora (Metzler, 2003)(Figure 7). The massive production of exogenous ammoniumin colon lumen results in a high intake of ammonium incolonocytes where it is partially detoxified into urea (Mouilleet al, 1999). Thus, it is assumed that the observed lower levelsof fumarate, glutamate, aspartate, alanine and lactate in GFprofiles reflect the lower input of ammonia and/or the lowersmooth muscle activity in these animals. All of theseperturbations emphasize the fundamental role of gut micro-biota in colonic epithelial metabolism.
Moreover, the liver metabotype of GF animals indicatedother bacterial-related changes. A lower level of GSSG, theoxidized form of the powerful antioxidative compound GSH
(Meister and Anderson, 1983) and a higher level of hypotaur-ine were observed in two GF animals of a total of four(Figure 2C). Despite the restricted numbers of individualsincluded in this study, it is possible that a subgroup of animalsmay exist. GSSG represents 1% of the total amount ofglutathione in vivo (Deneke and Fanburg, 1989). In this study,GSH was not observed because it is readily oxidized to GSSGby exposure to atmospheric oxygen during sample prepara-tion. Thus, it can be considered that the observed GSSG reflectsthe whole amount of glutathione in the liver extract. Normally,glutathione, rather than hypotaurine, is the predominantantioxidative molecule in the liver. Furthermore, it has beendemonstrated that hypotaurine is also a strong antioxidativecompound (Aruoma et al, 1988; Yancey, 2005). The observa-tion of a high level of hypotaurine concomitant with low levelof glutathione indicates a perturbation of the cell response tooxidative stress. Thus, for these two individuals, the higherlevel of hypotaurine may compensate for the lack ofglutathione in the liver. It is noteworthy that the low totalglutathione content was associated in these two animals withhigh levels of glycine, which is an essential amino acid forglutathione biosynthesis (Meister and Tate, 1976). Takentogether, these observations indicate a perturbed g-glutamylcycle activity in the liver of two GF mice and this may besuggestive of altered cysteine metabolism (Meister, 1988). Thelow level of total glutathione in GF animals may impact onmany metabolic pathways as it is also a coenzyme involved inthe regulation of protein synthesis and degradation, as well as
Table II Summaries of O-PLS-DA statistical models
Sample Orthogonal component Q2Y R2X
Duodenum 0 0.57 0.27Jejunum 1 0.37 0.52Ileum 0 0.46 0.26Colon 1 0.70 0.34Liver 1 0.58 0.47Kidney 1 0.42 0.61Urine 1 0.83 0.39
Q2Y, cross-validated predicted percentage of the response Y; R2X, variation ofX explained by the model.
Table III Summary of variations of metabolite signals with the highest discriminant power for each model
Metabolite d (p.p.m.) Duodenum Jejunum Ileum Colon Liver Kidney Urine
3-HCA 7.07 �0.934-HPP 6.89 �0.925-Aminovalerate 2.236 �0.86Alanine 1.476 +0.84 �0.83Aspartate 2.81 �0.84Betaine 3.904 +0.98Choline 3.2052 +0.94Creatine 3.04 +0.52 �0.83Creatinine 4.08 +0.89Ethanolamine 3.1448 +0.87Formate 8.459 �0.76Fumarate 6.520 �0.79 �0.91Glutamate 2.078 �0.85Glutathione 2.5528 �0.71Glycine 3.559 +0.49 +0.79GPC 3.2312 �0.85 �0.85Hippurate 7.84 �0.93Hypotaurine 2.645 +0.60Inosine 8.3468 +0.88Lactate 1.336 �0.79 �0.78Nac 2.185 �0.76myo-Inositol 3.5288 �0.76 +0.92PAG 7.38 �0.87Phosphocholine 3.2252 �0.76 +0.93Raffinose 5.435 +0.86scyllo-Inositol 3.3485 �0.72 +0.78Tauro-conjugated bile acids 0.697 +0.93 +0.51 +0.78 +0.66TMAO 3.269 +0.85Tyrosine 6.909 �0.81Uracil 5.811 �0.94
Full chemical shift data for each metabolite are reported in Table I. The correlation coefficients with the discriminant axis for the metabolites involved in the differencebetween GF and conventional animals are presented as either higher (+) or lower level (�) compared with the conventional control.
Gut microbiota and host metabolismSP Claus et al
& 2008 EMBO and Macmillan Publishers Limited Molecular Systems Biology 2008 9

in the mechanism of immune system and in the prostaglandinmetabolism (Meister and Anderson, 1983; DeLeve andKaplowitz, 1991; Uhlig and Wendel, 1992; Wang and Ballatori,1998).
TMAO variation contributes to the statistical separationbetween the metabolic profiles of livers from GF andconventional mice (Figure 2C). TMAO was expected to belower in GF animals as previously observed in urine profilesduring re-colonization of GF rats (Nicholls et al, 2003). Here,we observed a significantly higher level of TMAO in GF mice.TMAO in the liver derives either from a direct absorption ofTMAO contained in the diet, from the gut microbial processingof choline and carnitine, or is endogenously synthesized by theoxidation of TMA to TMAO by the flavin-containing mono-oxygenase isomer 3 (FMO3) (Smith et al, 1994; Zhang et al,2007). As the two groups were fed exactly the same diet, it canbe deduced that the higher level of TMAO found in the liver ofGF animals comes from either a greater uptake of TMA/TMAOcontained in the diet, or from a higher endogenous synthesis.In contrast to humans, expression of FMO3 in mouse is sexdependent with a much lower expression in males. However, ithas been recently demonstrated that this expression is highlyinducible by TCDD (dioxin) in an aryl hydrocarbon receptor-
dependent manner (Tijet et al, 2006). Thus, it is possible thatFMO3 in male GF animals was induced.
A lower level of N-acetylated glycoprotein (Nac) signal wasobserved in the urine of GF animals (Figure 1C). This signalcomes from the most abundant glycoprotein in urine, theTamm–Horsfall protein (THP), also known as uromodulin, asmall glycoprotein (B90 kDa) secreted by the thick ascendinglimb of the Henle’s loop of the nephron (Serafini-Cessi et al,2003). This protein is of particular interest in that its role isassociated with the prevention of urinary tract infections. TheN-glycans at the protein surface bind to uropathogenic strainsof Escherichia coli, preventing the adhesion of these pathogensto the bladder wall (Pak et al, 2001; Mo et al, 2004). Here, theobserved lower levels of Nac in GF urine profiles may becaused by a lower amount of THP in the urine or by a lowerglycosylation of the protein. The protective function of THP isdriven by N-glycans, so this observation reveals that protec-tion against urinary tract pathogens is affected in the absenceof gut microbiota. Also, choline, betaine, myo-inositol andscyllo-inositol were elevated in kidneys from GF mice(Figure 3C). All these metabolites are osmoprotectants (Burg,1995) and it has been shown that their level increases inkidney cells when the environment becomes hypertonic
‘Gut microbes’α-galactosidase
‘Mammalian’invertase
Germ-free environmentConventional microbiome environment
Abnormal apical membrane ?
Colonocyte
Gut lumen
Intact basal membrane
Raffinose absorption
GPC, myo-inositoland scyllo-inositol
Osmotic pressure
OO
CH2
O
O
O
CH2OHHO
HO
HO
HO
OH
OH
OH
OH
Galactose Glucose Fructose
Raffinose
Observed metabolites
HOCH2
HOCH2
O
O
O
CH2OHHO
HO
O
OH
OHO
HOCH2 HOCH2
HO
OH
OHOH
D-GalactoseSucrose
O
CH2OHHO
HO
HO
D-Fructose
O
OHO
OH
OH
D-Glucose
+
+
Bacterial fermentation
SCFAs
Figure 6 Variation of raffinose metabolism by colonocytes in germ-free (GF) and conventional microbiome animals. In conventional animals, raffinose is first digestedby microbial a-galactosidase to release galactose and sucrose. Then, the mammalian invertase attached to the brush border releases glucose and fructose fromsucrose. These monosaccharides are then utilized as a source of carbon for bacterial fermentation. In GF animals, raffinose is not catabolized and passive diffusion intocolonocytes may occur contributing to the osmotic pressure that is regulated by decreasing levels of the mobile osmolytes: glycerophosphocholine, myo-inositol andscyllo-inositol. GPC, glycerophosphocholine; SCFAs, short chain fatty acids.
Gut microbiota and host metabolismSP Claus et al
10 Molecular Systems Biology 2008 & 2008 EMBO and Macmillan Publishers Limited

(Yamauchi et al, 1991; Burg, 1995; Beck et al, 1998; Burger-Kentischer et al, 1999). Both decrease in THP concentration inurine and hypertonicity of interstitial fluid in kidney have beenassociated with renal dysfunction (Seldin and Giebisch, 2000),but it was not possible in this study to establish a link betweenthese two observations.
Finally, the observed increased excretion of creatinine, abiomarker of muscle mass, in the urine of GF mice (Figure 1) islikely related to the lean phenotype of GF mice, as confirmed ina recent study (Backhed et al, 2007). Collectively, these datademonstrate that gut microbiota have a function in the controlof the metabolic phenotype of the colon and liver andinfluence the whole-body metabolic homeostasis of the host.
Conclusions
We have demonstrated that gut microbiotal activities have animpact on site-specific intestinal epithelial biochemistry andinfluence at ‘long-range’ hepatic and renal metabolite profilesas well as the global metabolic phenotype of the host(summarized in Figure 7). It would be of considerable interestto correlate the compartmentalized metabolite profiles withthe known bacterial strains that compose the microbiota and
this is the focus of an ongoing investigation. Gut microbiotaseem to be an important regulator of the bile acid metabolismand may have an impact on CYP enzyme induction status.These results also suggest the potential impact of the gutmicrobiota on antioxidant mechanisms in the liver but furtherstudies are needed. We also show that gut microbiomeinfluences the renal metabolite profile possibly in responseto interstitial hypertonicity. By acting directly or indirectly onthe metabolism of liver and kidney, key organs of bodyphysiology (i.e. homeostasis of arterial pressure and equili-brium of cholesterol and electrolyte levels), the gut microbiotacan be considered as a major contributor of host homeostasis.Improved knowledge of host–microbiome interactions willlead to a better understanding of individual variation inrelation to health status and interventional outcomes (Claytonet al, 2006; Nicholson, 2006).
Materials and methods
Animal handling and sample preparation
All studies were conducted according to the Swiss legislation onanimal experimentation.
One group of five GF C3H/HeJ mice (Charles River, France) wasmaintained in isolators on g-ray-irradiated food (R03-10) and g-ray-
Enterohepatic cycle
alanine aminotransferaseglycerophosphocholinelactate dehydrogenasemyo-inositolpyruvate dehydrogenaseshort chain fatty acids scyllo-inositolthick ascending limbtamm-horsfall protein5-aminovalerate
ALATGPCLDHMIPDHSCFAsSITALTHP5-AV
Gallbladder
Glycine
Phospholipids
Bile acids
Phospholipids
PhosphocholineHypertonic interstitialfluid
TAL cell
Synthesis of THP
Betaine
Choline
Ethanolamine
MI SI
Urine
Bladder
THPGlucoseCreatinine
HippuratePAG4-HPP3-HCA
Dietorigin
Intestinal barrier
Intestinal lumen
Duodenum
Jejunum
Bile acids
Bile acids
Bile acids
IleumBile acids
Colon
Raffinose
Raffinose
SCFAs
fermentationGut microbial
Gut microbialdigestion
5-AV5-AV
Protein
NH3Ureacycle
Arginino-succinate
Citrulline
OrnithineArginine
Urea
Pyruvate
Lactate
Acetyl-CoA
LDH
PDH
Ala ALAT
Citric acidcycle
Oxaloacetate
MalateFumarate
2-oxoglutarate
Glu Asp
MI SI
GPC
Gln Glu
NH3
Liver
Kidney
Figure 7 Summary of some of the major systemic effects of the gut microbiome on mouse metabolism in different compartments. Metabolites observed in this studyare shown in red when their level is higher in GF profiles or in green when it is lower. The enterohepatic cycle of bile acids is shown as blue arrows. The citric acid cyclehas been simplified for clarity.
Gut microbiota and host metabolismSP Claus et al
& 2008 EMBO and Macmillan Publishers Limited Molecular Systems Biology 2008 11
irradiated water, whereas the other group of five conventional C3H/HeJ mice was maintained under identical conditions but in aconventional environment with non-irradiated food and water.Isolators were checked every week for any bacterial contaminationthroughout the life of GF animals. Throughout the duration of thestudy, water and food were provided ad libitum. Mice were euthanizedwhen they were 8 weeks old, at which time urine and organs(duodenum, jejunum, ileum, colon, liver and kidney) were collected.Samples were snap frozen in liquid nitrogen and stored at �801C untilanalysis.
1H NMR spectroscopy
Urine samples were freeze-dried and dissolved in 50mL of phosphatebuffer 0.2 M (pH 7.4) in D2O plus 0.05% sodium 3-(tri-methylsilyl)-propionate-2,3-d4 (TSP) before transferring to capillary tubes foranalysis by 1H NMR spectroscopy.
Tissue samples were homogenized and extracted in acetonitrile/water (1:1), as previously described (Waters et al, 2002). Thesupernatant containing the aqueous phase was collected, freeze-driedand dissolved in 600 ml of D2O. Samples were centrifuged for 10 min at15 000 g, and 500ml of the supernatant and 50ml of water were used forlater analysis by NMR spectroscopy.
All 1H NMR spectra were acquired on a Bruker Avance 600 MHzSpectrometer (Bruker Analytische GmbH, Rheinstetten, Germany)operating at 600.13 MHz and using a standard 1D pulse sequence(Nicholson et al, 1995) (recycle delay (RD)–901–t1–901–tm–901–ac-quire free induction decay (FID)) with water suppression appliedduring RD of 2 s and mixing time (tm) of 100 ms and a 901 pulse set at9.75ms. Spectra were acquired using 256 scans into 32K data pointswith a spectral width of 12 000 Hz. The FIDs were multiplied by anexponential function corresponding to 0.3 Hz line broadening. Zerofilling of a factor of four for all tissue extracts and two for urine sampleswas also applied to the FIDs. All spectra were manually phased,baseline corrected and calibrated to lactate (d 1.33) for tissue extractsand to TSP (d 0.00) for urine samples. Metabolites were assigned usingdata from literature (Nicholson et al, 1995; Fan, 1996; Garrod et al,2001) and additional two-dimensional (2D) NMR experiments onselected samples.
The 2D 1H–1H NMR spectra were performed on a Bruker DRX 400Spectrometer operating at 400.13 MHz (Bruker Analytische GmbH)using 2D correlation spectroscopy (Aue et al, 1975) and totalcorrelation spectroscopy (Glaser et al, 1996) experiments. 2D 1H–13Cheteronuclear single quantum coherence NMR (Bodenhausen andRuben, 1980) was performed on liver aqueous extracts on a BrukerDRX 500 Spectrometer operating at 499.9 MHz (Bruker AnalytischeGmbH) equipped with a 5 mm 1H–13C inverse cryoprobe.
Data analysis
To eliminate the variability in water resonance presaturation, thechemical shift region between d 4.66 and 4.88 was removed from allspectra before statistical analysis, except for liver where to avoid biasdue to baseline distortion, the region between d 4.77 and 5.38 wasremoved. As previously described (Cloarec et al, 2005), all data wereanalyzed on full-resolution spectra (35 600 data points for liver and36 500 data points for all other tissue extracts), normalized to the totalpeak area and models were constructed using O-PLS-DA with unitvariance scaling on Matlab 7.0.1 software (The MathWorks Inc.).Despite the use of phosphate buffer, many urine spectra still displayedsubtle pH-dependent shifts; therefore, the O-PLS-DAwas performed onlarger bins of 0.005 p.p.m. (1750 bucketed points) to minimize minorfrequency changes in spatial components.
To aid interpretation, the O-PLS coefficients were plotted into aspectral domain using the back-scaling method (Cloarec et al, 2005).Using this method, the weights of each variable are back-scaled to theirinitial metric of the data and then the shape of NMR spectra and thesign of the coefficients are preserved. However, the weights of thevariables can still be compared using a colour code corresponding tothe square of the actual O-PLS coefficients. By construction, the O-PLScoefficients are directly proportional to the correlation coefficientsbetween the discriminant axis and the NMR data. For this reason, the
square of the coefficients can be represented in terms of correlationafter applying the same corrective factor to all coefficients, allowing bythis way an estimation of the amount of variance of each NMRvariableinvolved in the discrimination.
Supplementary information
Supplementary information is available at the Molecular SystemsBiology website (www.nature.com/msb).
AcknowledgementsThis study was funded by Nestle.
References
Albrecht J, Jones EA (1999) Hepatic encephalopathy: molecularmechanisms underlying the clinical syndrome. J Neurol Sci 170:138–146
Alfieri R (2007) Hyperosmotic stress response: comparison with othercellular stresses. Pflugers Arch 454: 173–185
Alvaro D, Cantafora A, Attili AF, Ginanni Corradini S, De Luca C,Minervini G, Di Biase A, Angelico M (1986) Relationships betweenbile salts hydrophilicity and phospholipid composition in bile ofvarious animal species. Comp Biochem Physiol B 83: 551–554
Amieva MR, El-Omar EM (2008) Host–bacterial interactions inHelicobacter pylori infection. Gastroenterology 134: 306–323
Aruoma OI, Halliwell B, Hoey BM, Butler J (1988) The antioxidantaction of taurine, hypotaurine and their metabolic precursors.Biochem J 256: 251–255
Atkinson C, Frankenfeld CL, Lampe JW (2005) Gut bacterial meta-bolism of the soy isoflavone daidzein: exploring the relevance tohuman health. Exp Biol Med (Maywood) 230: 155–170
Aue WP, Baartholdi E, Ernst RR (1975) Two-dimensional spectroscopy.Application to nuclear magnetic resonance. J Chem Phys 64:2229–2246
Backhed F, Ding H, Wang T, Hooper LV, Young Koh G, Nagys A,Semenkovich CF, Gordon JI (2004) The gut microbiota as anenvironmental factor that regulates fat storage. Proc Natl Acad SciUSA 102: 11070–11075
Backhed F, Ley RE, Sonnenburg JL, Peterson DA, Gordon JI (2005)Host–bacterial mutualism in the human intestine. Science 307:1915–1920
Backhed F, Manchester JK, Semenkovich CF, Gordon JI (2007)Mechanisms underlying the resistance to diet-induced obesity ingerm-free mice. Proc Natl Acad Sci USA 104: 979–984
Barker HA (1981) Amino acid degradation by anaerobic bacteria. AnnuRev Biochem 50: 23–40
Barker HA, D’Ari L, Kahn J (1987) Enzymatic reactions in thedegradation of 5-aminovalerate by Clostridium aminovalericum.J Biol Chem 262: 8994–9003
Bates JM, Mittge E, Kuhlman J, Baden KN, Cheesman SE, Guillemin K(2006) Distinct signals from the microbiota promote differentaspects of zebrafish gut differentiation. Dev Biol 297: 374–386
Beck F-X, Burger-Kentischer A, Muller E (1998) Cellular response toosmotic stress in the renal medulla. Eur J Physiol 436: 814–827
Berg RD (1996) The indigenous gastrointestinal microflora. TrendsMicrobiol 4: 430–435
Bodenhausen G, Ruben DJ (1980) Natural abundance 15N NMR byenhanced heteronuclear spectroscopy. Chem Phys Lett 69: 185–189
Bollard ME, Stanley EG, Lindon JC, Nicholson JK, Holmes E (2005)NMR-based metabonomic approaches for evaluating physiologicalinfluences on biofluid composition. NMR Biomed 18: 143–162
Bourlioux P, Koletzko B, Guarner F, Braesco V (2003) The intestine andits microflora are partners for the protection of the host: report onthe Danone Symposium ‘The Intelligent Intestine’, held in Paris,June 14, 2002. Am J Clin Nutr 78: 675–683
Gut microbiota and host metabolismSP Claus et al
12 Molecular Systems Biology 2008 & 2008 EMBO and Macmillan Publishers Limited

Burg MB (1995) Molecular basis of osmotic regulation. Am J Physiol268: F983–F996
Burger-Kentischer A, Muller E, Marz J, Fraek ML, Thurau K, Beck FX(1999) Hypertonicity-induced accumulation of organic osmolytesin papillary interstitial cells. Kidney Int 55: 1417–1425
Burkholder PR, McVeigh I (1942) Synthesis of vitamins by intestinalbacteria. Proc Natl Acad Sci USA 28: 285–289
Claudel T, Staels B, Kuipers F (2005) The farnesoid X receptor—amolecular link between bile acid and lipid and glucose metabolism.Artherioscler Thromb Vasc Biol 25: 2020–2031
Clayton TA, Lindon JC, Cloarec O, Antti H, Charuel C, Hanton G,Provost JP, Le Net JL, Baker D, Walley RJ, Everett JR, Nicholson JK(2006) Pharmaco-metabonomic phenotyping and personalizeddrug treatment. Nature 440: 1073–1077
Cloarec O, Dumas M-E, Craig A, Barton RH, Lindon JC, Nicholson JK,Holmes E (2005) Evaluation of the O-PLS model limitations causedby chemical shift variability and improved visualization ofbiomarker changes in 1H NMR spectroscopic metabonomicstudies. Anal Chem 77: 517–526
DeLeve LD, Kaplowitz N (1991) Glutathione metabolism and its role inhepatotoxicity. Pharmacol Ther 52: 287–305
Deneke SM, Fanburg BL (1989) Regulation of cellular glutathione.Am J Physiol 257: L163–L173
Dumas ME, Barton RH, Toye A, Cloarec O, Blancher C, Rothwell A,Fearnside J, Tatoud R, Blanc V, Lindon JC, Mitchell SC, Holmes E,McCarthy MI, Scott J, Gauguier D, Nicholson JK (2006a) Metabolicprofiling reveals a contribution of gut microbiota to fatty liverphenotype in insulin-resistant mice. Proc Natl Acad Sci USA 103:12511–12516
Dumas ME, Maibaum EC, Teague C, Ueshima H, Zhou B, Lindon JC,Nicholson JK, Stamler J, Elliott P, Chan Q, Holmes E (2006b)Assessment of analytical reproducibility of 1H NMR spectroscopybased metabonomics for large-scale epidemiological research: theINTERMAP Study. Anal Chem 78: 2199–2208
Dunne C (2001) Adaptation of bacteria to the intestinal niche:probiotics and gut disorder. Inflamm Bowel Dis 7: 136–145
Fan TWM (1996) Metabolite profiling by one- and two-dimensionalNMR analysis of complex mixtures. Prog Nucl Magn Reson Spectrosc28: 161–219
Garrod S, Humpher E, Connor SC, Connelly JC, Spraul M, NicholsonJK, Holmes E (2001) High-resolution 1H NMR and magic anglespinning NMR spectroscopic investigation of the biochemicaleffects of 2-bromoethanamine in intact renal and hepatic tissue.Magn Reson Med 45: 781–790
Gavaghan CL, Holmes E, Lenz E, Wilson ID, Nicholson JK (2000) AnNMR-based metabonomic approach to investigate the biochemicalconsequences of genetic strain differences: application to theC57BL10J and Alpk:ApfCD mouse. FEBS Lett 484: 169–174
Glaser SJ, Schwalbe H, Marino JP, Griesinger C (1996) Direct TOCSY, amethod for selection of directed correlations by optimalcombinations of isotropic and longitudinal mixing. J Magn ResonB 112: 160–180
Goodwin BL, Ruthven CR, Sandler M (1994) Gut flora and the origin ofsome urinary aromatic phenolic compounds. Biochem Pharmacol47: 2294–2297
Hofmann AF (1999) The continuing importance of bile acids in liverand intestinal disease. Arch Intern Med 159: 2647–2658
Holmes E, Nicholson JK (2005) Variation in gut microbiota stronglyinfluences individual rodent phenotypes. Toxicol Sci 87: 1–2
Hooper LV, Gordon JI (2001) Commensal host–bacterial relationshipsin the gut. Science 292: 1115–1118
Hooper LV, Midtvedt T, Gordon JI (2002) How host–microbialinteractions shape the nutrient environment of the mammalianintestine. Annu Rev Nutr 22: 283–307
Hosokawa T, Kikuchi Y, Nikoh N, Shimada M, Fukatsu T (2006) Stricthost–symbiont cospeciation and reductive genome evolution ininsect gut bacteria. PLoS Biol 4: 1841–1851
Houten SM, Watanabe M, Auwerx J (2006) Endocrine functions of bileacids. EMBO J 25: 1419–1425
Kawamata Y, Fujii R, Hosoya M, Harada M, Yoshida H, Miwa M,Fukusumi S, Habata Y, Itoh T, Shintani Y, Hinuma S (2003) A Gprotein-coupled receptor responsive to bile acids. J Biol Chem 278:9435–9440
Koga N, Inskeep PB, Harris TM, Guengerich FP (1986) S-[2-(N7-Guanyl)ethyl]glutathione, the major DNA adduct formed from1,2-dibromoethane. Biochemistry 25: 2192–2198
Kostenis E (2004) A glance at G-protein-coupled receptors for lipidmediators: a growing receptor family with remarkably diverseligands. Pharmacol Ther 102: 243–257
LeBlanc JG, Silvestroni A, Connes C, Juillard V, Savoy de Giori G, PiardJC, Sesma F (2004) Reduction of non-digestible oligosaccharides insoymilk: application of engineered lactic acid bacteria that producea-galactosidase. Genet Mol Res 3: 432–440
Ley RE, Turnbaugh PJ, Klein S, Gordon JI (2006) Microbial ecology:human gut microbes associated with obesity. Nature 444:1022–1023
Lien YH, Michaelis T, Moats RA, Ross BD (1994) scyllo-Inositoldepletion in hepatic encephalopathy. Life Sci 54: 1507–1512
Lindon JC, Holmes E, Bollard ME, Stanley EG, Nicholson JK (2004)Metabonomics technologies and their applications in physiologicalmonitoring, drug safety assessment and disease diagnosis.Biomarkers 9: 1–31
Makishima M, Okamoto AY, Repa JJ, Tu H, Learned RM, Luk A, HullMV, Lustig KD, Mangelsdorf DJ, Shan B (1999) Identification ofa nuclear receptor for bile acids. Science 284: 1362–1365
Manach C, Scalbert A, Morand C, Remesy C, Jimenez L (2004)Polyphenols: food sources and bioavailability. Am J Clin Nutr 79:727–747
Martin FP, Dumas ME, Wang Y, Legido-Quigley C, Yap IK, Tang H, ZirahS, Murphy GM, Cloarec O, Lindon JC, Sprenger N, Fay LB, KochharS, van BP, Holmes E, Nicholson JK (2007a) A top–down systemsbiology view of microbiome–mammalian metabolic interactions ina mouse model. Mol Syst Biol 3: 112
Martin FP, Verdu EF, Wang Y, Dumas ME, Yap IK, Cloarec O,Bergonzelli GE, Corthesy-Theulaz I, Kochhar S, Holmes E, LindonJC, Collins SM, Nicholson JK (2006) Transgenomic metabolicinteractions in a mouse disease model: interactions of Trichinellaspiralis infection with dietary Lactobacillus paracaseisupplementation. J Proteome Res 5: 2185–2193
Martin FP, Wang Y, Dumas ME, Cloarec O, Holmes E, Kochhar S,Sprenger N, Nicholson JK (2007b) Biochemical characterization ofgut compartments in a germ-free mouse model and effects ofLactobacillus paracasei in mono-associated mice using high-resolution magic angle spinning 1H NMR spectroscopy. J ProteomRes 6: 1471–1481
Meister A (1988) Glutathione metabolism and its selectivemodification. J Biol Chem 263: 17205–17208
Meister A, Anderson ME (1983) Glutathione. Annu Rev Biochem 52:711–760
Meister A, Tate SS (1976) Glutathione and related gamma-glutamylcompounds: biosynthesis and utilization. Annu Rev Biochem 645:559–604
Metges CC (2000) Contribution of microbial amino acids to amino acidhomeostasis of the host. J Nutr 130: 1857S–11864
Metzler DE (2003) The metabolism of nitrogen and amino acids. InBiochemistry: the Chemical Reactions of Living Cells, Hayhurst J(ed), pp 1358–1419. USA: Elsevier Science
Mo L, Zhu XH, Huang HY, Shapiro E, Hasty DL, Wu XR (2004) Ablationof the Tamm–Horsfall protein gene increases susceptibility of miceto bladder colonization by type 1-fimbriated Escherichia coli. Am JPhysiol Renal Physiol 286: F795–F802
Modica S, Moschetta A (2006) Nuclear bile acid receptor FXRas pharmacological target: are we there yet? FEBS Lett 580:5492–5499
Moreno A, Arus C (1996) Quantitative and qualitative characterizationof 1H NMR spectra of colon tumors, normal mucosa and theirperchloric acid extracts: decreased levels of myo-inositol intumours can be detected in intact biopsies. NMR Biomed 9: 33–45
Gut microbiota and host metabolismSP Claus et al
& 2008 EMBO and Macmillan Publishers Limited Molecular Systems Biology 2008 13

Mouille B, Morel E, Robert V, Guihot-Joubrel G, Blachier F (1999)Metabolic capacity for L-citrulline synthesis from ammonia in ratisolated colonocytes. Biochim Biophys Acta 1427: 401–407
Nicholls AW, Mortishire-Smith RJ, Nicholson JK (2003) NMRspectroscopic-based metabonomic studies of urinary metabolitevariation in acclimatizing germ-free rats. Chem Res Toxicol 16:1395–1404
Nicholson JK (2006) Global systems biology, personalized medicineand molecular epidemiology. Mol Syst Biol 2: 52
Nicholson JK, Connelly J, Lindon JC, Holmes E (2002) Metabonomics:a platform for studying drug toxicity and gene function. Nat RevDrug Discov 1: 153–161
Nicholson JK, Foxall PJ, Spraul M, Farrant RD, Lindon JC (1995)750 MHz 1H and 1H–13C NMR spectroscopy of human bloodplasma. Anal Chem 67: 793–811
Nicholson JK, Holmes E, Wilson ID (2005) Gut microorganisms,mammalian metabolism and personalized health care. Nat RevMicrobiol 3: 431–438
Pak J, Pu Y, Zhang ZT, Hasty DL, Wu XR (2001) Tamm–Horsfall proteinbinds to type 1 fimbriated Escherichia coli and prevents E. colifrom binding to uroplakin Ia and Ib receptors. J Biol Chem 276:9924–9930
Rezzi S, Ramadan Z, Fay LB, Kochhar S (2007) Nutritionalmetabonomics: applications and perspectives. J Proteome Res 6:513–525
Robosky LC, Wells DF, Egnash LA, Manning ML, Reily MD, RobertsonDG (2005) Metabonomic identification of two distinct phenotypesin Sprague–Dawley (Crl:CD(SD)) rats. Toxicol Sci 87: 277–284
Rohde CM, Wells DF, Robosky LC, Manning ML, Clifford CB, Reily MD,Robertson DG (2007) Metabonomic evaluation of Schaedler alteredmicroflora rats. Chem Res Toxicol 20: 1388–1392
Russell DW (2003) The enzymes, regulation, and genetics of bile acidsynthesis. Annu Rev Biochem 72: 137–174
Savage DC (1986) Gastrointestinal microflora in mammalian nutrition.Annu Rev Nutr 6: 155–178
Seldin DW, Giebisch G (2000) The Kidney: Physiology and Pathology.Philadelphia, USA: Lippincott Williams & Wilkins
Serafini-Cessi F, Malagolini N, Cavallone D (2003) Tamm–Horsfallglycoprotein: biology and clinical relevance. Am J Kidney Dis 42:658–676
Setchell KD (1998) Phytoestrogens: the biochemistry, physiology, andimplications for human health of soy isoflavones. Am J Clin Nutr68: 1333S–1346S
Smith JL, Wishnok JS, Deen WM (1994) Metabolism and excretion ofmethylamines in rats. Toxicol Appl Pharmacol 125: 296–308
Tijet N, Boutros PC, Moffat ID, Okey AB, Tuomisto J, Pohjanvirta R(2006) Aryl hydrocarbon receptor regulates distinct dioxin-dependent and dioxin-independent gene batteries. Mol Pharmacol69: 140–153
Tsang TM, Woodman B, Mcloughlin GA, Griffin JL, Tabrizi SJ, BatesGP, Holmes E (2006) Metabolic characterisation of the R6/2transgenic mouse model of Huntington’s disease by high-resolution MAS 1H NMR spectroscopy. J Proteome Res 5: 483–492
Turnbaugh PJ, Ley RE, Mahowald MA, Magrini V, Mardis ER, Gordon JI(2006) An obesity-associated gut microbiome with increasedcapacity for energy harvest. Nature 444: 1027–1031
Uchida K, Nomura Y, Takeuchi N (1980) Effects of cholic acid,chenodeoxycholic acid, and their related bile acids on cholesterol,
phospholipid, and bile acid levels in serum, liver, bile, and feces ofrats. J Biochem (Tokyo) 87: 187–194
Ueyama J, Nadai M, Kanazawa H, Iwase M, Nakayama H, HashimotoK, Yokoi T, Baba K, Takagi K, Takagi K, Hasegawa T (2005)Endotoxin from various Gram-negative bacteria has differentialeffects on function of hepatic cytochrome P450 and drugtransporters. Eur J Pharmacol 510: 127–134
Uhlig S, Wendel A (1992) The physiological consequences ofglutathione variations. Life Sci 51: 1083–1094
Umesaki Y, Setoyama H (2000) Structure of the intestinal floraresponsible for development of the gut immune system in arodent model. Microbes Infect 2: 1343–1351
Wang W, Ballatori N (1998) Endogenous glutathione conjugatesoccurrence and biological functions. Pharmacol Rev 50: 335–356
Wang Y, Holmes E, Comelli EM, Fotopoulos G, Dorta G, Tang H,Rantalainen MJ, Lindon JC, Corthesy-Theulaz IE, Fay LB, KochharS, Nicholson JK (2007) Topographical variation in metabolicsignatures of human gastrointestinal biopsies revealed by high-resolution magic-angle spinning 1H NMR spectroscopy. J ProteomeRes 6: 3944–3951
Wang Y, Tang H, Holmes E, Lindon JC, Turini ME, Sprenger N,Bergonzelli G, Fay LB, Kochhar S, Nicholson JK (2005) Biochemicalcharacterization of rat intestine development using high-resolutionmagic-angle-spinning 1H NMR spectroscopy and multivariate dataanalysis. J Proteome Res 4: 1324–1329
Waters NJ, Holmes E, Waterfield CJ, Farrant RD, Nicholson JK (2002)NMR and pattern recognition studies on liver extracts and intactlivers from rats treated with a-naphthylisothiocyanate. BiochemPharmacol 64: 67–77
Wehner F (2003) Cell volume regulation: osmolytes, osmolytetransport, and signal transduction. Rev Physiol BiochemPharmacol 148: 1–80
Williams RE, Eyton-Jones HW, Farnworth MJ, Gallagher R, ProvanWM (2002) Effect of intestinal microflora on the urinary metabolicprofile of rats: a 1H-nuclear magnetic resonance spectroscopystudy. Xenobiotica 32: 783–794
Williams RE, Lenz EM, Evans JA, Wilson ID, Granger JH, Plumb RS,Stumpf CL (2005) A combined 1H NMR and HPLC-MS-basedmetabonomic study of urine from obese (fa/fa) Zucker and normalWistar-derived rats. J Pharm Biomed Anal 38: 465–471
Wostmann BS (1981) The germfree animal in nutritional studies. AnnuRev Nutr 1: 257–279
Yamauchi A, Kwon HM, Uchida S, Preston AS, Handler JS (1991) Myo-inositol and betaine transporters regulated by tonicity arebasolateral in MDCK cells. Am J Physiol 261: F197–F202
Yancey PH (2005) Organic osmolytes as compatible, metabolic andcounteracting cytoprotectants in high osmolarity and otherstresses. J Exp Biol 208: 2819–2830
Zhang J, Cerny MA, Lawson M, Mosadeghi R, Cashman JR (2007)Functional activity of the mouse flavin-containing monooxygenaseforms 1, 3, and 5. J Biochem Mol Toxicol 21: 206–215
Molecular Systems Biology is an open-access journalpublished by European Molecular Biology Organiza-
tion and Nature Publishing Group.This article is licensed under a Creative Commons Attribution-Noncommercial-Share Alike 3.0 Licence.
Gut microbiota and host metabolismSP Claus et al
14 Molecular Systems Biology 2008 & 2008 EMBO and Macmillan Publishers Limited