
Systematic changes in gene expression in postmortem human brains associated with tissue pH and...
26
1 Systematic changes in gene expression in postmortem human brains associated with tissue pH and terminal medical conditions Jun Z. Li 1,2 , Marquis P. Vawter 3 , David M. Walsh 3 , Hiroaki Tomita 3 , Simon J. Evans 4 , Prabhakara V. Choudary 5 , Juan F. Lopez 4 , Abigail Avelar 1 , Vida Shokoohi 1 , Tisha Chung 1 , Omar Mesarwi 1 , Edward G. Jones 5 , Stanley J. Watson 4 , Huda Akil 4 , William E. Bunney 3 Jr., Richard M. Myers 1,2, ++, * 1 Stanford Human Genome Center, 2 Department of Genetics, Stanford University School of Medicine, Stanford, California, USA 3 Department of Psychiatry and Human Behavior, University of California, Irvine, California, USA. 4 Mental Health Research Institute, University of Michigan, Ann Arbor, Michigan, USA. 5 Center for Neuroscience, University of California, Davis, California, USA. * Other members of Pritzker Neuropsychiatric Disorders Research Consortium and NIMH Conte Center. ++ Correspondence to Dr. Richard M. Myers, Department of Genetics, M344, Stanford University School of Medicine, Stanford, CA 94305. [email protected] Copyright © 2004 Oxford University Press HMG Advance Access published January 20, 2004 by guest on November 22, 2014 http://hmg.oxfordjournals.org/ Downloaded from
Transcript of Systematic changes in gene expression in postmortem human brains associated with tissue pH and...

1
Systematic changes in gene expression in postmortem human brains
associated with tissue pH and terminal medical conditions
Jun Z. Li1,2, Marquis P. Vawter3, David M. Walsh3, Hiroaki Tomita3, Simon J. Evans4,
Prabhakara V. Choudary5, Juan F. Lopez4 , Abigail Avelar1 , Vida Shokoohi1, Tisha
Chung1, Omar Mesarwi1 , Edward G. Jones5, Stanley J. Watson4 , Huda Akil4 , William E.
Bunney3 Jr., Richard M. Myers1,2, ++, *
1 Stanford Human Genome Center, 2 Department of Genetics, Stanford University School
of Medicine, Stanford, California, USA
3 Department of Psychiatry and Human Behavior, University of California, Irvine,
California, USA.
4 Mental Health Research Institute, University of Michigan, Ann Arbor, Michigan, USA.
5 Center for Neuroscience, University of California, Davis, California, USA.
* Other members of Pritzker Neuropsychiatric Disorders Research Consortium and
NIMH Conte Center.
++Correspondence to Dr. Richard M. Myers, Department of Genetics, M344, Stanford
University School of Medicine, Stanford, CA 94305. [email protected]
Copyright © 2004 Oxford University Press
HMG Advance Access published January 20, 2004 by guest on N
ovember 22, 2014
http://hmg.oxfordjournals.org/
Dow
nloaded from

2
Abstract Studies of gene expression abnormalities in psychiatric or neurological disorders often involve the use of postmortem brain tissue. Compared to single-cell organisms or clonal cell lines, the biological environment and medical history of human subjects cannot be controlled, and are often difficult to document fully. The chance of finding significant and replicable changes depends on the nature and magnitude of the observed variations among the studied subjects. During an analysis of gene expression changes in mood disorders, we observed a remarkable degree of natural variation among 120 samples, which represented three brain regions in 40 subjects. Most of such diversity can be accounted for by two distinct expression patterns, which in turn are strongly correlated with tissue pH. Individuals who suffered prolonged agonal states, such as with respiratory arrest, multi-organ failure, or coma, tended to have lower pH in the brain; whereas those who experienced brief deaths, associated with accidents, cardiac events or asphyxia, generally had normal pH. The lower pH samples exhibited a systematic decrease in expression of genes involved in energy metabolism and proteolytic activities, and a consistent increase of genes encoding stress-response proteins and transcription factors. This functional specificity of changed genes suggests that the difference is not merely due to random RNA degradation in low pH samples; rather it reflects a broad and actively coordinated biological response in living cells. These findings shed light on critical molecular mechanisms that are engaged during different forms of terminal stress, and may suggest clinical targets of protection or restoration.
by guest on Novem
ber 22, 2014http://hm
g.oxfordjournals.org/D
ownloaded from

3
Introduction Major depression and bipolar disorder are two of the most common and most debilitating psychiatric disorders, representing an enormous social, economic, and public health burden. Despite decades of intensive research, the cause of these disorders remains elusive (1). Functional studies have not identified a focal brain region or a particular neurotransmitter system as the primary site of abnormality. Genetic studies, taken as a whole, have not generated replicable evidence for specific chromosomal regions that harbor the culpability genes (2) or for allelic variations that show robust association in most populations, nor have they explained a major fraction of the risk (see for example (3)). Gene expression patterns, on the other hand, are likely to undergo recognizable changes in specific brain regions to initiate, sustain, or modify the altered biological states that accompany the behavior or emotional phenotypes, thus providing an excellent opportunity to characterize the neurological basis of mental disorders (4). Recent technical innovations in high-throughput methods, such as DNA microarrays, have made it possible to carry out global surveys of gene expression changes. While tens of thousands of genes can be monitored simultaneously, the number of samples measured is typically fewer than a hundred. This is especially true in comparative studies of mood disorders that make use of postmortem brain tissues, where the demanding processes of recruiting, psychiatric evaluation, case-control matching, tissue dissection, and RNA extraction and quality control, put a substantial constraint on the number of subjects that can be included in any given study. The power of finding truly significant and representative expression changes depends on the extent of the expression differences, the sample size, and the amount of variation among the studied subjects. Compared to single-cell organisms, such as E. coli or yeast cells, or cultured cell lines, the biological environments of human subjects cannot be controlled by the experimenters, and their full medical histories are often very difficult to document objectively. Furthermore, technical limitations can introduce significant amounts of additional variation (5). Because of these concerns, one of the earliest and most important tasks is to characterize all major sources of variation in gene expression in postmortem brain samples, and to understand their impact on downstream analyses. In this study, we compared postmortem brain samples from three brain regions of 40 individuals, evaluated the possible heterogeneities in gene expression among them, and tried to correlate the observed patterns with both biological and technical factors commonly examined in such studies. Results We used Affymetrix U95Av2 Genechips to analyze RNA samples from the anterior cingulate area (AnCg), dorsolateral prefrontal cortex (DLPFC), and cerebellum (CB) of nine patients with Bipolar Disorder (BPD), 11 patients with Major Depressive Disorder (MDD) and 20 normal controls. After data pre-processing, which included normalization and averaging over two replicate arrays for each sample, we calculated the Pearson’s correlations between all possible pairs of samples by using the expression values of all genes, and displayed the 40-by-40 correlation values in a color-coded grid where samples are placed in the same order in the left -to-right direction and the top-to-bottom direction.
by guest on Novem
ber 22, 2014http://hm
g.oxfordjournals.org/D
ownloaded from

4
(Figures 1a, b, and c, for AnCg, DLPFC, and CB samples, respectively). These “similarity heat maps” not only allow direct visual assessment of sample heterogeneity and comparability, but also reveal that most samples can be clustered into two main classes. Only a small number (1-3) of RNA samples cannot be classified into the two groups with certainty, for example, the AnCg sample of one Type 1 subject (see below) exhibits the pattern characteristic of Type 2 subjects, while the DLPFC samples of two Type 2 subjects, and the CB samples of three Type 2 subjects can be assigned to Type 1. However, each of these cases involves a different subject, and all are contradicted by quantitative reverse transcription – polymerase chain reaction (qRT-PCR, see be low). The majority of the assignments are maintained when we adopt other quantitative indices to measure between-sample distance (such as the Spearman’s rank correlation, or Median Absolute Difference), or when we use genes of different sample-sample variances to calculate the distance (data not shown). The gene expression values generated by using Microarray Analysis Software, version 5 (MAS5, Affymetrix, Santa Clara, CA) or dCHIP (6) yield similar findings. By using PAM, a software program that uses the “nearest shrunken centroid” algorithm to construct expression pattern class predictors (7) , we found that with gene sets that contain from several tens to several thousand genes, there were usually 1-5 cross-validation errors among the 40 samples in any of the three regions (data not shown). With the exception of a small number (1-3) of subjects, the classification agrees between the three regions of the same brain, suggesting that the observed patterns reflect an overall property of the brain, rather than being due to region-specific differences, or to technical factors in sample processing. By combining the evidence from all three regions, we define 17 subjects as “Type 2” and 23 subjects as “Type 1”. To complement the microarray experiments, we measured the transcript levels for 198 candidate genes by using qRT-PCR. We did not select these genes with the knowledge of Type 1 - Type 2 differences, but based solely on their known biological functions. An unsupervised, hierarchical clustering analysis (8) demonstrated the drastic difference between the two main clusters (Supplementary Figure 1), and independently confirmed the Type 1 - Type 2 assignments derived from the microarray data, with only two discrepancies (one AnCg sample, and one DLPFC sample for a different subject). There are 13 Type 2 subjects among the 20 controls; only two among the nine BP patients, and two among the 11 MDD patients (Table 1). A case -control comparison with all samples would have produced a large number of “positives” primarily driven by the substantial Type 1 - Type 2 differences. Although some of these differences may underlie the biological abnormalities associated with mood disorders, they may also represent natural variations in postmortem samples that result from extraneous, short-term, physiological rather than long-term, psychiatric causes. We compared the Type 1-Type 2 classification obtained from the microarray data with age of the subjects, post-mortem interval (PMI, interval between death and the time the tissue is frozen), and tissue pH, and found that the two observed expression patterns were strongly correlated with pH, with almost no correlation with PMI or age (Figure 2). In fact, the effect associated with tissue pH far exceeds those arising from gender, age, PMI, and the actual feature we are most interested in studying: mood disorder patients versus controls (not shown).
by guest on Novem
ber 22, 2014http://hm
g.oxfordjournals.org/D
ownloaded from

5
While we initially did not match cases and controls by cause of death, a re-examination of the clinical records revealed a striking disparity in terminal medical conditions between the Type 1 and Type 2 subjects. Nine of the 10 cancer patients, who suffered a prolonged death involving extended periods of respiratory or multi-orga n failure, were Type 2. Their medical complications likely led to hypoxia or acidosis in the brain. Conversely, 10 of the 11 suicide victims were Type 1. They experienced relatively rapid deaths, and their brains are of normal pH. The distributions of Type 1 and Type 2 subjects in different Johnston agonal categories (9) are also significantly different (Table 2, P < 0.005, Fisher Exact Test). This relationship between pH and rapidity of death was in agreement with previous reports (10-13). The expression differences between the two classes affected a major portion of all genes measured. A comparison of Type 1 and Type 2 AnCg samples, for example, reveal significant differences at P < 0.01 in about half, and P < 0.001 in about a third, of the probe sets (Welch’s approximate t tests). In the Significance Analysis of Microarrays (14) , the top 75% of all probe sets had a median False Discovery Rate of less than 5%. To put the breadth of this difference in perspective, in a separate study, we observed that only one sixth of the > 20,000 genes analyzed are differentially expressed at P < 0.01 (Welch’s approximate t tests) between nine human and ten chimpanzee lymphoblastoid cell lines (Zhang et al., manuscript in preparation). Because statistical significance is influenced by sample size, we also compare the magnitude of the differences. Approximately 20% and 6.3% of all probe sets are different between Type 1 and Type 2 brain samples by two-fold and four-fold, respectively, almost exactly the same as those observed between the mouse liver and kidney cells (21% and 6.5%, respectively) (5). In contrast, only 3% and 0.2% are different at these levels between the human and chimpanzee lymphoblastoid cell lines. In brain samples, only 1.8% and 7% of genes, respectively, were differentially expressed above the two-fold level between the human and chimpanzee, and human and orangutan samples (15). Considering that about half of the probe sets are called “Absent” in MAS5 due to low signal intensities, these results reflect strong and genome-wide gene expression changes in our brain samples. Several studies have investigated the relationship between RNA quality and pre- or post-mortem factors (such as PMI) (16-19). Others have identified tissue pH as an indicator of overall RNA stability or the levels of specific mRNAs (9, 12, 20, 21). These studies focused on a limited number (1-16) of genes, sometimes describing only the total amounts of extracted RNA, or the presence or absence of individual transcripts. By contrast, we used our genome-wide quantitative data to address the global question as to whether the Type 2 expression pattern reflects coherent biological regulation in living cells, or alternatively, results from general breakdown of RNA preservation. We calculated the Welch’s approximate t scores between the 23 Type 1 and 17 Type 2 AnCg samples, and identified Gene Ontology (GO) (22) terms that (1) occur more frequently among genes with large positive or large negative t scores and (2) contain genes whose averaged t score is significantly greater or smaller than zero. This unbiased approach shows that genes responsible for “Defense response”, “Immune response” and “Transcription regulation” have consistently negative t scores, i.e., are up-regulated in low pH (Type 2) samples (Table 3); whereas genes involved in “Oxidative
by guest on Novem
ber 22, 2014http://hm
g.oxfordjournals.org/D
ownloaded from
6
phosphorylation” or encoding “NADH dehydrogenase”, “26S proteasome” and “Hydrogen ion transporter” are generally down-regulated. For example, transcript levels for lysosomal ATPases that transport protons into lysosomes, mitochondrial ATP synthases that convert free energy obtained from the electron transport chain into the production of ATP, most subunits of the 26S proteasome, cytochrome c oxidase, and NADH dehydrogenase, are decreased (Figure 3). Genes involved in the stress response (Supplementary Figure 2a) or immunological functions (Supplementary Figure 2b) are increased. The results in Table 3 are significant even after adjusting for multiple hypotheses testing. For example, when we randomly draw 1,000 genes and counted the occurrence of GO terms, on average, only one term is over- or under-represented at P < 10-4 during each permutation. A similar analysis of the KEGG (23) terms also reveal that genes associated with “Apoptosis” and “Ribosome” show higher expression in low pH samples, and genes involved in “ATP synthesis”, “Oxidative phosphorylation” and “Proteasome” show lower expression (not shown). These findings are consistent with the report that immune-modulated, stress-induced, and hormonally-regulated genes are among the most variably expressed genes in murine tissues (5). Transcripts for many transcription factors are increased in the Type 2 samples (Supplementary Figure 3a), though some of those involved in cell cycle control and general transcriptional regulation are moderately decreased (Supplementary Figure 3b). Several transcription factor families, such as the zinc-finger proteins and nuclear receptors (Supplementary Figure 3c), have both members that are increased and, to a lesser extent, members that are decreased, probably due to the specific positive- or negative-feedback regulation of these genes. Discussion In this study, we observed a remarkable degree of natural variation in expression levels among 40 subjects. Interestingly, most of this sample-to-sample variation can be accounted for by two prototypical expression patterns, which in turn are explained by pH of the brain tissue and pre-death medical conditions. Furthermore, the genes that are changed include those involved in mitochondria respiratory function and stress response. The link between tissue acidity, energy metabolism, and physiological stress results from the tight coupling between energy metabolism and the production and consumption of protons (24). Under conditions such as hypoxia or ischemia, anaerobic metabolic pathways, particularly the lactic acid cycle, are activated, resulting in an enhanced production of acid equivalents, and intra- and intercellular acidosis (13, 25). The human brain has densely packed cells, relatively small cell bodies, and high levels of constitutive activity during normal function, is therefore particularly demanding of efficient energy metabolism, and is uniquely vulnerable with reduced oxygen supply. Our data suggest that under prolonged hypoxia, ordinary transcriptional programs are re-configured to divert the cellular resources to the increase of the more pressingly needed transcripts: those involved in stress response, apoptosis and inflammation control. There seems to be a critical pH threshold (around 6.8; also see below) in the brain, below which such transcriptional changes are accelerated. Type 2 samples are strongly correlated with each other (Figures 1a-c), suggesting that, while individual subjects experienced agonal stress
by guest on Novem
ber 22, 2014http://hm
g.oxfordjournals.org/D
ownloaded from

7
due to a multitude of causes, their expression patterns arrived at a definable and relatively stable regulatory endpoint, rather than exhibiting a diverse assortment of RNA degradation states. The functional coherence of changed genes depicts a biological response tha t is markedly different from the commonly held view that more stressed brains yield tissues of low pH, which simply contain degraded RNA, which, as a type of biological material, means just an increase of random noise in gene expression profiling. Our dat a suggest that, rather than more stress versus less stress, a distinction between long and short agonal duration is probably more relevant, as is whether the primary site of medical crisis is in the brain or elsewhere. Most of our Type 2 subjects were “brought down” by gradual failures of peripheral organs in hours, if not days; while most of the Type 1 brains were shut down suddenly, in minutes. Most of the Type 1 subjects died of a primary or abrupt assault of the brain – often involving acute hypoxia during cardiac events, suicide, or accident – our data suggest that their brains failed without exhausting the ATP store in the cells, nor did the cells had time to up-regulate stress response genes or down-regulate the energy metabolism genes. The Type 2 brains, on the other hand, may have gradually spent most of the molecular fuel, and have down-regulated genes in aerobic metabolism by 2- to 4-fold (Figure 3) -- only then did the brain cross a threshold, hours after the primary failure at another vital organ. Together, these results raise the interesting and practical possibility of leading to molecular targets of intervention in a clinical setting. For example, in animal models as well as in humans, if levels of certain RNA transcripts, proteins, small organic compounds, or specific metabolites can be found in the circulating blood that correlate strongly with the gene expression changes in the brain, these molecules could be used as peripheral markers that report the stress load and adaptive reserve of metabolic or proteolytic activities in the brain, predict imminent crisis, and inform the appropriate medical procedures that take into account of the unique limitations of the brain. Several tantalizing questions still remain. We do not know if neurons in different layers of the cortex or cerebellum have different vulnerabilities, nor if cell death and RNA degradation would occur at different rates in different types of cells (such as neurons and glial cells), which would effectively alter the relative abundance of different cell types in the tissue. Different methods of measuring pH may affect the ability to observe the association between pH, medical condition, and gene expression. We found that, during pH measurement, longer and more thorough cell lysis generated tissue homogenates of progressively lower pH (data not shown), possibly due to the gradual breakdown of highly acidic intracellular organelles, such as mitochondria and lysosomes, which have an interior pH of ~5.0. The protons from these high concentration sources may introduce large variations in pH readings, and weaken the correlation between the observed pH values and the expression pattern changes in the cytosol. At least one other brain bank has reported median pH (~ 6.1) lower than those observed in our Type 2 samples (21). Other collections had similar pH values as our Type 1 samples (26). Whether the difference is largely due to different techniques for lysing the cells, or to inherent differences in the samples, remains unknown.
by guest on Novem
ber 22, 2014http://hm
g.oxfordjournals.org/D
ownloaded from

8
What is also unclear is the relative contribution of regulated, de novo mRNA synthesis versus gene-specific, stimulus-dependent mRNA turnover. Several recent studies showed that, in addition to transcription initiation, the control of transcript decay rate is also an integral part of transcriptional regulation (27-33). For example, genes encoding proteins that form stoichiometric complexes (such as proteasomes) in yeast tend to have closely matched transcript turnover rates (29). Many of the activation-induced genes in human T lymphocytes produced transcripts with short half-lives (27). However, we believe that de novo transcription still plays a predominant role in eliciting the observed differences in postmortem samples. This is because that in these studies, energy metabolism genes were not among those producing the short-lived transcripts (28, 29, 33). Furthermore, transcripts for many transcription factors are increased in our low pH samples. In a recent study, Enard et al (15) compared three human prefrontal cortex samples with three chimpanzee brain samples, and found that not only the human-chimpanzee differences in the brain are larger than the corresponding differences in liver and in blood, but that the three human brains were also highly divergent—brain 2 was very different from brains 1 and 3—more so than the divergence among the three chimpanzee brains. This observation was interpreted as evidence for greater intra-specific variations of gene expression in human brains as compared to other primates (34). We downloaded the Affymetrix chip files for the three human cortical samples reported in that study, and included them in our comparisons of 40 DLPFC samples (Figure 1b). Interestingly, Brain 2 in their study can be readily classified as Type 2, whereas Brains 1 and 3 are clearly Type 1 samples. Thus, the intra-specific diversity observed in that study can be largely explained by the pH-related effect. In fact, the functional pathways that we highlighted -- most notably energy metabolism and stress/immune responses -- are among the most adaptable and responsive biological processes. As a result, genes in these pathways are often highly variable between biological specimens, such as in identically handled tissues from rodents of identical genetic background (5) , in human brains (this study), or in human and chimpanzee cell lines (our unpublished observation). These genes also tend to be tightly co-regulated, and have been reported as among the principle findings of differential expression in a number of comparative studies, including, for example, in bipolar disorder (35) , in skeletal muscles of human diabetics (36), in the kidneys of diabetic mice (37) , in the development and longevity of C. elegans (38) , in muscles of rhesus monkey during aging or caloric restriction (39) , in murine models of myocarditis (40), and in cultured cells under stimulation or stress (41). Many of these findings may have indeed captured a genuine functional aspect of the trait of interest, such as the abnormalities in energy management in diabetes, or the possible hypoactivity in specific brain regions in psychiatric diseases. But at the same time, the drastic changes in these pathways during terminal stress also make it very difficult to use postmortem samples to study or to confirm their contributions to the etiology or progression of chronic disorders. Genes in these pathways are likely to be under strong, transient, and coordinated regulation by a variety of biological factors, many of which are changing rapidly during the terminal stages of life. In our case, potential earlier involvement of these genes in the etiology of mental
by guest on Novem
ber 22, 2014http://hm
g.oxfordjournals.org/D
ownloaded from

9
disorders could be readily obscured, and may still be highly heterogeneous among samples that are of normal pH. For example, we have found that among the supposedly more homogeneous Type 1 samples, a major portion of the remaining variability still involve the same pathways that are drastically different between Type 1 and Type 2 samples, albeit to a much lesser extent. The eventual demonstration of the role played by these pathways in mental illnesses requires careful evaluation of all the confounding factors, and possibly in conjunction with in vivo imaging or other functional approaches. Even in samples that have an apparent match of pH and agonal factors, it may still be instructive to carry out a post hoc evaluation of heterogeneity in expression profiles, followed by a data-driven, reverse screening of possible explanatory factors in a manner similar to this study. While the observed expression patterns depend primarily on each person’s physiological condition at death, we do not know if there are inter-individual variabilities in the capacity or tendency in managing similar levels of metabolic stress, nor do we understand the extent to which regulatory activities in dying brains share common mechanisms with those invoked during chronic psychiatric maladaptation in mood disorders. Nevertheless, our analysis provides a global view of transcriptional re-programming in response to stresses of different nature and duration, and the identification of pH and medical conditions as principal explanatory factors for the marked variability in gene expression among postmortem brain samples. As postmortem tissue serves as a primary reagent linking physicians, pathologists and molecular geneticists in a wide variety of studies, pH values can be used as a readily measurable, objective criterion in tissue banking and sample matching, and should be regarded, together with clinical assessments, as a potential major confounder in quantitative studies that make use of such material. Furthermore, the observed gene expression changes may set major constraints on the molecular descriptions of cell death and brain death, and inform deeper regulatory logic of the brain in times of crisis. Whether they also suggest targets of protection or restoration in the clinical setting remains an interesting and practical question. Materials and Methods Human subjects Brain tissue was obtained by the authors at the University of California at Irvine with the consent of decedents’ next-of-kin. Information from the medical examiner’s conclusions, coroner’s investigation, medical records, and interviews of relatives were examined for information concerning physical health, medication use, psychopathology, substance use, and details of death. Agonal duration ratings were assigned to samples based on a scale by Johnston, et al (9). The 40 decedents consist of 20 without neurological or psychiatric diseases and 20 with major depression or bipolar affective disorder. Mean post-mortem interval was 22.6 hours (s.d. 7.14) and mean freezer duration was 38.1 months (s.d. 25.3). Decedents’ average age was 52.4 years (s.d. 15.9). Additional details concerning demographics, psychiatric diagnoses and agonal duration appear in Tables 1 and 2. RNA extraction and microarray experiments
by guest on Novem
ber 22, 2014http://hm
g.oxfordjournals.org/D
ownloaded from

10
Coronal slices of the brain were rapidly frozen on pre-cooled (to –120 °C) aluminum plates, and stored at –80 °C (see (42) for additional details). Following tissue dissection, total RNA was isolated by using TRIzol? reagents (Invitrogen, Carlsbad, CA), and shipped to the four research groups that collaborate on this project (University of California, Irvine; University of California, Davis; University of Michigan and the Stanford University). A detailed analysis of conventional indicators of RNA preservation, such as 28S/18S rRNA ratios, is presented in (Tomita et al, manuscript in preparation). Sample labeling and hybridization followed the exact Affymetrix procedures. Every sample was analyzed on two HuU95Av2 Genechips, one each at two different laboratories (AnCg and CB at University of California, Irvine; DLPFC and CB at University of California, Davis; AnCg and DLPFC at University of Michigan). Tissue pH measurement A 50-100 mg piece of cerebellar cortical tissue was mixed with 1.0 mm glass beads (BioSpec Products, Bartlesville, OK) and distilled deionized water in a 10% (w/v) solution, and homogenized by using Bead-Beater (BioSpec Products, Bartlesville, OK) for 60 seconds at 4 °C. The homogenate was measured at room temperature with a pH meter (Corning, Cypress , CA). Data processing and analysis We used the Robust Multichip Analysis (RMA) software (43) to analyze Affymetrix CEL files. After median-centering and normalized all arrays, we averaged the two replicated chips for each sample. Because the 40 subjects were analyzed in two cohorts of 20 each, there were cohort-specific effects not observed when we used RT-PCR to analyze all samples. We therefore median-centered the expression levels for each gene within the two cohorts separately, and used all ~12,000 probe sets to calculate the Pearson’s correlations between all possible sample pairs within each brain region. Each correlation thus indicates the overall similarity between two samples across all genes measured. The primary 40-by-40 correlation tables were graphically represented by a 40-by-40 grid where each cell is colored according to the individual correlation values for that particular pair of samples. The ordering of samples within Type 1 samples and within Type 2 samples was determined by a two-way clustering of the correlation matrices with the Cluster software (8), and is slightly different between Figures 1a, 1b and 1c. To analyze the six Affymetrix U95A chips for the three human cortical samples reported in (15) , we removed the expression values for the 26 probe sets that were not shared by the U95AV2 chips. For the remaining probe sets, we averaged the duplicate chips for each of the three samples, and included them with our 40 DLPFC samples to calculate the pairwise correlations in all 43 samples. Quantitative RT-PCR All amplicons were 70-130 bp in length, targeting the 600 bp 3'-most segment of the Refseq mRNA sequences for each gene. Total RNA was treated with DNase I (Ambion, Austin, TX), and converted to first-strand cDNA by using the Superscript Reverse Transcriptase (Gibco, BRL) and oligo-dT primer. Real-time PCR amplifications were performed on the iCycler Real-time Detection System (Bio-Rad, Hercules, CA). Each sample was measured in duplicate. For each gene, the average cycle number of the
by guest on Novem
ber 22, 2014http://hm
g.oxfordjournals.org/D
ownloaded from

11
duplicate was used to subtract a reference pattern, defined either as the average cycle numbers of four reference genes (ACTB, ACTG1, PPIA, and GAPDH), or the average cycle numbers of all 198 genes. The referenced cycle numbers of 198 genes in 80 samples were median-centered across genes, and clustered by using the Average Linkage Clustering in the Cluster software (8). Analyzing gene annotation We mapped Human Unigene clusters to GO terms and KEGG pathways terms. For the ~6,600 Unigenes with GO annotations, we counted the number of occurrences for each GO term among the 1,000 Unigenes of largest t scores and the 1,000 of smallest t scores. We calculated the nominal P value of the disproportionate representation of a GO term in the 1,000 subset as the probability of observing equal or more extreme counts. Because of the large number of annotation terms simultaneously tested, and their overlapping nature, we assessed the overall significance by establishing a null distribution for P through repeated random re-sampling of 1,000 genes and pooling of P values. For each GO term, we also calculated the average and standard deviation of t scores for all Unigenes associated with the term, and evaluated its significance by the Student’s t test where the null hypothesis is such that the average t score is zero. Acknowledgements We are grateful for the assistance of Xiaohong Fan and Phong Nguyen, Jacque Berndt (Orange County Coroners Office), and Wallace W. Tourtellotte (Human Brain and Spinal Fluid Resource Center). We thank Kevin Overman for pH measurements, and Robert Thompson, Fan Meng, and Terry Speed for helpful discussions. This project was supported by the Pritzker Neuropsychiatric Disorders Research Consortium Fund and NIMH Silvio O. Conte Centers for the Neuroscience of Mental Disorders (MH60398).
by guest on Novem
ber 22, 2014http://hm
g.oxfordjournals.org/D
ownloaded from

12
References 1. Nestler, E.J., Barrot, M., DiLeone, R.J., Eisch, A.J., Gold, S.J. and Monteggia,
L.M. (2002) Neurobiology of depression. Neuron, 34, 13-25. 2. Segurado, R., Detera-Wadleigh, S.D., Levinson, D.F., Lewis, C.M., Gill, M.,
Nurnberger, J.I., Jr., Craddock, N., DePaulo, J.R., Baron, M., Gershon, E.S. et al. (2003) Genome scan meta-analysis of schizophrenia and bipolar disorder, part III: Bipolar disorder. Am. J. Hum. Genet., 73, 49-62.
3. Lohmueller, K.E., Pearce, C.L., Pike, M., Lander, E.S. and Hirschhorn, J.N. (2003) Meta-analysis of genetic association studies supports a contribution of common variants to susceptibility to common disease. Nat. Genet., 33, 177-82.
4. Bunney, W. E., Bunney, B.G., Vawter, M.P., Tomita, H., Li, J., Evans, S.J., Choudary, P.V., Myers, R.M., Jones, E.G., Watson, S.J. et al. (2003) Microarray technology: a review of new strategies to discover candidate vulnerability genes in psychiatric disorders. Am. J. Psychiatry., 160, 657-66.
5. Pritchard, C.C., Hsu, L., Delrow, J. and Nelson, P.S. (2001) Project normal: defining normal variance in mouse gene expression. Proc. Natl. Acad. Sci. U S A, 98, 13266-71.
6. Li, C. and Wong, W.H. (2001) Model-based analysis of oligonucleotide arrays: expression index computation and outlier detection. Proc. Natl. Acad. Sci. U S A, 98, 31-6.
7. Tibshirani, R., Hastie, T., Narasimhan, B. and Chu, G. (2002) Diagnosis of multiple cancer types by shrunken centroids of gene expression. Proc. Natl. Acad. Sci. U S A, 99, 6567-72.
8. Eisen, M.B., Spellman, P.T., Brown, P.O. and Botstein, D. (1998) Cluster analysis and display of genome -wide expression patterns. Proc. Natl. Acad. Sci. U S A, 95, 14863-8.
9. Johnston, N.L., Cervenak, J., Shore, A.D., Torrey, E.F., Yolken, R.H. and Cerevnak, J. (1997) Multivariate analysis of RNA levels from postmortem human brains as measured by three different methods of RT-PCR. Stanley Neuropathology Consortium. J. Neurosci. Methods, 77, 83-92.
10. Hardy, J.A., Wester, P., Winblad, B., Gezelius, C., Bring, G. and Eriksson, A. (1985) The patients dying after long terminal phase have acidotic brains; implications for biochemical measurements on autopsy tissue. J. Neural. Transm., 61, 253-64.
11. Wester, P., Bateman, D.E., Dodd, P.R., Edwardson, J.A., Hardy, J.A., Kidd, A.M., Perry, R.H. and Singh, G.B. (1985) Agonal status affects the metabolic activity of nerve endings isolated from postmortem human brain. Neurochem. Pathol., 3, 169-80.
12. Harrison, P.J., Heath, P.R., Eastwood, S.L., Burnet, P.W., McDonald, B. and Pearson, R.C. (1995) The relative importance of premortem acidosis and postmortem interval for human brain gene expression studies: selective mRNA vulnerability and comparison with their encoded proteins. Neurosci. Lett., 200, 151-4.
by guest on Novem
ber 22, 2014http://hm
g.oxfordjournals.org/D
ownloaded from

13
13. Yates, C.M., Butterworth, J., Tennant, M.C. and Gordon, A. (1990) Enzyme activities in relation to pH and lactate in postmortem brain in Alzheimer-type and other dementias. J. Neurochem., 55, 1624-30.
14. Tusher, V.G., Tibshirani, R. and Chu, G. (2001) Significance analysis of microarrays applied to the ionizing radiation response. Proc. Natl. Acad. Sci. U S A, 98, 5116-21.
15. Enard, W., Khaitovich, P., Klose, J., Zollner, S., Heissig, F., Giavalisco, P., Nieselt-Struwe, K., Muchmore, E., Varki, A., Ravid, R. et al. (2002) Intra- and interspecific variation in primate gene expression patterns. Science, 296, 340-3.
16. Guillemette, J.G., Wong, L., Crapper McLachlan, D.R. and Lewis, P.N. (1986) Characterization of messenger RNA from the cerebral cortex of control and Alzheimer-afflicted brain. J. Neurochem., 47, 987-97.
17. Castensson, A., Emilsson, L., Preece, P. and Jazin, E.E. (2000) High-resolution quantification of specific mRNA levels in human brain autopsies and biopsies. Genome Res., 10, 1219-29.
18. Cummings, T.J., Strum, J.C., Yoon, L.W., Szymanski, M.H. and Hulette, C.M. (2001) Recovery and expression of messenger RNA from postmortem human brain tissue. Mod. Pathol., 14, 1157-61.
19. Trotter, S.A., Brill, L.B., 2nd and Bennett, J.P., Jr. (2002) Stability of gene expression in postmortem brain revealed by cDNA gene array analysis. Brain Res., 942, 120-3.
20. Kingsbury, A.E., Foster, O.J., Nisbet, A.P., Cairns, N., Bray, L., Eve, D.J., Lees, A.J. and Marsden, C.D. (1995) Tissue pH as an indicator of mRNA preservation in human post-mortem brain. Brain Res. Mol. Brain Res., 28, 311-8.
21. Torrey, E.F., Webster, M., Knable, M., Johnston, N. and Yolken, R.H. (2000) The stanley foundation brain collection and neuropathology consortium. Schizophr. Res., 44, 151-5.
22. Ashburner, M., Ball, C.A., Blake, J.A., Botstein, D., Butler, H., Cherry, J.M., Davis, A.P., Dolinski, K., Dwight, S.S., Eppig, J.T. et al. (2000) Gene ontology: tool for the unification of biology. The Gene Ontology Consortium. Nat. Genet., 25, 25-9.
23. Ogata, H., Goto, S., Sato, K., Fujibuchi, W., Bono, H. and Kanehisa, M. (1999) KEGG: Kyoto Encyclopedia of Genes and Genomes. Nucleic Acids Res., 27, 29-34.
24. Kaila, K. and Ransom, B.R. (1998) pH and brain function. Wiley-Liss, New York.
25. Rehncrona, S., Rosen, I. and Siesjo, B.K. (1981) Brain lactic acidosis and ischemic cell damage: 1. Biochemistry and neurophysiology. J. Cereb. Blood. Flow. Metab., 1, 297-311.
26. Middleton, F.A., Mirnics, K., Pierri, J.N., Lewis, D.A. and Levitt, P. (2002) Gene expression profiling reveals alterations of specific metabolic pathways in schizophrenia. J. Neurosci., 22, 2718-29.
27. Lam, L.T., Pickeral, O.K., Peng, A.C., Rosenwald, A., Hurt, E.M., Giltnane, J.M., Averett, L.M., Zhao, H., Davis, R.E., Sathyamoorthy, M. et al. (2001) Genomic-scale measurement of mRNA turnover and the mechanisms of action of the anti-cancer drug flavopiridol. Genome Biol., 2, RESEARCH0041.
by guest on Novem
ber 22, 2014http://hm
g.oxfordjournals.org/D
ownloaded from

14
28. Bernstein, J.A., Khodursky, A.B., Lin, P.H., Lin-Chao, S. and Cohen, S.N. (2002) Global analysis of mRNA decay and abundance in Escherichia coli at single-gene resolution using two-color fluorescent DNA microarrays. Proc. Natl. Acad. Sci. U S A, 99, 9697-702.
29. Wang, Y., Liu, C.L., Storey, J.D., Tibshirani, R.J., Herschlag, D. and Brown, P.O. (2002) Precision and functional specificity in mRNA decay. Proc. Natl. Acad. Sci. U S A, 99, 5860-5.
30. Gutierrez, R.A., Ewing, R.M., Cherry, J.M. and Green, P.J. (2002) Identification of unstable transcripts in Arabidopsis by cDNA microarray analysis: rapid decay is associated with a group of touch- and specific clock-controlled genes. Proc. Natl. Acad. Sci. U S A, 99, 11513-8.
31. Fan, J., Yang, X., Wang, W., Wood, W.H., 3rd, Becker, K.G. and Gorospe, M. (2002) Global analysis of stress-regulated mRNA turnover by using cDNA arrays. Proc. Natl. Acad. Sci. U S A, 99, 10611-6.
32. Raghavan, A., Ogilvie, R.L., Reilly, C., Abelson, M.L., Raghavan, S., Vasdewani, J., Krathwohl, M. and Bohjanen, P.R. (2002) Genome-wide analysis of mRNA decay in resting and activated primary human T lymphocytes. Nucleic Acids Res., 30, 5529-38.
33. Selinger, D.W., Saxena, R.M., Cheung, K.J., Church, G.M. and Rosenow, C. (2003) Global RNA half-life analysis in Escherichia coli reveals positional patterns of transcript degradation. Genome Res., 13, 216-23.
34. Gu, J. and Gu, X. (2003) Induced gene expression in human brain after the split from chimpanzee. Trends Genet., 19, 63-5.
35. Kato, T. and Kato, N. (2000) Mitochondrial dysfunction in bipolar disorder. Bipolar Disord., 2, 180-90.
36. Mootha, V.K., Lindgren, C.M., Eriksson, K.F., Subramanian, A., Sihag, S., Lehar, J., Puigserver, P., Carlsson, E., Ridderstrale, M., Laurila, E. et al. (2003) PGC-1alpha-responsive genes involved in oxidative phosphorylation are coordinately downregulated in human diabetes. Nat. Genet., 34, 267-73.
37. Wilson, K.H., Eckenrode, S.E., Li, Q.Z., Ruan, Q.G., Yang, P., Shi, J.D., Davoodi-Semiromi, A., McIndoe, R.A., Croker, B.P. and She, J.X. (2003) Microarray analysis of gene expression in the kidneys of new- and post-onset diabetic NOD mice. Diabetes, 52, 2151-9.
38. Wang, J. and Kim, S.K. (2003) Global analysis of dauer gene expression in Caenorhabditis elegans. Development, 130, 1621-34.
39. Kayo, T., Allison, D.B., Weindruch, R. and Prolla, T.A. (2001) Influences of aging and caloric restriction on the transcriptional profile of skeletal muscle from rhesus monkeys. Proc. Natl. Acad. Sci. U S A, 98, 5093-8.
40. Garg, N., Popov, V.L. and Papaconstantinou, J. (2003) Profiling gene transcription reveals a deficiency of mitochondrial oxidative phosphorylation in Trypanosoma cruzi-infected murine hearts: implications in chagasic myocarditis development. Biochim. Biophys. Acta, 1638, 106-20.
41. Zhang, Y., Song, S. , Fong, C.C., Tsang, C.H., Yang, Z. and Yang, M. (2003) cDNA microarray analysis of gene expression profiles in human fibroblast cells irradiated with red light. J. Invest. Dermatol., 120, 849-57.
by guest on Novem
ber 22, 2014http://hm
g.oxfordjournals.org/D
ownloaded from

15
42. Jones, E.G., Hendry, S.H., Liu, X.B., Hodgins, S., Potkin, S.G. and Tourtellotte, W.W. (1992) A method for fixation of previously fresh-frozen human adult and fetal brains that preserves histological quality and immunoreactivity. J. Neurosci. Methods, 44, 133-44.
43. Irizarry, R.A., Bolstad, B.M., Collin, F., Cope, L.M., Hobbs, B. and Speed, T.P. (2003) Summaries of Affymetrix GeneChip probe level data. Nucleic Acids Res., 31, e15.
by guest on Novem
ber 22, 2014http://hm
g.oxfordjournals.org/D
ownloaded from

16
Figure Legends Figure 1. Color-coded pairwise correlation matrices among 40 AnCg (a), 40 DLPFC (b), and 40 CB (c) samples. The ordering of samples are the same in the left-to-right direction and the top-to-bottom direction. The 17 Type 2 samples are grouped in the upper left corner, as marked by the yellow lines. Figure 1b also included the Affymetrix chips for the three human cortical samples reported in ref.(15) , which are labeled as “1”, “2” and “3”. Figure 2. Clustering diagram of microarray data for the 40 AnCg samples, and the plot of individual pH, Age (year) and PMI (hour) values. Seventeen Type 2 samples and one Type 1 sample are shown on the left branch. This sample is classified as Type 1 after considering data from all three brain regions and the RT-PCR data. Figure 3. Expression levels of several gene families, including proteasome subunits and genes involved in energy metabolism, in the 40 AnCg samples. The 17 Type 2 samples are on the left of the yellow line. Some genes appear multiple times because they correspond to multiple Affymetrix probe sets.
by guest on Novem
ber 22, 2014http://hm
g.oxfordjournals.org/D
ownloaded from
17
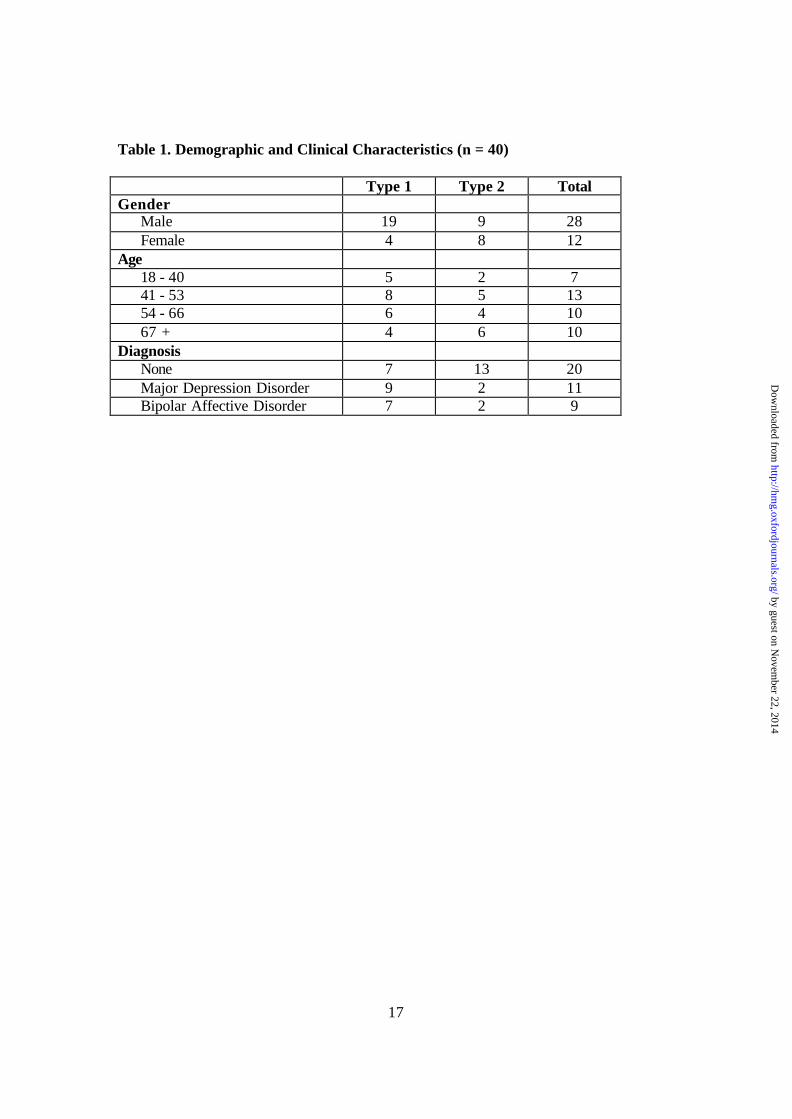
Table 1. Demographic and Clinical Characteristics (n = 40) Type 1 Type 2 Total Gender
Male 19 9 28 Female 4 8 12
Age 18 - 40 5 2 7 41 - 53 8 5 13 54 - 66 6 4 10 67 + 4 6 10
Diagnosis None 7 13 20 Major Depression Disorder 9 2 11 Bipolar Affective Disorder 7 2 9
by guest on Novem
ber 22, 2014http://hm
g.oxfordjournals.org/D
ownloaded from

18
Table 2. Numbers of Type 1 and Type 2 subjects in different agonal duration categories according to the Johnston scale (ref).
Agonal duration Type 1 Type 2 Total Instantaneous 8 1 9 <24 h / minimal hypoxia 13 5 18 >24 h / some hypoxia 1 2 3 Slow death > 24 h 1 8 9 Slow death w/ vent 0 1 1 Total 23 17 40
by guest on Novem
ber 22, 2014http://hm
g.oxfordjournals.org/D
ownloaded from
19
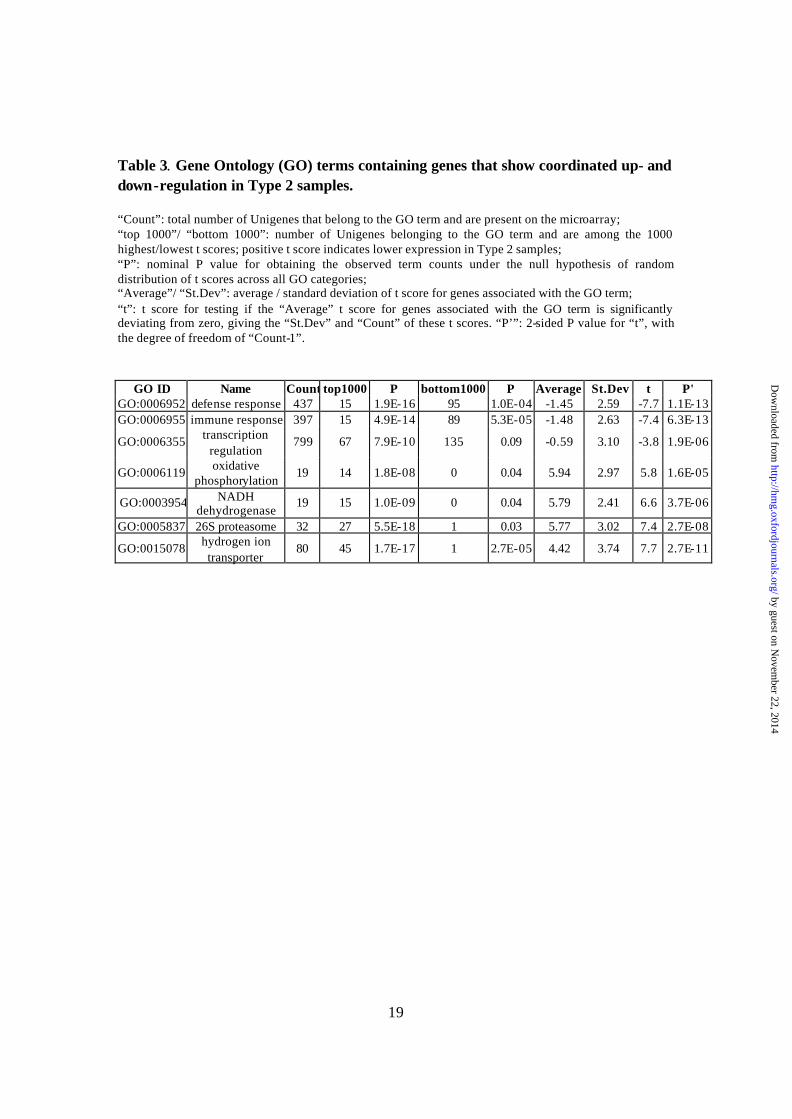
Table 3. Gene Ontology (GO) terms containing genes that show coordinated up- and down-regulation in Type 2 samples. “Count”: total number of Unigenes that belong to the GO term and are present on the microarray; “top 1000”/ “bottom 1000”: number of Unigenes belonging to the GO term and are among the 1000 highest/lowest t scores; positive t score indicates lower expression in Type 2 samples; “P”: nominal P value for obtaining the observed term counts under the null hypothesis of random distribution of t scores across all GO categories; “Average”/ “St.Dev”: average / standard deviation of t score for genes associated with the GO term; “t”: t score for testing if the “Average” t score for genes associated with the GO term is significantly deviating from zero, giving the “St.Dev” and “Count” of these t scores. “P’”: 2-sided P value for “t”, with the degree of freedom of “Count-1”.
GO ID Name Count top1000 P bottom1000 P Average St.Dev t P' GO:0006952 defense response 437 15 1.9E-16 95 1.0E-04 -1.45 2.59 -7.7 1.1E-13 GO:0006955 immune response 397 15 4.9E-14 89 5.3E-05 -1.48 2.63 -7.4 6.3E-13
GO:0006355 transcription regulation
799 67 7.9E-10 135 0.09 -0.59 3.10 -3.8 1.9E-06
GO:0006119 oxidative phosphorylation
19 14 1.8E-08 0 0.04 5.94 2.97 5.8 1.6E-05
GO:0003954 NADH dehydrogenase
19 15 1.0E-09 0 0.04 5.79 2.41 6.6 3.7E-06
GO:0005837 26S proteasome 32 27 5.5E-18 1 0.03 5.77 3.02 7.4 2.7E-08
GO:0015078 hydrogen ion transporter
80 45 1.7E-17 1 2.7E-05 4.42 3.74 7.7 2.7E-11
by guest on Novem
ber 22, 2014http://hm
g.oxfordjournals.org/D
ownloaded from

20
Figure 1
by guest on Novem
ber 22, 2014http://hm
g.oxfordjournals.org/D
ownloaded from

21
Figure 2
by guest on Novem
ber 22, 2014http://hm
g.oxfordjournals.org/D
ownloaded from

22
Figure 3
by guest on Novem
ber 22, 2014http://hm
g.oxfordjournals.org/D
ownloaded from

23
Legends for Supplementary Figures Supplementary Figure 1 The clustering diagram of the RT-PCR cycle numbers of 198 genes in 40 AnCg and 40 DLPFC samples. All but one Type 2 samples are on the left branch, and all but one Type 1 samples are on the right. The two discrepancies are marked with “*”. Supplementary Figure 2 Gene families for stress response (a) and immunological function (b) are expressed at higher levels in the low pH samples. The 17 Type 2 samples are on the left of the yellow line. Supplementary Figure 3 Transcription factors are mostly up-regulated in the type 2 samples (a), though a few families are down-regulated (b). Several transcription factor families have both members that are increased and, to a lesser degree, members that are decreased (c).
by guest on Novem
ber 22, 2014http://hm
g.oxfordjournals.org/D
ownloaded from

24
Supplementary Figure 1
by guest on Novem
ber 22, 2014http://hm
g.oxfordjournals.org/D
ownloaded from

25
Supplementary Figure 2
by guest on Novem
ber 22, 2014http://hm
g.oxfordjournals.org/D
ownloaded from

26
Supplementary Figure 3
by guest on Novem
ber 22, 2014http://hm
g.oxfordjournals.org/D
ownloaded from