System Clearance Part B - Reginfo.gov
249
NATIONAL CENTER FOR EDUCATION STATISTICS NATIONAL ASSESSMENT OF EDUCATIONAL PROGRESS National Assessment of Educational Progress (NAEP) 2018 and 2019 Supporting Statement Part C OMB# 1850-0928 v.5 March 2017
-
Upload
khangminh22 -
Category
Documents
-
view
0 -
download
0
Transcript of System Clearance Part B - Reginfo.gov
NATIONAL CENTER FOR EDUCATION STATISTICS NATIONAL ASSESSMENT OF EDUCATIONAL PROGRESS
National Assessment of Educational Progress (NAEP) 2018 and 2019
Supporting Statement Part C
OMB# 1850-0928 v.5
March 2017
Table of Contents
Part C-1: 2017 Core Contextual Modules White Paper .................................................................. 3
Part C-2: 2017 Reading Issues Paper ............................................................................................ 43
Part C-3: 2017 Mathematics Issues Paper ..................................................................................... 76
Part C-4: 2016 Science Issues Paper ........................................................................................... 111
Part C-5: 2011 Writing Issues Paper ........................................................................................... 153
Part C-6: 2018 Social Studies Issues Paper................................................................................. 173
Part C-7: 2014 TEL Issues Paper ................................................................................................ 213
Part C-8: 2015 NIES Issues Paper .............................................................................................. 242
NAEP 2018-2019 OMB Clearance: Supporting Statement Part C Page 2
Part C-1: 2017 Core Contextual Modules White Paper
NAEP 2018-2019 OMB Clearance: Supporting Statement Part C Page 3

PLANS FOR NAEP CORE CONTEXTUAL MODULES
Core “White Paper”
Jonas P. Bertling
Educational Testing Service
Written in preparation for New Item Development for the 2017 Digital Based NAEP Core Questionnaires
May 2014
1 Introduction This memo describes the plans to develop core contextual questionnaire modules for the 2017
National Assessment of Educational Progress (NAEP) technology-based survey questionnaires.
Two main goals for this memo are, first to describe a proposed revised general questionnaire
approach that focuses on questionnaire modules and indices in addition to stand-alone questions
and, second, to describe five potential modules capturing opportunity to learn and noncognitive
student factors relevant to student achievement that are proposed for future NAEP Core survey
questionnaires. Evidence from the research literature on selection of these modules will be provided.
We thereby directly address the National Assessment Governing Board’s policy principles laid out in
their 2012 policy statement, particularly the principles that “NAEP reporting should be enriched by
greater use of contextual data derived from background or non-cognitive questions asked of
NAEP 2018-2019 OMB Clearance: Supporting Statement Part C 4NAEP 2018-2019 OMB Clearance: Supporting Statement Part C Page 4

students, teachers, and schools” (National Assessment Governing Board, 2012, p. 2). Proposed
Revision of General Questionnaire Approach
Historically, NAEP has designed its contextual questionnaires around single questions and
questionnaire results were therefore reported as single questions as well. A revised approach is
presented that is a more balanced, one that provides a mixture of both breadth and depth of coverage.
That is, in addition to single questions that are important to providing context for student
achievement, indices that are based on aggregation of data and several questions that will add more
robust policy-relevant reporting elements to the NAEP survey questionnaires. Indices can be
clustered into a number of distinct modules that each focus on a specific area of contextual variables
(e.g., socio-economic status). This approach is not entirely new – the existing core questionnaires
already contain several questions on multiple topics. In the existing approach, however, no aggregate
indices were created for reporting. While additional questions will be needed to capture all modules
proposed here, the main difference between the existing and newly proposed approach is
aggregating questions into indices that build several modules. This approach directly addresses the
National Assessment Governing Board’s call for making better use of the NAEP contextual variables,
specifically the first implementation guideline that, “clusters of questions will be developed on
important topics of continued interest” (National Assessment Governing Board, 2012, p. 2).
NAEP 2018-2019 OMB Clearance: Supporting Statement Part C Page 5

Table 1 summarizes the differences between the current and proposed approaches in terms of both
questionnaire design and reporting.
NAEP 2018-2019 OMB Clearance: Supporting Statement Part C Page 6
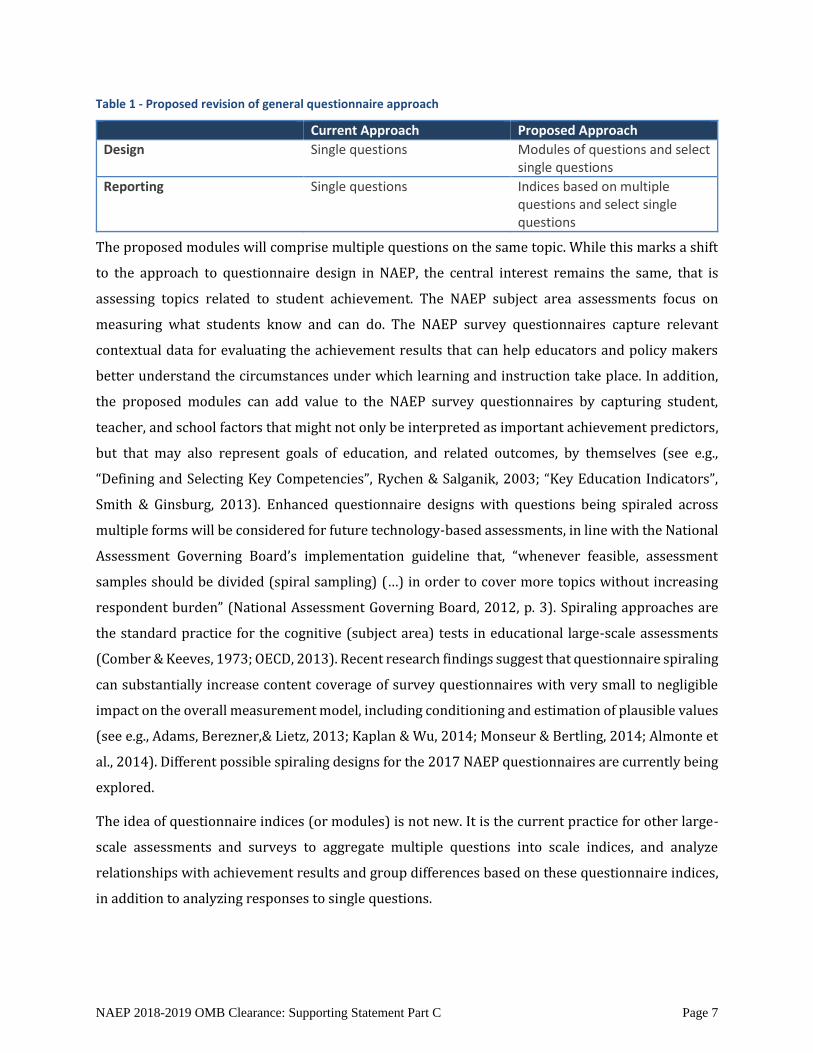
Table 1 - Proposed revision of general questionnaire approach
Current Approach Proposed Approach
Design Single questions Modules of questions and select single questions
Reporting Single questions Indices based on multiple questions and select single questions
The proposed modules will comprise multiple questions on the same topic. While this marks a shift
to the approach to questionnaire design in NAEP, the central interest remains the same, that is
assessing topics related to student achievement. The NAEP subject area assessments focus on
measuring what students know and can do. The NAEP survey questionnaires capture relevant
contextual data for evaluating the achievement results that can help educators and policy makers
better understand the circumstances under which learning and instruction take place. In addition,
the proposed modules can add value to the NAEP survey questionnaires by capturing student,
teacher, and school factors that might not only be interpreted as important achievement predictors,
but that may also represent goals of education, and related outcomes, by themselves (see e.g.,
“Defining and Selecting Key Competencies”, Rychen & Salganik, 2003; “Key Education Indicators”,
Smith & Ginsburg, 2013). Enhanced questionnaire designs with questions being spiraled across
multiple forms will be considered for future technology-based assessments, in line with the National
Assessment Governing Board’s implementation guideline that, “whenever feasible, assessment
samples should be divided (spiral sampling) (…) in order to cover more topics without increasing
respondent burden” (National Assessment Governing Board, 2012, p. 3). Spiraling approaches are
the standard practice for the cognitive (subject area) tests in educational large-scale assessments
(Comber & Keeves, 1973; OECD, 2013). Recent research findings suggest that questionnaire spiraling
can substantially increase content coverage of survey questionnaires with very small to negligible
impact on the overall measurement model, including conditioning and estimation of plausible values
(see e.g., Adams, Berezner,& Lietz, 2013; Kaplan & Wu, 2014; Monseur & Bertling, 2014; Almonte et
al., 2014). Different possible spiraling designs for the 2017 NAEP questionnaires are currently being
explored.
The idea of questionnaire indices (or modules) is not new. It is the current practice for other large-
scale assessments and surveys to aggregate multiple questions into scale indices, and analyze
relationships with achievement results and group differences based on these questionnaire indices,
in addition to analyzing responses to single questions.
NAEP 2018-2019 OMB Clearance: Supporting Statement Part C Page 7
Since the year 2000, the Organization for Economic Co-operation and Development’s (OECD)
Programme for International Student Assessment (PISA; e.g., OECD, 2013) has been providing
various questionnaire indices based on a 30 minute student questionnaire, plus additional indices
from a school principal questionnaire, as well as a number of optional questionnaires (e.g.,
Information and Communications Technology (ICT) Familiarity questionnaire) that are administered
in selected countries only. Example indices from PISA 2012 are Attitudes towards school (4 items),
Sense of Belonging (8 items), Perseverance (4 items), Openness for Problem Solving (4 items), or
Mathematics Self-Efficacy (8 items). PISA also entails an index of economic, social, and cultural status
that is based on several questionnaire components. With PISA 2012 OECD introduced several new
item formats for increased cross-cultural validity of the derived questionnaire indices, among them
Anchoring Vignettes to adjust Likert type responses (Bertling & Kyllonen, 2013), Topic Familiarity
items with overclaiming correction (Kyllonen & Bertling, 2013), and Situational Judgment Tests to
measure students’ problem solving approaches (Bertling, 2012; see Kyllonen & Bertling, 2013, for
an overview). The International Association for the Evaluation of Educational Achievement (IEA)
follows a very similar approach with their international large-scale assessments. Both the Trends in
International Mathematics and Science Study (TIMSS; e.g., Martin, Mullis, & Foy, 2008) and the
Progress in International Reading Literacy Study (PIRLS; e.g., Foy & Drucker, 2011) include
numerous questionnaire indices. While PISA assesses only 15-year olds, TIMSS and PIRLS are
administered at grades 4 and 8. At both grades, questionnaire indices are primarily based on matrix
questions, i.e., questions that comprise a general item stem plus multiple sub-items. Example indices
from TIMSS are Home Resources for Learning (5 items), or School Emphasis on Academic Success (5
items). The Gallup Student Poll measures Hope, Engagement, and Wellbeing of fifth- through twelfth-
graders in the United States, with 5 to 8 items per index.
Contextual modules with questionnaire indices can add value to the NAEP survey questionnaires in
several ways. Modules create more robust reporting through aggregating items into indices. Use of
scale indices to describe contextual factors instead of single items is not only beneficial from a
measurement perspective (e.g., indices will minimize wording effects of individual contextual
questions), but will also enhance the relevance of NAEP to policy makers, educators, and researchers
by enriching NAEP reporting and potentially providing trend data on important noncognitive student
factors as well as alternative outcomes of formal and informal education.
NAEP 2018-2019 OMB Clearance: Supporting Statement Part C Page 8
2 Overview of Key Factors Relevant to Student Achievement
The NAEP statute requires that contextual factors included in the NAEP survey questionnaires must
be directly related to the appraisal of academic achievement. A simple way to think of student
achievement is as a function of student factors and opportunity to learn factors, and their interplay.
Student factors can be further divided into a student’s cognitive ability and “noncognitive factors”
capturing a student’s attitudes towards school and learning, interest, motivation, self-related
competency beliefs, and other dispositions relevant to learning and achievement. The term
“noncognitive factors” will be described in more detail in the following section.
Opportunity to Learn (OTL) describes whether a student is exposed to opportunities to acquire
relevant knowledge and skills. It was originally defined quite narrowly as whether students had
sufficient time and received adequate instruction to learn (Carrol, 1963; see also Abedi et al., 2006).
Several different aspects of the OTL constructs have been highlighted since then and, therefore,
broadened the definition of the term. In this memo we use a broad definition of OTL as all contextual
factors that capture the cumulative learning opportunities a student was exposed to at the time of
the assessment. These factors comprise both learning opportunities at school and informal and
formal learning outside of school. Examples for opportunities to learn at school are exposure to
relevant content, access to resources for learning, and exposure to a positive school climate that
encourages learning. Outside of school, a student family’s socio-economic background (SES) and the
family academic climate/home academic resources can determine opportunities to learn. For
example, while a student’s mathematical reasoning ability will be a core driver for performance on a
mathematics test, whether or not the student has been exposed to relevant learning material, has
access to the resources needed, and received support for this learning as needed might play an
equally large or even larger role for the student’s success. Student factors and opportunity to learn
factors can interact as students may differ in how they make use of the opportunities provided, and
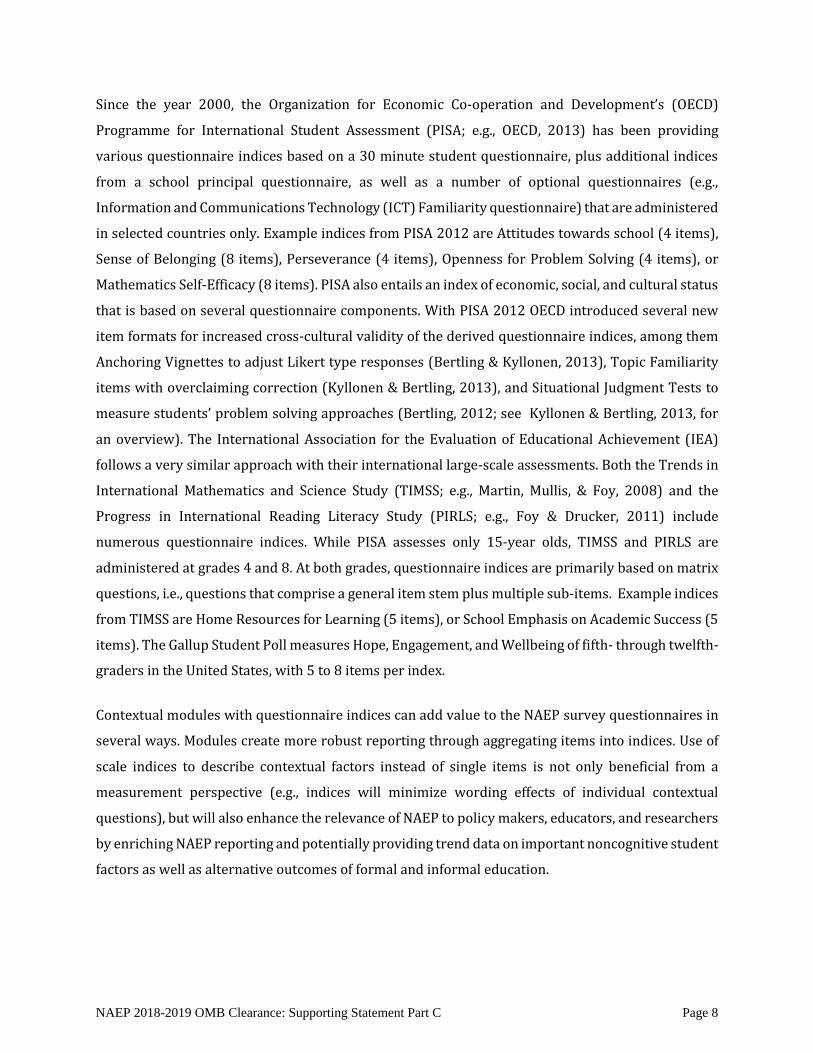
learning opportunities may help learners develop abilities and shape their attitudes. Figure 1 shows
a graphical illustration of this general model.
NAEP 2018-2019 OMB Clearance: Supporting Statement Part C Page 9
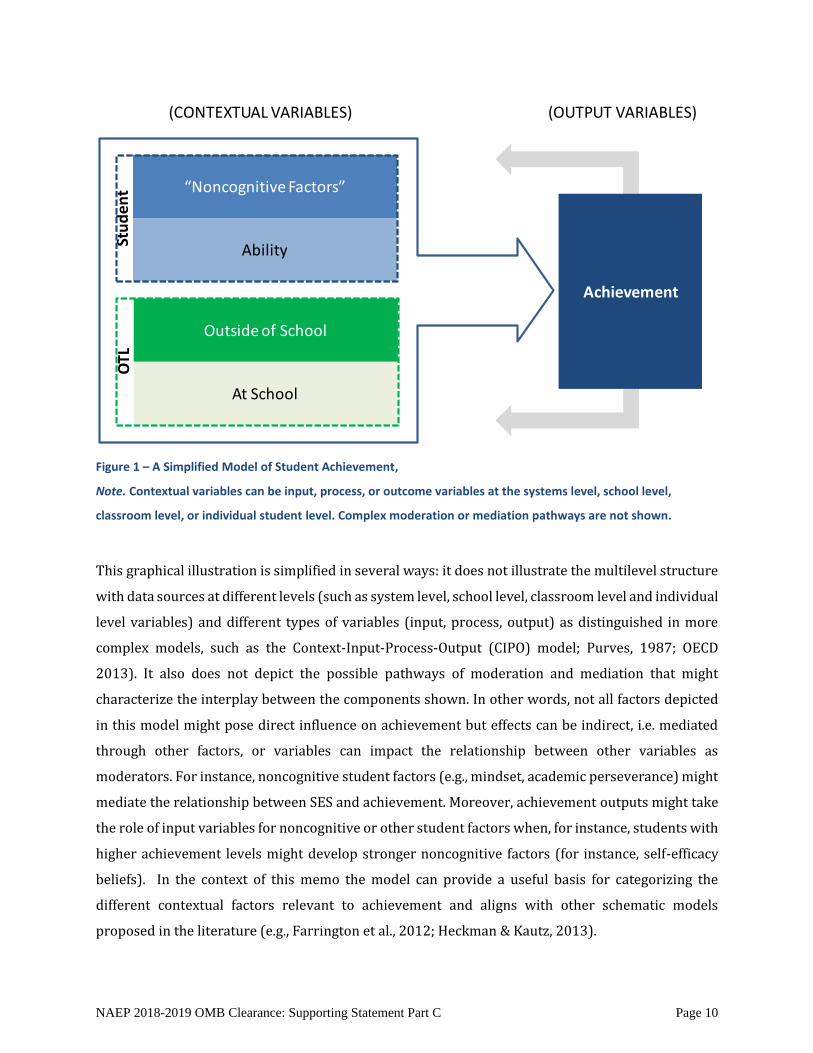
Figure 1 – A Simplified Model of Student Achievement,
Note. Contextual variables can be input, process, or outcome variables at the systems level, school level,
classroom level, or individual student level. Complex moderation or mediation pathways are not shown.
This graphical illustration is simplified in several ways: it does not illustrate the multilevel structure
with data sources at different levels (such as system level, school level, classroom level and individual
level variables) and different types of variables (input, process, output) as distinguished in more
complex models, such as the Context-Input-Process-Output (CIPO) model; Purves, 1987; OECD
2013). It also does not depict the possible pathways of moderation and mediation that might
characterize the interplay between the components shown. In other words, not all factors depicted
in this model might pose direct influence on achievement but effects can be indirect, i.e. mediated
through other factors, or variables can impact the relationship between other variables as
moderators. For instance, noncognitive student factors (e.g., mindset, academic perseverance) might
mediate the relationship between SES and achievement. Moreover, achievement outputs might take
the role of input variables for noncognitive or other student factors when, for instance, students with
higher achievement levels might develop stronger noncognitive factors (for instance, self-efficacy
beliefs). In the context of this memo the model can provide a useful basis for categorizing the
different contextual factors relevant to achievement and aligns with other schematic models
proposed in the literature (e.g., Farrington et al., 2012; Heckman & Kautz, 2013).
Stu
de
nt
At School
Outside of School
Ability
“Noncognitive Factors”
(OUTPUT VARIABLES)(CONTEXTUAL VARIABLES)O
TL
Achievement
NAEP 2018-2019 OMB Clearance: Supporting Statement Part C Page 10
Despite the importance to general cognitive ability and content knowledge to student achievement
in school educational, psychological, and econometric research over the past decades, has shown that
psycho-social variables or so-called “noncognitive skills” or “noncognitive factors” are of key
importance for success in K-12 and beyond (Almlund, Duckworth, Heckmann and Kauth 2011;
Heckmann, Stixrud and Urzua, 2006; Richardson et al., 2012), and also have effects in comparable
range on achievement as cognitive ability has (e.g., Poropat, 2009). Success in school and beyond
depends, for instance, on applying effort and being committed to succeed and persist during
adversity, seeing learning as an opportunity, and respecting and understanding others. Related
educational, and especially psychological, research has focused on noncognitive factors for many
years, while numerous theories on the respective constructs have been proposed and investigated.
Economics literature has only recently focused more on noncognitive skills. Here, the increased
interest in these skills can be explained based on studies showing the predictive value of constructs
beyond classical cognitive measures of reading and mathematics for important academic and
workforce-related outcomes. While the term “noncognitive” is currently the most widely used term
to describe student factors outside of those commonly measured by aptitude tests factors, it might
reinforce a false dichotomy between traditional academic factors and psycho-social variables when,
in fact, almost all aspects of human behavior can be linked to cognition (Borghans, Duckworth,
Heckman, & Weel, 2008). Given its wide use and the current lack of a widely accepted alternative
term, we use “noncognitive factors” here to refer to skills, strategies, attitudes, and behaviors that are
distinct from content knowledge and academic skills, as described by Farrington et al. in their 2012
report for the Consortium of Chicago School Research, “Teaching Adolescents to Become Learners:
The Role of Noncognitive Factors in Shaping School Performance”. Alternative labels that have been
used in the literature are “non-intellectual correlates of GPA” (Richardson et al., 2012), “Personality”
(Heckman et al.) or “incentive enhancing preferences” (e.g., Bowles, Gintis & Osborne, 2000) to
describe parameters “that shift the employee’s best response function upward, leading an employee
to work harder at every wage rate and holding all else constant” (p. 4). In the context of educational
large-scale assessments, this definition can be modified to relate to all student factors that motivate
a student to study harder, be more actively engaged in learning, and achieve higher grades, but also
in a broader sense, factors that make a student more successful in education, better prepared for
adult life as a student and/or member of the workforce, and an active citizen, potentially including
factors such as subjective well-being. Most taxonomies of so-called “21st Century Skills” (e.g.,
National Academy of Sciences/National Research Council) include noncognitive factors as well.
NAEP 2018-2019 OMB Clearance: Supporting Statement Part C Page 11
The National Assessment Governing Board’s first policy principle in their 2012 Policy Statement on
NAEP Background Questions and the Use of Contextual Data in NAEP Reporting explicitly highlights
the importance of “non-cognitive questions asked of students, teachers, and schools” for enriched
NAEP reporting (National Assessment Governing Board, 2012, p. 1). We propose to include, in
addition to the subject-specific contextual factors, several domain-general noncognitive student
factors in future NAEP questionnaires to broaden the coverage of relevant variables and increase the
policy relevance of the NAEP database and reports.
Several larger literature reviews and meta-analyses have recently highlighted the importance of
noncognitive factors. Richardson et al. (2012) identified 42 noncognitive factors relevant to student
achievement and proposed clustering these into the following five conceptually overlapping, but
distinct, research domains, (1) personality traits, (2) motivational factors, (3) self-regulated learning
strategies, (4) students’ approaches to learning, and (5) psychosocial contextual influences. Meta-
analytical correlations in the range of approximately .20 or larger with Grade Point Average (GPA)
were found for 10 noncognitive factors out of the 42 factors investigated: Performance self-efficacy,
Academic self-efficacy, Grade goal, Effort regulation, Strategic approaches to learning, Time/study
management, Procrastination, Conscientiousness, Test anxiety, and Need for cognition. Correlations
with achievement for these noncognitive factors are in the same range as the meta-analytical
correlation between general intelligence and GPA. When controlling for cognitive ability, several
studies reported conscientiousness to take the role of the strongest predictor of achievement
(O’Connor & Paunonen, 2007; Poropat, 2009), and as a “comparatively important predictor”
(Poropat, 2009, p. 330) in direct comparison with general intelligence. It was suggested that effort
regulation might be the driving force behind these relationships with achievement (Richardson &
Abraham, 2009). Other reviews have drawn similar conclusions highlighting goal setting and task-
specific self-efficacy as the strongest predictors of GPA (Robbins et al., 2004. A classification of
noncognitive factors that seems especially helpful in the context of NAEP is the recent work by the
University of Chicago Consortium on Chicago School Research (CCSR). The authors of the report
suggest a similar, though slightly different, classification of student success factors compared to the
classification suggested by Richardson and others. The five clusters of success factors identified are:
Academic Behaviors, Academic Perseverance, Academic Mindsets, Learning Strategies, and Social
Skills (Farrington et al., 2012). While some of the research on noncognitive factors (e.g., Heckman &
Kautz, 2013; Nyhus & Pons, 2005; O’Connor & Paunonen, 2007; Paunonen & Ashton, 2001; Poropat,
2009; Roberts, Kuncel, Shiner, Caspi, & Goldberg, 2007) focuses heavily on personality and the so-
called Big Five or OCEAN model (Openness, Conscientiousness, Extraversion, Agreeableness,
NAEP 2018-2019 OMB Clearance: Supporting Statement Part C Page 12
Neuroticism; Costa & McCrae, 1992; McCrae & Costa, 1989) which was seen primarily as a stable
person characteristics in a large part of the traditional literature, Farrington et al. emphasize the
malleability of noncognitive student factors, and the importance of teaching in fostering noncognitive
factors that help students become active learners who succeed in school. This view is consistent with
recent findings from individual differences researchers providing ample validity evidence for the
malleability, amenability for interventions, and lifetime changes of noncognitive factors (e.g.,
Heckman and Kautz, 2013; Specht, Egloff, Schmukle, 2011). As Farrington et al. (2012) describe,
social investments in the development of noncognitive factors may “yield payoffs in improved
educational outcomes as well as reduced racial/ethnic and gender disparities in school performance
and educational attainment” (p. 5). Dweck et al. (2011) highlight that educational intervention and
initiatives can “have transformative effects on students’ experience and achievement in school,
improving core academic outcomes such as GPA and test scores months and even years later” (p. 3).
Several researchers have described effective techniques to positively impact noncognitive factors
such as self-efficacy beliefs in various contexts (e.g., Abraham, 2012; Ashford, Edmunds, & French,
2010; Bandura, 1997) and have also highlighted the specific importance of teachers’ behaviors such
as setting grades, providing constructive feedback and promoting mastery experiences, especially at
early grades (Chen et al., 2000; Lent & Brown, 2006; Stock & Cervone, 1990). Research suggests that
performance-focused interventions show larger expected effects on students’ academic achievement
than more general counseling services (Richardson et al., 2012). Further, the CCSR model aligns well
with multidimensional models of students’ school engagement (Appleton, Christenson, Kim, &
Reschly, 2006; Fredricks, Blumenfeld, & Paris, 2004), with the three main engagement components
behavioral engagement, emotional engagement, and cognitive engagement. Academic behaviors and
perseverance relate to behavioral engagement, and academic mindsets and learning strategies
capture cognitive engagement as well as aspects of emotional engagement. The first cluster described
in the CCSR review, Academic behaviors, comprises behaviors such as going to class, doing
homework, organizing materials, participating in class, and studying. Academic perseverance
(cluster 2; also referred to as “grit”) as the second cluster is described as “a student’s tendency to
complete school assignments in a timely and thorough manner, to the best of one’s ability, despite
distractions, obstacles, or level of challenge. (...) It is the difference between doing the minimal
amount of work to pass a class and putting in long hours to truly master course material and excel in
one’s studies.” (p. 9). Academic perseverance is conceptualized as a direct antecedent to academic
behaviors. Academic mindsets (cluster 3) are described as “the psycho-social attitudes and beliefs
one has about oneself in relation to academic work” (p. 9) and thereby give rise to academic
NAEP 2018-2019 OMB Clearance: Supporting Statement Part C Page 13
perseverance. Four key academic mindsets highlighted by Farrington et al. (2012) are (1) “I belong
in this academic community”, (2) “My ability and competence grow with my effort, (3), “I can succeed
at this”, and (4) “This work has value for me”. Learning strategies (cluster 4) are processes or tactics
that help students leverage academic behaviors to maximize learning. Four groups of learning
strategies distinguished by Farrington et al. (2012) are: study skills, metacognitive strategies, self-
regulated learning, and goal-setting. Social skills (cluster 5) are conceptualized as interpersonal
qualities that have mostly indirect effects on academic performance by affecting academic behavior,
with key social skills being empathy, cooperation, assertion, and responsibility (Farrington et al.,
2012). Farrington et al. (2012) propose a model “as a simplified framework for conceptualizing the
primary relationships” (p. 13) for how these five noncognitive factors affect academic performance
within a classroom context. In their model, academic mindsets build the foundation for the
emergence of academic perseverance that may result in academic behaviors which, as a next step,
lead to academic performance. While Harrington’s focus clearly is on noncognitive factors, their
model also includes classroom factors and socio-cultural context factors that provide a foundation
for student learning and may shape noncognitive factors. These factors capture the OTL factors
previously described on in this section and illustrated in Figure 1.
NAEP 2018-2019 OMB Clearance: Supporting Statement Part C Page 14
3 Modules proposed for future Core Questionnaires
Based on a review of the research literature, as well as a review of approaches for other large-scale
assessments, five potential modules, each comprising related constructs, are suggested for future
core contextual questionnaires. These modules are (1) Socio-Economic Status (SES), (2) Technology
Use, (3) School Climate, (4) Grit, and (5) Desire for Learning1. Modules may differ in their scope, in
terms of the number of questions needed on the questionnaire. SES, Technology Use, and School
Climate will likely comprise variables at multiple levels (e.g., school level, classroom level, and
individual level) and, therefore, be represented by questions across all respondent groups, while Grit
and Desire for Learning are primarily student-level constructs and, therefore, might require fewer
questions. Table 2 shows how these modules fit in with the overall model of student achievement
described in the previous section. Some modules capture variables spanning both student and OTL
factors. Technology use, for instance, includes an ability component (Familiarity with technology), a
noncognitive component (Attitudes towards technology), and an OTL component (Access to
technology).
Main criteria for selecting these modules were the following:
(a) Factors captured in each module should have a clear relationship with student
achievement. Student factors with no clear or low correlations with achievement based
on the published research are discarded from inclusion. This criterion directly refers to
the NAEP statute. Modules with a strong research foundation based on several studies
(ideally, meta-analyses) and established theoretical models will be favored over modules
with less research evidence regarding the relationship with achievement or modules with
a less established theoretical foundation.
(b) Factors captured in each module should be malleable and actionable in terms of possible
interventions in an outside the classroom.
(c) Factors should be amenable for measurement with survey questionnaires. Some of the
factors summarized above (e.g., social skills, learning strategies) might require other
assessment strategies to provide meaningful and reliable measures.
1 In an earlier presentation of potential modules the term “Need for Cognition” (NFC) was used. We suggest using the more general term “Desire for Learning” to replace the previous term as it is less technical and broader than NFC with NFC as one possible facets.
NAEP 2018-2019 OMB Clearance: Supporting Statement Part C Page 15
(d) Modules suggested for inclusion in the Core Survey Questionnaires should focus on those
student and OTL factors that are domain-general, meaning that they are not specific to
one of the NAEP subject areas but, first, apply equally to all subject area assessments and,
second, cannot be measured better as part of the subject-specific questionnaires.
These modules also show high alignment with the modules suggested by the National Assessment
Governing Board’s first implementation guideline for questions and questionnaires (“Clusters of
questions will be developed on important topics of continuing interest, such as student motivation
and control over the environment, use of technology, and out-of school learning, which could be used
regularly or rotated across assessment cycles”, National Assessment Governing Board, 2012, p. 2) as
well as the “Key Education Indicators” (KEI) suggested by Smith and Ginsburg (2013). Technology
was suggested as one module and is proposed also in this memo. Motivation was suggested as a
module and is captured by the two proposed modules of Grit and Desire for Learning in this memo.
Grit captures predominantly students’ motivation to work hard, apply effort, and self-regulate their
learning. Desire for learning captures intrinsic motives and general learning motivation. Out of school
activities play a role in several modules, but are primarily covered in the Technology Use module.
Out of school activities related to specific subject-areas are suggested for inclusion in the subject-
specific questionnaires, which is in line with current NAEP practices. The Technology and
Engineering Literacy (TEL) and Science survey questionnaires, for instance, include several
questions specifically targeted at learning opportunities and activities outside of school. School
climate was suggested as one KEI and is captured in this memo.
Several important noncognitive and OTL factors are not suggested as possible modules for the core
questionnaires as they can be better measured if questions are contextualized within the subject-
area questionnaires. This applies, for instance, to self-efficacy, self-concept, confidence, and interest,
or to OTL factors such as availability of resources for learning and instruction, and curriculum
content. Contextual factors specific to a NAEP subject area are proposed to be measured via the
subject-specific questionnaires, in line with current NAEP practices. Table 2 lists not only the
suggested domain-general modules, but also examples for the domain-specific indicators that are
considered for future survey questionnaires. For each subject area, an Issues Paper (not part of this
document) further lays out the contextual variables relevant to each subject area and the subject-
specific questionnaires. In the following section, the proposed modules will be described in more
detail.
NAEP 2018-2019 OMB Clearance: Supporting Statement Part C Page 16
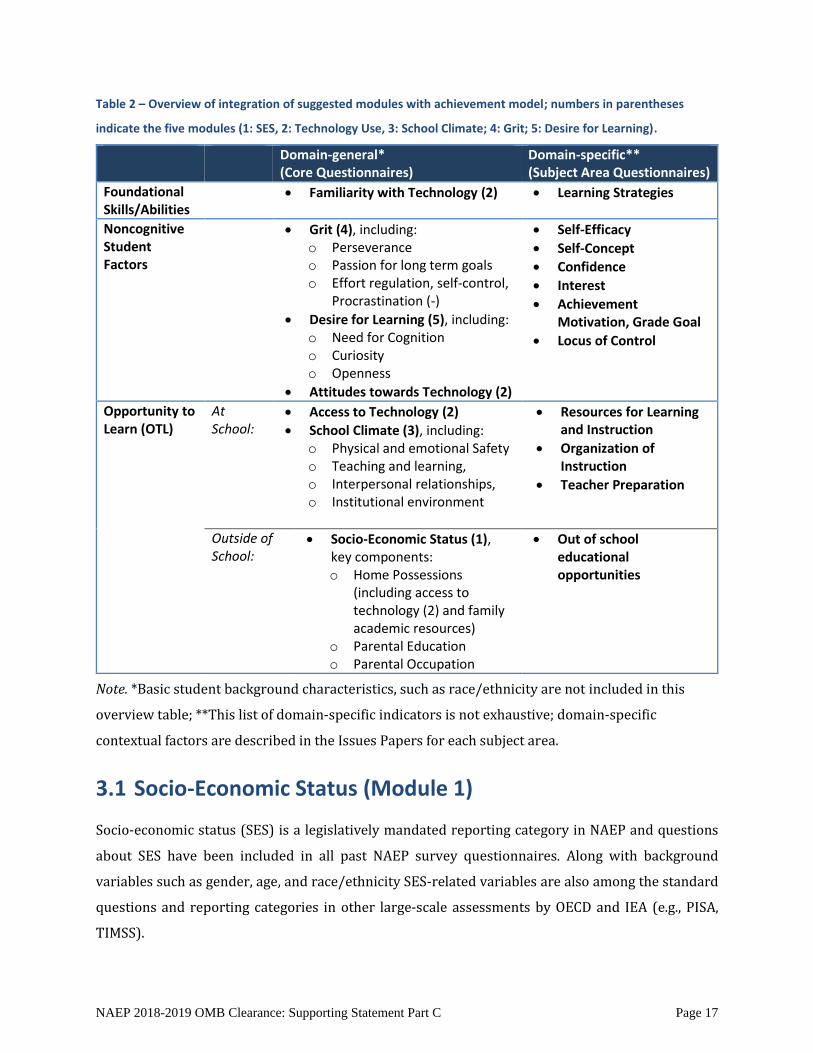
Table 2 – Overview of integration of suggested modules with achievement model; numbers in parentheses
indicate the five modules (1: SES, 2: Technology Use, 3: School Climate; 4: Grit; 5: Desire for Learning).
Domain-general* (Core Questionnaires)
Domain-specific** (Subject Area Questionnaires)
Foundational Skills/Abilities
Familiarity with Technology (2) Learning Strategies
Noncognitive Student Factors
Grit (4), including: o Perseverance o Passion for long term goals o Effort regulation, self-control,
Procrastination (-)
Desire for Learning (5), including: o Need for Cognition o Curiosity o Openness
Attitudes towards Technology (2)
Self-Efficacy
Self-Concept
Confidence
Interest
Achievement Motivation, Grade Goal
Locus of Control
Opportunity to Learn (OTL)
At School:
Access to Technology (2)
School Climate (3), including: o Physical and emotional Safety o Teaching and learning, o Interpersonal relationships, o Institutional environment
Resources for Learning and Instruction
Organization of Instruction
Teacher Preparation
Outside of School:
Socio-Economic Status (1), key components: o Home Possessions
(including access to technology (2) and family academic resources)
o Parental Education o Parental Occupation
Out of school educational opportunities
Note. *Basic student background characteristics, such as race/ethnicity are not included in this
overview table; **This list of domain-specific indicators is not exhaustive; domain-specific
contextual factors are described in the Issues Papers for each subject area.
3.1 Socio-Economic Status (Module 1)
Socio-economic status (SES) is a legislatively mandated reporting category in NAEP and questions
about SES have been included in all past NAEP survey questionnaires. Along with background
variables such as gender, age, and race/ethnicity SES-related variables are also among the standard
questions and reporting categories in other large-scale assessments by OECD and IEA (e.g., PISA,
TIMSS).
NAEP 2018-2019 OMB Clearance: Supporting Statement Part C Page 17
SES has been described as an individual’s access to resources for meeting needs (Cowan & Sellman,
2008), the social standing or class of an individual or group, or as a gradient that reveals inequities
in access to and distribution of resources (American Psychological Association, 2007). The first
research on SES emerged in the 1920s when Taussig (1920) analyzed father’s occupational status
and observed that students of families with low income or low-status jobs demonstrated lower
achievement in school. Sims (1927) and Cuff (1934) took a more comprehensive approach using a
score card consisting of 23 survey questions including also home possessions (e.g., books), rooms in
the home, cultural activities, and parents’ educational attainment. Since then multiple approaches to
SES have been taken, and more complex statistical models were applied (e.g., Ganzeboom et al., 1992;
Hauser & Warren, 1997). Two large meta-analyses of studies published before 1980 (White, 1982)
and between 1990 and 2000 (Sirin, 2005) consistently demonstrated medium to strong relationships
between SES and achievement, and further showed that parental educational attainment was the
most commonly used measure for SES, followed by occupational status and family income. Sirin
(2005) suggested six categories to group indicators of SES (numbers in parentheses denote the
number of studies identified by Sirin): parental educational attainment (30 studies), parental
occupational status (15 studies), family income (14 studies), free or reduced-price lunch (10 studies),
neighborhood (6 studies), and home resources (4 studies). OECD reports an Index of Economic, Social,
and Cultural Status (ESCS) in their PISA reports that are based on three main components: the highest
parental education (indicated as the educational attainment of the parent with the higher educational
attainment; classified using the ISCED coding), the highest parental occupation (indicated as the
occupational status of the parent with the higher occupational status; classified using the ISCO
coding), and an index of home possessions (derived as a composite of approximately 20 items about
various wealth possessions, cultural possessions, and home educational resources, plus a measure of
the total number of books in the home). While different studies have taken slightly different
approaches to the measurement of SES, a common element across the various definitions and
measurement approaches for SES is the distinction of the so-called “Big 3” components: education,
income, and occupation (APA, 2007; Cowan & Sellman, 2008; OECD, 2013). In 2012, NCES created an
Expert Panel that completed a white paper entitled, Improving the Measurement of Socioeconomic
Status for the National Assessment of Educational Progress: A Theoretical Foundation.2 Based on a
2 The SES Expert Panel White Paper is available at http://nces.ed.gov/nationsreportcard/pdf/researchcenter/Socioeconomic_Factors.pdf
NAEP 2018-2019 OMB Clearance: Supporting Statement Part C Page 18
comprehensive review and analysis of the literature the NAEP SES Expert Panel (2012) suggested
the following consensus definition that is adapted for this memo:
“SES can be defined broadly as one’s access to financial, social, cultural, and human capital
resources. Traditionally a student’s SES has included, as components, parental educational
attainment, parental occupational status, and household or family income, with appropriate
adjustment for household or family composition. An expanded SES measure could include
measures of additional household, neighborhood, and school resources.” (p. 14)
SES indicators can be defined at different levels, with the systems level (e.g., the general wealth of an
economy and spending on education), school level (e.g., a school’s funding situation and the
availability and quality of educational resources), and individual level (e.g., home possessions) being
three key levels described in the literature (e.g., OECD, 2013). An example for another level is
neighborhood SES. Studies often compare socio-economically advantaged with disadvantaged
students. OECD considers students socio-economically advantaged if their ESCS index falls into the
top quartile (i.e., the top 25 percent) in their country or economy, and socio-economically
disadvantaged if their ESCS falls into the bottom quartile, respectively (OECD, 2013). That is, the
definition of being advantaged or disadvantaged is, ultimately, relative to a reference population.
The relationship between SES and student achievement has been well documented in the research
literature (Bryant, Glazer, Hansen, & Kursch, 1974; Coleman et al., 1966; Cowan & Sellman, 2008;
Cuff, 1934; Harwell & Holley, 1916; Kieffer, 2012; LeBeau, 2010; Lynd & Lynd, 1929; Singh, 2013;
Sirin, 2005; White, 1982; ). This relationship can go in both directions. SES determines students’
opportunity to learn and what skills they acquire, and the distribution of skills across the population
can have significant implications on the distribution of economic and social outcomes within
societies (OECD, 2013). Data from OECD’s Survey of Adult Skills (PIAAC), for instance, shows that
individuals with literacy scores on the highest level are “almost three times as likely to enjoy higher
wages than those scoring at the lowest levels, and those with low literacy skills are also more than
twice as likely to be unemployed” (OECD, 2013, p. 26). Recursive models and more complex path
models have been proposed to explain the observed relationships with achievement based on
additional variables such as personal aspirations, peer effects, cultural and social capital, and
variables concerning home academic climate and cognitively challenging home environments (e.g.,
Blau & Duncan, 1967; Reynolds & Walberg, 1992; Spaeth, 1976; Levin & Belfield, 2002; Coleman,
1988).
The availability of SES as a contextual variable enables researchers and policy makers to study
educational equity and fairness issues, making the existence of a reliable and valid SES measure an
NAEP 2018-2019 OMB Clearance: Supporting Statement Part C Page 19
important indicator that can help monitoring achievement gaps. PISA 2012 results indicate that
socio-economic status strongly relates to achievement (“Socio-economically advantaged students
and school tend to outscore their disadvantaged peers by larger margins than between any other two
groups of students”, OECD, 2012, p. 34). At the same time, the socio-economic gradient (defined as
the relationship between SES and performance, OECD, 2013) can be altered by policies targeted at
increasing educational equity. PISA results show, for instance, that increasing educational equity
goes along with increased achievement overall in a majority of countries (OECD, 2013). SES further
is an important covariate with achievement to examine the effects of other variables, and as a
matching variable in educational intervention studies. (NAEP SES Expert Panel, 2012).
Current NAEP practice is to measure SES through a set of proxy variables that only partly capture the
“Big 3” components. Out of the three main components of SES, education, occupation, and income,
NAEP currently assesses parental education (based on student reported data) and household income
via several proxy variables including books in the home, household possessions (both student
reported), and school reported eligibility for the National School Lunch Program (NSLP; 2008), as
well as Title 1 status. For reporting purposes, all of these are treated as individual variables, rather
than as a composite index similar to the index of economic, social, and cultural status (ESCS) that is
reported by OECD based on PISA.
After reviewing the current SES indicators used in NAEP, the NAEP SES Expert Panel (2012)
concluded with four key recommendations for future SES developments in NAEP: First, developing
a core SES measure based on the “Big 3” indicators (family income, parental educational attainment,
and parental occupational status), second, considering development of an expanded SES measure,
which could include neighborhood and school SES variables; third, focusing on SES composite
measures rather than relying on single proxy measures; and forth, exploring possibilities of using
data from the U.S. Census Bureau, such as the American Community Survey (ACS), to link to NAEP.
Similar suggestions had been made earlier, particularly to create a composite measure rather than
relying on single proxy measures (Barton, 2003), and to use data linked from other sources, such as
the U.S.Census to provide more accurate data on income, parental educational attainment, and
parental occupation (Hauser & Andrew, 2007).
At the current stage of item development for the 2017 technology-based core survey questionnaires,
main considerations for future development are the design of parental occupation questions and a
possible update of existing questions on both household income and education. In this context, we
are pursuing a potential link between NAEP and Census that will allow us to obtain SES-related
information without increasing student burden. A special study will be conducted in 2015 to link
NAEP 2018-2019 OMB Clearance: Supporting Statement Part C Page 20
NAEP with the Early Childhood Longitudinal Study (ECLS) for grade 4 students. A short supplemental
questionnaire will be administered to all ECLS students, including new questions on parental
education and parental occupation. Furthermore, re-evaluating the validity of the NSLP measure and
some of the key traditional SES questions, such as the number of books in the home, is a priority for
future development. Particularly the availability of digital technologies has changed the use of
physical books and created new alternative indicators of wealth.
With the 2017 Core Survey Questionnaires we attempt to present a SES composite index that
captures the “big 3” components of SES and adds value to OECD’s ESCS index by improving the
validity of the parental education and occupation measures and, if feasible, combine student reported
data with other data sources in creating the index. These plans directly address the National
Assessment Governing Board’s implementation guideline that, “The development and use of
improved measures of socio-economic status (SES) will be accelerated, including further exploration
of an SES index for NAEP reporting” (National Assessment Governing Board, 2012, p. 3).
In addition, we attempt to further explore creation of an extended SES measure that might also
include psychological variables (such as, coping mechanisms, perceptions of the environment; see
also, SES Expert Panel, 2012) and potentially a subjective SES measure. In doing so we respond to
the NAEP SES Expert Panel’s recommendation that, “psychological variables and some subjective
measures of SES may be useful contextual and potentially explanatory variables that could help
interpret NAEP scores.” (NAEP SES Expert Panel, 2012, p. 17). Such an extension would correspond
to an SES model with an emphasis on social gradients and individuals’ positions relative to others
that was described by the American Psychological Association Task Force on Socioeconomic Status
as a potential alternative to the traditional materialist SES model (APA, 2007a).
3.2 Technology Use (Module 2)
Over the next few years, NAEP will fully transition from paper-and-pencil assessments to technology-
based assessments (TBAs). This represents not only a change in administration format, but also
signals the introduction of potentially new and expansive content in the subject area assessments
that reflect the way students are being prepared for post-secondary technology-rich environments.
Teaching and learning in and outside of the classroom increasingly involve using a variety of digital
technologies, such as internet resources, laptops, tablets, and smart phones.
As all NAEP assessments move to technology-based delivery, discerning to what extent students have
access to digital technology, are familiar with it, and whether students have positive attitudes
NAEP 2018-2019 OMB Clearance: Supporting Statement Part C Page 21
regarding the use of technology for learning, is especially important. Thus far, two NAEP assessments,
namely the 2011 Writing assessment and the 2014 TEL assessment have been administered via
computers. When one examines the contextual variables from these assessments that were designed
to measure previous access and exposure to computers, there is only a single contextual item
measuring computer access that is common to both assessments – “Is there a computer in your
home?” There are no common items that measure familiarity with computers or other relevant
technologies across the assessments. With this suggested module, the intent is to develop a set of
indicators that help evaluate and monitor over time how prepared students are, in a narrow sense,
to take a technology-based assessment and, more generally, to deal with digital technologies in their
everyday life, both at school and outside of school. Self-efficacy regarding major use cases of
computer software in and outside the classroom, as well as keyboarding skills, will be considered as
part of this module as well.
The literature shows that access to technology at school and outside of school is linked to student
achievement (Clements, 1999; Clements and Sarama, 2003; Salerno, 1995). For example, studies find
that access to technology in the home is linked with improved achievement in mathematics and
reading (Espinosa, Laffrey, Whittaker, & Sheng, 2006; Hess & McGarvey, 1987), as well as other
achievement indicators such as graduating from high school (Fairlie, 2005). Specifically, Fairlie
(2005) found that children who had access to a computer at home were more likely to graduate from
high school. Researchers also find that access to the technology at school is positively related to
achievement, that is students who have access to technology at school tend to demonstrate higher
levels of achievement (Lowther, Ross, & Morrison, 2003; Mackinnon & Vibert, 2002; Siegle & Foster,
2001). Interestingly, Lowther et al. (2003) also found that in addition to general access to technology,
student achievement is also influenced by whether students have their own laptop or have to share
a computer with other classmates. Specifically, these authors found that students, who had access to
their own laptop in the classroom, were more likely to have higher Problem-Solving, Science, and
Writing scores than students who had access to shared classroom computers. One encouraging
finding shows that at-risk students attending a school where a 1:1 laptop program is implemented
(i.e., one laptop is provided to each student) demonstrate the highest gains in Writing (Zheng,
Warschauer, Farkas, 2013).
While access to technology does have several educational implications, most notably on student
achievement, the literature also shows that familiarity with technology (i.e., knowing how to access
and search the Internet, use functions in Word, Excel, etc.) is crucial to student academic success
(Cuban, Kirkpatrick, & Peck, 2001) and shapes students attitudes about technology (Peck, Cuban, &
NAEP 2018-2019 OMB Clearance: Supporting Statement Part C Page 22
Kirkpatrick, 2002). Familiarity with technology, often referred to as computer literacy, technology
literacy, or information and communications (ICT) literacy (i.e., knowledge about computers and
other related technology), encompasses a wide range of skills from basic knowledge/skills such as
starting a computer, opening software programs (e.g., Word or Excel) or opening a web browser (e.g.,
Internet Explorer) to more advanced skills such as advanced programming.
OECD conceptualizes ICT literacy as the “availability and use of information and communications
technology (ICT), including where ICT is mostly used, as well as on the students’ ability to carry out
computer tasks and their attitudes towards computer use” (OECD, 2009). ICT literacy is considered
within the context of the home and at school, for example, the 2009 ICT questionnaire included items
related to devices available to students, activities, or tasks that students complete (e.g., home:
“Download music, films, games or software from the Internet”; school: “Post your work on the
school’s website”). In PISA, the importance of ICT literacy for learning and instruction is reflected by
a special questionnaire for students that is administered in addition to the regular student
questionnaire in a growing number of countries (45 countries in 2009). The optional ICT
questionnaire includes socio-economic factors (e.g., access to technology devices at home and
technology equipment at school), familiarity with specific tasks (e.g., using a spreadsheet or creating
a presentation), and attitudes towards computers (e.g., “it is very important to me to work with a
computer”) (OECD, 2009). Students who were more confident in their ability to perform routine ICT
tasks (e.g., open a file or save a file) and Internet tasks (e.g., browse the internet or use email) also
tended to demonstrate higher levels of mathematics and reading proficiency (OECD, 2003; 2010).
PISA also includes questions in the school principal questionnaire asking about the availability of
computers in schools and whether principles experience a shortage in computers that might
negatively impact instruction in their school (OECD, 2010).
In line with these results, other studies such as Cuban et al. (2001) and Peck et al. (2002) found that
increased technology literacy is positively associated with several non-cognitive factors such as self-
confidence and motivation to excel in school. Similarly, another study found that students who have
access to and use technology also report higher participation rates in class, more interest in learning,
and greater motivation to do well in class (Trimmel & Bachmann, 2004). In addition, students also
believe that the use of laptops, and technology in general, positively affects their study habits and
general academic learning (Demb, Erickson, & Hawkins-Wilding, 2004).
NAEP 2018-2019 OMB Clearance: Supporting Statement Part C Page 23
3.3 “School Climate” (Module 3)
School climate is a concept that captures a variety of experiences from the learning environment. It
is best thought of as a multidimensional construct. School climate refers to the quality and character
of school life. It sets the tone for all the learning and teaching done in the school environment
(National School Climate Center, 2013) and thereby also represents an important opportunity to
learn factor. School climate not only sets the tone for learning and teaching in the school, but may
also relate to student subjective well being (defined as “people’s experiences of their lives as
desirable”, Diener and William, 2006, p. 28) and happiness at school. The Gallup Student Poll, for
instance, includes a set of questions addressing student well-being. Several studies demonstrated the
strong impact that a student’s well-being and sense of belonging in a school or classroom can have
on achievement (Battistich, Solomon, Kim, Watson, & Schaps, 1995; Cohen & Garcia, 2008; Furrer &
Skinner, 2003; Goodenow, 1992; Goodenow & Grady, 1993; McMillan & Chavis, 1986; Ryan & Deci,
2000; Solomon, Watson, Battistich, Schaps, & Delucchi; 1996; Wentzel & Asher, 1995; Wentzel &
Caldwell, 1997). Particularly the feeling of being part of a school or classroom community can have
considerable psychological benefits for students and makes them more likely to engage in productive
academic behaviors. School climate can have impact on students’ academic mindsets and thereby,
indirectly, impact academic perseverance and behaviors (Farrington et al., 2012).
The literature suggests some common areas to address with any school climate measure (e.g. Clifford,
Menon, Condon, and Hornung, 2012; Cohen et al. 2013; Haggerty, Elgin, and Woodley, 2010; Voight
and Hanson, 2012). One of the latest reviews by Cohen et al. (2013) identifies four areas of focus:
safety (emotional and physical), teaching and learning, interpersonal relationships, and the
institutional environment. The various sub-dimensions for these four areas are discussed below.
Safety includes the sub-dimensions of rules and norms, sense of physical security, and sense of social-
emotional support. Rules and norms are measured by indicators of how clearly rules about physical
violence, verbal abuse, harassment, and teasing are communicated and enforced (e.g., “Rules in this
school are made clear to students”). Sense of physical security refers to a sense that students and
adults feel safe from physical harm in the school (e.g. “Students feel safe in this school”). Sense of
social-emotional security is measured by indicators of students who feeling safe from verbal abuse,
teasing, and exclusion (e.g. “Students left me out of things to make me feel badly”). The contextual
questionnaires in TIMSS and PIRLS, for instance, include a scale that captures whether students feel
that they are bullied at school.
NAEP 2018-2019 OMB Clearance: Supporting Statement Part C Page 24
Teaching and learning includes the sub-dimensions of support for learning, and social and civic
learning. Support for learning includes indicators of several different types of teaching practices that
provide varied opportunities for learning, encourage students to take risks, offer constructive
feedback, and foster an atmosphere conducive to academic challenge (e.g. “My teachers will always
listen to students' ideas”). Social and civic learning is measured by indicators of civic knowledge,
skills, and dispositions such as effective listening, conflict resolution, and ethical decision making (e.g.
“I can always find a way to help people end arguments”).
Interpersonal relationships include the sub-dimensions of respect for diversity, social support from
adults, and social support among students. Respect for diversity is measured by indicators of mutual
respect for individual differences at all levels of the school (e.g. “Students respect those of other
races”). Social support from adults is measured by indicators of supportive relationships between
adults and students, high expectations for student success, willingness to listen to students, and
personal concern for students (e.g. “Adults who work in this school care about students”). Social
support among students refers to the level of peer relationship or friendship between students (e.g.
“Students are friendly with each other”).
Institutional environment includes the sub-dimensions of school connectedness or engagement and
physical surroundings. School connectedness or engagement refers to whether the students
positively identify with the school and the norms for broad participation in school life (e.g. “I am
happy to be at this school”). The physical surroundings sub-dimension refers to how appealing the
schools facilities are and whether the school has adequate resources and materials (e.g. “This school
has clean and well–maintained facilities and property.”)
A great deal of research on school climate has been conducted in the United States at the national
level. The School Climate Surveys (SCLS) will pilot new questionnaires with middle and high schools
in 2015. Longitudinal surveys (such as the Early Childhood Longitudinal Study, ECLS-K) include
measures of school climate on their student, teacher, and school administrator survey instruments.
State-wide surveys are also common. States such as Alaska, California and Delaware have undertaken
item development efforts to develop their own surveys of school climate (American Institutes of
Research, 2011; Bear & Yang, 2011; Hanson, 2011). The PISA student questionnaire includes several
measures of school climate, such as Student-Teacher-Relations, Sense of Belonging, and Disciplinary
Climate that have been consistently used in the survey since 2000. PIRLS and TIMSS report several
indices related to school climate as well (e.g., Students Bullied at School Scale; School Discipline and
Safety Scale). Finally, there are nonprofit organizations such as the National School Climate Center
(http://www.schoolclimate.org) and the Center for the Study of School Climate
NAEP 2018-2019 OMB Clearance: Supporting Statement Part C Page 25
(http://www.schoolclimatesurvey.com) that assists schools with assessing school climate and
developing strategies for improving it at their school. Item development for the proposed school
climate module will consider using existing questions from other surveys where appropriate to
further strengthen the linkage between NAEP and other large-scale assessments and surveys, as
called for in the National Assessment Governing Board’s implementation guidelines for future survey
questionnaires (“NAEP will include background questions from international assessments, such as
PISA and TIMSS, to obtain direct comparison of states and TUDA districts to educational practices in
other countries”, National Assessment Governing Board, 2012, p.3).
Research has shown a relationship between several of the sub-dimensions of school climate and
student achievement. Information on school-level factors which help improve schools, and thereby
also positively affect student learning, is of high policy relevance. A positive school climate creates an
environment that is conducive to student learning and achievement. School climate has been proven
to show an increase in a student’s motivation to learn (Eccles et al., 1993). It has also been shown to
moderate the impact of socioeconomic context on academic success (Astor, Benebnisty, and Estrada,
2009).
There has been research showing that each of the sub-dimensions of school climate effect student
achievement. In the area of safety, schools without supportive norms, structures, and relationships
are more likely to experience violence and victimization which is often associated with reduced
academic achievement (Astor, Guerra, and Van Acker, 2010). The relationships that a student
encounters at all levels in school also have an effect on student achievement. Students’ perceptions
of teacher-student support and student-student support are positively associated with GPA (Jia et al.,
2009). The student-teacher relationship even very early on in school, such as kindergarten, portends
future academic success (Hamre and Pianta, 2001). Positive perceptions of the racial climate in a
school are also associated with higher student achievement while negative racial climate can
negatively influence college preparation (Griffin and Allen, 2006).
Perhaps some of the strongest predictors of achievement related to school climate refer to the
teaching and learning practices in a school. Several correlational studies have shown a positive
relationship between school climate in this area and academic achievement in elementary
(Sterbinksky, Ross, and Redfield, 2006), middle school (Brand, Felner, Shim, Seitsinger, and Dumas,
2003), and high school (Stewart, 2008). Research shows that positive school climate not only
contributes to immediate student achievement, but endures for years (Hoy, Hannum, and Tschannen-
Moran, 1998). Specific types of social and civic learning practices have been shown to be related to
higher achievement. For example, evidence-based character education programs are associated with
NAEP 2018-2019 OMB Clearance: Supporting Statement Part C Page 26
higher achievement scores for elementary students. One meta-analysis of 700 positive youth
development, social emotional learning, and character education programs found that socio-
emotional learning led to a gain of 11-17 percentile points in achievement (Payton et al., 2008). There
is also research suggesting that the institutional environment is related to achievement. School
connectedness or engagement has been shown to be predictive of academic outcomes (Ruus, 2007).
A school climate measure for NAEP should take into account the various major focus areas and sub-
dimensions reviewed above. A selection of the most important sub-dimensions to focus on in future
NAEP contextual questionnaires seems important. Also, different respondent groups might be more
appropriate for the measurement of different sub-dimensions.
3.4 “Grit” (Module 4)
One key finding from the research literature reviewed in the previous section is that academic
perseverance is one of the strongest predictors of achievement. This module focuses not only on
academic perseverance but combines perseverance with other, related factors that are comprised
under the factor “Grit”. Grit is defined as perseverance and passion for long-term goals (Duckworth,
Peterson, Matthews, and Kelly, 2007). Grit can contribute to understanding student achievement
beyond variables related to SES and other OTL factors. It is related to conscientiousness, defined as
the degree to which a person is hard working, dependable, and detail oriented (Berry et al., 2007),
but focuses on its facets perseverance, industriousness, self-control, and procrastination
(negatively), which are among the facets that are strongest related to achievement (e.g., Barrick,
Stewart and Piotrowski, 2002). Students’ persistence even on difficult tasks (perseverance, e.g., not
to put off difficult problems, not to give up easily), general work ethics (industriousness, e.g., prepare
for class, work consistently throughout the school year), and low level of procrastination are not only
among the strongest non-cognitive predictors of GPA (Richardson et al., 2012), but are also important
predictors of success in higher education and the workforce in general (e.g., Heckman, Stixrud &
Urzua, 2006; Lindqvist & Vestman, 2011; Poropat, 2009; Roberts et al., 2007). Meta-analyses (e.g.,
Poropat, 2009) have shown that perseverance and related person characteristics predict educational
success to a comparable degree as cognitive ability measures. In other words, a prediction of a
person’s educational outcomes, such as GPA, based on a score reflecting the person’s level of
perseverance is about as accurate as a prediction of the same outcome based on a person’s IQ.
Grit goes beyond what is captured with these conscientiousness facets by including the capacity to
sustain both the effort and interest in projects that take months or even longer to complete. Grit is a
NAEP 2018-2019 OMB Clearance: Supporting Statement Part C Page 27
noncognitive factor that may explain why some individuals accomplish more than others of equal
intellectual ability. Early psychologists recognized that there are certain factors that influence how
individuals utilize their abilities. William James suggested that psychologists should study both the
different types of human abilities and the means by which individuals utilize these abilities (James,
1907). Galton studied the biographical information of a number of eminent individuals and
concluded that high achievers had “ability combined with zeal and with capacity for hard labor”
(Galton, 1892). There are also more recent examples in modern psychology that demonstrate
renewed interest in the trait of perseverance (Peterson and Seligman, 2004). Howe (1999) studied
the biographical details of geniuses such as Einstein and Darwin and concluded that perseverance
must be as important as intelligence in predicting achievement. Similarly, Ericsson and Charness
(1994) found that in chess, sports, music, and the visual arts, dedicated or deliberate practice was an
important predictor of individual differences between individuals. Interestingly, these same studies
show that grit predicts achievement over and beyond the contribution of intelligence.
Grit is related to some of the Big Five personality traits. In particular, it shares some commonality
with the trait of conscientiousness. In contrast to conscientiousness, however, grit focuses on long-
term endurance. Grit may also be similar in certain aspects to an individual’s “need for achievement”
(McClelland, 1961). Need for achievement considers an individual’s ability to complete manageable
goals that provide immediate feedback on performance. While the idea of working towards a goal
may be similar between need for achievement and grit, individuals high in grit are more likely to set
long-term goals and continue to pursue these goals even without any positive feedback.
Grit has been measured in different settings. It has been measured with both children and adults, and
there are similar measuring instruments available for both children and adults. The questionnaire
has been administered on both the Web and by pencil and paper. A series of studies that have been
used to validate the measure were conducted on a variety of populations (Duckworth, Peterson,
Matthews, and Kelly, 2007; Duckworth and Quinn, 2009). These include visitors to a website
providing free information about psychological research, undergraduate students majoring in
psychology, incoming United States Army cadets, and children age 7-15 years old participating in a
national spelling bee. Grit is highly relevant to NAEP as a noncognitive factor that explains individual
differences in achievement. Students higher in grit may develop different study habits that allow
them to use more of their intellectual ability than other students with similar levels of intelligence.
Duckworth, Peterson, Matthews, and Kelly (2007) have provided some evidence in this direction.
When SAT scores were held constant, grit was shown to have roughly the same association to GPA as
SAT scores. These findings suggest that what student’s may lack in general cognitive ability, as
NAEP 2018-2019 OMB Clearance: Supporting Statement Part C Page 28
reflected in traditional test scores, be able to be made up in “grittiness”. They have also found that
children higher in grit were more likely to advance to higher rounds in a national spelling bee than
children who were lower in grit. Furthermore, this relationship was mediated by the number of hours
that the children practiced on the weekend—that is, children higher in grit seem to be more likely to
spend time practicing on weekends, which leads to better achievement in the spelling bee. Other
studies have shown that undergraduate students higher in grit have higher GPAs than students lower
in grit (Duckworth, Peterson, Matthews, and Kelly, 2007). This was true even though grit was
associated with lower SAT scores. In addition, U.S. military cadets who are higher in grit have been
shown to be less likely to drop out than cadets who are lower in grit (Duckworth, Peterson, Matthews,
and Kelly, 2007). This relationship holds even after controlling for other factors such as Scholastic
Aptitude Test (SAT) scores (as mentioned earlier), high school rank, and Big Five personality
characteristics.
3.5 “Desire for Learning” (Module 5)
Desire for Learning is proposed as a second main domain-general noncognitive student factor that
adds to Grit in that need for cognition assesses whether individuals see learning as an opportunity
and approach learning situations at school and outside of school with an academic mindset that helps
them apply effort, persevere, and refrain from procrastination attempts. As highlighted in the
overview section of this paper, grit and academic perseverance are key factors to student
achievement in the classroom. At the same time, the research suggests that “an isolated focus on
academic perseverance as a thing unto itself may well distract reformers from attending to student
mindsets and the development of learning strategies that appear to be crucial to supporting students’
academic perseverance.”(Farrington et al., 2012, p. 27). We therefore suggest including “Desire for
Learning” as an additional module that will provide policy relevant data on students’ mindset in
terms of their need for cognition, curiosity, and intrinsic motivation to learn and grow further. Desire
for learning plays an essential role in order to teach students to become truly engaged learners, as
highlighted by the authors of the CCSR review on noncognitive factors: “Teaching adolescents to
become learners requires more than improving test scores; it means transforming classrooms into
places alive with ideas that engage students’ natural curiosity and desire to learn in preparation for
college, career, and meaningful adult lives. This requires schools to build not only students’ skills and
knowledge but also their sense of what is possible for themselves, as they develop the strategies,
behaviors, and attitudes that allow them to bring their aspirations to fruition.” (p. 77). Desire for
NAEP 2018-2019 OMB Clearance: Supporting Statement Part C Page 29
learning relates to cognitive engagement in the multidimensional model of school engagement
described earlier on in this memo, particularly students’ motivation to learn, intrinsic motivation,
and task valuing in school (Ames, 1992; see also Eccles et al, 1993: subjective value of learning scale),
and mastery goal orientations (Wentzel, 1998).
A main theoretical basis for the relevance of desire for learning comes from research on so-called
“Need for Cognition”. Drawing on earlier work in social psychology, particularly the work of Cohen
(e.g, Cohen, 1957), Cacioppo and Petty (1982) described the need for cognition construct (that is,
“the tendency for an individual to engage in and enjoy thinking,” p. 116), and introduced a scale to
measure it, and presented evidence for the scale’s validity. For example, their first study showed that
university faculty had higher scores on the need for cognition than assembly line workers did. A
review of work in the ensuing 12 years (Cacioppo, Petty, Feinstein, and Jarvis, 1996) found that the
construct had been examined in more than 100 empirical studies; work on the need for cognition has
continued to the present day. The original scale for measuring need for cognition included 34 items,
but Cacioppo, Petty, and Kao (1984) introduced a shorter version with 18 items that appeared just a
reliable as the original.
More than 30 studies have examined reliability of scale scores, most of them using Cronbach’s alpha;
these studies generally find that the scale has high reliability. Numerous studies have also examined
the factorial structure of the original or short forms of the need for cognition scale; most of them find
a single dominant factor, with a few exceptions. For example, Tanaka, Panter, and Winborne (1988)
argue for three dimensions—cognitive persistence, cognitive confidence, and cognitive complexity.
Generally, researchers have treated the need for cognition as a one-dimensional construct. Those
who are high on need for cognition enjoy effortful cognitive endeavors and engage in them; those
who are low on need for cognition do not enjoy such endeavors and try to avoid them.
The need for cognition scale has been translated into several languages (including German, Dutch,
and Turkish) and has been administered in a variety of settings. The original items were designed for
self-administration. Respondents are presented with 18 or 34 statements (“Thinking is not my idea
of fun”) and are asked to rate each statement on a five-point scale, ranging from “extremely
uncharacteristic” to “extremely characteristic”. The items are balanced in the sense that half of the
statements indicate the presence of the need for cognition and half indicate the lack of it.
A few studies have included the need for cognition items in large-scale mail surveys (Verplanken,
1989, 1991, reports their use in a mail survey in the Netherlands), and the items would seem to lend
themselves to computerized administration (such as a web survey). The vast majority of studies
NAEP 2018-2019 OMB Clearance: Supporting Statement Part C Page 30
using the scale have administered it to undergraduates. The only studies we have found that have
used the items with respondents in the age range of the NAEP participants were conducted in
Germany (Bertrams and Dickhäuser, 2009; Preckel, Holling, and Vock, 2014). Some of the items in
the English version could exceed the vocabulary of the typical fourth grader. Thus, a version of the
scale might need to be developed for use with the NAEP student samples.
Several studies show that desire for learning/need for cognition is related to achievement in school
(e.g., Bertrams and Dickhäuser, 2009; Preckel, Holling, and Vock, 2006; see also Petty and Jarvis,
1996) and one of the stronger predictors of GPA based on meta-analytical data (Richardson et al.,
2012). There are several pathways that could account for the link between desire for learning/need
for cognition and academic success. Need for cognition reflects willingness to expend cognitive effort
and this is clearly a prerequisite for mastering difficult material. In addition, persons with higher
desire for learning engage in more effortful cognitive processing and seek out information more than
their counterparts who are low in desire for learning/need for cognition (Cacioppo et al., 1996).
Finally, those high on need for cognition also have higher intrinsic motivation to perform challenging
cognitive tasks (Cacioppo et al., 1996). Whatever the exact causal path, need for cognition does seem
to predict academic achievement, whether measured by GPA or standardized test scores.
Desire for Learning also captures aspects of Openness, reflecting people’s willingness to make
adjustments to existing attitudes and behaviors once they have been exposed to new ideas or
situations (Flynn, 2005). PISA 2012 includes a 4-item openness for problem solving scale (e.g., “I like
to solve complex problems”) that shows some conceptual overlap with the Need for Cognition (NFC)
scales described above. Correlations of the scale with achievement are among the largest across all
noncognitive indices included in the PISA questionnaires based on PISA 2012 data.
4 References Abedi, J. (2006). Psychometric issues in the ELL assessment and special education eligibility. The
Teachers College Record, 108, 2282–2303.
Abraham, C. (2012). Mapping change mechanisms and behavior change techniques: A systematic
approach to promoting behavior change through text. In C. Abraham & M. Kools (Eds.),
Writing health communication: An evidence–based guide for professionals (pp. 99–116).
London, England: Sage
NAEP 2018-2019 OMB Clearance: Supporting Statement Part C Page 31
Adams, R. J., Lietz, P.,& Berezner, A. (2013). On the use of rotated context questionnaires in
conjunction with multilevel item response models. Large–scale Assessments in Education,
1(5).
Almonte, D. E., McCullough, J., Lei, M., & Bertling. J. P. (2014, April). Spiraling of contextual
questionnaires in the NAEP TEL pilot assessment. In: Bertling, J.P. (Chair). Spiraling
Contextual Questionnaires in Educational Large–Scale Assessments (Coordinated Session).
2014 NCME Conference, Philadelphia.
Almlund, M., Duckworth, A., Heckman, J, J., & Kautz, T. (2011). Personality Psychology and
Economics. IZA Discussion Papers 5500. Retrieved from
http://ssrn.com/abstract=1765666.
American Institutes for Research (2011). 2011 School Climate and Connectedness Survey: Statewide
report. Retrieved from at http://alaskaice.org/school–climate/survey.
American Psychological Association. (2007a).Office on socioeconomic status. Retrieved from
http://www.apa.org/pi/ses/homepage.html.
American Psychological Association. (2007b). Report of the APA Task Force on socioeconomic status.
Washington, DC: Author. Retrieved from http://www2.apa.org/pi/ SES_task_force
report.pdf.
Ashford, S., Edmunds, J., & French, D. (2010). What is the best way to change self–efficacy to
promote lifestyle and recreational physical activity? A systematic review with meta–
analysis. British Journal of Health Psychology, 15, 265–288.
Astor, R. A., Benbenisty, R., & Estrada, J.N. (2009). School violence and theoretically atypical schools:
The principal’s centrality in orchestrating safe schools. American Educational Research
Journal, 46, 423-461.
Astor, R. A, Guerra, N., & Van–Acker, R. (2010). How can we improve school safety research?
Educational Researcher, 39, 69-78.
Barrick, M.R., Stewart, G. L. & Piotrowski, M. (2002). Personality and job performance: Test of the
mediating effects of motivation among sales representatives. Journal of Applied Psychology,
87, 43–51.
Barton, P.E. (2003). Parsing the achievement gap: Baselines for tracking progress. Princeton, NJ:
Policy Information Center, Educational Testing Service.
NAEP 2018-2019 OMB Clearance: Supporting Statement Part C Page 32
Battistich, V., Solomon, D., Kim, D., Watson, M., and Schaps, E. (1995). Schools as communities,
poverty levels of student populations, and students’ attitudes, motives, and performance: A
multilevel analysis. American Educational Research Journal, 32, 627–658.
Bear, G., and Yang, C. (2011). Delaware School Climate Survey technical manual. Retrieved from
http://wordpress.oet.udel.edu/pbs/wp–content/uploads/2011/12/Final–Technical–
Manual.pdf.
Bertrams, A. & Dickhäuser, O. (2009). High–school students’ need for cognition, self–control
capacity, and school achievement: Testing a mediation hypothesis. Learning and Individual
Differences, 19, 135-138.
Berry, C. M., Ones, D. C. & P.R. Sackett, P. R. (2007). Interpersonal deviance, organizational deviance,
and their common correlates: A review and meta–analysis. Journal of Applied Psychology,
92, 410-424.
Blau, P. M., & Duncan, O.D. (1967).The American Occupational Structure. New York: Wiley and Sons.
Borghans, L., Duckworth, A. L., Heckman, J. J., & Ter Weel, B. (2008). The economics and psychology
of personality traits. Journal of Human Resources, 43, 972-1059.
Bowles, S., Gintis H., & Osborne, M. (2001). The Determinants of Earnings: A Behavioral Approach.
Journal of Economic Literature, 39, 1137–1176.
Brand, S., Felner, R., Shim, M., Seitsinger, A., & Dumas, T. (2003). Middle school improvement and
reform: Development of validation of a school–level assessment of climate, cultural
pluralism and school safety. Journal of Educational Psychology, 95, 570–588.
Bryant, E.C., Glazer, E., Hansen, M.A., & Kursch, A. (1974). Associations between educational
outcomes and background variables [Monograph]. Denver, CO: National Assessment of
Educational Progress.
Cacioppo, J. T., Petty, R. E., Feinstein, J. A., and Jarvis, W. B. G. (1996). Dispositional differences in
cognitive motivation: The life and times of individuals varying in need for cognition.
Psychological Bulletin, 119, 197–253.
Cacioppo, J. T., Petty, R. E., & Kao, C. F. (1984). The efficient assessment of need for cognition.
Journal of Personality Assessment, 48, 306–307.
Carroll, J. (1963). A model of school learning. The Teachers College Record, 64, 723–723.
NAEP 2018-2019 OMB Clearance: Supporting Statement Part C Page 33
Chen, G., Gully, S. M., Whiteman, J. A., & Kilcullen, R. N. (2000). Examination of relationships among
trait–like individual differences, state–like individual differences, and learning performance.
Journal of Applied Psychology, 85, 835–847.
Clements, D. (1999). Young children and technology: In dialogue on early childhood science,
mathematics, and technology education. Washington, DC: American Association for the
Advancement of Science.
Clements, D. H., & Sarama, J. (2003). Young children and technology: What does the research say?
Young Children, 58, 34-40.
Clifford, M., Menon, R., Condon, C. & Hornung, K. (2012). Measuring School Climate for Gauging
Principal Performance: A Review of the Validity and Reliability of Publicly Accessible Measures.
American Institute for Research. Retrieved from http://www.air.org/resource/measuring-
school-climate-gauging-principal-performance.
Cohen, A. R. (1957). Need for cognition and order of communication as determinants of attitude
change. In C. Hovland (Eds.), The order of presentation in persuasion. New Haven, CT: Yale
University Press.
Cohen, J. (2013). School climate and culture improvement: A prosocial strategy that recognizes,
educates, and supports the whole child and the whole school community. In Brown, Cor-
rigan & Higgins–D’Alessandro (Eds.), The Handbook of Prosocial Education: Rowman and
Littlefield Publishing Group.
Cohen, G. L., & Garcia, J. (2008). Identity, belonging, and achievement: A model, interventions,
implications. Current Directions in Psychological Science, 17, 365-369.
Coleman, J. S., Campbell, E. Q., Hobson, C. J., McPartland, J., Mood, A. M., Weinfield, F. D., et at.
(1966).Equality of educational opportunity (2 vols.). Washington, DC: U.S. Government
Printing Office.
Comber, L. C., & Keeves, J. P. (1973). Science Education in Nineteen Countries. Stockholm: Almquist
& Wiksell.
Costa. P. T., & McCrae, R. R. (1992). Revised NEO Personality Inventory (NEO–PI–R) and NEO Five–
Factor Inventory (NEO–FFI) professional manual. Odessa: FL: Psychological Assessment
Resources, Inc.
Cowan, C. D., Sellman S.W. (2008). Improving the quality of NAEP socioeconomic status information:
Report on research activities. Alexandria, VA: Human Resources Research Organization
NAEP 2018-2019 OMB Clearance: Supporting Statement Part C Page 34
(HumRRO). Retrieved from http://www.humrro.org/corpsite/publication/ improving-
quality-naep-socioeconomic-status-information-report-research-activities, February, 2012.
Cuban, L., Kirkpatrick, H., & Peck, C. (2001). High access and low use of technologies in high school
classrooms: Explaining an apparent paradox. American Educational Research Journal, 38,
813-834.
Cuff, N.B.(1934).The vectors of socio–economic status. Peabody Journal of Education, 12, 114-117.
Demb, A., Erickson, D., & Hawkins–Wilding, S. (2004). The laptop alternative: student’s reactions
and strategic implications. Computers and Education, 43, 383-401.
Diener, E. & Tov, W. (2006). National accounts of well-being. In K. C. Land, A. C. Michalos, & M. J.
Sirgy (Eds.), Handbook of social indicators and quality of life research (pp. 137-156). New
York, NY: Springer. Duckworth, A.L., Peterson, C., Matthews, M.D., & Kelly, D.R. (2007). Grit:
Perseverance and passion for long–term goals. Journal of Personality and Social Psychology,
92, 1087-1101.
Duckworth, A. L., & Quinn, P. D. (2009). Development and validation of the short grit scale (grits).
Journal of Personality Assessment, 91, 166-174.
Dweck, C. S., Walton, G. M., and Cohen, G. L. (2011). Academic tenacity: Mindsets and skills that
promote long–term learning. White paper prepared for the Gates Foundation. Seattle, WA.
Eccles, J. S., Wigfield, A., Midgley, C., Reuman, D., MacIver, D., & Feldlaufer, H. (1993). Negative
effects of traditional middle schools on students’ motivation. Elementary School Journal, 93,
553-574.
Ericsson, K. A., & Charness, N. (1994). Expert performance: its structure and acquisition. American
Psychology, 49, 725-47
Espinosa, L.M.; Laffey, J.M., Whittaker, T., & Sheng, Y. (2006). Technology in the home and the
achievement of young children: Findings from the Early Childhood Longitudinal Study. Early
Education and Development, 17, 421-441.
Fairlie, R. (2005). The effects of home computers on school enrolment. Economics of Education
Review, 24, 533-547.
Farrington, C.A., Roderick, M., Allensworth, E., Nagaoka, J., Keyes, T.S., Johnson, D.W., & Beechum,
N.O. (2012). Teaching adolescents to become learners. The role of noncognitive factors in
shaping school performance: A critical literature review. Chicago: University of Chicago
Consortium on Chicago School Research.
NAEP 2018-2019 OMB Clearance: Supporting Statement Part C Page 35
Foy, P., & Drucker, K. T. (2011). PIRLS 2011 user guide for the international database. Supplement 1.
International version of the PIRLS 2011 background questionnaires and curriculum
questionnaire. Chestnut Hill, MA: TIMSS & PIRLS International Study Center, Lynch School of
Education, Boston College.
Furrer, C., & Skinner, E. (2003). Sense of relatedness as a factor in children’s academic engagement
and performance. Journal of Educational Psychology, 95, 148-162.
Galton, F. (1892). Hereditary Genius: An inquiry into its laws and consequences. London: Macmillan.
Ganzeboom, H. B., De Graaf, P. M., & Treiman, D. J. (1992). A standard international socio–economic
index of occupational status. Social Science Research 21, 1-56.
Ginsburg, A., & Smith, M. S. (2013, December 5-7). Key Education Indicators (KEI): Making Sense of
NAEP Contextual Variables. Presentation at National Assessment Governing Board Meeting,
Baltimore.
Goodenow, C. (1992). Strengthening the links between educational psychology and the study of
social contexts. Educational Psychologist, 27, 177–196.
Goodenow, C., & Grady, K. E. (1993). The relationship of school belonging and friends’ values to academic motivation among urban adolescent students. Journal of Experimental Education, 2, 60–71.
Griffin, K. A. & Allen, W. R. (2006). Mo’ money, mo’ problems?: High achieving Black high school
students? Experiences with resources, racial climate, and resilience. Journal of Negro
Education, 75, 478-494.
Haggerty, K., Elgin, J & Woodley, A. (2010). Social–emotional learning assessment measures for middle school youth. Social Development Research Group, University of Washington and the Raikes Foundation.
Harwell, M. R., & Lebeau, B. (2010). Student eligibility for a free lunch as an SES Measure in
education research. Educational Researcher, 39, 120-131.
Hauser, R. M., & Andrew, M. (2007). Reliability of student and parent reports of socioeconomic
status in NELS–88. Working paper presented at ITP seminar at the University of Wisconsin–
Madison. Retrieved from http://www.wcer.wisc.edu/itp/Spring%20 08%20
seminar/HauserNELS–SES%20measurement_070607a.pdf.
Hauser, R. M., & Warren, J.R. (1997). Sociological indexes for occupations: A review, update, and
critique. Sociological Methodology, 27, 177-298.
Heckman, J., & Rubinstein, Y. (2001). The importance of noncognitive skills: Lessons from the GED
testing program. American Economic Review, 91, 145–149.
NAEP 2018-2019 OMB Clearance: Supporting Statement Part C Page 36
Heckman J. J., Stixrud, J., & Urzua, S. (2006). The Effects of Cognitive and Noncognitive Abilities on
Labor Market Outcomes and Social Behavior. Journal of Labor Economics 24, 411-482.
Heckman, J. J., & Kautz, T. (2013). Fostering and Measuring Skills: Interventions That Improve
Character and Cognition. IZA Discussion Paper No. 7750. Bonn: Institute for the Study of
Labor.
Hess, R. D., & McGarvey, L., J. (1987). School-relevant effects of educational uses of microcomputers
in kindergarten classrooms and homes. Journal of Educational Computing Research, 3, 269-
287.
Hanson, T. L. (2011). Measurement analysis of California School Climate, Health, and Learning
Survey (Cal–SCHLS) for staff. Unpublished document.
Hamre, B. K., & Pianta, R. C. (2001). Early teacher–child relationships and the trajectory of
children’s school outcomes through eighth–grade. Child Development, 72, 625–638.
Hoy, W. K., Hannum, J., & Tschannen–Moran, M. (1998). Organizational climate and student
achievement: A parsimonious and longitudinal view. Journal of School Leadership, 8, 336–
359.
James, W. (1907, March 1). The energies of men. Science, 25, 321–332.
Kaplan, D. & Wu, D. (2014, April 2-6) Imputation Issues Relevant to Context Questionnaire Rotation.
In: Bertling, J.P. (Chair). Spiraling Contextual Questionnaires in Educational Large–Scale
Assessments (Coordinated Session). 2014 NCME Conference, Philadelphia.
Lent, R. W., & Brown, S. D. (2006). On conceptualizing and assessing social cognitive constructs in
career research: A measurement guide. Journal of Career Assessment, 14, 12-35.
Levin, H. M., & Belfield, C. R. (2002). Families as contractual partners in education. UCLA Law
Review, 49, 1799-1824.
Lindqvist, E., & R. Vestman (2011). The labor market returns to cognitive and noncognitive ability:
Evidence from the Swedish enlistment. American Economical Journal: Applied Economics, 3,
101-128.
Lowther, D. L., Ross, S. M., & Morrison, G. M. (2003). When each one has one: The influences on
teaching strategies and student achievement of using laptops in the classroom. Educational
Technology Research and Development, 51, 23–44.
NAEP 2018-2019 OMB Clearance: Supporting Statement Part C Page 37
Lynd, R. S., & Lynd, H. M. (1929). Middletown: A study in American culture. New York: Harcourt
Brace.
McCrae, R. R., & Costa, P. T. (1989). The structure of interpersonal traits: Wiggin’s circumplex and
the five–factor model. Journal of Personality and Social Psychology, 45, 586–595.
Mackinnon, G. R., & Vibert, C. (2002). Judging the constructive impacts of communication
technologies: a business education study. Education and Information Technology, 7, 127–
135.
Mattison, E., & Aber, M.S. (2007). Closing the achievement gap: The association of racial climate
with achievement and behavioral outcomes. American Journal of Community Psychology, 40,
1-12.
McClelland, D. C. (1961). The achieving society. Oxford, England: Van Nostrand.
McMillan, D.W., & Chavis, D. M. (1986). Sense of community: A definition and theory. Journal of Community Psychology, 14, 6–23.
Monseur, C. & Bertling, J. P. (2014, April 2-3). Questionnaire rotation in international surveys:
findings from PISA. In: Bertling, J.P. (Chair). Spiraling Contextual Questionnaires in
Educational Large–Scale Assessments (Coordinated Session). 2014 NCME Conference,
Philadelphia.
Nyhus, E. and E. Pons (2005). The effects of personality on earnings. Journal of Economic Psychology,
26, 363–384.
National Assessment Governing Board. (2012). Policy statement on NAEP background questions and
the use of contextual data in NAEP reporting. Washington, DC: U .S. Department of Education,
National Assessment Governing Board.
National School Lunch Program. (2008). Fact sheet. Retrieved from
http://www.fns.usda.gov/cnd/governance/notices/naps/NAPs.htm.
OECD (2009). Creating effective teaching and learning environment: First results of Teching and
Learning International Survey (TALIS). OECD.
OECD (2013, PISA 2012 assessment and analytical framework: Mathematics, reading, science,
problem solving and financial literacy. Paris: OECD Publishing. Retrieved from
http://dx.doi.org/10.1787/9789264190511-en.
O’Connor, M.C., & Paunonen, S. V. (2007). Big five personality predictors of postsecondary academic
performance. Personality and Individual Differences, 43, 971-990.
NAEP 2018-2019 OMB Clearance: Supporting Statement Part C Page 38
OECD (2003). Are students ready for a technology – rich world? What PISA studies tell us. Retrieved
from
http://www.oecd.org/education/school/programmeforinternationalstudentassessmentpis
a/35995145.pdf.
OECD (2009). Creating effective teaching and learning environment: First results of Teching and
Learning International Survey (TALIS). OECD.
OECD (2009). PISA 2009 assessment framework: Key competencies in reading, mathematics and
science. Retrieved from http://www.oecd.org/pisa/pisaproducts/44455820.pdf.
OECD (2010a). PISA 2009 Results: Overcoming Social Background - Equity in Learning Opportunities
and Outcomes (Volume II). Retrieved from http://dx.doi.org/10.1787/9789264091504-en.
OECD (2011). PISA 2009 Results: Students On Line Digital Technologies and Performance (Volume
VI). Paris: OECD Publishing.
Paunonen, S. V. (2003). Big five factors of personality and replicated predictions of behavior.
Journal of Personality and Social Psychology, 84, 411-424.
Paunonen, S. V. and M.C. Ashton (2001a). Big five factors and facets and the prediction of behavior.
Journal of Personality and Social Psychology, 81, 524-539.
Paunonen, S. V., and M.C. Ashton (2001b). Big five predictors of academic achievement. Journal of
Research in Personality, 35, 78-90.
Payton, J., Weissberg, R.P., Durlak, J.A., Dymnicki, A.B., Taylor, R.D., Schellinger, K.B., & Pachan, M.
(2008). The positive impact of social and emotional learning for kindergarten to eighth–grade
students: Findings from three scientific reviews. Chicago, IL: Collaborative for Academic,
Social, and Emotional Learning.
Peck, C., Cuban, L., & Kirkpatrick, H. (2002). Techno–promoter dreams, student realities. Phi Delta
Kappan, 83, 472-480.
Peterson, C & Seligman, M.E.P. (2004). Character Strengths and Virtues: A Handbook and
Classification. Washington, D.C.: APA Press and Oxford University Press.
Poropat, A. E. (2009). A meta–analysis of the five-factor model of personality and academic
performance. Psychological Bulletin, 135, 322–338.
Preckel, F., Holling, H., & Vock, M. (2006). Academic underachievement: Relationship with
cognitive motivation, achievement motivation, and conscientiousness. Psychology in the
Schools, 43, 401-411.
NAEP 2018-2019 OMB Clearance: Supporting Statement Part C Page 39
Purves A.C. (1987). I.E.A. an Agenda for the Future, International Review of Education, 33, 103–107.
Reynolds, A. J., & Walberg, H. J. (1992). A structural model of science achievement and attitude: An
extension to high school. Journal of Educational Psychology, 84, 371-382.
Richardson, M. & Abraham, C. (2009). Conscientiousness and achievement motivation predict
performance. European Journal of Personality, 23, 589–605.
Richardson, M., Abraham, C., & Bond, R. (2012). Psychological correlates of university students’
academic performance: A systematic review and meta–analysis. Psychological Bulletin, 138,
353-387.
Robbins, S. B., Lauver, K., Le, H., Davis, D., Langley, R., & Carlstrom, A. (2004). Do psychosocial and
study skill factors predict college outcomes? A meta–analysis. Psychological Bulletin, 130,
261–288.
Roberts, B. W., Kuncel, N. R., Shiner, R., Caspi, A. & Goldberg, L. R. (2007). The power of
personality: The comparative validity of personality traits, socioeconomic status, and
cognitive ability for predicting important life outcomes. Perspectives on Psychological
Science, 2,313–345.
Ruus, V., Veisson, M., Leino, M., Ots, L., Pallas, L., Sarv, E., & Veisson, A. (2007). Students’ well–being,
coping, academic success, and school climate. Social Behavior & Personality: An International
Journal, 35, 919–936.
Ryan, R. M., & Deci, E. L. (2000). Self–determination theory and the facilitation of intrinsic motivation, social development, and well–being. American Psychologist, 55, 68–78.
Rychen, D.S., & Salganik, L.H. (Eds). (2003). Defining and selecting key competencies. Cambridge, MA:
Hogrefe & Huber.
Saucier, G., & L.R. Goldberg (2002). Assessing the big five: Applications of 10 psychometric criteria
to the development of marker scales, In B. de Raad and M. Perugini (eds.), Big Five
Assessment (pp. 29–58). Goettingen, Germany: Hogrefe & Huber.
Salerno, C. (1995). The effect of time on computer-assisted instruction for at-risk students. Journal
of Research on Computing in Education, 28, 85–97.
SES Expert Panel. (2012). Improving the Measurement of Socioeconomic Status for the National
Assessment of Educational Progress: A Theoretical Foundation. White Paper prepared for the
National Center for Education Statistics. Washington, DC: U.S. Department of Education.
NAEP 2018-2019 OMB Clearance: Supporting Statement Part C Page 40
Siegle, D., & Foster, T. (2001). Laptop computers and multimedia and presentation software: their
eVects on student achievement in anatomy and physiology. Journal of Research on
Technology in Education, 34, 29–37.
Sims, V. M. (1927).The measurement of socioeconomic status. Bloomington, IL: Public School Printing
Co.
Singh, M. (2013). A longitudinal study of a state–wide reading assessment: The importance of early
achievement and socio–demographic factors. Educational Research and Evaluation, 19, 4-18.
Sirin, S. R. (2005). Socioeconomic status and academic achievement: A meta–analytic review of
research. Review of Educational Research, 75, 417-453.
Solomon, D., Watson, M., Battistich, V., Schaps, E. & Delucchi, K. (1996). Creating classrooms that
students experience as communities. American Journal of Community Psychology, 24, 719–
748.
Spaeth, J. L. (1976). Cognitive complexity: A dimension underlying the socioeconomic achievement
process. In W.H.Sewall, R.M.Hauser, & D.L.Featherman (Eds.), Schooling and achievement in
American society (pp.103–131). New York: Academic Press.
Specht, J., Egloff, B., & Schmukle, S. C. (2011). Stability and change of personality across the life
course: The impact of age and major life events on mean–level and rank–order stability of
the Big Five. Journal of Personality and Social Psychology, 101, 862–882.
Sterbinksky, A., Ross, S. M., & Redfield, D. (2006). Effects of comprehensive school reform on
student achievement and school change: A longitudinal multi–site study. School
Effectiveness and School Improvement, 17, 367–397.
Stewart, E. B. (2008). School structural characteristics, student effort, peer associations, and
parental involvement: The influence of school- and individual-level factors on academic
achievement. Education & Urban Society, 40, 179–204.
Stock, J., & Cervone, D. (1990). Proximal goal setting and self–regulatory processes. Cognitive
Therapy and Research, 14, 483–498.
Tanaka, J. S., Panter, A., & Winborne, W. C. (1988). Dimensions of the need for cognition: Subscales
and gender differences. Multivariate Behavioral Research, 23, 35–50.
Taussig, F. W. (1920).Principles of economics. Newcastle: Cambridge Scholars Publishing.
Trimmel, M., & Bachmann, J. (2004). Cognitive, social, motivational and health aspects of students
in laptop classrooms. Journal of Computer Assisted Learning, 20, 151–158.
NAEP 2018-2019 OMB Clearance: Supporting Statement Part C Page 41
Voight, A. & Hanson, T. (2012). Summary of existing school climate instruments for middle school.
San Francisco: REL West at WestEd.
Verplanken, B. (1989). Involvement and need for cognition as moderators of beliefs-attitude-
intention consistency. British Journal of Social Psychology, 28, 115–122.
Wentzel, K. B., & Asher, S. R. (1995). The academic lives of neglected, rejected, popular, and
controversial children. Child Development, 66, 754–763.
Wentzel, K. R., & Caldwell, K. (1997). Friendships, peer acceptance, and group membership:
Relations to academic achievement in middle school. Child Development, 68, 1198–1209.
White, K. R. (1982). The relation between socioeconomic status and academic achievement.
Psychological Bulletin, 91, 461–481.
Zheng, B., Warschauer, M., & Farkas, G. (2013). Digital writing and diversity: The effects of school
laptop programs on literacy process and outcomes. Journal of Educational Computing
Research, 48, 267–299.
NAEP 2018-2019 OMB Clearance: Supporting Statement Part C Page 42
Part C-2: 2017 Reading Issues Paper
NAEP 2018-2019 OMB Clearance: Supporting Statement Part C Page 43
KEY CONTEXTUAL FACTORS FOR READING ACHIEVEMENT
Reading “Issues Paper”
Jonas P. Bertling & Debby E. Almonte Educational Testing Service
Written in Preparation for New Item Development for the 2017 Digital Based NAEP Reading Survey Questionnaires
April 2015
Executive Summary
This paper presents an overview of key contextual factors for Reading Achievement and thereby provides a basis for the development of NAEP Reading Survey Questionnaires for the 2017 technology-based Reading assessment. Four “issues” (i.e., broad topics) are described in this issues paper. Throughout these issues, the role of technology for learning and instruction is highlighted as an overarching theme. Issues capture both opportunity-to-learn factors and noncognitive student factors relevant to Reading Achievement. High-level implementation recommendations are provided for each issue emphasizing key areas for suggested new item development, thereby creating a starting point for the definition of modules and/or clusters of survey questions that can provide a basis for scale indices.
Issue 1: Resources for Learning and Instruction
Issue 1 captures the extent to which resources for learning and instruction—People, Products, and Time—are available to students, teachers, and schools. Areas for potential new development are especially the availability and use of technology-based reading resources inside and outside of school, and a better quantification of the time available for learning and instruction.
Issue 2: Organization of Instruction
Issue 2 comprises how instruction inside and outside of school is organized, and how technology is incorporated into instruction. Areas for potential new development are especially the integration of technology-based reading, different text forms, web resources, assessments, interactive tools, and multimedia into the classroom. Important questions are also how teachers adapt their teaching practices to technology-based reading innovations, how teachers use technology-based reading innovations to engage students with reading, and how technology-based reading innovations impact the curricula at the different grade levels.
NAEP 2018-2019 OMB Clearance: Supporting Statement Part C Page 44
Issue 3: Teacher Preparation
Issue 3 captures how well teachers are prepared for teaching reading, what teachers’ professional development opportunities are, and to what extent teachers make use of these opportunities. An important area for new development is teachers’ preparedness to use technology in their reading instruction in purposeful ways. Inclusion of questions that explore the format of professional development programs, the skills taught within these programs, and the value and applicability of these programs in the classroom could be beneficial as well.
Issue 4: Student Factors
Issue 4 addresses noncognitive student factors related to reading, represented by their reading activities outside of school, reading interest and motivation, self-related beliefs, and their metacognition and reading strategies, especially with regard to technology-based reading. Future item development should focus on capturing more behavioral and attitudinal facets of engagement (e.g., interest, motivation, and self-related beliefs) given that engagement is a significant predictor of academic achievement. Additionally, an important question to address is how other student factors represented in the 2017 Core questionnaire can be contextualized for reading (e.g., Grit, Desire for Learning); this would allow us to distinguish whether items are domain general or domain specific.
NAEP 2018-2019 OMB Clearance: Supporting Statement Part C Page 45
Introduction
In 2013, the National Assessment Governing Board (NAGB) released the Reading Framework for the 2013 National Assessment of Educational Progress. Reading is conceptualized as an “active and complex process that involves: understanding written text, developing and interpreting meaning, and using meaning as appropriate to type of text, purpose, and situation.” This paper further describes the theoretical base and content of the 2013 NAEP Reading assessment. Past frameworks, along with subject-specific issues papers help inform item development for future survey questionnaires.
The current reading issues paper will serve as a guideline to identify constructs1 or modules2 that will be captured in the questionnaires by creating clusters of questions3 and more robust reporting elements such as scale indices4. Traditionally, NAEP survey questionnaires have been analyzed and reported on the item level, however in 2017 we will consider reporting at the indices level (see Table 2).
Table 1. Changes to NAEP Survey Questionnaire Approach.
Historical Approach New Approach
Design Single questions Modules of questions and select single questions
Reporting Single questions Indices based on multiple questions and select single questions
Specifically, the purpose of this revised issues paper5 is to guide the development of the 2017 technology-based Reading survey questionnaires, and subsequent reading questionnaires, based on relevant issues and sub-issues (i.e., more specific topics related to the broader issue) that are or might be related to student reading performance.
There are two different sets of contextual variables that guide this paper. The first set of contextual variables are noncognitve or student factors, referring to the skills, strategies, attitudes and behaviors that are distinct from content knowledge and academic skills (Farrington et al., 2012). Student factors also include cognitive ability, however we are not capturing cognitive ability with the NAEP survey questionnaires. For the sake of completeness cognitive ability is shown in the schematic model. The focus lies on noncognitive variables that can be measured with self-report questionnaire. The second set of contextual variables are related to whether students are exposed to opportunities to acquire relevant knowledge and skills, both at school and outside of school otherwise known as opportunity to learn factors.
1 Definition: Complex psychological concept, for example motivation. 2 Definition: A more defined, but still general, version of the issue. For example, a module for the issue “student engagement” may be “student engagement when reading on technological devices”. 3 Definition: A group of specific questions that capture the important components of the module. 4 Definition: A cluster of questions that can be aggregated. 5 The previous version of this issues paper was prepared in 2009.
NAEP 2018-2019 OMB Clearance: Supporting Statement Part C Page 46
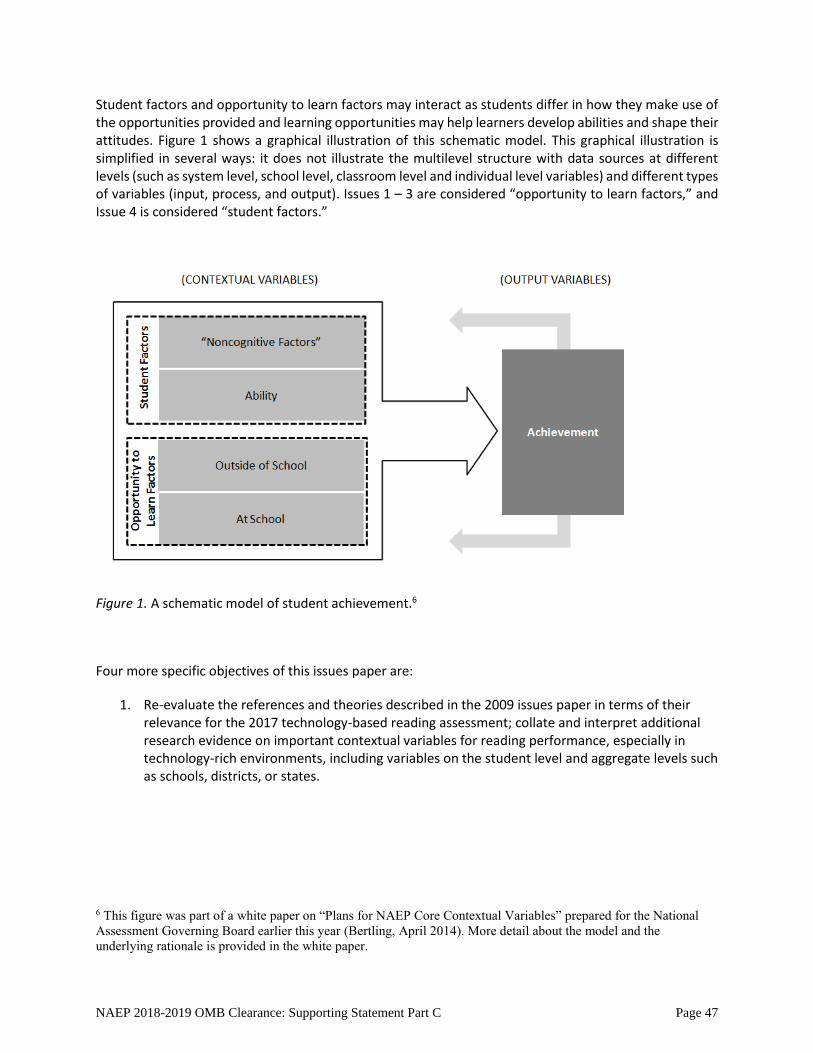
Student factors and opportunity to learn factors may interact as students differ in how they make use of the opportunities provided and learning opportunities may help learners develop abilities and shape their attitudes. Figure 1 shows a graphical illustration of this schematic model. This graphical illustration is simplified in several ways: it does not illustrate the multilevel structure with data sources at different levels (such as system level, school level, classroom level and individual level variables) and different types of variables (input, process, and output). Issues 1 – 3 are considered “opportunity to learn factors,” and Issue 4 is considered “student factors.”
Figure 1. A schematic model of student achievement.6
Four more specific objectives of this issues paper are:
1. Re-evaluate the references and theories described in the 2009 issues paper in terms of their relevance for the 2017 technology-based reading assessment; collate and interpret additional research evidence on important contextual variables for reading performance, especially in technology-rich environments, including variables on the student level and aggregate levels such as schools, districts, or states.
6 This figure was part of a white paper on “Plans for NAEP Core Contextual Variables” prepared for the National Assessment Governing Board earlier this year (Bertling, April 2014). More detail about the model and the underlying rationale is provided in the white paper.
NAEP 2018-2019 OMB Clearance: Supporting Statement Part C Page 47
2. Enhance clarity of defined issues by reducing redundancies and re-organizing issues or sub-issues where needed.
3. Strengthen focus on reading-specific contextual variables (i.e., important background or context variables) taking into consideration that these variables may overlap with core contextual variables. Variables that are relevant to performance across all subjects assessed in NAEP (e.g., general availability of and familiarity with technology, perseverance, achievement motivation, or school climate) should be included in the core, or possibly an extended core in the 2017 technology-based NAEP Survey Questionnaires.7
4. Provide high-level implementation recommendations for each issue emphasizing key areas for new item development, thereby creating a starting point for the definition of modules and/or clusters of survey questions that can provide a basis for scale indices.
Four issues with a total of 15 sub-issues that reflect key contextual variables for reading achievement are presented in this revised paper. The main criteria for selecting these issues were the following:
a) Factors captured in each issue should have a clear relationship with student achievement. Student factors with no clear or low correlations with achievement based on the published research are discarded from inclusion. This criterion directly refers to the NAEP statute. Issues with a strong research foundation based on several studies (ideally, meta-analyses) and established theoretical models will be favored over issues with less research evidence regarding the relationship with achievement or issues with a less established theoretical foundation.
b) Factors captured in each issue should be malleable and actionable in terms of possible interventions in an outside the classroom.
c) Factors should be amenable for measurement with survey questionnaires. Some of the factors summarized above (e.g., social skills, learning strategies) might require other assessment strategies to provide meaningful and reliable measures.
d) Issues suggested for inclusion in the Core Survey Questionnaires should focus on those student and OTL factors that are domain-specific, meaning that they are not specific to reading achievement.
Additional items will be developed for potential inclusion in the 2017 Reading questionnaires using this issues paper as a guideline, and will be tested in cognitive interviews. After the cognitive interviews have been conducted, the data will be reviewed to help inform which items should be administered in the 2016 Pilot. The items will be reviewed once more after the 2016 Pilot to inform which items are administered during in the 2017 Operational assessment. See Appendix A for an illustration of this process.
7 New item development for future core survey questionnaires is a separate effort not addressed in this issues paper.
NAEP 2018-2019 OMB Clearance: Supporting Statement Part C Page 48
ISSUE 1: RESOURCES FOR LEARNING AND INSTRUCTION
The resources available for reading learning and instruction affect how reading is learned and taught in schools (Greenwald, Hedges, & Laine, 1996; Lee & Barro, 2001; Lee & Zuze, 2011). Resources available to the student outside of school further shape their opportunities to learn. These “resources” encompass more than every day classroom tools, such as resources and services available at the local, district, and state levels. Resources include people resources (e.g., teachers and counselors), product resources (e.g., libraries or media centers, textbooks, computers, devices for technology-based reading, or other technologies), and time resources (e.g., teachers’ time to prepare lessons, or students’ time to learn and study). General resources (e.g., school buildings, classroom space, and technological equipment in the classroom) can be distinguished from subject-specific resources for reading (e.g., book, eBooks, and other technology-based reading resources, libraries, or time for reading instruction).
In the 21st Century literacy environment, information and knowledge about any topic is now readily accessible via technological devices (e.g., computers, tablets, handhelds, phones) linked to the internet, which is quintessentially a networked, virtual universal library. With the growing accessibility of the Internet and the increased use of electronic communication, technology-based reading and multimedia resources, technology not only influences student learning but also has a strong influence on the teaching environment. Apps that link to the Internet and online instructional tools are now available as instructional aids. Access to technologies, sufficient technological infrastructure in the classroom, and training in how to implement them effectively, will determine the extent to which teachers use them for instruction (Common Sense Media, 2013). Three sub-issues are defined in Table 1.
Table 1 - Resources for Learning and Instruction: Sub-issues
Issue 1.1.: People Resources
People resources include resources for learning and instruction both inside and outside of school. A school’s people resources are comprised of the individuals who provide instruction. The composition of the instructional staff, student-to-teacher ratio, and availability of curriculum specialists are key aspects (Ehrenberg, Brewer, Gamoran, & Willms, 2001; Funkhouser, E., 2009; Nye, Konstantpoulos, & Hedges, 2004). Outside the school, people resources include home reading support and parental interventions that can promote literacy acquisition (Darling & Westberg, 2004; Kim & Quinn, 2013, Sénéchal & Young, 2008; Van Steensel, McElvany, Kurvers, & Herppich, 2011), not only prior to a student’s entry to school but throughout all years of schooling (Baker, 2003; Klauda & Wigfield, 2012).
Issue 1.2.: Product Resources
Product resources describe school-based resources—in the classroom, in the local schools, and across the district as well as home resources relevant to reading. The availability or absence of specific types of product resources, and the quality of these may facilitate or hinder the learning environment’s positive impact. Desirable reading resources include books, technology-based reading resources, reading areas within classrooms and the school (i.e., library or media center), availability of reading-based interventions, and technology, such as computers, tablets and e-readers, software and apps, and access to the Internet and e-mail. The increase of technological access and availability has resulted in some school or school district shifts from traditional print reading to electronic reading. For example, Los Angeles Unified School District (LAUSD), the second largest school district in the country, has recently decided to transition students from hard-copy textbooks to electronic textbooks on iPads. General computer use has been shown to be positively associated with reading achievement (Bowers & Berland, 2013; Jenkins, 2006; Lee, Brescia, & Kissinger, 2009; Sutherland, Facer, Furlong, & Furlong, 2000) and apps for mobile devices can constitute effective complements to reading instruction (Chiong & Shuler, 2010; Lieberman, Bates, & So, 2009). As student access to online media is constantly increasing (Gutnick, Robb, Takeuchi, & Kotler, 2011; Rideout, Foehr, & Roberts, 2010), it
NAEP 2018-2019 OMB Clearance: Supporting Statement Part C Page 49
constitutes an important potential performance moderator. Limited home access to these resources can, for instance, widen achievement gaps and further disadvantage students who don’t have access to relevant technology (Hsu, Wang, & Runco, 2013, Leu et al., 2009).
Research underlines the importance of the availability of reading resources in schools, for instance through libraries (i.e., a stationary structure that houses books, and may or may not include a computer lab or an audio/video collection) or media centers (i.e., a stationary structure that includes various audio/video resources such as computers, Internet resources, DVDs, VHS, CDs, streaming video and audio; this center may or may not include book collections). Reading achievement is promoted especially by ensuring a variety of reading materials so that students can choose books they are interested in (Allington et al., 2010; Clark, 2010). Further, new resources for technology-based reading can help students solve tasks inside and outside of school in ways that were not accessible with traditional media resources. For example, if students do not know the meaning of a word, they may look it up in an online dictionary, or if they are unfamiliar with a concept, they may watch a video about it on YouTube. Research indicates that skilled readers use the resources available to them to foster their own understanding (Sabatini & O’Reilly, 2013). As a result of new technological devices student’s now might have access to new genres and types of texts, both inside and outside of school that they might be interested in and engaged with. In the classroom, as technology-based reading becomes more relevant, both for the teacher and student, it is important to capture (a) strategies by which teachers and schools adopt technological devices; (b) the ways teachers integrate technological devices into teaching activities; and (c) the ways schools integrate technological devices into extracurricular learning opportunities for students. Issue 2 will elaborate more on the integration of technologies into teaching practices.
Issue 1.3.: Time Resources
The third relevant resource category—time—can be conceptualized in terms of three facets of an effective reading program: importance, opportunity, and responsibility. “Importance” manifests as the amount of time devoted to reading instruction per week at the 4th, 8th, and 12th grade levels. Schools have been steadily increasing the time spent on reading and mathematics—the subjects that are the primary targets of standardized testing (Dillon, 2006; West, 2007). “Opportunity” refers to the degree to which schools provide teachers with the opportunity to prepare lessons, to review students’ work, or to collaborate with other teachers, to prepare assessments and interpret assessment data, and to make instructional decisions. Also, time as “responsibility” represents the time that schools expend preparing for and administering school-, district-, state-, and/or federally-mandated tests, the effects of which are a topic of continuing debate. Knowledge of the amount of time reading teachers devote to the activities associated with standardized testing can provide additional information on the relationship between testing preparation and student achievement in reading. Outside of school, time spent on homework and studying for exams and assessments is an important aspect that falls under this issue as well. Yet, the empirical evidence regarding relationships between time spent on homework and achievement is complex. For instance, high achievers often spend less time on homework because they apply more efficient learning strategies (Trautwein, 2007; Won & Han, 2010). Generally, homework seems more effective for high-achieving and older students (Hattie, 2009). Trautwein (2007) suggested measures of homework frequency rather than homework time as an alternative approach to capture the effect of homework on achievement. The second issue, Organization of Instruction will elaborate more on the importance of using time for learning and instruction in purposeful and effective ways.
Considerations for Potential Development for Issue 1: Promising areas for future item development may be enhancing the measurement of the availability and use of technology-based reading devices inside and outside of school. Item development could focus on distinguishing between different mediums (print versus digital reading), and types of technologies (e.g.,
NAEP 2018-2019 OMB Clearance: Supporting Statement Part C Page 50

desktop versus tablet). Item development might also discern between the quantity and quality of resources, and identifying limited resources that deter learning (e.g., classrooms being overcrowded, teachers having too many teaching hours). Further, including items that assess time available for learning and instruction could enhance future survey questionnaires.
NAEP 2018-2019 OMB Clearance: Supporting Statement Part C Page 51
ISSUE 2: ORGANIZATION OF INSTRUCTION
The literature shows that teaching and instruction can influence students’ opportunities to learn (Ancess, 2000). Issue 2 comprises two related sub-issues—the content of the curriculum and the instructional strategies applied by the teacher, including the integration of technological resources into classroom instruction and student assignments. These sub-issues are defined in Table 2.
Table 2 - Organization of Instruction: Sub-issues
Issue 2.1: Curriculum Content
Knowing what the curriculum comprises, as well as the degree to which it can be considered the same across a set of schools, is prerequisite to understanding its effectiveness, independently and in interaction with other factors. Questions that reflect key facets of curriculum definition and assessment are: Who creates the reading curriculum? Are teachers on board with the existing or mandated curriculum? How much flexibility are teachers granted to tailor the curriculum to individual students’ needs? To what extent may students choose their own reading material? Is reading taught as a separate course or as part of a larger language arts curriculum? Which types of text do students read? How, and to what extent are technology-based and multimedia resources integrated into the reading curriculum?
Content coverage, content exposure, and content emphasis are, in addition to quality of instruction, the three most prominently used variables in international educational research to capture students’ opportunity to learn (OTL; Carrol, 1963; Abedi et al., 2006). OTL and relevant prior knowledge students have acquired before an assessment represent important achievement moderators and/or predictors. When students or student groups differ considerably with regard to prior exposure to relevant content aspects of a Reading assessment, test scores reflect not only reading ability per se, but also prior knowledge (Katz & Lautenschlager, 2001). Including measures of opportunity to learn and curricular topics covered in classroom instruction (Kyllonen & Bertling, 2013) can help disentangle these relationships.
Issue 2.2: Instructional Strategies
In addition to understanding curriculum content, the relationships between different instructional strategies and achievement, within and across curricula should be considered. This might include asking teachers what pedagogical methods they believe are most effective; what genres they teach; whether they select texts for reading or whether textbooks and/or technology-based reading resources are mandated by the school/district; whether they teach vocabulary, reading, and other language arts separately or as part of a holistic context (e.g., do they teach vocabulary through providing lists of words, through analyzing context, or through both methods?), and whether reading strategies are taught in the classroom and teachers apply methods to activate student involvement and cognition (Klieme, Pauli, & Reusser, 2009; Lipowsky et al., 2009). Further, team teaching and teacher collaboration are other aspects of this issue.
Research on different teaching methods and instructional strategies shows that some methods for teaching reading and language arts are more effective than others. Effective instruction comes both from teachers’ own rich knowledge of reading and language arts, and from the repertoire of instructional strategies through which they facilitate students’ reading comprehension and skills. These strategies require teachers to know how students acquire reading comprehension and why they might misunderstand certain concepts. Teachers apply this knowledge when they match their instructional approach to the needs of a particular student or group of students. In addition, teachers’ approaches to instruction and their attitudes toward their students (including aspects such as, setting high expectations, creating a positive classroom climate, etc.) and subject are central to student learning in the
NAEP 2018-2019 OMB Clearance: Supporting Statement Part C Page 52
classroom. The literature shows that even the types of assessments that teachers create and administer send clear messages to the student as to what the teacher finds important about a particular topic or subject (ETS, 2013).
Instructional strategies also refer to ways of achievement grouping and differentiation of teaching in the classroom. Research indicates benefits for reading achievement of small-group instruction (Lou et al., 2000; Puzio & Colby, 2010) for both high and low achievers (Catsambis & Buttaro, 2012; Lleras & Rangel, 2009; Slavin, 2010). Positive relationships with achievement were also found for peer tutoring, small-group work, and peer mentoring to promote student learning (Hattie, 2009; Springer, Stanne, & Donovan, 1999). The literature also shows that in general classroom peer effects influence student achievement (Burke & Sass, 2008; Hoxby, C., 2000). Sabatini and O’Reilly (2013) point out that instructional differentiation can depend upon and be aided by the more nuanced information provided by an assessment. Students who score low on a reading test because they have low ability but are motivated are likely to benefit from reading strategy training that focuses on both foundational and comprehension skill development (McNamara, 2007). On the other hand, students who score low because of low motivation might require a different approach to boosting their performance (Guthrie & Davis, 2003). Supporting and measuring effort and motivation can, thereby, potentially improve the design, interpretation, and use of the reading scores from the cognitive assessment.
By applying effective instructional methods, teachers can also foster student engagement with reading, and consequentially their reading achievement. Instruction and curricula can, for instance, engage students by including texts and topics that are highly relevant and interesting for them (Moley, Bandre, & George, 2011). Incorporating technology that teachers readily have access to can also foster student engagement. It is important to note that teachers may not include technology into classroom instruction for many reasons, for example a teacher may (a) have limited access to technology, (b) may not have the necessary professional development.
Technology aside, the literature shows that students tend to display more motivation if topics are goal-driven, age appropriate, and relevant to the issues that concern them (Guthrie & Davis, 2003). Teachers may influence students’ literacy engagement by promoting reading and by supporting individual preferences in reading (Anderson et al., 1988).
Issue 2.3: Use of Assessments
Teachers can use various assessments (e.g., summative and formative assessments) to not only “test” what students learned, but also to help inform lessons and improve future learning. Further, a well-constructed assessment can help teachers monitor student learning and progress, and identify students’ weaknesses and strengths (ETS, 2003). Assessments can include traditional formats such as paper-and-pencil multiple choice/short answer items, as well as more elaborative formats such as essays, presentations, demonstrations, or problem-solving activities (ETS, 2013). Specifically, summative assessments are assessments that capture “learning” or “knowledge” that has already been acquired. On the other hand, formative assessments are designed to help teachers plan instruction more effectively by identifying what a student knows and can do. Research findings indicate that teachers gather better quality evidence of student understanding when they apply effective formative assessments in their classroom (e.g. McGatha, Bush and Rakes, 2009). Formative assessments can not only provide the teacher with important diagnostic feedback to guide instruction but also help students understand and overcome their misconceptions by encouraging the higher-order thinking skills of questioning and reflective thinking (Chin & Teou, 2009).
NAEP 2018-2019 OMB Clearance: Supporting Statement Part C Page 53
Considerations for Potential Development for Issue 2: Promising areas for future item development may be enhancing the measurement of curriculum content and instructional strategies as two important aspects of opportunity to learn. Questions could focus on technology-based reading, different text forms (e.g., formal and informal texts such as comic books, novels, text messages), and incorporation of web resources, assessments, interactive tools, and multimedia into the classroom. Important questions are also how teachers adapt their teaching practices to the rapid technological changes (i.e., do they try to incorporate new technology), how teachers use technological devices to engage students with reading (i.e., as part of the main lesson or as a supplement), and how technology-based reading impacts the curricula at the different grade levels (i.e., are students expected to read printed materials or on an digital device such as a laptop or tablet). Teachers’ use of formative assessments is another possible focus for development.
NAEP 2018-2019 OMB Clearance: Supporting Statement Part C Page 54
ISSUE 3: TEACHER PREPARATION
In addition to the contextual variables described under issue 2, key factors for the success of reading instruction are the qualification of the instructional staff and their levels of preparedness to apply effective teaching methods and teach relevant curricula (Wayne & Youngs, 2003). Teacher preparation comprises two main components: teacher education and training, and professional development. In the 2009 issues paper, a third sub-issue, teacher pedagogical knowledge, was defined. In order to increase consistency across issues and sub-issues and reduce redundancy, this sub-issue is integrated into sub-issue one. The key difference between the two sub-issues for teacher preparation is that the first captures the education and training teachers acquired before teaching in their current position, while the second sub-issue captures ongoing professional development activities. These sub-issues are defined in Table 3.
Table 3 - Teacher Preparation: Sub-issues
Issue 3.1: Education and Training
Education and training refers to both the quality and depth of the instructional staffs’ education, experience, and other teaching qualifications such as relevant content expertise (Darling-Hammond, 2000; Hill, Rowan, & Ball, 2005) and pedagogical knowledge and skills. This includes the proportion of reading teachers who have an undergraduate or graduate degree in a discipline related to reading, literature, or English/language arts, as well as the amount of reading/ELA-specific coursework taken and coursework and/or certificates related to understanding how students learn, effective pedagogy in teaching reading, as well as the amount of teacher experience on the job (Harris & Sass, 2011; Leigh, 2010). Professional development entails participating in seminars, workshops, conferences, and professional trainings that might be in-person or web-based. Such trainings can increase teaching effectiveness and content knowledge (Blank & de las Alas, 2009; Yoon, Duncan, Lee, Scarloss, & Shapley, 2007).
With regard to the 2017 technology-based assessment, collecting relevant contextual data on teacher education and training regarding the use of technology in instruction will be especially important. Recent studies indicate that professional development can help teachers incorporate online reading into their classroom practices (Coiro, 2012; Voogt, Westbroek, Handelzalts, Walraven, McKenny, Pieters, et al., 2011). The amount, quality, and type of education and training that teachers receive—particularly in the field of reading—are potentially related to their effectiveness in the classroom, and, thus, to student achievement. Questions about teacher preparation at the pre-service level might be reflected in such factors as educational emphasis (major and minor), courses taken, course content, and the relative emphasis on instruction in reading versus instruction in non-subject-specific pedagogy. Additional questions might ask what requirements the school or district specifies as necessary in hiring “highly qualified” teachers. Furthermore, once a new teacher’s formal training has been completed, does the school provide a mentor to help him or her adjust to the reality of the classroom? Finally, what does the state’s certification process entail? Teachers exert their impact on students through what they do, not what they know. Therefore, addressing teachers’ reading pedagogy by first describing the methods being practiced in reading classrooms across the nation is a reasonable goal. Further analyses might ultimately provide insight into which teacher (or curriculum) characteristics are associated with the prevalence of which pedagogical approaches, and which teaching strategies appear most effective with which types of students. The first step, however, would be to identify what actually happens in reading classrooms.
In addition to individually considering the role of content, pedagogy, and technology, we should also consider the overlap between these two constructs. Frameworks such as the TPACK model (Technology Pedagogical Content Knowledge) are useful in understanding how
NAEP 2018-2019 OMB Clearance: Supporting Statement Part C Page 55
these three constructs overlap. The TPACK model illustrates how effective teaching with technology requires “an understanding of the representation of concepts using technology, pedagogical techniques that use technologies in constructs ways to teach content, and knowledge of what makes concepts difficult or easy to understand and how technology can help redress some of the problems that students face” (Koehler & Mishra, 2009; TPACK.org)
Issue 3.2: Professional Development
The amount, types, settings, and content of professional development that teachers receive, specifically to teach reading, are important to track in any assessment of teacher preparation. Worth noting might be the relative emphasis that each course places on subject-specific content versus general pedagogical strategies. Further, if the school, district, or state mandates or recommends continued education in reading pedagogy, are teachers meeting these requirements or recommendations? What percentage of a school’s faculty is engaged in reading-focused professional development opportunities at any given time or on a continuing basis? Which opportunities do teachers have to receive professional development, and what are teachers’ experiences with professional development programs? In a related vein, the source of the training afforded to working teachers might also provide insight into the influence that teachers’ professional development experience ultimately exerts on students’ reading achievement. Potential training sources include workshops, courses, or seminars offered by private companies; workshops that precede professional conferences; courses offered or mandated within a school or across a district; and training sponsored by text-publishing firms or teachers’ professional associations. Finally, given the growing role of technology in instruction in general, teachers must be trained in the effective use of computers and emerging technologies. Participation in professional development courses that focus on integrating technology with instruction is one way for teachers to learn how these tools can enhance learning. Some teachers may not use technology because it is not available, and others may avoid it because they lack the knowledge to incorporate it effectively (Common Sense Media, 2013).
In addition to professional development, teachers may also need other support staff, such as specialists and coaches who are highly trained in a particular domain and can support teaching in the classroom. Traditionally, specialists and coaches have been viewed as a resource for students, but recently the role of a coach has changed to one of a mentor for teachers. The literature shows that support staff, in particular coaches, are important for teacher’s professional development (Dole, 2004).
Issue 3.3: Noncogntive Teacher Factors
In addition to teachers’ content and pedagogical knowledge, teacher attitudes (e.g. self-efficacy and curiosity), play an important role for effective teaching and instruction (Jerald, 2007). Studies show that teachers who have high self-efficacy are more likely to be open to new ideas and concepts, try new teaching/instructional methods, and persist when things in the classroom do not well (Berman, McLaughlin, Bass, Pauly, & Zellman, 1977; Guskey, 1988; Stein & Wang, 1988). The literature also shows that teacher self-efficacy can influence student achievement, motivation, and self-efficacy (Anderson, Greene, & Loewen, 1988; Midgley, Feldlaufer, & Eccles, 1989; Moore & Esselman, 1992; Ross 1992). Other noncognitive factors, such as curiosity, growth mindset, and attribution attitudes have also been shown to play an important role in student learning.
Considerations for Potential Development 3: Promising areas for future item development could focus on adding questions addressing teachers’ preparedness to use technology in their reading instruction in purposeful ways. Additionally, we could consider differentiating between professional development programs (e.g., content- versus pedagogical-focused professional development programs), and including questions about noncognitive teacher factors, such as teachers’ confidence to implement various instructional elements (e.g., content,
NAEP 2018-2019 OMB Clearance: Supporting Statement Part C Page 56

pedagogical knowledge), teacher attribution, mindset, and desire for learning. Questions about noncognitive teacher factors should clearly focus on teachers views of learning and instruction to ensure alignment with the NAEP statute to refrain from measuring “personal or family beliefs and attitudes.”
NAEP 2018-2019 OMB Clearance: Supporting Statement Part C Page 57
ISSUE 4: STUDENT FACTORS
As depicted in the schematic model in the introduction of this paper, noncognitive student factors constitute an important set of contextual variables relevant to student achievement. Indicators of student engagement with reading, such as reading-related attitudes, interests, self-efficacy, self-concept, reading confidence, and habits and behaviors, have been shown to be highly associated with reading achievement in many studies (Guthrie & Wigfield, 2000; OECD, 2010), with in some cases even stronger relationships with reading proficiency than other key contextual variables, such as indicators of socio-economic status (OECD, 2002). Further, research suggests that motivations toward reading play a crucial role in how long students read and how much effort they exert (Baker & Wigfield, 1999; Becker, McElvany, & Kortenbruck, 2010; Retelsdorf, Köller, & Möller, 2011; Taboada, Tonks, & Wigfield, & Guthrie, 2009). Students who read for personal interest have been shown to exhibit higher levels of reading achievement, compared to those who do not read for pleasure, because reading achievement is related to a positive attitude toward reading. Activities signaling engagement with reading include reading books or articles for enjoyment; discussing books or readings with friends and family; or doing other reading-related activities beyond strictly school-related tasks. Reading engagement variables constitute important predictors, moderators, and mediators of reading achievement. Moreover, knowing the level of interest and motivation students exert during test taking can bring about improvements to instructional methods, test design, and test interpretation that more accurately gauge and enhance student’s reading proficiency (Sabatini & O’Reilly, 2013). Relevant sub-issues are defined in Table 4.
Table 4 - Student Factors: Sub-issues
Issue 4.1.: Reading Activities outside of school
Students’ learning opportunities and behaviors outside of school or regular lessons have gained increased interest with policymakers, educators, and researchers. One basis for the increased interest is that students spend only about 20% of their time in school; therefore, how they spend the remaining 80% of their time can have profound effects on their academic achievement (Miller, 2003). Time spent reading is a strong factor in the relationship between out-of-school reading and in-school achievement (Anderson, Wilson, & Fielding, 1988). According to the Kaiser Family Foundation, 8- to 18-year-olds on average spend about 7.5 hours every day using technology (e.g., smart phones, computer, or other electronic devices) (Rideout, Foehr, and Roberts, 2010). These technologies may provide new forms of learning that do not necessarily take place in the regular, “traditional” classroom but provide new opportunities for learning outside of school. Blasé (2000) asserted that reliance on e-mail communication has changed the ways that students read and write. With the increased availability and use of technology-based reading devices, and the creation of new text forms (e.g., chat, tweets, multimedia text, etc.), new opportunities for students to read and to practice and develop their reading skills have emerged and continue to emerge. Used appropriately, computers and the Internet allow students to work more independently on higher-order thinking skills and provide an opportunity for students to access a wealth of reading materials. Technology broadens the learning community and enables students to communicate and collaborate with each other about reading (Common Sense Media, 2013). Research indicates that proficient readers tend to read more recreationally than poor readers (Leppänen, Aunola, & Nurmi, 2005; Mol & Bus, 2011). Reading for enjoyment, in turn helps enhance students’ vocabulary, spelling, grammar, and overall reading skills (Lewis & Samuels, 2003; Mol & Bus, 2011). When children and adolescents read outside of school, the purpose of reading can considerably differ depending on the type or medium of the reading material. The type of material (e.g., continuous text, noncontinuous text, mixed texts, or multimedia resources) students read out of school is, therefore, an important factor to be captured in the Reading survey questionnaire. While the purpose for reading determines the
NAEP 2018-2019 OMB Clearance: Supporting Statement Part C Page 58
level of processing, effort, and attention readers need to regulate (McCrudden et al., 2010, 2011; Sheehan & O’Reilly, 2012), the level of comprehension demanded by the reader also varies greatly depending upon the goals of reading (Carver, 1997; van den Broek et al., 2001; van den Broek, Risden, & Husebye-Hartman, 1995).
Under this sub-issue, capturing information on when, where, how much, and what types of text students read outside of school will be relevant in future NAEP Reading survey questionnaires.
Issue 4.2.: Interest and Motivation
Student interest and motivation to read is essential to success in reading (Anmarkrud & Bråten, 2009; Logan, Medford, & Hughes, 2011). Based on Deci & Ryan’s (1985) initial work, researchers typically distinguish intrinsic motivation from extrinsic motivation or instrumental motivation. Learners with high levels of intrinsic motivation like to read because they find it to be interesting and enjoyable whereas extrinsically motivated learners are more strongly driven by rewards and other incentives (Deci & Ryan, 1985). Research evidence from many studies shows that intrinsic motivation relates more strongly to reading achievement than extrinsic motivation (Becker, McElvany, & Kortenbruck, 2010; Schiefele, Schaffner, Möller, & Wigfield, 2012; Vansteenkiste, Timmermans, Lens, Soenens, & Van den Broeck, 2008). Motivation is affected by a number of factors including the reader’s interest in the topic, texts and tasks on an assessment, as well the value and stakes they ascribe to the assessment and its potential impact on their lives. Further, teacher instruction can indirectly impact achievement through the mediating effect of student engagement and motivation (Martin, Foy, Mullis, & O’Dwyer, 2013). Another important reason for the inclusion of motivation-related items in the survey questionnaires is that student scores might not (only) reflect true reading achievement but, to some extent, motivation or interest, and therefore underestimate students’ true abilities (Braun, Kirsch, & Yamamoto, 2011). If students are not giving their best effort, then one cannot be confident of the claim that a poor score reflects the lack of specific reading skills. Low scores on a reading comprehension test may be interpreted as reflecting low reading skill, or they may simply mean the test taker was not interested and did not try his/her best (Braun et al., 2011). Explicit assessment of motivation as a performance moderator could thereby help enhance the validity of the assessment.
Issue 4.3.: Self-related beliefs
Research has shown the importance of noncognitive constructs for predicting school, college, and workforce success (Poropat, 2009; Richardson, Abraham, & Bond, 2012; Robbins et al., 2004), with self-efficacy consistently found to be one of the most important predictors (Multon, Brown, & Lent, 1991; Richardson et al., 2012; Wright, Jenkins-Guarnieri, & Murdock, 2012). Self-efficacy has been generally defined as an individual’s evaluation of his or her own ability to perform a task and about what they believe they are capable of accomplishing (Bandura, 1986). Students’ reading-specific, self-related beliefs comprise their self-concept, self-efficacy, and confidence specific to reading tasks. These self-perceptions determine how individuals use the knowledge and skills that they have to achieve a certain task (Pajares & Schunk, 2001). It has been reported that self-efficacy beliefs are correlated with other self-beliefs, such as self-concept and other motivational constructs (Zimmerman, 2000). Evidence has also suggested that self-efficacy and self-concept beliefs are each related to and influential on academic achievement (Pajares, 1996). Pintrich and De Groot (1990) have suggested that self-efficacy has a special role in terms of cognitive engagement, that is, it may increase self-efficacy beliefs that in turn could lead to more frequent and increased use of cognitive strategies, leading to higher achievement (Pajares & Schunk, 2001). Students with high self-efficacy engage in effective self-regulating strategies more often than those with lower level beliefs; high self-efficacy also seems to enhance performance as these beliefs also tend to enhance persistence (Pajares, 1996; Bouffard-Bouchard, Parent, & Larivee, 1991; Berry, 1987). Measures of self-efficacy and self-concept should be designed to assess self-related beliefs relative to students’ peers or experiences separately for specific subject- or content-areas to account for the multi-dimensional nature of the construct
NAEP 2018-2019 OMB Clearance: Supporting Statement Part C Page 59
(Marsh & Craven, 2006); that is, students reading self-concept and self-efficacy are distinct from their mathematics or science self-concept or self-efficacy perceptions. Research suggests that students with strong positive self-related beliefs regarding their reading capabilities tend to read more than their peers and have better reading comprehension (De Naeghel, Van Keer, Vansteenkiste, & Rosseel, 2012). Zimmerman, Bandura, and Martinez-Pons (1992) demonstrated that academic self-efficacy mediated the influence of self-efficacy for self-regulated learning on academic achievement. Multon, Brown, and Lent (1991) conducted a meta-analysis that indicated self-efficacy was related to academic outcomes, with these effects becoming stronger as students progressed from elementary school to high school to college (Pajares & Schunk, 2001). The effects were stronger for classroom-based indices (i.e., grades) and basic skill measures when compared to standardized tests, demonstrating that self-efficacy beliefs are often subject- and context-specific (Pajares & Schunk, 2001). More recent meta-analytical results support these findings (Richardson et al., 2012)
Issue 4.4.: Metacognition and reading strategies
Twenty-first Century literacy skills require readers to synthesize, evaluate, and integrate diverse sources (Britt & Rouet, 2012; Graesser et al., 2007; Lawless et al., 2012; Metzger, 2007; Partnership for 21st Century Skills, 2008). This diversity not only includes the variety of text types used in the assessment, but also the range of different perspectives students need to understand, manage, and integrate with increased difficulty of reading as text complexity and number of sources increase (McNamara, Graesser, & Louwerse, 2012). This renders the strategies with which students approach reading tasks a crucial factor for their success (Eilers & Pinkley, 2006; Hacker et al., 2009). Especially dynamic multimedia texts place additional demands on readers as they need to update their old understanding with new evidence, or re-interpret text sources with a new perspective. Websites, for instance, might vary in terms of currency, quality, and perspective and the most current and evidence-based sources must be identified, reconciled and synthesized (Coiro, 2009; Lawless et al., 2012; Metzger, 2007). This management of cognition and understanding is often collectively referred to as self-regulation and metacognition in the research literature (Hacker et al., 2009; McKeown & Beck, 2009; Pressley, 2002; Schraw, 1998). A variety of specific reading strategies aimed at helping readers to simplify, organize, restructure, remember, and embellish text can be distinguished, including visualization/imagery (Oakhill & Patel, 1991), paraphrasing (Fisk & Hurst, 2003), elaborating (Menke & Pressley, 1994), predicting (Afflerbach, 1990), self-explanation (McNamara, 2004), note-taking (Faber, Morris, & Lieberman, 2000), summarization (Franzke, Kintsch, Caccamise, Johnson, & Dooley, 2005), previewing (Spires, Gallini, & Riggsbee, 1992), and the use of graphic organizers and text structure (Goldman & Rakestraw, 2000; Meyer & Wijekumar, 2007). Studies have shown that highly proficient readers tend to have strong self-regulation and metacognitive abilities (Hacker, Dunlosky, & Graesser, 2009; McNamara, 2007; Pressley, 2002). A skilled reader is a resilient reader who can tolerate error, respond to feedback, recover from mistakes, and use alternate resources and representations to achieve coherence (Linderholm, Virtue, Tzeng, & van den Broek, 2004).
Issue 4.5: Grit One key finding from the research literature reviewed in the previous section is that academic perseverance is one of the strongest predictors of achievement. This issue focuses on perseverance with other, related factors that are comprised under the factor “Grit.” Grit is defined as perseverance and passion for long-term goals (Duckworth, Peterson, Matthews, and Kelly, 2007). Grit is related to conscientiousness, defined as the degree to which a person is hard working, dependable, and detail oriented (Berry et al., 2007), but focuses on its facets perseverance, industriousness, self-control, and procrastination (negatively), which are among the facets that are strongest related to achievement (Barrick, Stewart and Piotrowski, 2002). Students’ persistence even on difficult tasks (perseverance, e.g., not to put off difficult problems, not to give up easily), general work ethics (industriousness, e.g.,
NAEP 2018-2019 OMB Clearance: Supporting Statement Part C Page 60
prepare for class, work consistently throughout the school year), and low level of procrastination are not only among the strongest non-cognitive predictors of GPA (Richardson et al., 2012), but are also important predictors of success in higher education and the workforce in general (Heckman, Stixrud & Urzua, 2006; Lindqvist & Vestman, 2011; Poropat, 2009; Roberts et al., 2007).
Issue 4.6: Desire for Learning
Desire for Learning is proposed as another noncognitive student factor that adds to Grit in that need for cognition assesses whether individuals see learning as an opportunity and approach learning situations at school and outside of school with an academic mindset that helps them apply effort, persevere, and refrain from procrastination attempts. The research suggests that “an isolated focus on academic perseverance as a thing unto itself may well distract reformers from attending to student mindsets and the development of learning strategies that appear to be crucial to supporting students’ academic perseverance”(Farrington et al., 2012, p. 27). Including “Desire for Learning” as an additional sub-issue will provide policy relevant data on students’ mindset in terms of their need for cognition, curiosity, and intrinsic motivation to learn and grow further.
Several studies show that desire for learning/need for cognition is related to achievement in school (Bertrams and Dickhäuser, 2009; Preckel, Holling, and Vock, 2006) and one of the stronger predictors of GPA based on meta-analytical data (Richardson et al., 2012).
Considerations for Potential Development for issue 4: Item development in 2017 will primarily focus on Issue 4 given that few items capture these sub-issues. Capturing the different aspects of student factors (i.e., sub-issues 4.1 – 4.4) is important given that they represent important predictors of achievement. Issue 4.4 could be considered for future item development; currently effective measurement of reading strategies and metacognition can only partly be accomplished with self-report questionnaire measures. Future development could also focus on discerning whether interactive assessment strategies (e.g., SBTs) could be used to measure this sub-issue. Additionally, an important question to address is how other student factors represented in the 2017 Core questionnaire can be contextualized for reading (e.g., Grit, Desire for Learning); this would allow us to distinguish whether items are domain general or domain specific.
NAEP 2018-2019 OMB Clearance: Supporting Statement Part C Page 61
REFERENCES
Abedi J., M. Courtney, S. Leon, J. Kao and T. Azzam (2006), English Language Learners and Math Achievement: A Study of Opportunity to Learn and Language Accommodation (CSE Report 702, 2006), University of California, Center for the Study of Evaluation/National Center for Research on Evaluation, Standards, and Student Testing, Los Angeles, California.
Afflerbach, P. (1990). The influence of prior knowledge and text genre on readers' prediction strategies. Journal of Reading Behavior, 22, 131-48.
Allington, R.L., Mcgill-Franzen, A., Camilli, G., Williams, L., Graff, J., Zeig, J., Zmach, C., & Nowak, R. (2010). Addressing summer reading setback among economically disadvantaged elementary students. Reading Psychology, 31(5), 411–427.
Ancess, J. (2000). The reciprocal influence of teacher learning, teacher practice, school restructuring, and student learning outcomes. Teachers College Record, 102(3), 590-619.
Anderson, R., Greene, M., & Loewen, P. (1988). Relationships among teachers’ and students’ thinking skills, sense of efficacy, and student achievement. Alberta Journal of Educational Research, 34(2), 148–165.
Anderson, R., Wilson, P., & Fielding, L. (1988). Growth in reading and how children spend their time outside school. Reading Research Quarterly, 23, 285-303.
Anmarkrud, Ø. & Bråten, I. (2009). Motivation for reading comprehension. Learning and Individual Differences, 19(2), 252–256.
Baker, L. (2003). The role of parents in motivating struggling readers. Reading & Writing Quarterly, 19(1), 87–106.
Baker, L., & Wigfield, A. (1999). Dimensions of children’s motivation for reading and their relations to reading activity and reading achievement. Reading Research Quarterly, 34, 452-477.
Bandura, A. (1986). Social foundations of thought and action: A social cognitive theory. Englewood Cliffs, NJ: Prentice Hall.
Barrick, M.R., Stewart, G. L. & Piotrowski, M. (2002). Personality and job performance: Test of the mediating effects of motivation among sales representatives. Journal of Applied Psychology, 87, 43–51.
Becker, M., McElvany, N., & Kortenbruck, M. (2010). Intrinsic and extrinsic reading motivation as predictors of reading literacy: A longitudinal study. Journal of Educational Psychology, 102(4), 773–785.
Becker, M., McElvany, N., & Kortenbruck, M. (2010). Intrinsic and extrinsic reading motivation as predictors of reading literacy: A longitudinal study. Journal of Educational Psychology, 102(4), 773.
Berman, P., McLaughlin, M., Bass, G., Pauly, E., & Zellman, G. (1977). Federal programs supporting educational change. Vol. VII: Factors affecting implementation and continuation (Report No. R-
NAEP 2018-2019 OMB Clearance: Supporting Statement Part C Page 62
1589/7-HEW). Santa Monica, CA: The Rand Corporation (ERIC Document Reproduction Service No.140 432).
Berry, J. M. (1987, September). A self-efficacy model of memory performance. Paper presented at the meeting of the American Psychological Association, New York, New York.
Berry, C. M., Ones, D. C. & P.R. Sackett, P. R. (2007). Interpersonal deviance, organizational deviance, and their common correlates: A review and meta–analysis. Journal of Applied Psychology, 92, 410-424.
Bertrams, A. & Dickhäuser, O. (2009). High–school students’ need for cognition, self–control capacity, and school achievement: Testing a mediation hypothesis. Learning and Individual Differences, 19, 135-138.
Blank, R.K. & de las Alas, N. (2009). Effects of teacher professional development on gains in student achievement. How meta analysis provides scientific evidence useful to education leaders. Washington, DC: Council of Chief State School Officers.
Blasé, D. W. (2000). A new sort of writing: E-Mail in the English classroom. English Journal, 90, 47-51.
Bouffard-Bouchard, T., Parent, S., & Larivee, S. (1991). Influence of self-efficacy on self-regulation and performance among junior and senior high-school aged students. International Journal of Behavioral Development, 14, 153-164.
Bowers, A.J., Berland, M. (2013) Does recreational computer use affect high school achievement? Educational Technology Research & Development, 61(1), 51-69. doi:10.1007/s11423-012-9274-1
Braun, H., Kirsch, I., & Yamamoto, K. (2011). An empirical study to examine whether monetary incentives improve 12th grade NAEP reading performance. Teachers College Record, 113, 2309-2344.
Britt, M. & Rouet, J. (2012). Learning with multiple documents: Component skills and their acquisition. In M. Lawson & J. Kirby (Eds.), The quality of learning. Oxford: Cambridge University Press.
Buijs, M., & Admiraal, W. (2013). Homework assignments to enhance student engagement in secondary education. European Journal of Psychology of Education, 28, 767-799.
Burke, M.A., & Sass, T.R. (2008). Classroom peer effects and student achievement. Working Paper, 18, 1-54. Retrieved from http://www.caldercenter.org/UploadedPDF/1001190_peer_effects.pdf.
Carroll, J. (1963). A model of school learning. The Teachers College Record, 64(8), 723-723.
Carver, R. P. (1997). Reading for one second, one minute, or one year from the perspective of rauding theory. Scientific Studies of Reading, 1, 3-43.
Catsambis, S. & Buttaro, A. (2012). Revisiting “Kindergarten as academic boot camp: A nationwide study of ability grouping and psycho-social development.” Social Psychology of Education, 15(4), 483–515.
NAEP 2018-2019 OMB Clearance: Supporting Statement Part C Page 63

Chiong, C. & Shuler, C. (2010). Learning: Is there an app for that? Investigations of young children’s usage and learning with mobile devices and apps. New York: The Joan Ganz Cooney Center at Sesame Workshop.
Clark, C. (2010). Linking school libraries and literacy: Young people’s reading habits and attitudes to their school library, and an exploration of the relationship between school library use and school attainment. London: National Literacy Trust.
Coiro, J. (2009). Rethinking reading assessment in a digital age: How is reading comprehension different and where do we turn now? Educational Leadership, 66, 59-63.
Coiro, J. (2012). The new literacies of online reading comprehension: Future directions. The Educational Forum, 76(4), 412–417.
Common Sense Media, (2013). Teaching with Technology: The Promise and Reality of the U.S. Digital Classroom. White paper retrieved from cdn2.ec.graphite.org/sites/default/files/teachingwithtechnology_thepromiseandrealityoftheusdigitalclassroom.pdf
Darling, S. & Westberg, L. (2004). Parent involvement in children’s acquisition of reading. The Reading Teacher, 57(8), 774–776.
Darling-Hammond, L. (2000). How teacher education matters. Journal of Teacher Education, 51(3), 166–173.
De Naeghel, J., Van Keer, H., Vansteenkiste, M., & Rosseel, Y. (2012). The relation between elementary students’ recreational and academic reading motivation, reading frequency, engagement, and comprehension: A self-determination theory perspective. Journal of Educational Psychology, 104(4), 1006–1021.
Deci, E.L. & Ryan, R.M. (1985). Intrinsic motivation and self-determination in human behavior. New York: Plenum Press.
Diener, E. & Tov, W. (2006). National accounts of well-being. In K. C. Land, A. C. Michalos, & M. J. Sirgy (Eds.), Handbook of social indicators and quality of life research (pp. 137-156). New York, NY: Springer. Duckworth, A.L., Peterson, C., Matthews, M.D., & Kelly, D.R. (2007). Grit: Perseverance and passion for long–term goals. Journal of Personality and Social Psychology, 92, 1087-1101.
Dillon, S. (2006, May 25). Test shows drop in science achievement for 12th graders. New York Times, p. A18.
Dole, J.A. (2004). The changing role of the reading specialist in school reform. International Reading Association, 462-471.
Ehrenberg, R.G., Brewer, D.J., Gamoran, A., & WIllms, J.D. (2001). Class size and student achievement. Psychological Science in the Public Interest, 2(1), 1-30.
Eilers, L. H., & Pinkley, C. (2006). Metacognitive strategies help students to comprehend all text. Reading Improvement, 43, 13-29.
NAEP 2018-2019 OMB Clearance: Supporting Statement Part C Page 64
Educational Testing Service (2003). Linking classroom assessment with student learning. Retrieved from https://www.ets.org/Media/Tests/TOEFL_Institutional_Testing_Program/ELLM2002.pdf
Faber, J. E., Morris, J. D., & Lieberman, M. G. (2000). The effect of note taking on ninth grade students' comprehension. Reading Psychology, 21, 257-70.
Farrington, C.A., Roderick, M., Allensworth, E., Nagaoka, J., Keyes, T.S., Johnson, D.W., & Beechum, N.O. (2012). Teaching adolescents to become learners. The role of noncognitive factors in shaping school performance: A critical literature review. Chicago: University of Chicago Consortium on Chicago School Research.
Fisk, C. & Hurst, C. B. (2003). Paraphrasing for comprehension. Reading Teacher, 57, 182-185.
Franzke, M., Kintsch, E., Caccamise, D., Johnson, N., & Dooley. S. (2005). Summary Street ® : Computer support for comprehension and writing. Journal of Educational Computing Research, 33, 53-80.
Funkhouser, E. (2009). The effect of kindergarten classroom size reduction on second grade student achievement: Evidence from California. Economics of Education Review, 28(3), 403-414.
Goldman, S. & Rakestraw, J. Jr. (2000). Structural aspects of constructing meaning from text. In M. Kamil, P. Mosenthal, P. Pearson, & R. Barr (Eds.), Handbook of reading research (Vol. 3, pp. 311–336). Mahwah, NJ: Lawrence Erlbaum Associates.
Graesser, A. C., Wiley, J., Goldman, S., O’Reilly, T., Jeon, M., & McDaniel, B. (2007). SEEK web tutor: fostering a critical stance while exploring the causes of volcanic eruption. Metacognition and Learning, 2, 89-105.
Greenwald, R., Hedges, L.V., & Laine, R.D. (1996). The effect of school resources on student achievement. Review of Educational Research, 66(3), 361–396.
Guskey, T. R. (1988). Teacher efficacy, self-concept, and attitudes toward the implementation of instructional motivation. Teaching and Teacher Education, 4, 63-69.
Guthrie, J., & Davis, M. (2003). Motivating struggling readers in middle school through an engagement model of classroom performance. Reading and Writing Quarterly, 19, 59-85.
Guthrie, J.T., & Wigfield, A. (2000). Engagement and motivation in reading. In M.L. Kamil, P.B. Mosenthal, P.D. Pearson, & R. Barr (Eds.), Handbook of reading research (Vol. III, pp. 403-422). Mahwah, NJ: Erlbaum.
Gutnick, A.L., Robb, M., Takeuchi, L., & Kotler, J. (2011). Always connected: The new digital media habits of young children. New York: The Joan Ganz Cooney Center at Sesame Workshop.
Hacker, D. J, Dunlosky, J., & Graesser, A. C. (2009). Handbook of metacognition in education. Mahwah, NJ: Erlbaum.
Harris, D.N. & Sass, T.R. (2011). Teacher training, teacher quality and student achievement. Journal of Public Economics, 95(7–8), 798–812.
Hattie, J. (2009). Visible learning: A synthesis of over 800 meta-analyses relating to achievement. New York: Routledge.
NAEP 2018-2019 OMB Clearance: Supporting Statement Part C Page 65

Heckman J. J., Stixrud, J., & Urzua, S. (2006). The Effects of Cognitive and Noncognitive Abilities on Labor Market Outcomes and Social Behavior. Journal of Labor Economics 24, 411-482.
Hill, H.C., B. Rowan and D.L. Ball (2005), “Effects of Teachers’ Mathematical Knowledge for Teaching on Student Achievement”, American Educational Research Journal, Vol. 42, pp. 371-406.
Hoxby, C. (2000). Peer effects in the classroom: Learning from gender and race variation. NBER Working Paper, No. 7867. Retrieved from http://www.nber.org/papers/w7867.pdf.
Hsu, H.-Y., Wang, S.-K., & Runco, L. (2013). Middle school science teachers’ confidence and pedagogical practice of new literacies. Journal of Science Education and Technology, 22(3), 314–324.
Jenkins, H. (2006). Fans, bloggers, and gamers: Exploring participatory culture.NYU Press.
Jerald, C. D. (2007). Believing and achieving (Issue Brief). Washington, DC: Center for Comprehensive School Reform and Improvement. Retrieved from http://www.centerforcsri.org/files/CenterIssueBriefJan07.pdf.
Katz, S., &. Lautenschlager, G. (2001). The contribution of passage and no-passage factors to item performance on the SAT reading task. Educational Assessment, 7, 165–176.
Kim, J.S. & Quinn, D.M. (2013). The effects of summer reading on low-income children’s literacy achievement from Kindergarten to Grade 8: A meta-analysis of classroom and home interventions. Review of Educational Research, 83(3), 386–431.
Klauda, S.L. & Wigfield, A. (2012). Relations of perceived parent and friend support for recreational reading with children’s reading motivations. Journal of Literacy Research, 44(1), 3–44.
Klieme, E., C. Pauli and K. Reusser (2009), “The Pythagoras Study: Investigating Effects of Teaching and Learning in Swiss and German Classrooms”, in T. Janik and T. Seidel (eds.), The Power of Video Studies in Investigating Teaching and Learning in the Classroom, Waxmann Verlag, Münster, pp. 137-160.
Koehler, M. J., & Mishra, P. (2009). What is technological pedagogical content knowledge? Contemporary Issues in Technology and Teacher Education, 9(1), 60-70.
Kyllonen, P. C., & Bertling, J. P. (2013). Innovative Questionnaire Assessment Methods to Increase Cross-Country Comparability. Handbook of International Large-Scale Assessment: Background, Technical Issues, and Methods of Data Analysis, 277.
Lawless, K. A., Goldman, S. R., Gomez, K., Manning, F., & Braasch, J. (2012). Assessing multiple source comprehension through evidence-centered design. In J. Sabatini, T., O’Reilly, & E. Albro (Eds.), Reaching an understanding: Innovations in how we view reading assessment (pp. 3-17). Lanham, MD: Rowman & Littlefield Education.
Lee, J.-W. & Barro, R.J. (2001). Schooling quality in a cross-section of countries. Economica, New Series, 68(272), 465–488.
Lee, S. M., Brescia, W., & Kissinger, D. (2009). Computer use and academic development in secondary schools. Computers in the Schools, 26(3), 224-235.
NAEP 2018-2019 OMB Clearance: Supporting Statement Part C Page 66
Lee, V.E. & Zuze, T.L. (2011). School resources and academic performance in Sub-Saharan Africa. Comparative Education Review, 55(3), 369–397.
Leigh, A. (2010). Estimating teacher effectiveness from two-year changes in students’ test scores. Economics of Education Review, 29(3), 480-488.
Leppänen, U., Aunola, K., & Nurmi, J. E. (2005). Beginning readers' reading performance and reading habits. Journal of Research in Reading, 28(4), 383-399.
Leu, D. J., O’Byrne, W. I., Zawilinski, L., McVerry, J. G., & Everett-Cacopardo, H. (2009). Comments on Greenhow, Robelia, and Hughes: Expanding the new literacies conversation. Educational Researcher, 38(4), 264-269.
Lewis, M., & Samuels, S. J. (2002). Read More-Read Better?: A Meta-analysis of the Literature on the Relationship Between Exposure to Reading and Reading Achievement (Doctoral dissertation, University of Minnesota).
Lieberman, D. A., Bates, C. H., & So, J. (2009). Young children's learning with digital media. Computers in the Schools, 26(4), 271-283.
Linderholm, T., Virtue, S., Tzeng, Y., & van den Broek, P. (2004). Fluctuations in the availability of information during reading: Capturing cognitive processes using the landscape model. Discourse Processes, 37(2), 165-186.
Lindqvist, E., & R. Vestman (2011). The labor market returns to cognitive and noncognitive ability: Evidence from the Swedish enlistment. American Economical Journal: Applied Economics, 3, 101-128.
Lipowsky, F., Rakoczy, K., Pauli, C., Drollinger-Vetter, B., Klieme, E., & Reusser, K. (2009). Quality of geometry instruction and its short-term impact on students' understanding of the Pythagorean Theorem. Learning and Instruction, 19(6), 527-537.
Lleras, C., & Rangel, C. (2009). Ability grouping practices in elementary school and African American/Hispanic achievement. American Journal of Education, 115(2), 279-304.
Logan, S., Medford, E., & Hughes, N. (2011). The importance of intrinsic motivation for high and low ability readers' reading comprehension performance. Learning and Individual Differences, 21(1), 124-128.
Lou, Y., Abrami, P. C., & Spence, J. C. (2000). Effects of within-class grouping on student achievement: An exploratory model. The Journal of Educational Research, 94(2), 101-112.
Marsh, H. W., & Craven, R. G. (2006). Reciprocal effects of self-concept and performance from a multidimensional perspective: Beyond seductive pleasure and unidimensional perspectives. Perspectives on Psychological Science, 1(2), 133-163.
Martin, M.O., Foy, P., Mullis, I.V.S., & O’Dwyer, L.M. (2013). Effective schools in reading, mathematics, and science at the fourth grade. In M.O. Martin & I.V.S. Mullis (Eds.), TIMSS and PIRLS 2011: Relationships among reading, mathematics, and science achievement at the fourth grade—Implications for early learning. Chestnut Hill, MA: TIMSS & PIRLS International Study Center, Boston College.
NAEP 2018-2019 OMB Clearance: Supporting Statement Part C Page 67
McCrudden, M. T., Magliano, J. P., & Schraw, G. (2011). Relevence in text comprehension (pp. 1-18). In M. T., McCrudden, J. P., Magliano, &, G. Schraw (Eds), Text relevance and learning from text. Greenwich, CT: Information Age Publishing.
McCrudden, M. T., Magliano, J. P., & Schraw, G. (2010). Exploring how relevance instructions affect personal reading intentions, reading goals and text processing: A mixed methods study. Contemporary Educational Psychology, 35(4), 229-241.
McKeown, M. G., & Beck, I. L. (2009). The role of metacognition in understanding and supporting reading comprehension. In D. J. Hacker, J. Dunlosky, & A. C. Graesser, (Eds.), Handbook of metacognition in education (pp. 7-25). Mahwah, NJ: Erlbaum.
McNamara, D. S. (2004). SERT: Self-explanation reading training. Discourse Processes, 38(1), 1-30.
McNamara, D. S. (Ed.). (2007). Reading comprehension strategies: Theories, interventions and technologies. Psychology Press.
McNamara, D. S., & Magliano, J. P. (2009b). Towards a comprehensive model of comprehension. In B. Ross (Ed.), The psychology of learning and motivation (Vol. 51, pp. 297-384). New York, NY: Elsevier Science.
McNamara, D. S., Graesser, A. C., & Louwerse, M. M. (2012). Sources of text difficulty: Across genres and grades. Measuring up: Advances in how we assess reading ability, 89-116.
Menke, D. J., & Pressley, M. (1994). Elaborative interrogation: Using" why" questions to enhance the learning from text. Journal of Reading, 37(8), 642-645.
Metzger, M. J. (2007). Making sense of credibility on the Web: Models for evaluating online information and recommendations for future research. Journal of the American Society for Information Science and Technology, 58(13), 2078-2091.
Meyer, B. J., & Wijekumar, K. (2007). A web-based tutoring system for the structure strategy: Theoretical background, design, and findings. Reading comprehension strategies: Theories, interventions, and technologies, 347-375.
Midgley, C., Feldlaufer, H., & Eccles, J. (1989). Change in teacher efficacy and student self- and task-related beliefs in mathematics during the transition to junior high school. Journal of Educational Psychology, 81, 247–258.
Miller, B. M. (2003). Afterschool programs and educational success: Critical hours executive summary. Retrieved January 17, 2008 from: http://www.nmefdn.org/uploads/Critical_Hours_Full.pdf .
Mol, S. E., & Bus, A. G. (2011). To read or not to read: a meta-analysis of print exposure from infancy to early adulthood. Psychological bulletin, 137(2), 267.
Moley, P. F., Bandré, P. E., & George, J. E. (2011). Moving Beyond Readability: Considering Choice, Motivation and Learner Engagement. Theory Into Practice, 50(3), 247-253.
Moore, W., & Esselman, M. (1992). Teacher efficacy, power, school climate and achievement: A desegregating district’s experience. Paper presented at the annual meeting of the American Educational Research Association, San Francisco.
NAEP 2018-2019 OMB Clearance: Supporting Statement Part C Page 68

Multon, K. D., Brown, S. D., & Lent, R. W. (1991). Relation of self-efficacy beliefs to academic outcomes: A meta-analytic investigation. Journal of counseling psychology, 38(1), 30.
National Assessment Governing Board (2013). Reading Framework for the 2013 National Assessment of Educational Progress. Washington, DC: U.S. Government Printing Office.
Nye, B., Konstantopoulos, S., & Hedges, L.V. (2004). How large are teacher effects? Educational Evaluation and Policy Analysis, 26, 237-257.
Oakhill, J., & Patel, S. (1991). Can imagery training help children who have comprehension problems?. Journal of Research in reading, 14(2), 106-115.
Organisation for Economic Cooperation and Development. (2002). Reading for change: Performance and engagement across countries. Paris: Author.
Organisation for Economic Cooperation and Development. (2010). Improving health and social cohesion through education. Paris: Author.
Pajares, F. (1996). Self-efficacy beliefs in academic settings. Review of educational research, 66(4), 543-578.
Pajares, F., & Schunk, D. H. (2001). Self-beliefs and school success: Self-efficacy, self-concept, and school achievement. Perception, 239-266.
Partnership for 21st Century Skills. (2004). Learning for the 21st century: A report and mile guide for 21st century skills. Washington, DC: Author. Retrieved from http://www.p21.org/storage/documents/P21_Report.pdf
Pintrich, P. R., & De Groot, E. V. (1990). Motivational and self-regulated learning components of classroom academic performance. Journal of educational psychology, 82(1), 33.
Poropat, A. E. (2009). A meta-analysis of the five-factor model of personality and academic performance. Psychological Bulletin, 135(2), 322.
Preckel, F., Holling, H., & Vock, M. (2006). Academic underachievement: Relationship with cognitive motivation, achievement motivation, and conscientiousness. Psychology in the Schools, 43, 401-411.
Pressley, M. (2002). Metacognition and self-regulated comprehension. What research has to say about reading instruction, 3, 291-309 Newark, DE: International Reading Association.
Puzio, K., & Colby, G. (2010). The effects of within class grouping on reading achievement: A meta-analytic synthesis. Educational Researcher, 33(1), 29-34.
Retelsdorf, J., Köller, O., & Möller, J. (2011). On the effects of motivation on reading performance growth in secondary school. Learning and Instruction, 21(4), 550-559.
Richardson, M., Abraham, C., & Bond, R. (2012). Psychological correlates of university students' academic performance: a systematic review and meta-analysis. Psychological bulletin, 138(2), 353.
NAEP 2018-2019 OMB Clearance: Supporting Statement Part C Page 69
Rideout, V. J., Foehr, U. G., & Roberts, D. F. (2010). Generation M [superscript 2]: Media in the Lives of 8-to 18-Year-Olds. Henry J. Kaiser Family Foundation.
Robbins, S. B., Lauver, K., Le, H., Davis, D., Langley, R., & Carlstrom, A. (2004). Do psychosocial and study skill factors predict college outcomes? A meta-analysis. Psychological bulletin, 130(2), 261.
Roberts, B. W., Kuncel, N. R., Shiner, R., Caspi, A. & Goldberg, L. R. (2007). The power of personality: The comparative validity of personality traits, socioeconomic status, and cognitive ability for predicting important life outcomes. Perspectives on Psychological Science, 2,313–345.
Rouet, J. F. (2006). The skills of document use: From text comprehension to Web-based learning. Mahwah, NJ: Erlbaum.
Rouet, J. F., & Britt, M. A. (2011). Relevance processes in multiple document comprehension. Text relevance and learning from text, 19-52.
Ross, J. A. (1992). Teacher efficacy and the effect of coaching on student achievement. Canadian Journal of Education, 17(1), 51–65.
Sabatini, J., & O’Reilly, T. (2013). Rationale for a new generation of reading comprehension assessments. In B. Miller, L. Cutting, & P. McCardle (Eds.), Unraveling the behavioral, neurobiological, and genetic components of reading comprehension, (pp.100-111). Baltimore, MD: Brookes Publishing, Inc.
Schiefele, U., Schaffner, E., Möller, J., & Wigfield, A. (2012). Dimensions of reading motivation and their relation to reading behavior and competence. Reading Research Quarterly, 47(4), 427-463.
Schraw, G. (1998). Promoting general metacognitive awareness. Instructional science, 26(1-2), 113-125.
Sénéchal, M., & Young, L. (2008). The effect of family literacy interventions on children’s acquisition of reading from kindergarten to grade 3: A meta-analytic review. Review of Educational Research, 78(4), 880-907.
Sheehan, K. M., & O’Reilly, T. (2012). The case for scenario-based assessments of reading competency. Reaching an Understanding: Innovations in How We View Reading Assessment, 19. Lanham, MD: Rowman & Littlefield Education.
Slavin, R. (2010). Co-operative learning: what makes group-work work. In The Nature of Learning: Using Research to Inspire Practice, OECD Publishing.
Spires, H. A., Gallini, J., & Riggsbee, J. (1992). Effects of schema-based and text structure-based cues on expository prose comprehension in fourth graders. The Journal of Experimental Education, 60(4), 307-320.
Springer, L., Stanne, M. E., & Donovan, S. S. (1999). Effects of small-group learning on undergraduates in science, mathematics, engineering, and technology: A meta-analysis. Review of educational research, 69(1), 21-51.
Stein, M. K., & Wang, M. C. (1988). Teacher development and school improvement: The process of teacher change. Teaching and Teacher Education, 4, 171–187.
NAEP 2018-2019 OMB Clearance: Supporting Statement Part C Page 70
Sutherland, R., Facer, K., Furlong, R., & Furlong, J. (2000). A new environment for education? The computer in the home. Computers & Education, 34(3-4), 195-212. doi: 10.1016/S0360-1315(99)00045-7
Taboada, A., Tonks, S. M., Wigfield, A., & Guthrie, J. T. (2009). Effects of motivational and cognitive variables on reading comprehension. Reading and Writing, 22(1), 85-106.
TPACK.org (n.d.). TPACK Explained. Retrieved from http://www.tpack.org/.
Trautwein, U. (2007). The homework–achievement relation reconsidered: Differentiating homework time, homework frequency, and homework effort. Learning and Instruction, 17(3), 372-388.
Van den Broek, P., Lorch, R. F., Linderholm, T., & Gustafson, M. (2001). The effects of readers’ goals on inference generation and memory for texts. Memory & Cognition, 29(8), 1081-1087.
Van den Broek, P., Risden, K., & Husebye-Hartmann, E. (1995). The role of readers’ standards for coherence in the generation of inferences during reading. Sources of coherence in reading, 353-373.
Van Steensel, R., McElvany, N., Kurvers, J., & Herppich, S. (2011). How effective are family literacy programs? Results of a meta-analysis. Review of Educational Research, 81(1), 69-96.
Vansteenkiste, M., Timmermans, T., Lens, W., Soenens, B., & Van den Broeck, A. (2008). Does extrinsic goal framing enhance extrinsic goal-oriented individuals' learning and performance? An experimental test of the match perspective versus self-determination theory. Journal of Educational Psychology, 100(2), 387.
Voogt, J., Westbroek, H., Handelzalts, A., Walraven, A., McKenney, S., Pieters, J., and deVries, J. (2011). Teacher learning in collaborative curriculum design. Teaching and Teacher Education, 27(8): 1235–44.
Wayne, A. J., & Youngs, P. (2003). Teacher characteristics and student achievement gains: A review. Review of Educational research, 73(1), 89-122.
West, M. (2007). Testing, Learning, and Teaching: The Effects of Test-Based Accountability on Student Achievement and Instructional Time in Core Academic Subjects. In Finn, C. & Ravitch, D. (Eds.) Beyond the Basics: Achieving a Liberal Education for All Children. Washington, DC: Thomas B. Fordham Institute, pp. 45–62.
Won, S. J., & Han, S. (2010). Out-of-school activities and achievement among middle school students in the US and South Korea. Journal of Advanced Academics, 21(4), 628-661.
Wright, S. L., Jenkins-Guarnieri, M. A., & Murdock, J. L. (2012). Career Development Among First-Year College Students: College Self-Efficacy, Student Persistence, and Academic Success. Journal of Career Development.
Yoon, K. S., Duncan, T., Lee, S., & W-Y, S. (2007). B., & Shapley, K.(2007). Reviewing the evidence on how teacher professional development affects student achievement.
NAEP 2018-2019 OMB Clearance: Supporting Statement Part C 71NAEP 2018-2019 OMB Clearance: Supporting Statement Part C Page 71

Zimmerman, B. J. (2000). Self-efficacy: An essential motive to learn. Contemporary educational psychology, 25(1), 82-91.
Zimmerman, B. J., Bandura, A., & Martinez-Pons, M. (1992). Self-motivation for academic attainment: The role of self-efficacy beliefs and personal goal setting. American educational research journal, 29(3), 663-67.
NAEP 2018-2019 OMB Clearance: Supporting Statement Part C Page 72
Appendices
NAEP 2018-2019 OMB Clearance: Supporting Statement Part C Page 73
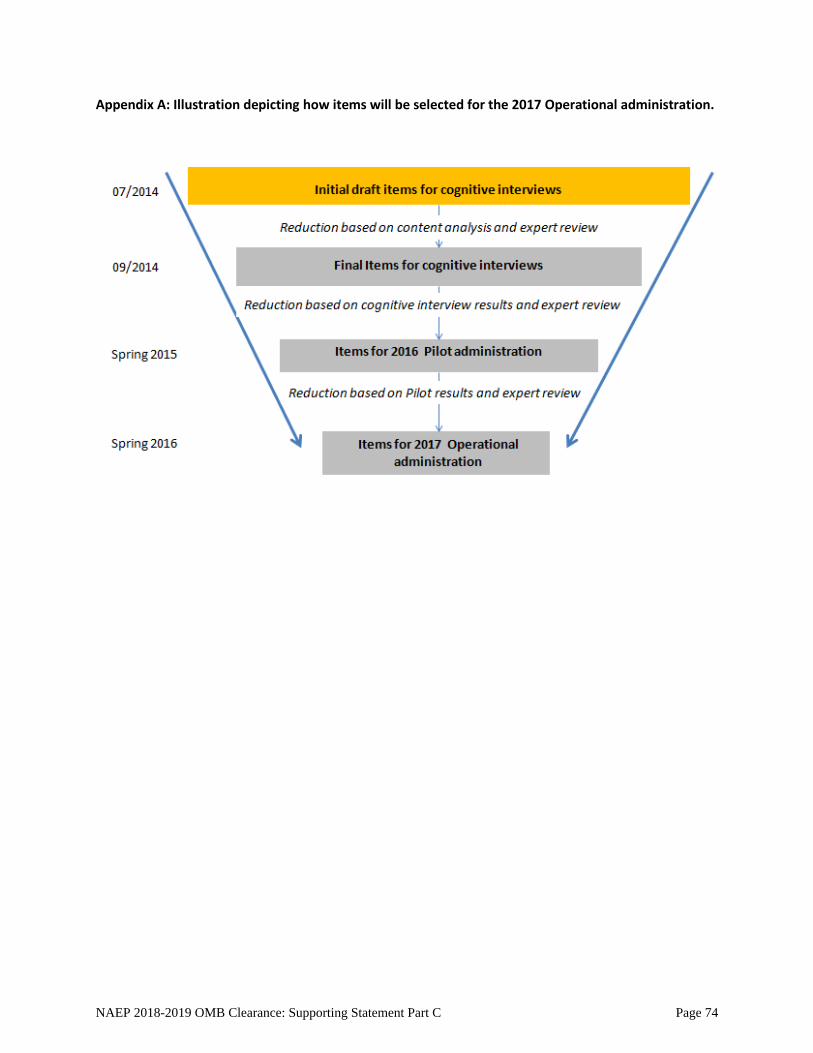
Appendix A: Illustration depicting how items will be selected for the 2017 Operational administration.
NAEP 2018-2019 OMB Clearance: Supporting Statement Part C Page 74
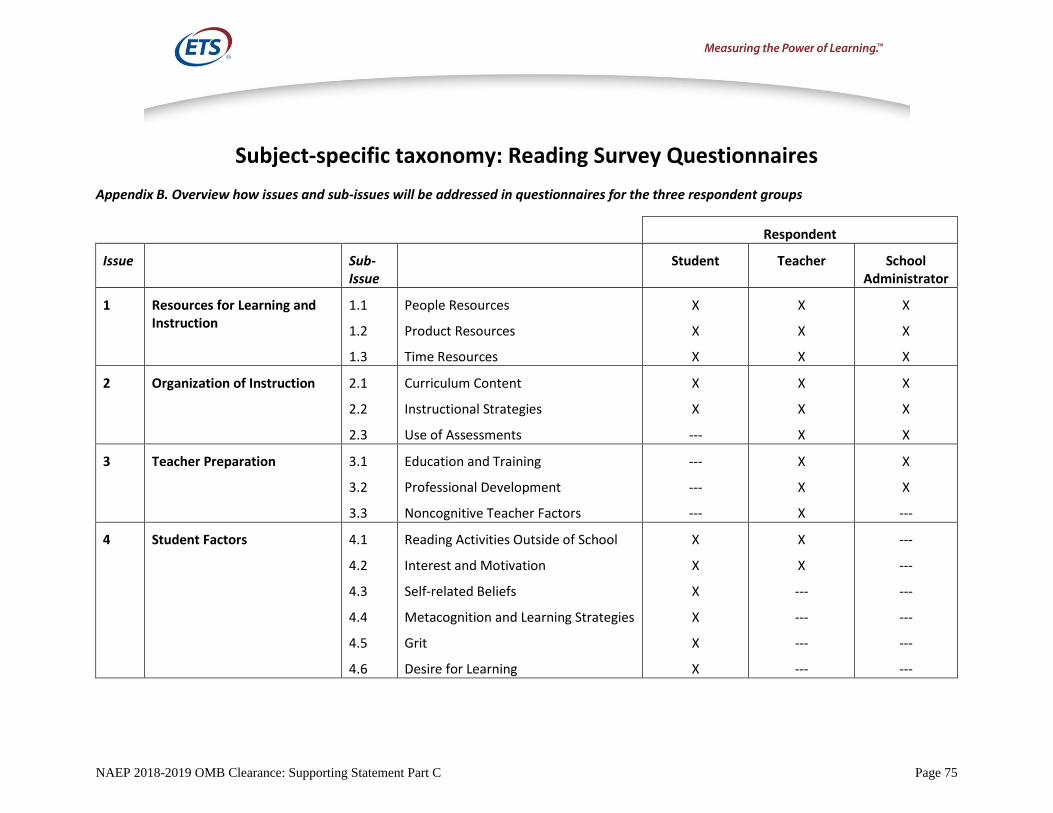
Subject-specific taxonomy: Reading Survey Questionnaires
Appendix B. Overview how issues and sub-issues will be addressed in questionnaires for the three respondent groups
Respondent
Issue Sub-Issue
Student Teacher School Administrator
1 Resources for Learning and Instruction
1.1
1.2
1.3
People Resources
Product Resources
Time Resources
X
X
X
X
X
X
X
X
X
2 Organization of Instruction 2.1
2.2
2.3
Curriculum Content
Instructional Strategies
Use of Assessments
X
X
---
X
X
X
X
X
X
3 Teacher Preparation 3.1
3.2
3.3
Education and Training
Professional Development
Noncognitive Teacher Factors
---
---
---
X
X
X
X
X
---
4 Student Factors 4.1
4.2
4.3
4.4
4.5
4.6
Reading Activities Outside of School
Interest and Motivation
Self-related Beliefs
Metacognition and Learning Strategies
Grit
Desire for Learning
X
X
X
X
X
X
X
X
---
---
---
---
---
---
---
---
---
---
NAEP 2018-2019 OMB Clearance: Supporting Statement Part C Page 75

Part C-3: 2017 Mathematics Issues Paper
NAEP 2018-2019 OMB Clearance: Supporting Statement Part C Page 76
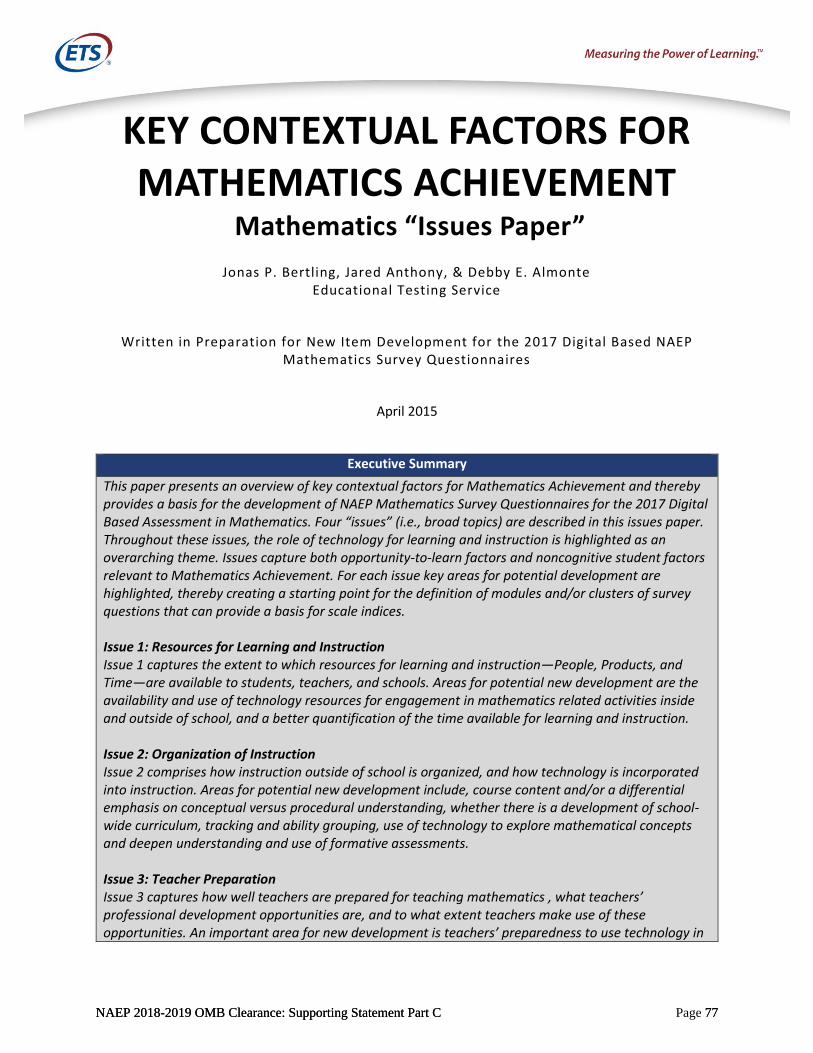
KEY CONTEXTUAL FACTORS FOR MATHEMATICS ACHIEVEMENT
Mathematics “Issues Paper”
Jonas P. Bertling, Jared Anthony, & Debby E. Almonte Educational Testing Service
Written in Preparation for New Item Development for the 2017 Digital Based NAEP Mathematics Survey Questionnaires
April 2015
Executive Summary
This paper presents an overview of key contextual factors for Mathematics Achievement and thereby provides a basis for the development of NAEP Mathematics Survey Questionnaires for the 2017 Digital Based Assessment in Mathematics. Four “issues” (i.e., broad topics) are described in this issues paper. Throughout these issues, the role of technology for learning and instruction is highlighted as an overarching theme. Issues capture both opportunity-to-learn factors and noncognitive student factors relevant to Mathematics Achievement. For each issue key areas for potential development are highlighted, thereby creating a starting point for the definition of modules and/or clusters of survey questions that can provide a basis for scale indices.
Issue 1: Resources for Learning and Instruction Issue 1 captures the extent to which resources for learning and instruction—People, Products, and Time—are available to students, teachers, and schools. Areas for potential new development are the availability and use of technology resources for engagement in mathematics related activities inside and outside of school, and a better quantification of the time available for learning and instruction.
Issue 2: Organization of Instruction Issue 2 comprises how instruction outside of school is organized, and how technology is incorporated into instruction. Areas for potential new development include, course content and/or a differential emphasis on conceptual versus procedural understanding, whether there is a development of school-wide curriculum, tracking and ability grouping, use of technology to explore mathematical concepts and deepen understanding and use of formative assessments.
Issue 3: Teacher Preparation Issue 3 captures how well teachers are prepared for teaching mathematics , what teachers’ professional development opportunities are, and to what extent teachers make use of these opportunities. An important area for new development is teachers’ preparedness to use technology in
NAEP 2018-2019 OMB Clearance: Supporting Statement Part C 77NAEP 2018-2019 OMB Clearance: Supporting Statement Part C Page 77
their mathematic instruction in purposeful ways. Inclusion of questions that explore the format of professional development programs, the skills taught within these programs, and the value and applicability of these programs in the classroom could be beneficial as well. Issue 4: Student Factors Issue 4 addresses student engagement with mathematics, represented by their mathematics activities outside of school, mathematics interest and motivation, self-related beliefs, and their meta-cognition strategies for mathematics problem solving, especially with regard to mathematics activities involving digital technology. Future item development should focus on capturing more behavioral and attitudinal facets of engagement (e.g., interest, motivation, and self-related beliefs) given that engagement is a significant predictor of academic achievement. Additionally, an important question to address is how other student factors represented in the 2017 Core questionnaire can be contextualized for mathematics (e.g., Grit, Desire for Learning); this would allow us to distinguish whether items are domain general or domain specific.
NAEP 2018-2019 OMB Clearance: Supporting Statement Part C Page 78
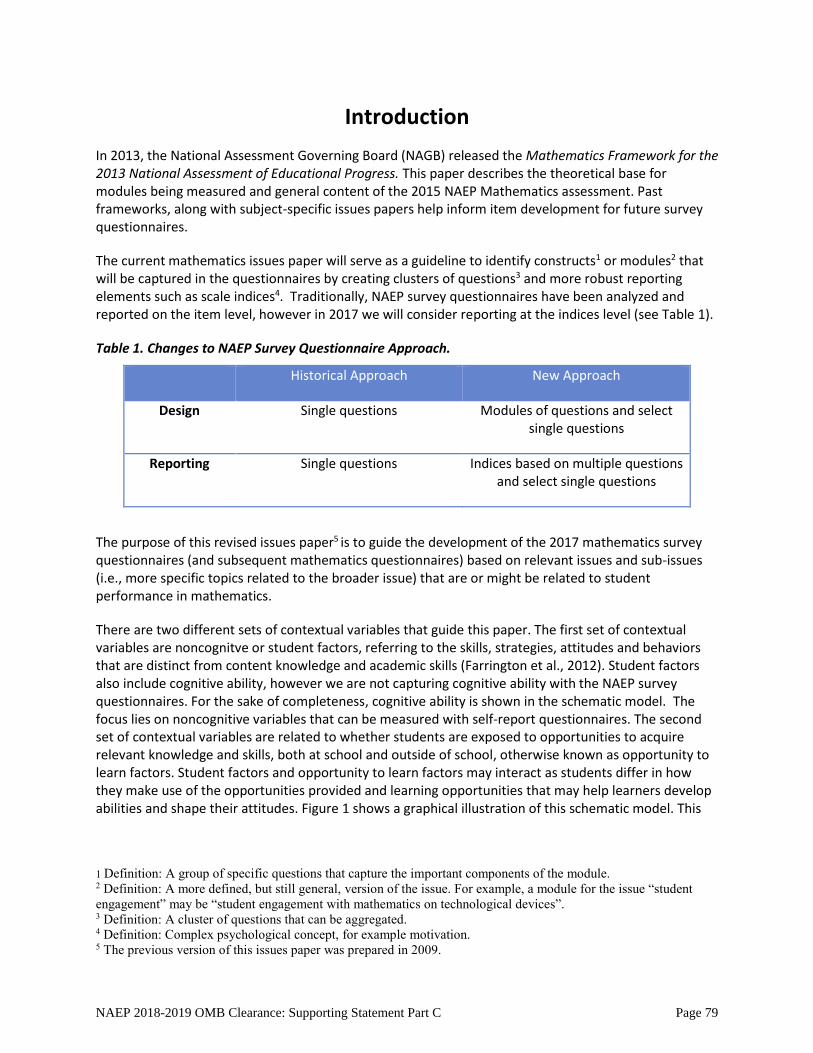
Introduction
In 2013, the National Assessment Governing Board (NAGB) released the Mathematics Framework for the 2013 National Assessment of Educational Progress. This paper describes the theoretical base for modules being measured and general content of the 2015 NAEP Mathematics assessment. Past frameworks, along with subject-specific issues papers help inform item development for future survey questionnaires.
The current mathematics issues paper will serve as a guideline to identify constructs1 or modules2 that will be captured in the questionnaires by creating clusters of questions3 and more robust reporting elements such as scale indices4. Traditionally, NAEP survey questionnaires have been analyzed and reported on the item level, however in 2017 we will consider reporting at the indices level (see Table 1).
Table 1. Changes to NAEP Survey Questionnaire Approach.
Historical Approach New Approach
Design Single questions Modules of questions and select single questions
Reporting Single questions Indices based on multiple questions and select single questions
The purpose of this revised issues paper5 is to guide the development of the 2017 mathematics survey questionnaires (and subsequent mathematics questionnaires) based on relevant issues and sub-issues (i.e., more specific topics related to the broader issue) that are or might be related to student performance in mathematics.
There are two different sets of contextual variables that guide this paper. The first set of contextual variables are noncognitve or student factors, referring to the skills, strategies, attitudes and behaviors that are distinct from content knowledge and academic skills (Farrington et al., 2012). Student factors also include cognitive ability, however we are not capturing cognitive ability with the NAEP survey questionnaires. For the sake of completeness, cognitive ability is shown in the schematic model. The focus lies on noncognitive variables that can be measured with self-report questionnaires. The second set of contextual variables are related to whether students are exposed to opportunities to acquire relevant knowledge and skills, both at school and outside of school, otherwise known as opportunity to learn factors. Student factors and opportunity to learn factors may interact as students differ in how they make use of the opportunities provided and learning opportunities that may help learners develop abilities and shape their attitudes. Figure 1 shows a graphical illustration of this schematic model. This
1 Definition: A group of specific questions that capture the important components of the module. 2 Definition: A more defined, but still general, version of the issue. For example, a module for the issue “student engagement” may be “student engagement with mathematics on technological devices”. 3 Definition: A cluster of questions that can be aggregated. 4 Definition: Complex psychological concept, for example motivation. 5 The previous version of this issues paper was prepared in 2009.
NAEP 2018-2019 OMB Clearance: Supporting Statement Part C Page 79
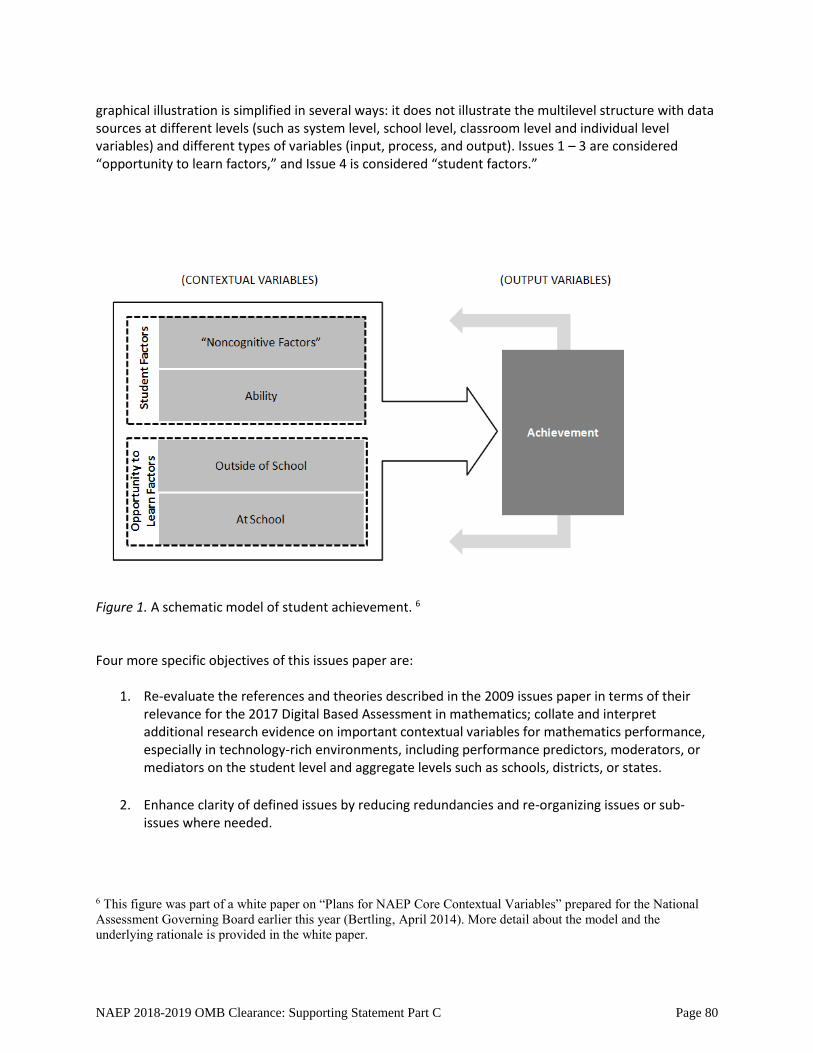
graphical illustration is simplified in several ways: it does not illustrate the multilevel structure with data sources at different levels (such as system level, school level, classroom level and individual level variables) and different types of variables (input, process, and output). Issues 1 – 3 are considered “opportunity to learn factors,” and Issue 4 is considered “student factors.”
Figure 1. A schematic model of student achievement. 6
Four more specific objectives of this issues paper are:
1. Re-evaluate the references and theories described in the 2009 issues paper in terms of their relevance for the 2017 Digital Based Assessment in mathematics; collate and interpret additional research evidence on important contextual variables for mathematics performance, especially in technology-rich environments, including performance predictors, moderators, or mediators on the student level and aggregate levels such as schools, districts, or states.
2. Enhance clarity of defined issues by reducing redundancies and re-organizing issues or sub-
issues where needed.
6 This figure was part of a white paper on “Plans for NAEP Core Contextual Variables” prepared for the National Assessment Governing Board earlier this year (Bertling, April 2014). More detail about the model and the underlying rationale is provided in the white paper.
NAEP 2018-2019 OMB Clearance: Supporting Statement Part C Page 80

3. Strengthen focus on mathematics-specific contextual variables (i.e., important background or contextual variables) taking into consideration that these variables may overlap with core contextual variables. Variables that are relevant to performance across all subjects assessed in NAEP (e.g., general availability of and familiarity with technology, perseverance, achievement motivation, or school climate) should be included in the mathematics questionnaire, or possibly an extended core in the 2017 NAEP Survey Questionnaires. 7
4. Provide high-level implementation recommendations for each issue emphasizing key areas for
new item development, thereby creating a starting point for the definition of modules and/or clusters of survey questions that can provide a basis for scale indices.
Four issues with a total of 18 sub-issues that reflect key contextual variables for mathematics achievement are presented in this revised paper. The main criteria for selecting these issues were the following:
a) Factors captured in each issue should have a clear relationship with student achievement. Student factors with no clear or low correlations with achievement based on the published research are discarded from inclusion. This criterion directly refers to the NAEP statute. Issues with a strong research foundation based on several studies (ideally, meta-analyses) and established theoretical models will be favored over issues with less research evidence regarding the relationship with achievement or issues with a less established theoretical foundation.
b) Factors captured in each issue should be malleable and actionable in terms of possible interventions in and outside the classroom.
c) Factors should be amenable for measurement with survey questionnaires. Factors such as social skills or learning strategies might require other assessment strategies to provide meaningful and reliable measures.
d) Issues suggested for inclusion in the mathematics Survey Questionnaires should focus on those students and OTL factors that are domain-specific, meaning they are not specific to mathematics achievement.
New items will be developed for potential inclusion in the 2017 Mathematics questionnaires using this issues paper as a guideline, and will be tested in cognitive interviews this fall. After the cognitive interviews have been conducted, the data will be reviewed to help inform which items should be administered in the 2016 Pilot. The items will be reviewed once more after the 2016 Pilot to inform which items are to be administered in the 2017 Operational assessment. See Appendix A for an illustration of this process.
7 New item development for future core survey questionnaires is a separate effort not addressed in this issues paper.
NAEP 2018-2019 OMB Clearance: Supporting Statement Part C Page 81
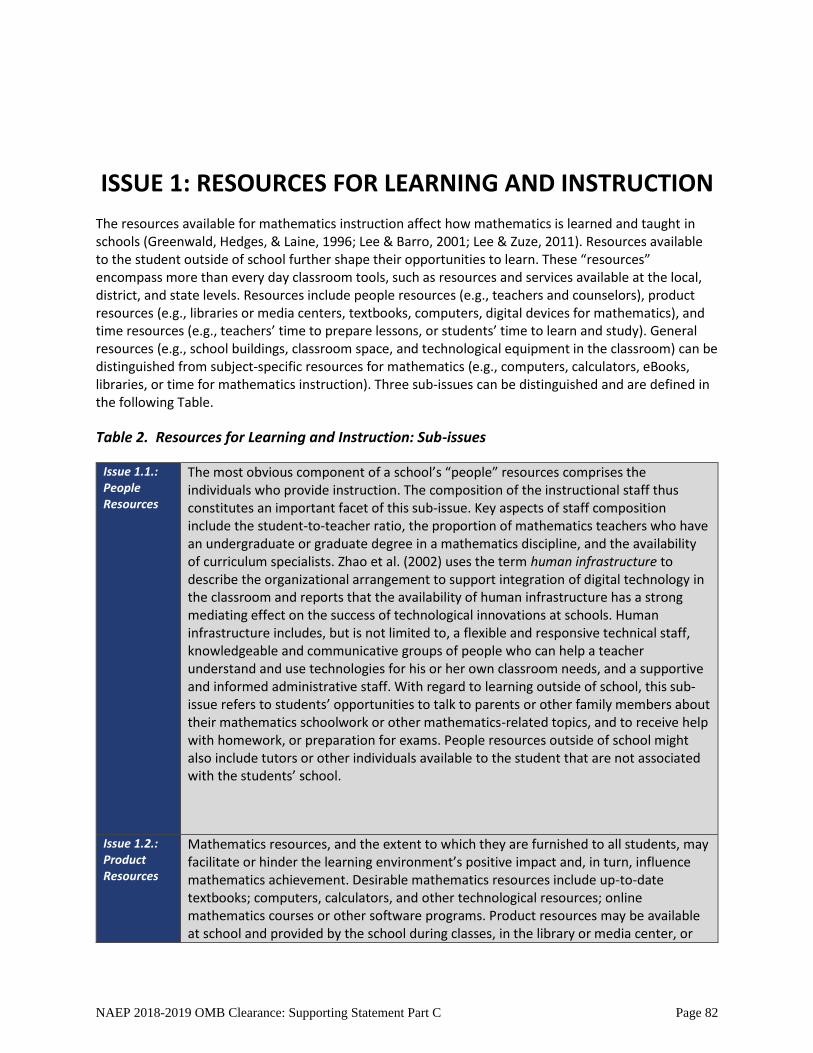
ISSUE 1: RESOURCES FOR LEARNING AND INSTRUCTION
The resources available for mathematics instruction affect how mathematics is learned and taught in schools (Greenwald, Hedges, & Laine, 1996; Lee & Barro, 2001; Lee & Zuze, 2011). Resources available to the student outside of school further shape their opportunities to learn. These “resources” encompass more than every day classroom tools, such as resources and services available at the local, district, and state levels. Resources include people resources (e.g., teachers and counselors), product resources (e.g., libraries or media centers, textbooks, computers, digital devices for mathematics), and time resources (e.g., teachers’ time to prepare lessons, or students’ time to learn and study). General resources (e.g., school buildings, classroom space, and technological equipment in the classroom) can be distinguished from subject-specific resources for mathematics (e.g., computers, calculators, eBooks, libraries, or time for mathematics instruction). Three sub-issues can be distinguished and are defined in the following Table.
Table 2. Resources for Learning and Instruction: Sub-issues
Issue 1.1.: People Resources
The most obvious component of a school’s “people” resources comprises the individuals who provide instruction. The composition of the instructional staff thus constitutes an important facet of this sub-issue. Key aspects of staff composition include the student-to-teacher ratio, the proportion of mathematics teachers who have an undergraduate or graduate degree in a mathematics discipline, and the availability of curriculum specialists. Zhao et al. (2002) uses the term human infrastructure to describe the organizational arrangement to support integration of digital technology in the classroom and reports that the availability of human infrastructure has a strong mediating effect on the success of technological innovations at schools. Human infrastructure includes, but is not limited to, a flexible and responsive technical staff, knowledgeable and communicative groups of people who can help a teacher understand and use technologies for his or her own classroom needs, and a supportive and informed administrative staff. With regard to learning outside of school, this sub-issue refers to students’ opportunities to talk to parents or other family members about their mathematics schoolwork or other mathematics-related topics, and to receive help with homework, or preparation for exams. People resources outside of school might also include tutors or other individuals available to the student that are not associated with the students’ school.
Issue 1.2.: Product Resources
Mathematics resources, and the extent to which they are furnished to all students, may facilitate or hinder the learning environment’s positive impact and, in turn, influence mathematics achievement. Desirable mathematics resources include up-to-date textbooks; computers, calculators, and other technological resources; online mathematics courses or other software programs. Product resources may be available at school and provided by the school during classes, in the library or media center, or
NAEP 2018-2019 OMB Clearance: Supporting Statement Part C Page 82
from other places outside of school. Access to computer technology and internet connectivity in U. S. schools has increased substantially over the past decade. Internet availability in public schools is usually presented as the percentage of classrooms and computer labs with Internet access or as the percentage of public schools with Internet access (Ogle et al. 2002). Product resources may refer to at school and outside of school learning contexts.
Issue 1.3.: Time Resources
The available time for learning and instruction is one of the core components of the OTL construct. Several facets can be distinguished: the amount of time devoted to mathematics instruction per week at the fourth, eighth, and twelfth- grade level; the degree to which schools provide teachers with the opportunity to prepare lessons, to review students’ work, or to collaborate with other teachers; the time that schools spend on preparing for and administering school-, district-, state-, and/or federally-mandated tests, and the available time for students to complete their mathematics homework and engage in mathematics related behaviors outside of school. Schools have been steadily increasing the time spent on reading and mathematics (Dillon, 2006). Further, when school policies afford mathematics teachers the opportunity to collaborate with science teachers, the level of student achievement increases in both disciplines (Xin & Lingling, 2004). Knowledge of the amount of time mathematics teachers devote to the activities associated with standardized testing can provide additional information on the relationship between testing and student achievement in math. With regard to learning outside of school, the available time for students varies as students might, for instance, need to fulfill other responsibilities (e.g., take care of a sibling or another family member), or work part-time (applies to 12th grade students).
Considerations for Potential Development for Issue 1: Promising areas for future item development may include enhancing the measurement of the availability and use of technological resources for practicing and learning mathematics inside and outside of the classroom. Item development might also discern between the quantity and quality of resources, and identifying limited resources that deter learning (e.g., limited outside of the classroom resources, limited outside of the school resources, classrooms being overcrowded, teachers having too many teaching hours).
NAEP 2018-2019 OMB Clearance: Supporting Statement Part C Page 83

ISSUE 2: ORGANIZATION OF INSTRUCTION
Current literature suggests that students’ opportunities to learn mathematics are determined in part by how mathematics instruction is organized. Issue 2 comprises four related sub-issues, the content of the mathematics curriculum (Issue 2.1.), the instructional strategies through which students experience this content (Issue 2.2.), the use of technology for instruction (Issue 2.3.), and the role of assessments in the classroom (Issue 2.4.).
Table 3. Organization of Instruction: Sub-issues
Issue 2.1.: Curriculum Content
A school’s mathematics curriculum can be understood by examining the required mathematics courses, the optional mathematics courses, and the students’ course histories in mathematics. This understanding is strengthened by viewing the data in conjunction with information about achievement grouping and tracking. Different tracks may offer altogether different courses or they may offer same-subject courses that differ in content and rigor. In either case, gathering information about, for example, differential course content and/or a differential emphasis on conceptual versus procedural understanding would be important. Curriculum content can also be examined in terms of whether there is a school-wide curriculum for mathematics in place and, if so, how it is developed and periodically updated, and whether it adheres to any content standards. Understanding how the mathematics curriculum functions requires an understanding of how it is organized and how students gain access. This, in turn, depends on understanding schools’ policies on tracking and achievement grouping, when students begin to receive instruction in different mathematics topics, and what specific courses are offered and taken by students.
Since the early 2000’s major changes to the middle school mathematics curriculum have been made and show many more students taking algebra courses and an increased emphasis in seventh- and eighth-grade on algebraic concepts, like pattern recognition and generalization, modeling relationships, and algebraic reasoning (National Assessment Governing Board [NAGB], 2003). In fact, many states now require that students demonstrate proficiency in algebra to graduate from high school (RAND Mathematics Study Panel & Ball, 2003). In addition, algebraic concepts in mathematics have infused instruction in elementary school. Within the 2009 issues paper, there was a specific emphasis on the teaching and learning of algebra as a separate issue. We do not present teaching and learning of algebra as a separate issue here as it shows considerable overlap with the other issues outlined here and refers not only to a single issue but cuts across issues. Algebra topics are of direct relevance, for instance, for instruction, teacher preparation, and for students’ self-efficacy and motivation. With regard to curriculum content, a special emphasis should lie on assessing whether and to what extent algebra topics are represented in the curriculum. The content of an algebra curriculum can take many forms depending on how much emphasis is placed on procedural
NAEP 2018-2019 OMB Clearance: Supporting Statement Part C Page 84
versus conceptual understanding, the depth to which topics are covered, and the manner in which different topics and skills are introduced.
Algebra is sometimes characterized as a “gateway” topic—for example, the RAND mathematics study panel (RAND Mathematics Study Panel & Ball, 2003) recommended that algebra instruction should receive focus, because without a solid foundation in it, higher mathematics is inaccessible to students. In the past, Algebra I was typically taught in the ninth grade. Over the years, more students have been taking algebra earlier, in Grade 8, and algebraic concepts are being addressed in earlier grades still. The NCTM standards, for example, include algebra standards across grade bands, starting in the K-2 band (NCTM, 2000).
The Common Core State Standards for Mathematics (CCSSM, 2010) also emphasize algebraic concepts from early on; beginning in Kindergarten, there is a high level standard for “Operations and Algebraic Thinking.” By high school, there is significant emphasis on functions, especially comparing different kinds of functions. This is consistent with the view that students should absorb and revisit algebraic concepts over an extended period of time. Whether or not it is advisable for students to begin Algebra 1 in eighth grade is a matter of some debate—for example, a recent report from the Brown Center suggests that while enrollment in Algebra 1 courses at Grade 8 has greatly increased since 1990, it is not significantly correlated with either the NAEP composite score or the NAEP Algebra strand score (Loveless, 2013). Whether algebra instruction begins at eighth- or ninth-grade, one promising direction for enhancing instruction in algebra is to emphasize the connection between Numbers and Operations. There is considerable evidence to suggest that students are unlikely to spontaneously observe the connection between numbers and algebra unless it is consistently reinforced (Lee & Wheeler, 1989).
Issue 2.2.: Instructional Strategies
Effective instruction comes not only from teachers’ own rich knowledge of mathematics, but also from the repertoire of instructional strategies through which they facilitate students’ thinking about and understanding the mathematical principles and concepts. These strategies require teachers to know how students acquire mathematical understanding and why they typically misunderstand certain concepts. Two important facets of effective instructional strategies are targeting instruction based on students’ needs, and creating connections to real-world problems in addition to teaching of abstract concepts.
Students’ learning of mathematical content and their mathematic achievement improves when teachers provide tailored instruction based on students’ specific learning needs (Bergan, Sladeczek, Schwartz and Smith, 1991; Chatterji et al., 2009; Stecker & Fuchs, 2000). In addition, student engagement also increases when teachers facilitate learning based on the
NAEP 2018-2019 OMB Clearance: Supporting Statement Part C Page 85
needs of their students (Beeland, 2002; Jang, Reeve & Deci, 2010). Two important engagement-promoting aspects of teachers’ instructional styles are ‘autonomy support’ and ‘structure’ (Jang et al., 2010). Providing clear expectations and framing students’ learning activities with explicit guidance helps students stay on task and persevere.
Research also suggests that teachers can foster student engagement by implementing real-world problems or everyday mathematics problems in their instruction (Civil, 2002; Gainsburg, 2008). For example, Civil (2002) investigated the relationship between students’ participation rates and tasks that were either traditional, formal mathematics or problems related to contextual, everyday mathematics. Results showed that, when students were asked to complete real-world tasks such as creating games that reflected math occurring outside of school, student’s involvement in classroom discussions, rates of homework completion, and the quality of students’ results increased.
The importance of teaching algebra has been highlighted in the previous issue. Whether or not a teacher has embraced the notion that all students should and can learn algebra will also affect how equitably the curriculum is delivered. One example for effective organization of instruction to facilitate learning based on students’ needs is the use of scaffolding activities that encourage students to perceive the connection between algebra and numbers and operations (Bernardo & Okagaki, 1994; Kieran, 1992; Koedinger & Anderson, 1998; Wollman, 1983). Scaffolding is an effective instructional strategy especially when used continuously for longer time periods but not as a short-term instructional technique (Rosnick & Clement, 1980; Graf, Bassok, Hunt, & Minstrell, 2004).
Issue 2.3.: Use of Technology in Instruction
Technology plays an increasingly prominent role in mathematics instruction. Although calculators have long been used in many classrooms, their use continues to become more sophisticated. Moreover, desktop, laptop, and tablet computers and other mobile devices are playing a more central role as their availability increases and as software and Internet tools become more useful for instructional purposes.
The availability of new technologies is changing the way mathematics is taught and learned. Teachers are able to demonstrate mathematical concepts in new ways, and students have access to a range of tools and programs that they can use to explore mathematical concepts. For example, graphing tools, three-dimensional shape manipulators, and statistical and simulator programs provide students with an opportunity to explore and deepen their understanding of mathematics. Of course, access to these technologies (see Issue 1) will determine the extent to which teachers use them in instruction. The growing availability of technology for mathematics instruction also points to the need for schools to prepare teachers to use them effectively (see Issue 3). In order to understand students’ opportunity to learn in terms of their opportunity to work with technology it is necessary to measure not only if
NAEP 2018-2019 OMB Clearance: Supporting Statement Part C Page 86

technology is available, but also how it is used. Barton (2000) concluded based on a review of the research literature that access to technology alone did not ensure enhanced learning. Moreover, the impact of the technology was found to depend on the ways in which it is used to mediate mathematics in the classroom as on simple access to the technology. Important facets of this sub-issues that should be differentiated in the 2017 mathematics questionnaires are: the use of different types of calculators; the use of different types of computers; and the use of online resources for instruction inside and outside the classroom.
Calculator use has been an important policy issue for years. Educators have debated whether or not calculator use, particularly at fourth-grade, is appropriate. For example, calculators may help students visualize numerical representations, learn more advanced mathematical concepts, or work on complex problems for which paper-and-pencil computation would be unnecessarily time-consuming and distracting. In contrast, students may use calculators to check answers or carry out simple arithmetic operations. This more simplistic application raises the educational concern that calculators may preclude students’ learning basic computation skills. Hansen, Fife, Graf, & Supernavage (2010) concluded that calculators may allow certain skills to be assessed that one might otherwise be unable to assess; that using calculators may make tasks more authentic in work and higher-education settings; and that calculator use can help remove construct-irrelevant variance in assessment situations. While calculator use can have beneficial effects, an important consideration is that calculators should have a pedagogical role in instruction supported by special curriculum materials, and not be used just for routine calculations (Hansen et al., 2010). Used appropriately, computers and the Internet allow students to work more independently on higher-order thinking skills and provide an opportunity for students to locate and use real data and to solve real-world problems. Technology broadens the learning community and enables students to communicate with each other about mathematics. Dynamic geometric software can help students visualize and understand complex mathematics concepts. Simulation software can help students explore real-world problems and database and spreadsheet programs can help students analyze and solve problems. The issue is not just whether these technologies and programs are used, but what impact they have on the level of mathematics being taught. Finally, given the wide availability of Internet connections, many schools can offer students access to mathematics courses offered online; such courses would otherwise be unavailable.
Issue 2.4.: Use of Formative Assessment
Summative assessments are essentially assessments “of” learning or knowledge that has already been acquired. On the other hand, formative assessments are to help teachers plan instruction: The purpose of a formative assessment is to help the teacher understand what a student knows and can
NAEP 2018-2019 OMB Clearance: Supporting Statement Part C Page 87
do so that the teacher can plan instruction more effectively. Arieli-Attali, Wylie, and Bauer (2012) provide an example how effective formative assessments can be designed by combining two components, a locator test that would place student understanding with respect to levels of understanding within a set of learning progressions; and incremental tasks to be used by teachers in class, both to update teachers’ understanding of where students are in their understanding and to support student learning as they transition from one level to the next within a progression. Research findings indicate that teachers gather better quality evidence of student understanding when they apply effective formative assessments in their classroom (McGatha, Bush and Rakes, 2009). Formative assessments can not only provide the teacher with important diagnostic feedback to guide instruction but also help students understand and overcome their misconceptions by encouraging the higher-order thinking skills of questioning and reflective thinking (Chin & Teou, 2009). Recent meta-analytical findings (Kingston and Nash, 2011) further support the use of formative assessment in mathematics classrooms.
Considerations for Potential Development for Issue 2: Promising areas for future item development may be enhancing the measurement of curriculum content, instructional strategies, and teacher practices as three important aspects of opportunity to learn. Questions might also discern between technology-based mathematics activities and incorporation of web resources, assessments, interactive tools, and multimedia into the classroom. Important questions may concern how teachers adapt their teaching practices to the rapid technological changes, how teachers use technological devices to engage students with mathematics, and how use of digital technologies for mathematics activities impacts the curricula at the different grade levels.
NAEP 2018-2019 OMB Clearance: Supporting Statement Part C Page 88
ISSUE 3: TEACHER PREPARATION
Although U.S. students' mathematics scores have increased in recent years, both in TIMSS and in NAEP, international comparisons show that they are still lower than student scores in Singapore, China, and Japan (Provasnik, et al., 2012; NCES, 2011); the PISA results in particular show lower scores for students in the U.S. than for students in Finland or Switzerland as well (OECD, 2010). It has been suggested that these differences may be due at least in part to inadequate teacher training as well as insufficient preparation time (i.e., U.S. teachers have fewer unscheduled hours per week to plan lessons). International performance differences are most evident in the middle grades, but the origin of these differences may have even earlier roots in instruction: an influential study based on in-depth interviews of small numbers of teachers in the U.S. and China suggested that relative to U.S. teachers, Chinese teachers possess enhanced conceptual schemas of fundamental mathematics content (Ma, 1999). For example, most of the Chinese teachers in Ma’s study could successfully construct a story problem around a fraction division statement such as 1 ¾ ÷ ½, but the U.S. teachers had difficulty with this task, sometimes reinterpreting the statement as a fraction multiplication problem (i.e., the scenario would involve taking half of 1 ¾). Four sub-issues with regard to teacher preparation are distinguished, content knowledge and subject-specific training, pedagogical training, professional development, and teacher attitudes. Teachers who have a sophisticated grasp of mathematics, who have experience teaching mathematics to students of diverse backgrounds, and learning styles, and who have access to professional development opportunities are likely to be more adept at providing students with a strong conceptual understanding than are teachers who lack these advantages.
Table 4. Teacher Preparation: Sub-issues
Issue 3.1.: Content knowledge and subject-specific training
Teachers’ undergraduate and graduate coursework in mathematics is a crucial indicator of their overall preparation. However, information regarding formal education and training alone is not sufficient for understanding the extent of teachers’ preparation. Traditionally, teachers' subject knowledge has been assessed based on background variables such as courses taken, degrees attained, etc. (Hill, Rowan, & Ball, 2005). In recent years however, instruments have been developed that are intended to measure teachers' content-specific knowledge and pedagogical content knowledge (e.g., Hill, Schilling, & Ball, 2004; Hill, Ball & Schilling, 2008). Measures of teacher content knowledge in mathematics have been associated with student performance gains (Hill et al., 2005) and better identification and remediation of gaps in students’ knowledge (e.g., Carpenter, Fennema, Peterson, Chiang and Loef, 1989). One especially important topic in which teachers’ content knowledge is crucial for student achievement is Algebra. Content knowledge is inextricable from pedagogical knowledge. That is, teachers’ ability to provide first-rate instruction in mathematics is strongly related to their own subject-matter expertise, as well as to their training in how to teach mathematical concepts. The RAND Mathematics Study Panel (2003) has noted that “the quality of mathematics teaching and learning depends on what teachers do with their students, and what teachers can do depends on their knowledge of mathematics.” A thorough knowledge of mathematics enables teachers to teach dynamically—by showing many representations of the same concept, by encouraging student questions, and by providing alternative explanations.
NAEP 2018-2019 OMB Clearance: Supporting Statement Part C Page 89
Teachers who lack such grounding often rely primarily upon teaching algorithms and procedures, whereas teachers with strong mathematical skills are also able to stress conceptual understanding.
In addition to teachers’ content knowledge and subject-specific training, gathering information about teachers’ pedagogical knowledge and training seems equally important. In order to provided targeted instruction based on students’ needs and engage students in the classroom discussion and foster their interest in learning mathematical content, teachers need to be equipped with the necessary pedagogical knowledge. Undergraduate and graduate coursework in mathematics pedagogy is therefore also important.
Issue 3.2.: Professional Development
Teachers’ ongoing participation in professional development activities that focus on mathematics is also critical to teacher preparation. Professional development in mathematics knowledge per se may be especially valuable, although pedagogically-oriented development opportunities are also important. Professional development includes courses, workshops, seminars, classroom observations and critiques (both observing and being observed), conferences, “camps,” or any other venue in which teachers are expected to hone their subject-matter or pedagogical skill— both within and outside the school environment. Furthermore, to enhance their learning and to assist with curriculum planning, teachers can access online instructional materials, websites, and chat rooms devoted to mathematics instruction. Finally, given the growing role of technology in mathematics instruction (see below), teachers must be trained in the effective use of computers, of calculators, and of emerging technologies. Participation in professional development courses that focus on integrating technology with instruction is one way for teachers to learn how these tools can enhance learning. Some teachers may not use technology because it is not available; others may avoid it because they lack the knowledge to incorporate it effectively; and still others may not fully understand the mathematics content that technology allows students to access when solving complex problems. When teachers participate in professional development programs that emphasize collective meetings with groups of teachers and that provide opportunities for teachers to review student work and discuss student responses and behaviors, they deepen both their content and pedagogical knowledge needed to effectively engage in the critical tasks of teaching and develop their teaching practices (e.g., Desimone, Porter, Garet, Yoon and Birman, 2002; Guskey and Yoon, 2009; Garet, Porter, Desimone, Birman and Yoon, 2001).
In addition to professional development, teachers may also need other support staff, such as specialists and coaches who are highly trained in a particular domain and can support teaching in the classroom. Traditionally, specialists and coaches have been viewed as a resource for students, but recently the role of a coach has changed to one of a mentor for teachers. The
NAEP 2018-2019 OMB Clearance: Supporting Statement Part C Page 90
literature shows that support staff, in particular coaches, are important for teacher’s professional development (Dole, 2004).
Issue 3.3.: Noncognitive Teacher Factors
In addition to teachers’ content and pedagogical knowledge, teacher attitudes (e.g. self-efficacy and attributions placed on student learning) play an important role for effective teaching and instruction. Teachers who are interested in the subject they are teaching, who have positive attitudes towards their work and show high levels of confidence in their ability to succeed in the classroom are more likely to be successful. Studies show that teachers who have high self-efficacy are more likely to be open to new ideas and concepts, try new teaching/instructional methods, and persist when things in the classroom do not go well (Berman, McLaughlin, Bass, Pauly, & Zellman, 1977; Guskey, 1988; Stein & Wang, 1988). The literature also shows that teacher self-efficacy can influence student achievement, motivation, and self-efficacy (Anderson, Greene, & Loewen, 1988; Midgley, Feldlaufer, & Eccles, 1989; Moore & Esselman, 1992; Ross 1992). Other noncognitive factors, such as curiosity, growth mindset, and attribution attitudes have also been shown to play an important role in student learning.
Considerations for Potential Development for Issue 3: Promising areas for future item development may be enhancing the measurement of teachers’ preparedness to use digital technologies in their mathematics instruction in purposeful ways. Additionally, development may consider differentiating between professional development programs (e.g., content- versus pedagogical-focused professional development programs), including questions about web-based trainings and teachers’ experiences with professional development programs, and including questions about noncognitive teacher factors, such as teacher factors (e.g., teacher attribution ) will clearly focus on teachers views of learning and instruction to ensure alignment with the NAEP statute to refrain from measuring “personal or family beliefs and attitudes.”
NAEP 2018-2019 OMB Clearance: Supporting Statement Part C Page 91

ISSUE 4: STUDENT FACTORS IN MATHEMATICS
Research has shown that student learning of mathematical content improves when students are more engaged in their classroom activities. Two aspects of engagement can be distinguished: (1) engagement in regular classroom activities and study behavior in the classroom, and (2) students’ time use for mathematics related activities outside the classroom, including extracurricular and out-of-school activities. Also research has shown that the relationship between student social behavior and academic performance is generally positive. Academic and school-oriented behaviors, such as increased interest in schoolwork, striving to make good grades, and active attempts at subject mastery have been consistently linked to positive academic outcomes (Wentzel, 1993). Additionally, several studies have noted that a relationship exists between well-behaved students and academic achievement and other intellectual outcomes (Malecki & Elliott, 2002; DiPerna & Elliot, 1999; Feshbach & Feshbach, 1987; Green, Forehand, Beck, & Vosk, 1980; Lambert & Nicholl, 1977). For example, social skills have often emerged as a significant predictor of academic achievement (Malecki & Elliot, 2002). Wentzel (1993) provided evidence for this claim, noting that social skills and good behavior are associated with higher levels of academic achievement; problematic behaviors are negatively correlated with academic success. It has been suggested that disruptive and disinterested students may not strive for or achieve academic success as such behaviors often lead to negative treatment by the teacher and classmates. Thus, these behaviors impact the student-teacher relationship, possibly hindering the student’s academic achievement (Wentzel, 1993). Marks (2000) studied student engagement in the classroom as a factor which contributed to students’ social and cognitive development and led to higher achievement, and consequently better understanding of mathematical content. The author defined engagement as a psychological process – “the attention, interest, investment, and effort students expend in the work of learning” (p.155). Previous research reported that greater engagement with school and class work increased academic success and, accordingly, knowledge about the content, among middle and high school students (Lee & Smith, 1993). Finn, Pannozzo, and Voelkl (1995) found that students who are inattentive, withdrawn, and disengaged in the classroom activities (e.g., mathematical activities) have poorer academic performance compared to engaged students.
Another important component of students’ attitudes and behaviors are students’ self-related beliefs. Four sub-issues can be distinguished: (1) mathematics self-efficacy, (2) mathematics self-concept, (3) mathematics anxiety, (4) and perceived control of success in mathematics. All components are captured in the PISA 2012 student questionnaire and there is a strong research base supporting their importance for mathematics learning in specific.
Two important conditions for students’ success in mathematics are their interest in the topic and their willingness to engage in it. This issue comprises student attitudes and behaviors related to motivation and interest. Three sub-issues are distinguished, mathematics interest, instrumental motivation, and achievement motivation. Mathematics interest captures whether students show interest in the topics covered at school. Instrumental motivation captures whether students see mathematics as useful for their real life and their future choices whether or not to study mathematics beyond school and chose a mathematics-oriented career. Achievement motivation captures students’ motivation to achieve good results in mathematics and in school in general, more closely related to a general motive of being a good student and being better than other students in class. Achievement motivation is one of the strongest predictors of success based on meta-analysis (e.g., Richardson et al., 2012).
NAEP 2018-2019 OMB Clearance: Supporting Statement Part C Page 92
Table 5. Student Factors: Sub-issues
Issue 4.1.: Mathematics Activities outside of school
How students spend their time outside of school, and to what extent they engage in mathematics related activities adds an important component to studying student behaviours in the classroom. Several studies provide evidence that students’ time use patterns in general (i.e., not only time spent on mathematics related activities) relate to important success variables. Time use patterns might play an important role to explain relationships between various student background variables (such as ESCS) and performance variables, for instance, as important mediator variables (see Porterfield and Winkler, 2007). Patterns of free-time activities in middle childhood predict adjustment in early adolescence (McHale, Crouter and Tucker, 2001). Fuligni and Stevenson (1995) showed in a cross-cultural study that time use predicts mathematics achievement across several countries. The participation in extracurricular activities has been demonstrated to protect against early school drop-out for at risk students (Mahoney and Cairns, 1997). More than 60 countries of the world economy regularly conduct systematic time use studies among adults and adolescents, but time-use has not been measured as part of educational large-scale assessments so far. Important activities and behaviors to capture with regard to students’ time use are extracurricular activities, homework, study time, and other mathematics-related activities.
Student engagement is clearly related to involvement in extracurricular activities (Fredricks & Eccles, 2006). These activities, including music, fine arts, academic clubs, and athletics, have been shown to be beneficial to academic growth. Participation in such activities can provide students with opportunities to learn about teamwork, respect, and responsibility, and provide a venue for the student to apply these lessons (NCES, 1995). Participation in extracurricular activities has been associated with academic achievement (NCES, 1995). Several longitudinal studies have suggested that participation in school sports plays a role in increasing student grades (Fejgin, 1994; Hanson & Kraus, 1998, 1999; Broh, 2002). Similarly, Marsh’s (1992) analysis of student participation in extracurricular activities indicated that extracurricular involvement is associated with improved GPA and higher educational aspirations (Broh, 2002).
The existing literature on homework is optimistic as most studies indicate it has a positive impact on academic achievement (McMullen, 2007; Betts 1997; Neilson, 2005). For instance, using data from the National Educational Longitudinal Study of 1988, Aksoy and Link (2000) found homework to have a positive and significant impact on tenth grade math scores (Eren & Henderson, 2008). Cooper, Robinson, and Patall (2006) analyzed recent articles in education, psychology, and sociology and found that increased amounts of homework are related to small increases in academic achievement (McMullen, 2007). McMullen (2007) reiterated this, finding that one extra hour of mathematics homework per week improved
NAEP 2018-2019 OMB Clearance: Supporting Statement Part C Page 93

mathematics achievement. Betts (1997) used teacher reported hours of homework assigned to understand the effect of homework on math scores and found significant results. It was reported that one extra hour of math homework for seventh through eleventh graders did indeed advance student math skills (Eren & Henderson, 2006). Such findings indicate that homework is an important factor in student achievement.
Ben-Avie, Haynes, White, Ensign, Steinfeld, & Sartin, L. (2003) conducted three studies to evaluate the work of the Institute for Student Achievement (ISA) for three years. In those studies, researchers emphasized the meaningful connection between engagement and perseverance, and the importance of academic perseverance in showing high performance in mathematics. Perseverance was defined as “students’ persistence in performing strategic behaviors that increase the likelihood of academic success, regardless of obstacles or distractions” (p.22). Students’ openness for problem solving (e.g., enjoy solving complex problems, seek explanations for things), their planning & organization behaviors (e.g., make to-do lists, keep notes for subjects; finish assignments on time, don’t do things at the last minute), persistence even on difficult tasks (e.g., not put off difficult problems, don’t give up easily), and general work ethics (e.g., prepare for class, work consistently throughout the school year) are not only among the most predictive noncognitive predictors of GPA (see recent meta-analysis by Richardson et al., 2012), but also important predictors of success in higher education and the workforce in general (e.g., Heckman, Stixrud & Urzua, 2006; Lindqvist & Vestman, 2011; Poropat, 2009; Roberts et al., 2007
Issue 4.2.: Self-related beliefs
Self-efficacy refers to the beliefs that individuals hold about what they believe they are capable of accomplishing. These self-perceptions determine how individuals use the knowledge and skills that they have to achieve a certain task (Pajares & Schunk, 2001). It has been reported that self-efficacy beliefs are correlated with other self-beliefs, such as self-concept and other motivational constructs (Zimmerman, 2000). Evidence has also suggested that self-efficacy and self-concept beliefs are each related to and influential on academic achievement (Pajares, 1996). Pintrich and De Groot (1990) have suggested that self-efficacy has a special role in terms of cognitive engagement, that is, it may increase self-efficacy beliefs that in turn, could lead to more frequent and increased use of cognitive strategies, leading to higher achievement (Pajares & Schunk, 2001). Students with high self-efficacy engage in effective self-regulating strategies more often than those with lower level beliefs; high self-efficacy also seems to enhance performance as these beliefs also tend to enhance persistence (Pajares, 1996; Bouffard-Bouchard, Parent, & Larivee, 1991; Berry, 1987). Self-efficacy beliefs have been positively related to academic achievement, moderating the effect of experiences, abilities, and prior achievement. Zimmerman, Bandura, and Martinez-Pons (1992) demonstrated that academic self-efficacy mediated the influence of self-efficacy for self-regulated learning on academic achievement (Pajares, 1996). Multon,
NAEP 2018-2019 OMB Clearance: Supporting Statement Part C Page 94
Brown, and Lent (1991) conducted a meta-analysis that indicated self-efficacy was related to academic outcomes, with these effects becoming stronger as students progressed from elementary school to high school to college (Pajares & Schunk, 2001). The effects were stronger for classroom-based indices (i.e., grades) and basic skill measures when compared to standardized tests, demonstrating that self-efficacy beliefs are often subject and context-specific (Pajares & Schunk, 2001). Overall, there is an ample amount of evidence that suggests self-efficacy and self-concept are powerful constructs that predict both academic beliefs and performance (Pajares, 1996).Stevens, Olivarez, and Hamman (2006) studied the relationship between cognitive, motivational and emotional variables to predict students’ performance in mathematics. Results supported the importance of self-efficacy as a predictor of math performance. In general, students who feel more confident with mathematics are more likely than others to use mathematics in the various contexts that they encounter. This is why self-efficacy is often also considered an outcome by itself, not only an important contextual factor for mathematics achievement.
Self-concept also is widely accepted as an important universal aspect of being human and central to understanding the quality of human existence (Bandura, 2006; Bruner, 1996; Marsh & Craven, 2006; Pajares, 1996; Pajares & Schunk, 2005). Positive self-beliefs are valued as a desirable outcome in many disciplines of psychology and central in the current positive psychology revolution sweeping psychology; that focuses on how individuals can optimize their life (Diener, 2000; Fredrickson, 2001; Seligman & Csikszentmihalyi, 2000). Motivational constructs in the TIMSS survey (and for purposes of the present investigation) can be broadly divided into self-concept (sometimes referred to as competence beliefs), positive affect (sometimes referred to as intrinsic motivation), and task value (a construct combining value and importance, but overlapping substantially with what some refer to as extrinsic motivation). Stipek, Salmon, Givvin, Kazemi, Saxe, & MacGyvers (1998) investigated a broader range of motivational variables related to instructional teacher practices and student preferences. Results revealed that two relevant factors of motivation – mastery orientation and enjoyment – significantly correlated with learning on procedurally oriented fractions problems and traditional computation items (r=.12 and r=.15 with p<.05, respectively). Students who rated their mathematics or fractions competencies relatively high were more focused on learning and mastery, and they reported more positive emotions, and greater enjoyment.
Students who have a strong sense of perceived control approach tasks differently than students who do not think that they are in control of their success. In PISA 2012, several items measure students’ perceived control of success in mathematics in specific and of success in school in general. Responses to these items are among the strongest predictors of cognitive performance on the mathematics tasks. Measuring perceived control in the NAEP 2017 mathematics questionnaires will add an important component
NAEP 2018-2019 OMB Clearance: Supporting Statement Part C Page 95
about students’ self-related beliefs and an important contextual variable for understanding student performance.
Students who have positive emotions towards mathematics are in a position to learn mathematics better than students who feel anxiety towards mathematics. Students who are anxious towards mathematics tasks and tests are less likely to be successful and struggle with reaching their true potential when engaging in mathematics related tasks. Research (e.g., Deci & Ryan, 1985; Eccles, 1983; Eccles & Wigfield, 2002; Renninger, 2000; 2009; Renninger, Hidi & Krapp, 1992; Stipek & MacIver, 1989) provides a clear theoretical rational for the separation of competency self-beliefs from affective components such as intrinsic motivation and interest.
Issue 4.3.: Interest and Motivation
Intrinsically motivated learners are motivated by internal rather than external incentives. Students might, for example, learn in order to find out more about a subject domain or to achieve the positive emotional state that learning can engender (Csikszentmihalyi, 1990). Interest and enjoyment are classic examples of intrinsic motivation (Bøe et al., 2011; Renninger, Hidi, & Krapp, 1992) that represent a relatively stable evaluative orientation towards certain topics or domains. Intrinsic motivation is often accompanied by positive feelings (e.g., feelings of involvement or stimulation) and attribution of personal significance to an object or domain. Subject-specific intrinsic motivation affects the intensity and continuity of engagement in learning situations, the selection of learning strategies, and the depth of understanding achieved, and choice behaviors (Schiefele, 2001). Mathematics interest captures whether students show interest in the topics covered at school and generally like mathematics. Zhu and Leung (2011) used the Trends in International Mathematics and Science Studies (TIMSS) 2003 eighth-grade mathematics data to investigate the effects of intrinsic and extrinsic motivation on learning and academic performance. Overall, more than 70% of the students had a higher level of extrinsic than intrinsic motivation. Regression analyses further revealed a significant positive effect of pleasure-oriented (intrinsic) motivation on mathematical achievement among the U.S. students (r=.17, p<.001). Data from the 2003 cycle of the Program for International Student Assessment (PISA) support these findings by indicating that both the degree and continuity of engagement in learning and the depth of understanding relates to interest in and enjoyment of particular subjects, or intrinsic motivation. This effect has been shown to operate largely independently of students’ general motivation to learn (OECD, 2004; see also the last section of this chapter). Intrinsic motivation can be understood as a factor for engagement and constitutes at the same time an important outcome of increased engagement. Research has also shown that positive attitudes towards mathematics and mathematics interest at age 15 predict future success (e.g., Thomson & Hillman, 2010).
NAEP 2018-2019 OMB Clearance: Supporting Statement Part C 96NAEP 2018-2019 OMB Clearance: Supporting Statement Part C Page 96
A central requirement of effective learning is the motivation to learn—the driving force behind learning. Deci and Ryan (1985) devised a theory of learning motivation that differentiates between extrinsic and intrinsic motivation and explicitly acknowledge the central importance of self-conceptions within the motivational spectrum (Ryan & Deci, 2003). Extrinsically motivated students pursue learning goals associated with valued consequences located outside the person and deemed personally important, such as instrumental value, positive feedback or rewards for good performance. Instrumental motivation captures whether students see mathematics as useful for their real life and their future choices whether or not to study mathematics beyond school and chose a mathematics-oriented career.
Achievement motivations captures students’ motivation to achieve good results in mathematics and in school in general, more closely related to a general motive of being a good student and being better than other students in class. Achievement motivation is one of the strongest predictor of success based on meta-analysis (e.g., Richardson et al., 2012).
Issue 4.4.: Grit for Mathematics
One key finding from the research literature reviewed in the previous section is that academic perseverance is one of the strongest predictors of achievement. This module focuses not only on academic perseverance but combines perseverance with other, related factors that are comprised under the factor “Grit”. Grit is defined as perseverance and passion for long-term goals (Duckworth, Peterson, Matthews, and Kelly, 2007). Grit can contribute to understanding student achievement beyond variables related to SES and other OTL factors. It is related to conscientiousness, defined as the degree to which a person is hard working, dependable, and detail oriented (Berry et al., 2007), but focuses on its facets perseverance, industriousness, self-control, and procrastination (negatively), which are among the facets that are strongest related to achievement (e.g., Barrick, Stewart and Piotrowski, 2002). Students’ persistence even on difficult tasks (perseverance, e.g., not to put off difficult problems, not to give up easily), general work ethics (industriousness, e.g., prepare for class, work consistently throughout the school year), and low level of procrastination are not only among the strongest noncognitive predictors of GPA (Richardson et al., 2012), but are also important predictors of success in higher education and the workforce in general (e.g., Heckman, Stixrud & Urzua, 2006; Lindqvist & Vestman, 2011; Poropat, 2009; Roberts et al., 2007). Meta-analyses (e.g., Poropat, 2009) have shown that perseverance and related person characteristics predict educational success to a comparable degree as cognitive ability measures. In other words, a prediction of a person’s educational outcomes, such as GPA, based on a score reflecting the person’s level of perseverance is about as accurate as a prediction of the same outcome based on a person’s IQ.
NAEP 2018-2019 OMB Clearance: Supporting Statement Part C Page 97
Grit goes beyond what is captured with these conscientiousness facets by including the capacity to sustain both the effort and interest in projects that take months or even longer to complete. Grit is a noncognitive factor that may explain why some individuals accomplish more than others of equal intellectual ability. Early psychologists recognized that there are certain factors that influence how individuals utilize their abilities. William James suggested that psychologists should study both the different types of human abilities and the means by which individuals utilize these abilities (James, 1907). Galton studied the biographical information of a number of eminent individuals and concluded that high achievers had “ability combined with zeal and with capacity for hard labor” (Galton, 1892). There are also more recent examples in modern psychology that demonstrate renewed interest in the trait of perseverance (Peterson and Seligman, 2004). Howe (1999) studied the biographical details of geniuses such as Einstein and Darwin and concluded that perseverance must be as important as intelligence in predicting achievement. Similarly, Ericsson and Charness (1994) found that in chess, sports, music, and the visual arts, dedicated or deliberate practice was an important predictor of individual differences between individuals. Interestingly, these same studies show that grit predicts achievement over and beyond the contribution of intelligence.
Grit is related to some of the Big Five personality traits. In particular, it shares some commonality with the trait of conscientiousness. In contrast to conscientiousness, however, grit focuses on long-term endurance. Grit may also be similar in certain aspects to an individual’s “need for achievement” (McClelland, 1961). Need for achievement considers an individual’s ability to complete manageable goals that provide immediate feedback on performance. While the idea of working towards a goal may be similar between need for achievement and grit, individuals high in grit are more likely to set long-term goals and continue to pursue these goals even without any positive feedback.
Grit has been measured in different settings but there are few if any studies that have examined grit within a specific context. It has been measured with both children and adults, and there are similar measuring instruments available for both children and adults. The questionnaire has been administered on both the Web and by pencil and paper. A series of studies that have been used to validate the measure were conducted on a variety of populations (Duckworth, Peterson, Matthews, and Kelly, 2007; Duckworth and Quinn, 2009). These include visitors to a website providing free information about psychological research, undergraduate students majoring in psychology, incoming United States Army cadets, and children age 7-15 years old participating in a national spelling bee. Grit is highly relevant to NAEP as a noncognitive factor that explains individual differences in achievement. Students higher in grit may develop different study habits that allow them to use more of their intellectual ability than other students with similar levels of intelligence. Duckworth, Peterson, Matthews, and Kelly (2007) have provided some evidence in this direction. When SAT scores were
NAEP 2018-2019 OMB Clearance: Supporting Statement Part C Page 98
held constant, grit was shown to have roughly the same association to GPA as SAT scores. These findings suggest that what student’s may lack in general cognitive ability, as reflected in traditional test scores, be able to be made up in “grittiness”. They have also found that children higher in grit were more likely to advance to higher rounds in a national spelling bee than children who were lower in grit. Furthermore, this relationship was mediated by the number of hours that the children practiced on the weekend—that is, children higher in grit seem to be more likely to spend time practicing on weekends, which leads to better achievement in the spelling bee. Other studies have shown that undergraduate students higher in grit have higher GPAs than students lower in grit (Duckworth, Peterson, Matthews, and Kelly, 2007). This was true even though grit was associated with lower SAT scores. In addition, U.S. military cadets who are higher in grit have been shown to be less likely to drop out than cadets who are lower in grit (Duckworth, Peterson, Matthews, and Kelly, 2007). This relationship holds even after controlling for other factors such as Scholastic Aptitude Test (SAT) scores (as mentioned earlier), high school rank, and Big Five personality characteristics.
Issue 4.5.: Desire for Learning for Mathematics
Desire for Learning is proposed as a second main domain-general noncognitive student factor that adds to grit in that need for cognition assesses whether individuals see learning as an opportunity and approach learning situations at school and outside of school with an academic mindset that helps them apply effort, persevere, and refrain from procrastination attempts. As highlighted in the overview section of this paper, grit and academic perseverance are key factors to student achievement in the classroom. At the same time, the research suggests that “an isolated focus on academic perseverance as a thing unto itself may well distract reformers from attending to student mindsets and the development of learning strategies that appear to be crucial to supporting students’ academic perseverance.”(Farrington et al., 2012, p. 27).
Considerations for Potential Development Recommendation for Issue 4: Promising areas for future item development may focus on capturing the different aspects of noncognitive student factors given that they represent important performance predictors, moderators, or mediators of academic achievement. Additionally, an important question to consider is how the use of different media platforms interact with the aforementioned sub-issues. Future item development may also focus on student motivation and other noncognitive factors to determine the specific beliefs held by students for achievement in mathematics. Item development may also enhance focus on the mathematics activities that students engage in outside of the classroom. Additionally, an important question to consider is how other student factors represented in the 2017 Core questionnaire can be contextualized for mathematics (e.g., Grit, Desire for Learning); this would allow us to distinguish whether items are domain general or domain specific.
NAEP 2018-2019 OMB Clearance: Supporting Statement Part C Page 99

NAEP 2018-2019 OMB Clearance: Supporting Statement Part C 100NAEP 2018-2019 OMB Clearance: Supporting Statement Part C Page 100
REFERENCES
Abedi, J. (2006). Psychometric issues in the ELL assessment and special education eligibility. The Teachers College Record, 108(11), 2282-2303.
Aksoy, T., & Link, C. R. (2000). A panel analysis of student mathematics achievement in the US in the 1990s: does increasing the amount of time in learning activities affect math achievement? Economics of education review, 19(3), 261-277.
Allard, M. D., & Stewart, J. (2008). How does employment affect the timing of time with children? Washington, DC.
Arieli-Attali, M., Wylie, E. C., Bauer, M. I. (2012, April). The use of three learning progressions in supporting formative assessment in middle school mathematics. Paper presented at the annual meeting of the American Educational Research Association, Vancouver, Canada
Ball, L. D. (2003). Mathematical Proficiency for All Students: Toward a Strategic Research and Development Program in Mathematics Education. Santa Monica, CA: RAND
Bandura, A. (June 01, 2006). Toward a Psychology of Human Agency. Perspectives on Psychological Science, 1(2), 164-180.
Barton, S. (2000). What does the research say about achievement of students who use calculator technologies and those who do not? In Electronic Proceedings of the Thirteenth Annual International Conference on Technology in Collegiate Mathematics. See also [online] http://archives.math. utk. edu/ICTCM/EP-13 C (25).
Beeland, W. D. (2002, July). Student engagement, visual learning and technology: Can interactive whiteboards help. In Annual Conference of the Association of Information Technology for Teaching Education.
Ben-Avie, M., Haynes, N. M., White, J., Ensign, J., Steinfeld, T. R., Sartin, L., & Squires, D. A. (2003). Youth development and student learning in math and science. How social and emotional development add up: Making gains in math and science education, 9(35).
Bergan, J. R., Sladeczek, I. E., Schwarz, R. D., & Smith, A. N. (1991). Effects of a measurement and planning system on kindergartners’ cognitive development and educational programming. American Educational Research Journal, 28(3), 683-714.
Bernardo, A. B., & Okagaki, L. (1994). Roles of symbolic knowledge and problem-information context in solving word problems. Journal of Educational Psychology, 86, 212–220
Berry, J. M. (1987, September 1). A self-efficacy model of memory performance. Paper presented at the American Psychological Association meetings, New York, NY.
Bøe, M. V., Henriksen, E. K., Lyons, T., & Schreiner, C. (2011). Participation in science and technology: young people’s achievement‐related choices in late‐modern societies. Studies in Science Education, 47(1), 37-72.
Bouffard-Bouchard, T., Parent, S., & Larivee, S. (1991). Influence of self-efficacy on self-regulation and performance among junior and senior high-school age students. International Journal of Behavioral Development, 14(2), 153-164.
Broh, B. A. (2002). Linking extracurricular programming to academic achievement: Who benefits and why? Sociology of Education, 75(1), 69-95.
Carpenter, T. P., Fennema, E., Peterson, P. L., Chiang, C. P., & Loef, M. (1989). Using knowledge of children’s mathematics thinking in classroom teaching: An experimental study. American Educational Research Journal, 26(4), 499-531.
Carroll, J. (1963). A model of school learning. The Teachers College Record, 64(8), 723-723. Common Core State Standards Initiative. (2010). Common core state standards for mathematics.
Retrieved from http://www.corestandards.org/Math/ on September, 15, 2014.
NAEP 2018-2019 OMB Clearance: Supporting Statement Part C Page 101
Chin, C., & Teou, L. Y. (2009). Using concept cartoons in formative assessment: Scaffolding students’ argumentation. International Journal of Science Education, 31(10), 1307-1332.
Civil, M. (2002). Culture and mathematics: A community approach. Journal of Intercultural Studies, 23,133-148
Civil, M., & Quintos, B. (2002). Uncovering Mothers' Perceptions about the Teaching and Learning of Mathematics. Paper presentation at the Annual Meeting of the American Educational Research Association, New Orleans, LA.
Cohen, A. S., & Kim, S. H. (1992). Detecting calculator effects on item performance. Applied Measurement in Education, 5(4), 303-320.
Csikszentmihalyi, M. (1990). The domain of creativity. Theories of creativity, 4, 61-91. Deci, E. L., & Ryan, R. M. (1985). Self‐Determination. John Wiley & Sons, Inc. Desimone, L. M., Porter, A. C., Garet, M. S., Yoon, K. S., & Birman, B. F. (2002). Effects of professional
development on teachers’ instruction: Results from a three-year longitudinal study. Educational evaluation and policy analysis, 24(2), 81-112.
Desimone, L., Porter, A. C., Birman, B. F., Garet, M. S., & Yoon, K. S. (2002). How Do District Management and Implementation Strategies Relate to the Quality of the Professional Development That Districts Provide to Teachers? Teachers College Record, 104(7), 1265-1312.
Diener, E. (2000). Subjective well-being: The science of happiness and a proposal for a national index. American psychologist, 55(1), 34.
Dillon, S. (2006). Schools cut back subjects to push reading and math. New York Times, 1(1). DiPerna, J. C., & Elliott, S. N. (1999). Development and validation of the academic competence
evaluation scales. Journal of Psychoeducational Assessment, 17(3), 207-225. Eccles, J. S., & Wigfield, A. (2002). Motivational beliefs, values, and goals. Annual review of psychology,
53(1), 109-132. Ellington, A. J. (2003). A meta-analysis of the effects of calculators on students' achievement and
attitude levels in precollege mathematics classes. Journal for Research in Mathematics Education, 54(5), 433-463.
Eren, O., & Henderson, D. J. (2008). The impact of homework on student achievement. The Econometrics Journal, 11(2), 326-348.
Fejgin, N (1994). Participation in high school competitive sports: A subversion of school mission or contribution to academic Goals? Sociology of Sport Journal, 11(3), 211-230
Feshbach, N. D., & Feshbach, S. (1987). Affective processes and academic achievement. Child Development 58(5), 1335-1347.
Finn, J. D., Pannozzo, G. M., & Voelkl, K. E. (1995). Disruptive and inattentive-withdrawn behavior and achievement among fourth graders. The Elementary School Journal 95(5), 421-434.
Fredricks, J. A., & Eccles, J. S. (2006). Is extracurricular participation associated with beneficial outcomes? Concurrent and longitudinal relations. Developmental psychology, 42(4), 698.
Fredrickson, B. L. (2001). The role of positive emotions in positive psychology: The broaden-and-build theory of positive emotions. American psychologist, 56(3), 218.
Fuligni, A. J., & Stevenson, H. W. (1995). Time use and mathematics achievement among American, Chinese, and Japanese high school students. Child Development, 66(3), 830-842.
Gainsburg, J. (2008). Real-world connections in secondary mathematics teaching. Journal of Mathematics Teacher Education, 11(3), 199-219.
Greenwald, R., Hedges, V. L., & Laine, R. D. (1996). The effect of school resources on student achievement. Review of Educational Research, 66, 361-396
NAEP 2018-2019 OMB Clearance: Supporting Statement Part C 102NAEP 2018-2019 OMB Clearance: Supporting Statement Part C Page 102
Garet, M. S., Porter, A. C., Desimone, L., Birman, B. F., & Yoon, K. S. (2001). What makes professional development effective? Results from a national sample of teachers. American Educational Research Journal, 38(4), 915-945.
Graf, E. A., Bassok, M. I. R. I. A. M., Hunt, E. A. R. L., & Minstrell, J. (2004). A computer-based tutorial for algebraic representation: The effects of scaffolding on performance during the tutorial and on a transfer task. Technology Instruction Cognition and Learning, 2, 135-170.
Green, K. D., Forehand, R., Beck, S. J., & Vosk, B. (1980). An assessment of the relationship among measures of children's social competence and children's academic achievement. Child Development, 51(4), 1149-1156.
Guskey, T. R., & Yoon, K. S. (2009). What works in professional development? Phi delta kappan, 90(7), 495-500.
Hanson, S. L., & Kraus, R. S. (1998). Women, sports, and science: do female athletes have an advantage? Sociology of Education, 74(2), 93-110.
Hanson, S. L., & Kraus, R. S. (1999). Women in male domains: sport and science. Sociology of Sport Journal, 16(2), 92-110.
Heckman, J. J., Stixrud, J., & Urzua, S. (2006). The effects of cognitive and noncognitive abilities on labor market outcomes and social behavior (No. w12006). National Bureau of Economic Research.
Hill, H. C., Ball, D. L., & Schilling, S. G. (2008). Unpacking pedagogical content knowledge: Conceptualizing and measuring teachers' topic-specific knowledge of students. Journal for Research in Mathematics Education, 39(4), 372-400.
Hill, H. C., Rowan, B., & Ball, D. L. (2005). Effects of teachers’ mathematical knowledge for teaching on student achievement. American Educational Research Journal, 42(2), 371-406.
Hill, H. C., Schilling, S. G., & Ball, D. L. (2004). Developing measures of teachers’ mathematics knowledge for teaching. The Elementary School Journal, 105(1), 11-30.
Hoyles, C., Wolf, A., Molyneux-Hodgson, S., & Kent, P. (2002). Mathematical skills in the workplace. London: The Science, Technology and Mathematics Council. Retrieved from: http://www. ioe. ac. uk/tlrp/technomaths/skills2002.
Huang, D. (2001). An after-school evaluation system for middle and high school programs. Nassp Bulletin, 85(626), 45-61.
Huang, D., Gribbons, B., Kim, K. S., Lee, C., & Baker, E. L. (2000). A decade of results: The impact of the LA’s BEST after school enrichment initiative on subsequent student achievement and performance. Los Angeles: UCLA Center for the Study of Evaluation, Graduate School of Education and Information Studies.
Jang, H., Reeve, J., & Deci, E. L. (2010). Engaging students in learning activities: It is not autonomy support or structure but autonomy support and structure. Journal of Educational Psychology, 102(3), 588.
Johnson, L.J., Zorn, D., Williams, J., & Smith, J. (1999). (Eds.) School Year Program Evaluation: Urban School Initiative School Age Child Care Expansion. Cincinnati, OH: University of Cincinnati.
Kalenkoski, C. M., & Pabilonia, S. W. (2009). Does Working While in High School Reduce US Study Time? Social Indicators Research, 93(1), 117-121.
Kieran, C. (1992). The learning and teaching of school algebra. In D. Grouws (Ed.). Handbook of research on mathematics teaching and learning. (pp. 390-419). New York: Macmillan Publishing Company.
Kingston, N., & Nash, B. (2011). Formative assessment: A meta‐analysis and a call for research. Educational measurement: Issues and practice, 30(4), 28-37.
Koedinger, K. R., & Anderson, J. R. (1998). Illustrating principled design: The early evolution of a cognitive tutor for algebra symbolization. Interactive Learning Environments, 5(1), 161-179.
NAEP 2018-2019 OMB Clearance: Supporting Statement Part C Page 103
Lee, V. E., & Smith, J. B. (1993). Effects of school restructuring on the achievement and engagement of middle-grade students. Sociology of Education, 66(3)164-187.
Lee, L., & Wheeler, D. (1989). The arithmetic connection. Educational Studies in Mathematics, 20(1), 41-54.
Lindqvist, E. & Vestman, R. (2011). The labor market returns to cognitive and noncognitive ability: evidence from the Swedish Enlistment. American Economic Journal: Applied Economics 3, 101-128.
Loveless, T. (2013). 2013 Brown Center Report on American Education: How Well Are American Students Learning? (No. Vol. 3, No. 2). The Brookings Institution. Retrieved from http://www.brookings.edu/research/reports/2013/03/18-brown-center-report-loveles
Ma, L. (1999). Knowing and teaching elementary mathematics: Teachers’ understanding of fundamental mathematics in China and the United States. Mahwah, NJ: Erlbaum.
Mahoney, J. L., & Cairns, R. B. (1997). Do extracurricular activities protect against early school dropout? Developmental psychology, 33(2), 241-253.
Malecki, C. K., & Elliot, S. N. (2002). Children's social behaviors as predictors of academic achievement: A longitudinal analysis. School Psychology Quarterly, 17(1), 1-23.
Marsh, H. W., & Craven, R. G. (2006). Reciprocal effects of self-concept and performance from a multidimensional perspective: Beyond seductive pleasure and unidimensional perspectives. Perspectives on Psychological Science, 1(2), 133-163.
Marsh, H. W. (1992). Self-Description Questionnaire II: Manual. Macarthur, Australia: Publication Unit, Faculty of Education, University of Western Sydney.
McGatha, M. B., Bush, W. S., & Rakes, C. (2009). The effects of professional development in formative assessment on mathematics teaching performance and student achievement. Journal of MultiDisciplinary Evaluation, 6(12), 32-43.
McHale, S. M., Crouter, A. C., & Tucker, C. J. (2001). Free‐time activities in middle childhood: Links with adjustment in early adolescence. Child development, 72(6), 1764-1778.
McMullen, S. (2007). The impact of homework time on academic achievement. The University of North Carolina at Chapel Hill. Retrieved from: http://www. learndoearn. org/For-Educators adresinden
Miller, B. M. (2003). Critical Hours: Afterschool Programs and Educational Success. The Nellie Mae Education Foundation. Retrieved from http://www.nmefoundation.org/getmedia/08b6e87b-69ff-4865-b44e-ad42f2596381/Critical-Hours
Multon, K. D., Brown, S. D., & Lent, R. W. (1991). Relation of self-efficacy beliefs to academic outcomes: A meta-analytic investigation. Journal of counseling psychology, 38(1), 30-38.National Center on Educational Statistics (1995). Extracurricular participating and student Engagement. Retrieved from http://nces.ed.gov/pubs95/web/95741.asp
National Center on Educational Statistics (2011). Digest of education statistics 2010. Retrieved from http://nces.ed.gov/pubsearch/pubsinfo.asp?pubid=2011015
Neilson, W. (2005) Homework and performance for time-constrained students. Economics Bulletin, 9, 1-6
Organization for Economic Cooperation and Development. (2010). Improving health and social cohesion through education. Retrieved from http://www.oecd.org/edu/ceri/improvinghealthandsocialcohesionthrougheducation.htm
Ogle, T., Branch, M, Canada, B., Christmas, O., Clement, J., Fillion, J., Loudat, N. (2002).Technology in schools: Suggestions, tools and guidelines for assessing technology in elementary and secondary education, U.S. Department of Education.
NAEP 2018-2019 OMB Clearance: Supporting Statement Part C 104NAEP 2018-2019 OMB Clearance: Supporting Statement Part C Page 104
Pajares, F., & Schunk, D. (2001). The development of academic self-efficacy. , Development of achievement motivation. In A. Wigfield & J. Eccles (Eds.), Development of achievement motivation. San Diego: Academic Press.
Schunk, D. H., & Pajares, F. (2005). Competence perceptions and academic functioning. Handbook of competence and motivation, 85-104.
Pajares, F. (1996). Self-efficacy beliefs in academic settings. Review of educational research, 66(4), 543-578.
Pintrich, P. R., & De Groot, E. V. (1990). Motivational and self-regulated learning components of classroom academic performance. Journal of educational psychology, 82(1), 33.
Poropat, A. E. (2009). A meta-analysis of the five-factor model of personality and academic performance. Psychological bulletin, 135(2), 322.
Porterfield, S. L., & Winkler, A. E. (2007). Teen time use and parental education: Evidence from the CPS, MTF, and ATUS. Monthly Labor Revie, 130(5), 37-56.
Provasnik, S., Kastberg, D., Ferraro, D., Lemanski, N., Roey, S., & Jenkins, F. (2012). Highlights from TIMSS 2011: Mathematics and Science Achievement of US Fourth-and Eighth-Grade Students in an International Context. Retrieved from http://nces.ed.gov/pubsearch/pubsinfo.asp?pubid=2013009rev
Renninger, K.A. (2000) Individual interest and its implications for understanding intrinsic motivation. In C. Sansone and J.M. Harackiewicz(Eds.) Intrinsic motivation: Controversies and new directions (pp.372-404). San Diego, CA: Academic Press
Renninger, K. A. (2009). Interest and identity development in instruction: An inductive model. Educational Psychologist, 44(2), 1-14.
Renninger, K., Hidi, S. E., & Krapp, A. E. (1992). The role of interest in learning and development. Lawrence Erlbaum Associates, Inc.
Richardson, M., Abraham, C., & Bond, R. (2012). Psychological correlates of university students’ academic performance: A systematic review and meta-analysis. Psychological Bulletin, 138(2), 353–387.
Roberts, R. D., Schulze, R., & MacCann, C. (2007). Student 360TM: A valid medium for noncognitive assessment? Paper presented at the annual meeting of the American Educational Research Association and the National Council on Measurement in Education. Chicago, IL.
Rosnick, P., & Clement, J. (1980). Learning without understanding: The effect of tutoring strategies on algebra misconceptions. The Journal of Mathematical Behavior, 3(1), 3-27
Ryan, R. M., & Deci, E. L. (2003). On assimilating identities to the self: A self-determination theory perspective on internalization and integrity within cultures. Handbook of self and identity, 253-272.
Schiefele, U. (2001). The role of interest in motivation and learning. Intelligence and personality: Bridging the gap in theory and measurement. In J. M. Collis and S. Messick (Eds.), (pp. 163-194). Mawah: New Jersey. Lawrence Erlbaum Associates Inc.
Seligman, M. E., & Csikszentmihalyi, M. (2000). Positive psychology: an introduction. American psychologist, 55(1), 5-14.
Shanahan, M. J., & Flaherty, B. P. (2001). Dynamic patterns of time use in adolescence. Child Development, 72(2), 385-401.
Stecker, P. M., & Fuchs, L. S. (2000). Effecting superior achievement using curriculum-based measurement: The importance of individual progress monitoring. Learning Disabilities Research & Practice, 15(3), 128-134.
Stipek, D., & MacIver, D. (1989). Developmental change in children's assessment of intellectual competence. Child Development, 60(3), 521-538.
NAEP 2018-2019 OMB Clearance: Supporting Statement Part C 105NAEP 2018-2019 OMB Clearance: Supporting Statement Part C Page 105
Stipek, D., Salmon, J. M., Givvin, K. B., Kazemi, E., Saxe, G., & MacGyvers, V. L. (1998). The value (and convergence) of practices suggested by motivation research and promoted by mathematics education reformers. Journal for Research in Mathematics Education, 465-488.
Thomson, S., & Hillman, K. (2010). Against the odds; Influences on the post-school success of "low performers". Adelaide: National Centre for Vocational Education Research
Wentzel, K. R. (1993). Does being good make the grade? Social behavior and academic competence in middle school. Journal of Educational Psychology, 85(2), 357-364.
West, R. L., Berry, J. M., & Dennehy, D. (1987, August). Self-efficacy and memory performance: Measurement issues. In JM Berry & JC Cavanaugh (Chairs), Cognitive and memory self-efficacy in adults. Symposium conducted at the meeting of the American Psychological Association, New York.
Wollman, W. (1983). Determining the sources of error in a translation from sentence to equation. Journal for Research in Mathematics Education, 17(3) 169-181.
Xin, M & Lingling (2004). Modeling stability of growth between mathematics and science achievement during middle and high school. Evaluation Review, 28(2), 104-122
Zimmerman, B. J. (2000). Self-efficacy: An essential motive to learn. Contemporary educational psychology, 25(1), 82-91.
Zimmerman, B. J., Bandura, A., & Martinez-Pons, M. (1992). Self-motivation for academic attainment: The role of self-efficacy beliefs and personal goal setting. American educational research journal, 29(3), 663-676.
NAEP 2018-2019 OMB Clearance: Supporting Statement Part C 106NAEP 2018-2019 OMB Clearance: Supporting Statement Part C Page 106

Appendices
NAEP 2018-2019 OMB Clearance: Supporting Statement Part C Page 107
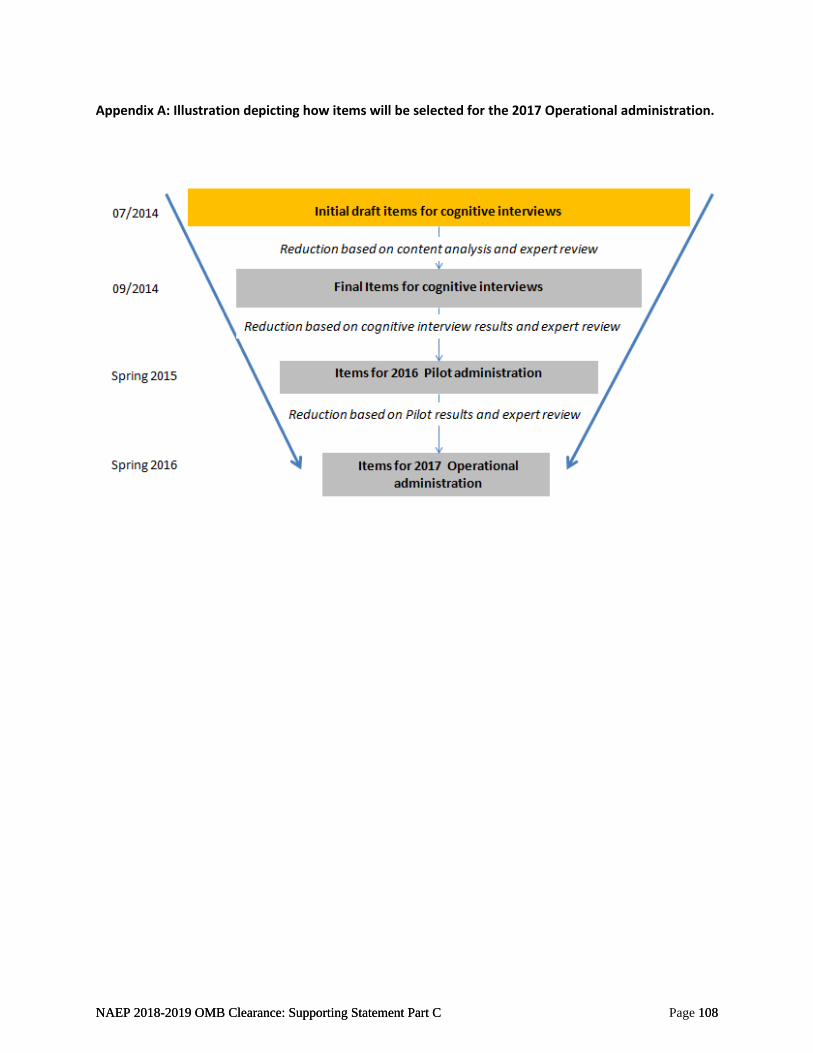
Appendix A: Illustration depicting how items will be selected for the 2017 Operational administration.
NAEP 2018-2019 OMB Clearance: Supporting Statement Part C 108NAEP 2018-2019 OMB Clearance: Supporting Statement Part C Page 108
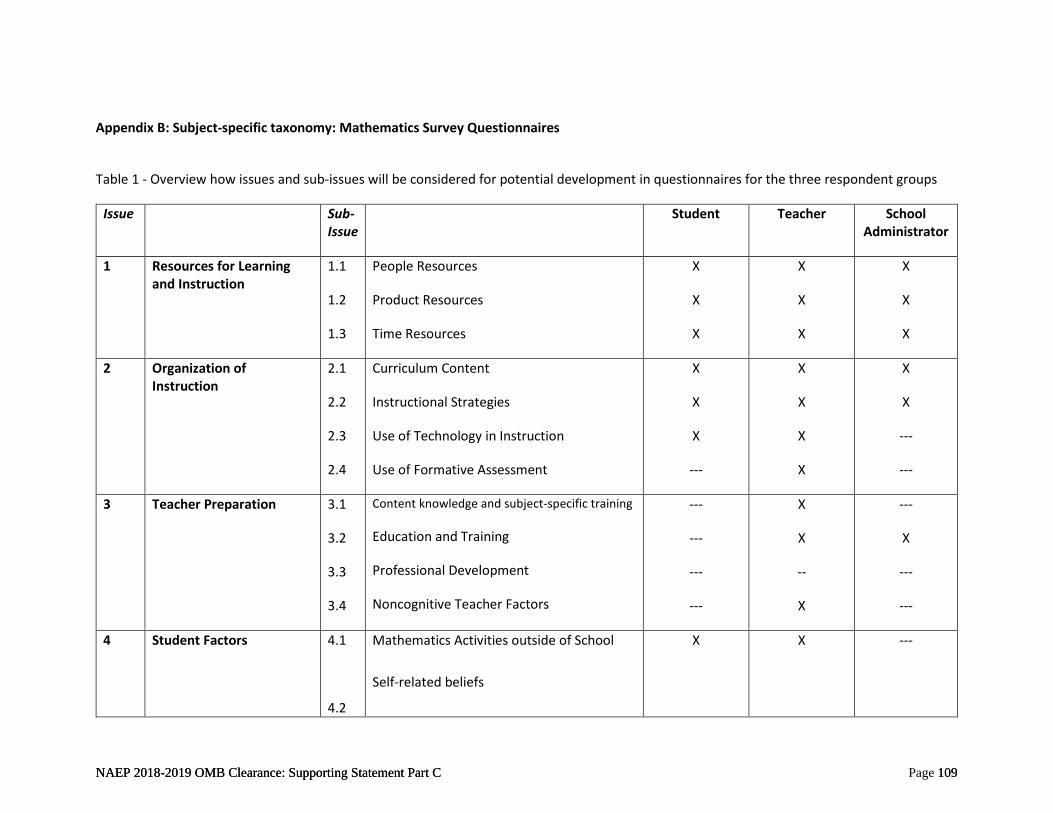
Appendix B: Subject-specific taxonomy: Mathematics Survey Questionnaires
Table 1 - Overview how issues and sub-issues will be considered for potential development in questionnaires for the three respondent groups
Issue Sub-Issue
Student Teacher School Administrator
1 Resources for Learning and Instruction
1.1
1.2
1.3
People Resources
Product Resources
Time Resources
X
X
X
X
X
X
X
X
X
2 Organization of Instruction
2.1
2.2
2.3
2.4
Curriculum Content
Instructional Strategies
Use of Technology in Instruction
Use of Formative Assessment
X
X
X
---
X
X
X
X
X
X
---
---
3 Teacher Preparation 3.1
3.2
3.3
3.4
Content knowledge and subject-specific training
Education and Training
Professional Development
Noncognitive Teacher Factors
---
---
---
---
X
X
--
X
---
X
---
---
4 Student Factors 4.1
4.2
Mathematics Activities outside of School
Self-related beliefs
X X ---
NAEP 2018-2019 OMB Clearance: Supporting Statement Part C 109NAEP 2018-2019 OMB Clearance: Supporting Statement Part C Page 109
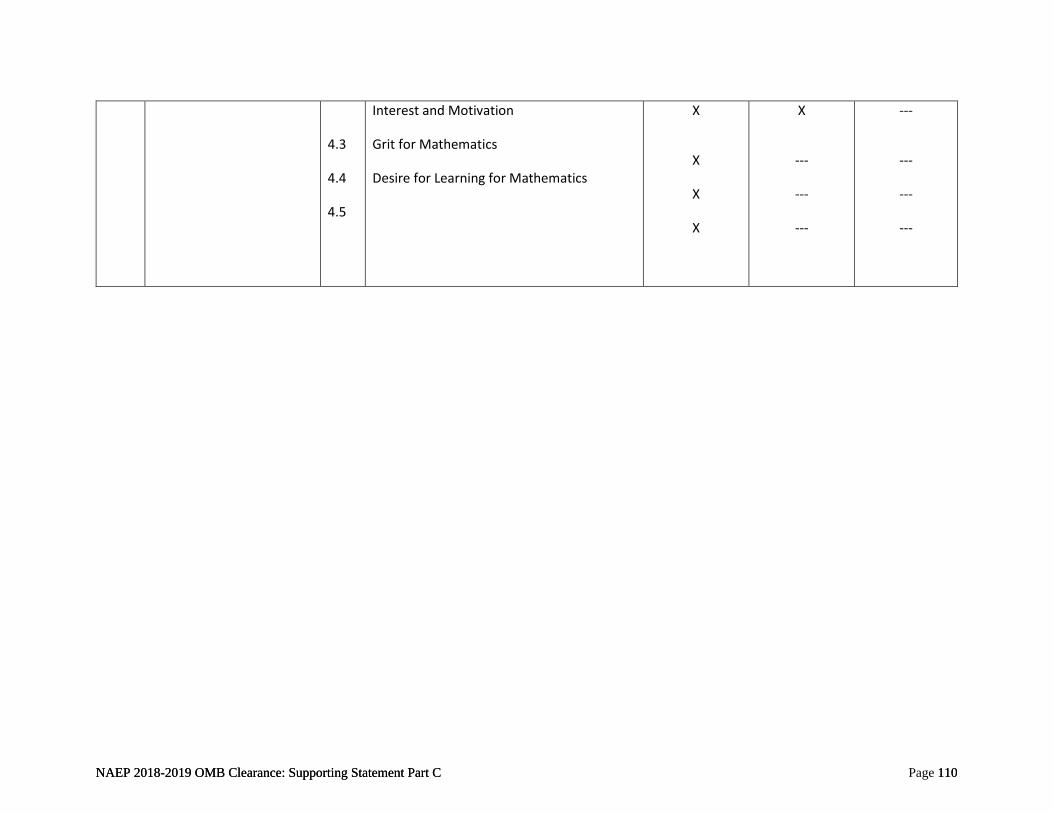
4.3
4.4
4.5
Interest and Motivation
Grit for Mathematics
Desire for Learning for Mathematics
X
X
X
X
X
---
---
---
---
---
---
---
NAEP 2018-2019 OMB Clearance: Supporting Statement Part C 110NAEP 2018-2019 OMB Clearance: Supporting Statement Part C Page 110
Part C-4: 2016 Science Issues Paper
NAEP 2018-2019 OMB Clearance: Supporting Statement Part C Page 111
KEY CONTEXTUAL FACTORS FOR SCIENCE ACHIEVEMENT
Science “Issues Paper”
Jared Anthony, Farah Qureshi, Stephen Horvath, & Jonas P. Bertling Educational Testing Service
Written in Preparation for New Item Development for the 2019 Digitally-Based NAEP Science Survey Questionnaires, June 2016
NAEP 2018-2019 OMB Clearance: Supporting Statement Part C Page 112
Executive Summary
This paper presents an overview of key contextual factors for science achievement. It builds on content provided in the previous 2009 Issues Paper to provide a basis for the development of NAEP Science Survey Questionnaires for the 2019 digitally based science assessment. Four “issues” (i.e., broad topics) are described in this issues paper. Throughout these issues, the role of digital technology for learning and instruction is highlighted as an overarching theme. Issues capture both opportunity-to-learn factors (e.g., digital technology use, resources for learning, out-of-school learning) and noncognitive student factors relevant to science achievement (e.g., self-efficacy, interest, grit, achievement goals). For each issue, key areas for potential development are highlighted, thereby creating a starting point for the definition of modules and/or clusters of survey questions that can provide a basis for aggregating questions into indices.
Issue 1: Resources for Learning and Instruction Issue 1 captures the extent to which resources for learning and instruction—People, Products, and Time—are available to students, teachers, and schools. Areas for potential new development include the availability and use of digital technology for engagement in science-related activities in and outside of school, and a better quantification of the time available for learning and instruction.
Issue 2: Organization of Instruction Issue 2 comprises how instruction in school is organized, and how digital technology is incorporated into instruction. Areas for potential new development include course content and/or a differential learning emphasis on conceptual understanding; scientific literacy and inquiry, whether there is a development of a school-wide science curriculum and the extent to which new standards for science instruction are incorporated; tracking and ability grouping; use of digital technology to explore and deepen understanding of scientific concepts; and use of formative assessments.
Issue 3: Teacher Preparation Issue 3 captures how well teachers are prepared for teaching science, what teachers’ professional development opportunities are, and to what extent teachers make use of these opportunities. An important area for new development is teachers’ preparedness to use digital technology in their science instruction in purposeful ways. Inclusion of questions that explore the format of professional development programs, the skills taught within these programs, and the value and applicability of these programs in the classroom could be beneficial as well.
Issue 4: Student Factors in Science Issue 4 addresses social, motivational, and self-regulatory student factors capturing engagement with science. Future item development will explore capturing more behavioral and attitudinal facets of engagement (e.g., interest, motivation, and self-related beliefs) given that engagement is a significant predictor of academic achievement. Areas for potential new development may include participation in outside-of-school activities; science-related interest and motivation; self-related beliefs pertaining to science learning; and digital technology-based activities and engagement. Development will be aimed at capturing factors that are consistent with other subjects and have been shown to be key predictors for student achievement.
NAEP 2018-2019 OMB Clearance: Supporting Statement Part C Page 113
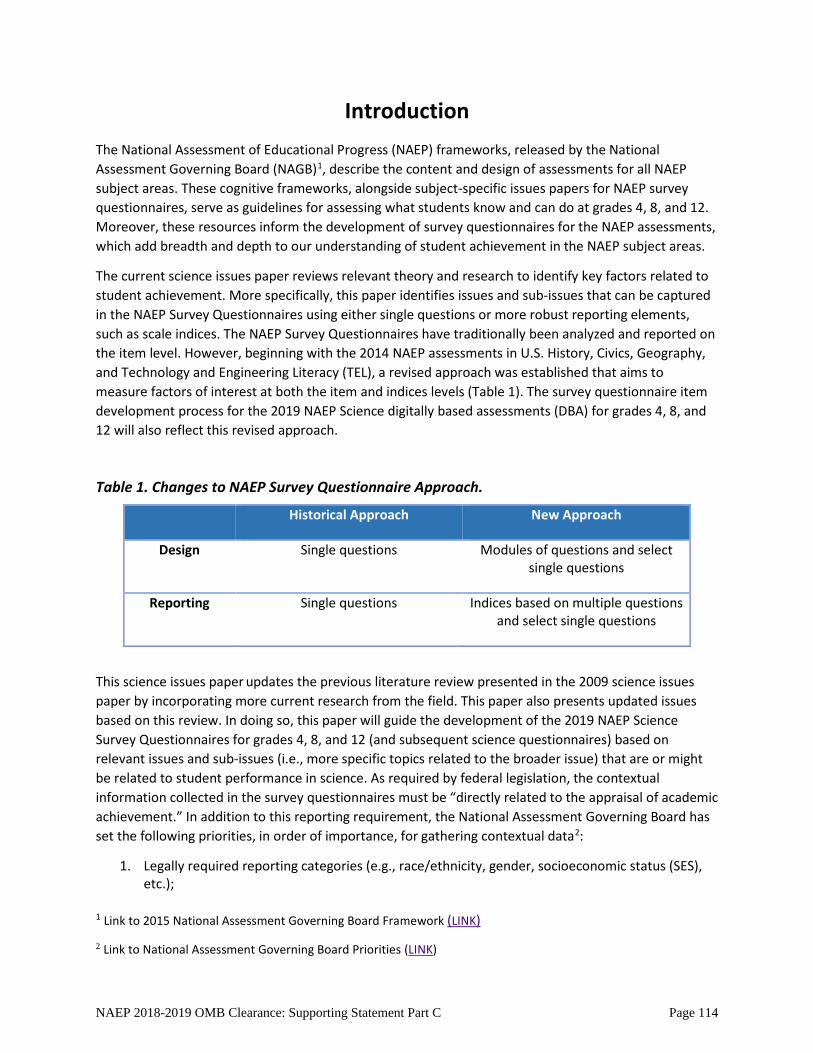
Introduction The National Assessment of Educational Progress (NAEP) frameworks, released by the National Assessment Governing Board (NAGB)1, describe the content and design of assessments for all NAEP subject areas. These cognitive frameworks, alongside subject-specific issues papers for NAEP survey questionnaires, serve as guidelines for assessing what students know and can do at grades 4, 8, and 12. Moreover, these resources inform the development of survey questionnaires for the NAEP assessments, which add breadth and depth to our understanding of student achievement in the NAEP subject areas.
The current science issues paper reviews relevant theory and research to identify key factors related to student achievement. More specifically, this paper identifies issues and sub-issues that can be captured in the NAEP Survey Questionnaires using either single questions or more robust reporting elements, such as scale indices. The NAEP Survey Questionnaires have traditionally been analyzed and reported on the item level. However, beginning with the 2014 NAEP assessments in U.S. History, Civics, Geography, and Technology and Engineering Literacy (TEL), a revised approach was established that aims to measure factors of interest at both the item and indices levels (Table 1). The survey questionnaire item development process for the 2019 NAEP Science digitally based assessments (DBA) for grades 4, 8, and 12 will also reflect this revised approach.
Table 1. Changes to NAEP Survey Questionnaire Approach.
Historical Approach New Approach
Design Single questions Modules of questions and select single questions
Reporting Single questions Indices based on multiple questions and select single questions
This science issues paper updates the previous literature review presented in the 2009 science issues paper by incorporating more current research from the field. This paper also presents updated issues based on this review. In doing so, this paper will guide the development of the 2019 NAEP Science Survey Questionnaires for grades 4, 8, and 12 (and subsequent science questionnaires) based on relevant issues and sub-issues (i.e., more specific topics related to the broader issue) that are or might be related to student performance in science. As required by federal legislation, the contextual information collected in the survey questionnaires must be “directly related to the appraisal of academic achievement.” In addition to this reporting requirement, the National Assessment Governing Board has set the following priorities, in order of importance, for gathering contextual data2:
1. Legally required reporting categories (e.g., race/ethnicity, gender, socioeconomic status (SES),etc.);
1 Link to 2015 National Assessment Governing Board Framework (LINK)
2 Link to National Assessment Governing Board Priorities (LINK)
NAEP 2018-2019 OMB Clearance: Supporting Statement Part C Page 114
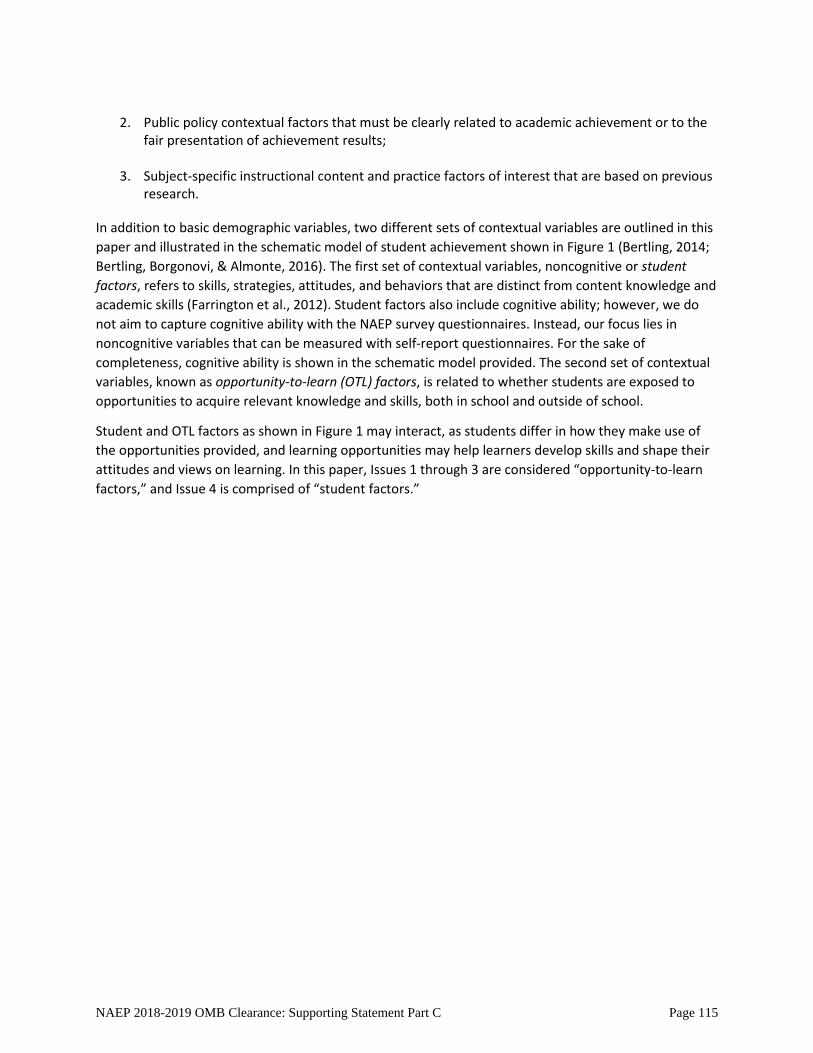
2. Public policy contextual factors that must be clearly related to academic achievement or to thefair presentation of achievement results;
3. Subject-specific instructional content and practice factors of interest that are based on previousresearch.
In addition to basic demographic variables, two different sets of contextual variables are outlined in this paper and illustrated in the schematic model of student achievement shown in Figure 1 (Bertling, 2014; Bertling, Borgonovi, & Almonte, 2016). The first set of contextual variables, noncognitive or student factors, refers to skills, strategies, attitudes, and behaviors that are distinct from content knowledge and academic skills (Farrington et al., 2012). Student factors also include cognitive ability; however, we do not aim to capture cognitive ability with the NAEP survey questionnaires. Instead, our focus lies in noncognitive variables that can be measured with self-report questionnaires. For the sake of completeness, cognitive ability is shown in the schematic model provided. The second set of contextual variables, known as opportunity-to-learn (OTL) factors, is related to whether students are exposed to opportunities to acquire relevant knowledge and skills, both in school and outside of school.
Student and OTL factors as shown in Figure 1 may interact, as students differ in how they make use of the opportunities provided, and learning opportunities may help learners develop skills and shape their attitudes and views on learning. In this paper, Issues 1 through 3 are considered “opportunity-to-learn factors,” and Issue 4 is comprised of “student factors.”
NAEP 2018-2019 OMB Clearance: Supporting Statement Part C Page 115
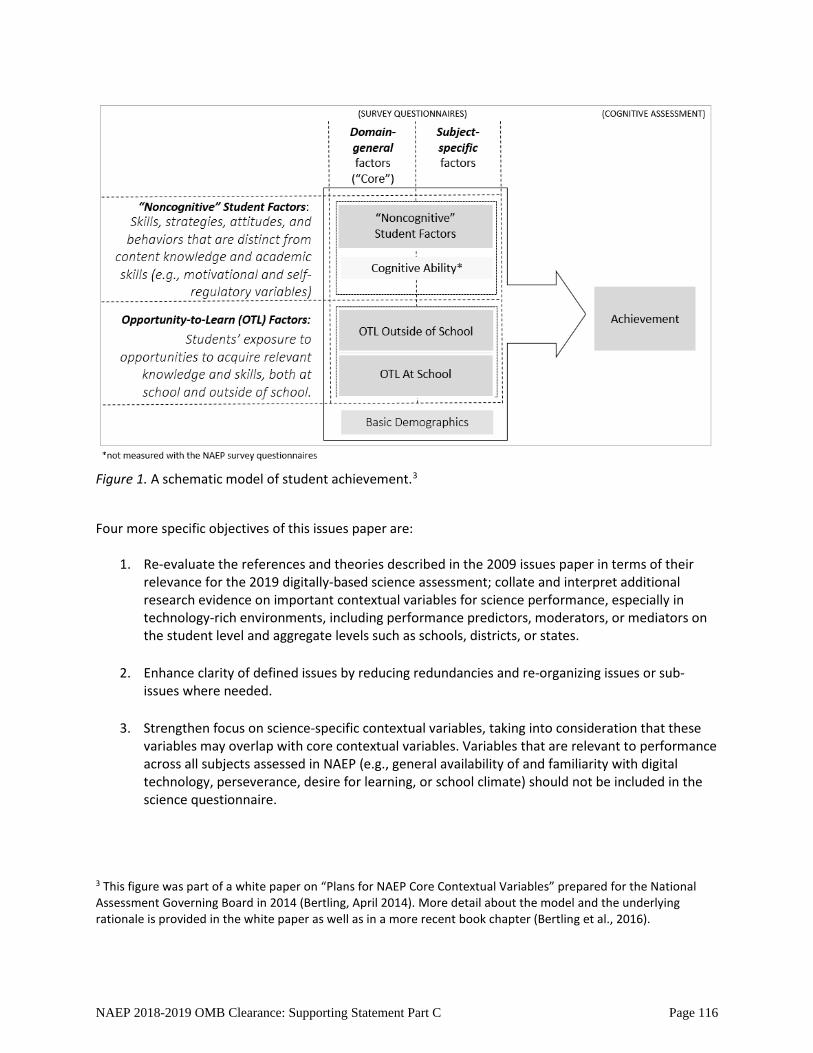
Figure 1. A schematic model of student achievement.3
Four more specific objectives of this issues paper are:
1. Re-evaluate the references and theories described in the 2009 issues paper in terms of their relevance for the 2019 digitally-based science assessment; collate and interpret additional research evidence on important contextual variables for science performance, especially in technology-rich environments, including performance predictors, moderators, or mediators on the student level and aggregate levels such as schools, districts, or states.
2. Enhance clarity of defined issues by reducing redundancies and re-organizing issues or sub-issues where needed.
3. Strengthen focus on science-specific contextual variables, taking into consideration that thesevariables may overlap with core contextual variables. Variables that are relevant to performanceacross all subjects assessed in NAEP (e.g., general availability of and familiarity with digitaltechnology, perseverance, desire for learning, or school climate) should not be included in thescience questionnaire.
3 This figure was part of a white paper on “Plans for NAEP Core Contextual Variables” prepared for the National Assessment Governing Board in 2014 (Bertling, April 2014). More detail about the model and the underlying rationale is provided in the white paper as well as in a more recent book chapter (Bertling et al., 2016).
NAEP 2018-2019 OMB Clearance: Supporting Statement Part C Page 116
4. Provide high-level implementation recommendations for each issue by emphasizing key areasfor new item development, thereby creating a starting point for the definition of modules ofsurvey questions that can provide a basis for scale indices.
Four issues with a total of 18 sub-issues that reflect key contextual variables for science achievement are presented in this revised paper.
The main criteria for selecting constructs and topics were the following:
a) Factors captured in each issue should have a clear relationship with student achievement.Student factors with no clear or low correlations with achievement based on the publishedresearch are discarded from inclusion. This criterion directly refers to the NAEP statute. Topicswith a strong research foundation based on several studies (ideally, meta-analyses) andestablished theoretical models will be favored over topics with less research evidence regardingthe relationship with achievement or issues with a less established theoretical foundation.
b) Factors captured in each construct should be malleable and actionable in terms of possibleinterventions in and outside the classroom.
c) Factors should be amenable for measurement with survey questionnaires. Factors such as socialskills or learning strategies might require other assessment strategies to provide meaningful andreliable measures.
d) Factors suggested for inclusion in Science Survey Questionnaires should focus on those studentsand OTL factors that are domain-specific, meaning they are specific to science achievement.
New items will be developed for potential inclusion in the 2019 Science questionnaires using this issues paper as a guideline, and will be tested in cognitive interviews in fall 2016 (See Appendices B and C). After the cognitive interviews have been conducted, the data will be reviewed to help inform which items should be administered in the 2018 pilot. The items will be reviewed once more after the 2017 pilot to inform which items will be administered in the 2019 operational assessment.
NAEP 2018-2019 OMB Clearance: Supporting Statement Part C Page 117
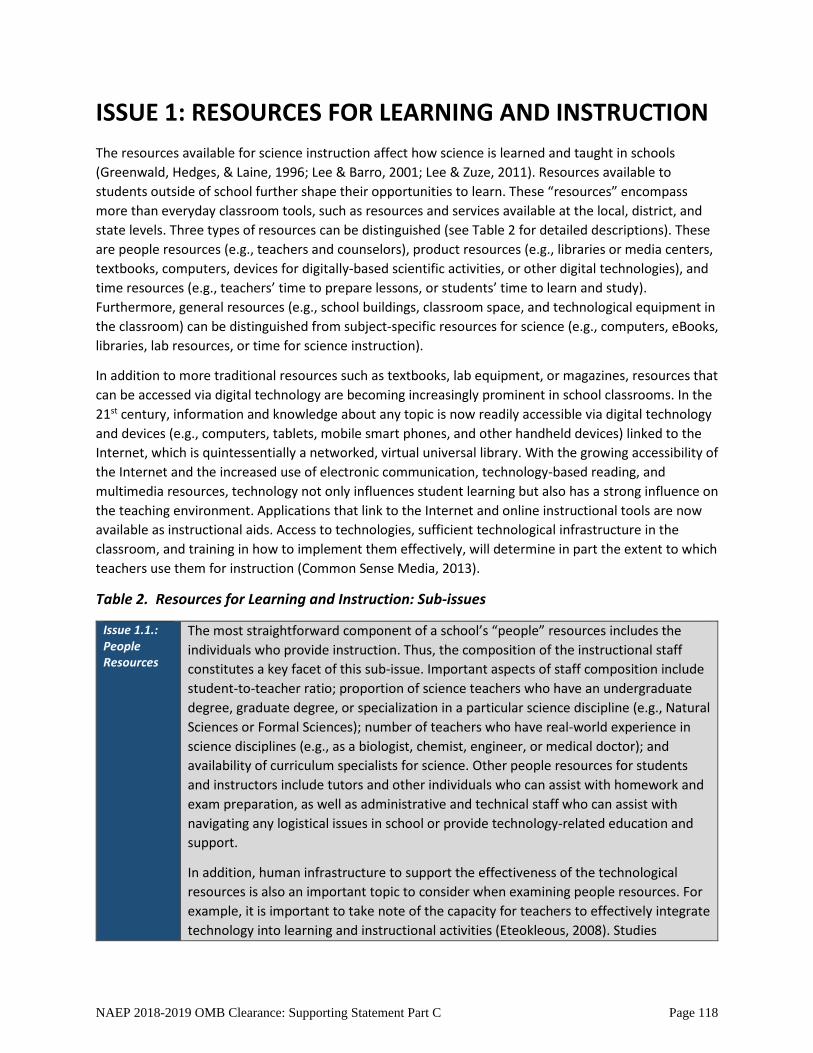
ISSUE 1: RESOURCES FOR LEARNING AND INSTRUCTION The resources available for science instruction affect how science is learned and taught in schools (Greenwald, Hedges, & Laine, 1996; Lee & Barro, 2001; Lee & Zuze, 2011). Resources available to students outside of school further shape their opportunities to learn. These “resources” encompass more than everyday classroom tools, such as resources and services available at the local, district, and state levels. Three types of resources can be distinguished (see Table 2 for detailed descriptions). These are people resources (e.g., teachers and counselors), product resources (e.g., libraries or media centers, textbooks, computers, devices for digitally-based scientific activities, or other digital technologies), and time resources (e.g., teachers’ time to prepare lessons, or students’ time to learn and study). Furthermore, general resources (e.g., school buildings, classroom space, and technological equipment in the classroom) can be distinguished from subject-specific resources for science (e.g., computers, eBooks, libraries, lab resources, or time for science instruction).
In addition to more traditional resources such as textbooks, lab equipment, or magazines, resources that can be accessed via digital technology are becoming increasingly prominent in school classrooms. In the 21st century, information and knowledge about any topic is now readily accessible via digital technology and devices (e.g., computers, tablets, mobile smart phones, and other handheld devices) linked to the Internet, which is quintessentially a networked, virtual universal library. With the growing accessibility of the Internet and the increased use of electronic communication, technology-based reading, and multimedia resources, technology not only influences student learning but also has a strong influence on the teaching environment. Applications that link to the Internet and online instructional tools are now available as instructional aids. Access to technologies, sufficient technological infrastructure in the classroom, and training in how to implement them effectively, will determine in part the extent to which teachers use them for instruction (Common Sense Media, 2013).
Table 2. Resources for Learning and Instruction: Sub-issues
Issue 1.1.: People Resources
The most straightforward component of a school’s “people” resources includes the individuals who provide instruction. Thus, the composition of the instructional staff constitutes a key facet of this sub-issue. Important aspects of staff composition include student-to-teacher ratio; proportion of science teachers who have an undergraduate degree, graduate degree, or specialization in a particular science discipline (e.g., Natural Sciences or Formal Sciences); number of teachers who have real-world experience in science disciplines (e.g., as a biologist, chemist, engineer, or medical doctor); and availability of curriculum specialists for science. Other people resources for students and instructors include tutors and other individuals who can assist with homework and exam preparation, as well as administrative and technical staff who can assist with navigating any logistical issues in school or provide technology-related education and support.
In addition, human infrastructure to support the effectiveness of the technological resources is also an important topic to consider when examining people resources. For example, it is important to take note of the capacity for teachers to effectively integrate technology into learning and instructional activities (Eteokleous, 2008). Studies
NAEP 2018-2019 OMB Clearance: Supporting Statement Part C Page 118
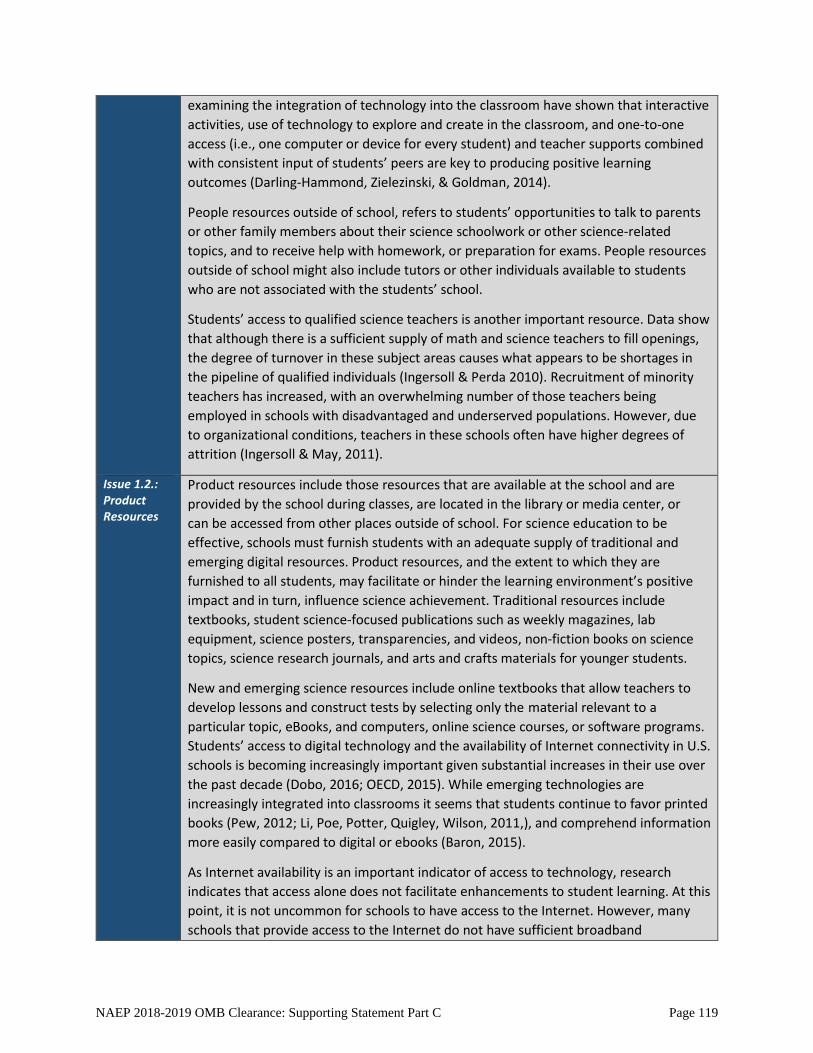
examining the integration of technology into the classroom have shown that interactive activities, use of technology to explore and create in the classroom, and one-to-one access (i.e., one computer or device for every student) and teacher supports combined with consistent input of students’ peers are key to producing positive learning outcomes (Darling-Hammond, Zielezinski, & Goldman, 2014).
People resources outside of school, refers to students’ opportunities to talk to parents or other family members about their science schoolwork or other science-related topics, and to receive help with homework, or preparation for exams. People resources outside of school might also include tutors or other individuals available to students who are not associated with the students’ school.
Students’ access to qualified science teachers is another important resource. Data show that although there is a sufficient supply of math and science teachers to fill openings, the degree of turnover in these subject areas causes what appears to be shortages in the pipeline of qualified individuals (Ingersoll & Perda 2010). Recruitment of minority teachers has increased, with an overwhelming number of those teachers being employed in schools with disadvantaged and underserved populations. However, due to organizational conditions, teachers in these schools often have higher degrees of attrition (Ingersoll & May, 2011).
Issue 1.2.: Product Resources
Product resources include those resources that are available at the school and are provided by the school during classes, are located in the library or media center, or can be accessed from other places outside of school. For science education to be effective, schools must furnish students with an adequate supply of traditional and emerging digital resources. Product resources, and the extent to which they are furnished to all students, may facilitate or hinder the learning environment’s positive impact and in turn, influence science achievement. Traditional resources include textbooks, student science-focused publications such as weekly magazines, lab equipment, science posters, transparencies, and videos, non-fiction books on science topics, science research journals, and arts and crafts materials for younger students.
New and emerging science resources include online textbooks that allow teachers to develop lessons and construct tests by selecting only the material relevant to a particular topic, eBooks, and computers, online science courses, or software programs. Students’ access to digital technology and the availability of Internet connectivity in U.S. schools is becoming increasingly important given substantial increases in their use over the past decade (Dobo, 2016; OECD, 2015). While emerging technologies are increasingly integrated into classrooms it seems that students continue to favor printed books (Pew, 2012; Li, Poe, Potter, Quigley, Wilson, 2011,), and comprehend information more easily compared to digital or ebooks (Baron, 2015).
As Internet availability is an important indicator of access to technology, research indicates that access alone does not facilitate enhancements to student learning. At this point, it is not uncommon for schools to have access to the Internet. However, many schools that provide access to the Internet do not have sufficient broadband
NAEP 2018-2019 OMB Clearance: Supporting Statement Part C Page 119
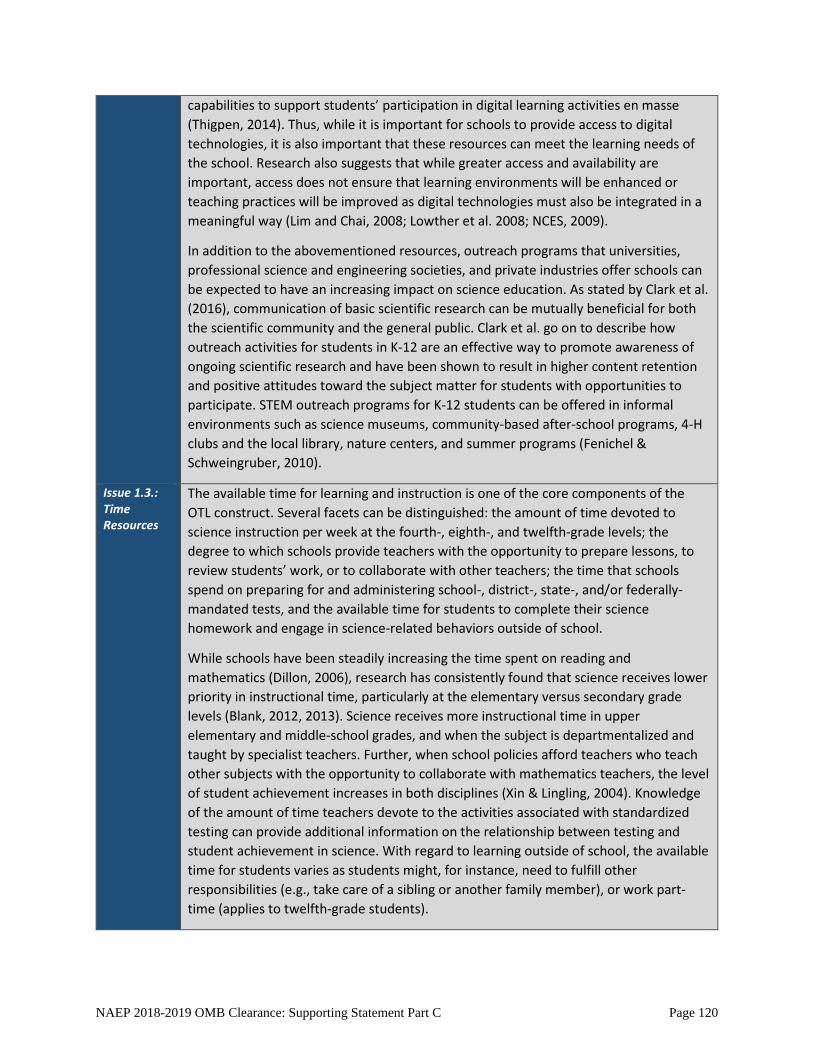
capabilities to support students’ participation in digital learning activities en masse (Thigpen, 2014). Thus, while it is important for schools to provide access to digital technologies, it is also important that these resources can meet the learning needs of the school. Research also suggests that while greater access and availability are important, access does not ensure that learning environments will be enhanced or teaching practices will be improved as digital technologies must also be integrated in a meaningful way (Lim and Chai, 2008; Lowther et al. 2008; NCES, 2009).
In addition to the abovementioned resources, outreach programs that universities, professional science and engineering societies, and private industries offer schools can be expected to have an increasing impact on science education. As stated by Clark et al. (2016), communication of basic scientific research can be mutually beneficial for both the scientific community and the general public. Clark et al. go on to describe how outreach activities for students in K-12 are an effective way to promote awareness of ongoing scientific research and have been shown to result in higher content retention and positive attitudes toward the subject matter for students with opportunities to participate. STEM outreach programs for K-12 students can be offered in informal environments such as science museums, community-based after-school programs, 4-H clubs and the local library, nature centers, and summer programs (Fenichel & Schweingruber, 2010).
Issue 1.3.: Time Resources
The available time for learning and instruction is one of the core components of the OTL construct. Several facets can be distinguished: the amount of time devoted to science instruction per week at the fourth-, eighth-, and twelfth-grade levels; the degree to which schools provide teachers with the opportunity to prepare lessons, to review students’ work, or to collaborate with other teachers; the time that schools spend on preparing for and administering school-, district-, state-, and/or federally-mandated tests, and the available time for students to complete their science homework and engage in science-related behaviors outside of school.
While schools have been steadily increasing the time spent on reading and mathematics (Dillon, 2006), research has consistently found that science receives lower priority in instructional time, particularly at the elementary versus secondary grade levels (Blank, 2012, 2013). Science receives more instructional time in upper elementary and middle-school grades, and when the subject is departmentalized and taught by specialist teachers. Further, when school policies afford teachers who teach other subjects with the opportunity to collaborate with mathematics teachers, the level of student achievement increases in both disciplines (Xin & Lingling, 2004). Knowledge of the amount of time teachers devote to the activities associated with standardized testing can provide additional information on the relationship between testing and student achievement in science. With regard to learning outside of school, the available time for students varies as students might, for instance, need to fulfill other responsibilities (e.g., take care of a sibling or another family member), or work part-time (applies to twelfth-grade students).
NAEP 2018-2019 OMB Clearance: Supporting Statement Part C Page 120
ISSUE 2: ORGANIZATION OF INSTRUCTION
Current literature shows that students’ opportunities to learn are influenced in part by how instruction is organized (Ancess, 2000). Issue 2 consists of three related sub-issues: the content of the science curriculum; the instructional strategies applied by the teacher, including the integration of technological resources for instruction and students assignments; and the role of assessments in the classroom. These sub-issues are described in Table 3.
Table 3. Organization of Instruction: Sub-issues
Issue 2.1.: Curriculum Content
A school’s science curriculum can be understood by examining the required science courses, the optional science courses, and the students’ course histories in science. This understanding is strengthened by viewing the data in conjunction with information about achievement grouping and tracking. Different tracks may offer altogether different courses or they may offer same-subject courses that differ in content and rigor.
Curriculum content also considers the delivery of course content and the difference in the amount of content being delivered (e.g., more time spent on life sciences when compared to physical sciences). Further, delivery of course content also refers to teaching practices and the extent to which emphasis is placed on conceptual (e.g., traditional sciences, scientific methodology, and rote memorization learning) versus procedural understanding (e.g., science practice and inquiry).
Additionally, successful curriculum can be understood by its ability to integrate foundational concepts and shared ideas across each of the disciplinary areas (e.g., physical sciences, life sciences, earth and space sciences) (NAGB, 2015; NGSS, 2013; NRC, 2012; Stage, Asturias, Cheuk, Daro, & Hampton, 2013). When considering scientific practices, emphasis can also be placed on individual practices that are widely held in the field as being successful for science instruction. These practices can be related directly to scientific inquiry and include students’ ability to ask questions and define problems, gather evidence and data and support their conclusions, create and initiate investigations, and evaluate and communicate information gathered Bybee, 2013; Stage et al., 2013). An additional concern may be whether there is a school-wide curriculum for science in place and, if so, how it is developed, updated, and whether it adheres to any content standards. Understanding how the science curriculum functions requires an understanding of how it is organized and how students are able to use it. This, in turn, depends on understanding schools’ policies on tracking and achievement grouping, when students begin to receive instruction in different science topics, and what specific courses are offered to and taken by students.
NAEP 2018-2019 OMB Clearance: Supporting Statement Part C Page 121
Curriculum content also encompasses how the science curriculum is integrated into the curricula of other subjects. With respect to this concern, educators and state standards increasingly emphasize that isolating virtually any curriculum is a disservice to both the student and the subject. Consistent with this philosophy, Frykholm & Meyer (2002) highlight the importance of integrating the science curricula into other subjects, as do Schmidt, Wang, and McKnight (2005). Moreover, Schmidt et al. (2005) base their recommendation on TIMSS data that showed a relationship between the inclusion of science curricula within other subjects and achievement scores for students in eighth grade. Further, Gayford (2002) and Lang, Drake, and Olson (2006) argue for integrating real-world problems, such as global climate change, into the science curriculum, to foster the development of citizens who can make informed decisions.
Issue 2.2.: Instructional Strategies
While instructional methods interact strongly with curriculum, scholars suggest that scientific literacy is an underlying component of many instructional strategies. Scientific literacy can be understood as students’ understanding of the nature of science and scientific practice (Lederman, Lederman, and Frank, 2013; NAP, 2015; NRC, 2012). One of the primary strategies that emphasizes scientific literacy is the integration of scientific inquiry (SI) and exploration. SI and exploration involve collecting relevant data, logical reasoning, and the use of one’s imagination and information gathered to develop hypotheses and explain patterns in data (NAGB, 2015). Scientific inquiry also emphasizes scientific practices that include modeling, critical thinking, developing explanations, and argumentation with the intention of helping students gain insight into how scientific knowledge is gained. Meta-analysis by Minor et al. (2012) report a positive trend for instructional practices that involve students who actively think through investigations and draw conclusions from data. In their study, the authors’ found evidence for the importance of engaging students through more active learning processes. Further, more active learning process were shown to increase student conceptual understanding of scientific concepts when compared to more passive techniques. Specific approaches include learning through student engagement that provides opportunities for students to actively create, interpret, reorganize, and synthesize knowledge (Gordan, 2008). More specifically, classroom practices should provide students with opportunities to engage in scientifically oriented questions, prioritize evidence when responding to questions, formulate explanations from evidence gathered, connect explanations to scientific knowledge, and communicate and justify explanations (NRC, 2000).
An additional strategy for learning and scientific literacy acquisition includes providing students with out-of-class learning experiences, such as field trips to museums, participation in school-sponsored science projects, and visits to or participation in science fairs. Finally, encouraging students to relate their own
NAEP 2018-2019 OMB Clearance: Supporting Statement Part C Page 122
experiences to the science material under consideration also enhances learning (Upadhyay, 2006).
While digital technologies, such as desktop and laptop computers, tablets, other mobile devices, software, and Internet tools, are growing in their instruction and the engagement of student learning, information and communication technology continue to play a significant role in science achievement. In the context of science education, digital technology for instruction encompasses an ever-increasing array of online digital tools through which learners seek information and manipulate data (Webb, 2005). Digitally-enabled environments facilitate four significant aspects of science learning: (1) increasing the rate of student learning, (2) allowing students to explore experiences and apply science to the real world, (3) fostering student self-management, and (4) enhancing students’ ability to gather and disseminate data (Webb, 2005). Learning technologies such as these have also been promoted as a way to ensure equity and foster knowledge among students with differing abilities and/or learning styles (Hug, Krajcik, & Marx, 2005).
Issue 2.3.: Use of Assessments
Organization of Instruction also includes the use of assessments. Use of assessments continues to be a pressing topic as the more information educators have about student progress, learning, and knowledge, the more educators are provided with guidance about classroom instruction and curriculum outcomes. When considering assessments in the classroom, it is important to strive for a balance between summative and formative assessments. Summative assessments can be used by teachers upon completion of a segment of instruction, such as at the end of a unit, semester, or school year, to measure student achievement at the course level, for purposes of informing decisions about grades and performance categories (Cizek, 2010). Summative assessments can take the form of a state, district, or classroom assessment, with results being used to determine program effectiveness or final grades (Chappuis, 2010). They can also support learning through the process of studying and preparation (Bennett, 2011), and enable greater retention of the material (Rohrer and Pashler, 2010).
By contrast, formative assessment is a process used by teachers and students during instruction that provides feedback to adjust ongoing teaching and learning to improve students' achievement of intended instructional outcomes (CCSSO, 2008b). Formative assessments also refer to the combination of using a process and a testing instrument (Bennett, 2011), and are useful in providing timely feedback to teachers and students on how to develop and enhance their understanding of the task. Research has shown that formative assessments can have a particularly positive impact on the achievement of low-performing students (Treffinger, 2008). Additionally, The formative assessment process includes clearly defining the learning intentions and criteria for success, designing classroom tasks that provide evidence of learning, providing feedback
NAEP 2018-2019 OMB Clearance: Supporting Statement Part C Page 123
that will allow the learner to advance, and mobilizing learners to be an instructional resource for their peers and to take ownership of their learning (Black & Wiliam, 2009). Research suggests that teachers’ incorporation of student self-assessments (tasks used to evaluate one’s performance and identify strengths and weaknesses for the purpose of improving learning outcomes) into their instructional design is also beneficial to student achievement (Andrade & Boulay, 2003). The positive effects of self-assessment on achievement, particularly when used for formative rather than summative purposes, are reported across a range of academic subjects (Ross, et al., 2002a, 2002b).
ISSUE 3: TEACHER PREPARATION Because of its profound impact on student achievement, teacher preparation continues to be a crucial issue for all the subjects that NAEP assesses. Teacher preparation can be grouped into three sub-issues: education and training, pedagogical knowledge, and professional development. Evidence suggests that to become effective educators, teacher preparation may include the extent to which teachers have an educational foundation that includes college-level study of the science discipline; understanding of essential objectives for student science learning; knowledge of the way students develop science proficiency; and grasp of various instructional approaches used to develop students’ learning of content, intellectual conventions, and other practices that are important in gaining science proficiency (NRC, 2012).
Table 4. Teacher Preparation: Sub-issues
Issue 3.1.: Content Knowledge and Subject-specific Training
Education and training refer to teachers’ academic preparation, both in their chosen science discipline and science related instruction. Research indicates that the most salient prerequisite to teaching science effectively is the teacher’s own command of science content (Rice, 2005; Vlaardingerbroek & Taylor, 2003). In fact, science proficiency is so crucial to teachers’ pedagogical success—even for non-science majors teaching at the elementary-school level—that educational institutions design specific courses to improve the science literacy of prospective elementary- and middle-school science teachers (Akerson, Morrison, & McDuffle, 2006; Haefner, Fredrichsen, & Zembal-Saul, 2006; Potter & Meisels, 2005).
Complementary to academic preparation is teacher awareness of current best practices in the field and knowledge of currently held beliefs about how proficiency in science can be acquired. Science proficiency can be conceptualized into three parts that include scientific practices, concepts that
NAEP 2018-2019 OMB Clearance: Supporting Statement Part C Page 124
are used across all domains of science, and ideas that are core to the K-12 science curriculum (NRC, 2012). Taken together each of these parts also represents science as not only content knowledge but also an evidence-based, model-building process that continually refines and revises knowledge (NAP, 2010). Successful teachers possess the ability to connect students to science material by focusing on science as content and process. In doing so, research suggests six intertwining strands of science learning that provide a framework for thinking about scientific knowledge and practice. The six strands include (1) sparking interest and excitement, (2) understanding scientific content and knowledge, (3) engaging in scientific reasoning, (4) reflecting on science, (5) using tools and language of science, and (6) identifying with scientific expertise. It is important to note that each of the strands has been conceptualized as a unit where progress in one strand promotes progress in the other (NAP, 2010).
Teachers who utilize STEM practices in their classroom can positively impact student learning; however, teachers who do not have adequate familiarity with the new standards may not be able to readily communicate the practices to students and may struggle to adequately engage them in new processes that are making their way into the field. It is important for schools to continue to engage teachers in conversations about the practices and set expectations for their implementation (Nadelson, et. al., 2015).
Issue 3.2.: Professional Development
As standards are regularly revised, professional development must also be flexible and adjust to new best practices that are released to the field. Professional development is needed to provide teachers with ongoing and systemic supports for their learning (NRC, 2011) in response to emerging standards. Professional development includes courses, workshops, seminars, classroom observations and critiques (both observing and being observed), conferences, “camps,” or any other venue in which teachers are expected to hone their subject matter or pedagogical skill, scientific literacy, or scientific practices—both within and outside the school environment (Desimone, et. al., 2002). Professional development needs to focus on giving teachers sufficient exposure to and practice with activities that will lead to an increased level of insight and aid in their ability to teach scientific practice (Nadelson, et. al., 2015).
Furthermore, to enhance their learning and to assist with curriculum planning, teachers can access online instructional materials, websites, and chat rooms devoted to science instruction. Finally, given the growing role of technology in science instruction (see below), teachers must be trained in the effective use of computers, scientific calculators, and emerging technologies (Guskey & Yoon, 2009). Participation in professional development courses that focus on integrating technology with instruction is one way for teachers to learn how these tools can enhance learning. Some teachers may not use technology
NAEP 2018-2019 OMB Clearance: Supporting Statement Part C Page 125
because it is not available; others may avoid it because they lack the knowledge to incorporate it effectively; and still others may not fully understand the science content that technology allows students to access when solving complex problems. When teachers participate in professional development programs that emphasize collective meetings with groups of teachers and that provide opportunities for teachers to review student work and discuss student responses and behaviors, they deepen both their content and pedagogical knowledge needed to effectively engage in the critical tasks of teaching and develop their teaching practices (Garet, et al., 2001).
In addition to professional development, teachers may also need specialists and coaches who are highly trained in a particular domain and can support teaching in the classroom. Traditionally, specialists and coaches have been viewed as a resource for teachers and students (McGatha, 2009), but recently the role of a coach has changed to one of a mentor for teachers.
Issue 3.3.: Noncognitive Teacher Factors
Along with teachers’ content and pedagogical knowledge, noncognitive teacher factors (e.g., self-efficacy, confidence, growth mindset, and attributions for student learning and achievement) play an important role in effective teaching and instruction (Dweck, Walton, & Cohen, 2014). Teachers who are interested in the subject they are teaching, have positive attitudes toward their work, and show high levels of confidence in their ability to be effective in the classroom are more likely to be successful. For instance, studies show that teachers who have high teaching self-efficacy are more likely to be open to new ideas and concepts, try new instructional methods, and persist when things in the classroom do not go well (Berman, McLaughlin, Bass, Pauly, & Zellman, 1977; Guskey, 1988; Stein & Wang, 1988). The literature also shows that teacher self-efficacy can, in turn, influence students’ achievement, motivation, and self-efficacy (Anderson, Greene, & Loewen, 1988; Midgley, Feldlaufer, & Eccles, 1989; Moore & Esselman, 1992; Ross, 1992). Other noncognitive factors, such as curiosity, growth mindset, and attribution beliefs have also been shown to play an important role in teaching and student learning (Dweck, Walton, & Cohen, 2014).
ISSUE 4: STUDENT FACTORS As depicted in the schematic model in the introduction of this paper, noncognitive student factors constitute an important set of contextual variables relevant to student achievement. In this paper, we categorize student factors into social, motivational, and self-regulatory facets. Social facets encompass student engagement with opportunities to learn in school (see Issues 1 and 2) and outside of school (described in this section). Activities and behaviors signaling engagement with science can include trips to science museums or centers, participation in science fairs or clubs for enjoyment, participating in citizen science investigations, discussing real-world issues related to science with friends and family,
NAEP 2018-2019 OMB Clearance: Supporting Statement Part C Page 126
engaging in conversations about science, or participating in other science-related activities beyond strictly school-related tasks. Engagement variables constitute important predictors, moderators, and mediators of science achievement. Motivation also plays a crucial role in students’ persistence and how much effort they exert in school (Baker & Wigfield, 1999; Becker, McElvany, & Kortenbruck, 2010; Retelsdorf, Köller, & Möller, 2011; Taboada, Tonks, Wigfield, & Guthrie, 2009). Knowing the level of interest and motivation students exert during a task or test can bring about improvements to instructional methods, test design, and test interpretation that more accurately gauge and enhance student’s proficiency (Sabatini & O’Reilly, 2013). Other self-regulatory or self-related attitudes such as self-efficacy, self-concept, and confidence have been shown to be highly associated with achievement across many studies (Guthrie & Wigfield, 2000; OECD, 2010). Relevant sub-issues are described further in Table 5.
Table 5. Student Factors: Sub-issues
Issue 4.1.: Social Facets Student engagement in opportunities to learn, specifically how they spend their time outside of the classroom and outside of school, adds an important complementary element to studying student engagement in classroom instruction. In looking at general time use patterns outside of school, several studies provide evidence that students’ time use patterns relate to important success variables. Time use patterns might play a key mediating role between various student contextual factors (such as SES) and performance (Porterfield and Winkler, 2007). While more than 60 countries worldwide regularly conduct systematic time use studies among adults and adolescents, time use has received very little coverage in large-scale assessments. However, research provides strong support for their inclusion. Important activities and behaviors to capture with regard to students’ time use include extracurricular activities (e.g., fairs, clubs, and camps), homework, study time, and other activities that incorporate components of science learning. Sahin et. al., (2014) provide evidence that STEM activities, particularly in afterschool programs, allow for student collaboration, ownership, and helps to increases their interest in the STEM fields.
Patterns of free-time activities in middle childhood predict adjustment in early adolescence (McHale, Crouter, & Tucker, 2001, Gardner et al, 2008) and student engagement in outside-of-school activities is clearly related to involvement in extracurricular activities and hobbies (Fredricks & Eccles, 2006). Activities including music, fine arts, academic clubs, and athletics have been shown to be beneficial to academic growth. Participation in such activities can provide students with opportunities to learn about teamwork, respect, and responsibility, and offer a venue for students to apply these lessons (NCES, 1995). With regards to science, trends indicate that many students attend after-school learning programs. Quality after-school
NAEP 2018-2019 OMB Clearance: Supporting Statement Part C Page 127
programs help students develop academic and interpersonal skills (Huang, 2001). Such programs support student learning activities in an informal environment, and provide a bridge between home and school (Miller, 2003). Learning programs have been shown to improve school habits and increase academic achievement in students (Huang, 2001). Miller (2003) also reports that students who participated in the educational programs of the Boys and Girls Clubs reported that they enjoyed academic tasks more than those who did not participate in such a program. Evaluations of after-school learning programs have indicated that participating students were more likely to complete their homework and perform better than their peers on standardized tests (Huang, Gribbins, Kim, Lee, & Baker, 2001; Johnson, Zorn, Williams, & Smith, 1999; and Miller, 2003).
Ben-Avie, Haynes, White, Ensign, Steinfeld, & Sartin (2003) have emphasized the meaningful connection between student engagement and perseverance in their studies evaluating the work of the Institute for Student Achievement (ISA) for three years. Perseverance is defined as “students’ persistence in performing strategic behaviors that increase the likelihood of academic success, regardless of obstacles or distractions” (p.22). Students’ openness for problem solving (e.g., enjoyment in solving complex problems, seeking explanations for things), their planning and organization behaviors (e.g., making to-do lists, keeping notes for subjects; finishing assignments on time, not doing things at the last minute), persistence even on difficult tasks (e.g., not putting off difficult problems, not giving up easily), and general work ethic (e.g., preparing for class, working consistently throughout the school year) are not only among the most predictive noncognitive factors of GPA (see recent meta-analysis by Richardson et al., 2012), but also important predictors of success in higher education and the workforce in general (Heckman, Stixrud & Urzua, 2006; Lindqvist & Vestman, 2011; Poropat, 2009; Roberts et al., 2007). Student engagement also contributes to the development of collaboration, another key competency that is considered important for educational and workforce success (Nagaoka et al., 2015). Collaboration, or working with others effectively and respectfully toward a common goal, is commonly practiced through group-based activities and learning opportunities both in school and outside of school. While collaboration builds upon a set of skills related to working with others, it also requires a particular individual mindset that allows for an openness to and valuing of others’ contributions (Nagaoka et al., 2015). Thus, collaboration not only has the potential to inform whether effective group-based learning is occurring in class, but also students’ enjoyment and orientation toward working with others in general.
In addition to extracurricular activities, hobbies, activities that incorporate aspects of scientific practice, scientific learning, or science content (e.g.,
NAEP 2018-2019 OMB Clearance: Supporting Statement Part C Page 128
citizen science, visiting science centers and museums with exhibits related to science), engagement in opportunities outside of school may include gaining competence in academic areas such as the completion of homework and studying (Morrissey, 2005). The existing literature examining the impact of homework on achievement generally agrees that a positive relationship exists between the two (Cooper, Robinson, & Patall, 2006; Cooper & Valentine, 2001; Cooper, McMullen, 2007; Cooper, Steenbergen-Hu, & Dent, 2012; Neilson, 2005). In the last decade, many studies have noted this positive relationship including a study by Cooper, Robinson, and Patall (2006) who analyzed articles across education, psychology, and sociology and found that increased amounts of homework were related to increases in academic achievement. Eren & Henderson (2008), utilized data from the National Educational Longitudinal Study to find that homework has a positive and significant impact on tenth-grade math scores. In addition to traditional positivistic research methodologies, more sophisticated methods have also been used to examine the link between homework and achievement; namely, two-level and hierarchical-linear models. Using these more rigorous approaches to research, studies have shown homework to be a predictor of academic performance when considering factors that occur at more than one level, such as between classrooms, teachers, and student factors (De Jong, Westerhof, and Creemers, 2000; Dettmers, Trautwein, & Ludtke, 2009; Nunez, Vallejo, Rosario, Tuero, & Valle, 2014). Further, researchers have also examined the many factors that influence the effectiveness of homework such as frequency of homework delivery (Trautwein & Köller, 2003; Trautwein, 2007; Farrow et al, 1999), time spent (De Jong et al., 2000, Trautwein, 2007; Trautwein, Schnyder et al., 2009), and effort (Dettmers et al., 2010, 2011; Trautwein and Lüdtke, 2007). A study by Fernandez-Alonso, Suarez-Alvarez, and Muniz (2015) helped to uncover the relationship of each of these factors to student achievement. When looking at the abovementioned variables, the authors found that the optimal amount of time spent on homework is around 60 minutes per day with performance beginning to drop once students spend more than 100 minutes on homework per day. It is also important to note that when looking at time spent, gains in student performance were incremental after the 60-minute mark, which is to say that spending more than 60 minutes on homework did not add the necessary value to justify additional time spent. However, as their study also looked at effort and level of autonomy during homework tasks, the authors found that time spent on homework becomes irrelevant if students do not exert effort or feel ownership over what they are learning (Fernandez-Alonso, Suarez-Alvarez, Muniz, 2015). More specifically, the results of their study would indicate that engagement with homework and effort applied are of paramount importance when considering homework delivery in science education.
Moreover, autonomy when completing homework is linked to student self-regulated learning. This construct helps to shed light on the types of homework that are most effective for science instruction. While there is
NAEP 2018-2019 OMB Clearance: Supporting Statement Part C Page 129
very little research on the specific types of homework that are most effective (e.g. worksheets, at home activities, etc.), Vatterott (2010) has identified five fundamental characteristics of good homework. These fundamental characteristics include homework that is meaningful to students and works for their learning styles (purpose), does not take more time than is necessary (efficiency), lets students feel connected to the content (ownership), lets students feel that they can complete the assigned work (competency), and looks visually appealing to students (aesthetic appeal). Carr (2013) posits that in addition to the five principals for effective homework as laid out by Vatterrott (2010), work completed at home must also provide students with the opportunity to self-regulate their learning process. That is, homework should also provide students with the chance to set goals, select appropriate learning strategies, maintain their motivation, monitor their progress, and evaluate the results of their efforts (Bembenutty, 2011).
Issue 4.2.: Motivational Facets
Achievement motivation captures students’ motivation to achieve positive results in specific classes and in school in general. Achievement goals fall under two broad categories. The first category, referred to as mastery or task-involved, is closely related to individual goals that are aimed at mastering or learning material. The second category, often labeled as performance, is closely related to goals that are aimed at ability and the students’ performance relative to others (Pintrich, 2000). Meta-analyses have found that achievement motivation is one of the strongest predictors of success (e.g., Richardson et al., 2012).
In addition to achievement motivation, Deci & Ryan (1985) devised a theory of learning motivation that differentiates between intrinsic and extrinsic motivation and explicitly acknowledges the central importance of self-conceptions within the motivational spectrum (Ryan & Deci, 2003). Extrinsically motivated students pursue learning goals associated with valued consequences located outside the person and deemed personally important, such as instrumental value, positive feedback, or rewards for good performance. Instrumental motivation captures whether students see science as useful for their real life and their future choices to possibly study science topics beyond school and/or choose a science-oriented career.
In contrast, intrinsically motivated learners are motivated by internal rather than external incentives. Students might, for example, learn in order to find out more about a subject domain or to achieve the positive emotional state that learning can engender (Csikszentmihalyi, 1990). Interest and enjoyment are classic examples of intrinsic motivation (Bøe et al., 2011; Renninger, Hidi, & Krapp, 1992) that represent a relatively stable evaluative orientation toward certain topics or domains. Intrinsic motivation is often accompanied by positive feelings (e.g., feelings of involvement or stimulation) and attribution of personal significance to an object or domain.
NAEP 2018-2019 OMB Clearance: Supporting Statement Part C Page 130
Subject-specific intrinsic motivation affects the intensity and continuity of engagement in learning situations, the selection of learning strategies, the depth of understanding achieved, and choice behaviors (Schiefele, 2001).
Using Trends in International Mathematics and Science Studies (TIMSS; 2003) eighth-grade mathematics data, Zhu and Leung (2011) investigated the effects of intrinsic and extrinsic motivation on learning and academic performance. They found that overall, more than 70% of students had a higher level of extrinsic than intrinsic motivation. Regression analyses further revealed a significant positive effect of pleasure-oriented (intrinsic) motivation on mathematical achievement among the U.S. students (r=.17, p<.001). Data from the 2003 cycle of the Program for International Student Assessment (PISA) support these findings by indicating that both the degree and continuity of engagement in learning and the depth of understanding relates to interest in and enjoyment of particular subjects, or intrinsic motivation. This effect has been shown to operate largely independently of students’ general motivation to learn (OECD, 2004). In sum, intrinsic motivation can be understood as a factor for engagement and constitutes at the same time an important outcome of increased engagement. With respect to science, Bryan, Glynn, & Kittleson (2011), found similar results when looking at the intrinsic motivation, self-efficacy, and science achievement among 14-to 16-year-old male and female students. The authors found motivation and self-efficacy to be significant predictors of science achievement and AP science aspirations.
Interest captures whether students value and show interest in the topics covered in school and generally like specific subjects. Interest and enjoyment are strongly related to motivation. Additionally, students’ perception of the importance and utility of a class or assigned task, in concert with their perception of their ability to succeed, can affect motivation (Pintrich & Schrauben, 1992; Wolters & Pintrich, 1998), effort (Salomon, 1983), and ultimately achievement (Gipps, 1994; Wolters, Yu, & Pintrich, 1996).
Students who have positive attitudes and emotions toward a subject are in a position to learn that subject better than students who feel anxiety or negative emotion toward it. For instance, a study by Singh, Granville, & Dika (2010) found strong effects when examining the role of motivation, positive attitude, engagement in academic work and success in science and mathematics. However, students who have more negative attitudes about science tasks and tests are less likely to be successful and struggle to reach their true potential when engaging in related tasks. Researchers have provided a clear theoretical rationale for the separation of affective factors such as interest and enjoyment from motivational and self-regulatory components such as goal orientation and competency self-beliefs (Deci &
NAEP 2018-2019 OMB Clearance: Supporting Statement Part C Page 131

Ryan, 1985; Eccles & Wigfield, 2002; Renninger, 2000; Renninger, 2009; Renninger, Hidi & Krapp, 1992; Stipek & MacIver, 1989).
Issue 4.3.: Self-regulatory Facets
Self-efficacy refers to the beliefs that individuals hold about what they believe they are capable of accomplishing. These self-perceptions determine how individuals use the knowledge and skills that they have to achieve a certain task (Pajares & Schunk, 2001). It has been reported that self-efficacy beliefs are correlated with other self-beliefs, such as self-concept and other motivational constructs (Zimmerman, 2000). Evidence has also suggested that self-efficacy and self-concept beliefs are each related to and influential on academic achievement (Pajares, 1996). Pintrich and De Groot (1990) have suggested that self-efficacy has a special role in terms of cognitive engagement, that is, it may increase students’ beliefs that in turn, could lead to more frequent and increased use of cognitive strategies, leading to higher achievement (Pajares & Schunk, 2001). Students with high self-efficacy engage in effective self-regulating strategies more often than those with lower-level beliefs; high self-efficacy also seems to enhance performance as these beliefs also tend to enhance persistence (Pajares, 1996; Bouffard-Bouchard, Parent, & Larivee, 1991; Berry, 1987). Self-efficacy beliefs have been positively related to academic achievement, moderating the effect of experiences, abilities, and prior achievement. Zimmerman, Bandura, & Martinez-Pons (1992) demonstrated that academic self-efficacy mediated student self-regulated learning strategies and their relationship to academic achievement (Pajares, 1996). Multon, Brown, & Lent (1991) conducted a meta-analysis that indicated self-efficacy was related to academic outcomes, with these effects becoming stronger as students progressed from elementary school to high school to college (Pajares & Schunk, 2001). The effects were stronger for classroom-based indices (i.e., grades) and basic skill measures when compared to standardized tests, demonstrating that self-efficacy beliefs are often subject and context specific (Pajares & Schunk, 2001). Overall, there is an ample amount of evidence that suggests self-efficacy and self-concept are powerful constructs that predict both academic beliefs and performance (Pajares, 1996).
Self-concept also is widely accepted as an important universal aspect of being human and central to understanding the quality of human existence (Bandura, 2006; Bruner, 1996; Marsh & Craven, 2006; Pajares, 1996; Pajares & Schunk, 2005). Positive self-beliefs are valued as a desirable outcome in many disciplines of psychology including those that focus on how individuals can optimize their lives (Diener, 2000; Fredrickson, 2001; Seligman & Csikszentmihalyi, 2000). Motivational constructs in the TIMSS survey (and for purposes of the present investigation) can be broadly divided into self-concept (sometimes referred to as competence beliefs),
NAEP 2018-2019 OMB Clearance: Supporting Statement Part C Page 132
positive affect (sometimes referred to as intrinsic motivation), and task value (a construct combining value and importance, but overlapping substantially with what some refer to as extrinsic motivation). Stipek, Salmon, Givvin, Kazemi, Saxe, & MacGyvers (1998) investigated a broader range of motivational variables related to instructional teacher practices and student preferences. Results revealed that two relevant factors of motivation—mastery orientation and enjoyment—significantly correlated with learning on procedurally oriented fraction problems and traditional computation items.
Students who have a strong sense of perceived control approach tasks differently than students who do not think that they are in control of their success. In PISA 2012, several items measure students’ perceived control of success in mathematics specifically, and overall success in school. Responses to these items are among the strongest predictors of cognitive performance on the mathematics tasks. Measuring perceived control in the NAEP 2019 science questionnaires will add an important component about students’ self-related beliefs and an important contextual variable for understanding student performance.
NAEP 2018-2019 OMB Clearance: Supporting Statement Part C Page 133
References
Aksoy, T., & Link, C. R. (2000). A panel analysis of student mathematics achievement in the U.S. in the 1990s: Does increasing the amount of time in learning activities affect math achievement? Economics of Education Review, 19, 261-277.
Akerson, V. L., Morrison, J. A., & McDuffie, A. R. (2006). One course is not enough: Pre-service elementary teachers’ retention of improved views of nature of science. Journal of Research in Science Teaching, 43(2), 194–213.
Ancess, J. (2000). The reciprocal influence of teacher learning, teacher practice, school restructuring, and student learning outcomes. Teachers College Record, 102(3), 590-619.
Andrade, H.G. and B.A. Boulay. 2003. Role of rubric-referenced self-assessment in learning to write. Journal of Educational Research, 97, 21–34.
Andrade, H., & Cizek, G. J. (Eds.). (2010). Handbook of formative assessment. Routledge.
Barton, S. (2000). What does the research say about achievement of students who use calculator technologies and those who do not? In Electronic Proceedings of the Thirteenth Annual International Conference on Technology in Collegiate Mathematics. See also [online] http://archives.math.utk.edu/ICTCM/EP-13 C (25).
Baker, L., & Wigfield, A. (1999). Dimensions of children’s motivation for reading and their relations to reading activity and reading achievement. Reading Research Quarterly, 34, 452-477.
Becker, M., McElvany, N., & Kortenbruck, M. (2010). Intrinsic and extrinsic reading motivation as predictors of reading literacy: A longitudinal study. Journal of Educational Psychology, 102(4), 773.
Bembenutty, H. (2011). Meaningful and maladaptive homework practices: The role of self-efficacy and self-regulation. Journal of Advanced Academics, 22, 448–473.
Ben-Avie, M., Haynes, N. M., White, J., Ensign, J., Steinfeld, T. R., Sartin, L., & Squires, D. A. (2003). Youth development and student learning in math and science. How Social and Emotional Development Add Up: Making Gains in Math and Science Education, 9(35).
Bennett, R. E. (2011). Formative assessment: A critical review. Assessment in Education: Principles, Policy & Practice, 18(1), 5-25.
Berry, C. M., Ones, D. C. & P.R. Sackett, P. R. (2007). Interpersonal deviance, organizational deviance, and their common correlates: A review and meta–analysis. Journal of Applied Psychology, 92, 410-424.
Berry, J. M. (1987, September). A self-efficacy model of memory performance. In annual meeting of the American Educational Research Association, New York.
Berman, P., McLaughlin, M., Bass, G., Pauly, E., & Zellman, G. (1977). Federal programs supporting educational change. Vol. VII: Factors affecting implementation and continuation (Report No. R-
NAEP 2018-2019 OMB Clearance: Supporting Statement Part C Page 134
1589/7-HEW). Santa Monica, CA: The Rand Corporation (ERIC Document Reproduction Service No.140 432).
Bertling, J. P. (2014, May). Improving the contextual questionnaires for the National Assessment of Educational Progress: Plans for NAEP Core contextual modules. White paper presented at the meeting of the National Assessment Governing Board, Boston, MA.
Bertling, J. P., Borgonovi, F., & Almonte, D. E. (2016). Psychosocial skills in large-scale assessments: Trends, challenges, and policy implications. In A. Lipnevich, F. Preckel, & R. Roberts (Eds.), Psychosocial Skills and School Systems. Berlin: Springer.
Black, P., & Wiliam, D. (2009). Developing the theory of formative assessment. Educational Assessment, Evaluation and Accountability (formerly: Journal of Personnel Evaluation in Education), 21(1), 5-31.
Blank, R. K. (2012). What is the impact of decline in science instructional time in elementary school? Retrieved from http://www.csssscience.org/downloads/NAEPElemScienceData.pdf
Blank, R. K (2013). Science instruction time is declining in elementary schools: What are the implications for student achievement and closing the gap? Science Education, 97(6),831-847.
Bøe, M. V., Henriksen, E. K., Lyons, T., & Schreiner, C. (2011). Participation in science and technology: young people’s achievement-related choices in late-modern societies. Studies in Science Education, 47(1), 37-72.
Bouffard-Bouchard. T., Parent, S., & Larivee, S. (1991). Influence of self-efficacy on self-regulation and performance among junior and senior high-school aged students. International Journal of Behavioral Development, 14, 153-164.
Bryan, R. R., Glynn, M. S., & Kittleson, M. J. (2011). Motivation, achievement, and advanced placement intent of high school students learning science. Science Education, 95(6) 1049-1065.
Bybee, R. W. (2013). The next generation science standards and the life sciences. Science & Children, 50(6), 7-14.
Carter, L. (2005). Globalization and science education: Rethinking science education reforms. Journal of Research in Science Teaching, 42(5), 561–580.
Carr, N. S. (2013). Increasing the effectiveness of homework for all learners in the inclusive classroom. School Community Journal, 1, 169-182
Csikszentmihalyi, M. (1990). Flow: The Psychology of Optimal Experience.New York, NY: Harper and Row.
Chin, C., & Teou, L. Y. (2009). Using concept cartoons in formative assessment: Scaffolding students’ argumentation. International Journal of Science Education, 31(10), 1307-1332.
Clark, G., Russell, J., Enyeart, P., Gracia, B.,Wessel, A., Jarmoskaite, L., et al. (2016) Science Educational Outreach Programs That Benefit Students and Scientists. PLoS Biol 14(2): e1002368.doi:10.1371/journal.pbio.1002368
NAEP 2018-2019 OMB Clearance: Supporting Statement Part C Page 135
Common Sense Media, (2013). Teaching with Technology: The Promise and Reality of the U.S. Digital Classroom. White paper retrieved from cdn2.ec.graphite.org/sites
Cooper, H., Robinson, J. C., & Patall, E. A. (2006). Does homework improve academic achievement? A synthesis of research, 1987–2003. Review of Educational Research, 76, 1–62. http://dx.doi.org/10.3102/ 00346543076001001
Cooper, H., & Valentine, J. C. (2001). Using research to answer practicalquestions about homework. Educational Psychologist, 36, 143–153. http://dx.doi.org/10.1207/S15326985EP3603_1
Cooper, H., Steenbergen-Hu, S., & Dent, A. L. (2012). Homework, in: K. R. Harris, S. Graham, & T. Urdan (Eds.), APA educational psychology handbook, Volume 3: Application to learning and teaching. (pp.475–495). Washington, DC: American Psychological Association
Csikszentmihalyi, M. (1990). Literacy and Intrinsic Motivation. Daedalus, 119(2), 115-140. Retrieved from http://www.jstor.org/stable/20025303
Darling-Hammond, L., Zielezinski, M. B., & Goldman, S. (2014). Using technology to support at-risk students’ learning. Stanford Center for Opportunity Policy in Education. Online https://edpolicy. stanford. edu/publications/pubs/1241.
Diener, E. (2000). Subjective well-being: The science of happiness and a proposal for a national index. American Psychologist, 55(1), 34.
Dillon, S. (2006, May 25) Test shows drop in science achievement for 12th graders. New York Times, p. A18.
Deci, E.L. & Ryan, R.M. (1985). Intrinsic motivation and self-determination in human behavior. New York: Plenum Press.
De Jong, R., Westerhof, K. J., & Creemers, B. P. M. (2000). Homework and student math achievement in junior high schools. Educational Research and Evaluation, 6, 130–157. http://dx.doi.org/10.1076/1380-3611(200006)6:2;1-E;F130
Desimone, L., Porter, A. C., Birman, B. F., Garet, M. S., & Yoon, K. S. (2002). How Do District Management and Implementation Strategies Relate to the Quality of the Professional Development That Districts Provide to Teachers? Teachers College Record, 104, 1265-1312.
Dettmers, S., Trautwein, U., Lüdtke, M., Kunter, M., & Baumert, J. (2010). Homework works if homework quality is high: Using multilevel modeling to predict the development of achievement in mathematics. Journal of Educational Psychology, 102, 467–482. http://dx.doi.org/10.1037/a0018453
Dettmers, S., Trautwein, U., & Lüdtke, O. (2009). The relationshipbetween homework time and achievement isnot universal: Evidence from multilevel analyses in 40 countries. School Effectiveness and School Improvement, 20, 375– 405. http://dx.doi.org/10.1080/09243450902904601
NAEP 2018-2019 OMB Clearance: Supporting Statement Part C Page 136
Dettmers, S., Trautwein, U., Lüdtke, O., Goetz, T., Frenzel, A., & Pekrun, R. (2011). Students’ emotions during homework in mathematics: Testing a theoretical model of antecedents and achievement outcomes. Contemporary Educational Psychology, 36, 25–35. http://dx.doi.org/10.1016/j.cedpsych.2010.10.001
Dobo, N. (2016, February). U.S. schools have more computers than ever. But what are they doing with all that (expensive) technology? The Hechinger Report. Retrieved from: http://hechingerreport.org/u-s-schools-have-more-computers-than-ever-but-what-are-they-doing-with-all-that-expensive-technology/
Dweck, C.S., Walton, G.M., & Cohen, G.L. (2014). Academic Tenacity: Mindsets and Skills that Promote Long-Term Learning. Bill and Melinda Gates Foundation.
Eccles, J. S., & Wigfield, A. (2002). Motivational beliefs, values, and goals. Annual review of psychology, 53(1), 109-132.
Eren, O. & Henderson, D. J. (2006). The impact of homework on student achievement. Retrieved January 17, 2008 from http://ssrn.com/abstract=917447.
Eteokleous, N. (2008). Evaluating computer technology integration in a centralized school system. Computers & Education, 51(2), 669-686.
Farrington, C.A., Roderick, M., Allensworth, E., Nagaoka, J., Keyes, T.S., Johnson, D.W., & Beechum, N.O. (2012). Teaching adolescents to become learners. The role of noncognitive factors in shaping school performance: A critical literature review. Chicago: University of Chicago Consortium on Chicago School Research.
Farrow, S., Tymms, P., & Henderson, B. (1999). Homework and attainment in primary schools. British Educational Research Journal, 25, 323–341. http://dx.doi.org/10.1080/0141192990250304
Fenichel, M., & Schweingruber, H. A. (2010). Surrounded by science: Learning science in informal environments. National Academies Press.
Fernandez-Alonso, R., Suarez-Alvarez, J., and Muniz, J (2015). Adolescents’ Homework Performance in Mathematics and Science: Personal Factors and Teaching Practices. Journal of Educational Psychology, 4, 1075-1085, http://dx.doi.org/10.1037/edu0000032
Fredricks, J. A., & Eccles, J. S. (2006). Is extracurricular participation associated with beneficial outcomes? Concurrent and longitudinal relations. Developmental Psychology, 42, 698-713.
Frykholm, J. A., & Meyer, M. R. (2002). Integrated instruction. Mathematics Teaching in the Middle School, 7(9), 502–509.
Galloway, M. K., & Pope, D. (2007). Hazardous Homework?: The relationship between homework, goal orientation, and well-being in adolescence. Encounter: Education for Meaning and Social Justice, 20, 25-31.
Gayford, C. (2002). Controversial environmental issues: A case study for the professional development of science teachers. International Journal of Science Education, 24(11), 1191–1200.
NAEP 2018-2019 OMB Clearance: Supporting Statement Part C Page 137
Gardner, M., Roth, J., & Brooks-Gunn, J. (2008). Adolescents’ participation in organized activities and developmental success 2 and 8 years after high school: Do sponsorship, duration, and intensity matter? Developmental Psychology, 44, 814-830.
Garet, M. S., Porter, A. C., Desimone, L., Birman, B. F., & Yoon, K. S. (2001). What makes professional development effective? Results from a national sample of teachers. American Educational Research Journal, 38(4), 915-945.
Gipps, C.V. (1994). Beyond Testing: Towards a Theory of Educational Assessment. New York, NY: Routledge.
Gordon, M. (2008). Between constructivism and connectedness. Journal of Teacher Education, 59, 322-331.
Greenwald, R., Hedges, L.V., & Laine, R.D. (1996). The effect of school resources on student achievement. Review of Educational Research, 66(3), 361–396.
Guskey, T. R. (1988). Teacher efficacy, self-concept, and attitudes toward the implementation of instructional motivation. Teaching and Teacher Education, 4, 63-69.
Guskey, T. R., & Yoon, K. S. (2009). What works in professional development? Phi delta kappan, 90(7), 495-500.
Guthrie, J.T., & Wigfield, A. (2000). Engagement and motivation in reading. In M.L. Kamil, P.B. Mosenthal, P.D. Pearson, & R. Barr (Eds.), Handbook of reading research (Vol. III, pp. 403-422). Mahwah, NJ: Erlbaum.
Haefner, Leigh A., Friedrichsen, Patricia Meis, & Zembal-Saul, Carla. (2006). Teaching with Insects: An Applied Life Science Course for Supporting Prospective Elementary Teachers’ Scientific Inquiry. American Biology Teacher, 68(4), 206–212.
Heckman, J. J., Stixrud, J., & Urzua, S. (2006). The effects of cognitive and noncognitive abilities on labor market outcomes and social behavior (No. w12006). National Bureau of Economic Research.
Huang, D. (2001). An after-school evaluation system for middle and high school programs. National Association of Secondary School Principals Bulletin, 85, 45-61.
Huang, D., Gribbons, B., Kim, K. S., Lee, C., & Baker, E. L. (2000). A decade of results: The impact of the LA’s BEST after school enrichment initiative on subsequent student achievement and performance. Los Angeles: UCLA Center for the Study of Evaluation, Graduate School of Education and Information Studies.
Hug, B., Krajcik, J. S., & Marx, R. W. (2005). Using innovative learning technologies to promote learning and engagement in an urban science classroom. Urban Education, 40(4), 446–472.
Ingersoll, R. M., & Perda, D. (2010). Is the supply of mathematics and science teachers sufficient?. American Educational Research Journal, 47(3), 563-594.
NAEP 2018-2019 OMB Clearance: Supporting Statement Part C Page 138
Ingersoll, R.M. and May, H. (2011). Recruitment, Retention and the Minority Teacher Shortage. Consortium for Policy Research in Education. CPRE Research Report #RR-69.
Johnson, L. J., Zorn, D., Williams, J., & Smith, J. (1999). 1998-99 school year program evaluation: Urban school initiative school age child care expansion. Cincinnati, OH, University of Cincinnati: 1-60.
Kingston, N. & Nash, B. (2011). Formative assessment: A meta-Analysis and a call for research. Educational Measurement: Issues and Practice, 30(4), 28-37.
Lang, M., Drake, S., & Olson, J. (2006). Discourse and the new didactics of scientific literacy. Journal of Curriculum Studies, 38(2), 177–188.
Lee, J.-W. & Barro, R.J. (2001). Schooling quality in a cross-section of countries. Economica, New Series, 68(272), 465–488.
Lee, V.E. & Zuze, T.L. (2011). School resources and academic performance in Sub-Saharan Africa. Comparative Education Review, 55(3), 369–397.
Lederman, G. N., Lederman, S. J., & Antink, A. (2013). Nature of science and scientific inquiry as contexts for the learning of science and achievement of scientific literacy. International Journal of Education in Mathematics, Science and Technology, 1(3), 138-147.
Lim, C. P., & Chai, C. S. (2008). Teachers’ pedagogical beliefs and their planning and conduct of computer-mediated classroom lesson. British Journal of Educational Technology, 807–82
Lindqvist, E., & R. Vestman (2011). The labor market returns to cognitive and noncognitive ability: Evidence from the Swedish enlistment. American Economical Journal: Applied Economics, 3, 101-128.
Lowther, D. L., Inan, F. A., Daniel Strahl, J., & Ross, S. M. (2008). Does technology integration “work” when key barriers are removed?. Educational Media International, 45(3), 195-213.
Marsh, H. W., & Craven, R. G. (2006). Reciprocal effects of self-concept and performance from a multidimensional perspective: Beyond seductive pleasure and unidimensional perspectives. Perspectives on Psychological Science, 1(2), 133-163.
McHale, S. M., Crouter, A. C., & Tucker, C. J. (2001). Free-time activities in middle childhood: Links with adjustment in early adolescence. Child development, 72(6), 1764-1778.
McMullen, S. (2007). The impact of homework time on academic achievement. The University of North Carolina at Chapel Hill [Online]: http://www. learndoearn. org/For-Educators adresinden, 13.
McGatha, M (2009). Mathematics specialists and mathematics coaches: What does the research say? NCTM Research Briefs, ed. Judith Reed Quander (Reston, VA: NCTM, 2009)
McGatha, M. B., Bush, W. S., & Rakes, C. (2009). The effects of professional development in formative assessment on mathematics teaching performance and student achievement. Journal of Multidisciplinary Evaluation, 6, 32-43.
NAEP 2018-2019 OMB Clearance: Supporting Statement Part C Page 139
McManus, S. 2008. Attributes of effective formative assessment. Washington, DC: Council for Chief State School Officers. http://www.ccsso.org/publications/details.cfm?PublicationID=362 (accessed March 2, 2009).
Midgley, C., Feldlaufer, H., & Eccles, J. (1989). Change in teacher efficacy and student self- and task-related beliefs in mathematics during the transition to junior high school. Journal of Educational Psychology, 81, 247–258.
Miller, B. M. (2003). Afterschool programs and educational success: Critical hour’s executive summary. Retrieved January 17, 2008 from: http://www.nmefdn.org/uploads/Critical_Hours_Full.pdf.
Minner, D. D., Levy, J. A., & Centeury, J. (2010) Inquiry-based science instruction – What is it and does it matter? Results from a research synthesis Years 1984 to 2002. Journal of Research in Science Teaching, 47(4), 474-496.
Moore, W., & Esselman, M. (1992). Teacher efficacy, power, school climate and achievement: A desegregating district’s experience. Paper presented at the annual meeting of the American Educational Research Association, San Francisco.
Morrissey, K. (2005). The relationship between out-of-school activities and positive youth development: An investigation of the influences of communities and family. Adolescence, 40, 67-85.
Multon, K. D., Brown, S. D., & Lent, R. W. (1991). Relation of self-efficacy beliefs to academic outcomes: A meta-analytic investigation. Journal of Counseling Psychology, 38, 30-38.
Nadelson, L., Seifert, A., Hendricks, J.K. Are we preparing the next generation? K-12 teacher knowledge and engagement in teaching core STEM practices (2015) ASEE Annual Conference and Exposition, Conference Proceedings, 122nd ASEE Annual Conference and Exposition: Making Value for Society (122nd ASEE Annual Conference and Exposition: Making Value for Society), . http://www.scopus.com/inward/record.url?eid=2-s2.0-84941995482&partnerID=40&md5=94927f59bcf42532a10bcd5841a6e066
Nagaoka, J., Farrington, C. A., Erlich, S. B., Heath, R. D., Johnson, D. W., Dickson, S., Turner, A. C., Mayo, A., & Hayes, K. (2015). Foundations for young adult success: A developmental framework. Chicago: University of Chicago Consortium on Chicago School Research.
National Assessment Governing Board (2015). Science framework for the 2015 National Assessment of Educational Progress. Retrieved March 4, 2016 from: https://www.nagb.org/publications/frameworks/science/2015-science-framework.html
National Academies of Sciences, Engineering, and Medicine. Science Teachers' Learning: Enhancing Opportunities, Creating Supportive Contexts. Washington, DC: The National Academies Press, 2015. doi:10.17226/21836.
National Research Council. Surrounded by Science: Learning Science in Informal Environments. Washington, DC: The National Academies Press, 2010. doi:10.17226/12614.
NAEP 2018-2019 OMB Clearance: Supporting Statement Part C Page 140
National Center for Education Statistics. (1995, June). Extracurricular participation and student engagement. Retrieved January 16, 2008 from: http://nces.ed.gov/pubs95/web/95741.asp
National Center for Education Statistics (2009). The Nation's Report Card: Reading 2009 (NCES 2010–458). Institute of Education Sciences, U.S. Department of Education, Washington, D.C
National Research Council (2012). A framework for K-12 Science Education: Practices, crosscutting concepts, and core ideas. Retrieved March 4, 2016 from: http://www.nap.edu/catalog/13165/a-framework-for-k-12-science-education-practices-crosscutting-concepts
National Research Council. (2011). A framework for K-12 science education: Practices, crosscutting concepts, and core ideas. Washington, DC: The National Academies Press. Retrieved May 1, 2016 from: http://www.nap.edu/catalog/13165/a-framework-for-k-12-science-education-practices-crosscutting-concepts
National Research Council. (2000). Inquiry and the National Science Education Standards: A Guide for Teaching and Learning. Washington, D.C.: National Academies Press. Retrieved May 1, 2016 from http://www.nap.edu/catalog/9596/inquiry-and-the-national-science-education-standards-a-guide-for
Neilson, W. (2005). Homework and performance for time-constrained students. Economics Bulletin, 9, 1-6.
NGSS Lead States. 2013. Next Generation Science Standards: For States, By States. Washington, DC: The National Academies Press.
Núñez, J. C., Vallejo, G., Rosário, P., Tuero, E., & Valle, A. (2013). Student, Teacher, and School Context Variables Predicting Academic Achievement in Biology: Analysis from a Multilevel Perspective//Variables del estudiante, del profesor y del contexto en la predicción del rendimiento académico en Biología: Análisis... Journal of Psychodidactics, 19(1).
OECD (2015). Students, computers, and learning: Making the connection. OECD Publishing, Paris.
Ogle, T., Branch, M, Canada, B., Christmas, O., Clement, J., Fillion, J., Loudat, N. (2002). Technology in schools: Suggestions, tools and guidelines for assessing technology in elementary and secondary education, U.S. Department of Education.
Pajares, F. (1996). Self-efficacy beliefs in academic settings. Review of Educational Research, 66, 543-578.
Pajares, F., & Schunk, D. H. (2001). Self-beliefs and school success: Self-efficacy, self-concept and school achievement. In R. Riding & S. Raynor (Eds.), Perception (pp. 239-266), London: Ablex Publishing.
Pintrich (2004). An achievement goal theory perspective on issues in motivation terminology, theory, and research. Contemporary Educational Psychology, 25, 92-104
Pintrich, P. R. (2000). Multiple goals, multiple pathways: The role of goal orientation in learning and achievement. Journal of Educational Psychology, 92(3), 544.
NAEP 2018-2019 OMB Clearance: Supporting Statement Part C Page 141
Pintrich, P. R., & De Groot, E. V. (1990). Motivational and self-regulated learning components of classroom academic performance. Journal of Educational Psychology, 82, 33-40.
Pintrich, P.R., & Schrauben, B. (1992). Students’ motivational beliefs and their cognitive engagement in classroom academic tasks. In D.H. Schunk & J.L. Meece (Eds.), Student Perceptions in the Classroom (pp.149-183). Hillsdale, NJ: Lawrence Erlbaum Associates.
Poropat, A. E. (2009). A meta-analysis of the five-factor model of personality and academic performance. Psychological Bulletin, 135(2), 322.
Porterfield, S. L., & Winkler, A. E. (2007). Teen time use and parental education: Evidence from the CPS, MTF, and ATUS. Monthly Labor Review, 130(5), 37-56.
Potter, R. & Meisels, G. (2005). Enhancing teacher preparation and improving faculty teaching skills: Lessons learned from implementing “Science that Matters” a standards based interdisciplinary science course sequence. Journal of Science Education & Technology, 14(2), 191–204.
Premysl, J., & Jiri, B. (2012). Characteristics of Science and Scientific Activities: Considerations about What Is and What Is Not Scientific. Journal of Mechanics Engineering and Automation, 2(9).
Renninger, K.A. (2000) Individual interest and its implications for understanding intrinsic motivation. In C. Sansone and J.M. Harackiewicz (Eds.) Intrinsic motivation: Controversies and new directions (pp.372-404). San Diego, CA: Academic Press.
Renninger, K. A. (2009). Interest and identity development in instruction: An inductive model. Educational Psychologist, 44(2), 1-14.
Renninger, K., Hidi, S. E., & Krapp, A. E. (1992). The role of interest in learning and development. Lawrence Erlbaum Associates, Inc.
Retelsdorf, J., Köller, O., & Möller, J. (2011). On the effects of motivation on reading performance growth in secondary school. Learning and Instruction, 21(4), 550-559.
Rice, D. (2005). I didn’t know oxygen could boil! What pre-service and in-service elementary teachers’ answers to ‘simple’ science questions reveals about their subject matter knowledge. International Journal of Science Education, 27(9), 1059–1082.
Richardson, M., Abraham, C., & Bond, R. (2012). Psychological correlates of university students’ academic performance: A systematic review and meta-analysis. Psychological Bulletin, 138(2), 353–387.
Roberts, B. W., Kuncel, N. R., Shiner, R., Caspi, A. & Goldberg, L. R. (2007). The power of personality: The comparative validity of personality traits, socioeconomic status, and cognitive ability for predicting important life outcomes. Perspectives on Psychological Science, 2, 313–345.
Rohrer, D., & Pashler, H. (2010). Recent research on human learning challenges conventional instructional strategies. Educational Researcher,39(5), 406-412.
NAEP 2018-2019 OMB Clearance: Supporting Statement Part C Page 142
Romberg, T. A., Carpenter, T. P., & Dremock, F. (2005). Understanding mathematics and science matters. In T. A. Romberg (Ed.), Studies in mathematical thinking and learning. Mahwah, NJ: Lawrence Erlbaum Associates, Publishers.
Ross, J. A. (1992). Teacher efficacy and the effect of coaching on student achievement. Canadian Journal of Education, 17(1), 51–65.
Ross, J. A., Hogaboam-Gray, A., & Rolheiser, C. (2002a). Self-evaluation in grade 11 mathematics: Effects on student achievement and student beliefs about ability. In D. McDougall (Ed.), OISE Papers on Mathematical Education (pp. 71-86).
Ross, J. A., Hogaboam-Gray, A., & Rolheiser, C. (2002b). Student self-evaluation in grade 5–6 mathematics: Effects on problem solving achievement. Educational Assessment, 8, 43–58.
Ryan, R. M., & Deci, E. L. (2003). On assimilating identities to the self: A self-determination theory perspective on internalization and integrity within cultures, in: Leary, Mark R. (Ed); Tangney, June Price (Ed), (2003). Handbook of self and identity, (pp. 253-272). New York, NY, US: Guilford Press, xv, 703 pp.
Sabatini, J., & O’Reilly, T. (2013). Rationale for a new generation of reading comprehension assessments. In B. Miller, L. Cutting, & P. McCardle (Eds.), Unraveling the behavioral, neurobiological, and genetic components of reading comprehension, (pp.100-111). Baltimore, MD: Brookes Publishing, Inc.
Sahin, A. S., Ayar, M. A., & Adiguzel, T. T. (2014). STEM Related After-School Program Activities and Associated Outcomes on Student Learning. Educational Sciences: Theory & Practice, 14(1), 309-322. doi:10.12738/estp.2014.1.1876
Salomon, G. (1983). The differential investment of mental effort in learning from different sources. Educational Psychologist, 18.
Schiefele, U. (2001). The role of interest in motivation and learning. In J. M. Collis and S. Messick (Eds.), Intelligence and personality: Bridging the gap in theory and measurement. (pp. 163-194)..
Schmidt, William H., Hsing Chi Wang, & McKnight, Curtis C. (2005). Curriculum coherence: an examination of US mathematics and science content standards from an international perspective. Journal of Curriculum Studies, 37(5), 525–559.
Singh, K., Granville, M., & Dika, S. (2010) Mathematics and Science Achievement: Effects of Motivation, Interest, and Academic Engagement. The Journal of Educational Research, 95 (6), 323-332.
Stage, E. K., Asturias, H., Cheuk, T., Daro, P. A., & Hampton, S. B. (2013). Opportunities and challenges in next generation standards. Science, 340(6130), 276-277.
Stein, M. K., & Wang, M. C. (1988). Teacher development and school improvement: The process of teacher change. Teaching and teacher education, 4(2), 171-187.
Stipek, D., & MacIver, D. (1989). Developmental change in children's assessment of intellectual competence. Child Development, 60(3), 521-538.
NAEP 2018-2019 OMB Clearance: Supporting Statement Part C Page 143
Stipek, D., Salmon, J.M., Givvin, K.B., Kazemi, E., Saxe, G., & MacGyvers, V.L. (1998). The value (and convergence) of practices suggested by motivation research and promoted by mathematics education reformers. Journal for Research in Mathematics Education, 29, 465-488.
Taboada, A., Tonks, S. M., Wigfield, A., & Guthrie, J. T. (2009). Effects of motivational and cognitive variables on reading comprehension. Reading and Writing, 22(1), 85-106.
Thigpen, K (2014) Creating Anytime Anywhere Learning for All Students: Key Elements of a Comprehensive Digital. All for Excellent Education. Retrieved May 16, from http://all4ed.org/wp-content/uploads/2014/06/DigitalInfrastructure.pdf
Trautwein, U. (2007). The homework–achievement relation reconsidered: Differentiating homework time, homework frequency, and homework effort. Learning and Instruction, 17, 372–388. http://dx.doi.org/10.1016/ j.learninstruc.2007.02.009
Trautwein, U., & Köller, O. (2003). The relationship between homework and achievement: Still much of a mystery. Educational Psychology Review, 15, 115–145. http://dx.doi.org/10.1023/A:1023460414243
Trautwein, U., & Lüdtke, O. (2007). Students' self-reported effort and time on homework in six school subjects: Between-students differences and within-student variation. Journal of Educational Psychology, 99(2), 432.
Trautwein, U., Lüdtke, O., Schnyder, I., & Niggli, A. (2006). Predicting homework effort: Support for a domain-specific, multilevel homework model. Journal of Educational Psychology, 98, 438–456. http://dx.doi.org/10.1037/0022-0663.98.2.438
Trautwein, U., Niggli, A., Schnyder, I., & Lüdtke, O. (2009). Between-teacher differences in homework assignments and the development of students' homework effort, homework emotions, and achievement. Journal of Educational Psychology, 101(1), 176.
Treffinger, D. J., Young, G. C., Nassab, C. A., & Selby, E. C. (2008). The talent development planning handbook: Designing inclusive gifted programs. Corwin Press.
Upadhyay, B. (2006). Using students’ lived experiences in an urban science classroom: An elementary school teacher’s thinking. Science Education, 90(1), 94–110.
Vatterott, C. (2010). Five hallmarks of good homework. Educational Leadership, 10–15.
Vlaardingerbroek, B., & Neil Taylor, T. G. (2003). Teacher education variables as correlates of primary science ratings in thirteen TIMSS systems. International Journal of Science Education, 23(4), 429–439.
Webb, Mary E. (2005). Affordances of ICT in science learning: implications for an integrated pedagogy. International Journal of Science Education, 27(6), 705–735.
Wolters, C.A., & Pintrich, P.R. (1998). Contextual differences in student motivation and self-regulated learning in mathematics, English, and social studies classrooms. Instructional Science, 26, 27-47.
NAEP 2018-2019 OMB Clearance: Supporting Statement Part C Page 144

Wolters, C.A., Yu, S.L., & Pintrich, P.R. (1996). The relation between goal orientation and students’’ motivational beliefs and self-regulated learning. Learning and Individual Differences, 8, 211-238.
Windschitl, M. (2009). Cultivating 21st Century Skills in science learners: How systems of teacher preparation and professional development will have to evolve. Paper presented at the National Academies of Science Workshop on 21st century skills, Washington, DC
Xin, M., & Lingling, M. (2004). Modeling stability of growth between mathematics and science achievement during middle and high school. Evaluation Review, 28(2), 104–122.
Zhu, Y., & Leung, F. K. (2011). Motivation and achievement: Is there an East Asian model?. International Journal of Science and Mathematics Education, 9(5), 1189-1212.
Zimmerman, B. J. (2000). Self-efficacy: An essential motive to learn. Contemporary Educational Psychology, 25, 82-91.
Zimmerman, B. J., Bandura, A, & Martinez-Pons, M. (1992). Self-motivation for academic attainment: The role of self-efficacy beliefs and personal goal setting. American Educational Research Journal, 29, 663-676.
NAEP 2018-2019 OMB Clearance: Supporting Statement Part C Page 145
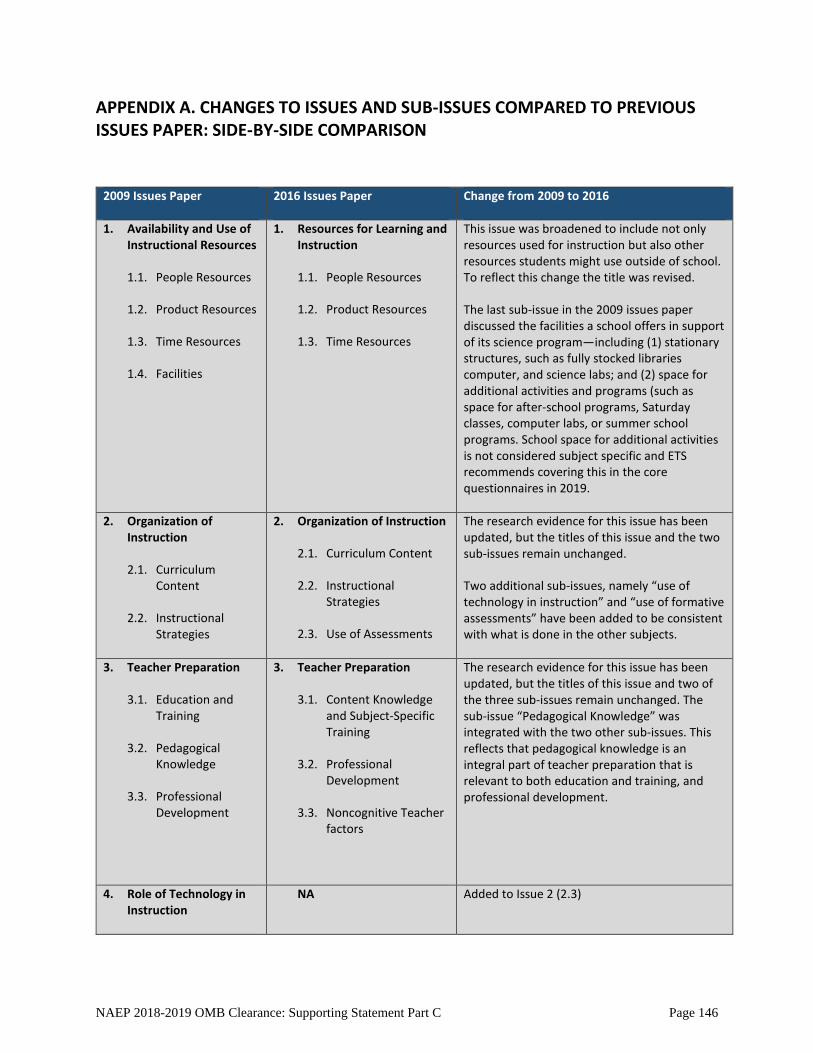
APPENDIX A. CHANGES TO ISSUES AND SUB-ISSUES COMPARED TO PREVIOUS ISSUES PAPER: SIDE-BY-SIDE COMPARISON
2009 Issues Paper 2016 Issues Paper Change from 2009 to 2016
1. Availability and Use ofInstructional Resources
1.1. People Resources
1.2. Product Resources
1.3. Time Resources
1.4. Facilities
1. Resources for Learning andInstruction
1.1. People Resources
1.2. Product Resources
1.3. Time Resources
This issue was broadened to include not only resources used for instruction but also other resources students might use outside of school. To reflect this change the title was revised.
The last sub-issue in the 2009 issues paper discussed the facilities a school offers in support of its science program—including (1) stationary structures, such as fully stocked libraries computer, and science labs; and (2) space for additional activities and programs (such as space for after-school programs, Saturday classes, computer labs, or summer school programs. School space for additional activities is not considered subject specific and ETS recommends covering this in the core questionnaires in 2019.
2. Organization ofInstruction
2.1. CurriculumContent
2.2. Instructional Strategies
2. Organization of Instruction
2.1. Curriculum Content
2.2. InstructionalStrategies
2.3. Use of Assessments
The research evidence for this issue has been updated, but the titles of this issue and the two sub-issues remain unchanged.
Two additional sub-issues, namely “use of technology in instruction” and “use of formative assessments” have been added to be consistent with what is done in the other subjects.
3. Teacher Preparation
3.1. Education andTraining
3.2. Pedagogical Knowledge
3.3. Professional Development
3. Teacher Preparation
3.1. Content Knowledgeand Subject-Specific Training
3.2. Professional Development
3.3. Noncognitive Teacher factors
The research evidence for this issue has been updated, but the titles of this issue and two of the three sub-issues remain unchanged. The sub-issue “Pedagogical Knowledge” was integrated with the two other sub-issues. This reflects that pedagogical knowledge is an integral part of teacher preparation that is relevant to both education and training, and professional development.
4. Role of Technology inInstruction
NA Added to Issue 2 (2.3)
NAEP 2018-2019 OMB Clearance: Supporting Statement Part C Page 146
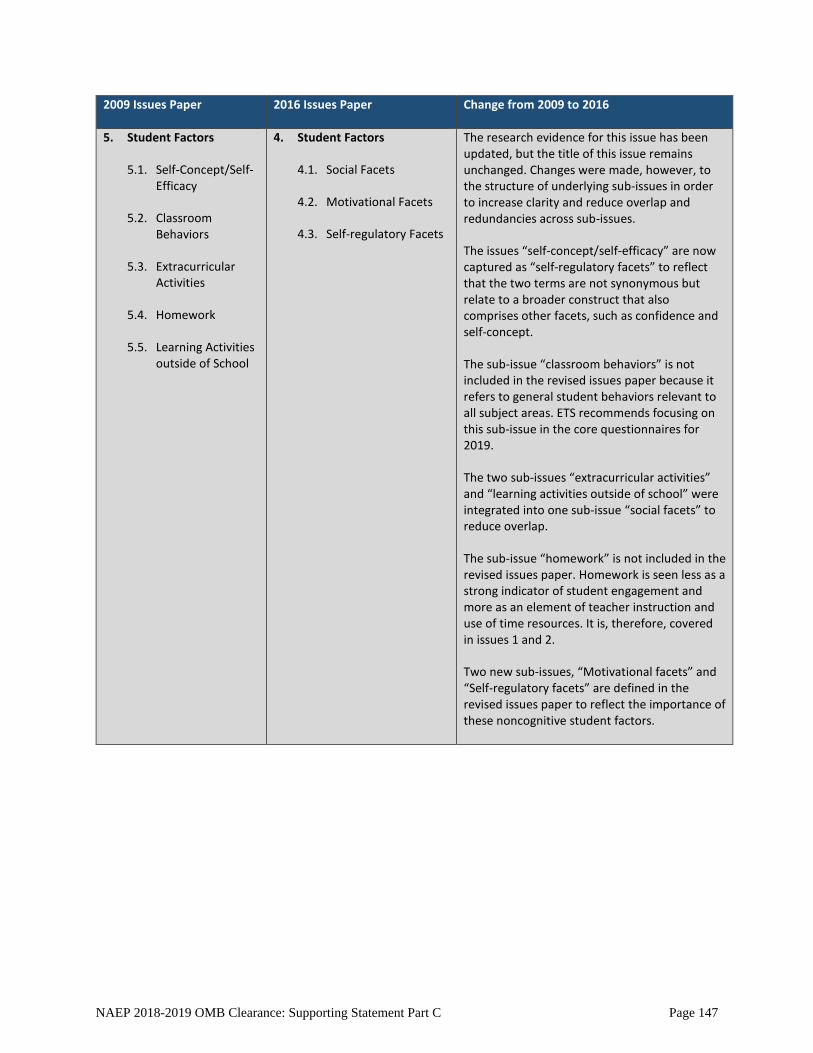
2009 Issues Paper 2016 Issues Paper Change from 2009 to 2016
5. Student Factors
5.1. Self-Concept/Self-Efficacy
5.2. Classroom Behaviors
5.3. Extracurricular Activities
5.4. Homework
5.5. Learning Activities outside of School
4. Student Factors
4.1. Social Facets
4.2. Motivational Facets
4.3. Self-regulatory Facets
The research evidence for this issue has been updated, but the title of this issue remains unchanged. Changes were made, however, to the structure of underlying sub-issues in order to increase clarity and reduce overlap and redundancies across sub-issues.
The issues “self-concept/self-efficacy” are now captured as “self-regulatory facets” to reflect that the two terms are not synonymous but relate to a broader construct that also comprises other facets, such as confidence and self-concept.
The sub-issue “classroom behaviors” is not included in the revised issues paper because it refers to general student behaviors relevant to all subject areas. ETS recommends focusing on this sub-issue in the core questionnaires for 2019.
The two sub-issues “extracurricular activities” and “learning activities outside of school” were integrated into one sub-issue “social facets” to reduce overlap.
The sub-issue “homework” is not included in the revised issues paper. Homework is seen less as a strong indicator of student engagement and more as an element of teacher instruction and use of time resources. It is, therefore, covered in issues 1 and 2.
Two new sub-issues, “Motivational facets” and “Self-regulatory facets” are defined in the revised issues paper to reflect the importance of these noncognitive student factors.
NAEP 2018-2019 OMB Clearance: Supporting Statement Part C Page 147
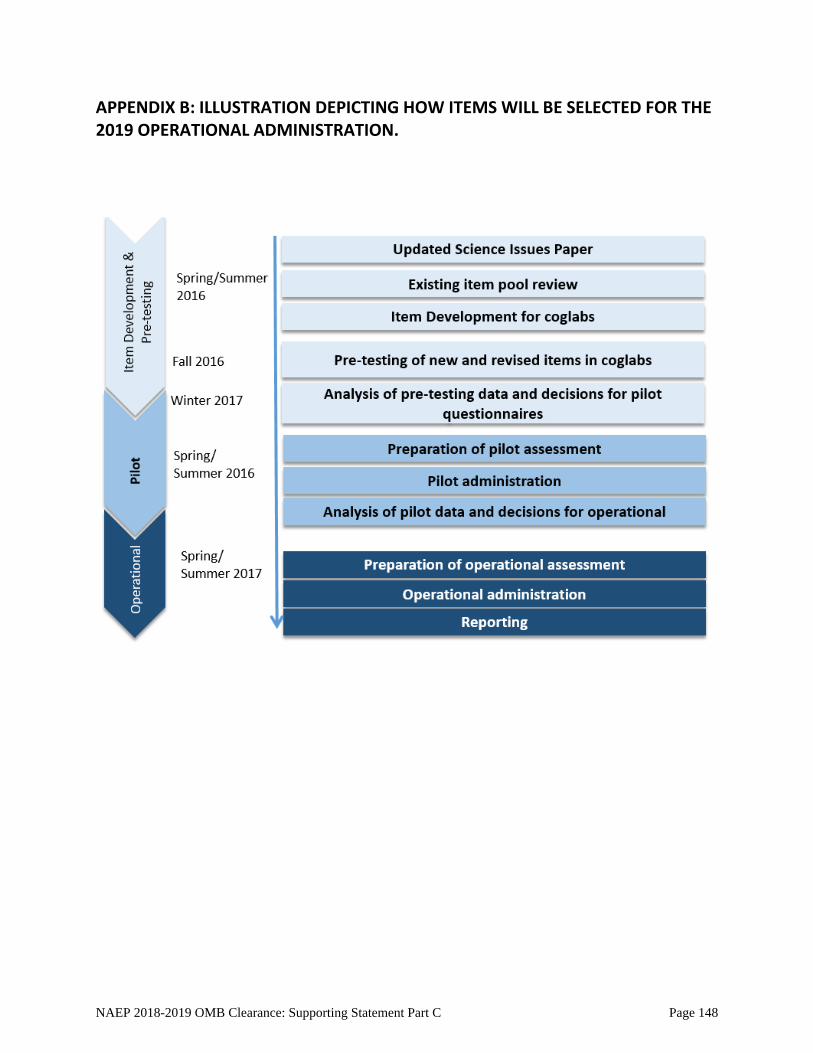
APPENDIX B: ILLUSTRATION DEPICTING HOW ITEMS WILL BE SELECTED FOR THE 2019 OPERATIONAL ADMINISTRATION.
NAEP 2018-2019 OMB Clearance: Supporting Statement Part C Page 148
APPENDIX C: SUBJECT-SPECIFIC TAXONOMY: SCIENCE SURVEY QUESTIONNAIRES
This subject-specific taxonomy provides an overview of the issues and sub-issues to be captured with the three different NAEP respondent groups.
Preliminary considerations for new development to capture all topics in the taxonomy are summarized in the following. Please note the preliminary nature of these recommendations. This taxonomy will be updated throughout item development based on discussions with NCES, the Science Standing Committee, and the National Assessment Governing Board. As can be seen in the table, some issues are addressed with questions for only one respondent groups whereas other issues or sub-issues are intended to be captured with multiple respondent groups. In the latter case, one respondent group is designated primary (as indicated by “X”) and other respondent group(s) are designated as a secondary source (as indicated by “(X)”.
Preliminary considerations for development for Issue 1: Resources for Learning and Instruction
Promising areas for future item development for resources for learning and instruction might include enhancing the measurement of the availability and use of digitally-based resources for practicing and learning science-related content in and outside of the classroom. Item development might also take into consideration use of eBooks and online technology for science learning, participation in science outreach activities and identifying limited resources that deter learning (e.g., limited outside-of-classroom resources, limited outside-of-school resources, classrooms being overcrowded, teachers having too many teaching hours). Furthermore, including items that assess opportunities for teachers to collaborate with each other and/or partner organizations, and time available for learning and instruction could enhance future survey questionnaires.
Preliminary considerations for development for Issue 2: Organization of Instruction
Promising areas for future item development concerning the resources for learning and instruction may be enhancing the measurement of curriculum content, instructional strategies, and teacher practices as three important aspects of opportunity to learn. Questions might also discern between digitally-based science activities and incorporation of web resources, assessments, interactive tools, and multimedia into the classroom. Important questions may concern how teachers adapt their teaching practices to the rapid technological changes and the new standards established for science teaching and learning, how teachers use technological devices to engage students with science, and how digitally-based science activities impact the curricula at the different grade levels. One particular area for potential development in the context of NAEP concerns the identification of contextual factors relevant for students’ experiences with interactive computer tasks to better understand student performance on the science assessments in NAEP.
Preliminary considerations for development for Issue 3: Teacher Preparation
Promising areas for future item development for teacher preparation may include the measurement of teachers’ preparedness to implement the recent nationally recognized standards for science instruction, with and instructional strategies that are used to encourage scientific practices and inquiry. Areas for future development may also include instructional strategies that incorporate the use of emerging digital technology and the incorporation of serious games and popular games into instruction in
NAEP 2018-2019 OMB Clearance: Supporting Statement Part C Page 149
purposeful ways. Additional development may also consider teachers’ experiences with professional development (PD); specifically, their experiences and participation in programs that are content-focused versus programs that are pedagogical focused, programs that focus on incorporating digital technology into the classroom such as websites, apps, digital simulations, serious games, and popular games, and programs that use digital technology to personalize learning and skill acquisition. PD considerations may also include teachers’ experience and participation in web-based trainings and the use of digital resources to add depth and breadth of content delivered. Areas for future development may also include noncognitive teacher factors, (e.g., teacher attribution) and teachers’ views of learning and instruction to ensure alignment with the NAEP statute to refrain from measuring “personal or family beliefs and attitudes.”
Preliminary considerations for development for Issue 4: Student Factors
Promising areas for future item development for student factors may focus on capturing the different aspects of noncognitive student factors given that they represent important performance predictors, moderators, or mediators of academic achievement. Future item development should focus on capturing social, motivational, and self-regulatory facets such as student engagement, achievement goals, self-efficacy, and self-control as they relate to science learning. Future development may also focus on relevant activities inside and outside of school, student motivation, and specific beliefs or attitudes toward science topics.
General considerations for questionnaire assembly
Matrix sampling (“spiraling”) will be used in the pilot administration for the 2019 science survey questionnaires in order to test a larger number of items than what can be taken to operational, and to keep respondent burden as low as possible. This approach is consistent with pilot approaches for other subjects.
While a rotation method (i.e., rotation topics across assessment cycles) remains an option, it is deemed less practical for assessments that are administered on a 4-year cycle, such as Science. Rotating topics across cycles would lead to a very sparse trend line on relevant topics and questions. We therefore aim to establish a trend line on important contextual factors that spans through several consecutive administration years. During pilots, matrix sampling ("spiraling") will be used to lower respondent burden. During operational assessments, questionnaire length will be determined based on timing data while ensuring that 90% of all students can answer all questions in time. Rather than rotating topics across years, we recommend selecting the most important topics for any given administration with some topics being trend topics and other topics being new topics with a new cycle. This will ensure that the policy relevance of the survey questionnaires to provide context for the cognitive assessment is maximized.
NAEP 2018-2019 OMB Clearance: Supporting Statement Part C Page 150
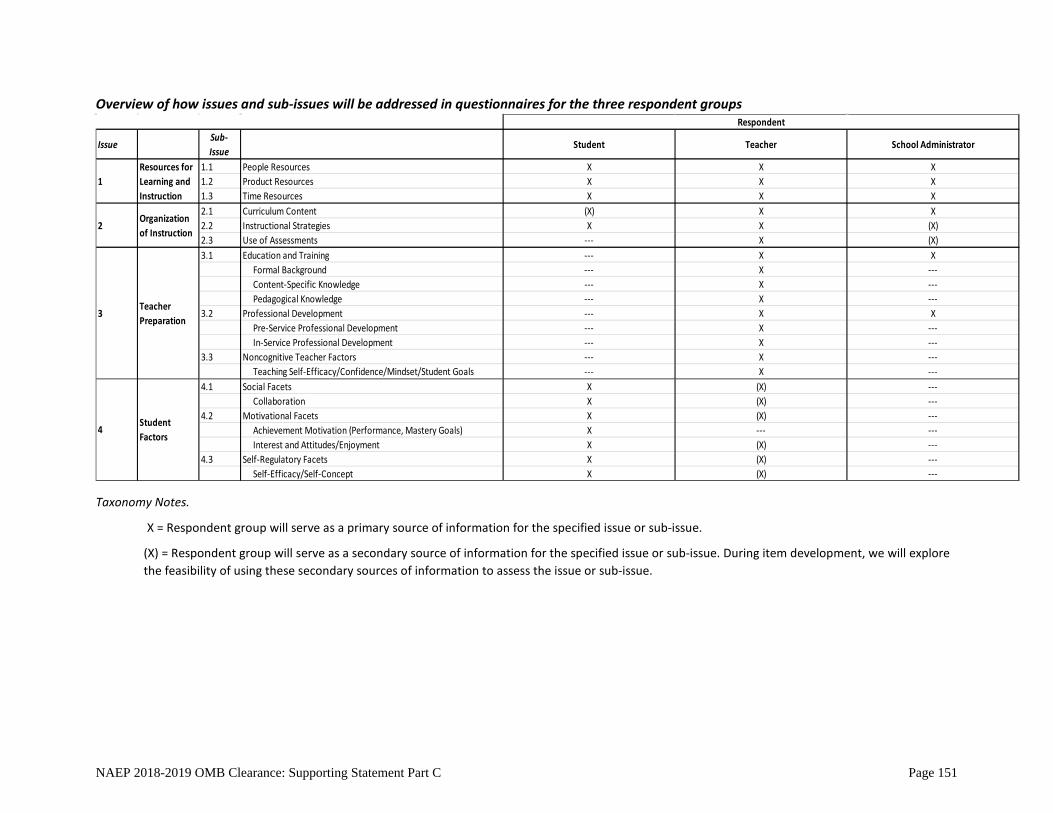
Overview of how issues and sub-issues will be addressed in questionnaires for the three respondent groups
Taxonomy Notes.
X = Respondent group will serve as a primary source of information for the specified issue or sub-issue.
(X) = Respondent group will serve as a secondary source of information for the specified issue or sub-issue. During item development, we will explore the feasibility of using these secondary sources of information to assess the issue or sub-issue.
IssueSub-Issue
Student Teacher School Administrator
1.1 People Resources X X X1.2 Product Resources X X X1.3 Time Resources X X X2.1 Curriculum Content (X) X X2.2 Instructional Strategies X X (X)2.3 Use of Assessments --- X (X)3.1 Education and Training --- X X
Formal Background --- X --- Content-Specific Knowledge --- X --- Pedagogical Knowledge --- X ---
3.2 Professional Development --- X X Pre-Service Professional Development --- X --- In-Service Professional Development --- X ---
3.3 Noncognitive Teacher Factors --- X --- Teaching Self-Efficacy/Confidence/Mindset/Student Goals --- X ---
4.1 Social Facets X (X) --- Collaboration X (X) ---
4.2 Motivational Facets X (X) --- Achievement Motivation (Performance, Mastery Goals) X --- --- Interest and Attitudes/Enjoyment X (X) ---
4.3 Self-Regulatory Facets X (X) --- Self-Efficacy/Self-Concept X (X) ---
4Student Factors
Respondent
1Resources for Learning and Instruction
2Organization of Instruction
3Teacher Preparation
NAEP 2018-2019 OMB Clearance: Supporting Statement Part C Page 151
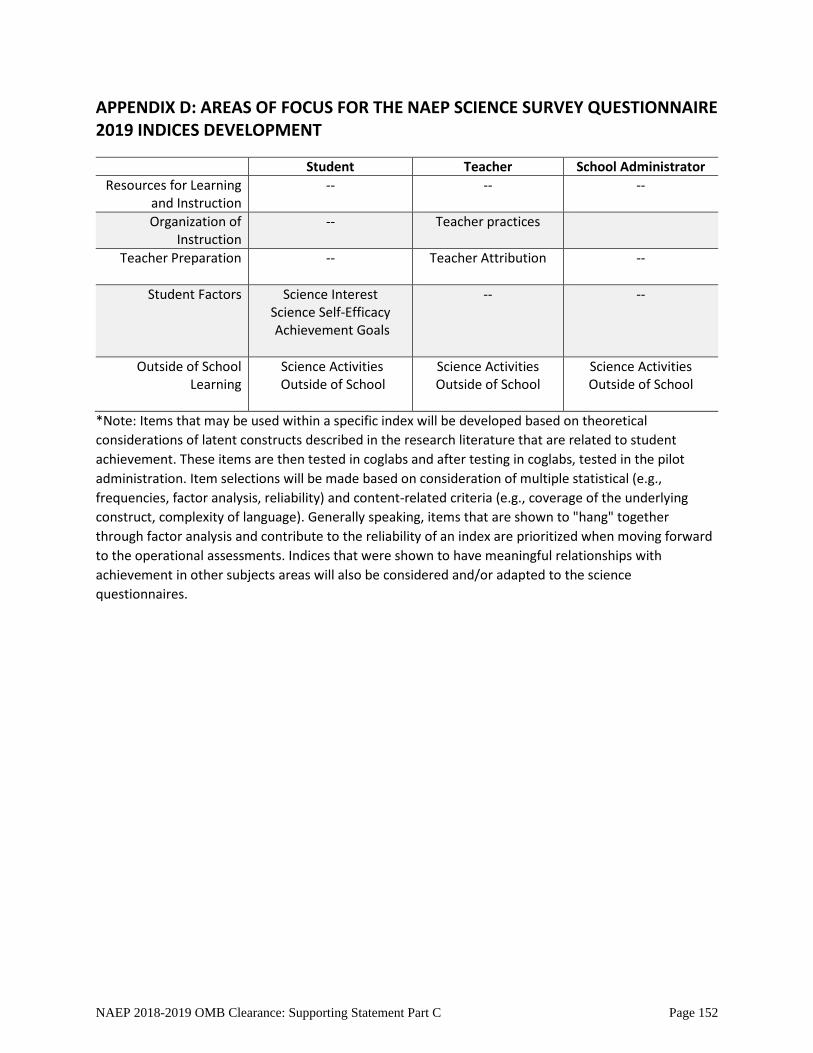
APPENDIX D: AREAS OF FOCUS FOR THE NAEP SCIENCE SURVEY QUESTIONNAIRE 2019 INDICES DEVELOPMENT
Student Teacher School Administrator Resources for Learning
and Instruction -- -- --
Organization of Instruction
-- Teacher practices
Teacher Preparation -- Teacher Attribution --
Student Factors Science Interest Science Self-Efficacy Achievement Goals
-- --
Outside of School Learning
Science Activities Outside of School
Science Activities Outside of School
Science Activities Outside of School
*Note: Items that may be used within a specific index will be developed based on theoreticalconsiderations of latent constructs described in the research literature that are related to student achievement. These items are then tested in coglabs and after testing in coglabs, tested in the pilot administration. Item selections will be made based on consideration of multiple statistical (e.g., frequencies, factor analysis, reliability) and content-related criteria (e.g., coverage of the underlying construct, complexity of language). Generally speaking, items that are shown to "hang" together through factor analysis and contribute to the reliability of an index are prioritized when moving forward to the operational assessments. Indices that were shown to have meaningful relationships with achievement in other subjects areas will also be considered and/or adapted to the science questionnaires.
NAEP 2018-2019 OMB Clearance: Supporting Statement Part C Page 152
Part C-5: 2011 Writing Issues Paper
NAEP 2018-2019 OMB Clearance: Supporting Statement Part C Page 153
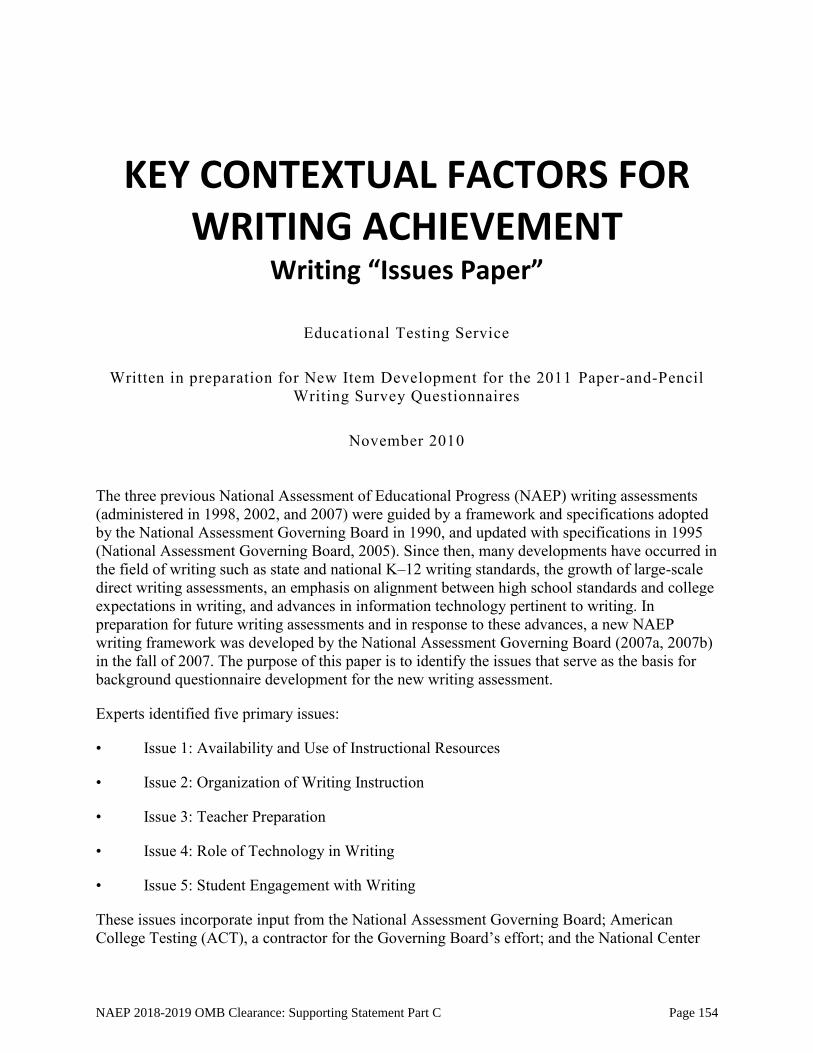
KEY CONTEXTUAL FACTORS FOR WRITING ACHIEVEMENT
Writing “Issues Paper”
Educational Testing Service
Written in preparation for New Item Development for the 2011 Paper-and-Pencil Writing Survey Questionnaires
November 2010
The three previous National Assessment of Educational Progress (NAEP) writing assessments (administered in 1998, 2002, and 2007) were guided by a framework and specifications adopted by the National Assessment Governing Board in 1990, and updated with specifications in 1995 (National Assessment Governing Board, 2005). Since then, many developments have occurred in the field of writing such as state and national K–12 writing standards, the growth of large-scale direct writing assessments, an emphasis on alignment between high school standards and college expectations in writing, and advances in information technology pertinent to writing. In preparation for future writing assessments and in response to these advances, a new NAEP writing framework was developed by the National Assessment Governing Board (2007a, 2007b) in the fall of 2007. The purpose of this paper is to identify the issues that serve as the basis for background questionnaire development for the new writing assessment.
Experts identified five primary issues:
• Issue 1: Availability and Use of Instructional Resources
• Issue 2: Organization of Writing Instruction
• Issue 3: Teacher Preparation
• Issue 4: Role of Technology in Writing
• Issue 5: Student Engagement with Writing
These issues incorporate input from the National Assessment Governing Board; American College Testing (ACT), a contractor for the Governing Board’s effort; and the National Center
NAEP 2018-2019 OMB Clearance: Supporting Statement Part C Page 154
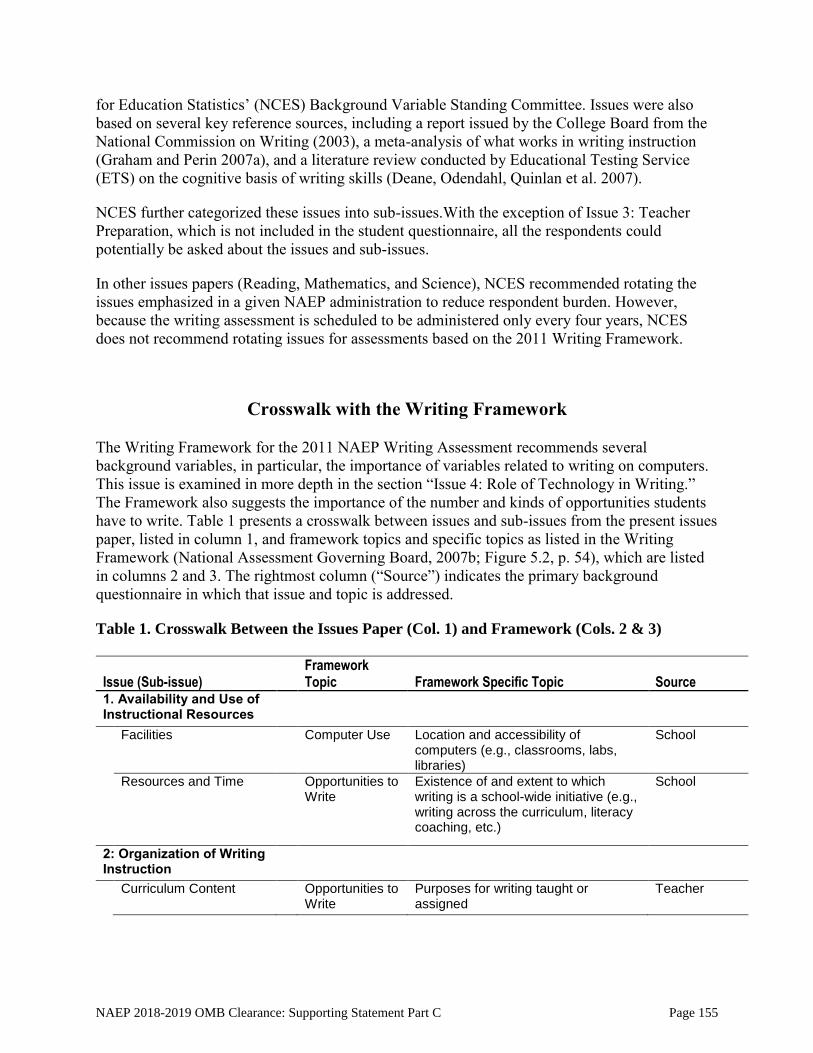
for Education Statistics’ (NCES) Background Variable Standing Committee. Issues were also based on several key reference sources, including a report issued by the College Board from the National Commission on Writing (2003), a meta-analysis of what works in writing instruction (Graham and Perin 2007a), and a literature review conducted by Educational Testing Service (ETS) on the cognitive basis of writing skills (Deane, Odendahl, Quinlan et al. 2007).
NCES further categorized these issues into sub-issues.With the exception of Issue 3: Teacher Preparation, which is not included in the student questionnaire, all the respondents could potentially be asked about the issues and sub-issues.
In other issues papers (Reading, Mathematics, and Science), NCES recommended rotating the issues emphasized in a given NAEP administration to reduce respondent burden. However, because the writing assessment is scheduled to be administered only every four years, NCES does not recommend rotating issues for assessments based on the 2011 Writing Framework.
Crosswalk with the Writing Framework
The Writing Framework for the 2011 NAEP Writing Assessment recommends several background variables, in particular, the importance of variables related to writing on computers. This issue is examined in more depth in the section “Issue 4: Role of Technology in Writing.” The Framework also suggests the importance of the number and kinds of opportunities students have to write. Table 1 presents a crosswalk between issues and sub-issues from the present issues paper, listed in column 1, and framework topics and specific topics as listed in the Writing Framework (National Assessment Governing Board, 2007b; Figure 5.2, p. 54), which are listed in columns 2 and 3. The rightmost column (“Source”) indicates the primary background questionnaire in which that issue and topic is addressed.
Table 1. Crosswalk Between the Issues Paper (Col. 1) and Framework (Cols. 2 & 3)
Issue (Sub-issue) Framework Topic Framework Specific Topic Source
1. Availability and Use ofInstructional Resources
Facilities Computer Use Location and accessibility of computers (e.g., classrooms, labs, libraries)
School
Resources and Time Opportunities to Write
Existence of and extent to which writing is a school-wide initiative (e.g., writing across the curriculum, literacy coaching, etc.)
School
2: Organization of Writing Instruction
Curriculum Content Opportunities to Write
Purposes for writing taught or assigned
Teacher
NAEP 2018-2019 OMB Clearance: Supporting Statement Part C Page 155
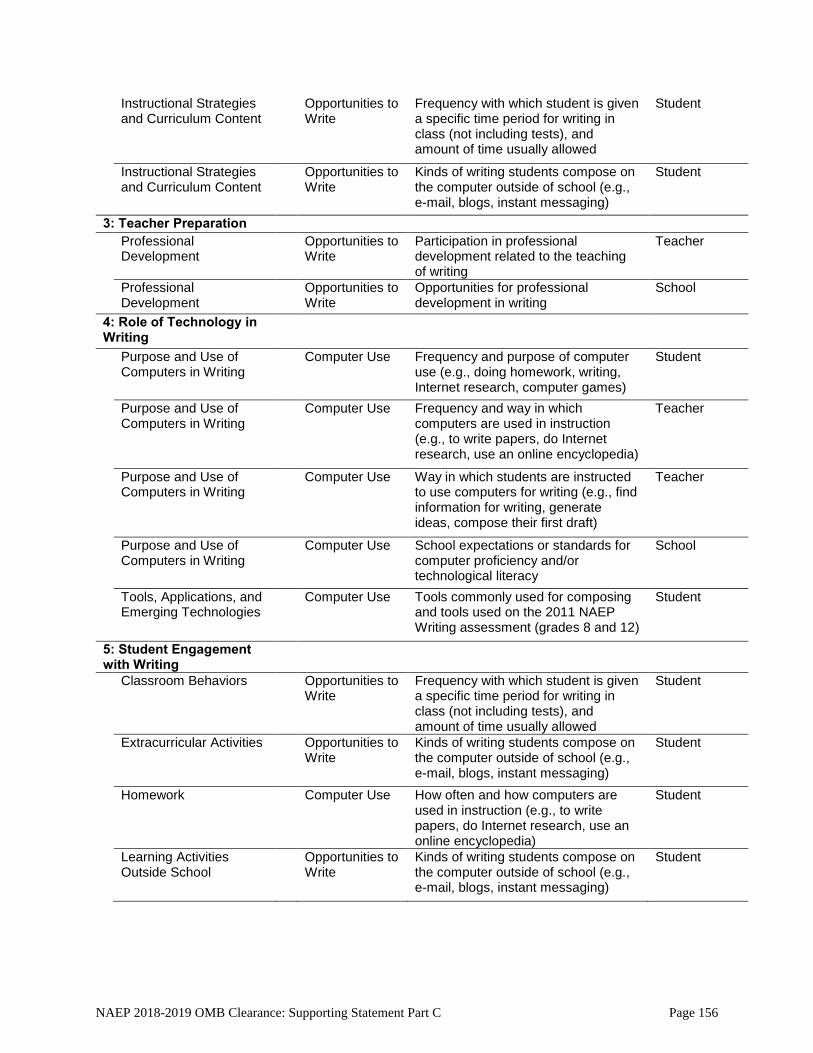
Instructional Strategies and Curriculum Content
Opportunities to Write
Frequency with which student is given a specific time period for writing in class (not including tests), and amount of time usually allowed
Student
Instructional Strategies and Curriculum Content
Opportunities to Write
Kinds of writing students compose on the computer outside of school (e.g., e-mail, blogs, instant messaging)
Student
3: Teacher Preparation Professional Development
Opportunities to Write
Participation in professional development related to the teaching of writing
Teacher
Professional Development
Opportunities to Write
Opportunities for professional development in writing
School
4: Role of Technology in Writing
Purpose and Use of Computers in Writing
Computer Use Frequency and purpose of computer use (e.g., doing homework, writing, Internet research, computer games)
Student
Purpose and Use of Computers in Writing
Computer Use Frequency and way in which computers are used in instruction (e.g., to write papers, do Internet research, use an online encyclopedia)
Teacher
Purpose and Use of Computers in Writing
Computer Use Way in which students are instructed to use computers for writing (e.g., find information for writing, generate ideas, compose their first draft)
Teacher
Purpose and Use of Computers in Writing
Computer Use School expectations or standards for computer proficiency and/or technological literacy
School
Tools, Applications, and Emerging Technologies
Computer Use Tools commonly used for composing and tools used on the 2011 NAEP Writing assessment (grades 8 and 12)
Student
5: Student Engagement with Writing
Classroom Behaviors Opportunities to Write
Frequency with which student is given a specific time period for writing in class (not including tests), and amount of time usually allowed
Student
Extracurricular Activities Opportunities to Write
Kinds of writing students compose on the computer outside of school (e.g., e-mail, blogs, instant messaging)
Student
Homework Computer Use How often and how computers are used in instruction (e.g., to write papers, do Internet research, use an online encyclopedia)
Student
Learning Activities Outside School
Opportunities to Write
Kinds of writing students compose on the computer outside of school (e.g., e-mail, blogs, instant messaging)
Student
NAEP 2018-2019 OMB Clearance: Supporting Statement Part C Page 156
Issue 1: Availability and Use of Instructional Resources
Instructional resources comprise four relevant sub-issues: staff, materials and resources, time, and facilities. Although these sub-issues are closely interrelated, we present them separately for purposes of discussion.
People
The most obvious component of a school’s staff resources comprises the individuals who provide instruction. Aspects of staff composition include the student-to-teacher ratio, the proportion of writing teachers who have an undergraduate or graduate degree in a writing discipline, and the availability of curriculum specialists.
Materials and Resources (Products)
The availability of writing texts may be important, along with other materials that could serve as models of good writing—newspapers, magazines, books, and literary journals. In addition to texts, writing rubrics can be considered a resource. One recommendation of the National Commission on Writing (College Board 2003) to help schools create skillful writers was to measure results with assessments. This suggests an emphasis on evaluating writing by highlighting and making explicit the importance of the development and organization of ideas, and of language facility when assessing student writing. Also important is using good models of writing, such as rubrics in the classroom and in writing assignments to help students understand expectations for writing (Graham & Perin 2007b).
Time
Adolescents need to develop strong writing skills to participate fully in a highly technological society—to be successful at the postsecondary level, to obtain more than menial employment, and to participate fully as an adult member of the community (Perrin 2001). Because of the importance of writing, a key recommendation by the National Commission on Writing (College Board 2003) was to increase the time students spend in and out of school on writing, across the curriculum. This recommendation follows a finding that most students spend little time writing, and consequently do not have sufficient time to practice. Trend data on the amount of time students spend writing could be analyzed to determine the degree to which this recommendation is being implemented.
Accountability Testing
The amount of time spent on writing could be related to accountability testing. The growth in accountability testing in writing by itself, or in conjunction with other content areas, could influence the attention writing receives in the schools, how writing is taught, and what writing practices are used. Schools might vary in their writing instruction objectives, in the existence of and extent to which writing is a schoolwide initiative (e.g., writing across the curriculum, literacy
NAEP 2018-2019 OMB Clearance: Supporting Statement Part C Page 157
coaching, etc.), and in the extent to which opportunities for professional development in writing are encouraged, not just by the language arts faculty but by all teachers.
There is widespread interest in how school writing instruction is influenced by the curriculum and the accountability policy―for example, knowing the degree to which writing instruction and assessments are influenced by nationally mandated writing assessments, or by the state accountability testing writing tasks. More generally, how do certain educational policies (e.g., NCLB) affect writing instruction at school, and how influential are state standards or large-scale writing assessments on instruction (i.e., the extent to which the school is driven by state assessments)? There is also an issue of the role and extent of test preparation for college entrance tests in the English or language arts curriculum.
Facilities
In writing, the use of facilities such as libraries or computer labs provides support to writing instruction and opportunities to practice and improve writing. There is a general question about the importance of access to writing facilities or technology (hardware and software) on writing achievement. Although most students have access to a computer and the Internet at home (92 percent and 90 percent of eighth graders, respectively; U.S. Department of Education, 2009), there are wide disparities in access associated with race and income. For example, 19 percent of eighth-grade students who are eligible for a free lunch, 18 percent of American Indian students, and 16 percent of Hispanic students answered “no” to the question of whether they use the Internet at home, compared to only 5 percent of the White students who answered that way. Similar numbers were associated with the question of whether there is a computer available at home. School-level data have recently suggested that equity issues in computer access have been reduced, but at the student level, issues of access have not been completely resolved (Applebee 2005). For example, fewer computers with Internet access have been available in schools serving high proportions of minority students than in schools with low proportions of minority students, and more White students have reported using a computer for writing compared with Black and Hispanic students (Applebee 2005). Within schools, location and accessibility of computers (e.g., classrooms, labs, and library) may be an equity issue.
Issue 2: Organization of Writing Instruction
The 2011 NAEP Writing assessment measures three communicative purposes common to academic and professional settings. These are to persuade, to change the readers’ point of view or affect the reader’s action, to explain, to expand the reader’s understanding, and to convey experience, real or imagined, to communicate individual and imagined experience to others. These purposes of writing are recognized in the issues that inform background questionnaire development for the writing assessment based on the 2011 writing framework. Organization of writing instruction is conceptualized as encompassing two sub-issues: curriculum content and instructional strategies, discussed separately.
Curriculum Content
Writing instruction can occur within the context of the language arts or English classroom, where instruction focuses on developing students’ writing skills. Students are expected to perform a
NAEP 2018-2019 OMB Clearance: Supporting Statement Part C Page 158
wide variety of writing in school, including stories, persuasive essays, logs or journals, research reports, summaries of readings, and analyses and interpretations. As the Graham and Perin (2007a) meta-analysis showed, it is important to provide students with pertinent models to improve their writing ability. It is uncertain how much instructional time is devoted to writing that explains, persuades, shares feelings, or tells stories, and the frequency with which a specific audience or kinds of audiences.
However, writing is not limited to the language arts or English classroom. Such a limitation artificially separates writing from content knowledge. As Hillocks (2002) points out in his critique of state writing assessments, one of the biggest problems in many assessments is the lack of a substantive content base for writing assignments, resulting in writing that is formulaic and shallow. There are various ways to combine writing instruction with content instruction (Graham and Perrin 2007b; Shanahan 2004), such as with the applied academics and learning community approaches.
In applied academics the language arts or English teacher as well as a learning specialist could use subject matter, such as science, social studies, or mathematics, as the content of writing instruction. For example, strategies for writing persuasive essays might be taught using text read in a concurrent social studies class. Alternatively, a content-area teacher could teach writing skills in the course of teaching subject matter, as encouraged by content-area literacy educators (e.g., Alvermann and Phelps 2002).
With a learning community approach (Perrin 2001), a content-area teacher and the English or language arts instructor would align their curricula, giving students assignments that would connect writing and content instruction. This was illustrated in a study by De La Paz (2005), when a history teacher taught reasoning strategy using historical documents, and the English teacher used the same historical documents as models for writing argumentation essays. The effectiveness of these various formats has not been tested nor has a comparison been made between the two (Graham and Perin, 2007a).
Recent research in writing emphasizes the extent to which writing genres are socially situated and context specific (Applebee 2007). For example, Miller (1984) emphasizes genre as social action, and the Australian genre theorists (Halliday and Martin 1993; Cope and Kalantzis 1993) provide a systemic linguistics approach. These perspectives challenge the traditional emphasis on writing as a generic skill, taught primarily in English or language arts and tested through generic writing tasks detached from particular disciplinary or socially constituted contexts. They suggest that what counts as effective argument and persuasive evidence shifts in moving from one context to another, so that what counts as “good writing” is itself socially constructed and context specific. For example, science writing has many features that English teachers would ordinarily find objectionable—such as reliance on technical vocabulary, use of the passive voice, and nominalization (use of verbs and adjectives as nouns)―though these features have evolved in science writing to serve particular communicative needs (Halliday and Martin 1993).
Two additional forms of writing have received attention in the recent writing literature—on-demand writing and nonacademic writing. On-demand writing asks the student to write about some topic more or less immediately, with a time limit. This form of writing is commonly assessed with standardized tests. It is sometimes contrasted to writing based on having the time
NAEP 2018-2019 OMB Clearance: Supporting Statement Part C Page 159
to do research and make revisions based on reviews or audience reactions, prior to composing a final draft. On-demand writing commonly occurs in business and is therefore a practical kind of writing. Issues worth exploring related to on-demand writing concern how often students practice this kind of writing in class, and how much time do teachers typically allow for it. The other rather new form of writing is nonacademic writing, where the student composes on the computer outside of school, for example, in e-mails, blogs, and instant messages. There is an issue with rapid changes in technology about terminology for this kind of writing.
Instructional Strategies
A meta-analysis on the effectiveness of various writing instructional strategies (Graham and Perin 2007a; Appendix) showed that it is advantageous to explicitly and systematically teach students the processes and strategies involved in writing, including planning, sentence construction, summarizing, and revising. It is also advantageous for teachers to structure writing by having students work together in an organized fashion; establishing clear and reachable goals for writing assignments; providing models of what the end product should look like; and engaging students in activities that help them acquire, evaluate, and organize ideas for their writing. The meta-analysis provided evidence for the importance of these and other specific writing strategies, such as inquiry activities, pre-writing, and instruction in how to write increasingly complex sentences. The findings were generally consistent with previous meta-analyses (Bangert-Drowns 1993; Goldberg et al. 2003; Graham 2006, Graham and Harris 2003; Hillocks 1986). There is also some evidence that integrating some of the specific treatments, such as process writing and strategy instruction, can be beneficial (Curry 1997; Danoff, Harris, and Graham 1993). These findings suggest that it is important to determine the extent to which these practices are being implemented.
In summary, important issues are the prevalence of activities such as brainstorming with others, working in groups to improve writing, organizing a paper before writing, writing more than one draft, and correcting mistakes. Additional important issues are the emphasis that is placed on grammar and on process-oriented instruction, and whether there is explicit instruction on writing strategies. It is important to assess the degree to which these instructional strategies are used in the classrooms.
Issue 3: Teacher Preparation
Because of its profound impact on student achievement, teacher preparation continues to be a crucial issue for writing (College Board 2003). Teacher preparation reflects three sub-issues: education and training, pedagogical knowledge, and professional development.
Education and Training
Education and training refer to teachers’ academic preparation, both in the discipline of writing and in teaching. Gathering data on the academic preparation of those who teach writing is particularly challenging because of the variety of academic backgrounds associated with writing instructors. Expertise in writing can be acquired through academic preparation in many disciplines—the humanities, social sciences, as well as English and language arts. And teachers in other disciplines may be responsible for some of the writing instruction as discussed in the curriculum content sub-issue (within Issue 2).
NAEP 2018-2019 OMB Clearance: Supporting Statement Part C Page 160
Pedagogical Knowledge
Given the importance of the various strategies that were proven effective in enhancing writing (Graham and Perin, 2007a), pedagogical knowledge is particularly important for teaching writing. Professional preparation for writing instruction can come in the form of classes and seminars, and be validated through certification. Some schools may promote or deliberately make such opportunities for professional development available. Informal professional development may also be useful. For example, teachers may engage in writing outside of school such as conducting research and writing to publish, or writing newsletter articles, journals, novels, and short stories.
Professional Development
The National Commission on Writing (College Board 2003) recommends increasing teacher professional development for writing. The effectiveness of teacher professional development on writing achievement was supported by a meta-analysis concerned with which interventions produced successful writing outcomes (Graham and Perin, 2007a). Providing teachers with professional development in how to implement the process-writing approach was associated with improved student writing in grades 4–12. Use of the process-writing approach without professional development was still effective but with a smaller effect size. The positive impact of professional development in the process-writing approach supports the work of the National Writing Project (NWP: Nagin 2003), as five of the six studies in the meta-analysis assessed the impact of NWP training. Many of the components included in the NWP model, e.g., peers working together, inquiry, and sentence combining (Nagin 2003), were independently found to enhance student writing in the meta-analysis. It is important to assess the degree to which professional development experiences reflect methods that are known to be effective in enhancing student writing achievement.
There may also be particular issues associated with writing instruction for students with disabilities (SD) and English language learners (ELL). For example, the National Writing Project, a federally funded professional development network that serves teachers of writing at all grade levels, provides several resources for specialized writing instruction for special populations.
Issue 4: Role of Technology in Writing
Technology plays an important role in writing. The emphasis on technology in the writing process and on writing opportunities throughout the curriculum and beyond reflects the shifts in information technologies, writing instruction, and accountability (e.g., high-stakes testing, state standards) that occurred during the tenure of the last NAEP framework. One of the key recommendations by the National Commission on Writing (College Board 2003) was to apply technology to the teaching, development, grading, and assessment of writing.
Because of its importance, the role of technology sub-issue “Use of Computers and New Technologies” is divided into two parts—the purpose and use of computers in writing; and tools, applications, and emerging technologies. These topics are related, but it is useful to present them separately.
NAEP 2018-2019 OMB Clearance: Supporting Statement Part C Page 161
Use of Computers and New Technologies
Purpose and Use of Computers in Writing
Data can be gathered on practices related to student writing achievement, such as writing assignments, e-mailing, and Internet searches. While many studies have been conducted on computer usage—particularly in relation to demographic factors such as race/ethnicity or socioeconomic status—and many have looked at student writing performance on computers, information on how students use computers and how computers are integrated into writing (as well as other subject areas) provides a useful snapshot of the impact informational technologies have on classroom practices. Almost all students use computers to some degree (DeBell and Chapman 2006). However, the extent of computer use for specific purposes, such as homework, Internet searches, games, and writing per se, undoubtedly varies among students and seems likely to be related to writing achievement, yet surprisingly little is known thus far on the extent of that relationship.
The frequency of computer use, both within the classroom and through homework assignments, can be determined by addressing the following:
Do teachers use computers as part of daily instruction?
Do schools have policies on what students are allowed to do on school computers?
Do schools have expectations for computer proficiency and technological literacy?
Writing technology may also vary by the point in the instruction or composition at which it is introduced. Students may create first drafts on the computer but edit with paper-and-pencil, or vice versa. There may be a variety of pedagogical strategies for how students are instructed to write on computers.
Tools, Applications, and Emerging Technologies
There is evidence that writing achievement increases when students use word processing as a primary tool for writing (Graham and Perin 2007a). Several studies suggest that using word processing applications can lead to more collaboration with other writers, support the production of longer compositions, and encourage the use of researched arguments that require inquiry and investigation (Baker and Kinzer 1998; Goldberg, Russell, and Cook 2003; Graham and Perin 2007a; Grejda and Hannafin 1992, Lunsford and Lunsford, in press). It is not clear which specific components of word processing applications, such as cut/copy/paste; select all; spell check; grammar check; or access to a dictionary, encyclopedia, or thesaurus are responsible for these effects. It may also be useful to examine the degree to which other technologies related to writing, such as the Internet, graphics, hypertext, multimedia, and web development tools, are used. Do the schools allow these tools in school or for homework?
There are also emerging various new collaborative writing tools such as wikis (a collaborative website whose content can be edited by anyone who has access to it). Collaborative writing was shown to be effective in increasing writing achievement (Graham and Perrin 2007a). However,
NAEP 2018-2019 OMB Clearance: Supporting Statement Part C Page 162
the terrain shifts rapidly with these kinds of technologies, and so this issue has to be addressed at a fairly abstract level.
There is also an issue with the mode of writing. On the one hand, assessments that require students to generate responses using paper and pencil severely underestimate the achievement of fourth and eighth grade students accustomed to writing using a computer. (Russell & Platti, 2002). On the other, students may vary in their keyboarding skills due to differential familiarity and practice opportunities and poor keyboarding skills may lead to worse performance on a computer-based writing assessment (Russell, 2006).
Issue 5: Student Engagement with Writing
In an ideal educational environment, the purpose of the first four issues—resources, instruction, teacher preparation, and technology—is to enhance students’ engagement with writing. During students’ school years, behavior signaling such engagement includes participating in school-sponsored extracurricular activities and participating in non-school activities related to writing. Relevant activities include writing for the school newspaper, and writing articles, fiction, poems, letters to the editor, newsletters, and so forth.
Following graduation, selecting a career that emphasizes writing demonstrates continued engagement. This issue defines students’ writing engagement in terms of activities in which they are currently involved and in which they can envision themselves pursuing in adulthood.
Self-Concept/Self-Efficacy
Self-efficacy refers to beliefs about one’s capabilities in specific settings, such as writing. These beliefs partially determine how individuals use the knowledge and skills they have to achieve a certain task (Pajares and Schunk 2001). Self-efficacy beliefs relate to self-concept and motivation (Zimmerman 2000), and they affect academic achievement (Pajares 1996). Self-efficacy in writing affects engagement in writing (Pintrich and De Groot 1990) and leads to more frequent and increased use of cognitive strategies, leading to higher achievement (Pajares and Schunk 2001). Self-efficacious students engage in self-regulating strategies, which enhance performance due to increased persistence (Pajares 1996; Bouffard-Bouchard, Parent, and Larivee, 1991; Berry 1987).
Academic achievement reflects experiences, abilities, and prior achievement but is also related to self-efficacy, which moderates the effects of those other influences on academic achievement (Zimmerman, Bandura, and Martinez-Pons 1992; Pajares 1996). Meta-analysis indicates that self-efficacy is related to academic outcomes (Multon, Brown, and Lent 1991), and these effects become stronger as students progressed from elementary school to high school to college (Pajares and Schunk 2001).
Classroom Behaviors
Academic and school-oriented behaviors, such as increased interest in schoolwork, striving to make good grades, and active attempts at subject mastery in areas including writing have been consistently linked to positive academic outcomes including writing (Wentzel 1993).
NAEP 2018-2019 OMB Clearance: Supporting Statement Part C Page 163
Appropriate classroom behaviors are also correlated with academic achievement (Malecki and Elliott 2002; DiPerna and Elliot 1999; Feshbach and Feshbach 1987; Green, Forehand, Beck, and Vosk 1980; Lambert and Nicholl 1977). Similarly, social skills predict academic achievement (Malecki and Elliot 2002). Disruptive and disinterested students may not strive for or achieve academic success, as such behaviors often lead to negative treatment by the teacher and classmates. Disruptive behaviors affect the student-teacher relationship, hindering the student’s academic achievement (Wentzel 1993). (Note: The new writing framework does not emphasize students' classroom behaviors. Thus this construct is considered low priority at this time.)
Extracurricular Activities
Student engagement also has been noted to be related to involvement in extracurricular activities (Fredricks and Eccles 2006; The Center for Comprehensive School Reform and Improvement 2007). These activities, including music, fine arts, academic clubs, athletics, and other organized activities, have been shown to be beneficial to academic growth. Participation in such activities can provide students with opportunities to learn about teamwork, respect, and responsibility, and provide a venue for the student to apply these lessons (NCES 1995). Participation in extracurricular activities has been associated with academic achievement (NCES 1995). Several longitudinal studies have suggested that participation in school sports plays a role in increasing student grades (Broh 2002; Fejgin 1994; Hanson and Kraus 1998, 1999). Similarly, Marsh’s (1992) analysis of student participation in extracurricular activities indicated that extracurricular involvement is associated with improved GPA and higher educational aspirations (Broh 2002).
Homework
In general, research suggests that homework has a positive impact on academic achievement (McMullen 2007; Betts 1997; Neilson 2005). This has been demonstrated with data from the National Educational Longitudinal Study of 1988 (Aksoy and Link 2000) for tenth-grade math scores (Eren and Henderson 2006), and other areas (Cooper, Robinson, and Patall 2006; McMullen 2007). Feedback has been shown to be one of the most significant activities a teacher can engage in to improve student achievement (Hattie 1992), particularly when feedback is timely (Banger-Drowns, Kulik, Kulik, and Morgan 1991).
Learning Activities Outside School
Students only spend about 20 percent of their time in school; therefore, how they spend the remaining 80 percent of their time can have profound effects on their academic achievement (Miller 2003). Recent trends indicate that many students attend after-School learning programs. Quality after-school programs help students develop academic and interpersonal skills (Huang 2001, middle and high school students). Such programs support student learning activities in an informal environment and provide a bridge between home and school (Miller 2003, elementary and middle school). Learning programs have been shown to improve school habits and increase academic achievement in students (Huang 2001). Students who participated in the educational aspects of the Boys and Girls Club reported that they enjoyed academic tasks more than those who did not participate in such a program (Miller 2003; Schinke, Orlandi, and Cole 1992, primary, middle, and secondary school). Evaluations of after-school learning programs have indicated that participating students were more likely to complete their homework and perform
NAEP 2018-2019 OMB Clearance: Supporting Statement Part C Page 164
better than their peers on standardized tests (Huang, Gribbins, Kim, Lee, and Baker 2001; middle and high school; Johnson, Zorn, Williams, and Smith 1999, middle and elementary school; Miller 2003).
NAEP 2018-2019 OMB Clearance: Supporting Statement Part C Page 165

References
Aksoy, T. and Link, C.R. (2000). A Panel Analysis of Student Mathematics Achievement in the U.S. in the 1990s: Does Increasing the Amount of Time in Learning Activities Affect Math Achievement? Economics of Education Review, 19, 261–277.
Alvermann, D.E. and Phelps, S.F. (2002). Content Reading and Literacy: Succeeding in Today’s Diverse Classrooms. Boston: Allyn & Bacon.
Applebee, A. (2005). NAEP 2011 Writing Assessment: Issues in Developing a Framework and Specifications. Washington, DC: National Assessment Governing Board.
Baker, E.A. and Kinzer, C.K. (1998). Effects of Technology on Process Writing: Are They All Good? In T. Shanahan and F. Rodriguez-Brown (Eds.), Forty-seventh Yearbook of the National Reading Conference (pp. 428–440). Chicago, IL: National Reading Conference.
Banger-Drowns, Kulik, Kulik, & Morgan, 1991
Banger-Drowns, R. (1993). The Word Processor as an Instructional Tool: A Meta-Analysis of Word Processing in Writing Instruction. Review of Educational Research, 63, 69–93.
Berry, J.M. (1987, September). A Self-Efficacy Model of Memory Performance. Paper presented at the meeting of the American Psychological Association, New York, New York.
Betts, J. R. (1997). The Role of Homework in Improving School Quality. Unpublished Manuscript, Department of Economics, University of California, San Diego.
Bouffard-Bouchard. T., Parent, S., and Larivee, S. (1991). Influence of Self-Efficacy on Self-Regulation and Performance Among Junior and Senior High-School Aged Students. International Journal of Behavioral Development, 14, 153–164.
Broh, B.A. (2002, January). Linking Extracurricular Programming to Academic Achievement: Who Benefits and Why? [Electronic version]. Sociology of Education, 75, 69–96.
College Board (2003). The Neglected “R:” The Need for a Writing Revolution. Report of the National Commission on Writing in America’s Schools and Colleges. New York: The College Board.
Cooper, H., Robinson, J., and Patall, E. (2006). Does Homework Improve Academic Achievement? A Synthesis of Research, 1987–2003. Review of Educational Research, 76, 1–62.
Cope, B. and Kalantzis, M. (Eds.). (1993). The Powers of Literacy: A Genre Approach to Teaching Writing. Pittsburgh, PA: University of Pittsburgh Press.
NAEP 2018-2019 OMB Clearance: Supporting Statement Part C Page 166
Curry, K.A. (1997). A Comparison of the Writing Products of Students With Learning Disabilities in Inclusive and Resource Room Settings Using Different Writing Instruction Approaches. Unpublished doctoral dissertation, Florida Atlantic University, Boca Raton, FL.
Danoff, B., Harris, K.R., and Graham, S. (1993). Incorporating Strategy Instruction Within the Writing Process in the Regular Classroom: Effects on the Writing of Students ith and Without Learning Disabilities. Journal of Reading Behavior, 25, 295–322.
De La Paz, S. (2005). Teaching Historical Reasoning and Argumentative Writing in Culturally and Academically Diverse Middle School Classrooms. Journal of Educational Psychology, 97, 139–158.
DeBell, M. and Chapman, C. (2006). Computer and Internet Use by Students in 2003 (NCES 2006–065). U.S. Department of Education. Washington, DC: National Center for Education Statistics.
Deane, P., Odendahl, N., Quinlan, T., Fowles, M., Welsh, C., and Bivens-Tatum, J. (2007). Cognitive Models of Writing: Writing Proficiency as a Complex Integrated Skill. Research Report No. RR-08-55. Princeton, NJ: Educational Testing Service.
DiPerna, J.C. and Elliott, S.N. (1999). Development and Validation of the Academic Competence Evaluation Scales. Journal of Psychoeducational Assessment, 17, 207–225.
Eren, O. and Henderson, D.J. (2006). The Impact of Homework on Student Achievement. Retrieved January 17, 2008, from http://ssrn.com/abstract=917447.
Fejgin, N. (1994). Participation in High School Competitive Sports: A Subversion of School Mission or Contribution to Academic Goals? Sociology of Sport Journal, 1, 211–230.
Feshbach, N. D. and Feshbach, S. (1987). Affective Processes and Academic Achievement. Child Development, 58, 1335–1347.
Fredricks, J.A. and Eccles, J.S. (2006). Is Extracurricular Participation Associated With Beneficial Outcomes? Concurrent and Longitudinal Relations. Developmental Psychology, 42, 698–713.
Goldberg, A., Russell, M., and Cook, A. (2003). The Effects of Computers on Student Writing: A Meta-Analysis of Studies From 1992–2002. Journal of Technology, Learning, and Assessment, 2, 1–51. Retrieved January 17, 2008, from http://www.bc.edu/research/intasc/jtla/journal/pdf/v2n1%5fjtla.pdf
Graham, S. (2006). Strategy Instruction and the Teaching of Writing: A Meta-Analysis. In C. MacArthur, S. Graham, and J. Fitzgerald (Eds.), Handbook of Writing Research (pp. 187–207). New York: Guilford.
NAEP 2018-2019 OMB Clearance: Supporting Statement Part C Page 167
Graham, S. and Harris, K.R. (2003). Students with Learning Disabilities and the Process of Writing: A Meta-Analysis of SRSD Studies. In H.L. Swanson, K.R. Harris, and S. Graham (Eds.), Handbook of Learning Disabilities (pp. 323–344). New York: Guilford Press.
Graham, S. and Perin, D. (2007a). A Meta-Analysis of Writing Instruction for Adolescent Students. Journal of Educational Psychology, 99, 445–476.
Graham, S. and Perin, D. (2007b). Writing Next: Effective Strategies to Improve Writing of Adolescents in Middle and High Schools. New York: Carnegie Corporation of New York.
Graves, D. (1979). What Children Show Us About Revision. Language Arts, 56, 312–319.
Green, K.D., Forehand, R., Beck, S.J., and Vosk, B. (1980). An Assessment of the Relationship Among Measures of Children’s Social Competence and Children’s Academic Achievement. Child Development, 51, 1149–1156.
Grejda, G. and Hannafin, M. (1992). Effect of Word Processing on Sixth Graders’ Holistic Writing and Revisions. Journal of Educational Research, 85, 3, 144–149.
Halliday, M.A.K. and Martin, J.R. (1993). Writing Science: Literacy and Discursive Power. Pittsburgh: University of Pittsburgh Press.
Hanson, S.L..and Kraus, R.S. (1998). Women, Sports, and Science: Do Female Athletes Have an Advantage? Sociology of Education, 71, 93–110.
Hanson, S.L. and Kraus, R.S. (1999). Women in Male Domains: Sport and Science. Sociology of Sport Journal, 16, 92–110.
Hillocks, G. (1986). Research on Written Composition: New Directions for Teaching. Urbana, IL: National Council of Teachers of English.
Hillocks, G., Jr. (2002). The Testing Trap: How State Writing Assessments Control Learning. New York: Teachers College Press.
Huang, D. (2001). An After-School Evaluation System for Middle and High School Programs. National Association of Secondary School Principals Bulletin, 85, 45–61.
Huang, D., Gribbons, B., Kim, K.S., Lee, C., and Baker, E.L. (2000). A Decade of Results: The Impact of the LA’s BEST After School Enrichment Initiative on Subsequent Student Achievement and Performance. Los Angeles: UCLA Center for the Study of Evaluation, Graduate School of Education and Information Studies.
Johnson, L.J., Zorn, D., Williams, J., and Smith, J. (1999). 1998–99 School Year Program Evaluation: Urban School Initiative School Age Child Care Expansion. Cincinnati, OH, University of Cincinnati: 1–60.
NAEP 2018-2019 OMB Clearance: Supporting Statement Part C Page 168
Lambert, N.M. and Nicholl, R.C. (1977). Competence Model of Nonintellectual Behavior and Its Relationship to Early Reading Achievement. Journal of Educational Psychology, 69, 481–490.
Lunsford, A, A. and Lunsford, K. J. (in press). 'Mistakes Are a Fact of Life': A National Comparative Study. CCC: College Composition and Communication.
Malecki, C.K., and Elliot, S.N. (2002). Children’s Social Behaviors as Predictors of Academic Achievement: A Longitudinal Analysis. School Psychology Quarterly, 17, 1–23.
Marsh, H.W. (1992). Extracurricular Activities: Beneficial Extension of the Traditional Curriculum or Subversion of Academic Goals? Journal of Educational Psychology, 84, 553–562.
McMullen, S. (2007). The Impact of Homework Time on Academic Achievement. Retrieved January 17, 2008, from: http://www.unc.edu/~mcmullen/McMullen%20-%20The%20Impact%20of%20Homework%20Time%20on%20Academic%20Achievement.pdf.
Miller, B.M. (2003). Afterschool Programs and Educational Success: Critical Hours Executive Summary. Retrieved January 17, 2008, from: http://www.nmefdn.org/uploads/Critical_Hours_Full.pdf .
Miller, C.R. (1984). Genre as Social Action. Quarterly Journal of Speech, 70, 151–167.
Multon, K.D., Brown, S.D., and Lent, R.W. (1991). Relation of Self-Efficacy Beliefs to Academic Outcomes: A Meta-Analytic Investigation. Journal of Counseling Psychology, 38, 30–38.
Nagin, C. (2003). Because Writing Matters: Improving Student Writing in Our Schools. San Francisco, CA: Jossey-Bass.
National Assessment of Educational Progress (NAEP) Data Explorer Writing Assessment (2002). Washington, DC: U.S. Department of Education.
National Assessment Governing Board (2003). Background Information Framework for the National Assessment of Educational Progress. Washington DC: Author.
National Assessment Governing Board (October 18, 2005). Governing Board Launches Project to Develop New NAEP Writing Assessment Framework (press release). Washington DC: Author. Retrieved February 21, 2009, from: http://www.nagb.org/newsroom/release/framework-1005.htm.
National Assessment Governing Board (2007a). Writing Framework and Specifications for the 2007 National Assessment of Educational Progress. Washington, DC: Author.
NAEP 2018-2019 OMB Clearance: Supporting Statement Part C Page 169
National Assessment Governing Board (2007b, Fall). Writing Specifications for the 2011 National Assessment of Educational Progress. Pre-publication Edition. Retrieved February 21, 2009, from: http://www.nagb.org/publications/frameworks.htm
National Center for Education Statistics (2004). NCES Plan for NAEP Background Variable Development. Washington DC: Author.
National Center for Education Statistics. (1995, June). Extracurricular Participation and Student Engagement. Retrieved January 16, 2008, from: http://nces.ed.gov/pubs95/web/95741.asp.
National Commission on Writing (2003, April). The Neglected R: The Need for a Writing Revolution. Retrieved September 1, 2008, from www.collegeboard.com.
Neilson, W. (2005). Homework and Performance for Time-Constrained Students. Economics Bulletin, 9, 1–6.
Pajares, F. (1996). Self-Efficacy Beliefs in Academic Settings. Review of Educational Research, 66, 543–578.
Pajares, F. & Schunk, D.H. (2001). Self-Beliefs and School Success: Self-Efficacy, Self-Concept and School Achievement. In R. Riding and S. Raynor (Eds.), Perception (pp. 239–266), London: Ablex Publishing.
Perin, D. (2001). Academic-Occupational Integration as a Reform Strategy for the Community College: Classroom Perspectives. Teachers College Record, 103, 303–335.
Pintrich, P.R. and De Groot, E.V. (1990). Motivational and Self-Regulated Learning Components of Classroom Academic Performance. Journal of Educational Psychology, 82, 33–40.
Russell, M. (2006). Technology and Assessment: The Tale of Two Interpretations. Charlotte, NC: Information Age Publishing.
Russell, M., & Plati, T. (2002, May 29). Does It Matter With What I Write? Comparing Performance on Paper, Computer and Portable Writing Devices. Current Issues in Education [On-line], 5 (4). Available: http://cie.ed.asu.edu/volume5/number4/
Schinke, S.P., Orlandi, M.A., and Cole, K.C. (1992). Boys and Girls Clubs in Public Housing Developments: Prevention Services for Youth at Risk. Journal of Community Psychology, 28 (OSAP Special Issue), 118–128.
Shanahan, T. (2004). Overcoming the Dominance of Communication: Writing to Think and to Learn. In T.L. Jetton and J.A. Dole (Eds.). Adolescent Literacy Research and Practice (pp. 59–73). New York: Guilford.
NAEP 2018-2019 OMB Clearance: Supporting Statement Part C Page 170
The Center for Comprehensive School Reform and Improvement (2007). Using Positive Student Engagement to Increase Student Achievement. Retrieved January 17, 2008, from http://www.castategearup.org/calendar/pdf/TheCenterNewsletterApril2007.pdf
Wentzel, K.R. (1993). Does Being Good Make the Grade? Social Behavior and Academic Competence in Middle School. Journal of Educational Psychology, 85, 357–364.
Zimmerman, B.J. (2000). Self-Efficacy: An Essential Motive to Learn. Contemporary Educational Psychology, 25, 82–91.
Zimmerman, B.J., Bandura, A., and Martinez-Pons, M. (1992). Self-Motivation for Academic Attainment: The Role of Self-Efficacy Beliefs and Personal Goal Setting. American Educational Research Journal, 29, 663–676.
NAEP 2018-2019 OMB Clearance: Supporting Statement Part C Page 171
Appendix
A meta-analysis on the effectiveness of various writing instructional strategies on writing achievement (Graham and Perin, 2007a) found support for the following strategies:
Teaching planning, revising, and editing strategies (mean weighted effect size = .82; grades 4 - 10). This was especially powerful for struggling writers (mean weighted effect size = 1.02; grades 4 - 10), but it is also effective with adolescents in general (mean weighted effect size = .70; grades 4 - 10).
Teaching summarization strategies (mean weighted effect size = .82; grades 5 - 12). Encouraging collaborative writing activities (working together to plan, draft, revise, and edit
their compositions) (mean weighted effect size = .75; grades 4 – high school). Teaching goal setting for what students are to accomplish with their writing product (e.g., to
persuade; to address both sides of an argument) (mean weighted effect size = .70; grades 4 - 8).
Providing instruction in how to write increasingly complex sentences (e.g., combining simpler sentences into more sophisticated ones) (mean weighted effect size = .50; grades 4 - 11).
Encouraging inquiry activities in writing (including having a clearly specified goal (e.g., describe the actions of people), analysis of concrete and immediate data (e.g.. observe one or more peers during specific activities), use of specific strategies to conduct the analysis (e.g., retrospectively ask the person being observed the reason for their action), and applying what was learned (e.g., write a story where the insights from the inquiry are incorporated into the composition) (mean weighted effect size = .32; grades 7 - 12).
Encouraging pre-writing (i.e., activities involving gathering and organizing ideas for a composition before writing; such as gathering possible information for a paper through reading or developing a visual representation of an ideas before writing (mean weighted effect size = .32; grades 4 - 9).
Providing good models for each type of writing that is the focus of instruction (mean weighted effect size = .25; grades 4 - 12).
NAEP 2018-2019 OMB Clearance: Supporting Statement Part C Page 172

Part C-6: 2018 Social Studies Issues Paper
NAEP 2018-2019 OMB Clearance: Supporting Statement Part C Page 173

KEY CONTEXTUAL FACTORS FOR SOCIAL STUDIES ACHIEVEMENT
Civics, Geography, & U.S. History “Issues Paper”
Jan M. Alegre & Jonas P. Bertling Educational Testing Service
Written in preparation for New Item Development for the 2018 Digital Based NAEP Civics, Geography, and U.S. History Survey Questionnaires
July 2015
Executive Summary
This paper presents an overview of key contextual factors for social studies achievement, thereby providing a basis for the development of the National Assessment of Educational Progress (NAEP) Social Studies Survey Questionnaires for the 2018 digital based assessments in Civics, Geography, and U.S. History. Four “issues” (i.e., broad topics) are described in this issues paper. Throughout these issues, the role of digital technology for learning and instruction is highlighted as an overarching theme. Issues capture both opportunity-to-learn factors and noncognitive student factors (e.g., social, motivational, and self-regulatory factors) relevant to social studies achievement. For each issue, key areas for potential development are highlighted, thus creating a starting point for the definition of modules and/or clusters of survey questions that can provide a basis for questionnaire scale indices.
Issue 1: Resources for Learning and Instruction Issue 1 captures the extent to which resources for learning and instruction—people, products, and time—are available to students, teachers, and schools. Areas for potential new development are the availability and use of digital based technology resources for engagement in social studies-related activities inside and outside of school, and an improved quantification of the time available for learning and instruction.
Issue 2: Organization of Instruction Issue 2 captures how classroom instruction as well as instructional activities outside of school (e.g., history field trips, library visits, and community service activities) are organized, and how technology is incorporated into instruction. Areas for potential new development include: course content and/or a
NAEP 2018-2019 OMB Clearance: Supporting Statement Part C Page 174
differential emphasis on conceptual and procedural knowledge versus declarative knowledge, whether there is a development of school-wide curriculum, tracking and ability grouping, use of technology to explore concepts and deepen understanding, and use of assessments.
Issue 3: Teacher Preparation Issue 3 captures how well teachers are prepared for teaching social studies, what teachers’ professional development opportunities are and to what extent teachers make use of these opportunities, and the social and motivational factors that influence their teaching (e.g., self-efficacy, mindset, intrinsic interest in topics taught). An important area for new development is teachers’ preparedness to use digital technology in their instruction in purposeful ways. Inclusion of questions that explore the format of professional development programs, the skills taught within these programs, and the value and applicability of these programs in the classroom could be beneficial as well.
Issue 4: Student Factors Issue 4 addresses social, motivational, and self-regulatory student factors capturing engagement with social studies. Areas for potential new development include capturing more behavioral and attitudinal facets of engagement (e.g., participation in outside of school activities; social studies-related interest and motivation; self-related beliefs pertaining to social studies learning and technology-based activities) given that engagement is a significant predictor of academic achievement. Another important question to address is how other student factors represented in the 2018 Core questionnaire might be contextualized for social studies (e.g., self-control) to allow for a distinction between domain-general and domain-specific factors.
NAEP 2018-2019 OMB Clearance: Supporting Statement Part C Page 175
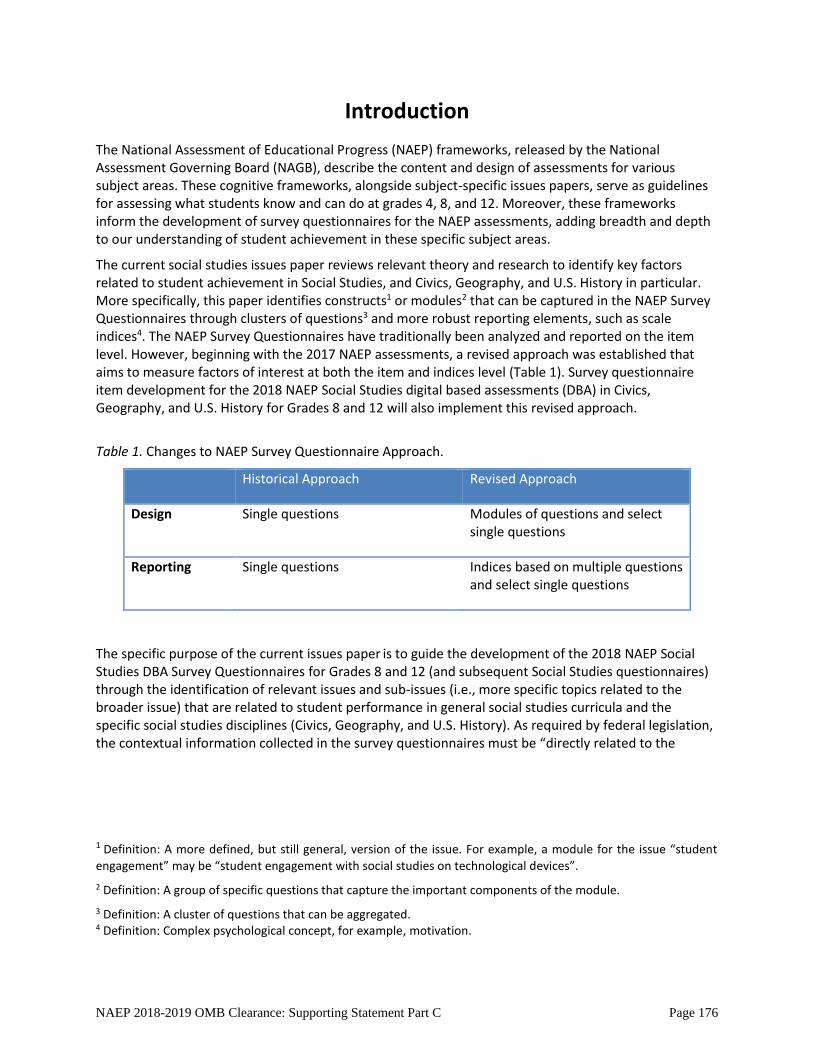
Introduction
The National Assessment of Educational Progress (NAEP) frameworks, released by the National Assessment Governing Board (NAGB), describe the content and design of assessments for various subject areas. These cognitive frameworks, alongside subject-specific issues papers, serve as guidelines for assessing what students know and can do at grades 4, 8, and 12. Moreover, these frameworks inform the development of survey questionnaires for the NAEP assessments, adding breadth and depth to our understanding of student achievement in these specific subject areas.
The current social studies issues paper reviews relevant theory and research to identify key factors related to student achievement in Social Studies, and Civics, Geography, and U.S. History in particular. More specifically, this paper identifies constructs1 or modules2 that can be captured in the NAEP Survey Questionnaires through clusters of questions3 and more robust reporting elements, such as scale indices4. The NAEP Survey Questionnaires have traditionally been analyzed and reported on the item level. However, beginning with the 2017 NAEP assessments, a revised approach was established that aims to measure factors of interest at both the item and indices level (Table 1). Survey questionnaire item development for the 2018 NAEP Social Studies digital based assessments (DBA) in Civics, Geography, and U.S. History for Grades 8 and 12 will also implement this revised approach.
Table 1. Changes to NAEP Survey Questionnaire Approach.
Historical Approach Revised Approach
Design Single questions Modules of questions and select single questions
Reporting Single questions Indices based on multiple questions and select single questions
The specific purpose of the current issues paper is to guide the development of the 2018 NAEP Social Studies DBA Survey Questionnaires for Grades 8 and 12 (and subsequent Social Studies questionnaires) through the identification of relevant issues and sub-issues (i.e., more specific topics related to the broader issue) that are related to student performance in general social studies curricula and the specific social studies disciplines (Civics, Geography, and U.S. History). As required by federal legislation, the contextual information collected in the survey questionnaires must be “directly related to the
1 Definition: A more defined, but still general, version of the issue. For example, a module for the issue “student
engagement” may be “student engagement with social studies on technological devices”.
2 Definition: A group of specific questions that capture the important components of the module.
3 Definition: A cluster of questions that can be aggregated. 4 Definition: Complex psychological concept, for example, motivation.
NAEP 2018-2019 OMB Clearance: Supporting Statement Part C Page 176
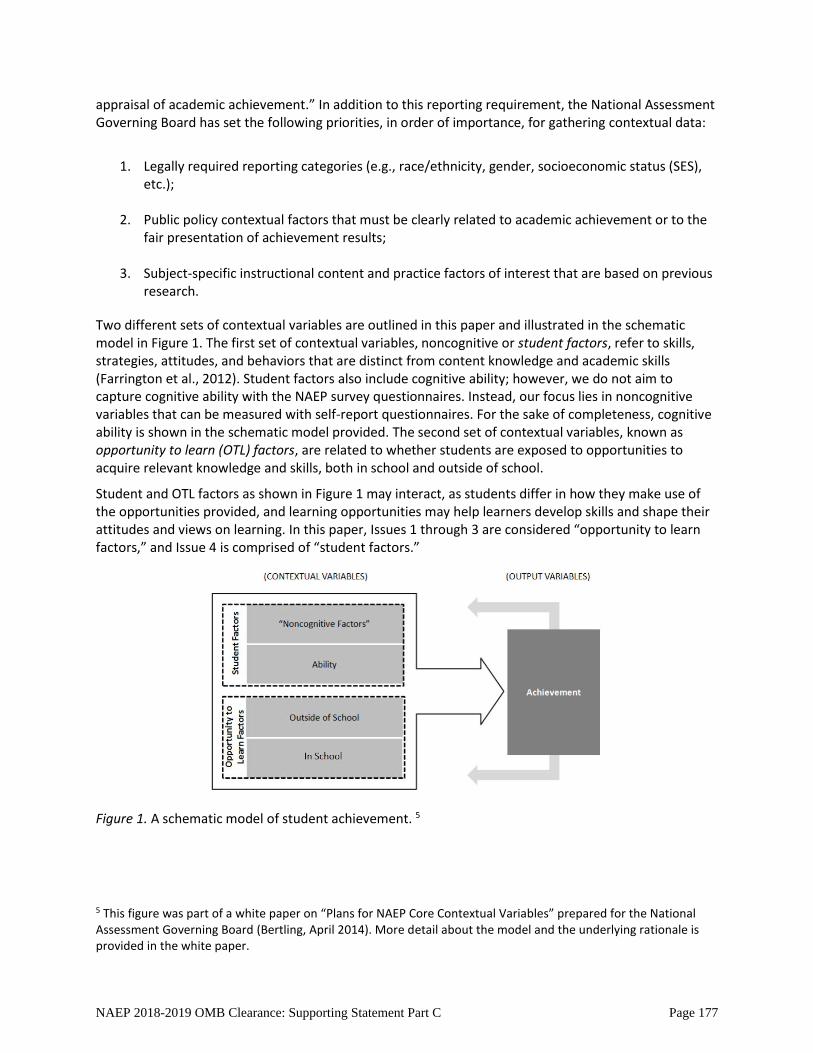
appraisal of academic achievement.” In addition to this reporting requirement, the National Assessment Governing Board has set the following priorities, in order of importance, for gathering contextual data:
1. Legally required reporting categories (e.g., race/ethnicity, gender, socioeconomic status (SES),
etc.);
2. Public policy contextual factors that must be clearly related to academic achievement or to the fair presentation of achievement results;
3. Subject-specific instructional content and practice factors of interest that are based on previous research.
Two different sets of contextual variables are outlined in this paper and illustrated in the schematic model in Figure 1. The first set of contextual variables, noncognitive or student factors, refer to skills, strategies, attitudes, and behaviors that are distinct from content knowledge and academic skills (Farrington et al., 2012). Student factors also include cognitive ability; however, we do not aim to capture cognitive ability with the NAEP survey questionnaires. Instead, our focus lies in noncognitive variables that can be measured with self-report questionnaires. For the sake of completeness, cognitive ability is shown in the schematic model provided. The second set of contextual variables, known as opportunity to learn (OTL) factors, are related to whether students are exposed to opportunities to acquire relevant knowledge and skills, both in school and outside of school.
Student and OTL factors as shown in Figure 1 may interact, as students differ in how they make use of the opportunities provided, and learning opportunities may help learners develop skills and shape their attitudes and views on learning. In this paper, Issues 1 through 3 are considered “opportunity to learn factors,” and Issue 4 is comprised of “student factors.”
Figure 1. A schematic model of student achievement. 5
5 This figure was part of a white paper on “Plans for NAEP Core Contextual Variables” prepared for the National Assessment Governing Board (Bertling, April 2014). More detail about the model and the underlying rationale is provided in the white paper.
NAEP 2018-2019 OMB Clearance: Supporting Statement Part C Page 177
This issues paper has four specific objectives:
1) Evaluate references and theories in terms of their relevance for the 2018 Social Studies DBA for Grades 8 and 12. Collate and interpret existing research evidence on important contextual variables associated with social studies academic performance, especially in technology-rich environments, including performance predictors, moderators, or mediators on the student level and aggregate levels such as schools, districts, or states. Given that the specific purpose of the issues paper is to guide the development of the 2018 NAEP Social Studies DBA Survey Questionnaires for Grades 8 and 12, the present literature review primarily describes and elaborates upon research evidence drawn from middle school and high school populations.
2) Identify variables that might also serve as moderators, mediators, and alternative social studies-related noncognitive outcomes of schooling. Identify contextual factors that might not relate directly to student-level outcomes, but serve as important descriptive and/or predictive variables on aggregate levels (e.g., schools, districts, states).
3) Strengthen focus on important social studies-specific contextual variables while taking into
consideration that these variables may overlap with core contextual variables. Variables that are relevant to performance across all subjects assessed in NAEP (e.g., general availability of and familiarity with digital technology, perseverance, desire for learning, or school climate) should be included as Core items in the 2018 NAEP Social Studies DBA Survey Questionnaires for Grades 8 and 12.
4) To provide high-level implementation recommendations for each issue and highlight key areas
for new item development, thereby creating a starting point for the definition of modules and/or clusters of survey questions that can provide a basis for scale indices.
In addition to considering their alignment with the current social studies (Civics, Geography, and U.S. History) cognitive frameworks, issues and sub-issues were selected based on the following criteria:
a) Factors captured in each issue should have a clear relationship with student achievement. This criterion directly refers to the NAEP statute. In accordance with this criterion, issues with a strong research foundation based on several published studies (ideally, meta-analyses) and established theoretical models are prioritized over issues with less research evidence supporting a relationship with achievement (i.e., no clear relationship or low correlation with achievement) or issues with a less established theoretical foundation.
b) Factors captured in each issue should be malleable and actionable in terms of possible interventions in and outside the classroom.
c) Factors should be amenable for measurement with survey questionnaires. Factors such as social skills or learning strategies might require other assessment strategies to provide meaningful and reliable measures.
d) Issues suggested for inclusion in the Social Studies Survey Questionnaires should focus on those student and OTL factors that are domain-specific, meaning they are specific to social studies achievement (NAEP Frameworks for Civics, Geography, and U.S. History can be found at https://nces.ed.gov/nationsreportcard/frameworks.aspx).
NAEP 2018-2019 OMB Clearance: Supporting Statement Part C Page 178
Four issues with a total of 12 sub-issues that reflect key contextual variables for social studies achievement are identified in this paper. For each issue, we describe research findings regarding contextual variables that are common across all social studies disciplines (i.e., social studies-general). Where appropriate, social studies general discussion is accompanied by a consideration of any sub-issues or variables that may be specific to Civics, Geography, or U.S. History (i.e., discipline-specific).
New items will be developed for potential inclusion in the 2018 Social Studies Survey Questionnaires for Grades 8 and 12 using this issues paper as a guideline, and will be tested in cognitive interviews currently planned for Fall/Winter 2015-2016. After the cognitive interviews have been conducted, the data will be reviewed to help inform which items should be administered in the 2017 Pilot. The items will be reviewed once more after the 2017 Pilot to inform which items are administered during in the 2018 Operational assessment. See Appendix A for a high-level overview of the item development process. See Appendix B for a taxonomy outlining how new items will aim to capture issues and sub-issues in survey questionnaires across respondent groups.
NAEP 2018-2019 OMB Clearance: Supporting Statement Part C Page 179
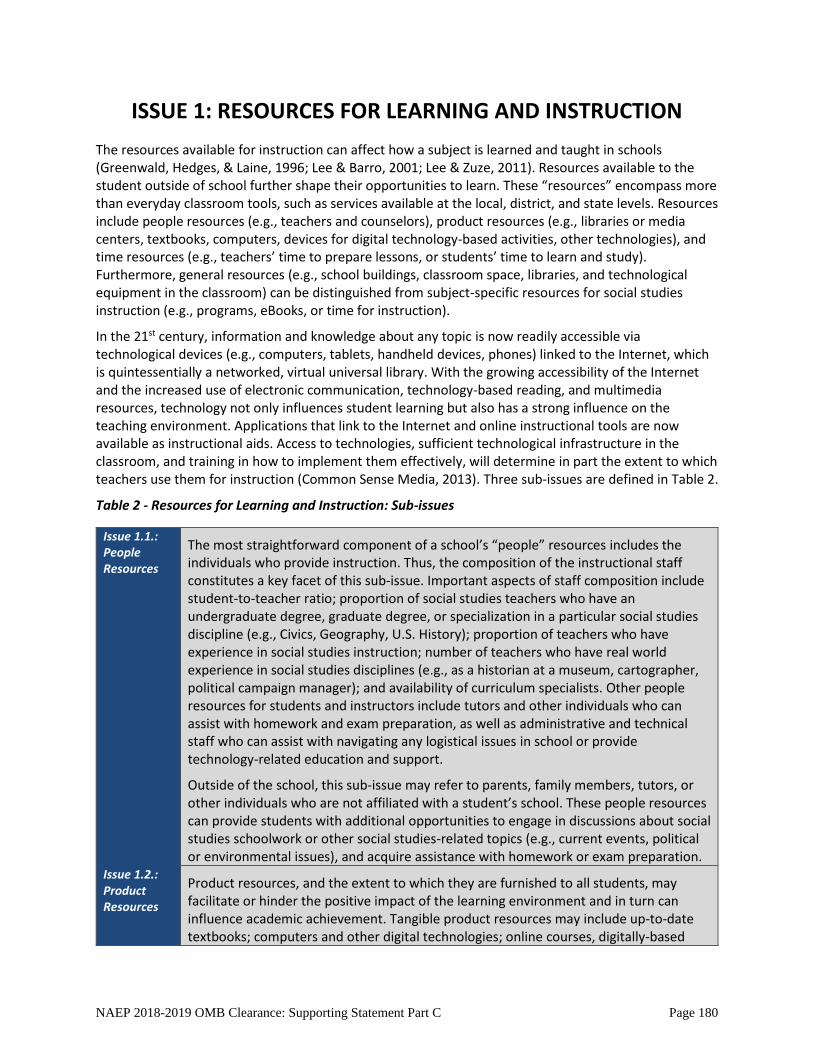
ISSUE 1: RESOURCES FOR LEARNING AND INSTRUCTION
The resources available for instruction can affect how a subject is learned and taught in schools (Greenwald, Hedges, & Laine, 1996; Lee & Barro, 2001; Lee & Zuze, 2011). Resources available to the student outside of school further shape their opportunities to learn. These “resources” encompass more than everyday classroom tools, such as services available at the local, district, and state levels. Resources include people resources (e.g., teachers and counselors), product resources (e.g., libraries or media centers, textbooks, computers, devices for digital technology-based activities, other technologies), and time resources (e.g., teachers’ time to prepare lessons, or students’ time to learn and study). Furthermore, general resources (e.g., school buildings, classroom space, libraries, and technological equipment in the classroom) can be distinguished from subject-specific resources for social studies instruction (e.g., programs, eBooks, or time for instruction).
In the 21st century, information and knowledge about any topic is now readily accessible via technological devices (e.g., computers, tablets, handheld devices, phones) linked to the Internet, which is quintessentially a networked, virtual universal library. With the growing accessibility of the Internet and the increased use of electronic communication, technology-based reading, and multimedia resources, technology not only influences student learning but also has a strong influence on the teaching environment. Applications that link to the Internet and online instructional tools are now available as instructional aids. Access to technologies, sufficient technological infrastructure in the classroom, and training in how to implement them effectively, will determine in part the extent to which teachers use them for instruction (Common Sense Media, 2013). Three sub-issues are defined in Table 2.
Table 2 - Resources for Learning and Instruction: Sub-issues
Issue 1.1.: People Resources
The most straightforward component of a school’s “people” resources includes the individuals who provide instruction. Thus, the composition of the instructional staff constitutes a key facet of this sub-issue. Important aspects of staff composition include student-to-teacher ratio; proportion of social studies teachers who have an undergraduate degree, graduate degree, or specialization in a particular social studies discipline (e.g., Civics, Geography, U.S. History); proportion of teachers who have experience in social studies instruction; number of teachers who have real world experience in social studies disciplines (e.g., as a historian at a museum, cartographer, political campaign manager); and availability of curriculum specialists. Other people resources for students and instructors include tutors and other individuals who can assist with homework and exam preparation, as well as administrative and technical staff who can assist with navigating any logistical issues in school or provide technology-related education and support.
Outside of the school, this sub-issue may refer to parents, family members, tutors, or other individuals who are not affiliated with a student’s school. These people resources can provide students with additional opportunities to engage in discussions about social studies schoolwork or other social studies-related topics (e.g., current events, political or environmental issues), and acquire assistance with homework or exam preparation.
Issue 1.2.: Product Resources
Product resources, and the extent to which they are furnished to all students, may facilitate or hinder the positive impact of the learning environment and in turn can influence academic achievement. Tangible product resources may include up-to-date textbooks; computers and other digital technologies; online courses, digitally-based
NAEP 2018-2019 OMB Clearance: Supporting Statement Part C Page 180
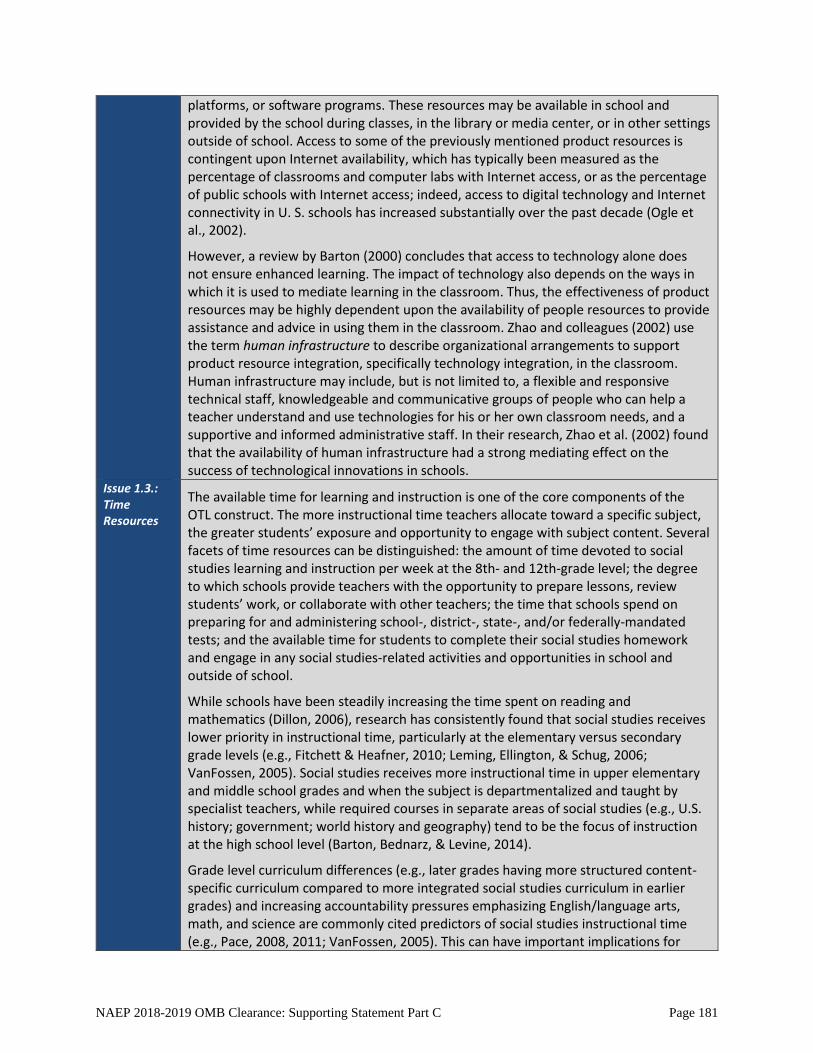
platforms, or software programs. These resources may be available in school and provided by the school during classes, in the library or media center, or in other settings outside of school. Access to some of the previously mentioned product resources is contingent upon Internet availability, which has typically been measured as the percentage of classrooms and computer labs with Internet access, or as the percentage of public schools with Internet access; indeed, access to digital technology and Internet connectivity in U. S. schools has increased substantially over the past decade (Ogle et al., 2002).
However, a review by Barton (2000) concludes that access to technology alone does not ensure enhanced learning. The impact of technology also depends on the ways in which it is used to mediate learning in the classroom. Thus, the effectiveness of product resources may be highly dependent upon the availability of people resources to provide assistance and advice in using them in the classroom. Zhao and colleagues (2002) use the term human infrastructure to describe organizational arrangements to support product resource integration, specifically technology integration, in the classroom. Human infrastructure may include, but is not limited to, a flexible and responsive technical staff, knowledgeable and communicative groups of people who can help a teacher understand and use technologies for his or her own classroom needs, and a supportive and informed administrative staff. In their research, Zhao et al. (2002) found that the availability of human infrastructure had a strong mediating effect on the success of technological innovations in schools.
Issue 1.3.: Time Resources
The available time for learning and instruction is one of the core components of the OTL construct. The more instructional time teachers allocate toward a specific subject, the greater students’ exposure and opportunity to engage with subject content. Several facets of time resources can be distinguished: the amount of time devoted to social studies learning and instruction per week at the 8th- and 12th-grade level; the degree to which schools provide teachers with the opportunity to prepare lessons, review students’ work, or collaborate with other teachers; the time that schools spend on preparing for and administering school-, district-, state-, and/or federally-mandated tests; and the available time for students to complete their social studies homework and engage in any social studies-related activities and opportunities in school and outside of school.
While schools have been steadily increasing the time spent on reading and mathematics (Dillon, 2006), research has consistently found that social studies receives lower priority in instructional time, particularly at the elementary versus secondary grade levels (e.g., Fitchett & Heafner, 2010; Leming, Ellington, & Schug, 2006; VanFossen, 2005). Social studies receives more instructional time in upper elementary and middle school grades and when the subject is departmentalized and taught by specialist teachers, while required courses in separate areas of social studies (e.g., U.S. history; government; world history and geography) tend to be the focus of instruction at the high school level (Barton, Bednarz, & Levine, 2014).
Grade level curriculum differences (e.g., later grades having more structured content-specific curriculum compared to more integrated social studies curriculum in earlier grades) and increasing accountability pressures emphasizing English/language arts, math, and science are commonly cited predictors of social studies instructional time (e.g., Pace, 2008, 2011; VanFossen, 2005). This can have important implications for
NAEP 2018-2019 OMB Clearance: Supporting Statement Part C Page 181
student knowledge in social studies (e.g., Bisland, 2012). When school policies afford teachers the opportunity to collaborate with teachers across disciplines, the level of student achievement increases in both disciplines (Xin & Lingling, 2004). Knowledge of the amount of time teachers devote to activities associated with standardized testing can provide additional information on the relationship between testing and student achievement in social studies. Research indicates that teachers who report more frequent social studies content integration in their lesson plans or who report having a mandated test tend to spend more time on discipline-specific strategies in their instruction (Fitchett, Heafner, & VanFossen, 2014). With regard to learning outside of school, the available time for students varies as students might, for instance, need to fulfill other responsibilities (e.g., take care of a sibling or another family member), or work part-time (this applies to 12th grade students).
Implementation Recommendation for Issue 1:
Promising areas for future item development include enhancing the measurement of the availability and use of various resources, including digital technologies, for practicing and learning social studies-related content and skills inside and outside of the classroom. In addition, items should focus on distinguishing between different mediums (e.g., primary sources in print versus digital format), and types of technologies used (e.g., desktop versus tablet). Item development might also discern between the quantity and quality of various resources, and identifying limited resources that may deter learning (e.g., classrooms being overcrowded, teachers having too many teaching hours). Furthermore, including items that assess time available for learning and instruction could enhance future survey questionnaires.
NAEP 2018-2019 OMB Clearance: Supporting Statement Part C Page 182
ISSUE 2: ORGANIZATION OF INSTRUCTION
Current literature shows that students’ opportunities to learn are influenced in part by how instruction is organized (Ancess, 2000). Issue 2 consists of three related sub-issues: the content of the social studies curriculum; the instructional strategies applied by the teacher, including the integration of technological resources for instruction and students assignments; and the role of assessments in the classroom. These sub-issues are described in Table 3.
Table 3 - Organization of Instruction: Sub-issues
Issue 2.1: Curriculum Content
A school’s social studies curriculum can be understood by examining required social studies courses at each grade level, elective or specialized social studies courses, and students’ course histories. From 4th to 8th grade, social studies is usually required for all students and the curriculum tends to include a systematic study of specific disciplines (e.g., civics, geography, history) with the most emphasis on history and geography, though the course is often labeled as general “social studies” (Barton, Bednarz, & Levine, 2014). From 9th to 12th grade, social studies curriculum is mostly comprised of separate courses (e.g., U.S. History, U.S. Government) focusing on specific disciplines, and these courses are either required or elective (Barton, Bednarz, & Levine, 2014).
Understanding of social studies curricula can be strengthened by examining course offerings in conjunction with information about achievement grouping and tracking. Different tracks may offer altogether different courses or they may offer same-subject courses that differ in content and rigor (e.g., remedial courses, Advanced Placement or International Baccalaureate level courses). For instance, at the high school level, students who elect to take special courses and programs tend to be exposed to a more extensive, in-depth curriculum compared to students who take standard, required courses (Barton, Bednarz, & Levine, 2014). Achievement grouping and tracking may have a significant impact on academic performance to the extent that lower-achieving students start their coursework with small but measurable differences in academic skills compared to higher-achieving students, and these disparities increase significantly over time (Ansalone & Ming, 2006).
Curriculum content can be examined in terms of whether there is a school-wide curriculum in place that includes general or integrated social studies, and/or specific social studies disciplines. If a curriculum exists, it is important to also understand how that curriculum is developed and periodically updated (i.e., curricular decision-making) and its adherence to state/national standards and frameworks. Understanding how the social studies curriculum functions informs our understanding of how it is organized, how and when students gain access to specific courses, and what types of knowledge (e.g., conceptual thinking, declarative knowledge) are emphasized to students during instruction. For example, research examining a social studies curriculum developed to address state standards and the needs of middle school students in heterogeneous (i.e., higher- and lower-achieving student) classrooms revealed that a curriculum integrating higher level processes and specific conceptual thinking activities with strong content can yield performance gains as strong as or stronger than a more direct, declarative knowledge-based
NAEP 2018-2019 OMB Clearance: Supporting Statement Part C Page 183
structure for teaching to standards (Little, Feng, VanTassel-Baska, Rogers, & Avery, 2007). Moreover, this work has found that an integrated and challenging social studies curriculum designed to respond to the needs of higher-achieving students can also promote learning gains for students who are lower in achievement. In sum, the organization and structure of a school’s social studies curricula can have an important impact on student performance.
Issue 2.2: Instructional Strategies
Effective instruction comes from teachers’ own rich knowledge of social studies, as well as the repertoire of instructional strategies and methods through which they facilitate students’ thinking about and understanding of concepts (Adeyemi, 1992; Gallavan & Kottler, 2002; Gamoran & Nystrand, 1991). These strategies require teachers to know how students acquire understanding and why they typically (mis)understand certain social studies concepts. Important facets of effective instructional strategies include targeting instruction based on students’ needs and creating connections to real-world problems, in addition to teaching facts, processes, or abstract concepts (e.g., Adeyemi, 1992; Ansalone & Ming, 2006; Bergan, Sladeczek, Stecker & Fuchs, 2000; Box & Little, 2003; Civil, 2002; Gainsburg, 2008).
Students’ learning of social studies content and their social studies achievement can improve when teachers provide tailored instruction based on students’ specific learning needs (e.g., Bergan, Sladeczek, Stecker & Fuchs, 2000). Teacher feedback and support are also correlated with students’ achievement motivation in social studies as well as their academic self-concept (Knight & Waxman, 1990). Instructional techniques that are responsive to students’ individual learning styles and skills (e.g., “programmed learning sequences”) are found to be effective in improving social studies achievement among diverse middle school learners compared to traditional grouped instruction (Ansalone & Ming, 2006). In addition, student engagement increases when teachers facilitate learning based on the various needs of their students (e.g., Beeland, 2002; Jang, Reeve & Deci, 2010). Two important engagement-promoting aspects of teachers’ instructional styles include ‘autonomy support’ and ‘structure’ (Jang et al., 2010). That is, providing clear expectations and framing students’ learning activities with explicit guidance helps students stay on task and persevere.
Research also suggests that teachers can foster student engagement by connecting their instruction to real-world problems, current events, or data and encouraging critical reflection (e.g., Adeyemi, 1992; Civil, 2002; Gainsburg, 2008). This experience-based method of instruction promotes the “habits of mind” of the social studies disciplines and is important for content learning (Little, Feng, VanTassel-Baska, Rogers, & Avery, 2007). Work by Ives and Obenchain (2006) on experience-based learning in 12th grade U.S. government classrooms reveals that students in experience-oriented classes demonstrate greater gains higher-order thinking skills compared to students who receive traditional lecture-based instruction. This finding is consistent with research on inquiry-based, “authentic pedagogy” in social studies classrooms; higher levels of this form of instruction are generally associated with higher student achievement, and students in classes featuring even moderate levels of authentic pedagogy have significantly higher performance on state-mandated tests than their school averages (Saye & Social Studies Inquiry Research
NAEP 2018-2019 OMB Clearance: Supporting Statement Part C Page 184
Collaborative, 2013). Furthermore, engagement in group-based, collaborative social studies instruction and learning is found to benefit students’ learning, academic achievement, self-concept (Box & Little, 2003; Mattingly & VanSickle, 1991; Vaughn, Swanson, Roberts, Wanzek, Stillman-Spisak, Solis, & Simmons, 2013; Wanzek, Vaughn, Kent, Swanson, Roberts, Haynes, Fall, Stillman-Spisak, & Solis, 2014). Engagement in project-based instruction also has a significant impact on secondary social studies students’ academic achievement and college and career readiness (Summers & Dickinson, 2012). Additional instructional strategies that are specific to Civics, Geography, and U.S. History are described in more detail at the end of this section.
Digital technologies, such as desktop and laptop computers, tablets, other mobile devices, software, and Internet tools, are growing in their availability and playing an increasingly prominent role in facilitating social studies instruction and the engagement of student learning. When used with teacher guidance, such digital resources have been shown to benefit academic achievement in social studies (Gürer & Yildirim, 2014). Newer technologies and electronic modes of information delivery allow teachers to demonstrate concepts and assess student learning in new ways through the improved range and accessibility of materials. In addition, students have access to an array of tools and programs that they can use to explore concepts and demonstrate their learning. The use of applications such as digital simulation gaming have the potential to engage students in higher-order, holistic thinking in social studies and to help them connect isolated events and information into themes (Devlin-Scherer & Sardone, 2010).
As noted in Issue 1.2, access to emerging digital technologies plays a role in the extent to which students and teachers use them in learning and instruction, but access alone does not ensure use. The growing availability of digital technologies for social studies instruction points to the need for schools to prepare students and teachers to use them effectively (see Issues 1.2 and 3). Digital technologies have the potential to enable students to work more independently and cultivate higher-order thinking skills (Devlin-Scherer & Sardone, 2010). In addition, dynamic software can help students visualize and understand complex concepts. Simulation software can help students explore real-world problems, and databases and spreadsheet programs can help students locate and use real data to analyze real-world issues. Technology also broadens the learning community and enables students to communicate with each other about social studies-related topics. Given the wide availability of Internet connections, many schools can offer students access to social studies courses offered online that would otherwise be unavailable to them. Taken together, in order to understand students’ opportunity to learn in terms of their opportunity to work with technology, it is necessary to measure not only whether technology is available, but also how it is used (Barton, 2000).
Discipline-Specific Considerations
Civics. Research indicates that students who are provided with curriculum and educational experiences that specifically help them to develop their civic knowledge, skills, and dispositions through interactive learning and practice not only acquire a commitment to civic problem solving, but are also more likely to develop stronger critical thinking skills, earn better grades, graduate from high school, enroll in
NAEP 2018-2019 OMB Clearance: Supporting Statement Part C Page 185
college, and complete college on time (e.g., Brownell & Swaner, 2010; Northup & Brown, 2010). Classroom discussion and debate of controversial issues has been linked to the development of civic concepts, process skills, and the formation of attitudes (e.g., Hess, 2009). In line with these findings, studies have found that curricula that feature traditional classroom activities as well as open discussion classroom climates, interactive teaching, and class activities are significant predictors of students’ civics content knowledge and skills (Homana & Barber, 2006; Torney-Purta & Wilkenfeld, 2009; Zhang, Torney-Purta, & Barber, 2012). In terms of technology use, Yang (2012) has found that the use of digital game-based learning in the Civics classroom improves 9th grade students’ problem-solving skills as well as their learning motivation.
Geography. New technologies are providing new opportunities in Geography instruction. In Geography classrooms, the use of digital maps is found to provide learning advantages over traditional maps, in part due to constraints of the print medium (Verdi, Crooks, & White, 2003). Tools such as geographic information systems (GIS), remote sensing, global positioning systems, geospatial technologies, and Google Earth can enhance instruction and learning by facilitating geographic analysis. Research on the use of geospatial technologies, particularly GIS, in Geography instruction shows that these tools facilitate problem-based and inquiry-based learning; provide opportunities for issue-based, student-centered education; and empower students to become active users of geospatial data and active learners of geography. Moreover, these technologies are found to enhance students’ spatial thinking skills and geospatial relational thinking (e.g., Demirci, Karaburun, & Kilar, 2013; Favier & Van der Schee, 2014).
U.S. History. Students’ learning of history benefits from the consultation and analysis of historical evidence and texts (e.g., primary sources in print and digital form) and the engagement of multiple methods to conduct in-depth research (Brophy, 1992). When students interact with primary sources such as historical narratives, personal letters, or diaries, they are able to make more complex connections to individuals from the past and have an opportunity to practice examining sources critically; such analyses can be done in conjunction with the use of other resources such as films and novels (e.g., examples of counterfactual history) in order to enhance historical understanding (Roberts, 2011). The use of multimedia-based software to supplement textbook and lecture materials has also been found to have positive effects on middle school U.S. History students’ achievement (Kingsley & Boone, 2006).
Issue 2.3: Use of Assessments
Summative assessments are essentially assessments of learning or knowledge that has already been acquired. By contrast, formative assessments can help teachers understand what a student knows and can do so that the teacher can plan instruction more effectively. Scholars have advocated the use of improved assessments, including formative assessments, in social studies to facilitate students’ critical thinking skills (e.g., Stobaugh, Tassell, Day, & Blankenship, 2011). Formative assessments can have a particularly positive impact on the achievement of low-performing students (Treffinger, 2008). Arieli-Attali, Wylie, and Bauer (2012) provide an example how effective formative assessments can be designed by combining two components: a locator test that would place student understanding with respect to
NAEP 2018-2019 OMB Clearance: Supporting Statement Part C Page 186

levels of understanding within a set of learning progressions, and incremental tasks to be used by teachers in class, both to update teachers’ understanding of where students are in their understanding and to support student learning as they transition from one level to the next within a progression. Research findings indicate that teachers gather better quality evidence of student understanding when they apply effective formative assessments in their classroom (e.g. McGatha, Bush and Rakes, 2009). Formative assessments can not only provide the teacher with important diagnostic feedback to guide instruction, but also help students understand and overcome misconceptions by encouraging the higher-order thinking skills of questioning and reflective thinking (Chin & Teou, 2009). Research has found that the use of low-stakes multiple-choice, short answer quizzes, and brief vocabulary-matching probes as a learning mechanism can help to monitor and boost students’ academic performance in social studies courses (Espin, Busch, Shin, & Kruschwitz, 2001; Roediger, Agarwal, McDaniel, & McDermott, 2011).
Research suggests that teachers’ incorporation of student self-assessments, or tasks used to evaluate one’s performance and identify strengths and weaknesses for the purpose of improving learning outcomes, into their instructional design is also beneficial to student achievement. The positive effects of self-assessment on achievement, particularly when used for formative rather than summative purposes, is reported across a range of academic subjects (e.g., Andrade & Boulay, 2003; Ross, et al., 2002a, 2002b). With respect to social studies, Ross and Starling (2008) found that the use of student self-assessments in a technology-supported learning context (i.e., grade 9 Geography classes using GIS software) had a positive effect on student performance across three domains of learning (spatial reasoning, solving authentic problems, basic geographic knowledge and skill) and student self-efficacy (for more on self-efficacy, see Issue 4). Similarly, Panadero, Tapia, and Huertas (2012) examined the use of formative self-assessment tools—specifically, rubrics (consisting of task criteria, a scale for rating different levels of achievement, and a description of each qualitative level) and scripts (consisting of structured questions designed to guide a learner through the process of understanding and completing a task)—and found that both tools increased secondary school students’ learning in Geography. Additionally, their results indicated that scripts enhanced students’ self-regulation of their own learning process.
Implementation Recommendation for Issue 2:
Future item development should focus especially on enhancing the measurement of curriculum content, instructional strategies, and teacher practices as three important aspects of opportunity to learn. Questions should focus on digital technology-based resources, and incorporation of traditional resources, assessments, interactive tools, and multimedia resources into the classroom. Important questions to address also include how teachers adapt their teaching practices to the rapid technological changes (i.e., do they try to incorporate new digital technology), how teachers use technological devices to engage students with social studies content (i.e., as part of the main lesson or as a supplement), and how technology-based activities impact the curricula at different grade levels (i.e., are students expected to read print materials or interact with other resources on a digital device such as a laptop or tablet). Teachers’ use of formative assessments in instruction is another suggested focus for development.
NAEP 2018-2019 OMB Clearance: Supporting Statement Part C Page 187
ISSUE 3: TEACHER PREPARATION
Torney-Purta, Richardson, and Barber (2005) identify three characteristics that are important to effective preparation in teaching social studies: content knowledge, pedagogical content knowledge, and beliefs. Similarly, three sub-issues pertaining to teacher preparation are described in this paper: content knowledge, subject-specific pedagogical training and professional development, and noncognitive teacher factors. Teachers who have a sophisticated grasp of social studies, who have experience teaching social studies to students of diverse backgrounds and learning styles, and who have access to professional development opportunities are likely to be more adept at providing students with a strong conceptual understanding than are teachers who lack these advantages. These sub-issues are described in Table 4.
Table 4 - Teacher Preparation: Sub-issues
Issue 3.1: Education and Training
Teachers’ subject-specific undergraduate and graduate coursework is a crucial indicator of their overall preparation. However, information regarding formal education and training alone is not sufficient for understanding the extent of teachers’ preparation. Traditionally, teachers' subject content knowledge has been assessed based on variables such as courses taken and degrees attained (Hill, Rowan, & Ball, 2005). In recent years, instruments have also been developed that are intended to measure teachers' content-specific knowledge and pedagogical content knowledge (e.g., Hill, Schilling, & Ball, 2004; Hill, Ball & Schilling, 2008). Measures of teachers’ content-specific knowledge have been associated with student performance gains (Hill et al., 2005) and better identification and remediation of gaps in students’ knowledge (e.g., Carpenter, Fennema, Peterson, Chiang, & Loef, 1989). Thus, understanding teachers’ formal education in addition to their subject-specific knowledge is important to understanding preparation and subsequent instructional effectiveness.
Content knowledge is inextricable from pedagogical knowledge. That is, teachers’ ability to provide first-rate instruction in social studies is strongly related to their own subject-matter expertise as well as to their training in how to teach these concepts. A thorough knowledge of social studies enables teachers to teach dynamically—by demonstrating different representations of the same concept, encouraging student questions, and providing alternative explanations. Teachers who lack such grounding may often rely primarily upon teaching procedures and rote instruction, whereas teachers with stronger social studies skills are also able to stress more complex, conceptual understanding.
In addition to teachers’ content knowledge and subject-specific training, gathering information about teachers’ pedagogical knowledge and training seems equally important. To provide targeted instruction based on students’ needs, engage students in classroom discussion, and foster students’ interest in learning course content, teachers need to be equipped with the necessary pedagogical knowledge. Undergraduate and graduate coursework in social studies-specific pedagogy is therefore also important. Social studies is less prioritized among educators in the United States, with teachers and students viewing social studies as the least important of the core subject areas (Good et al., 2010; Passe, 2006; Zhao & Hoge,
NAEP 2018-2019 OMB Clearance: Supporting Statement Part C Page 188
2005). For instance, elementary teacher education programs have found that pre-service teachers experience less time in social studies-specific instruction during student teaching compared to other core subject areas (Bolick, Adams, & Willox, 2010; Yon & Passe, 1990). This lack of emphasis and prioritization on student teaching in social studies can lead to educators feeling less prepared to teach the subject.
Issue 3.2: Professional Development
Teachers’ participation in pre-service and in-service professional development activities that focus on social studies is critical to teacher preparation. Professional development in social studies content knowledge may be especially valuable, though pedagogically-oriented development opportunities are also important. Professional development opportunities include courses, workshops, seminars, classroom observations and critiques (both observing and being observed), conferences, “camps,” or any other venue in which teachers are expected to hone their subject-matter or pedagogical skill—both within and outside of the school environment. De La Paz, Malkus, Monte-Sano, and Montanaro (2011) found effects of professional development (specifically, participation in a federally funded Teaching American History project) on teachers’ pedagogical knowledge and on 5th and 11th grade students’ content knowledge in U.S. History; teachers of successful students had participated in activities that allowed them to increase their content knowledge and broaden their approach to teaching with primary documents. Moreover, Torney-Purta et al. (2005) found that U.S. schools where teachers reported participating in civics-related professional training had students with significantly higher civic knowledge and skills than students where teachers did not report such training. More specifically, teachers’ in-service training is associated with students’ mastery of civics concepts and civics-related process skills (Zhang, Torney-Purta, & Barber, 2012).
To enhance their learning and to assist with curriculum planning, teachers can also access online instructional materials, websites, and chat rooms devoted to instruction in their specific subject. Given the growing role of digital technology in social studies instruction, teachers must be trained in the effective use of computers and emerging technologies (see Issue 1). Participation in professional development courses that focus on integrating technology with instruction is one way for teachers to learn how these tools can enhance learning. Some teachers may not use digital technology because it is not available; others may avoid it because they lack the knowledge to incorporate it effectively; and still others may not fully understand the social studies-related content that technology allows students to access when analyzing and solving complex problems. When teachers participate in professional development programs that emphasize collective meetings with groups of teachers and that provide opportunities for teachers to review student work and discuss student responses and behaviors, they can deepen both their content and pedagogical knowledge needed to effectively engage in the critical tasks of teaching and develop their teaching practices (e.g., Desimone, Porter, Garet, Yoon & Birman, 2002; Guskey & Yoon, 2009; Garet, Porter, Desimone, Birman & Yoon, 2001).
In addition to professional development, teachers may also need other support staff, such as specialists and coaches who are highly trained in a particular domain and can support teaching in the classroom. Traditionally, specialists and coaches have been viewed as resources primarily for students, but recently these roles have expanded to
NAEP 2018-2019 OMB Clearance: Supporting Statement Part C Page 189
include serving as a mentor for teachers. Accordingly, the literature shows that support staff are important for teachers’ professional development (Dole, 2004).
Issue 3.3: Noncognitive Teacher Factors
Along with teachers’ content and pedagogical knowledge, teacher attitudes (e.g., self-efficacy, confidence, growth mindset, and attributions for student learning and achievement) play an important role in effective teaching and instruction. Teachers who are interested in the subject they are teaching, have positive attitudes towards their work, and show high levels of confidence in their ability to be effective in the classroom are more likely to be successful. For instance, studies show that teachers who have high teaching self-efficacy are more likely to be open to new ideas and concepts, try new instructional methods, and persist when things in the classroom do not go well (Berman, McLaughlin, Bass, Pauly, & Zellman, 1977; Guskey, 1988; Stein & Wang, 1988). The literature also shows that teacher self-efficacy can in turn influence students’ achievement, motivation, and self-efficacy (Anderson, Greene, & Loewen, 1988; Midgley, Feldlaufer, & Eccles, 1989; Moore & Esselman, 1992; Ross 1992). These findings are consistent with work examining social studies teachers’ beliefs, including their confidence in teaching and goals for students in the classroom (Chin & Barber, 2010; Dunkin et al., 1998). Other noncognitive factors, such as curiosity, growth mindset, and attributional beliefs have also been shown to play an important role in teaching and student learning (e.g., Dweck, Walton, & Cohen, 2014).
Implementation Recommendation for Issue 3:
Future item development should focus especially on adding questions addressing teachers’ preparedness to integrate digital technology in their social studies instruction in purposeful ways. Additionally, development may consider differentiating between professional development programs (e.g., content- versus pedagogy-focused professional development programs), including questions about web-based trainings and teachers’ experiences with professional development programs, and including questions about noncognitive teacher factors, such as teachers’ confidence to implement various instructional elements (e.g., content, pedagogical knowledge), mindset, and attributions for student achievement. Questions about noncognitive teacher factors will clearly focus on teachers views of learning and instruction in social studies to ensure alignment with the NAEP statute to refrain from measuring “personal or family beliefs and attitudes.”
NAEP 2018-2019 OMB Clearance: Supporting Statement Part C Page 190
ISSUE 4: STUDENT FACTORS
As depicted in the schematic model in the introduction of this paper, noncognitive student factors constitute an important set of contextual variables relevant to student achievement. In this paper, we categorize student factors into social, motivational, and self-regulatory facets. Social facets encompass student engagement with opportunities to learn in school (see Issues 1 and 2) and outside of school (described in this section). Activities and behaviors signaling engagement with social studies can include reading history books or news articles for enjoyment; discussing social studies-related readings or current events with friends and family; engaging in conversations about politics or civics-related issues with friends and family; field trips outside of school; or participating in other social studies-related activities beyond strictly school-related tasks. Engagement variables constitute important predictors, moderators, and mediators of social studies achievement. Motivation also plays a crucial role in students’ persistence and how much effort they exert in school (Baker & Wigfield, 1999; Becker, McElvany, & Kortenbruck, 2010; Retelsdorf, Köller, & Möller, 2011; Taboada, Tonks, Wigfield, & Guthrie, 2009). Knowing the level of interest and motivation students exert during a task or test can bring about improvements to instructional methods, test design, and test interpretation that more accurately gauge and enhance student’s proficiency (Sabatini & O’Reilly, 2013). Other self-regulatory or self-related attitudes such as self-efficacy, self-concept, and confidence have been shown to be highly associated with achievement across many studies (Guthrie & Wigfield, 2000; OECD, 2010). Relevant sub-issues are described further in Table 5.
Table 5 - Student Factors: Sub-issues
Issue 4.1.: Social facets
Student engagement in opportunities to learn, specifically how they spend their time outside of the classroom and outside of school, adds an important complementary component to studying student engagement in classroom instruction. Several studies provide evidence that students’ time use patterns in general (i.e., not only time spent on social studies-related activities) relate to important success variables. Time use patterns might play a key mediating role between various student contextual factors (such as SES) and performance variables; that is, they have the potential to explain important relationships between these variables (e.g., Porterfield and Winkler, 2007). While more than 60 countries of the world economy regularly conduct systematic time use studies among adults and adolescents, time use has not been measured as part of educational large-scale assessments to date. However, research provides a strong support for their inclusion. Important activities and behaviors to capture with regard to students’ time use include extracurricular activities (e.g., volunteerism, clubs), homework, study time, and other social studies-related activities (e.g., Model U.N., debate teams).
Patterns of free-time activities in middle childhood predict adjustment in early adolescence (McHale, Crouter, & Tucker, 2001). Additionally, Fuligni and Stevenson (1995) showed in their cross-cultural study that free-time use predicts achievement (in this case, in math) across several countries. Participation in extracurricular activities has also been demonstrated to protect against early school drop-out for at-risk students (Mahoney and Cairns, 1997).
Student engagement outside of school is clearly related to involvement in extracurricular activities and hobbies (Fredricks & Eccles, 2006). These activities,
NAEP 2018-2019 OMB Clearance: Supporting Statement Part C Page 191
including music, fine arts, academic clubs, and athletics, have been shown to be beneficial to academic growth. Participation in such activities can provide students with opportunities to learn about teamwork, respect, and responsibility, and provide a venue for the student to apply these lessons (NCES, 1995). With regards to social studies, engagement in extracurricular activities can enable students to more personally engage with history or democratic citizenship (e.g., Morris, 2012). Participation in extracurricular activities has been associated with academic achievement (NCES, 1995). Similarly, Marsh’s (1992) analysis of student participation in extracurricular activities indicated that extracurricular involvement is associated with improved GPA and higher educational aspirations (Broh, 2002). Furthermore, adolescents engaged in community civic activities demonstrate higher grades and motivation, enhanced well-being, and fewer problem behaviors (Ludden, 2011).
Ben-Avie, Haynes, White, Ensign, Steinfeld, & Sartin (2003) have emphasized the meaningful connection between student engagement and perseverance in their studies evaluating the work of the Institute for Student Achievement (ISA) for three years. Perseverance is defined as “students’ persistence in performing strategic behaviors that increase the likelihood of academic success, regardless of obstacles or distractions” (p.22). Students’ openness for problem solving (e.g., enjoyment in solving complex problems, seeking explanations for things), their planning and organization behaviors (e.g., making to-do lists, keeping notes for subjects; finishing assignments on time, not doing things at last minute), persistence even on difficult tasks (e.g., not putting off difficult problems, not giving up easily), and general work ethics (e.g., preparing for class, working consistently throughout the school year) are not only among the most predictive noncognitive predictors of GPA (see recent meta-analysis by Richardson et al., 2012), but also important predictors of success in higher education and the workforce in general (e.g., Heckman, Stixrud & Urzua, 2006; Lindqvist & Vestman, 2011; Poropat, 2009; Roberts et al., 2007). Student engagement also contributes to the development of collaboration, another key competency that is considered important for educational and workforce success (Nagaoka et al., 2015). Collaboration, or working with others effectively and respectfully toward a common goal, is commonly practiced through group-based activities and learning opportunities both in school and outside of school. While collaboration builds upon a set of skills related to working with others, it also requires a particular individual mindset that allows for an openness to and valuing of others’ contributions (Nagaoka et al., 2015). Thus, collaboration not only has the potential to inform whether effective group-based learning is occurring in class, but also students’ enjoyment and orientation towards working with others in general.
In addition to extracurricular activities, hobbies, and social studies-specific undertakings (e.g., community service, civic participation, political activism), engagement in opportunities outside of school may include the completion of homework and studying. The existing literature on homework is optimistic, as most studies indicate it has a positive impact on academic achievement (McMullen, 2007; Neilson, 2005). Cooper, Robinson, and Patall (2006) analyzed recent articles across education, psychology, and sociology and found that increased amounts of homework are related to small increases in academic achievement (McMullen, 2007). Using data from the National Educational Longitudinal Study of 1988, Aksoy and Link (2000) found homework to have a positive and significant impact on 10th
NAEP 2018-2019 OMB Clearance: Supporting Statement Part C Page 192
grade math scores (Eren & Henderson, 2008). Additionally, Betts (1997) used teacher-reported hours of homework assigned to understand the effect of homework on math scores and also found significant results. However, some research also points to a negative relationship between homework and academic achievement, indicating that there are some limits to the extent to which homework can be beneficial (Cooper & Valentine, 2001). Research by Galloway and Pope (2007) indicates that schoolwork, more specifically homework, is a primary source of stress and worry among high school students, particularly those who spend more time per night (e.g., more than 3.5 hours) completing it. Thus it is important to note that in addition to homework quantity, homework quality plays a key part in student performance. The same study by Galloway and Pope (2007) finds that when high school students perceive their homework as more useful for their learning and preparation for tests and projects, they report less stress and worry. This is consistent with previous research showing that relevant and purposeful schoolwork is related to increased academic motivation (Committee on Increasing High school Students’ Engagement and Motivation to Learn, 2003). In addition, the nature of the assignment itself matters. For instance, Hippler, Alber, and Heward (1998) found that students performed better on next-day quizzes when they were assigned structured worksheets (e.g., fill-in-the-blank questions) compared to traditional homework assignments (e.g., open-ended questions). In an extension of this research, students who completed structured reading worksheets for social studies homework performed higher on next-day quizzes and maintained more social studies content than students assigned standard review questions for homework (Alber, Nelson, & Brennan, 2002). In sum, these findings indicate that student engagement in homework and studying is an important factor to consider when seeking to understand student achievement.
Discipline-Specific Considerations
Civics. Opportunities to develop civic knowledge and skills in high school typically take the form of volunteering, community service, school government, and service clubs, which tend to be disproportionately available to wealthier students (Kanter & Schneider, 2013; National Task force on Civic Learning and Democratic Engagement, 2012). The research literature suggests that students’ civic engagement is associated with a number of and individual benefits (e.g., resilience, self-efficacy) (Bradshaw, Hoelscher, & Richardson, 2007), social benefits (e.g., greater social capital, stronger community network, voting/electoral engagement) (Black, Stokes, Turnbull & Levy, 2009; Callahan, Muller, & Schiller, 2010; Geske & Ceske, 2013), and academic benefits (e.g., literacy, analysis, communication, problem-solving, social competency) (e.g., Edwards, Johnson, & McGillicuddy, 2003). Despite its potential for positive outcomes, socioeconomic status is a factor that might limit civic engagement at the school, community, and local level. Thus, civic engagement may serve as an important predictor of success or outcome in its own right (e.g., the extent to which civics knowledge is subsequently applied).
Issue 4.2.: Motivational facets
Achievement Motivation. Achievement motivation captures students’ motivation to achieve positive results in specific classes and in school in general, and is closely related to a general motive of being a good student and being better than other
NAEP 2018-2019 OMB Clearance: Supporting Statement Part C Page 193
students in class. Meta-analyses have found that achievement motivation is one of the strongest predictors of success (e.g., Richardson et al., 2012).
A central requirement of effective learning is the motivation to learn—the driving force behind learning. Deci and Ryan (1985) devised a theory of learning motivation that differentiates between intrinsic and extrinsic motivation and explicitly acknowledge the central importance of self-conceptions within the motivational spectrum (Ryan & Deci, 2003). Extrinsically motivated students pursue learning goals associated with valued consequences located outside the person and deemed personally important, such as instrumental value, positive feedback or rewards for good performance. Instrumental motivation captures whether students see social studies as useful for their real life and their future choices whether or not to study social studies topics beyond school and/or chose a social studies-oriented career.
In contrast, intrinsically motivated learners are motivated by internal rather than external incentives. Students might, for example, learn in order to find out more about a subject domain or to achieve the positive emotional state that learning can engender (Csikszentmihalyi, 1990). Interest and enjoyment are classic examples of intrinsic motivation (Bøe et al., 2011; Renninger, Hidi, & Krapp, 1992) that represent a relatively stable evaluative orientation towards certain topics or domains. Intrinsic motivation is often accompanied by positive feelings (e.g., feelings of involvement or stimulation) and attribution of personal significance to an object or domain. Subject-specific intrinsic motivation affects the intensity and continuity of engagement in learning situations, the selection of learning strategies, and the depth of understanding achieved, and choice behaviors (Schiefele, 2001).
Using Trends in International Mathematics and Science Studies (TIMSS) 2003 eighth grade mathematics data, Zhu and Leung (2011) investigated the effects of intrinsic and extrinsic motivation on learning and academic performance. They found that overall, more than 70% of students had a higher level of extrinsic than intrinsic motivation. Regression analyses further revealed a significant positive effect of pleasure-oriented (intrinsic) motivation on mathematical achievement among the U.S. students (r=.17, p<.001). Data from the 2003 cycle of the Program for International Student Assessment (PISA) support these findings by indicating that both the degree and continuity of engagement in learning and the depth of understanding relates to interest in and enjoyment of particular subjects, or intrinsic motivation. This effect has been shown to operate largely independently of students’ general motivation to learn (OECD, 2004). In sum, intrinsic motivation can be understood as a factor for engagement and constitutes at the same time an important outcome of increased engagement.
With respect to social studies, Gehlbach (2006) examined the relationship between achievement motivation goals and several outcomes among 9th and 10th grade world history students over the course of a school year. Results indicated that increases in an intrinsic or mastery goal orientation (e.g., a focus on developing competence, learning new skills, and mastering new concepts or ways of thinking) during the school year were positively related to academic achievement, specifically in world history knowledge and social studies grades. In contrast, increases in an extrinsic or performance goal orientation (e.g., a focus on outperforming others and looking smart in front of others) were unrelated to social studies achievement. Moreover,
NAEP 2018-2019 OMB Clearance: Supporting Statement Part C Page 194
increases in mastery goal orientation were positively related to interest in world events, course satisfaction, social perspective taking (i.e., the propensity to try and discern what others are thinking and feeling), and historical empathy (i.e., the propensity to place historical events in their proper context and seek out multiple forms of evidence to form opinions about historical occurrences) (Gehlbach, 2006). Consistent with these findings, work by Brookhart, Walsh, and Zientarski (2006) has also examined the dynamics of achievement motivation and effort in middle school social studies classrooms. These researchers found that mastery goal orientation predicts achievement even after controlling for students’ prior performance and their classroom assessment environment, though related work also suggests that social studies classroom assessments tend to engage both mastery and performance goal orientations (Brookhart & Durkin, 2003).
Interest and Attitudes. Interest captures whether students value and show interest in the topics covered in school and generally like specific subjects. Interest and enjoyment is strongly related to motivation. Research has documented that students tend to perceive social studies as less interesting and important compared to other subjects such as English and Mathematics (e.g., Schug, Todd, & Beery, 1984; Stodolsky, Salk, & Glasessner, 1991; Wolters & Pintrich, 1998). These findings are notable, as students’ perception of the importance and utility of a class or assigned task, in concert with their perception of their ability to succeed, can affect motivation (Pintrich & Schrauben, 1992; Wolters & Pintrich, 1998), effort (Salomon, 1983), and ultimately achievement (Gipps, 1994; Wolters, Yu, & Pintrich, 1996).
Students who have positive attitudes and emotions towards a subject are in a position to learn that subject better than students who feel anxiety or negative emotion towards it. For instance, students who are anxious about mathematics tasks and tests are less likely to be successful and struggle with reaching their true potential when engaging in related tasks. Research (e.g., Deci & Ryan, 1985; Eccles & Wigfield, 2002; Renninger, 2000; Renninger, 2009; Renninger, Hidi & Krapp, 1992; Stipek & MacIver, 1989) provides a clear theoretical rationale for the separation of affective factors such as interest and enjoyment from motivational and self-regulatory components such as goal orientation and competency self-beliefs.
Issue 4.3.: Self-regulatory facets
Self-efficacy refers to the beliefs that individuals hold about what they believe they are capable of accomplishing. These self-perceptions determine how individuals use the knowledge and skills that they have to achieve a certain task (Pajares & Schunk, 2001). It has been reported that self-efficacy beliefs are correlated with other self-beliefs, such as self-concept, and other motivational constructs (Zimmerman, 2000). Evidence has also suggested that self-efficacy and self-concept beliefs are each related to and influential on academic achievement (Pajares, 1996). Pintrich and De Groot (1990) suggest that self-efficacy has a special role in cognitive engagement; that is, it may increase self-efficacy beliefs that in turn could lead to more frequent and increased use of cognitive learning strategies, leading to higher achievement (Pajares & Schunk, 2001).
Students with high self-efficacy engage in effective self-regulating strategies more often than those with lower level beliefs; high self-efficacy also seems to enhance performance as these beliefs also tend to enhance persistence (Pajares, 1996; Bouffard- Bouchard, Parent, & Larivee, 1991; Berry, 1987). Self-efficacy beliefs have
NAEP 2018-2019 OMB Clearance: Supporting Statement Part C Page 195

been positively related to academic achievement, moderating the effect of experiences, abilities, and prior achievement. A meta-analysis by Multon, Brown, and Lent (1991) indicated that self-efficacy was significantly related to academic outcomes, with these effects becoming stronger as students progressed from elementary school to high school to college. The effects were stronger for classroom-based indices (i.e., grades) and basic skill measures when compared to standardized tests, demonstrating that self-efficacy beliefs are often subject and context-specific (Pajares & Schunk, 2001).
As mentioned previously, Brookhart, Walsh, and Zientarski (2006) examined middle school social studies students’ perceptions of the importance and value of assessment tasks in the classroom (a variable capturing interest and attitudes towards social studies), their achievement motivation, and perceived self-efficacy. They found that perceived self-efficacy was the strongest predictor of classroom achievement in social studies tests and performance assessments, even after controlling for students’ prior achievement (as measured by a standardized test) and their motivation. Similarly, Zimmerman, Bandura, and Martinez-Pons (1992) examined the causal role of students’ self-efficacy beliefs and academic goals in self-motivated academic attainment in social studies. They found that students’ self-efficacy and goals at the beginning of the semester predicted their final course grades in social studies. Moreover, they found that students’ self-efficacy for academic achievement mediated the influence of self-efficacy for self-regulated learning on academic achievement in social studies. In other words, students’ beliefs in their own ability to use self-regulated learning strategies affected their beliefs in succeeding in social studies, which in turn impacted their class performance.
Similarly, Stevens, Olivarez and Hamman (2006) have studied the relationship between cognitive, motivational and emotional variables to predict students’ performance in mathematics. Again, results supported the importance of self-efficacy as a strong predictor of performance. Students who feel more confident with a subject are more likely than others to apply lessons from that subject in the various contexts that they encounter. Taken together, self-efficacy is not only an important contextual factor for understanding academic achievement, but also an important outcome in its own right.
Overall, there is an ample amount of evidence that suggests self-efficacy and self-concept are powerful constructs that predict both academic beliefs and performance (Pajares, 1996). Self-concept is also widely accepted as an important universal aspect of being human and is central to understanding the quality of human existence (Bandura, 2006; Bruner, 1996; Marsh & Craven, 2006; Pajares, 1996; Pajares & Schunk, 2005). Positive self-beliefs are valued as a desirable outcome in many disciplines of psychology and are a central aspect of the current positive psychology movement, which focuses on how individuals can optimize their life (Diener, 2000; Fredrickson, 2001; Seligman & Csikszentmihalyi, 2000).
Research examining the relationship between learning perceptions of high competency and motivational variables were significantly correlated with a learning and mastery motivational goal focus, more positive emotions, and greater enjoyment (Stipek, Salmon, Givvin, Kazemi, Saxe, & MacGyvers, 1998). Additionally, students who have a strong sense of perceived control over their academic success
NAEP 2018-2019 OMB Clearance: Supporting Statement Part C Page 196
tend to approach tasks differently than students who do not think that they are in control of their success.
Discipline-Specific Considerations
U.S. History. Scholars have advocated for the importance of historical empathy, or the propensity for individuals to examine, appreciate, and understand the perspectives of people in the past within their separate context, in the development of complex historical thinking and understanding (Davis, Yeager, & Foster, 2001). Historical empathy may be conceptualized as both cognitive and affective in nature (Davison, 2010), as it captures an individual’s ability to hold different perspectives (cognitive perspective taking) and recognize others’ emotional responses or feelings (emotional perspective taking). Related work has revealed a significant relationship between social perspective taking and conflict resolution and achievement (i.e., social studies grades) among 9th and 10th grade world history students (Gehlbach, 2004). McCully et al. (2002) found that 11th grade history students who handled multiple sources and alternative perspectives in class were able to temporarily empathize with different political viewpoints. Similarly, Kohlmeier (2006) found that 9th grade world history students demonstrated increased historical empathy (i.e., appreciation of the historical context as both unique and connected to the present; ability to distinguish among various perspectives of historical figures) over the course of a semester. In this work, this growth in historical empathy was attributed to the provision of opportunities to practice it through Socratic classroom discussions that involved interpretation of historical documents.
Implementation Recommendation for Issue 4:
Future item development should focus on capturing the different aspects of noncognitive student factors given that they represent important performance predictors, moderators, or mediators of academic achievement; few existing items capture these sub-issues. Future item development should focus on capturing social, motivational, and self-regulatory facets such as student engagement in relevant activities inside and outside of school, student motivation, and specific beliefs or attitudes toward social studies topics. An important question to consider is how other student factors represented in the 2018 Core questionnaire can be contextualized for social studies (e.g., self-control); this would allow us to distinguish whether items are domain general or domain specific.62
6 Selection of what student factors to contextualize will be guided by the issues paper as well as lessons learned from item development completed in other subjects (e.g., Reading, Mathematics). For select student factors, contextualized (e.g., perceptions of social studies) and decontextualized (e.g., perceptions of school) items would be developed for testing in cognitive interviews in order to determine the appropriate version to administer in the pilot assessment. Similar to what has been done with other subjects, these items would be asked in the Social Studies section of the questionnaire and not the Core. For example, contextualized and decontextualized versions
NAEP 2018-2019 OMB Clearance: Supporting Statement Part C Page 197

of self-control items were examined in the Reading and Mathematics cognitive interviews. If cognitive interview data are inconclusive, similar items may also be tested in the pilot to further inform appropriate versions to ask in the operational assessment (e.g., administration of different versions of an item to equivalent samples).
NAEP 2018-2019 OMB Clearance: Supporting Statement Part C Page 198
REFERENCES
Adeyemi, M. B. (1992). The relative effectiveness of the reflective and the lecture approach methods on the achievement of high school social studies students. Educational Studies, 18, 49-56.
Aksoy, T., & Link, C. R. (2000). A panel analysis of student mathematics achievement in the US in the 1990s: does increasing the amount of time in learning activities affect math achievement? Economics of education review, 19(3), 261-277.
Alber, S.R., Nelson, J.S., Brennan, K.B. (2002). A comparative analysis of two homework study methods on elementary and secondary school students’ acquisition and maintenance of social studies content.
Ancess, J. (2000). The reciprocal influence of teacher learning, teacher practice, school restructuring, and student learning outcomes. Teachers College Record, 102(3), 590-619.
Anderson, R., Greene, M., & Loewen, P. (1988). Relationships among teachers’ and students’ thinking skills, sense of efficacy, and student achievement. Alberta Journal of Educational Research, 34(2), 148–165.
Andrade, H.G. and B.A. Boulay. 2003. Role of rubric-referenced self-assessment in learning to write. Journal of Educational Research, 97, 21–34.
Ansalone, G., & Ming, C. (2006), Programming students for academic success: The PLS as an alternative to traditional tracking. Educational Research Quarterly, 29, 3-10.
Arieli-Attali, M., Wylie, E. C., Bauer, M. I. (2012, April). The use of three learning progressions in supporting formative assessment in middle school mathematics. Paper presented at the annual meeting of the American Educational Research Association, Vancouver, Canada.
Baker, L., & Wigfield, A. (1999). Dimensions of children’s motivation for reading and their relations to reading activity and reading achievement. Reading Research Quarterly, 34, 452-477.
Bandura, A. (1986). Social foundations of thought and action: A social cognitive theory. Englewood Cliffs, NJ: Prentice Hall.
Barrick, M.R., Stewart, G. L. & Piotrowski, M. (2002). Personality and job performance: Test of the mediating effects of motivation among sales representatives. Journal of Applied Psychology, 87, 43–51.
Barton, K.C., Bednarz, S., Levine, P. (2014, November). NAEP Civics, Geography, & U.S. History: Considerations for future assessments. NAEP Social Studies Standing Committee White Paper.
Barton, S. (2000). What does the research say about achievement of students who use calculator technologies and those who do not? In Electronic Proceedings of the Thirteenth Annual International Conference on Technology in Collegiate Mathematics. See also [online] http://archives.math.utk.edu/ICTCM/EP-13 C (25).
Becker, M., McElvany, N., & Kortenbruck, M. (2010). Intrinsic and extrinsic reading motivation as predictors of reading literacy: A longitudinal study. Journal of Educational Psychology, 102(4), 773.
Beeland, W. D. (2002, July). Student engagement, visual learning and technology: Can interactive whiteboards help. In Annual Conference of the Association of Information Technology for Teaching Education.
NAEP 2018-2019 OMB Clearance: Supporting Statement Part C Page 199
Ben-Avie, M., Haynes, N. M., White, J., Ensign, J., Steinfeld, T. R., Sartin, L., & Squires, D. A. (2003). Youth development and student learning in math and science. How Social and Emotional Development Add Up: Making Gains in Math and Science Education, 9(35).
Berman, P., McLaughlin, M., Bass, G., Pauly, E., & Zellman, G. (1977). Federal programs supporting educational change. Vol. VII: Factors affecting implementation and continuation (Report No. R-1589/7-HEW). Santa Monica, CA: The Rand Corporation (ERIC Document Reproduction Service No.140 432).
Berry, C. M., Ones, D. C. & P.R. Sackett, P. R. (2007). Interpersonal deviance, organizational deviance, and their common correlates: A review and meta–analysis. Journal of Applied Psychology, 92, 410-424.
Bisland, B.M. (2012). The marginalization of social studies: An overview. In W.B. Russell (Ed.), Contemporary Social Studies: An Essential Reader (pp. 173-191). Charlotte, NC: Information Age Publishing.
Black, R., Stokes, H., Turnbull, M.J., & Levy, J. (2009). Civic participation through the curriculum. Youth Studies Australia, 28, 13-20.
Bøe, M. V., Henriksen, E. K., Lyons, T., & Schreiner, C. (2011). Participation in science and technology: young people’s achievement‐related choices in late‐modern societies. Studies in Science Education, 47(1), 37-72.
Bolick, C.M., Adams, R., & Willox, L. (2010). The marginalization of elementary social studies in teacher education. Social Studies Research and Practice, 5, 1-22.
Box, J. A., & Little, D. C. (2003). Cooperative small-group instruction combined with advanced organizers and their relationship to self-concept and social studies achievement of elementary school students. Journal of Instructional Psychology, 30, 285-287.
Bradshaw, J., Hoelscher, P. & Richardson, D. (2007). An index of child well-being in the European Union. Social Indicators Research, 80, 133-77.
Broh, B. A. (2002). Linking extracurricular programming to academic achievement: Who benefits and why? Sociology of Education, 75(1), 69-95.
Brookhart, S.M., & Durkin, D.T. (2003). Classroom assessment, student motivation, and achievement in high school social studies classes. Applied Measurement in Education, 16, 27-54.
Brookhart, S.M., Walsh, J.M., & Zientarski, W.A. (2006). The dynamics of motivation and effort for classroom assessments in middle school science and social studies. Applied Measurement in Education, 19, 151-184.
Brophy, J. (1992). Fifth-grade U.S. history: How one teacher arranged to focus on key areas in depth. Theory and Research in Social Education, 20, 141-155.
Brownell, J.E., & Swaner, L.E. (2010). Five high-impact practices: Research on learning outcomes, completion, and quality. Washington, DC: Association of American Colleges and Universities.
Callahan, R.M., Muller, C., & Schiller, K.S. (2010). Preparing the next generation for electoral engagement: Social studies and the school context. American Journal of Education, 116, 525-556.
NAEP 2018-2019 OMB Clearance: Supporting Statement Part C Page 200
Carpenter, T. P., Fennema, E., Peterson, P. L., Chiang, C. P., & Loef, M. (1989). Using knowledge of children’s mathematics thinking in classroom teaching: An experimental study. American Educational Research Journal, 26, 499-531.
Chin, C., & Teou, L. Y. (2009). Using concept cartoons in formative assessment: Scaffolding students’ argumentation. International Journal of Science Education, 31(10), 1307-1332.
Chin, K., & Barber, C.E. (2010). A multi-dimensional exploration of teachers’ beliefs about civic education in Australia, England, and the United States. Theory & Research in Social Education, 38, 395-427.
Civil, M. (2002). Culture and mathematics: A community approach. Journal of Intercultural Studies, 23,133-148.
Committee on Increasing High School Students’ Engagement and Motivation to Learn. (2003). Engaging schools: Fostering high school students’ motivation to learn. Washington, D.C.: National Academies Press.
Common Sense Media, (2013). Teaching with Technology: The Promise and Reality of the U.S. Digital Classroom. White paper retrieved from cdn2.ec.graphite.org/sites
Davis, O.L., Yeager, E.A., & Foster, S.J. (2001). Historical Empathy and Perspective Taking in the Social Studies. Lanham, MD: Rowman & Littlefield.
Davison, M. (2010). The case for empathy in the classroom. Curriculum Matters, 6, 82-98.
De La Paz, S., Malkus, N., Monte-Sano, C., & Montanaro, E. (2011). Evaluating American History teachers’ professional development: Effects on student learning. Theory and Research in Social education, 39, 494-540.
Deci, E.L. & Ryan, R.M. (1985). Intrinsic motivation and self-determination in human behavior. New York: Plenum Press.
Demirci, A., Karaburun, A., & Kilar, H. (2013). Using Google Earth as an educational tool in secondary school geography lessons. International Research in Geographical and Environmental Education, 22, 277-290.
Desimone, L., Porter, A. C., Birman, B. F., Garet, M. S., & Yoon, K. S. (2002). How Do District Management and Implementation Strategies Relate to the Quality of the Professional Development That Districts Provide to Teachers? Teachers College Record, 104, 1265-1312.
Devlin-Scherer, R., & Sardone, N.B. (2010). Digital simulation games for social studies classrooms. The Clearing House, 83, 138-144.
Dole, J.A. (2004). The changing role of the reading specialist in school reform. International Reading Association, 462-471.
Duckworth, A.L., Peterson, C., Matthews, M.D., & Kelly, D.R. (2007). Grit: Perseverance and passion for long-term goals. Journal of Personality and Social Psychology, 92, 1087-1101.
Duckworth, A.L., Quinn, P.D., & Seligman, M.E.P. (2009). Positive predictors of teacher effectiveness. The Journal of Positive Psychology, 4, 540-547.
Dunkin, M.J., Welch, A.A., Merritt, A.A., Phillips, R.R., & Craven, R.R. (1998). Teachers’ explanations of classroom events: Knowledge and beliefs about teaching civics and citizenship. Teaching and Teacher Education, 14, 141-151.
NAEP 2018-2019 OMB Clearance: Supporting Statement Part C Page 201
Dweck, C.S., Walton, G.M., & Cohen, G.L. (2014). Academic Tenacity: Mindsets and Skills that Promote Long-Term Learning. Bill and Melinda Gates Foundation.
Eccles, J. S., & Wigfield, A. (2002). Motivational beliefs, values, and goals. Annual review of psychology, 53(1), 109-132.
Edwards, D., Johnson, N.A., & McGillicuddy, K. (2003). An emerging model for working with youth. Funders’ Collaborative on Youth Organizing, NY.
Eren, O., & Henderson, D. J. (2008). The impact of homework on student achievement. The Econometrics Journal, 11(2), 326-348.
Ericsson, K. A., & Charness, N. (1994). Expert performance: Its structure and acquisition. American Psychologist, 49, 725–747.
Espin, C. A., Busch, T. W., & Shin, J. (2001). Curriculum-based measurement in the content areas: Validity of vocabulary-matching as an indicator of performance in social studies. Learning Disabilities Research and Practice, 16, 142-151.
Farrington, C.A., Roderick, M., Allensworth, E., Nagaoka, J., Keyes, T.S., Johnson, D.W., & Beechum, N.O. (2012). Teaching adolescents to become learners. The role of noncognitive factors in shaping school performance: A critical literature review. Chicago: University of Chicago Consortium on Chicago School Research.
Favier, T.T., & van der Schee, J.A. (2014). Effects of geography lessons with geospatial technologies on the development of high school students’ relational thinking. Computers & Education, 76, 225-236.
Fitchett, P.G., Heafner, T.L., & Lambert, R.G. (2014). Assessment, autonomy, and social studies instructional time. Teachers College Record. http://www.tcrecord.org/Content.asp?ContentId-17605.
Fitchett, P.G., Heafner, T.L., & VanFossen, P. (2014). An analysis of time prioritization for social studies in elementary school classrooms. Journal of Curriculum and Instruction, 8, 7-35.
Fredricks, J. A., & Eccles, J. S. (2006). Is extracurricular participation associated with beneficial outcomes? Concurrent and longitudinal relations. Developmental Psychology, 42, 698.
Fuligni, A. J., & Stevenson, H. W. (1995). Time use and mathematics achievement among American, Chinese, and Japanese high school students. Child Development, 66(3), 830-842.
Gainsburg, J. (2008). Real-world connections in secondary mathematics teaching. Journal of Mathematics Teacher Education, 11(3), 199-219.
Gallavan, N. P., & Kottler, E. (2002). After the reading assignment: Strategies for leading student-centered classroom conversations. The Social Studies, November/December, 267-271.
Galloway, M. K., & Pope, D. (2007). Hazardous Homework?: The relationship between homework, goal orientation, and well-being in adolescence. Encounter: Education for Meaning and Social Justice, 20, 25-31.
Galton, F. (1892). Hereditary Genius: An inquiry into its laws and consequences. London: Macmillan.
Gamoran, A., & Nystrand, M. (1991). Background and instructional effects on achievement in eighth-grade English and social studies. Journal of Research on Adolescence, 1, 277-300.
NAEP 2018-2019 OMB Clearance: Supporting Statement Part C Page 202
Garet, M. S., Porter, A. C., Desimone, L., Birman, B. F., & Yoon, K. S. (2001). What makes professional development effective? Results from a national sample of teachers. American Educational Research Journal, 38(4), 915-945.
Gehlbach, H. (2004). Social perspective taking: A facilitating aptitude for conflict resolution, historical empathy, and social studies achievement. Theory and Research in Social Education, 32, 39-55.
Gehlbach, H. (2006). How changes in students’ goal orientations relate to outcomes in social studies. The Journal of Educational Research, 99, 358-370.
Gipps, C.V. (1994). Beyond Testing: Towards a Theory of Educational Assessment. New York, NY: Routledge.
Geske, A., & Cekse, I. (2013). The influence of civic and citizenship education achievements on the development of students’ citizenship attitudes. Problems of Education in the 21st Century, 52, 21-34.
Good, A.J., Heafner, T.L., Rock, T.C., O’Connor, K.A., Passe, J., Waring, S., & Byrd, S.P. (2010). The de-emphasis on social studies in elementary schools: Teacher candidate perspective. Current Issues in Education, 13, 1-22.
Graf, E. A., Bassok, M. I. R. I. A. M., Hunt, E. A. R. L., & Minstrell, J. (2004). A computer-based tutorial for algebraic representation: The effects of scaffolding on performance during the tutorial and on a transfer task. Technology Instruction Cognition and Learning, 2, 135-170.
Greenwald, R., Hedges, L.V., & Laine, R.D. (1996). The effect of school resources on student achievement. Review of Educational Research, 66(3), 361–396.
Gürer, M.D., & Yildirim, Z. (2014). Effectiveness of learning objects in primary school social studies education: Achievement, perceived learning, engagement and usability. Education and Science, 39, 131-143.
Guskey, T. R. (1988). Teacher efficacy, self-concept, and attitudes toward the implementation of instructional motivation. Teaching and Teacher Education, 4, 63-69.
Guskey, T. R., & Yoon, K. S. (2009). What works in professional development? Phi delta kappan, 90(7), 495-500.
Guthrie, J.T., & Wigfield, A. (2000). Engagement and motivation in reading. In M.L. Kamil, P.B. Mosenthal, P.D. Pearson, & R. Barr (Eds.), Handbook of reading research (Vol. III, pp. 403-422). Mahwah, NJ: Erlbaum.
Heckman, J. J., Stixrud, J., & Urzua, S. (2006). The effects of cognitive and noncognitive abilities on labor market outcomes and social behavior (No. w12006). National Bureau of Economic Research.
Hill, H. C., Ball, D. L., & Schilling, S. G. (2008). Unpacking pedagogical content knowledge: Conceptualizing and measuring teachers' topic-specific knowledge of students. Journal for Research in Mathematics Education, 39(4), 372-400.
Hill, H. C., Rowan, B., & Ball, D. L. (2005). Effects of teachers’ mathematical knowledge for teaching on student achievement. American Educational Research Journal, 42(2), 371-406.
Hill, H. C., Schilling, S. G., & Ball, D. L. (2004). Developing measures of teachers’ mathematics knowledge for teaching. The Elementary School Journal, 105(1), 11-30.
NAEP 2018-2019 OMB Clearance: Supporting Statement Part C Page 203
Hippler, B., Alber, S., & Heward, W. (1998). Comparative analysis of two homework study methods on middle school students' acquisition and maintenance of social studies content. Twenty-fourth annual convention of the Association for Behavior Analysis, Chicago, IL.
Homana, G., & Barber, C. H. (2006, November). School climate for citizenship education: A comparison of England and the United States. Paper for the proceedings of the International Research Conference, International Association for the Evaluation of Educational Research, The Brookings Institution, Washington, DC.
Howe, M. J. A. (1999). Genius explained. New York: Cambridge University Press.
Ives, B., & Obenchain, K. (2006). Experiential education in the classroom and academic outcomes: For those who want it all. Journal of Experiential Education, 29, 61-77.
James, W. (1907, March 1). The energies of men. Science, 25, 321–332.
Jang, H., Reeve, J., & Deci, E. L. (2010). Engaging students in learning activities: It is not autonomy support or structure but autonomy support and structure. Journal of Educational Psychology, 102, 588.
Kanter, M., & Schneider, C.G. (2013, January). Civic learning and engagement. Change, 6-14.
Kingsley, K.V., & Boone, R. (2006). Effects of multimedia software on achievement of middle school students in an American History class. Journal of Research on Technology in Education, 41, 203-221.
Knight, S. L., & Waxman, H. C. (1990). Investigating the effects of the classroom learning environment on students’ motivation in social studies. Journal of Social Studies Research, 12, 1-12.
Kohlmeier, J. (2006). “Couldn’t she just leave?”: The relationship between consistently using class discussions and the development of historical empathy in a 9th grade world history course. Theory and Research in Social Education, 34, 34-57.
Lee, J.-W. & Barro, R.J. (2001). Schooling quality in a cross-section of countries. Economica, New Series, 68(272), 465–488.
Lee, V.E. & Zuze, T.L. (2011). School resources and academic performance in Sub-Saharan Africa. Comparative Education Review, 55(3), 369–397.
Leming, J.S., Ellington, L., & Schug, M. (2006). The state of social studies: A national random survey of elementary and middle school social studies teachers. Social Education, 70, 322-327.
Lindqvist, E., & R. Vestman (2011). The labor market returns to cognitive and noncognitive ability: Evidence from the Swedish enlistment. American Economical Journal: Applied Economics, 3, 101-128.
Little, C. A., Feng, A. X., VanTassel-Baska, J., Rogers, K. B., & Avery, L. D. (2007). A study of curriculum effectiveness in social studies. Gifted Child Quarterly, 51, 272-284.
Ludden, A.B. (2011). Engagement in school and community civic activities among rural adolescents. Journal of Youth and Adolescence, 40, 1254-1270.
Mahoney, J. L., & Cairns, R. B. (1997). Do extracurricular activities protect against early school dropout? Developmental Psychology, 33, 241-253.
NAEP 2018-2019 OMB Clearance: Supporting Statement Part C Page 204
Marsh, H. W., & Craven, R. G. (2006). Reciprocal effects of self-concept and performance from a multidimensional perspective: Beyond seductive pleasure and unidimensional perspectives. Perspectives on Psychological Science, 1(2), 133-163.
Mattingly, R. M., & VanSickle, R. L. (1991). Cooperative learning and achievement in social studies: Jigsaw II. Department of Education.
McCully, A., Pilgrim, N., Sutherland, A., & McMinn, T. (2002). “Don’t worry Mr. Trimble we can handle it””: Balancing the rational and the emotional in the teaching of contentious topics. Teaching History, 106, 6-12.
McGatha, M. B., Bush, W. S., & Rakes, C. (2009). The effects of professional development in formative assessment on mathematics teaching performance and student achievement. Journal of Multidisciplinary Evaluation, 6, 32-43.
McHale, S. M., Crouter, A. C., & Tucker, C. J. (2001). Free‐time activities in middle childhood: Links with adjustment in early adolescence. Child development, 72(6), 1764-1778.
McClelland, D. C. (1961). The achieving society. Oxford, England: Van Nostrand.
McMullen, S. (2007). The impact of homework time on academic achievement. The University of North Carolina at Chapel Hill. Retrieved from: http://www.learndoearn.org/For-Educators adresinden
Midgley, C., Feldlaufer, H., & Eccles, J. (1989). Change in teacher efficacy and student self- and task-related beliefs in mathematics during the transition to junior high school. Journal of Educational Psychology, 81, 247–258.
Moore, W., & Esselman, M. (1992). Teacher efficacy, power, school climate and achievement: A desegregating district’s experience. Paper presented at the annual meeting of the American Educational Research Association, San Francisco.
Multon, K. D., Brown, S. D., & Lent, R. W. (1991). Relation of self-efficacy beliefs to academic outcomes: A meta-analytic investigation. Journal of counseling psychology, 38(1), 30-38.
Nagaoka, J., Farrington, C. A., Erlich, S. B., Heath, R. D., Johnson, D. W., Dickson, S., Turner, A. C., Mayo, A., & Hayes, K. (2015). Foundations for young adult success: A developmental framework. Chicago: University of Chicago Consortium on Chicago School Research.
National Center on Educational Statistics (1995). Extracurricular Participating and Student Engagement. Retrieved from http://nces.ed.gov/pubs95/web/95741.asp
National Task Force on Civic Learning and Democratic Engagement. (2012). A crucible moment: College learning & democracy’s future. Washington, DC: Association of American Colleges and Universities.
Neilson, W. (2005). Homework and performance for time-constrained students. Economics Bulletin, 9, 1-6.
Northup, J., & Brown, S. (2010, June). Cluster evaluation of Ohio Learn and Serve, 2009-2010. RMC Research Corporation. Retrieved from http://s3.amazonaws.com/zanran_storage/www.learnandserveohio.org/ContentPages/2467771292.pdf
NAEP 2018-2019 OMB Clearance: Supporting Statement Part C Page 205
Ogle, T., Branch, M, Canada, B., Christmas, O., Clement, J., Fillion, J., Loudat, N. (2002). Technology in schools: Suggestions, tools and guidelines for assessing technology in elementary and secondary education, U.S. Department of Education.
Organisation for Economic Cooperation and Development (OECD). (2010). Improving Health and Social Cohesion Through Education. Paris: Author.
Pace, J. (2008). Inequalities in history-social science teaching under high stakes accountability: Interviews with fifth-grade teachers in California. Social Studies Research and Practice, 3, 24-40.
Pajares, F. (1996). Self-efficacy beliefs in academic settings. Review of educational research, 66(4), 543-578.
Pajares, F., & Schunk, D. (2001). The development of academic self-efficacy. , Development of achievement motivation. In A. Wigfield & J. Eccles (Eds.), Development of achievement motivation. San Diego: Academic Press.
Panadero, E., Tapia, J.A., & Huertas, J.A., (2012). Rubrics and self-assessment scripts effects on self-regulation, learning and self-efficacy in secondary education. Learning and Individual Differences, 22, 806-813.
Passe, J. (2006). New challenges in elementary social studies. The Social Studies, 97, 189-192.
Peterson, C., & Seligman, M. E. P. (2004). Character strengths and virtues: A handbook and classification. Washington, DC: American Psychological Association.
Pintrich, P.R., & Schrauben, B. (1992). Students’ motivational beliefs and their cognitive engagement in classroom academic tasks. In D.H. Schunk & J.L. Meece (Eds.), Student Perceptions in the Classroom (pp.149-183). Hillsdale, NJ: Lawrence Erlbaum Associates.
Poropat, A. E. (2009). A meta-analysis of the five-factor model of personality and academic performance. Psychological Bulletin, 135(2), 322.
Porterfield, S. L., & Winkler, A. E. (2007). Teen time use and parental education: Evidence from the CPS, MTF, and ATUS. Monthly Labor Review, 130(5), 37-56.
Renninger, K.A. (2000) Individual interest and its implications for understanding intrinsic motivation. In C. Sansone and J.M. Harackiewicz (Eds.) Intrinsic motivation: Controversies and new directions (pp.372-404). San Diego, CA: Academic Press.
Renninger, K. A. (2009). Interest and identity development in instruction: An inductive model. Educational Psychologist, 44(2), 1-14.
Renninger, K., Hidi, S. E., & Krapp, A. E. (1992). The role of interest in learning and development. Lawrence Erlbaum Associates, Inc.
Retelsdorf, J., Köller, O., & Möller, J. (2011). On the effects of motivation on reading performance growth in secondary school. Learning and Instruction, 21(4), 550-559.
Richardson, M., Abraham, C., & Bond, R. (2012). Psychological correlates of university students’ academic performance: A systematic review and meta-analysis. Psychological Bulletin, 138(2), 353–387.
Roberts, B. W., Kuncel, N. R., Shiner, R., Caspi, A. & Goldberg, L. R. (2007). The power of personality: The comparative validity of personality traits, socioeconomic status, and cognitive ability for predicting important life outcomes. Perspectives on Psychological Science, 2,313–345.
NAEP 2018-2019 OMB Clearance: Supporting Statement Part C Page 206
Roberts, S.L. (2011). Using counterfactual history to enhance students’ historical understanding. The Social Studies, 102, 117-123.
Roediger III, H. L., Agarwal, P. K., McDaniel, M. A., & McDermott, K. B. (2011). Test-enhanced learning in the classroom: Long-term improvements from quizzing. Journal of Experimental Psychology: Applied, 17, 382-395.
Rosnick, P., & Clement, J. (1980). Learning without understanding: The effect of tutoring strategies on algebra misconceptions. The Journal of Mathematical Behavior, 3(1), 3-27.
Ross, J. A. (1992). Teacher efficacy and the effect of coaching on student achievement. Canadian Journal of Education, 17(1), 51–65.
Ross, J.A., & Starling, M. (2008). Self-assessment in a technology-supported environment: The case of grade 9 geography. Assessment in Education: Principles, Policy & Practice, 15, 183-199.
Ross, J. A., Hogaboam-Gray, A., & Rolheiser, C. (2002a). Self-evaluation in grade 11 mathematics: Effects on student achievement and student beliefs about ability. In D. McDougall (Ed.), OISE Papers on Mathematical Education (pp. 71-86).
Ross, J. A., Hogaboam-Gray, A., & Rolheiser, C. (2002b). Student self-evaluation in grade 5–6 mathematics: Effects on problem solving achievement. Educational Assessment, 8, 43–58.
Ryan, R. M., & Deci, E. L. (2003). On assimilating identities to the self: A self-determination theory perspective on internalization and integrity within cultures. Handbook of self and identity, 253-272.
Sabatini, J., & O’Reilly, T. (2013). Rationale for a new generation of reading comprehension assessments. In B. Miller, L. Cutting, & P. McCardle (Eds.), Unraveling the behavioral, neurobiological, and genetic components of reading comprehension, (pp.100-111). Baltimore, MD: Brookes Publishing, Inc.
Salomon, G. (1983). The differential investment of mental effort in learning from different sources. Educational Psychologist, 18.
Saye, J., & the Social Studies Inquiry Research Collaborative. (2013). Authentic pedagogy: Its presence in social studies classrooms and relationship to student performance on state-mandated tests. Theory and Research on Social Education, 41, 89-132.
Schiefele, U. (2001). The role of interest in motivation and learning. Intelligence and personality: Bridging the gap in theory and measurement. In J. M. Collis and S. Messick (Eds.), (pp. 163-194). Mawah: New Jersey. Lawrence Erlbaum Associates Inc.
Schug, M. C., Todd, R.J., & Berry, R. (1984). Why kids don’t like social studies. Social Education, 48, 382–87.
Stein, M. K., & Wang, M. C. (1988). Teacher development and school improvement: The process of teacher change. Teaching and Teacher Education, 4, 171–187.
Stipek, D., & MacIver, D. (1989). Developmental change in children's assessment of intellectual competence. Child Development, 60(3), 521-538.
Stipek, D., Salmon, J.M., Givvin, K.B., Kazemi, E., Saxe, G., & MacGyvers, V.L. (1998). The value (and convergence) of practices suggested by motivation research and promoted by mathematics education reformers. Journal for Research in Mathematics Education, 29, 465-488.
NAEP 2018-2019 OMB Clearance: Supporting Statement Part C Page 207
Stobaugh, R., Tassell, J. L., Day, M. M., & Blankenship, H. (2011). Enhancing the cognitive complexity in social studies assessments. Social Studies and the Young Learner, 23, 4-8.
Stodolsky, S.S., Salk, S., & Glaessner, B. (1991). Student views about learning math and social studies. American Educational Research Journal, 28, 89-116.
Summers, E. J., & Dickinson, G. (2012). A longitudinal investigation of project-based instruction and student achievement in high school social studies. Interdisciplinary Journal of Problem-Based Learning, 6, 82-103.
Taboada, A., Tonks, S. M., Wigfield, A., & Guthrie, J. T. (2009). Effects of motivational and cognitive variables on reading comprehension. Reading and Writing, 22(1), 85-106.
Torney-Purta, J., Richardson, W.K., & Barber, C.H. (2005). Teachers’ educational experience and confidence in relation to students’ civic knowledge across countries. International Journal of Citizenship and Teacher Education, 1, 32-57.
Torney-Purta, J., & Wilkenfeld, B. S. (2009). Paths to 21st century competencies through civic education classrooms: An analysis of survey results from ninth-graders (A Technical Assistance Bulletin). Chicago, IL: American Bar Association Division for Public Education.
Treffinger, D. (2008). Preparing creative and critical thinkers. Educational Leadership, 65, www.ascd.org.
VanFossen, P.J. (2005). Reading and math take so much time: An overview of social studies instruction in Indiana. Theory and Research in Social Education, 33, 376-403.
Vaughn, S. Swanson, E. A., Roberts, G., Wanzek, J., Stillman-Spisak, S. J., Solis, M., & Simmons, D. (2012). Improving reading comprehension and social studies knowledge in middle school. Reading Research Quarterly, 48, 77-93.
Verdi, M.P., Crooks, S.M., & White, D.R., (2003). Learning effects of print and digital geographic maps. Journal of Research on Technology in Education, 35, 290-302.
Wanzek, J., Vaughn, S., Kent, S. C., Swanson, E. A., Roberts, G., Haynes, M., Fall, A., Stillman-Spisak, S. J., & Solis, M. (2014). The effects of team-based learning on social studies knowledge acquisition in high school. Journal of Research on Educational Effectiveness, 7, 183-204.
Wolters, C.A., & Pintrich, P.R. (1998). Contextual differences in student motivation and self-regulated learning in mathematics, English, and social studies classrooms. Instructional Science, 26, 27-47.
Wolters, C.A., Yu, S.L., & Pintrich, P.R. (1996). The relation between goal orientation and students’’ motivational beliefs and self-regulated learning. Learning and Individual Differences, 8, 211-238.
Yang, Y. C. (2012). Building virtual cities, inspiring intelligent citizens: Digital games for developing students’ problem solving and learning motivation. Computers & Education, 59, 365-377.
Yon, M., & Passe, J. (1990). The relationship between the elementary social studies methods course and student teachers’ beliefs and practices. Journal of Social Studies Research, 14, 13-24.
Zhang, T., Torney-Purta, J., & Barber, C. (2012). Students’ conceptual knowledge and process skills in civic education: Identifying cognitive profiles and classroom correlates. Theory & Research in Social Education, 40, 1-34.
Zhao, Y., & Hoge, J.D. (2005). What elementary students and teachers say about social studies. The Social Studies, 96, 216-221.
NAEP 2018-2019 OMB Clearance: Supporting Statement Part C Page 208
Zimmerman, B. J. (2000). Self-efficacy: An essential motive to learn. Contemporary educational psychology, 25(1), 82-91.
Zimmerman, B. J., Bandura, A., & Martinez-Pons, M. (1992). Self-motivation for academic attainment: The role of self-efficacy beliefs and personal goal setting. American educational research journal, 29(3), 663-676.
NAEP 2018-2019 OMB Clearance: Supporting Statement Part C Page 209
Appendices
NAEP 2018-2019 OMB Clearance: Supporting Statement Part C Page 210
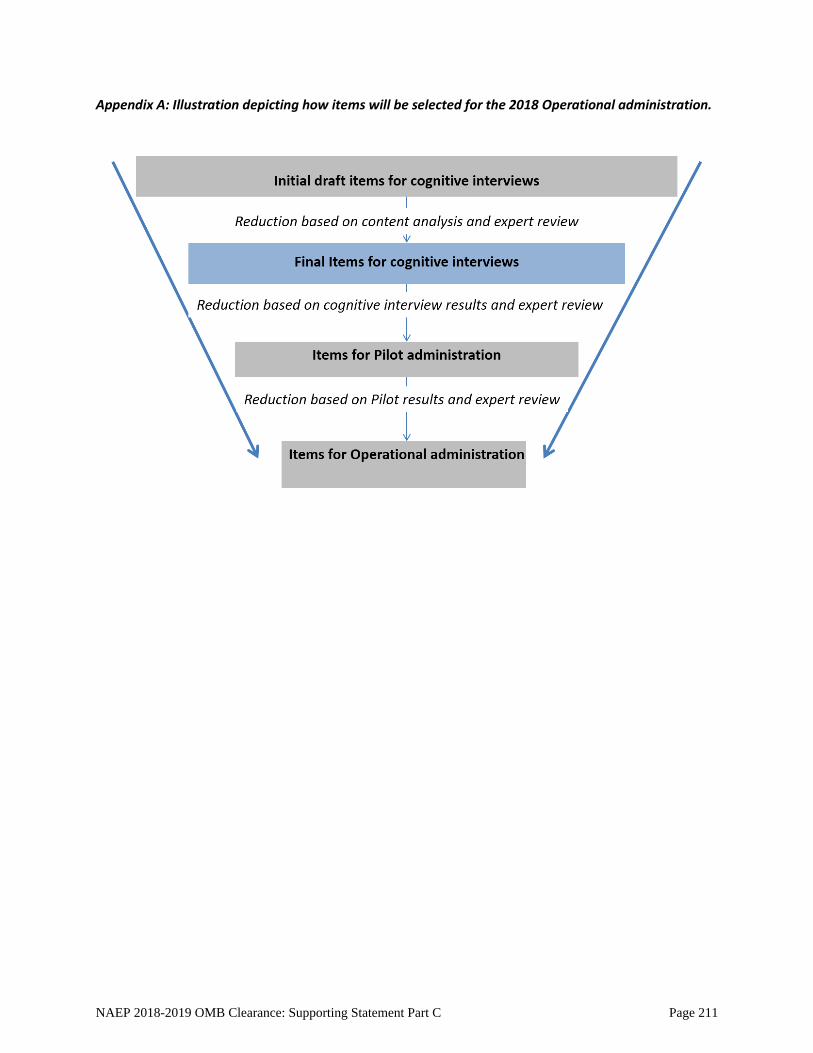
Appendix A: Illustration depicting how items will be selected for the 2018 Operational administration.
NAEP 2018-2019 OMB Clearance: Supporting Statement Part C Page 211
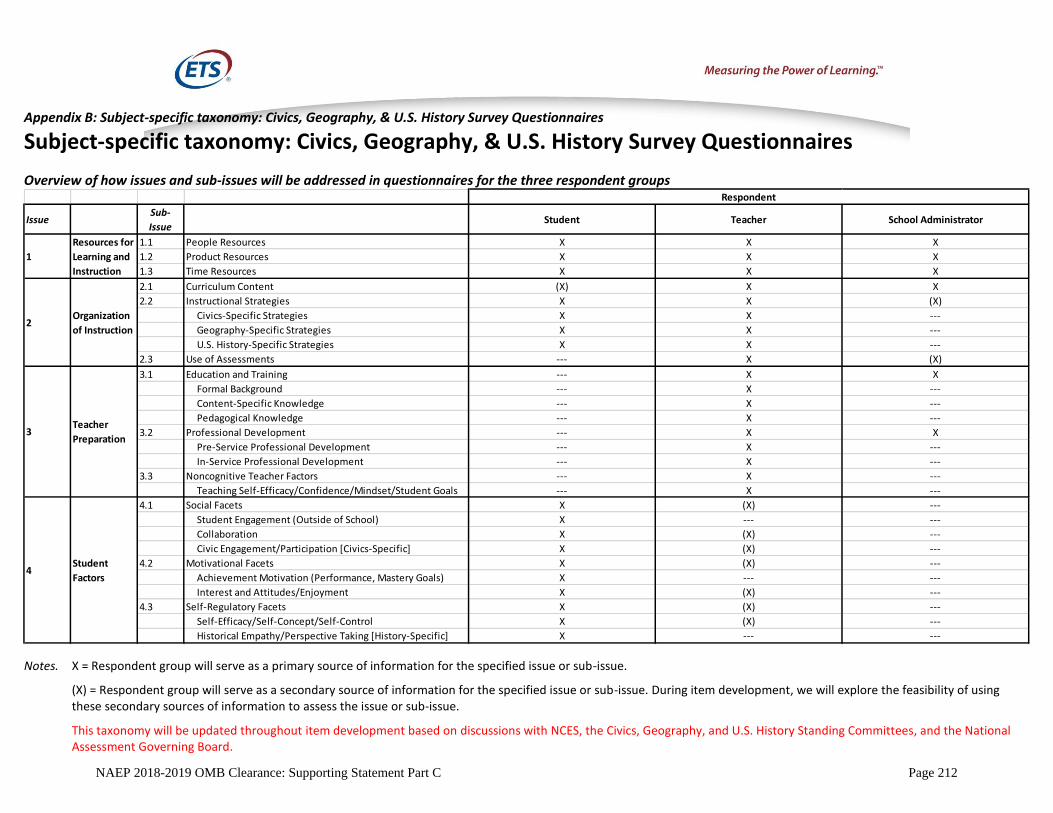
Appendix B: Subject-specific taxonomy: Civics, Geography, & U.S. History Survey Questionnaires
Subject-specific taxonomy: Civics, Geography, & U.S. History Survey Questionnaires
Overview of how issues and sub-issues will be addressed in questionnaires for the three respondent groups
Notes. X = Respondent group will serve as a primary source of information for the specified issue or sub-issue.
(X) = Respondent group will serve as a secondary source of information for the specified issue or sub-issue. During item development, we will explore the feasibility of using these secondary sources of information to assess the issue or sub-issue.
This taxonomy will be updated throughout item development based on discussions with NCES, the Civics, Geography, and U.S. History Standing Committees, and the National Assessment Governing Board.
IssueSub-
IssueStudent Teacher School Administrator
1.1 People Resources X X X
1.2 Product Resources X X X
1.3 Time Resources X X X
2.1 Curriculum Content (X) X X
2.2 Instructional Strategies X X (X)
Civics-Specific Strategies X X ---
Geography-Specific Strategies X X ---
U.S. History-Specific Strategies X X ---
2.3 Use of Assessments --- X (X)
3.1 Education and Training --- X X
Formal Background --- X ---
Content-Specific Knowledge --- X ---
Pedagogical Knowledge --- X ---
3.2 Professional Development --- X X
Pre-Service Professional Development --- X ---
In-Service Professional Development --- X ---
3.3 Noncognitive Teacher Factors --- X ---
Teaching Self-Efficacy/Confidence/Mindset/Student Goals --- X ---
4.1 Social Facets X (X) ---
Student Engagement (Outside of School) X --- ---
Collaboration X (X) ---
Civic Engagement/Participation [Civics-Specific] X (X) ---
4.2 Motivational Facets X (X) ---
Achievement Motivation (Performance, Mastery Goals) X --- ---
Interest and Attitudes/Enjoyment X (X) ---
4.3 Self-Regulatory Facets X (X) ---
Self-Efficacy/Self-Concept/Self-Control X (X) ---
Historical Empathy/Perspective Taking [History-Specific] X --- ---
4Student
Factors
Respondent
1
Resources for
Learning and
Instruction
2Organization
of Instruction
3Teacher
Preparation
NAEP 2018-2019 OMB Clearance: Supporting Statement Part C Page 212
Part C-7: 2014 TEL Issues Paper
NAEP 2018-2019 OMB Clearance: Supporting Statement Part C Page 213
KEY CONTEXTUAL FACTORS FOR TECHNOLOGY AND ENGINEERING
LITERACY ACHIEVEMENTTEL “Issues Paper”
Educational Testing Service
Written in preparation for New Item Development for the 2014 Digital Based NAEP Technology and Engineering Literacy Survey Questionnaires
November 2011
The increasing importance of technology and engineering in education prompted the National Assessment Governing Board to initiate an assessment of technology and engineering literacy (TEL) as part of the National Assessment of Educational Progress (NAEP). Informed by the expertise of individuals and organizations from technological and engineering backgrounds, the National Assessment Governing Board developed a new framework for the cognitive assessment of TEL principles and applications (WestEd, 2010a). While developing the framework, it became apparent that various definitions of “technology,” “engineering,” and related terms were being used inconsistently across various domains. Thus, for the purpose of the TEL assessment, a broad definition was chosen: “Technology and engineering literacy is the capacity to use, understand, and evaluate technology as well as to understand technological principles and strategies needed to develop solutions and achieve goals (WestEd, 2010a, p. xi).”
The purpose of this TEL Issues Paper is to review existing research designed to ensure that the TEL background questionnaire provides context for reporting student performance on the TEL assessment and expands understanding of technology and engineering literacy in American education.
TEL is a new assessment with characteristics very different from other NAEP subjects (e.g., TEL is not consistently defined in policy or practice nor is it taught as a course in the majority of American schools). Moreover, unlike previous cognitive assessments, the National Assessment Governing Board created a document to accompany the framework that recommends guidance for background questionnaire development (WestEd, 2010b). Therefore, an overview of where the TEL Issues Paper fits in the background item development process is warranted.
NAEP 2018-2019 OMB Clearance: Supporting Statement Part C Page 214
TEL Background Questionnaire Item Development Process
The atypical nature of the TEL process warrants aligning several components that motivate questionnaire item development. The following list is presented in order of prioritization importance. Prioritization importance is based on recognizing that burden constraints require focusing questionnaire item development on topics and items that stand the best chance of meeting the needs of as many (preferably all) of the component drivers of questionnaire item development as possible. The four components are as follows:
1. Technology and Engineering Literacy Framework for the 2014 National Assessment of Education Progress (TEL Framework)
a. Cognitive Item Development: Assessed Constructs b. Reporting Goals
2. Technology and Engineering Background Variables for the 2014 National Assessment of Educational Progress (TEL BQ Guidance Document)
3. Background Information Framework for the National Assessment of Educational Progress (Background Information Framework)
4. TEL Issues Paper
The TEL Framework motivates cognitive item development by identifying target assessment areas, constructs, and competencies that will be measured on the TEL assessment. Therefore, questionnaire item development aims to produce items that attempt to reliably and validly measure contextual factors (e.g., student educational experiences and school resources) that might explain differences in student performance. The TEL Framework also motivates reporting goals, which are types of information that will be used or needed by various stakeholders regarding categories of performance within each assessment area. Therefore, an expansion of the aforementioned questionnaire item development research objective is to develop items that provide reportable survey results based on reliable and valid estimates of measures of contextual factors that might explain differences in student performance (e.g., more proficient students have access to more instructional or extracurricular content related to engineering design).
In the past, the Background Information Framework has served as a framework document for the questionnaires (NAGB 2003). However, in a document (2/7/2011) outlining NCES comments to the TEL Issues Paper, the Technology and Engineering Background Variables for the 2014 National Assessment of Educational Progress document was referred to as the “guidance document for [TEL] BQ development.” No other subject-specific framework has ever included a section to guide background questionnaire development, let alone a standalone guidance paper. The guidance in this new document is not entirely consistent with the Background Information Framework. For example, the variables presented lack empirical research evidence to support their inclusion or relationship to academic achievement.1 In addition, there are too many variables recommended to administer in light of respondent burden constraints (e.g., 10 minutes for students) prescribed by the Background Information Framework. Nonetheless, the TEL BQ Guidance Document provides a wide assortment of potential variables of interest that can be
1 This is explicitly noted as a challenge on page 5 of the TEL BQ Framework: There is little research relating variables to achievement in any of the three content areas. As a result, the variables selected correspond to the kinds of learning activities that are typical for a content area (e.g., in Technology and Society whether students have explored how introduction of a new technology can change a society). These variables should provide a picture of what is being taught in the schools in the three content areas. This alone is new and valuable information.
NAEP 2018-2019 OMB Clearance: Supporting Statement Part C Page 215
used as a starting point for item development for different TEL-related topics and constructs. Moreover, the document provides important guidance as to the intent of the Governing Board with regard to the contextual factors of interest for stakeholders. The Background Information Framework is the guiding document for NAEP questionnaire item development, indicating that the questionnaire items should focus on the following:
Student demographic required reporting categories, Public policy contextual factors that must be clearly related to academic achievement or
to the fair presentation of achievement results, and Subject-specific instructional content and practice background factors of interest, based
on previous research. The latter two foci are the impetus for the development of an issues paper for each cognitive assessment. An issues paper is a review of existing research to identify contextual factors that are related to student performance in the subject being assessed. The challenge of identifying empirical research studies for an issues paper on TEL is significantly greater because of the lack of common and consistent terminology for terms associated with the subject across disciplines. Moreover, TEL is an emerging area of inquiry with great diversity and includes empirical research studies across a vast array of disciplines (e.g., education, physics, engineering, health sciences, mathematics, sociology, etc.). Feedback from the NCES and the TEL standing committee has been incorporated into this version of the TEL Issues Paper. TEL, as a concept and subject, is and will be rapidly developing and changing. Therefore, the TEL Issues Paper should be seen as a living document that can be revised periodically throughout the background questionnaire item development process. Technology and engineering literacy are emerging fields of inquiry. Drawing from the latest research on the topic, the issues identified for this paper can be classified into four categories.
1. Availability and Use of Instructional Resources 2. Organization of Instruction 3. Teacher Preparation 4. Student Engagement
Although these issues are presented and discussed as separate topics, they are highly interconnected; both the issues and (where appropriate) sub-issues are presented in the following discussion.
Crosswalk with the TEL Framework and TEL BQ Framework
The TEL Framework established three target assessment areas: Technology and Society (T&S), Design and Systems (D&S), and Information and Communication Technologies (ICT). The 2014 NAEP TEL Assessment Framework measures three core areas of interest: “Technology and Society,” “Design and Systems,” and “Information and Communication Technology” (WestEd, 2010a). Technology and Society addresses the effects that technology has on society and on the natural world. Design and Systems covers the nature of technology, the engineering design process, and basic principles of dealing with everyday technologies. Information and
NAEP 2018-2019 OMB Clearance: Supporting Statement Part C Page 216
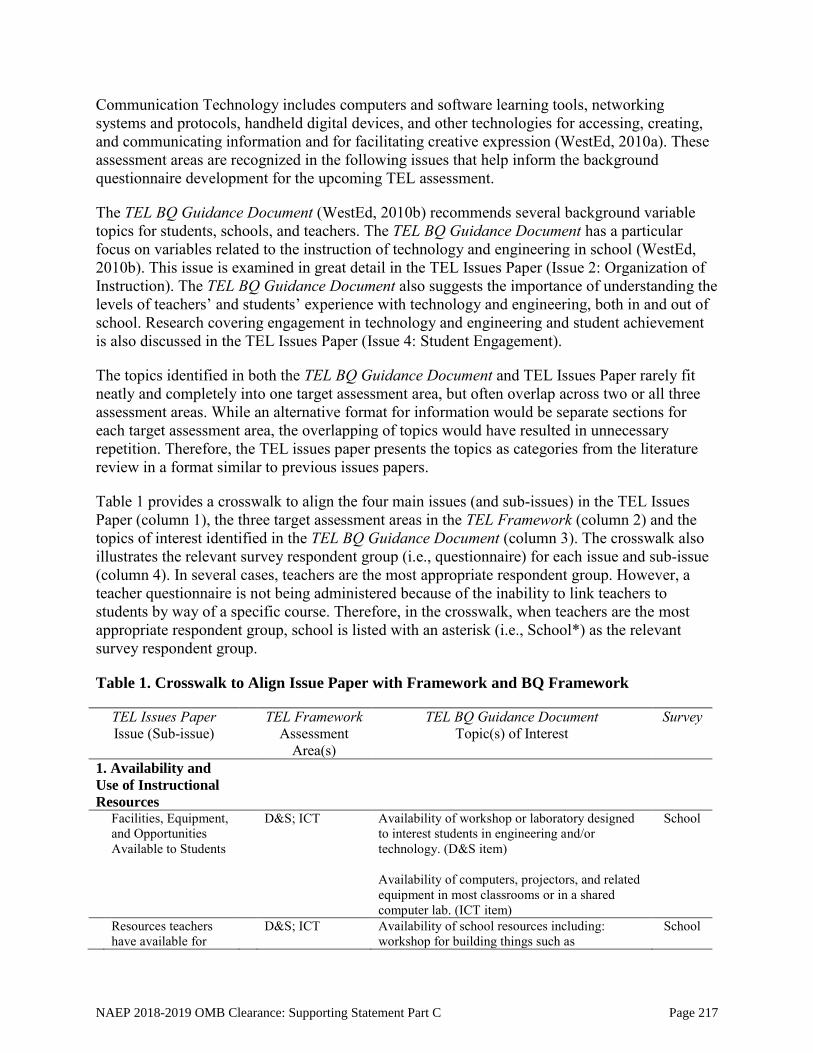
Communication Technology includes computers and software learning tools, networking systems and protocols, handheld digital devices, and other technologies for accessing, creating, and communicating information and for facilitating creative expression (WestEd, 2010a). These assessment areas are recognized in the following issues that help inform the background questionnaire development for the upcoming TEL assessment.
The TEL BQ Guidance Document (WestEd, 2010b) recommends several background variable topics for students, schools, and teachers. The TEL BQ Guidance Document has a particular focus on variables related to the instruction of technology and engineering in school (WestEd, 2010b). This issue is examined in great detail in the TEL Issues Paper (Issue 2: Organization of Instruction). The TEL BQ Guidance Document also suggests the importance of understanding the levels of teachers’ and students’ experience with technology and engineering, both in and out of school. Research covering engagement in technology and engineering and student achievement is also discussed in the TEL Issues Paper (Issue 4: Student Engagement).
The topics identified in both the TEL BQ Guidance Document and TEL Issues Paper rarely fit neatly and completely into one target assessment area, but often overlap across two or all three assessment areas. While an alternative format for information would be separate sections for each target assessment area, the overlapping of topics would have resulted in unnecessary repetition. Therefore, the TEL issues paper presents the topics as categories from the literature review in a format similar to previous issues papers.
Table 1 provides a crosswalk to align the four main issues (and sub-issues) in the TEL Issues Paper (column 1), the three target assessment areas in the TEL Framework (column 2) and the topics of interest identified in the TEL BQ Guidance Document (column 3). The crosswalk also illustrates the relevant survey respondent group (i.e., questionnaire) for each issue and sub-issue (column 4). In several cases, teachers are the most appropriate respondent group. However, a teacher questionnaire is not being administered because of the inability to link teachers to students by way of a specific course. Therefore, in the crosswalk, when teachers are the most appropriate respondent group, school is listed with an asterisk (i.e., School*) as the relevant survey respondent group.
Table 1. Crosswalk to Align Issue Paper with Framework and BQ Framework
TEL Issues Paper Issue (Sub-issue)
TEL Framework Assessment
Area(s)
TEL BQ Guidance Document Topic(s) of Interest
Survey
1. Availability and
Use of Instructional
Resources
Facilities, Equipment, and Opportunities Available to Students
D&S; ICT Availability of workshop or laboratory designed to interest students in engineering and/or technology. (D&S item) Availability of computers, projectors, and related equipment in most classrooms or in a shared computer lab. (ICT item)
School
Resources teachers have available for
D&S; ICT Availability of school resources including: workshop for building things such as
School
NAEP 2018-2019 OMB Clearance: Supporting Statement Part C Page 217
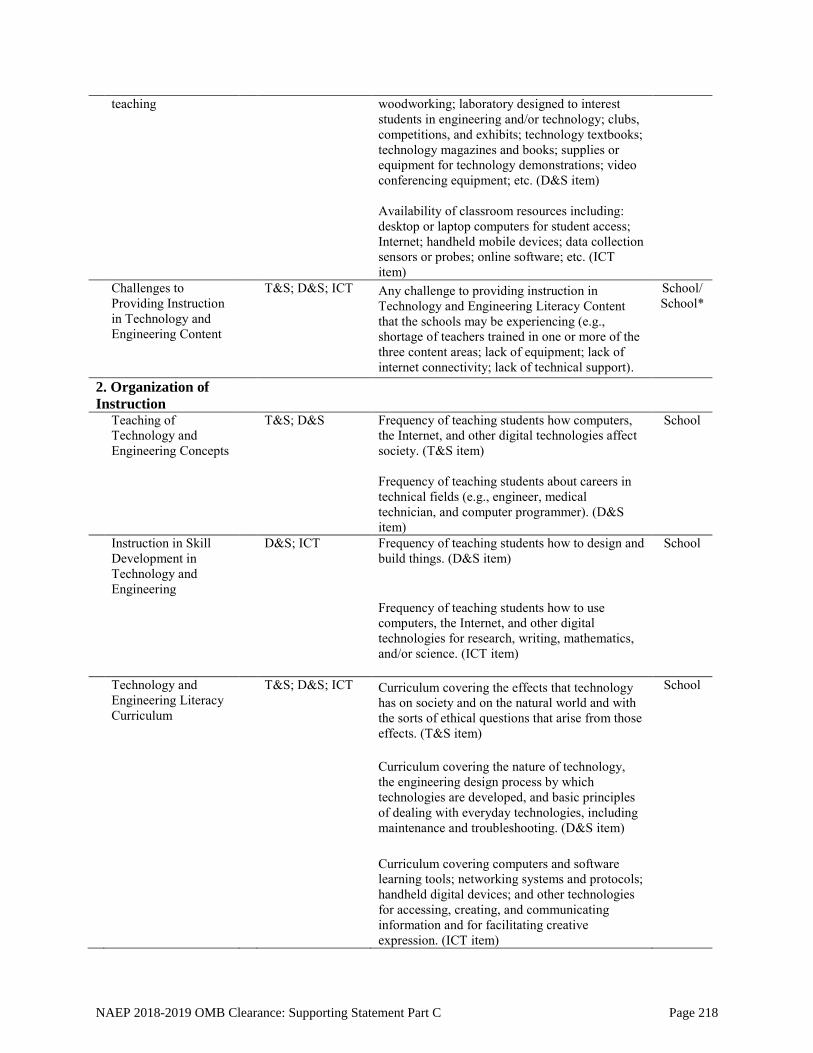
teaching woodworking; laboratory designed to interest students in engineering and/or technology; clubs, competitions, and exhibits; technology textbooks; technology magazines and books; supplies or equipment for technology demonstrations; video conferencing equipment; etc. (D&S item) Availability of classroom resources including: desktop or laptop computers for student access; Internet; handheld mobile devices; data collection sensors or probes; online software; etc. (ICT item)
Challenges to Providing Instruction in Technology and Engineering Content
T&S; D&S; ICT Any challenge to providing instruction in Technology and Engineering Literacy Content that the schools may be experiencing (e.g., shortage of teachers trained in one or more of the three content areas; lack of equipment; lack of internet connectivity; lack of technical support).
School/School*
2. Organization of
Instruction
Teaching of Technology and Engineering Concepts
T&S; D&S Frequency of teaching students how computers, the Internet, and other digital technologies affect society. (T&S item) Frequency of teaching students about careers in technical fields (e.g., engineer, medical technician, and computer programmer). (D&S item)
School
Instruction in Skill Development in Technology and Engineering
D&S; ICT Frequency of teaching students how to design and build things. (D&S item)
Frequency of teaching students how to use computers, the Internet, and other digital technologies for research, writing, mathematics, and/or science. (ICT item)
School
Technology and Engineering Literacy Curriculum
T&S; D&S; ICT Curriculum covering the effects that technology has on society and on the natural world and with the sorts of ethical questions that arise from those effects. (T&S item) Curriculum covering the nature of technology, the engineering design process by which technologies are developed, and basic principles of dealing with everyday technologies, including maintenance and troubleshooting. (D&S item) Curriculum covering computers and software learning tools; networking systems and protocols; handheld digital devices; and other technologies for accessing, creating, and communicating information and for facilitating creative expression. (ICT item)
School
NAEP 2018-2019 OMB Clearance: Supporting Statement Part C Page 218
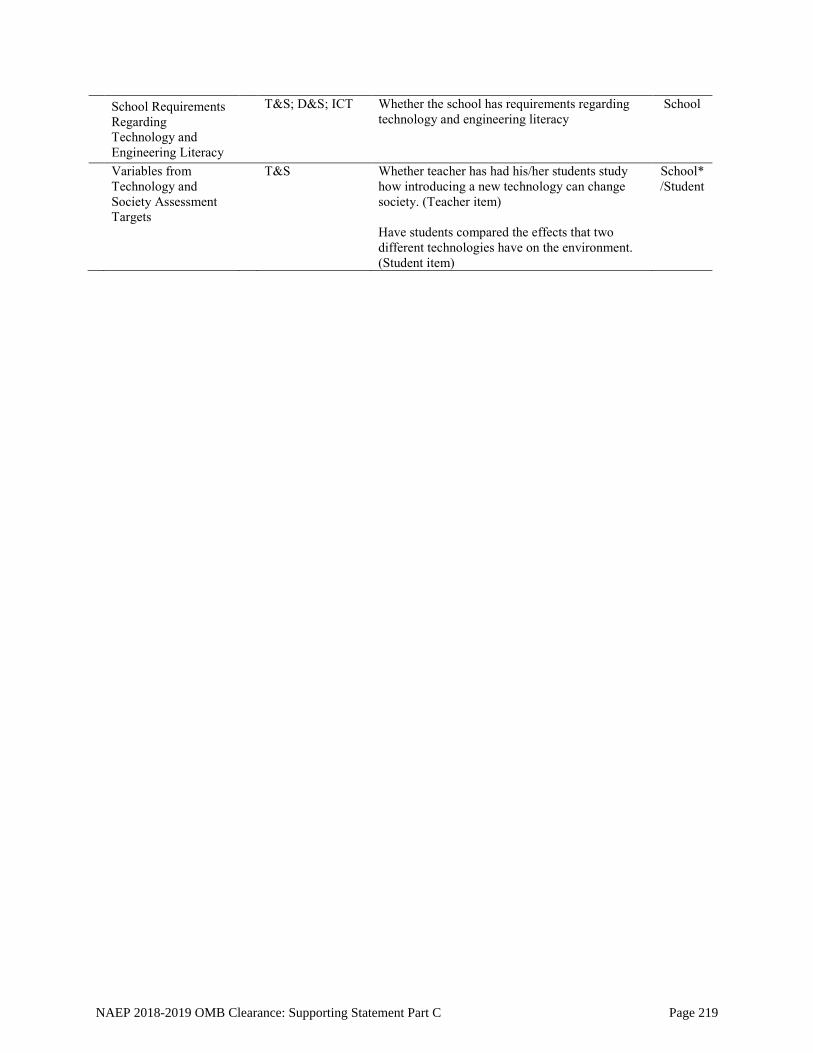
School Requirements Regarding Technology and Engineering Literacy
T&S; D&S; ICT Whether the school has requirements regarding technology and engineering literacy
School
Variables from Technology and Society Assessment Targets
T&S Whether teacher has had his/her students study how introducing a new technology can change society. (Teacher item) Have students compared the effects that two different technologies have on the environment. (Student item)
School*/Student
NAEP 2018-2019 OMB Clearance: Supporting Statement Part C Page 219
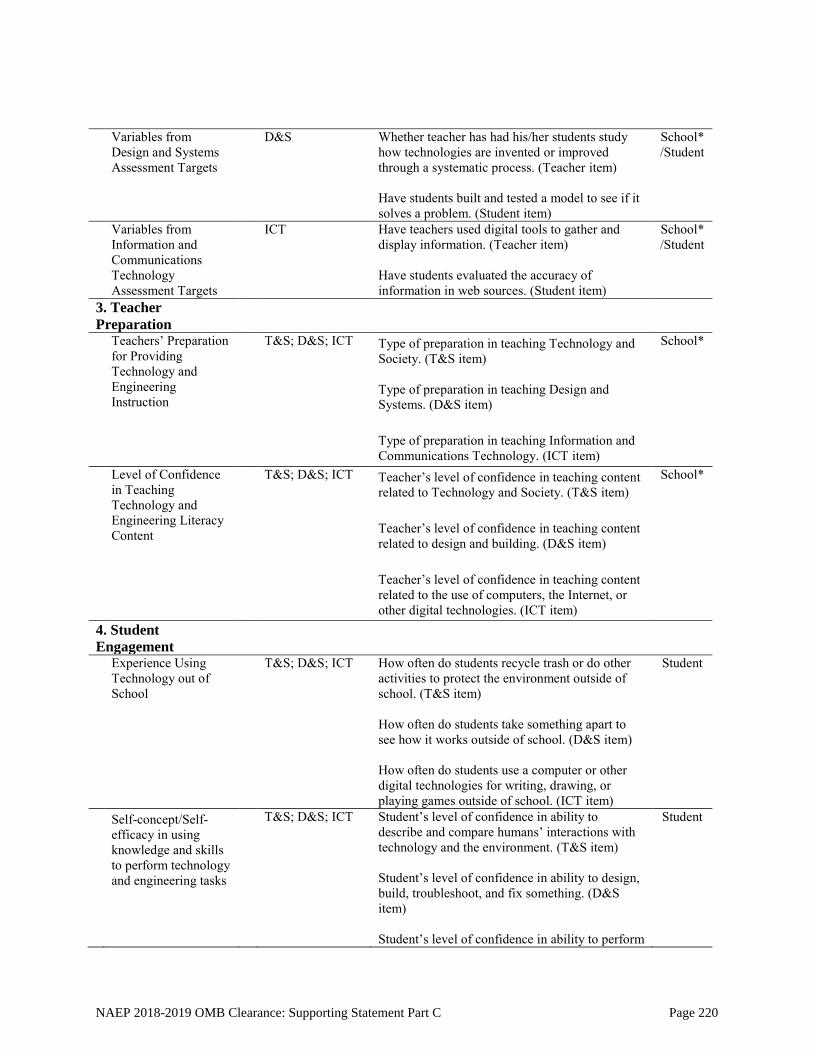
Variables from Design and Systems Assessment Targets
D&S Whether teacher has had his/her students study how technologies are invented or improved through a systematic process. (Teacher item) Have students built and tested a model to see if it solves a problem. (Student item)
School*/Student
Variables from Information and Communications Technology Assessment Targets
ICT Have teachers used digital tools to gather and display information. (Teacher item) Have students evaluated the accuracy of information in web sources. (Student item)
School* /Student
3. Teacher
Preparation
Teachers’ Preparation for Providing Technology and Engineering Instruction
T&S; D&S; ICT Type of preparation in teaching Technology and Society. (T&S item) Type of preparation in teaching Design and Systems. (D&S item) Type of preparation in teaching Information and Communications Technology. (ICT item)
School*
Level of Confidence in Teaching Technology and Engineering Literacy Content
T&S; D&S; ICT Teacher’s level of confidence in teaching content related to Technology and Society. (T&S item) Teacher’s level of confidence in teaching content related to design and building. (D&S item) Teacher’s level of confidence in teaching content related to the use of computers, the Internet, or other digital technologies. (ICT item)
School*
4. Student
Engagement
Experience Using Technology out of School
T&S; D&S; ICT How often do students recycle trash or do other activities to protect the environment outside of school. (T&S item) How often do students take something apart to see how it works outside of school. (D&S item) How often do students use a computer or other digital technologies for writing, drawing, or playing games outside of school. (ICT item)
Student
Self-concept/Self-efficacy in using knowledge and skills to perform technology and engineering tasks
T&S; D&S; ICT Student’s level of confidence in ability to describe and compare humans’ interactions with technology and the environment. (T&S item) Student’s level of confidence in ability to design, build, troubleshoot, and fix something. (D&S item) Student’s level of confidence in ability to perform
Student
NAEP 2018-2019 OMB Clearance: Supporting Statement Part C Page 220
tasks using technology for information and communication. (ICT item)
NAEP Assessment Specific Items
ICT Whether the student has taken a test on a computer before today.
Student
NOTES: Column 2 acronyms: T&S: Technology and Society; D&S: Design and Systems; ICT: Information and
Communication Technologies * School administrators as respondent group because teacher questionnaire is not being administered.
NAEP 2018-2019 OMB Clearance: Supporting Statement Part C Page 221
Issue 1: Availability and Use of Instructional Resources
The importance of resources is highlighted in the TEL BQ Guidance Document (WestEd 2010b) and the National Science Education Standards (NRC 1996), which posits that “Effective science teaching depends on the availability and organization of materials, equipment, media, and technology” (p. 44). This sentiment also holds true for technology and engineering as the availability of such resources affects how skills in these fields are learned, taught, and used (NAE 2009, 2010). Even though current measures of technological leadership (i.e., percentage of gross domestic product invested in R&D, absolute numbers of researchers, labor productivity, and high-technology production and exports) still favor the United States, a closer look reveals several interrelated trends indicating that the United States may have difficulty maintaining its global leadership in technological innovation over the long term (NAE 2005a). These well-documented trends include: (1) a large and growing imbalance in federal research funding between the engineering and physical sciences on the one hand and biomedical and life sciences on the other; (2) increased emphasis on applied R&D in industry and government-funded research at the expense of fundamental long-term research; and (3) erosion of the engineering research infrastructure because of inadequate investment over many years. This conclusion echoes the findings of other recent assessments by the Council on Competitiveness (2001, 2004), President’s Committee of Advisors on Science and Technology (2002, 2004a, 2004b), National Science Board (2003), National Academies (COSEPUP 2002; NAE 2003, 2004, 2005b; NRC, 2001), and other distinguished bodies (DOE 2003; National Commission on Mathematics and Science Teaching for the 21st Century 2000). With these findings in mind, availability of school resources comprises three relevant sub-issues: engineering resources, availability of computers and Internet access, and human infrastructure.
Engineering Resources
One result of the stagnation of federal investment in engineering research has been the deterioration of the engineering infrastructure at many K–12 schools. Many schools operate in old facilities, with outdated laboratory equipment and insufficient technological resources (NAE 2005a).
Availability of Computers and Internet Access
As pointed out in the TEL BQ Guidance Document, items related to the availability of computers appear in other background questionnaires, including the school and teacher core background questionnaires (WestEd 2010b). This reflects the importance of technology literacy involving computers and the usefulness of knowing the extent of availability and use of such technology resources in schools (Ogle et al. 2002). In fact, the TEL BQ Guidance Document suggests asking the following questions of school administrators regarding the availability of technology, computers, and the Internet: “Availability of computers, projectors, and related equipment in most classrooms or in a shared computer lab” (WestEd 2010b, p. 12) and “Availability of classroom resources including: desktop or laptop computers for student access; Internet; handheld mobile devices; data collection sensors or probes; online software; etc.” (WestEd 2010b, p. 18). Both computer availability and Internet access in K-12 schools are discussed briefly.
NAEP 2018-2019 OMB Clearance: Supporting Statement Part C Page 222
Computer Availability U. S. schools have made great strides in improving access to computer technology as indicated by the average national student-to-instructional computer ratio and student-to-instructional-multimedia computer ratio of 5:1 and 10:1, respectively (CEO Forum on Education and Technology 2000). In 2008, the national student-to-instructional computer ratio was even much lower, at 3.8:1 (Education Week: Technology Counts 2008). Internet Access
Internet connectivity in U. S. schools has increased substantially since 1994 (Williams 2000). Internet availability in public schools is usually presented as the percentage of classrooms and computer labs with Internet access or as the percentage of public schools with Internet access (Ogle et al. 2002). Several studies (Kleiner and Farris 2002; Kleiner and Lewis 2003; Parsad and Jones 2005) have documented a substantial increase in the number of schools and instruction rooms with Internet connectivity. According to Kleiner and Farris, the percentage of public schools with Internet access more than doubled from 35 percent in 1994 to 99 percent in 2001. The number of instruction rooms with Internet access steadily increased from 3 percent in 1994 to 93 percent in 2003 (Kleiner and Farris 2002; Parsad and Jones 2005). However, characteristics such as school level, size, locale, poverty level, and socioeconomic factors have been found to impact the availability of Internet access. Specifically, higher percentages of Internet access are more likely to be found in: high schools compared to elementary schools, schools that are medium or large in size compared to smaller schools, urban and city schools compared to rural schools, and lower poverty schools compared to higher poverty schools (Cattagni and Farris 2001; CEO Forum on Education and Technology 2001a, 2001b; National Post Secondary Education Cooperative 2004; Parsad and Jones 2005). Availability of Human Infrastructure
More than other school innovations, technology and engineering innovations require institutional support because the resources and knowledge required for implementing and maintaining modern computing technology is often beyond an individual teacher’s abilities (Duncan et al. 2007; Zhao et al. 2002). For example, having students exchange e-mails with each other in the classroom requires computers installed, electric outlets wired or rewired, network connections established, and student e-mail accounts created. Teachers are not expected to accomplish any of these tasks without interacting with the administration and a wide range of support personnel (Zhao et al. 2002). Zhao et al. (2002) uses the term human infrastructure to describe the organizational arrangement to support technology integration in the classroom. Zhao et al. (2002) reports that the availability of human infrastructure has a strong mediating effect on the success of technological innovations at schools. Human infrastructure includes, but is not limited to, a flexible and responsive technical staff, knowledgeable and communicative groups of people who can help a teacher understand and use technologies for his or her own classroom needs, and a supportive and informed administrative staff. Human infrastructure also includes institutionalized policies and
NAEP 2018-2019 OMB Clearance: Supporting Statement Part C Page 223
procedures related to technology issues, such as hardware and software purchases, professional development, and student access to computers and the Internet.
Issue 2: Organization of Instruction
Organization of technology and engineering instruction is conceptualized as encompassing three sub-issues: content standards, curriculum content, and instructional strategies.
Content Standards
Historically, technology and engineering have not received the same level of attention and focus as the fields of science and math (NAE 2010). On one hand, technology education has a long history (Herschbach, 2009), a small but dedicated teacher corps (Dugger 2007), and, as of 2000, a set of standards specifying what students should know and be able to do to be considered technologically literate (ITEA 2000). In contrast, engineering education has only recently begun to make its way into the K–12 classrooms, and there are currently no national standards specifying what students should know and be taught. Both technology and engineering content standards are discussed separately below. Content Standards for K–12 Technology Education
Despite a sustained campaign by the International Technology Education Association (ITEA) and others, technology education is only slowly gaining acceptance. Numerous individuals—including many educators—confuse it with classes that train students to use computers. Today, classes in technology education are offered in less than half of the school districts around the country, and only 12 states require completion of a technology education course by students graduating high school (Dugger 2007). Furthermore, many preparatory technology education teacher programs have either closed or reduced their number of graduates (Gray & Daugherty 2004). Consequently, there are far fewer technology education teachers working in U.S. schools than science or mathematics teachers, and far fewer students are taking technology education classes than classes in science and mathematics (Gray & Daugherty 2004).
Some of the specific goals of K–12 technology education are described in Standards for Technological Literacy: Content for the Study of Technology (ITEA 2000). To meet those standards, K–12 students must develop competencies in five areas: the nature of technology, technology and society, design, abilities for a technological world, and the designed world. The first three competencies are self-explanatory and are very similar in nature to the three core areas of interest that are to be measured in the 2014 TEL assessment (WestEd 2010a). The fourth and fifth competencies, while appearing different, are also similar to the three TEL assessment areas (Technology and Society, Design and Systems, and ICT). The fourth competency, “abilities for a technological world,” requires that students know how to use and maintain everyday technologies and be able to assess the effects of using different technologies on society and the environment. The fifth competency, “the designed world,” requires an understanding of technologies in specific areas, such as medicine, agriculture, and information and communications.
NAEP 2018-2019 OMB Clearance: Supporting Statement Part C Page 224
Content Standards for K–12 Engineering Education
Even though standards have been a major element in education reform in the United States for more than 20 years, K–12 engineering education is currently being taught without accepted content standards to define what students should know and be able to do (NAE, 2010). Existing standards in other subjects (e.g., science and technology education) include connections to engineering; however, there are no separate, comprehensive, grade-by-grade standards for engineering in K–12 education. Many feel that the creation of standards for a subject new to most classrooms can make a statement about the importance of the subject for students, and for society at large, and could help create an identity for engineering as a separate and important discipline in the overall curriculum on a par with more established disciplines (NAE 2010). This was an important goal, for example, of the technology education community when it developed the Standards for Technological Literacy (ITEA 2000).
The Committee on Standards for K–12 Engineering Education, a group of experts on diverse subjects working with the National Academy of Engineering (NAE) and the National Research Council, conducted a two-year study to assess the potential value and feasibility of developing and implementing content standards for engineering education at the K–12 level in the United States (NAE 2010). In working on this project, the committee collected and reviewed information about standards and documents for precollege engineering education developed by the United States and by other nations, including Australia, England, Wales, France, Germany, and South Africa (DeVries 2009). The committee concluded that, although it is theoretically possible to develop standards for K–12 engineering education, it would be extremely difficult to ensure their usefulness and effective implementation. This conclusion was supported by several key findings.
First, there is relatively limited experience with K–12 engineering education in United States’ elementary and secondary schools (NAE 2010). This is perhaps the most serious argument against developing content standards for K–12 engineering education. Although there has been a considerable increase in the last 5 to 10 years, the number of K–12 students, teachers, and schools engaged in engineering education is still extremely small compared to the numbers for almost every other school subject (NAE 2010).
Second, there are not enough teachers qualified to deliver engineering instruction. For standards to have a chance of succeeding, there must be teachers willing and able to deliver engineering instruction (NAE 2010). Although no precise threshold number has been determined, based on the committee’s experience with the development of standards in other subjects, the committee concluded that 10 percent would be a reasonable minimum. However, meeting this requirement would necessitate a teaching force in the K–12 educational system that would be much larger than the current estimated K–12 engineering teaching force (NCES 2008).
Third, evidence regarding the impact of standards-based educational reforms on student learning in other subjects, such as mathematics and science, is inconclusive. For example, in a meta-analysis conducted by Harris and Goertz (2008), the authors note that standards that succeed in changing what is taught may do little to change how classroom instruction is delivered. For this reason, they conclude that the impact of creating standards is frequently not as decisive as advocates hope. This has also been found to be true with engineering. According to the most recent data available, 40 states have adopted or adapted the Standards for Technological Literacy
NAEP 2018-2019 OMB Clearance: Supporting Statement Part C Page 225
(ITEA 2000). Of these, only 12 require students to take at least one technology education course (Dugger 2007). In addition, it is not clear whether these state standards include the engineering content of the national technological literacy standards. More importantly, the NAE (2010) committee could not find reliable data indicating how many states assess student learning in engineering. Without the pressure of an assessment, particularly an assessment with consequences tied to student performance, teachers may have little incentive to teach engineering.
The final concern is that we may not know enough about the teaching and learning of engineering at the K–12 level to develop credible standards (NAE 2010). There appears to be a growing agreement on the central importance of the design process in K–12 engineering education; a handful of core ideas, such as when specific engineering ideas or concepts should be introduced and at what level of complexity. In addition, opinions differ on how engineering concepts connect with one another and with concepts in mathematics and science (NAE 2009). Indeed, standards that encourage separate treatment of engineering may make it more difficult to leverage the connections between engineering, science, and mathematics, potentially reducing the positive effects of engineering on student interest and learning in these domains (NAE 2009, 2010).
It was for these reasons that the committee concluded that the development of national standards for K–12 engineering education is unwise at this time (NAE 2010). Instead, the committee suggests other approaches to increasing the presence and improving the quality of K–12 engineering education in the United States. (For a full report of the committee’s findings and recommendations for engineering education see NAE 2010.)
Curriculum Content
Technology and engineering curricula vary greatly in focus, content, and requirements, in part, because of the lack of content standards that was covered in the previous section. The curricula span a range of purposes that include encouraging students to pursue careers in engineering, increasing technological literacy, and improving student performance in science and mathematics (NAE 2009). A review by Silk and Schunn (2008) of national and international content standards in both technology and engineering education uncovered that the majority of empirical research focuses on four concepts: (1) trade-offs, (2) structure-behavior-function, (3) emergent properties, and (4) multiple variables. Each concept will be briefly discussed. (For a full review of these concepts see NAE 2009.) Trade-offs
A trade-off is a situation that involves losing one quality or aspect of something in return for gaining another quality or aspect. It implies a decision to be made with full comprehension of both the upside and downside of a particular choice. Trade-offs are an important concept in engineering and technology (Otto and Antonsson 1991). For example, in electrical engineering, negative feedback is used in amplifiers to trade gain for other desirable properties, such as improved bandwidth, stability of the gain and/or bias point, noise immunity, and reduction of nonlinear distortion. In computer science, a trade-off is a tool of the trade. A program can often run faster if it uses more memory (a space-time tradeoff). For example, by compressing an
NAEP 2018-2019 OMB Clearance: Supporting Statement Part C Page 226
image, you can reduce transmission time/costs at the expense of CPU time to perform the compression and decompression.
Based on their review of the literature, Silk and Schunn (2008) concluded that because K–12 students are unlikely to have a normative understanding of interactions among variables in a general sense, they may not easily come to a conceptual understanding of trade-offs. Nevertheless, some research studies (Acredelo et al. 1984; Zohar 1995) have shown that younger students may have some kinds of understanding that can be a basis for a more complete grasp of the trade-off concept. Structure-Behavior-Function Structure-behavior-function (SBF) is a framework for representing a system and can be used to describe both natural and designed systems. SBF relates the components (structures) in a system to their purpose (function) in the system and the mechanisms that enable them to perform their functions (behavior). The SBF framework has been used to explain designed physical systems, such as electrical devices (Goel 1991; Goel and Bhatta 2004), as well as to represent the process of design as conducted by experienced technology designers (Gero and Kannengiesser 2004). Emergent Properties Not all systems are appropriately analyzed in terms of simple causal behaviors or a direct, linear sequence of events. Therefore, another prominent framework for understanding systems is emergent properties (Silk and Schunn 2008). Emergent properties focus on the behaviors that emerge from the dynamic interactions between components within the system. Emergent behaviors occur when the global, aggregate, or macro level behavior of a system emerges from the local, simple, or micro level interactions of the individual elements or components within the system. In these cases, the aggregate level behavior is not just a sum of the individual component behaviors, but is qualitatively distinct. Emergent properties are a central part of many engineered systems that are commonly found today, including highways, the Internet, and the U.S. power grid (Ottino 2004), so understanding about these types of systems is important for engineers and technicians who intend to work in these fields.
Multiple Variables The goal of engineering is to design products or processes that result in predictable outcomes within a given set of resource and other constraints. In almost all real-world products or processes there are typically a large number and wide range of input variables that can be manipulated in the design of an effective solution. Knowing which of these variables have a causal effect on the outcome is thus of central importance in engineering design and is the basis for the concept of multiple variables (Silk and Schunn 2008).
Instructional Strategies
Based on the reviews of the literature (NAE 2009; Silk & Schunn 2008), three important principles about effective approaches to curriculum development and classroom practice were identified: (1) the allocation of sufficient classroom time, (2) student engagement in iterative
NAEP 2018-2019 OMB Clearance: Supporting Statement Part C Page 227
design activities, and; (3) sequencing of instruction that moves from easier- to- learn concepts to more- difficult- to- learn concepts (NAE 2009). Sufficient Classroom Time Core technology and engineering ideas and skills cannot be developed in a single class period. These ideas and skills must be developed and elaborated through extended investigations that give students time to engage in the full engineering process of design and redesign. In every successful intervention reviewed, Silk & Schunn (2008) found that significant learning in technology and engineering resulted only after students were given sufficient, often extended, time for activities (NAE 2009). Iterative, Purposeful Revisions of Designs, Ideas, and Models
Research has shown that iterative, purposeful modeling appears to be central to helping both engineering and technology students to a more sophisticated understanding of salient ideas or skills (Gainsburg 2006; NAE 2009). Modeling can take the form of a physical design or a conceptual, graphical, mathematical, or diagrammatic design. The models help students answer particular questions based on their analysis of previous designs and, as iterations continue, the questions become increasingly specific and operationally defined, thus increasingly purposeful. As models are developed, revised, and refined over time, students begin to understand ideas in deeper ways (Gainsburg 2006; NersessianN et al. 2003; Nersessian and Patton, in press). Sequencing Instruction from Easier to More Difficult Ideas
The third important instructional strategy is that knowledge builds on itself. Therefore, a simple understanding of an idea is likely to precede a more complex understanding, and so on. This applies to learning concepts and skills in both engineering and technology classes (NAE 2009). Of course, the learning progressions, types of ideas, and depth of exploration of these ideas must be adapted for different grade levels (Duschl et al. 2007). Unfortunately at this time, the literature on teaching core technology and engineering concepts is not sufficient to make specific recommendations about sequencing instruction (NAE 2009).
Issue 3: Teacher Preparation
Professional Development
Since technology and, specifically, engineering are developing areas of content for K–12 schools, professional training for teachers is still in its infancy. However, in a national sample of public schools, the National Center for Education Statistics found that about 70 percent of schools agreed that their teachers were sufficiently trained in the use of technology, and 64 percent agreed that teachers were sufficiently trained to integrate technology into the classroom (Gray, Thomas, & Lewis 2010). Some resources that support teacher professional development can be found online. For example, The National Science Digital Library (NSDL), http://nsdl.org, funded by the National Science Foundation, provides teachers with science, technology, engineering, and mathematics resources for educational and research purposes. The resources
NAEP 2018-2019 OMB Clearance: Supporting Statement Part C Page 228
include, for example, video, audio, images, and lesson plans, and allow teachers the opportunity to collaborate with colleagues through blogging, digital workspaces, and discussion boards. Although some development resources are online, most of the professional development activities identified in the literature are in-service rather than pre-service programs that provide supplemental education based on specific curricula for teachers already working in the classroom (NAE 2009). One advantage of such professional development is that teachers gain an in-depth understanding of the purpose of the materials and firsthand experience with some of the difficulties and successes students might encounter. Education researchers have identified common characteristics of effective in-service professional development programs for teachers. In a discussion of in-service programs for K–12 science educators, Mundry (2007) identified the following requirements:
Clear and challenging goals for student learning; Adequate time, follow-up, and continuity; Coherence with local policy, teachers’ goals, and state standards; Active, research-based learning; Critical reflection on practice to support a collaborative professional culture; and Evaluation of teacher and student gains resulting from professional development.
Mundry (2007) notes that professional development sustained over time is more likely to be coherent, have a clear focus, and support active learning than “one-shot” workshops and other limited interventions. Opinions differ on the necessary number of hours, but most experts agree that single experiences are not likely to support teacher competence or confidence (e.g., NCES 2001). Recent research has shown that teachers’ participation in professional development with respect to engineering has been beneficial in increasing the understanding of engineering-related concepts for both teachers and students (Duncan, Cox, and Diefes-Dux 2007). A study conducted by Lyons and Thompson (2006) demonstrated that when elementary and middle school science and mathematics teachers were paired with engineering professors and graduate students over the course of three years, the teachers’ students significantly gained in their understanding of engineering compared with control students whose teachers were not paired with engineering professors or graduate students. Specifically, the students had a better understanding of the various engineering fields and the diversity within the discipline and they were able to recognize the cognitive processes related to engineering. Teacher Attitudes about Technology and Engineering
Research has found that teacher beliefs and attitudes about technology contribute greatly to their subsequent incorporation of technology in their classrooms (Duncan et al. 2007; Russell et al. 2003; Zhao 2003). Findings from Project Tomorrow’s 2007 Speak Up Survey, which surveyed 25,544 K–12 teachers from across the country with a focus on attitudes about science education, revealed that depending on the level of comfort with technology, teachers used different strategies in their classroom. Specifically, teachers who identified themselves as advanced in their technological capabilities were more likely to use multimedia and interactive simulations
NAEP 2018-2019 OMB Clearance: Supporting Statement Part C Page 229
when teaching scientific concepts than teachers who considered themselves average or beginner (Project Tomorrow and PASCO Scientific 2008).
Furthermore, a recent report by the National Education Association (2008) revealed that overall, teachers consider technology as having a positive impact on their job. The report included responses from 1,934 K–12 educators across the nation and found that 86 percent of public school teachers believed that technology increased their efficiency in their job performance, and 88 percent felt that technology improved their overall effectiveness in their job. Moreover and, perhaps most importantly, 89 percent believed that technology was essential to teaching and learning (National Education Association 2008). Similar findings from an NCES survey found that 93 percent of school administrators felt that teachers were interested in using technology in classroom instruction (Gray et al. 2010).
Given that engineering is not traditionally part of the K–12 curriculum, many teachers are apprehensive about attempting to teach engineering-related subjects and often hold many misconceptions and negative attitudes about engineering (Cunningham et al. 2006; Duncan et al. 2007). A large number of teachers have a limited view of engineering and believe that the primary engineering activities are construction as well as electrical and auto repair (Cunningham et al. 2006). With some teachers having incomplete knowledge about engineering, it is not surprising that similar misconceptions are found among students (Duncan et al. 2007).
Issue 4: Student Engagement
One of the claims most often made about K–12 technology and engineering education is that engagement in these areas improves learning and achievement in science and mathematics. The idea is that if students are taught science and mathematics concepts and skills while solving technology, engineering, or engineering-like problems, they will be able to grasp these concepts and learn these skills more easily and retain them, because technology and engineering can provide real-world context to what are otherwise very abstract concepts (NAE 2009). Although the amount of quality research on student engagement is limited, there is evidence that technology and engineering education can enhance learning and achievement in science and mathematics. For example, a student impact study conducted by Harcourt Education Measurement found that elementary, middle, and secondary school students using Internet-based real-time data and telecollaborative projects showed statistically significant gains in their science and mathematics learning, measured via pretest and posttest school assessments (Yepes-Baraya 2004). Additionally, there is some evidence suggesting that academically successful students engage in and use technology in different ways than low achieving students. In a study by Wenglinsky (2005), student technology use and achievement on the NAEP U.S. history assessment was examined. In general, students with higher NAEP U.S. history scores reported higher rates of using word processing programs and using computers for creating charts, tables, and graphs and completing school projects than students with lower NAEP history scores. Finally, the study found that students with higher NAEP history scores were more likely to use computers to communicate through e-mail and Internet chat groups. The author suggests that having e-mail access gives students more opportunity to discuss readings, homework assignments, and projects
NAEP 2018-2019 OMB Clearance: Supporting Statement Part C Page 230
in various classes (Wenglinsky 2005). However, it is important to note that such positive effects are not universal, and the research has not clearly established the causal mechanisms to explain such benefits when they occur (NAE 2009). For example, students who had participated in “Engineering is Elementary,” a program developed by the Boston Museum of Science that integrates engineering and technology with science content for elementary students, showed improvement in a posttest measuring science and engineering knowledge (Lachapelle and Cunningham 2007). Unfortunately, there was no control group for comparison in this study. In another study, students who had taken the “Engineering Our Future New Jersey” course, which is offered in 32 elementary, middle, and high schools in the state, demonstrated significant improvements in scores on both science and mathematics achievement tests. However, in this study the results were not disaggregated, and no measure of variance was provided. Thus, it is not known if the gains were uniform or if some subgroups were more or less impacted (Hotaling et al. 2007).
Likewise, studies examining the potential of K–12 technology and engineering to differentially affect mathematics and science achievement among girls and underrepresented minorities have also yielded inconsistent findings. In a study by Cantrel et al. (2006), university faculty were paired with middle school science teachers to create three units that included engineering designs using a variety of interactive learning activities in order to engage a wide range of students. The units included an Internet-based simulation activity, lesson plans, a design project, and a student assessment. Results of assessments were disaggregated by gender, ethnicity, special education, and socioeconomic level. Pre-post-assessment data showed that while the achievement gap for African American and Latin American students narrowed, the achievement gap for girls actually increased (Cantrel et al. 2006). Similarly, Barnett (2005) reported on a study of inner city, low SES, predominantly ethnic minority high school students that included a significant population of English language learners and many students with disabilities. All of these students had participated in a project that involved designing remotely operated vehicles. Pre-post data revealed that, overall, students’ understanding of physics had improved. However, the improvement did not translate to higher scores on a districtwide final exam in physics.
Overall, there is only limited evidence for many of the predicted or claimed benefits for K–12 technology and engineering education. This does not mean that the benefits do not exist, but it does confirm that relatively few well-designed, carefully executed studies have been conducted on this subject (NAE 2009).
Student Technology Use Outside of School Student technology use outside of school is pervasive, with students using computers, cell phones, and other digital devices for various purposes, such as helping with schoolwork, socially networking with friends and family, entertaining themselves, and researching. Through their collection of data from a nationally representative sample of 1,100 students aged 12 to 17, the Pew Internet and American Life Project (Lenhart, Madden, and Hitlin 2005) found that 87 percent of students go online from home; the predominant activities that students engaged in online included: sending or reading e-mails, accessing websites for entertainment-related information, playing games, and reading news and current events stories. Results from NCES (DeBell and Chapman 2005) found similar findings from their national survey of 29,075 students
NAEP 2018-2019 OMB Clearance: Supporting Statement Part C Page 231
enrolled in nursery school and grades K–12, that students’ online activity mainly included game playing, e-mailing, and completing homework. Furthermore, the report revealed that household characteristics also impact whether students are likely to use computers and the Internet, namely that students are more likely to use computers and the Internet at home, for example, if they are living with a parent who has graduate schooling or if they have families with high incomes. Educational and Career Expectations
Whether students show interest in a particular content area may also relate to their subsequent career choice (e.g., Holland 1997; Lubinski 2000). For instance, Tai et al. (2006) analyzed data from the National Educational Longitudinal Study of 1988, which included mathematics and science achievement test scores and tracked the students who had both provided responses concerning their career expectations as eighth graders and obtained baccalaureate degrees by the year 2000. The sample included 3,359 students, and results indicated that those who expressed interest in a science-related career in eighth grade were about three-and-a-half times more likely to earn science and engineering degrees than students with a nonscience career expectation. Furthermore, students who were only average mathematics performers but expected to have a science-related career were about three times more likely to obtain science or engineering degrees than students who were high mathematical performers without a science-related career expectation. Thus, it appears that early interest in science can shape students’ pursuit of a science-related career. Out-of-school Learning Exposure to science outside of school is perhaps one avenue to increase students’ interest in this content area. The importance of students participating in ‘informal learning’ activities is widespread and support can be found, for example, in the National Science Education Standards (National Research Council 1996) which states that “many communities have access to science centers and museums, as well as to the science communities in higher education, national laboratories, and industry; these can contribute greatly to the understanding of science and encourage students to further interests outside of school (p. 45).” Informal learning is described as learning that can be accomplished in any environment, can be unstructured, spontaneous, voluntary, and motivation is predominantly intrinsic (Eshach 2007). Recently, Education Week published a special report on the topic of informal science education (April 6, 2011). The articles showcased various programs that states have adopted to try to engage students outside of the classroom in science-related activities in order to enhance students’ interest. For example, in Albuquerque, New Mexico, a science center regularly hosts Family Science Night providing hands-on experiments for students and their families, and the Minnesota Zoo offers an online educational game with the intent of teaching students about ecology by simulating Yellowstone National Park. The National Research Council (2009) established the Committee on Learning Science in Informal Environments, tasked with investigating and assessing nonacademic, informal settings designed for science learning. Composed of 14 experts from various disciplines including science, psychology, and education, the committee concluded that, individuals do learn science in nonschool settings. Environments such as museums and zoos, or media including radio,
NAEP 2018-2019 OMB Clearance: Supporting Statement Part C Page 232
television, and the Internet, can encourage interest in science and may influence academic achievement for students, as well as provide inspiration for adopting science-related careers. The committee also developed a framework that demonstrates the necessary capabilities that informal environments should exhibit in order to support science learning, for instance, individuals should: (1) have an experience that generates excitement and motivation to learn about science; (2) understand, retain, and apply the knowledge learned; (3) make observations; and explore and manipulate science-related concepts; (4) comprehend science as a mechanism of knowing; (5) discover and participate in science activities with others; and (6) view themselves as learners of science.
Summary of Concepts to Explore for Background Questionnaire Item Development
The purpose of this paper was to examine existing research and identify concepts to consider for item development for the NAEP TEL background questionnaires. Additional research should be conducted by the item development team to identify whether these concepts can be measured accurately and reliably. Existing research, emerging research, and feedback from the Governing Board, NCES, and appropriate experts will be consulted during the process of item development. The following is a summary of the concepts identified from the literature review that would best ensure that the TEL background questionnaires provide context for reporting student performance on the TEL assessment and expand understanding of technology and engineering literacy in American education.
Issue 1: Availability and Use of Instructional Resources Resources
o Many schools operate in old facilities and with outdated laboratory equipment. Computer and Internet Access
o U.S. schools have made great strides in improving access to computer technology, as indicated by the average national student-to-instructional computer ratio and student-to-instructional-multimedia computer ratio.
o Internet connectivity in U.S. schools has increased substantially since 1994 (Williams 2000).
Human Infrastructure o Technology innovations require institutional support because the resources and
knowledge is often beyond an individual teacher’s abilities (Duncan et al. 2007; Zhao et al. 2002).
o The availability of human infrastructure has a strong mediating effect on the success of technological innovations at schools (Zhao et al. 2002).
Issue 2: Organization of Instruction
Content Standards o Content Standards for Technology
Some of the specific goals of K–12 technology education are described in Standards for Technological Literacy: Content for the Study of Technology (ITEA 2000).
To meet those standards, K–12 students must develop competencies in five areas: the nature of technology, technology and society, design, abilities
NAEP 2018-2019 OMB Clearance: Supporting Statement Part C Page 233
for a technological world, and the designed world. o Content Standards for Engineering
Currently no standards of curriculum content exist for K–12 engineering. Although it is theoretically possible to develop standards for K–12
engineering education, it would be extremely difficult to ensure their usefulness and effective implementation.
This conclusion was supported by several key findings. 1. There is relatively limited experience with K–12 engineering
education in U.S. elementary and secondary schools. 2. There are not enough teachers qualified to deliver engineering
instruction. 3. Evidence regarding the impact of standards-based educational
reforms on student learning in other subjects, such as mathematics and science, is inconclusive.
4. We may not know enough about the teaching and learning of engineering at the K–12 level to develop credible standards.
Curriculum Content o Technology and engineering curricula vary greatly in focus, content, and
requirements because of the lack of content standards. o A review by Silk and Schunn (2008) of national and international content
standards in both technology and engineering education uncovered that the majority of empirical research focuses on four concepts:
1. Trade-offs 2. Structure-behavior-function 3. Emergent properties 4. Multiple variables
Instructional Strategies o Based on the reviews of the literature, three important principles about effective
approaches to curriculum development and classroom practice were identified: The allocation of sufficient classroom time Student engagement in iterative design activities Sequencing of instruction that moves from easier-to-learn concepts to more-
difficult-to-learn concepts.
Issue 3: Teacher Preparation Professional Development
o Most of the professional-development activities identified in the literature are in-service rather than pre-service programs that provide supplemental education based on specific curricula for teachers already working in the classroom.
o Mundry (2007) notes that professional development sustained over time is more likely to be coherent, have a clear focus, and support active learning than “one-shot” workshops and other limited interventions.
o Opinions differ on the necessary number of hours, but most experts agree that single experiences are not likely to support teacher competence or confidence (e.g., NCES 2001).
NAEP 2018-2019 OMB Clearance: Supporting Statement Part C Page 234
Teacher Attitudes o Research has found that teacher beliefs and attitudes about technology contribute
greatly to their subsequent incorporation of technology in their classrooms (Duncan et al. 2007; Russell et al. 2003; Zhao 2003).
o Since engineering is not traditionally part of the K–12 curriculum, many teachers are apprehensive about attempting to teach engineering-related subjects and often hold many misconceptions and negative attitudes about engineering (Cunningham, Lachapelle, and Lindgren-Streicher 2006; Duncan et al. 2007).
Issue 4: Student Engagement
Student Engagement o The available research suggests that under certain circumstances, technology and
engineering education can boost learning and achievement in science and mathematics. However, the positive effects are not universal, and research has not clearly established the causal mechanism(s) to explain such benefits when they occur.
o Student technology use outside of school is pervasive, with students using computers, cell phones, and other digital devices for various purposes, such as helping with schoolwork, socially networking with friends and family, entertaining themselves, and researching.
o Whether students show interest in particular content areas may also relate to their subsequent career choices (e.g., Holland 1997; Lubinski 2000).
NAEP 2018-2019 OMB Clearance: Supporting Statement Part C Page 235
References
Acredelo, C., Adams, A., & Schmid., J. (1984). On the understanding of the relationships between speed, duration, and distance. Child Development 55(6): 2151–2159. Barnett, M. (2005). Engaging inner city students in learning through designing remote operated vehicles. Journal of Science Education and Technology 14(1): 87–100. Cantrell, P., G. Pekcan, A. Itani, and N. Velasquez-Bryant. (2006). The effects of engineering modules on student learning in middle school science classrooms. Journal of Engineering Education 95(4): 301–310. CEO Forum on Education and Technology. (June 2000). The Power of Digital Learning: Integrating Digital Content. The CEO Forum School Technology and Readiness Report (Year 3). Washington, DC. COSEPUP (Committee on Science, Engineering and Public Policy). (2002). Observations on the President’s Fiscal Year 2003 Federal Science and Technology Budget. Washington, DC: National Academies Press. Council on Competitiveness. (2001). Imperatives for Innovation: The Second National Innovation Summit 2001. Washington, DC: Council on Competitiveness. Council on Competitiveness. (2005). Innovate America. Washington, DC: Council on Competitiveness. Available online at: http://www.compete.org/images/uploads/File/PDF%20Files/NII_Innovate_America.pdf. Cunningham, C.M., Lachapelle, C., and Lindgren-Streicher, A. (2006). Elementary Teachers’ Understandings of Engineering and Technology. Paper presented at the 2006 American Society for Engineering Education Annual Conference and Exposition. Chicago. Daugherty, M. (1998). A recruitment crisis: Strategies for affecting change. The Technology Teacher, 57, 21-26. DeVries, M.J. (2009). Report for NAE on non-U.S. Standards for Pre-university Engineering Education. Paper presented at the NAE Workshop on Standards for K–12 Engineering Education, July 8, 2009, Washington, DC. Available online at: http://www.nap.edu/openbook.php?record_id=12990&page=81. DOE (U.S. Department of Energy). (2003). Critical Choices: Science, Energy, and Security. Final Report of the Secretary of Energy Advisory Board Task Force on the Future of Science Programs at the Department of Energy. Washington, DC: U.S. Department of Energy. Dugger, W.E. Jr. (2007). The status of technology education in the United States: a triennial report of the findings from the states. The Technology Teacher 67(1): 14–21.
NAEP 2018-2019 OMB Clearance: Supporting Statement Part C Page 236
Duncan, D., Oware, E., Cox, M.F., and Diefes-Dux, H.A. (2007). Program and Curriculum Assessment for the Institute for P–12 Engineering Research and Learning (INSPIRE) Summer Academies for P–6 Teachers. Paper presented at the 2007 American Society for Engineering Education Annual Conference and Exposition. Honolulu, Hawaii. Available online at: https://engineering.purdue.edu/INSPIRE/Research/papers/ASEE%20Paper%20with%20citation.pdf. Duschl, R.A., H.A. Schweingruber, and A.W. Shouse, eds. (2007). Taking Science to School: Learning and Teaching Science in Grades K–8. Committee on Science Learning, Kindergarten through Eighth Grade. Washington, DC: The National Academies Press. Education Week (2008). Ohio State Technology Report: A Special State-Focused Supplement to Education Week’s Technology Counts 2008. Available online at: http://www.edweek.org/media/ew/tc/2008/30OH_STR2008.h27.pdf. Education Week (2011). A special report on informal science education. Available online at: http://www.edweek.org/ew/collections/sciencereport-2011/index.html. Eshach, H. (2007). Bridging in-school and out-of-school learning: Formal, non-formal, and informal education. Journal of Science Education and Technology 16:171-190. Gainsburg, J. 2006. The mathematical modeling of structural engineers. Mathematical Thinking and Learning 8: 3–36. Gray, M., & Daugherty, M. (2004). Factors that influence students to enroll in technology education programs. Journal of Technology Education 15: 5-19. Gray, L., Thomas, N., & Lewis, L. (2010). Educational Technology in U.S. Public Schools: Fall 2008 (NCES 2010-034). U.S. Department of Education, National Center for Education Statistics. Washington, DC: U.S. Government Printing Office. Goel, A. (1991). A Model-Based Approach to Case Adaptation. Pp. 143–148 in Proceedings of the Thirteenth Annual Conference of the Cognitive Science Society. Wheat Ridge, CO: Cognitive Science Society. Goel, A., & Bhatta. S. (2004). Use of design patterns in analogy-based design. Advanced Engineering Informatics 18(2): 85–94. Harris, D.N., and M. Goertz. (2008). The potential effects of “high-quality and uniform” standards: Lessons from a synthesis of previous research and proposals for a new research agenda. A Final Report to the National Research Council. Available online at: http://www7.nationalacademies.org/cfe/Harris%20Goertz%20Paper.pdf. Herschbach, D. R. (2009). Technology Education: Foundations and Perspectives. Homewood, Ill.: American Technical Publishers, Inc.
NAEP 2018-2019 OMB Clearance: Supporting Statement Part C Page 237
Hester, K., & Cunningham, C. (2007). Engineering is elementary: An engineering and technology curriculum for children. Paper presented at the American Society for Engineering Education Annual Conference and Exposition. Honolulu, HI: American Society for Engineering Education. Available online at: http://www.mos.org/eie/pdf/research/asee_2007_dev_paper.pdf. Holland, J.L. (1997). Making vocational choices. Odessa: FL: Psychological Assessment Resources. Hotaling, L., B. McGrath, M. McKay, C. Shields, S. Lowes, C.M. Cunningham, et al. (2007). Engineering Our Future New Jersey. Paper presented at the American Society for Engineering Education Annual Conference and Exposition, Honolulu, HI, June 24–27, 2007. ITEA (International Technology Education Association). (2000). Standards for Technological Literacy: Content for the Study of Technology. Reston, VA.: ITEA. Kleiner, A., and Farris, E. (2002). Internet Access in United States’ Public Schools and Classrooms: 1994–2001 (NCES 2002–018). Available online at: https://nces.ed.gov/pubs2002/2002018.pdf. Kleiner, A., and Lewis, L. (2003). Internet Access in United States’ Public Schools and Classrooms: 1994–2002 (NCES 2004–011). Available online at: https://nces.ed.gov/pubs2004/2004011.pdf. Kolodner, J.L., P.J. Camp, D. Crismond, B. Fasse, J. Gray, and J. Holbrook. (2003). Problem- based learning meets case-based reasoning in the science classroom: putting learning-by-design into practice. Journal of the Learning Sciences 12(4): 495–547. Lachapelle, C.P., and C.M. Cunningham. (2007). Engineering is Elementary: Children’s Changing Understandings of Science and Engineering. Paper presented at the American Society for Engineering Education Annual Conference and Exposition, Honolulu, HI, June 24–27, 2007. Available online at: http://www.icee.usm.edu/ICEE/conferences/asee2007/papers/9_ENGINEERING_IS_ELEMENTARY__CHILDREN_S_CH.pdf. Lenhart, A., Madden, M., & Hitlin, P. (2005). Teens and technology: Youth are leading the transition to a fully wired and mobile nation. Washington, DC: Pew Internet & American Life Project. Lubinski, D. (2000). Scientific and social significance of assessing individual differences: Sinking shafts at a few critical points. Annual Review of Psychology 51: 405-444. McKay, M., and B. McGrath. 2007. Real-world problem-solving using real-time data. Inter- national Journal of Engineering Education 23(1): 36–42.
NAEP 2018-2019 OMB Clearance: Supporting Statement Part C Page 238
National Assessment Governing Board (NAGB). (2003). Background Information Framework for the National Assessment of Educational Progress. Washington, DC: National Assessment Governing Board (NAGB). National Academy of Engineering (NAE). (2003). The Impact of Academic Research on Indus- trial Performance. Washington, DC: National Academies Press. NAE. (2004). The Engineer of 2020: Visions of Engineering in the New Century. Washington, DC: National Academies Press. NAE. (2005a). Engineering Research and America's Future: Meeting the Challenges of a Global Economy. Washington, DC: National Academies Press NAE. (2005b). Educating the Engineer of 2020: Adapting Engineering Education to the New Century. Washington, DC: National Academies Press. NAE. (2009). Engineering in K-12 Education: Understanding the Status and Improving the Prospects. Washington, DC: National Academies Press. NAE. (2010). Standards for K-12 Engineering Education? Washington, DC: National Academies Press. National Education Association in collaboration with American Federation of Teachers. (May 2008). Access, Adequacy, and Equity in Education Technology: Results of a Survey of America’s Teachers and Support Professionals on Technology in Public Schools and Classrooms. Washington, DC: National Education Association. Available online at: http://sc08.sc-education.org/conference/k12/sat/stem/08gainsandgapsedtech.pdf. National Center for Education Statistics (NCES). (2001). Teacher Preparation and Professional Development: 2000. Available online at https://nces.ed.gov/pubs2001/2001088.pdf. NCES. (2008). Digest of Education Statistics. Table 64, Public and private elementary and secondary teachers, enrollment, and pupil/teacher ratios: Selected years, fall 1955 through fall 2017. Available online at https://nces.ed.gov/programs/digest/d08/tables/dt08_064.asp. NCMST (National Commission on Mathematics and Science Teaching for the 21st Century). 2000. Before It’s Too Late: A Report to the Nation. Jessup, Md.: Education Publications Center. Nersessian, N. J., and C. Patton. (2009). Model-based reasoning in interdisciplinary engineering. In A. Meijers (Ed.), Handbook of the Philosophy of Technology and Engineering Sciences, Springer, pp. 678-718. Nersessian, N. J., E. Kurz-Milcke, W.C. Newsletter, and J. Davies. (2003). Research laboratories as evolving distributed cognitive systems. Pp. 857-862 in Proceedings of the Twenty-Fifth Annual Conference of the Cognitive Science Society, R. Alterman and D. Kirsh, Eds. Mahwah, NJ: Erlbaum.
NAEP 2018-2019 OMB Clearance: Supporting Statement Part C Page 239
National Research Council (NRC). (1996). National science education standards. Washington, DC: National Academy Press. NRC. (2001). Trends in Federal Support of Research and Graduate Education. Washington, DC: National Academy Press. NRC. (2009). Learning science in informal environments: People, places, and pursuits. Bell, P., Levenstein, B., Shouse A.W., & Feder, M.A. (Eds.). Washington, DC: The National Academies Press. NSB (National Science Board). (2003). The Science and Engineering Workforce: Realizing America’s Potential. NSB 0369. Available online at: http://www.nsf.gov/nsb/documents/ 2003/nsb0369/nsb0369.pdf. Ogle, T., Branch, M., Canada, B., Christmas, O., Clement, J., Fillion, J., Goddard, E., Loudat, N. B., Purwin, T., Rogers, A., Schmitt, C., & Vinson, M. (2002). Technology In schools Task Force: Suggestions, Tools, and Guidelines for Assessing Technology in Elementary and Secondary Education (Report No. NCES 2003-313). Available online at: http://nces.ed.gov/pubs2003/2003313.pdf. Ottino, J. M. (2004). Engineering complex systems. Nature 427(6973): 399. Otto, K.N., and E.K. Antonsson. (1991). Trade-off strategies in engineering design. Research in Engineering Design 3(2): 87–103. Parsad, B., and Jones, J. (2005). Internet Access in United States’ Public Schools and classrooms: 1994-2003 (NCES 2005–015). Washington, DC: U.S. Department of Education. National Center for Education Statistics. Available online at: http://www.nces.ed.gov/pubs2005/2005015.pdf. PCAST (President’s Committee of Advisors on Science and Technology). (2002). Assessing the U.S. R&D Investment. Available online at: http://www.whitehouse.gov/sites/default/files/microsites/ostp/pcast-02-rdinvestment.pdf. PCAST. (2004a). Sustaining the Nation’s Innovation Ecosystem: Maintaining the Strength of Our Science and Engineering Capabilities. Available online at: http://www.whitehouse.gov/sites/default/files/microsites/ostp/pcast-04-itreport.pdf. PCAST. (2004b). Sustaining the Nation’s Innovation Ecosystem: Information Technology, Manufacturing and Competitiveness. Available online at: http://www.calstate.edu/psm/docs/1-11-07PSM_Jun2004.pdf. Project Tomorrow and PASCO scientific (2008). Inspiring the next generation of innovators: Students, parents and educators speak up about science education. Available online at: http://www.tomorrow.org/speakup/pdfs/Inspiring_the_next_generation_of_innovators.pdf
NAEP 2018-2019 OMB Clearance: Supporting Statement Part C Page 240
Russell, M., Bebell, D., O’Dwyer, L., and O’Conner, K. (Sept.-Oct. 2003). Examining Teacher Technology Use: Implications for Preservice and Inservice Teacher Preparation. Journal of Teacher Education 54(4): 297–310. Silk, E.M., and C. Schunn. (2008). Core Concepts in Engineering as a Basis for Understanding and Improving K–12 Engineering Education in the United States. Paper presented at the National Academy of Engineering/National Research Council workshop on K–12 Engineering Education, Washington, DC. WestEd (2010a). Technology and Engineering Literacy Framework for the 2014 National Assessment of Educational Progress. Washington, DC: WestEd. WestEd (2010b). Technology and Engineering Literacy Background Variables for the 2014 National Assessment of Educational Progress. Washington, DC: WestEd. Williams, C. (2000). Stats in Brief: Internet access in public schools and classrooms: 1994-99, (Report No. NCES 2000-086) Retrieved from National Center for Education Statistics: http://nces.ed.gov/pubs2000/2000086.pdf. Yepes-Baraya, M. (2004). The student impact study of the Alliance+ Project: Three case studies in K-12 technology integration. Phoenix: League for Innovation in the Community College. Available online at: http://www.league.org/league/projects/files/alliance_impact_study.pdf. Zhao, Y., Pugh, K., Sheldon, S., and Byers, J. (April 2002). Conditions for Classroom Technology Innovation. Teachers College Record 104(3): 482–515. Zhao, Y. (2003). What Teachers Need to Know About Technology? Framing the Question. In W. Heinecke and K. Knestis (Series Eds.) and Y. Zhao (Vol. Ed.), What Should Teachers Know About Technology? Perspectives and Practices (pp.1–14). Greenwich, CT: Information Age Publishing. Zohar, A. (1995). Reasoning about interactions between variables. Journal of Research in Science Teaching 32(10): 1039–1063.
NAEP 2018-2019 OMB Clearance: Supporting Statement Part C Page 241
Part C-8: 2015 NIES Issues Paper
NAEP 2018-2019 OMB Clearance: Supporting Statement Part C Page 242
KEY CONTEXTUAL FACTORS FOR THE NATIONAL INDIAN
EDUCATION STUDY NIES “Issues Paper”
Educational Testing Service
Written in preparation for New Item Development for the 2015 Paper-and-Pencil National Indian Education Study Survey Questionnaires
August 2013
The National Indian Education Study (NIES), is being conducted by the National Center for Education Statistics on behalf of the Office of Indian Education, in partial fulfillment of Executive Order 13336, American Indian and Alaska Native Education1. This order [13336] recognizes the responsibility of the federal government to assist American Indian and Alaska Native students in meeting the challenging academic standards of the No Child Left Behind Act of 2001 in a manner that is consistent with tribal traditions, languages, and cultures.
Section 3 of the Executive Order calls for a research agenda that will
1. compile comprehensive data on the academic achievement and progress of American Indian or Alaska Native students,
2. identify practices and methods that raise the academic achievement of American Indian or Alaska Native students, and
3. assess the role of native language and culture on the development of strategies that improve academic achievement for American Indian or Alaska Native students.
1 The Executive Order [13336] has been revoked by President Obama in December 2011 (Executive Order 13592: Improving American Indian and Alaska Native Educational Opportunities and Strengthening Tribal Colleges and Universities).
NAEP 2018-2019 OMB Clearance: Supporting Statement Part C Page 243
The issues and themes to be addressed in the survey component of the NIES reflect the concerns identified by Executive Order 13336. They were developed by NCES in consultation with the Technical Review Panel of American Indian and Alaska Native educators and researchers assembled to advise the NIES and have been used to report the results of the 2005 NIES.
Issues addressed by the NIES student, teacher, and school administrator questionnaires can be organized into five broad themes:
1. To what extent are American Indian or Alaska Native culture and language part of the curricula?
2. How available are school resources for improving American Indian or Alaska Native student achievement?
3. How assessment information is used by schools with American Indian or Alaska Native student populations?
4. How are American Indian tribes or Alaska Native groups or villages involved with the schools?
5. How do American Indian and Alaska Native students, teachers, and schools feel about education?
The remainder of this NIES Issues Paper is organized around these five themes, and several points within these themes are addressed specifically.
Theme 1: To what extent are American Indian or Alaska Native culture
and language part of the curricula?
American Indian and Alaska Native students receive schooling in such a variety of settings that understanding the degree to which culture plays a part in the curricula in various schools at which they attend is essential. For largely urban schools in areas where American Indian or Alaska Native students are a minority, the concept of allowing this culture to play a part in developing the curricula may come as a surprise; however, for those schools located on a reservation or in another setting where the majority of students are American Indian or Alaska Native, this may seem like an obvious concept, thus highlighting the need for further understanding of how schools use culture and language in the development of curricula. In addition, Executive Order 13336 places a special emphasis on examining the impact and role of native language and culture in the development of educational strategies to improve academic achievement for American Indian or Alaska Native students. The extent to and manner in which native cultures and languages are used in the classroom, the principles that shape instruction, and the tools used to assess American Indian or Alaska Native students should all be explored.
General emphasis on American Indian or Alaska Native culture in the curriculum While teachers frequently introduce supplementary activities that celebrate the diversity of their students, the NIES focus is on exploring a deeper integration of an American Indian or Alaska
NAEP 2018-2019 OMB Clearance: Supporting Statement Part C Page 244

Native student’s background in the curriculum. Schools with a high concentration of American Indian or Alaska Native students may infuse references to American Indian or Alaska Native culture and history, as well as references to contemporary American Indian or Alaska Native issues and experiences, throughout their curriculum. Whether or not the school employs this type of broad curricular emphasis, it is still possible to offer instruction to some or all students on various facets of native culture and history.
Classroom activities that reference American Indian or Alaska Native culture Because the achievement estimates derived for the NIES study will focus on reading and mathematics, these curricular areas have also been selected for detailed probing with regard to the emphasis on American Indian or Alaska Native culture in the curriculum.
Using students’ American Indian or Alaska Native languages in subject-area instruction Schools might choose to use the students’ own American Indian or Alaska Native languages in subject-area instruction for a variety of reasons, such as facilitating subject-area comprehension or strengthening students’ linguistic heritage.
Preparation for teaching American Indian or Alaska Native students The number of years teachers have worked at the school where they are currently employed will, in the case of schools with large American Indian or Alaska Native populations, give some indication of their experience with native cultures. Other factors may be membership in an American Indian tribe or Alaska Native group or village and knowledge of relevant tribal/village languages. Specific preparation for teaching American Indian or Alaska Native students will include college coursework, workshops and in-services, independent study, and other options. For teachers with students who require assistance in English-language learning, qualification for teaching ELL or Bilingual Education is also a factor.
Theme 2: How available are school resources for improving American
Indian or Alaska Native student achievement?
The resources available for instruction affect how students perform and encompass more than everyday classroom tools. Funding for schools, preparation for teaching American Indian or Alaska Native students, and the use of formal and informal resources by teachers for continuous learning all provide for a potential increase in student achievement. Within the context of the NIES survey, a particular focus is given to how these resources are expended or used in relation to American Indian or Alaska Native students.
Use of formal and informal resources for continuous learning The extent to which a teacher continues to use various resources—such as websites, professional journals and other magazines, workshops, and consultation with local experts including other
NAEP 2018-2019 OMB Clearance: Supporting Statement Part C Page 245

teachers—in order to improve the academic performance of American Indian or Alaska Native students should also be considered.
School control and funding The schools that serve American Indian or Alaska Native students may be public or non-public; regular public, charter public, or alternative; or directly managed by the Bureau of Indian Education (BIE) or managed through a BIE tribal contract or grant. Funding used to augment the education of American Indian or Alaska Native students may come to the school from a variety of sources including formula and discretionary grants under Indian Education; the Impact Aid Program; Title I, Title II, Title III, Title VII or other bilingual or ESL funds; Johnson-O’Malley grants; and Alaska Native Education Programs.
Theme 3: How is assessment information used by schools with
American Indian or Alaska Native student populations?
The use of assessment information can give schools a guide to determine how well they are doing in providing a learning environment for American Indian or Alaska Native students, as well as helping to increase the ability of educators and administrators to understand the needs of these students.
Standards and assessments that shape instruction for American Indian or Alaska Native students Increasingly, the content of instruction is guided by principles that dictate what students must know and be able to do. One way for schools to support and encourage culturally-relevant instruction for American Indian or Alaska Native students, therefore, is to adopt the use of specific American Indian or Alaska Native content or cultural principles that lay out guidelines for such instruction as well as assessments developed by American Indian or Alaska Native groups. Various kinds of assessments are used to evaluate student progress and plan appropriate instruction, and these also influence the ways in which students experience the curriculum.
Theme 4: How are American Indian tribes or Alaska Native groups or
villages involved with the schools?
The presence in and involvement with schools by American Indian or Alaska Native communities is important as it can show the degree to which a school is giving attention to the needs of those students. It can increase the awareness of these cultures by other students (those who are not American Indian or Alaska Native students), as well as help to provide a greater sense of community support for American Indian or Alaska Native students.
NAEP 2018-2019 OMB Clearance: Supporting Statement Part C Page 246
American Indian or Alaska Native student presence in schools As mentioned earlier, the proportion of American Indian or Alaska Native students enrolled in various types of schools will vary greatly and will have a major impact on the kinds of educational experiences offered to these students.
American Indian or Alaska Native teacher, staff, and administrator presence in schools The percentage of teachers and other staff members at a given school who are American Indian or Alaska Native is also significant. This can have an impact on the awareness that other teachers have of American Indian or Alaska Native culture and tradition and influence curricula.
American Indian or Alaska Native community member presence in schools Particularly in schools with large numbers of American Indian or Alaska Native students, it is of interest to examine the extent to which members of the American Indian or Alaska Native community participate in policy-making decisions and a variety of school activities. Knowing the degree to which these community members are present in the schools is important, whether they are authorized representatives of a local American Indian tribe or Alaska Native village or group or simply an interested community members.
Theme 5: How do American Indian and Alaska Native students,
teachers, and schools feel about education?
School climate School climate will be impacted by various sociocultural problems such as student absenteeism and tardiness, student health problems, misbehavior, physical conflicts, and drug or alcohol related problems. Lack of parent involvement may also be a factor. School climate will also be affected by the extent of staff turnover experienced by the school. Schools with very high teacher or administrator turnover will experience problems building a coherent educational program for their students.
American Indian or Alaska Native students’ exposure to traditional cultures and languages American Indian and Alaska Native students vary greatly in the extent to which they are raised in
circumstances that preserve their native cultures and languages. In addition, considerable cultural, linguistic, historical, and social differences exist among the various American Indian tribes and Alaska Native cultural groups. To understand how students identify with specific American Indian or Alaska Native cultures and languages, it is necessary to ask that they give self-evaluations of familiarity with traditions and practices of their tribes or villages. Students’ home environments will have a strong bearing on cultural identification. Therefore, topics such as whether or not traditional languages are used in the home and family participation in tribal/village ceremonies, gatherings,
NAEP 2018-2019 OMB Clearance: Supporting Statement Part C Page 247
and other activities should be explored. Students should also be given the opportunity to name the specific tribal/village groups with which they identify.
American Indian or Alaska Native students’ perceptions regarding school and learning, family support for education, and engagement with school A student’s attitude toward school in general, including the perceived relevance of what is being taught, will have an important bearing on that student’s overall educational experience. Special attention should be paid to the student’s attitude toward reading in general as well as specific reading habits. Self-appraisal of academic success will also have an important bearing on a student’s perceptions about school and learning. Furthermore, the extent to which the student has thought about and set challenging educational goals may also be an indication of these perceptions.
In addition to providing opportunities to learn about and participate in activities associated with their cultures (as discussed earlier), the home environment is an important factor in characterizing the total school experience of individual students. The extent to which family members engage in conversation with the students regarding their school work or offer help completing school work are also ways in which the family can support the students directly and encourage their academic progress.
Closely related to student perceptions about school and learning are indicators of the student’s involvement with school. These indicators include participation in school activities and programs as well as the type and frequency of interactions with teachers and counselors. While the family is very important in shaping the student’s response to education, other resources may also exist in the community. Community members can offer support to students through formal structures or through informal networks.
Characteristics of Teachers Who Serve American Indian or Alaska Native Students Students’ educational experiences depend in large part on their encounters with their individual teachers. In addition to standard education and certification requirements (which are surveyed by NAEP), teachers of American Indian or Alaska Native students should be familiar with the predominant culture or cultures of their students and should have received some specific training focused on working with these students. They should also avail themselves of specific resources to improve the academic performance of their American Indian or Alaska Native students on an ongoing basis.
Outreach to families Schools sometimes offer health or other social services to families as well as adult education opportunities. The type and frequency of the communications that the school initiates with families is another factor to be considered.
NAEP 2018-2019 OMB Clearance: Supporting Statement Part C Page 248
Reference Stancavage, F.B., Mitchell, J.H., Bandeira de Mello, V.P., Gaertner, F.E., Spain, A.K., and Rahal,
M.L., (2006). National Indian Education Study: Part II: The Educational Experiences of Fourth- and Eighth-Grade American Indian and Alaska Native Students (NCES 2007–454). U.S. Department of Education, National Center for Education Statistics. Washington, DC: U.S. Government Printing Office.
NAEP 2018-2019 OMB Clearance: Supporting Statement Part C Page 249