Sensor-Based Prototype of a Smart Assistant for Visually ...
Upload
independentCategory
view
1download
0
Multisensory Research 27 (2014) 225–246 brill.com/msr
14th IMRF collection
Synaesthesia or Vivid Imagery? A Single Case fMRIStudy of Visually Induced Olfactory Perception
Jason S. Chan 1,∗, Jasper J. F. van den Bosch 1, Stephanie Theves 1,
Stefanie Hardt 1, Patrick Pflanz 1, Jörn Lötsch 2, Jochen Kaiser 1
and Marcus J. Naumer 1
1 Institute of Medical Psychology, Goethe-University of Frankfurt, Frankfurt am Main,Germany
2 Department of Clinical Pharmacology, Goethe-University of Frankfurt, Frankfurt am Main,Germany
Received 24 October 2013; accepted 21 June 2014
AbstractThe most common form of synaesthesia is grapheme–colour synaesthesia. However, rarer formsof synaesthesia also exist, such as word–gustatory and olfactory–gustatory synaesthesia, wherebya word or smell will induce a specific. In this study we describe a single individual (LJ) who ex-periences a concurrent olfactory stimulus when presented with congruent visual images. For somevisual stimuli, he perceives a strong and automatic olfactory percept, which has existed throughouthis life. In this study, we explore whether his experiences are a new form of synaesthesia or simplyvivid imagery. Unlike other forms of synaesthesia, the concurrent odour is congruent to the visualinducer. For example, a photograph of dress shoes will elicit the smell of leather. We presented LJand several control participants with 75 images of everyday objects. Their task was to indicate thestrength of any perceived odours induced by the visual images. LJ rated several of the images as in-ducing a concurrent odour, while controls did not have any such percept. Images that LJ reported asinducing the strongest odours were used, along with colour-matched control images, in the context ofan fMRI experiment. Participants were given a one-back task to maintain attention. A block-designodour localizer was presented to localize the piriform cortex (primary olfactory cortex). We foundan increased BOLD response in the piriform cortex for the odour-inducing images compared to thecontrol images in LJ. There was no difference in BOLD response between these two stimulus typesin the control participants. A subsequent olfactory imagery task did not elicit enhanced activity in thepiriform cortex in LJ, suggesting his perceptual experiences may not be based on olfactory imagery.
This article is part of the 14th IMRF collection, guest edited by A. Amedi, D. I. Shore and S. Levy-Tzedek.
* To whom correspondence should be addressed. E-mail: [email protected]
© Koninklijke Brill NV, Leiden, 2014 DOI:10.1163/22134808-00002451
226 J. S. Chan et al. / Multisensory Research 27 (2014) 225–246
KeywordsSynaesthesia, single-case study, fMRI, visuo-olfactory
1. Introduction
Arguably the most common (at least the most reported) form of synaesthesia isgrapheme–colour synaesthesia (Brang et al., 2012). It has gradually emergedthat some forms of synaesthesia are induced by higher-order cognitive con-structs, such as language units (Simner, 2012). In total, 61 different forms ofsynaesthesia have been reported to date (Day, 2004). There are other forms ofsynaesthesia including tone to colour, words to taste, taste to shapes, and spa-tial sequence synaesthesia, to name a few. These inducer-concurrent couplingshave been reported to remain consistent over long periods of time (Simner andLogie, 2008), reflecting a core definition criterion of synaesthesia. Often, indi-viduals are made aware of their synaesthesia because it resembles one that hasbeen characterised before. This approach of recording is prone to self-reportbias, as there are likely more subtle and concealed variants that are not re-ported because of a failure to match the popular definition of a ‘merging ofthe senses’, or because the affected individuals lack the awareness that theircondition differs from the average person (Simner, 2012). In this way, synaes-thesia may become defined by those cases that are reported and not by thosethat remain hidden.
Few cases of olfactory synaesthesia have been reported. According to asurvey, some synaesthetes experienced synaesthetic smells in response to per-sonal associations (Simner et al., 2006). Cytowic also reported several casesof olfactory synaesthesia (Cytowic and Cole, 2003), but tended to rely en-tirely upon self-reports and did not provide a proof of genuineness. A study oflexical–gustatory synaesthesia reported that one out of seven participants alsoexperienced an olfactory response to synaesthesia-inducing words (Ward etal., 2005). However, flavour is rather a unitary experience of taste (Stevensonand Tomiczek, 2007), indicating that most participants may have been oblivi-ous of the olfactory component of their perception.
In this study, we describe the perception of one individual with what ispossibly visuo-olfactory synaesthesia. To our knowledge, this is the first timethis potential form of synaesthesia is described. When he is presented withan image of an odour-inducing item he ‘smells’ the object as if it is actuallypresent. LJ reported that these smells occur automatically and he describesthe phenomenon as always having been present throughout his life. He doesnot perceive an odour for every visual object. Nor does he perceive odours forimages of objects that are naturally odourless. His perception of a synaestheticodour is not as intense as the real object; he states “it is as if it is further away”.
J. S. Chan et al. / Multisensory Research 27 (2014) 225–246 227
LJ possesses a graduate degree. He wears corrective lenses but has normalsensory acuity for his age group. Similar to many synaesthetes who decide touse their synaesthesia in their professional life (Berman, 1999), LJ does workin a field of medical research. He does not have any history of neurologicaldisease.
The semantic congruency between the inducer and concurrent makes the‘proof of genuineness’ difficult, as we were unable to perform the classicaltests for synaesthesia, such as a consistency test over time; or tests of au-tomaticity such as the Stroop task. Analogous to previous colour–graphemestudies which found increased activity in area V4 for grapheme stimuli insynaesthetes compared to non-synaesthetes (Brang et al., 2010; cf. Howardet al., 1998; Nunn et al., 2002; Ramachandran and Hubbard, 2001; see Rouwet al., 2011 for an overview), we employed fMRI techniques to investigateBOLD activity in the primary olfactory (piriform) cortex when he viewed in-ducing and non-inducing visual stimuli. Similar to the results demonstratedby Ramachandran and Hubbard (2001), we expect increased BOLD activityin the piriform cortex when LJ is viewing odour-inducing stimuli compared tonon-inducing stimuli.
It is also possible that we will not find increased piriform activation in LJcompared to controls. It is important to highlight that other studies investi-gating colour–grapheme-induced, and auditory-induced colour (Aleman et al.,2001; Paulesu et al., 1995) did not find increased V4 activity. This could be dueto inconstancies in the type of synaesthesia, the heterogeneity in the methodsand analyses between experiments, or the relatively small number of partici-pants (see Rouw et al., 2011 for a review). This does not suggest that thesesynaesthetes did not perceive an additional synaesthetic colour. Rather, thereare several additional brain areas involved in colour processing (V1, V2, V3,hV4, and VO1; Brouwer and Heeger, 2009). Hupé et al. (2012) also did notfind increased V4 activity for synaesthetic colour (in synaesthetes) comparedto non-synaesthetic colours. However, they demonstrated that the synaestheticcolour–grapheme experience does not lie in the colour processing area of V4,but rather in more distributed processing over the visual cortex. Olfactoryperception utilizes a smaller network of brain regions (Bekkers and Suzuki,2013). Thus, it is less likely that the odour percept of LJ will rely on regionsother than the piriform cortex.
2. Methods
2.1. Participants
One putative visuo-olfactory synaesthete (LJ) and three control participantstook part in the study. LJ is a 50-year-old, right-handed male with an ad-
228 J. S. Chan et al. / Multisensory Research 27 (2014) 225–246
vanced university degree. He was given the Eagleman Synaesthesia Battery(Eagleman et al., 2007) to initially determine if he might have synaesthesia.
Control participants had a mean age of 42 years (standard deviation 5 years)and were recruited from the neuroscience community of Goethe-University,Frankfurt. The control participants were matched for sex and handedness. Allparticipants were screened with the standard MRI protocol. Control partici-pants were also given the Eagleman Synaesthesia Battery (Eagleman et al.,2007) to confirm that they did not have any form of synaesthesia. LJ was com-pletely aware of the goals of this study. Thus, to counter this possible artefactall of the controls were also completely informed as to the goals of this study.
All participants gave written informed consent prior to their participation.They did not receive any compensation for taking part. The study was ap-proved by the ethics committee of the Medical Faculty of Goethe-UniversityFrankfurt.
2.2. Behavioural Measurements
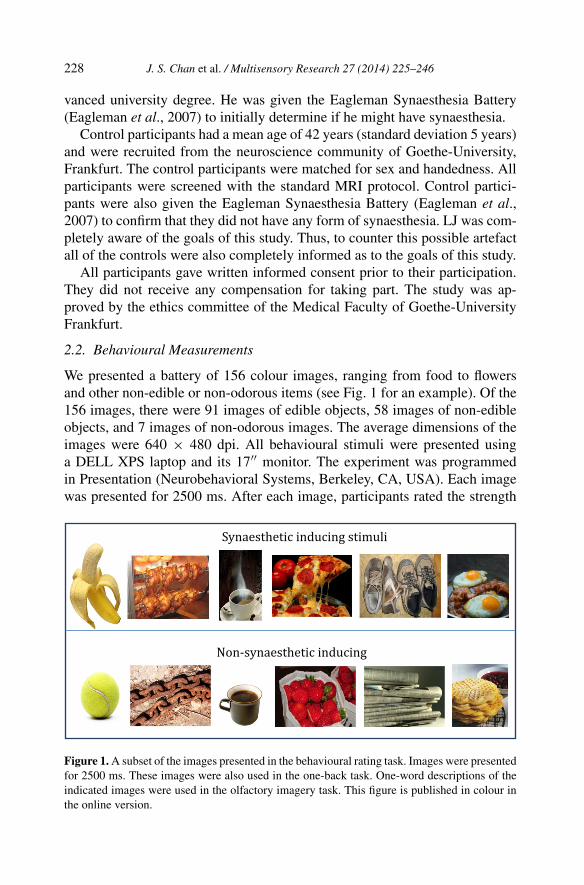
We presented a battery of 156 colour images, ranging from food to flowersand other non-edible or non-odorous items (see Fig. 1 for an example). Of the156 images, there were 91 images of edible objects, 58 images of non-edibleobjects, and 7 images of non-odorous images. The average dimensions of theimages were 640 × 480 dpi. All behavioural stimuli were presented usinga DELL XPS laptop and its 17′′ monitor. The experiment was programmedin Presentation (Neurobehavioral Systems, Berkeley, CA, USA). Each imagewas presented for 2500 ms. After each image, participants rated the strength
Figure 1. A subset of the images presented in the behavioural rating task. Images were presentedfor 2500 ms. These images were also used in the one-back task. One-word descriptions of theindicated images were used in the olfactory imagery task. This figure is published in colour inthe online version.
J. S. Chan et al. / Multisensory Research 27 (2014) 225–246 229
of a perceived odour that was induced by seeing the image on a 1–7 Likertscale (1 = no olfactory perception, 7 = strong olfactory perception). Partici-pants responded via the keyboard (using the horizontal row of numerical keys1–7). They were instructed to respond as accurately as possible and not to em-phasize reaction times. Each image was randomly repeated five times. Controlparticipants were given the same instructions; in other words, they were askednot to attempt to recall the odour of an object but to rate the level at which theimage induced an odour.
2.3. Neuroimaging
The fMRI experiment took place approximately three weeks after the be-havioural task. The fMRI experiment was separated into three tasks, a one-back task, an olfactory localizer task, and finally an olfactory imagery task.The total experimental time was approximately 1.5 hours.
2.3.1. One-Back TaskFrom the images chosen by LJ in the behavioural experiment as inducing anodour (rated 4 or higher on the perceived odour scale), six images were se-lected (SYN). An additional six images were chosen as control images (NON-SYN). These control images were randomly selected from the images that didnot induce an odour percept (i.e., images rated as 1 or 2). NON-SYN imageshad a similar overall colour spectrum and were edited to have the same imagedimensions as the SYN images (see Fig. 1).
This task was based on a slow event-related design. At the beginning ofeach trial a fixation cross was presented in the centre of the screen. Thenan image was presented for 2500 ms [one TR (Repetition Time)]. Followingeach stimulus presentation a response screen was presented for 2500 ms. Afterthe response screen, there was a jittered inter-trial interval between 7500 and12 500 ms. During each inter-trial interval a fixation cross was presented tomaintain fixation. There were 12 repetitions of each image, totalling 144 stim-ulus presentations. This was separated into four runs of 36 trials. The order ofstimulus presentation was randomized between each participant. The partici-pants’ task was to determine which image was repeated (i.e., one-back task).Once a repetition was detected, participants pressed a button with their rightindex finger. Throughout the presentation of non-repeated stimuli, no buttonpress was made.
The responses were analysed to ensure participants’ alertness and are notreported here. Participants responded via a custom-built magnetically safe re-sponse box.
2.3.2. Piriform Cortex LocalizerA single smell localizer run was conducted to localize the piriform cortex. Theblock-design for this task was adapted from Small et al. (2005). A block de-
230 J. S. Chan et al. / Multisensory Research 27 (2014) 225–246
sign was employed, with the two odours ‘rose’ and ‘leather cleaner’ (Model:“Sniffin’ Sticks”, Burghart, Wedel, Germany; Hummel et al., 1997) presentedinside the MR scanner. Each smell stick was fixed to either end of a one-meterwooden pole. An experimenter stood behind the scanner bore and held eachodour near the head coil. The scanner fan was turned to its maximum setting.This allowed the fan to blow the scent toward the participant, but also evacuatethe odour during the baseline condition. The timing of the odour presentationwas regulated by a series of tones presented to the experimenter via head-phones. Each odour was presented for 15 s (six TRs). A baseline condition,in which no odour was presented, was presented between each odour for thesame duration. The presentation of each odour was alternated to avoid possibleadaptation effects.
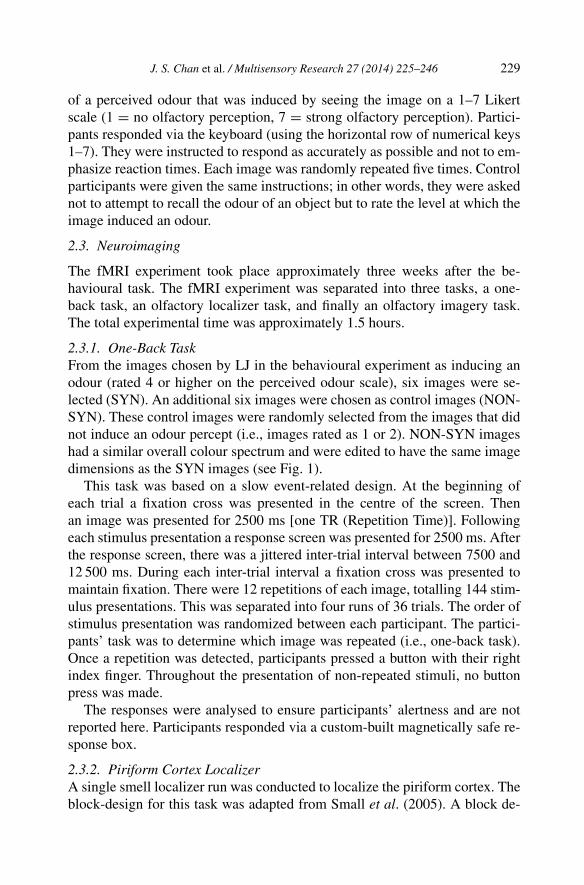
2.3.3. Mental Imagery TaskFifteen German words were presented to the participants in the fMRI scanner.Five of these words corresponded to images that induced an odour perceptin LJ (SYN) in the behavioural experiment. These words were: ‘Orange’,‘Clementine’, ‘Coke’, ‘Kuhstall’, and ‘Leder’ (orange, clementine, Coke, cowbarn, and leather, respectively). An additional five words were also chosenwhich did not induce an odour percept in LJ (NON-SYN). These words were:‘Lavendel’, ‘Marmelade’, ‘Kleber’, ‘Fisch’, and ‘Blumen’ (lavender, mar-malade, glue, fish, and flowers, respectively). For their respective results inthe behavioural task see Fig. 2. While these words represent visual objectsthat were presented in the previous behavioural experiment they were not pre-sented in the one-back task. Finally, we also presented words of objects whichtypically do not have an odour (NON-ODOUR). These words were: ‘Glas’,‘Marmor’, ‘Sonne’, ‘Fenster’, and ‘Büroklammer‘ (glass, marble, sun, win-dow, and paper clip, respectively). These served as control objects and shouldnot induce any olfactory imagery.
This task was based on a block-design. At the beginning of each trial, afixation cross was presented at the centre of the screen. Following the fixationcross, a word (in white) was presented at the centre of the screen against ablack background for 10 s (four TRs). The participants’ task was to imaginethe smell of the object. Immediately after the word, a response screen ap-peared for 2500 ms (one TR) and participants indicated whether they wereable to imagine the smell of the object. They pressed ‘1’ with their right in-dex finger if they were able to imagine its smell and ‘2’ if they were unableto imagine its smell. After the response screen, there was a jittered inter-trialinterval (between 7500 and 12 500 ms). Words were presented in a pseudoran-dom order. Each word was randomly repeated five times, for a total of 75 trialpresentations. This was separated into two runs, with 37 trials in one run and
J. S. Chan et al. / Multisensory Research 27 (2014) 225–246 231
Fig
ure
2.R
esul
tsfr
omth
ebe
havi
oura
lra
ting
task
.Par
ticip
ants
indi
cate
dth
ele
vel
ofpe
rcei
ved
odou
ron
asc
ale
of1–
7,w
ith1
repr
esen
ting
nood
our
and
7re
pres
entin
ga
stro
ngod
our.
Thi
sfig
ure
isa
subs
etof
the
tota
lset
ofim
ages
pres
ente
d.T
his
figur
eis
publ
ishe
din
colo
urin
the
onlin
eve
rsio
n.
232 J. S. Chan et al. / Multisensory Research 27 (2014) 225–246
38 trials in the other run. Words within each condition were grouped togetherfor the analyses.
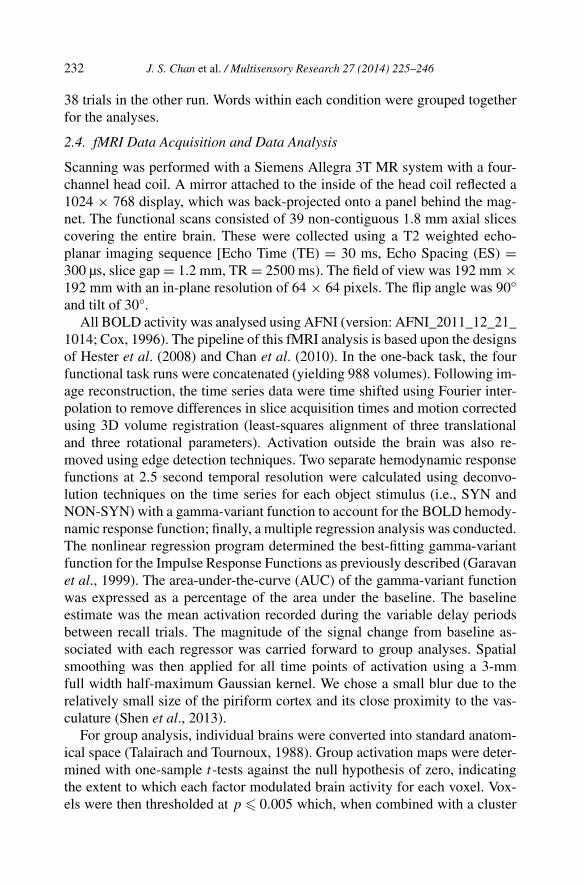
2.4. fMRI Data Acquisition and Data Analysis
Scanning was performed with a Siemens Allegra 3T MR system with a four-channel head coil. A mirror attached to the inside of the head coil reflected a1024 × 768 display, which was back-projected onto a panel behind the mag-net. The functional scans consisted of 39 non-contiguous 1.8 mm axial slicescovering the entire brain. These were collected using a T2 weighted echo-planar imaging sequence [Echo Time (TE) = 30 ms, Echo Spacing (ES) =300 µs, slice gap = 1.2 mm, TR = 2500 ms). The field of view was 192 mm ×192 mm with an in-plane resolution of 64 × 64 pixels. The flip angle was 90°and tilt of 30°.
All BOLD activity was analysed using AFNI (version: AFNI_2011_12_21_1014; Cox, 1996). The pipeline of this fMRI analysis is based upon the designsof Hester et al. (2008) and Chan et al. (2010). In the one-back task, the fourfunctional task runs were concatenated (yielding 988 volumes). Following im-age reconstruction, the time series data were time shifted using Fourier inter-polation to remove differences in slice acquisition times and motion correctedusing 3D volume registration (least-squares alignment of three translationaland three rotational parameters). Activation outside the brain was also re-moved using edge detection techniques. Two separate hemodynamic responsefunctions at 2.5 second temporal resolution were calculated using deconvo-lution techniques on the time series for each object stimulus (i.e., SYN andNON-SYN) with a gamma-variant function to account for the BOLD hemody-namic response function; finally, a multiple regression analysis was conducted.The nonlinear regression program determined the best-fitting gamma-variantfunction for the Impulse Response Functions as previously described (Garavanet al., 1999). The area-under-the-curve (AUC) of the gamma-variant functionwas expressed as a percentage of the area under the baseline. The baselineestimate was the mean activation recorded during the variable delay periodsbetween recall trials. The magnitude of the signal change from baseline as-sociated with each regressor was carried forward to group analyses. Spatialsmoothing was then applied for all time points of activation using a 3-mmfull width half-maximum Gaussian kernel. We chose a small blur due to therelatively small size of the piriform cortex and its close proximity to the vas-culature (Shen et al., 2013).
For group analysis, individual brains were converted into standard anatom-ical space (Talairach and Tournoux, 1988). Group activation maps were deter-mined with one-sample t-tests against the null hypothesis of zero, indicatingthe extent to which each factor modulated brain activity for each voxel. Vox-els were then thresholded at p � 0.005 which, when combined with a cluster
J. S. Chan et al. / Multisensory Research 27 (2014) 225–246 233
size criterion of 276 mm3, resulted in a false positive level of p � 0.05 (cor-rected for multiple comparisons) as calculated by Monte Carlo simulationsimplemented in the AlphaSim command available in AFNI.
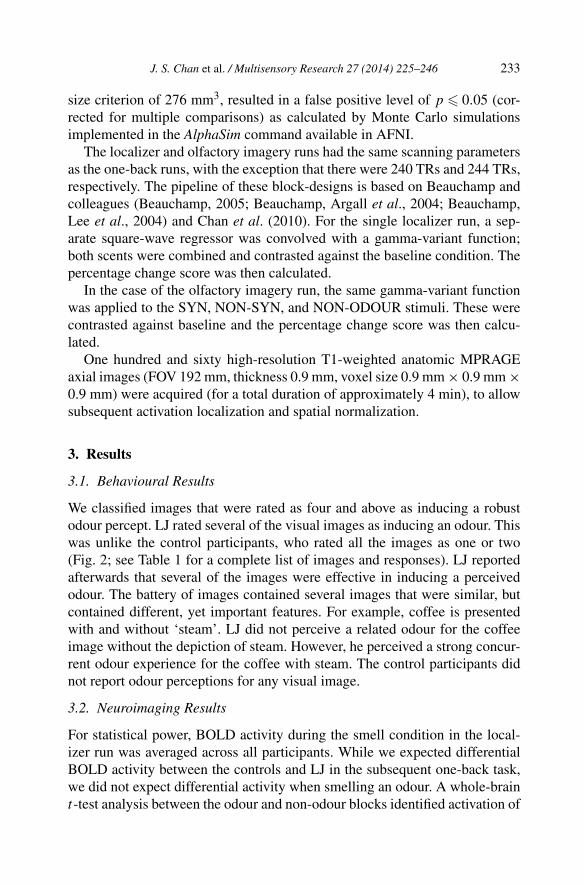
The localizer and olfactory imagery runs had the same scanning parametersas the one-back runs, with the exception that there were 240 TRs and 244 TRs,respectively. The pipeline of these block-designs is based on Beauchamp andcolleagues (Beauchamp, 2005; Beauchamp, Argall et al., 2004; Beauchamp,Lee et al., 2004) and Chan et al. (2010). For the single localizer run, a sep-arate square-wave regressor was convolved with a gamma-variant function;both scents were combined and contrasted against the baseline condition. Thepercentage change score was then calculated.
In the case of the olfactory imagery run, the same gamma-variant functionwas applied to the SYN, NON-SYN, and NON-ODOUR stimuli. These werecontrasted against baseline and the percentage change score was then calcu-lated.
One hundred and sixty high-resolution T1-weighted anatomic MPRAGEaxial images (FOV 192 mm, thickness 0.9 mm, voxel size 0.9 mm × 0.9 mm ×0.9 mm) were acquired (for a total duration of approximately 4 min), to allowsubsequent activation localization and spatial normalization.
3. Results
3.1. Behavioural Results
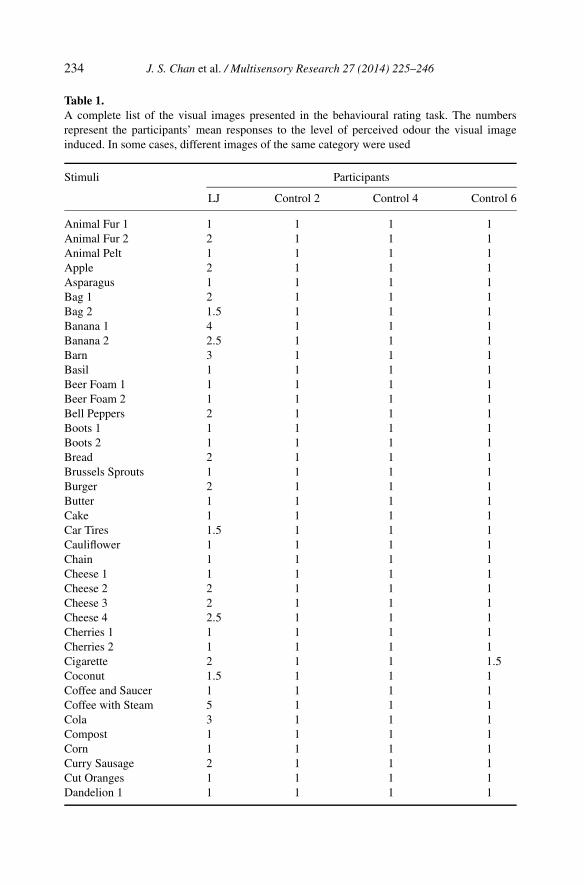
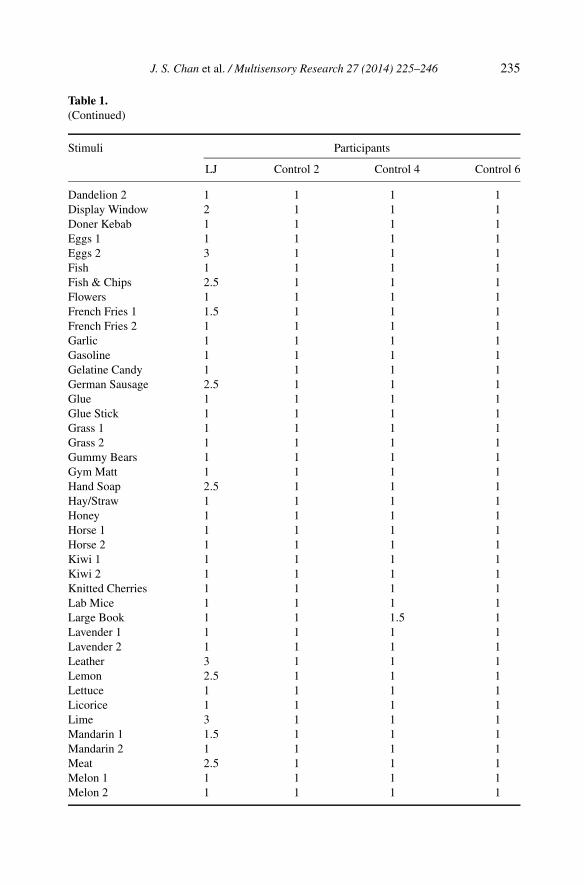
We classified images that were rated as four and above as inducing a robustodour percept. LJ rated several of the visual images as inducing an odour. Thiswas unlike the control participants, who rated all the images as one or two(Fig. 2; see Table 1 for a complete list of images and responses). LJ reportedafterwards that several of the images were effective in inducing a perceivedodour. The battery of images contained several images that were similar, butcontained different, yet important features. For example, coffee is presentedwith and without ‘steam’. LJ did not perceive a related odour for the coffeeimage without the depiction of steam. However, he perceived a strong concur-rent odour experience for the coffee with steam. The control participants didnot report odour perceptions for any visual image.
3.2. Neuroimaging Results
For statistical power, BOLD activity during the smell condition in the local-izer run was averaged across all participants. While we expected differentialBOLD activity between the controls and LJ in the subsequent one-back task,we did not expect differential activity when smelling an odour. A whole-braint-test analysis between the odour and non-odour blocks identified activation of
234 J. S. Chan et al. / Multisensory Research 27 (2014) 225–246
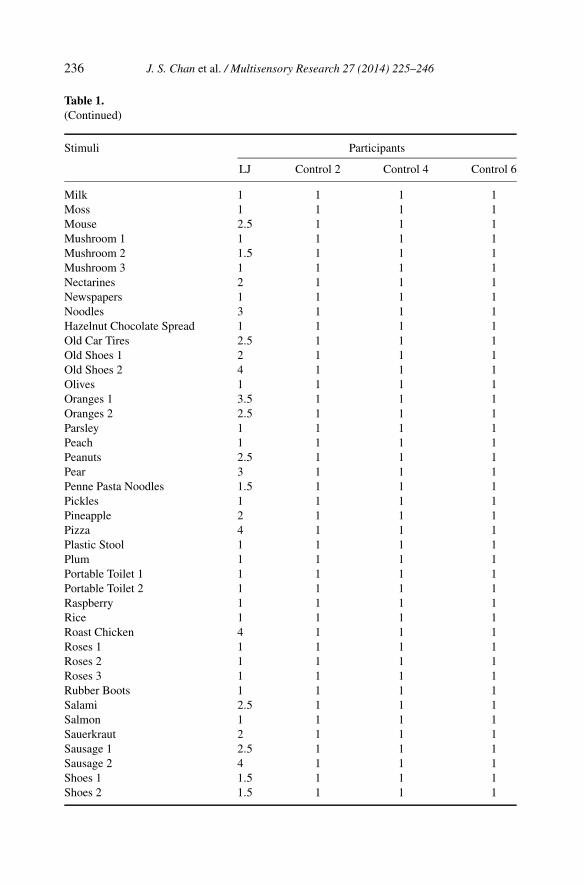
Table 1.A complete list of the visual images presented in the behavioural rating task. The numbersrepresent the participants’ mean responses to the level of perceived odour the visual imageinduced. In some cases, different images of the same category were used
Stimuli Participants
LJ Control 2 Control 4 Control 6
Animal Fur 1 1 1 1 1Animal Fur 2 2 1 1 1Animal Pelt 1 1 1 1Apple 2 1 1 1Asparagus 1 1 1 1Bag 1 2 1 1 1Bag 2 1.5 1 1 1Banana 1 4 1 1 1Banana 2 2.5 1 1 1Barn 3 1 1 1Basil 1 1 1 1Beer Foam 1 1 1 1 1Beer Foam 2 1 1 1 1Bell Peppers 2 1 1 1Boots 1 1 1 1 1Boots 2 1 1 1 1Bread 2 1 1 1Brussels Sprouts 1 1 1 1Burger 2 1 1 1Butter 1 1 1 1Cake 1 1 1 1Car Tires 1.5 1 1 1Cauliflower 1 1 1 1Chain 1 1 1 1Cheese 1 1 1 1 1Cheese 2 2 1 1 1Cheese 3 2 1 1 1Cheese 4 2.5 1 1 1Cherries 1 1 1 1 1Cherries 2 1 1 1 1Cigarette 2 1 1 1.5Coconut 1.5 1 1 1Coffee and Saucer 1 1 1 1Coffee with Steam 5 1 1 1Cola 3 1 1 1Compost 1 1 1 1Corn 1 1 1 1Curry Sausage 2 1 1 1Cut Oranges 1 1 1 1Dandelion 1 1 1 1 1
J. S. Chan et al. / Multisensory Research 27 (2014) 225–246 235
Table 1.(Continued)
Stimuli Participants
LJ Control 2 Control 4 Control 6
Dandelion 2 1 1 1 1Display Window 2 1 1 1Doner Kebab 1 1 1 1Eggs 1 1 1 1 1Eggs 2 3 1 1 1Fish 1 1 1 1Fish & Chips 2.5 1 1 1Flowers 1 1 1 1French Fries 1 1.5 1 1 1French Fries 2 1 1 1 1Garlic 1 1 1 1Gasoline 1 1 1 1Gelatine Candy 1 1 1 1German Sausage 2.5 1 1 1Glue 1 1 1 1Glue Stick 1 1 1 1Grass 1 1 1 1 1Grass 2 1 1 1 1Gummy Bears 1 1 1 1Gym Matt 1 1 1 1Hand Soap 2.5 1 1 1Hay/Straw 1 1 1 1Honey 1 1 1 1Horse 1 1 1 1 1Horse 2 1 1 1 1Kiwi 1 1 1 1 1Kiwi 2 1 1 1 1Knitted Cherries 1 1 1 1Lab Mice 1 1 1 1Large Book 1 1 1.5 1Lavender 1 1 1 1 1Lavender 2 1 1 1 1Leather 3 1 1 1Lemon 2.5 1 1 1Lettuce 1 1 1 1Licorice 1 1 1 1Lime 3 1 1 1Mandarin 1 1.5 1 1 1Mandarin 2 1 1 1 1Meat 2.5 1 1 1Melon 1 1 1 1 1Melon 2 1 1 1 1
236 J. S. Chan et al. / Multisensory Research 27 (2014) 225–246
Table 1.(Continued)
Stimuli Participants
LJ Control 2 Control 4 Control 6
Milk 1 1 1 1Moss 1 1 1 1Mouse 2.5 1 1 1Mushroom 1 1 1 1 1Mushroom 2 1.5 1 1 1Mushroom 3 1 1 1 1Nectarines 2 1 1 1Newspapers 1 1 1 1Noodles 3 1 1 1Hazelnut Chocolate Spread 1 1 1 1Old Car Tires 2.5 1 1 1Old Shoes 1 2 1 1 1Old Shoes 2 4 1 1 1Olives 1 1 1 1Oranges 1 3.5 1 1 1Oranges 2 2.5 1 1 1Parsley 1 1 1 1Peach 1 1 1 1Peanuts 2.5 1 1 1Pear 3 1 1 1Penne Pasta Noodles 1.5 1 1 1Pickles 1 1 1 1Pineapple 2 1 1 1Pizza 4 1 1 1Plastic Stool 1 1 1 1Plum 1 1 1 1Portable Toilet 1 1 1 1 1Portable Toilet 2 1 1 1 1Raspberry 1 1 1 1Rice 1 1 1 1Roast Chicken 4 1 1 1Roses 1 1 1 1 1Roses 2 1 1 1 1Roses 3 1 1 1 1Rubber Boots 1 1 1 1Salami 2.5 1 1 1Salmon 1 1 1 1Sauerkraut 2 1 1 1Sausage 1 2.5 1 1 1Sausage 2 4 1 1 1Shoes 1 1.5 1 1 1Shoes 2 1.5 1 1 1
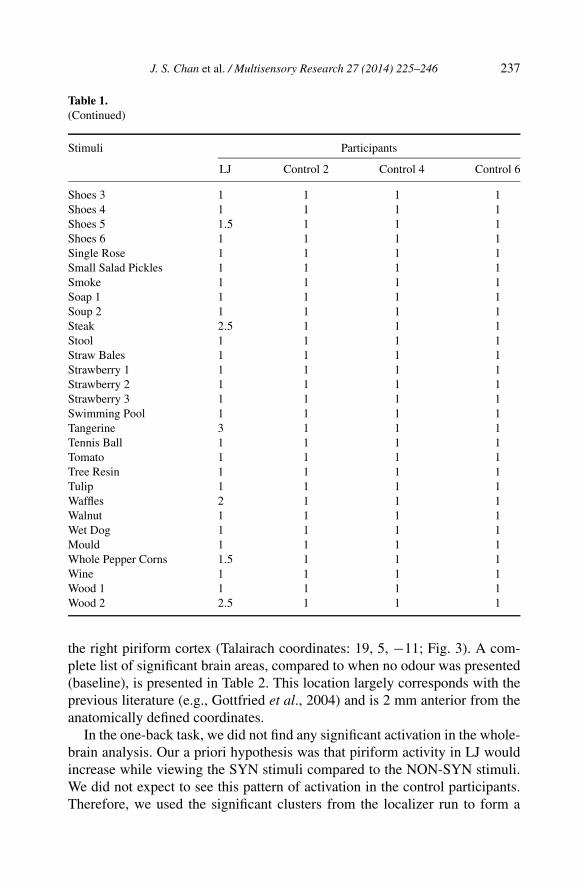
J. S. Chan et al. / Multisensory Research 27 (2014) 225–246 237
Table 1.(Continued)
Stimuli Participants
LJ Control 2 Control 4 Control 6
Shoes 3 1 1 1 1Shoes 4 1 1 1 1Shoes 5 1.5 1 1 1Shoes 6 1 1 1 1Single Rose 1 1 1 1Small Salad Pickles 1 1 1 1Smoke 1 1 1 1Soap 1 1 1 1 1Soup 2 1 1 1 1Steak 2.5 1 1 1Stool 1 1 1 1Straw Bales 1 1 1 1Strawberry 1 1 1 1 1Strawberry 2 1 1 1 1Strawberry 3 1 1 1 1Swimming Pool 1 1 1 1Tangerine 3 1 1 1Tennis Ball 1 1 1 1Tomato 1 1 1 1Tree Resin 1 1 1 1Tulip 1 1 1 1Waffles 2 1 1 1Walnut 1 1 1 1Wet Dog 1 1 1 1Mould 1 1 1 1Whole Pepper Corns 1.5 1 1 1Wine 1 1 1 1Wood 1 1 1 1 1Wood 2 2.5 1 1 1
the right piriform cortex (Talairach coordinates: 19, 5, −11; Fig. 3). A com-plete list of significant brain areas, compared to when no odour was presented(baseline), is presented in Table 2. This location largely corresponds with theprevious literature (e.g., Gottfried et al., 2004) and is 2 mm anterior from theanatomically defined coordinates.
In the one-back task, we did not find any significant activation in the whole-brain analysis. Our a priori hypothesis was that piriform activity in LJ wouldincrease while viewing the SYN stimuli compared to the NON-SYN stimuli.We did not expect to see this pattern of activation in the control participants.Therefore, we used the significant clusters from the localizer run to form a

238 J. S. Chan et al. / Multisensory Research 27 (2014) 225–246
Figure 3. Results from the smell localizer, averaged across all participants. BOLD activity wascontrasted between the smell and the no-smell blocks. The right piriform cortex is indicatedwithin the circle (Talairach coordinates: 19, 6, −12). The piriform region-of-interest based onthe activity from this localizer was used in the subsequent analyses of the one-back and olfactorytask. This figure is published in colour in the online version.
Table 2.A list of the brain regions that was significant against baseline, in the olfactory localizer task
Talairach coordinates Hemisphere Location Volume
(mm3)X Y Z
43 −40 −13 right fusiform gyrus 8159−8 54 2 left medial frontal gyrus 500048 −34 12 right superior temporal gyrus 338719 5 −11 right piriform cortex 333144 −47 39 right inferior parietal lobule 220824 −25 36 right cingulate gyrus 2194
−42 −54 29 left superior temporal gyrus 2065
mask and contrasted this activity between the SYN and NON-SYN stimuli. Totest whether there was a difference between LJ and controls when they werepresented the SYN and NON-SYN stimuli, we conducted separate single-case
J. S. Chan et al. / Multisensory Research 27 (2014) 225–246 239
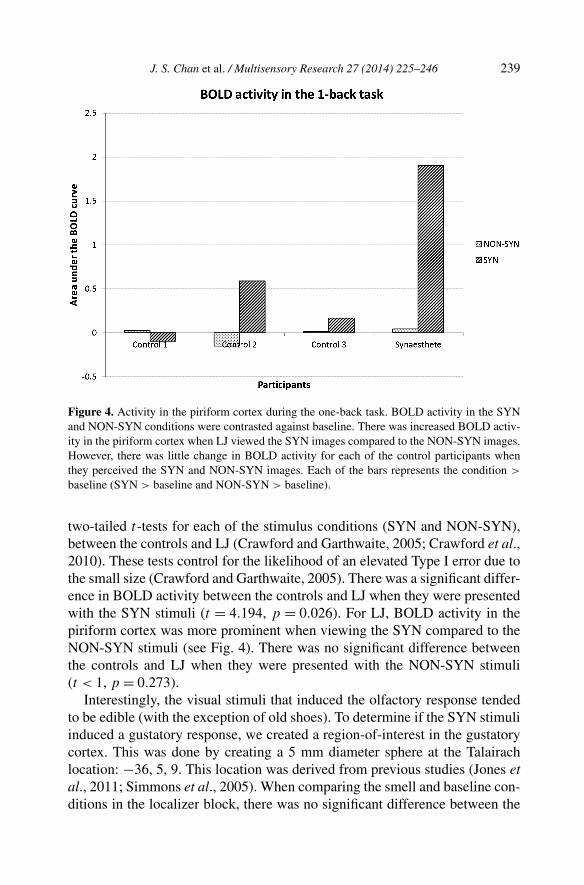
Figure 4. Activity in the piriform cortex during the one-back task. BOLD activity in the SYNand NON-SYN conditions were contrasted against baseline. There was increased BOLD activ-ity in the piriform cortex when LJ viewed the SYN images compared to the NON-SYN images.However, there was little change in BOLD activity for each of the control participants whenthey perceived the SYN and NON-SYN images. Each of the bars represents the condition >
baseline (SYN > baseline and NON-SYN > baseline).
two-tailed t-tests for each of the stimulus conditions (SYN and NON-SYN),between the controls and LJ (Crawford and Garthwaite, 2005; Crawford et al.,2010). These tests control for the likelihood of an elevated Type I error due tothe small size (Crawford and Garthwaite, 2005). There was a significant differ-ence in BOLD activity between the controls and LJ when they were presentedwith the SYN stimuli (t = 4.194, p = 0.026). For LJ, BOLD activity in thepiriform cortex was more prominent when viewing the SYN compared to theNON-SYN stimuli (see Fig. 4). There was no significant difference betweenthe controls and LJ when they were presented with the NON-SYN stimuli(t < 1, p = 0.273).
Interestingly, the visual stimuli that induced the olfactory response tendedto be edible (with the exception of old shoes). To determine if the SYN stimuliinduced a gustatory response, we created a region-of-interest in the gustatorycortex. This was done by creating a 5 mm diameter sphere at the Talairachlocation: −36, 5, 9. This location was derived from previous studies (Jones etal., 2011; Simmons et al., 2005). When comparing the smell and baseline con-ditions in the localizer block, there was no significant difference between the
240 J. S. Chan et al. / Multisensory Research 27 (2014) 225–246
two groups. Also, there was no significant difference in the gustatory cortexbetween the LJ and the controls in the one-back task when they watched theSYN (t = 0.29, p = 0.79) and NON-SYN stimuli (t = 3.76, p = 0.064).
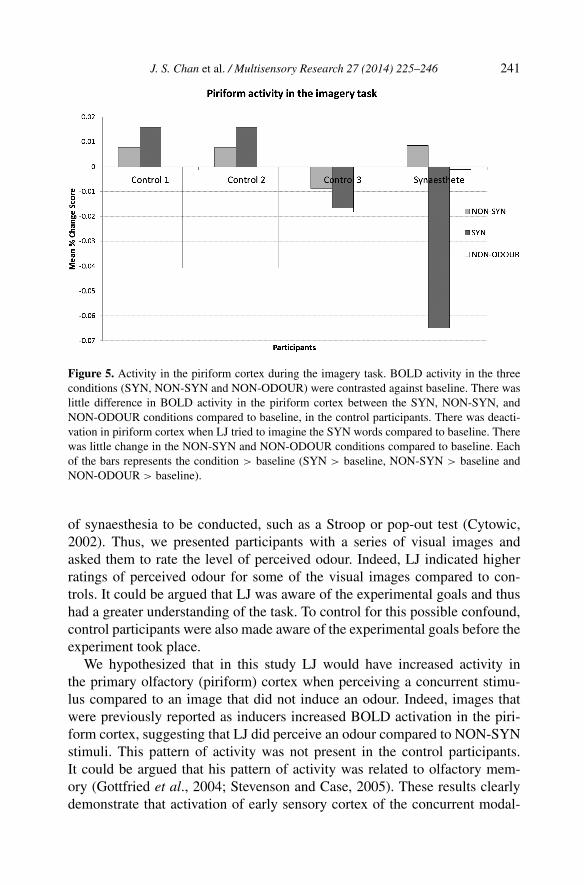
There was no significant difference between LJ and controls in their be-havioural ability to imagine the odour of the words (all t’s < 1, n.s.). Unlikeprevious studies on olfactory imagery (e.g., Djordjevic et al., 2005), we did notfind any significant brain activations in the whole-brain analysis of the imagerytask. However, this is likely due to the relatively small number of participants.The same mask that was used in the one-back task as a region-of-interest maskwas also used here. In the control participants, there was a small increasein activation when participants viewed the odour inducing images (SYN andNON-SYN). This is in accordance with the previous research (Djordjevic etal., 2005). Once again, we conducted a single-case analysis and found no sig-nificant difference between the control participants and LJ when they werepresented with the NON-SYN (t < 1, p = 0.32) and NON-ODOUR (t = 2.13,p = 0.17) stimuli. There was a significant difference between the controls andLJ when they were presented with the SYN stimuli (t = −3.72, p = 0.04). LJappeared to show deactivation compared to baseline when attempting to imag-ine the SYN images (see Fig. 5). In fact, anecdotally, LJ self-reported to havefound it very difficult to imagine the smell of the words presented, regardlessof whether they were SYN, NON-SYN, or NON-ODOUR words.
Previously, it had been reported that V4 activation may not differ betweensynaesthetes and non-synaesthetes when imagining colours (Rich et al., 2006).However, increased activity was found in other colour processing areas (leftmedial lingual gyrus) for synaesthetes compared to controls. It is possiblethat other brain areas, such as the fusiform gyrus, were involved in olfac-tory imagery (Howard et al., 1998) and olfactory perception (Cerf-Ducasteland Murphy, 2006). We decided to examine activity in the fusiform gyrus be-cause it is also implicated in olfactory perception. A mask was created for thefusiform gyrus activation in the localizer block. Using the same single-casetwo-tailed t-tests as in the previous tasks, there was no significant differencebetween LJ and controls in this location when imagining non-synaesthetic(t = −0.499, p = 0.667), and non-odour words (t = −0.5, p = 0.667). Whenasked to imagine a synaesthetic word, there was significantly greater BOLDactivity in LJ (AUC = 0.061) compared to controls (AUC = 0.002; t = 5.084,p = 0.037).
4. Discussion
This study details an interesting phenomenon, possibly a new form of synaes-thesia, where congruent odours are perceived when particular visual stimuliare viewed. This visuo-olfactory congruency did not allow for the typical tests
J. S. Chan et al. / Multisensory Research 27 (2014) 225–246 241
Figure 5. Activity in the piriform cortex during the imagery task. BOLD activity in the threeconditions (SYN, NON-SYN and NON-ODOUR) were contrasted against baseline. There waslittle difference in BOLD activity in the piriform cortex between the SYN, NON-SYN, andNON-ODOUR conditions compared to baseline, in the control participants. There was deacti-vation in piriform cortex when LJ tried to imagine the SYN words compared to baseline. Therewas little change in the NON-SYN and NON-ODOUR conditions compared to baseline. Eachof the bars represents the condition > baseline (SYN > baseline, NON-SYN > baseline andNON-ODOUR > baseline).
of synaesthesia to be conducted, such as a Stroop or pop-out test (Cytowic,2002). Thus, we presented participants with a series of visual images andasked them to rate the level of perceived odour. Indeed, LJ indicated higherratings of perceived odour for some of the visual images compared to con-trols. It could be argued that LJ was aware of the experimental goals and thushad a greater understanding of the task. To control for this possible confound,control participants were also made aware of the experimental goals before theexperiment took place.
We hypothesized that in this study LJ would have increased activity inthe primary olfactory (piriform) cortex when perceiving a concurrent stimu-lus compared to an image that did not induce an odour. Indeed, images thatwere previously reported as inducers increased BOLD activation in the piri-form cortex, suggesting that LJ did perceive an odour compared to NON-SYNstimuli. This pattern of activity was not present in the control participants.It could be argued that his pattern of activity was related to olfactory mem-ory (Gottfried et al., 2004; Stevenson and Case, 2005). These results clearlydemonstrate that activation of early sensory cortex of the concurrent modal-
242 J. S. Chan et al. / Multisensory Research 27 (2014) 225–246
ity, demonstrated for vision (i.e., Brang et al., 2010) and taste (Hänggi et al.,2008; Jones et al., 2011) can be extended to the primary olfactory cortex.
It is important to highlight the relatively small number of participants inthis study. It has been previously reported by several labs (with larger samplesizes) that there are widespread functional and structural differences betweenthe brains of synaesthetes (as well as non-synaesthetes; Rouw et al., 2011).Thus, it is important to consider these results in this context. Further researchwith a larger population sample is needed to confirm these results.
Interestingly, LJ does not perceive a synaesthetic olfactory perception for allvisual stimuli. LJ reported that he does not perceive an odour for every visualimage. He self-reported the illusion tends to arise when the visual images canplausibly induce an odour in the ‘real world’.
Furthermore, an olfactory imagery task was performed in order to deter-mine if LJ simply had enhanced olfactory imagery. In fact, we found piriformcortex deactivation in LJ for the SYN stimuli compared to the NON-SYN andNON-ODOUR stimuli. This seems to coincide with his self-report that the im-ages (particularly the SYN images) were difficult to imagine. If his perceptionwas due to olfactory imagery the pattern of activity in the piriform cortex dur-ing the imagery task should be similar to the one-back task, albeit at possiblylower BOLD responses. However, this was not the case. It is important to out-line the limitations of these results. The results from the imagery task did notoffer additional evidence in support of LJ’s synaesthesia. However, they ruleout the possibility that his perceptual phenomenon is due to olfactory imagery.Indeed, LJ exhibited increased BOLD activity in the fusiform gyrus when per-ceiving SYN stimuli in the one-back task, compared to controls.
This is not the first case of synaesthesia whereby the inducers and con-currents are congruent (Fitzgibbon et al., 2012). There are reported cases oflexical–gustatory synaesthesia, whereby the synaesthete perceives a congruenttaste when a flavourful word is presented. For example, they perceive the tasteof an apple when they are presented with the word apple. However, with theincreasing number of synaesthesia types, there is increasing debate as to thedefinition of synaesthesia (Deroy and Spence, 2013; Rothen and Meier, 2013).It has been argued that synaesthesia should be confined to phenomena wherethe concurrent and inducers are incongruous. The authors ascribe to the op-tions made by Deroy and Spence (2013), that synaesthesia differs from othertypically developing multisensory phenomena, such as crossmodal correspon-dence. In contrast to synaesthesia, crossmodal correspondence does not createan automatic ‘illusory’ percept. This is an important distinction that cannot beoverlooked when we consider what is synaesthesia.
It can be argued that LJ is, in fact, experiencing a sort of crossmodal corre-spondence (Deroy and Spence, 2013; Spence, 2011). Synaesthesia is definedas a “conscious experience of systematically induced sensory attributes that
J. S. Chan et al. / Multisensory Research 27 (2014) 225–246 243
are not experienced by most people under comparable conditions” (Grossen-bacher and Lovelace, 2001; Ward and Mattingley, 2006). Interestingly, thisdefinition does not require that the inducer and concurrent be semanticallyincongruent to one another.
In crossmodal correspondence, a stimulus in one sensory modality does notgive rise to the automatic conscious perception of another attribute in a differ-ent modality. Importantly, crossmodal correspondence occurs in the generalpopulation. While LJ’s concurrents and inducers are semantically congruent,similarly to crossmodal correspondence, LJ’s concurrents are part of his con-scious experience. It is beyond a mere sensory association.
It is also possible that LJ’s experience results from nothing more thana ‘non-volitional’ ability to recall from memory and imagine odours (seeStevenson and Case, 2005 for a review). After all, it has been demonstratedthat synaesthetes score higher on self-rated imagery questionnaires comparedto controls (Barnett and Newell, 2008). In an attempt to assess whether olfac-tory imagery might constitute the root cause of these perceptions (Bensafi etal., 2003), participants performed an olfactory imagery task inside the scanner.Previous olfactory studies have demonstrated that it is possible to ‘imagine’ anodour (Bensafi et al., 2003; Djordjevic et al., 2005). Similar to these studiesinvestigating ‘real perception’ versus imagery, if LJ’s synaesthetic perceptionis simply caused by imagery we would predict a similar pattern of activityin the piriform cortex compared to the one-back task. Further research usingdiffusion tensor imaging (DTI) may also help to elucidate the structural andfunctional network differences between LJ and controls with regard to fibersconnecting the visual and olfactory systems.
Acknowledgements
This project was funded by the Hessian initiative for the development of sci-entific and economic excellence (LOEWE) Neuronal Coordination ResearchFocus Frankfurt (NeFF). We are grateful to Tessa M. van Leeuwen for her in-sightful comments. We would also like to thank Ralf Deichmann at the BrainImaging Center, Goethe University for his help to setup the fMRI protocols.
References
Aleman, A., Rutten, G.-J. M., Sitskoorn, M. M., Dautzenberg, G. and Ramsey, N. F. (2001). Ac-tivation of striate cortex in the absence of visual stimulation: an fMRI study of synesthesia,Neuroreport 12, 2827–2830.
Barnett, K. J. and Newell, F. N. (2008). Synaesthesia is associated with enhanced, self-ratedvisual imagery, Conscious. Cogn. 17, 1032–1039.
Beauchamp, M. S. (2005). Statistical criteria in fMRI studies of multisensory integration, Neu-roinformatics 3, 93–113.

244 J. S. Chan et al. / Multisensory Research 27 (2014) 225–246
Beauchamp, M. S., Argall, B. D., Bodurka, J., Duyn, J. H. and Martin, A. (2004). Unravelingmultisensory integration: patchy organization within human STS multisensory cortex, Nat.Neurosci. 7, 1190–1192.
Beauchamp, M. S., Lee, K. E., Argall, B. D. and Martin, A. (2004). Integration of auditory andvisual information about objects in superior temporal sulcus, Neuron 41, 809–823.
Bekkers, J. M. and Suzuki, N. (2013). Neurons and circuits for odor processing in the piriformcortex, Trends Neurosci. 36, 429–438.
Bensafi, M., Porter, J., Pouliot, S., Mainland, J., Johnson, B., Zelano, C., Young, N., Bremner,E., Aframian, D., Khan, R. and Sobel, N. (2003). Olfactomotor activity during imagerymimics that during perception, Nat. Neurosci. 6, 1142–1144.
Berman, G. (1999). Synesthesia and the arts, Leonardo 32, 15–22.Brang, D., Hubbard, E., Coulson, S., Huang, M. and Ramachandran, V. S. (2010). Magnetoen-
cephalography reveals early activation of V4 in grapheme-color synesthesia, NeuroImage53, 268–274.
Brang, D., Williams, L. E. and Ramachandran, V. S. (2012). Grapheme-color synesthetes showenhanced crossmodal processing between auditory and visual modalities, Cortex 48, 630–637.
Brouwer, G. J. and Heeger, D. J. (2009). Decoding and reconstructing color from responses inhuman visual cortex, J. Neurosci. 29, 13992–14003.
Cerf-Ducastel, B. and Murphy, C. (2006). Neural substrates of cross-modal olfactory recogni-tion memory: an fMRI study, NeuroImage 31, 386–396.
Chan, J. S., Simões-Franklin, C., Garavan, H. and Newell, F. N. (2010). Static images of novel,moveable objects learned through touch activate visual area hMT+, NeuroImage 49, 1708–1716.
Cox, R. W. (1996). AFNI: software for analysis and visualization of functional magnetic reso-nance neuroimages, Comput. Biomed. Res. 29, 162–173.
Crawford, J. R. and Garthwaite, P. H. (2005). Testing for suspected impairments and disso-ciations in single-case studies in neuropsychology: evaluation of alternatives using MonteCarlo simulations and revised tests for dissociations, Neuropsychology 19, 318–331.
Crawford, J. R., Garthwaite, P. H. and Porter, S. (2010). Point and interval estimates of effectsizes for the case-controls design in neuropsychology: rationale, methods, implementations,and proposed reporting standards, Cogn. Neuropsychol. 27, 245–260.
Cytowic, R. E. (2002). Synesthesia: A Union of the Senses, 2nd edn. Bradford Books, London,UK.
Cytowic, R. E. and Cole, J. (2003). The Man Who Tasted Shapes. Bradford Books, London,UK.
Day, S. (2004). Some demographic and socio-cultural aspects of synesthesia, in: Synesthesia:Perspectives from Cognitive Neuroscience, L. C. Robertson and N. Sagiv (Eds), pp. 11–33.Oxford University Press, New York, NY, USA.
Deroy, O. and Spence, C. (2013). Why we are not all synesthetes (not even weakly so), Psy-chonom. Bull. Rev. 20, 643–664.
Djordjevic, J., Zatorre, R. J., Petrides, M., Boyle, J. A. and Jones-Gotman, M. (2005). Func-tional neuroimaging of odor imagery, NeuroImage 24, 791–801.
Eagleman, D. M., Kagan, A. D., Nelson, S. S., Sagaram, D. and Sarma, A. K. (2007). A stan-dardized test battery for the study of synesthesia, J. Neurosci. Meth. 159, 139–145.
J. S. Chan et al. / Multisensory Research 27 (2014) 225–246 245
Fitzgibbon, B. M., Enticott, P. G., Rich, A. N., Giummarra, M. J., Georgiou-Karistianis, N. andBradshaw, J. L. (2012). Mirror-sensory synaesthesia: exploring ‘shared’ sensory experiencesas synaesthesia, Neurosci. Biobehav. Rev. 36, 645–657.
Garavan, H., Ross, T. J. and Stein, E. A. (1999). Right hemispheric dominance of inhibitorycontrol: an event-related functional MRI study, Proc. Natl Acad. Sci. 96, 8301–8306.
Gottfried, J. A., Smith, A. P. R., Rugg, M. D. and Dolan, R. J. (2004). Remembrance of odorspast: human olfactory cortex in cross-modal recognition memory, Neuron 42, 687–695.
Grossenbacher, P. G. and Lovelace, C. T. (2001). Mechanisms of synesthesia: cognitive andphysiological constraints, Trends Cogn. Sci. 5, 36–41.
Hänggi, J., Beeli, G., Oechslin, M. S. and Jäncke, L. (2008). The multiple synaesthete E.S. —neuroanatomical basis of interval-taste and tone-colour synaesthesia, NeuroImage 43, 192–203.
Hester, R., Barre, N., Murphy, K., Silk, T. J. and Mattingley, J. B. (2008). Human medial frontalcortex activity predicts learning from errors, Cereb. Cortex 18, 1933–1940.
Howard, R. J., ffytche, D. H., Barnes, J., McKeefry, D., Ha, Y., Woodruff, P. W., Bullmore,E. T., Simmons, A., Williams, S. C., David, A. S. and Brammer, M. (1998). The functionalanatomy of imagining and perceiving colour, Neuroreport 9, 1019–1023.
Hummel, T., Sekinger, B., Wolf, S. R., Pauli, E. and Kobal, G. (1997). ‘Sniffin’ Sticks’: olfactoryperformance assessed by the combined testing of odor identification, odor discriminationand olfactory threshold, Chem. Senses 22, 39–52.
Hupé, J.-M., Bordier, C. and Dojat, M. (2012). The neural bases of grapheme–color synesthesiaare not localized in real color-sensitive areas, Cereb. Cortex 22, 1622–1633.
Jones, C. L., Gray, M. A., Minati, L., Simner, J., Critchley, H. D. and Ward, J. (2011). The neu-ral basis of illusory gustatory sensations: two rare cases of lexical–gustatory synaesthesia,J. Neuropsychol. 5, 243–254.
Nunn, J. A., Gregory, L. J., Brammer, M., Williams, S. C., Parslow, D. M., Morgan, M. J.,Morris, R. G., Bullmore, E. T., Baron-Cohen, S. and Gray, J. A. (2002). Functional magneticresonance imaging of synesthesia: activation of V4/V8 by spoken words, Nat. Neurosci. 5,371–375.
Paulesu, E., Harrison, J., Baron-Cohen, S., Watson, J. D., Goldstein, L., Heather, J., Frackowiak,R. S. and Frith, C. D. (1995). The physiology of coloured hearing. A PET activation studyof colour-word synaesthesia, Brain 118, 661–676.
Ramachandran, V. S. and Hubbard, E. M. (2001). Psychophysical investigations into the neuralbasis of synaesthesia, Proc. R. Soc. B Biol. Sci. 268(1470), 979–983.
Rich, A. N., Williams, M. A., Puce, A., Syngeniotis, A., Howard, M. A., McGlone, F. andMattingley, J. B. (2006). Neural correlates of imagined and synaesthetic colours, Neuropsy-chologia 44, 2918–2925.
Rothen, N. and Meier, B. (2013). Why vicarious experience is not an instance of synaesthesia,Front. Hum. Neurosci. 7, 128. DOI:10.3389/fnhum.2013.00128
Rouw, R., Scholte, H. S. and Colizoli, O. (2011). Brain areas involved in synaesthesia: a review,J. Neuropsychol. 5, 214–241.
Shen, J., Kassir, M. A., Wu, J., Zhang, Q., Zhou, S., Xuan, S. Y., Li, Q., Ye, Y. and Hu, J.(2013). MR volumetric study of piriform-cortical amygdala and orbitofrontal cortices: theaging effect, PLoS ONE 8, e74526. DOI:10.1371/journal.pone.0074526
246 J. S. Chan et al. / Multisensory Research 27 (2014) 225–246
Simmons, W. K., Martin, A. and Barsalou, L. W. (2005). Pictures of appetizing foods activategustatory cortices for taste and reward, Cereb. Cortex 15, 1602–1608.
Simner, J. (2012). Defining synaesthesia, Br. J. Psychol. 103, 1–15.Simner, J. and Logie, R. H. (2008). Synaesthetic consistency spans decades in a lexical–
gustatory synaesthete, Neurocase 13, 358–365.Simner, J., Mulvenna, C., Sagiv, N., Tsakanikos, E., Witherby, S. A., Fraser, C., Scott, K. and
Ward, J. (2006). Synaesthesia: the prevalence of atypical cross-modal experiences, Percep-tion 35, 1024–1033.
Small, D. M., Gerber, J. C., Mak, Y. E. and Hummel, T. (2005). Differential neural responsesevoked by orthonasal versus retronasal odorant perception in humans, Neuron 47, 593–605.
Spence, C. (2011). Crossmodal correspondences: a tutorial review, Atten. Percept. Psychophys.73, 971–995.
Stevenson, R. J. and Case, T. I. (2005). Olfactory imagery: a review, Psychol. Bull. 12, 244–264.
Stevenson, R. J. and Tomiczek, C. (2007). Olfactory-induced synesthesias: a review and model,Psychol. Bull. 133, 294–309.
Talairach, J. and Tournoux, P. (1988). Co-Planar Stereotaxic Atlas of the Human Brain. Thieme,New York, NY, USA.
Ward, J. and Mattingley, J. B. (2006). Synaesthesia: an overview of contemporary findings andcontroversies, Cortex 42, 129–136.
Ward, J., Simner, J. and Auyeung, V. (2005). A comparison of lexical-gustatory and grapheme-colour synaesthesia, Cogn. Neuropsychol. 22, 28–41.
Copyright © 2022 FDOKUMEN