Supporting group work in crisis management: visually mediated human – GIS – human dialogue
22
Environment and Planning B: Planning and Design (Forthcoming) Supporting Group Work in Crisis Management: Visually Mediated Human-GIS-Human Dialogue Alan M. MacEachren GeoVISTA Center and Department of Geography, Penn State University, University Park, PA 16802 Email: [email protected] Guoray Cai GeoVISTA Center and School of Information Science and Technology, Penn State University, University Park, PA 16802. Email: [email protected] Abstract. Geospatial information is a fundamental component of many crisis management activities. However, current geospatial technologies do not support work by crisis management personnel, most of whom are not technology specialists – the technologies require that the user learn the system’s language. In addition, geospatial technologies are not “collaboration- friendly” – they impede rather than facilitate group work. This paper addresses both issues by presenting (1) a theoretical framework for understanding the roles of visual mediation in map-supported human-human dialogues, and (2) a computational approach for enabling such roles in collaborative spatial decision-making contexts. Citing our initial implementation of a map- mediated collaborative environment, DAVE_G system (a natural, multimodal, dialogue-enabled interface to GISystems), we model human-GIS and human-GIS-human dialogues as complex visual-cognitive signification processes where maps become dynamic facilitators. Using a scenario simulating two crisis managers dealing with a major nuclear release event, we demonstrate how visual display (in DAVE_G) actively mediates human-human dialogue directed to situation assessment and action planning in real applications. 1. Introduction Crisis management is a time-critical and collaborative activity that involves multiple individuals and organizations sharing information, expertise, and resources in support of rapid situation assessment and decision-making activities. Geospatial information is fundamental to supporting crisis management at scales from the local to the global. The potential roles of Geographical Information Systems (GIS) in providing this information to crisis managers have been detailed repeatedly (Cutter, 2003; Mondschein, 1994; Kumar et al. 1999) . In spite of the potential, several impediments exist to widespread utilization of GIS in crisis management activities (Zerger and Smith 2003). These include limited data and software interoperability, lack of mechanisms for immediate integration of real time geospatial data into the crisis management process, difficult to use GIS interfaces that force crisis managers to rely on GIS technicians to provide necessary information, and lack of support for same- and different-place group work. Our research addresses the latter two issues. Specifically, we are developing a conceptual approach to natural, multimodal, dialogue-enabled interfaces for GIS that will make GIS more responsive to non- specialist user needs and to supporting group work with geographical information. In this paper, we focus on map-mediated, dialogue-enabled human-human communications in the same place and at the same time. Central to the dialogue-enabled interaction is a dialogue management component which serves as a semantic mediator and information flow controller between human users and the GIS. This dialogue
Transcript of Supporting group work in crisis management: visually mediated human – GIS – human dialogue
Environment and Planning B: Planning and Design (Forthcoming)
Supporting Group Work in Crisis Management: Visually Mediated Human-GIS-Human Dialogue
Alan M. MacEachren GeoVISTA Center and Department of Geography, Penn State University, University Park, PA 16802 Email: [email protected] Guoray Cai GeoVISTA Center and School of Information Science and Technology, Penn State University, University Park, PA 16802. Email: [email protected]
Abstract. Geospatial information is a fundamental component of many crisis management activities. However, current geospatial technologies do not support work by crisis management personnel, most of whom are not technology specialists – the technologies require that the user learn the system’s language. In addition, geospatial technologies are not “collaboration-friendly” – they impede rather than facilitate group work. This paper addresses both issues by presenting (1) a theoretical framework for understanding the roles of visual mediation in map-supported human-human dialogues, and (2) a computational approach for enabling such roles in collaborative spatial decision-making contexts. Citing our initial implementation of a map-mediated collaborative environment, DAVE_G system (a natural, multimodal, dialogue-enabled interface to GISystems), we model human-GIS and human-GIS-human dialogues as complex visual-cognitive signification processes where maps become dynamic facilitators. Using a scenario simulating two crisis managers dealing with a major nuclear release event, we demonstrate how visual display (in DAVE_G) actively mediates human-human dialogue directed to situation assessment and action planning in real applications.
1. Introduction Crisis management is a time-critical and collaborative activity that involves multiple individuals and organizations sharing information, expertise, and resources in support of rapid situation assessment and decision-making activities. Geospatial information is fundamental to supporting crisis management at scales from the local to the global. The potential roles of Geographical Information Systems (GIS) in providing this information to crisis managers have been detailed repeatedly (Cutter, 2003; Mondschein, 1994; Kumar et al. 1999) . In spite of the potential, several impediments exist to widespread utilization of GIS in crisis management activities (Zerger and Smith 2003). These include limited data and software interoperability, lack of mechanisms for immediate integration of real time geospatial data into the crisis management process, difficult to use GIS interfaces that force crisis managers to rely on GIS technicians to provide necessary information, and lack of support for same- and different-place group work.
Our research addresses the latter two issues. Specifically, we are developing a conceptual approach to natural, multimodal, dialogue-enabled interfaces for GIS that will make GIS more responsive to non-specialist user needs and to supporting group work with geographical information. In this paper, we focus on map-mediated, dialogue-enabled human-human communications in the same place and at the same time. Central to the dialogue-enabled interaction is a dialogue management component which serves as a semantic mediator and information flow controller between human users and the GIS. This dialogue
MacEachren and Cai
component (initially developed to support human-system interaction) has been extended to provide mechanisms to support group work. We have implemented aspects of the approach and have begun to assess its use and usability(MacEachren, Cai et al. 2003; MacEachren and Brewer 2004; Cai, Wang et al. 2005; MacEachren, Cai et al. 2005; Cai, Sharma et al. forthcoming).
In the previous work cited above, we have focused on interpretation of multimodal requests from users to a GIS. The goals in this work have been to: (a) model the strategies humans use to specify their geospatial information needs through language and gesture and (b) using these models, to create a natural interface that supports easy information retrieval from a GIS. Our more general goal is to support more efficient and richer dialogue between users and the system and among users enabled by the system. Through the work carried out thus far, we have recognized a need to develop additional strategies that leverage the flexible map-based display provided by GIS.
While there has been considerable past attention in multiple domains to both dialogue-based interfaces and group work with GIS, neither body of research had directed much attention to the importance of visual display, or to maps specifically, as a component of dialogue or a mediator of group work with GIS and there has been limited work directed toward integrating advances in dialogue-based interfaces with that in group-enabled GIS. We believe that treating the visual, map-based display as part of an ongoing dialogue (rather than a simple repository of information) may be the key to computer-supported group work with geospatial information. In this paper, therefore, we focus on the use of visual representation as a mediator for dialogue, both between a human and the system and among humans.
In the next section, we present a theoretical framework for conceptualizing the roles of visual display in facilitating effective human-human collaboration involving geographical information. The framework is based on cognitive and social theories relevant to human-machine and human-human communication, with an emphasis on distributed cognition and the role of shared artifacts in facilitating group work. Then, in section 3, we describe our prototype system, DAVE_G (Dialogue-Assisted Virtual Environment for Geoinformation), and articulate the associated cognitive-semiotic principles towards enabling human-human task-oriented dialogues. In section 4, we then outline the computational framework for our dialogue agent, GeoDialogue, which is responsible for intelligence gathering and implementation of visual mediation functions. We also provide analyses of a sample dialogue to exemplify three distinct roles of visual displays in dialogue processing, and to demonstrate how GeoDialogue recognizes the intended role of visual displays and reasons about user intentions based on recognition of these roles. We conclude by a brief discussion of challenges and plans for further research.
2. Conceptual Framework There is a vast literature relevant to group work with geospatial information and technologies – literature that ranges from a focus on developing methods and technologies that enable group work to a focus on the process of that work. For recent reviews of this interdisciplinary literature from a GIScience perspective, see: (MacEachren 2000, Jankowski and Nyerges 2001, MacEachren 2001).
Here, we draw upon and synthesize a portion of this research to begin building a conceptual basis for understanding and supporting visually mediated human-GIS-human dialogue. We begin by outlining the roles of visual signification in group work with geospatial information. Then, we consider the potential of two related theoretical perspectives (distributed cognition and boundary objects) to provide a framework for understanding and enhancing these roles of visual representation to support geospatial dialogue.
Environment and Planning B: Planning and Design (Forthcoming)
2.1 Roles of visual signification in group work with geospatial information
MacEachren and Brewer (2004) propose three functions for visual signification in group work with geospatial information (their ideas extend previous work focused on the role of external artifacts in collaborative urban design (Arias, Eden et al. 2000)). Visual signification can be used as: shared objects to talk about (to signify the object of collaboration), shared objects to think with (to signify components of group knowledge and thinking), and shared objects to coordinate perspectives and actions (to signify components of group activity). Each is discussed below briefly (a more detailed account of each can be found in (MacEachren, Cai et al. 2005) ).
Objects to talk about: In a geospatial application context, maps are often the primary representation of the real world referents – thus of the object of dialogue among participants in group activities. In the context of crisis management, for example, maps depict the location of people and facilities at risk as well as features and facilities that act as resources for reacting to that risk. Many other forms of visual representation are also important objects of dialogue. For example, remotely sensed imagery and real-time photos and video generated by GPS-enabled devices can provide current, georeferenced information about a developing crisis situation and can support discussion of actions that need to be taken on the ground (e.g., redirecting traffic, getting emergency vehicles to a collapsed building, etc).
Objects to think with: In addition to signifying the objects of group work directly, maps (and geospatial images) serve an important role in framing group thinking and supporting analytical reasoning. Geospatial representations provide a framing function by delineating the geographic and temporal bounds of the problem domain as well as the themes around which consideration and discussion is focused. Thus, the display of geospatial information, particularly in a dynamic representation that participants can manipulate, provides structure for the processes of comparing perspectives, constructing knowledge and applying that knowledge to decision-making. Visual geospatial and other representations also can also enable the analytical reasoning by supporting analyst operations on reasoning artifacts (“tangible pieces of information that contribute to reaching defensible judgments”) and by supporting the process of “collaborative-competitive dialogue (in which team members or different teams work toward the same goals but pose competitive explanations and solutions” [National Visualization and Analytics Center, 2005 #63, p. 36 and p. 55, respectively]).
Objects to coordinate perspectives and actions: Beyond direct support for dialogue (or argumentation), visual representations can be used to create a social framework within which dialogue is facilitated, creating what Erickson and Kellogg (2000) call social translucence. Socially translucent systems make participants in group activities, and their behaviors, visible to one another – in ways that respect privacy, balance the advantages of independent and group work, and lead to “deep, coherent, and productive” communication. The goal of technology in this context is to enhance user awareness of relevant activities by collaborators (Carroll, Neale et al. 2003). For geospatial work, displays must go beyond simply depicting the place and features that are the focus of work to also support activity awareness and coordinated actions.
2.2 Distributed cognition The roles of visual signification in group work can (potentially) be understood through the perspective of distributed cognition. The theory of distributed cognition proposes that cognition in not completely individual nor completely “in-the-head.” Instead, cognition is viewed as distributed among actors and artifacts (Salomon 1993). This perspective on cognition has been adopted as a framework for understanding group work in a variety of contexts. These include: complex team problem solving in shared information spaces (McNeese et al. 2002), the development of team situation awareness for
MacEachren and Cai
emergency operations (Artman 1998), and the process of collaborative urban design (Arias et al. 2000), among others.
As part of an argument for distributed cognition as a new foundation for human-computer interaction research, Hollan, et al (2000) identify three categories of distribution: across members of a social group, between internal cognitive processes and external artifacts, and over time. All are critical components of the cognitive processes that underpin group work with geospatial information. Here we focus on the role of external artifacts, particularly the visual display.
Visual representations (in the form of diagrams, graphs, and maps) have long been assumed to facilitate thinking and problem solving and research has focused on how visual representation interacts with human cognition to do so (Larkin and Simon 1987). Scaife and Rogers (1996) apply a distributed cognition framework to explicating the processes by which visual representation can augment human cognition. Specifically, they propose a three part analytical framework from which to explore and understand the process of what they term external cognition (external cognition can be considered distributed cognition that off loads part of the cognitive process to external artifacts).
First, visual representations can support computational offloading, reducing the cognitive effort required to solve some problem (e.g., it is much easier to “see” which schools are within the projected danger zone for a hurricane path from a map than from a table listing schools and their geographic coordinates or zip codes).
Second, the form of visual representations can have a substantial impact on helping to structure a problem in a way that makes it comprehensible (or not) – they label this re-representation. The implication here (although not stated by Scaife and Rogers) is that environments that support the transformation among visual representations of the same information will provide increased potential for both individual and group understanding. Their re-representation is quite similar to the geovisualization process of re-expression articulated by DiBiase et al. (1992).
Third, visual representations can provide graphical constraining – they put limits on the kinds of inferences and interpretations that can be made about the world that is represented.
We will demonstrate some examples (in section 4.1) where visual displays externalize cognition on complex spatial problems.
2.3 Boundary objects Most of the work grounded in a distributed cognition perspective, not surprisingly, focuses on how cognition is distributed (to external representations, across individuals in a group, or over time). Thus, when visual representations have been considered, the focus has been primarily on their role as “objects to think with”. A complementary perspective that supports exploration of the role of visual representation as “objects to talk about” is provided by the concept of boundary objects. This theoretical perspective (sometimes applied within a distributed cognition framework) is focused on the process of developing shared understanding, particularly among collaborators who address a problem or knowledge domain from initially different perspectives.
In a relevant study focused on visual display, Henderson (1991) contends that, in the context of engineering design, sketches and drawings can serve as boundary objects that enable the elicitation and group manipulation of tacit knowledge. She reports on a detailed case study of the unanticipated restructuring of a machine production process that resulted from introduction of CAD tools, a restructuring that is attributed to the role of the new CAD drawings as boundary objects. These drawings
Environment and Planning B: Planning and Design (Forthcoming)
allowed subgroups in the process to by-pass traditional communication and decision making structures. The study illustrates the power of visual signification devices to provide the scaffolding on which work practices are built and the importance of understanding the multiple roles that these visual representations have in group work.
The roles of geospatial boundary objects have been considered in variety of contexts. Harvey and Chrisman (1998) adopt the boundary object concept as the theoretical framework to support an empirical study of cross-agency interaction focused on building, sharing, and collaboratively applying geospatial databases. In research focused on public participation in urban design and planning, Arias, Fischer, and colleagues have developed group work environments that mix virtual and real objects to talk about (Arias and Fischer 2000, Fischer 2002). They have implemented a table-top group work environment for public participation in planning that provides users with an interface to computer simulations (depicted in the display space) through manipulation of three-dimensional, physical objects (representing buildings and other features). Participants can construct and manipulate neighborhoods and these constructions become the boundary objects through which a group can work together to frame and resolve a community development problem.
While not specifically citing the concept of boundary objects, McGee and colleagues (McGee and Cohen 2001, McGee et al. 2001) report on complementary research directed to augmenting paper maps with digital enhancements (essentially the opposite approach to that of Arias and Fischer who support use of physical artifacts within a virtual display). McGee emphasizes the important role that language plays (in conjunction with visible artifacts) as a mechanism to bridge contexts. In the case of their digitally augmented paper maps, abstract objects added to the map work space take on meaning through the dialogue carried on about them (e.g., a drawn line becomes a road or a river or a rectangle becomes a medical facility or military barracks based on spoken labels). Thus, the abstract objects combined with language act as boundary objects to enable shared understanding.
3. Visual Support for Dialogue-Assisted Human-GIS Interaction in DAVE_G In this section, we introduce the Dialogue-Assisted Visual Environment for Geoinformation (DAVE_G), a prototype multimodal interface to GIS. In implementing DAVE_G, and extending it for support of group work, we have integrated the conceptual perspectives on device-mediated group work described above with a cognitive-semiotic approach to map-based representation and sharing of geospatial information (outlined briefly below). Our initial application context is emergency preparedness and crisis management. Some technical details about the DAVE_G system has been published elsewhere (Rauschert et al. 2002, Sharma et al. 2003). In this section, we will focus on the principles of supporting visual mediation of human-GIS interaction within DAVE_G.
3.1 Crisis Management Crisis management requires timely compilation and analysis of a large number of spatial data sources for situation assessment and decision-making. Such tasks are commonly done by a group of people (crisis managers and first responders) who need to access geospatial information while they monitor the changing situation, communicate about that situation, and make decisions. While current GIS has the potential to support key crisis management activities, in practice it often impedes and interferes with user tasks. One reason for this is that using current GIS requires substantial knowledge of the software and attention to using it, knowledge that emergency managers often do not have and attention that should be given to the task at hand. In addition, the use of keyboard, mouse, and small computer displays in desktop GIS environments does not support productive group work, particularly with large screen

MacEachren and Cai
displays common in emergency operation centers (EOCs); the combination of single-user controls and small screen size does not support even the kinds of direct interaction typical with a large paper map.
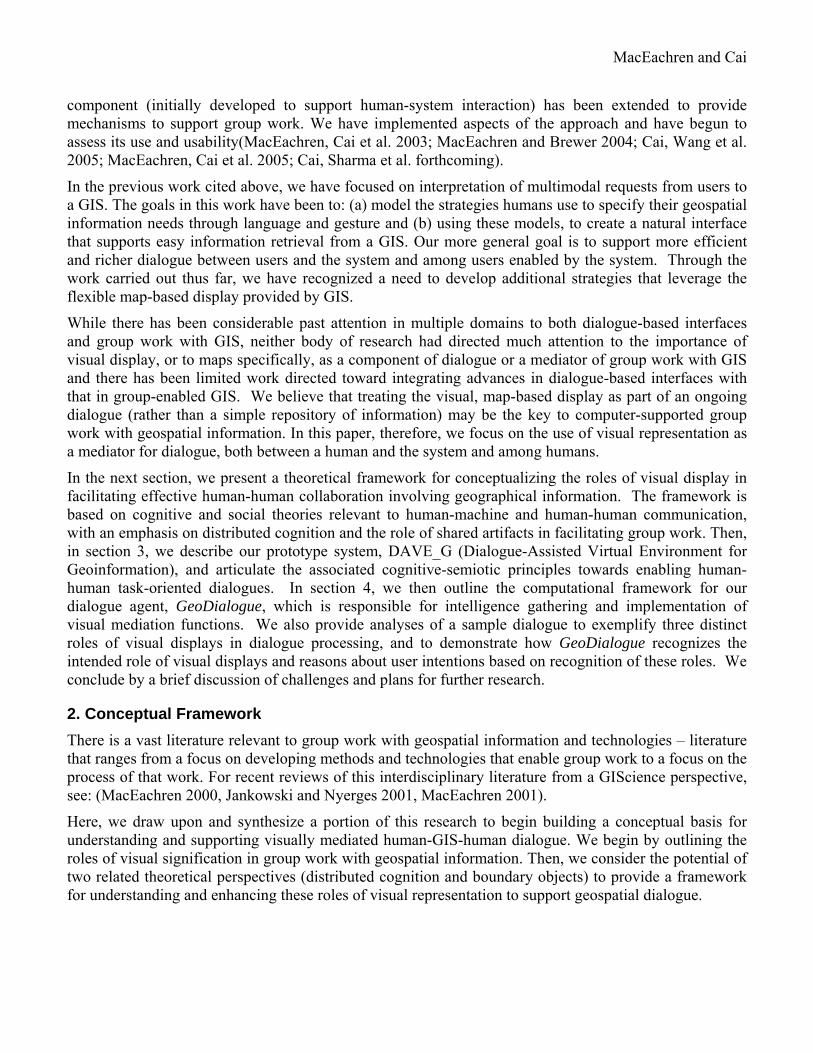
Current use of GIS for crisis management typically requires a GIS technician to be part of the crisis management team, to translate user needs into GIS commands (Frank and Mark 1991; Shiffer 1998). While the group works, the GIS technician typically sits at the computer console and attempts to interpret users’ information needs (through overhearing conversations among others or through explicit requests), then manipulate the map display accordingly. A caricature of how this visually-supported dialogue might work in a typical crisis management decision-making situation is shown in figure 2.
Limitations of the above situation for meeting the needs of crisis managers are: (1) a GIS technician is required to support each team of users, the users cannot interact directly with the display elements (thus they cannot participate in natural dialogue since work must be strictly sequential); (2) the system does not support activity awareness (distinctions among actions by different users is not provided), and (3) spatial aspects of cognition are distributed to the display but temporal aspects are not (the system does not help users remember what they have seen or done).
To address some of these limits, we have designed and begun implementing an environment (DAVE_G) that supports one or more users through a dialogue-based interface and that uses visual signification in the three roles outlined above (as an object to talk about, think with, and support activity). The use of a large screen display in DAVE_G creates a shared representation of the world situation (a shared object to talk/collaborate about) and a shared workspace for group actions (framing the dialogue geographically and socially). Next, we provide a brief overview of this system, DAVE_G.
DAVE_G transfers some of the communication and cognitive skills of a GIS technician directly into the computer system. When there is an information need, an emergency manager can interact with DAVE_G
Figure 2. A typical emergency operations center scenario in which two emergency managers are discussing an approaching hurricane and necessary evacuation procedures (The Director’s comments are in green, the transportation engineer’s comments are in beige, and the technicians prompts about new information being presented are in blue.).

Environment and Planning B: Planning and Design (Forthcoming)
as if she or he is interacting with another human (a GIS technician). With the use of natural spoken language and free-hand gestures (for details, see (Rauschert, Agrawal et al. 2002; Sharma, Yeasin et al. 2003)), an environment like DAVE_G has the potential of supporting group collaboration and communication for information access and developing shared understanding among participants (both human and machine)
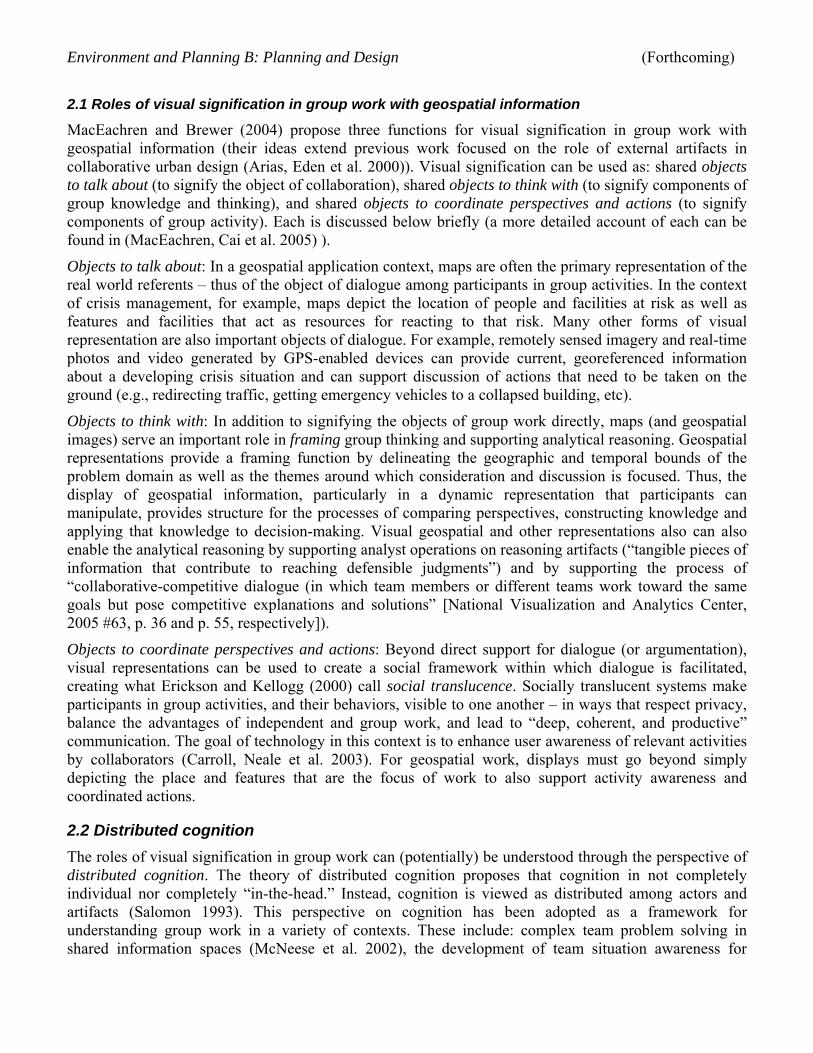
3.2 Cognitive-Semiotic Theory of Human-GIS Dialogues The DAVE_G approach for facilitating Human-Computer Dialogue (HCD) draws upon an evolving cognitive-semiotic theoretical framework for geospatial information representation and use (MacEachren 1995). The core concept of the framework is that there is a semiotic basis to the process of human understanding; that perception and cognition of all phenomena are mediated through a system of signs (Saussure 1916, Pierce 1955). A sign is a relationship, depicted by Pierce as a triangle (figure 3), where some signifier (a “sign-vehicle” – S-V in the figure) stands for a referent in the world, and through that signifier a concept (an “interpretant”) is communicated and understood (Deely 1990). The signifier encodes an idea via language, image, gesture, or through the schema of an information system. Assembling and communicating information is the act of ‘weaving’ data into a set of integrated signifiers that, linked through a semantic framework, convey a concept successfully (e.g., a cartographer using symbols to build a map). Similarly, reading and interpreting information is the process of perceiving a signifier or set of them and from it/them building a mental model of a concept.
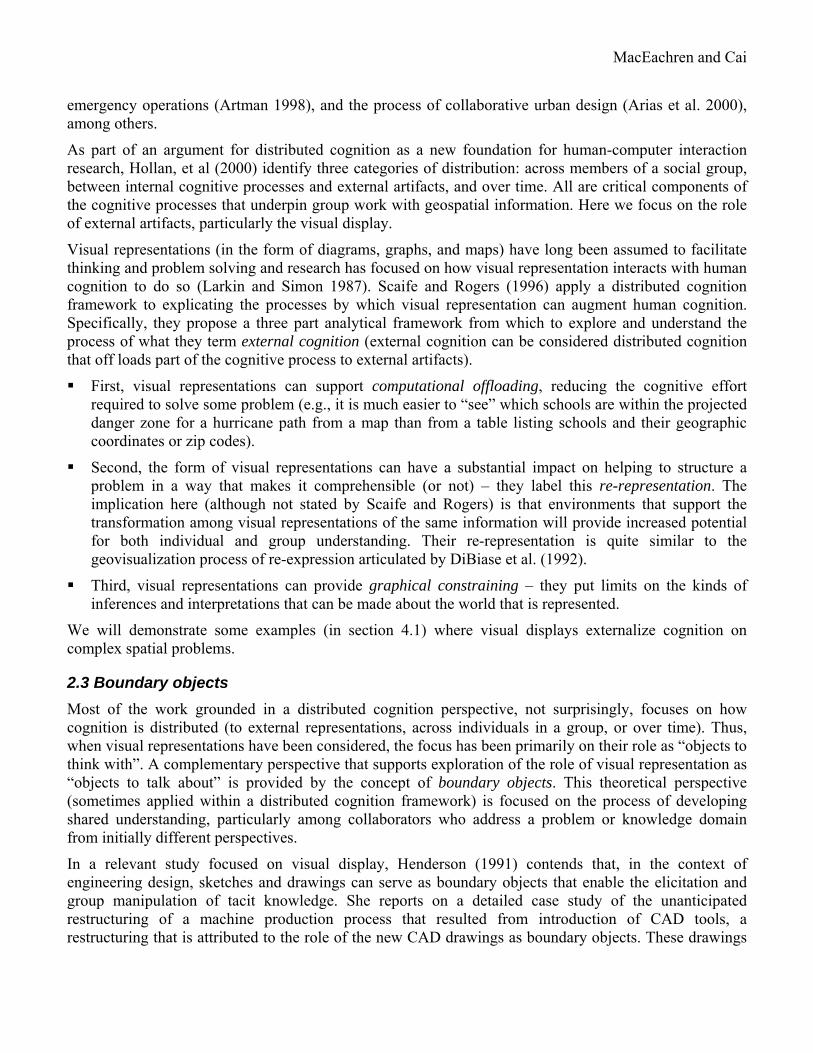
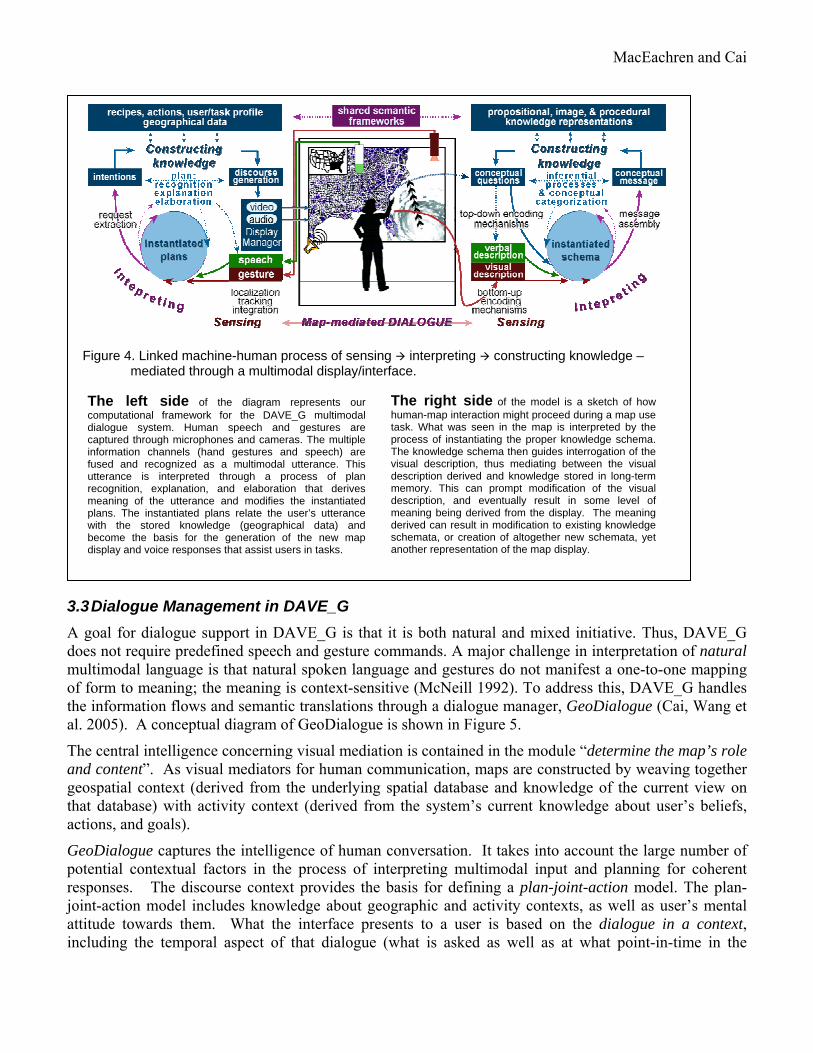
Multimodal interaction with visually presented geospatial information involves complex visual-cognitive signification process working in two directions. Figure 4 depicts the complementary nature of (a) human signification, sensing, interpreting, and knowledge construction processes (right) and (b) the computational equivalent implemented in DAVE_G (left). As multiple human collaborators are added, the multimodal environment becomes a mediator for sharing knowledge and perspectives on problems among the collaborators (imagine multiple versions of the sensing-that interpreting constructing-knowledge process on the right).
Our approach to human-GIS interaction, based on map-mediated dialogues, is fundamentally different from traditional map access and use in GISystems. It reflects the philosophy that maps as devices to support work (rather than being simple information sources) should act as dynamic facilitators to individual and distributed cognition, and that they can accomplish this (in part) by mediating human-system and human-human dialogue. As noted above, maps (and related visual representations) support three roles for visual signification: (1) objects of dialogue/work, (2) components of external cognition that provide scaffolding for that dialogue/work, and (3) devices representing group activity – that frame the social contexts for dialogue/work. Visual displays in our approach act as both externalized representations of human thinking and active participants in that thinking. To do so, they should 'listen' to users and yield a significant amount of control to the user who is actively creating representations of his/her ideas as part of an ongoing dialogue. In other words, the process of generating map displays must be mixed-initiative, allowing a productive division of roles among human actors and the system.
Figure 3. Semiotic triangle
S-V Referent
Interpretant
MacEachren and Cai
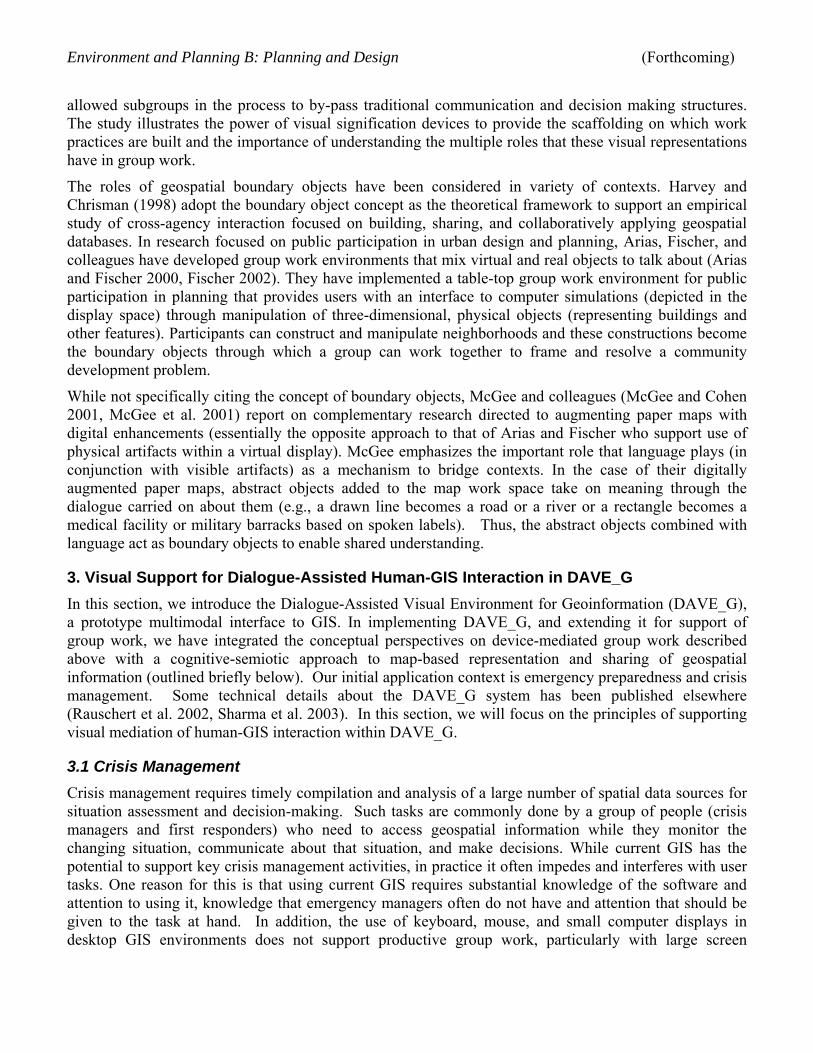
3.3 Dialogue Management in DAVE_G A goal for dialogue support in DAVE_G is that it is both natural and mixed initiative. Thus, DAVE_G does not require predefined speech and gesture commands. A major challenge in interpretation of natural multimodal language is that natural spoken language and gestures do not manifest a one-to-one mapping of form to meaning; the meaning is context-sensitive (McNeill 1992). To address this, DAVE_G handles the information flows and semantic translations through a dialogue manager, GeoDialogue (Cai, Wang et al. 2005). A conceptual diagram of GeoDialogue is shown in Figure 5.
The central intelligence concerning visual mediation is contained in the module “determine the map’s role and content”. As visual mediators for human communication, maps are constructed by weaving together geospatial context (derived from the underlying spatial database and knowledge of the current view on that database) with activity context (derived from the system’s current knowledge about user’s beliefs, actions, and goals).
GeoDialogue captures the intelligence of human conversation. It takes into account the large number of potential contextual factors in the process of interpreting multimodal input and planning for coherent responses. The discourse context provides the basis for defining a plan-joint-action model. The plan-joint-action model includes knowledge about geographic and activity contexts, as well as user’s mental attitude towards them. What the interface presents to a user is based on the dialogue in a context, including the temporal aspect of that dialogue (what is asked as well as at what point-in-time in the
Figure 4. Linked machine-human process of sensing interpreting constructing knowledge – mediated through a multimodal display/interface.
The right side of the model is a sketch of how human-map interaction might proceed during a map usetask. What was seen in the map is interpreted by the process of instantiating the proper knowledge schema. The knowledge schema then guides interrogation of the visual description, thus mediating between the visual description derived and knowledge stored in long-term memory. This can prompt modification of the visual description, and eventually result in some level of meaning being derived from the display. The meaning derived can result in modification to existing knowledge schemata, or creation of altogether new schemata, yet another representation of the map display.
The left side of the diagram represents our computational framework for the DAVE_G multimodal dialogue system. Human speech and gestures are captured through microphones and cameras. The multiple information channels (hand gestures and speech) are fused and recognized as a multimodal utterance. This utterance is interpreted through a process of plan recognition, explanation, and elaboration that derives meaning of the utterance and modifies the instantiated plans. The instantiated plans relate the user’s utterance with the stored knowledge (geographical data) and become the basis for the generation of the new map display and voice responses that assist users in tasks.

Environment and Planning B: Planning and Design (Forthcoming)
dialogue it is asked). We use a shared plan and tractable context dependent schemes for dynamic update of the knowledge about the user. Below, we focus on the aspects of GeoDialogue that are particularly relevant to understanding and supporting the external cognitive process of visually mediated human-human dialogue.
Successful mediation of human-human dialogue requires situated understanding of the role of maps within the message structures of a dialogue. In GeoDialogue, we have implemented specific mechanisms to maximize the above roles of visual displays. Our user modeling subsystem within GeoDialogue (as detailed in (Cai et al. 2005)) keeps track of the states of collaboration and knowledge sharing and guides the process of display generation.
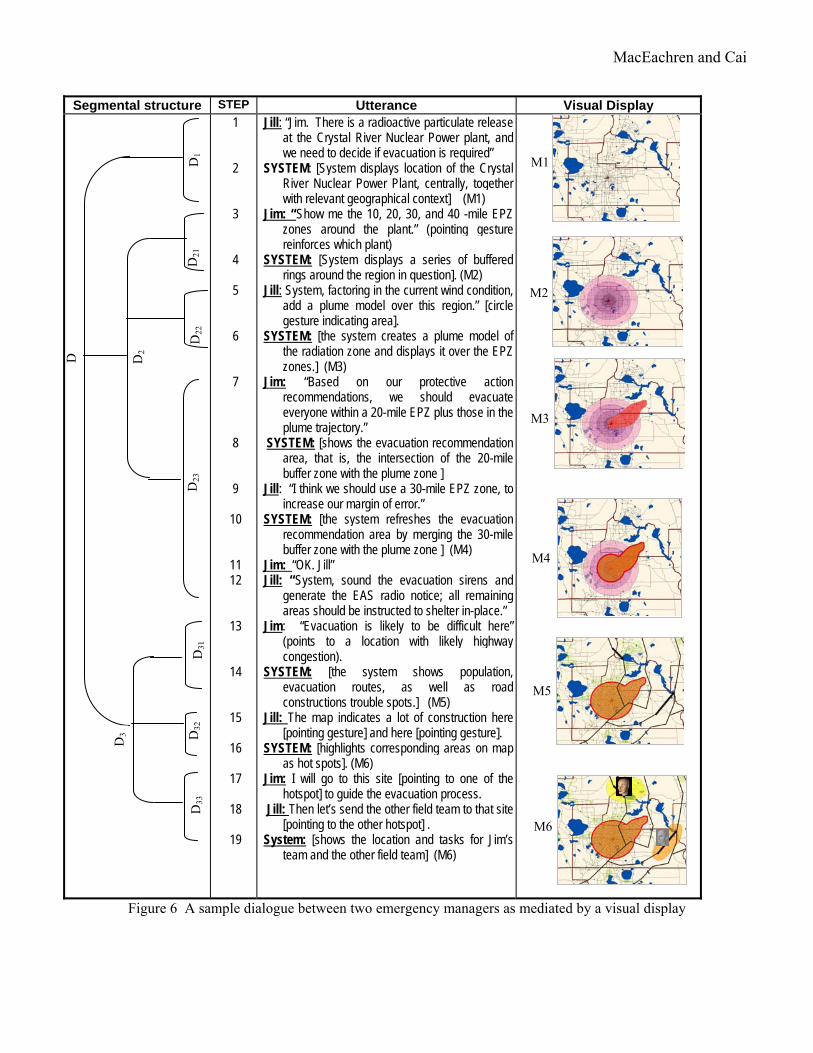
4. Enabling Map-mediated Human-human Dialogues We have implemented methods to enable map-mediated human-human dialogues in DAVE_G environment. Figure 6 show an example of map-mediated human-human dialogues that is currented supported by DAVE_G. Before introducing the computational principles, we first provide an intuitive analysis of this dialogue, linking back to the conceptual framework established in section 2.
4.1 An Analysis of a Sample Dialogue A structured analysis of a sample dialogue is provided here to illustrate the principles of our visual mediation approach. The dialogue in Figure 6 is based on the following scenario:
A radioactive particulate release event has been reported from the Crystal River nuclear power plant, potentially causing disasters to the neighborhoods. Jim and Jill are part of an emergency response team in an EOC (Emergency Operation Center) where a GIS-driven wall display provides a shared virtual environment for information access, situation depiction, and decision support (note: this is what DAVE_G is designed for). While Jim and Jill discuss the evacuation plan, the computer system ‘overhears’ their conversation (through sensing human speech and gestures) and participates in the dialogue by presenting visual information that plays certain mediating roles for human dialogue. DAVE_G combines visual and audio (thus multimodal) signification in its responses, but we focus just on the visual signification in this example.
We have redrawn the dialogue of Figure 6 into Figure 7 for the purpose of showing a clear correspondence between dialogue moves and objects on visual displays.
Query Actions map generation
Conceptual messages and
Questions
Text, Voice Map & legend
Geographical Information Portal
Dialogue Response
Figure 5. Dialogue processing during map-mediated interactions
Sensing and parsing of multimodal
utterances
Interpreting meaning and
intention
Determine the role and content
of map
Dialogue Context (PlanGraph)
Knowledge Base Grammar and
semantics Goals, Actions and
recipes Database Semantics
MacEachren and Cai
Segmental structure STEP Utterance Visual Display 1
2 3 4 5 6 7 8 9
10
11 12
13
14
15
16
17
18
19
Jill: “Jim. There is a radioactive particulate release at the Crystal River Nuclear Power plant, and we need to decide if evacuation is required”
SYSTEM: [System displays location of the Crystal River Nuclear Power Plant, centrally, together with relevant geographical context] (M1)
Jim: “Show me the 10, 20, 30, and 40 -mile EPZ zones around the plant.” (pointing gesture reinforces which plant)
SYSTEM: [System displays a series of buffered rings around the region in question]. (M2)
Jill: System, factoring in the current wind condition, add a plume model over this region.” [circle gesture indicating area].
SYSTEM: [the system creates a plume model of the radiation zone and displays it over the EPZ zones.] (M3)
Jim: “Based on our protective action recommendations, we should evacuate everyone within a 20-mile EPZ plus those in the plume trajectory.”
SYSTEM: [shows the evacuation recommendation area, that is, the intersection of the 20-mile buffer zone with the plume zone ]
Jill: “I think we should use a 30-mile EPZ zone, to increase our margin of error.”
SYSTEM: [the system refreshes the evacuation recommendation area by merging the 30-mile buffer zone with the plume zone ] (M4)
Jim: “OK. Jill” Jill: “System, sound the evacuation sirens and
generate the EAS radio notice; all remaining areas should be instructed to shelter in-place.”
Jim: “Evacuation is likely to be difficult here” (points to a location with likely highway congestion).
SYSTEM: [the system shows population, evacuation routes, as well as road constructions trouble spots.] (M5)
Jill: The map indicates a lot of construction here [pointing gesture] and here [pointing gesture].
SYSTEM: [highlights corresponding areas on map as hot spots]. (M6)
Jim: I will go to this site [pointing to one of the hotspot] to guide the evacuation process.
Jill: Then let’s send the other field team to that site [pointing to the other hotspot] .
System: [shows the location and tasks for Jim’s team and the other field team] (M6)
Figure 6 A sample dialogue between two emergency managers as mediated by a visual display
M1
M2
M3
M4
M5
M6
D
D1
D2
D3
D21
D
22
D23
D
33
D32
D
31

Environment and Planning B: Planning and Design (Forthcoming)
An analysis of the above dialogue reveals that visual displays served multiple roles in mediating conversations/collaborative work between the two humans, Jim and Jill. These roles match well with those categories of visual signification, external cognition, and boundary objects as mentioned in the section 2.
4.1.1 Map displays as visual signification mechanisms
Signifying objects of collaboration. A key goal for visual signification here is to facilitate shared situation assessment by Jill and Jim. In Figure 6, maps signify the location of the Crystal River Nuclear Power Plant (M1), the dynamics of the pollution (M4), the population distribution (M5), and the evacuation routes available in the area, which are objects of central importance to emergency response in case of a radioactive particulate release.
Signifying group thinking. In this role, maps (as a type of visual displays) serve as a medium and resource for structuring human thinking. They are tangible representations that prompt mental representations (thus are stimuli for accessing memory, constructing new knowledge, and representing the evolution of that knowledge). For example, the display of map M1 in Figure 6 immediately creates a shared workspace which delineates a common spatial frame of references for the group (Jim and Jill) to construct a model of the problem. The map features (roads, township boundaries, water bodies, etc) are not directly part of the task, but they provide the necessary background knowledge of the area that supports the discussion of the situation. Group thinks also often times generate conceptual objects that must be shared, integrated, or related. This is supported in our system by allowing the conceptual objects to be concretized (or externalized) into visual objects and by keeping a trace of such group thinking in the visual workspace. Such is the case in the dialogue D2 where maps M2, M3, M4 visually signify EPZ zones, plume models,
Figure 7 Correspondence between dialogue moves and objects on visual displays
The utterances of Jim and Jill are shown in the call-out box, color-coded as blue and Green, respectively. The tip of each call-out box points to the visual objects that get displayed as the result of processing that utterance. The number assigned to each box indicates the temporal sequence of the utterance within the whole dialogue.
(1). There is a radioactive particulate release at the Crystal River Nuclear power plant
(2). Show me the 10, 20, 30, and 40 -mile EPZ zones around the plant
(3). Factoring in the current wind condition, add a plume model over this region
(5) I suggest using 30-mile EPZ zone, since the radiation level is quite high in this case
(4). Based on our protective action recommendations, we should evacuate everyone within a 20-mile EPZ and those covered by the plume model
(6) System, sound the sirens around and relay the evacuation zones on the EAS radio; all remaining areas will have to in-place shelter
(7) Evacuation is likely to be difficult here (points to a location with likely highway congestion)
(8) The map indicates a lot of construction here [pointing gesture] and here
(9) I will go to this [pointing to one of the hotspot] site to guide the evacuation process
(10) Then let’s send the other field team to that site [pointing to the other hotspot]
MacEachren and Cai
and federal regulation recommendations as they were discussed among the team. Here the dialogue involves several maps that represent evolution of shared knowledge about a conceptual object (i.e., the evacuation zone). This externalized representation of shared knowledge enables the group to quickly reach consensus on the area to be evacuated.
Signifying group activities. Dealing with an emergency like radioactive release involves multiple individuals collaborating on an extended activity. Each member of the team must individually keep track of the status of the collaboration (who has done what, who needs help, what is the progress so far) in order to decide what to do next, who to talk to, and how to respond. Visual displays can provide mechanisms to directly support awareness of coordinated activities. For example (in Figure 6), the map M2 and M3 show knowledge contributions from Jim (on EPZ zones) and Jill (on the plume model) as two different color codes (purple and red, respectively), while map M4 shows the evacuation zone that Jim and Jill have agreed after negotiation (which is coded by a filled region with solid outline). Such uses of color coding and feature symbols effectively track the progression of the overall activity and make such knowledge available in the shared visual workspace (the map view). During the whole course of the interaction, the maps (M1 – M6) depict the “history” of group activity at any moment and contextualize subsequent group actions.
4.1.2 Map displays as external cognitive devices
The map supports external, distributed cognition through concrete (non-verbal) signification of the objects of interest and of the spatial context in which they are situated (e.g., relative location of entities, what entities are connected and by what means, how widespread particular entities are, and a wide range of other site and situation information). In the example of Figure 6, we view Jim, Jill, the map vew, and the system collectively as a distributed cognitive system. The dynamic map view supports group cognition in three ways (following the framework of Scaife and Rogers (1996)):
First, the map view support computational offloading because each one of the maps M1 – M6 serves as the group’s external memory device where both the resources and the results of the cognitive processes are recorded visually in the map. Threads of cognition directly ‘operate’ on the objects in the map, and the results of each segments of cognition are immediately available to others. None of the human participants needs to maintain mentally the spatial knowledge encoded in the display.
Second, the map view re-represents private (or personal) cognition in such a way that it is comprehensive to all other members. For example, Jill (through step 1 of the dialogue) communicated his judgment about what was happening, and M1 re-represented that knowledge in a geographically explicit view that is understandable by Jim. Similar functions of the map can be found throughout the sample dialogue. Re-presentation provides the mechanism to ‘mesh’ together individual cognition into group cognitive processes and ensures that segments of the distributed cognition are well-connected.
Third, graphical constraining is provided by the map view since the encoding of all the elements involved in the evacuation decision into a common geospatial reference system eliminates the possibility of miscommunication or misunderstanding on the spatial configuration of the problem, and makes the search of solutions relatively effortless. In the sample dialogue, Jim and Jill reached an agreed-upon decision in very a short dialogue, without the need for extensive linguistic exchanges.
An example for lack of graphical constraining can be found in a recent happening of miscommunication during a 911 emergency call in Denver. The caller tried to report a warning about a loose girder on a
Environment and Planning B: Planning and Design (Forthcoming)
bridge being constructed and the 911 operator misunderstood (thinking the caller was talking about a highway sign at the same location. As reported in the Denver Post:
Though the caller was explicit that an I-beam girder was out of place, the dispatcher mistakenly believed the caller was concerned about a sign hanging over the roadway. That inaccurate information was relayed to the Colorado Department of Transportation, which sent out a maintenance crew looking for a dislodged road sign rather than a 100-foot-long girder perched at an odd angle on the C-470 overpass above Interstate 70. By 9:29 a.m. the CDOT crew radioed that it had found a damaged sign in the median and left the scene. Approximately 30 minutes later, the girder collapsed, killing {a family of three}.souce: Girder warning botched, Trent Seibert and Jeffrey Leib, Denver Post, Tuesday, May 18, 2004
It is not hard to envision visual support for multi-person dialogue that would make such fatal mistakes less likely. Consider a caller with a smartphone that includes a map display (something that is increasingly common) AND the ability to share the display with the 911 dispatcher (technology that is possible but not available). If the dispatcher could see a location being pointed to on the shared map display, it would be clear that the object of discussion was the bridge, not the roadside sign. In this case, of course, a camera on the cell phone would be at least as useful, so the caller could share a picture of the out of position bridge girder. The ideal aid to remote dialogue in this case might be having the picture anchored to the right spot on the map by a GPS in the cell phone (to avoid a different error … sending the response team to the wrong bridge).
4.1.3 Map displays as boundary objects
Our sample dialogue also exemplifies the idea of map signification as boundary objects of a collaborative group with multiple perspectives. The visible, concrete nature of map signification allows map objects to be less transitory boundary objects to enable dialogue than are spoken words. For example, in subdialogue D1 the location of Crystal River Nuclear Power Plant is shown on the map, as are the transportation network, water bodies, and location of facilities. The map as a whole acts as a boundary object that frames the dialogue, steering emphasis to the geographic extent depicted. It also helps Jim and Jill to establish common spatial reference for the geographical features central to the subdialogue, and enables further discussions about this power plant, evacuation routes, shelters, and other key components of decision-making. If the map extent is not appropriate, or the features displayed are not the relevant ones, the Jill and/or Jim must focus attention on updating the geographical framework so that it can enable discussion more effectively.
Shared meaning attached to the sign-vehicles depicting infrastructure (even before it is mentioned) allows those sign vehicles to acquire additional shared meaning (extended interpretants) simply by drawing attention to them. For example, Jim’s voicing of a concern about evacuation in a particular region, and indication of the region by pointing, draws attention to the transportation network and road obstructions and their signification on the map allows the spoken concerns to support a more complex interpretant than the spoken words could generate alone. Both Jill and the System use these visual boundary objects (or their internal representation), together with the overall decision-making context, to infer that the issue is capacity of the roads to handle the expected traffic (and to recognize the implications of travel impediments on specific roads). This simple example makes clear the impact that visual map signification might have in a situation in which there is insufficient time to engage in detailed discussion. If an important item does not attract enough attention, it may not be considered as quickly as if it does attract attention. Or, if a sign-vehicle for a feature prompts the wrong interpretant, mistakes in situation assessment or in decisions about actions to take are possible.

MacEachren and Cai
4.2 Overview of the Computational Method Human-human dialogues supported by map displays (like the dialogue depicted in figures 6 and 7) have two primary components: (1) intentional structure, and (2) geographical objects. The intentional structure of a dialogue refers to the purposes of the dialogue and subdialogues, together with their relationships, and it is a mental state representation of the underlying activity. Geographical objects, on the other hand, are referents signified by map features (on the display) and geographical terms (within human spoken utterances). These are integral components through which humans signify and share meanings within dialogues involving spatial information. The relationship between the two dialogue components determines what roles are played by the visual display within the current dialogue. To actively mediate a dialogue, a visual display must present the currently salient geographical objects in such a way that enables their roles in the dialogue.
An important observation from the above analysis of the sample dialogue is that visual displays can play multiple and different roles throughout an extended dialogue. This is due to the fact that each dialogue move might cause changes in the salient geographical objects, the intentional structure of the dialogue, and their relationships. Such shifts in the role of visual displays, when recognized, can assist the dialogue manager in choosing the right strategies for visual mediation.
Based on this idea, the problem of visual mediation of human-human dialogue becomes a four-step process:
(1) Recognition and representation of the intentional structure of the dialogue;
(2) Recognition and representation of the salient geographical objects;
(3) Recognition of the relationship between the above two, to determine the role of maps and other visual signification devices;
(4) Cartographic and graphic decisions to enable the role of maps and diagrams, as believed by the system.
Our work has paid particular attention to maps as a component in the first three steps. That is, we have focused on enabling recognition of the roles for maps in the cognitive-semiotic process of visually-mediated human-human dialogue, through modeling the intentional structure of the dialogue and implementing strategies to include map displays as an integral component of that dialogue. The fourth step is currently done based on some simple and intuitive rules, but this can be enhanced by incorporating empirical investigation centered around different problem types, such as the work done by Armstrong and Durham (Armstrong, Densham et al. 1992) on locational decision making and by Jankowski, et al (Jankowski, Andrienko et al. 2001) on direct manipulation maps through which a user (or users) can control the weighting of parameters in a multi-criterion decision model and see immediate feedback in a map display.
Below, we outline each of the four steps in visual mediation of human-human dialogue proposed.
4.3 Modeling Intentional Structure of Dialogues People engage in dialogues with others for a reason. Their intentions guide their behavior and their conversational partners’ recognition of those intentions aids in the mutual understanding of their utterances (Grosz and Sidner 1986; Lochbaum 1998). For task-oriented dialogues, the intentions of a dialogue are organized around the collaborative activities that contribute to accomplishing a shared task, hence there is direct correspondence between the intentional structure and the task structure. A dialogue
Environment and Planning B: Planning and Design (Forthcoming)
purpose operates on these structures to determine the best dialogue initiation and continuation. So the problem becomes one of guiding the user through a series of dialogue steps. These steps consist of: initiative, reaction, and evaluation (Hesiterkamp and McGlashan 1996) (steps that match those addressed within the group spatial decision support literature (Armstrong 1994)).
While the reasons for engaging in dialogues can be quite diverse, there are structural regularities in conversational dialogues. A key to computer support for (or participation in) dialogues is to recognize such regularities and capture them as conversational knowledge. We have developed a computational model for recognizing intentional structure of multimodal dialogues involving geographical information (Cai, Wang et al. 2005), based on the collaborative planning model of discourse intentions (Grosz and Sidner 1990; Grosz and Kraus 1996; Lochbaum 1998; Lochbaum, Grosz et al. 2000). According to linguistic studies of human-to-human interaction (Grosz and Sidner 1986; Grosz and Sidner 1990), task-oriented dialogues often form natural groups of utterances, called subdialogues or discourse segments. Lochbaum (Lochbaum 1998) differentiate among three types of relationships between a subdialogue and its parent dialogue segment: subtasking, knowledge-preconditioning, and problem correction. These purposes and their relationships form the intentional structure of a dialogue.
We follow the view that human-human dialogues (and sub-dialogues) are part of collaborative planning process among rational agents. Thus, a sufficient model of the intentional structure of a discourse must include a theory of the actions and plans underlying a collaboration. Our model of intentional structure of map-mediated human-human dialogues is a partial implementation of the SharedPlan theory (Grosz and Kraus 1996), which specifies exactly the constituents of collaborative plans, as well as how such plans are initiated, elaborated, and augmented during the course of a collaboration. Extensions were made to handle recognition of and reasoning about the roles of visual mediation.
4.4 Modeling Semiotics of the Geographical Objects Human dialogues that reference geographical objects need to be grounded by invoking the same (or similar) understanding of the objects being referenced. Based on MacEachren’s cognitive-semiotic theory of geographical information representation and use (MacEachren 1995), we have implemented a relational model that relates the signifier (human language and gestures, or visual features in map displays), interpretants (human or system derived meaning, as conditioned by domain and task contexts), and referents (geographical objects) through a set of knowledge schemas. These schemas allow the representation of many-to-many relationships among signifiers, interpretant, and referents. For example, the same geographical object can be signified by multiple terms (and/or gestures) which vary with application contexts. Ambiguous signifiers (i.e., one signifier can be mapped to multiple referents) can also be resolved through task contexts. The goal is to enable both human participants and the system to build on initially shared boundary objects for which at least partial meaning is shared to construct a more comprehensive, shared mental model of any communicated spatial concepts.
4.5 Recognizing the Role of Maps in Mediating a Dialogue If we assume (for purposes of discussion here) an adequate model of (a) the intentional structure of a dialogue (section 4.1) and (b) the geographical objects involved (section 4.2), then recognizing the roles of maps within a human-human dialogue can be treated as the problem of relating the geographical (and other) objects signified on the visual display with the intentional state of the dialogue. This relationship can take many forms. In this paper, we are interested in three categories of this relationship that can be used as the basis for reasoning about the roles of visual mediation in map-augmented human-human dialogues. Following from discussion of section 2.1 and 4.1.1 about the roles of visual signification, we
MacEachren and Cai
define three types of intentions embedded in dialogue segments and three corresponding types of visual information that are embedded in visual display.
The three types of intentions are:
• INT.That.Share.GeoKnow : agents intend that knowledge about a set of geographical objects be shared;
• INT.That.Share.Mental: agents intend to share their spatial mental models about a conceptual object (such as “an evacuation zone”), an argument (such as “evacuation routes need to account for uncertainty in predicted development of the hazard”), an approach to decision-making (such as using a multi-criteria decision model and/or a map on which alternative scenarios can be sketched as decision inputs), or a decision (such as choices and preferences).
• INT.To.CoordinateActivity: agents intend that individuals commit to individual and collaborative activities, and coordinate those activities for successful execution.
The three kinds of visual sign-vehicles that provide external cognition support are:
• (O-1) Existential objects: visual sign-vehicles corresponding to real world geographical objects or objects captured in geographical databases; these include standard forms of map signification typical on highway, topographic, and other reference maps.
• (O-2) Conceptual objects: visual sign-vehicles corresponding to the representation of concepts or objects that exist only in the human mind; these include symbolic sign vehicles that provide meaning to geographic objects through a rule, usually provided via a legend (e.g., red highlighting added to a highway representation to signify a designation as an evacuation route) as well as indexical sign-vehicles used to draw attention to features or regions of interest (e.g., an outline drawn on the map by a group member to depict the evacuation zone).
• (O-3) Activity objects: visual sign-vehicles representing participants, equipment, and other artifacts associated with spatial activities and sign-vehicles representing those activities (individually and collectively). These also include symbolic sign-vehicles (e.g., moving map symbols to signify moving emergency vehicles) and indexical sign-vehicles (e.g., flashing of map symbol that depicts a field team to indicate which team’s video feed of a critical incident is being displayed).
To relate the three types of map mediation roles (Role-I, Role-II, Role-III as mentioned in section 3.3) with the above intention types and visual signification object types, we apply the following rules in our reasoning algorithm:
(RULE-1) A visual display is likely to play Role-I (shared objects to talk about) if:
• The intention α of the immediate subdialogue is of type INT.That.Share.GeoKnow, and
• The group has selected a recipe γ(α) for achieving α, and γ(α) involves real world geographical objects (i.e., O-1 type of objects) as parameters or pre-conditions.
• Representation of these objects can be found in the system’s knowledgebase or database, and can be visualized.
(RULE-2) A visual display is likely to play Role-II (shared objects to think with) if:
Environment and Planning B: Planning and Design (Forthcoming)
• The intention α of the immediate subdialogue is of type INT.That.Share.Mental, and
• The group has selected a recipe γ(α) for achieving α, γ(α) involves mentally constructed objects (i.e., O-2 type of objects) as parameters or pre-conditions.
• These objects can be captured by the system into its knowledgebase or database, and can be visualized.
(RULE-3) A visual display is likely to play Role-III (shared objects to coordinate activity) if:
• The intention α of the immediate subdialogue is of type INT.To.CoordinateActivity, and
• The group has selected a recipe γ(α) for achieving α, γ(α) involves knowledge of individual and group activities (i.e. O-3 type of objects) as parameters or pre-conditions.
• These objects can be captured by the system for input to its knowledgebase or database, and can be retrieved and visualized.
These three rules, although not covering all situations, represent our initial generalization of the process of map-mediated dialogue, based on creating, implementing, and testing a number of dialogue scenarios. This set of rules has been implemented in our dialogue agent, GeoDialogue. This system has been tested for the sample dialogue in Figure 6, and it successfully inferred that the visual display should play Role-I in subdialogue D1, and Role-II in subdialogue D2, and Role-III in subdialogue D3. More detail on the algorithms of this reasoning process is beyond the scope of this paper and will be reported separately.
4.6 Cartographic Support for Mediating Human-Human Dialogues Cartographic support for the three visual mediation roles outlined above requires reasoning about the selection of appropriate visual content, visual transformations (if necessary), symbology, scaling, and highlighting methods. Our work on cartographic support of visual mediation within GeoDialogue has, thus far, been focused on the task of selecting visual content (subsequent work will focus on its visual signification).
Specifically, we have focused on formalizing the heuristic knowledge used by humans when selecting map content for a given role of visual mediation. For example, in support of Role-I, visual displays are expected to include not only the geographical objects explicitly discussed, but also adequate contextual features that are necessary for human users to interpret features signifying the objects of collaboration. Using subdialogue D1 in Figure 5 as an example, the system responded to utterance #1 with the map M1 which included not only the Crystal River Nuclear Power Plant, but also county boundaries, major roads, water bodies, and location of selected populated places. The set of information beyond the power plant itself helps frame the context for dialogue, allowing the team members to consider the site and situation of the power plant in a common geographic context. Such contextual information items are usually not requested explicitly, but our system is able to infer such expectations based on knowledge of that particular application domain.
Another example of cartographic support in our system is the ability to maintain a visual memory of conceptual objects when the visual display serves Role-II. For example, in our sample dialogue of Figure 6, the subdialogue D21 resulted in a map M2 which showed four EPZ zones as conceptual objects contributed by Jim. The next subdialogue, D22, resulted in another conceptual object, which is a plume model. Map M3 (as the response to Jill’s utterance #5) includes not only the plume model (in the

MacEachren and Cai
foreground), but also the four EPZ zones that were the result of the previous subdialogue D21. This system behavior results because the system recognized that the visual display served Role-II. In other words, the display was mediating a complex construction of shared mental knowledge about radioactive pollution, which requires visually combining the knowledge about EPZ zones and the plume model.
We recognize that little is known about what cartographic rules should be applied for visual mediation, and this is likely to be application specific and task-constrained. Such knowledge needs to be collected by field observations within real collaborative spatial decision contexts. Our future plan is to endow DAVE_G with learning capabilities so that, when placed into real world environments (such as EOCs), the system will ‘learn’ from human behavior over time and form heuristic knowledge.
5 Discussion Making geographical information technologies collaboration-friendly represents a grand challenge that requires advances in and integration of perspectives from multiple disciplines including human-computer interactions, cognitive science, group work dynamics, spatial decision-making, GIS and cartography. In this paper, we have outlined the roles of visual mediation in map-supported human-human dialogues within the context of crisis management. Our conceptual framework identifies three roles of visual signification in facilitating group work with geospatial information and incorporates perspectives from distributed cognition and the theory of boundary objects.
To develop a computational approach for visually mediating human-human dialogues, we have applied a problem-centered and scenario-based human-centered design methodology. Several steps in the iterative process being followed have been reported elsewhere. Specifically, members of our research team have carried out extensive knowledge elicitation and cognitive task analysis activities (see: [Brewer, 2004 #57; Terrell, 2004 #59]) and we have used the results of these activities to develop detailed, realistic scenarios [Brewer, 2005 #11787] against which we have designed our GeoDialogue approach [Cai, 2005 #10546]. Grounding our approach to dialogue-enabled interfaces in an understanding of real world work with geospatial information and technology provides a practical basis for the agent-based visual mediation approach that has been implemented in GeoDialogue and introduced here. As part of the process of assessing the viability of our approach, we also rely on laboratory-based studies of team work in simulated emergency/crisis management situations [MacEachren, 2005 #60; McNeese, in press #61] and have carried out usability assessments of the initial implementation of GeoDialogue [Fuhrmann, 2005 #62]. Thus, the approach to visually-mediated human-computer-hum dialogue presented here is grounded in a comprehensive, ongoing research program that bridges the gaps among real world practice, cognitive and information science theory, and technological advances.
We have shown, through a sample scenario, that the kinds of visual mediation we suggested can in fact be supported computationally. For future work, relatively simple extensions to the visual interface have the potential to make a substantial contribution to the team distributed cognition process, thus to the process of making informed decisions. One logical addition would be a visual depiction of the map algebra operations applied to produce a proposed evacuation zone along with a visual depiction of the history of operations applied. Signifying, visually (e.g., in a visual programming design panel), that the proposed zone was based on the intersection of distance from the site with predicted plume location would allow another member of the team (who joins the discussion after step 11) to recognize that travel time was not considered nor was certainty in the predicted plume location. These extensions are currently being implemented.
Environment and Planning B: Planning and Design (Forthcoming)
Further enhancement could also incorporate past research by others to integrate multi-criteria decision making tools with GIS-based map depictions of results (e.g., (Jankowski, Nyerges et al. 1997; Medeiros, Souza et al. 2001) or Rinner’s idea of integrating explicit, visual argumentation tools with GIS to support distributed group planning and decision making (Rinner 2001). The goal for such extensions is to support the role of visual display in enabling the process of group thinking, negotiation, and decision-making, through its framing of the geographic and activity context and its shared signification of key objects of attention.
Crisis management, with its central importance on geographical information and group work, provides a rich ‘laboratory’ for advancing the agenda the goals of making GIS more accessible, usable, and useful. Multimodal, dialogue-enabled interfaces seem well suited to supporting work with large screen displays in this context. Our computational work on enabling active mediation of human-human dialogues by visual displays initially focused on the modeling of the intentional structure of conversational dialogues and the semiotics of representing the geographical objects involved. Both are critical to recognizing the visual mediation roles played by map displays. The four-step process and associated reasoning rules developed here were adequate for generating the behavior of the sample dialogue used in the paper. Although a level of success has been achieved, it is also clear that more scenarios and problems need to be analyzed to verify and enrich the functions of GeoDialogue in visual mediation. In addition, the goal of effective, dynamic mediation of multiperson dialogue poses new challenges for map symbolization and design. These and other issues will require continued, multi-disciplinary research attention.
6 Acknowledgement Part of this work is based upon work supported by the National Science Foundation under Grants BCS-0113030, EIA-0306845, IIS-97-33644 and IIS-0081935. We thank Isaac Brewer for developing the initial draft of the nuclear particulate release scenario from which the sample dialogue of Figure 6 was generated.
References Arias E, Eden H, Fischer G, Gorman A and Scharff E 2000 Transcending the individual human mind - creating
shared understanding through collaborative design. ACM Transactions on Computer-Human Interaction 7: 84 - 113
Arias E G and Fischer G 2000 Boundary objects: Their role in articulating the task at hand and making information Relevant to It. In International ICSC Symposium on Interactive & Collaborative Computing (ICC'2000). Wetaskiwin, Canada, 567-74
Armstrong M P 1994 Requirements for the development of GIS-based group decison-support systems. Journal of the American Society of Information Science 45: 669-77
Armstrong M P and Densham P J 1995 Cartographic support for collaborative spatial decision-making. In Auto Carto 12, ACSM/ASPRS Technical Papers, Vol. 4. Charlotte, NC, Feb. 27 - March 2, 1995, 49-58
Armstrong M P, Densham P J, Lolonis P and Rushton G 1992 Cartographic displays to support locational decision making. Cartography and Geographic Information Systems 19: 154-64
Artman H 1998 Situation awareness and co-operation within and between hierarchical units in dynamic decision making. Ergonomics 42: 1404-17
Beveridge M and Parkins E 1987 Visual representation in analogical problem solving. Memory & Cognition 15(3): 230-37
MacEachren and Cai
Cai G, Sharma R, MacEachren A M and Brewer I (accepted) Human-GIS Interaction Issues in Crisis Response. International Journal of Risk Assessment and Management special issue on GIS in Crisis management:
Cai G, Wang H, MacEachren A M and Fuhrmann S 2004 Natural Conversational Interfaces to Geospatial Databases. Transactions in GIS: 9(2): 199-221
Carroll J M, Neale D C, Isenhour P L, Rosson M B and McCrickard D S 2003 Notification and awareness: synchronizing task-oriented collaborative activity. International Journal of Human-Computer Studies 58: 605-32
Cutter, S. L. (2003). "GI Science, Disasters, and Emergency Management." Transactions in GIS 7(4): 439-445.
Deely J 1990 Basics of Semiotics. Bloomington, IA, Indiana University Press.
DiBiase D, MacEachren A M, Krygier J B and Reeves C 1992 Animation and the role of map design in scientific visualization. Cartography and Geographic Information Systems 19: 201-14, 65-66
Erickson T and Kellogg W A 2000 Social translucence: Designing systems that support social processes. ACM Transactions on Computer-Human Interaction 7: 59-83
Fischer G 2002 External and Sharable Artifacts as Sources for Social Creativity in Communities of Interest. In Proceedings of the Fifth International Roundtable Conference on Computational and Cognitive Models of Creative Design. Heron Island, Australia
Frank A U and Mark D M 1991 Language issues for GIS. In Maguire D J, Goodchild M F and Rhind D W (eds) Geographical Information Systems: Principles and Applications, Vol 1. London, Longmans Publishers, 147-63
Grosz B J and Kraus S 1996 Collaborative plans for complex group action. Artificial Intelligence 86: 269-357
Grosz B J and Sidner C L 1986 Attention, intentions, and the structure of discourse. Computational Linguistics 12: 175-204
Grosz B J and Sidner C L 1990 Plans for discourse. In Cohen P R, Morgan J L and Pollack M E (eds) Intentions in Communication. Cambridge, MA, MIT Press, 417-44
Harvey F and Chrisman N 1998 Boundary objects and the social construction of GIS technology. Environment and Planning A 30: 1683-94
Henderson K 1991 Flexible sketches and inflexible data bases: Visual communication, conscription devices and boundary objects in design engineering. Science, Technology and Human Values 16: 448-73
Hesiterkamp P and McGlashan S 1996 Units of dialogue management: An Example. In presented at: Fourth International Conference on Spoken Language Processing. October 3 - 6, 1996, Philadelphia, PA
Hollan J, Hutchins E and Kirsh D 2000 Distributed cognition: toward a new foundation for human-computer interaction research. ACM Transactions on Computer-Human Interaction 7: 174 - 96
Jankowski P, Andrienko N and Andrienko G 2001 Map-centred exploratory approach to multiple criteria spatial decision making. International Journal of Geographical Information Science 15: 101-27
Jankowski P and Nyerges T 2001 Geographic Information Systems for Group Decision Making. New York, Taylor & Francis, Inc.
Jankowski P and Nyerges T 2001 GIS-Supported Collaborative Decision Making: Results of an Experiment. Annals- Association of American Geographers 91: 48-70
Jankowski P, Nyerges T L, Smith A, Moore T J and Horvath E 1997 Spatial group choice: a SDSS tool for collaborative spatial decision-making. International Journal of Geographical Information Science 11: 577-602
Environment and Planning B: Planning and Design (Forthcoming)
Kerr B 2003 THREAD ARCS: An Email Thread Visualization. In Proceedings of the Information Visualization Symposium. Seattle, WA, 211-18
Kirschner P A, Shum S J B and Carr C S 2003 Visualizing Argumentation: Software Tools for Collaborative and Educational Sense-Making. In. London, Springer-Verlag:
Kumar V, Bugacov A, Coutinho M and Neches R 1999 Integrating Geographic Information Systems, Spatial Digital Libraries and Information Spaces for conducting Humanitarian Assistance and Disaster Relief Operations in Urban Environments. In ACM GIS'99 - International Symposium on Advances in Geographic Information Systems. Kansas City, Missouri
Larkin J H and Simon H A 1987 Why a diagram is (sometimes) worth ten thousand words. Cognitive Science 11: 65-99
Lochbaum K E 1998 A collaborative planning model of intentional structure. Computational Linguistics 24: 525-72
Lochbaum K E, Grosz B J and Sidner C L 2000 Discourse Structure and Intention Recognition. In Dale R, Moisl H and Somers H (eds) Handbook of Natural Language Processing. New York, USA, Marcel Dekker, 123-46
MacEachren A M 1995 How maps work: representation, visualization and design. New York, Guilford Press.
MacEachren A M 2000 Cartography and GIS: facilitating collaboration. Progress in Human Geography 24: 445-56
MacEachren A M 2001 Cartography and GIS: extending collaborative tools to support virtual teams. Progress in Human Geography 25: 431-44
MacEachren A M in press Moving geovisualization toward support for group work. In Dykes J, MacEachren A M and Kraak M-J (eds) Exploring Geovisualization, Elsevier:
MacEachren A M and Brewer I 2004 Developing a conceptual framework for visually-enabled geocollaboration. International Journal of Geographical Information Science 18: 1-34
MacEachren A M, Cai G, Brewer I and Chen J 2003 Geocollaboration for data exploration and decision-making: Enabling group work through natural interaction with large screen displays. In International Advanced Workshop on Virtual Geographic Environments and GeoCollaboration, December 15-16, 2003. The Chinese University of Hong Kong
MacEachren A M, Cai G, Sharma R, Brewer I and Rauschert I 2005 Enabling collaborative geoinformation access and decision-making through a natural, multimodal interface. Internaional Journal of Geographical Information Science 19(1): 1-26
McGee D R and Cohen P R 2001 Creating tangible interfaces by augmenting physical objects with multimodal language. In Proceedings of the International Conference on Intelligent User Interfaces (IUI 2001). Santa Fe, NM, 113-20
McGee D R, Pavel M and Cohen P R 2001 Context shifts: extending the meaning of physical objects with language. Human-Computer Interaction (Special issue on context-aware computing) 16: 351-62
McNeese M D, Theodorou E, Ferzandi L, Jefferson T, Jr. and Ge X 2002 Distributed cognition in shared information spaces. In Proceedings of the 46th Annual Meeting of the Human Factors and Ergonomics Society. Santa Monica, 556-60
McNeill D 1992 Hand and Mind: What Gestures Reveal About Thought. Chicago, University of Chicago Press.
Medeiros S P J, Souza J M d, Strauch J C M and Pinto G R B 2001 Coordination aspects in a spatial group decision support collaborative system. In Proceedings of the 2001 ACM symposium on Applied computing
Mondschein L G 1994 The Role of Spatial Information Systems in Environmental Emergency Management. Journal of the American Society for Information Science 45: 678-85
MacEachren and Cai
Pierce C S 1955 Logic as semiotic: The theory of signs (published first in 1891). In Buchler H (ed) Philisophical Writings of Peirce, 98-119
Rauschert I, Agrawal P, Fuhrmann S, Brewer I, Sharma R, Cai G and MacEachren A 2002 Designing a User-Centered, Multimodal GIS Interface to Support Emergency Management. In Proceedings of the tenth ACM international symposium on Advances in geographic information systems. McLean, VA, 119-24
Rinner C 2001 Argumentation maps: GIS-based discussion support for online planning. Environment and Planning B-Planning & Design 28: 847-63
Salomon G 1993 No distribution without individual cognition: a dynamic international view. In Salomon G (ed) Distributed Cognitions -- Psychological and Educational Considerations. Cambridge, Cambridge University Press, 111-39
Saussure F d 1916 Cours de Linguistique Generale. New York, Philosophical Library.
Scaife M and Rogers Y 1996 External cognition: how do graphical representations work? International Journal of Human-Computer Studies 45: 185-213
Sharma R, Yeasin M, Krahnstoever N, Rauschert, Cai G, Brewer I, MacEachren A and Sengupta K 2003 Speech-Gesture Driven Multimodal Interfaces for Crisis Management. Proceedings of the IEEE 91: 1327-54
Shiffer M J 1998 The evolution of public participation GIS. Cartography and Geographic Information Systems 25: 89-94
Suthers D and Hundhausen C 2003 An Empirical Study of the Effects of Representational Guidance on Collaborative Learning. Journal of the Learning Sciences 12: 183-219
Zerger A and Smith D I 2003 Impediments to using GIS for real-time disaster decision support. Computers, Environment and Urban Systems 27: 123-41