Sustainable Livelihood and Socio-economic Status - Journals
18
Ushus-Journal of Business Management 2017, Vol. 16, No. 1, 21-38 ISSN 0975-3311|https://doi: 10.12725/ujbm.38.2 21 Sustainable Livelihood and Socio-economic Status: A Study on the Role of Microfinance in Sonitpur District of Assam Nikita Sharma * Abstract In this study, focus has been given on the role played by micro finance in supporting the livelihood generating activities by helping in acquiring the livelihood assets. Further, the changes in the socio-economic status of the beneficiaries of micro finance have also been studied. This study has been conducted in two randomly selected development blocks of Sonitpur district in Assam viz. Balipara development block and Rangapara development block. A sampling size of 400 units has been taken up for collecting the primary data required for the study, consisting of the members of the Self-Help Groups (SHGs) as the sampling unit. The collected primary data have been analyzed with the help of the Statistical Package for the Social Sciences (SPSS) software, have shown positive results regarding acquiring the livelihood assets by the rural folk with the help of micro finance. Moreover, Social Status Index and Economic Status Index has also been computed to study the socio-economic changes among the beneficiaries of micro finance. Keywords: Sustainable Livelihood, Social Status, Economic Status, Micro Finance. * Guwahati University, Assam, India; [email protected]
-
Upload
khangminh22 -
Category
Documents
-
view
2 -
download
0
Transcript of Sustainable Livelihood and Socio-economic Status - Journals
Ushus-Journal of Business Management 2017, Vol. 16, No. 1, 21-38 ISSN 0975-3311|https://doi: 10.12725/ujbm.38.2
21
Sustainable Livelihood and Socio-economic
Status: A Study on the Role of Microfinance
in Sonitpur District of Assam
Nikita Sharma*
Abstract
In this study, focus has been given on the role played by micro finance in supporting the livelihood generating activities by helping in acquiring the livelihood assets. Further, the changes in the socio-economic status of the beneficiaries of micro finance have also been studied. This study has been conducted in two randomly selected development blocks of Sonitpur district in Assam viz. Balipara development block and Rangapara development block. A sampling size of 400 units has been taken up for collecting the primary data required for the study, consisting of the members of the Self-Help Groups (SHGs) as the sampling unit. The collected primary data have been analyzed with the help of the Statistical Package for the Social Sciences (SPSS) software, have shown positive results regarding acquiring the livelihood assets by the rural folk with the help of micro finance. Moreover, Social Status Index and Economic Status Index has also been computed to study the socio-economic changes among the beneficiaries of micro finance.
Keywords: Sustainable Livelihood, Social Status, Economic Status, Micro Finance.
*Guwahati University, Assam, India; [email protected]
Ushus-Journal of Business Management, Vol. 16, No. 1 ISSN 0975-3311
22
Introduction
This paper considers the way in which microfinance plays a role in earning sustainable livelihood, by helping people acquire the requisite livelihood assets.The Oxford dictionary defines livelihood as „a means of earning money in order to live‟. In a classic way Chambers and Conway (1991) proposed the following composite definition of a sustainable rural livelihood:
A livelihood comprises the capabilities, assets (stores, resources, claims and access) and activities required for a means of living: a livelihood is sustainable which can cope with and recover from stress and shocks, maintain or enhance its capabilities and assets, and provide sustainable livelihood opportunities for the next generation; and which contributes net benefits to other livelihoods at the local and global levels and in the short and long term.
The approach of sustainable livelihood has been taken up by development agencies since 1990s, which serves a way to lower vulnerability and poverty by undertaking livelihood generating activities (Scoones, 1998). The concept of endowments, entitlements and capabilities given by Amartya Sen which have thrown light on how economically weak people can adopt different livelihood options by accessing resources have also influenced the concept of sustainable livelihood (Scoones 1998, Carney 2003).A wide range of resources including tangible and intangible, especially the institutional arrangements are covered in the term endowment, allows the beneficiaries to take-up different livelihood activities. The capabilities of people relates to the valued life options which they choose (Alkire, 2002).
The concept of sustainable livelihood may be defined in different ways, but some authors have put arguments that the approach to attain sustainable livelihood should not be rigid, which means it should not follow any institutional specific design (Ellis 2000, Hinshelwood, 2003).
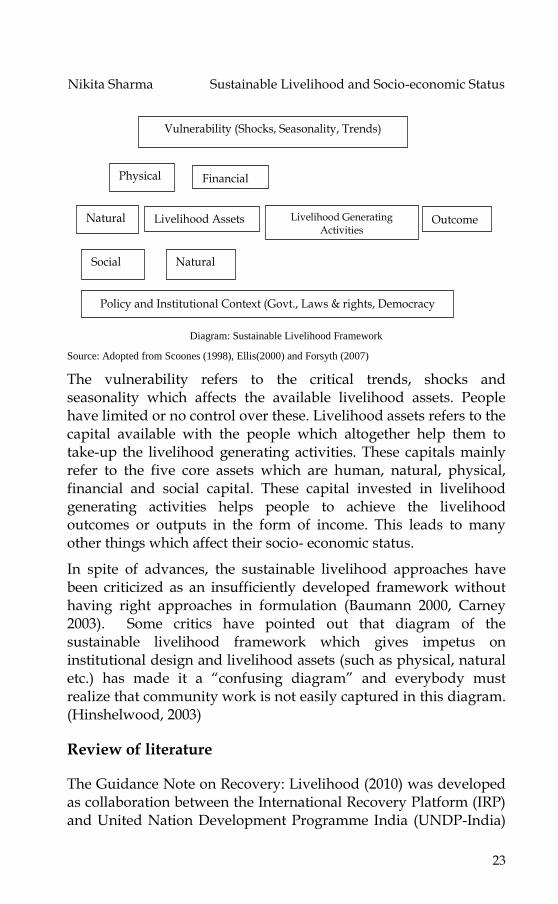
The following framework of sustainable livelihood gives the basic idea of the key features to be looked into while developing a sustainable livelihood framework:
Nikita Sharma Sustainable Livelihood and Socio-economic Status
23
Diagram: Sustainable Livelihood Framework
Source: Adopted from Scoones (1998), Ellis(2000) and Forsyth (2007)
The vulnerability refers to the critical trends, shocks and seasonality which affects the available livelihood assets. People have limited or no control over these. Livelihood assets refers to the capital available with the people which altogether help them to take-up the livelihood generating activities. These capitals mainly refer to the five core assets which are human, natural, physical, financial and social capital. These capital invested in livelihood generating activities helps people to achieve the livelihood outcomes or outputs in the form of income. This leads to many other things which affect their socio- economic status.
In spite of advances, the sustainable livelihood approaches have been criticized as an insufficiently developed framework without having right approaches in formulation (Baumann 2000, Carney 2003). Some critics have pointed out that diagram of the sustainable livelihood framework which gives impetus on institutional design and livelihood assets (such as physical, natural etc.) has made it a “confusing diagram” and everybody must realize that community work is not easily captured in this diagram. (Hinshelwood, 2003)
Review of literature
The Guidance Note on Recovery: Livelihood (2010) was developed as collaboration between the International Recovery Platform (IRP) and United Nation Development Programme India (UNDP-India)
Vulnerability (Shocks, Seasonality, Trends)
Policy and Institutional Context (Govt., Laws & rights, Democracy
Livelihood Assets Natural
Physical Financial
Natural Social
Livelihood Generating Activities
Outcomes
Ushus-Journal of Business Management, Vol. 16, No. 1 ISSN 0975-3311
24
has pointed out the livelihood assets which, supports livelihood generation as human, social, physical, financial and natural capital.
Micro finance is a tool which acts as an input for ensuring sustainable livelihood to the poor people of the world. There is an important linkage between micro finance and sustainable livelihood (Abul Bashar et. al., 2011)
In spite of having an extensive banking infrastructure, 70% of the rural population do not have access to formal financing. Micro finance has played an important role to bring the population closure to avail financial services. By hosting maximum number of micro finance model in India, micro finance sector has improved the standard of living of the rural folk (Pema Lama et. al., 2011).
Inclusive growth takes place when all the sectors of the society have equal opportunity and access to finance. Livelihood is an important area which can deliver immense benefit to the self-help group member if the micro finance is tuned in the right direction (K.S. Srinivasa Rao et. al., 2011)
Objectives of the study
The objectives of these research papers are as follows:
i. To study the livelihood assets owned by the beneficiaries of micro finance.
Sustainable livelihood activities undertaken by the beneficiaries substantially depend upon the livelihood assets owned by them. So, this study has focused on the livelihood assets owned by the beneficiaries with the help of micro finance which in turn help them to get themselves engaged in different livelihood generating activities.
ii. To study the changes in the socio-economic status of the beneficiaries, if any.
Further, this study will also focus on the change of socio-economic status of the beneficiaries. The changes are calculated by computing Social Status Index and Economic Status Index.
Nikita Sharma Sustainable Livelihood and Socio-economic Status
25
Research Methodology of the study
The descriptive research design which involves studying the state of affairs as it exists using a range of qualitative and quantitative techniques of data collection have been used for the study. The primary data were collected by using a self-developed questionnaire for getting the information from respondents. The questionnaire was developed by using 5 point Likert Scale to measure the attributes of opinion. The study has been conducted in two randomly selected community development blocks out of the 14 development blocks of Sonitpur district in Assam. Secondary data pertaining to the research have been collected from different sources including books, journals, websites, reports of different institutions etc.
Selection of sample: The population of the study comprises of the registered members of the Self-help group of Balipara and Rangapara Development blocks, which were 41,280 and 11050 respectively for the financial year 2014-15 and 2015-16. To calculate the sample size following factors need to be considered:
Population size: The size of the population affects the size of the sample, however in case of population size being more than 20,000 the difference in the sample size is not much.
Margin of Error (Confidence Interval): No sample is perfect and margin of error indicates the percentage of error that the researcher allows. The margin of error is taken at 0.05 for this research study.
Confidence level: Confidence level refers to the percentage of all possible samples that can be expected to include the true population parameter. The confidence level is taken at 95% for this research study.
Standard of deviation: Standard deviation refers to the variance expected in the responses. Standard deviation is taken as .5 in this research study.
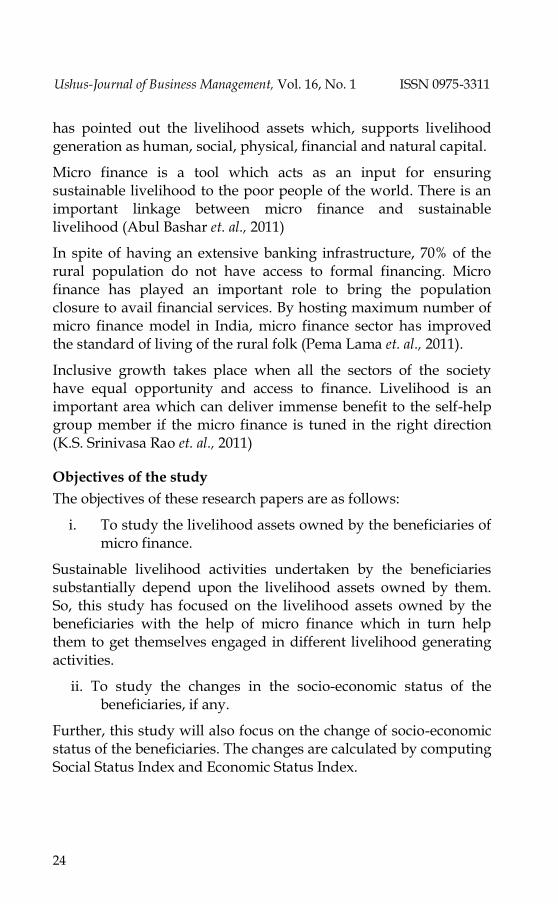
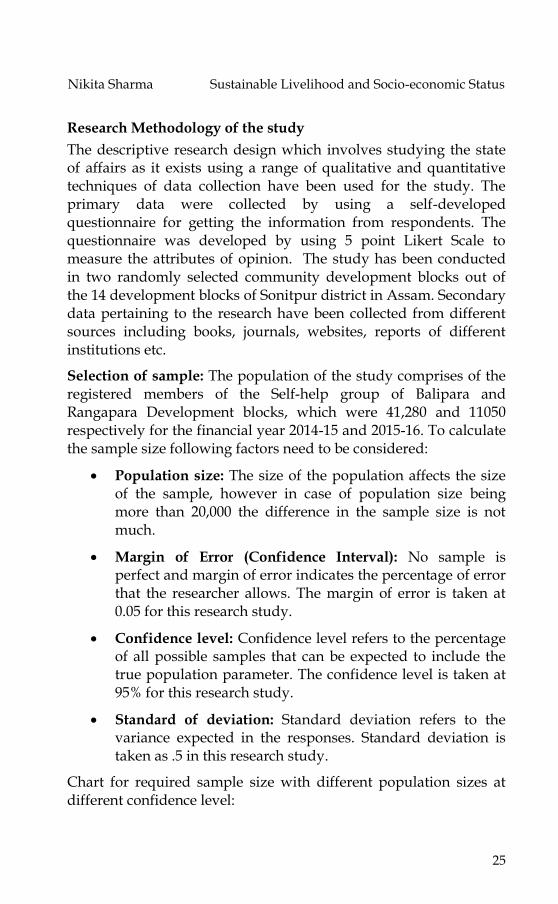
Chart for required sample size with different population sizes at different confidence level:
Ushus-Journal of Business Management, Vol. 16, No. 1 ISSN 0975-3311
26
Table: Sample Size
Margin of error Confidence level
Population 10% 5% 1% 90% 95% 99%
10 50 80 99 74 80 88
500 81 218 476 176 218 286
1000 88 278 906 215 278 400
10000 96 370 4900 264 370 623
100000 96 383 8763 270 383 660
1000000+ 97 384 9513 271 384 664
Source: www.checkmarket.com
Confidence level corresponds to a Z-score, and is a constant value needed for the equation. The value of Z score at 95% confidence level is 1.96. Considering the above mentioned factors the sample size was calculated using the following formula:
Sample size = n = { z2 * σ2 * [ N / (N - 1) ] } / { ME2 + [ z2 * σ2 / (N - 1) ] }
Where, n= sample size; z = z score; N= population size; ME =
Margin of error;
σ = std. deviation.
Therefore,
n = [(1.96)2 * 0.52 * {52330/ (52330-1)}] / [0.052 + {(1.96)2 * 0.52/ (52330 -1)}]
n = 3.8416 *.25 * 1.000019 / .0025 + 1.835
n = 382.67 or 383 (Approx.)
This is after keeping in mind that some respondents won‟t submit responses within prescribed time limit and some questionnaire may be returned without having all the data filled. So, the researcher decided to collect data from 430 samples. The duly filled questionnaire of 400 respondents have been evaluated for the purpose of the study.
Data Analysis: The researcher has used SPSS as main analysis software package. The statistical techniques used for analysis in this research study are as follows:
Nikita Sharma Sustainable Livelihood and Socio-economic Status
27
I. Descriptive Analysis: It is designed to demonstrate the distribution of the variables by using the frequencies and cross-tabs.
II. Analysis of Variance (ANOVA): This technique helps to draw inferences whether the difference in the means for population are attributed to some specific cause or attributed by chance.
Hypothesis and research query for the study
Hypothesis: The hypothesis formulated for the purpose of study is as follows:
H0: There is no significant difference between the livelihood assets owned by the beneficiaries and the livelihood activities undertaken by them.
H1: There is significant difference between the livelihood assets owned by the beneficiaries and the livelihood activities undertaken by them.
Research query: The research query for the purpose of study is as follows:
Whether there is any change in the socio-economic status of the beneficiaries after availing micro finance?
Data Analysis, interpretation and results
Test of reliability:
The results of Cronbach Alpha (α), measure of internal consistency of a test, were interpreted to test the reliability of the collected primary data. The values of this test are interpreted as follows:
≥0.9 – Excellent; ≥ 0.8 – Good; ≥ 0.7 – Acceptable; ≥ 0.6 – Questionable; ≥ 0.5 – Poor and ≤ 0.5 – Unacceptable. According to this, Cronbach's Alpha measuring the internal consistency for Socio-economic changes is Acceptable (George and Mallery, 2003; Gliem and Gliem, 2003).
Ushus-Journal of Business Management, Vol. 16, No. 1 ISSN 0975-3311
28
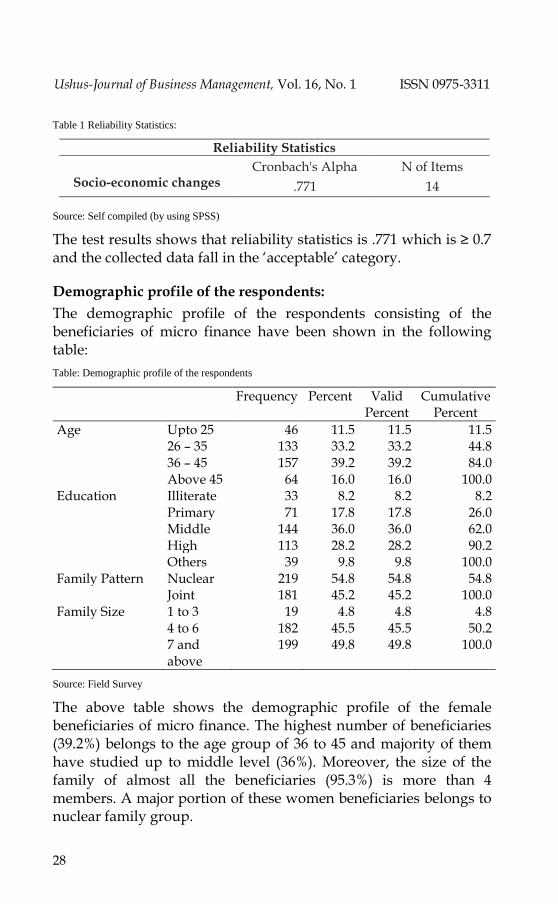
Table 1 Reliability Statistics:
Source: Self compiled (by using SPSS)
The test results shows that reliability statistics is .771 which is ≥ 0.7 and the collected data fall in the „acceptable‟ category.
Demographic profile of the respondents:
The demographic profile of the respondents consisting of the beneficiaries of micro finance have been shown in the following table:
Table: Demographic profile of the respondents
Frequency Percent Valid Percent
Cumulative Percent
Age Upto 25 46 11.5 11.5 11.5 26 – 35 133 33.2 33.2 44.8 36 – 45 157 39.2 39.2 84.0 Above 45 64 16.0 16.0 100.0
Education Illiterate 33 8.2 8.2 8.2 Primary 71 17.8 17.8 26.0 Middle 144 36.0 36.0 62.0 High 113 28.2 28.2 90.2 Others 39 9.8 9.8 100.0 Family Pattern Nuclear 219 54.8 54.8 54.8
Joint 181 45.2 45.2 100.0 Family Size 1 to 3 19 4.8 4.8 4.8
4 to 6 182 45.5 45.5 50.2 7 and
above 199 49.8 49.8 100.0
Source: Field Survey
The above table shows the demographic profile of the female beneficiaries of micro finance. The highest number of beneficiaries (39.2%) belongs to the age group of 36 to 45 and majority of them have studied up to middle level (36%). Moreover, the size of the family of almost all the beneficiaries (95.3%) is more than 4 members. A major portion of these women beneficiaries belongs to nuclear family group.
Reliability Statistics
Socio-economic changes
Cronbach's Alpha N of Items
.771 14
Nikita Sharma Sustainable Livelihood and Socio-economic Status
29
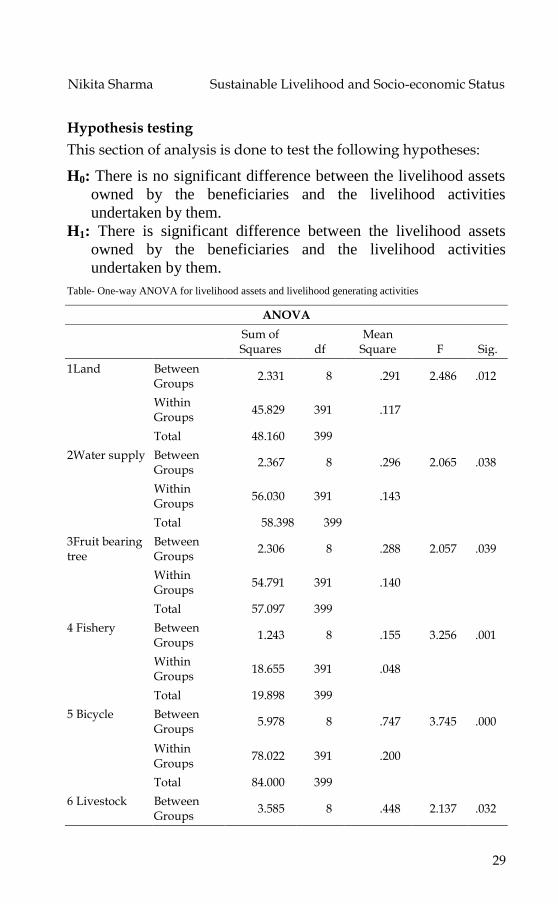
Hypothesis testing
This section of analysis is done to test the following hypotheses:
H0: There is no significant difference between the livelihood assets
owned by the beneficiaries and the livelihood activities
undertaken by them.
H1: There is significant difference between the livelihood assets
owned by the beneficiaries and the livelihood activities
undertaken by them.
Table- One-way ANOVA for livelihood assets and livelihood generating activities
ANOVA
Sum of Squares df
Mean Square F Sig.
1Land Between Groups
2.331 8 .291 2.486 .012
Within Groups
45.829 391 .117
Total 48.160 399
2Water supply Between Groups
2.367 8 .296 2.065 .038
Within Groups
56.030 391 .143
Total 58.398 399
3Fruit bearing tree
Between Groups
2.306 8 .288 2.057 .039
Within Groups
54.791 391 .140
Total 57.097 399
4 Fishery Between Groups
1.243 8 .155 3.256 .001
Within Groups
18.655 391 .048
Total 19.898 399
5 Bicycle Between Groups
5.978 8 .747 3.745 .000
Within Groups
78.022 391 .200
Total 84.000 399
6 Livestock Between Groups
3.585 8 .448 2.137 .032
Ushus-Journal of Business Management, Vol. 16, No. 1 ISSN 0975-3311
30
Within Groups
81.975 391 .210
Total 85.560 399
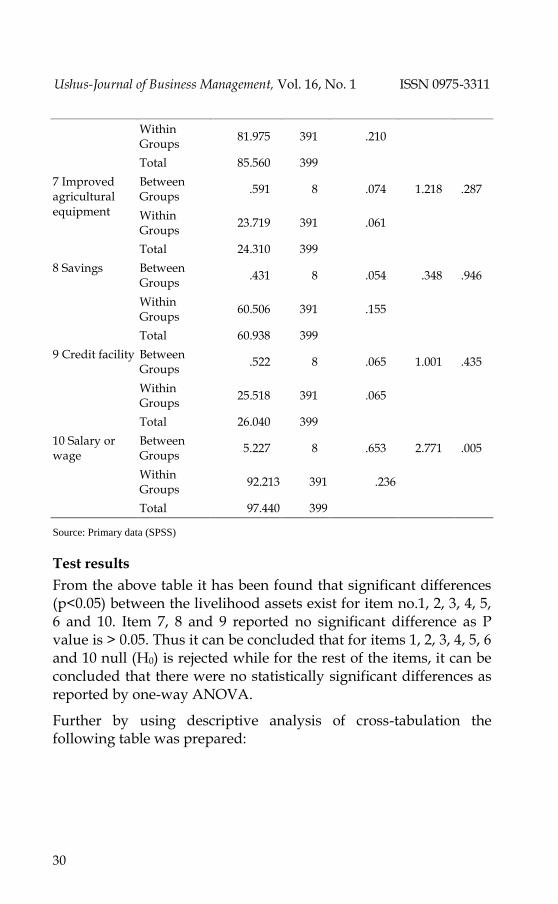
7 Improved agricultural equipment
Between Groups
.591 8 .074 1.218 .287
Within Groups
23.719 391 .061
Total 24.310 399
8 Savings Between Groups
.431 8 .054 .348 .946
Within Groups
60.506 391 .155
Total 60.938 399
9 Credit facility Between Groups
.522 8 .065 1.001 .435
Within Groups
25.518 391 .065
Total 26.040 399
10 Salary or wage
Between Groups
5.227 8 .653 2.771 .005
Within Groups
92.213 391 .236
Total 97.440 399
Source: Primary data (SPSS)
Test results
From the above table it has been found that significant differences (p<0.05) between the livelihood assets exist for item no.1, 2, 3, 4, 5, 6 and 10. Item 7, 8 and 9 reported no significant difference as P value is > 0.05. Thus it can be concluded that for items 1, 2, 3, 4, 5, 6 and 10 null (H0) is rejected while for the rest of the items, it can be concluded that there were no statistically significant differences as reported by one-way ANOVA.
Further by using descriptive analysis of cross-tabulation the following table was prepared:
Nikita Sharma Sustainable Livelihood and Socio-economic Status
31
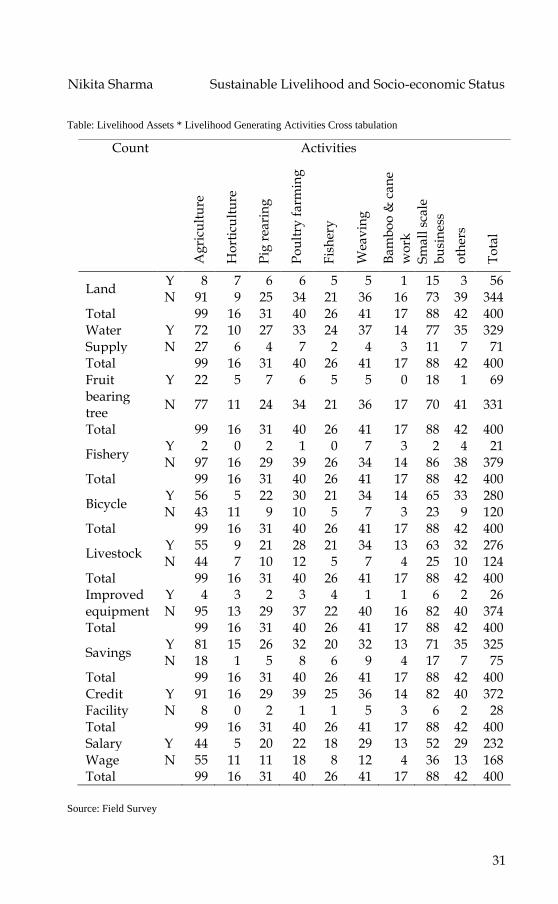
Table: Livelihood Assets * Livelihood Generating Activities Cross tabulation
Source: Field Survey
Count Activities
To
tal
A
gri
cult
ure
Ho
rtic
ult
ure
Pig
rea
rin
g
Po
ult
ry f
arm
ing
Fis
her
y
Wea
vin
g
Ba
mb
oo
& c
an
e
wo
rk
Sm
all
sca
le
bu
sin
ess
oth
ers
Land Y 8 7 6 6 5 5 1 15 3 56 N 91 9 25 34 21 36 16 73 39 344
Total 99 16 31 40 26 41 17 88 42 400 Water Supply
Y 72 10 27 33 24 37 14 77 35 329 N 27 6 4 7 2 4 3 11 7 71
Total 99 16 31 40 26 41 17 88 42 400 Fruit bearing tree
Y 22 5 7 6 5 5 0 18 1 69
N 77 11 24 34 21 36 17 70 41 331
Total 99 16 31 40 26 41 17 88 42 400
Fishery Y 2 0 2 1 0 7 3 2 4 21 N 97 16 29 39 26 34 14 86 38 379
Total 99 16 31 40 26 41 17 88 42 400
Bicycle Y 56 5 22 30 21 34 14 65 33 280 N 43 11 9 10 5 7 3 23 9 120
Total 99 16 31 40 26 41 17 88 42 400
Livestock Y 55 9 21 28 21 34 13 63 32 276 N 44 7 10 12 5 7 4 25 10 124
Total 99 16 31 40 26 41 17 88 42 400 Improved equipment
Y 4 3 2 3 4 1 1 6 2 26 N 95 13 29 37 22 40 16 82 40 374
Total 99 16 31 40 26 41 17 88 42 400
Savings Y 81 15 26 32 20 32 13 71 35 325 N 18 1 5 8 6 9 4 17 7 75
Total 99 16 31 40 26 41 17 88 42 400 Credit Facility
Y 91 16 29 39 25 36 14 82 40 372 N 8 0 2 1 1 5 3 6 2 28
Total 99 16 31 40 26 41 17 88 42 400 Salary Y 44 5 20 22 18 29 13 52 29 232 Wage N 55 11 11 18 8 12 4 36 13 168 Total 99 16 31 40 26 41 17 88 42 400
Ushus-Journal of Business Management, Vol. 16, No. 1 ISSN 0975-3311
32
The cross tabulation further validates the results of the ANOVA test. Because, in the test results it have been seen that there exist no significant difference between the savings, credit facilities and the livelihood generating activities undertaken by the beneficiaries. Here also the case is same, the beneficiaries who have savings and credit facilities have undertaken different activities, which means that they have not confined themselves to one activity. They can opt for any livelihood generating activity which they think is suitable for them.
Further, the table shows that the beneficiaries have scope for getting themselves engaged in any other livelihood generating activity along with their primary activity. The substitute activity would give them more support to make their living better. For example, 99 of the respondents as shown in the second column (land) are earning their livelihood through agricultural activities but only 8 of them have agricultural land. Since, they have other livelihood assets with them (e.g. 55 have livestock), so they may engage in other activities for which they have the necessary resources.
According to Juan Somavia, ILO Director- General Social Status Index (SSI) and Economic Status Index (ESI) “Microcredit plays a critical role in empowering women, helps deliver newfound respect, independence, and participation for women in their communities and in their households” (Mayoux, 2000)
The most important thing to mention here in this study is that the beneficiaries of micro finance studied are all women. Women constitute seventy percent of the world‟s poor. Still, conventionally, the financing institutions of the formal sector prefer to lend fund to the males and other businesses. So, women are the most neglected in getting finance. So, microfinance is a major support system to them as it helps them to borrow money and use this borrowed fund to utilise in earning a sustainable livelihood. It empowers them and makes them to contribute in the economic growth of the nation in general and in growth of their families and communities in particular (ILO, Geneva).
In this study, the researcher has opted to calculate the changes in the socio-economic status of the beneficiaries by computing the
Nikita Sharma Sustainable Livelihood and Socio-economic Status
33
Social Change Index and Economic Change Index. These indexes were used by Islam et. al. (2008)in their study on poverty alleviation of rural women in Bangladesh and by Ahmed et. al. (2011) to study the impact of micro-credit programme on changing the livelihood status of rural women. The indexes are computed as follows:
Social Status Index (SSI)
The Social Status Index is calculated by using the following formula:
Social Status Index (SSI) = 𝒘𝒊𝒇𝒊
𝒏
where, wi= Weight fi = No. of Respondents n = Total Respondents
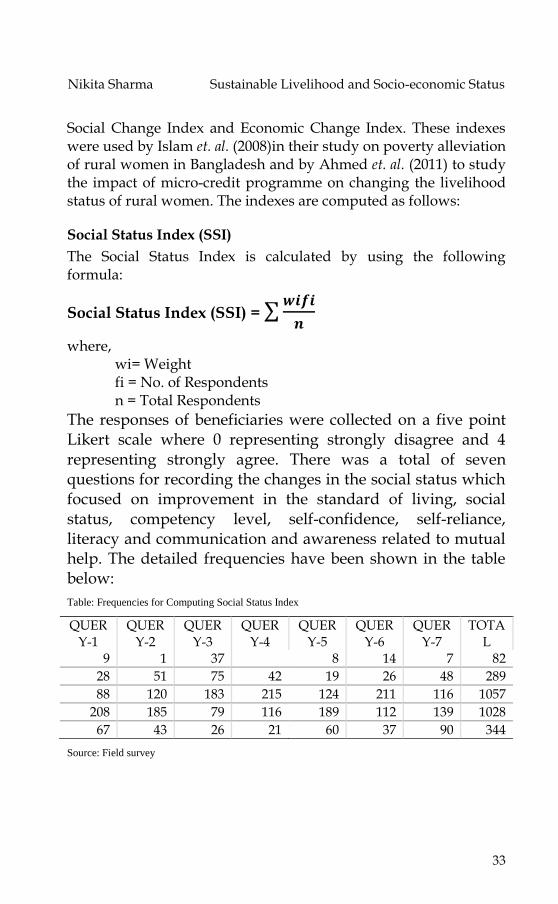
The responses of beneficiaries were collected on a five point Likert scale where 0 representing strongly disagree and 4 representing strongly agree. There was a total of seven questions for recording the changes in the social status which focused on improvement in the standard of living, social status, competency level, self-confidence, self-reliance, literacy and communication and awareness related to mutual help. The detailed frequencies have been shown in the table below:
Table: Frequencies for Computing Social Status Index
QUERY-1
QUERY-2
QUERY-3
QUERY-4
QUERY-5
QUERY-6
QUERY-7
TOTAL
9 1 37 6 8 14 7 82
28 51 75 42 19 26 48 289
88 120 183 215 124 211 116 1057
208 185 79 116 189 112 139 1028
67 43 26 21 60 37 90 344
Source: Field survey
Ushus-Journal of Business Management, Vol. 16, No. 1 ISSN 0975-3311
34
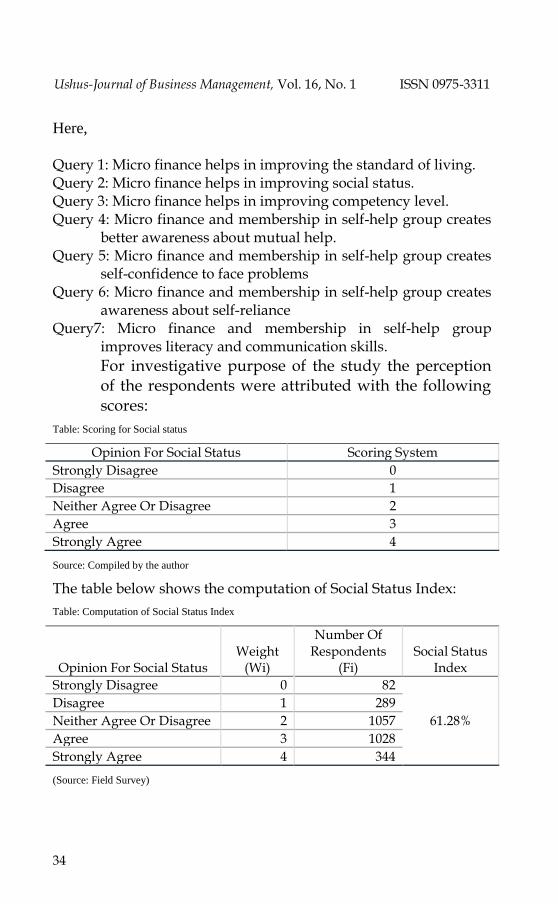
Here,
Query 1: Micro finance helps in improving the standard of living. Query 2: Micro finance helps in improving social status. Query 3: Micro finance helps in improving competency level. Query 4: Micro finance and membership in self-help group creates
better awareness about mutual help. Query 5: Micro finance and membership in self-help group creates
self-confidence to face problems Query 6: Micro finance and membership in self-help group creates
awareness about self-reliance Query7: Micro finance and membership in self-help group
improves literacy and communication skills.
For investigative purpose of the study the perception of the respondents were attributed with the following scores:
Table: Scoring for Social status
Opinion For Social Status Scoring System
Strongly Disagree 0
Disagree 1
Neither Agree Or Disagree 2
Agree 3
Strongly Agree 4
Source: Compiled by the author
The table below shows the computation of Social Status Index:
Table: Computation of Social Status Index
Opinion For Social Status Weight
(Wi)
Number Of Respondents
(Fi) Social Status
Index
Strongly Disagree 0 82
61.28%
Disagree 1 289
Neither Agree Or Disagree 2 1057
Agree 3 1028
Strongly Agree 4 344
(Source: Field Survey)
Nikita Sharma Sustainable Livelihood and Socio-economic Status
35
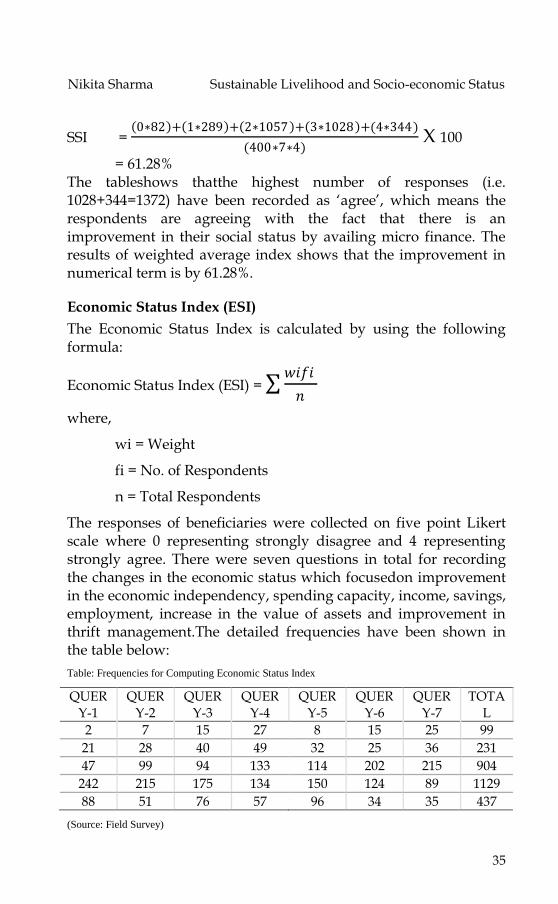
SSI = 0∗82 + 1∗289 + 2∗1057 + 3∗1028 +(4∗344)
(400∗7∗4) X 100
= 61.28% The tableshows thatthe highest number of responses (i.e. 1028+344=1372) have been recorded as „agree‟, which means the respondents are agreeing with the fact that there is an improvement in their social status by availing micro finance. The results of weighted average index shows that the improvement in numerical term is by 61.28%.
Economic Status Index (ESI)
The Economic Status Index is calculated by using the following formula:
Economic Status Index (ESI) = 𝑤𝑖𝑓𝑖
𝑛
where,
wi = Weight
fi = No. of Respondents
n = Total Respondents
The responses of beneficiaries were collected on five point Likert scale where 0 representing strongly disagree and 4 representing strongly agree. There were seven questions in total for recording the changes in the economic status which focusedon improvement in the economic independency, spending capacity, income, savings, employment, increase in the value of assets and improvement in thrift management.The detailed frequencies have been shown in the table below:
Table: Frequencies for Computing Economic Status Index
QUERY-1
QUERY-2
QUERY-3
QUERY-4
QUERY-5
QUERY-6
QUERY-7
TOTAL
2 7 15 27 8 15 25 99
21 28 40 49 32 25 36 231
47 99 94 133 114 202 215 904
242 215 175 134 150 124 89 1129
88 51 76 57 96 34 35 437
(Source: Field Survey)
Ushus-Journal of Business Management, Vol. 16, No. 1 ISSN 0975-3311
36
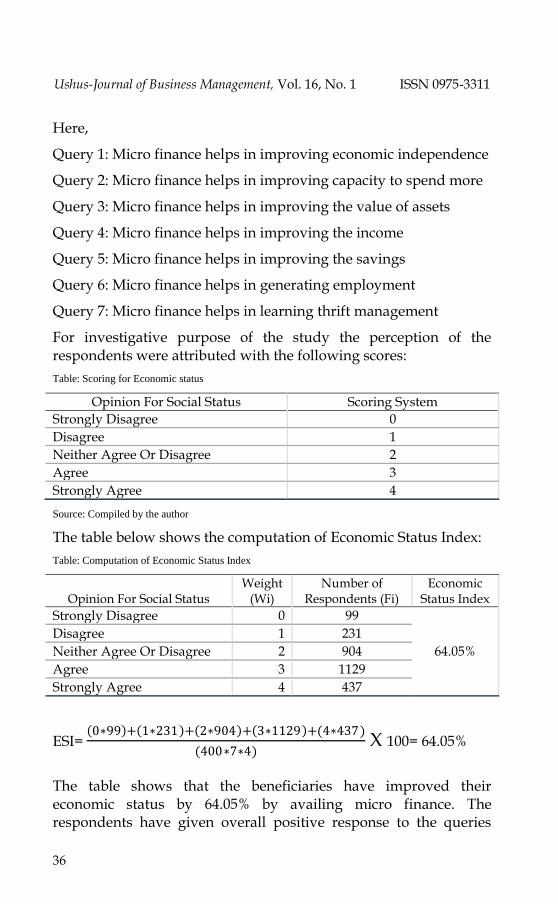
Here,
Query 1: Micro finance helps in improving economic independence
Query 2: Micro finance helps in improving capacity to spend more
Query 3: Micro finance helps in improving the value of assets
Query 4: Micro finance helps in improving the income
Query 5: Micro finance helps in improving the savings
Query 6: Micro finance helps in generating employment
Query 7: Micro finance helps in learning thrift management
For investigative purpose of the study the perception of the respondents were attributed with the following scores:
Table: Scoring for Economic status
Opinion For Social Status Scoring System
Strongly Disagree 0
Disagree 1
Neither Agree Or Disagree 2
Agree 3
Strongly Agree 4
Source: Compiled by the author
The table below shows the computation of Economic Status Index:
Table: Computation of Economic Status Index
Opinion For Social Status Weight
(Wi) Number of
Respondents (Fi) Economic
Status Index
Strongly Disagree 0 99
64.05%
Disagree 1 231
Neither Agree Or Disagree 2 904
Agree 3 1129
Strongly Agree 4 437
ESI= 0∗99 + 1∗231 + 2∗904 + 3∗1129 +(4∗437)
(400∗7∗4) X 100= 64.05%
The table shows that the beneficiaries have improved their economic status by 64.05% by availing micro finance. The respondents have given overall positive response to the queries
Nikita Sharma Sustainable Livelihood and Socio-economic Status
37
related to improvement in their economic dependency, improvement in income etc.
Conclusion
Micro finance has played an important role in the lives of the weaker section of the society by becoming an accessible input to own livelihood assets and to invest these livelihood assets for generating livelihood. Micro finance has helped overcome the challenges pertaining to accessing formal financing by rural folks, especially women. The Sustainable Livelihood Framework explains the different aspects related to earning sustainable livelihood, which includes the vulnerability (climate change, natural disaster etc.) in the context of livelihood, the livelihood assets (natural, physical, financial, social and human), livelihood generating activities, outcomes (income) and the external important factors like policies of government, different institutions etc.
The analysis of primary data has brought forth positive results, which show that micro finance not only plays an indispensable role in acquiring livelihood assets but also in improving their socio-economic status. The study was conducted in a rural area in the state of Assam and it has been shown that micro finance still has immense scope to make life better for the weaker section of the society by helping them make their livelihood sustainable.
References
Ahmed, F., Siwar, C., Idris, N. A. H., & Begum, R. A. (2011). Impact of Grameen bank microcredit programme on changing livelihood status of the rural women in Panchagarh District of Bangladesh. American Journal of Applied Sciences, 8(10), 973-978.
Alkire, S. (2005). Valuing freedoms: Sen's capability approach and poverty reduction. Oxford University Press on Demand.
Baumann, P. (2000). Sustainable livelihoods and political capital: Arguments and evidence from decentralisation and natural resource management in India (p. 136). London: Overseas Development Institute.
Bhuiyan, A. B., Siwar, C., Ismail, A. G., & Islam, M. A. (2012). Microfinance and sustainable livelihood: A conceptual linkage of
Ushus-Journal of Business Management, Vol. 16, No. 1 ISSN 0975-3311
38
Microfinancing approaches towards sustainable livelihood. American Journal of Environmental Sciences, 8(3), 328-333.
Carney, D. (2003). Sustainable livelihoods approaches: progress and possibilities for change. London: Department for International Development.
Chambers, R., & Conway, G. (1992). Sustainable rural livelihoods: practical concepts for the 21st century. Institute of Development Studies (UK).
Ellis, F. (2000). Rural livelihoods and diversity in developing countries. Oxford university press.
George, D., & Mallery, P. (2003). SPSS for Windows Step by Step: A Simple Guide and Reference. 11.0 update (4th ed.). Boston: Allyn & Bacon.
Hinshelwood, E. (2003). Making friends with the sustainable livelihoods framework. Community Development Journal, 38(3), 243-254.
Islam M.M., Ali R.N., Salehin M.M.& Islam A.H.M.S. (2008). Rural Women and Poverty in Alleviation in Bangladesh. Journal of Bangladesh Agricultural University, 6, 415-421.
Mayoux, L. 2000. Jobs, gender, and small enterprises: getting the policy environment right. Geneva: International Labour Organization (ILO).
Pema, L.& Suranjana, S. (2011). Microfinance: Indian Perspectives. Banking Finance, 24(7), 11-15.
Rao K.S., Srinivasa& Kumar V.D. Santosh (2011). Microfinance: A need for sustainable development. Banking Finance, 24(1), 10-13.
Scoones, I. (1998). Sustainable rural livelihoods: a framework for analysis, IDS Working Paper 72, IDS: Brighton.
Forsyth, T. (2007). Sustainable livelihood approaches and soil erosion risks: who is to judge?. International Journal of Social Economics, 34(1/2), 88-102.
Sample size calculator. Retrieved November 20, 2016, from https://www.checkmarket.com/sample-size-calculator-