Supplemental Data Article Acquisition of Granule Neuron Precursor Identity Is a Critical Determinant...
12
Cancer Cell, Volume 14 Supplemental Data Article Acquisition of Granule Neuron Precursor Identity Is a Critical Determinant of Progenitor Cell Competence to Form Shh-Induced Medulloblastoma Ulrich Schüller, Vivi M. Heine, Junhao Mao, Alvin T. Kho, Allison K. Dillon, Young-Goo Han, Emmanuelle Huillard, Tao Sun, Azra H. Ligon, Ying Qian, Qiufu Ma, Arturo Alvarez-Buylla, Andrew P. McMahon, David H. Rowitch, and Keith L. Ligon Supplemental Experimental Procedures Transgenic Animals, Mouse Procedures, and Genotyping All mouse procedures were performed in accordance with National Research Council recommendations for the care and use of animals. In all experiments embryos were obtained from timed pregnancies, with plug detection date defined as E0.5. For all animals, genotyping was done by PCR analysis using genomic DNA from mouse tail biopsies. Primers have been previously published in the respective literature for each line. Cre expression was further verified by immunohistochemistry using anti-Cre antibodies (see below). The ROSA26-eYFP flox/flox (Gt(ROSA)26Sor tm1(EYFP)Cos /J), Z/EG flox/flox (Tg(CAG- Bgeo/GFP)21Lbe), SmoM2 flox/flox (Gt(ROSA)26Sor tm1(Smo/EYFP)Amc /J) and hGFAP-cre (FVB- Tg(GFAP-cre)25Mes/J) mouse lines were obtained from Jackson Laboratory (Bar Harbour, ME). The Gli1-creERT2 and Shh-creERT2 mouse lines have been previously described (Ahn and Joyner, 2005; Harfe et al., 2004) and were induced with Tamoxifen at postnatal day 10. Immunocompromised Icr-SCID mice (Model #ICRSC-M) were obtained from Taconic Inc. (Germantown, NY). Generation and characterization of CAGCAT-EGFP flox/flox and Math1-cre transgenic animals that carry bacteriophage P1 cre recombinase under control of a 1.4 kb upstream Math1 enhancer element have been previously described (Kawamoto et al., 2000; Schüller et al., 2007). The Tlx3-cre mouse line was generated by insertion of the cre recombinase cassette just following the Tlx3 start site within the first coding exon of the Tlx3 locus (Xu et al., 2008). Generation of Olig2-tva-cre Mice Olig2-tva-cre mice were constructed using a 3.1Kb Sac I fragment from the Olig2 locus as a 5’ arm and a 3.6Kb Sma I-EcoRV fragment for the 3’ arm of the targeting vector. The full-length coding region of TVA receptor was cloned in tandem with an IRES-cre PGK neo cassette to yield a bicistronic, targeted allele capable of expression of TVA and Cre from a single transcript. The targeting construct was electroporated into 129 ES cells and colonies selected for neomycin resistance resulting in a targeting frequency of 4%. Several lines were used to generate high
Transcript of Supplemental Data Article Acquisition of Granule Neuron Precursor Identity Is a Critical Determinant...

Cancer Cell, Volume 14
Supplemental Data
Article
Acquisition of Granule Neuron Precursor Identity
Is a Critical Determinant of Progenitor Cell
Competence to Form Shh-Induced Medulloblastoma Ulrich Schüller, Vivi M. Heine, Junhao Mao, Alvin T. Kho, Allison K. Dillon, Young-Goo Han, Emmanuelle Huillard, Tao Sun, Azra H. Ligon, Ying Qian, Qiufu Ma, Arturo Alvarez-Buylla, Andrew P. McMahon, David H. Rowitch, and Keith L. Ligon Supplemental Experimental Procedures Transgenic Animals, Mouse Procedures, and Genotyping All mouse procedures were performed in accordance with National Research Council recommendations for the care and use of animals. In all experiments embryos were obtained from timed pregnancies, with plug detection date defined as E0.5. For all animals, genotyping was done by PCR analysis using genomic DNA from mouse tail biopsies. Primers have been previously published in the respective literature for each line. Cre expression was further verified by immunohistochemistry using anti-Cre antibodies (see below).
The ROSA26-eYFPflox/flox (Gt(ROSA)26Sortm1(EYFP)Cos/J), Z/EGflox/flox (Tg(CAG-Bgeo/GFP)21Lbe), SmoM2flox/flox (Gt(ROSA)26Sortm1(Smo/EYFP)Amc/J) and hGFAP-cre (FVB-Tg(GFAP-cre)25Mes/J) mouse lines were obtained from Jackson Laboratory (Bar Harbour, ME). The Gli1-creERT2 and Shh-creERT2 mouse lines have been previously described (Ahn and Joyner, 2005; Harfe et al., 2004) and were induced with Tamoxifen at postnatal day 10. Immunocompromised Icr-SCID mice (Model #ICRSC-M) were obtained from Taconic Inc. (Germantown, NY). Generation and characterization of CAGCAT-EGFPflox/flox and Math1-cre transgenic animals that carry bacteriophage P1 cre recombinase under control of a 1.4 kb upstream Math1 enhancer element have been previously described (Kawamoto et al., 2000; Schüller et al., 2007). The Tlx3-cre mouse line was generated by insertion of the cre recombinase cassette just following the Tlx3 start site within the first coding exon of the Tlx3 locus (Xu et al., 2008). Generation of Olig2-tva-cre Mice Olig2-tva-cre mice were constructed using a 3.1Kb Sac I fragment from the Olig2 locus as a 5’ arm and a 3.6Kb Sma I-EcoRV fragment for the 3’ arm of the targeting vector. The full-length coding region of TVA receptor was cloned in tandem with an IRES-cre PGK neo cassette to yield a bicistronic, targeted allele capable of expression of TVA and Cre from a single transcript. The targeting construct was electroporated into 129 ES cells and colonies selected for neomycin resistance resulting in a targeting frequency of 4%. Several lines were used to generate high
percentage chimeras and one line was selected for further studies. Southern blot confirmation of targeting was performed using a 500bp HindIII/SacI 5’ fragment as probe and a PacI/EcoRV 700bp 3’ fragment as probe. Detection of wild type band was 12.6 kb and mutant targeted allele produced a 7.8 kb band. Targeting and ES cell work was performed with the assistance of the Dana-Farber Cancer Institute Transgenic-Gene Targeting Core Facility. Routine PCR genotyping was performed on the established lines using internal primers specific for Cre as well as wild type Olig2 primers, which flank the targeted allele, producing product only from wild type loci. Genotyping for routine maintenance was performed by PCR using wild-type Olig2 primers (forward 5’-CAC AGG AGG GAC TGT GTC CT-3’, reverse 5’-TAG ATC TCG CTC ACC AGT CG-3’). The wild-type Olig2 primers flank the inserted mutant cassette and produce a 429bp product from the wild type but not the mutant allele. The mutant allele was detected using internal cre primers (forward 5’-TCC GGG CTG CCA CGA CCA A -3’; reverse 5’-GGC GCG GCA ACA CCA TTT T-3’) to produce a 446bp product. In Utero RCAS Injection of Olig2-tva-cre Embryonic Hindbrain For in utero injections, anesthesia was induced using isoflurane and the uterine horns of E15.5 timed pregnant Olig2-tva-cre mice were exposed in a sterile biosafety level II hood. Retrovirus (1 µl) was injected into the rhombic lip through a beveled calibrated glass micropipette (Drummond Scientific, PA, USA). After injection, the peritoneal cavity was lavaged with 5ml 0.9% NaCl and the uterine horns were replaced. After closure of the wounds, the pregnant females were injected with buprenorphine (0.003 mg/100 g). At p7, pups were perfused with PFA. Tumor Transplantation Assay For tumor cell injections into Icr-SCID mice, cells were dissected fresh, dissociated and resuspended in DMEM at a concentration of 100,000 viable cells/µl. One microliter of cells in DMEM was injected using a stereotactic frame into the cerebellum at a position 0 x 2 x 1.5 mm with respect to Lambda and into the striatum at a position of 0 x 2 x 2.5 mm with respect to Bregma. Tissue Collection and Histology Human tissue samples were obtained in accordance with the rules and regulations for human tissue collection and their use in this study was approved by the Institutional Review Boards of the Brigham and Women’s Hospital/Partners Healthcare and Children’s Hopsital Boston. Each sample used in this study had received a clinical neuropathologic diagnosis and was independently reconfirmed by two neuropathologists (K.L.L. and U.S.). Mouse embryos and brains were fixed in 4% paraformaldehyde/PBS overnight at 4°C after dissection. Tissue for frozen sections was equilibrated in 0.5M sucrose/PBS (pH7.4) and embedded in OCT. 12 µm sections were prepared on Superfrost plus slides (Fisher). Tissue for paraffin-embedded sections was dehydrated, embedded and sectioned at 5 µm according to standard protocols used by the Dana-Farber/Harvard Cancer Center Rodent Histopathology Core. Overall morphology was assessed by staining with H&E. All photomicrographs including those from immunohistochemical experiments were taken digitally using a Zeiss Axioskop and Axiocam imaging system. For whole mount pictures of mouse medulloblastomas, fluorescent and bright-field images were overlaid using Photoshop software (Adobe Systems).

Immunocytochemistry and In Situ Hybridization All samples for immunocytochemical procedures were subjected to 0.5% Triton-X in blocking solution for increased permeability and antigen heat retrieval was performed at 99°C in 10mM sodium citrate buffer for 20 minutes. For immunocytochemistry on tissue culture samples, cells were grown on poly-L-ornithine coated coverslips (Fisher, 12mm). Coverslip cultures were fixed in 4% paraformaldehyde/PBS. Cells were washed in PBS and incubated for 1 hr in 5% normal goat serum, 0.1% bovine serum albumin and 0.3% Triton X-100 to block non-specific binding. All primary antibodies were applied overnight. Staining was performed using fluorescence-labeled secondary antibodies or using the HRP/DAB based Envision+ staining system (DAKO) according to the manufacturers specifications with the only modification being increased incubation time for secondary antibodies (one hour, room temperature). Counterstaining was performed using Harris hematoxylin (Sigma) or with DAPI (dihydrochloride; 2 µg/ml; Calbiochem). Sections or coverslips were mounted in Fluoromount-G aqueous mounting medium (Southern Biotech)
Primary antibodies used were: Anti-GFP (A-11122, Molecular Probes, 1:200; GFP-1020, Aves Labs, 1:500), anti-OLIG2 (DF308, polyclonal, gift from Dr. C. Stiles, Boston, 1:20,000), anti-Zic (polyclonal, recognizes Zic1 and other Zic proteins, gift from Dr. R. Segal, Boston, 1:3000), anti-GFAP (G3893, Sigma, 1:500), anti-NeuN (A60, Chemicon, 1:500), anti-phospho HistoneH3 (6G3, Cell Signaling, 1:100), anti-Ki67 (MM1, Novocastra, 1:100), anti-Calbindin (CB-955, Sigma, 1:1000), anti-Pax2 (polyclonal, Zymed, 1:200), anti-Cre (polyclonal, Covance, 1:1500), anti-Pax6 (polyclonal, Chemicon (AB5409), 1:1000 and monoclonal, DSHB, 1:50), anti-Synaptophysin (A0010, DAKO, 1:100), anti-Nestin (25, BD Transduction Laboratories, 1:2000) and anti-TuJ1 (MMS435P, BABCO, 1:500). Fluorescence secondary antibodies were anti-mouse Alexa Fluor 488 (A11029, Molecular Probes, 1:500), anti-rabbit Alexa Fluor 555 (A21428), anti-chicken Alexa Fluor 488 (A11039), and/or anti-mouse Alexa Fluor 350 (A21049).
Gene fragments for in situ hybridization (ISH) were directly amplified from plasmids using ready-made T7, T3 or SP6 primers (IDT). Digoxigenin-labeled antisense probes were made using amplified DNA as template and SP6, T3 or T7 as RNA polymerases (Roche). In situ hybridization on frozen sections was performed according to standard protocols. Briefly, brain sections were hybridized overnight with labeled RNA probes at 65°C, washed twice in 0.2x SSC pH 4.5, 0.1% Tween20 at 65°C, washed twice in MBST buffer, pH 7.5, containing 100 mM maleic acid, 150 mM NaCl2, 2mM levamisole and 0.1% Tween20, blocked in MBST with 2% BM blocking agent (Roche) and 20% lamb serum, and incubated with alkaline phosphatase labeled anti-DIG antibodies (Roche, 1:2500 in 2% serum) for 2 hours. Sections were washed and color was visualized using BM purple (Roche) (detailed protocol available upon request). Colocalization of IHC and FISH Four micron formalin-fixed, paraffin-embedded sections were prepared from archival human MB specimens previously identified as having amplification of the MYC (c-Myc) locus by qPCR (Herms et al., 2000). IHC detection of OLIG2 protein was performed as described above using DAB as substrate and allowing only short-term development for bright-field detection. Fluorescent in situ hybridization (FISH) was then performed on the IHC stained slides using a probe to the MYC locus (Dual color break apart probe, Abbot Molecular LSI-C-MYC, #32-191096, Abbott Molecular Labs) following pepsin digestion and heat treatment of slides. Imaging was performed using the Cytovision software (Applied Imaging Inc.) to colocalize
bright-field IHC signals and fluorescent FISH signals in single cells. Images for OLIG2 IHC and MYC FISH were pseudocolored, merged and colocalized using Photoshop software. Results were collected from 2 cases and 50 cells in each were analyzed. Microarray Analysis and Biomathematics The transcriptome of 21 cre-activated tumors: Math1-derived (n = 3), Tlx3- (n = 3), Olig2- (n = 7), hGFAP- (n = 6), and Ptc+/- (n = 2), and control (n = 6) were profiled using the Affymetrix GeneChip Mouse Genome 430 2.0 Plus microarray which contains 54,675 probes representing 13,002 unique NCBI Entrez identified genes. We computed the expression signal fold change for each of the probes between any 2 tissue groups using the geometric average logarithmic fold (AvgLF) method described in (Zhao et al., 2002; Kho et al., 2004). Transcriptomes of the developing mouse cerebellum postnatal from days 1 to 60 were profiled using the Affymetrix Murine Mu11K set, described previously (Kho et al., 2004) following a previously described protocol (Zhao et al., 2002). Between these microarray platforms are 7,003 common Entrez-identified unique genes. Each sample transcriptome profile was comprised of the 7,003 genes common to the 2 microarray platforms and ranked normalized to reduce the influence of probes with extremal expression signal measurements across the 2 microarray platforms.
Following previously described procedures (Kho et al., 2004), we first computed the principal components for the developing mouse cerebellum (its transcriptome). Principal component analysis (PCA) is an unsupervised (sample labels are not input parameters) method for identifying, quantifying and ranking the dominant sample components (PC’s) capture 68.50% of the total sample (transcriptome) variance of the developing mouse cerebellum. In the space of PC1-3, we noted a temporally contiguous localization of the developing cerebellar time points. The PC1 coordinate axis appeared to be correlated with the day of development. PC2 and PC3 coordinate axes reflected differences in mid (P15-30) to late (P50-60), and very early (P1-3) to early (P5-10) cerebellar development, respectively. Next, we projected the mouse tumor and control samples (as 7,003-gene profiles) into the PC1-3 space of mouse cerebellar development as in (Kho et al., 2004). The 6 control mouse cerebellar tissue profiles localized with the later time points of cerebellar development, whereas the tumor profiles localized with the earlier developmental time points. The closest average developmental time point to all tumors was P1, and for all controls P21.
Hierarchical clustering (agglomerative with average linkage) (Duda et al., 2001) was used to visualize the 150 tumor type-specific (over-expressed) probes and genes in relation to the different tumor samples. The measure of similarity here was Pearson (linear) correlation.
Supplemental References Ahn, S. and Joyner, A.L. (2005). In vivo analysis of quiescent adult neural stem cells responding to Sonic hedgehog. Nature. 437, 894-897.
Duda,R.H., Hart,P.E., and Stork,D.G. (2001). Pattern Classification. (New York: Wiley).
Harfe, B.D., Scherz, P.J., Nissim, S., Tian, H., McMahon, A.P., and Tabin, C.J. (2004). Evidence for an expansion-based temporal Shh gradient in specifying vertebrate digit identities. Cell. 118, 517-528.
Herms, J., Neidt, I., Lüscher, B., Sommer, A., Schurmann, P., Schröder, T., Bergmann, M., Wilken, B., Probst-Cousin, S., Hernaiz-Driever, P., Behnke, J., Hanefeld, F., Pietsch, T., and Kretzschmar, H.A. (2000). C-MYC expression in medulloblastoma and its prognostic value. Int. J. Cancer. 89, 395-402.
Kawamoto, S., Niwa, H., Tashiro, F., Sano, S., Kondoh, G., Takeda, J., Tabayashi, K., and Miyazaki, J. (2000). A novel reporter mouse strain that expresses enhanced green fluorescent protein upon Cre-mediated recombination. FEBS Lett. 470, 263-268.
Kho, A. T., Zhao, Q., Cai, Z., Butte, A. J., Kim, J. Y., Pomeroy, S. L., Rowitch, D. H., and Kohane, I. S. (2004). Conserved mechanisms across development and tumorigenesis revealed by a mouse development perspective of human cancers. Genes Dev 18, 629-40.
Schüller, U., Zhao, Q., Godinho, S.A., Heine, V.M., Medema, R.H., Pellman, D., and Rowitch, D.H. (2007). Forkhead transcription factor FoxM1 regulates mitotic entry and prevents spindle defects in cerebellar granule neuron precursors. Mol. Cell Biol. 27, 8259-8270.
Xu, Y., Lopes, C., Qian, Y., Cheng, L., Goulding, M., Turner, E., Lima, D., and Ma, Q. (2008). Tlx1 and Tlx3 coordinate specification of dorsal horn pain-modulary peptidergic neurons. J. Neuroscience. 28, 4037-4046
Zhao, Q., Kho, A., Kenney, A.M., Yuk, D.D., Kohane, I., and Rowitch, D.H. (2002). Identification of genes expressed with temporal-spatial restriction to developing cerebellar neuron precursors by a functional genomic approach. Proc. Natl. Acad. Sci. U. S. A. 99, 5704-5709.
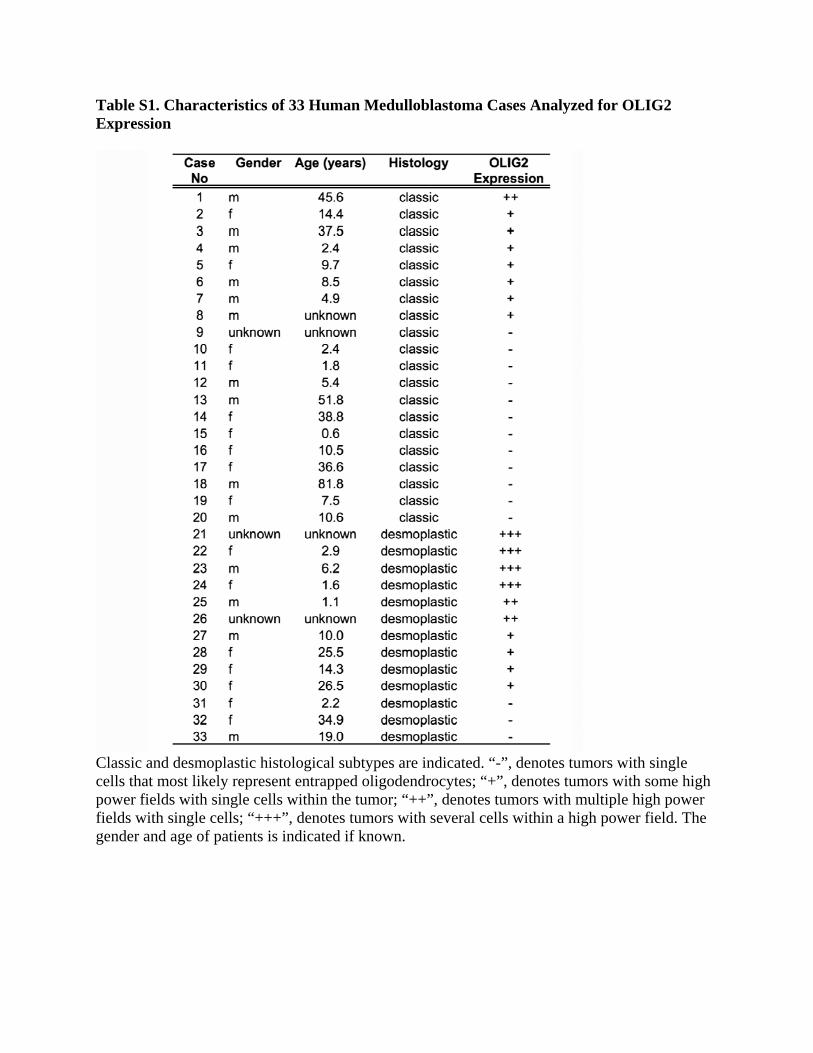
Table S1. Characteristics of 33 Human Medulloblastoma Cases Analyzed for OLIG2 Expression
Classic and desmoplastic histological subtypes are indicated. “-”, denotes tumors with single cells that most likely represent entrapped oligodendrocytes; “+”, denotes tumors with some high power fields with single cells within the tumor; “++”, denotes tumors with multiple high power fields with single cells; “+++”, denotes tumors with several cells within a high power field. The gender and age of patients is indicated if known.

Figure S1. Olig2-tva-cre Fate Mapping Demonstrates Olig2 Contributions to Multiple Lineages within the Cerebellum (A-C) Olig2-tva-cre crossed to the ROSA26-YFP conditional reporter line demonstrates fate mapping in cerebellum is predominantly within white matter at P21.
(D-F) Overlap of the fate map reporter was confirmed in (D) MBP-expressing oligodendrocytes, (E) calbindin+ Purkinje cells, and (F) interneurons that express AP2β.
(G-I) Further results of RCAS-GFP viral infection of the E15 RL of Olig2-tva-cre mice. Tracing at P7 for Olig2+ cells in white matter (probably oligodendrocytes) as well as interneurons (AP2β+ or Pax2+) is illustrated in the insets. The low magnification images are shown to indicate the rare cells that are marked by this technique.

Figure S2. Tlx3 Expression in Developing Cerebellum Sagittal cerebellar analysis at the times indicated reveals that expression of Tlx3 from its onset at E14 until early postnatal stages is restricted to the EGL of lobes VI-IX (arrows), consistent with fate mapping analysis of Tlx3-cre (see Figure 4). No expression was observed in the ventricular zone (VZ) or rostral rhombic lip (rRL) at any stage.

Figure S3. Zoom-in of the MB’s Profiles on Mouse Cerebellar Development Principal Component Space Expanded from Figure 5A Note that both Olig2 and hGFAP tumor molecular profiles are more heterogeneous than the other 3 MB types, and the Olig2 and hGFAP transcriptomic spectrum together encompasses the transcriptomic diversity of all MBs under consideration. Second, Olig2 profiles segregate with an earlier transcriptomic state of cerebellar development than the hGFAP profiles. PC1 coordinate centroids were significantly different in Tlx3 versus Ptc+/-, Olig2 versus hGFAP, hGFAP versus Ptc+/-, p values < 0.05 (two-tailed t tests) but not between any other tumor combination. In particular, no significant differences were observed between hGFAP versus Math1, hGFAP versus Tlx3, Olig2 versus Math1 or Olig2 versus Tlx3 tumors.
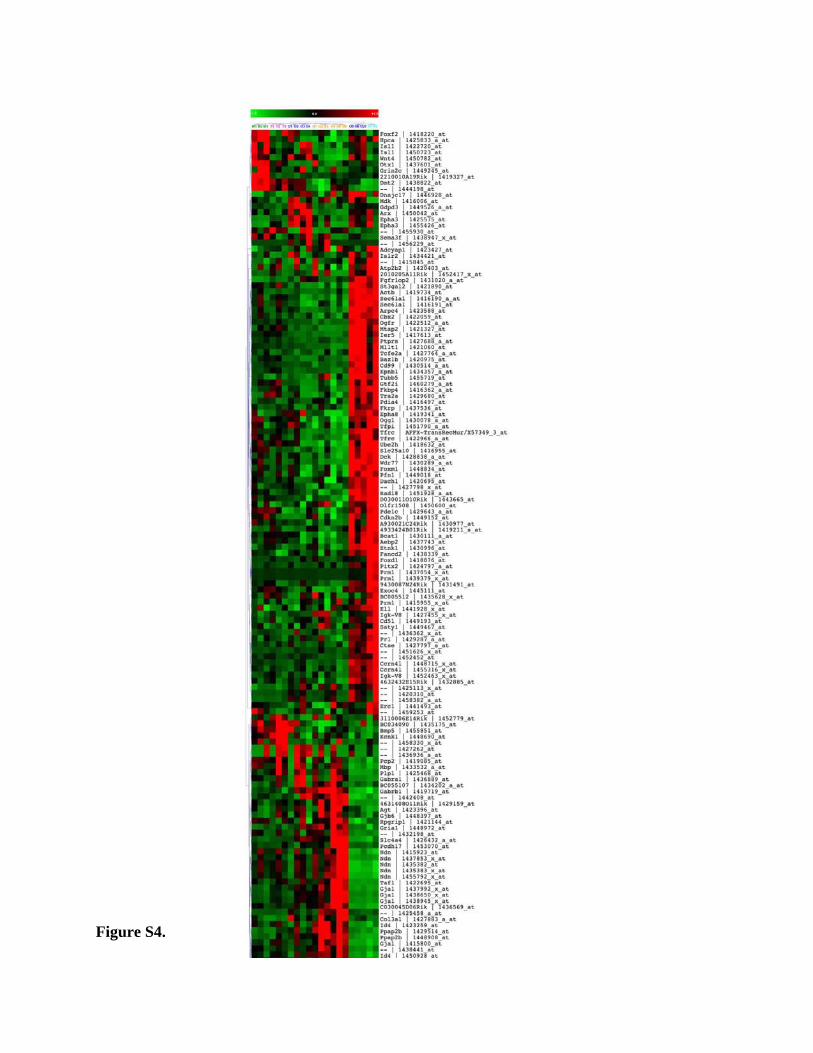
Figure S4.

Figure S4. Hierarchical Cluster Analysis of Math1-, Tlx3-, Olig2-, and hGFAP-cre × SmoM2 and Ptc+/--Derived Medulloblastoma Reveals Subtle Differences in Gene Expression Principal component analysis (Figure 5) shows that all tumors have an almost identical expression profile. However, it is possible to find subtle differences between tumors. Hierarchical cluster analysis of murine medulloblastomas arising from the various models demonstrates segregation of late (Math1-, Tlx3-cre)-stage progenitor-derived tumors from earlier stage (Olig2-, hGFAP-cre) progenitors. Ptc+/--derived tumors segregated most closely with early-stage progenitor-derived tumors. Classes were determined by 150 probes (corresponding to 110 unique genes) that were relatively overexpressed in one tumor type relative to the other four (>2.5 fold change). Clustering was agglomerative with average linking and measures of similarity were Pearson (linear) correlation.

Figure S5. Tumor-Competent Cells of the CGNP Lineage Can Give Rise to Diffuse and Focal Forms of Medulloblastoma (A) Scheme showing P7 neuronal progeny deriving from hGFAP- and Olig2-expressing progenitors of the embryonic CB. hGFAP+ cells produce the majority of granule neuron precursors (GNPs) as well as astrocytes (Glia) and INs. While some Olig2+ cells derive from hGFAP+ cells (dashed black arrow), additional sources are possible. Olig2+ cells of the rRL produce a subset of GNPs in cerebellar lobes IX and X and also give rise to INs and oligodendrocytes (Glia) in all lobes (red arrows). The dashed blue arrow indicates the possibility of GNP dedifferentiation in the context of Hedgehog-induced MB.
(B) Activation of SmoM2 in GNPs using hGFAP-cre or Math1-cre produced diffuse MB involving most cerebellar lobes and the vermis, while focal, posterior-lateral MB was produced from the Olig2-cre driver; Tlx3-cre produced tumors with posterior restriction.
(C) Possible cellular pathways of tumorigenesis. Introduction of an oncogene (red arrowheads) into multipotent (type A, giving rise to distinct progeny types B1, B2, and B3), unipotent (C2), or even differentiated (D2) subtypes of a tumor-competent lineage (e.g., GNPs of the CB) might result in a uniform tumor phenotype provided that only one stage (C2) is capable of rapid expansion in response to the signal. This seems to be the simplest model to fit our collective findings; however, tumor propagation from an A or B2 cell cannot be ruled out. The possibility of later dedifferentiation from D2 to C2 is speculative and is not supported by the present work.