A review of the genus Epsilon de Saussure (Hymenoptera: Vespidae: Eumeninae) from India
Clostridium perfringens Epsilon Toxin Targets GranuleCells in the Mouse Cerebellum and Stimulates GlutamateReleaseEtienne Lonchamp1, Jean-Luc Dupont1, Laetitia Wioland1, Raphael Courjaret1¤, Corinne Mbebi-
Liegeois1, Emmanuel Jover1, Frederic Doussau1, Michel R. Popoff2, Jean-Louis Bossu1, Jean de Barry1,
Bernard Poulain1*
1 Centre National de la Recherche Scientifique, Institut des Neurosciences Cellulaires et Integratives UPR3212, Strasbourg, France, 2 Unite des Anaerobies et Leurs Toxines,
Institut Pasteur a Paris, Paris, France
Abstract
Epsilon toxin (ET) produced by C. perfringens types B and D is a highly potent pore-forming toxin. ET-intoxicated animalsexpress severe neurological disorders that are thought to result from the formation of vasogenic brain edemas and indirectneuronal excitotoxicity. The cerebellum is a predilection site for ET damage. ET has been proposed to bind to glial cells suchas astrocytes and oligodendrocytes. However, the possibility that ET binds and attacks the neurons remains an openquestion. Using specific anti-ET mouse polyclonal antibodies and mouse brain slices preincubated with ET, we found thatseveral brain structures were labeled, the cerebellum being a prominent one. In cerebellar slices, we analyzed the co-staining of ET with specific cell markers, and found that ET binds to the cell body of granule cells, oligodendrocytes, but notastrocytes or nerve endings. Identification of granule cells as neuronal ET targets was confirmed by the observation that ETinduced intracellular Ca2+ rises and glutamate release in primary cultures of granule cells. In cultured cerebellar slices, wholecell patch-clamp recordings of synaptic currents in Purkinje cells revealed that ET greatly stimulates both spontaneousexcitatory and inhibitory activities. However, pharmacological dissection of these effects indicated that they were only aresult of an increased granule cell firing activity and did not involve a direct action of the toxin on glutamatergic nerveterminals or inhibitory interneurons. Patch-clamp recordings of granule cell somata showed that ET causes a decrease inneuronal membrane resistance associated with pore-opening and depolarization of the neuronal membrane, whichsubsequently lead to the firing of the neuronal network and stimulation of glutamate release. This work demonstrates that asubset of neurons can be directly targeted by ET, suggesting that part of ET-induced neuronal damage observed inneuronal tissue is due to a direct effect of ET on neurons.
Citation: Lonchamp E, Dupont J-L, Wioland L, Courjaret R, Mbebi-Liegeois C, et al. (2010) Clostridium perfringens Epsilon Toxin Targets Granule Cells in the MouseCerebellum and Stimulates Glutamate Release. PLoS ONE 5(9): e13046. doi:10.1371/journal.pone.0013046
Editor: Frederic Andre Meunier, The University of Queensland, Australia
Received April 29, 2010; Accepted September 3, 2010; Published September 30, 2010
Copyright: � 2010 Lonchamp et al. This is an open-access article distributed under the terms of the Creative Commons Attribution License, which permitsunrestricted use, distribution, and reproduction in any medium, provided the original author and source are credited.
Funding: EL and LW are recipients of a doctoral grant from the Mission pour la Recherche et l’Innovation Scientifique - Delegation Generale l’Armement (MRIS/DGA). RC has been supported by a grant from Association Francaise contre les Myopathies (AFM). Part of the experimental work has been supported by grantsfrom DGA (contract no. 03 34 046 to MRP and BP) and from Sanofi-Aventis France and Bayer Pharma as part of the BIOTOX multi-organism program, and theEuropean Neuroscience Institutes Network project (ENINET, contract Nu LSHM-CT-2005-019063 from the EU). The funders had no role in study design, datacollection and analysis, decision to publish, or preparation of the manuscript.
Competing Interests: The BIOTOX program, a multiorganisms/multifunders grant funding call organized by INSERM (the French national health and medicalresearch institute), was funded by both governmental and commercial sources (Sanofi-Aventis, Bayer-Pharma). The funders of the work did not play any role inthe research (determination of the objectives and aims, research plan design, etc.). The results obtained have not led to any patent or commercial product. Noneof the contributors has been or is an employee of the mentioned commercial entities. E. Lonchamp and L. Wioland have been supported by PhD grants of DGA,which belongs to the French Ministry of Defense, R. Courjaret was a post-doctoral fellow supported by a charity (AFM, i.e., French telethon), J. de Barry is apermanent staff member of INSERM (governmental), M. Popoff is employed by Institut Pasteur (nonprofit foundation), and all the other coauthors are CNRS(governmental) permanent staff. Thus, this does not alter the authors’ adherence to all the PLoS ONE policies on sharing data and materials.
* E-mail: [email protected]
¤ Current address: Weill Cornell Medical College-Qatar, Qatar Foundation - Education City, Doha, State of Qatar
Introduction
Epsilon toxin (ET) is a protein of 30 kDa produced by
Clostridium perfringens types B and D with a very high lethality
(,400.000 mouse LD100/mg protein). This ranks this toxin among
the 10 most potent poisonous substances so far known. Infection
with the bacteria occurs via food, water, animal litter or soil, and
causes severe, often fatal, enterotoxaemia (e.g. pulpy kidney disease
and diarrhoea) in sheep, goats, cattle, poultry and pigs [1]. ET is
secreted in the gut lumen as a proto-toxin and following its
activation by endoproteases the toxin compromises the intestinal
barrier [2]. This allows ET to spread through the blood-stream,
affecting the lungs, kidneys and the brain [1,3,4].
ET shares significant sequence homology and structural
similarities with aerolysin from Aeromonas hydrophila and with alpha
toxin produced by C. septicum and belongs to a large family of pore
forming bacterial toxins [5–7]. Most of its cellular mode of action
has been deduced from studies performed on renal cell lines or
purified membranes. After binding to specific, yet unknown,
membrane acceptor(s) ET undergoes a cholesterol-dependent
PLoS ONE | www.plosone.org 1 September 2010 | Volume 5 | Issue 9 | e13046
heptamerization leading to the formation of a transmembrane
pore [8–12]. The channel-forming domain of ET has been
recently identified [13]. The ET-induced pore leads to an efflux of
K+, and influx of Na+ and Cl2 [8,11,14,15]. In renal cells ET also
induces intracellular Ca2+ rise, ATP depletion and cell death,
which involves a caspase-independent process [12]. However, the
causal link between pore formation and altered functions remains
unclear: in conditions that prevent ET heptamerization ET can
cause cell death [12].
ET-intoxicated animals express severe neurological disorders
[1,4,16,17] associated with a marked increase in neurotransmitter
release (including glutamate and dopamine) and neuronal cell
death [18–21]. Altered neurons are found scattered among
apparently normal nerve cells in the cerebral cortex, hippocam-
pus, thalamus, basal ganglia and cerebellum; cerebellum is a
predilection site for the induction of early central nervous system
damage [4,18,22].
Since ET binds to capillary endothelial cells and alters the blood
brain barrier [23–25], the nerve tissue damages caused by ET
have been proposed to indirectly result from vasogenic edema [4].
The possibility that ET acts directly on the nerve tissue cells needs
to be considered. Several studies support such a possibility: the
bilateral symmetry of the damage caused by ET, notably in the
brain stem [22], and the local nerve-tissue alterations produced by
intra-hippocampal injection of ET [19] suggests a nerve-tissue
vulnerability to ET. However, the identity of the cells directly
altered by ET remains a matter of debate. On one hand, 125I-
labelled ET binds and forms pores in membranes purified from rat
brain synaptosomes [11,14,26]. On the other hand, the most
recent studies performed using GFP-tagged ET support the notion
that the toxin binds to cells belonging to the glial lineage (the
astrocytes and myelin, which is formed by oligodendrocytes), but
not to the neurons [25,27].
In this study, we addressed the possibility that ET targets
neurons. To identify the nerve tissue regions of interest, we
examined ET-binding on brain slices by immunofluorescence. An
intense staining was observed in the cerebellum. By analyzing the
staining of ET and cell markers of interest we established that ET
binds to the cell body and dendrites of granule neurons and
oligodendrocytes, but not to the astroglial cells, GABAergic
neurons, or nerve terminals in the cerebellar cortex. To investigate
the effect of ET on neurons, electrophysiological and pharmaco-
logical analyses were performed and revealed that ET directly
depolarizes granule cell somata, thereby greatly stimulating their
firing activity and ensuing glutamate release. However, we found
that ET has no direct effect on inhibitory cerebellar GABAergic
interneurons and Purkinje cells. The effect of ET on glutamatergic
neurons is likely to enhance the highly potent action of the toxin,
and this may explain why ET lethality is 100-fold higher than that
of other structurally related, pore-forming toxins.
Results
ET binds to defined regions of the cerebellar cortexWhole brain acute sagittal slices taken from adult (P25–P30)
mice were incubated in the presence of ET (1028 and 1027 M, at
room temperature) for 5 min before fixation and then immuno-
stained for ET using immunoaffinity purified primary antibodies
specific for ET (see single 36 kDa ET band in Fig. 1A). In the
presence of 1027 M ET the staining was marked in several brain
regions, including cerebellum (Fig. 1B), hippocampus, thalamus,
striatum (myelinated tracts), olfactive bulb, the colliculi, and
cerebral white matter. To determine possible cross reactivity of the
anti-ET antibodies, similar experiments were repeated with slices
incubated without ET: no immuno-staining was detected for ET,
while immunoreactivity for cells markers could be revealed
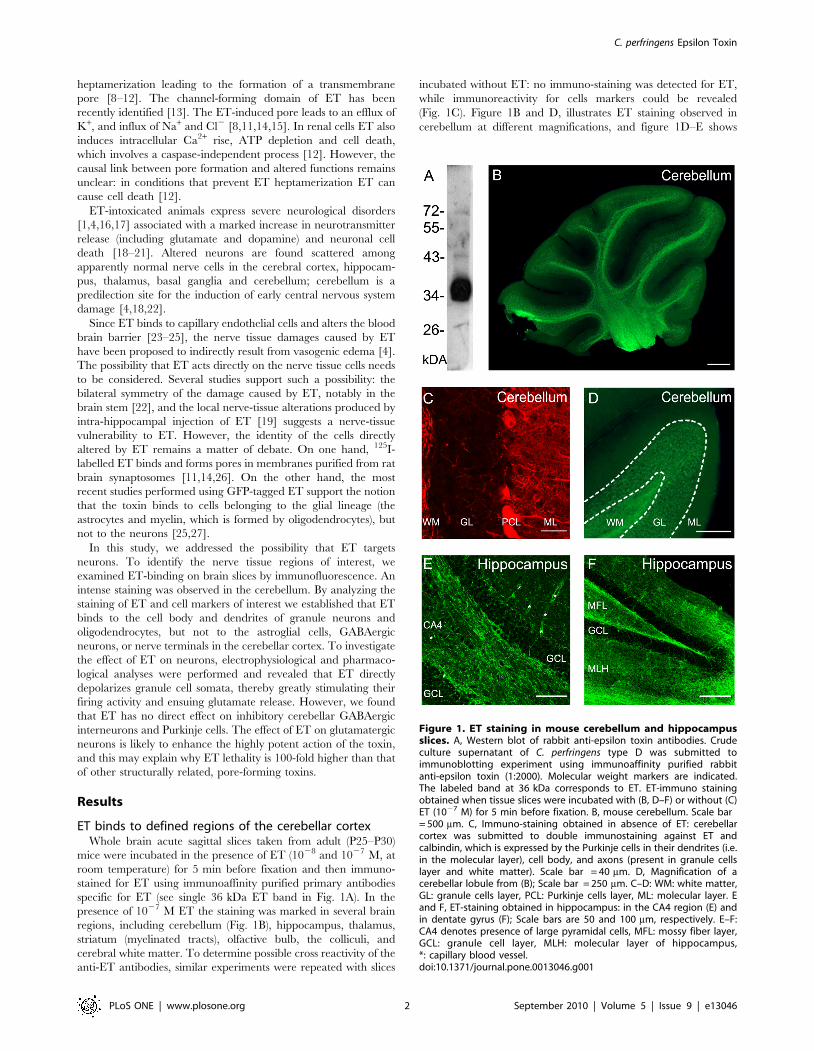
(Fig. 1C). Figure 1B and D, illustrates ET staining observed in
cerebellum at different magnifications, and figure 1D–E shows
Figure 1. ET staining in mouse cerebellum and hippocampusslices. A, Western blot of rabbit anti-epsilon toxin antibodies. Crudeculture supernatant of C. perfringens type D was submitted toimmunoblotting experiment using immunoaffinity purified rabbitanti-epsilon toxin (1:2000). Molecular weight markers are indicated.The labeled band at 36 kDa corresponds to ET. ET-immuno stainingobtained when tissue slices were incubated with (B, D–F) or without (C)ET (1027 M) for 5 min before fixation. B, mouse cerebellum. Scale bar= 500 mm. C, Immuno-staining obtained in absence of ET: cerebellarcortex was submitted to double immunostaining against ET andcalbindin, which is expressed by the Purkinje cells in their dendrites (i.e.in the molecular layer), cell body, and axons (present in granule cellslayer and white matter). Scale bar = 40 mm. D, Magnification of acerebellar lobule from (B); Scale bar = 250 mm. C–D: WM: white matter,GL: granule cells layer, PCL: Purkinje cells layer, ML: molecular layer. Eand F, ET-staining obtained in hippocampus: in the CA4 region (E) andin dentate gyrus (F); Scale bars are 50 and 100 mm, respectively. E–F:CA4 denotes presence of large pyramidal cells, MFL: mossy fiber layer,GCL: granule cell layer, MLH: molecular layer of hippocampus,*: capillary blood vessel.doi:10.1371/journal.pone.0013046.g001
C. perfringens Epsilon Toxin
PLoS ONE | www.plosone.org 2 September 2010 | Volume 5 | Issue 9 | e13046
examples of ET labeling in hippocampus. At 1028 M, the labeling
was faint. Overall the staining pattern in the brain is reminiscent of
the distribution of tissue injuries (hippocampus, basal ganglia,
internal capsule, thalamus and substantia nigra, and cerebellum)
resulting from subacute intoxication of mice and rats [4,18]. The
marked staining observed in the cerebellum is consistent with the
previous reports that the cerebellum is a predilection site for the
induction of ET damage [4,18,22].
When ET-labeling was observed at a higher magnification, we
found that the toxin markedly stained the capillary vessels
(denoted by * in Fig. 1E), numerous fibers likely to correspond
to myelinated axons (as in the cerebellar white mater in Fig. 1D or
hippocampal regions displayed in Fig. 1E and F). A less intense ET
labeling was also found on pericaryon of numerous cells (for
example in the granule cell layer in the hippocampus (Fig. 1E)
raising the possibility that neurons might be labeled by ET.
To determine whether neurons or a subset of neurons are
targeted by ET in the central nervous system we focused on the
cerebellar cortex which segregates glial cells and neuron somata
or/and processes in identified layers by its laminar organization.
When ET was applied (1027 M, at room temperature) for 5 min
either before (Fig. 1B, see D for a closer view) or after fixation (not
illustrated), the staining distribution was qualitatively similar, albeit
less intense when performed on nerve tissue fixed prior to ET
application. With the exception of some capillary walls (not
illustrated), no obvious structure in the molecular layer was
significantly stained by ET (Fig. 1B,D). This indicates that the cells
constituting this layer (i.e. the inhibitory GABAergic neurons and
the astrocyte related Bergmann’s glial cells), as well as neuronal
processes, corresponding to parallel fibers from granule cells and
dendritic trees of Purkinje cells, are not targeted by ET. The large
soma of the Purkinje cells that lie at the interface of the molecular
and granule cell layers were not stained (Fig. 1B,D). The granular
layer was clearly stained, thus raising the question of which cell
types and/or processes are targeted by ET: granule cells,
GABAergic interneurons, the nerve fibers afferent to the granule
cells (i.e. the mossy fiber nerve terminals), astrocytes or
oligodendrocytes. The cerebellar white matter mainly composed
of myelinated axons (including the Purkinje cells axons) and
oligodendrocytes displayed a strong ET staining.
Granule cells and oligodendrocytes are the cell targets ofET in the cerebellum
To identify the cells types targeted by ET in the granular layer,
we analyzed cerebellar slices immuno-labeled for ET and well
defined cell markers.
Since, as mentioned above, the ET-labeling intensity produced
by applying the toxin on acute (i.e. still living) slices was higher
than that observed when applying ET on fixed tissue, we analyzed
double (ET, cell marker) staining in slices submitted to ET 1027 M
for 5 min before washing out and fixation (see the Material and
Methods). However such a staining procedure can introduce a bias
if ET is cytotoxic for a subset of its targets, which is revealed by the
fast appearance of pyknotic nuclei in renal cell culture [12] and
nerve tissue cells [22]. Accordingly we examined nuclei in the
granular layer using the DNA marker DRAQ5. We did not
observe any pyknotic nucleus indicating that ET (1027 M for up to
20 min before fixation) does not induce cell death in the acute
cerebellar slices at least within the duration of the experiments.
This ruled out the possibility that cell-specific cytotoxicity hampers
the interpretation of double stained cells.
Each of the double staining experiments (ET, cell marker of
interest) listed in Table 1 was performed a minimum of 3 times.
Figure 2 illustrates several typical examples. The biological
significance of the double staining for each of the mentioned
pairs (ET, cell marker) was determined by calculating the
Pearson’s correlation coefficient (rp) for each analyzed region of
interest (ROI) in multiple slices. The number of analyzed ROI,
averaged rp, and statistical significance are reported in Table 1.
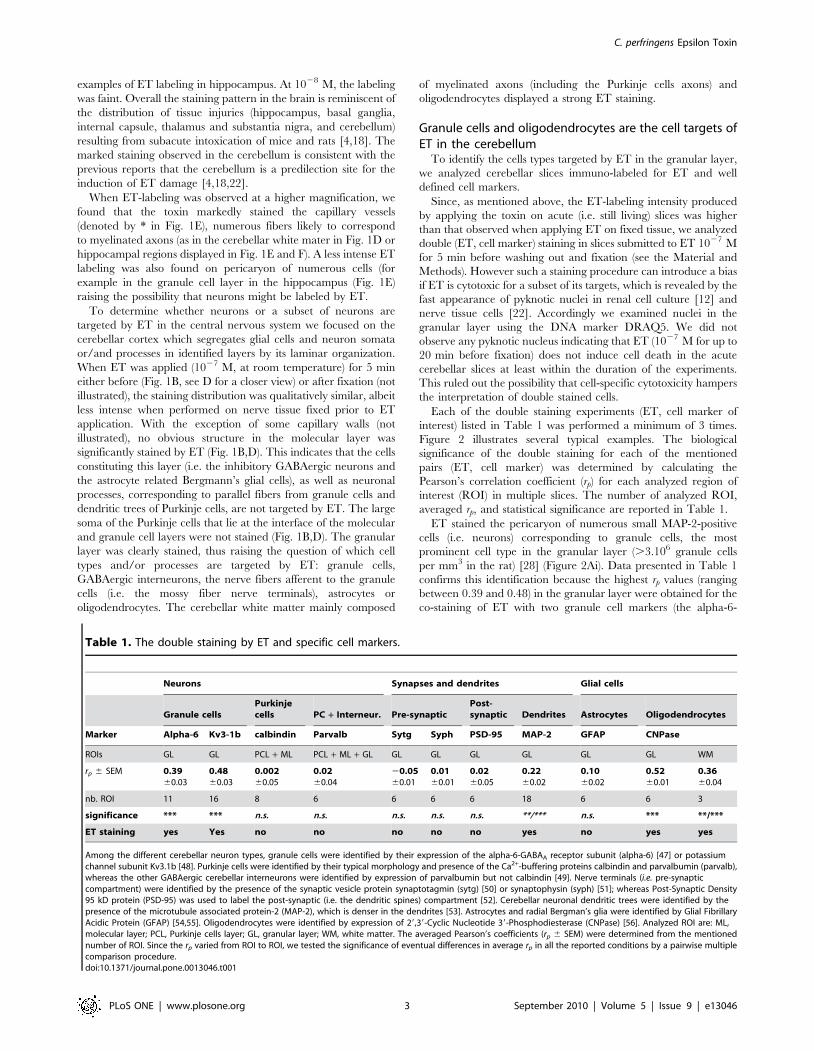
ET stained the pericaryon of numerous small MAP-2-positive
cells (i.e. neurons) corresponding to granule cells, the most
prominent cell type in the granular layer (.3.106 granule cells
per mm3 in the rat) [28] (Figure 2Ai). Data presented in Table 1
confirms this identification because the highest rp values (ranging
between 0.39 and 0.48) in the granular layer were obtained for the
co-staining of ET with two granule cell markers (the alpha-6-
Table 1. The double staining by ET and specific cell markers.
Neurons Synapses and dendrites Glial cells
Granule cellsPurkinjecells PC + Interneur. Pre-synaptic
Post-synaptic Dendrites Astrocytes Oligodendrocytes
Marker Alpha-6 Kv3-1b calbindin Parvalb Sytg Syph PSD-95 MAP-2 GFAP CNPase
ROIs GL GL PCL + ML PCL + ML + GL GL GL GL GL GL GL WM
rp 6 SEM 0.3960.03
0.4860.03
0.00260.05
0.0260.04
20.0560.01
0.0160.01
0.0260.05
0.2260.02
0.1060.02
0.5260.01
0.3660.04
nb. ROI 11 16 8 6 6 6 6 18 6 6 3
significance *** *** n.s. n.s. n.s. n.s. n.s. **/*** n.s. *** **/***
ET staining yes Yes no no no no no yes no yes yes
Among the different cerebellar neuron types, granule cells were identified by their expression of the alpha-6-GABAA receptor subunit (alpha-6) [47] or potassiumchannel subunit Kv3.1b [48]. Purkinje cells were identified by their typical morphology and presence of the Ca2+-buffering proteins calbindin and parvalbumin (parvalb),whereas the other GABAergic cerebellar interneurons were identified by expression of parvalbumin but not calbindin [49]. Nerve terminals (i.e. pre-synapticcompartment) were identified by the presence of the synaptic vesicle protein synaptotagmin (sytg) [50] or synaptophysin (syph) [51]; whereas Post-Synaptic Density95 kD protein (PSD-95) was used to label the post-synaptic (i.e. the dendritic spines) compartment [52]. Cerebellar neuronal dendritic trees were identified by thepresence of the microtubule associated protein-2 (MAP-2), which is denser in the dendrites [53]. Astrocytes and radial Bergman’s glia were identified by Glial FibrillaryAcidic Protein (GFAP) [54,55]. Oligodendrocytes were identified by expression of 29,39-Cyclic Nucleotide 39-Phosphodiesterase (CNPase) [56]. Analyzed ROI are: ML,molecular layer; PCL, Purkinje cells layer; GL, granular layer; WM, white matter. The averaged Pearson’s coefficients (rp 6 SEM) were determined from the mentionednumber of ROI. Since the rp varied from ROI to ROI, we tested the significance of eventual differences in average rp in all the reported conditions by a pairwise multiplecomparison procedure.doi:10.1371/journal.pone.0013046.t001
C. perfringens Epsilon Toxin
PLoS ONE | www.plosone.org 3 September 2010 | Volume 5 | Issue 9 | e13046
GABAA receptor subunit and the potassium channel subunit
Kv3.1b). Table 1 shows no significant ET-staining on Purkinje
cells, which are calbindin and parvalbumin positive, or GABAer-
gic interneurons, which are calbindin negative but parvalbumin
positive, as revealed by almost null rp. We also determined that ET
did not bind to the pre- and post-synaptic compartments in the
granular layer as revealed by almost null rp when ET labeling and
synaptotagmin (Fig. 2B), synaptophysin or PSD-95 staining were
analyzed (Table 1). Analysis of CNPase and ET co-labeling
revealed that ET binds to the oligodendrocytes (Fig. 2C) in
agreement with positive and reproducible rp values (0.52 in the
granular layer, and 0.36 in the white matter). Figure 2Ci shows
that in the granular layer the CNPase positive structures (i.e. the
oligodendrocytes and their processes) were stained with higher
intensity than that observed on granule cells.
Whatever the staining conditions (ET applied before or after
tissue fixation), the ET and GFAP co-labeling was low (Fig. 2D),
with an averaged rp = 0.10. This value is close to that obtained
when analyzing co-staining of pairs of markers specific for distinct
cell types: for example, immunolabeling against alpha-6-GABAA
(specific of the granule cells) and GFAP (specific of the astrocytes)
led to an average rp = 0.1560.03, n = 6. Thus, the averaged
rp = 0.10 found for the ET GFAP co-staining does not indicate that
ET binds to the astroglial cells and likely results from interspersion
Figure 2. ET stains granule cells and oligodendrocytes but not astrocytes or nerve endings. A–D: column i: ET-staining (green), columnii: specific cell-marker immunoreactivity (red) and DRAQ5 DNA signal (cyan), column iii: merge of the ET and cell-marker immunoreactivities. In allexperiments ET was applied for 5 min 1027 M. A: ET and MAP-2, B: ET and synaptotagmin. C: ET and CNPase. D: ET and GFAP. Scale bars are 10 mm inA, B, D, and 50 mm in C.doi:10.1371/journal.pone.0013046.g002
C. perfringens Epsilon Toxin
PLoS ONE | www.plosone.org 4 September 2010 | Volume 5 | Issue 9 | e13046
of astrocytes with other cell types present in the cerebellar tissue
giving rise to detection of signals from different cell types in a small
portion of the analyzed voxels.
To summarize the above data establishes that ET targets
granule cell somata, which are glutamatergic neurons, but not the
granule cell axons or nerve terminals, afferent nerve terminals or
cerebellar GABAergic neurons (Purkinje cells or interneurons).
Among the glial cell lineage, ET binds to oligodendrocytes, but
neither the astrocytes nor related radial glia (i.e. Bergman’s cells).
ET effects on granule cells in primary cultureHaving established that ET binds granule cells in cerebellar
slices, we performed experiments aimed at examining the specific
effect(s) of ET on granule cells in primary culture. Under the
conditions used to prepare primary cultures of mice cerebellar
cortex, most of the cells present are granule cells (96%), few are
astrocytes (,4%) and none are oligodendrocytes, Purkinje cells or
fibroblasts. When applied at 1027 M in PBS onto fixed primary
cultures, ET stained granule cells, but not astrocytes, which
express GFAP (Fig. 3Ai, and 3Aii for a closer view), confirming the
observations made above. Since PBS buffer does not contain Ca2+
ions, this indicates that binding of ET to granule cells does not
require Ca2+ ions. When applied at lower concentrations
(1028 M), no significant ET labeling was observed. A noticeable
difference compared with the staining of ET in acute slices is that
the toxin binds to the neuronal somatic and neurite membranes as
well as varicosities corresponding to nerve terminals on the
cultured neurons (not illustrated).
Since the ET injection into the brain stimulates glutamate and
dopamine release, by a yet unknown mechanism [19–21], we first
examined whether ET could trigger glutamate release from
granule cells. Figure 3B shows a typical experiment of a series of 5
during which increasing concentrations of ET were tested.
Consistent with the staining of granule cells by ET that we
observed at 1027 M, but not 1028 M, ET 1027 M and higher
concentrations, but not 1028 M and lower ones, induced
glutamate efflux (red, Fig. 3B). This effect was strongly diminished
when the experiments were repeated using physiological medium
lacking Ca2+ ions (containing 10 mM EGTA, and 0 mM CaCl2;
cyan curve in Fig. 3B). Since ET binds to granule cells in absence
of Ca2+ ions (see above, and data not shown), this finding suggests
that glutamate release is mediated by a Ca2+-dependent process.
However, we also detected leakage of cytoplasmic lactate
deshydrogenase (LDH) in the surrounding medium (Fig. 3C).
Consistent with previous reports [19–21] these experiments
indicate that ET causes glutamate efflux from cultured granule
neurons in part due to stimulation of the Ca2+-dependent
glutamate release machinery and in part due to neuronal leakage
as indicated by the release of LDH. This latter effect might
account for presence of a Ca2+-independent glutamate release
component when ET is applied at high concentration. Moreover,
we observed that after a 10–20 min incubation with ET 1027 M,
many granule cells presented membrane blebs (not illustrated).
This manifestation of late ET cytotoxicity on the cultured granule
cells contrasts with the apparent lack of detectable cell toxicity in
acute slices (see above mention of lack of appearance of pyknotic
nuclei).
In the renal cells lines, ET has been reported to induce a rise in
the intracellular concentration of [Ca2+] [12]. Similarly, we
observed that ET induced a very fast and marked increase in the
cytosolic Ca2+ concentration in the cultured granule cells, as
determined using Fura2 (Fig. 3D). Preincubation with a medium
containing no Ca2+ ions (10 mM ETGA, 0 M Ca2+) almost
abolished the intracellular rise in [Ca2+] induced by 1027 M ET
(Fig. 3D). This suggests that this intracellular Ca2+ rise is due to
influx of Ca2+ ions and not from mobilization of intracellular
Ca2+-stores.
In the renal cell lines a causal relationship between cell toxicity
and ET oligomerization has been proposed. Since ET oligomer-
ization, but not ET binding, depends on the presence of
cholesterol [10–12], we examined whether cholesterol sequestra-
tion by methyl-b-cyclodextrin interfered with the cytotoxicity of
ET. Granule cell cultures were incubated with 1 mM methyl-b-
cyclodextrin for 30 min at 37uC (a condition which efficiently
prevents formation of ET-heptamers in membranes of renal cells
[12]). Under these conditions, ET staining in granule cell cultures
appeared qualitatively similar to that observed without methyl-b-
cyclodextrin pre-treatment (compare panels Ai or Aii and Aiii in
Fig.3) and a significant decrease in ET-induced glutamate release
was observed (Fig. 3B). This pretreatment almost abolished the
intracellular rise in [Ca2+] induced by 1027 M ET (Fig. 3D). This
is reminiscent of previous studies in renal cells, in which cholesterol
depletion prevented the ET-induced intracellular rise in [Ca2+]
[12]. Moreover no blebs were observed on the cultured cells
submitted to ET 1027 M for at least 20 min (not illustrated).
Overall these data confirm that the granule cell can be targeted
and affected by ET, leading to [Ca2+]i rise likely due to Ca2+
influx, glutamate release and membrane severing. Since choles-
terol sequestration impairs these effects and efficiently prevents
formation of ET-heptamers in membranes and cytotoxicity in
renal cells [12], it is tempting to speculate that they relate to the
pore forming activity of ET.
ET directly stimulates glutamatergic, and indirectlyGABAergic, synaptic transmission afferent to the Purkinjecells
To analyze the effect of ET on neurotransmission (i.e. neuronal
network activity and neurotransmitter release), we used cerebellar
slices cultured for 2–3 weeks in vitro, which form a simplified
cerebellar neuronal network, and are thin enough (few layers of
neurons) to allow access of ET to all the neurons present in the
slice, which is not the case in acute slices. In cultured slices,
Purkinje cells receive glutamatergic (excitatory) inputs originating
only from granule cells while the GABAergic (inhibitory) inputs
are made by inhibitory interneurons and Purkinje cells [29,30].
To allow simultaneous recording of spontaneous postsynaptic,
mostly Na+-dependent, excitatory currents (sEPSC) resulting from
vesicular release of glutamate or spontaneous postsynaptic
inhibitory, Cl2-dependent, currents (sIPSC) due to GABA release,
Purkinje cells were voltage clamped (whole cell patch configura-
tion) at a holding potential of 255 mV (note that ENa+ ,
+107 mV and ECl- ,292 mV using the mentioned extracellular
and intrapipette solutions). Typical postsynaptic current traces are
shown in Figure 4A. sEPSC and sIPSC frequencies were
determined from recording epochs of 5 min duration, made
before and after ET (1027 M) application. Due to the irreversible
action of ET, only one Purkinje cell could be recorded per
cultured slice. After a delay of a few minutes (281+/253 s), sEPSC
frequency was significantly increased by a factor of ,2.5 fold
(p,0.01) after ET application. Bar chart in Figure 4A summarizes
data from n = 15 independent experiments. sIPSC frequency was
also significantly increased, but only by ,60% (p,0.05) (Fig. 4A).
Then, during the course of each experiment both sEPSC and
sIPSC frequencies declined. No change in plasma membrane
resistance of the Purkinje cells was detected (control: 42.1+/
25.2 MV, vs ET: 43.4+/24.1 MV, n.s.).
No significant change was detected in the mean amplitudes of
the sEPSC and sIPSC, under control condition (cont.) and after
C. perfringens Epsilon Toxin
PLoS ONE | www.plosone.org 5 September 2010 | Volume 5 | Issue 9 | e13046
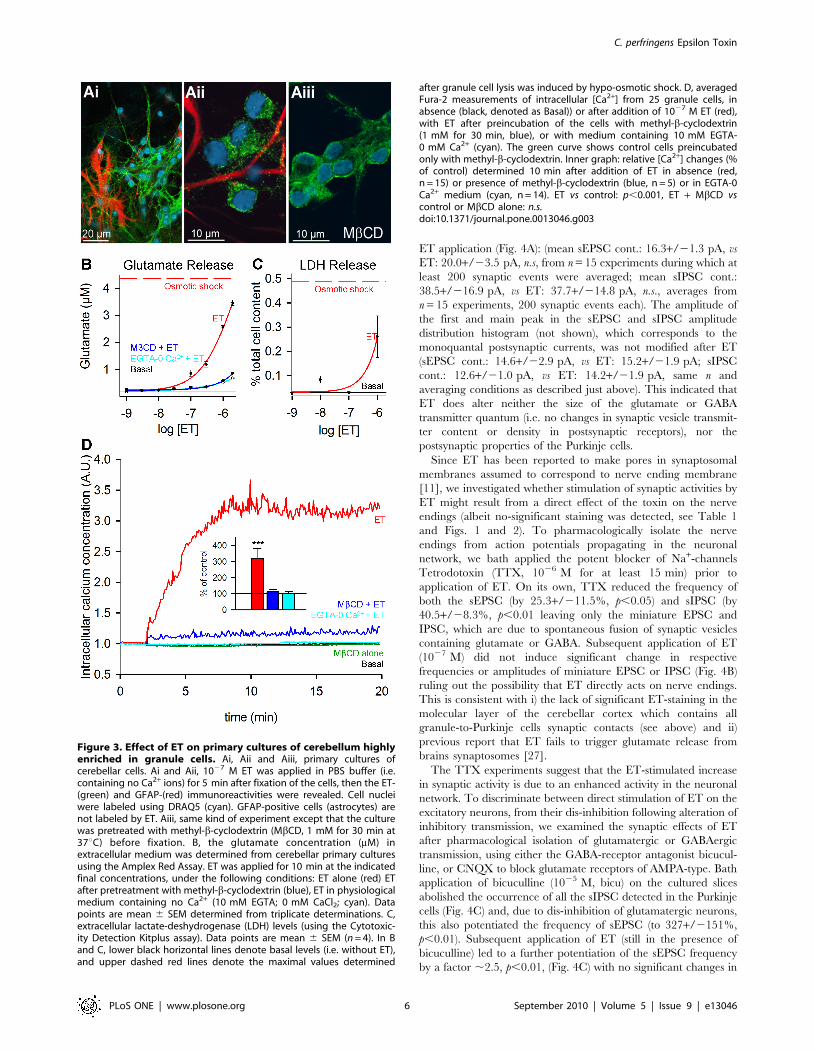
ET application (Fig. 4A): (mean sEPSC cont.: 16.3+/21.3 pA, vs
ET: 20.0+/23.5 pA, n.s, from n = 15 experiments during which at
least 200 synaptic events were averaged; mean sIPSC cont.:
38.5+/216.9 pA, vs ET: 37.7+/214.8 pA, n.s., averages from
n = 15 experiments, 200 synaptic events each). The amplitude of
the first and main peak in the sEPSC and sIPSC amplitude
distribution histogram (not shown), which corresponds to the
monoquantal postsynaptic currents, was not modified after ET
(sEPSC cont.: 14.6+/22.9 pA, vs ET: 15.2+/21.9 pA; sIPSC
cont.: 12.6+/21.0 pA, vs ET: 14.2+/21.9 pA, same n and
averaging conditions as described just above). This indicated that
ET does alter neither the size of the glutamate or GABA
transmitter quantum (i.e. no changes in synaptic vesicle transmit-
ter content or density in postsynaptic receptors), nor the
postsynaptic properties of the Purkinje cells.
Since ET has been reported to make pores in synaptosomal
membranes assumed to correspond to nerve ending membrane
[11], we investigated whether stimulation of synaptic activities by
ET might result from a direct effect of the toxin on the nerve
endings (albeit no-significant staining was detected, see Table 1
and Figs. 1 and 2). To pharmacologically isolate the nerve
endings from action potentials propagating in the neuronal
network, we bath applied the potent blocker of Na+-channels
Tetrodotoxin (TTX, 1026 M for at least 15 min) prior to
application of ET. On its own, TTX reduced the frequency of
both the sEPSC (by 25.3+/211.5%, p,0.05) and sIPSC (by
40.5+/28.3%, p,0.01 leaving only the miniature EPSC and
IPSC, which are due to spontaneous fusion of synaptic vesicles
containing glutamate or GABA. Subsequent application of ET
(1027 M) did not induce significant change in respective
frequencies or amplitudes of miniature EPSC or IPSC (Fig. 4B)
ruling out the possibility that ET directly acts on nerve endings.
This is consistent with i) the lack of significant ET-staining in the
molecular layer of the cerebellar cortex which contains all
granule-to-Purkinje cells synaptic contacts (see above) and ii)
previous report that ET fails to trigger glutamate release from
brains synaptosomes [27].
The TTX experiments suggest that the ET-stimulated increase
in synaptic activity is due to an enhanced activity in the neuronal
network. To discriminate between direct stimulation of ET on the
excitatory neurons, from their dis-inhibition following alteration of
inhibitory transmission, we examined the synaptic effects of ET
after pharmacological isolation of glutamatergic or GABAergic
transmission, using either the GABA-receptor antagonist bicucul-
line, or CNQX to block glutamate receptors of AMPA-type. Bath
application of bicuculline (1025 M, bicu) on the cultured slices
abolished the occurrence of all the sIPSC detected in the Purkinje
cells (Fig. 4C) and, due to dis-inhibition of glutamatergic neurons,
this also potentiated the frequency of sEPSC (to 327+/2151%,
p,0.01). Subsequent application of ET (still in the presence of
bicuculline) led to a further potentiation of the sEPSC frequency
by a factor ,2.5, p,0.01, (Fig. 4C) with no significant changes in
Figure 3. Effect of ET on primary cultures of cerebellum highlyenriched in granule cells. Ai, Aii and Aiii, primary cultures ofcerebellar cells. Ai and Aii, 1027 M ET was applied in PBS buffer (i.e.containing no Ca2+ ions) for 5 min after fixation of the cells, then the ET-(green) and GFAP-(red) immunoreactivities were revealed. Cell nucleiwere labeled using DRAQ5 (cyan). GFAP-positive cells (astrocytes) arenot labeled by ET. Aiii, same kind of experiment except that the culturewas pretreated with methyl-b-cyclodextrin (MbCD, 1 mM for 30 min at37uC) before fixation. B, the glutamate concentration (mM) inextracellular medium was determined from cerebellar primary culturesusing the Amplex Red Assay. ET was applied for 10 min at the indicatedfinal concentrations, under the following conditions: ET alone (red) ETafter pretreatment with methyl-b-cyclodextrin (blue), ET in physiologicalmedium containing no Ca2+ (10 mM EGTA; 0 mM CaCl2; cyan). Datapoints are mean 6 SEM determined from triplicate determinations. C,extracellular lactate-deshydrogenase (LDH) levels (using the Cytotoxic-ity Detection Kitplus assay). Data points are mean 6 SEM (n = 4). In Band C, lower black horizontal lines denote basal levels (i.e. without ET),and upper dashed red lines denote the maximal values determined
after granule cell lysis was induced by hypo-osmotic shock. D, averagedFura-2 measurements of intracellular [Ca2+] from 25 granule cells, inabsence (black, denoted as Basal)) or after addition of 1027 M ET (red),with ET after preincubation of the cells with methyl-b-cyclodextrin(1 mM for 30 min, blue), or with medium containing 10 mM EGTA-0 mM Ca2+ (cyan). The green curve shows control cells preincubatedonly with methyl-b-cyclodextrin. Inner graph: relative [Ca2+] changes (%of control) determined 10 min after addition of ET in absence (red,n = 15) or presence of methyl-b-cyclodextrin (blue, n = 5) or in EGTA-0Ca2+ medium (cyan, n = 14). ET vs control: p,0.001, ET + MbCD vscontrol or MbCD alone: n.s.doi:10.1371/journal.pone.0013046.g003
C. perfringens Epsilon Toxin
PLoS ONE | www.plosone.org 6 September 2010 | Volume 5 | Issue 9 | e13046
C. perfringens Epsilon Toxin
PLoS ONE | www.plosone.org 7 September 2010 | Volume 5 | Issue 9 | e13046
the mean sEPSC amplitude (mean sEPSC bicu: 12.7+/20.7 pA,
vs bicu + ET: 16.2+/21.8 pA, n.s.) or monoquantal sEPSC (first
peak sEPSC bicu: 10.8+/20.5 pA, vs bicu + ET: 12.1+/20.9 pA,
n.s.). When CNQX (1025 M) was applied, sIPSC frequency was
reduced (to 62.2+/212.2%, p,0.01) consistent with the fact that,
in the slices, the firing activity of the inhibitory interneurons is
driven by the excitatory inputs they receive [29,30]. Subsequent
application of ET (1027 M) failed to induce any increase in the
sIPSC frequency recorded in the Purkinje cells (Fig. 4D) with no
significant changes in the mean sIPSC amplitude (mean sIPSC-
CNQX: 17.5+/22.2 pA, vs CNQX + ET: 14.6+/21.9 pA, n.s.)
or monoquantal sIPSC amplitude (first peak sIPSC-CNQX:
12.9+/21.0 pA, vs CNQX + ET: 11.6+/20.8 pA, n.s.). This
important finding unambiguously indicates that ET directly and
selectively stimulates glutamatergic transmission by the granule
cells, which are the only glutamatergic neuronal cell type in
cultured cerebellar slices. Moreover, a lack of ET effect on the
GABAergic transmission, when ET is applied after excitatory
transmission has been blocked, indicates that the stimulation of the
inhibitory activity by ET, as observed in absence of pretreatment
(Fig. 4A), is indirect and results from enhanced GABAergic
neurons firing activity in response to increased firing activity of the
granule cells.
ET directly depolarizes granule cell somata causing theirfiring
The above immunostaining data and our electrophysiological
findings clearly pinpoint the granule cells of the cerebellar cortex
as a major ET target. Since ET binds to granule cell somata
(Table 1, Fig. 2) and has effects on them in primary culture (see
above, Fig. 3), we examined whether and how ET acts on the cell
body of granule cells. Granule cells were current-clamped under
the whole cell patch configuration (Fig. 5A). The transmembrane
potential changes were continuously monitored, during a control
resting period (at least 15 min) and after ET was bath applied. In
all of the n = 15 experiments performed (one cell recorded per
slice), after a delay of 3–5 min (see Table enclosed in Fig. 5F), ET
induced a ,20 mV depolarization of the granule cell leading to
bursts of action potentials (Fig. 5B) followed by a plateau
depolarization in about 2/3 of the cells.
We could not completely exclude the possibility that the ET-
induced depolarization of the granule cell soma was indirect,
mediated by an ET-induced release of excitatory neuroactive
molecules from neighboring glial cells (as the oligodendrocytes that
are targeted by ET). Thus, we repeated the above described
experiments after the recorded granule cells were pharmacolog-
ically isolated by pre-incubating the slices with agents aimed at
blocking receptors to the neurotransmitters or reducing the firing
activity. Application of bicuculline (1025 M, for 10 min, see a
typical recording from a series of 6 in Fig. 5C), CNQX (1025 M,
for 10 min, see a typical recording from a series of 7 in Fig. 5D),
TTX alone (1026 M, for 10 min, not illustrated) or a mixture of
the 3 drugs (see a typical recording from a series of 8 in Fig. 5E)
did not prevent the depolarizing effect of ET on granule cells
(Fig. 5F).
When determined 1 min after the onset of ET-induced
depolarization, the membrane resistance was found about 8 fold
decreased (from about 2 GigaV to about 270 MegaV, p,0.001;
see Fig. 5G). Note however that the residual membrane resistance
was still high, suggesting that no membrane disruption occurs.
These findings bring rational for explaining how TTX suppressed
the stimulation of glutamate release by ET: TTX, which does not
interfere with the initial depolarizing effect of ET on granule cells,
prevents propagation of its consequences (i.e. the action potentials)
to nerve endings.
Figure 4. ET stimulates excitatory and inhibitory synaptic transmission onto the Purkinje cells. A, right: spontaneous PSC detected involtage-clamped Purkinje cells maintained at 260 mV, in absence (Cont) or 5 min after ET (1027 M) application. The relative mean frequencies (Freq)and amplitudes (Ampl) of spontaneous EPSC (upper graph) or IPSC (lower graph), before (white bar) or 5–7 min after 1027 M ET was added (blackbar), n = 15 distinct experiments. B–D, same kind of measurements but after pre-treatment (B) with TTX (1026 M for 10 min, n = 18, (C) withbicuculline (1025 M for 5 min) to block the IPSC (n = 17), or (D) CNQX (1025 M for 5 min) to block the EPSC (n = 18). The frequencies and amplitudesare presented as percent of control condition (i.e. without any treatment, white bars) or after pre-treatment (grey bars), and after subsequentapplication of ET (black bars). **: p,0.01, *: p,0.05, otherwise n.s. Same scale for all current traces.doi:10.1371/journal.pone.0013046.g004
Figure 5. ET depolarizes granule cells in cultured slices.A, Schematic representation of the recording configuration (WholeCell). B–E, typical membrane potential changes recorded in granule cells(using the Current Clamp mode) adjusted at 260 mV, after applicationof 1027 M ET but without (B, n = 15) or after pre-treatment for 10 minwith (C, n = 6) Bicuculline (Bicu, 1025 M), (D, n = 7) CNQX (1025 M) or, (E,n = 8) a cocktail of Bicuculline (1025 M), CNQX (1025 M) and TTX(1026 M). F, quantification of the delay and amplitude of thedepolarization induced by ET. For the corresponding n, see above. Allcomparisons vs ET alone are n.s. G, Changes in membrane resistance ofthe granule cells before (white bar) and 5 min after 1027 M ET (blackbar) (n = 15, p,0.001). Same scale for all voltage traces.doi:10.1371/journal.pone.0013046.g005
C. perfringens Epsilon Toxin
PLoS ONE | www.plosone.org 8 September 2010 | Volume 5 | Issue 9 | e13046

Characterization of the neuronal membrane changesinduced by ET
We investigated the mechanisms by which ET affects neuronal
plasma membrane. To this aim we recorded the transmembrane
current (voltage-clamp, whole cell configuration) changes pro-
duced by ET on granule cells maintained at –75 mV. To
minimize the contribution to the whole cell membrane current
of the recruitment of endogenous voltage- or neurotransmitter
gated channels, the preparations were preincubated for 10 min
with a cocktail containing bicuculline (1025 M), CNQX (1025 M),
TTX (1026 M), TEA (2 mM) and 4-aminopyridine (1 mM), these
two latter drugs blocking endogenous K+-selective voltage-
dependent channels. Under this experimental configuration, the
ET effect on granule cells was revealed by abrupt inward current
changes that may reach ,100 pA amplitude, during which
smaller steps of ,15 pA could be also observed. Such current
changes (see the downward step in the current trace illustrated in
Fig. 6A) appeared after an averaged delay of 561.5 min, very
similar to the delay observed for ET-induced depolarization of
granule cells (Fig. 5F). The transmembrane current increased with
time either progressing by large or smaller steps (not illustrated).
On average, as determined within 1 min after the first membrane
current change was detected, the increase in plasma transmem-
brane current due to ET was ,50 pA (holding potential of –
75 mV), but it increased with time. These findings suggest that the
ET-induced transmembrane current is contributed by activation/
opening of several pores or channels, the recruitment of which
increases with time.
To determine the reversal potential of the ET-induced current,
we built the current (I) to membrane potential (V) relationship (i.e.
the I = f(V) curves). Given the kinetic of the membranes changes
caused by ET, we could not construct the I = f(V) curves by
analyzing the current traces corresponding to voltage square pulses
of incremented amplitude, but, instead, we used a continuous
depolarizing ramp of membrane potential (from 2115 mV to
215 mV, 100 mV.s21). The corresponding ramp currents
increased almost linearly with transmembrane potential (see
example in Fig. 6B). Figure 6C shows the average I = f(V) curve
(summary of 5 experiments, data denoted by filled circle). The I =
f(V) curve showed no rectification between 2115 and 215 mV,
and the reversal potential for ET-induced current was ,225 mV.
We also attempted to investigate the elementary membrane
changes induced by ET. In a series of n = 100 experiments, ET
(1027 M) was applied inside the recording pipette prior to cell-
attach recordings were made (scheme in Fig. 7A). To minimize
leakage of ET from the tip of the micropipette during the micro-
positioning, a negative pressure was applied. The pipette potential
was maintained at 0 mV. In 34 out of the 100 experiments
performed, within the few minutes after the sealing of the tip of the
patch pipette was established onto the outer face of the plasma
membrane of the granule cells, we observed the appearance of
abrupt increases (i.e. step) in the membrane current (Fig. 7B).
Their amplitude distribution showed a main peak at ,16 pA, but
the average amplitude was 70 pA (Fig. 7E). When control
recordings (for more than 20 min without ET inside the
micropipette) were performed, no similar change in transmem-
brane current was observed (occurrence of abrupt membrane
current change: + ET, n = 34/100, - ET: n = 0/26, p,0.001). This
finding revealed a direct effect of ET on the granule cell
membrane. In the 66 negative experiments, it was unclear
whether ET had failed to produce an effect (may be no ET
receptor was present in the recorded patch of membrane or the
pore/channel activation occurred during the process of sealing of
the patch pipette to the plasma membrane of granule cell).
Since heptamerization of ET and ensuing pore forming activity
needs the presence of cholesterol [11,12], we examined whether
the membrane effects of ET were sensitive to methyl-b-
cyclodextrin. Slices were preincubated with methyl-b-cyclodextrin
(1 mM for at least 20 min at 37uC), and the recording was
performed with micropipettes containing ET (1027 M) + methyl-
b-cyclodextrin (1 mM). Surprisingly, in 16 out of 39 experiments
(i.e. 41%, similar as the 34% reported above in methyl-b-
cyclodextrin untreated slices), ET was still able to induce outward
membrane current steps (a typical example is provided in Fig. 7C).
No occurrence of abrupt membrane current change was observed
in absence of ET (+ MbCD and + ET, n = 16/39, + MbCD - ET:
n = 0/21; p,0.001). However, cholesterol sequestration increased
the delay before observing the ET-induced outward current steps
(Fig. 7D), and diminished their average amplitude (Fig. 7E).
Figure 6. Membrane current induced by ET in granule cells. Granule cells were maintained under voltage clamp using the whole cellconfiguration. A, a recording taken from a series of 15 independent experiments (granule cells hold at 275 mV) during which slices werepreincubated for 10 min with TTX (1025 M), TEA (1 mM), 4-AP (2 mM), CNQX (1025 M) and bicuculline (1025 M) before application of ET (1027 M,arrow). Note the abrupt large inward current step that manifests action of ET on the membrane characteristics. B, During the course of the sameseries of experiments, membrane holding potential was changed from 275 mV to 2115 mV, followed by depolarizing ramps from 2115 mV to215 mV, before returning to 275 mV. This paradigm was performed before application of ET and after the toxin had induced an abrupt change inthe whole cell current, as illustrated in A. Typical currents (before: grey; after ET: black) are shown. C) Currents traces were pooled under control(before ET) or after ET and averaged, to build the I = f(V) relationship.doi:10.1371/journal.pone.0013046.g006
C. perfringens Epsilon Toxin
PLoS ONE | www.plosone.org 9 September 2010 | Volume 5 | Issue 9 | e13046
Despite the number of recordings made after methyl-b-cyclodex-
trin pre-treatment was fewer than in control, the main peak in the
distribution amplitude histogram of the ET-induced step currents
was unchanged (Fig. 7F, peak at around 16 pA).
Discussion
Following acute injection of ET into animals [20], excessive
neurotransmitter release has been reported. This has been
proposed to result from ET-induced brain micro-vessels lesions
[27,31], ensuing diffuse brain edema, and leakage of transmitters
from damaged neurons [4]. Albeit some biochemical studies
performed on rat brain synaptosomes have suggested a direct
action of ET on neurons [11,14,26], the more recent binding
studies performed using GFP-tagged ET, have disputed this
possibility. Indeed only the astrocytes and myelin (i.e. oligoden-
drocytes), microglial cells, but not neurons, were reported to be
targeted by GFP-tagged ET [25,27]. In this study, we bring a set of
compelling evidence (immunolabeling, functional data) that refutes
part of the previous deductions and establishes unambiguously
that ET can directly act on a subset of neurons, the granule cells in
the cerebellar cortex. The reason for the discrepancy between our
data and previous reports, may relate to i) unknown properties of
the GFP-tagged ET and/or, ii) the fact that the staining of the
neurons was faint as compared to that of the oligodendrocytes,
hence difficult to detect.
ET binds to oligodendrocytes but not to astrocytesThe lack of ET-staining on the molecular layer and on GFAP-
expressing cells in the granule layer of acute cerebellar slices or
primary cultures from the mouse cerebellar cortex indicates that
neither Bergman’s radial glial cells nor cerebellar velimentous
astrocytes are targeted by ET. This contradicts previous reports
that GFP-tagged ET binds to astrocytes [25]. Maybe, the presence
of the GFP-tag has miss-targeted ET in these previous studies, or
the close apposition of astrocytic processes (GFAP positive) with
the capillary blood vessel lead to the appearance that ET-bound to
the astrocytes. However, from our present results, the possibility
that a sub-population of GFAP-expressing cells may bind ET in
other brain regions cannot be ruled out.
The identification of oligodendrocytes as a major ET target is
consistent with a previous report showing that GFP-tagged ET
Figure 7. Abrupt current changes induced by ET in membrane patches. A, Schematic representation of the recording configuration (Cellattached). ET (1027 M) was applied inside the patch-pipette. B–C, typical membrane current changes recorded after sealing the patch-pipette onto agranule cell membrane (membrane potential maintained at 245 mV using the Voltage Clamp mode), without pre-treatment (Bi, Bii) or after pre-treatment (C) for 30 min with 1 mM of methyl-b-cyclodextrin (MbCD). The corresponding average delays (D) before current changes were detected,and average amplitude of the detected current changes (E), and distribution amplitude (F) of the observed current changes. Grey and black barsdenote experiments performed using ET alone (mean from 34 recordings) or after pre-treatment with MbCD (mean from 16 recordings) respectively.doi:10.1371/journal.pone.0013046.g007
C. perfringens Epsilon Toxin
PLoS ONE | www.plosone.org 10 September 2010 | Volume 5 | Issue 9 | e13046

binds to myelin [27], and staining of brain white matter by ET
(this study). The strong staining intensity of white matter, which
contains myelinated axons and oligodendrocytes cell bodies, as
compared to the granular layer, suggests a greater avidity of the
oligodendrocytes for ET than the granule cells. Perhaps this does
relate on the high cholesterol content of their plasma membrane
and of myelin [32]. Analysis of the functional consequences of ET
binding on oligodendrocytes was beyond the aim of this report,
but this deserves to be investigated in further studies.
Induction of glutamate release by ETOur observations that ET stimulates glutamate release in
cerebellar primary and cultured slices are fully consistent with the
several previous studies, which have shown ET-induced release of
various neurotransmitters, including glutamate [19–21]. Since
neuron and glial cells contain and can release glutamate, the large
efflux of glutamate reported in poisoning experiments may have a
neuronal or glial origin. Our present observation that ET directly
acts on neurons, induces glutamate release in primary cultures of
granule cells, and stimulates glutamatergic transmission at the
granule cell - Purkinje cell synapse in slices largely supports the
possibility that the release of glutamate reported in brain [19–21]
is mostly neuronal. However, since oligodendrocytes are labeled
by GFP-ET [27] as well as native ET (this study), the possibility
they are a source for ET-induced release glutamate cannot be
ruled out.
ET-induced release of glutamate may involve two distinct effects
of ET: i) stimulation of the neurotransmitter release machinery,
and ii) leakage from severed cells. Since glutamate is present in the
cytosolic compartment of any kind of cells, ET-induced plasma
membrane severing of the toxin’s targets can lead to an efflux of
glutamate. This possibility is supported by our observations that
LDH, which is a cytosolic protein, is released upon application of
high ET concentration (1026 M). We also observed that a similar
fraction of glutamate efflux induced by ET in primary culture is
Ca2+-independent and resistant to pretreatment with methyl-b-
cyclodextrin. However, our study cannot distinguish between
plasma membrane disruption and formation of ET-pores large
enough to allow transmembrane passage of proteins or amino
acids. Since we observed that ET depolarizes neurons and induces
intracellular Ca2+-rise, most of the glutamate efflux induced by ET
at 1027M may result from stimulation of the vesicular release
machinery in cultured granule cells. This is supported by
observations that i) when Ca2+ ions are lacking in the extracellular
medium, ET binds to neuronal membrane but fails to induce
glutamate efflux, and ii) pretreatment with methyl-b-cyclodextrin
prevents induction by 1027 M ET of Ca2+-intracellular rise as well
as glutamate release. Further experiments directly altering the
vesicular release machinery should be performed to confirm the
vesicular origin of the glutamate released by cultured cells
submitted to ET. In next paragraph, we discuss the possibility
that glutamate release is a secondary, distant, manifestation of the
ET effects.
Propagation of ET-effect from its binding site to nerveendings and non-target neurons
Our labeling and functional data in nerve tissue revealed that
the ET effects comprise primary action(s) close to the toxin’s
binding site, and secondary actions, possibly occurring distant
from the binding site. Although one of the most prominent effects
of ET in nerve tissue is the stimulation of glutamate release (see
electrophysiological data in Fig. 4), no experimental evidence
supports the possibility that ET directly acts on nerve ending.
Indeed i) the molecular layer of the cerebellar cortex, which
contains the glutamatergic varicosities making synaptic contacts
between granule cells (highly susceptible to ET), and the dendritic
tree of Purkinje cells appears almost unlabelled by ET; ii) no co-
staining was observed between ET and synaptic markers such as
synaptotagmin, synaptophysin and PSD-95 in the granular layer.
Thus our labeling data contradict the initial reports that ET forms
pores into membranes isolated from rat brain synaptosomes
[11,14] but confirms previous observations that ET-GFP fails to
directly induce glutamate release from synaptosomes [27].
Consistent with the binding of ET on granule cell pericaryon,
the electrophysiological measurements performed on granule cells
showed that the membrane resistance is lowered by a factor ,8
following ET application. The pore-forming activity recorded
during cell-attach experiments on granule cell somata indicates
that the membrane resistance change is likely to represent a
primary effect of ET. This change is associated with an inward
increase of the resting current in the range of 50–100 pA, which
depolarizes the granule cells thus reaching the threshold for
initiating action potentials. The latter propagate toward nerve
endings and produces a secondary effect of ET consisting in
stimulating vesicular glutamate release. This view is fully
supported by our observation that TTX, which prevents action
potential propagation, abolishes the stimulatory effect of ET on
neurotransmitter release. Our findings are also consistent with a
previous report that riluzole, which blocks persistent Na+- and
Ca2+-currents [33] and thus impairs the action potential
propagation, attenuates ET-induced glutamate release in the
mouse hippocampus [20].
Propagation of ET effect in the neuronal network may also
explain its stimulatory action on the release of other neurotrans-
mitters (as GABA in the cerebellar cortex). In the cerebellar
cortex, we did not identify neurons other than granule cells
potentially sensitive to ET. In the molecular layer and the granular
layer ET does bind neither to GABAergic interneurons nor to
Purkinje cells. Moreover we did not detect significant change in
the membrane input resistance of the Purkinje cells in presence of
ET. The pharmacological dissection of the synaptic effects of ET
on neurotransmission clearly indicates that the stimulation of
GABA-release by ET is only indirect and results from the ET-
induced increase in the excitatory activities in the neuronal
network.
Comparison of the primary effects of ET on neurons andon other cell targets
Few cell types have been identified to be targeted by ET. This
includes the cells of the distal renal tubule [24,34] and related cell
lines [8,12,35], vascular capillary endothelial cells [23–25], enteric
epithelial cells [2], the oligodendrocytes and peripheral Schwann
cells that both contribute to neuronal axon myelination [27],
specific neurons, as the cerebellar granule cells (this study),
macrophages and the related brain microglial cells [27,36]. This
strongly suggests that this biological spectrum of selectivity relates
to the expression of yet unidentified specific receptor(s) by ET cell
targets.
With regard to the other aspects of the cellular and molecular
effects of ET, most of the current knowledge has been established
using renal cells and comparison of the data established using
neurons (this study) and renal cells reveals several commonalities.
For example the extent of ET binding on the baso-lateral and
apical membranes of renal cells differs [12], and in the acute
cerebellar slices, where granule cells are highly differentiated, ET
labels their cell body but not axons and nerve terminals. This
suggests that only specific membrane domains allow ET binding as
revealed by immunostaining. Further experiments are needed to
C. perfringens Epsilon Toxin
PLoS ONE | www.plosone.org 11 September 2010 | Volume 5 | Issue 9 | e13046

determine whether this results from a local enrichment in ET
receptors or/and organization of phospholipids and cholesterol
micro-domains. In renal cells or granule neurons, the data suggest
that part of the ET action, but not ET binding, relies on
cholesterol or integrity of cholesterol containing microdomains:
pretreatment with methyl-b-cyclodextrin abolishes ET-induced
Ca2+-rise in granule cell primary cultures (this study) as well as in
renal cells [12]. This is less clear with regard to the pore forming
action of ET: it is abolished in renal cells when pre-treating the
cells with methyl-b-cyclodextrin [8–12], but in granule neurons
the ET-induced changes in transmembrane currents were not
abolished in presence of methyl-b-cyclodextrin (cells pretreated for
30 min); yet these currents were slightly delayed and their mean
amplitude lowered but without affecting the main peak of their
distribution amplitude. Thus the question arises of whether the
observed ET-induced abrupt changes in membrane current relate
to the pore-forming activity of ET or to activation of endogenous
conductances. Although we cannot exclude this later possibility,
we have to point the facts that ET has been reported to form pores
in liposomes containing phosphatidylcholine exclusively [10] and
that pre-treatment with 1 mM methyl-b-cyclodextrin for 30 min
might not be sufficient to extract enough cholesterol from the
granule cell membranes, as discussed elsewhere [37]. This makes
the possibility of endogenous conductance activation less likely.
The pore formed or activated by ET in neuronalmembrane
In membrane bilayers, ET pore has been previously determined
as a general diffusion pore, allowing Cl2, K+ Na+ ions to flow, but
with a preferential anionic selectivity (permeability ratio PK+/PCl-
,0.30) [9]. Thus, if PNa+ , PK+, and given EK+ = 2101 mV,
ENa+ = +107 mV, and ECl2 = 292 mV, under our exper-
imental conditions the expected equilibrium potential should be ,237 mV (based on the Goldman-Hodgkin-Katz equations). Our
findings that the reversal potential for ET-current was ,225 mV, indicates that the ionic selectivity determined previously
using bilayers [9] does not fully apply to pores formed or activated
into neuronal membrane. May be, the ET- induced intracellular
Ca2+ rise (which is abolished when cells are incubated with no
extracellular Ca2+ ions) is due to Ca2+ permeation through ET
formed pores, thus explaining a more depolarized equilibrium
potential than that expected. Given the depolarizing effect of ET
on granule cells, further experiments are needed to determine the
respective contribution of ET-pores and endogenous voltage-
dependent Ca2+-channels in the ET-induced rise of intracellular
Ca2+.
Considering that the resting potential of granule cells submitted
to cell-attached recording is ,265 to 260 mV and the reversal
potential for ET-induced current , 225 mV, the ET-induced
current steps of 15 pA (see main peak of the distribution, Fig. 7F)
may correspond to the opening of single state conductance large
pores of over 370 pS, as determined using the Ohm’s law. This is
far larger than the conductance of endogenous neuronal channels
and reminiscent of that determined for ET-pore in lipid bilayers
(550 pS in presence of 1 M KCl) [9]. Using the membrane model
where pores are analog to parallel resistors, the large fall in
membrane resistance that we observed in granule cells (from
,2 GV to ,270 MV) can be accounted by formation of ,9 pores
per granule cell.
To conclude, the emerging picture from our labeling and
functional studies is that granule cells and oligodendrocytes are
major ET targets in the mouse cerebellar cortex. In view of the
high bio-hazard of ET [38], identification of neurons as ET targets
shed a new light on the mechanisms by which ET can exert
deleterious action on the central nervous system. It probably
results from a direct severing action of ET on subsets of neurons
(our study), and indirect damage resulting from vasogenic edemas
[4]. The direct effect of ET on neurons is likely to amplify the
highly potent systemic action of the toxin, and this may explain
why ET lethal activity is 100-fold higher than that of other
structurally related pore-forming toxins [39].
Materials and Methods
Ethic StatementAll experiments have been conducted using protocols designed
according to the European and French guidelines on animal
experimentation and approved by the direction of the Bas-Rhin
veterinary office, Strasbourg, France; authorization number 67-
295 to JdB), and the direction of Paris veterinary office, France,
(authorization number 75-279 to MP).
Epsilon toxin materialsET was purified from an overnight culture of C. perfringens type
D strain NCTC2062 as previously described [8]. The purity of ET
(.90%) was checked by SDS-PAGE electrophoresis. Unless
otherwise stated, ET was extemporaneously diluted to a final
concentration of 1027 M in the superfusion medium from stock
aliquots stored at 280uC. Specific anti-ET antibodies were raised
in rabbit with formalin treated wild type epsilon toxin as described
previously for other clostridial toxins [40]. Antibodies against
epsilon toxin were purified from hyper-immune rabbit sera using
wild type epsilon toxin coupled to cyanogen bromide activated
sepharose 4B (Amersham Biosciences) according to the manufac-
turer’s recommendations. Specificity for ET of immunoaffinity
purified antibodies was checked by immunoblotting experiments:
crude culture supernatant of C. perfringens type D strain
NCTC2062 (100 mg proteins) was run on a SDS-PAGE (10%),
and then transferred on nitrocellulose. The membrane was
blocked with non-fat milk and incubated with rabbit anti-epsilon
toxin (1:2000) and subsequently with protein A-peroxidase.
Protein bands were visualized using the ECL detection system
(InVitrogen, Gergy-Pontoise, France).
Whole brain and cerebellar preparationsAcute slices of whole brain or cerebellum alone were prepared
according to standard procedures. 150 mm thick parasagittal
cerebellar slices from 25–30 days old C57/BL6 mice were made
following a protocol approved by the European and French
guidelines on animal experimentation. Briefly, mice were killed by
decapitation under isoflurane general anesthesia (AErrane, Baxter
SA, Maurepas, France; Isoflurane anesthesia unit from Medical
Supply Service lnt, England). Whole brains or only cerebella were
dissected in ice-cold physiological medium (i.e. artificial cerebro-
spinal fluid) equilibrated with 95% O2 and 5% CO2, and
containing: NaCl 124 mM, KCl 2.7 mM, CaCl2 2 mM, MgCl21.3 mM, NaHCO3 26 mM, NaH3PO4 0.4 mM, glucose 18 mM
and ascorbate 4 mM. Slices were made using a Leica VT1000S
slicer, and then maintained at the desired temperature in the same
physiological solution.
Cerebellar slices in organotypic culture were prepared from
cerebella removed from 7–10 day old C57/BL6 mice and cultured
using the roller tube technique modified from [41] as described
previously [29,42]. In short, parasagittal cerebellar slices (350 mm
thick) cut under aseptic condition were embedded in clotted
chicken plasma on glass cover-slips and placed in culture tubes
containing 750 ml of culture medium made of 25% heat-
inactivated horse serum, 50% Eagle’s basal medium, 25% HBSS
C. perfringens Epsilon Toxin
PLoS ONE | www.plosone.org 12 September 2010 | Volume 5 | Issue 9 | e13046
supplied with 33.3 mM D-glucose and 0.1 mM glutamine. The
tubes were placed in a roller drum at 36uC. To delay the
overgrowth of macrophages, glial cells and fibroblasts in the
cultured slices, 2 days after the culture was started, uridine,
cytosine-b-D-arabino-furanoside and 5-fluorodeoxyuridine (Sig-
ma) were added (1027 M final) to the culture medium for
24 hours. The cultures were fed once a week by renewing the
culture medium.
Cerebellar cells primary cultures highly enriched in granule cells
were prepared from 7 day old C57BL6 mice. In brief, dissected
cerebella were transferred in Hank’s buffer salt solution (HBSS).
Enzymatic dissociation of the cells was made by incubating
cerebella for 5 min at 37uC in trypsin 0.05%-EDTA 0.02%
solution (GIBCO), then in papaın (Sigma-Aldrich) 15 U/ml
during 20 min at 37uC. The enzymatic reaction was stopped by
adding B27/Neurobasal medium (GIBCO). After centrifugation
(1 min, 120 g), the pellet was resuspended in Neurobasal medium
and mechanically dissociated. Cells were plated on poly-ornithin-
coated glass coverslips and cultured in modified Neurobasal
medium. To increase granule cells survival the culture medium
was supplemented with KCl 30 mM, insulin 1 mM, putrescin
100 mM, progesterone 20 nM, transferin 100 mg/ml, and sodium
selenite 30 nM. Experiments were performed after 5 days in vitro
(5 DIV).
For glutamate release studies, cells were plated on poly-L-lysine-
coated (10 mg/ml) 24-well Corning dishes (3–5 105 cells in 30 ml)
and then incubated at 37uC in a water saturated atmosphere of
5% CO2-air.
Immunodetection of ET and immunocytochemistry ofspecific cell markers
Whole brain or cerebellar acute slices (150 mm thick) were pre
incubated with BSA (1% in physiological medium), then submitted
to ET (at the concentrations and for the indicated duration at
room temperature) and then fixed using paraformaldehyde 4% in
PBS at 4uC overnight. Cerebellar cells primary cultures or, when
needed, slices were fixed in paraformaldehyde 4% in working
solution during 20 min before incubation with ET. Fixed slices
were permeabilized using Triton 0.1% for 1 day followed by 3
washes in PBS. Then, the fixed slices were transferred in a working
solution containing PBS with 1% bovine serum albumin +10%
normal goat serum (Chemicon-Millipore) for 2 h to saturate non-
specific sites.
To reveal the labeling contributed by ET, the primary anti-
toxin antibodies (see above) were applied (dilution 1/150)
overnight at 4uC. Secondary anti-rabbit antibody tagged with
Alexa 488 or Alexa 546 (Molecular Probes, 1/2000) was applied
overnight at 4uC. Whole brain or cerebellar slices were then
mounted on glass coverslips with mowiol (Calbiochem).
To identify the cells targeted by the toxin, a similar protocol was
applied except that the immuno-labeling against ET and the cell
marker of interest were performed simultaneously by applying the
primary antibodies overnight at 4uC (ET: antibodies from rabbit;
cell marker: antibodies from mouse, except when specified)
followed by 3 washes in the working solution, by overnight
application of the secondary antibodies tagged with Alexa 546
(Molecular Probes, diluted 1/2000), at 4uC. When the primary
anti-cell marker antibodies were from rabbit, we used the two steps
sequential process described previously [43]: tissue preparations
were first treated for ET immunodetection and then, after a
20 min post-fixation in paraformaldehyde 4%, the preparations
were processed for cell marker detection.
The following primary antibodies were used: Glial Fibrillary
Acidic Protein (GFAP) (Sigma-Aldrich, mouse monoclonal diluted
1/400), 29,39-Cyclic Nucleotide 39-Phosphodiesterase (CNPase)
(Sigma-Aldrich, mouse monoclonal diluted 1/1000), synaptotag-
min (1D12 mouse monoclonal, diluted 1/500, a generous gift from
Dr. M. Seagar, Marseille, France), alpha-6-GABAA receptor
subunit (Chemicon-Millipore, rabbit polyclonal diluted 1/1000),
Kv3.1b (Sigma-Aldrich, rabbit polyclonal, diluted 1/200), parval-
bumin (Sigma-Aldrich, mouse monoclonal clone PARV-19,
diluted 1/1500), MAP-2 (Sigma-Aldrich, mouse monoclonal,
diluted 1/250), Post-Synaptic Density Protein 95 (PSD-95;
Chemicon-Millipore, mouse monoclonal, clone 666-1C9, diluted
1/100), calbindin (Sigma-Aldrich, mouse monoclonal clone CB-
955, diluted 1/1500)
When needed after the immunostaining process the cell nuclei
were stained using the DNA marker DRAQ5TM (Biostatus Ltd,
UK), 10 mM final in PBS.
Imaging and co-staining analysisUnless otherwise stated, confocal images (confocal microscope
Zeiss LSM 510, software release 3.2; fields of 102461024 pixels,
magnification x40, initial pixel size of 0.053 mm2) were acquired
using 500–530 nm (green, channel 1), 560–615 nm (red, channel
2) and .633 nm (ultrared for DRAQ5) filters at the Imaging
Facility of the Institut Federatif des Neurosciences (IFR37) at
Strasbourg (France). The possible presence of ET on a specific cell
type (identified on the basis of an immuno-labeling against a
marker of interest) was tested: if ET binds to a cell type expressing
a specific marker of interest, the respective intensities of the
corresponding fluorescent immuno-signals should be positively
correlated. To examine this issue, regions of interest (ROI; e.g.
cerebellar molecular layer, granular layer, white matter) of at least
100,000 pixels were determined under each of the studied
conditions and taken from at least triplicates of the immune-
labeling experiments. For each ROI, an intensity threshold was
applied (10% of maximum amplitude for each channel) for either
channel 1 or 2. Then for each channel, the signal intensity was
normalized to the maximum observed in the ROI [44] and the
Pearson’s correlation coefficient (rp) was determined for channels 1
and 2.
Calcium imagingIntracellular calcium changes were monitored using the Fura-2
probe (Molecular probes) as described [45]. Cerebellar primary
cultures enriched in granule cells were incubated in the presence of
Fura-2-AM + pluronic acid (2 mM each) for 30 min at 37uC. Cells
were then washed for 20 min in a solution containing NaCl
130 mM, KCl 5.4 mM, CaCl2 2 mM, MgCl2 1 mM, D-glucose
5.5 mM, Hepes 10 mM, adjusted at pH 7.2 and placed in an
inverted microscope (Axiovert, Zeiss). They were alternatively
illuminated at 350 nm and 380 nm and images pairs were
recorded using an EM-CCD camera (Hamamatsu) at 520 nm
every 5 s for 20 min. The ratio of the fluorescence intensities (Ex
350 nm/Ex 380 nm) was calculated on a pixel basis for each
image pair using the Metafluor software (Molecular Devices). The
mean value of the fluorescence ratio was normalized for each
region of interest and the intracellular [Ca2+] changes were
estimated without further calibration.
Electrophysiological recordingsOrganotypic cerebellar slices cultured for 2 weeks were placed
in a recording chamber fixed on the stage of an upright
microscope (Nikon Eclipse FN1 or Olympus BX51WI). The
recording chamber was filled with a physiological solution
containing in mM: NaCl 145, KCl 2.7, CaCl2 5, MgCl2 0.5,
Hepes 1, glucose 5.6, pH 7.4 adjusted with TrisOH. Neurons to
C. perfringens Epsilon Toxin
PLoS ONE | www.plosone.org 13 September 2010 | Volume 5 | Issue 9 | e13046

be recorded were identified at the 40x magnification under DIC.
Purkinje cells and granule cells were identified by their typical
morphology: in cultured slices, Purkinje cells have large cell body
(15–20 mm) characterized by highly refringent nucleolus, whereas
granule cell are small (5–8 mm) and mostly spherical.
Whole-cell patch clamp recordings were carried out at room
temperature using an Axopatch 200A Amplifier (Axon Instru-
ments), under current- or voltage-clamp modes. Electrodes of
5 MV (for Purkinje cells recording) or 15 MV (for Granule cell
recording) were pulled from borosilicate glass capillaries (Harvard)
and filled with a solution containing: K+-gluconate 132 mM,
EGTA/KOH 1 mM, MgCl2 2 mM, NaCl 2 mM, Hepes 10 mM,
MgATP 2 mM, and GTP 0.5 mM; pH 7.2 adjusted with TrisOH;
osmotic pressure was adjusted to that of extracellular medium
using saccharose. Under the extracellular medium condition used,
the junction potential was calculated , +16 mV using the JPCalc
software in the PClamp suite (Axon Instruments) and corrections
of membrane potentials were made a posteriori. When cell-attach
recordings were needed, 15 MV electrodes were filled with filtered
extracellular medium and the pipette potential maintained at
0 mV. The recorded current and voltage traces were digitized
prior acquisition at 20 KHz using a Digidata 1320 (Axon
Instruments). Off-line analysis was performed using MiniAnalysis
(Synaptosoft) or pClamp-9 (Axon Instruments) softwares. When
appropriate, changes in membrane resistance were determined
from membrane current changes induced by a hyperpolarizing
step of 10 mV under voltage-clamp.
Determination of glutamate release using the Amplexred assay
Glutamate release was determined following a process
inspired from Chapman and Zhou [46]. Granule cells cultured
on 24-well plates were washed three times with 300 ml HBSS
before being challenged with the indicated ET final concentra-
tions. After 10 min incubation at 37uC, the medium was
collected and stored appropriately for glutamate determination.
Glutamate concentration was monitored three times for each
sample using a cycling assay based on the ‘amplex red glutamic
acid kit’ (Molecular Probes). Typically, reactions were conduct-
ed in 96-well plates. To each 50 ml sample was added 50 ml of
reagent containing 0.25 U.ml21 HRP, 0.08 U.ml21 Glutamate
oxydase, 0.5 U.ml21 Glutamate pyruvate synthase, 0.2 mM L-
alanine and 100 mM amplex red in 0.1 mM Tris buffer, pH 7.4.
The cycling reaction was allowed to proceed at 37uC for 30 min
and the increase in the resorufin fluorescence was measured
using a fluorescence plate reader (Mithras LB 940, Berthold
technologies) (530 nm excitation –590 nm emission). Determi-
nation of the total intracellular pool of glutamate was performed
by lysing all the cells by a hypo-osmotic shock: the supernatant
was removed and the cells were submitted to distilled water
containing only 10 mM Tris, pH 7.4.
Determination of lactate deshydrogenase releaseThe lactate des-hydrogenase released by ET treated cells was
quantified using the Cytotoxicity Detection Kitplus (LDH) (Roche)
on 96-well plates, following the manufacturer instructions. The
assay was performed on the cell culture medium collected before
the HBSS cell monolayer wash (basal release during the culture),
on the same samples used for glutamate concentration quantifi-
cation (LDH release due to toxin effect) and on the cell extract
(total LDH) after hypo-osmotic shock. The reaction results are
obtained by reading the optical density on a multi-plate reader
Mithras LB 940 (Berthold, Germany).
Other materialsMethyl-b-cyclodextrin was from Sigma-Aldrich. Tetrodotoxin
(TTX, Latoxan), bicuculline methiodide, TEA, 4-AP (Sigma-
Aldrich) were prepared as stock solutions in distilled water and
CNQX (Sigma-Aldrich) was dissolved in DMSO prior dilution to
the desired final concentration in the physiological solution
immediately before the experiments.
Statistical analysisWhen adequate, results are presented as means 6 SE from the
indicated number n of separate experiments. Statistical compar-
isons were done using Khi2 or ANOVA tests as appropriate. When
statistical differences were detected with ANOVA, multiple
comparisons Bonferroni test was performed. A p value ,0.05
was considered significant; n.s. denotes not significant comparison.
Acknowledgments
We thank the Imaging facility of the Institut Federatif des Neurosciences
IFR37/Strasbourg, Sophie Reibel and her team at the Animal House of
IFR37. We are grateful to Dr Alain Vandewalle (INSERM U773, Paris)
and Dr Nancy Grant (CNRS UPR3212, Strasbourg) for their valuable
comments and discussions.
Author Contributions
Conceived and designed the experiments: EL JLD EJ JLB JdB BP.
Performed the experiments: EL JLD LW RC CML EJ FD MRP. Analyzed
the data: EL JLD LW EJ MRP JdB BP. Contributed reagents/materials/
analysis tools: MRP BP. Wrote the paper: EL JdB BP.
References
1. Sakurai J (1995) Toxins of Clostridium perfringens. Rev Med Microbiol 6: 175–185.
2. Goldstein J, Morris WE, Loidl CF, Tironi-Farinatti C, McClane BA, et al.
(2009) Clostridium perfringens epsilon toxin increases the small intestinal
permeability in mice and rats. PLOs-One 4(9): e7065.
3. Uzal FA (2004) Diagnosis of Clostridium perfringens intestinal infections in sheep
and goats. Anaerobe 10: 135–143.
4. Finnie JW (2004) Neurological disorders produced by Clostridium perfringens type
D epsilon toxin. Anaerobe 10: 145–150.
5. Cole AR, Gibert M, Popoff M, Moss DS, Titball RW, et al. (2004) Clostridium
perfringens e-toxin shows structural similarity to the pore-forming toxin aerolysin.
Nature Struct Mol Biol 11: 797–798.
6. Melton JA, Parker MW, Rossjohn J, Buckley JT, Tweten RK (2004) The
identification and structure of the membrane-spanning domain of the Clostridium
septicum alpha toxin. J Biol Chem 279: 14315–14322.
7. Melton JA, Tweten RK (2006) Clostridium septicum pore-forming a-toxin. In:The
Comprehensive Sourcebook of Bacterial Protein Toxins, editors JE Alouf and
MR Popoff. pp 623–630.
8. Petit L, Gibert M, Gillet D, Laurent-Winter C, Boquet P, et al. (1997) Clostridium
perfringens epsilon-toxin acts on MDCK cells by forming a large membrane
complex. J Bacteriol 179: 6480–6487.
9. Petit L, Maier E, Gibert M, Popoff MR, Benz R (2001) Clostridium perfringens
epsilon toxin induces a rapid change of cell membrane permeability to ions and
forms channels in artificial bilayers. J Biol Chem 276: 15736–15740.
10. Nagahama M, Hara H, Fernandez-Miyakawa M, Itohayashi Y, Sakurai J (2006)
Oligomerization of Clostridium perfringens epsilon-toxin is dependent upon
membrane fluidity in liposomes. Biochemistry 45: 296–302.
11. Miyata S, Minami J, Tamai E, Matsushita O, Shimamoto S, et al. (2002)
Clostridium perfringens e-toxin forms a heptameric pore within the detergent-
insoluble microdomains of Madin-Darby canine kidney cells and rat
synaptosomes. J Biol Chem 277: 39463–39468.
12. Chassin C, Bens M, de Barry J, Courjaret R, Bossu JL, et al. (2007) Pore-forming
epsilon toxin causes membrane permeabilization and rapid ATP depletion-
mediated cell death in renal collecting duct cells. Am J Physiol Renal Physiol
293: F927–F937.
C. perfringens Epsilon Toxin
PLoS ONE | www.plosone.org 14 September 2010 | Volume 5 | Issue 9 | e13046
13. Knapp O, Maier E, Benz R, Geny B, Popoff MR (2009) Identification of the
channel-forming domain of Clostridium perfringens Epsilon-toxin (ETX). BiochimBiophys Acta 1788: 2584–2593.
14. Miyata S, Matsushita O, Minami J, Katayama S, Shimamoto S, et al. (2001)
Cleavage of a C-terminal peptide is essential for heptamerization of Clostridium
perfringens e-toxin in the synaptosomal membrane. J Biol Chem 276:
13778–13783.15. Shimamoto S, Tamai E, Matsushita O, Minami J, Okabe A, et al. (2005)
Changes in gangliosides content affect the binding of Clostridium perfringens
Epsilon-toxin to detergent-resistant membrane of madin-Darby canine kidneycells. Microbiol Immunol 49(3): 245–253.
16. Uzal FA, Kelly WR, Morris WE, Bermudez J, Baiso’n M (2004) The pathologyof peracute experimental Clostridium perfringens type D enterotoxaemia in sheep.
J Vet Diagn Invest 16: 403–411.17. Fernandez-Miyakawa ME, Sayeed S, Fisher DJ, Poon R, Adams V, et al. (2007)
Development and application of an oral challenge mouse model for studying
Clostridium perfringens type D infection. Infect Immun 75: 4282–4288.18. Finnie JW (1984) Histopathological changes in the brain of mice given Clostridium
perfringens type D epsilon toxin. J Comp Pathol 94: 363–370.19. Miyamoto O, Minami J, Toyoshima T, Nakamura T, Masada T, et al. (1998)
Neurotoxicity of Clostridium perfringens epsilon-toxin for the rat hipocampus via
glutamanergic system. Infect. Immun 66: 2501–2508.20. Miyamoto O, Sumitami K, Nakamura T, Yamagani S, Miyatal S, et al. (2000)
Clostridium perfringens epsilon toxin causes excessive release of glutamate in themouse hippocampus. FEMS Microbiol Lett 189: 109–113.
21. Nagahama M, Sakurai J (1993) Effect of drugs acting on the central nervoussystem on the lethality in mice of Clostridium perfringens e-toxin. Toxicon 31:
427–435.
22. Finnie JW, Blumbergs PC, Manavis J (1999) Neuronal damage produced in ratbrains by Clostridium perfringens type D epsilon toxin. J Comp Pathol 120:
415–420.23. Zhu C, Ghabriel MN, Blumbergs PC, Reilly PL, Manavis J, et al. (2001)
Clostridium perfringens prototoxin-induced alteration of endothelial barrier antigen
(EBA) immunoreactivity at the blood-brain barrier (BBB). Exp Neurol 169:72–82.
24. Soler-Jover A, Blasi J, Gomez de Aranda I, Navarro P, Gibert M, et al. (2004)Effect of Epsilon toxin-GFP on MDCK cells and renal tubule in vivo.
J Histochem Cytochem 52: 931–942.25. Soler-Jover A, Dorca J, Popoff MR, Gibert M, Saura J, et al. (2007) Distribution
of Clostridium perfringens epsilon toxin in the brains of acutely intoxicated mice and
its effect upon glial cells. Toxicon 50: 530–540.26. Nagahama M, Sakurai J (1992) High-affinity binding of Clostridium perfringens
epsilon-toxin to rat brain. Infect Immun 60: 1237–1240.27. Dorca-Arevalo J, Soler-Jover A, Gibert M, Popoff MR, Martın-Satue M, et al.
(2008) Binding of epsilon-toxin from Clostridium perfringens in the nervous system.
Vet Microbiol 131: 14–25.28. Palay SL, Chan-Palay V (1974) Cerebellar cortex cytology and organization.
Springer-Verlag.29. Dupont JL, Fourcaudot E, Beekenkamp H, Poulain B, Bossu JL (2006) Synaptic
organization of the mouse cerebellar cortex in organotypic slice cultures.Cerebellum 5: 243–256.
30. Lonchamp E, Dupont JL, Doussau F, Shin HS, Poulain B, et al. (2009) Deletion
of Cav2.1(alpha1(A)) subunit of Ca2+-channels impairs synaptic GABA andglutamate release in the mouse cerebellar cortex in cultured slices. Eur J Neurosci
30(12): 2293–307.31. Adamson RH, Ly JC, Fernandez-Miyakawa M, Ochi S, Sakurai J, et al. (2005)
Clostridium perfringens epsilon-toxin increases permeability of single perfused
microvessels of rat mesentery. Infect Immun 73: 4879–4887.32. Dietschy JM, Turley SD (2004) Thematic review series: brain Lipids. Cholesterol
metabolism in the central nervous system during early development and in themature animal. J Lipid Res 45: 1375–1397.
33. Lamanauskas N, Nistri A (2008) Riluzole blocks persistent Na+ and Ca2+currents and modulates release of glutamate via presynaptic NMDA receptorson neonatal rat hypoglossal motoneurons in vitro. Eur J Neurosci 27:
2501–2514.
34. Payne DW, Williamson ED, Havard H, Modi N, Brown J (1994) Evaluation of a
new cytotoxicity assay for Clostridium perfringens type D epsilon toxin. FEMSMicrobiol Lett 116: 161–167.
35. Petit L, Gibert M, Gourch A, Bens M, Vandewalle A, et al. (2003) Clostridium
perfringens epsilon toxin rapidly decreases membrane barrier permeability ofpolarized MDCK cells. Cell Microbiol 5: 155–164.
36. Buxton D (1978) In-vitro effects of Clostridium welchii type-D epsilon toxin onguinea-pig, mouse, rabbit and sheep cells. J Med Microbiol 11(3): 299–302.
37. Ottico E, Prinetti A, Prioni S, Giannotta C, Basso L, et al. (2003) Dynamics of
membrane lipid domains in neuronal cells differentiated in culture. J Lipid Res44: 2142–2151.
38. Greenfield RA, Brown BR, Hutchins JB, Iandolo JJ, Jackson R, et al. (2002)Microbiological, biological, and chemical weapons of warfare and terrorism.
Am J Med Sci 323: 326–340.39. Gill DM (1987) Bacterial Toxins: lethal amounts. In: Toxins and Enzymes
(Laskin AI, Lechevalier HA, eds 8: 127–135.
40. Popoff MR (1987) Purification and characterization of Clostridium sordellii lethaltoxin and cross-reactivity with Clostridium difficile cytotoxin. Infect Immun 55:
35–43.41. Gahwiler BH (1981) Organotypic monolayer cultures of nervous tissue.
J Neurosci Methods 4: 329–342.
42. Munro P, Kojima H, Dupont JL, Bossu JL, Poulain B, et al. (2001) Highsensitivity of mouse neuronal cells to tetanus toxin requires a GPI-anchored
protein. Biochem Biophys Res Commun 289: 623–629.43. Ribaut-Barassin C, Dupont JL, Haeberle AM, Bombarde G, Huber G, et al.
(2003) Alzheimer’s disease proteins in cerebellar and hippocampal synapsesduring postnatal development and aging of the rat. Neuroscience 120: 405–423.
44. Li Q, Lau A, Morris TJ, Guo L, Fordyce CB, et al. (2004) A syntaxin 1,
Galpha(o), and N-type calcium channel complex at a presynaptic nerve terminal:analysis by quantitative immunocolocalization. J Neurosci 24: 4070–4081.
45. de Barry J, Janoshazi A, Dupont JL, Procksch O, Chasserot-Golaz S, et al.(2006) Functional implication of neuronal calcium sensor-1 and phosphoinositol
4-kinase-beta interaction in regulated exocytosis of PC12 cells. J Biol Chem 281:
18098–18111.46. Chapman J, Zhou MJ (1999) Microplate-based fluorometric methods for the
enzymatic determination of l-glutamate: application in measuring l-glutamate infood samples. Anal Chim Acta 402: 47–52.
47. Thompson CL, Stephenson F (1994) GABAA receptor subtypes expressed incerebellar granule cells: a developmental study. J Neurochem 62: 2037–2044.
48. Weiser M, Bueno E, Sekirnjak C, Martone ME, Baker H, et al. (1995) The
potassium channel subunit KV3.1b is localized to somatic and axonalmembranes of specific populations of CNS neurons. J Neurosci 15: 4298–4314.
49. Barski JJ, Hartmann J, Rose CR, Hoebeek F, Morl K, et al. (2003) Calbindin incerebellar Purkinje neurons is a critical determinant of the precision of motor
coordination. J Neurosci 23: 3469–3477.
50. Fox MA, Sanes JR (2007) Synaptotagmin I and II are present in distinct subsetsof central synapses. J Comp Neurol 503: 280–296.
51. Kadota T, Fujita M, Kadota K (1991) Immunocytochemical localization ofsynaptophysin on the smooth-surfaced tubular membranes present in nerve
terminal and preterminal areas in the rat cerebellar cortex. Arch Histol Cytol 54:519–525.
52. Castejon OJ, Fuller L, Dailey ME (2004) Localization of synapsin-I and PSD-95
in developing postnatal rat cerebellar cortex. Brain Res Dev Brain Res 151:25–32.
53. Huber G, Matus A (1984) Differences in the cellular distributions of twomicrotubule-associated proteins, MAP1 and MAP2, in rat brain. J Neurosci 4:
151–160.
54. Fuchs E, Weber K (1994) Intermediate filaments: structure, dynamics, function,and disease. Annu Rev Biochem 63: 345–382.
55. Imura T, Kornblum HI, Sofroniew MV (2003) The predominant neural stemcell isolated from postnatal and adult forebrain but not early embryonic
forebrain expresses GFAP. J Neurosci 23: 2824–2832.
56. Trapp BD, Bernier L, Andrews SB, Colman DR (1988) Cellular and subcellulardistribution of 29,39-cyclic nucleotide 39-phosphodiesterase and its mRNA in the
rat central nervous system. J Neurochem 51: 859–868.
C. perfringens Epsilon Toxin
PLoS ONE | www.plosone.org 15 September 2010 | Volume 5 | Issue 9 | e13046
Copyright © 2022 FDOKUMEN