Sulphur isotopes as tracers of the influence of potash mining in groundwater salinisation in the...
12
Water Research 36 (2002) 3989–4000 Sulphur isotopes as tracers of the influence of potash mining in groundwater salinisation in the Llobregat Basin (NE Spain) N. Otero*, A. Soler Departament de Cristal.lografia, Mineralogia i Dip " osits Minerals, Facultat de Geologia, Universitat de Barcelona, Mart ! ı i Franqu " es, s/n, 08028, Barcelona, Spain Received 9 August 2001; accepted 19 February 2002 Abstract Conventional chemical data for spring and river waters are presented together with sulphur isotopic data for dissolved sulphate to elucidate the source of water salinisation in the middle section of the Llobregat River. As dilution processes do not affect sulphur isotopic composition, the analysis of d 34 S of dissolved sulphate in waters provides an excellent tool for quantifying the environmental impact caused by the mining activity existing in the area. The d 34 S of dissolved sulphate from mining effluents and saline springs unrelated to mining activity was analysed. The results obtained range from +18% to +20% (VCDT) for mining effluents and from +10% to +14% (VCDT) for natural saline springs. These values are in accordance with the pattern of sulphur isotopic composition of sulphates from the evaporite materials of this area. This distinctive isotopic composition has allowed us to determine the origin of salinity in those cases in which chemical features are not conclusive. In addition, two fertilisers widely used in the studied area are chemically and isotopically characterised and their contribution to groundwater salinisation is assessed. r 2002 Elsevier Science Ltd. All rights reserved. Keywords: Sulphur isotopes; Potash mining; Water salinisation; Fertilisers; Contamination 1. Introduction In the middle section of the Llobregat Basin (North- eastern Spain) several potash mining works exist in the localities of Sallent, S ! uria, Balsareny and Cardona (Fig. 1). This activity produces large salt mining tailings, which are stored around the mining sites, with no waterproofing. Some aquifers near the mining zones are highly salinised. The origin of the salinity is controver- sial, as it can be related to natural water interaction with saline formations, or it could be caused by contamina- tion from mine tailing effluents. Fertilisers could also contribute to groundwater salinisation, as agriculture is an important economic activity in the Llobregat Basin. Sulphur isotopes of dissolved sulphate can be used to identify natural sources of sulphate in surface waters [1– 6] and in groundwater [7–9]. In some cases they can be applied to distinguish between natural and anthropo- genic sources [10–16] and to trace processes in the soil [17,18]. In a previous paper [19], we reported differences between sulphur isotopic composition of natural and anthropogenic sources in the Llobregat River waters large enough to consider d 34 S as a good tool to discriminate their different origins. This tool, however, is more useful when the studied area is small since the inputs can be better constrained and more limited. On the basis of our previous results, the aim of the present paper is to determine the origin of groundwater salinisation in a specific area of Llobregat Basin with some saline springs, using the sulphur isotope composition of dissolved sulphate as well as water chemistry. *Corresponding author. Tel.: +34-93-402-1345; fax: +34- 93-402-1340. E-mail address: [email protected] (N. Otero). 0043-1354/02/$ - see front matter r 2002 Elsevier Science Ltd. All rights reserved. PII:S0043-1354(02)00125-2
Transcript of Sulphur isotopes as tracers of the influence of potash mining in groundwater salinisation in the...
Water Research 36 (2002) 3989–4000
Sulphur isotopes as tracers of the influence of potash mining ingroundwater salinisation in the Llobregat Basin (NE Spain)
N. Otero*, A. Soler
Departament de Cristal.lografia, Mineralogia i Dip "osits Minerals, Facultat de Geologia, Universitat de Barcelona, Mart!ı i Franqu"es, s/n,
08028, Barcelona, Spain
Received 9 August 2001; accepted 19 February 2002
Abstract
Conventional chemical data for spring and river waters are presented together with sulphur isotopic data for
dissolved sulphate to elucidate the source of water salinisation in the middle section of the Llobregat River. As dilution
processes do not affect sulphur isotopic composition, the analysis of d34S of dissolved sulphate in waters provides an
excellent tool for quantifying the environmental impact caused by the mining activity existing in the area.
The d34S of dissolved sulphate from mining effluents and saline springs unrelated to mining activity was analysed.
The results obtained range from+18% to +20% (VCDT) for mining effluents and from+10% to +14% (VCDT) for
natural saline springs. These values are in accordance with the pattern of sulphur isotopic composition of sulphates
from the evaporite materials of this area. This distinctive isotopic composition has allowed us to determine the origin of
salinity in those cases in which chemical features are not conclusive. In addition, two fertilisers widely used in the
studied area are chemically and isotopically characterised and their contribution to groundwater salinisation is assessed.
r 2002 Elsevier Science Ltd. All rights reserved.
Keywords: Sulphur isotopes; Potash mining; Water salinisation; Fertilisers; Contamination
1. Introduction
In the middle section of the Llobregat Basin (North-
eastern Spain) several potash mining works exist in the
localities of Sallent, S !uria, Balsareny and Cardona
(Fig. 1). This activity produces large salt mining tailings,
which are stored around the mining sites, with no
waterproofing. Some aquifers near the mining zones are
highly salinised. The origin of the salinity is controver-
sial, as it can be related to natural water interaction with
saline formations, or it could be caused by contamina-
tion from mine tailing effluents. Fertilisers could also
contribute to groundwater salinisation, as agriculture is
an important economic activity in the Llobregat Basin.
Sulphur isotopes of dissolved sulphate can be used to
identify natural sources of sulphate in surface waters [1–
6] and in groundwater [7–9]. In some cases they can be
applied to distinguish between natural and anthropo-
genic sources [10–16] and to trace processes in the soil
[17,18].
In a previous paper [19], we reported differences
between sulphur isotopic composition of natural
and anthropogenic sources in the Llobregat River
waters large enough to consider d34S as a good tool
to discriminate their different origins. This tool,
however, is more useful when the studied area is small
since the inputs can be better constrained and more
limited. On the basis of our previous results, the aim
of the present paper is to determine the origin of
groundwater salinisation in a specific area of Llobregat
Basin with some saline springs, using the sulphur isotope
composition of dissolved sulphate as well as water
chemistry.
*Corresponding author. Tel.: +34-93-402-1345; fax: +34-
93-402-1340.
E-mail address: [email protected] (N. Otero).
0043-1354/02/$ - see front matter r 2002 Elsevier Science Ltd. All rights reserved.
PII: S 0 0 4 3 - 1 3 5 4 ( 0 2 ) 0 0 1 2 5 - 2
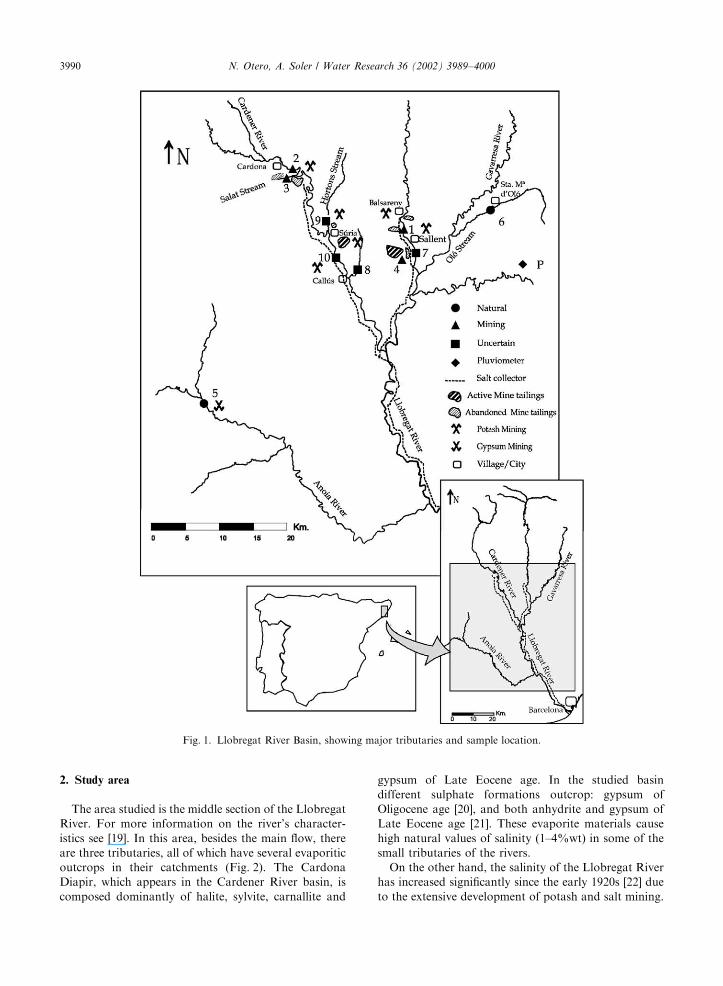
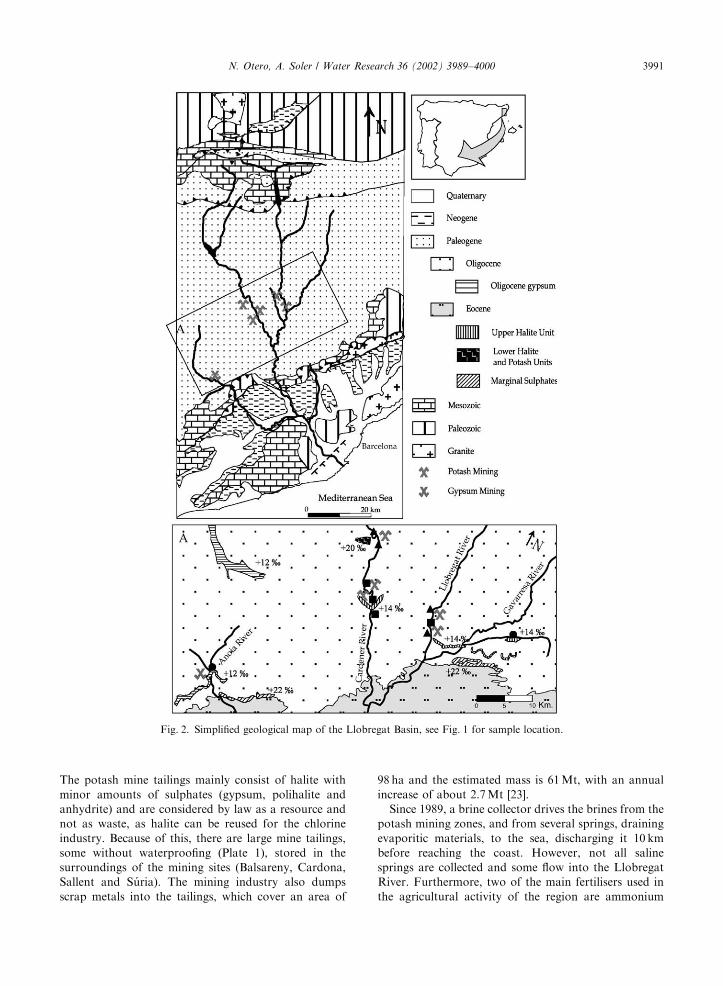
2. Study area
The area studied is the middle section of the Llobregat
River. For more information on the river’s character-
istics see [19]. In this area, besides the main flow, there
are three tributaries, all of which have several evaporitic
outcrops in their catchments (Fig. 2). The Cardona
Diapir, which appears in the Cardener River basin, is
composed dominantly of halite, sylvite, carnallite and
gypsum of Late Eocene age. In the studied basin
different sulphate formations outcrop: gypsum of
Oligocene age [20], and both anhydrite and gypsum of
Late Eocene age [21]. These evaporite materials cause
high natural values of salinity (1–4%wt) in some of the
small tributaries of the rivers.
On the other hand, the salinity of the Llobregat River
has increased significantly since the early 1920s [22] due
to the extensive development of potash and salt mining.
Fig. 1. Llobregat River Basin, showing major tributaries and sample location.
N. Otero, A. Soler / Water Research 36 (2002) 3989–40003990
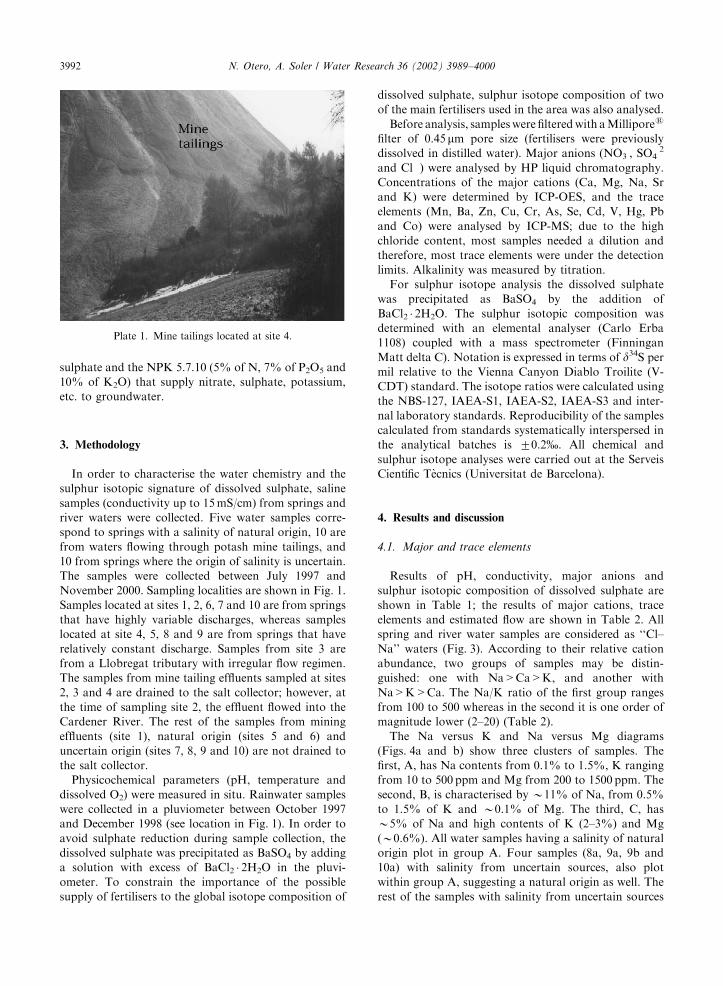
The potash mine tailings mainly consist of halite with
minor amounts of sulphates (gypsum, polihalite and
anhydrite) and are considered by law as a resource and
not as waste, as halite can be reused for the chlorine
industry. Because of this, there are large mine tailings,
some without waterproofing (Plate 1), stored in the
surroundings of the mining sites (Balsareny, Cardona,
Sallent and S !uria). The mining industry also dumps
scrap metals into the tailings, which cover an area of
98 ha and the estimated mass is 61Mt, with an annual
increase of about 2.7Mt [23].
Since 1989, a brine collector drives the brines from the
potash mining zones, and from several springs, draining
evaporitic materials, to the sea, discharging it 10 km
before reaching the coast. However, not all saline
springs are collected and some flow into the Llobregat
River. Furthermore, two of the main fertilisers used in
the agricultural activity of the region are ammonium
Fig. 2. Simplified geological map of the Llobregat Basin, see Fig. 1 for sample location.
N. Otero, A. Soler / Water Research 36 (2002) 3989–4000 3991
sulphate and the NPK 5.7.10 (5% of N, 7% of P2O5 and
10% of K2O) that supply nitrate, sulphate, potassium,
etc. to groundwater.
3. Methodology
In order to characterise the water chemistry and the
sulphur isotopic signature of dissolved sulphate, saline
samples (conductivity up to 15mS/cm) from springs and
river waters were collected. Five water samples corre-
spond to springs with a salinity of natural origin, 10 are
from waters flowing through potash mine tailings, and
10 from springs where the origin of salinity is uncertain.
The samples were collected between July 1997 and
November 2000. Sampling localities are shown in Fig. 1.
Samples located at sites 1, 2, 6, 7 and 10 are from springs
that have highly variable discharges, whereas samples
located at site 4, 5, 8 and 9 are from springs that have
relatively constant discharge. Samples from site 3 are
from a Llobregat tributary with irregular flow regimen.
The samples from mine tailing effluents sampled at sites
2, 3 and 4 are drained to the salt collector; however, at
the time of sampling site 2, the effluent flowed into the
Cardener River. The rest of the samples from mining
effluents (site 1), natural origin (sites 5 and 6) and
uncertain origin (sites 7, 8, 9 and 10) are not drained to
the salt collector.
Physicochemical parameters (pH, temperature and
dissolved O2) were measured in situ. Rainwater samples
were collected in a pluviometer between October 1997
and December 1998 (see location in Fig. 1). In order to
avoid sulphate reduction during sample collection, the
dissolved sulphate was precipitated as BaSO4 by adding
a solution with excess of BaCl2 � 2H2O in the pluvi-
ometer. To constrain the importance of the possible
supply of fertilisers to the global isotope composition of
dissolved sulphate, sulphur isotope composition of two
of the main fertilisers used in the area was also analysed.
Before analysis, sampleswere filteredwith aMillipores
filter of 0.45mm pore size (fertilisers were previously
dissolved in distilled water). Major anions (NO3�, SO4
�2
and Cl�) were analysed by HP liquid chromatography.
Concentrations of the major cations (Ca, Mg, Na, Sr
and K) were determined by ICP-OES, and the trace
elements (Mn, Ba, Zn, Cu, Cr, As, Se, Cd, V, Hg, Pb
and Co) were analysed by ICP-MS; due to the high
chloride content, most samples needed a dilution and
therefore, most trace elements were under the detection
limits. Alkalinity was measured by titration.
For sulphur isotope analysis the dissolved sulphate
was precipitated as BaSO4 by the addition of
BaCl2 � 2H2O. The sulphur isotopic composition was
determined with an elemental analyser (Carlo Erba
1108) coupled with a mass spectrometer (Finningan
Matt delta C). Notation is expressed in terms of d34S per
mil relative to the Vienna Canyon Diablo Troilite (V-
CDT) standard. The isotope ratios were calculated using
the NBS-127, IAEA-S1, IAEA-S2, IAEA-S3 and inter-
nal laboratory standards. Reproducibility of the samples
calculated from standards systematically interspersed in
the analytical batches is 70.2%. All chemical and
sulphur isotope analyses were carried out at the Serveis
Cient!ıfic T"ecnics (Universitat de Barcelona).
4. Results and discussion
4.1. Major and trace elements
Results of pH, conductivity, major anions and
sulphur isotopic composition of dissolved sulphate are
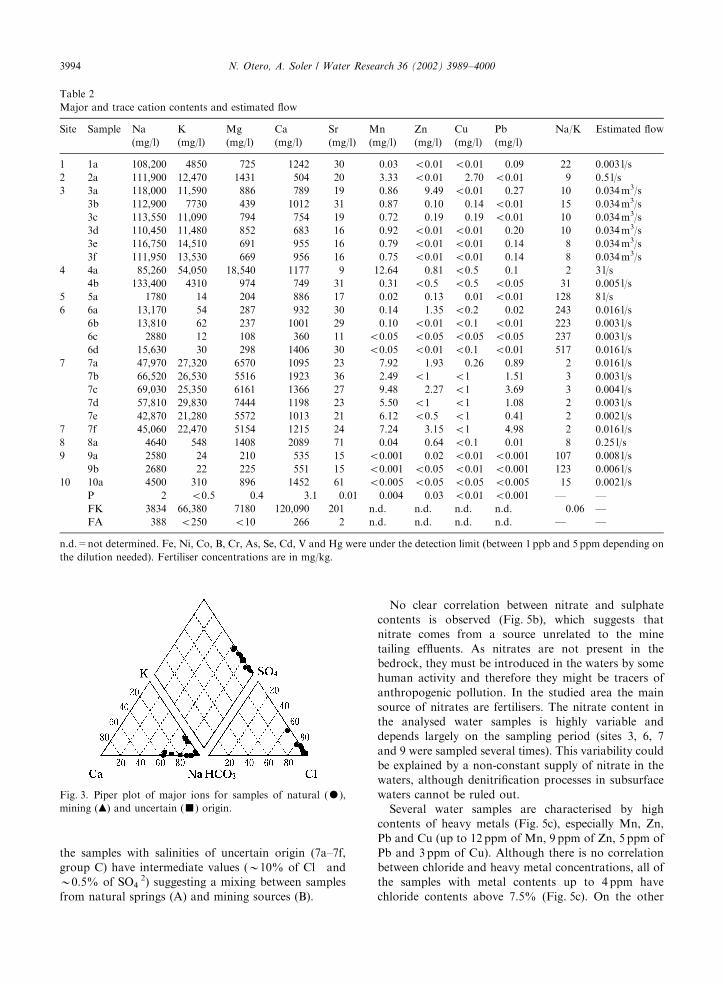
shown in Table 1; the results of major cations, trace
elements and estimated flow are shown in Table 2. All
spring and river water samples are considered as ‘‘Cl–
Na’’ waters (Fig. 3). According to their relative cation
abundance, two groups of samples may be distin-
guished: one with Na>Ca>K, and another with
Na>K>Ca. The Na/K ratio of the first group ranges
from 100 to 500 whereas in the second it is one order of
magnitude lower (2–20) (Table 2).
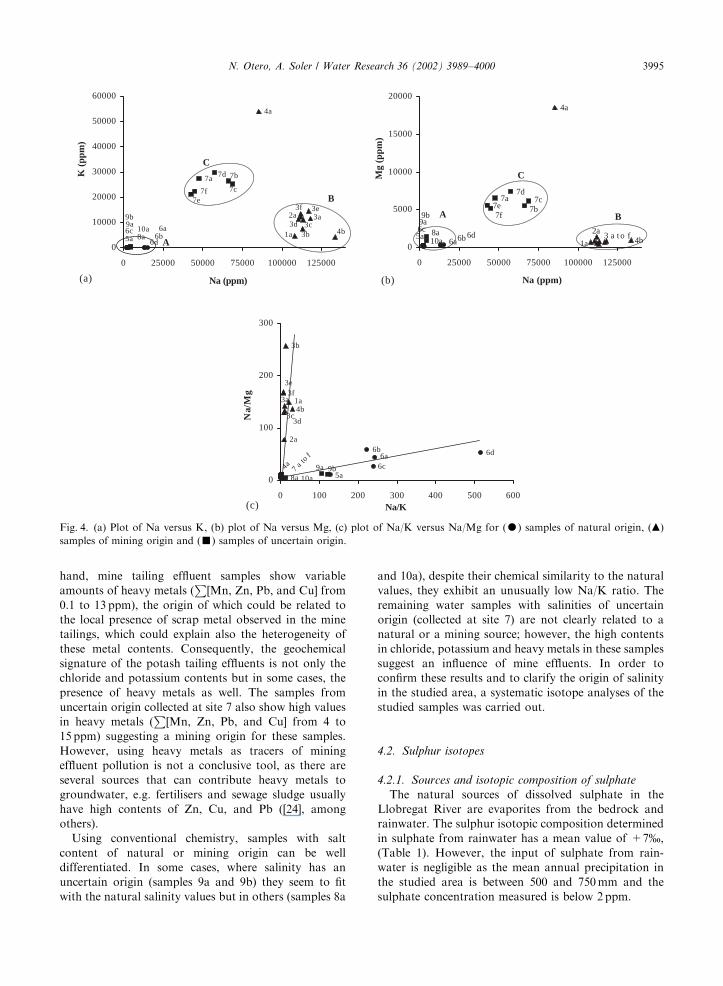
The Na versus K and Na versus Mg diagrams
(Figs. 4a and b) show three clusters of samples. The
first, A, has Na contents from 0.1% to 1.5%, K ranging
from 10 to 500 ppm and Mg from 200 to 1500 ppm. The
second, B, is characterised by B11% of Na, from 0.5%
to 1.5% of K and B0.1% of Mg. The third, C, has
B5% of Na and high contents of K (2–3%) and Mg
(B0.6%). All water samples having a salinity of natural
origin plot in group A. Four samples (8a, 9a, 9b and
10a) with salinity from uncertain sources, also plot
within group A, suggesting a natural origin as well. The
rest of the samples with salinity from uncertain sources
Plate 1. Mine tailings located at site 4.
N. Otero, A. Soler / Water Research 36 (2002) 3989–40003992
form group C. Group B includes water samples from the
Salat Stream (draining the Cardona diapir as well as
mine tailings, site 3) and samples from mine tailing
effluents (1a, 2a and 4b). Sample 4a from mine effluents
plots outside these groups. The mine effluents collected
at site 4a drain active mine tailings; the effluents
collected at sites 1, 2, 3 and 4b are from abandoned
mine tailings. As solubility of silvite and carnallite is
greater than solubility of halite, the active and the
abandoned mine tailings would have different K and Mg
contents.
On a Na/Mg versus Na/K diagram (Fig. 4c) samples
plot in two distinct trends: one with a wide Na/K range
and low Na/Mg ratio which are the natural springs; and
a second trend with a low Na/K ratio and high Na/Mg
variability which includes samples from mining efflu-
ents. The samples with salinity of uncertain origin
plot in the lower Na/K and Na/Mg ratio region,
and cannot clearly be associated either to a natural or
to a mining origin, although samples 9a and 9b seem to
fit in the trend defined by the salinity of the natural
springs.
K and Mg contents allow the distinction between
samples of natural origin and samples of mining
effluents because the potash unit is mainly made up of
sylvite (KCl) and carnallite (KMgCl3 � 6H2O). Never-
theless, K and Mg data are not conclusive indicators of
the origin of salinisation in uncertain cases since (a)
there are other sources for K and Mg in the basin such
as NPK fertilisers (nitrate–phosphate–potassium) and/
or industry pollutants; and (b) Na/K and Na/Mg ratios
from the mine tailings are time dependant as solubility
of silvite and carnallite is greater than solubility of
halite. Therefore, as suggested above, K and Mg
contents in active mine tailings are greater than in
abandoned mine tailings.
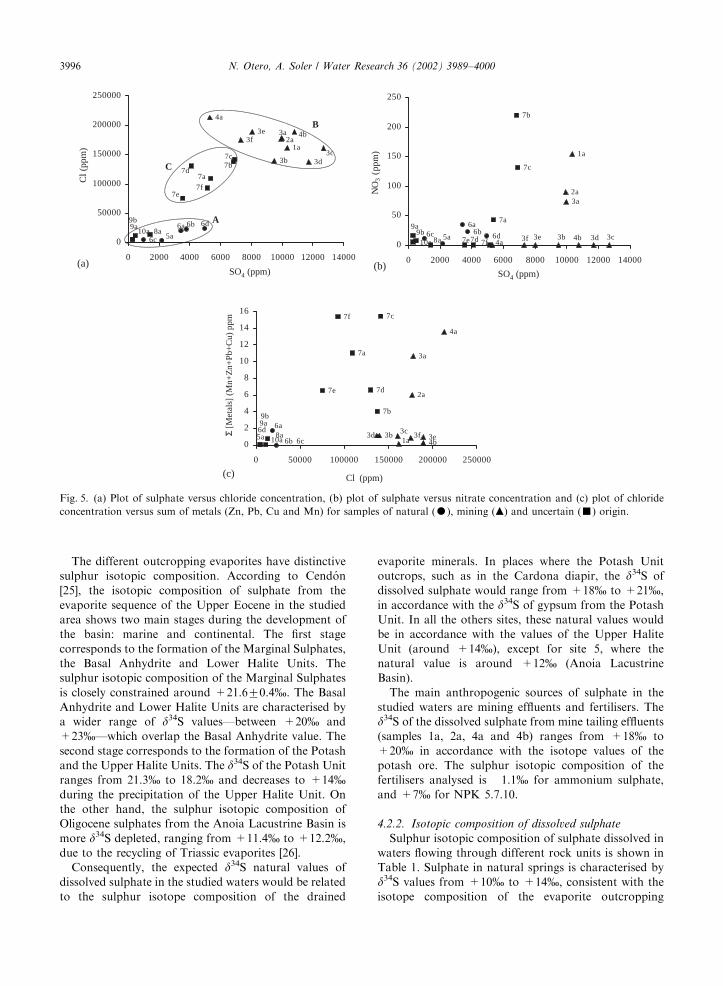
In the chloride versus sulphate diagram (Fig. 5a) the
natural and mining samples are well differentiated:
natural samples have o2% of Cl� and o0.5% of
SO4�2(group A), whereas mining samples contain B15%
of Cl� and variable amounts of SO4�2 (group B). As
previously suggested by Na–K–Mg contents (Fig. 4a
and b), the Cl�/SO4�2ratios in the samples 8a, 9a, 9b and
10a also point to a natural origin (group A). The rest of
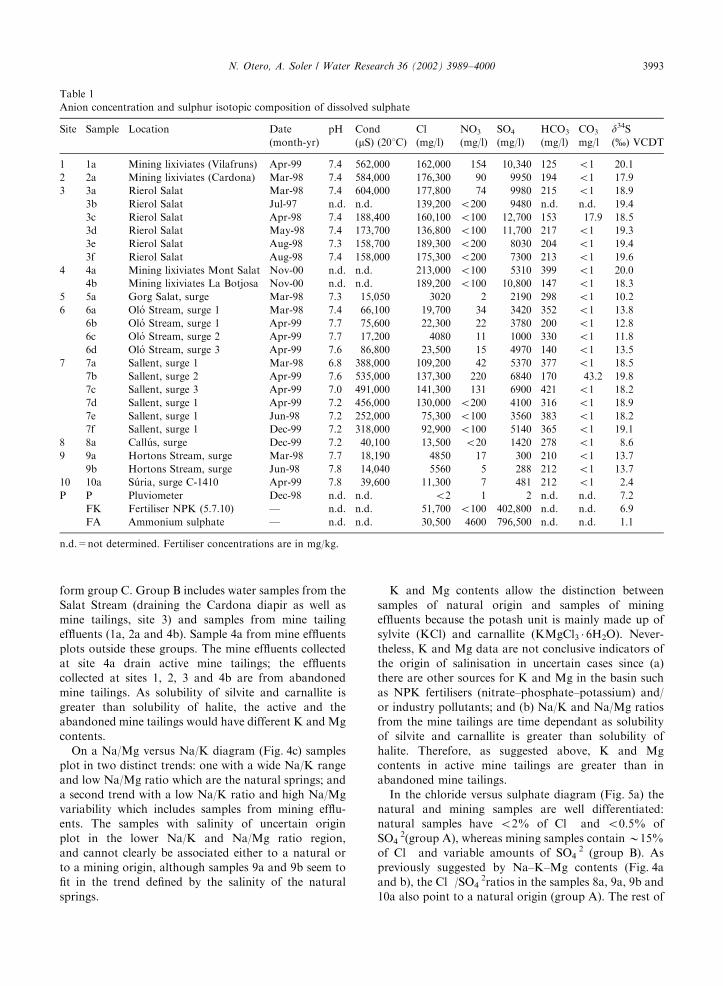
Table 1
Anion concentration and sulphur isotopic composition of dissolved sulphate
Site Sample Location Date pH Cond Cl NO3 SO4 HCO3 CO3 d34S(month-yr) (mS) (201C) (mg/l) (mg/l) (mg/l) (mg/l) mg/l (%) VCDT
1 1a Mining lixiviates (Vilafruns) Apr-99 7.4 562,000 162,000 154 10,340 125 o1 20.1
2 2a Mining lixiviates (Cardona) Mar-98 7.4 584,000 176,300 90 9950 194 o1 17.9
3 3a Rierol Salat Mar-98 7.4 604,000 177,800 74 9980 215 o1 18.9
3b Rierol Salat Jul-97 n.d. n.d. 139,200 o200 9480 n.d. n.d. 19.4
3c Rierol Salat Apr-98 7.4 188,400 160,100 o100 12,700 153 17.9 18.5
3d Rierol Salat May-98 7.4 173,700 136,800 o100 11,700 217 o1 19.3
3e Rierol Salat Aug-98 7.3 158,700 189,300 o200 8030 204 o1 19.4
3f Rierol Salat Aug-98 7.4 158,000 175,300 o200 7300 213 o1 19.6
4 4a Mining lixiviates Mont Salat Nov-00 n.d. n.d. 213,000 o100 5310 399 o1 20.0
4b Mining lixiviates La Botjosa Nov-00 n.d. n.d. 189,200 o100 10,800 147 o1 18.3
5 5a Gorg Salat, surge Mar-98 7.3 15,050 3020 2 2190 298 o1 10.2
6 6a Ol !o Stream, surge 1 Mar-98 7.4 66,100 19,700 34 3420 352 o1 13.8
6b Ol !o Stream, surge 1 Apr-99 7.7 75,600 22,300 22 3780 200 o1 12.8
6c Ol !o Stream, surge 2 Apr-99 7.7 17,200 4080 11 1000 330 o1 11.8
6d Ol !o Stream, surge 3 Apr-99 7.6 86,800 23,500 15 4970 140 o1 13.5
7 7a Sallent, surge 1 Mar-98 6.8 388,000 109,200 42 5370 377 o1 18.5
7b Sallent, surge 2 Apr-99 7.6 535,000 137,300 220 6840 170 43.2 19.8
7c Sallent, surge 3 Apr-99 7.0 491,000 141,300 131 6900 421 o1 18.2
7d Sallent, surge 1 Apr-99 7.2 456,000 130,000 o200 4100 316 o1 18.9
7e Sallent, surge 1 Jun-98 7.2 252,000 75,300 o100 3560 383 o1 18.2
7f Sallent, surge 1 Dec-99 7.2 318,000 92,900 o100 5140 365 o1 19.1
8 8a Call !us, surge Dec-99 7.2 40,100 13,500 o20 1420 278 o1 8.6
9 9a Hortons Stream, surge Mar-98 7.7 18,190 4850 17 300 210 o1 13.7
9b Hortons Stream, surge Jun-98 7.8 14,040 5560 5 288 212 o1 13.7
10 10a S !uria, surge C-1410 Apr-99 7.8 39,600 11,300 7 481 212 o1 2.4
P P Pluviometer Dec-98 n.d. n.d. o2 1 2 n.d. n.d. 7.2
FK Fertiliser NPK (5.7.10) — n.d. n.d. 51,700 o100 402,800 n.d. n.d. 6.9
FA Ammonium sulphate — n.d. n.d. 30,500 4600 796,500 n.d. n.d. �1.1
n.d.=not determined. Fertiliser concentrations are in mg/kg.
N. Otero, A. Soler / Water Research 36 (2002) 3989–4000 3993
the samples with salinities of uncertain origin (7a–7f,
group C) have intermediate values (B10% of Cl� and
B0.5% of SO4�2) suggesting a mixing between samples
from natural springs (A) and mining sources (B).
No clear correlation between nitrate and sulphate
contents is observed (Fig. 5b), which suggests that
nitrate comes from a source unrelated to the mine
tailing effluents. As nitrates are not present in the
bedrock, they must be introduced in the waters by some
human activity and therefore they might be tracers of
anthropogenic pollution. In the studied area the main
source of nitrates are fertilisers. The nitrate content in
the analysed water samples is highly variable and
depends largely on the sampling period (sites 3, 6, 7
and 9 were sampled several times). This variability could
be explained by a non-constant supply of nitrate in the
waters, although denitrification processes in subsurface
waters cannot be ruled out.
Several water samples are characterised by high
contents of heavy metals (Fig. 5c), especially Mn, Zn,
Pb and Cu (up to 12 ppm of Mn, 9 ppm of Zn, 5 ppm of
Pb and 3 ppm of Cu). Although there is no correlation
between chloride and heavy metal concentrations, all of
the samples with metal contents up to 4 ppm have
chloride contents above 7.5% (Fig. 5c). On the other
Table 2
Major and trace cation contents and estimated flow
Site Sample Na K Mg Ca Sr Mn Zn Cu Pb Na/K Estimated flow
(mg/l) (mg/l) (mg/l) (mg/l) (mg/l) (mg/l) (mg/l) (mg/l) (mg/l)
1 1a 108,200 4850 725 1242 30 0.03 o0.01 o0.01 0.09 22 0.003 l/s
2 2a 111,900 12,470 1431 504 20 3.33 o0.01 2.70 o0.01 9 0.5 l/s
3 3a 118,000 11,590 886 789 19 0.86 9.49 o0.01 0.27 10 0.034m3/s
3b 112,900 7730 439 1012 31 0.87 0.10 0.14 o0.01 15 0.034m3/s
3c 113,550 11,090 794 754 19 0.72 0.19 0.19 o0.01 10 0.034m3/s
3d 110,450 11,480 852 683 16 0.92 o0.01 o0.01 0.20 10 0.034m3/s
3e 116,750 14,510 691 955 16 0.79 o0.01 o0.01 0.14 8 0.034m3/s
3f 111,950 13,530 669 956 16 0.75 o0.01 o0.01 0.14 8 0.034m3/s
4 4a 85,260 54,050 18,540 1177 9 12.64 0.81 o0.5 0.1 2 3 l/s
4b 133,400 4310 974 749 31 0.31 o0.5 o0.5 o0.05 31 0.005 l/s
5 5a 1780 14 204 886 17 0.02 0.13 0.01 o0.01 128 8 l/s
6 6a 13,170 54 287 932 30 0.14 1.35 o0.2 0.02 243 0.016 l/s
6b 13,810 62 237 1001 29 0.10 o0.01 o0.1 o0.01 223 0.003 l/s
6c 2880 12 108 360 11 o0.05 o0.05 o0.05 o0.05 237 0.003 l/s
6d 15,630 30 298 1406 30 o0.05 o0.01 o0.1 o0.01 517 0.016 l/s
7 7a 47,970 27,320 6570 1095 23 7.92 1.93 0.26 0.89 2 0.016 l/s
7b 66,520 26,530 5516 1923 36 2.49 o1 o1 1.51 3 0.003 l/s
7c 69,030 25,350 6161 1366 27 9.48 2.27 o1 3.69 3 0.004 l/s
7d 57,810 29,830 7444 1198 23 5.50 o1 o1 1.08 2 0.003 l/s
7e 42,870 21,280 5572 1013 21 6.12 o0.5 o1 0.41 2 0.002 l/s
7 7f 45,060 22,470 5154 1215 24 7.24 3.15 o1 4.98 2 0.016 l/s
8 8a 4640 548 1408 2089 71 0.04 0.64 o0.1 0.01 8 0.25 l/s
9 9a 2580 24 210 535 15 o0.001 0.02 o0.01 o0.001 107 0.008 l/s
9b 2680 22 225 551 15 o0.001 o0.05 o0.01 o0.001 123 0.006 l/s
10 10a 4500 310 896 1452 61 o0.005 o0.05 o0.05 o0.005 15 0.002 l/s
P 2 o0.5 0.4 3.1 0.01 0.004 0.03 o0.01 o0.001 — —
FK 3834 66,380 7180 120,090 201 n.d. n.d. n.d. n.d. 0.06 —
FA 388 o250 o10 266 2 n.d. n.d. n.d. n.d. — —
n.d.=not determined. Fe, Ni, Co, B, Cr, As, Se, Cd, V and Hg were under the detection limit (between 1 ppb and 5 ppm depending on
the dilution needed). Fertiliser concentrations are in mg/kg.
Fig. 3. Piper plot of major ions for samples of natural (K),
mining (m) and uncertain (’) origin.
N. Otero, A. Soler / Water Research 36 (2002) 3989–40003994
hand, mine tailing effluent samples show variable
amounts of heavy metals (P
[Mn, Zn, Pb, and Cu] from
0.1 to 13 ppm), the origin of which could be related to
the local presence of scrap metal observed in the mine
tailings, which could explain also the heterogeneity of
these metal contents. Consequently, the geochemical
signature of the potash tailing effluents is not only the
chloride and potassium contents but in some cases, the
presence of heavy metals as well. The samples from
uncertain origin collected at site 7 also show high values
in heavy metals (P
[Mn, Zn, Pb, and Cu] from 4 to
15 ppm) suggesting a mining origin for these samples.
However, using heavy metals as tracers of mining
effluent pollution is not a conclusive tool, as there are
several sources that can contribute heavy metals to
groundwater, e.g. fertilisers and sewage sludge usually
have high contents of Zn, Cu, and Pb ([24], among
others).
Using conventional chemistry, samples with salt
content of natural or mining origin can be well
differentiated. In some cases, where salinity has an
uncertain origin (samples 9a and 9b) they seem to fit
with the natural salinity values but in others (samples 8a
and 10a), despite their chemical similarity to the natural
values, they exhibit an unusually low Na/K ratio. The
remaining water samples with salinities of uncertain
origin (collected at site 7) are not clearly related to a
natural or a mining source; however, the high contents
in chloride, potassium and heavy metals in these samples
suggest an influence of mine effluents. In order to
confirm these results and to clarify the origin of salinity
in the studied area, a systematic isotope analyses of the
studied samples was carried out.
4.2. Sulphur isotopes
4.2.1. Sources and isotopic composition of sulphate
The natural sources of dissolved sulphate in the
Llobregat River are evaporites from the bedrock and
rainwater. The sulphur isotopic composition determined
in sulphate from rainwater has a mean value of +7%,
(Table 1). However, the input of sulphate from rain-
water is negligible as the mean annual precipitation in
the studied area is between 500 and 750mm and the
sulphate concentration measured is below 2ppm.
5a6c 6a
6b6d
3a
4b3d
3f 3e
4a
2a
1a3c
3b9a9b
8a10a
7c7e
7d 7b7a
7f
0
10000
20000
30000
40000
50000
60000
0 25000 50000 75000 100000 125000
A
B
C
5a6c
6a6b 6d4b
3 a t o f1a
4a
2a9a9b
8a10a
7d7a
7e7f
7b7c
0
5000
10000
15000
20000
0 25000 50000 75000 100000 125000
A
C
B
6d6b6a
6c5a
3d
4b
3b
3e3f
3c
3a 1a
2a
7 a to
f
9b9a10a8a
4a
0
100
200
300
0 100 200 300 400 500 600
Na/
Mg
(a) (b)
(c)
Na (ppm)Na (ppm)
Na/K
K (
ppm
)
Mg
(ppm
)
Fig. 4. (a) Plot of Na versus K, (b) plot of Na versus Mg, (c) plot of Na/K versus Na/Mg for (K) samples of natural origin, (m)
samples of mining origin and (’) samples of uncertain origin.
N. Otero, A. Soler / Water Research 36 (2002) 3989–4000 3995
The different outcropping evaporites have distinctive
sulphur isotopic composition. According to Cend !on
[25], the isotopic composition of sulphate from the
evaporite sequence of the Upper Eocene in the studied
area shows two main stages during the development of
the basin: marine and continental. The first stage
corresponds to the formation of the Marginal Sulphates,
the Basal Anhydrite and Lower Halite Units. The
sulphur isotopic composition of the Marginal Sulphates
is closely constrained around +21.670.4%. The Basal
Anhydrite and Lower Halite Units are characterised by
a wider range of d34S values—between +20% and
+23%—which overlap the Basal Anhydrite value. The
second stage corresponds to the formation of the Potash
and the Upper Halite Units. The d34S of the Potash Unit
ranges from 21.3% to 18.2% and decreases to +14%during the precipitation of the Upper Halite Unit. On
the other hand, the sulphur isotopic composition of
Oligocene sulphates from the Anoia Lacustrine Basin is
more d34S depleted, ranging from +11.4% to +12.2%,
due to the recycling of Triassic evaporites [26].
Consequently, the expected d34S natural values of
dissolved sulphate in the studied waters would be related
to the sulphur isotope composition of the drained
evaporite minerals. In places where the Potash Unit
outcrops, such as in the Cardona diapir, the d34S of
dissolved sulphate would range from +18% to +21%,
in accordance with the d34S of gypsum from the Potash
Unit. In all the others sites, these natural values would
be in accordance with the values of the Upper Halite
Unit (around +14%), except for site 5, where the
natural value is around +12% (Anoia Lacustrine
Basin).
The main anthropogenic sources of sulphate in the
studied waters are mining effluents and fertilisers. The
d34S of the dissolved sulphate from mine tailing effluents
(samples 1a, 2a, 4a and 4b) ranges from +18% to
+20% in accordance with the isotope values of the
potash ore. The sulphur isotopic composition of the
fertilisers analysed is �1.1% for ammonium sulphate,
and +7% for NPK 5.7.10.
4.2.2. Isotopic composition of dissolved sulphate
Sulphur isotopic composition of sulphate dissolved in
waters flowing through different rock units is shown in
Table 1. Sulphate in natural springs is characterised by
d34S values from +10% to +14%, consistent with the
isotope composition of the evaporite outcropping
6c 5a6a 6b 6d
2a3a
3d3c
4b
1a
3b
3e3f
4a
9a9b
10a 8a
7b7c
7e7f7a
7d
0
50000
100000
150000
200000
250000
0 2000 4000 6000 8000 10000 12000 14000
B
A
C
5a6c6a
6b 6d4a
3c3d4b3b3e3f
1a
2a3a
9b10a 8a 7e7d 7f
7b
7c
7a9a
0
50
100
150
200
250
0 2000 4000 6000 8000 10000 12000 14000
NO
3 (p
pm)
6a
10a6d
6b 6c
4a
3a
2a
3d 3b 3c 3f 3e4b1a
7c7f
7a
7d7e
8a
9a9b
5a
7b
0
2
4
6
8
10
12
14
16
0 50000 100000 150000 200000 250000
(a) (b)
(c)
Cl (
ppm
)
Σ Σ [M
etal
s] (
Mn+
Zn+
Pb+
Cu)
ppm
Cl (ppm)
SO4 (ppm) SO4 (ppm)
Fig. 5. (a) Plot of sulphate versus chloride concentration, (b) plot of sulphate versus nitrate concentration and (c) plot of chloride
concentration versus sum of metals (Zn, Pb, Cu and Mn) for samples of natural (K), mining (m) and uncertain (’) origin.
N. Otero, A. Soler / Water Research 36 (2002) 3989–40003996
materials. Thus, samples 6a–6d (site 6) have d34S values
around +13% in agreement with evaporites from the
Upper Halite Unit. Sample 5a (site 5), from waters
flowing through evaporites of the Anoia Lacustrine
System, has a d34S=+10.2% close to the isotope
composition of the gypsum formation of Oligocene age
(d34S=+11%).
Water samples collected at site 3 (3a–3f) flow through
mine tailings and evaporites from the Cardona diapir
(Lower Halite and Potash Units) and their d34SSO4
ranges from +18.5% to +19.6% (Plate 2). As sulphur
isotopic composition of bedrock and mine tailings in this
site is similar (d34S=+1970.5%), the sulphate con-
tribution to waters of mining tailings is, in this case,
impossible to evaluate.
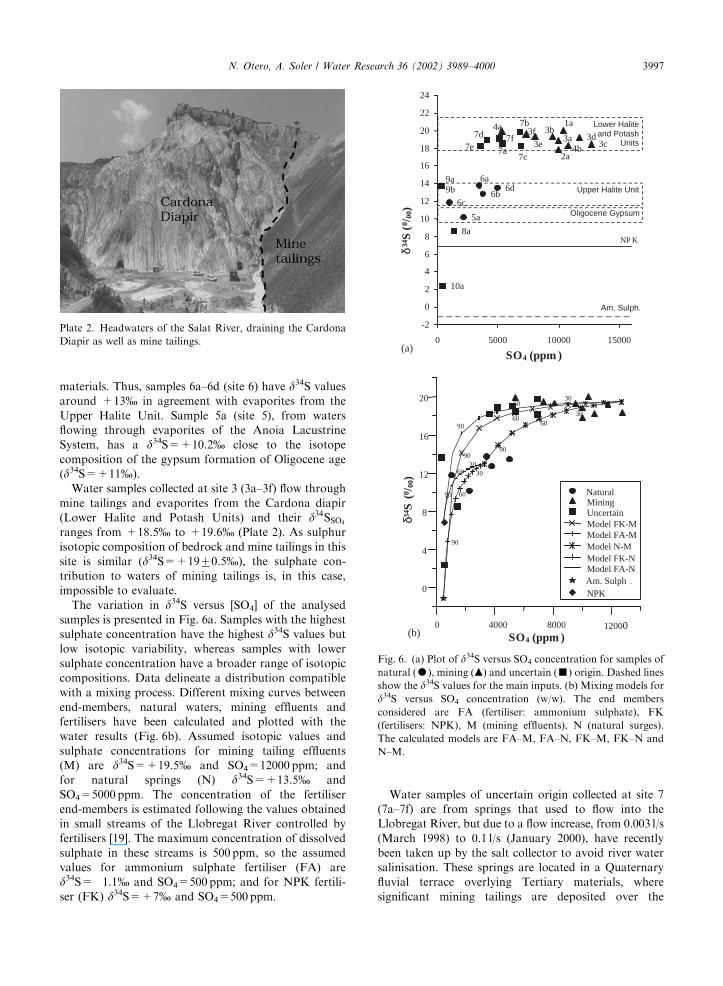
The variation in d34S versus [SO4] of the analysed
samples is presented in Fig. 6a. Samples with the highest
sulphate concentration have the highest d34S values but
low isotopic variability, whereas samples with lower
sulphate concentration have a broader range of isotopic
compositions. Data delineate a distribution compatible
with a mixing process. Different mixing curves between
end-members, natural waters, mining effluents and
fertilisers have been calculated and plotted with the
water results (Fig. 6b). Assumed isotopic values and
sulphate concentrations for mining tailing effluents
(M) are d34S=+19.5% and SO4=12000 ppm; and
for natural springs (N) d34S=+13.5% and
SO4=5000 ppm. The concentration of the fertiliser
end-members is estimated following the values obtained
in small streams of the Llobregat River controlled by
fertilisers [19]. The maximum concentration of dissolved
sulphate in these streams is 500 ppm, so the assumed
values for ammonium sulphate fertiliser (FA) are
d34S=�1.1% and SO4=500 ppm; and for NPK fertili-
ser (FK) d34S=+7% and SO4=500ppm.
Water samples of uncertain origin collected at site 7
(7a–7f) are from springs that used to flow into the
Llobregat River, but due to a flow increase, from 0.003 l/s
(March 1998) to 0.1 l/s (January 2000), have recently
been taken up by the salt collector to avoid river water
salinisation. These springs are located in a Quaternary
fluvial terrace overlying Tertiary materials, where
significant mining tailings are deposited over the
Plate 2. Headwaters of the Salat River, draining the Cardona
Diapir as well as mine tailings.
Upper Halite Unit
5a
6c
6d6b
6a
4b3d
3c
3b3a
1a4a
2a3e
3f
10a
8a
7e7d
7b
7c7a
7f
9b9a
NP K
Am. Sulph.
-2
0
2
4
6
8
10
12
14
16
18
20
22
24
0 5000 10000 15000
SO4 (ppm )
Lower Haliteand Potash
Units
Oligocene Gypsum
δ34 S
(0 /
00)
0 4000 8000 12000
0
4
8
12
16
20
90
6090
30
90
6030
90
60
30
90
6030
60
Am. Sulph .
Natural Mining Uncertain Model FK-M Model FA-M Model N-M Model FK-N
NPK
Model FA-N
SO4 (ppm )
δ34 S
(0/ 0
0)
(a)
(b)
Fig. 6. (a) Plot of d34S versus SO4 concentration for samples of
natural (K), mining (m) and uncertain (’) origin. Dashed lines
show the d34S values for the main inputs. (b) Mixing models for
d34S versus SO4 concentration (w/w). The end members
considered are FA (fertiliser: ammonium sulphate), FK
(fertilisers: NPK), M (mining effluents), N (natural surges).
The calculated models are FA–M, FA–N, FK–M, FK–N and
N–M.
N. Otero, A. Soler / Water Research 36 (2002) 3989–4000 3997
Quaternary sediments. The d34S of dissolved sulphate
for these springs has a mean value of +18.8%. This
isotopic composition is in accordance with the values of
the potash unit implying that the waters are flowing
through the mine tailings. The d34S of these samples can
be achieved by mixing 35% sulphate from mine effluents
and 65% sulphate of natural origin (Fig. 6b, model N–
M). If the model considered is a mixing between mine
effluents and fertilisers (models FA–M or FK–M), the
proportion of sulphate from mine effluents is 25%, and
75% fertilisers. These results are especially important
since, unlike conventional chemistry, the sulphur iso-
topic signature of the waters is not sensitive to high
dilution of the original brines. As this result indicates,
even when an anthropogenic source is highly diluted,
and cannot be detected by classical chemistry, its
sulphur isotopic signature may be used as a fingerprint.
Sample 8a has a sulphur isotope value of +8%.
Although the Na/K ratio points to salinity related to
the mining activity (Fig. 4c), the Na, K, Cl� and
SO4�2concentrations are compatible with a natural
source. The d34S values of the outcropping evaporites
in the area are between +12% and +14%. Therefore,
this low value (+8%) could be caused by the addition of
isotopically light sulphate from another source, such as
fertilisers which may also contribute to the high contents
of K. This d34S value can be obtained in a mixture of
75% sulphate from ammonium sulphate fertiliser and
natural sulphate (FA–N model) or in a mixture of 95%
NPK fertilisers and natural sulphate (FK–N model)
(Fig. 6b).
Although a natural origin could be assumed for
sample 10a from the major ion contents, the Na/K ratio
also points to a mining origin. According to the nearby
evaporite rocks, the expected sulphur isotope value
should be 1371%. However, the measured d34S for that
sample is +2.4%, close to the ammonium sulphate
fertiliser value which has a sulphur isotopic composition
of�1.1%. The calculated mixing models (Fig. 6b, model
FA–N) indicate that this isotopic composition can be
achieved by an input of B95% of sulphate derived from
fertilisers to the waters.
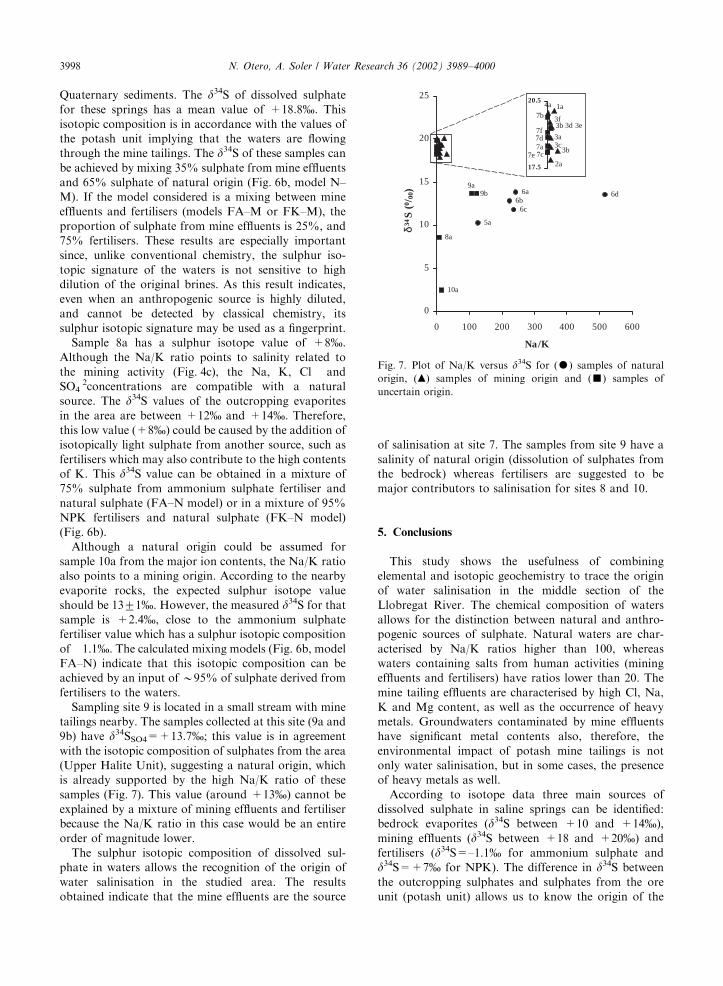
Sampling site 9 is located in a small stream with mine
tailings nearby. The samples collected at this site (9a and
9b) have d34SSO4=+13.7%; this value is in agreement
with the isotopic composition of sulphates from the area
(Upper Halite Unit), suggesting a natural origin, which
is already supported by the high Na/K ratio of these
samples (Fig. 7). This value (around +13%) cannot be
explained by a mixture of mining effluents and fertiliser
because the Na/K ratio in this case would be an entire
order of magnitude lower.
The sulphur isotopic composition of dissolved sul-
phate in waters allows the recognition of the origin of
water salinisation in the studied area. The results
obtained indicate that the mine effluents are the source
of salinisation at site 7. The samples from site 9 have a
salinity of natural origin (dissolution of sulphates from
the bedrock) whereas fertilisers are suggested to be
major contributors to salinisation for sites 8 and 10.
5. Conclusions
This study shows the usefulness of combining
elemental and isotopic geochemistry to trace the origin
of water salinisation in the middle section of the
Llobregat River. The chemical composition of waters
allows for the distinction between natural and anthro-
pogenic sources of sulphate. Natural waters are char-
acterised by Na/K ratios higher than 100, whereas
waters containing salts from human activities (mining
effluents and fertilisers) have ratios lower than 20. The
mine tailing effluents are characterised by high Cl, Na,
K and Mg content, as well as the occurrence of heavy
metals. Groundwaters contaminated by mine effluents
have significant metal contents also, therefore, the
environmental impact of potash mine tailings is not
only water salinisation, but in some cases, the presence
of heavy metals as well.
According to isotope data three main sources of
dissolved sulphate in saline springs can be identified:
bedrock evaporites (d34S between +10 and +14%),
mining effluents (d34S between +18 and +20%) and
fertilisers (d34S=–1.1% for ammonium sulphate and
d34S=+7% for NPK). The difference in d34S between
the outcropping sulphates and sulphates from the ore
unit (potash unit) allows us to know the origin of the
5a
6d
6c6b
6a
10a
8a
9b9a
0
5
10
15
20
25
0 100 200 300 400 500 600
Na/K
3d 3e3f
3c3b
2a
4a 1a
3b
3a
7b
7a7c7e
7f7d
17.5
20.5
δ34S
(0/ 0
0)
Fig. 7. Plot of Na/K versus d34S for (K) samples of natural
origin, (m) samples of mining origin and (’) samples of
uncertain origin.
N. Otero, A. Soler / Water Research 36 (2002) 3989–40003998
sulphate contamination caused by the mining effluents,
except in the Cardona Diapir where the potash unit
outcrops. Accordingly, this study has shown that the
origin of salinisation in the springs located at site 7 is
contamination from mine tailing effluents, also a natural
origin has been determined for the springs from site 9.
Fertilisers used in this area are characterised by sulphur
isotopic values of dissolved sulphate lower than the
bedrock allowing us to identify their contribution to
groundwater salinisation. Elemental and isotope geo-
chemistry point to fertilisers as the major source of
sulphate in sites 8 and 10. Coupling isotopic composi-
tion analysis together with geochemistry allowed us also
to quantify the relative contribution of these sources to
groundwater salinisation.
Since the data reveal that fertilisers play an important
role as salinity source, a more detailed sampling and
isotopic characterisation of fertilisers is proposed in a
further project. Also, the analysis of the oxygen isotopic
composition of sulphate could be used in future studies
to assess the extent of the redox processes, which have
been considered negligible in the present study.
Acknowledgements
This study has been financed by the CICYT project
HID99-0498 of Spanish Government, and partially
by the SGR99-00062 from the Catalonian Government.
We would like to thank J. Capdevila for the pluvio-
meter sampling, Ag"encia Catalana de l’Aigua (Environ-
mental Department of Catalonian Government, espe-
cially Llu!ıs God!e and Josep Bertran) for the field
assistance, and the Serveis Cient!ıfics T"ecnics (University
of Barcelona). We also wish to thank S.H. Bottrell and
an anonymous reviewer for their constructive comments
on the paper.
References
[1] Cameron EM, Hall GEM, Veizer J, Krouse HR. Isotopic
and elemental hydrogeochemistry of a major river system;
Fraser River, British Columbia, Canada. Chem Geol
1995;122(1–4):149–69.
[2] Hitchon B, Krouse HR. Hydrogeochemistry of the surface
waters of the Mackenzie River drainage basin, Canada:
stable isotopes of oxygen, carbon and sulfur. Geochim
Cosmochim Acta 1972;36:1337–57.
[3] Ingri J, Torssander P, Andersson PS, M .orth CM,
Kusakabe M. Hydrogeochemistry of sulfur isotopes in
the Kalix River catchment, northern Sweden. Appl
Geochem 1997;12(4):483–96.
[4] Longinelli A, Edmond JM. Isotope geochemistry of the
Amazon basin: a reconnaissance. J Geophys Res 1983;
88:3807–17.
[5] Williams MV, Yang D, Liu F, Turk JT, Melack JM.
Controls on the major ion chemistry of the Urumqi River,
Tian Shan, People’s Republic of China. J Hydrol 1995;
172(1–4):209–29.
[6] Yang W, Spencer RJ, Krouse HR. Stable isotope
composition of waters and sulfate species therein, Death
Valley, California, USA: implications for inflow and
sulfate sources, and arid basin climate. Earth Planet Sci
Lett 1997;147:69–82.
[7] Dowuona GN, Mermut AR, Krouse HR. Stable isotope
geochemistry of sulfate in relation to hydrogeology in
southern Saskatchewan, Canada. Appl Geochem 1993;8:
255–63.
[8] Feast NA, Hiscock KM, Dennis PF, Bottrell SH. Controls
on stable isotope profiles in the Chalk aquifer of north-east
Norfolk, UK, with special reference to dissolved sulphate.
Appl Geochem 1997;12:803–12.
[9] van-Donkelaar C, Hutcheon IE, Krouse HR. d34S, d18O,
dD in shallow groundwater: tracing anthropogenic sulfate
and accompanying groundwater/rock interactions. Water
Air Soil Pollut 1995;79:279–98.
[10] Bottrell SH, Weber N, Gunn J, Worthington SRH. The
geochemistry of sulphur in a mixed allogenic-autogenic
karst catchment, Castelton, Derbyshire, UK. Earth Surf
Process Landforms 2000;25:155–65.
[11] de Caritat P, Krouse HR, Hutcheon I. Sulphur isotope
composition of stream water, moss and humus from eight
arctic catchments in the Kola Peninsula Region (NW
Russia, N Finland, NE Norway). Water Air Soil Pollut
1997;94:191–208.
[12] Grinenko VA, Krouse HR, Fedorov YuA. Sulfur-isotope
composition as the key to determining whether the salt
mass in lake Baykal was formed by natural or man-made
processes. Geochem Int 1994;31(1):116–21.
[13] Grasby SE, Hutcheon I, Krouse HR. Application of the
stable isotope composition of SO4 to tracing anomalous
TDS in Nose Creek, southern Alberta, Canada. Appl
Geochem 1997;12:567–75.
[14] Moncaster SJ, Bottrell SH, Tellam JH, Lloyd JW,
Konhauser KO. Migration and attenuation of agro-
chemical pollutants: insights from isotopic analysis
of groundwater sulphate. J Contam Hydrol 2000;43:
147–63.
[15] Robinson BW, Bottrell SH. Discrimination of sulfur
sources in pristine and polluted New Zealand River
catchments using stable isotopes. Appl Geochem 1997;12:
305–19.
[16] Yang C, Telmer K, Veizer J. Chemical dynamics of the
‘‘St. Lawrence’’ riverine system; delta D (sub H2O), delta
(super 18) O (sub H2O), delta (super 13) C (sub DIC),
delta (super 34) S (sub sulfate), and dissolved (super 87) Sr/
(super 86) Sr. Geochim Cosmochim Acta 1996;60(5):
851–66.
[17] Mayer B, Fritz P, Prietzel J, Krouse HR. The use of stable
sulfur and oxygen isotope ratios for interpreting the
mobility of sulfate in aerobic forest soils. Appl Geochem
1995;10(2):161–73.
[18] M .orth CM, Torssander P, Kusakabe M, Hultberg H.
Sulfur isotope values in a forested catchment over four
years: evidence for oxidation and reduction processes.
Biogeochemistry 1999;44:51–71.
N. Otero, A. Soler / Water Research 36 (2002) 3989–4000 3999
[19] Soler A, Canals A, Goldstein SL, Otero N, Antich N,
Spangerberg J. Sulfur and strontium isotope composition
of Llobregat River (NE Spain): tracers of natural and
anthropogenic chemicals in stream waters. Water Air Soil
Pollut 2002;136:207–24.
[20] S!aez A. Estratigraf!ıa y sedimentolog!ıa de las formaciones
lacustres del tr!ansito Eoceno—Oligoceno de la Cuenca del
Ebro. Translated title: Stratigraphy and sedimentology of the
Upper Eocene and Oligocene lacustrine systems of the Ebro
Basin. Ph.D. Thesis, University of Barcelona, 1987. 353pp.
[21] Rossell L. Estudi petrol "ogic, sedimentol"ogic i geoqu!ımic de
la formaci !o de sals pot"assiques de Navarra (Eoc"e sup.).
Translated title: Petrology, sedimentology and geochem-
istry of the Navarra potash formation (Upper Eocene).
Ph.D. Thesis, University of Barcelona, 1983. 321pp.
[22] God!e Ll. Ag"encia Catalana de l’Aigua, Dept. de Medi
Ambient de la Generalitat de Catalunya. C/Proven-ca 204-
208, 08036, Barcelona, 2001.
[23] Vall"es F. La Salinitzaci !o del Riu Llobregat a Sallent.
Translated title: Llobregat River salinization at Sallent
village. Proceedings of the El ruman sal!ı: impacte sobre el
medi natural, urb"a i hum"a de la comarca del Bages, 1998.
p. 97–108.
[24] Mortvedt JJ. Heavy metal contaminants in inorganic and
organic fertilizers. Fert Res 1996;43:55–61.
[25] Cend !on D. Evoluci !on geoqu!ımica de cuencas evapor!ıticas
terciarias: implicaciones en la composici !on isot !opica del
sulfato disuelto en el oc!eano durante el terciario.
Translated title: Geochemical evolution of tertiary eva-
poritic basins: implications for the isotopic composition of
dissolved oceanic sulphates during Tertiary Age. Ph.D.
Thesis, Universitat de Barcelona, 1999. 270pp.
[26] Utrilla R, Pierre C, Ort!ı F, Pueyo JJ. Oxygen and sulphur
isotope compositions as indicators of the origin of
Mesozoic and Cenozoic evaporites from Spain. Chem
Geol (Isot Geosci Sect) 1992;102:229–44.
N. Otero, A. Soler / Water Research 36 (2002) 3989–40004000