Interstellar grains in meteorites: II. SiC and its noble gases

Energy Procedia 63 ( 2014 ) 4172 – 4179
Available online at www.sciencedirect.com
ScienceDirect
1876-6102 © 2014 The Authors. Published by Elsevier Ltd. This is an open access article under the CC BY-NC-ND license (http://creativecommons.org/licenses/by-nc-nd/3.0/).Peer-review under responsibility of the Organizing Committee of GHGT-12doi: 10.1016/j.egypro.2014.11.449
GHGT-12
Investigating the role of noble gases as tracers for CO2 storage
Rachel Kilgallona*, Stuart Gilfillana, Christopher McDermotta, Katriona Edlmanna, Stuart Haszeldinea
aSchool of GeoSciences, The University of Edinburgh, Grant Institute, West Mains Road, EH9 3JW, Edinburgh
Abstract
Developing a monitoring strategy which would provide an early warning of unplanned CO2 leakage from a storage site is imperative. This study uses specially constructed experimental equipment to determine the factors affecting the transport of noble gases relative to CO2 through porous media. Preliminary laboratory scale data have shown the travel time curves of helium, argon and CO2 through porous media for pressures of 10,000 – 50,000 Pa. These results are then compared to modelled data to determine whether these experimentally derived travel times for the different noble gases can be used to more accurately predict migrant CO2 from storage sites. © 2013 The Authors. Published by Elsevier Ltd. Selection and peer-review under responsibility of GHGT.
Keywords: CO2; storage; noble gases; monitoring; breakthrough curves; modelling
1. Introduction
The capture and long term storage of CO2 in the subsurface is one of the most promising ways of mitigating the current level of anthropogenic CO2 being released to the atmosphere. A major issue surrounding storage is the potential risk posed by failure of CO2 containment. Monitoring a CO2 storage site before, during and after injection is vital. Comprehensive monitoring of a storage site will minimize the risk of CO2 leakage by providing the opportunity to detect early warning signals prior to large scale CO2 leakage, allowing mitigation measures to be undertaken to prevent further CO2 migration out of the storage site [1]. Tracers which travel ahead of the injected CO2 could provide an early alert of CO2 containment failure. However, it is not yet known how the travel times of different tracers compare to that of CO2 and hence how much of a warning would be given.
* Corresponding author. Tel.: +44-131-650-5936; fax: +44-131-650-7340.
E-mail address: [email protected]
© 2014 The Authors. Published by Elsevier Ltd. This is an open access article under the CC BY-NC-ND license (http://creativecommons.org/licenses/by-nc-nd/3.0/).Peer-review under responsibility of the Organizing Committee of GHGT-12

Rachel Kilgallon et al. / Energy Procedia 63 ( 2014 ) 4172 – 4179 4173
Nomenclature
C(x,t) advective-dispersion equation for one dimensional pulse injection D diffusion coefficient Dx longitudinal apparent diffusion constant Kd solid-water distribution ratio m molecular weight of the diffusing gas mg molecular weight of feeder gas M0 mass injected ne effective porosity P atmospheric pressure q specific discharge Rf retardation factor t time T temperature v advective velocity V molecular volume of the diffusing gas Vg molecular volume of feeder gas x flow path length α dispersivity ρb bulk density of porous media
Noble gases can behave as conservative tracers and will not be affected by chemical processes. Existing field
research has shown how naturally occurring noble gas tracers in CO2 reservoirs can be used to identify the different sources of CO2 [2]. Experiments and modelling results have shown that noble gases have the potential to act as early warning tracers for CO2 arrival [3]. If the origin and transport mechanisms of natural CO2 reservoirs can be determined using noble gases, then this provides positive grounds for using them in the same manner for future anthropogenic CO2 storage sites. While work has been carried out on a large scale, there has been less focus on laboratory scale experiments, which can be used to further understand the factors and processes involved in noble gas and CO2 transport. This study uses purpose built experimental equipment to determine the factors affecting the transport of noble gases relative to CO2 in a porous sandstone media. In doing so, it aims to investigate how noble gases could be used as effective early warning tracers of CO2 migration in engineered CO2 storage sites.
2. Experimental Setup
In order to carry out transport experiments, this research uses specially constructed equipment to measure the transport time and flow behavior of noble gases compared to CO2 through porous media. A CO2 flow rig has been designed and purpose built within the School of GeoSciences at the University of Edinburgh.
2.1. Sample Characterization
A sample with relatively homogeneous mineralogy and a moderate permeability is required to represent a basic porous media. The Fell Sandstone was selected due to its high quartz content (~95%) and low carbonate content (trace amounts) implying there would be minimal mineral alteration from CO2 during the flow experiments. Samples of the Fell Sandstone were sourced from a local stone works. Table 1 shows the rock description of the Fell Sandstone which identifies it as a semipermeable rock with an average porosity of 20.3%. Some complexity arises with the selected rock for experiments as it is not a freshly cored sample sourced from point of primary

4174 Rachel Kilgallon et al. / Energy Procedia 63 ( 2014 ) 4172 – 4179
sedimentation. There is evidence of supergene processes throughout the rock, most likely from meteroic water circulation (Fig. 1).
Table 1. Sample characterization of the sandstone used in fluid flow experiments.
Rock Description
Rock Name Hazeldean Sandstone
Formation Name Fell Sandstone
Age Lower Carboniferous
Depositional Environment Fluvio-deltaic sequence
Rock Type Quartz arenite
Grain Shape and Sorting Well sorted, sub-angular to rounded
Effective Porosity 20.3%
Permeability 221.3 mD
Fig. 1. SEM images of Fell Sandstone. Image A: Kaolinite secondary overgrowths. Image B: Pitting in a microcline crystal. Supergene changes - weak dissolution of feldspar. Image C: Muscovite with intergranular kaolinite. Image D: Quartz with secondary kaolinite and silica overgrowth.
2.2. Experimental Design
A CO2 flow rig has been designed and constructed at the School of GeoSciences, University of Edinburgh (Fig. 2). The system is designed to load a sample loop with a desired gas mixture, which at a given time, can be released into a feeder stream as a pulse through the flow cell. The flow cell consists of an air dried 98cm x 3.6cm core of the Fell Sandstone surrounded by aluminum foil and treated with epoxy resin to provide airtight stable conditions. The core is encased upstream and downstream by gas dispersion plates to allow unobstructed gas flow. Real-time analysis of the arrival peaks of the gases downstream is recorded using a HPR20-QIC Quadrupole Mass Spectrometer (QMS).
2.3. Experimental Procedure
Initial travel time experiments have been completed using the equipment (Fig. 2). Experiments using the following gas mixtures have been investigated:
CO2 pulse in a nitrogen feeder system Argon pulse in a CO2 feeder system Helium pulse in a CO2 feeder system
Experiments were carried out over an operating pressure range of 10,000 – 50,000 Pa in intervals of 10,000 Pa.
Experiments at each pressure value were replicated five times to assess the reproducibility of the breakthrough curves. The resulting breakthrough curves were then plotted together for comparison.

Rachel Kilgallon et al. / Energy Procedia 63 ( 2014 ) 4172 – 4179 4175
Fig. 2. Schematic diagram of the flow cell system and the associated pipelines. Gas exiting downstream of the flow cell is detected by HPR-20 QMS for real-time analysis.
3. Modelling Setup
For the three gas flow scenarios presented in this paper, corresponding modelling conditions were developed to determine whether the expected results could be analytically replicated. The transport of gases in porous media can be modelled using the advective-dispersion equation for one dimensional flow [4]. This is represented by the analytical equation:
(1) The advective velocity was determined with the experimentally derived results for permeability and porosity
(Table 1) and used in Darcy’s Law for incompressible flow through the feeder system such that:
(2)
Diffusion was calculated using the analytical formula [5]:
tDvtx
tDMtxC
xx 4exp
2,
20
enqv
4176 Rachel Kilgallon et al. / Energy Procedia 63 ( 2014 ) 4172 – 4179
(3)
The process of molecular diffusion cannot be separated from mechanical dispersion. The two are combined to define the following equation [6]:
(4)
A current limitation of this modelling approach is that there are no defined inputs for any of the dispersion factors for the systems yet. In addition, sorption is likely to take place with CO2 and to some degree with the nitrogen – this would affect the CO2 pulse in a nitrogen feeder system. Sorption can be expressed as [7]:
(5)
The Kd value is typically quantified using experimental data. It is a unit of measurement that is used to describe the extent to which a specific substrate has sorbed within a system. This has not been accounted for in the current model.
4. Results
4.1. Experimental Results
Breakthrough curves are first identified from the raw data output from the HPR-20 QMS. Next, a baseline correction is required; a value not associated with the breakthrough profile is selected for this. The breakthrough profile time is set so that the moment of pulse release is equal to 0. The data values are divided by the maximum output (C/Cmax) - this is to check the accuracy and precision of the system. A regression curve has been plotted for each of the pressures to identify whether a unique curve can be used to describe each gas under the different conditions. Figure 3 shows the breakthrough curves for the three separate gas experiments. Table 2 shows the time at which the peak values were obtained. As anticipated, the arrival times of all the gases take longer as the pressure of the system is decreased.
4.1.1. Noble Gas Pulses The helium and argon pulses were passed through a CO2 feeder system. The peak arrival times of argon were
similar to that of helium; however the helium was marginally slower at each pressure. The differences in peak arrival times between the helium and argon curves increased as the pressure decreased. However, the curve profiles for the two noble gas systems differ greatly. The helium curve profiles show that it takes longer to arrive than the argon at each pressure. The argon curve profiles also show a steeper angle for initial appearance, but have a longer tail than the helium curves do.
2
31
31
5.0
75.1 11001.0
VVP
mmT
D
g
g
vDnD ex
e
dbf n
KR 1

Rachel Kilgallon et al. / Energy Procedia 63 ( 2014 ) 4172 – 4179 4177
4.1.2. CO2 Pulses The CO2 pulses were passed through a nitrogen feeder system. The CO2 pulses yield slower peak arrival times –
compared to those of the helium or argon experiments (Table 2). With decrease in pressure, the calculated regression curves become less representative of the experimentally derived CO2 breakthrough data (Fig. 3).
Fig. 3. Experimental results of flow experiments through the flow cell. Experiments were carried out over five different pressures (10,000 – 50,000 Pa). Each experiment was replicated five times. Replicated results are plotted as scatter plots. Regression lines have been plotted to represent the relationship between gas concentrations (C/Cmax) over time (s) as an average of the five experiments.
Table 2. Peak arrival times (s) for three gas mixtures for the different pressures from the experiments in Figure 3. Standard deviation is derived from the difference between the five replication values.
10,000 Pa 20,000 Pa 30,000 Pa 40,000 Pa 50,000 Pa
CO2/N2 476 ± 35.77 239 ± 19.62 149 ± 9.09 109 ± 6.58 81 ± 3.56
He/CO2 242 ± 12.49 128 ± 5.81 87 ± 6.95 63 ± 3.96 54 ± 2.86
Ar/CO2 224 ± 3.20 112 ± 6.61 76 ± 3.27 55 ± 2.19 45 ± 1.48
4178 Rachel Kilgallon et al. / Energy Procedia 63 ( 2014 ) 4172 – 4179
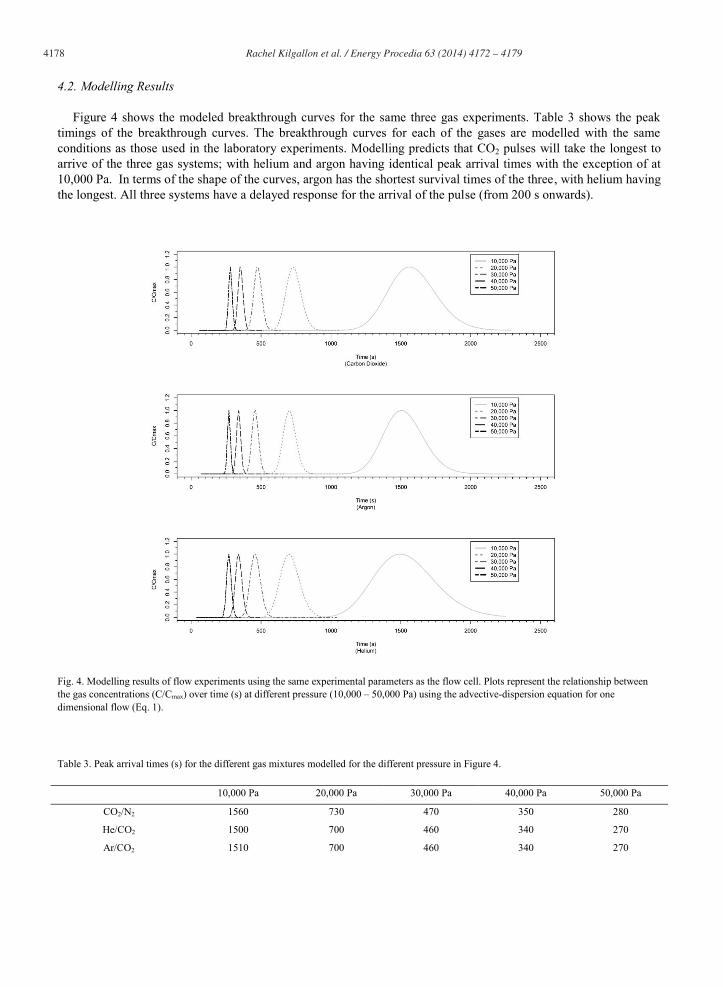
4.2. Modelling Results
Figure 4 shows the modeled breakthrough curves for the same three gas experiments. Table 3 shows the peak timings of the breakthrough curves. The breakthrough curves for each of the gases are modelled with the same conditions as those used in the laboratory experiments. Modelling predicts that CO2 pulses will take the longest to arrive of the three gas systems; with helium and argon having identical peak arrival times with the exception of at 10,000 Pa. In terms of the shape of the curves, argon has the shortest survival times of the three, with helium having the longest. All three systems have a delayed response for the arrival of the pulse (from 200 s onwards).
Fig. 4. Modelling results of flow experiments using the same experimental parameters as the flow cell. Plots represent the relationship between the gas concentrations (C/Cmax) over time (s) at different pressure (10,000 – 50,000 Pa) using the advective-dispersion equation for one dimensional flow (Eq. 1).
Table 3. Peak arrival times (s) for the different gas mixtures modelled for the different pressure in Figure 4.
10,000 Pa 20,000 Pa 30,000 Pa 40,000 Pa 50,000 Pa
CO2/N2 1560 730 470 350 280
He/CO2 1500 700 460 340 270
Ar/CO2 1510 700 460 340 270

Rachel Kilgallon et al. / Energy Procedia 63 ( 2014 ) 4172 – 4179 4179
5. Discussion
It is evident from Figure 3 and 4 that there are significant differences between the experimental and modelled results. The most obvious difference is that the modelled arrival times are an order of magnitude greater than those of the experimental data for all three gases. According to the modelling data, the helium should appear the quickest out of the three gas mixtures and the helium signature should have been retained the longest; instead it is slower to arrive than the argon values with shorter peak duration. The model system does not currently account for any dispersion taking place. It is likely that this process is greatly affecting the time it takes the gases to reach the sampling point downstream. The lighter noble gases may be susceptible to routes that a larger molecule such as CO2 would be too large to pass through. As a result the current model will tend to overestimate the transport rates of the noble gases through the porous media. Interestingly, there also appears to be evidence of sorption effects in the CO2/nitrogen system. All experiments undergo the same purging cycle prior to gas pulse injection. However, this effect only becomes apparent in the lower pressure CO2/nitrogen systems. Despite eradicating the baseline values, there is still a high level of CO2 being released prior to the breakthrough curve commences. It is possible that this sorption process is not visible in the higher pressures as the nitrogen flow is too high to allow it to occur.
6. Conclusions
Preliminary data have shown how travel times of CO2, helium and argon behave relative to each other in porous media. It is the intention of the authors to expand this research to the remainder of the noble gases (excluding radioactive radon). As shown in these results, the noble gases may be susceptible to routes that a CO2 molecule would be too large to pass through. Partitioning of the noble gases between the CO2 and other phases present will also occur – this will need to be considered. Upscaling of these results will determine how effective the different noble gases could be as early warning tracers of CO2 migration with real world storage sites.
Acknowledgements
This research is financially supported by the Scottish Power Academic Alliance and the Scottish Energy Technology Partnership. The authors also wish to acknowledge the EC FP7 research project PANACEA and Core Laboratories, Aberdeen.
References
[1] Haszeldine, R.S., Carbon capture and storage: how green can black be? Science, 2009, 325(5948): p. 1647-52. [2] Gilfillan, S.M.V., Ballentine, C.J., Holland, G., Blagburn, D., Lollar, B.S., Stevens, S., Schoell, M., The noble gas geochemistry of natural
CO2 gas reservoirs from the Colorado Plateau and Rocky Mountain provinces, USA. Geochimica et Cosmochimica Acta, 2008, 72(4): p. 1174-1198.
[3] Cohen, G., Loisy, C., Laveuf, C., Le Roux, O., Delaplace, P., Magnier, C., Rouchon, V., Garcia, B., Cerepi, A., The CO2-Vadose project: Experimental study and modelling of CO2 induced leakage and tracers associated in the carbonate vadose zone. International Journal of Greenhouse Gas Control, 2013, 14: p. 128-140.
[4] Kinzelbach, W., Numerische Methoden zur Modellierung des Transports von Schadstoffen im Grundwasser. München: Oldenbourg Verlag; 1992.
[5] Lyman, W.J., Handbook of Chemical Property Estimation Methods. American Chemical Society; 1982. [6] Fetter, C.W., Contaminant Hydrogeology. 2nd ed. Long Grove: Waveland Press Inc.; 2008. [7] Kosakowski, G., McDermott, C., Modelling matrix diffusion - Results of a bench mark study. Journal of Environmental Science and
Sustainable Society, 2008, 2: p. 57-62.
Copyright © 2022 FDOKUMEN