2008 Barnes & Noble Annual Report
50
-
Upload
khangminh22 -
Category
Documents
-
view
0 -
download
0
Transcript of 2008 Barnes & Noble Annual Report

69552 Cover.indd 169552 Cover.indd 1 4/4/09 12:31 PM4/4/09 12:31 PM

CONTENTS
2 Barnes & Noble 2008 Letter to Shareholders
4 Selected Consolidated Financial Data
7 Management’s Discussion and Analysis of Financial Condition and Results of Operations
19 Consolidated Statements of Operations
20 Consolidated Balance Sheets
21 Consolidated Statements of Changes in Shareholders’ Equity
22 Consolidated Statements of Cash Flows
23 Notes to Consolidated Financial Statements
42 Report of Independent Registered Public Accounting Firm
44 Reports of Management
45 Shareholder Information
47 Barnes & Noble Bestsellers 2008
48 2008 Award Winners
2008 Annual Report 1
69552 Text.indd 169552 Text.indd 1 4/8/09 10:12 AM4/8/09 10:12 AM

BARNES & NOBLE 2008 LETTER TO SHAREHOLDERS
Dear Shareholder:
2008 was a year of unprecedented economic upheaval, which caused almost
all business sectors to suff er, especially retail. The bookselling industry was
aff ected as well, posting declines at levels never before experienced. As is
now widely known, the retail recession actually began in the fourth quarter of
2007, which, while lowering the bar in 2008, only made the ensuing declines
more problematic.
Fortunately, for Barnes & Noble, we did read the tea leaves early in the year,
and did begin to take measures well before the crisis became national news.
Accordingly, we reduced inventory levels, overhead and operating expenses,
and eff ectively ceased negotiations for new stores. Later in the year, when
the recession began taking a tighter grip on the economy, we made minor
adjustments to our already scaled back forecasts. As a result, we came out of one
of the nation’s deepest economic downturns in a very solid position, achieving
$150 million in operating cash fl ow, and maintaining our $52 million dividend
to shareholders. At year end, we had no debt on our balance sheet and $282
million cash on hand.
Even as our comparable sales declined 5.4 percent for the year, our management
team again executed our business plan fl awlessly, managing store payroll
and store expenses in line with diminished sales, while providing world
class customer service. As well, continued improvement of our supply chain
system enabled us to reduce inventories while maintaining the same levels of
in stock positions we have always achieved. Inventory turns increased during
the slowdown, and markdowns actually decreased compared to last year. The
healthier gross margin that resulted enabled us to post after tax earnings of
$76 million, which we viewed as a victory under the conditions with which we
were confronted.
2008 also vindicated our long range real estate strategy: fi rst, to exit the
declining small store business in the malls; second, to sign shorter leases
than those of our competitors; and third, to seek to relocate stores at the
end of their terms to accommodate the ever-changing landscape of retail
development. The success of this strategy is evident in the fact that our
long-range lease obligations are declining as a percentage of sales, and
that our sales per square foot lead the industry.
2 Barnes & Noble, Inc.
69552 Text.indd 269552 Text.indd 2 4/8/09 10:12 AM4/8/09 10:12 AM

Despite the bleak year, we did have a couple of bright spots on the horizon,
notably the increase in children’s department sales, the increase in our
membership card enrollments, and the solid results from Barnes & Noble.com,
which were virtually fl at to last year. To the extent that increased children’s
book sales are a harbinger for the future of our business, we feel confi dent
our better years lie ahead.
Although some economic forecasters, most notably those in government,
would like us to believe that the recession will end before year end, we believe
it is risky to rely on those assumptions. Therefore, we have little choice but
to manage our business with a wary eye on the near term, yet with a sense of
optimism for the longer range future. If nothing else, these tougher times
have caused us to become a better company; more focused than ever before,
more effi cient in every way, and most importantly, more creative.
Like all Americans, the 37,000 booksellers who are the backbone of
Barnes & Noble are doing all of the big and little things to make business
better. Even during the worst of times business activity continues, and the
miracle of our economic engine remains the envy of the world.
For me, nothing has changed the simple pleasure of curling up on my favorite
sofa and reading a good book.
Sincerely,
Chairman
2008 Annual Report 3
69552 Text.indd 369552 Text.indd 3 4/9/09 6:28 PM4/9/09 6:28 PM

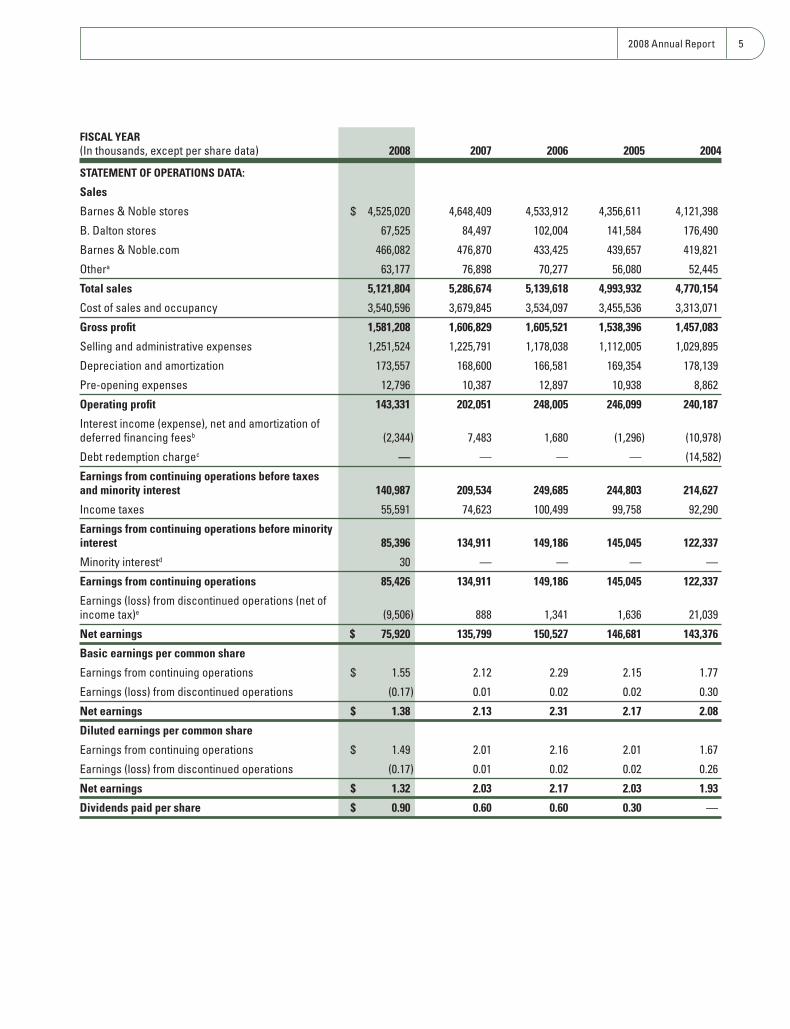
SELECTED CONSOLIDATED FINANCIAL DATA
The selected consolidated fi nancial data of Barnes & Noble, Inc. and its subsidiaries (collectively, the Company) set
forth on the following pages should be read in conjunction with the consolidated fi nancial statements and notes
included elsewhere in this report. The Company’s fi scal year is comprised of 52 or 53 weeks, ending on the Saturday
closest to the last day of January. The Statement of Operations Data for the 52 weeks ended January 31, 2009 (fi scal
2008), 52 weeks ended February 2, 2008 (fi scal 2007), and 53 weeks ended February 3, 2007 (fi scal 2006) and the
Balance Sheet Data as of January 31, 2009 and February 2, 2008 are derived from, and are qualifi ed by reference to,
audited consolidated fi nancial statements which are included elsewhere in this report. The Statement of Operations
Data for the 52 weeks ended January 28, 2006 (fi scal 2005) and 52 weeks ended January 29, 2005 (fi scal 2004) and the
Balance Sheet Data as of February 3, 2007, January 28, 2006 and January 29, 2005 are derived from audited consoli-
dated fi nancial statements not included in this report.
The Company has restated its previously reported consolidated fi nancial statements for fi scal 2007, 2006, 2005
and 2004 to refl ect the results of Calendar Club as a discontinued operation as discussed in Note 2 to the Notes to
Consolidated Financial Statements.
4 Barnes & Noble, Inc.
69552 Text.indd 469552 Text.indd 4 4/8/09 10:12 AM4/8/09 10:12 AM
FISCAL YEAR
(In thousands, except per share data) 2008 2007 2006 2005 2004
STATEMENT OF OPERATIONS DATA:
Sales
Barnes & Noble stores $ 4,525,020 4,648,409 4,533,912 4,356,611 4,121,398
B. Dalton stores 67,525 84,497 102,004 141,584 176,490
Barnes & Noble.com 466,082 476,870 433,425 439,657 419,821
Othera 63,177 76,898 70,277 56,080 52,445
Total sales 5,121,804 5,286,674 5,139,618 4,993,932 4,770,154
Cost of sales and occupancy 3,540,596 3,679,845 3,534,097 3,455,536 3,313,071
Gross profi t 1,581,208 1,606,829 1,605,521 1,538,396 1,457,083
Selling and administrative expenses 1,251,524 1,225,791 1,178,038 1,112,005 1,029,895
Depreciation and amortization 173,557 168,600 166,581 169,354 178,139
Pre-opening expenses 12,796 10,387 12,897 10,938 8,862
Operating profi t 143,331 202,051 248,005 246,099 240,187
Interest income (expense), net and amortization of deferred fi nancing feesb (2,344) 7,483 1,680 (1,296) (10,978)
Debt redemption chargec — — — — (14,582)
Earnings from continuing operations before taxes and minority interest 140,987 209,534 249,685 244,803 214,627
Income taxes 55,591 74,623 100,499 99,758 92,290
Earnings from continuing operations before minority interest 85,396 134,911 149,186 145,045 122,337
Minority interestd 30 — — — —
Earnings from continuing operations 85,426 134,911 149,186 145,045 122,337
Earnings (loss) from discontinued operations (net of income tax)e (9,506) 888 1,341 1,636 21,039
Net earnings $ 75,920 135,799 150,527 146,681 143,376
Basic earnings per common share
Earnings from continuing operations $ 1.55 2.12 2.29 2.15 1.77
Earnings (loss) from discontinued operations (0.17) 0.01 0.02 0.02 0.30
Net earnings $ 1.38 2.13 2.31 2.17 2.08
Diluted earnings per common share
Earnings from continuing operations $ 1.49 2.01 2.16 2.01 1.67
Earnings (loss) from discontinued operations (0.17) 0.01 0.02 0.02 0.26
Net earnings $ 1.32 2.03 2.17 2.03 1.93
Dividends paid per share $ 0.90 0.60 0.60 0.30 —
2008 Annual Report 5
69552 Text.indd 569552 Text.indd 5 4/8/09 10:12 AM4/8/09 10:12 AM

FISCAL YEAR
(In thousands, except per share data) 2008 2007 2006 2005 2004
Weighted average common shares outstanding
Basic 55,207 63,662 65,212 67,560 69,018
Diluted 57,327 67,050 69,226 72,150 75,696
OTHER OPERATING DATA
Number of stores
Barnes & Noble stores 726 713 695 681 666
B. Dalton stores 52 85 98 118 154
Total 778 798 793 799 820
Comparable store sales increase (decrease)
Barnes & Noble storesf (5.4)% 1.8% (0.3)% 2.9% 3.1%
Barnes & Noble.comg (1.3)% 13.4% (1.1)% 5.0% (1.3)%
Capital expendituresh $ 192,153 193,958 176,040 182,698 179,299
BALANCE SHEET DATA
Total assets $ 2,993,888 3,249,826 3,196,798 3,156,250 3,318,389
Long-term debt $ — — — — 245,000
a Includes primarily third-party sales of Sterling Publishing Co., Inc., a wholly-owned subsidiary of the Company.
b Amounts for fi scal 2008, 2007, 2006, 2005 and 2004 are net of interest income of $1,518, $9,169, $5,292, $6,615 and $3,133, respectively.
c One-time charge associated with the redemption of the Company’s convertible subordinated notes in fi scal 2004.
d Minority interest represents the 50% outside interest in Begin Smart LLC.
e Includes results from Calendar Club for all periods presented and GameStop, Corp.’s operations in fi scal 2004 prior to the spin-off of GameStop.
f Comparable store sales increase (decrease) is calculated on a 52-week basis, and includes sales from stores that have been open for at least 15 months and does not include closed or relocated stores.
g Comparable online sales increase (decrease) is calculated by adjusting the prior year results to conform with the fi scal 2008 presentation.
h Excludes Calendar Club capital expenditures of $1,988, $2,551, $3,333, $4,469 and $5,586 for fi scal 2008, 2007, 2006, 2005 and 2004, respectively.
6 Barnes & Noble, Inc. SELECTED CONSOLIDATED FINANCIAL DATA continued
69552 Text.indd 669552 Text.indd 6 4/8/09 10:12 AM4/8/09 10:12 AM

Barnes & Noble, Inc.’s (Barnes & Noble or the Company)
fi scal year is comprised of 52 or 53 weeks, ending on the
Saturday closest to the last day of January. As used in this
section, “fi scal 2009” represents the 52 weeks ending
January 30, 2010, “fi scal 2008” represents the 52 weeks
ended January 31, 2009, “fi scal 2007” represents the 52
weeks ended February 2, 2008 and “fi scal 2006” repre-
sents the 53 weeks ended February 3, 2007.
GENERAL
The Company is the nation’s largest bookseller1, and
as of January 31, 2009 operated 778 bookstores and a
website. Of the 778 bookstores, 726 operate primarily
under the Barnes & Noble Booksellers trade name (35
of which were opened in fi scal 2008) and 52 operate
primarily under the B. Dalton Bookseller trade name.
Barnes & Noble conducts the online part of its busi-
ness through barnesandnoble.com llc (Barnes & Noble.
com), one of the largest sellers of books on the Internet.
Through Sterling Publishing Co., Inc. (Sterling or
Sterling Publishing), the Company is a leading general
trade book publisher. Additionally, as of January 31,
2009, the Company owned an approximate 74% interest
in Calendar Club, an operator of seasonal kiosks. The
Company subsequently sold its interest in Calendar
Club in February 2009. The results of Calendar Club have
been classifi ed as discontinued operations in all periods
presented. The Company employed approximately 37,000
full- and part-time employees as of January 31, 2009.
Barnes & Noble stores are located in all 50 states and
the District of Columbia as of January 31, 2009. With
over 40 years of bookselling experience, management
has a strong sense of customers’ changing needs and the
Company leads book retailing with a “community store”
concept. Barnes & Noble’s typical store off ers a compre-
hensive title base, a café, a children’s section, a music/
DVD department, a magazine section and a calendar
of ongoing events, including author appearances and
children’s activities that make each Barnes & Noble store
an active part of its community.
Barnes & Noble stores range in size from 10,000 to
60,000 square feet depending upon market size with
1Based upon sales reported in trade publications and public fi lings.
an overall average store size of 26,000 square feet.
Each store features an authoritative selection of books,
ranging from 60,000 to 200,000 unique titles. The
comprehensive title selection is diverse and tailored to
each store location to refl ect local interests. In addition,
Barnes & Noble emphasizes books published by small
and independent publishers and university presses.
Bestsellers (the “top ten” highest selling hardcover
fi ction and hardcover non-fi ction titles) typically
represent between 3% and 5% of Barnes & Noble sales.
Complementing this extensive in-store selection, all
Barnes & Noble stores provide customers with on-site
access to the millions of books available to online shop-
pers while off ering an option to have the book sent to the
store or shipped directly to the customer through Barnes
& Noble.com’s delivery system. All Barnes & Noble
stores are equipped with the Company’s proprietary
BookMaster in-store operating system, which enhances
the Company’s merchandise-replenishment system,
resulting in high in-stock positions and productivity at
the store level through effi ciencies in receiving, cashier-
ing and returns processing. The Company is in the
process of integrating the BookMaster system used in
each store with Barnes & Noble.com so that its custom-
ers share the same experience across both channels.
During fi scal 2008, the Company added 0.5 million
square feet to the Barnes & Noble store base, bringing
the total square footage to 18.7 million square feet, a
3% increase over the prior year. Barnes & Noble stores
contributed approximately 88.3% of the Company’s
total sales in fi scal 2008. The Company plans to open
approximately 15 Barnes & Noble stores in fi scal 2009,
which are expected to average 34,000 square feet in size.
At the end of fi scal 2008, the Company operated 52
B. Dalton bookstores in 24 states and the District of
Columbia. B. Dalton bookstores employ merchandising
strategies that target the mainstream consumer book
market, off ering a wide range of bestsellers and general-
interest titles. Most B. Dalton bookstores range in
size from 2,000 to 6,000 square feet, and while they
are appropriate to the size of adjacent mall tenants,
the opening of book superstores in nearby locations
continues to have a signifi cant adverse impact on B.
Dalton bookstores.
MANAGEMENT’S DISCUSSION AND ANALYSIS OF FINANCIAL CONDITION AND RESULTS OF OPERATIONS
2008 Annual Report 7
69552 Text.indd 769552 Text.indd 7 4/8/09 10:12 AM4/8/09 10:12 AM

The Company is continuing its controlled descent in
the number of its smaller format B. Dalton bookstores
in response to declining sales attributable primarily to
book superstore competition. Part of the Company’s
strategy has been to close underperforming stores,
which has resulted in the closing of 915 B. Dalton book-
stores since 1989.
The Company has a multi-channel marketing strategy
that deploys various merchandising programs and
promotional activities to drive traffi c to both its stores
and website. At the center of this program is Barnes &
Noble.com, which receives over 365 million visits annu-
ally, ranking it among the top 15 multi-channel retailer
websites in terms of traffi c, as measured by Comscore
Media Metrix. As a result of this reach, the Company
believes that its website provides signifi cant advertising
power which would be valued in the tens of millions of
dollars if such advertising were placed with third-party
websites with comparable reach. In this way, Barnes
& Noble.com serves as both the Company’s direct-to-
home delivery service and as an important broadcast
channel and advertising medium for the Barnes & Noble
brand. For example, the online store locator at Barnes &
Noble.com receives millions of customer visits each year
providing store hours, directions, information about
author events and other in-store activities. Additionally,
customers can view store availability for book, music
and video products through the website and reserve the
available items for pick-up at the store. The Company
fi rmly believes that its website is a key factor behind its
industry-leading comparable store sales performance.
The Company’s subsidiary Sterling Publishing is one
of the leading publishers of non-fi ction trade titles,
with more than 5,000 books in print. Founded in 1949,
Sterling publishes a wide range of non-fi ction and
illustrated books, consisting primarily of subjects such
as crafts, food and wine, mind / body / spirit, photog-
raphy, puzzles and games, current aff airs and children’s
books. Sterling also publishes books for a number of
brands, including many of the Hearst magazines such
as Good Housekeeping and Cosmopolitan, Hasbro, The
American Museum of Natural History and AARP.
RESULTS OF OPERATIONS
FISCAL YEAR 2008 2007 2006
Sales (in thousands) $ 5,121,804 5,286,674 5,139,618Earnings From Continuing Operations (in thousands) $ 85,426 134,911 149,186Diluted Earnings Per Common Share From Continuing Operations $ 1.49 2.01 2.16Comparable Store Sales Increase (Decrease)
Barnes & Noble storesa (5.4)% 1.8% (0.3)%Barnes & Noble.comb (1.3)% 13.4% (1.1)%STORES OPENED
Barnes & Noble stores 35 31 32B. Dalton stores — — —Total 35 31 32
STORES CLOSED
Barnes & Noble stores 22 13 18B. Dalton stores 33 13 20Total 55 26 38NUMBER OF STORES OPEN AT YEAR END
Barnes & Noble stores 726 713 695B. Dalton stores 52 85 98Total 778 798 793
SQUARE FEET OF SELLING SPACE AT YEAR END (in millions)Barnes & Noble stores 18.7 18.2 17.5B. Dalton stores 0.2 0.3 0.4Total 18.9 18.5 17.9
a Comparable store sales increase (decrease) is calculated on a 52-week basis, and includes sales of stores that have been open at least 15 months and does not include closed or relocated stores.
b Comparable online sales increase (decrease) is calculated by adjusting the prior year results to conform with the fi scal 2008 presentation.
8 Barnes & Noble, Inc. MANAGEMENT’S DISCUSSION AND ANALYSIS OF FINANCIAL CONDITION AND RESULTS OF OPERATIONS continued
69552 Text.indd 869552 Text.indd 8 4/8/09 10:12 AM4/8/09 10:12 AM

Discontinued Operations
During the fourth quarter of fi scal 2008, the Company
committed to a plan to dispose of its approximate 74%
interest in Calendar Club. The Company subsequently
sold its interest in Calendar Club in February 2009 to
Calendar Club and its chief executive offi cer for $7.0
million, which was comprised of $1.0 million in cash
and $6.0 million in notes. Calendar Club qualifi ed
for held for sale accounting treatment in fi scal 2008
and was written down to its fair value. The Company
recorded an after tax charge of $9.7 million related to the
write down in fi scal 2008. The results of Calendar Club
have been classifi ed as discontinued operations in all
periods presented.
Tax Settlement
During the fi rst quarter of fi scal 2008, the Company
recorded a charge of $8.3 million in connection with
a settlement regarding the collection of sales and use
taxes on sales made by Barnes & Noble.com from
1999 to 2005. See Note 16, Legal Proceedings under
“Barnesandnoble.com LLC v. Yee, et al.” to the consolidated
fi nancial statements for additional information regarding
this settlement.
Stock Option Review
In July 2006, the Company created a Special Committee
of the Board of Directors, consisting of Patricia Higgins,
to review all of the stock option grants by the Company
and the Company’s wholly-owned subsidiary, Barnes
& Noble.com, during the period from 1996 through
2006 and engaged independent outside counsel and an
independent forensic auditor to assist in this matter. On
April 2, 2007, the Special Committee presented its fi nd-
ings and recommendations to the Company’s Board of
Directors, as reported in the Company’s Form 8-K fi led
April 4, 2007. The Special Committee indicated that the
Committee and its advisors received the Company’s full
cooperation throughout its investigation.
Among other fi ndings, the Special Committee deter-
mined that there were numerous instances of stock
option grants for which there was an improper mea-
surement of compensation expense under Accounting
Principles Board Opinion No. 25, Accounting for Stock
Issued to Employees (APB 25). Although the Special
Committee determined that there were instances of
stock options having been dated using favorable dates
that were selected with the benefi t of hindsight and that
serious mistakes were made, the Special Committee did
not fi nd any intent to defraud or fraudulent misconduct
by any individual or group of individuals. The Special
Committee found that the Company’s dating and pricing
practice for stock options was applied uniformly by
Company personnel to stock options granted and was
not used selectively to benefi t any one group or indi-
vidual within the Company. The Company evaluated
these fi ndings and agreed with the Special Committee.
The Company concluded that the charges were not mate-
The following table sets forth, for the periods indicated, the percentage relationship that certain items bear to total
sales of the Company:
FISCAL YEAR 2008 2007 2006
Sales 100.0% 100.0% 100.0%
Cost of sales and occupancy 69.1 69.6 68.8
Gross margin 30.9 30.4 31.2
Selling and administrative expenses 24.4 23.2 22.9
Depreciation and amortization 3.4 3.2 3.2
Pre-opening expenses 0.2 0.2 0.3
Operating margin 2.8 3.8 4.8
Interest income, net and amortization of deferred fi nancing fees — 0.1 —
Earnings before income taxes and minority interest 2.8 4.0 4.9
Income taxes 1.1 1.4 2.0
Earnings before minority interest 1.7 2.6 2.9
Minority interest — — —
Earnings from continuing operations 1.7% 2.6% 2.9%
2008 Annual Report 9
69552 Text.indd 969552 Text.indd 9 4/8/09 10:12 AM4/8/09 10:12 AM
rial to the fi nancial statements in any of the periods to
which such charges relate and therefore did not restate
its historic fi nancial statements. The Company recorded
an adjustment of $0.4 million ($0.2 million after tax) to
increase non-cash compensation expense in the fourth
quarter of fi scal 2006 to correctly present compensa-
tion expense for fi scal 2006. In accordance with Staff
Accounting Bulletin (SAB) No. 108, Considering the
Eff ects of Prior Year Misstatements when Quantifying
Misstatements in Current Year Financial Statements, the
Company also recorded an adjustment to decrease
retained earnings by $22.8 million, increase deferred
taxes by $5.9 million and increase additional paid-in
capital by $28.7 million, to correct the consolidated
balance sheet for the cumulative impact of the misstated
compensation cost in periods prior to fi scal 2006.
In December 2006, the Board members and all Section
16 offi cers holding options unvested as of December
31, 2004 voluntarily agreed to reprice such options,
upon a fi nding by the Special Committee that such
options were improperly priced, to an exercise price
determined to be the appropriate fair market value by
the Special Committee. The Special Committee recom-
mended that all incorrectly dated and unexercised stock
options issued to Section 16 offi cers and directors of
the Company, other than hiring grants, be re-priced to
refl ect the greater of the original grant price or the price
appropriate to the measurement date as determined by
the Special Committee. The Board members and Section
16 offi cers did not receive any cash payments to com-
pensate them for their voluntary agreements to reprice
such options. The total diff erence in exercise price as a
result of the re-pricing of these unexercised options was
approximately $2.6 million.
Consistent with the Special Committee’s recommenda-
tion that all incorrectly dated and unexercised options
issued to Section 16 offi cers be re-priced, the Section 16
offi cers voluntarily agreed to repay to the Company for
options granted and exercised while they were Section 16
offi cers an amount equal to the diff erence in the price at
which the stock options were exercised and the price at
which the Special Committee believes the stock options
should have been priced, net of any allocable portion
of income taxes paid in connection with such exercise.
The total amount voluntarily repaid to the Company by
Section 16 offi cers was approximately $2.0 million, prior
to any allocable portion of income taxes paid in con-
nection with such exercise, which was recorded as an
increase to additional paid-in capital in fi scal 2007.
Incorrectly dated options that vested after December 31,
2004 and were exercised in 2006 were subject to penalty
taxes under Section 409A of the Internal Revenue
Code. The Company reimbursed Section 16 offi cers
who voluntarily repaid the Company and were subject
to these penalty taxes. The Board approved payment to
such executives who were subject to Section 409A taxes
in connection with exercised options in an amount equal
to the cost of the Section 409A penalty tax, any interest
or penalties, plus an amount to off set the associated
income tax consequences of the reimbursement pay-
ments. In reaching this decision, the Board took into
consideration, among other factors, the fact that the
applicable taxes under Section 409A far exceeded the
amount of any possible enrichment to such offi cers as
a result of improper grant dating and the agreement by
such offi cers to repay the amount of any enrichment as
a result of the improper dating. The aggregate payments
to such offi cers, including the gross-up amounts, were
$1.2 million.
Additionally, the Company made payments on behalf of
option holders who were not Section 16 offi cers, for any
Section 409A tax liability due to the exercise of incor-
rectly dated options in 2006. These payments, including
gross-up payments, were $1.2 million.
The Company implemented a program for employees
who were not Section 16 offi cers to amend incorrectly
dated options that vested after December 31, 2004 so
as to increase the exercise price to the trading price
on the correct measurement date determined by the
Special Committee. In addition, the Company paid such
employees whose options were repriced cash bonuses in
the amount of the diff erence. The aggregate amount paid
by the Company as cash bonuses under this program was
$1.4 million, which was paid in January 2008 to comply
with applicable tax laws.
52 WEEKS ENDED JANUARY 31 , 2009 COMPARED WITH 52 WEEKS ENDED FEBRUARY 2 , 2008
Sales
The Company’s sales decreased $164.9 million, or 3.1%,
during fi scal 2008 to $5,121.8 million from $5,286.7
million during fi scal 2007. This decrease was primar-
ily attributable to a $123.4 million decrease in sales at
Barnes & Noble stores, a $17.0 million decrease in sales
10 Barnes & Noble, Inc. MANAGEMENT’S DISCUSSION AND ANALYSIS OF FINANCIAL CONDITION AND RESULTS OF OPERATIONS continued
69552 Text.indd 1069552 Text.indd 10 4/8/09 10:12 AM4/8/09 10:12 AM

at B. Dalton stores and a $10.8 million decrease in sales
at Barnes & Noble.com.
Barnes & Noble store sales decreased $123.4 million,
or 2.7%, during fi scal 2008 to $4,525.0 million from
$4,648.4 million during fi scal 2007 and accounted for
88.3% of total Company sales. The 2.7% decrease in
Barnes & Noble store sales was primarily attributable
to a 5.4% decrease in comparable store sales or $237.7
million, closed stores that decreased sales by $101.3
million, off set by new Barnes & Noble store sales of
$208.5 million.
B. Dalton sales decreased $17.0 million, or 20.1%,
during fi scal 2008 to $67.5 million from $84.5 million
during fi scal 2007. This decrease was primarily attribut-
able to the closing of 33 B. Dalton stores.
Barnes & Noble.com sales decreased $10.8 million, or
2.3%, during fi scal 2008 to $466.1 million from $476.9
million during fi scal 2007. This decrease was primarily
attributable to a 1.3% decrease in comparable sales or
$6.1 million.
In fi scal 2008, the Company opened 35 Barnes & Noble
stores and closed 22, bringing its total number of Barnes
& Noble stores to 726 with 18.7 million square feet. The
Company closed 33 B. Dalton stores, ending the period
with 52 B. Dalton stores and 0.2 million square feet. As
of January 31, 2009, the Company operated 778 stores in
the fi fty states and the District of Columbia.
Cost of Sales and Occupancy
The Company’s cost of sales and occupancy includes
costs such as merchandise costs, distribution center
costs (including payroll, freight, supplies, depreciation
and other operating expenses), rental expense, common
area maintenance and real estate taxes, partially off set
by landlord tenant allowances amortized over the life of
the lease.
Cost of sales and occupancy decreased $139.2 million, or
3.8%, to $3,540.6 million in fi scal 2008 from $3,679.8
million in fi scal 2007. As a percentage of sales, cost of
sales and occupancy decreased to 69.1% in fi scal 2008
from 69.6% in fi scal 2007. This decrease was primar-
ily attributable to reduced promotional markdowns,
better product mix and increased volume through the
Company’s distribution centers, which more than off set
the deleveraging of fi xed occupancy costs on the negative
comparable store sales.
Selling and Administrative Expenses
Selling and administrative expenses increased $25.7
million, or 2.1%, to $1,251.5 million in fi scal 2008
from $1,225.8 million in fi scal 2007. As a percentage
of sales, selling and administrative expenses increased
to 24.4% in fi scal 2008 from 23.2% in fi scal 2007.
Included in selling and administrative expenses in
fi scal 2008 were an $11.7 million impairment charge
for property and equipment, an $8.3 million charge for
the settlement with the State of California regarding
the collection of sales and use taxes on sales made by
Barnes & Noble.com from 1999 to 2005, $4.1 million of
severance related to the elimination of certain corpo-
rate offi ce expenses and a $3.0 million charge related
to a management resignation. Included in selling and
administrative expenses in fi scal 2007 were legal costs
of $11.1 million, and an impairment charge of $5.9 mil-
lion, off set by a $6.4 million gain in insurance proceeds
from the Hurricane Katrina settlement. Excluding these
charges, selling and administrative expenses increased
in fi scal 2008 as a percentage of sales to 23.9% from
23.0% in fi scal 2007. This increase was primarily due
to the deleveraging of fi xed expenses with the negative
comparable store sales.
Depreciation and Amortization
Depreciation and amortization increased $5.0 million,
or 2.9%, to $173.6 million in fi scal 2008 from $168.6
million in fi scal 2007. The increase was primarily due to
the depreciation on additional capital expenditures for
existing store maintenance, technology investments and
new store openings, off set by $2.6 million of acceler-
ated depreciation in fi scal 2007 related to an Internet
distribution center closing.
Pre-Opening Expenses
Pre-opening expenses increased $2.4 million, or 23.2%,
in fi scal 2008 to $12.8 million from $10.4 million in
fi scal 2007. This was primarily the result of the timing of
new store openings.
Operating Profi t
The Company’s consolidated operating profi t decreased
$58.7 million, or 29.1%, to $143.3 million in fi scal
2008 from $202.0 million in fi scal 2007. This decrease
in operating profi t was primarily due to the negative
comparable store sales, as well as the matters discussed
above.
2008 Annual Report 11
69552 Text.indd 1169552 Text.indd 11 4/8/09 10:12 AM4/8/09 10:12 AM

Interest Income (Expense), Net and Amortization of
Deferred Financing Fees
Interest income (expense), net and amortization of
deferred fi nancing fees, decreased $9.8 million, or
131.3%, to ($2.3) million in fi scal 2008 from $7.5
million in fi scal 2007. The decrease was primarily due
to the utilization of cash to buy back shares under the
Company’s repurchase program during the fi rst quarter
of fi scal 2008, as well as the decline in operating profi t
discussed above.
Income Taxes
Income taxes were $55.6 million in fi scal 2008 com-
pared with $74.6 million in fi scal 2007. The Company’s
eff ective tax rate was 39.43% and 35.61% during fi scal
2008 and 2007, respectively. The provision for income
taxes for fi scal 2007 included a tax benefi t of $10.3 mil-
lion resulting from previously unrecognized tax benefi ts
for which the statute of limitations expired in fi scal 2007.
Earnings (Loss) from Discontinued Operations
During the fourth quarter of fi scal 2008, the Company
committed to a plan to dispose of its approximate 74%
interest in Calendar Club. The Company subsequently
sold its interest in Calendar Club in February 2009 to
Calendar Club and its chief executive offi cer for $7.0
million, which was comprised of $1.0 million in cash
and $6.0 million in notes. Calendar Club qualifi ed
for held for sale accounting treatment in fi scal 2008
and was written down to its fair value. The Company
recorded an after tax charge of $9.7 million related to the
write down in fi scal 2008. The results of Calendar Club
have been classifi ed as discontinued operations in all
periods presented.
Net Earnings
As a result of the factors discussed above, the Company
reported consolidated net earnings of $75.9 million (or
$1.32 per diluted share) during fi scal 2008 compared
with consolidated net earnings of $135.8 million (or
$2.03 per diluted share) during fi scal 2007.
52 WEEKS ENDED FEBRUARY 2 , 2008 COMPARED WITH 53 WEEKS ENDED FEBRUARY 3 , 2007
Sales
The Company’s sales increased $147.0 million, or 2.9%,
during fi scal 2007 to $5,286.7 million from $5,139.6
million during fi scal 2006. This increase was primar-
ily attributable to a $114.5 million increase in sales at
Barnes & Noble stores and a $43.4 million increase
in Barnes & Noble.com sales, off set by a $17.5 million
decrease in sales at B. Dalton stores.
Barnes & Noble store sales increased $114.5 million,
or 2.5%, during fi scal 2007 to $4,648.4 million from
$4,533.9 million during fi scal 2006 and accounted for
87.9% of total Company sales. The 2.5% increase in
Barnes & Noble store sales was primarily attributable
to new Barnes & Noble store sales of $159.9 million,
coupled with a 1.8% increase in comparable store
sales which increased sales by $76.1 million, off set by
closed stores that decreased sales by $70.4 million and
the inclusion of the 53rd week in fi scal 2006 which
accounted for $77.7 million of sales.
B. Dalton sales decreased $17.5 million, or 17.2%, dur-
ing fi scal 2007 to $84.5 million from $102.0 million
during fi scal 2006. This decrease was primarily attribut-
able to the closing of 13 B. Dalton stores.
Barnes & Noble.com sales increased $43.4 million, or
10.0%, during fi scal 2007 to $476.9 million from $433.4
million during fi scal 2006. This increase was attribut-
able to a 13.4% increase in comparable sales.
In fi scal 2007, the Company opened 31 Barnes & Noble
stores and closed 13, bringing its total number of Barnes
& Noble stores to 713 with 18.2 million square feet. The
Company closed 13 B. Dalton stores, ending the period
with 85 B. Dalton stores and 0.3 million square feet. As
of February 2, 2008, the Company operated 798 stores in
the fi fty states and the District of Columbia.
Cost of Sales and Occupancy
The Company’s cost of sales and occupancy includes
costs such as merchandise costs, distribution center
costs (including payroll, freight, supplies, depreciation
and other operating expenses), rental expense, common
area maintenance and real estate taxes, partially off set
by landlord tenant allowances amortized over the life of
the lease.
Cost of sales and occupancy increased $145.7 million, or
4.1%, to $3,679.8 million in fi scal 2007 from $3,534.1
million in fi scal 2006. As a percentage of sales, cost of
sales and occupancy increased to 69.6% in fi scal 2007
from 68.8% in fi scal 2006. This increase was primarily
attributable to the impact of the new discount structure
in the Company’s Member program, which went into
eff ect in October 2006, and the deep discount on J.K.
12 Barnes & Noble, Inc. MANAGEMENT’S DISCUSSION AND ANALYSIS OF FINANCIAL CONDITION AND RESULTS OF OPERATIONS continued
69552 Text.indd 1269552 Text.indd 12 4/8/09 10:12 AM4/8/09 10:12 AM
Rowling’s Harry Potter and the Deathly Hallows, off set by a
favorable variance of $10.3 million related to the annual
physical count of inventory.
Selling and Administrative Expenses
Selling and administrative expenses increased $47.8
million, or 4.1%, to $1,225.8 million in fi scal 2007 from
$1,178.0 million in fi scal 2006. As a percentage of sales,
selling and administrative expenses increased to 23.2%
in fi scal 2007 from 22.9% in fi scal 2006. This increase
was primarily due to legal costs off set by a gain in insur-
ance proceeds from the Hurricane Katrina settlement.
Depreciation and Amortization
Depreciation and amortization increased $2.0 million,
or 1.2%, to $168.6 million in fi scal 2007 from $166.6
million in fi scal 2006. The increase was primarily due
to the accelerated depreciation related to the closing of
the Company’s Internet distribution center and higher
depreciation in the Company’s new distribution center,
off set by lower depreciation in the Company’s home
offi ce due to certain assets that became fully depreciated.
Pre-Opening Expenses
Pre-opening expenses decreased $2.5 million, or 19.5%,
in fi scal 2007 to $10.4 million from $12.9 million in
fi scal 2006. The decrease in pre-opening expenses was
primarily the result of the timing of new store openings.
Operating Profi t
The Company’s consolidated operating profi t decreased
$46.0 million, or 18.5%, to $202.0 million in fi scal 2007
from $248.0 million in fi scal 2006. This decrease was
primarily due to the matters discussed above.
Interest Income (Expense), Net and Amortization of
Deferred Financing Fees
Interest income (expense), net and amortization of
deferred fi nancing fees, increased $5.8 million, or
345.4%, to $7.5 million in fi scal 2007 from $1.7 million
in fi scal 2006. The increase was primarily due to higher
average cash investments and lower average borrowings.
Income Taxes
Barnes & Noble’s eff ective tax rate in fi scal 2007
decreased to 35.61% compared with 40.25% during
fi scal 2006. The provision for income taxes for fi scal
2007 included a tax benefi t of $10.3 million resulting
from previously unrecognized tax benefi ts for which the
statute of limitations expired in fi scal 2007.
Earnings from Discontinued Operations
During the fourth quarter of fi scal 2008, the Company
committed to a plan to dispose of its approximate 74%
interest in Calendar Club. Calendar Club qualifi ed
for held for sale accounting treatment in fi scal 2008
and was written down to its fair value. The results of
Calendar Club have been classifi ed as discontinued
operations in all periods presented.
Net Earnings
As a result of the factors discussed above, the Company
reported consolidated net earnings of $135.8 million (or
$2.03 per diluted share) during fi scal 2007 compared
with consolidated net earnings of $150.5 million (or
$2.17 per diluted share) during fi scal 2006.
SEASONALITY
The Company’s business, like that of many retailers, is
seasonal, with the major portion of sales and operating
profi t realized during the fourth quarter which includes
the holiday selling season.
LIQUIDITY AND CAPITAL RESOURCES
Working capital requirements are generally at their
highest in the Company’s fi scal quarter ending on or
about January 31 due to the higher payments to vendors
for holiday season merchandise purchases. In addition,
the Company’s sales and merchandise inventory levels
will fl uctuate from quarter to quarter as a result of the
number and timing of new store openings.
Cash and cash equivalents on hand, cash fl ows from
operating activities, funds available under its senior
credit facility and short-term vendor fi nancing con-
tinue to provide the Company with liquidity and capital
resources for store expansion, seasonal working capital
requirements and capital investments.
Cash Flow
Cash fl ows provided from operating activities were
$376.2 million, $429.0 million and $258.0 million
during fi scal 2008, 2007 and 2006, respectively. The
decrease in cash fl ows provided from operating activi-
ties in fi scal 2008 was primarily due to lower earnings as
a result of negative comparable store sales. The increase
in cash fl ows provided from operating activities in
fi scal 2007 was due to timing of payments on inventory
purchases, related principally to the impact of the 53rd
week in fi scal 2006.
2008 Annual Report 13
69552 Text.indd 1369552 Text.indd 13 4/8/09 10:12 AM4/8/09 10:12 AM

Capital Structure
Strong cash fl ows from operations and a continued
emphasis on working capital management strengthened
the Company’s balance sheet in fi scal 2008.
The Company has an $850 million revolving credit
facility dated as of June 17, 2005, as amended and
restated on August 2, 2006 (Revolving Credit Facility).
The Revolving Credit Facility has a maturity date of July
31, 2011 and may be increased to $1.0 billion under
certain circumstances at the option of the Company. The
Revolving Credit Facility has an applicable margin that
is applied to loans and standby letters of credit ranging
from 0.500% to 1.000% above the stated Eurodollar rate.
A fee is paid on commercial letters of credit ranging
from 0.2500% to 0.5000%. In addition, a commit-
ment fee ranging from 0.100% to 0.200% is paid on the
unused portion of the Revolving Credit Facility. In each
case, the applicable rate is based on the Company’s con-
solidated fi xed charge coverage ratio. Proceeds from the
Revolving Credit Facility are used for general corporate
purposes, including seasonal working capital needs.
Selected information related to the Company’s
Revolving Credit Facility (in thousands):
Fiscal Year 2008 2007 2006
Revolving credit facility at year end $ — — —
Average balance outstanding during the year $ 63,871 1,392 23,337
Maximum borrowings outstanding during the year $ 199,900 37,600 91,800
Weighted average interest rate during the yeara 6.05% 173.16% 15.40%
Interest rate at end of year — — —
a The fi scal 2007 and 2006 interest rates are higher than the fi scal 2008 interest rate due to the lower average borrowings and the fi xed nature of the amortization of the deferred fi nancing fees and commit-ment fees. Excluding the deferred fi nancing fees and the commitment fees in fi scal 2007 and 2006, the weighted average interest rate was 7.51% and 7.70%, respectively.
Fees expensed with respect to the unused portion of the
Revolving Credit Facility were $1.0 million, $1.0 million
and $1.3 million, during fi scal 2008, 2007 and 2006,
respectively.
The Company has no agreements to maintain compen-
sating balances.
Capital Investment
Capital expenditures for continuing operations were
$192.2 million, $194.0 million and $176.0 million
during fi scal 2008, 2007 and 2006, respectively. Capital
expenditures planned for fi scal 2009 primarily relate
to the opening of approximately 15 new Barnes & Noble
stores, the maintenance of existing stores and system
enhancements for the retail stores and the website. The
capital expenditures are projected to be in the range
of $120.0 million to $130.0 million for fi scal 2009,
although commitment to many of such expenditures has
not yet been made.
Based on planned operating levels and capital expen-
ditures for fi scal 2009, management believes cash and
cash equivalents on hand, cash fl ows generated from
operating activities, short-term vendor fi nancing and
borrowing capacity under the Revolving Credit Facility
will be suffi cient to meet the Company’s working capital
and debt service requirements, and support the devel-
opment of its short- and long-term strategies for at least
the next 12 months.
On September 15, 2005, the Company’s Board of
Directors authorized a stock repurchase program for the
purchase of up to $200.0 million of the Company’s com-
mon stock. The Company completed this $200.0 million
repurchase program during the third quarter of fi scal
2007. On May 15, 2007, the Company announced that its
Board of Directors authorized a new stock repurchase
program for the purchase of up to $400.0 million of the
Company’s common stock. The maximum dollar value
of common stock that may yet be purchased under the
current program is approximately $2.5 million as of
January 31, 2009.
Stock repurchases under this program may be made
through open market and privately negotiated transac-
tions from time to time and in such amounts as manage-
ment deems appropriate. As of January 31, 2009, the
Company has repurchased 33,065,712 shares at a cost of
approximately $1.0 billion under its stock repurchase
programs. The repurchased shares are held in treasury.
14 Barnes & Noble, Inc. MANAGEMENT’S DISCUSSION AND ANALYSIS OF FINANCIAL CONDITION AND RESULTS OF OPERATIONS continued
69552 Text.indd 1469552 Text.indd 14 4/8/09 10:12 AM4/8/09 10:12 AM

Contractual Obligations
The following table sets forth the Company’s contractual obligations as of January 31, 2009 (in millions):
CONTRACTUAL OBLIGATIONS PAYMENTS DUE BY PERIOD
TotalLess Than 1
Year 1-3 Years 3-5 YearsMore Than
5 Years
Long-term debt $ — $ — $ — $ — $ —
Capital lease obligations — — — — —
Operating lease obligationsa 1,961.8 362.7 611.6 421.3 566.2
Purchase obligationsb 45.0 30.5 11.0 3.5 —
Other long-term liabilities refl ected on the Company’s balance sheet under GAAPc — — — — —
Total $ 2,006.8 $ 393.2 $ 622.6 $ 424.8 $ 566.2
a Excludes operating leases for Calendar Club of $11.3, $2.8, $4.7, $3.3 and $0.5 for total, less than 1 year, 1-3 years, 3-5 years and more than 5 years, respectively.
b Excludes purchase obligations for Calendar Club of $0.4, $0.2 and $0.1 for total, less than 1 year and 1-3 years, respectively.
c Excludes $23.8 million of unrecognized tax benefi ts for which the Company cannot make a reasonably reliable estimate of the amount and period of payment. See Note 9 to the Notes to Consolidated Financial Statements.
See also Note 8 to the Notes to Consolidated Financial Statements for information concerning the Company’s Pension and Postretirement Plans.
Off-Balance Sheet Arrangements
As of January 31, 2009, the Company had no off -balance
sheet arrangements as defi ned in Item 303 of Regulation
S-K.
Impact of Infl ation
The Company does not believe that infl ation has had a
material eff ect on its net sales or results of operations.
Certain Relationships and Related Transactions
See Note 17 to the Notes to Consolidated Financial
Statements.
Critical Accounting Policies
“Management’s Discussion and Analysis of Financial
Condition and Results of Operations” discusses the
Company’s consolidated fi nancial statements, which
have been prepared in accordance with accounting
principles generally accepted in the United States. The
preparation of these fi nancial statements requires
management to make estimates and assumptions in
certain circumstances that aff ect amounts reported in
the accompanying consolidated fi nancial statements and
related footnotes. In preparing these fi nancial state-
ments, management has made its best estimates and
judgments of certain amounts included in the fi nancial
statements, giving due consideration to materiality. The
Company does not believe there is a great likelihood that
materially diff erent amounts would be reported related
to the accounting policies described below. However,
application of these accounting policies involves the
exercise of judgment and use of assumptions as to future
uncertainties and, as a result, actual results could diff er
from these estimates.
Merchandise Inventories
Merchandise inventories are stated at the lower of cost
or market. Cost is determined on the fi rst-in, fi rst-out
(FIFO) basis. The Company uses the retail inventory
method on the FIFO basis for 97% and 98% of the
Company’s merchandise inventories as of January 31,
2009 and February 2, 2008, respectively.
Market is determined based on the estimated net
realizable value, which is generally the selling price.
Reserves for non-returnable inventory are based on
the Company’s history of liquidating non-returnable
inventory.
The Company also estimates and accrues shortage for
the period between the last physical count of inventory
and the balance sheet date. Shortage rates are estimated
and accrued based on historical rates and can be aff ected
by changes in merchandise mix and changes in actual
shortage trends.
Contractual Obligations
The following table sets forth the Company’s contractual obligations as of January 31, 2009 (in millions):
CONTRACTUAL OBLIGATIONS PAYMENTS DUE BY PERIOD
TotalLess Than 1
Year 1-3 Years 3-5 YearsMore Than
5 Years
Long-term debt $ — $ — $ — $ — $ —
Capital lease obligations — — — — —
Operating lease obligationsa 1,961.8 362.7 611.6 421.3 566.2
Purchase obligationsb 45.0 30.5 11.0 3.5 —
Other long-term liabilities reflected on the Company’s balance sheet under GAAPc — — — — —
Total $ 2,006.8 $ 393.2 $ 622.6 $ 424.8 $ 566.2
a Excludes operating leases for Calendar Club of $11.3, $2.8, $4.7, $3.3 and $0.5 for total, less than 1 year, 1-3 years, 3-5 years and more than 5 years, respectively.
b Excludes purchase obligations for Calendar Club of $0.4, $0.2 and $0.1 for total, less than 1 year and 1-3 years, respectively.
c Excludes $23.8 million of unrecognized tax benefits for which the Company cannot make a reasonably reliable estimate of the amount and period of payment. See Note 9 to the Notes to Consolidated Financial Statements.
See also Note 8 to the Notes to Consolidated Financial Statements for information concerning the Company’s Pension and Postretirement Plans.
Off-Balance Sheet Arrangements
As of January 31, 2009, the Company had no off-balance
sheet arrangements as defined in Item 303 of Regulation
S-K.
Impact of Inflation
The Company does not believe that inflation has had a
material effect on its net sales or results of operations.
CERTAIN RELATIONSHIPS AND RELATED TRANSACTIONS
See Note 17 to the Notes to Consolidated Financial
Statements.
CRITICAL ACCOUNTING POLICIES
“Management’s Discussion and Analysis of Financial
Condition and Results of Operations” discusses the
Company’s consolidated financial statements, which have
been prepared in accordance with accounting principles
generally accepted in the United States. The preparation
of these financial statements requires management to
make estimates and assumptions in certain circum-
stances that affect amounts reported in the accompanying
consolidated financial statements and related footnotes.
In preparing these financial statements, management has
made its best estimates and judgments of certain amounts
included in the financial statements, giving due consider-
ation to materiality. The Company does not believe there
is a great likelihood that materially different amounts
would be reported related to the accounting policies
described below. However, application of these account-
ing policies involves the exercise of judgment and use of
assumptions as to future uncertainties and, as a result,
actual results could differ from these estimates.
Merchandise Inventories
Merchandise inventories are stated at the lower of cost
or market. Cost is determined on the first-in, first-out
(FIFO) basis. The Company uses the retail inventory
method on the FIFO basis for 97% and 98% of the
Company’s merchandise inventories as of January 31,
2009 and February 2, 2008, respectively.
Market is determined based on the estimated net realiz-
able value, which is generally the selling price. Reserves
for non-returnable inventory are based on the Company’s
history of liquidating non-returnable inventory.
The Company also estimates and accrues shortage for
the period between the last physical count of inventory
and the balance sheet date. Shortage rates are estimated
and accrued based on historical rates and can be affected
by changes in merchandise mix and changes in actual
shortage trends.
2008 Annual Report 15
69552 Text.indd 1569552 Text.indd 15 4/13/09 2:40 PM4/13/09 2:40 PM

Stock-Based Compensation
The calculation of share-based employee compensation
expense involves estimates that require management’s
judgment. These estimates include the fair value of each
of the stock option awards granted, which is estimated
on the date of grant using a Black-Scholes option pric-
ing model. There are two signifi cant inputs into the
Black-Scholes option pricing model: expected volatility
and expected term. The Company estimates expected
volatility based on traded option volatility of the
Company’s stock over a term equal to the expected term
of the option granted. The expected term of stock option
awards granted is derived from historical exercise
experience under the Company’s stock option plans and
represents the period of time that stock option awards
granted are expected to be outstanding. The assump-
tions used in calculating the fair value of share-based
payment awards represent management’s best estimates,
but these estimates involve inherent uncertainties
and the application of management’s judgment. As a
result, if factors change and the Company uses diff erent
assumptions, stock-based compensation expense could
be materially diff erent in the future. In addition, the
Company is required to estimate the expected forfei-
ture rate, and only recognize expense for those shares
expected to vest. If the Company’s actual forfeiture rate
is materially diff erent from its estimate, the stock-
based compensation expense could be signifi cantly
diff erent from what the Company has recorded in the
current period. See Note 3 to the Consolidated Financial
Statements for a further discussion on stock-based
compensation.
Other Long-Lived Assets
The Company’s other long-lived assets include property
and equipment and amortizable intangibles. At January
31, 2009, the Company had $820.7 million of property
and equipment, net of accumulated depreciation, and
$13.6 million of amortizable intangible assets, net of
accumulated amortization, accounting for approximately
27.9% of the Company’s total assets. The Company
reviews its long-lived assets for impairment whenever
events or changes in circumstances indicate that the
carrying amount of an asset may not be recoverable in
accordance with Statement of Financial Accounting
Standards (SFAS) No. 144, Accounting for the Impairment
or Disposal of Long-Lived Assets. The Company evaluates
long-lived assets for impairment at the individual store
level, which is the lowest level at which individual cash
fl ows can be identifi ed. When evaluating long-lived
assets for potential impairment, the Company will
fi rst compare the carrying amount of the assets to the
individual store’s estimated future undiscounted cash
fl ows. If the estimated future cash fl ows are less than
the carrying amount of the assets, an impairment loss
calculation is prepared. The impairment loss calcula-
tion compares the carrying amount of the assets to the
individual store’s fair value based on its estimated dis-
counted future cash fl ows. If required, an impairment
loss is recorded for that portion of the asset’s carrying
value in excess of fair value. Impairment losses included
in selling and administrative expenses totaled $11.7 mil-
lion, $5.9 million and $3.4 million in fi scal 2008, 2007
and 2006, respectively, and are related to individual
store locations.
Goodwill and Unamortizable Intangible Assets
At January 31, 2009, the Company had $240.0 million of
goodwill and $69.9 million of unamortizable intangible
assets (those with an indefi nite useful life), accounting
for approximately 10.4% of the Company’s total assets.
SFAS No. 142, Goodwill and Other Intangible Assets (SFAS
142), requires that goodwill and other unamortizable
intangible assets no longer be amortized, but instead be
tested for impairment at least annually or earlier if there
are impairment indicators. The Company performs a
two-step process for impairment testing of goodwill as
required by SFAS 142. The fi rst step of this test, used to
identify potential impairment, compares the estimated
fair value of a reporting unit with its carrying amount.
The second step (if necessary) measures the amount of
the impairment. The Company completed its annual
impairment test on the goodwill in November 2008
and deemed that no impairment charge was necessary.
The Company has noted no subsequent indicators of
impairment. During the third quarter of fi scal 2007, the
Company reevaluated the categorization of distribu-
tion contracts based on the then recently observed rate
of contract retention and reclassifi ed certain of these
contracts having a recorded value of $8.3 million from
an unamortizable intangible asset to an amortizable
intangible asset. Such distribution contracts were
tested for impairment prior to the reclassifi cation and
the Company determined that no impairment charge
was necessary. The Company also completed its annual
impairment tests for its other unamortizable intangible
16 Barnes & Noble, Inc. MANAGEMENT’S DISCUSSION AND ANALYSIS OF FINANCIAL CONDITION AND RESULTS OF OPERATIONS continued
69552 Text.indd 1669552 Text.indd 16 4/8/09 10:12 AM4/8/09 10:12 AM

assets by comparing the estimated fair value to the
carrying value of such assets and determined that no
impairment was necessary. Changes in market condi-
tions, among other factors, could have a material impact
on these estimates.
Gift Cards
The Company sells gift cards which can be used in stores
or on Barnes & Noble.com. The Company does not
charge administrative or dormancy fees on gift cards,
and gift cards have no expiration dates. Upon the pur-
chase of a gift card, a liability is established for its cash
value. Revenue associated with gift cards is deferred
until redemption of the gift card. Over time, some
portion of the gift cards issued is not redeemed. The
Company estimates the portion of the gift card liability
for which the likelihood of redemption is remote based
upon the Company’s historical redemption patterns.
The Company records this amount in income on a
straight-line basis over a 12-month period beginning
in the 13th month after the month the gift card was
originally sold. If actual redemption patterns vary from
the Company’s estimates, actual gift card breakage may
diff er from the amounts recorded. The Company also
sells online gift certifi cates for use solely on Barnes &
Noble.com, which are treated the same way as gift cards.
Income Taxes
Judgment is required in determining the provision
for income taxes and related accruals, deferred tax
assets and liabilities. In the ordinary course of busi-
ness, tax issues may arise where the ultimate outcome is
uncertain. Additionally, the Company’s tax returns are
subject to audit by various tax authorities. Consequently,
changes in the Company’s estimates for contingent tax
liabilities may materially impact the Company’s results
of operations or fi nancial position.
Recent Accounting Pronouncements
In September 2006, the Financial Accounting Standards
Board (FASB) issued SFAS No. 157, Fair Value Measurements
(SFAS 157). SFAS 157 provides guidance for using fair
value to measure assets and liabilities. Under SFAS 157,
fair value refers to the price that would be received to
sell an asset or paid to transfer a liability in an orderly
transaction between market participants in the market
in which the reporting entity transacts. SFAS 157 is
eff ective for fi nancial statements issued for fi scal years
beginning after November 15, 2007. The Company
adopted SFAS 157 at February 3, 2008, and the adop-
tion had no impact on the Company’s fi nancial position,
results of operations and cash fl ows.
In February 2007, the FASB issued SFAS No. 159, The Fair
Value Option for Financial Assets and Financial Liabilities
(SFAS 159). SFAS 159 permits an entity to measure cer-
tain fi nancial assets and fi nancial liabilities at fair value
that were not previously required to be measured at fair
value. Entities that elect the fair value option will report
unrealized gains and losses in earnings at each subse-
quent reporting date. The Company has not elected to
measure any fi nancial assets and fi nancial liabilities
at fair value that were not previously required to be
measured at fair value. Therefore, the adoption of this
standard has had no impact on the Company’s fi nancial
position, results of operations and cash fl ows.
In December 2007, the FASB issued SFAS No. 160,
Noncontrolling Interest in Consolidated Financial
Statements, an amendment of ARB No. 51 (SFAS 160),
which will change the accounting and reporting for
minority interests, which will be recharacterized as
noncontrolling interests and classifi ed as a component
of equity within the consolidated balance sheets. SFAS
160 is eff ective for fi scal years beginning after December
15, 2008. Earlier adoption is prohibited, and the
Company does not expect SFAS 160 to have a material
impact on its fi nancial position, results of operations
and cash fl ows.
In December 2007, the FASB issued SFAS No. 141
(revised 2007), Business Combinations (SFAS 141R). SFAS
141R signifi cantly changes the accounting for business
combinations in a number of areas, including the treat-
ment of contingent consideration, preacquisition con-
tingencies, transaction costs, in-process research and
development and restructuring costs. In addition, under
SFAS 141R, changes in an acquired entity’s deferred tax
assets and uncertain tax positions after the measure-
ment period will impact income tax expense. SFAS 141R
is eff ective for fi scal years beginning after December
15, 2008. This standard will change the Company’s
accounting treatment for business combinations, if any,
on a prospective basis, including the treatment of any
income tax adjustments related to past acquisitions. The
Company is currently evaluating the
2008 Annual Report 17
69552 Text.indd 1769552 Text.indd 17 4/8/09 10:12 AM4/8/09 10:12 AM

eff ect, if any, that the adoption of SFAS 141R will have
on its fi nancial position, results of operations and cash
fl ows.
In April 2008, the FASB issued FASB Staff Position
No. FAS 142-3, Determination of the Useful Life of
Intangible Assets (FSP No. FAS 142-3), which amends the
factors an entity should consider in developing renewal
or extension assumptions used in determining the useful
lives of recognized intangible assets. FSP No. FAS 142-3
is eff ective for fi scal years beginning after December 15,
2008. The Company is currently evaluating the eff ect, if
any, that the adoption of FSP No. FAS 142-3 will have on
its fi nancial position, results of operations and cash fl ows.
In June 2008, the FASB issued FASB Staff Position
No. EITF 03-6-1, Determining Whether Instruments
Granted in Share-Based Payment Transactions Are
Participating Securities (FSP No. EITF 03-6-1), which
classifi es unvested share-based payment awards that
contain nonforfeitable rights to dividends or dividend
equivalents (whether paid or unpaid) as participating
securities and requires them to be included in the com-
putation of earnings per share pursuant to the two-class
method described in SFAS No. 128, Earnings per Share.
This Staff Position is eff ective for fi nancial statements
issued for fi scal years beginning after December 15,
2008, and interim periods within those years. All
prior-period earnings per share data presented are to
be adjusted retrospectively (including interim fi nan-
cial statements, summaries of earnings, and selected
fi nancial data) to conform with the provisions of this
Staff Position, with early application not permitted. The
Company is currently evaluating the eff ect, if any, that
the adoption of FSP No. EITF 03-6-1 will have on its
fi nancial position, results of operations and cash fl ows.
Disclosure Regarding Forward-Looking Statements
This report may contain certain forward-looking
statements (within the meaning of Section 27A of the
Securities Act of 1933 and Section 21E of the Securities
Exchange Act of 1934) and information relating to the
Company that are based on the beliefs of the manage-
ment of the Company as well as assumptions made by
and information currently available to the management
of the Company. When used in this report, the words
“anticipate,” “believe,” “estimate,” “expect,” “intend,”
“plan” and similar expressions, as they relate to the
Company or the management of the Company, identify
forward-looking statements. Such statements refl ect
the current views of the Company with respect to future
events, the outcome of which is subject to certain
risks, including, among others, general economic and
market conditions, decreased consumer demand for
the Company’s products, possible disruptions in the
Company’s computer or telephone systems, possible
risks associated with data privacy and information secu-
rity, possible work stoppages or increases in labor costs,
possible increases in shipping rates or interruptions
in shipping service, eff ects of competition, possible
disruptions or delays in the opening of new stores or the
inability to obtain suitable sites for new stores, higher-
than-anticipated store closing or relocation costs,
higher interest rates, the performance of the Company’s
online and other initiatives such as Barnes & Noble.com,
the performance and successful integration of acquired
businesses, the success of the Company’s strategic
investments, unanticipated increases in merchandise or
occupancy costs, unanticipated adverse litigation results
or eff ects, the results or eff ects of any governmental
review of the Company’s stock option practices, product
shortages, and other factors which may be outside of the
Company’s control, including those factors discussed in
detail in Item 1A, “Risk Factors,” in the Company’s Form
10-K for the fi scal year ended January 31, 2009, and in
the Company’s other fi lings made from time to time with
the Securities and Exchange Commission. Should one
or more of these risks or uncertainties materialize, or
should underlying assumptions prove incorrect, actual
results or outcomes may vary materially from those
described as anticipated, believed, estimated, expected,
intended or planned. Subsequent written and oral
forward-looking statements attributable to the Company
or persons acting on its behalf are expressly qualifi ed
in their entirety by the cautionary statements in this
paragraph. The Company undertakes no obligation to
publicly update or revise any forward-looking state-
ments, whether as a result of new information, future
events or otherwise after the date of this Annual Report.
18 Barnes & Noble, Inc. MANAGEMENT’S DISCUSSION AND ANALYSIS OF FINANCIAL CONDITION AND RESULTS OF OPERATIONS continued
69552 Text.indd 1869552 Text.indd 18 4/8/09 10:12 AM4/8/09 10:12 AM

CONSOLIDATED STATEMENTS OF OPERATIONS
FISCAL YEAR (In thousands, except per share data) 2008 2007 2006
Sales $ 5,121,804 5,286,674 5,139,618
Cost of sales and occupancy 3,540,596 3,679,845 3,534,097
Gross profi t 1,581,208 1,606,829 1,605,521
Selling and administrative expenses 1,251,524 1,225,791 1,178,038
Depreciation and amortization 173,557 168,600 166,581
Pre-opening expenses 12,796 10,387 12,897
Operating profi t 143,331 202,051 248,005
Interest income (expense), net and amortization of deferred fi nancing fees (2,344) 7,483 1,680
Earnings from continuing operations before taxes and minority interest 140,987 209,534 249,685
Income taxes 55,591 74,623 100,499
Earnings from continuing operations before minority interest 85,396 134,911 149,186
Minority interest 30 — —
Earnings from continuing operations 85,426 134,911 149,186
Earnings (loss) from discontinued operations (net of income tax) (9,506) 888 1,341
Net earnings $ 75,920 135,799 150,527
Basic earnings per common share
Earnings from continuing operations $ 1.55 2.12 2.29
Earnings (loss) from discontinued operations (0.17) 0.01 0.02
Net earnings $ 1.38 2.13 2.31
Diluted earnings per common share
Earnings from continuing operations $ 1.49 2.01 2.16
Earnings (loss) from discontinued operations (0.17) 0.01 0.02
Net earnings $ 1.32 2.03 2.17
Weighted average common shares outstanding
Basic 55,207 63,662 65,212
Diluted 57,327 67,050 69,226
See accompanying notes to consolidated fi nancial statements.
2008 Annual Report 19
69552 Text.indd 1969552 Text.indd 19 4/8/09 10:12 AM4/8/09 10:12 AM

CONSOLIDATED BALANCE SHEETS
(In thousands, except per share data) JANUARY 31, 2009 FEBRUARY 2, 2008
ASSETS
Current assets
Cash and cash equivalents $ 281,608 335,080Receivables, net 80,998 107,137Merchandise inventories 1,203,471 1,358,170Prepaid expenses and other current assets 127,028 125,043Current assets of discontinued operations 30,199 40,251Total current assets 1,723,304 1,965,681
Property and equipment
Land and land improvements 9,298 3,247Buildings and leasehold improvements 1,096,801 1,053,490Fixtures and equipment 1,385,454 1,310,225
2,491,553 2,366,962
Less accumulated depreciation and amortization 1,670,839 1,553,067Net property and equipment 820,714 813,895
Goodwill 240,008 242,633Intangible assets, net 83,443 87,987Deferred taxes 110,098 102,633Other noncurrent assets 8,000 8,372Noncurrent assets of discontinued operations 8,321 28,625Total assets $ 2,993,888 3,249,826
LIABILITIES AND SHAREHOLDERS’ EQUITY
Current liabilities
Accounts payable $ 746,599 831,669Accrued liabilities 710,269 725,054Current liabilities of discontinued operations 18,807 33,444Total current liabilities 1,475,675 1,590,167
Deferred taxes 189,268 173,496Other long-term liabilities 393,006 397,674Noncurrent liabilities of discontinued operations 12,713 13,769Minority interest 1,612 —Shareholders’ equity
Common stock; $.001 par value; 300,000 shares authorized;87,681 and 86,754 shares issued, respectively 88 87Additional paid-in capital 1,262,358 1,233,343Accumulated other comprehensive loss (14,503) (9,523)Retained earnings 721,200 696,861Treasury stock, at cost, 33,066 and 26,461 shares, respectively (1,047,529) (846,048)Total shareholders’ equity 921,614 1,074,720
Commitments and contingencies — —Total liabilities and shareholders’ equity $ 2,993,888 3,249,826
See accompanying notes to consolidated fi nancial statements.
20 Barnes & Noble, Inc.
69552 Text.indd 2069552 Text.indd 20 4/8/09 10:12 AM4/8/09 10:12 AM

CONSOLIDATED STATEMENTS OF CHANGES IN SHAREHOLDERS’ EQUITY
(In thousands)COMMON
STOCK
ADDITIONAL PAID-INCAPITAL
ACCUMULATEDOTHER
COMPREHENSIVELOSS
RETAINEDEARNINGS
TREASURYSTOCK
AT COST TOTAL
Balance at January 28, 2006 $ 83 1,091,018 (9,085) 512,594 (478,769) $ 1,115,841
COMPREHENSIVE EARNINGS
Net earnings — — — 150,527 —Other comprehensive earnings (loss), net of tax (See Note 10): Foreign currency translation — — 843 — —Minimum pension liability — — 1,156 — —Total comprehensive earnings 152,526
Exercise of 1,177 common stock options 2 19,733 — — — 19,735Stock options and restricted stock tax benefi ts — 12,551 — — — 12,551Stock-based compensation expense — 17,146 — — — 17,146Cash dividends paid to stockholders — — — (39,910) — (39,910)APB 25 cumulative adjustment (See Note 3) — 28,719 — (22,807) — 5,912Treasury stock acquired, 2,830 shares — — — — (118,936) (118,936)Balance at February 3, 2007 85 1,169,167 (7,086) 600,404 (597,705) 1,164,865
COMPREHENSIVE EARNINGS
Net earnings — — — 135,799 —Other comprehensive earnings (loss), net of tax (See Note 10): Foreign currency translation — — 73 — —Minimum pension liability — — (2,510) — —Total comprehensive earnings 133,362
Exercise of 1,852 common stock options 2 31,216 — — — 31,218Stock options and restricted stock tax benefi ts — 15,792 — — — 15,792Stock-based compensation expense — 17,168 — — — 17,168Cash dividends paid to stockholders — — — (39,342) — (39,342)Treasury stock acquired, 6,941 shares — — — — (248,343) (248,343)Balance at February 2, 2008 87 1,233,343 (9,523) 696,861 (846,048) 1,074,720
COMPREHENSIVE EARNINGS
Net earnings — — — 75,920 —Other comprehensive earnings (loss), net of tax (See Note 10):Foreign currency translation — — (3,352) — —Minimum pension liability — — (1,628) — —Total comprehensive earnings 70,940
Exercise of 488 common stock options 1 9,661 — — — 9,662Stock options and restricted stock tax benefi ts — (1,195) — — — (1,195)Stock-based compensation expense — 20,549 — — — 20,549Cash dividends paid to stockholders — — — (51,581) — (51,581)Treasury stock acquired, 6,604 shares — — — — (201,481) (201,481)Balance at January 31, 2009 $ 88 1,262,358 (14,503) 721,200 (1,047,529) $ 921,614
See accompanying notes to consolidated fi nancial statements.
2008 Annual Report 21
69552 Text.indd 2169552 Text.indd 21 4/8/09 10:12 AM4/8/09 10:12 AM

CONSOLIDATED STATEMENTS OF CASH FLOWS
FISCAL YEAR (In thousands) 2008 2007 2006
CASH FLOWS FROM OPERATING ACTIVITIES
Net earnings $ 75,920 135,799 150,527
Net earnings (loss) from discontinued operations (9,506) 888 1,341Net earnings from continuing operations 85,426 134,911 149,186Adjustments to reconcile net earnings from continuing operations to net cash fl ows from operating activities
Depreciation and amortization (including amortization of deferred fi nancing fees) 174,104 169,145 167,098Stock-based compensation expense 20,549 17,168 17,146Property and equipment impairment charge 11,715 5,876 3,411Deferred taxes (430) 11,593 1,368Decrease (increase) in other long-term liabilities 7,590 (2,858) (2,048)Loss on disposal of property and equipment 4,625 2,927 1,391Minority interest (30) — —Changes in operating assets and liabilities, net 72,700 90,251 (79,577)Net cash fl ows from operating activities 376,249 429,013 257,975
CASH FLOWS FROM INVESTING ACTIVITIES
Purchases of property and equipment (192,153) (193,958) (176,040)Net increase in other noncurrent assets (723) (523) (583)Insurance proceeds from property claims — 4,666 —Payments on GameStop note receivable — 12,173 12,173Net cash fl ows from investing activities (192,876) (177,642) (164,450)
CASH FLOWS FROM FINANCING ACTIVITIES
Purchase of treasury stock through repurchase program (201,481) (248,343) (118,936)Cash dividends paid to shareholders (51,581) (39,342) (39,910)Proceeds from exercise of common stock options 9,662 31,218 19,735Excess tax benefi t from stock-based compensation 869 15,792 12,551Net cash fl ows from fi nancing activities (242,531) (240,675) (126,560)
Cash fl ows from discontinued operationsOperating cash fl ows 7,242 4,880 4,476Investing cash fl ows (738) (2,849) (2,834)Financing cash fl ows (818) (1,162) (1,228)Net cash fl ows from discontinued operations 5,686 869 414
Net increase (decrease) in cash and cash equivalents (53,472) 11,565 (32,621)Cash and cash equivalents at beginning of year 335,080 323,515 356,136Cash and cash equivalents at end of year $ 281,608 335,080 323,515
CHANGES IN OPERATING ASSETS AND LIABILITIES, NET
Receivables, net $ 13,881 3,037 6,027Merchandise inventories 154,699 (12,436) (39,159)Prepaid expenses and other current assets (1,985) (4,425) (31,641)Accounts payable and accrued liabilities (93,895) 104,075 (14,804)Changes in operating assets and liabilities, net $72,700 90,251 (79,577)
SUPPLEMENTAL CASH FLOW INFORMATION
Cash paid (received) during the period for
Interest paid (received) $ 1,812 (8,251) (1,040)Income taxes (net of refunds) $ 50,383 60,716 85,898
See accompanying notes to consolidated fi nancial statements.
22 Barnes & Noble, Inc.
69552 Text.indd 2269552 Text.indd 22 4/8/09 10:12 AM4/8/09 10:12 AM

(Thousands of dollars, except per share data)
For the 52 weeks ended January 31, 2009 (fi scal 2008),
the 52 weeks ended February 2, 2008 (fi scal 2007) and
the 53 weeks ended February 3, 2007 (fi scal 2006).
1 . SUMMARY OF SIGNIFICANT ACCOUNTING POLICIES
Business
Barnes & Noble, Inc. (Barnes & Noble), through its
subsidiaries (collectively, the Company), is primarily
engaged in the sale of books. As of January 31, 2009, the
Company operated 778 bookstores, 726 primarily under
the Barnes & Noble Booksellers trade name (hereafter
collectively referred to as Barnes & Noble stores) and
52 primarily under the B. Dalton Bookseller trade name
(hereafter collectively referred to as B. Dalton stores).
Barnes & Noble conducts the online part of its business
through barnesandnoble.com llc (Barnes & Noble.com).
The Company publishes books under its own imprints
which include the imprints of Sterling Publishing Co.,
Inc. (Sterling or Sterling Publishing). Additionally, as of
January 31, 2009, the Company owned an approximate
74% interest in Calendar Club, an operator of seasonal
kiosks. The Company subsequently sold its interest in
Calendar Club in February 2009. The results of Calendar
Club have been classifi ed as discontinued operations in
all periods presented.
Consolidation
The consolidated fi nancial statements include the
accounts of Barnes & Noble and its wholly and majority-
owned subsidiaries. Investments in affi liates in which
ownership interests range from 20% to 50%, are
accounted for under the equity method. All signifi cant
intercompany accounts and transactions have been
eliminated in consolidation. The Company consolidates
a variable interest entity in which the Company absorbs
a majority of the entity’s expected losses, receives a
majority of the entity’s expected residual returns, or
both, as a result of ownership.
Use of Estimates
In preparing fi nancial statements in conformity with
generally accepted accounting principles, the Company
is required to make estimates and assumptions that
aff ect the reported amounts of assets and liabilities and
the disclosure of contingent assets and liabilities at
the date of the fi nancial statements and revenues and
expenses during the reporting period. Actual results
could diff er from those estimates.
Cash and Cash Equivalents
The Company considers all short-term, highly liquid
instruments purchased with an original maturity of
three months or less to be cash equivalents.
Merchandise Inventories
Merchandise inventories are stated at the lower of cost
or market. Cost is determined on the fi rst-in, fi rst-out
(FIFO) basis. The Company uses the retail inventory
method on the FIFO basis for 97% and 98% of the
Company’s merchandise inventories as of January 31,
2009 and February 2, 2008, respectively.
Market is determined based on the estimated net
realizable value, which is generally the selling price.
Reserves for non-returnable inventory are based on
the Company’s history of liquidating non-returnable
inventory.
The Company also estimates and accrues shortage for
the period between the last physical count of inventory
and the balance sheet date. Shortage rates are estimated
and accrued based on historical rates and can be aff ected
by changes in merchandise mix and changes in actual
shortage trends.
Property and Equipment
Property and equipment are carried at cost, less accu-
mulated depreciation and amortization. For fi nancial
reporting purposes, depreciation is computed using the
straight-line method over estimated useful lives. For tax
purposes, diff erent methods are used. Maintenance and
repairs are expensed as incurred, while major mainte-
nance and remodeling costs are capitalized. Leasehold
improvements are capitalized and amortized over the
shorter of their estimated useful lives or the terms of
the respective leases. Capitalized lease acquisition costs
are being amortized over the lease terms of the underly-
ing leases. Costs incurred in purchasing management
information systems are capitalized and included in
property and equipment. These costs are amortized over
their estimated useful lives from the date the systems
become operational.
NOTES TO CONSOLIDATED FINANCIAL STATEMENTS
2008 Annual Report 23
69552 Text.indd 2369552 Text.indd 23 4/8/09 10:12 AM4/8/09 10:12 AM

Other Long-Lived Assets
The Company’s other long-lived assets include prop-
erty and equipment, and amortizable intangibles. At
January 31, 2009, the Company had $820,714 of property
and equipment, net of accumulated depreciation, and
$13,563 of amortizable intangible assets, net of accumu-
lated amortization, accounting for approximately 27.9%
of the Company’s total assets. The Company reviews
its long-lived assets for impairment whenever events
or changes in circumstances indicate that the carrying
amount of an asset may not be recoverable in accordance
with Statement of Financial Accounting Standards
(SFAS) No. 144, Accounting for the Impairment or Disposal
of Long-Lived Assets. The Company evaluates long-lived
assets for impairment at the individual store level,
which is the lowest level at which individual cash fl ows
can be identifi ed. When evaluating long-lived assets for
potential impairment, the Company will fi rst compare
the carrying amount of the assets to the individual
store’s estimated future undiscounted cash fl ows. If the
estimated future cash fl ows are less than the carrying
amount of the assets, an impairment loss calculation is
prepared. The impairment loss calculation compares the
carrying amount of the assets to the individual store’s
fair value based on its estimated discounted future cash
fl ows. If required, an impairment loss is recorded for
that portion of the asset’s carrying value in excess of fair
value. Impairment losses included in selling and admin-
istrative expenses totaled $11,715, $5,876 and $3,411 in
fi scal 2008, 2007 and 2006, respectively, and relate to
individual store locations.
Goodwill and Unamortizable Intangible Assets
The costs in excess of net assets of businesses acquired
are carried as goodwill in the accompanying consoli-
dated balance sheets.
At January 31, 2009, the Company had $240,008 of
goodwill and $69,880 of unamortizable intangible assets
(i.e., those with an indefi nite useful life), accounting
for approximately 10.4% of the Company’s total assets.
SFAS No. 142, Goodwill and Other Intangible Assets (SFAS
142), requires that goodwill and other unamortizable
intangible assets no longer be amortized, but instead be
tested for impairment at least annually or earlier if there
are impairment indicators. The Company performs a
two-step process for impairment testing of goodwill as
required by SFAS 142. The fi rst step of this test, used to
identify potential impairment, compares the estimated
fair value of a reporting unit with its carrying amount.
The second step (if necessary) measures the amount of
the impairment. The Company completed its annual
impairment test on the goodwill in November 2008 and
determined that no impairment charge was necessary.
The Company has noted no subsequent indicators of
impairment. During the third quarter of fi scal 2007,
the Company reevaluated the categorization of distri-
bution contracts based on the then recently observed
rate of contract retention and reclassifi ed certain of
these contracts having a recorded value of $8,325 from
an unamortizable intangible asset to an amortizable
intangible asset. Such distribution contracts were
tested for impairment prior to the reclassifi cation and
the Company determined that no impairment charge
was necessary. The Company also completed its annual
impairment tests for its other unamortizable intangible
assets by comparing the estimated fair value to the
carrying value of such assets and determined that no
impairment was necessary. Changes in market condi-
tions, among other factors, could have a material impact
on these estimates.
Deferred Charges
Costs incurred to obtain long-term fi nancing are amor-
tized over the terms of the respective debt agreements
using the straight-line method, which approximates the
interest method. Unamortized costs included in other
noncurrent assets as of January 31, 2009 and February 2,
2008 were $1,208 and $1,677, respectively. Amortization
expense included in interest and amortization of
deferred fi nancing fees was $547, $546 and $517 during
fi scal 2008, 2007 and 2006, respectively.
Revenue Recognition
Revenue from sales of the Company’s products is rec-
ognized at the time of sale. Sales returns (which are not
signifi cant) are recognized at the time returns are made.
Sales taxes collected from retail customers are excluded
from reported revenues.
The Barnes & Noble Member Program entitles Members
to receive the following benefi ts: 40% discount of each
week’s hardcover Barnes & Noble store bestsellers, 20%
discount of all adult hardcover books, 10% discount on
all other purchases made, as well as periodic special
promotions. The annual fee of $25.00 is non-refundable
after the fi rst 30 days. Revenue is recognized over the
twelve-month period based upon historical spending
patterns for Barnes & Noble Members. Refunds of fees
due to cancellations within the fi rst 30 days are minimal.
24 Barnes & Noble, Inc. NOTES TO CONSOLIDATED FINANCIAL STATEMENTS continued
69552 Text.indd 2469552 Text.indd 24 4/8/09 10:12 AM4/8/09 10:12 AM

Advertising Costs
The costs of advertising are expensed as incurred dur-
ing the year pursuant to Statement of Position 93-7,
Reporting on Advertising Costs. Advertising costs charged
to selling and administrative expenses were $28,772,
$27,158 and $27,335 during fi scal 2008, 2007 and 2006,
respectively.
The Company receives payments and credits from
vendors pursuant to co-operative advertising and other
programs, including payments for product placement
in stores, catalogs and online. In accordance with
Emerging Issues Task Force Issue 02-16, Accounting by
a Customer (Including a Reseller) for Certain Consideration
Received from a Vendor, the Company classifi es certain
co-op advertising received as a reduction in costs of
sales and occupancy. The gross advertising expenses
noted above were completely off set by allowances
received from vendors and the excess allowances
received were recorded as a reduction of cost of goods
sold or inventory, as appropriate.
Closed Store Expenses
When the Company closes or relocates a store, the
Company charges unrecoverable costs to expense. Such
costs include the net book value of abandoned fi xtures
and leasehold improvements and, when a store is closed
prior to the expiration of the lease, a provision for future
lease obligations, net of expected sublease recover-
ies. Costs associated with store closings of $11,875,
$9,378 and $7,425 during fi scal 2008, 2007 and 2006,
respectively, are included in selling and administrative
expenses in the accompanying consolidated statements
of operations.
Net Earnings Per Common Share
Basic earnings per share is computed by dividing
income available to common shareholders by the
weighted-average number of common shares outstand-
ing. Diluted earnings per share refl ect, in periods in
which they have a dilutive eff ect, the impact of common
shares issuable upon exercise of the Company’s out-
standing stock options, common shares released from
restriction upon the vesting of the Company’s outstand-
ing restricted stock and the impact of common shares
issuable under the Company’s deferred compensation
plan. The Company has not excluded any shares from the
computation of diluted earnings per share.
Income Taxes
The provision for income taxes includes federal, state
and local income taxes currently payable and those
deferred because of temporary diff erences between the
fi nancial statement and tax bases of assets and liabili-
ties. The deferred tax assets and liabilities are measured
using the enacted tax rates and laws that are expected to
be in eff ect when the diff erences reverse. The Company
regularly reviews its deferred tax assets for recoverabil-
ity and establishes a valuation allowance, if determined
to be necessary.
Stock-Based Compensation
The calculation of share-based employee compensation
expense involves estimates that require management’s
judgment. These estimates include the fair value of each
of the stock option awards granted, which is estimated
on the date of grant using a Black-Scholes option pric-
ing model. There are two signifi cant inputs into the
Black-Scholes option pricing model: expected volatility
and expected term. The Company estimates expected
volatility based on traded option volatility of the
Company’s stock over a term equal to the expected term
of the option granted. The expected term of stock option
awards granted is derived from historical exercise
experience under the Company’s stock option plans and
represents the period of time that stock option awards
granted are expected to be outstanding. The assump-
tions used in calculating the fair value of share-based
payment awards represent management’s best esti-
mates, but these estimates involve inherent uncertain-
ties and the application of management’s judgment. As a
result, if factors change and the Company uses diff erent
assumptions, stock-based compensation expense could
be materially diff erent in the future. In addition, the
Company is required to estimate the expected forfei-
ture rate, and only recognize expense for those shares
expected to vest. If the Company’s actual forfeiture rate
is materially diff erent from its estimate, the stock-
based compensation expense could be signifi cantly
diff erent from what the Company has recorded in the
current period. See Note 3 to the Consolidated Financial
Statements for a further discussion on stock-based
compensation.
2008 Annual Report 25
69552 Text.indd 2569552 Text.indd 25 4/8/09 10:12 AM4/8/09 10:12 AM

Gift Cards
The Company sells gift cards which can be used in stores
or on Barnes & Noble.com. The Company does not
charge administrative or dormancy fees on gift cards,
and gift cards have no expiration date. Upon the pur-
chase of a gift card, a liability is established for its cash
value. Revenue associated with gift cards is deferred
until redemption of the gift card. Over time, some
portion of the gift cards is not redeemed. The Company
estimates the portion of the gift card liability for which
the likelihood of redemption is remote based upon
the Company’s historical redemption patterns. The
Company records this amount in income on a straight-
line basis over a 12-month period beginning in the 13th
month after the month the gift card was originally sold.
If actual redemption patterns vary from the Company’s
estimates, actual gift card breakage may diff er from the
amounts recorded. The Company also sells online gift
certifi cates for use solely on Barnes & Noble.com, which
are treated the same way as gift cards.
Reclassifi cations
Certain prior-period amounts have been reclassifi ed for
comparative purposes to conform with the fi scal 2008
presentation.
Reporting Period
The Company’s fi scal year is comprised of 52 or 53
weeks, ending on the Saturday closest to the last day of
January. The reporting periods ended January 31, 2009,
February 2, 2008 and February 3, 2007 contained 52
weeks, 52 weeks and 53 weeks, respectively.
Recent Accounting Pronouncements
In September 2006, the Financial Accounting
Standards Board (FASB) issued SFAS No. 157, Fair Value
Measurements (SFAS 157). SFAS 157 provides guidance
for using fair value to measure assets and liabilities.
Under SFAS 157, fair value refers to the price that would
be received to sell an asset or paid to transfer a liability
in an orderly transaction between market participants in
the market in which the reporting entity transacts. SFAS
157 is eff ective for fi nancial statements issued for fi scal
years beginning after November 15, 2007. The Company
adopted SFAS 157 at February 3, 2008, and the adoption
had no impact on the Company’s fi nancial position,
results of operations and cash fl ows.
In February 2007, the FASB issued SFAS No. 159, The Fair
Value Option for Financial Assets and Financial Liabilities
(SFAS 159). SFAS 159 permits an entity to measure
certain fi nancial assets and fi nancial liabilities at fair
value that were not previously required to be measured
at fair value. Entities that elect the fair value option will
report unrealized gains and losses in earnings at each
subsequent reporting date. The Company has not elected
to measure any fi nancial assets and fi nancial liabilities
at fair value that were not previously required to be
measured at fair value. Therefore, the adoption of this
standard has had no impact on the Company’s fi nancial
position, results of operations and cash fl ows.
In December 2007, the FASB issued SFAS No. 160,
Noncontrolling Interest in Consolidated Financial
Statements, an amendment of ARB No. 51 (SFAS 160),
which will change the accounting and reporting for
minority interests, which will be recharacterized as
noncontrolling interests and classifi ed as a component
of equity within the consolidated balance sheets. SFAS
160 is eff ective for fi scal years beginning after December
15, 2008. Earlier adoption is prohibited and the
Company does not expect SFAS 160 to have a material
impact on its fi nancial position, results of operations
and cash fl ows.
In December 2007, the FASB issued SFAS No. 141
(revised 2007), Business Combinations (SFAS 141R).
SFAS 141R signifi cantly changes the accounting for
business combinations in a number of areas, including
the treatment of contingent consideration, preacqui-
sition contingencies, transaction costs, in-process
research and development and restructuring costs.
In addition, under SFAS 141R, changes in an acquired
entity’s deferred tax assets and uncertain tax positions
after the measurement period will impact income tax
expense. SFAS 141R is eff ective for fi scal years beginning
after December 15, 2008. This standard will change the
Company’s accounting treatment for business combi-
nations, if any, on a prospective basis, including the
treatment of any income tax adjustments related to past
acquisitions. The Company is currently evaluating the
eff ect, if any, that the adoption of SFAS 141R will have
on its fi nancial position, results of operations and cash
fl ows.
In April 2008, the FASB issued FASB Staff Position No.
FAS 142-3, Determination of the Useful Life of Intangible
Assets (FSP No. FAS 142-3), which amends the factors an
entity should consider in developing renewal or exten-
sion assumptions used in determining the useful lives
of recognized intangible assets. FSP No. FAS 142-3 is
26 Barnes & Noble, Inc. NOTES TO CONSOLIDATED FINANCIAL STATEMENTS continued
69552 Text.indd 2669552 Text.indd 26 4/8/09 10:12 AM4/8/09 10:12 AM

eff ective for fi scal years beginning after December 15,
2008. The Company is currently evaluating the eff ect,
if any, that the adoption of FSP No. FAS 142-3 will have
on its fi nancial position, results of operations and cash
fl ows.
In June 2008, the FASB issued FASB Staff Position No.
EITF 03-6-1, Determining Whether Instruments Granted
in Share-Based Payment Transactions Are Participating
Securities (FSP No. EITF 03-6-1), which classifi es
unvested share-based payment awards that contain
nonforfeitable rights to dividends or dividend equiva-
lents (whether paid or unpaid) as participating securi-
ties and requires them to be included in the computation
of earnings per share pursuant to the two-class method
described in SFAS No. 128, Earnings per Share. This Staff
Position is eff ective for fi nancial statements issued for
fi scal years beginning after December 15, 2008, and
interim periods within those years. All prior-period
earnings per share data presented are to be adjusted
retrospectively (including interim fi nancial statements,
summaries of earnings, and selected fi nancial data) to
conform with the provisions of this Staff Position, with
early application not permitted. The Company is cur-
rently evaluating the eff ect, if any, that the adoption of
FSP No. EITF 03-6-1 will have on its fi nancial position,
results of operations and cash fl ows.
2 . DISCONTINUED OPERATIONS
During the fourth quarter of fi scal 2008, the Company
committed to a plan to dispose of its approximate 74%
interest in Calendar Club. The Company subsequently
sold its interest in Calendar Club in February 2009 to
Calendar Club and its chief executive offi cer for $7,000,
which was comprised of $1,000 in cash and $6,000 in
notes. Calendar Club qualifi ed for held for sale account-
ing treatment in fi scal 2008 and was written down to its
fair value. The Company recorded a charge of $18,655
($9,675 after tax) related to the write down in fi scal
2008. The results of Calendar Club have been classifi ed
as discontinued operations in all periods presented.
The operations of Calendar Club have been segregated
from continuing operations and are refl ected as discon-
tinued operations in each period’s consolidated state-
ment of operations as follows:
FISCAL YEAR 2008 2007 2006
Sales $ 113,539 124,154 121,636Earnings (loss) from discontinued operations,net of tax $ (9,506) 888 1,341
Diluted earnings (loss) per common share from discontinued operations, net of tax $ (0.17) 0.01 0.02
FISCAL YEAR
January 31, 2009
February 2, 2008
Cash and cash equivalents $ 23,370 25,967Receivables, net 760 5,061Merchandise inventories 5,569 8,689Prepaid expenses and other current assets 500 534Current assets of discontinued operations 30,199 40,251Net property and equipment 3,813 10,739Goodwill — 12,656Other noncurrent assets 4,508 5,230Noncurrent assets of discontinued operations 8,321 28,625Accounts payable 16,028 23,002Accrued liabilities 2,779 10,442Current liabilities of discontinued operations 18,807 33,444Noncurrent liabilities of discontinued operations 12,713 13,769Net assets of discontinued operations $ 7,000 21,663
3 . STOCK-BASED COMPENSATION
The Company has share-based awards outstanding
under its 1996 Incentive Plan (the 1996 Plan) and its
2004 Incentive Plan (the 2004 Plan). Stock options
granted and outstanding under each of the plans
generally begin vesting in one year in 33-1/3% or 25%
increments per year, expire 10 years from issuance and
are conditioned upon continued employment during the
vesting period.
The 2004 Plan allows the Company to grant options
to purchase up to 8,376,562 shares of common stock.
Restricted stock awards are counted against this limit as
two shares for every one share granted.
2008 Annual Report 27
69552 Text.indd 2769552 Text.indd 27 4/8/09 10:12 AM4/8/09 10:12 AM

A restricted stock award is an award of common shares
that is subject to certain restrictions during a speci-
fi ed period. Restricted stock awards are independent of
option grants and are generally subject to forfeiture if
employment terminates prior to the release of the restric-
tions. The grantee cannot transfer the shares before the
restricted shares vest. Shares of nonvested restricted
stock have the same voting rights as common stock, are
entitled to receive dividends and other distributions
thereon and are considered to be currently issued and
outstanding. Restricted stock awards vest over a period of
one to fi ve years. The Company expenses the cost of the
restricted stock awards, which is determined to be the fair
market value of the shares at the date of grant, straight-
line over the period during which the restrictions lapse.
For these purposes, the fair market value of the restricted
stock is determined based on the closing price of the
Company’s common stock on the grant date.
The Company uses the Black-Scholes option-pricing
model to value the Company’s stock options for each stock
option award. Using this option-pricing model, the fair
value of each stock option award is estimated on the date
of grant. The fair value of the Company’s stock option
awards, which are generally subject to pro-rata vesting
annually over four years, is expensed on a straight-line
basis over the vesting period of the stock options. The
expected volatility assumption is based on traded options
volatility of the Company’s stock over a term equal to the
expected term of the option granted. The expected term
of stock option awards granted is derived from historical
exercise experience under the Company’s stock option
plans and represents the period of time that stock option
awards granted are expected to be outstanding. The
expected term assumption incorporates the contractual
term of an option grant, which is ten years, as well as the
vesting period of an award, which is generally pro-rata
vesting annually over four years. The risk-free inter-
est rate is based on the implied yield on a U.S. Treasury
constant maturity with a remaining term equal to the
expected term of the option granted.
The Company recognizes stock-based compensation
costs, net of estimated forfeitures, for only those shares
expected to vest on a straight-line basis over the requisite
service period of the award. The Company estimated the
forfeiture rates for fi scal 2008, 2007 and 2006 based on
its historical experience.
The weighted average assumptions relating to the
valuation of the Company’s stock options for fi scal years
2008, 2007 and 2006 were as follows:
FISCAL YEAR 2008 2007 2006
Weighted average fair value of grants $ 7.52 $ 11.61 $ 11.10
Volatility 65.36% 28.00% 30.22%
Risk-free interest rate 1.43% 4.59% 4.91%
Expected life .94 years 5 years 5 years
Expected dividend yield 3.54% 1.47% 1.63%
Stock-Based Compensation Activity
The following table presents a summary of the Company’s stock options activity:
NUMBER OFSHARES
(in thousands)WEIGHTED AVERAGE
EXERCISE PRICE
WEIGHTED AVERAGEREMAINING
CONTRACTUAL TERM
AGGREGATEINTRINSIC VALUE
(in thousands)
Balance, January 28, 2006 9,769 $ 18.62 6.61 years $ 224,067
Granted 45 36.94Exercised (1,177) 16.90Forfeited (132) 17.55Balance, February 3, 2007 8,505 18.97 5.64 years $ 182,557
Granted 20 40.70Exercised (1,852) 16.84Forfeited (91) 22.58Balance, February 2, 2008 6,582 20.19 4.98 years $ 91,597
Granted 289 23.19Exercised (488) 19.79Forfeited (416) 23.88Balance, January 31, 2009 5,967 $ 20.11 4.03 years $ 3,557
Vested and expected to vest in the future at January 31, 2009 5,967 $ 20.11 4.03 years $ 3,557
Exercisable at January 31, 2009 5,883 $ 19.90 4.00 years $ 3,557
Available for grant at January 31, 2009 1,832
28 Barnes & Noble, Inc. NOTES TO CONSOLIDATED FINANCIAL STATEMENTS continued
69552 Text.indd 2869552 Text.indd 28 4/8/09 10:12 AM4/8/09 10:12 AM

The aggregate intrinsic value in the table above rep-
resents the total pretax intrinsic value (the diff erence
between the Company’s closing stock price on the last
trading day of the related fi scal year and the exercise
price, multiplied by the related in-the-money options)
that would have been received by the option holders had
they exercised their options at the end of the fi scal year.
This amount changes based on the market value of the
Company’s common stock. The amount as of February 3,
2007 has been reduced by $2,643 due to the increase in
price of certain options resulting from the stock option
review discussed below. Total intrinsic value of options
exercised for fi scal 2008, 2007 and 2006 (based on the
diff erence between the Company’s stock price on the
exercise date and the respective exercise price, multi-
plied by the number of options exercised) was $3,997,
$43,649 and $30,029, respectively.
As of January 31, 2009, there was $248 of total unrecog-
nized compensation expense related to unvested stock
options granted under the Company’s share-based
compensation plans. That expense is expected to be
recognized over a weighted average period of 0.2 years.
The following table presents a summary of the
Company’s restricted stock activity:
NUMBER OF SHARES
(in thousands)
WEIGHTED AVERAGE GRANT DATE FAIR VALUE
Balance, January 28, 2006 452 $ 33.60
Granted 479 45.85
Vested (124) 33.52
Forfeited (40) 38.94
Balance, February 3, 2007 767 40.97
Granted 539 40.01
Vested (236) 39.83
Forfeited (44) 40.87
Balance, February 2, 2008 1,026 40.74
Granted 991 28.27
Vested (431) 39.27
Forfeited (135) 31.13
Balance, January 31, 2009 1,451 $ 33.55
Total fair value of shares of restricted stock that vested
during fi scal 2008, 2007 and 2006 was $12,108, $9,108
and $5,666, respectively. As of January 31, 2009, there
was $37,111 of unrecognized stock-based compensation
expense related to nonvested restricted stock awards.
That cost is expected to be recognized over a weighted
average period of 2.8 years.
For fi scal 2008, 2007 and 2006, stock-based com-
pensation expense of $20,549, $17,168 and $17,146,
respectively, is included in selling and administrative
expenses.
Stock Option Review
In July 2006, the Company created a Special Committee
of the Board of Directors, consisting of Patricia Higgins,
to review all of the stock option grants by the Company
and the Company’s wholly-owned subsidiary, Barnes
& Noble.com, during the period from 1996 through
2006 and engaged independent outside counsel and an
independent forensic auditor to assist in this matter. On
April 2, 2007, the Special Committee presented its fi nd-
ings and recommendations to the Company’s Board of
Directors, as reported in the Company’s Form 8-K fi led
April 4, 2007. The Special Committee indicated that the
Committee and its advisors received the Company’s full
cooperation throughout its investigation.
Among other fi ndings, the Special Committee deter-
mined that there were numerous instances of stock
option grants for which there was an improper mea-
surement of compensation expense under Accounting
Principles Board Opinion No. 25, Accounting for Stock
Issued to Employees (APB 25). Although the Special
Committee determined that there were instances of
stock options having been dated using favorable dates
that were selected with the benefi t of hindsight and that
serious mistakes were made, the Special Committee did
not fi nd any intent to defraud or fraudulent misconduct
by any individual or group of individuals. The Special
Committee found that the Company’s dating and pricing
practice for stock options was applied uniformly by
Company personnel to stock options granted and was
not used selectively to benefi t any one group or indi-
vidual within the Company. The Company has evaluated
these fi ndings and agrees with the Special Committee.
The Company has concluded, however, that the charges
are not material to the fi nancial statements in any of
the periods to which such charges relate and therefore
will not restate its historic fi nancial statements. The
Company recorded an adjustment of $411 ($246 after
tax) to increase non-cash compensation expense in the
fourth quarter of fi scal 2006 to correctly present com-
pensation expense for fi scal 2006. In accordance with
Staff Accounting Bulletin (SAB)
2008 Annual Report 29
69552 Text.indd 2969552 Text.indd 29 4/8/09 10:12 AM4/8/09 10:12 AM

No. 108, Considering the Eff ects of Prior Year Misstatements
when Quantifying Misstatements in Current Year Financial
Statements, the Company also recorded an adjustment
to decrease retained earnings by $22,807, increase
deferred taxes by $5,911 and increase additional paid-in
capital by $28,719, to correct the consolidated balance
sheet for the cumulative impact of the misstated com-
pensation cost in periods prior to fi scal 2006.
In December 2006, the Board members and all Section
16 offi cers holding options unvested as of December
31, 2004 voluntarily agreed to reprice such options,
upon a fi nding by the Special Committee that such
options were improperly priced, to an exercise price
determined to be the appropriate fair market value by
the Special Committee. The Special Committee recom-
mended that all incorrectly dated and unexercised stock
options issued to Section 16 offi cers and directors of
the Company, other than hiring grants, be re-priced to
refl ect the greater of the original grant price or the price
appropriate to the measurement date as determined by
the Special Committee. The Board members and Section
16 offi cers did not receive any cash payments to com-
pensate them for their voluntary agreements to reprice
such options. The total diff erence in exercise price as a
result of the re-pricing of these unexercised options was
approximately $2,643.
Consistent with the Special Committee’s recommenda-
tion that all incorrectly dated and unexercised options
issued to Section 16 offi cers be re-priced, the Section
16 offi cers voluntarily agreed to repay to the Company
for options granted while they were Section 16 offi cers
an amount equal to the diff erence in the price at which
the stock options were exercised and the price at which
the Special Committee believes the stock options should
have been priced, net of any allocable portion of income
taxes paid in connection with such exercise. The total
amount voluntarily repaid to the Company by Section 16
offi cers was approximately $1,981, prior to any allocable
portion of income taxes paid in connection with such
exercise, which was recorded as an increase to addi-
tional paid in capital upon receipt.
Incorrectly dated options that vested after December 31,
2004 and were exercised in 2006 were subject to penalty
taxes under Section 409A of the Internal Revenue
Code. The Company reimbursed Section 16 offi cers
who voluntarily repaid the Company and were subject
to these penalty taxes. The Board approved payment to
such executives who were subject to Section 409A taxes
in connection with exercised options in an amount equal
to the cost of the Section 409A penalty tax, any interest
or penalties, plus an amount to off set the associated
income tax consequences of the reimbursement pay-
ments. In reaching this decision, the Board took into
consideration, among other factors, the fact that the
applicable taxes under Section 409A far exceeded the
amount of any possible enrichment to such offi cers as
a result of improper grant dating and the agreement by
such offi cers to repay the amount of any enrichment as
a result of the improper dating. The aggregate payments
to such offi cers, including the gross-up amounts, were
$1,194.
Additionally, the Company made payments on behalf of
option holders who were not Section 16 offi cers, for any
Section 409A tax liability due to the exercise of incor-
rectly dated options in 2006. These payments, including
gross-up payments, were $1,216.
The Company implemented a program for employees
who were not Section 16 offi cers to amend incorrectly
dated options that vested after December 31, 2004 so
as to increase the exercise price to the trading price
on the correct measurement date determined by the
Special Committee. In addition, the Company paid such
employees whose options were repriced cash bonuses in
the amount of the diff erence. The aggregate amount paid
by the Company as cash bonuses under this program was
$1,389, which was paid in January 2008 to comply with
applicable tax laws.
4 . RECEIVABLES, NET
Receivables represent customer, credit/debit card,
advertising, landlord and other receivables due within
one year as follows:
JANUARY 31, 2009
FEBRUARY 2, 2008
Credit/debit card receivablesa $ 36,311 35,878
Trade accounts 15,429 18,511
Advertising 13,842 11,616
Receivables from landlordsfor leasehold improvements 10,576 33,281
Other receivables 4,840 7,851
Total receivables, net $ 80,998 107,137
a Credit/debit card receivables consist of receivables from credit/debit card companies. The Company assumes no customer credit risk for these receivables.
30 Barnes & Noble, Inc. NOTES TO CONSOLIDATED FINANCIAL STATEMENTS continued
69552 Text.indd 3069552 Text.indd 30 4/8/09 10:12 AM4/8/09 10:12 AM

5 . DEBT
The Company has an $850,000 revolving credit facil-
ity dated as of June 17, 2005, as amended and restated
on August 2, 2006 (Revolving Credit Facility). The
Revolving Credit Facility has a maturity date of July 31,
2011 and may be increased to $1,000,000 under cer-
tain circumstances at the option of the Company. The
Revolving Credit Facility has an applicable margin that
is applied to loans and standby letters of credit ranging
from 0.500% to 1.000% above the stated Eurodollar
rate. A fee is paid on commercial letters of credit rang-
ing from 0.2500% to 0.5000%. In addition, a commit-
ment fee ranging from 0.100% to 0.200% is paid on the
unused portion of the Revolving Credit Facility. In each
case, the applicable rate is based on the Company’s con-
solidated fi xed charge coverage ratio. Proceeds from the
Revolving Credit Facility are used for general corporate
purposes, including seasonal working capital needs.
Selected information related to the Company’s Revolving
Credit Facility:
Fiscal Year 2008 2007 2006
Revolving credit facility at year end $ — — —
Average balance outstanding during the year $ 63,871 1,392 23,337
Maximum borrowings outstanding during the year $ 199,900 37,600 91,800
Weighted average interest rate during the yeara 6.05% 173.16% 15.40%
Interest rate at end of year — — —
a The fi scal 2007 and 2006 interest rates are higher than the fi scal 2008 interest rate due to the lower average borrowings and the fi xed nature of the amortization of the deferred fi nancing fees and commitment fees. Excluding the deferred fi nancing fees and the commitment fees in fi scal 2007 and 2006, the weighted average interest rate was 7.51% and 7.70%, respectively.
Fees expensed with respect to the unused portion of the
Revolving Credit Facility were $956, $1,034 and $1,275,
during fi scal 2008, 2007 and 2006, respectively.
The Company has no agreements to maintain compen-
sating balances.
6 . FAIR VALUES OF FINANCIAL INSTRUMENTS
The carrying values of cash and cash equivalents
reported in the accompanying consolidated balance
sheets approximate fair value due to the short-term
maturities of these assets. The aggregate fair value of
the Revolving Credit Facility approximates its carrying
amount because of its recent and frequent repricing
based upon market conditions.
7 . NET EARNINGS PER SHARE
Following is a reconciliation of earnings from continu-
ing operations and weighted average common shares
outstanding for purposes of calculating basic and diluted
earnings per share:
FISCAL YEAR 2008 2007 2006
NUMERATOR:
Earnings from continuing operations $ 85,426 134,911 149,186
DENOMINATOR:
Basic weighted average common shares outstanding 55,207 63,662 65,212
Dilutive effect of stock awards 2,120 3,388 4,014
Diluted outstanding shares 57,327 67,050 69,226
EARNINGS FROM CONTINUING OPERATIONS
Basic $ 1.55 2.12 2.29
Diluted $ 1.49 2.01 2.16
8 . EMPLOYEES’ RETIREMENT AND DEFINED CONTRIBUTION PLANS
As of December 31, 1999, substantially all employees
of the Company were covered under a noncontributory
defi ned benefi t pension plan (the Pension Plan). As
of January 1, 2000, the Pension Plan was amended so
that employees no longer earn benefi ts for subsequent
service. Eff ective December 31, 2004, the Barnes &
Noble.com Employees’ Retirement Plan (the B&N.com
Retirement Plan) was merged with the Pension Plan.
Substantially all employees of Barnes & Noble.com were
covered under the B&N.com Retirement Plan. As of July
1, 2000, the B&N.com Retirement Plan was amended so
that employees no longer earn benefi ts for subsequent
service. Subsequent service continues to be the basis for
vesting of benefi ts not yet vested at December 31, 1999
and June 30, 2000 for the Pension Plan and the B&N.
com Retirement Plan, respectively, and the Pension
Plan will continue to hold assets and pay benefi ts. The
actuarial assumptions used to calculate pension costs are
2008 Annual Report 31
69552 Text.indd 3169552 Text.indd 31 4/8/09 10:12 AM4/8/09 10:12 AM

reviewed annually. Pension expense was $1,301, $576
and $645 for fi scal 2008, 2007 and 2006, respectively.
The Company maintains a defi ned contribution plan
(the Savings Plan) for the benefi t of substantially all
employees. Total Company contributions charged to
employee benefi t expenses for the Savings Plan were
$11,645, $10,699 and $10,243 during fi scal 2008, 2007
and 2006, respectively. In addition, the Company
provides certain health care and life insurance benefi ts
(the Postretirement Plan) to retired employees, limited
to those receiving benefi ts or retired as of April 1, 1993.
Total Company contributions charged to employee
benefi t expenses for the Postretirement Plan were
$210, $199 and $183 during fi scal 2008, 2007 and 2006,
respectively.
9 . INCOME TAXES
The Company fi les a consolidated federal return with
all subsidiaries owned 80% or more. Federal and state
income tax provisions (benefi ts) for fi scal 2008, 2007
and 2006 are as follows:
FISCAL YEAR 2008 2007 2006
CURRENT:
Federal $ 44,038 50,325 83,377
State 11,983 12,705 15,754
Total current 56,021 63,030 99,131
DEFERRED:
Federal 2,540 10,687 703
State (2,970) 906 665
Total deferred (430) 11,593 1,368
Total $ 55,591 74,623 100,499
Reconciliation between the eff ective income tax rate and
the federal statutory income tax rate is as follows:
FISCAL YEAR 2008 2007 2006
Federal statutory income tax rate 35.00% 35.00% 35.00%
State income taxes, net of federal income tax benefi t 4.31 4.20 4.26
Expiration of statuteof limitations (0.23) (4.90) —
Other, net 0.35 1.31 0.99
Effective income tax rate 39.43% 35.61% 40.25%
The tax eff ects of temporary diff erences that give rise to
signifi cant components of the Company’s deferred tax
assets and liabilities as of January 31, 2009 and February
2, 2008 are as follows:
JANUARY 31, 2009
FEBRUARY 2, 2008
DEFERRED TAX LIABILITIES:
Investment in Barnes & Noble.com $ (94,843) (94,784)
Depreciation (63,224) (47,201)
Goodwill and intangible asset amortization (29,703) (25,454)
Prepaid expenses (5,927) (5,945)
Other (1,499) (6,057)
Total deferred tax liabilities (195,196) (179,441)
DEFERRED TAX ASSETS:
Loss carryover 42,907 43,948
Lease transactions 41,285 35,745
Estimated accruals 41,098 30,145
Stock-based compensation 14,375 13,343
Insurance liability 9,697 9,541
Pension 9,400 7,471
Inventory 7,584 7,978
Investments in equity securities 2,132 2,126
Total deferred tax assets $ 168,478 150,297
Net deferred tax liabilities $ (26,718) (29,144)
BALANCE SHEET CAPTION REPORTED IN:
Prepaid expenses and other current assets $ 58,380 47,664
Deferred taxes (assets) 110,098 102,633
Accrued liabilities (5,928) (5,945)
Deferred taxes (liabilities) (189,268) (173,496)
Net deferred tax liabilities $ (26,718) (29,144)
At January 31, 2009, the Company had federal and state
net operating loss carryforwards (NOLs) of approxi-
mately $93,000 that expire beginning in 2018 through
2022, the utilization of which is limited to approximately
$6,700 on an annual basis. These NOLs account for
$36,722 of the $42,907 of loss carryover deferred tax
assets at January 31, 2009, with the remainder relating
primarily to other state NOLs.
32 Barnes & Noble, Inc. NOTES TO CONSOLIDATED FINANCIAL STATEMENTS continued
69552 Text.indd 3269552 Text.indd 32 4/8/09 10:12 AM4/8/09 10:12 AM

In July 2006, the Financial Accounting Standards Board
issued FASB Interpretation No. 48, Accounting for
Uncertainty in Income Taxes (FIN 48). FIN 48 clarifi es
the accounting for uncertain income tax positions that
are recognized in a company’s fi nancial statements in
accordance with the provisions of FASB Statement No.
109, Accounting for Income Taxes (SFAS 109). FIN 48 also
provides guidance on the derecognition of uncertain
positions, fi nancial statement classifi cation, account-
ing for interest and penalties, accounting for interim
periods and new disclosure requirements. FIN 48 is
eff ective for fi scal years beginning after December 15,
2006.
The Company adopted FIN 48 as of February 4, 2007.
The adoption of FIN 48 did not result in any adjustments
to the Company’s reserves for uncertain tax positions.
As of January 31, 2009, the Company had $23,833 of
unrecognized tax benefi ts, all of which, if recognized,
would aff ect the Company’s eff ective tax rate. A recon-
ciliation of the beginning and ending amount of unrec-
ognized tax benefi ts for fi scal 2007 and fi scal 2008 is as
follows:
Balance at February 3, 2007 $ 23,155
Additions for tax positions of the current period 853
Additions for tax positions of prior periods 7,022
Expiration of statute of limitations (10,294)
Settlements paid during the current period (1,303)
Other reductions for tax positions of prior periods (487)
Balance at February 2, 2008 $ 18,946
Additions for tax positions of the current period 455
Additions for tax positions of prior periods 5,000
Expiration of statute of limitations (329)
Settlements paid during the current period (55)
Other reductions for tax positions of prior periods (184)
Balance at January 31, 2009 $ 23,833
The Company’s continuing practice is to recognize
interest and penalties related to income tax matters
in income tax expense. As of January 31, 2009, the
Company had accrued $6,349 for interest and penalties,
which is included in the $23,833 of unrecognized tax
benefi ts noted above. The Company recognized $2,482
in income tax expense for interest and penalties in its
fi scal 2008 statement of operations.
The Company is subject to U.S. federal income tax as
well as income tax in jurisdictions of each state having an
income tax. The tax years that remain subject to examina-
tion are primarily fi scal 2004 through fi scal 2008. Some
earlier years remain open for a small minority of states.
Prior to fi scal 2006, the Company had a fi scal tax year
ending in October.
2008 Annual Report 33
69552 Text.indd 3369552 Text.indd 33 4/8/09 10:12 AM4/8/09 10:12 AM

10 . OTHER COMPREHENSIVE EARNINGS (LOSS) , NET OF TAX
Comprehensive earnings are net earnings, plus certain other items that are recorded directly to shareholders’ equity, as
follows:
FISCAL YEAR 2008 2007 2006
Net earnings $ 75,920 135,799 150,527
OTHER COMPREHENSIVE EARNINGS (LOSS), NET OF TAX:
Foreign currency translation adjustments (3,352) 73 843
Decrease (increase) in minimum pension liability (net of deferred tax expense (benefi t) of ($1,048), ($1,674) and $788, respectively) (1,628) (2,510) 1,156
Total comprehensive earnings $ 70,940 133,362 152,526
The components of Accumulated Other Comprehensive Loss are as follows:
FOREIGN CURRENCY TRANSLATION
MINIMUM PENSION LIABILITY
ACCUMULATED OTHER COMPREHENSIVE LOSS
Balance at January 28, 2006 $ (180) (8,905) $ (9,085)
Change during period 843 1,156 1,999
Balance at February 3, 2007 663 (7,749) (7,086)
Change during period 73 (2,510) (2,437)
Balance at February 2, 2008 736 (10,259) (9,523)
Change during period (3,352) (1,628) (4,980)
Balance at January 31, 2009 $ (2,616) (11,887) $ (14,503)
11 . CHANGES IN INTANGIBLE ASSETS AND GOODWILL
AS OF JANUARY 31, 2009
AMORTIZABLE INTANGIBLE ASSETSGROSS CARRYING
AMOUNTACCUMULATED AMORTIZATION TOTAL
Author contracts $ 18,461 (11,045) $ 7,416
Distribution contracts 8,325 (2,894) 5,431
D&O Insurance 3,202 (2,486) 716
$ 29,988 (16,425) $ 13,563
UNAMORTIZABLE INTANGIBLE ASSETS
Trade name $ 48,400
Copyrights 144
Publishing contracts 21,336
$ 69,880
34 Barnes & Noble, Inc. NOTES TO CONSOLIDATED FINANCIAL STATEMENTS continued
69552 Text.indd 3469552 Text.indd 34 4/8/09 10:12 AM4/8/09 10:12 AM

Author contracts, distribution contracts and D&O
insurance are generally being amortized over 10 years,
10 years and 6 years, respectively.
AGGREGATE AMORTIZATION EXPENSE:
For the 52 weeks ended January 31, 2009 $ 4,563
Estimated Amortization Expense:
(12 months ending on or about January 31)
2010 $ 3,009
2011 $ 2,650
2012 $ 2,473
2013 $ 2,473
2014 $ 2,456
The changes in the carrying amount of goodwill for the
52 weeks ended January 31, 2009 are as follows:
Balance as of February 2, 2008 (as previously reported) $ 255,290
Discontinued operations (See Note 2) (12,657)
Balance as of February 2, 2008 $ 242,633
Goodwill acquired (See Note 12) 1,803
Benefi t of excess tax amortizationa (4,428)
Balance as of January 31, 2009 $ 240,008
a The tax basis of goodwill arising from an acquisition in fi scal 2004 exceeded the related basis for fi nancial reporting purposes by approximately $96,576. In accordance with SFAS 109, the Company is recognizing the tax benefi ts of amortizing such excess as a reduction of goodwill as it is realized on the Company’s income tax return.
12 . OTHER ACQUISITIONS
Sterling Publishing entered into a joint venture in Begin
Smart LLC, acquiring a 50% interest to develop, sell,
and distribute books for infants, toddlers, and chil-
dren under the brand name BEGIN SMART™. In fi scal
2008, the Company determined that Begin Smart LLC
should be consolidated under the provisions of FASB
Interpretation No. 46, Consolidation of Variable Interest Entities, an Interpretation of ARB No. 51, as revised and,
accordingly, the results of operations for the period
subsequent to the acquisition are included in the con-
solidated fi nancial statements. The operating results of
Begin Smart LLC are immaterial to the Company.
13 . SHAREHOLDERS’ EQUITY
On September 15, 2005, the Company’s Board of
Directors authorized a stock repurchase program for the
purchase of up to $200,000 of the Company’s common
stock. The Company completed this $200,000 repur-
chase program during the third quarter of fi scal 2007.
On May 15, 2007, the Company’s Board of Directors
authorized a new stock repurchase program for the
purchase of up to $400,000 of the Company’s common
stock. The maximum dollar value of common stock
that may yet be purchased under the current program
is approximately $2,471 as of January 31, 2009. Stock
repurchases under this program may be made through
open market and privately negotiated transactions from
time to time and in such amounts as management deems
appropriate. As of January 31, 2009, the Company has
repurchased 33,065,712 shares at a cost of approximately
$1,047,529 under its stock repurchase programs. The
repurchased shares are held in treasury.
14 . COMMITMENTS AND CONTINGENCIES
The Company leases retail stores, warehouse facilities,
offi ce space and equipment. Substantially all of the
retail stores are leased under noncancelable agreements
which expire at various dates through 2036 with various
renewal options for additional periods. The agreements,
which have been classifi ed as operating leases, generally
provide for both minimum and percentage rentals and
require the Company to pay insurance, taxes and other
maintenance costs. Percentage rentals are based on
sales performance in excess of specifi ed minimums at
various stores.
Rental expense under operating leases is as follows:
FISCAL YEAR 2008 2007 2006
Minimum rentals $ 310,967 302,060 299,022
Percentage rentals 4,380 6,932 7,171
$ 315,347 308,992 306,193
Future minimum annual rentals, excluding percentage
rentals, required under leases that had initial, noncan-
celable lease terms greater than one year, as of January
31, 2009 are:
FISCAL YEARa
2009 $ 362,714
2010 332,304
2011 279,293
2012 231,226
2013 190,087
After 2013 566,221
$ 1,961,845
a Excludes future minimum annual rentals for Calendar Club of $2,754, $2,339, $2,387, $1,909, $1,438 and $488 for fi scal years 2009, 2010, 2011, 2012, 2013 and after 2013, respectively.
2008 Annual Report 35
69552 Text.indd 3569552 Text.indd 35 4/10/09 11:57 AM4/10/09 11:57 AM

The Company provides for minimum rent expense over
the lease terms (including the build-out period) on a
straight-line basis. The excess of such rent expense
over actual lease payments (net of tenant allowances) is
refl ected primarily in other long-term liabilities in the
accompanying balance sheets.
On June 26, 2008, the Company exercised its purchase
option under a lease on one of its distribution facilities
located in South Brunswick, New Jersey from the New
Jersey Economic Development Authority. Under the
terms of the lease expiring in June 2011, the Company
purchased the distribution facility and equipment for
approximately $21,000.
15 . SEGMENT REPORTING
The Company has determined that it has one operat-
ing segment: bookselling. This evaluation was made in
accordance with SFAS 131, Disclosures about Segments
of an Enterprise and Related Information (SFAS 131),
and took into account the Company’s determination
that it operates in one business segment was based on
application of the criteria in paragraph 10 of SFAS 131.
The Company’s evaluation includes the identifi cation of
operating segments by considering the way the busi-
ness is managed (focusing on the fi nancial informa-
tion distributed) and the manner in which the chief
operating decision maker interacts with other members
of management. The bookselling segment has as its
principal business the sale of trade books, mass market
paperbacks, children’s books, bargain books, magazines,
music, movies, calendars, games, café products and
services, and gift items directly to customers. Most of
these products are sourced by third parties while some
are sourced through the Company’s own publishing
activities. These product sales collectively account for
substantially all of the Company’s sales. Operating seg-
ments for the Company have not been aggregated.
16 . LEGAL PROCEEDINGS
The Company is involved in a variety of claims, suits,
investigations and proceedings that arise from time to
time in the ordinary course of its business, including
actions with respect to contracts, intellectual property,
taxation, employment, benefi ts, securities, personal
injuries and other matters. The results of these proceed-
ings in the ordinary course of business are not expected
to have a material adverse eff ect on the Company’s
consolidated fi nancial position or results of operations.
The following is a discussion of the material legal mat-
ters involving the Company.
In re Barnes & Noble, Inc. Derivative LitigationIn July and August 2006, four putative stockholder
derivative actions were fi led in New York County
Supreme Court against certain members of the
Company’s Board of Directors and certain current
and former executive offi cers of the Company, alleg-
ing breach of fi duciary duty and unjust enrichment in
connection with the grant of certain stock options to
certain executive offi cers and directors of the Company.
These actions were subsequently consolidated under
the caption In re Barnes & Noble, Inc. Derivative Litigation
(the State Derivative Action). In September 2006, three
putative stockholder derivative actions were fi led in the
United States District Court for the Southern District
of New York naming the directors of the Company and
certain current and former executive offi cers as defen-
dants and alleging that the defendants backdated certain
stock option grants to executive offi cers and caused the
Company to fi le false or misleading fi nancial disclosures
and proxy statements. These actions were subsequently
consolidated under the caption In re Barnes & Noble, Inc.
Shareholders Derivative Litigation (the Federal Derivative
Action).
On September 6, 2007, the parties in the State Derivative
Action and in the Federal Derivative Action signed
a Stipulation of Compromise and Settlement (the
Settlement Agreement) with respect to these matters.
In entering into the Settlement Agreement, neither the
Company nor any of the named defendants admitted
to any liability or wrongdoing. Under the terms of the
Settlement Agreement, the Company agreed to institute
certain corporate governance and internal control mea-
sures and to pay plaintiff s’ attorneys’ fees and expenses
in the total amount of $2,750.
On May 5, 2008, the New York Supreme Court granted
fi nal approval to the Settlement Agreement in the State
Derivative Action, and on May 7, 2008, entered fi nal
judgment dismissing all of the state derivative claims
with prejudice. Pursuant to the terms of the Settlement
Agreement, the parties then jointly applied to the United
States District Court to dismiss all of the claims in the
Federal Derivative Action with prejudice, and on May
36 Barnes & Noble, Inc. NOTES TO CONSOLIDATED FINANCIAL STATEMENTS continued
69552 Text.indd 3669552 Text.indd 36 4/8/09 10:12 AM4/8/09 10:12 AM
16, 2008, the District Court entered an order doing so.
The time to fi le notices of appeal in the State Derivative
Action and the Federal Derivative Action expired in June
2008, and no such notices were fi led.
In re Initial Public Offering Securities LitigationThe class action lawsuit In re Initial Public Off ering
Securities Litigation fi led in the United States District
Court for the Southern District of New York in April
2002 (the Action) named over 1,000 individuals and 300
corporations, including Fatbrain.com, LLC, a former
subsidiary of Barnes & Noble.com (Fatbrain), and its
former offi cers and directors. The amended complaints
in the Action all allege that the initial public off ering
registration statements fi led by the defendant issu-
ers with the SEC, including the one fi led by Fatbrain,
were false and misleading because they failed to dis-
close that the defendant underwriters were receiving
excess compensation in the form of profi t sharing with
certain of its customers and that some of those custom-
ers agreed to buy additional shares of the defendant
issuers’ common stock in the after market at increasing
prices. The amended complaints also allege that the
foregoing constitute violations of: (i) Section 11 of the
Securities Act of 1933, as amended (Securities Act), by
the defendant issuers, the directors and offi cers signing
the related registration statements, and the related
underwriters; (ii) Rule 10b-5 promulgated under the
Securities Exchange Act of 1934, as amended (Exchange
Act), by the same parties; and (iii) the control person
provisions of the Securities Act and Exchange Act by
certain directors and offi cers of the defendant issuers.
A motion to dismiss by the defendant issuers, including
Fatbrain, was denied.
After extensive negotiations among representatives
of plaintiff s and defendants, the parties entered into
a memorandum of understanding (MOU), outlin-
ing a proposed settlement resolving the claims in the
Action between plaintiff s and the defendant issuers.
Subsequently a settlement agreement was executed
between the defendants and plaintiff s in the Action, the
terms of which are consistent with the MOU. The settle-
ment agreement was submitted to the court for approval
and on February 15, 2005, the judge granted preliminary
approval of the settlement.
On December 5, 2006, the federal appeals court for the
Second Circuit issued a decision reversing the District
Court’s class certifi cation decision in six focus cases.
In light of that decision, the District Court stayed all
proceedings, including consideration of the settle-
ment. Plaintiff s then fi led, in January 2007, a Petition
for Rehearing En Banc before the Second Circuit, which
was denied in April 2007. On May 30, 2007, plaintiff s
moved, before the District Court, to certify a new class.
On June 25, 2007, the District Court entered an order
terminating the settlement agreement. On October 2,
2008, plaintiff s agreed to withdraw the class certifi ca-
tion motion. On October 10, 2008, the District Court
signed an order granting the request.
An agreement in principle has now been negotiated
among counsel for all of the issuers, plaintiff s, insur-
ers and underwriters, which has been executed by the
Company and remains subject to court approval. If
the proposed settlement is approved, no settlement
payment will be made by the Company. If the proposed
settlement is not approved, the Company intends to
vigorously defend this lawsuit.
Barnesandnoble.com LLC v. Yee, et al.On December 21, 2007, Barnes & Noble.com fi led a
complaint in the United States District Court for the
Eastern District of California for declaratory and injunc-
tive relief against the members of the California Board
of Equalization (the BOE) and others. The complaint
sought a declaration that the actions of the State of
California in seeking to impose California sales and use
tax on the sales of Barnes & Noble.com for the period
of May 1, 2000 through March 31, 2004 in the amount
of approximately $17,000, plus interest and penalties,
violate the Commerce Clause and the First Amendment
of the United States Constitution, as well as the
California Administrative Procedures Act. This assess-
ment was also the subject of an administrative protest
fi led by Barnes & Noble.com. Barnes & Noble.com was
also challenging another earlier assessment by the BOE
in the amount of approximately $700, plus interest and
penalties, for the period of November 15, 1999 through
January 31, 2000. This earlier assessment was struck
down by a decision of the California Superior Court on
September 7, 2007 in favor of Barnes & Noble.com, and
the BOE fi led an appeal in the California Court of Appeal
(First District).
On May 29, 2008, the BOE approved a global settlement
with Barnes & Noble.com resolving all disputes between
2008 Annual Report 37
69552 Text.indd 3769552 Text.indd 37 4/8/09 10:12 AM4/8/09 10:12 AM
Barnes & Noble.com and the State of California for sales
and use taxes, including the pending litigation in the
United States District Court for the Eastern District
of California and the California Court of Appeal (First
District). Under the settlement, the two tax determina-
tions against Barnes & Noble.com in the total amount of
approximately $17,700, plus all interest and penalties,
were canceled by the BOE. In addition, the BOE waived
all claims for sales and use taxes, interest, and penalties
through November 1, 2005, the date on which Barnes
& Noble.com voluntarily commenced collecting and
remitting sales and use taxes to the State of California. A
fi nal settlement agreement was entered into by the par-
ties on August 19, 2008. In connection with the settle-
ment, Barnes & Noble.com paid the State of California
$8,302 on August 28, 2008.
Hostetter v. Barnes & Noble Booksellers, Inc. et al.On December 4, 2008, a purported class action com-
plaint was fi led against Barnes & Noble Booksellers, Inc.
in the Superior Court for the State of California making
the following allegations against defendants with respect
to hourly managers and/or assistant managers at Barnes
& Noble stores located in the State of California: (1)
failure to pay wages and overtime; (2) failure to provide
meal and/or rest breaks; (3) waiting time penalties;
and (4) unfair competition. The complaint contains no
allegations concerning the number of any such alleged
violations or the amount of recovery sought on behalf the
purported class. On March 4, 2009, Barnes and Noble
fi led an answer denying all claims. On March 5, 2009,
Barnes and Noble removed this matter to federal court.
17 . CERTAIN RELATIONSHIPS AND RELATED TRANSACTIONS
The Company believes that the transactions and agree-
ments discussed below (including renewals of any
existing agreements) between the Company and related
third parties are at least as favorable to the Company
as could have been obtained from unrelated parties at
the time they were entered into. The Audit Committee
of the Board of Directors is designated to approve in
advance any new proposed transaction or agreement
(including amendments of any existing agreements)
with related parties and utilizes procedures in evaluating
the terms and provisions of such proposed transaction
or agreements as are appropriate in accordance with
the fi duciary duties of directors under Delaware law. In
addition, management annually analyzes all existing
related party agreements and transactions and reviews
them with the Audit Committee.
The Company has leases for two locations for its cor-
porate offi ces with related parties: the fi rst location
is leased from an entity in which Leonard Riggio (the
Company’s Founder and Chairman) has a majority inter-
est and expires in 2013; the second location is leased
from an entity in which Leonard Riggio has a minority
interest and expires in 2016. The space was rented at
an aggregate annual rent including real estate taxes of
$4,681, $4,603 and $4,559 in fi scal years 2008, 2007
and 2006, respectively.
The Company leases an offi ce/warehouse from a
partnership in which Leonard Riggio has a 50% inter-
est, pursuant to a lease expiring in 2023. The space was
rented at an annual rent of $810, $738 and $727 in fi scal
years 2008, 2007 and 2006, respectively. Net of subten-
ant income, the Company paid $307, $258 and $260 in
fi scal years 2008, 2007 and 2006, respectively.
The Company leases retail space in a building in
which Barnes & Noble College Booksellers, Inc. (B&N
College), a company owned by Leonard Riggio and his
wife, subleases space from the Company, pursuant to a
sublease expiring in 2020. Pursuant to such sublease,
the Company charged B&N College $773, $840 and
$884 for such subleased space and other operating costs
incurred on its behalf during fi scal years 2008, 2007 and
2006, respectively. The amount paid by B&N College to
the Company exceeds the cost per square foot paid by the
Company to its unaffi liated third-party landlord.
The Company purchases new and used textbooks at
market prices directly from MBS Textbook Exchange,
Inc. (MBS), a corporation majority-owned by Leonard
Riggio, Stephen Riggio and various members of the
Riggio family. Total purchases were $8,250, $7,539 and
$6,945 for fi scal years 2008, 2007 and 2006, respec-
tively. MBS distributes certain proprietary products
on behalf of the Company. Net sales received by the
Company after deducting MBS fees were $340, $419 and
$362 for fi scal years 2008, 2007 and 2006, respectively.
Fees paid to MBS were $50, $65 and $55 during fi scal
years 2008, 2007 and 2006, respectively. In fi scal 2006,
MBS began selling used books as part of the Barnes &
Noble.com dealer network. MBS pays Barnes & Noble.
com the same commission as other dealers in the Barnes
38 Barnes & Noble, Inc. NOTES TO CONSOLIDATED FINANCIAL STATEMENTS continued
69552 Text.indd 3869552 Text.indd 38 4/8/09 10:12 AM4/8/09 10:12 AM

& Noble dealer network. Barnes & Noble.com earned a
commission of $1,410, $1,598 and $1,626 on the MBS
used book sales in fi scal 2008, 2007 and 2006, respec-
tively. In addition, Barnes & Noble.com maintains a
link on its website which is hosted by MBS and through
which Barnes & Noble.com customers are able to sell
used books directly to MBS. Barnes & Noble.com is paid
a fi xed commission on the price paid by MBS to the
customer. Total commissions paid to Barnes & Noble.
com were $130, $81 and $34 for fi scal years 2008, 2007
and 2006, respectively.
The Company licenses the “Barnes & Noble” name
under a royalty-free license agreement dated February
11, 1987, as amended, from B&N College. Barnes &
Noble.com licenses the “Barnes & Noble” name under
a royalty-free license agreement, dated October 31,
1998, as amended, between Barnes & Noble.com and
B&N College (the License Agreement). Pursuant to
the License Agreement, Barnes & Noble.com has
been granted an exclusive license to use the “Barnes
& Noble” name and trademark in perpetuity for the
purpose of selling books over the Internet (excluding
sales of college textbooks). Under a separate agree-
ment dated as of January 31, 2001 (the Textbook License
Agreement), between Barnes & Noble.com, B&N College
and Textbooks.com, Inc. (Textbooks.com), a corpora-
tion owned by Leonard Riggio, Barnes & Noble.com
was granted the right to sell college textbooks over the
Internet using the “Barnes & Noble” name. Pursuant to
the Textbook License Agreement, Barnes & Noble.com
pays Textbooks.com a royalty on revenues (net of prod-
uct returns, applicable sales tax and excluding shipping
and handling) realized by Barnes & Noble.com from
the sale of books designated as textbooks. The current
term of the agreement is through January 31, 2010 and it
renews annually for additional one-year periods unless
terminated 12 months prior to the end of any given term.
Royalty expense was $5,814, $4,864 and $3,916 for fi scal
years 2008, 2007 and 2006, respectively, under the
terms of the Textbook License Agreement.
The Company reimbursed B&N College certain oper-
ating costs B&N College incurred on the Company’s
behalf. These charges are included in the accompanying
consolidated statements of operations and were $235,
$200 and $248 for fi scal 2008, 2007 and 2006, respec-
tively. B&N College purchased inventory, at cost plus
an incremental fee, of $49,172, $50,597 and $48,574
from the Company during fi scal 2008, 2007 and 2006,
respectively. B&N College reimbursed the Company
$3,506, $4,889 and $2,698 for fi scal years 2008, 2007
and 2006, respectively, for capital expenditures, busi-
ness insurance and other operating costs incurred on its
behalf.
The Company uses a jet aircraft owned by B&N College
and pays for the costs and expenses of operating the
aircraft based upon the Company’s usage. Such costs
which include fuel, insurance and other costs were
$1,823, $1,921 and $1,722 during fi scal 2008, 2007 and
2006, respectively, and are included in the accompany-
ing consolidated statements of operations.
B&N College operates campus bookstores pursuant to
agreements with a large number of colleges and uni-
versities. The Company has recently learned that an
offi cer of the Company executed one such agreement
between B&N College and a university in 1998 purport-
edly limiting the Company’s ability to open a store
within fi ve miles of the university bookstore without the
university’s consent. This agreement, which expires in
December 2012, has not played and is not expected to
play any role in the Company’s decisions about where to
open stores, and the Company has advised B&N College
that the provision in question is not enforceable against
the Company.
GameStop Corp. (GameStop), a company in which
Leonard Riggio is a member of the Board of Directors
and a minority shareholder, operates departments
within some of the Company’s bookstores. GameStop
pays a license fee to the Company in an amount equal to
7% of the gross sales of such departments, which totaled
$1,250, $1,221 and $996 during fi scal 2008, 2007 and
2006, respectively.
GameStop sells new and used video games and consoles
on the Barnes & Noble.com website. Barnes & Noble.
com receives a commission on sales made by GameStop.
For fi scal years 2008, 2007 and 2006, the commission
earned by Barnes & Noble.com was $531, $447 and
$343, respectively.
Until June 2005, GameStop participated in the
Company’s worker’s compensation, property and
general liability insurance programs. The costs incurred
by the Company under these programs were allocated to
GameStop based upon GameStop’s total payroll expense,
2008 Annual Report 39
69552 Text.indd 3969552 Text.indd 39 4/8/09 10:12 AM4/8/09 10:12 AM
property and equipment, and insurance claim history.
GameStop reimbursed the Company for these services
$162, $289 and $838 during fi scal 2008, 2007 and 2006,
respectively. Although GameStop secured its own insur-
ance coverage, costs are continuing to be incurred by the
Company on insurance claims which were made under
its programs prior to June 2005 and any such costs
applicable to insurance claims against GameStop will be
charged to GameStop at the time incurred.
The Company is provided with national freight dis-
tribution, including trucking services by Argix Direct
Inc. (Argix), a company in which a brother of Leonard
and Stephen Riggio owns a 20% interest, pursuant
to a transportation agreement expiring in 2012. The
Company paid Argix $16,981, $18,953 and $20,524 for
such services during fi scal years 2008, 2007 and 2006,
respectively. At the time of the agreement, the cost of
freight delivered to the stores by Argix was comparable
to the prices charged by publishers and the Company’s
other third party freight distributors. However, due to
higher contracted fuel surcharge and transportation
costs, Argix’s rates are now higher than the Company’s
other third party freight distributors. As a result, the
Company amended its existing agreement with Argix
eff ective January 1, 2009. The amendment provides the
Company with a $3,000 annual credit to its freight and
transportation costs for the remaining life of the existing
agreement. Argix also leases offi ce and warehouse space
from the Company in Jamesburg, New Jersey, pursuant
to a lease expiring in 2011. The Company charged Argix
$2,835, $2,642 and $2,005 for such leased space and
other operating costs incurred on its behalf during fi scal
2008, 2007 and 2006, respectively.
The Company uses Source Interlink Companies, Inc.
(Source Interlink) as its primary supplier of music
and DVD/video, as well as magazines and newspapers.
Leonard Riggio is an investor in an investment company
that owns a minority interest in Source Interlink. In
addition, Ronald W. Burkle, who owns a minority inter-
est in the Company, also owns a minority interest in
Source Interlink through his ownership interests in AEC
Associates, LLC. The Company paid Source Interlink
$395,144, $438,159 and $442,685 for merchandise
purchased at market prices during fi scal 2008, 2007
and 2006, respectively. Outstanding amounts payable
to Source Interlink for merchandise purchased were
$53,217, $58,822 and $68,048 as of January 31, 2009,
February 2, 2008 and February 3, 2007, respectively.
The Company uses Digital on Demand as its provider
of music and video database equipment and services.
Leonard Riggio owns a minority interest in Digital on
Demand through the same investment company through
which he owns a minority interest in Source Interlink.
The Company paid Digital on Demand $4,893, $4,396
and $4,705 for music and video database equipment and
services during fi scal 2008, 2007 and 2006, respectively.
18 . DIVIDENDS
During fi scal 2008, the Company paid a quarterly cash
dividend of $0.15 per share on March 31, 2008 to stock-
holders of record at the close of business on March 10,
2008. On March 20, 2008, the Company announced that
its Board of Directors has authorized an increase to its
quarterly cash dividend from $0.15 to $0.25 per share,
commencing with the dividend to be paid in June 2008.
The Company paid quarterly cash dividends of $0.25
per share on June 30, 2008 to stockholders of record at
the close of business on June 9, 2008, on September 30,
2008 to stockholders of record at the close of busi-
ness on September 9, 2008, and on December 31, 2008
to stockholders of record at the close of business on
December 10, 2008. The Company also paid a dividend
of $0.25 per share on March 31, 2009 to stockholders of
record at the close of business on March 10, 2009.
During fi scal 2007, the Company paid quarterly cash
dividends of $0.15 per share on March 30, 2007 to
stockholders of record at the close of business on March
9, 2007, on June 29, 2007 to stockholders of record at
the close of business on June 8, 2007, on September 28,
2007 to stockholders of record at the close of busi-
ness on September 7, 2007, and on December 28, 2007
to stockholders of record at the close of business on
December 7, 2007.
19 . SUBSEQUENT EVENTS
On March 4, 2009, the Company acquired Fictionwise,
a leader in the e-book marketplace, for $15,700 in
cash. The Company plans to use Fictionwise as part of
its overall digital strategy, which includes the expected
launch of an e-Bookstore later this year. In addition to
the purchase price, the Company will make earn out
payments if certain performance targets are met over the
next two years.
40 Barnes & Noble, Inc. NOTES TO CONSOLIDATED FINANCIAL STATEMENTS continued
69552 Text.indd 4069552 Text.indd 40 4/8/09 10:12 AM4/8/09 10:12 AM

20 . SELECTED QUARTERLY FINANCIAL INFORMATION (UNAUDITED)
A summary of quarterly fi nancial information for each of the last two fi scal years is as follows:
FISCAL 2008 QUARTER ENDED ON OR ABOUT
APRIL 2008
JULY2008
OCTOBER2008
JANUARY2009
TOTAL FISCAL YEAR 2008
Sales $ 1,155,882 1,220,989 1,113,317 1,631,616 5,121,804
Gross profi t $ 347,967 374,399 336,123 522,717 1,581,208
Earnings (loss) from continuing operations $ (566) 16,771 (15,952) 85,172 85,426
Loss from discontinued operations (1,658) (1,360) (2,468) (4,020) (9,506)
Net earnings (loss) $ (2,224) 15,411 (18,420) 81,152 75,920
Basic earnings (loss) per common share:
Earnings (loss) from continuing operations $ (0.01) 0.31 (0.29) 1.56 1.55
Loss from discontinued operations (0.03) (0.03) (0.05) (0.07) (0.17)
Net earnings (loss) $ (0.04) 0.28 (0.34) 1.49 1.38
Diluted earnings (loss) per common share:
Earnings (loss) from continuing operations $ (0.01) 0.30 (0.29) 1.53 1.49
Loss from discontinued operations (0.03) (0.03) (0.05) (0.07) (0.17)
Net earnings (loss) $ (0.04) 0.27 (0.34) 1.46 1.32
FISCAL 2007 QUARTER ENDED ON OR ABOUTAPRIL
2007JULY2007
OCTOBER2007
JANUARY2008
TOTAL FISCAL YEAR 2007
Sales $ 1,142,256 1,241,434 1,164,004 1,738,980 5,286,674
Gross profi t $ 333,783 362,167 354,230 556,649 1,606,829
Earnings (loss) from continuing operations $ (128) 19,897 6,601 108,540 134,911
Earnings (loss) from discontinued operations (1,543) (1,845) (2,224) 6,501 888
Net earnings (loss) $ (1,671) 18,052 4,377 115,041 135,799
Basic earnings (loss) per common share:
Earnings (loss) from continuing operations $ (0.00) 0.30 0.10 1.78 2.12
Earnings (loss) from discontinued operations (0.02) (0.03) (0.04) 0.11 0.01
Net earnings (loss) $ (0.03) 0.28 0.07 1.88 2.13
Diluted earnings (loss) per common share:
Earnings (loss) from continuing operations $ (0.00) 0.29 0.10 1.69 2.01
Earnings (loss) from discontinued operations (0.02) (0.03) (0.04) 0.10 0.01
Net earnings (loss) $ (0.03) 0.26 0.07 1.79 2.03
Barnes & Noble, Inc. 41
69552 Text.indd 4169552 Text.indd 41 4/10/09 2:09 PM4/10/09 2:09 PM
REPORT OF INDEPENDENT REGISTERED PUBLIC ACCOUNTING FIRM
Board of Directors and Stockholders
Barnes & Noble, Inc.
New York, New York
We have audited the accompanying consolidated bal-
ance sheets of Barnes & Noble, Inc. and subsidiaries
as of January 31, 2009 and February 2, 2008 and the
related consolidated statements of operations, changes
in shareholders’ equity and cash fl ows for each of the
three fi scal years in the period ended January 31, 2009.
These fi nancial statements are the responsibility of
the Company’s management. Our responsibility is to
express an opinion on these fi nancial statements based
on our audits.
We conducted our audits in accordance with the stan-
dards of the Public Company Accounting Oversight
Board (United States). Those standards require that we
plan and perform the audit to obtain reasonable assur-
ance about whether the fi nancial statements are free of
material misstatement. An audit includes examining,
on a test basis, evidence supporting the amounts and
disclosures in the fi nancial statements, assessing the
accounting principles used and signifi cant estimates
made by management, as well as evaluating the overall
fi nancial statement presentation. We believe that our
audits provide a reasonable basis for our opinion.
In our opinion, the consolidated fi nancial statements
referred to above present fairly, in all material respects,
the fi nancial position of Barnes & Noble, Inc. and
subsidiaries as of January 31, 2009 and February 2, 2008
and the results of their operations and their cash fl ows
for each of the three fi scal years in the period ended
January 31, 2009, in conformity with accounting princi-
ples generally accepted in the United States of America.
We also have audited, in accordance with the standards
of the Public Company Accounting Oversight Board
(United States), Barnes & Noble, Inc. and subsidiaries’
internal control over fi nancial reporting as of January 31,
2009, based on criteria established in Internal Control
– Integrated Framework issued by the Committee of
Sponsoring Organizations of the Treadway Commission
(COSO) and our report dated March 31, 2009 expressed
an unqualifi ed opinion thereon.
BDO Seidman, LLP
New York, New York
March 31, 2009
42 Barnes & Noble, Inc.
69552 Text.indd 4269552 Text.indd 42 4/8/09 10:12 AM4/8/09 10:12 AM

Board of Directors and Stockholders
Barnes & Noble, Inc.
New York, New York
We have audited Barnes & Noble, Inc.’s internal control
over fi nancial reporting as of January 31, 2009, based
on criteria established in Internal Control-Integrated
Framework issued by the Committee of Sponsoring
Organizations of the Treadway Commission (the COSO
criteria). Barnes & Noble, Inc.’s management is respon-
sible for maintaining eff ective internal control over
fi nancial reporting and for its assessment of the eff ec-
tiveness of internal control over fi nancial reporting,
included in the accompanying Management’s Report
on Internal Control over Financial Reporting appear-
ing under Item 9A. Our responsibility is to express an
opinion on the company’s internal control over fi nancial
reporting based on our audit.
We conducted our audit in accordance with the stan-
dards of the Public Company Accounting Oversight
Board (United States). Those standards require that
we plan and perform the audit to obtain reasonable
assurance about whether eff ective internal control
over fi nancial reporting was maintained in all material
respects. Our audit included obtaining an understand-
ing of internal control over fi nancial reporting, assess-
ing the risk that a material weakness exists, and testing
and evaluating the design and operating eff ectiveness
of internal control based on the assessed risk. Our
audit also included performing such other procedures
as we considered necessary in the circumstances. We
believe that our audit provides a reasonable basis for our
opinion.
A company’s internal control over fi nancial reporting
is a process designed to provide reasonable assurance
regarding the reliability of fi nancial reporting and the
preparation of fi nancial statements for external pur-
poses in accordance with generally accepted accounting
principles. A company’s internal control over fi nancial
reporting includes those policies and procedures that (1)
pertain to the maintenance of records that, in reason-
able detail, accurately and fairly refl ect the transactions
and dispositions of the assets of the company; (2) pro-
vide reasonable assurance that transactions are recorded
as necessary to permit preparation of fi nancial state-
ments in accordance with generally accepted accounting
principles, and that receipts and expenditures of the
company are being made only in accordance with autho-
rizations of management and directors of the company;
and (3) provide reasonable assurance regarding preven-
tion or timely detection of unauthorized acquisition,
use, or disposition of the company’s assets that could
have a material eff ect on the fi nancial statements.
Because of its inherent limitations, internal control
over fi nancial reporting may not prevent or detect
misstatements. Also, projections of any evaluation of
eff ectiveness to future periods are subject to the risk that
controls may become inadequate because of changes in
conditions, or that the degree of compliance with the
policies or procedures may deteriorate.
In our opinion, Barnes & Noble, Inc. maintained, in
all material respects, eff ective internal control over
fi nancial reporting as of January 31, 2009, based on the
COSO criteria.
We also have audited, in accordance with the standards
of the Public Company Accounting Oversight Board
(United States), the consolidated balance sheets of
Barnes & Noble, Inc. and subsidiaries as of January 31,
2009 and February 2, 2008, and the related consolidated
statements of operations, changes in shareholders’
equity, and cash fl ows for each of the three fi scal years in
the period ended January 31, 2009, and our report dated
March 31, 2009 expressed an unqualifi ed opinion on
those consolidated fi nancial statements.
BDO Seidman, LLP
New York, New York
March 31, 2009
REPORT OF INDEPENDENT REGISTERED PUBLIC ACCOUNTING FIRM
2008 Annual Report 43
69552 Text.indd 4369552 Text.indd 43 4/8/09 10:12 AM4/8/09 10:12 AM

MANAGEMENT’S RESPONSIBILITY FOR CONSOLIDATED FINANCIAL STATEMENTS
The management of Barnes & Noble, Inc. is responsible
for the content of the Consolidated Financial Statements,
which are prepared in conformity with accounting
principles generally accepted in the United States of
America. The Consolidated Financial Statements neces-
sarily include amounts based on judgments and esti-
mates. Financial information elsewhere in the Annual
Report is consistent with that in the Consolidated
Financial Statements.
The Company maintains a comprehensive accounting
system which includes controls designed to provide
reasonable assurance as to the integrity and reliability
of the fi nancial records and the protection of assets.
An internal audit staff is employed to regularly test and
evaluate both internal accounting controls and operating
procedures, including compliance with the Company’s
statement of policy regarding ethical and lawful con-
duct. The Audit Committee of the Board of Directors
composed of directors who are not members of manage-
ment, meets regularly with management, the indepen-
dent registered public accountants and the internal
auditors to ensure that their respective responsibilities
are properly discharged. BDO Seidman, LLP and the
Internal Audit Department of the Company have full
and free independent access to the Audit Committee.
The role of BDO Seidman, LLP, an independent regis-
tered public accounting fi rm, is to provide an objective
examination of the Consolidated Financial Statements
and the underlying transactions in accordance with the
standards of the Public Company Accounting Oversight
Board. The report of BDO Seidman, LLP accompanies
the Consolidated Financial Statements.
MANAGEMENT’S REPORT ON INTERNAL CONTROL OVER FINANCIAL REPORTING
The management of Barnes & Noble, Inc. is responsible
for establishing and maintaining adequate internal
control over fi nancial reporting, as such term is defi ned
in Exchange Act Rules 13a-15(f) and 15d-15(f). Under
the supervision and with the participation of manage-
ment, including the Chief Executive Offi cer and Chief
Financial Offi cer, the Company conducted an evaluation
of the eff ectiveness of the Company’s internal control
over fi nancial reporting based on the framework in
Internal Control–Integrated Framework issued by the
Committee of Sponsoring Organizations of the Treadway
Commission. Based on the Company’s evaluation, man-
agement concluded that the Company’s internal control
over fi nancial reporting was eff ective as of January 31,
2009. The Company’s internal control over fi nancial
reporting as of January 31, 2009 has been independently
audited by BDO Seidman, LLP, an independent regis-
tered public accounting fi rm, and their attestation is
included herein.
OTHER INFORMATION
The Company has included the Section 302 certifi ca-
tions of the Chief Executive Offi cer and the Chief
Financial Offi cer of the Company as Exhibits 31.1 and
31.2 to its Annual Report on Form 10-K for fi scal 2008
fi led with the Securities and Exchange Commission,
and the Company has submitted to the New York Stock
Exchange a certifi cate of the Chief Executive Offi cer
of the Company certifying that he is not aware of any
violation by the Company of New York Stock Exchange
corporate governance listing standards.
REPORTS OF MANAGEMENT
44 Barnes & Noble, Inc.
69552 Text.indd 4469552 Text.indd 44 4/8/09 10:12 AM4/8/09 10:12 AM

SHAREHOLDER INFORMATION
BARNES & NOBLE, INC. BOARD OF DIRECTORS
Leonard Riggio
Chairman
Barnes & Noble, Inc.
Stephen Riggio
Vice Chairman and Chief Executive Offi cer
Barnes & Noble, Inc.
George Campbell Jr.
President
The Cooper Union for the Advancement
of Science and Art
Michael J. Del Giudice
Senior Managing Director
Millennium Capital Markets LLC
William Dillard, II
Chairman and Chief Executive Offi cer
Dillard’s, Inc.
Patricia L. Higgins
Former President and Chief Executive Offi cer
Switch & Data Facilities Company, Inc.
Irene R. Miller
Chief Executive Offi cer
Akim, Inc.
Margaret T. Monaco
Principal
Probus Advisors
Lawrence S. Zilavy
Senior Vice President
Barnes & Noble College Booksellers, Inc.
BARNES & NOBLE, INC. EXECUTIVE OFFICERS
Leonard Riggio
Chairman
Stephen Riggio
Vice Chairman and Chief Executive Offi cer
Mitchell S. Klipper
Chief Operating Offi cer
Joseph J. Lombardi
Chief Financial Offi cer
William J. Lynch, Jr.
President of Barnes & Noble.com
J. Alan Kahn
President of Barnes & Noble Publishing Group
William F. Duffy
Executive Vice President of Distribution and Logistics
Mary Ellen Keating
Senior Vice President of Corporate Communications and
Public Aff airs
Mark Bottini
Vice President and Director of Stores
Jaime Carey
Vice President and Chief Merchandising Offi cer
Jennifer M. Daniels
Vice President, General Counsel and Corporate Secretary
David S. Deason
Vice President of Barnes & Noble Development
Christopher Grady-Troia
Vice President and Chief Information Offi cer
Allen W. Lindstrom
Vice President and Corporate Controller
Michelle Smith
Vice President of Human Resources
2008 Annual Report 45
69552 Text.indd 4569552 Text.indd 45 4/8/09 10:12 AM4/8/09 10:12 AM
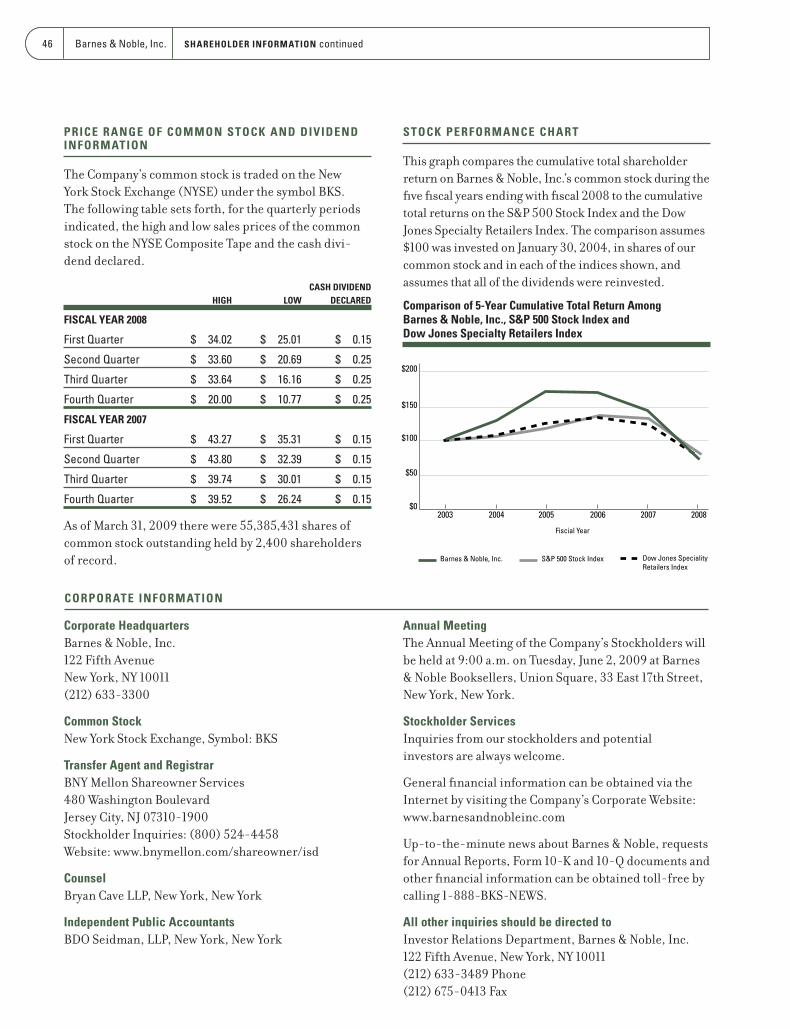
PRICE RANGE OF COMMON STOCK AND DIVIDEND INFORMATION
The Company’s common stock is traded on the New
York Stock Exchange (NYSE) under the symbol BKS.
The following table sets forth, for the quarterly periods
indicated, the high and low sales prices of the common
stock on the NYSE Composite Tape and the cash divi-
dend declared.
HIGH LOW
CASH DIVIDEND
DECLARED
FISCAL YEAR 2008
First Quarter $ 34.02 $ 25.01 $ 0.15
Second Quarter $ 33.60 $ 20.69 $ 0.25
Third Quarter $ 33.64 $ 16.16 $ 0.25
Fourth Quarter $ 20.00 $ 10.77 $ 0.25
FISCAL YEAR 2007
First Quarter $ 43.27 $ 35.31 $ 0.15
Second Quarter $ 43.80 $ 32.39 $ 0.15
Third Quarter $ 39.74 $ 30.01 $ 0.15
Fourth Quarter $ 39.52 $ 26.24 $ 0.15
As of March 31, 2009 there were 55,385,431 shares of
common stock outstanding held by 2,400 shareholders
of record.
STOCK PERFORMANCE CHART
This graph compares the cumulative total shareholder
return on Barnes & Noble, Inc.’s common stock during the
fi ve fi scal years ending with fi scal 2008 to the cumulative
total returns on the S&P 500 Stock Index and the Dow
Jones Specialty Retailers Index. The comparison assumes
$100 was invested on January 30, 2004, in shares of our
common stock and in each of the indices shown, and
assumes that all of the dividends were reinvested.
Comparison of 5-Year Cumulative Total Return Among Barnes & Noble, Inc., S&P 500 Stock Index and Dow Jones Specialty Retailers Index
Corporate Headquarters
Barnes & Noble, Inc.
122 Fifth Avenue
New York, NY 10011
(212) 633-3300
Common Stock
New York Stock Exchange, Symbol: BKS
Transfer Agent and Registrar
BNY Mellon Shareowner Services
480 Washington Boulevard
Jersey City, NJ 07310-1900
Stockholder Inquiries: (800) 524-4458
Website: www.bnymellon.com/shareowner/isd
Counsel
Bryan Cave LLP, New York, New York
Independent Public Accountants
BDO Seidman, LLP, New York, New York
Annual Meeting
The Annual Meeting of the Company’s Stockholders will
be held at 9:00 a.m. on Tuesday, June 2, 2009 at Barnes
& Noble Booksellers, Union Square, 33 East 17th Street,
New York, New York.
Stockholder Services
Inquiries from our stockholders and potential
investors are always welcome.
General fi nancial information can be obtained via the
Internet by visiting the Company’s Corporate Website:
www.barnesandnobleinc.com
Up-to-the-minute news about Barnes & Noble, requests
for Annual Reports, Form 10-K and 10-Q documents and
other fi nancial information can be obtained toll-free by
calling 1-888-BKS-NEWS.
All other inquiries should be directed to
Investor Relations Department, Barnes & Noble, Inc.
122 Fifth Avenue, New York, NY 10011
(212) 633-3489 Phone
(212) 675-0413 Fax
CORPORATE INFORMATION
$02003 2004 2005 2006 2007 2008
$50
$100
$150
$200
S&P 500 Stock Index Dow Jones Speciality Retailers Index
Fiscial Year
Barnes & Noble, Inc.
46 Barnes & Noble, Inc. SHAREHOLDER INFORMATION continued
69552 Text.indd 4669552 Text.indd 46 4/8/09 10:12 AM4/8/09 10:12 AM

TOP 10 HARDCOVER FICTION
The Host Stephenie Meyer
Little, Brown &
Company
233,778
The Appeal John Grisham
Doubleday
214,251
The Story of Edgar Sawtelle David Wroblewski
HarperCollins
205,584
The Christmas Sweater Glenn Beck
Simon & Schuster
133,510
The Lucky One Nicholas Sparks
Grand Central
127,455
Cross Country James Patterson
Little, Brown &
Company
123,930
Fearless Fourteen Janet Evanovich
St. Martin’s Press
109,101
7th Heaven James Patterson and
Maxine Paetro
Little, Brown &
Company
105,355
Scarpetta Patricia Cornwell
Penguin
98,050
A Thousand Splendid Suns Khaled Hosseini
Penguin
95,508
TOP 10 HARDCOVER NON-FICTION
The Last Lecture Randy Pausch
Hyperion
720,208
The Secret Rhonda Byrne
Simon & Schuster
282,729
Dewey Vicki Myron with Bret
Witter
Grand Central
153,271
Outliers Malcolm Gladwell
Little, Brown &
Company
146,897
Audition Barbara Walters
Random House
142,880
When You Are Engulfed in Flames David Sedaris
Little, Brown &
Company
133,750
Strengths Finder 2.0 Tom Rath
PGW
125,924
A Bold Fresh Piece of Humanity Bill O’Reilly
Broadway
102,072
Hot, Flat, and Crowded Thomas L. Friedman
Farrar, Straus and
Giroux
101,659
Are You There, Vodka? It’s Me, Chelsea Chelsea Handler
Simon & Schuster
100,687
TOP 10 PAPERBACK NON-FICTION
A New Earth Eckhart Tolle
Penguin
888,996
Eat, Pray, Love Elizabeth Gilbert
Penguin
315,024
Three Cups of Tea Greg Mortenson and
David Oliver Relin
Penguin
302,819
The Audacity of Hope Barack Obama
Crown Publishing
235,815
Dreams from My Father Barack Obama
Crown Publishing
201,984
Marley & Me John Grogan
HarperCollins
170,253
Skinny Bitch Rory Freedman and
Kim Barnouin
Running Press
168,008
Into the Wild Jon Krakauer
Knopf
162,335
Eat This Not That! David Zinczenko with
Matt Goulding
Rodale
161,947
The Power of Now Eckhart Tolle
New World Library
154,182
TOP 10 PAPERBACK FICTION
The Shack William P. Young
Windblown Media
597,164
To Kill a Mockingbird Harper Lee
HarperCollins
210,122
The Kite Runner Khaled Hosseini
Penguin
181,736
The Pillars of the Earth Ken Follett
Penguin
178,893
The Alchemist Paulo Coelho
HarperCollins
174,474
Atonement Ian McEwan
Random House
140,809
Water for Elephants Sara Gruen
Workman
135,745
The Secret Life of Bees Sue Monk Kidd
Penguin
133,243
Barefoot Elin Hilderbrand
Back Bay
130,838
The Other Boleyn Girl Philippa Gregory
Simon & Schuster
128,816
TOP 10 JUVENILE
Breaking Dawn Stephenie Meyer
Little, Brown &
Company
910,638
Twilight Stephenie Meyer
Little, Brown &
Company
905,251
New Moon Stephenie Meyer
Little, Brown &
Company
857,944
Eclipse Stephenie Meyer
Little, Brown &
Company
797,235
The Tales of Beedle the Bard J.K. Rowling
Scholastic
346,456
Brisingr Christopher Paolini
Random House
293,722
Rodrick Rules Jeff Kinney
Harry N Abrams Inc
246,498
Diary of a Wimpy Kid Jeff Kinney
Amulet Books
221,892
The Tale of Despereaux Kate DiCamillo
Candlewick Press
144,766
The Battle of the Labyrinth Rick Riordan
Hyperion
136,151
BARNES & NOBLE BESTSELLERS 2008
2008 Annual Report 47
69552 Text.indd 4769552 Text.indd 47 4/8/09 10:12 AM4/8/09 10:12 AM

SLEEPERS
The Shack William P. Young
Windblown Media
597,164
Eat This Not That! David Zinczenko with
Matt Goulding
Rodale
161,947
Dewey Vicki Myron with Bret
Witter
Grand Central
153,271
Too Fat to Fish Artie Lange with
Anthony Bozza
Spiegel & Grau
75,127
In Defense of Food Michael Pollan
Penguin
69,417
The Love Dare Stephen Kendrick
B&H Books
55,626
The Post-American World Fareed Zakaria
W. W. Norton
52,622
My Stroke of Insight Jill Bolte Taylor, Ph.D.
Penguin
43,272
Escape Carolyn Jessop with
Laura Palmer
Bantam
36,649
Netherland Joseph O’Neill
Knopf
12,690
PULITZER PRIZE
The Brief Wondrous Life of Oscar Wao Junot Diaz
Riverhead Books
Fiction
August: Osage County Tracy Letts
Theatre
Communications
Group
Drama
What Hath God Wrought Daniel Walker Howe
Oxford University
Press
History
Eden’s Outcasts John Matteson
W. W. Norton
Biography
Time and Materials Robert Hass
HarperCollins
Poetry
Failure Philip Schultz
Harcourt
Poetry
The Years of Extermination Saul Friedländer
HarperCollins
General Non-Fiction
THE NATIONAL BOOK AWARDS
Shadow Country Peter Matthiessen
Random House
Fiction
The Hemingses of Monticello Annette Gordon-Reed
W. W. Norton &
Company
Non-Fiction
Fire to Fire Mark Doty
HarperCollins
Poetry
What I Saw and How I Lied Judy Blundell
Scholastic
Young People’s Literature
NATIONAL BOOK CRITICS CIRCLE AWARDS
2666 Roberto Bolaño
Farrar, Straus and
Giroux
Fiction
The World Is What It Is Patrick French
Knopf
Biography
My Father’s Paradise Ariel Sabar
Algonquin
Autobiography
Children’s Literature Seth Lerer
University of Chicago
Press
Criticism
The Forever War Dexter Filkins
Knopf
General Non-Fiction
Sleeping It Off in Rapid City August Kleinzahler
Farrar, Straus and
Giroux
Poetry
Half of the World in Light Juan Felipe Herrera
University of Arizona
Press
DISCOVER AWARDS
The Well and the Mine Gin Phillips
Hawthorne Books
Fiction
Beautiful Boy David Sheff
Houghton Miffl in
Non-Fiction
THE MAN BOOKER PRIZE
The White Tiger Aravind Adiga
Simon & Schuster
CALDECOTT MEDAL
The House in the Night Susan Marie Swanson
Houghton Miffl in
Harcourt
NEWBERY MEDAL
The Graveyard Book Neil Gaiman
HarperCollins
CORETTA SCOTT KING AUTHOR AWARD
We Are the Ship Kadir Nelson
Hyperion
THE HUGO AWARD
The Yiddish Policemen’s Union Michael Chabon
HarperCollins
Best Novel
THE EDGAR AWARD
Down River John Hart
St. Martin’s Press
Best Novel
2008 AWARD WINNERS
48 Barnes & Noble, Inc.
69552 Text.indd 4869552 Text.indd 48 4/8/09 10:12 AM4/8/09 10:12 AM

69552 Cover.indd 1 4/4/09 12:31 PM