
Non-noble metal catalysts for oxygen reduction reaction in low ...
292
15 July 2022 POLITECNICO DI TORINO Repository ISTITUZIONALE Non-noble metal catalysts for oxygen reduction reaction in low temperature fuel cells / Osmieri, Luigi. - (2016). [10.6092/polito/porto/2640183] Original Non-noble metal catalysts for oxygen reduction reaction in low temperature fuel cells Publisher: Published DOI:10.6092/polito/porto/2640183 Terms of use: Altro tipo di accesso Publisher copyright (Article begins on next page) This article is made available under terms and conditions as specified in the corresponding bibliographic description in the repository Availability: This version is available at: 11583/2640183 since: 2016-04-18T12:29:31Z Politecnico di Torino
-
Upload
khangminh22 -
Category
Documents
-
view
4 -
download
0
Transcript of Non-noble metal catalysts for oxygen reduction reaction in low ...

15 July 2022
POLITECNICO DI TORINORepository ISTITUZIONALE
Non-noble metal catalysts for oxygen reduction reaction in low temperature fuel cells / Osmieri, Luigi. - (2016).[10.6092/polito/porto/2640183]
Original
Non-noble metal catalysts for oxygen reduction reaction in low temperature fuel cells
Publisher:
PublishedDOI:10.6092/polito/porto/2640183
Terms of use:Altro tipo di accesso
Publisher copyright
(Article begins on next page)
This article is made available under terms and conditions as specified in the corresponding bibliographic description inthe repository
Availability:This version is available at: 11583/2640183 since: 2016-04-18T12:29:31Z
Politecnico di Torino
1
POLITECNICO DI TORINO SCUOLA DI DOTTORATO
Dottorato di Ricerca in Ingegneria Chimica – XXVIII Ciclo
PhD Thesis
Non-Noble Metal Catalysts for Oxygen Reduction Reaction in Low Temperature Fuel Cells
Dissertation Presented in partial fulfillment of the requirements for the Degree of Doctor of Philosophy in
Chemical Engineering
Supervisor
Prof. Stefania Specchia
Candidate
Luigi Osmieri
Torino, March 2016

2

3
Ai miei genitori

4

5
Acknowledgments
The writing of this Thesis is approaching the end, and these three years of PhD are finishing… so is
the moment to thank all the people who, with their help, in different ways, have made this possible.
First of all, I am very grateful to my supervisor, Prof. Stefania Specchia. Thank you for taking care
of me during these three years, for your kindness and positivity in every moment. Thank you for the
discussions and the suggestions, for giving me the opportunity to participate to interesting
conferences and to meet some of the most important scientists in the world in our research field.
Thank you for stimulating and being opened to our initiative in research, and for organizing and
making possible the stay in Madrid. But, above all, thank you for have create the Green2 Group, with
its always positive and pleasant environment, and for giving me the opportunity to work here… a
wonderful place… Group of top people!
Thank you to Prof. Vito Specchia, my supervisor in the Bachelor and Master Thesis, for giving me
the initial input and encouraging me to start the PhD.
Thank you to the person who gave me the biggest help in these three years, Dr. Alessandro
Monteverde. Thank you for introducing me in the world of electrochemistry, electrocatalysis, and
fuel cells. Thank you for teaching me to move “the first steps” in the lab, and for all the following
suggestions and inputs. Thank you for the interesting hours of conversation about the “state of the
art” and its advances. Thank you for the always kind help in every difficulty moment. I am very proud
to have had you as mentor and colleague, and to have you as friend.
Thank you to all the other colleagues and friends of the Green2 Group and DISAT, for all the help
and the support in the lab, and for sharing unforgettable funny and pleasant moments together! Thank
you Reza, Giuliana, Andrea, Svetla, Nicolò, Arsalan and Salma.
I am particularly grateful to Dr. Marco Armandi for the FTIR, TGA and mass-spectroscopy: thank
you for the measurements and for the kind help in the analysis of the data and interpretation of the
results.
I spent in the Universidad Autónoma de Madrid three wonderful intense months of hard work,
sometimes frustrating but at the same time exciting and very interesting, in the world of fuel cell
testing. In particular I am very grateful to Prof. Pilar Ocón for giving me the opportunity to join her
group. Thank you Pilar for receiving me so kindly and making me feeling part of the group from the
first moment. Thank you for the fruitful deep discussions about electrochemistry and ORR, and for
all of your precious suggestions. I want to thank a lot Dr. Ricardo Escudero Cid, the person who was
by my side in the lab in Madrid. Thank you Ricardo for giving me the knowledge about the MEA
fabrication and testing, for the long and fruitful talking about the dualism “RDE test – fuel cell test”,

6
and for making me understand the importance “de las pruebas en pila”. Thank you also to Manuel
and Dani for their kind help in the lab, and to Dr. José Luís Garcia Fierro of the Instituto de Catálisis
y Petroleoquímica – CSIC for the XPS measurements.
And least but not last, I want to thank my family. My mother, my father and my brother. They are the
most important I have in my life. The ones that have been, are and will be always by my side. Thank
you for supporting me in every moment of my life, and for always encouraging me to go further and
believe in myself. Thank you to my parents to have taught me the importance of the education, and
the importance of being always a respectful and polite person.
All this work is dedicated to them.
Luigi

7
Table of Contents ABSTRACT ……………………………………………………………………………………….. 9
CHAPTER 1. Introduction. ……………………………………………………………………... 11
1.1. Renewable Energy, Hydrogen & Fuel Cells: towards a sustainable development. ………….. 11
1.2. Fuel Cell Systems. ……………………………………………………………………………. 15
1.3. The Pt problem: strategies and research approaches to reduce the dependence on Pt. ………. 26
1.4. Electrocatalysis of ORR. ……………………………………………………………………... 30
1.5. Non Precious Metal Catalysts (NPMC) for ORR. ……………………………………………. 40
CHAPTER 2. The use of different types of reduced graphene oxide for the preparation of Fe-
N-C electrocatalysts for the oxygen reduction reaction. ………………………………………. 51
CHAPTER 3. Activity of Co-N multi walled carbon nanotubes electrocatalysts for oxygen
reduction reaction in acid conditions. As published in Journal of Power Sources, 278 (2015) 296–
307 ; DOI: 10.1016/j.jpowsour.2014.12.080. ………………………………………………….…. 79
CHAPTER 4. Optimization of a Fe-N-C electrocatalyst supported on mesoporous carbon
functionalized with polypyrrole for oxygen reduction reaction under both alkaline and acidic
conditions. As submitted to International Journal of Hydrogen Energy (manuscript number:
HE_2016_137). ………………………………………………………………………………….. 109
CHAPTER 5. Varying the morphology of Fe-N-C electrocatalysts by templating Iron
Phthalocyanine precursor with different porous SiO2 to promote the Oxygen Reduction
Reaction. As published in Electrochimica Acta, 177 (2015) 43–50 ; DOI:
10.1016/j.electacta.2015.01.165. ………………………………………………………………... 143

8
CHAPTER 6. The influence of different transition metals (Me = Fe, Co, Cu, Zn) on the
properties and ORR electroactivity of Me-N-C catalysts synthesized from Me(II)-
Phthalocyanine precursors. ……………………………………………………………………. 163
CHAPTER 7. Fe-N-C electrocatalysts for oxygen reduction reaction derived from the
impregnation of Fe – 1,10-phenanthroline complex on different carbon supports. ……….. 255
CHAPTER 8. Conclusions. …………………………………………………………………….. 281
8.1. General findings from the experimental work. ……………………………………………… 281
8.2. Resume of catalysts activities measured in RDE in both acid and alkaline conditions. ……. 282
8.3. Overall performances obtained in single fuel cell and economic considerations. …………... 284
8.4. Suggestions for future work. ………………………………………………………………... 287
List of Publications. …………………………………………………………………………….. 289
List of Abstracts or Proceedings of Congresses. ……………………………………………… 290

9
ABSTRACT
Polymer electrolyte membrane fuel cells (PEMFC) are electrochemical devices which can directly
convert the chemical energy of a fuel (such as hydrogen or a low-molecular weight alcohol) and an
oxidant (i.e. oxygen) into electrical energy with high efficiency. Moreover, due their low operating
temperature, they are suitable for automotive or portable applications. However, the slow kinetics of
oxygen reduction reaction (ORR) requires the use of costly Pt-based catalysts at the cathode in order
to obtain the desired power density values. Nevertheless, the cathode is still responsible for the main
voltage loss in the cell.
The overall objective of the research carried out in this Ph.D. thesis was the development of Pt-free
ORR catalysts starting from different carbon, nitrogen and transition metals precursors. Different
synthesis approaches were used in order to obtain an improvement of the activity, and to understand
the influence of the synthesis process variables. In particular, the influence of carbon supports
(commercial and synthesized in the lab), nitrogen and transition metals precursors, templating agents,
number and temperature of pyrolysis were examined. The catalysts produced were characterized by
means of several instrumental techniques such as N2 physisorption, XRD, XPS, EDX, SEM, FESEM,
TEM, Raman and FTIR. The effect of the presence of different transition metals on the pyrolysis
process was investigated by TGA coupled with a mass spectroscopy analysis, in order to have an
insight on their influence in the formation of ORR active sites. The activity toward ORR was assessed
by RDE-RRDE (rotating disk electrode - rotating ring disk electrode) analysis and by gas-diffusion
electrode in a 3-electrodes electrochemical cell configuration. The electrochemical techniques used
were cyclic voltammetry (CV), linear sweep voltammetry (LSV), staircase voltammetry (SV),
chronoamperometry and electrochemical impedance spectroscopy (EIS). These electrochemical tests
were performed in both acid and alkaline conditions, with reference to the potential applications in
both H+ and OH– conducing polymer electrolyte membrane fuel cells. This first part of research was
carried out in the laboratories of the Gre.En2 (Green Energy and Engineering) Group in the
Department of Applied Science and Technology (DISAT) at Politecnico di Torino.
Then, in the second part, some of the most promising electrocatalysts in terms of ORR activity were
in different types of single PEMFC. In particular, using acidic electrolyte membrane, the tests were
performed using H2 or methanol as fuels. In the case of direct methanol fuel cell (DMFC) tests, short-
term durability tests were done in order to compare the durability performance of our catalysts with

10
a standard Pt-based catalysts. The tests with alkaline electrolyte membrane were performed using
ethanol as fuel. This second part of research was carried out at the Universidad Autonoma de Madrid
in the laboratories of the Department of Applied Physical-Chemistry.
Here the structure of the thesis:
Chapter 1 is a general introduction about the PEMFC fuel cell technology, particularly focusing on
the non-noble metal catalysts for ORR as potential alternative to Pt.
Chapter 2 is focused on the use of different types of reduced graphene oxide as support for the
synthesis of Fe-N/C catalysts.
In Chapter 3, a complex between Co ions and a N-containing ligand molecule is impregnated on multi
walled carbon nanotubes and pyrolyzed one or two times for producing a Co-N-C catalyst, and the
influence of the second pyrolysis on the activity improvement was investigated.
Chapter 4 deals the optimization of the synthesis process of a Fe-N-C catalyst using polypyrrole as N
source and mesoporous carbon a C-support.
In Chapter 5 the study of the influence of different silica templates on the morphology on the ORR
activity of a Fe-N-C catalyst synthesized using Fe-phthalocyanine as precursor is presented.
In Chapter 6, different Me-phthalocyanines (Me = Fe, Co, Cu, Zn) were used as precursor for the
synthesis of Me-N-C catalysts using SBA-15 silica as hard template. The influence of the different
transition metals on the pyrolysis process and on the ORR activity and selectivity toward a complete
4 e- oxygen reduction was investigated in both acid and alkaline conditions. A detailed kinetic
analysis in acid conditions is also presented. The most active catalyst was tested in different types of
PEMFCs.
Finally, in Chapter 7, the influence of four different carbon supports on the ORR activity of Fe-N/C
catalysts in acid and alkaline conditions as well as the performance in single PEMFC is examined.
The general conclusions of the thesis are presented in Chapter 8.

11
CHAPTER 1. Introduction.
1.1. Renewable Energy, Hydrogen & Fuel Cells: towards a sustainable development.
One of the targets of the United Nations 2030 Agenda for a Sustainable Development (Goal 7) is to
“Ensure access to affordable, reliable, sustainable and modern energy for all”. In particular, this target
is subdivided into the following points:
- By 2030, ensure universal access to affordable, reliable and modern energy services.
- By 2030, increase substantially the share of renewable energy in the global energy mix.
- By 2030, double the global rate of improvement in energy efficiency.
- By 2030, enhance international cooperation to facilitate access to clean energy research and
technology, including renewable energy, energy efficiency and advanced and cleaner fossil-fuel
technology, and promote investment in energy infrastructure and clean energy technology.
- By 2030, expand infrastructure and upgrade technology for supplying modern and sustainable
energy services for all in developing countries, in particular least developed countries, small island
developing States, and land-locked developing countries, in accordance with their respective
programs of support. [1]
In this context, to reduce the dependence on non-renewable energy sources like oil, gas and coal, and
favor the transition to an emissions-free way to produce energy, the implementation of a “Hydrogen
Economy” worldwide is essential [2]. Hydrogen is a sustainable, non-polluting source of power that
can be used in mobile and stationary applications, usable as an ideal energy carrier.
It is an alternative to hydrocarbon fuels such as gasoline. It has many potential uses, and it is
environmentally friendly. Today many available technologies can use hydrogen to power cars,
trucks, electrical plants, and buildings. However, the absence of an infrastructure for producing,
transporting, and storing large quantities of hydrogen have prevent until now its practical use.
Hydrogen cannot be found by itself in nature in the form of H2, because the chemical element H
always combines with other elements such as oxygen and carbon. Therefore, H2 needs to be produced,
and this requires energy. If this energy comes from renewable sources, the “Hydrogen Economy” is
completely clean and sustainable. Nowadays, however, the most common H2 production method is
the steam reforming of methane (from natural gas). Steam reforming is a chemical process that
converts hydrocarbons into hydrogen and carbon monoxide by reaction with water steam [3].
Another method of producing hydrogen is the water electrolysis: it consists in splitting water (H2O)
into its component parts of hydrogen (H2) and oxygen (O2) using electrical current. If this electricity

12
is produced by renewable energy sources, this process would be completely emission-free and
sustainable, and hydrogen production and use can be part of a clean natural cycle [4].
After production, if not immediately consumed, hydrogen needs to be stored in some way. The
available hydrogen storage technologies are listed below [5].
- Gaseous storage in C-fibre composite vessels at pressure 350-700 bar. This technology is
commercially available but costly. The main R&D issues to be overcome are mechanical resistance
to fracture, safety, compression energy, and reduction of volume.
- Liquid storage in cryogenic insulated dewars (at 1 bar and –253 °C). This technology is also
commercially available, but costly. The main R&D issues to be overcome in this case are high
liquefaction energy, dormant boil off, and safety.
- Solid storage. There are many potential options for hydrogen storage in a solid form. One
possibility is the physisorption of molecular H2 on extremely high surface area carbon based
materials (like carbon nanotubes or graphite nanofibers) or on other high surface area materials
like MOF (metal-organic-frameworks) or zeolites. However, the most-developed technology is the
storage in metal hydrides (H2O-reactive chemical hydrides, thermal chemical hydrides and
rechargeable hydrides). The problem of these solid storage technologies is that they are still in a
very early development status and many R&D questions have to be addressed, some of them are:
weight, low desorption temperatures, high desorption kinetics, high recharge time and pressure,
heat management, cost, pyrophoricity, cyclic life and container compatibility.
Due to all these factors, cost is the biggest impediment to the wide use of hydrogen as a fuel. In fact,
since electricity is required for hydrogen production by electrolysis, this makes hydrogen more
expensive than the fuels it would replace. Moreover, many expensive changes should be made in the
present energy infrastructure to accommodate hydrogen.
Another concern is flammability: H2 can ignite in low concentrations, meaning that any leak in
transport and storage equipment could present a safety hazard. These facts highlight some of the many
practical considerations to be addressed before wide-scale use of hydrogen becomes a reality.
Researchers are developing new technologies in order to make the use of hydrogen cheaper and safer
in the future.
A fundamental advance toward a hydrogen-based energy system that uses hydrogen as a fuel are the
fuel-cell powered vehicles. This technology is already available and some car manufacturers have
already put on the market a fuel-cell car model. However, only a few models are now available for
sale or lease, and availability is limited to areas with hydrogen fueling stations, mostly in the USA
(California and East Coast), Japan and Northern Europe. Nevertheless, several challenges must be
overcome before fuel cell vehicles (FCVs) will be a successful, competitive alternative for consumers.

13
Figure 1. General scheme of the main components of a fuel-cell vehicle [6].
However, the clear advantages of reducing the dependence on fossil fuels, reducing the greenhouse
gases emissions (mostly carbon dioxide, CO2) that contribute to global climate change, and other
harmful air pollutants (like NOx, SOx, unburned hydrocarbons, CO and particulate) in comparison
with conventional gasoline- and diesel-powered vehicles cannot be neglected [7].
Another example of fuel cell powered device that is already available on the market are small scale
power generator units that are suitable for off-grid stationary and portable applications. They could
be based on Direct Methanol Fuel Cell (DMFC) systems, converting methanol directly into electrical
energy. Other systems are based on Reformed Methanol Fuel Cell (RMFC), which first convert
methanol into hydrogen via reforming, and then use the hydrogen as fuel in the fuel cell system.
14
Figure 2. An example of Reformed Methanol Fuel Cell power generator [8].
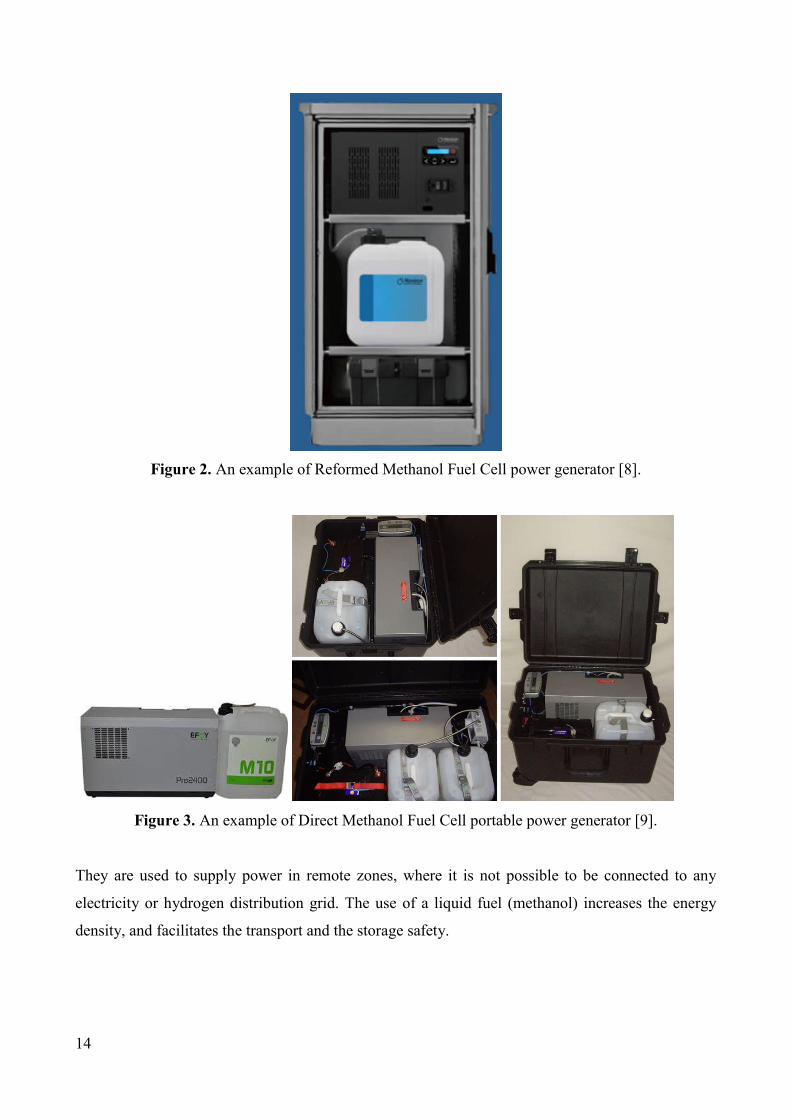
Figure 3. An example of Direct Methanol Fuel Cell portable power generator [9].
They are used to supply power in remote zones, where it is not possible to be connected to any
electricity or hydrogen distribution grid. The use of a liquid fuel (methanol) increases the energy
density, and facilitates the transport and the storage safety.
15
1.2. Fuel Cell systems.
1.2.1. What is a fuel cell?
A fuel cell is a device that directly converts the chemical energy of a fuel (generally hydrogen or
methanol) and an oxidant (oxygen from the air) into electrical energy. This happens by means of an
electrochemical reaction that takes place at the electrodes (anode and cathode) of the fuel cell. The
electrochemical reaction is the reverse of what occurs when electricity is used to produce hydrogen
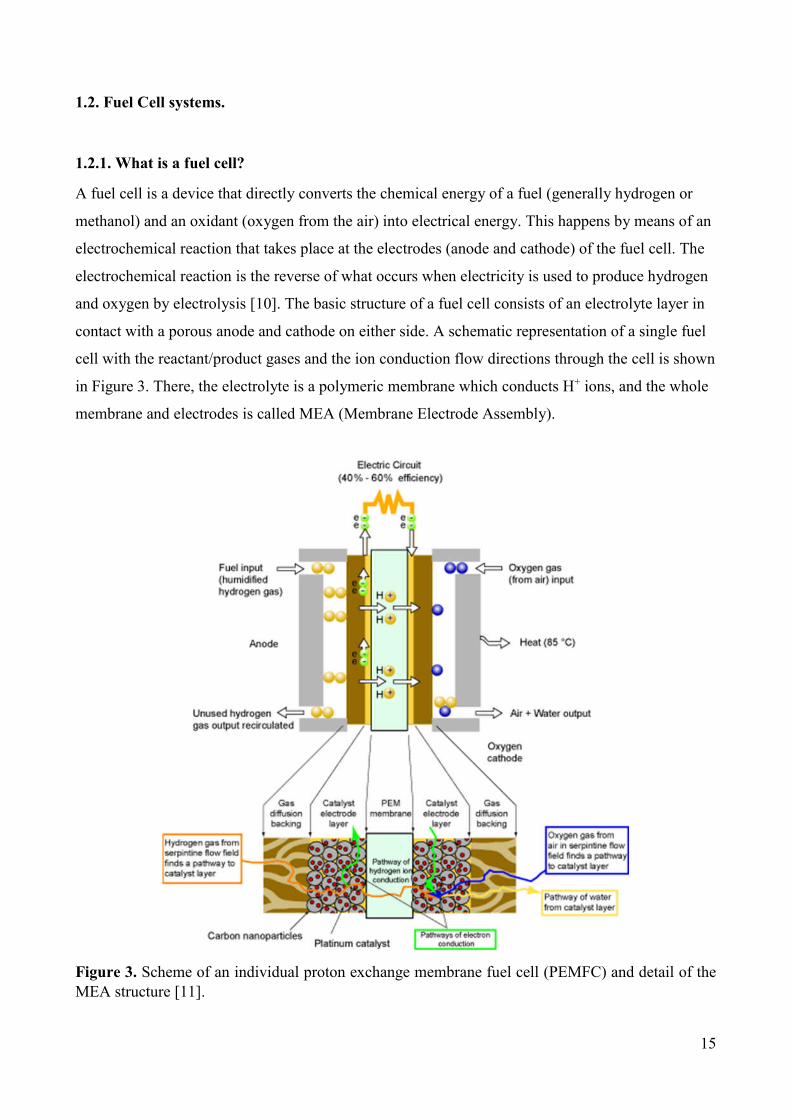
and oxygen by electrolysis [10]. The basic structure of a fuel cell consists of an electrolyte layer in
contact with a porous anode and cathode on either side. A schematic representation of a single fuel
cell with the reactant/product gases and the ion conduction flow directions through the cell is shown
in Figure 3. There, the electrolyte is a polymeric membrane which conducts H+ ions, and the whole
membrane and electrodes is called MEA (Membrane Electrode Assembly).
Figure 3. Scheme of an individual proton exchange membrane fuel cell (PEMFC) and detail of the MEA structure [11].

16
The electrochemical reaction occurs at a specific voltage, and the current density is a function of the
real or active surface area of the electrode. Thus, electrical series/parallel configurations are necessary
in order to get the desired amount of power. Series combinations are achieved by placing multiple
single cells together to reach the desired voltage. This is named the fuel cell “stack”. Parallel
combinations are achieved by placing multiple stacks together to achieve the desired current [12].
Figure 4. Scheme representing how the single MEAs are assembled together in a fuel cell “stack” [13].
The internal combustion engines in today’s cars convert less than 20% of the fuel energy into power
that moves the car. Otherwise, fuel cells are highly efficient. They can capture 40 – 60 % or more of
a fuel’s energy to power a car, depending on the fuel. However, before fuel cells can be widely used
in vehicles, some important problems have to be overcome:
• reduce the size and weight of all the components of a fuel cell power system to improve overall
efficiency;
• reduce the cost of producing the fuel cell stacks;
• help fuel cells start faster and respond better to rapid changes in power requirements;
• increase durability and reliability in extreme operating conditions;
• improve the processing systems for hydrogen production and distribution. [10]
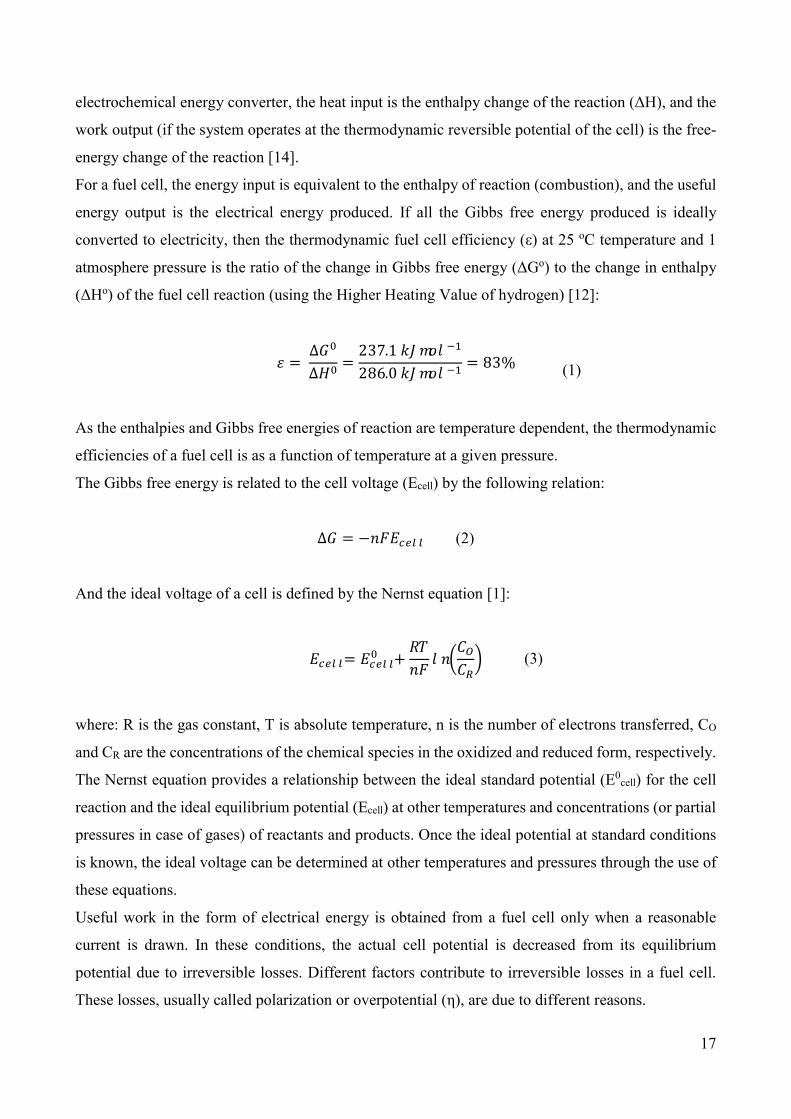
1.2.2. Fuel cell efficiency.
The ideal performance of a fuel cell depends on the electrochemical reactions that occur with different
fuels and oxygen. The efficiency is defined as the work output divided by the heat input. In an
17
electrochemical energy converter, the heat input is the enthalpy change of the reaction (ΔH), and the
work output (if the system operates at the thermodynamic reversible potential of the cell) is the free-
energy change of the reaction [14].
For a fuel cell, the energy input is equivalent to the enthalpy of reaction (combustion), and the useful
energy output is the electrical energy produced. If all the Gibbs free energy produced is ideally
converted to electricity, then the thermodynamic fuel cell efficiency (ε) at 25 oC temperature and 1
atmosphere pressure is the ratio of the change in Gibbs free energy (ΔGo) to the change in enthalpy
(ΔHo) of the fuel cell reaction (using the Higher Heating Value of hydrogen) [12]:
= Δ
Δ =
237.1
286.0 = 83%
As the enthalpies and Gibbs free energies of reaction are temperature dependent, the thermodynamic
efficiencies of a fuel cell is as a function of temperature at a given pressure.
The Gibbs free energy is related to the cell voltage (Ecell) by the following relation:
Δ = − (2)
And the ideal voltage of a cell is defined by the Nernst equation [1]:
= +
where: R is the gas constant, T is absolute temperature, n is the number of electrons transferred, CO
and CR are the concentrations of the chemical species in the oxidized and reduced form, respectively.
The Nernst equation provides a relationship between the ideal standard potential (E0cell) for the cell
reaction and the ideal equilibrium potential (Ecell) at other temperatures and concentrations (or partial
pressures in case of gases) of reactants and products. Once the ideal potential at standard conditions
is known, the ideal voltage can be determined at other temperatures and pressures through the use of
these equations.
Useful work in the form of electrical energy is obtained from a fuel cell only when a reasonable
current is drawn. In these conditions, the actual cell potential is decreased from its equilibrium
potential due to irreversible losses. Different factors contribute to irreversible losses in a fuel cell.
These losses, usually called polarization or overpotential (η), are due to different reasons.
(1)
(3)

18
- Activation overpotential (ηact): it is dominant at low current density, when the rate of an
electrochemical reaction at an electrode surface is controlled by sluggish electrode kinetics.
Therefore, the activation polarization is directly related to the rates of electrochemical reactions.
- Ohmic overpotential (ηohm): it is due to resistance to the flow of ions in the electrolyte and resistance
to flow of electrons through the electrode materials. Both the electrolyte and fuel cell electrodes obey
Ohm's law, therefore the ohmic losses can be expressed by the equation ηohm = iR where i is the
current flowing through the cell, and R is the total cell resistance (which includes electronic, ionic,
and contact resistance).
- Concentration overpotential (ηconc): it is important at high currents, where it becomes difficult to
provide enough reactant flow to the reactive sites. In facts, as a reactant is consumed at the electrode
at a high rate, there is a loss of potential due to the inability to maintain the initial concentration of
the bulk fluid (a concentration gradient is formed). The slow transport of reactants/products to/from
the electrochemical reaction site is the major contributor to concentration polarization.
- Other losses can be caused by fuel crossover from the anode through the electrolyte, resulting in a
mixed potential at the cathode, and also by internal currents. Fuel crossover and internal currents have
an effect on the voltage at open circuit (Vocv), which results to be lower than the ideal cell potential
(Ecell) [12,14].
The actual fuel cell voltage (Vcell) is given by:
Vcell = Vocv – η
Where: η = ηact + ηohm + ηconc
(4)

19
Figure 5. Typical PEM fuel cell polarization curve with the different losses [16].
The standard electrochemical technique for characterizing both single fuel cells and stacks is called
polarization curve. Here, the cell voltage is plotted as a function of current density (see Fig. 5).
However, polarization curves can only show the overall performance of the fuel cell. They cannot
distinguish within the different polarization losses [12].
1.2.3. Different types of low-temperature fuel cells.
When hydrogen is used as fuel, two different configurations of fuel cell with a polymeric membrane
electrolyte are possible. The first one is the PEMFC (Proton Exchange Membrane Fuel Cell), where
the membrane is a conductor of H+ ions. The second type is the AEMFC (Anion Exchange Membrane
Fuel Cell) or APEFC (Alkaline Polymer Electrolyte Fuel Cell), where the membrane is a conductor
of OH- ions. This substantial difference implies that, although the overall reaction between H2 and O2
is the same for both types of fuel cells:
2H + O → 2H O

20
the half-reactions that take place at the two electrodes (hydrogen oxidation at the anode and oxygen
reduction at the cathode) are different.
For a PEMFC (acidic conditions) we have:
HOR: 2H → 4H + 4e (E0 = 0.00 V vs SHE)
ORR: O + 4H + 4e → 2H O (E0 = +1.23 V vs SHE)
For an AEMFC (alkaline conditions) we have:
HOR: 2H + 4OH → 4H O + 4e (E0 = -0.83 V vs SHE)
ORR: O + 2H O + 4e → 4OH (E0 = +0.40 V vs SHE)
This implies that in the case of a PEMFC, the H+ cations are transported through the solid membrane
from the anode to the cathode, while in the case of an AEMFC the OH- anions are transported through
the membrane in the opposite direction, from the cathode to the anode.
As evident in the half-reactions, and shown in the schemes of Figure 6, water is not a direct reactant
in PEMFCs, while it is in APEFCs (it is consumed at the cathode). Moreover, water is generated at
cathode side of PEMFCs, otherwise it is generated at the anode in APEFCs.
The advantages of the PEMFC are mainly related to the membrane. The most commonly used
membrane material is a sulfonated tetrafluoroethylene based polymer (Nafion®), which has a
relatively low cost, and good mechanical and chemical properties.
On the contrary, the advantages of the AEMFCs over PEMFCs are related to the alkaline pH cell
environment. In these conditions the ORR catalysis is enhanced (allowing for the use of less
expensive Pt-free catalysts), and the operative conditions for the cell and stack materials are less
severe (allowing to use cheaper materials, and reducing corrosion problems of carbon based
materials). The most critical concerns for APEFC technology are the low conductivities and the
relatively poor stabilities of the alkaline polymer exchange membranes, and the carbonation problems
due to the presence of CO2 in the air [17].

21
Figure 6. Schematic comparison of a proton exchange membrane fuel cell (PEMFC, left) and an alkaline polymer electrolyte fuel cell (APEFC, right) that use H2 as fuel [17].
In alternative to H2, organic molecules like light alcohols can be directly used as fuels. In this case
the fuel cell devices are called Direct Alcohol Fuel Cells. In particular, methanol and ethanol are the
most commonly used alcohols due to their availability and low cost. Because of their simple chemical
structure, they can be more easily oxidized. Other more complex alcohols like ethylene glycol,
propanols and glycerol have also been tested, especially in direct alcohol AEMFC fuel cells [18].
In a direct methanol fuel cell (DMFC) working with a proton-conducting membrane (acidic
conditions) the reactions are the followings:
MOR: CHOH + H O → CO + 6H + 6e (E0 = +0.02 V vs SHE)
ORR: 3 2 O + 6H + 6e → 3H O (E0 = +1.23 V vs SHE)
If we operate with an OH- -conducting membrane (alkaline conditions) we have:
MOR: CHOH + 6OH → CO + 5H O + 6e (E0 = -0.81 V vs SHE)
ORR: 3 2 O + 3H O + 6e → 6OH (E0 = +0.40 V vs SHE)

22
Figure 7. Schematic comparison between a hydrogen or methanol-fuelled proton exchange membrane fuel cell (PEMFC) and an alkaline anion exchange membrane fuel cell (AEMFC) [19].
To operate with direct alcohol fuel cells in alkaline conditions has many advantages in comparison
with acid ones. In particular, alcohol oxidation is generally more facile at high pH. Therefore, it is
potentially possible to use cheaper and more abundant anode catalysts. Also, the ORR is kinetically
favored in alkaline conditions allowing to use Pt-free catalysts as stated before. In addition, the OH-
ions move through the membrane in the direction cathode anode, that is contrary to alcohol
crossover (anode cathode). This may mitigate the effect of alcohol crossover, especially at
higher currents. The crossover problem is particularly serious in acid DMFC when Nafion® material
is used as electrolyte [19]. However, the production of CO2 could cause problems in the alkaline
electrolyte due to the formation of carbonates.
1.2.4. The MEA structure – Factors that affect the performance of the fuel cell.
The MEA is the “core” component of PEMFCs and APEFCs. It is the place where the
electrochemical reactions occur. The MEA has a “sandwich” structure (as shown in the detail of
Figure 3), consisting of a gas diffusion layer (GDL) made of porous carbon paper or carbon cloth, a
microporous layer (generally carbon), a catalyst layer mixed with a certain quantity of ionomer (the
same type of the membrane), and the polymer electrolyte membrane. The same components are
repeated on the other side of the membrane, in reverse order. The MEA structure in the cathode side
of a PEM is shown in Figure 8. Here it is also shown the complex mechanism of transport of H+ ions,
O2 and electrons, which have to simultaneously be present in the catalytic active site, to give rise to
the oxygen reduction reaction. After that, H2O is generated as product, and has to be removed away
from the catalytic site back through the GDL, and finally to the flow channels.

23
Due to this complexity, all of the MEA components play an important role in the fuel cell system
operation. Therefore, to get a good performance, each one of them needs to be optimized.
Figure 8. Scheme of the transport of reactants (protons and gaseous O2), electrons and products (H2O) in a PEM fuel cell cathode [20].
Below we will analyze how the different parts of the MEA influence its operation.
Catalyst: its function is to catalyze the electrode reaction, so it must possess a good catalytic activity
(for ORR at the cathode side and for HOR or MOR at the anode side). Moreover, it must also have a
good electronic conductivity, to allow the electrons transport towards or away from the active sites.
In addition, the catalyst must be capable to resist at the strong acidic (or alkaline) environment of the
PEMFC (or AEMFC) for a reasonably long period, comparable to the life of the fuel cell.
So far, only noble metal-based catalysts, essentially Pt for ORR and HOR, and Pt-Ru alloys for MOR
have reached satisfactory results in terms of electroactivity and durability demonstrated on a large
scale. Due to Pt high cost, a high surface area per weight of catalyst is highly desirable. Therefore, to
maximize platinum utilization and minimize cost, platinum is dispersed in the form of nanoparticles
(2-10 nm diameter) on an electrically conducting, and relatively chemically inert support (generally
a carbon black). In this way, one of the best state-of-the-art Pt-utilization efficiency of 60 –70 kW/gPt
was achieved for catalyst layers with Pt-loadings as low as 0.01 – 0.02 mg/cm2 [21,22].
To make the electrodes, the two most common techniques are coating the catalyst ink on a gas
diffusion layer (GDL), or directly onto the membrane to form a catalyst coated membrane (CCM)
[12].
24
Another aspect of the catalyst that has to be considered is the selectivity. Pt is not a selective catalyst.
This is not a problem if H2 is used as fuel, due to its low permeation rate across the membrane. On
the contrary, when the fuel is methanol, non-negligible quantities cross the membrane and are
oxidized at the Pt cathode catalyst. This results in a lowered fuel cell performance and fuel utilization
[23]. For this reason, the research toward very selective catalyst for ORR is important.
Carbon electrode material (GDL, catalyst C support): the GDL has the main function of
homogeneously distribute the reactant gases inside the porous electrode, providing at the same time
a good electronic conductivity. The GDL also plays an important role in water removal away from
the catalyst layer. The GDL usually has a dual layer structure. The first layer (in contact with the
catalyst) is a microporous layer made of carbon powder and a hydrophobic agent (generally PTFE).
The latter serves to minimize the water flooding. The second layer is a macroporous conductive
carbon substrate consisting of the carbon paper or carbon cloth. Therefore, an ideal GDL should have
the following characteristics: appropriate hydrophobicity, surface that enhances good electronic
contact, high electronic conductivity, and effective mass-transport properties for the reactant gases
[12]. Regarding the C support for catalysts based on Pt nanoparticles, first, it must also provide a
good electronic conductivity. Second, it must be an effective support for the finely dispersed Pt
particles. To do this, it should have a sufficiently high surface area to ensure a high enough inter-
distance between the Pt particles, and avoid coalescence during long time operation [24]. However,
a too high surface area of the carbon support may result in Pt particles being located in very narrow
pores, not being in contact with the electrolyte and therefore not participating in the reaction. In
particular, for Pt catalysts supported on different carbons having surface areas in the range of 20 to
1500 m2g-1, it was found that the best performances were obtained with supports having a surface
area in the range of 250-300 m2g-1 [25]. Actually, Vulcan XC-72 (254 m2g-1 surface area) is currently
one of the most widely used carbon support materials for low-temperature fuel cell applications.
Membrane: the main polymer electrolyte membrane function is to separate the anode and cathode,
avoiding the direct mixing of fuel and oxidant, functioning as an electronic current insulator to avoid
short-circuit between the electrodes, while providing at the same time high ionic current conductivity.
The required properties for the polymer are high ionic conductivity (for H+ in the case of PEM, for
OH- in the case of AEM), good mechanical strength, good chemical stability under the fuel cell
operation conditions, low permeability to reactants, and low cost. Polymer electrolyte membranes
appear macroscopically like a single phase. However, microscopically there are two phases
chemically bonded to each other, each containing either hydrophilic or hydrophobic moieties, that
when hydrated, result in phase separation, with the hydrophilic moieties forming continuous
interconnected water containing channels [12].

25
The most commonly used polymer with a relatively low cost, low water drag, low gas permeability,
good mechanical properties (flexibility, strength), good chemical and thermal stability, and high
protonic conductivity is DuPont’s Nafion®. Its structure is similar to that of Teflon (see Figure 9A).
The hydrophilic moieties that facilitate proton transport are sulfonic acid groups. The -SO3- groups
are fixed to the polymer chain, while H+ can move throughout the membrane jumping from group to
group [26].
Regarding the anion exchange membrane the research is less advanced. Therefore, many different
chemical structures could be potential candidates for application in AEMFCs, providing better results
in terms of chemical and thermal stability will be achieved in the next future [27]. Some of the main
chemical species that could be used as alkaline solid polymer electrolyte are shown in Figure 9B.
Figure 9. Unit molecular structure of Nafion® proton exchange membrane electrolyte (A) and some examples of chemical structure of anion exchange groups capable to transport OH- ions [26,27].
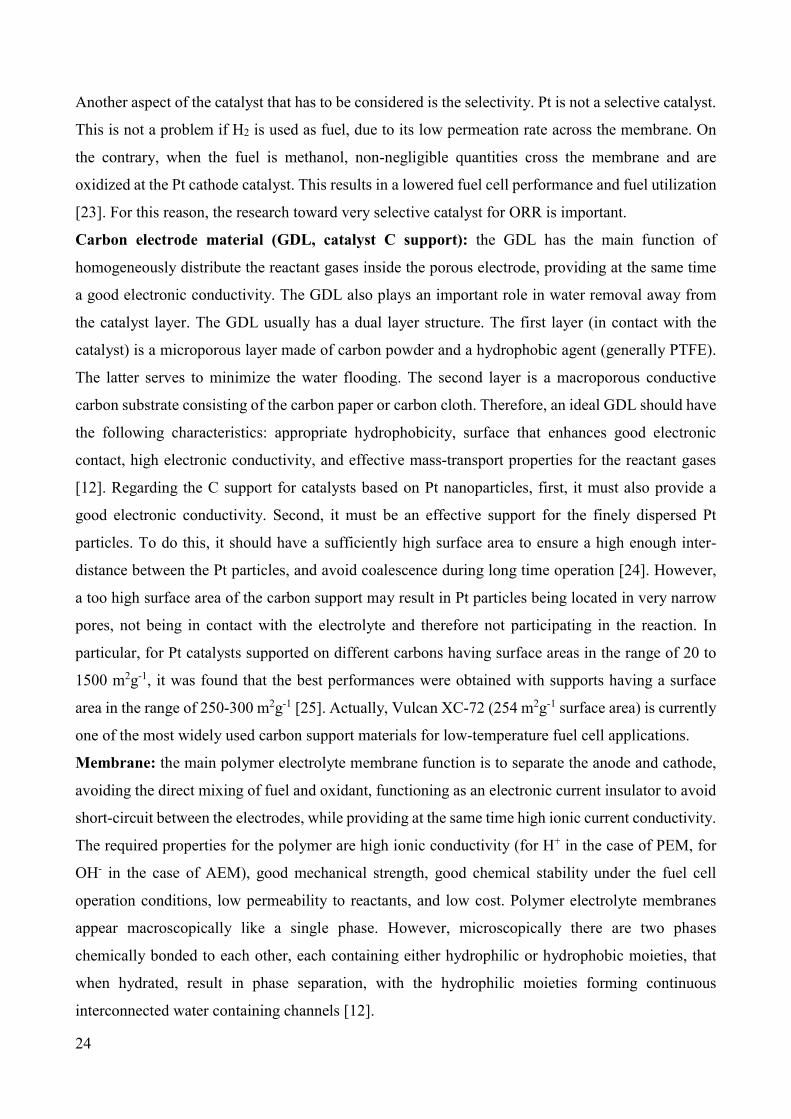
Quantity of ionomer in the catalyst layer: before being deposited on the GDL, the catalyst is
dispersed by an appropriate solvent (or mixture of different solvents) to form an ink [23]. In order to
ensure all of the catalyst’s active sites are in contact with the polymer electrolyte membrane (see
Figure 10), a certain amount of ionomer is added to the ink. For the preparation of the electrode ink,
the ionomer needs to be dissolved in a solvent. The relative amount of solid phase (catalyst + C-
support) and ionomer in the electrode catalytic layer has an important effect on the final fuel cell
performance, as evidenced by many studies [20,28,29]. In PEMFCs, the percentage of Nafion relative
to the total weight of the electrode has been recognized as a key parameter to obtain higher power
densities. In particular, the results obtained by various authors could be compared despite the varying
loadings, resulting that the optimal content of Nafion lay in the range of 30–40 wt. %.
A B
26
Figure 10. Schematic planar representation of the catalytic layer. (A) Too low Nafion content: not all the catalyst particles are connected to the membrane by a Nafion bridge. (B) Optimal Nafion content: good connections for ionic and electronic conduction for all the catalyst particles (C) Too high Nafion content: not all the catalyst particles are electronically connected to the diffusion layer [28].
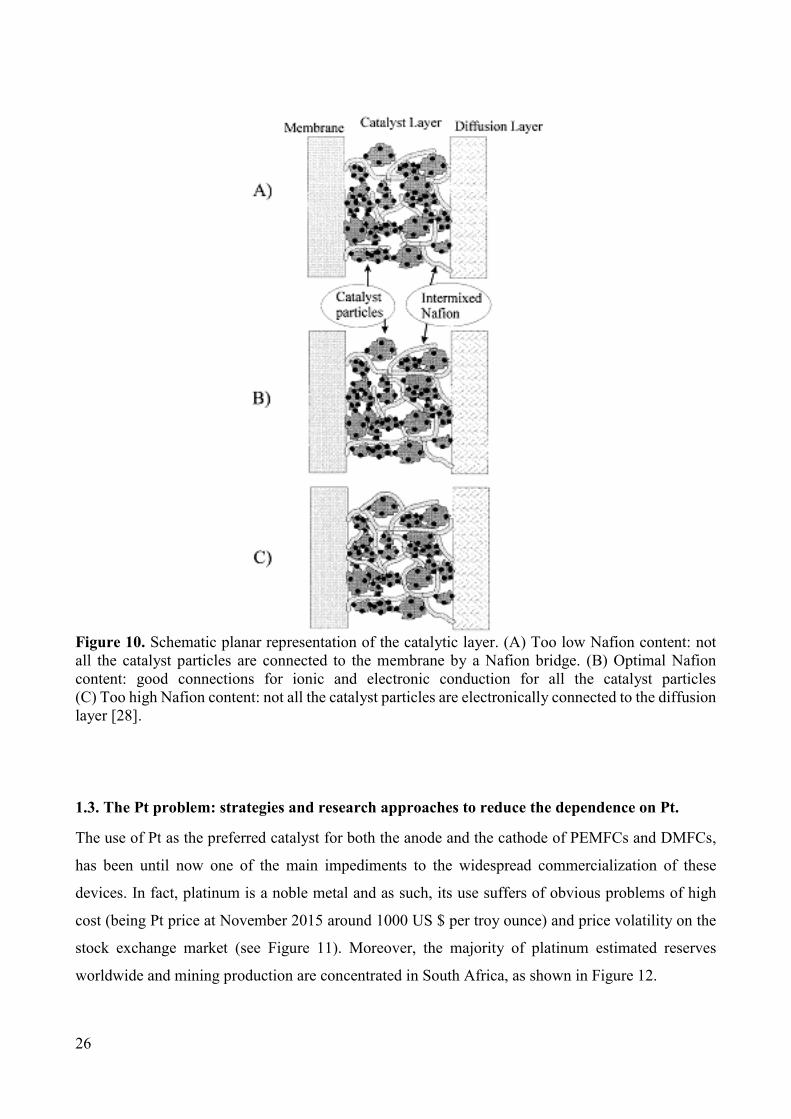
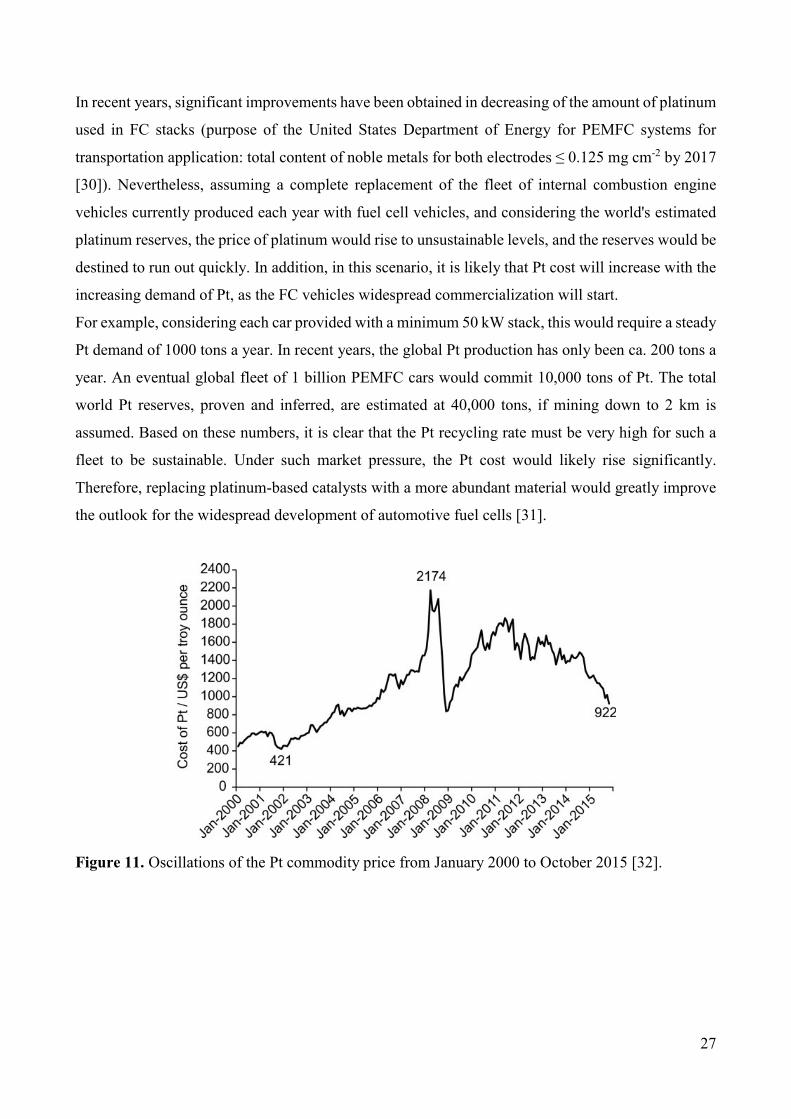
1.3. The Pt problem: strategies and research approaches to reduce the dependence on Pt.
The use of Pt as the preferred catalyst for both the anode and the cathode of PEMFCs and DMFCs,
has been until now one of the main impediments to the widespread commercialization of these
devices. In fact, platinum is a noble metal and as such, its use suffers of obvious problems of high
cost (being Pt price at November 2015 around 1000 US $ per troy ounce) and price volatility on the
stock exchange market (see Figure 11). Moreover, the majority of platinum estimated reserves
worldwide and mining production are concentrated in South Africa, as shown in Figure 12.
27
In recent years, significant improvements have been obtained in decreasing of the amount of platinum
used in FC stacks (purpose of the United States Department of Energy for PEMFC systems for
transportation application: total content of noble metals for both electrodes ≤ 0.125 mg cm-2 by 2017
[30]). Nevertheless, assuming a complete replacement of the fleet of internal combustion engine
vehicles currently produced each year with fuel cell vehicles, and considering the world's estimated
platinum reserves, the price of platinum would rise to unsustainable levels, and the reserves would be
destined to run out quickly. In addition, in this scenario, it is likely that Pt cost will increase with the
increasing demand of Pt, as the FC vehicles widespread commercialization will start.
For example, considering each car provided with a minimum 50 kW stack, this would require a steady
Pt demand of 1000 tons a year. In recent years, the global Pt production has only been ca. 200 tons a
year. An eventual global fleet of 1 billion PEMFC cars would commit 10,000 tons of Pt. The total
world Pt reserves, proven and inferred, are estimated at 40,000 tons, if mining down to 2 km is
assumed. Based on these numbers, it is clear that the Pt recycling rate must be very high for such a
fleet to be sustainable. Under such market pressure, the Pt cost would likely rise significantly.
Therefore, replacing platinum-based catalysts with a more abundant material would greatly improve
the outlook for the widespread development of automotive fuel cells [31].
Figure 11. Oscillations of the Pt commodity price from January 2000 to October 2015 [32].

28
Figure 12. Major countries in global mine production of platinum from 2010 to 2014 [33].
Currently, Pt-based catalysts contribute to a large portion of cost of a state-of-the-art PEMFC stack
[34–36]. A recent technical report from the United States Department of Energy [33] forecasted a
cost of 55 U.S.$/kW for a 80 kW stack containing Pt-based catalyst, produced as 500,000 units per
year (see Figure 13). In the cost breakdown of the stack, with Pt price accounted as 1,500 U.S.$ per
troy ounce [37], the cost of the catalyst plus its application accounts for 49% (20% only for purchasing
Pt) of the total price of the stack itself (Figure 13).
Figure 13. Cost breakdown of a 80 kW Platinum group metal (PGM)-based stack (assumptions done on 2013: Pt loading 0.153 mgPt cm–2; power density 692 mW cm–2; Pt price assumed as 1,500 U.S.$ per troy ounce; 500,000 units per year production [37]) and of a 80 kW non-noble metal (NNM)-based stack (assumptions done on 2015). NNM loading 4 mgcat cm–2; power density 370 mW cm–2; catalyst cost 0.35 U.S. $/kW; 500,000 units per year production [38].

29
Durability is an additional key factor affecting the PEMFC performance. In fact, platinum
dissolution/coalescence phenomena and carbon support corrosion are mainly responsible for PEMFC
degradation. Therefore, a breakthrough in the development of cost effective, highly performing and
durable catalysts has been identified as the determining factor for success toward PEMFC
commercialization [39–41], and the development of alternative cheaper catalysts is of primary
importance.
In order to overcome these problems, the USA Department of Energy has identified and carry out
two different research directions, as shown in Figure 14.
The first strategy is focused on low Pt loading electrocatalyst development. The second strategy is
focused on non-noble metal (NNM) cathodic electrocatalyst. In facts, Pt loadings are usually higher
on cathode than on anode of a PEMFC. In the acid environment of PEMFC (around pH 1), the
hydrogen oxidation reaction (HOR) on Pt is a faster electrochemical reaction than the oxygen
reduction reaction (ORR) on Pt. The latter reaction is notoriously slow. Consequently, about 5–10
times more Pt is needed at the cathode of PEM fuel cells than at the anode [39]. Therefore, a much
greater cost reduction can be achieved by replacing Pt with a lower cost non noble metal-based
catalyst at the cathode of PEM fuel cells [42].
However, for a long-term strategy toward commercialization, only NNM catalysts would be the
definitive solution to the problem of dependence on Pt [41]. A preliminary new cost breakdown
analyses estimate the cost of a NNM-based 80 kW PEMFC stack as 30 U.S.$/kW, with a cost of 0.35
U.S.$/kW for the NNM catalyst (see Figure 13) [38]. Considering the current average state-of-the-art
level of specific power density ranging from 300 to 400 mW cm–2 reached for NNM-catalysts [38],
the improvement of this parameter to levels close to the specific power density of Pt-based catalysts
(more than 700 mW cm–2 [37]) is crucial on the point of view of the stack size and dimensioning.

30
Figure 14. United States Department of Energy 2012 Technical Plans Targets for Fuel Cells: Electrocatalysts for Transportation Applications [30].
1.4. Electrocatalysis of ORR.
1.4.1. Theoretical aspects: Butler-Volmer equation and Tafel approximation.
The oxygen reduction reaction (ORR) is one of the most important reaction in life processes such as
biological respiration, and in energy converting systems such as fuel cells and metal-air batteries.

31
ORR in aqueous solutions occurs mainly by two pathways: the direct 4-electron reduction pathway
from O2 to H2O, and the 2-electron reduction pathway from O2 to hydrogen peroxide (H2O2).
In polymer electrolyte membrane (PEM) fuel cells, including direct methanol fuel cells (DMFCs),
ORR is the reaction occurring at the cathode. Normally, the ORR kinetics is very slow. In order to
speed up the ORR kinetics to reach a practical usable level in a fuel cell, a cathode ORR catalyst is
needed [43].
In order to minimize the losses due to cathodic activation overpotential, it is desirable that the ORR
occurs at potentials as close as possible to the eversible electrode potential (thermodynamic electrode
potential) with a satisfactory reaction rate.
We can represent the elementary reaction in a simple model: O + n e R
where O and R represent the oxidant and reductant, and nα is the number of electrons transferred in a
simple elementary reaction, which is different from the overall electron-transfer number (n) in a
complex reaction such as ORR is. In fact, for a complex electrochemical reaction, the reaction
mechanism consists of several elementary reactions, among which there should be one such
elementary reaction as the reaction rate-determining step. The value of nα is normally 1.
If we define E as the electrode potential and Eeq as the equilibrium potential for the electrochemical
reaction (for ORR Eeq = 1.23 V vs SHE), the overpotential (η) is given by:
η = E – Eeq
Considering an elementary reaction, the relation between the current density and the overpotential is
given by the Butler-Volemr equation [15,44,45]:
= exp
− exp−
Where:
i is the current density;
i0 is the exchange current density;
nα is the number of electrons transferred in the rate determining step;
αa and αc are the anodic and cathodic transfer coefficients respectively (αa + αc = 1);
η is the overpotential;
F is the Faraday constant;
R is the gas constant;
T is the absolute temperature.
The exchange current density (i0) represents either the forward or backward current density when the
forward and the backward reaction rates become equal, in other words, when the reaction is at the
equilibrium state, and the net current in the system is zero.
(5)

32
As evident from the Butler-Volmer equation, overpotential is the driving force of the electrode
reaction: the larger the overpotential, the faster the electrode reaction rate would be. It is also evident
that if the overpotential is high enough (i.e. < -60 mV), the first term in equation (5) becomes much
smaller than the first one, and can be neglected. Therefore, the equation (5) can be rewritten as
follows:
= − exp−
(6)
That is, in linearized form:
= −
ln()+
ln ()
This is called Tafel equation, which gives a linear relationship between the potential and the logarithm
of the current density. From the intercept and the slope of the straight line, both the exchange current
density and the transfer coefficient can be calculated. The slope is called the “Tafel slope”. The higher
the Tafel slope, the faster the overpotential increases with the current density. Thus, for an
electrochemical reaction to obtain a high current at low overpotential, the reaction should exhibit a
low Tafel slope [43].
1.4.2. Electrochemical experimental techniques for ORR activity measurements.
Three-electrode electrochemical cell.
The three-electrode cell setup is the most common electrochemical cell configuration used to measure
the ORR activity data. As shown in Figure XX, it counts of three electrodes, a reference electrode
(RE), a working electrode (WE) and a counter electrode (CE) [46].
The RE is an electrode with a stable and well-known electrode potential and it is used as a point of
reference in the electrochemical cell for the potential control and measurement. The high stability of
the reference electrode potential is usually reached by employing a redox system with constant
concentrations of each specie in the redox reaction. The current flow through the reference electrode
is kept close to zero.
The WE is the electrode on which the reaction of interest is occurring. Working electrodes must be
made of an inert material for the reaction of interest, and for the reaction environment. In particular,
for experiments involving catalysts for ORR, the catalyst under examination is usually deposited on
a WE made of glassy carbon (GC).
The CE is used to close the current circuit in the electrochemical cell. It is usually made of an inert
material (e.g. Pt, Au, graphite, glassy carbon) and it does not participate in the electrochemical
reaction. Because the current is flowing between the WE and the CE, the total surface area of the CE
(6)
(7)

33
(source / sink of electrons) must be higher than the area of the WE so that it will not be a limiting
factor in the kinetics of the electrochemical process under investigation.
As shown in Figure 15, the current flows between the CE and the WE. The potential difference is
controlled between the WE and the CE and measured between the RE (kept at close proximity of the
WE) and the WE. The potential difference between RE and WE is controlled by controlling the
polarization of the CE. The potential between the WE and CE usually is not measured. It is adjusted
so that the potential difference between the WE and RE will be equal to the potential difference
specified by the user. This configuration allows the potential across the electrochemical interface at
the WE to be controlled with respect to the RE.
Figure 15. 3-electrodes electrochemical cell configuration [47].
Rotating Disk Electrode (RDE)
The Rotating Disk Electrode apparatus is a special type of 3-electrodes electrochemical cell, where
the WE can be put in rotation precisely controlling the rotating rate. In this way, a quantitatively
control of diffusion layer thickness is realized, resulting in feasible quantitative analysis of the
electrode reaction kinetics. Due to the solution convection, the reactant (oxygen) dissolved in the
solution will move together with the convection at the same transport rate [48,49].
Figure 16-A shows a schematic structure of the RDE. The disk electrode’s surface is plane and it is
in contact with the electrolyte solution. An electric insulator (e.g. Teflon) covers the remaining part
of the electrode. An electrical brush is used to make the electrical connection between the electrode
shaft and the electric cable. When the electrode is rotating, the solution runs from the bulk to the
surface, and then it is flushed out along the direction parallel to the disk surface, as shown in Figure
16-B [48].

34
Figure 16. Scheme of the rotating disk electrode (A). Solution flow pattern near the disk electrode surface (B): x is the coordinate direction perpendicular to the disk electrode surface, r is the coordinate direction parallel to the disk surface, and Φ is the coordinate direction of the electrode rotation, respectively [48].
The main equation governing the RDE operation is the Koutecky-Levich equation:
1
=
1
+
1
where I is the current measured at the disk electrode.
IK is the kinetic current density, that is, the current that would flow under the kinetic limitation if the
mass transfer were efficient enough to keep the concentration at the electrode surface equal to the
bulk value, regardless of the electrode reaction [15]:
=
Γ
Where: n is the overall electron transfer number, F is the Faraday’s constant, A is the electrode area,
KO2 is the kinetic constant of ORR, CO2 is the concentration of dissolved O2, and Γcat is the catalyst
loading on the electrode.
IL is the limiting current (or Levich current), which represents the height of the sigmoidal wave
observed in rotating disk voltammetry. In fact, for high overpotential values, there is no more kinetic
limitation for the electrochemical reaction, and the concentration of the electroactive species at the
(8)
(9)

35
electrode surface becomes is zero. Therefore, the current at the disk depends only from the diffusional
processes, that is, from the electrode’s rotation speed.
= 0.62
// /
Where: n is the overall electron transfer number, A is the electrode area, F is the Faraday’s constant,
CO2 is the concentration of dissolved O2, DO2 is the diffusion coefficient of O2 in the electrolyte
solution, υ is the kinematic viscosity of the electrolyte solution, and ω is the electrode rotation speed
[48]. In particular, recording the electrode polarization curve at different ω, (being all the other
parameters known), it is possible to calculate the overall electron transfer number (n) form the slope
of the plot of IL-1 vs ω-1/2.
Figure 17. (A) RDE experimental setup for ORR tests in Politecnico di Torino – Green2 Group Laboratory: RDE apparatus (Mod. ALS RRDE-3A) + Potentiostat (Mod. Bio-Logic SP-150). (B) Detail of the RDE 3-electrode electrochemical cell. (C) RDE apparatus coupled with thermostatic bath vessel used for measurement at different temperatures.
(10)
A
C B

36
Figure 18. RDE experimental setup for ORR test in Universidad Autónoma de Madrid (UAM): RDE (Mod. PINE) + 3-electrode electrochemical cell (A), potentiostat-galvanostat (MOD. Auto-PG EG&G273A) (B), RDE rotation speed controller (Mod. PINE) (C).
Gas Diffusion Electrode (GDE)
In a 3-electrodes cell configuration equipped with a gas diffusion electrode, the working electrode is
substantially a half-MEA. That is, a piece of gas diffusion layer (GDL) is mounted into a holder
A B
C

37
provided with a current collector. The GDL side covered with a catalyst layer is put in contact with
the electrolyte solution and the back side is in contact with a chamber with a gaseous oxygen flow
[50,51]. Optionally, a piece of membrane can be put on the catalyst layer, being in this way the system
even more similar to a MEA [52,53].
As an example, in Figures 19 it is shown the GDE cell device that we used for our tests. In Figure 20
it is shown the preparation of the electrode.
Figure 19. Pictures (A-B) and scheme (C-D) of the GDE cell in Politecnico di Torino – Green2 Group Laboratory.
A B
C D

38
Figure 20. Pictures of the Gas Diffusion Electrode preparation: catalyst ink deposition on the GDL (A), GDL disk cutting (B) and positioning in the holder of the plexiglass cell (C).
Single Fuel Cell testing.
Testing a catalyst in a complete fuel cell device is the final step for the validation of its performances.
This test is more complicated, costly and time consuming than the test in the 3-electrodes cell
configuration, and it is usually performed after screening the ORR activity of a catalyst in RDE or
GDE cell. However, the real performance of the catalyst in a fuel cell can be assessed. In this way, in
addition to the ORR catalytic activity of the material, also other aspects like reactant and products
mass transport problems (i.e. O2 gas diffusion, H+ transport through the membrane and the ionomer
in the catalyst layer, water flooding) can be evaluated. Concerning the catalyst durability problem,
the performance of the catalyst in a real fuel cell operating environment (e.g. temperature, pressure,
pH, fuel crossover) can be assessed.
Many different operative variables must be considered in performing the test. In testing cathodic
catalysts for ORR, a standard commercial Pt or Pt-Ru based catalyst (for H2 and methanol fueled fuel
cells, respectively) is usually used at the anode. Cell temperature, electrolyte membrane type and
thickness, reactants pressure and flow rate are other variables to be chosen. In case of liquid fuel (i.e.
direct alcohol fuel cells), its concentration must also be chosen. For gaseous reactants, the possibility
of humidification of the gas stream should also be considered. All these operating conditions have an
influence on the performance of the fuel cell.
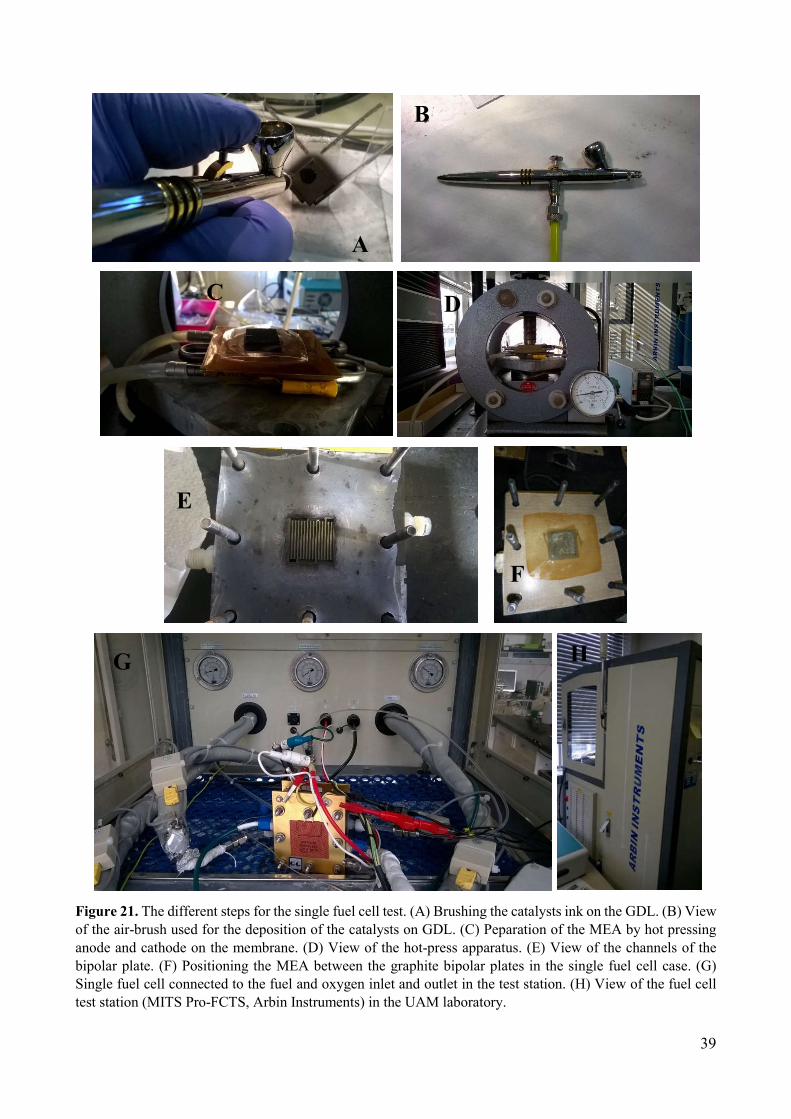
In the pictures of Figure 21, the different steps of the preparation of a MEA for the test in the single
fuel cell station are shown.
A B C
39
Figure 21. The different steps for the single fuel cell test. (A) Brushing the catalysts ink on the GDL. (B) View of the air-brush used for the deposition of the catalysts on GDL. (C) Peparation of the MEA by hot pressing anode and cathode on the membrane. (D) View of the hot-press apparatus. (E) View of the channels of the bipolar plate. (F) Positioning the MEA between the graphite bipolar plates in the single fuel cell case. (G) Single fuel cell connected to the fuel and oxygen inlet and outlet in the test station. (H) View of the fuel cell test station (MITS Pro-FCTS, Arbin Instruments) in the UAM laboratory.
A
B
C D
E
F
G H

40
1.5. Non Precious Metal Catalysts (NPMC) for ORR.
In 2005, a detailed review by Gasteiger et al. [39] highlighted the fact that even a Pt-free catalyst
having a volumetric activity (A cm-3 of catalytic layer) less than 1/10 of a Pt/C catalysts could never
be used for automotive applications due to the very tight volumetric constraints when designing an
automobile. Fortunately, several breakthroughs since 2005 have led to significant advances in the
activity of NPMC. Therefore, in addition to strictly focusing only on ORR activity improvements,
the optimization of the catalyst layer has become a crucial area of work for NPMC researchers. In
fact, the much lower ORR activity of NPMCs versus Pt/C has necessitated much thicker cathode
catalyst layers (~100 µm for NPMC versus ~12 µm for Pt/C [54]) and it has become widely known
that thick catalyst layers result in mass transport limitations [55].
The targeted Pt loading for automotive application is 0.1mgcm-2 per electrode in 2015. While a
negligible performance decay occurs when the anode Pt loading is reduced from 0.4 to 0.1 mg cm-2,
an equal reduction at the cathode without adverse effects on the performance requires that the mass
activity of Pt catalysts be increased by 4-fold [56]. This explains the major focusing on the research
about alternative catalysts to replace Pt at the cathode side of the fuel cell than to the anode side.
Despite the great advances in activity, the NPMC have shown remarkably poor stability and
durability. Stability refers to the ability to maintain performance at constant current conditions while
durability refers to the ability to maintain performance following a voltage cycling accelerated stress
test. In the literature, three main mechanisms of instability for NPMCs are generally proposed [55]:
1) dissolution/leaching of the active metal site;
2) oxidative attack by H2O2 or the resulting free radicals;
3) protonation of the active site or protonation of a N species neighbouring the active site followed
by anion adsorption.
Regardless of the mechanism, state-of-the-art NPMCs have still demonstrated poor stability when
tested in a membrane electrode assembly (MEA).
1.5.1. Different types of NPMC.
M-N-C catalysts.
The most promising NPMC for ORR in low-temperature fuel cell application are carbon-supported
transition metal/nitrogen (M–Nx/C) materials (M = Co, Fe, Ni, Mn, etc., and normally x = 2 or 4).
They have gained increasing attention due to their promising catalytic activity towards ORR, along
with the utilization of abundant and inexpensive precursor materials. It was demonstrated since from
1964 that transition metal macrocyclic molecules like porphyrins and phthalocyanines could act as
ORR electrocatalysts. However, they showed stability issues, as the catalyst structure decomposition
in acidic media, resulting in a loss of catalytic activity. A significant breakthrough was achieved when

41
high temperature heat treatment (400 – 1000 °C) were introduced to the catalyst synthesis process.
This approach modify the structure of M–Nx/C materials, increasing the concentration of available
ORR active sites while at the same time improving the catalyst stability [57].
Therefore, due to the structure modification after the high temperature heat treatment, it was proposed
that the particular use of transition metal macrocycle compounds was not strictly required, and that
catalytically active sites could be formed with a variety of different metal, nitrogen and carbon
precursor materials. The only requirement for the production of ORR active sites is that elemental
metal ions (Fe, Co, etc.) a source of carbon (carbon support, molecule, polymer), and a source of
nitrogen (macrocycle, N-bearing molecule or polymer, N-containing gas) are simultaneously present
during the heat-treatment [31].
Conductive polymers
Conductive polymers such as polypyrrole, polyaniline, polythiophene, poly-3-methyl-thiophen, poly-
3,4-ethylenedioxythiophene, characteristically display mixed metal and polymer like properties and
are considered ideal for many applications due to their low cost, high electronic conductivity and
redox properties [57]. Conductive polymers have been investigated as non-precious ORR
electrocatalysts in three different ways:
- utilizing conductive polymers as ORR electrocatalysts on their own [58,59];
- incorporating non-precious metal complexes into the conductive polymer matrix [58–61];
- employing conductive polymers as a nitrogen/carbon precursor material for preparing M–Nx/C
catalysts via a high-temperature heat treatment, as described before [62,63].
Non-precious transition metal chalcogenides.
Many different types of non-precious transition metal chalcogenides have been demonstrated to have
a potential application as ORR electrocatalysts. These materials can be indicated as MzN3-zX4, where
M = Mn, Fe, Co, Ni, Cu or Zn, N = Ti, V, Cr, Fe, Co or Ni and X = S, Se or Te. However, their ORR
activity and stability are still significantly lower than those of commercially available Pt/C catalyst,
and furthermore, lower than those of precious metal chalcogenide compounds like for example Mo-
Ru-Se. The research is focusing in developing novel non-precious chalcogenides (including new
binary and ternary combinations) along with the optimization of bulk and surface properties. The use
of a carbon support could also improve the dispersion and consequently the reactive surface area of
transition metal chalcogenide particles [57].
Non-precious transition metal oxides.
Non-precious transition metal oxides like zirconia, tungsten oxide and cobalt oxides possess
reasonable ORR activity and stability in alkaline media. However, despite suitable stability in acidic
and oxidizing conditions, their limited ORR activity still remains a challenge [64,65]. The low ORR

42
activity is attributed to the low conductivity and poor adsorption of oxygen on the surface suggesting
they may not be suitable as cathode catalysts for acidic fuel cells. Regardless, numerous studies have
been reported in recent years investigating the potential application of metal oxide composites as
ORR electrocatalysts. However, their performance is still not sufficient enough for practical usage as
acidic fuel cell cathode catalysts. For developing more active and stable ORR catalysts, more research
is necessary in order to provide facile O2 adsorption and enhanced electronic conductivity, coupled
with improved stability in acidic media [57].
Non-precious transition metal nitrides.
Transition metal nitrides have shown relatively good stability in acidic conditions and under high
electrochemical potentials. Therefore they could be considered as potential ORR electrocatalysts. For
example, carbon supported tungsten nitride (W2N/C) was investigated using a single PEM fuel cell
setup, where significant stability after 100 hours of operation was observed [66]. Although the ORR
activity of this material was relatively low (ORR onset potential of 0.6 V vs. RHE), its high stability
renders it as a promising non-precious electrocatalyst. Molybdenum nitride materials were also
investigated as ORR electrocatalysts [67]. When supported on carbon black, these Mo2N/C catalyst
materials were found to display an open circuit potential of over 0.7 V in a single fuel cell setup.
Non-precious transition metal oxynitrides.
Metal oxynitrides are another kind of materials which show some ORR activity. These materials are
commonly obtained by substitutionally doping nitrogen into metal oxides. This doping could
effectively reduce the high inherent band gap of metal oxides, leading to enhanced electron
conducting properties important to electrocatalysis [68]. Ta oxy-nitrides were investigated as ORR
electrocatalysts and found to have a promising onset potential of 0.8V vs RHE.216 In addition, the
incorporation of carbon into this kind of material could also further enhance their ORR activity [69].
Another example is carbon supported zirconium oxynitride (ZrOxNy/C) catalysts formed by
pyrolyzing ZrO2/C at a high temperature in the presence of ammonia. This catalyst material gave an
ORR onset potential of 0.7 V vs. RHE [70].
Enzymatic compounds
The extremely high onset potential and ORR activity observed on several naturally occurring oxygen
reducing oxidase enzymes has stimulated in recent years the exploration of enzyme modified
electrodes as alternative non-precious fuel cell cathode materials [57]. However, these systems have
many issues, like the strict ORR activity dependency on temperature and pH [71]. Enzyme based
catalysts in fact, could only give optimal activity at mildly acidic conditions [72]. Moreover,
considering their issues with stability, utilizing these types of materials as PEM fuel cell cathode
catalysts may not be realistic [57].

43
1.5.2. The best “state-of-the-art” NPMC.
Until now the maximum FC performance using NPMC catalysts available in the literature are listed
in Table 1. They all belong to the M-N-C pyrolyzed (heat treated at high temperature) catalysts.
Table 1. Performance of NNM catalysts available in the literature measured in single cell PEMFC at 80 °C, fully humidified H2 and O2.
Research
group
Starting precursors of Fe-NX-C
catalysts developed, and pyrolyzation conditions
Max power
density
mW cm–2
Specific power
density
mW mgcat–1
PEMFC conditions used
Lefèvre et al. [73]
Black Pearls 2000 mixed with iron acetate, ball milling.
Pyrolyzation @ 1050 °C in NH3
280 280 5 cm2 MEA Nafion 117, cathode: 5 mgNNM cm–2; anode:
0.5 mgPt cm–2 (Pt/C 20 wt.%), 1 bar gauge, 0.5 bar attributed to
water vapour
Wu et al. [62]
Ketjenblack EC 300J mixed with aniline, ammonium
peroxydisulfate, iron chloride, and cobalt nitrate. Two
pyrolyzations in N2 from 400 to 1000 °C with intermediate acid leaching
550 138 5 cm2, MEA Nafion 1135, cathode: 4 mgNNM cm–2; anode:
0.25 mgPt cm–2, 2.8 bar gauge
Cheon et al. [74]
FeTMPPCl, CoTMPP and SBA15. Pyrolization @ 800 °C
in N2
700 460 25 cm2 MEA Nafion 212, cathode: 1.52 mgNNM cm–2;
anode: 0.425 mgPt cm–2 (Pt/C 60 wt.%), 2 bar, gauge, 0.47 attributed to water vapour
Zitolo et al. [75]
ZIF-8, 1,10-phenanthroline and iron acetate. Pyrolization @ 1050 °C in Ar and 5 min @ 950
°C in NH3
528 132 5 cm2 MEA Nafion 211, cathode: 4 mgNNM cm–2; anode: 0.5 mgPt cm–2, 1 bar gauge
Strickland al. [76]
2-methylimidazole, zinc nitrate, 1,10 phenanthroline, iron acetate.
Pyrolyzation @ 1050 °C in Ar and 18 min @ 1050 °C in NH3
380 127 5 cm2 MEA Nafion 211, cathode: 3 mgNNM cm–2; anode:
0.25 mgPt cm–2 (Pt/C 20 wt.%), 1.5 bar gauge
Zhao et al. [77]
Imidazole, ZnO, f tris-1,10-phenanthroline, iron(II) perchlorate (TPI). Pyrolyzation
@ 1050 °C in Ar, acid leaching, pyrolyzation 15 min @ 950 °C in
NH3
620 282 5 cm2 MEA Nafion 211, cathode: 2.2 mgNNM cm–2; anode: 0.25 mgPt cm–2 (Pt/C 20
wt.%), 1.5 bar gauge
Different approaches have been adopted to synthesize the active NNM catalysts listed in Table 1. For
the first one, ammonia was used as nitrogen source fluxing it into a hot tubular furnace containing the

44
mixture of carbon and transition metal [73]. For the second one, aniline was polymerized in presence
of a transition metal, then two consecutive pyrolyzations were performed [62]. For the third one, a
dry macrocyclic molecule was mixed with a porous silica template and then pyrolyzed in order to
obtain a porous catalyst [74]. For the fourth one a commercial metal organic framework, zeolitic
imidazolate framework (MOF ZIF-8), 1,10-phenanthroline and Fe(II) acetate were dry mixed
together in a ball mill, then pyrolyzed first under argon for 1 h and then under ammonia at 950 °C for
5 min, no intermediate acid leaching was performed [75]. For the fifth one, 1,10 phenanthroline,
Fe(II) acetate, 2-methylimidazole and Zn(II) nitrate were mixed together to obtain a complex used to
impregnate an in-house synthesized MOF. Two pyrolysis steps followed, first under argon at 1050
°C for 1 h, then under ammonia for 18 min, without intermediate acid leaching [76]. For the sixth
catalyst, 5% of tris-1,10-phenanthroline Fe(II) perchlorate was mixed with ZnO and imidazole,
grinded and sealed in an autoclave for 18 h at 180 °C. The product was first pyrolyzed at 1050 °C for
1 h under argon followed by a second pyrolysis under ammonia for 15 min at 950 °C, with an
intermediate acid leaching [77]. In these six different syntheses, high temperature and porosity of the
support play an important role in the production of highly active electrocatalyst as well as the
pyrolysis atmosphere and the transition metals used.
1.5.3. Different proposed theories for the ORR active sites in M-N-C catalysts.
Despite decades of research, the nature of the catalytic sites in M-N-C non-noble metal catalysts for
ORR is still a topic of debate. The major debate is about the role of the transition metal: is it an active
participant in the ORR or it is not?
Starting from a precursor where the M-N4 structure of the chelate is present, what happens to this
structure during the thermal treatment in inert gas (i.e. N2 or Ar)? This topic was strongly debated in
the past, and it is still not completely understood today. Essentially, three models of the catalytic site
for ORR were presented, one each by the research groups of van Veen, Yeager, and Wiesener,
respectively [42].
- van Veen theory: the thermal treatment at temperatures at which catalytic activity is maximum
(500 - 600 °C) does not lead to the complete destruction of the M-N4 structure, but just to a
modification which keeps the M-N4 moiety intact, remaining the ORR active site structure the
same as for the unpyrolyzed macrocyclic molecules.
- Yeager theory: the decomposition of M-N4 macrocyclic structure starts at about 400 - 500 °C and,
going at higher temperatures (800 - 850 °C), most of the coordinated transition metal becomes a
mixture of oxides and metal, which spontaneously oxidize when exposed to air at room
temperature. Upon contact with an electrolyte solution, the oxide species undergo dissolution, and

45
metallic ions subsequently adsorb or coordinate to the thermally formed N-containing sites on the
carbon surface. These N-containing sites are different from the macrocycle-like M-N4 structures,
differently from what proposed by van Veen. The resulting M-Nx-C structure, is believed to be the
catalytic site for ORR.
- Wiesener theory: the role of the transition metal ions initially present in the M-N4 structure of the
precursor is to promote the decomposition of the chelate during the heat treatment. This leading to
the formation, of C-Nx, a special form of N-doped carbon, that is the true catalyst. In this case, the
metal would be only a “catalyst” for the formation of the active sites, but it has no role in the ORR.
References
[1] https://sustainabledevelopment.un.org/topics UN Sustainable Development Goals, Target 7,
accessed on 24/10/2015.
[2] http://www1.eere.energy.gov/vehiclesandfuels/pdfs/basics/jtb_hydrogen.pdf , accessed on
24/10/2015.
[3] M.A. Ashraf, G. Ercolino, S. Specchia, V. Specchia. Final step for CO syngas clean-up:
Comparison between CO-PROX and CO-SMET processes. Int. J. Hydrogen Energy 39 (2014)
18109–18119.
[4] C. Lemke, F. Grueger, O. Arnhold. MELY: Market Model for Water Electrolysis – Electrolysis’
Economic Potential given its Technological Feasibility. Energy Procedia 73 (2015) 59–68.
[5] https://www.iea.org/publications/freepublications/publication/hydrogen.pdf , accessed on
24/10/2015.
[6] http://www.fueleconomy.gov/feg/fuelcell.shtml , accessed on 24/10/2015.
[7] http://www.fueleconomy.gov/feg/fcv_benefits.shtml , accessed on 24/10/2015.
[8] http://www.horizonfuelcell.com/#!small-rmfc-systems/ca0q , accessed on 25/10/2015.
[9] http://www.sefca.com.au/portable-fuel-cells , accessed on 25/10/2015.
[10] http://www1.eere.energy.gov/vehiclesandfuels/pdfs/basics/jtb_fuel_cell.pdf , accessed on
24/10/2015.
[11] http://physics.nist.gov/MajResFac/NIF/pemFuelCells.html , accessed on 25/10/2015.
[12] http://knowledge.electrochem.org/encycl/art-f04-fuel-cells-pem.htm , accessed on 25/10/2015.
[13] V. Mehta, J.S. Cooper. Review and analysis of PEM fuel cell design and manufacturing. J. Power
Sources 114 (2003) 32–53.

46
[14] Fuel Cell Handbook (Fifth edition) EG&G Services Parsons, Inc., Science applications
international corporation, Morgantown, West Virginia, U.S. Department of Energy, 2000.
[15] J.A. Bard, L.R. Faulkner, Electrochemical Methods – Fundamentals and Applications (Second
Edition), John Wiley & sons, Inc., New York, 2001.
[16] A.S. Aricò, Processi, materiali e metodologie per celle a combustibile – Scuola divisionale di
elettrochimica, Pavia, 19-09-2013 (slides).
[17] J.R. Varcoe, P. Atanassov, D.R. Dekel, A.M. Herring, M.A. Hickner, P.A. Kohl, A.R. Kucernak,
W.E. Mustain, K.Nijmeijer, K. Scott, T. Xu, L. Zhuang. Anion-exchange membranes in
electrochemical energy systems. Energy Environ. Sci. 7 (2014) 3135–3191.
[18] A. Napoleao Geraldes, D.F. da Silva, L. Gondim de Andrade e Silva, E.V. Spinacé, A. Oliveira
Neto, M. Coelho dos Santos. Binary and ternary palladium based electrocatalysts for alkaline direct
glycerol fuel cell. J. Power Sources 293 (2015) 823–830.
[19] J.R. Varcoe, J.P. Kizewski, D.M. Halepoto, S.D. Poynton, R.C.T. Slade, F. Zhao. FUEL CELLS
– ALKALINE FUEL CELLS | Anion-Exchange Membranes. In: J. Garche (Ed.), Encyclopedia of
Electrochemical Power Sources, Elsevier, 2009, pp. 329–343. doi:10.1016/B978-044452745-
5.00937-0
[20] Litster S., McLean G., PEM fuel cell electrodes, Journal of Power Sources 130 (2004) 61–76.
[21] M. Breitwieser, M. Klingele, B. Britton, S. Holdcroft, R. Zengerle, S. Thiele. Improved Pt-
utilization efficiency of low Pt-loading PEM fuel cell electrodes using direct membrane deposition.
Electrochemistry Comm. 60 (2015) 168 –171.
[22] S. Martin, B. Martinez-Vazquez, P.L. Garcia-Ybarra, J.L. Castillo. Peak utilization of catalyst
with ultra-low Pt loaded PEM fuel cell electrodes prepared by the electrospray method. J. Power
Sources 229 (2013) 179 –184.
[23] R. Escudero-Cid, M. Montiel, L. Sotomayor, B. Loureiro, E. Fatás, P. Ocón. Evaluation of
polyaniline-Nafion® composite membranes for direct methanol fuel cells durability tests. Int. J.
Hydrogen Energy 40 (2015) 8182–8192.
[24] F. Jaouen, Electrochemical Characterisation of Porous Cathodes in the Polymer Electrolyte Fuel
Cell, 2003, PhD thesis.
[25] J. Fournier, G. Faubert, J.Y. Tilquin, R. Côté, D. Guay, J.P. Dodelet. High‐Performance, Low Pt
Content Catalysts for the Electroreduction of Oxygen in Polymer‐Electrolyte Fuel Cells. J.
Electrochem. Soc. 144 (1997) 145–154.
[26] X. Zhou, Z. Chen, F. Delgado, D. Brenner, R. Srivastava. Atomistic Simulation of Conduction
and Diffusion Processes in Nafion Polymer Electrolyte and Experimental Validation. J. Electrochem.
Soc. 154 (2007) B82-B87.

47
[27] G. Merle, M. Wessling, K. Nijmeijer. Anion exchange membranes for alkaline fuel cells: A
review. J. Membrane Sci. 377 (2011) 1–35.
[28] E. Passalacqua, F. Lufrano, G. Squadrito, A. Patti , L. Giorgi. Nafion content in the catalyst layer
of polymer electrolyte fuel cells: effects on structure and performance. Electrochim. Acta 46 (2001)
799–805.
[29] T. Frey, M. Linardi. Effects of membrane electrode assembly preparation on the polymer
electrolyte membrane fuel cell performance. Electrochim. Acta 50 (2004) 99–105.
[30] http://www1.eere.energy.gov/hydrogenandfuelcells/mypp/pdfs/fuel_cells.pdf , accessed on
03/11/2015.
[31] F. Jaouen, E. Proietti, M. Lefèvre, R. Chenitz, J-P Dodelet, G. Wu, H.T Chung, C.M. Johnston,
P. Zelenay. Recent advances in non-precious metal catalysis for oxygen-reduction reaction in
polymer electrolyte fuel cells. Energy Environ. Sci. 4 (2011) 114–130.
[32] www.platinum.matthey.com , accessed on 03/11/2015.
[33] www.statista.com , data from US Geological Survey, accessed on 03/11/2015.
[34] P. Garcia, J.P. Torreglosa, L.M. Fernández, F. Jurado. Control strategies for high-power electric
vehicles powered by hydrogen fuel cell, battery and supercapacitor. Expert Systems Applications 40
(2013) 4791–4804.
[35] S. Specchia, C. Francia, P. Spinelli (2011) Polymer Electrolyte Membrane Fuel Cells. Chapter
13 in: Electrochemical Technologies for Energy Storage and Conversion, Liu R.-S., Zhang L., Sun
X., Liu H., and Zhang J., Wiley-VHC Verlag GmbH & Co., KGaA, Weinheim (Germany), pp. 601–
670, ISBN: 978-3-527-328679.
[36] B.G. Pollet, I. Staffell, J.L. Shang. Current status of hybrid, battery and fuel cell electric vehicles:
From electrochemistry to market prospects. Electrochim. Acta 84 (2012) 235–249.
[37] DOE Fuel Cell Technologies Office Record # 13012, (2013),
http://energy.gov/sites/prod/files/2014/03/f11/13012_fuel_cell_system_cost_2013.pdf accessed on
03/11/2015.
[38] P. Zelenay. Non-precious metal fuel cell cathodes: Catalyst development and electrode structure
design. http://www.hydrogen.energy.gov/pdfs/review15/fc107_zelenay2015_o.pdf accessed on
03/11/2015.
[39] H. Gasteiger, S.S. Kocha, B. Sompalli, F.T. Wagner. Activity benchmarks and requirements for
Pt, Pt-alloy, and non-Pt oxygen reduction catalysts for PEMFCs. Appl. Catal. B: Environ. 56 (2005)
9–35.
[40] A. Ishihara, Y. Ohgi, K. Matsuzawa, S. Mitsushima, K.-I. Ota. Progress in non-precious metal
oxide-based cathode for polymer electrolyte fuel cells. Electrochim. Acta 55 (2010) 8005–8012.
48
[41] G. Wu, K.L. More, C.M. Johnston, P. Zelenay. High-performance electrocatalysts for oxygen
reduction derived from polyaniline, iron, and cobalt. Science 332 (2011) 443–447.
[42] J-P. Dodelet In: Electrocatalysis in Fuel Cells; M. Shao, (Ed.), Springer-Verlag, London, 2013;
Chapter 10, pp. 271–338.
[43] C. Song, J. Zhang (2008) Electrocatalytic Oxygen Reduction Reaction. Chapter 2 in:
Electrocatalytic Oxygen Reduction Reaction. J. Zhang (Ed.), Springer-Verlag, London, pp. 89–134.
[44] W. Cai, X. Zhao, C. Liu, W. Xing, J. Zhang (2014) Electrode kinetics of electron-transfer and
reactant transport in electrolyte solution. Chapter 2 in: Rotating Electrode Methods and Oxygen
Reduction Electrocatalysis. W. Xing, G. Yin and J. Zhang (Eds.), Elsevier, pp. 33–65.
[45] R. Guidelli, R.G. Compton, J.M. Feliu, E. Gileadi, J. Lipkowski, W. Schmickler, S. Trasatti.
Definition of the transfer coefficient in electrochemistry (IUPAC Recommendations 2014). Pure
Appl. Chem. 86(2) (2014) 259–262.
[46] http://www.ecochemie.nl/download/Applicationnotes/Autolab_Application_Note_EC08.pdf ,
accessed on 04/11/2015.
[47] http://www.intechopen.com/books/state-of-the-art-in-biosensors-general-
aspects/bioelectronics-for-amperometric-biosensors , accessed on 04/11/2015.
[48] C. Du, Q. Tan, G. Yin, J. Zhang (2014) Rotating Disk Electrode Method. Chapter 5 in: Rotating
Electrode Methods and Oxygen Reduction Electrocatalysis. W. Xing, G. Yin and J. Zhang (Eds.),
Elsevier, pp. 171–198.
[49] S. Treimer, A. Tang, D.C. Johnson. A Consideration of the Application of Koutecky-Levich
Plots in the Diagnose s of Charge-Transfer Mechanisms at Rotated Disk Electrodes. Electroanalysis
14 (2002) 165–171.
[50] L. Osmieri, A.H.A. Monteverde Videla, S. Specchia. Activity of Co-N multi walled carbon
nanotubes electrocatalysts for oxygen reduction reaction in acid conditions. J. Power Sources 278
(2015) 296–307.
[51] E. Antolini, L. Giorgi, A. Pozio, E. Passalacqua. Influence of Nafion loading in the catalyst layer
of gas-diffusion electrodes for PEFC. J. Power Sources 77 (1999) 136–142.
[52] S. Tang, W. Lin, P.A. Christensen, G.M. Haarberg. Effect of methanol concentration on oxygen
reduction reaction activity of Pt/C catalysts. Chin. J. Catal. 34 (2013) 1105–1111.
[53] A.S. Aricò, V. Antonucci, V. Alderucci, E. Modica, N. Giordano. A.c.-impedance spectroscopy
study of oxygen reduction at Nafion® coated gas-diffusion electrodes in sulphuric acid: Teflon
loading and methanol cross-over effects. J. Appl. Electrochem 23 (1993) 1107–1116.

49
[54] E. Proietti, F. Jaouen, M. Lefèvre, N. Larouche, J. Tian, J. Herranz, J-P. Dodelet. Iron-based
cathode catalyst with enhanced power density in polymer electrolyte membrane fuel cells. Nat.
Commun. 2 (2011).
[55] D. Banham S. Ye, K. Pei, J. Ozaki, T. Kishimoto, Y. Imashiro. A review of the stability and
durability of non-precious metal catalysts for the oxygen reduction reaction in proton exchange
membrane fuel cells. Journal of Power Sources 285 (2015) 334-348.
[56] F. Jaouen, J. Herranz, M. Lefèvre, J-P. Dodelet, U.I. Kramm, I. Herrmann, P. Bogdanoff, J.
Maruyama, T. Nagaoka, A. Garsuch, J.R. Dahn, T. Olson, S. Pylypenko, P. Atanassov, E.A. Ustinov.
Cross-laboratory experimental study of non-noble-metal electrocatalysts for the oxygen reduction
reaction. ACS Appl. Mater. Interfaces 1 (2009) 1623–1639.
[57] Z. Chen, D. Higgins, A. Yu, L. Zhang, J. Zhang. A review on non-precious metal electrocatalysts
for PEM fuel cells. Energy Environ. Sci. 4 (2011) 3167–3192.
[58] W. Martinez-Millan, T. Toledano Thompson, L.G. Arriaga, M.A. Smit. Characterization of
composite materials of electroconductive polymer and cobalt as electrocatalysts for the oxygen
reduction reaction. Int. J. Hydrogen Energy 34 (2009) 694–702.
[59] R. Sulub, W. Martinez-Millan, M.A. Smit. Study of the Catalytic Activity for Oxygen Reduction
of Polythiophene Modified with Cobalt or Nickel. Int. J. Electrochem. Sci. 4 (2009) 1015–1027.
[60] W. Martinez-Millan, M.A. Smit. Study of Electrocatalysts for Oxygen Reduction Based on
Electroconducting Polymer and Nickel. J. Applied Polymer Sci. 112 (2009) 2959–2967.
[61] R. Bashyam, P. Zelenay. A class of non-precious metal composite catalysts for fuel cells. Nature
443 (2006) 63–66.
[62] G. Wu, K.L. More, C.M. Johnston, P. Zelenay. High-performance electrocatalysts for oxygen
reduction derived from polyaniline, iron, and cobalt. Science 332 (2011) 443–447.
[63] K. Lee, L. Zhang, H. Lui, R. Hui, Z. Shi, J. Zhang. Oxygen reduction reaction (ORR) catalyzed
by carbon-supported cobalt polypyrrole (Co-PPy/C) electrocatalysts. Electrochim. Acta 54 (2009)
4704–4711.
[64] S. Doi, A. Ishihara, S. Mitsushima, N. Kamiya, K.I. Ota. Zirconium-Based Compounds for
Cathode of Polymer Electrolyte Fuel Cell. J. Electrochem. Soc. 154 (2007) B362–B369.
[65] A. Ishihara, K. Lee, S. Doi, S. Mitsushima, N. Kamiya, M. Hara, K. Domen, K. Fukuda, K. Ota.
Tantalum Oxynitride for a Novel Cathode of PEFC. Electrochem. Solid-State Lett., 8 (2005) A201–
A203.
[66] H.X. Zhong, H.M. Zhang, Y.M. Liang, J.L. Zhang, M.R. Wang, X.L. Wang. A novel non-noble
electrocatalyst for oxygen reduction in proton exchange membrane fuel cells. J. Power Sources 164
(2007) 572–577.

50
[67] H.X. Zhong, H.M. Zhang, G. Liu, Y.M. Liang, J.W. Hu, B.L. Yi. A novel non-noble
electrocatalyst for PEM fuel cell based on molybdenum nitride. Electrochem. Commun. 8 (2006)
707–712.
[68] R. Asahi, T. Morikawa, T. Ohwaki, K. Aoki, Y. Taga. Visible-Light Photocatalysis in Nitrogen-
Doped Titanium Oxides. Science 293 (2001) 269–271.
[69] A. Kikuchi, A. Ishihara, K. Matsuzawa, S. Mitsushima, K. Ota. Tantalum-based Compounds
Prepared by Reactive Sputtering as a New Non-platinum Cathode for PEFC. Chem. Lett. 38 (2009)
1184–1185.
[70] G. Liu, H.M. Zhang, M.R. Wang, H.X. Zhong, J. Chen. Preparation, characterization of
ZrOxNy/C and its application in PEMFC as an electrocatalyst for oxygen reduction. J. Power Sources
172 (2007) 503–510.
[71] S.C. Barton, H.H. Kim, G. Binyamin, Y.C. Zhang, A. Heller. The “Wired” Laccase Cathode:
High Current Density Electroreduction of O2 to Water at +0.7 V (NHE) at pH 5. J. Phys. Chem. B
105 (2001) 11917–11921.
[72] N.S. Hudak, J.W. Gallaway, S.C. Barton. Formation of mediated biocatalytic cathodes by
electrodeposition of a redox polymer and laccase. J. Electroanal. Chem. 629 (2009) 57–62.
[73] M. Lefèvre, E. Proietti, F. Jaouen, J-P. Dodelet. Iron-based catalysts with improved oxygen
reduction activity in polymer electrolyte fuel cells. Science 324 (2009) 71−74.
[74] J.Y. Cheon, T.Y. Kim, Y.M. Choi, H.Y. Jeong, M.G. Kim, Y.J. Sa, J. Kim, Z.H. Lee, T.H. Yang,
K.J. Kwon, O. Terasaki, G.-G. Park, R.R. Adzic, S.H. Joo. Ordered mesoporous porphyrinic carbons
with very high electrocatalytic activity for the oxygen reduction reaction. Scientific Reports 3 (2013)
2715.
[75] A. Zitolo, V. Goellner, V. Armel, M.-T. Sougrati, T. Mineva, L. Stievano, E. Fonda, F. Jaouen.
Identification of catalytic sites for oxygen reduction in iron- and nitrogen-doped graphene materials.
Nature Mater. 14 (2015) 937–942.
[76] K. Strickland, E. Miner, Q. Jia, U. Tylus, N. Ramaswamy, W. Liang, M.-T. Sougrati, F. Jaouen,
S. Mukerjee. Highly active oxygen reduction non-platinum group metal electrocatalyst without direct
metal–nitrogen coordination. Nature Communications 6 (2015) 7343.
[77] D. Zhao, J.-L. Shui, L.R. Grabstanowicz, C. Chen, S.M. Commet, T. Xu, J. Lu, D.-J. Liu. Highly
efficient non-precious metal electrocatalyst prepared from one-pot synthesized zeolitic imidazolate.
Adv. Mater. 26 (2014) 1093–1097.
51
CHAPTER 2. The use of different types of reduced graphene oxide for the
preparation of Fe-N-C electrocatalysts for the oxygen reduction reaction.
1. Introduction
Fuel cell devices produce electricity from the energy of a fuel through a highly efficient direct
electrochemical conversion process, resulting in low emissions and low environmental impact [1].
Between the different types of fuel cell, the Polymer Electrolyte Membrane Fuel Cell (PEMFC) is
the most attractive for the replacement of internal combustion engine for transport applications [2],
and the Direct Methanol Fuel Cells (DMFC) are very promising energy sources for low power
portable electronic applications [3]. In both these devices, platinum is the most widely used catalyst
for the anodic hydrogen and methanol oxidation reactions, and for the cathodic oxygen reduction
reaction (ORR) [4]. The high cost of Pt is the main factor that contributes to the high cost of PEMFC
and DMEFC, and this has been so far one of the main bottlenecks to the widespread
commercialization of fuel cell [5]. On the cathode of the fuel cell, the sluggish reaction kinetics for
the ORR leads to great overpotentials and therefore to low conversion efficiency. For this reason,
higher Pt loadings are needed at the cathode than at the anode of PEMFC, stimulating consequently
the research toward alternative Pt-free catalysts for ORR [6].
Several types of carbon materials functionalized with nitrogen and transition metals (Me-N/C, Me =
transition metal) have been investigated as non-precious metal catalysts (NPMC) for ORR [7]. The
exact structure of the ORR active site in these materials has not been clearly identified so far [8].
However, the active site is believed to be formed during a heat-treatment at 500 – 1000 °C with the
simultaneous presence of transition metal ions (Fe, Co, etc.), a source of carbon (carbon support,
polymer) and a source of nitrogen (N-containing molecule, polymer or gas). According to this fact,
many synthesis strategies can be adopted for the preparation of NPMC supported on carbon-based
materials [9]. For example, a carbon support with a high specific surface area can be impregnated
with a complex formed in solution between a N-containing ligand molecule (e.g. TPTZ, 1,10-
Phenanthroline) and a transition metal ion (i.e. Fe, Co) [10–13].
In particular, these NPMC have been found to be much more active towards ORR in alkaline than in
acid conditions [14,15]. This has stimulated research in the development of alkaline ionomers
(conducing OH- ions) [16].
To improve the activity and the stability of Me-N/C catalysts, many approaches have been explored.
These include the development of new synthesis procedures, the optimization of heat-treatment

52
strategies, the exploration of different carbon supports, and the use of different transition metal and
nitrogen containing precursor molecules [17].
Within many different carbon support materials, graphene has attracted great interest in recent years,
due to its unique properties, like high theoretical surface area, high electrical conductivity and good
chemical stability within a broad potential window [18].
Graphene with a relatively perfect structure and excellent properties can be produced by micro-
mechanical exfoliation of highly ordered pyrolytic graphite and chemical vapor deposition (CVD)
[19]. Chemically modified graphene can be obtained from graphite oxide through a cost-effective and
high-yield chemical method, which is theoretically implementable for large scale production [18,20].
This material, named reduced graphene oxide (rGO), has a great amount of residual functional groups
and defects that dramatically alter the structure of the carbon plane [21,22].
rGO is produced from graphite oxide (GO). GO has a similar layered structure to graphite, but the
plane of carbon atoms in GO is rich in oxygen-containing groups, which expand the interlayer
distance and make the atomic-thick layers hydrophilic. As a result, these oxidized layers can be
exfoliated in water under moderate ultrasonication [22,23]. If the exfoliated sheets contain only one
or few layers of carbon atoms like graphene, these sheets are named graphene oxide (GO). The most
attractive property of GO is that it can be partly reduced to graphene-like sheets by removing the
oxygen-containing groups with the recovery of a conjugated structure. The rGO sheets can be
considered as one kind of chemically derived graphene [22].
In the literature, different reduction / exfoliation methods are reported: thermal annealing, microwave
irradiation, chemical reduction with strong reducing agents (i.e. hydrazine or NaBH4), photocatalyst
reduction, electrochemical reduction, solvothermal reduction and multistep reduction using
combinations of different methods [21–25]. In the thermal annealing process, the exfoliation of the
GO flakes is caused by the huge pressure increase generated by the sudden expansion of gases (mainly
CO and CO2) evolved into the spaces between the graphene sheets during the heating [26]. The
heating temperature significantly affects the GO reduction. If the temperature is less than 500 °C, the
C/O ratio increase only up to no more than 7, while if the temperature reached 750 °C, the C/O ratio
could be higher than 13. So, high temperature is needed to achieve the good reduction and electrical
conductivity [22,27].
In this paper, three different types of rGO are obtained from the same GO with three different
reduction-exfoliation methods. They are therefore used as carbon support materials for the synthesis
of Fe-N/rGO catalysts. Fe and N were incorporated onto the rGO supports surface by a wet
impregnation with the complex between Fe(II) ions and the N-rich ligand molecule TPTZ (six
nitrogen atoms per molecule), followed by a heat treatment in inert atmosphere at 800°C for 3 hours.
53
Morphology, chemical composition, physical properties and crystalline structure of all the catalysts
and their respective supports were also investigated using several instrumental methods. The activity
toward ORR of the as-syntesized catalysts has been tested using RDE technique in alkaline medium.
Electrochemical kinetic parameters like Tafel slope, cathodic transfer coefficient and exchange
current density have also been calculated.
2. Experimental
2.1. Chemicals
Synthetic graphite flakes TIMCAL C-NERGY SFG 6 L was purchased from IMERYS and used as
received. Concentrated sulfuric acid (98 % wt.) and ethanol (>99.8% purity) were purchased from
Fluka. Sodium nitrate (NaNO3 , >99.0% purity), potassium permanganate (KMnO4 , >99.0% purity),
hydrogen peroxide (H2O2 , 30% wt.), 2,4,6-tris(2-pyridyl)-1,3,5-triazine (TPTZ, ≥98% purity),
iron(II) acetate (Fe(CH3COO)2 , >99.99% purity), Nafion (5% wt hydroalcoholic solution),
concentrated hydrochloric acid (37% wt.) and potassium hydroxide (KOH, 99.0% purity) were
purchased from Sigma Aldrich. Nitrogen, hydrogen and oxygen gases were purchased in cylinders
by SIAD with purity ≥99.999%. All aqueous solutions were prepared using deionized water obtained
from a Millipore Milli-Q system with resistivity >18 MΩ cm–1.
2.2. rGO supports preparation
Graphite oxide was prepared using the modified Hummers method [28,29]. In detail, 115 mL of
concentrated H2SO4 (98%) was added to a mixture of graphite flakes (5 g) and sodium nitrate (2.5 g)
under stirring until complete homogeneous dispersion. The mixture was kept into an ice bath to avoid
the temperature to raise over 20 °C. Then, 15 g of KMnO4 was slowly added to the mixture in small
portions. After reacting for 24 hours, water (700 mL) was added to the slurry producing a large
amount of heat. Then, 30% H2O2 (5 mL) was dropped to complete the oxidation. The slurry was
cooled at room temperature into a water bath ad left decanting without stirring for 24 hours to obtain
a brown precipitate. The supernatant was removed and the precipitate was filtered and washes
repeatedly with 1 M HCl solution and deionized water until pH was about 7. Finally GO was dried at
60° in oven.
The exfoliation/reduction of GO was carried out in 3 different ways. For the first method, GO was
put into a quartz boat and placed in a tubular quartz furnace under N2 atmosphere (N2 gas flow was
set at 150 N mL min–1 with a mass flow controller from Bronkhorst, ELFLOW series). The
temperature was increased until 700°C with a heating rate of 5°C min-1 and kept constant for 1 hour.

54
Then the furnace was switched off leaving the apparatus cooling down naturally to room temperature.
The second method was similar to the previous, but the gas atmosphere was a 1:1 vol. mixture of H2
and N2 and the heating temperature was 500°C. Finally, the third method consisted in dispersing the
GO in acid solution (1:1 vol. solution of 1 M HCl and ethanol) and keeping this dispersion under
sonication (130 W, Soltec 2200 M 3S sonicator) for 3 hours. The three rGO obtained with these three
different exfoliation/reduction methods were named rGON700, rGOHN500 and rGOsonic,
respectively.
2.3. Fe-N/rGO electrocatalysts preparation
The three rGO were used as carbon support material to prepare three Fe-N/rGO catalysts. The
synthesis method consists in a wet impregnation of a complex between a N-containing ligand
molecule and Fe(II) ion, followed by a heat treatment at 800°C under inert atmosphere. For each rGO
type, a typical amount of 100 mg was dispersed in 100 mL of a 1:1 vol. deionized water and ethanol
solution under ultrasonic bath for 30 minutes (130 W, Soltec 2200 M 3S sonicator), and left stirring
for 1 hour. At the same time, 176 mg of TPTZ ligand molecule, used as a nitrogen source, was
dissolved in about 100 mL of deionized water, and the pH was adjusted to 1 by addition of 1 M HCl
solution under stirring. This helps the dissolution of the TPTZ in the solvent. Then, 16.4 mg of
Fe(CH3COO)2 was added to the solution, with the immediate formation of a blue-colored complex.
The Fe:TPTZ molar ratio in this complex was of 1:6. This excess of TPTZ ligand should favor the
chemical equilibrium of the Fe2+ ion complexation. Moreover, this provides a greater amount of N
atoms, in order to favor a higher doping level of the rGO surface with N atoms, favoring thus the
formation of active sites [30]. The solution was left stirring at room temperature for 6 hours, added
to the rGO dispersion and stirred overnight. The solvent was evaporated by heating, and the recovered
powder was ground in a mortar. The Fe:rGO mass ratio in this powder was expected to be 0.05. All
the three powders were then heat treated in a tubular quartz furnace at 800 °C for 3 hours under N2
flow (heating rate of 5°C min-1). The catalysts derived from the three different rGO supports were
named Fe-N/rGON700, Fe-N/rGOHN500 and Fe-N/rGOsonic, respectively.
2.4. Physico-chemical characterization
Nitrogen adsorption isotherms of rGO supports and their respective catalysts were recorded by an
ASAP 2020 Instrument (Micromeritics) at –196 °C. Before the analysis, all of the samples were
placed into the cell and degassed under vacuum for 3 hours at 150 °C. The specific surface area of
the samples was calculated using the Brunauer–Emmett–Teller (BET) method within the relative

55
pressure range of 0–1. The pore size distribution was obtained with the Barrett–Joyner–Halenda
(BJH) method.
Scanning electron microscopy coupled with energy-dispersive X-ray spectroscopy (SEM-EXD FEI-
QuantaTM Inspect 200 with EDAX PV 9900 instrument working at 15 kV) were performed to
analyze the morphology and evaluate the average bulk chemical composition of rGO supports and
Fe-N/rGO catalysts.
The crystallographic structures of the samples were analyzed using X-ray powder diffraction (XRD)
with X’Pert PRO diffractometer (PANalytical) using a Cu Kα radiation (λ = 0.15406 nm). The X'Pert
HighScore software (PANalytical) was used to determine the crystallographic phases associated with
the peaks that appear in the XRD patterns.
X-ray photoelectron spectroscopy (XPS) was performed to determine the elemental surface
composition of the catalysts samples. The analysis was carried out using a Physical Electronics PHI
5000 Versa Probe electron spectrometer system with monochromated Al Kα X-ray source (1486.60
eV) run at 15 kV and 1 mA anode current. Survey scans as well as narrow scans (high resolution
spectra) were recorded with a spot of 100 nm size. The survey spectra were collected from 0 to
1200 eV. The narrow N 1s spectra were collected from 396 to 405 eV and the narrow C 1s spectra
from 280 to 293 eV. All of the spectra related to the three samples were obtained under identical
conditions, with the samples placed in an ultrahigh vacuum chamber at 2·10–10 mmHg, and calibrated
against a value of the C 1s binding energy of 284.5 eV. CasaXPS software was used for obtaining
semi-quantitative atomic percentage compositions, using Gauss-Lorentz equations with Shirley
background.
2.5. Electrochemical characterization
The electrochemical measurements for rGO supports and their respective Fe-N catalysts were
performed in a conventional three-electrodes electrochemical cell configuration. The cell was
equipped with a glassy carbon disk working electrode (0.0707 cm2 geometric area), a Pt helical wire
counter electrode, and a saturated calomel (SCE) reference electrode. Cyclic voltammetries (CV) and
linear sweep voltammetries (LSV) were performed using a rotating disk electrode (RDE) equipment
(RRDE-3A ALS) and a multi-potentiostat (Bio-Logic SP-150).
All of the inks were prepared in the same way. A typical ink preparation consists in mixing 10 mg of
sample powder with 43 μL of Nafion® 5% wt. solution and 400 μL of ethanol. The ink was kept
under sonication for 1 hour to achieve a good dispersion. Afterwards, 1 μL of ink was taken with a
micro-pipette and deposited on the working electrode, resulting in a catalyst loading of 0.0225 mg,
which corresponds to 0.318 mg cm–2 referred to the geometrical area of the disk working electrode.

56
All of the current densities were thus normalized per geometric area of the electrode. The electrode
potentials were corrected and referred to the reversible hydrogen electrode (RHE). The electrolyte
was 0.1 M KOH aqueous solution, saturated with either N2 or O2 by direct gas bubbling into the
electrolyte solution.
Prior to start tests, 80 CV cycles were performed from 0.0 to 1.2 V vs RHE in N2 saturated electrolyte
at 100 mV s–1 scan rate, in order to electrochemically clean and stabilize the working electrode
surface. For each rGO support and catalyst, cyclic voltammograms were recorded between 0.0 and
1.2 V vs RHE in N2-saturated electrolyte at 10 mV s–1 scan rate. For the ORR measurements, the
solution was saturated with O2. LSV were recorded at 5 mV s–1 scan rate. This scan rate value should
be sufficiently low to consider the background capacitive current contribution negligible [31], and
sufficiently high to allow to neglect the possible effect of impurities in the cell [31 – 33]. An
electrochemical impedance spectroscopy measurement was done at OCV, with a wave amplitude of
10 mV and frequencies in the range of 10 kHz – 100 mHz, for the evaluation of the high frequency
resistance value. This value was used to subtract the ohmic drop contribution from the linear sweep
voltammetry curves [33].
3. Results and discussion
3.1. Physico-chemical characterization of rGO supports and Fe–N/rGO catalysts
3.1.1. BET and pore size analysis
The surface area values of the three rGO samples (Table 1) are very different depending on the
reduction - exfoliation method. rGON700 has the highest BET surface area (104.7 m2 g-1) suggesting
that the thermal annealing exfoliation in N2 atmosphere at 700°C is the best method to obtain an
highly exfoliated rGO. rGOHN500 surface area is almost one half of the previous sample (51.8 m2 g-
1), suggesting that for this thermal annealing exfoliation method the temperature effect seems to be
more important than the presence of a reducing agent (H2 in this case). The sonication process leads
to obtain a lower surface area (11.5 m2 g-1).

57
Table 1. Properties calculated from the nitrogen physisorption analysis for the three different rGO
and their respective catalysts.
The rGO supports N2 adsorption-desorption isotherms (Fig. 1A) exhibit a type II isotherm with a type
H3-H4 hysteresis loop according to the International Union of Pure and Applied Chemistry (IUPAC)
classification [34]. The type II shape is normally associated with a non-porous or macroporous
materials, while the hysteresis appearing in the multilayer range of physisorption isotherms is usually
associated with capillary condensation in mesopore structures. This is confirmed by pore size
distribution analysis (Fig. 1B) which shows that these materials are mainly meso- and macroporous.
During the catalysts synthesis process, the rGO supports exfoliated by thermal annealing (rGON700
and rGOHN500) undergo a significant surface area decrease (see Table 1). This could be due to the
incorporation of new carbon coming from the TPTZ molecule, which graphitized during the pyrolysis
treatment [11]. A further reason could be the agglomeration of the graphene nanosheets, adhering to
each other during the thermal treatment at 800°C, causing a surface area decrease. In fact, as reported
in the literature, during the thermal treatment the rGO sheets could adhere to each other causing a
reduction of the sample’s specific surface area [35–37]. On the contrary, the catalyst supported on
rGOsonic undergoes a surface area increase in comparison to its respective rGO support. This
behavior could be ascribed to a further exfoliation-reduction of the rGO support during the pyrolysis
at 800°C. The rGOsonic, in facts, did not undergo a previous thermal annealing exfoliation, and its
initial surface area was significantly lower in comparison with rGON700 and rGOHN500, probably
due to the lower reduction and the consequent lower level of exfoliation.
Regarding the Fe-N/rGO catalysts, their N2 adsorption-desorption isotherms (Fig. 1C) exhibit a type
II shape [34]. The hysteresis loop shape is of type III for Fe-N/rGON700 and Fe-N/rGOHN500. This
is usually observed with aggregates of plate-like particles giving rise to slit-shaped pores. The Fe-
N/rGOHN500 loop is almost imperceptible, indicating lower amount of mesopores, as also evidenced
Sample BET specific surface area
[m2 g
-1]
Adsorption pore volume
[cm3 g
-1]
Micropore area
[m2 g
-1]
Adsorption average pore
size [nm]
Desorption average pore
size [nm]
rGON700 104.7 0.954 40.19 41.2 6.9 rGOHN500 51.8 0.269 17.19 23.9 9.9 rGOsonic 11.5 0.059 4.13 27.6 19.9 Fe-N/rGON700 34.1 0.247 0.27 27.3 19.9 Fe-N/rGOHN500 5.8 0.037 0.68 37.7 28.9 Fe-N/rGOsonic 32.1 0.052 8.75 9.0 7.1

58
in Fig. 1D. The hysteresis loop shape for Fe-N/rGOsonic is more similar to type IV, suggesting the
presence of narrow slit-like pores, but associated with a higher microporosity content, as also
evidenced in Table 1. The surface area values are comparable to values found in the literature for
rGO [11,36,37].
Fig. 1 Nitrogen adsorption – desorption isotherms of the rGO (A) and the Fe-N/rGO catalysts (B).
Pore size distribution of the rGO (C) and the Fe-N/rGO catalysts (D).
3.1.2. XRD analysis
The XRD spectra of GO, rGO supports and their respective Fe-N/rGO catalysts were recorded in
order to evidence the structural changes occurring during the conversion of graphite first to GO, then
to rGO through the different reduction-exfoliation methods, and finally to Fe-N/rGO catalysts. They
are shown in Fig. 2.
For all of the samples, the spectra were recorded in the 2θ range 10 – 100 °. However, for all of the
samples, only one peak attributable to the (002) plane of the graphitic structure was detected.
Therefore, in Fig. 2, the 2θ range was restricted in the 2θ range from 10 – 35°.
0.0 0.1 0.2 0.3 0.4 0.5 0.6 0.7 0.8 0.9 1.0
0
5
10
15
20
25
30A
Qu
an
tity
ad
so
rbe
d (
mm
ol
g-1)
P / P0
rGO N700 rGO HN500 rGO sonic
0.0 0.1 0.2 0.3 0.4 0.5 0.6 0.7 0.8 0.9 1.0
0
1
2
3
4
5
6
7
Qu
an
tity
ad
so
rbed
(m
mo
l g
-1)
P / P0
Fe-N/rGO N700 Fe-N/rGO HN500 Fe-N/rGO sonic
B
1 10 1000.000
0.001
0.002
0.003
0.004
0.005
0.006
0.007
0.008
C
po
re v
ol (c
m3 g
-1 n
m-1)
pore width (nm)
rGO N700 rGO HN500 rGO sonic
1 10 1000.000
0.001
0.002
0.003
0.004
0.005
0.006
D
po
re v
ol
(cm
3 g
-1 n
m-1)
pore width (nm)
Fe-N/rGO N700 Fe-N/rGO HN500 Fe-N/rGO sonic
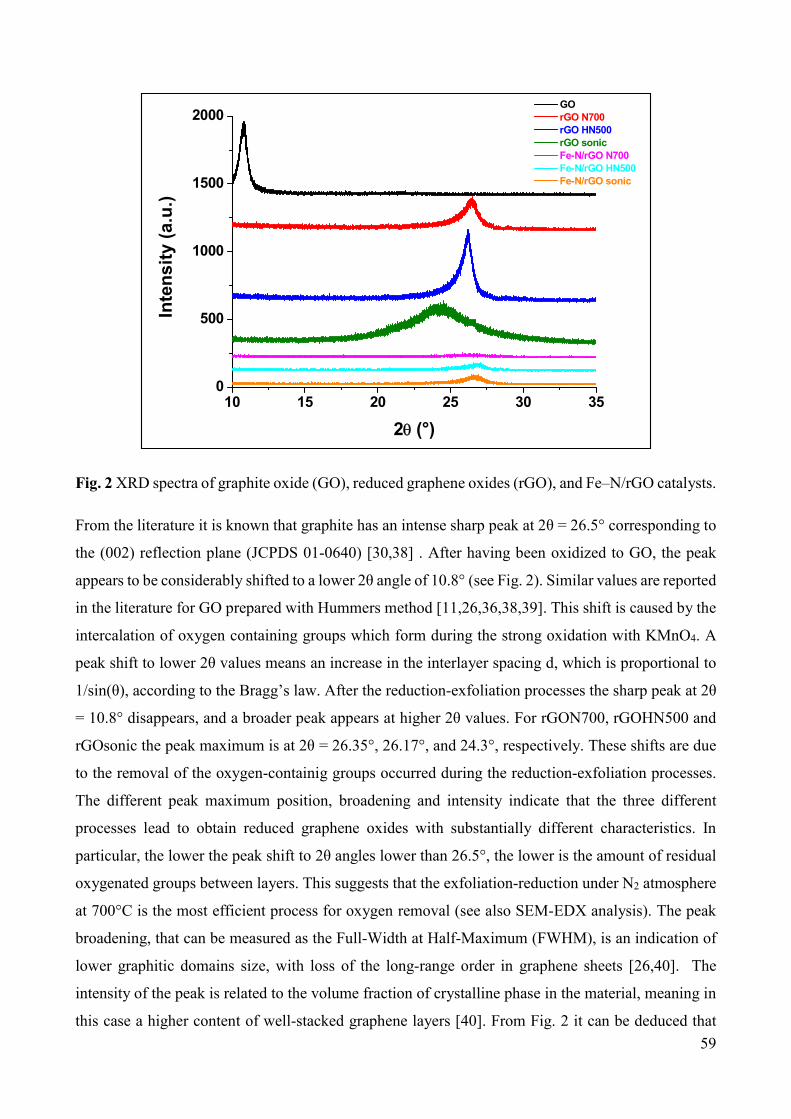
59
Fig. 2 XRD spectra of graphite oxide (GO), reduced graphene oxides (rGO), and Fe–N/rGO catalysts.
From the literature it is known that graphite has an intense sharp peak at 2θ = 26.5° corresponding to
the (002) reflection plane (JCPDS 01-0640) [30,38] . After having been oxidized to GO, the peak
appears to be considerably shifted to a lower 2θ angle of 10.8° (see Fig. 2). Similar values are reported
in the literature for GO prepared with Hummers method [11,26,36,38,39]. This shift is caused by the
intercalation of oxygen containing groups which form during the strong oxidation with KMnO4. A
peak shift to lower 2θ values means an increase in the interlayer spacing d, which is proportional to
1/sin(θ), according to the Bragg’s law. After the reduction-exfoliation processes the sharp peak at 2θ
= 10.8° disappears, and a broader peak appears at higher 2θ values. For rGON700, rGOHN500 and
rGOsonic the peak maximum is at 2θ = 26.35°, 26.17°, and 24.3°, respectively. These shifts are due
to the removal of the oxygen-containig groups occurred during the reduction-exfoliation processes.
The different peak maximum position, broadening and intensity indicate that the three different
processes lead to obtain reduced graphene oxides with substantially different characteristics. In
particular, the lower the peak shift to 2θ angles lower than 26.5°, the lower is the amount of residual
oxygenated groups between layers. This suggests that the exfoliation-reduction under N2 atmosphere
at 700°C is the most efficient process for oxygen removal (see also SEM-EDX analysis). The peak
broadening, that can be measured as the Full-Width at Half-Maximum (FWHM), is an indication of
lower graphitic domains size, with loss of the long-range order in graphene sheets [26,40]. The
intensity of the peak is related to the volume fraction of crystalline phase in the material, meaning in
this case a higher content of well-stacked graphene layers [40]. From Fig. 2 it can be deduced that
10 15 20 25 30 350
500
1000
1500
2000
Inte
ns
ity (
a.u
.)
2(°)
GO rGO N700 rGO HN500 rGO sonic Fe-N/rGO N700 Fe-N/rGO HN500 Fe-N/rGO sonic

60
rGOsonic is the rGO with the higher amount of oxygen still present (higher shift to lower 2θ angles),
but it is also the more homogeneously exfoliated one (higher peak broadening). rGON700 and
rGOHN500 exhibit almost the same peak broadening, with the latter peak being more intense than
the former one, suggesting a lower effectiveness of the thermal annealing under H2-N2 atmosphere at
500°C. A similar result was also found by Kaniyoor et al. [26]. This difference between the two
annealing processes should thus be due to the temperature effect. Increasing the temperature at 700°C
seems to be favorable for the evolution of a higher amount of oxygen-containing gases between the
layers with consequent better exfoliation.
Concerning the three Fe-N/rGO catalysts, it is evident how the intensity of the (002) graphite peak at
2θ = 25° - 26° is considerably decreased. This suggests the formation of a more disordered structure
during the catalyst synthesis process. This phenomenon can be due to both the incorporation of C and
N coming from TPTZ molecule, and to further de-stacking of graphene ordered layers occurring
during the pyrolysis treatment at 800°C. However, there are some differences between the three
samples. In particular the peak almost disappeared for Fe-N/rGON700. For Fe-N/rGOHN500 a small
peak is still present, but less shifted away from 26.5° than for the respective rGO support, suggesting
a further decrease in O content (as confirmed by EDX and XPS analyses). The same considerations
can be made for Fe-N/rGOsonic.
More intense peaks are observed for samples having higher N and Fe content [39,41] (see XPS
analysis, Table 3), sign that Fe most likely favors the nitrogen fixation [11,39].
Peaks related with Fe containing crystallites, as metallic Fe or Fe oxides, carbides and nitrides were
not detected, suggesting that these compounds have been effectively removed by the acid washing
treatment with 1 M HCl, or that their presence is below the detection range of the X-ray
diffractometer.
3.1.3. EDX analysis
EDX analysis of GO and rGO confirms that the three different exfoliation-reduction methods lead to
obtain rGO with different characteristics, as discussed before. The results are summarized in Table
2.

61
Table 2. Elemental composition by EDX for GO and the rGO obtained with the three different
methods.
Sample Total C
[atomic %]
Total O
[atomic %]
C/O atomic ratio
GO 60.7 39.3 1.54
rGON700 94.4 5.6 16.86
rGOHN500 92.6 7.4 12.51
rGOsonic 89.6 10.4 8.62
The C/O atomic ratio for GO is 1.54, confirming the high effectiveness in graphite oxidation of the
Hummers method. Similar values can be found in the literature [26,42,43]. The oxygen content
increase in the order rGON700 < rGOHN500 < rGOsonic, confirming the results of XRD and BET-
porosimetry analyses about the oxygenated functional groups content, and the exfoliation degree.
Therefore, the best method in order to obtain a well-exfoliated and low oxygen-containing rGO is the
thermal annealing at 700°C under N2.
EDX analysis was also performed on the Fe–N/rGO catalysts after the acid washing. The measured
C, O and Fe atomic percentages are shown in Table 3. Fe contents vary between 0.7 and 1.0 atomic
%, which correspond to wt. % between 3.1 and 4.4. This well matches with the Fe content designed
during the synthesis process (5 wt. %).
3.1.4. SEM pictures
The morphology of GO, rGO supports and Fe-N/rGO catalysts was investigated by SEM. Fig. 3A
shows the surface of a GO platelet. Corrugations could indicate that oxygen insertion occurred
between the layers, which still appear well stacked, since exfoliation has not occurred yet. Fig. 3B,
3C and 3D show rGON700, rGOHN500 and rGOsonic, respectively. The morphology of the three
different samples appears to be considerably different, confirming what found by N2 adsorption and
XRD analyses. In all the three samples planar structures attributable to graphene sheets are visible
[11,26,44].
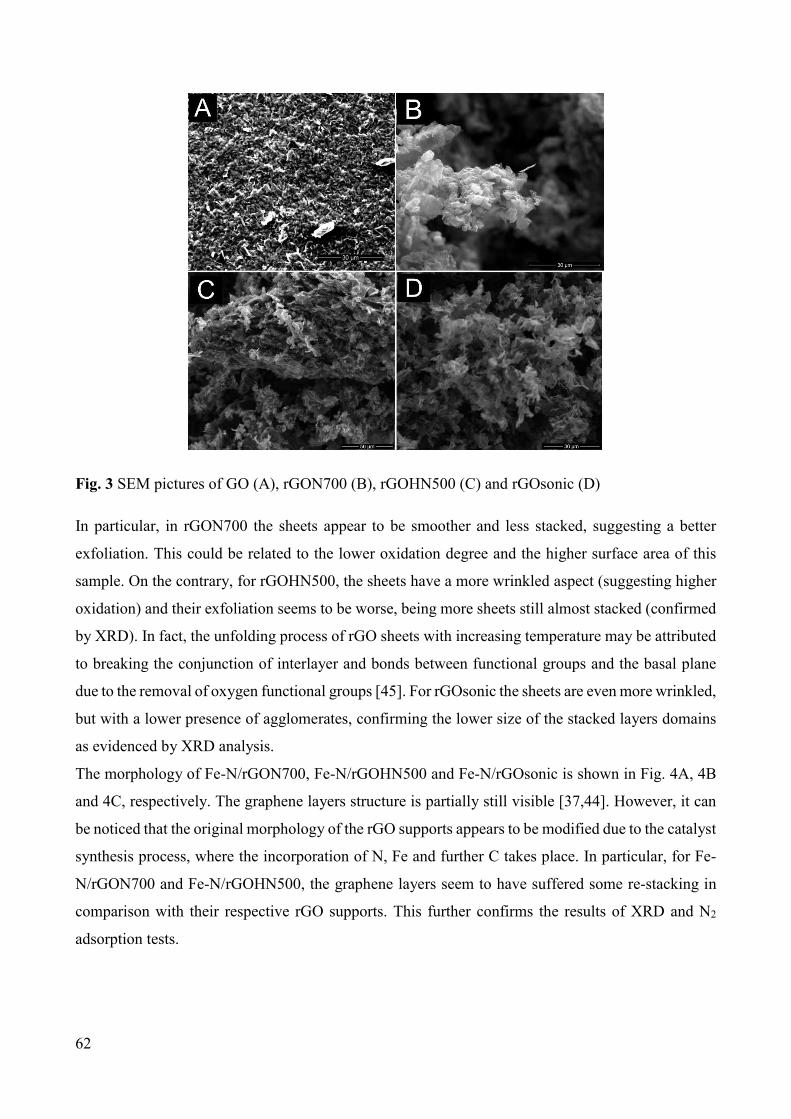
62
Fig. 3 SEM pictures of GO (A), rGON700 (B), rGOHN500 (C) and rGOsonic (D)
In particular, in rGON700 the sheets appear to be smoother and less stacked, suggesting a better
exfoliation. This could be related to the lower oxidation degree and the higher surface area of this
sample. On the contrary, for rGOHN500, the sheets have a more wrinkled aspect (suggesting higher
oxidation) and their exfoliation seems to be worse, being more sheets still almost stacked (confirmed
by XRD). In fact, the unfolding process of rGO sheets with increasing temperature may be attributed
to breaking the conjunction of interlayer and bonds between functional groups and the basal plane
due to the removal of oxygen functional groups [45]. For rGOsonic the sheets are even more wrinkled,
but with a lower presence of agglomerates, confirming the lower size of the stacked layers domains
as evidenced by XRD analysis.
The morphology of Fe-N/rGON700, Fe-N/rGOHN500 and Fe-N/rGOsonic is shown in Fig. 4A, 4B
and 4C, respectively. The graphene layers structure is partially still visible [37,44]. However, it can
be noticed that the original morphology of the rGO supports appears to be modified due to the catalyst
synthesis process, where the incorporation of N, Fe and further C takes place. In particular, for Fe-
N/rGON700 and Fe-N/rGOHN500, the graphene layers seem to have suffered some re-stacking in
comparison with their respective rGO supports. This further confirms the results of XRD and N2
adsorption tests.
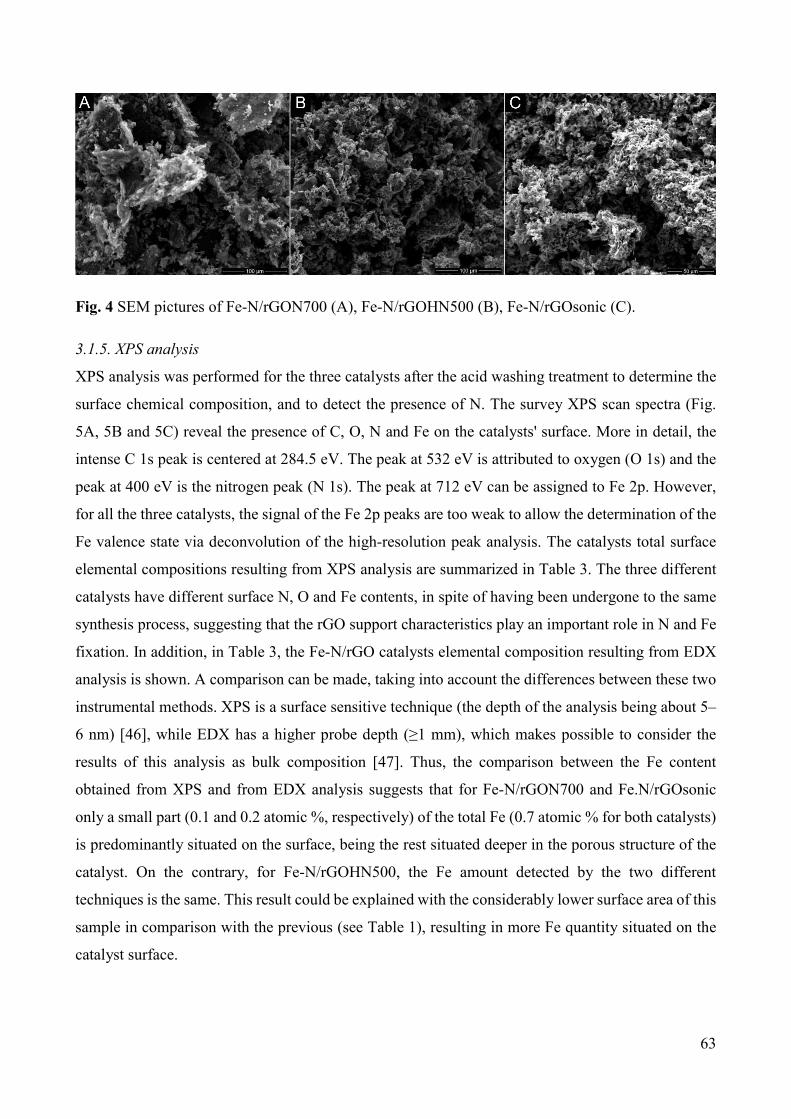
63
Fig. 4 SEM pictures of Fe-N/rGON700 (A), Fe-N/rGOHN500 (B), Fe-N/rGOsonic (C).
3.1.5. XPS analysis
XPS analysis was performed for the three catalysts after the acid washing treatment to determine the
surface chemical composition, and to detect the presence of N. The survey XPS scan spectra (Fig.
5A, 5B and 5C) reveal the presence of C, O, N and Fe on the catalysts' surface. More in detail, the
intense C 1s peak is centered at 284.5 eV. The peak at 532 eV is attributed to oxygen (O 1s) and the
peak at 400 eV is the nitrogen peak (N 1s). The peak at 712 eV can be assigned to Fe 2p. However,
for all the three catalysts, the signal of the Fe 2p peaks are too weak to allow the determination of the
Fe valence state via deconvolution of the high-resolution peak analysis. The catalysts total surface
elemental compositions resulting from XPS analysis are summarized in Table 3. The three different
catalysts have different surface N, O and Fe contents, in spite of having been undergone to the same
synthesis process, suggesting that the rGO support characteristics play an important role in N and Fe
fixation. In addition, in Table 3, the Fe-N/rGO catalysts elemental composition resulting from EDX
analysis is shown. A comparison can be made, taking into account the differences between these two
instrumental methods. XPS is a surface sensitive technique (the depth of the analysis being about 5–
6 nm) [46], while EDX has a higher probe depth (≥1 mm), which makes possible to consider the
results of this analysis as bulk composition [47]. Thus, the comparison between the Fe content
obtained from XPS and from EDX analysis suggests that for Fe-N/rGON700 and Fe.N/rGOsonic
only a small part (0.1 and 0.2 atomic %, respectively) of the total Fe (0.7 atomic % for both catalysts)
is predominantly situated on the surface, being the rest situated deeper in the porous structure of the
catalyst. On the contrary, for Fe-N/rGOHN500, the Fe amount detected by the two different
techniques is the same. This result could be explained with the considerably lower surface area of this
sample in comparison with the previous (see Table 1), resulting in more Fe quantity situated on the
catalyst surface.
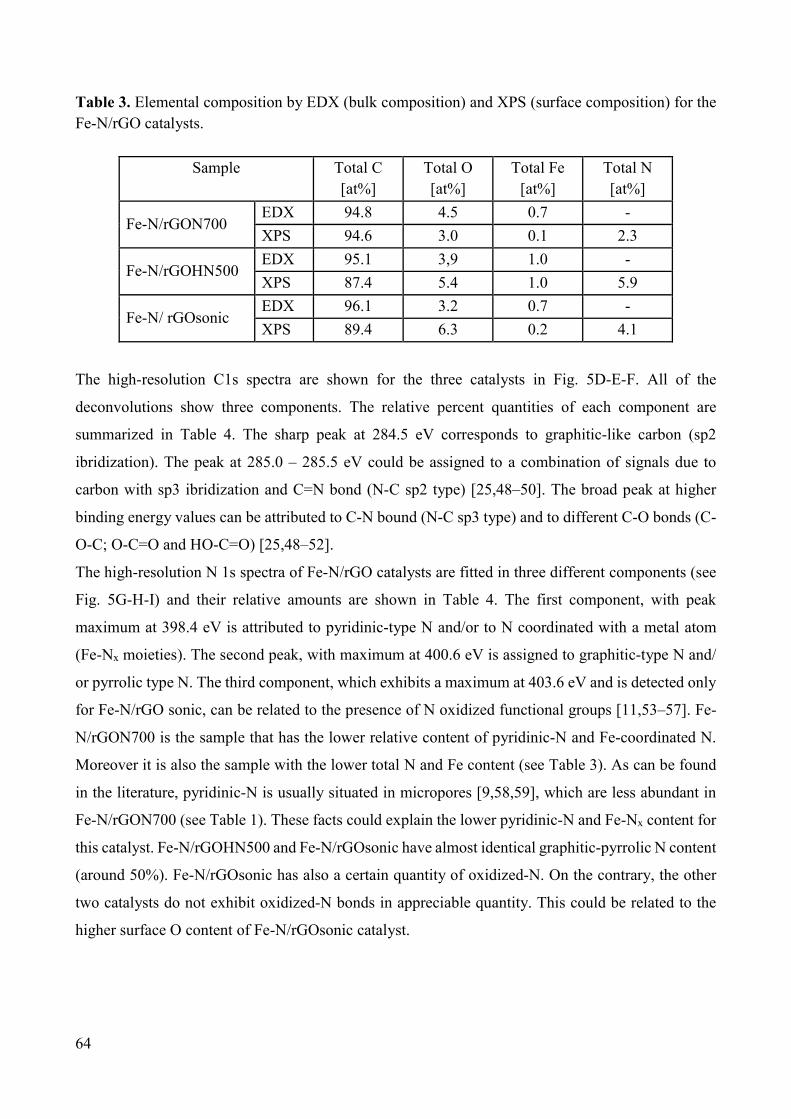
64
Table 3. Elemental composition by EDX (bulk composition) and XPS (surface composition) for the
Fe-N/rGO catalysts.
Sample Total C
[at%]
Total O
[at%]
Total Fe
[at%]
Total N
[at%]
Fe-N/rGON700 EDX 94.8 4.5 0.7 -
XPS 94.6 3.0 0.1 2.3
Fe-N/rGOHN500 EDX 95.1 3,9 1.0 -
XPS 87.4 5.4 1.0 5.9
Fe-N/ rGOsonic EDX 96.1 3.2 0.7 -
XPS 89.4 6.3 0.2 4.1
The high-resolution C1s spectra are shown for the three catalysts in Fig. 5D-E-F. All of the
deconvolutions show three components. The relative percent quantities of each component are
summarized in Table 4. The sharp peak at 284.5 eV corresponds to graphitic-like carbon (sp2
ibridization). The peak at 285.0 – 285.5 eV could be assigned to a combination of signals due to
carbon with sp3 ibridization and C=N bond (N-C sp2 type) [25,48–50]. The broad peak at higher
binding energy values can be attributed to C-N bound (N-C sp3 type) and to different C-O bonds (C-
O-C; O-C=O and HO-C=O) [25,48–52].
The high-resolution N 1s spectra of Fe-N/rGO catalysts are fitted in three different components (see
Fig. 5G-H-I) and their relative amounts are shown in Table 4. The first component, with peak
maximum at 398.4 eV is attributed to pyridinic-type N and/or to N coordinated with a metal atom
(Fe-Nx moieties). The second peak, with maximum at 400.6 eV is assigned to graphitic-type N and/
or pyrrolic type N. The third component, which exhibits a maximum at 403.6 eV and is detected only
for Fe-N/rGO sonic, can be related to the presence of N oxidized functional groups [11,53–57]. Fe-
N/rGON700 is the sample that has the lower relative content of pyridinic-N and Fe-coordinated N.
Moreover it is also the sample with the lower total N and Fe content (see Table 3). As can be found
in the literature, pyridinic-N is usually situated in micropores [9,58,59], which are less abundant in
Fe-N/rGON700 (see Table 1). These facts could explain the lower pyridinic-N and Fe-Nx content for
this catalyst. Fe-N/rGOHN500 and Fe-N/rGOsonic have almost identical graphitic-pyrrolic N content
(around 50%). Fe-N/rGOsonic has also a certain quantity of oxidized-N. On the contrary, the other
two catalysts do not exhibit oxidized-N bonds in appreciable quantity. This could be related to the
higher surface O content of Fe-N/rGOsonic catalyst.

65
Table 4. Nitrogen and carbon contents with relative intensities and binding energies of N 1s (N1:
pyridinic N and/or Fe-Nx; N2: pyrrolic and/or graphitic N; N3: oxidized N) and C 1s (C1: graphitic
C; C2: C-C sp3 and/or C=N sp2; C3: C-N sp3 and/or oxidized C) peaks from XPS analysis of the Fe-
N/rGO catalysts.
Sample
N 1s C 1s
N1 [at. %]
(B.E [eV])
N2 [at. %]
(B.E [eV])
N3 [at. %]
(B.E [eV])
C1 [at. %]
(B.E [eV])
C2 [at. %]
(B.E [eV])
C3 [at. %]
(B.E [eV])
Fe-N/rGON700 26.2
(398.4)
73.8
(400.6)
n.d.
-
45.7
(284.5)
34.5
(285.1)
19.8
(289.3)
Fe-N/rGOHN500 49.4
(398.3)
50.6
(400.6)
n.d.
-
43.9
(284.5)
44.9
(285.0)
11.2
(287.2)
Fe-N/rGOsonic 38.9
(398.3)
50.5
(400.5)
10.6
(403.6)
49.0
(284.5)
32.5
(285.3)
18.5
(288.5)
Therefore, the amount of nitrogen incorporated, as well as the abundance of the different nitrogen
species created during the catalysts synthesis process, is significantly influenced by the nature of the
starting rGO support. Regarding the relative content of the different N bound types, the amounts
found in our samples are comparable to the values found in the literature for similar rGO-supported
catalysts doped with N and Fe [11,56]. Nitorgen doping occurring during a heat treatment at T
between 700 and 1000 °C in presence of a transition metal ion, is essential to significantly increase
the catalytic activity of carbon-based materials [9]. However, neither the exact structure of the active
sites, nor the role of the transition metal in them have been clearly identified yet [8].
In fact, no direct relation was found between total N and Fe content and catalyst electroactivity
towards ORR. The same conclusion can be done restricting the analysis to the different nitrogen
types. This means that even if nitrogen atoms are known to be part of active sites, their amount is not
the limiting factor for the ORR electroactivity [55].
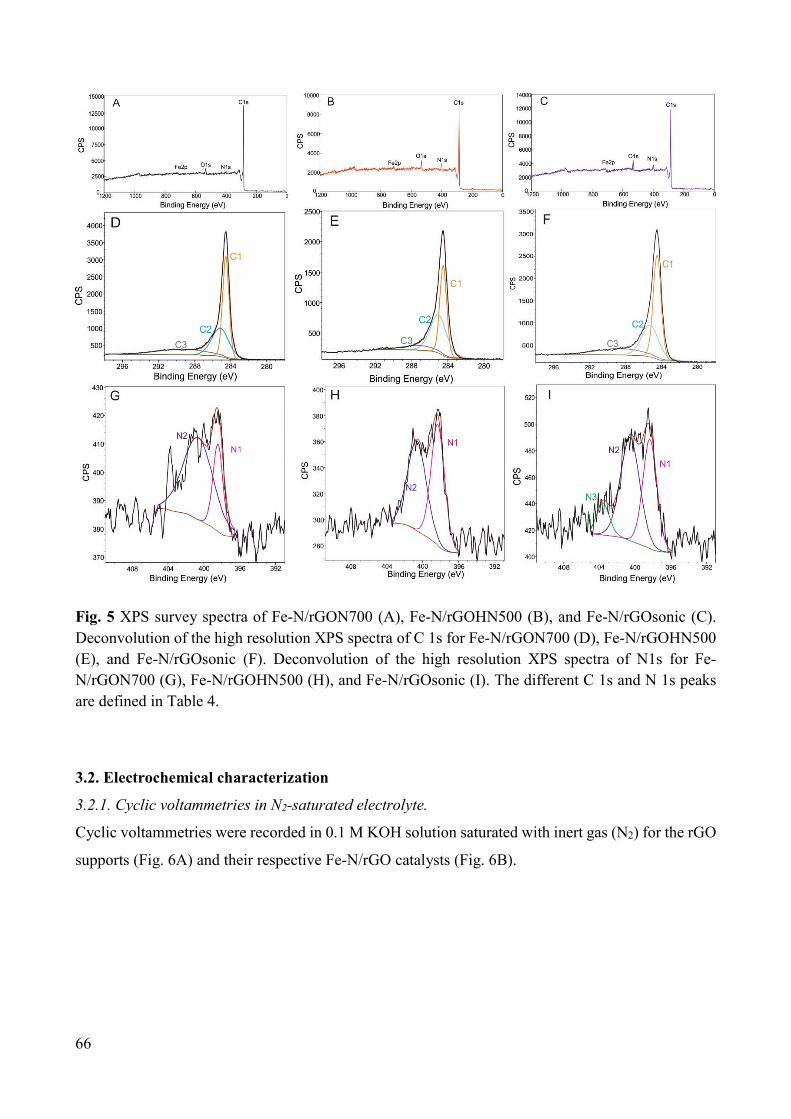
66
Fig. 5 XPS survey spectra of Fe-N/rGON700 (A), Fe-N/rGOHN500 (B), and Fe-N/rGOsonic (C).
Deconvolution of the high resolution XPS spectra of C 1s for Fe-N/rGON700 (D), Fe-N/rGOHN500
(E), and Fe-N/rGOsonic (F). Deconvolution of the high resolution XPS spectra of N1s for Fe-
N/rGON700 (G), Fe-N/rGOHN500 (H), and Fe-N/rGOsonic (I). The different C 1s and N 1s peaks
are defined in Table 4.
3.2. Electrochemical characterization
3.2.1. Cyclic voltammetries in N2-saturated electrolyte.
Cyclic voltammetries were recorded in 0.1 M KOH solution saturated with inert gas (N2) for the rGO
supports (Fig. 6A) and their respective Fe-N/rGO catalysts (Fig. 6B).

67
Fig. 6 CV recorded at 10 mV s-1 scan rate in N2-saturated 0.1 M KOH for rGO supports (A) and Fe-
N/rGO catalysts (B).
Then, starting from these capacitive current densities values, the average specific capacitance per
mass of catalyst (Cm) was calculated by using the following equation [55]:
=∫
() (1)
where icap is the capacitive current density, E is the potential, ν is scan rate, E1 and E2 are the extremes
of the scanned potential range and mc is the catalyst loading. For rGO supports the as calculated
capacitance values are summarized in Table 5. It can be noticed that the specific capacitance is grater
for the samples which exhibit a lower C/O ratio. This means that capacitance is strictly related with
surface oxidation and more generally, with surface functionalization, as reported in several works
[60–63]. In the case of rGO supports, since no other elements than C and O are detected by the EDX,
the surface functionalization could be totally ascribed to oxygen-containing functional groups still
present due to the only partial progress of the reduction-exfoliation processes, as also confirmed by
XRD analysis.
Generally, the enhancement of specific capacitance for carbon materials can be realized by special
oxidation of carbon for increasing the surface functionality (e.g. through chemical treatment or
electro-chemical polarization) [63]. The capacitive current phenomena on this type of carbonaceous
materials could be influenced by different factors: pore geometry, pore size distribution, electrical
conductivity, wettability, and presence of surface electroactive species [61,63]. Pseudo-capacitance
effect of surface redox-sites must also be considered. Pseudo-capacitance at the carbon surface can
be due to chemisorption phenomena with partial charge transfer, or to redox processes (e.g. involving
quinone-hydroquinone functional groups). These pseudo-capacitance effects related with faradic
0.0 0.1 0.2 0.3 0.4 0.5 0.6 0.7 0.8 0.9 1.0 1.1 1.2
-0.4
-0.3
-0.2
-0.1
0.0
0.1
0.2
0.3
0.4
i (m
A c
m-2)
E vs RHE (V)
rGON700 rGOHN500 rGOsonic
A
0.0 0.1 0.2 0.3 0.4 0.5 0.6 0.7 0.8 0.9 1.0 1.1 1.2
-0.30
-0.25
-0.20
-0.15
-0.10
-0.05
0.00
0.05
0.10
0.15
0.20B
i (m
A c
m-2)
E vs RHE (V)
Fe-N/rGON700 Fe-N/rGOHN500 Fe-N/rGOsonic
68
reactions of surface groups enhance the value of the capacitance [63]. Therefore, the importance of
these pseudo-capacitance phenomena seem to be significantly higher than the electrostatic double
layer capacitance, which is related to the surface area [11,64]. Theoretically, the higher the specific
surface area, the higher the specific capacitance should be. Practically, the situation is more
complicated, and carbons with smaller surface area give a larger specific capacitance than those with
a larger surface area [63]. However, this could be limited by the surface wettability and accessibility.
An important factor, in fact, is the accessibility of micropores to acqueous solution [65].
The specific capacitance values for the Fe-N/rGO catalysts are also shown in Table 5. The samples
with more surface modification (higher N, O and Fe content) also exhibit higher capacitance. For Fe-
N/rGON700 there is a decrease of the capacitance value with respect to rGON700 support of about
one half. This could be partly due to the considerable surface area decrease (see Table 1). Concerning
Fe-N/rGO, its capacitance slightly increases in comparison with its respective support (rGOHN500).
This could be ascribed to the increase of the surface functionalization (Table 2 and 3) calculated as C
to other atoms ratio. Fe-N/rGOsonic specific capacitance is considerably lower than for rGOsonic
support, and this could probably be caused by further reduction of C-oxidized surface groups (that
are still present in great quantity on rGOsonic) during the pyrolisis at 800° C in the catalyst synthesis
process.
3.2.2. ORR electroactivity.
The oxygen reduction activity in alkaline medium was assessed by the RDE technique for the three
diferent types of rGO and their respective Fe-N/rGO electrocatalysts. As evidenced in Fig. 7A, the
rGO have a not negligible activity towards ORR. This is due to the fact that in alkaline medium,
carbon materials themselves are effective catalysts for the reduction of O2 to peroxide [66]. The ORR
activity of the electrocatalysts is highly enhanced in comparison with the rGO supports. Observing
the LSV recorded in RDE test (Fig. 7A), it is evident how both the ORR onset potential (defined as
the potential at which a current density of 0.1 mA cm-2 is generated [67]) and the half-wave potential
of the Fe-N/rGO catalysts are between 100 and 150 mV higher than for their respective rGO supports.
This electroactivity increase is due to the incorporation of N and Fe in the rGO carbon structure during
the heat treatment at high temperature. In the linear sweep voltammetries of the three rGO (see Fig.
7A) there is no any trace of well-developed diffusion limited plateau current zone, sign that the current
density at high overpotential values is still in a mixed kinetic and mass- or charge-transport limited
zone [68]. The values of the limiting current densities range can be assumed to be in the range
between -2.76 and -3.03 mA cm-2.

69
Otherwise, for the Fe-N/rGO catalysts, the linear sweep voltammetry shape at high overpotentials is
less inclined, even if also in this case there is no well-developed diffusion limited zone. The limiting
current densities are higher than for rGO supports, and range between -3.25 and -3.55 mA cm-2.
These limiting current densities values were used to calculate the mass-transport corrected ORR
electro-reduction kinetic activity by equation (2):
= −∙
(2)
where ik is mass transport-corrected current density, i is the current density, and iL is the limiting
current density. A correction for the ohmic drop was also done, based on the resistance values
obtained by the impedance measurements as described in the experimental section. The as-calculated
ik values can be transformed in specific mass current densities (A g-1), simply dividing by the catalyst
loading on the electrode (mg cm-2). The potential vs logarithm of specific mass current density plot
for the rGO and the Fe-N/rGO catalysts are shown in Fig. 7B. The ORR mass activity values (A per
g of catalyst) at 0.9 and 0.8 v vs RHE for Fe-N/rGO catalysts and at 0.8 V vs RHE for rGO supports
are shown in Table 5.
Fig. 7 LSV recorded in O2-saturated 0.1 M KOH solution at a rotational speed of 900 rpm and
potential scan rate of 5 mV s-1 (A). Tafel plot after mass-transport limitation correction (B).
The portion of the curves at low overpotentials has a linear trend (Tafel behavior), and allows the
calculation of two kinetic parameters: the exchange current density (i0) and the cathodic transfer
coefficient (αc), according to the Tafel equation [2,69–71]:
= +.
log −
.
log (3)
0.0 0.1 0.2 0.3 0.4 0.5 0.6 0.7 0.8 0.9 1.0 1.1 1.2
-3.5
-3.0
-2.5
-2.0
-1.5
-1.0
-0.5
0.0A
i (m
A c
m-2)
E vs RHE (V)
rGON700 rGOHN500 rGOsonic Fe-N/rGON700 Fe-N/rGOHN500 Fe-N/rGOsonic
0.1 1 10
0.65
0.70
0.75
0.80
0.85
0.90
0.95
B rGON700 rGOHN500 rGOsonic Fe-N/rGON700 Fe-N/rGOHN500 Fe-N/rGOsonic
E v
s R
HE
(V
)
i mass-transport corrected (A g-1)
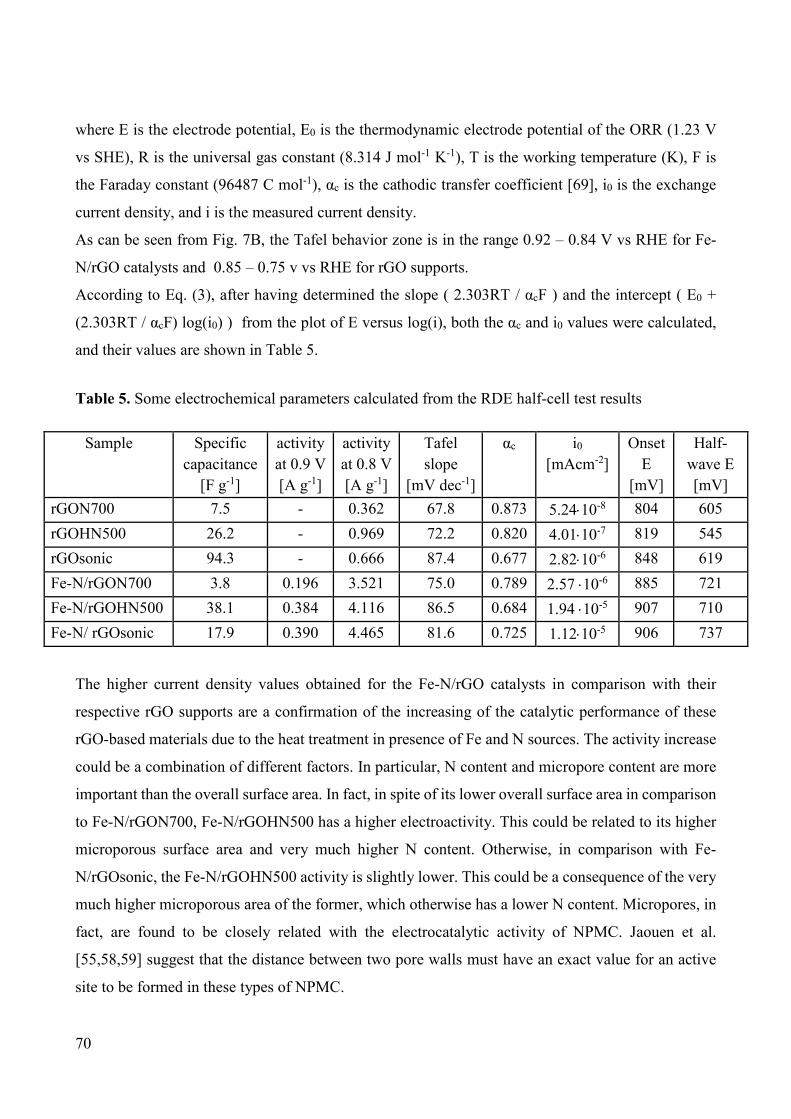
70
where E is the electrode potential, E0 is the thermodynamic electrode potential of the ORR (1.23 V
vs SHE), R is the universal gas constant (8.314 J mol-1 K-1), T is the working temperature (K), F is
the Faraday constant (96487 C mol-1), αc is the cathodic transfer coefficient [69], i0 is the exchange
current density, and i is the measured current density.
As can be seen from Fig. 7B, the Tafel behavior zone is in the range 0.92 – 0.84 V vs RHE for Fe-
N/rGO catalysts and 0.85 – 0.75 v vs RHE for rGO supports.
According to Eq. (3), after having determined the slope ( 2.303RT / αcF ) and the intercept ( E0 +
(2.303RT / αcF) log(i0) ) from the plot of E versus log(i), both the αc and i0 values were calculated,
and their values are shown in Table 5.
Table 5. Some electrochemical parameters calculated from the RDE half-cell test results
Sample Specific
capacitance
[F g-1]
activity
at 0.9 V
[A g-1]
activity
at 0.8 V
[A g-1]
Tafel
slope
[mV dec-1]
αc i0
[mAcm-2]
Onset
E
[mV]
Half-
wave E
[mV]
rGON700 7.5 - 0.362 67.8 0.873 5.2410-8 804 605
rGOHN500 26.2 - 0.969 72.2 0.820 4.0110-7 819 545
rGOsonic 94.3 - 0.666 87.4 0.677 2.8210-6 848 619
Fe-N/rGON700 3.8 0.196 3.521 75.0 0.789 2.57 10-6 885 721
Fe-N/rGOHN500 38.1 0.384 4.116 86.5 0.684 1.94 10-5 907 710
Fe-N/ rGOsonic 17.9 0.390 4.465 81.6 0.725 1.1210-5 906 737
The higher current density values obtained for the Fe-N/rGO catalysts in comparison with their
respective rGO supports are a confirmation of the increasing of the catalytic performance of these
rGO-based materials due to the heat treatment in presence of Fe and N sources. The activity increase
could be a combination of different factors. In particular, N content and micropore content are more
important than the overall surface area. In fact, in spite of its lower overall surface area in comparison
to Fe-N/rGON700, Fe-N/rGOHN500 has a higher electroactivity. This could be related to its higher
microporous surface area and very much higher N content. Otherwise, in comparison with Fe-
N/rGOsonic, the Fe-N/rGOHN500 activity is slightly lower. This could be a consequence of the very
much higher microporous area of the former, which otherwise has a lower N content. Micropores, in
fact, are found to be closely related with the electrocatalytic activity of NPMC. Jaouen et al.
[55,58,59] suggest that the distance between two pore walls must have an exact value for an active
site to be formed in these types of NPMC.
71
Concerning cathodic transfer coefficient (αc), all of the found values are in the range 0.6 – 0.9. This
is in accordance to the values found in the literature for similar C-based materials and Me-N-C
catalysts in alkaline conditions [72–75].
4. Conclusions
Starting from GO, by means of three different reduction/exfoliation methods we obtained rGO
samples with different characteristics, as demonstrated by physicochemical and electrochemical
characterizations. Annealing at 700°C in N2 lead to obtain a better exfoliated rGO. This is also the
more suitable method to obtain a better reduction (higher C/O ratio). The rGO themselves have a
certain electroactivity towards the ORR in alkaline conditions. However, to improve this activity, Fe-
N/rGO catalysts were synthesized by doping the rGO surface using a Fe-complex with the N-
containing ligand molecule TPTZ, by wet impregnation and a subsequent pyrolysis at 800°C.
Different behaviors of catalysts synthesized in the same way but starting from different rGO supports
were obtained, showing different electroactivities and physiscochemical properties as overall and
microporous surface area and nitrogen content. The electroactivity increase is a consequence of the
combination of these properties, as well as the carbon support characteristics. In particular, the
importance of the starting rGO support characteristics on the final properties of the Fe-N/rGO catalyst
are pointed out.
References
[1] Othman R, Dicks AL, Zhu Z (2010) Non precious metal catalysts for the PEM fuel cell cathode.
Int J Hydrogen Energy 37:357–372
[2] Monteverde Videla AHA, Zhang L, Kim J, Zeng J, Francia C, Zhang J, Specchia S (2013)
Mesoporous carbons supported non-noble metal Fe–NX electrocatalysts for PEM fuel cell oxygen
reduction reaction. J Appl Electrochem 43:159–169
[3] Santasalo-Aarnio A, Borghei M, Anoshkin IV, Nasibulin AG, Kauppinen EI, Ruiz V, Kallio T
(2012) Durability of different carbon nanomaterial supports with PtRu catalyst in a direct methanol
fuel cell. Int J Hydrogen Energy 37:3415–3424
[4] Specchia S, Francia C, Spinelli P, in: J. Zhang, L. Zhang, H. Liu, A. Sun, R.S. Liu (Eds.),
Electrochemical Technologies for Energy Storage and Conversion, Wiley-VCH, Weinheim, 2011,
pp. 601–670
[5] Monteverde Videla AHA, Osmieri L, Armandi M, Specchia S (2015) Varying the morphology of
Fe-N-C electrocatalysts by templating Iron Phthalocyanine precursor with different porous SiO2 to
promote the Oxygen Reduction Reaction. Electrochim Acta 177:43–50

72
[6] Alonso-Vante N, Feng Y (2008) Nonprecious metal catalysts for the molecular oxygen-reduction
reaction. Physica Status Solidi (B) 245:1792–1806
[7] Bezerra CWB, Zhang L, Lee K, Liu H, Marques ALB, Marques EP, Wang H, Zhang J (2008) A
review of Fe–N/C and Co–N/C catalysts for the oxygen reduction reaction. Electrochim Acta
53:4937–4951.
[8] Dodelet J.-P. In: Electrocatalysis in Fuel Cells; Shao, M., Ed.; Springer-Verlag: London, 2013;
Chapter 10, pp 271–338
[9] Jaouen F, Proietti E, Lefèvre M, Chenitz R, Dodelet J-P, Wu G, Chung HT, Johnston CM, Zelenay
P (2011) Recent advances in non-precious metal catalysis for oxygen-reduction reaction in polymer
electrolyte fuel cells. Energy Environ Sci 4:114–130
[10] Li S, Zhang L, Liu H, Pan M, Zan L, Zhang J (2010) Heat-treated cobalt–tripyridyl triazine (Co–
TPTZ) electrocatalysts for oxygen reduction reaction in acidic medium. Electrochim Acta 55:4403–
4411
[11] Monteverde Videla AHA, Ban S, Specchia S, Zhang L, Zhang J (2014) Non-noble Fe–NX
electrocatalysts supported on the reduced graphene oxide for oxygen reduction reaction. Carbon
76:386–400
[12] Bron M, Radnik J, Fieber-Erdmann M, Bogdanoff P, Fiechter S (2002) EXAFS, XPS and
electrochemical studies on oxygen reduction catalysts obtained by heat treatment of iron
phenanthroline complexes supported on high surface area carbon black. J Electroanal Chem 535:113–
119
[13] Tian J, Morozan A, Sougrati MT, Lefèvre M, Chenitz R, Dodelet J-P, Jones D, Jaouen F (2013)
Optimized Synthesis of Fe/N/C Cathode Catalysts for PEM Fuel Cells: A Matter of Iron–Ligand
Coordination Strength. Angew. Chem. Int. Ed. 52:6867–6870
[14] Gojkovic SL, Gupta S, Savinell RF (1999) Heat-treated iron(III) tetramethoxyphenyl porphyrin
chloride supported on high-area carbon as an electrocatalyst for oxygen reduction. Part II. Kinetics
of oxygen reduction. J Electroanal Chem 462:63–72
[15] Ramaswamy N, Mukerjee S (2012) Fundamental Mechanistic Understanding of Electrocatalysis
of Oxygen Reduction on Pt and Non-Pt Surfaces: Acid versus AlkalineMedia. Adv Phys Chem
doi:10.1155/2012/491604
[16] Couture G, Alaaeddine A, Boschet F, Ameduri B (2011) Polymeric materials as anion-exchange
membranes for alkaline fuel cells. Progress Polymer Sci 36:1521–1557
[17] Chen Z, Higgins D, Yu A, Zhang L, Zhang J (2011) A review on non-precious metal
electrocatalysts for PEM fuel cells. Energy Environ Sci 4:3167–3192
73
[18] Zhu Y, Murali S, Cai W, Li X, Suk JW, Potts JR, Ruoff RS (2010) Graphene and Graphene
Oxide: Synthesis, Properties, and Applications. Adv. Mater. 22:3906–3924
[19] Choi H-J, Jung S-M, Seo J-M, Chang DW, Dai L, Baek JB (2012) Graphene for energy
conversion and storage in fuel cells and supercapacitors. Nano Energy 1:534–551
[20] Lee S, Eom SH, Chung JS, Hur SH (2013) Large-scale production of high-quality reduced
graphene oxide. Chem Eng J 223:297–304
[21] Dreyer DR, Park S, Bielawski CW, Ruoff RS (2010) The chemistry of graphene oxide. Chem
Soc Rev 39:228–240
[22] Pei S, Cheng H-M (2012) The reduction of graphene oxide. Carbon 50:3210–3228
[23] Krishnamoorthy K, Veerapandian M, Yun K, Kim SJ (2013) The chemical and structural
analysis of graphene oxide with different degrees of oxidation. Carbon 53:38–49
[24] Zhu Y, Murali S, Stoller MD, Velamakanni A, Piner RD, Ruoff RS (2010) Microwave assisted
exfoliation and reduction of graphite oxide for ultracapacitors. Carbon 48:2106–2122
[25] Stankovich S, Dikin DA, Piner RD, Kohlhaas KA, Kleinhammes A, Jia Y, Wu Y, Nguyen SBT,
Ruoff RS (2007) Synthesis of graphene-based nanosheets via chemical reduction of exfoliated
graphite oxide. Carbon 45:1558–1565
[26] Kaniyoor A, Baby TT, Arockiadoss T, Rajalakshmi N, Ramaprabhu S (2011) Wrinkled
Graphenes: A Study on the Effects of Synthesis Parameters on Exfoliation-Reduction of Graphite
Oxide. J Phys Chem C 115:17660–17669
[27] Schniepp HC, Li J-L, McAllister MJ, Sai H, Herrera-Alonso M, Adamson DH, Prud’homme
RK, Car R, Saville DA, Aksay IA (2006) Functionalized single graphene sheets derived from splitting
graphite oxide. J Phys Chem B 110:8535–8539
[28] Hummers WS, Offeman RE (1958) Prepration of Graphitic Oxide. J Am Chem Soc 80:1339
[29] Marcano DC, Kosynkin DV, Berlin JM, Sinitskii A, Sun Z, Slesarev A, Alemany LB, Lu W,
Tour JM (2010) ACS nano 4:4806–4814
[30] Osmieri L, Monteverde Videla AHA, Specchia S (2015) Activity of Co–N multi walled carbon
nanotubes electrocatalysts for oxygen reduction reaction in acid conditions. J. Power Sources
278:296–307
[31] Garsany Y, Ge J, St-Pierre J, Rocheleau R, Swider-Lyons KE (2014) Analytical Procedure for
Accurate Comparison of Rotating Disk Electrode Results for the Oxygen Reduction Activity of Pt/C.
J Electrochem Soc 161:F628–F640
[32] Paulus UA, Schmidt TJ, Gasteiger HA, Behm RJ (2001) Oxygen reduction on a high-surface
area Pt/Vulcan carbon catalyst: a thin-film rotating ring-disk electrode study. J Electroanal Chem
495:134–145
74
[33] van der Vliet D, Strmcnik DS, Wang C, Stamenkovic VR, Markovic NM, Koper MTM (2010)
On the importance of correcting for the uncompensated Ohmic resistance in model experiments of
the Oxygen Reduction Reaction. J electroanal Chem 647:29–34
[34] Sing KSW, Everett DH, Haul RAW, Moscou L, Pierotti RA, Rouquérol J, Siemieniewska T
(1985) Reporting Physisorption Data for Gas/Solid Systems with Special Reference to the
Determination of Surface Area and Porosity. Pure & Appl Chem 57:603–619
[35] Liu Q, Zhang H, Zhong H, Zhang S, Chen S (2012) N-doped graphene/carbon composite as non-
precious metal electrocatalyst for oxygen reduction reaction. Electrochim Acta 81:313–320
[36] Lee KR, Lee KU, Lee JW, Ahn BT, Woo SI (2010) Electrochemical oxygen reduction on
nitrogen doped graphene sheets in acid media. Electrochem Comm 12:1052–1055
[37] Yu L, Shen Y, Huang Y (2014) Fe-N-C catalyst modified graphene sponge as a cathode material
for lithium-oxygen battery. J. Alloys and Compounds 595:185–191
[38] Sun Z, Fu Q, Li H, Li K (2014) Preparation and electrochemical capacitive behavior of graphene
by microwave assisted thermal reduction of graphite oxide in hydrazine hydrate. NANO 6: 1450066
[39] Tsai C-W, Tu M-H, Chen CJ, Hung TF, Liu RS, Liu W-R, Lo M-Y, Peng Y-M, Zhang L, Zhang
J, Shyd D-S, Xing XK (2011) Nitrogen-doped graphene nanosheet-supported non-precious iron
nitride nanoparticles as an efficient electrocatalyst for oxygen reduction. RCS Advances 1:1349–1357
[40] Waseda Y, Matsubara E, Shinoda K, X-ray diffraction crystallography: introduction, examples
and solved problems, Springer, Berlin, 2011.
[41] Merzougui B, Hachimi A, Akinpelu A, Bukola S, Shao M (2013) A Pt-free catalyst for oxygen
reduction reaction based on Fe–N multiwalled carbon nanotube composites. Electrochim Acta
107:126–132
[42] Jeong H-K, Lee YP, Lahaye RJWE, Park M-H, An K-H, Kim IJ, Yang CW, Park CY, Ruoff RS,
Lee YH (2008) Evidence of Graphitic AB Stacking Order of Graphite Oxides. J Am Chem Soc
130:1362–1366
[43] Szabó T, Berkesi O, Forgó P, Josepovits K, Sanakis T, Petridis D, Dékány Y (2006) Evolution
of Surface Functional Groups in a Series of Progressively Oxidized Graphite Oxides. Chem Mater
18:2740–2749
[44] Geng D, Yanga S, Zhang Y, Yang J, Liu J, Li R, Sham T-K, Sun X, Ye S, Knights S (2011)
Nitrogen doping effects on the structure of grapheme. Appl Surf Sci 257:9193–9198
[45] Seresht RJ, Jahanshahi M, Rashidi A, Ghoreyshi AA (2013) Synthesize and characterization of
graphene nanosheets with high surface area and nano-porous structure. Appl Surf Sci 276:672–681
[46] Pérez-Alonso FJ, Abdel Salam M, Herranz T, Gómez de la Fuente JL, Al-Thabaiti SA, Basahel
SN, Peña MA, Fierro JLG, Rojas S (2013) Effect of carbon nanotube diameter for the synthesis of

75
Fe/N/multiwall carbon nanotubes and repercussions for the oxygen reduction reaction. J. Power
Sources 240:494–502
[47] Susac D, Sode A, Zhu L, Wong PC, Teo M, Bizzotto D, Mitchell KAR, Parsons RR, Campbell
SA (2006) A Methodology for Investigating New Nonprecious Metal Catalysts for PEM Fuel Cells.
J. Phys. Chem. B 110:10762–10770
[48] Li H, Kang W, Wang L, Yue Q, Xu S, Wang H, Liu J (2013) Synthesis of three-dimensional
flowerlike nitrogen-doped carbons by a copyrolysis route and the effect of nitrogen species on the
electrocatalytic activity in oxygen reduction reaction. Carbon 54:249–257
[49] Meng L-Y, Park S-J (2012) Preparation and Characterization of Reduced Graphene Nanosheets
via Pre-exfoliation of Graphite Flakes. Bull Korean Chem Soc 33:209–214
[50] Filik J, May PW, Pearce SRJ, Wild RK, Hallam KR (2003) XPS and laser Raman analysis of
hydrogenated amorphous carbon films. Diamond and Related Materials 12:974–978
[51] Niwa H, Horiba K, Harada Y, Oshima M, Ikeda T, Terakura K, Ozaki J, Miyata S (2009) X-ray
absorption analysis of nitrogen contribution to oxygen reduction reaction in carbon alloy cathode
catalysts for polymer electrolyte fuel cells. J Power Sources 187:93–97
[52] Lyth SM, Nabae Y, Moriya S, Kuroki S, Kakimoto M,Ozaki J, Miyata S (2009) Carbon Nitride
as a Nonprecious Catalyst for Electrochemical Oxygen Reduction. J Phys Chem C 113:20148–20151
[53] Artyushkova K, Habel-Rodriguez D, Olson TS, Atanassov P (2013) Optimization of ink
composition based on a non-platinum cathode for single membrane electrode assembly proton
exchange membrane fuel cells. J Power Sources 226:112–121
[54] Serov A, Artyushkova K, Andersen NI, Stariha S, Atanassov P (2015) Original
Mechanochemical Synthesis of Non-Platinum Group Metals Oxygen Reduction Reaction Catalysts
Assisted by Sacrificial Support Method. Electrochim Acta 179:154–160
[55] Jaouen F, Herranz J, Lefèvre M, Dodelet J-P, Kramm UI, Herrmann I, Bogdanoff P, Maruyama
J, Nagaoka T, Garsuch A, Dahn JR, Olson T, Pylypenko S, Atanassov P, Ustinov EA (2009) Cross-
laboratory experimental study of non-noble-metal electrocatalysts for the oxygen reduction reaction.
ACS Appl Mater Interfaces 1:1623–1639
[56] Byon HR, Suntivich J, Shao-Horn Y (2011) Graphene-Based Non-Noble-Metal Catalysts for
Oxygen Reduction Reaction in Acid. Chem Mater 23:3421–3428
[57] Byon HR, Suntivich J, Crumlin EJ, Shao-Horn Y (2011) Fe-N-modified multi-walled carbon
nanotubes for oxygen reduction reaction in acid. Phys Chem Chem Phys 13:21437–21445
[58] Lefèvre M, Proietti E, Jaouen F, Dodelet J-P (2009) Iron-based catalysts with improved oxygen
reduction activity in polymer electrolyte fuel cells. Science 324:71–74

76
[59] Jaouen F, Lefèvre M, Dodelet J-P, Cai M (2006) Heat-treated Fe/N/C catalysts for O2
electroreduction: are active sites hosted in micropores? J Phys Chem B 110:5553–5558
[60] Shao Y, Yin G, Zhang J, Gao Y (2006) Comparative investigation of the resistance to
electrochemical oxidation of carbon black and carbon nanotubes in aqueous sulfuric acid solution.
Electrochim Acta 51:5853–5857
[61] Wang J, Yin G, Shao Y, Zhang S, Wang Z, Gao Y (2007) Effect of carbon black support
corrosion on the durability of Pt/C catalyst. J Power Sources 171:331–339
[62] Ye J-S, Liu X, Cui HF, Zhang W-D, Sheu F-S, Lim TM (2005) Electrochemical oxidation of
multi-walled carbon nanotubes and its application to electrochemical double layer capacitors.
Electrochem Comm 7:249–255
[63] Frackowiak E, Beguin F (2001) Carbon materials for the electrochemical storage of energy in
capacitors. Carbon 39:937–950
[64] Kim T, Lim S, Kwon K, Hong S-H, Qiao W, Rhee CK, Yoon S-H, Mochida I (2006)
Electrochemical Capacitances of Well-Defined Carbon Surfaces. Langmuir 22:9086–9088
[65] Qu D, Shi H (1998) Studies of activated carbons used in double-layer capacitors. J Power Sources
74:99–107
[66] Kinoshita K, Carbon – Electrochemical and Physicochemical Properties, Wiley Interscience,
1988
[67] Wu G, More KL, Johnston CM, Zelenay P (2011) High-performance electrocatalysts for
oxygen reduction derived from polyaniline, iron, and cobalt. Science 332:443–447
[68] Garsany Y, Baturina OA, Swider-Lyons KE, Kocha SS (2010) Experimental methods for
quantifying the activity of platinum electrocatalysts for the oxygen reduction reaction. Anal. Chem.
82:6321–6328
[69] Guidelli R, Compton RG, Feliu JM, Gileadi E, Lipkowski J, Schmickler W, Trasatti S (2014)
Defining the transfer coefficient in electrochemistry: An assessment (IUPAC Technical Report). Pure
Appl Chem 86:245–258
[70] Guidelli R, Compton RG, Feliu JM, Gileadi E, Lipkowski J, Schmickler W, Trasatti S (2014)
Definition of the transfer coefficient in electrochemistry (IUPAC Recommendations 2014). Pure
Appl Chem 86:259–262
[71] Holewinski A, Linic S (2012) Elementary Mechanisms in Electrocatalysis: Revisiting the ORR
Tafel Slope. J Electrochem Soc 159:H864-H870
[72] Wong WY, Daud WRW, Mohamad AB, Kadhum AAK, Loh KS, Majlan EH, Lim KL (2014)
The Impact of Loading and Temperature on the Oxygen Reduction Reaction at Nitrogen-doped
Carbon Nanotubes in Alkaline Medium. Electrochimica Acta 129:47–54

77
[73] Fu X, Liu Y, Cao X, Jin J, Liu Q, Zhang J (2013) FeCo–Nx embedded graphene as high
performance catalysts for oxygen reduction reaction. Appl Catal B: Environm 131:143– 151
[74] Chung HT, Won JH, Zelenay P (2013) Nanostructured Active and stable carbon
nanotube/nanoparticle composite electrocatalyst for oxygen reduction. Nat Comm 4:1922
[75] Chen Z, Higgins D, Chen Z (2010) Electrocatalytic activity of nitrogen doped carbon nanotubes
with different morphologies for oxygen reduction reaction. Electrochimica Acta 55:4799–4804

78
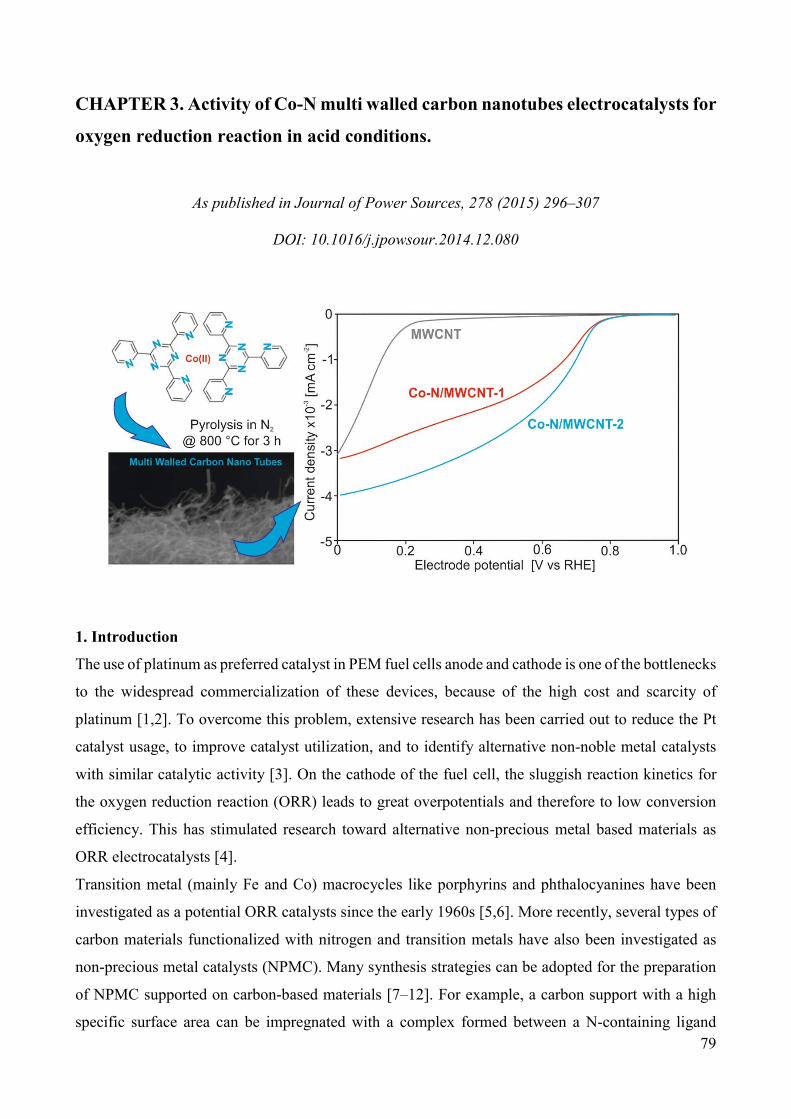
79
CHAPTER 3. Activity of Co-N multi walled carbon nanotubes electrocatalysts for
oxygen reduction reaction in acid conditions.
As published in Journal of Power Sources, 278 (2015) 296–307
DOI: 10.1016/j.jpowsour.2014.12.080
1. Introduction
The use of platinum as preferred catalyst in PEM fuel cells anode and cathode is one of the bottlenecks
to the widespread commercialization of these devices, because of the high cost and scarcity of
platinum [1,2]. To overcome this problem, extensive research has been carried out to reduce the Pt
catalyst usage, to improve catalyst utilization, and to identify alternative non-noble metal catalysts
with similar catalytic activity [3]. On the cathode of the fuel cell, the sluggish reaction kinetics for
the oxygen reduction reaction (ORR) leads to great overpotentials and therefore to low conversion
efficiency. This has stimulated research toward alternative non-precious metal based materials as
ORR electrocatalysts [4].
Transition metal (mainly Fe and Co) macrocycles like porphyrins and phthalocyanines have been
investigated as a potential ORR catalysts since the early 1960s [5,6]. More recently, several types of
carbon materials functionalized with nitrogen and transition metals have also been investigated as
non-precious metal catalysts (NPMC). Many synthesis strategies can be adopted for the preparation
of NPMC supported on carbon-based materials [7–12]. For example, a carbon support with a high
specific surface area can be impregnated with a complex formed between a N-containing ligand

80
molecule like TPTZ (2,4,6-tris(2-pyridyl)-1,3,5-triazine) or 1,10-phenanthroline, and a transition
metal ion (i.e., Fe, Co) [12–14], as precursor molecule for the formation of the ORR active sites [4].
According to the literature, in these NPMC the active site is formed during a heat-treatment at 500–
1000 °C if transition metal ions (Fe, Co, etc.), a source of carbon (carbon support, polymer) and a
source of nitrogen (N-containing molecule, polymer or gas) are simultaneously present. Nitrogen, in
fact, is a necessary component to form an active site for ORR in these catalysts [15–18].
Despite many years of research on non-noble metal electrocatalysts for ORR in acidic medium, the
role of transition metals (Fe, Co) is still controversial, and therefore the exact ORR active site has not
been exactly identified so far. Some scientists believe that the metal is an integral and
electrochemically active part of the catalytic site, while others believe that it is merely a chemical
catalyst for the formation of special oxygen reducing N-doped carbon structures [19]. In particular,
three different types of active sites were proposed in the 1980s by van Veen, Yeager, and Wiesener
respectively. On the basis of more recent studies, these different active sites could be simultaneously
present in transition metal based catalysts active for ORR in acidic medium, but their activity and
relative population can vary depending on the choice of the metal and nitrogen precursors, the
structural properties of the carbon support, and the synthesis procedure [19].
The kinetics of these M-N/C (M = Fe, Co, etc.) electrodes is around 150–200 mV below that of Pt/C
based electrocatalysts. This is partly because M-N/C electrocatalysts have a lower number of active
sites per unit volume than Pt/C based electrocatalysts [20]. The activity per unit volume (A cm–3) at
a given potential of these kinds of non-noble metal electrocatalysts could be described as the product
of the site density (sites cm–3) and the average turnover frequency (electrons per site per time at the
given potential) and the charge of a single electron [16]. After the calculation of the non-precious
metal catalysts mass activity (A g–1), the volumetric activity (A cm–3) can be calculated by
considering the density of the catalyst in the porous cathode [21].
The best activity values of NPMC previously reported in the literature rapidly increased in recent
years [16]. An overview of catalysts obtained with different synthesis procedures and their activities
as mass-specific current densities (A g–1) at 0.8 V vs RHE in RDE can be found in the works of
Jaouen et al. [16] and Cheon et al. [22]. These activities range between 0.5 and 20 A g–1 at 0.8 V vs
RHE. An exceptionally high activity of 45 A g–1 was obtained by Cheon et al. [22]. Lower specific
mass activities at 0.8 V vs RHE in the range of 0.01 and 0.8 A g–1 are obtained by other groups [19,
23 – 26]. In some works, activities are calculated at the potential of 0.75 V vs RHE and they range
between 0.1 and 2.5 A g–1 [27,28].
To improve both activity and stability of M-N/C catalysts, a variety of approaches have been
explored. These include the optimization of synthesis conditions and procedures, the development of
81
heat-treatment strategies, the exploration of different carbon supports, and the use of different
transition metal complexes with N-containing ligand molecules as precursors [12,23,29].
As carbon support, MWCNT have been studied by several groups [20,24,29–33]. Carbon nanotubes
have high electrical conductivity [34]. This can facilitate electron delivery to the active site, making
oxygen reduction fast and efficient in any possible active site. Carbon nanotubes also possess good
chemical and thermal stability [35]. These properties make MWCNT good candidates to be used as
carbon support for fuel cell catalysts preparation. The simultaneous doping of the carbon support with
nitrogen and transition metals can be done by using a N-containing ligand molecule that can form a
complex in solution with transition metals [12,23,26,29]. TPTZ ligand, which contains six nitrogen
atoms per molecule, could provide a sufficient amount of nitrogen for both the N-doping of the carbon
and the consequent formation of the ORR catalytic active sites.
In the literature, RDE-RRDE equipment and/or MEA configuration [36,37] are mainly used for the
study of both NPMC and Pt-based catalysts ORR activity. Some attempts have been made to try to
compare activity results obtained for the same catalyst in RDE and MEA, considering the differences
between the two testing approaches [21,37].
In this work, two Co-N catalysts were synthesized by wet impregnation of multi-walled carbon
nanotubes (MWCNT) and a complex between Co(II) ions and the N-containing TPTZ molecule,
followed by one or two heat treatments. The catalysts were characterized using several instrumental
methods for morphology, structure, chemical composition and thermal behavior. The activities
towards ORR in acid conditions were measured in rotating disk electrode (RDE) and in a gas-
diffusion electrode (GDE) cell. The stability of the as prepared Co-N/MWCNT catalysts was assessed
by performing chronoamperometries in both RDE and GDE cell.
RDE tests are suitable to study the ORR in controlled fluid-dynamic conditions according to the
classical approach of Levich, whereas GDE tests can be considered closer to the working operation
of a fuel cell testing. In the GDE the catalyst is deposited on a gas diffusion layer (GDL) disk whose
front is exposed to the electrolyte solution, where the counter and reference electrodes are also
immersed. The back of the GDL, on the other hand, is exposed to a gas flow (O2, air or N2) that can
be adequately regulated and controlled. The GDE slot configuration also allows the insertion of an
ionomer membrane layer on the catalyst [38,39].
The RDE measurements can be considered an ex-situ characterization method, which allows a fast
screening for the characterization of supported catalysts with respect to their ORR activity [40,41]. If
the preparation method of the glassy carbon disk results in a relatively thick and/or porous layer (1–
7 μm) with a high ionomer content, film diffusion resistance plays an important role. Such an ionomer
film diffusion resistance could strongly hamper the extraction of electrode kinetics from the measured
82
RDE data [36,42]. Thus, the reliability of RDE measurements could be problematic due to the absence
of a real fuel cell operation correlation.
On the other hand, the GDE cell setup can be considered an in-situ characterization method with a
behavior which is as close as possible to an actual fuel cell [40]. Here, the synthesized catalysts are
used for fabrication of catalyst layers similar to the cathode of a membrane electrode assembly
(MEA). The main advantage of the GDE cell, in fact, is the direct supply of gaseous oxygen to the
cathode, avoiding losses due to oxygen diffusion through the liquid electrolyte, thus increasing the
amount of accessible oxygen [43–46].
2. Experimental
2.1. Chemicals
2,4,6-tris(2-pyridyl)-1,3,5-triazine (TPTZ, ≥98% purity) and cobalt(II) nitrate hexahydrate
(Co(NO3)26H2O, ≥98% purity) were purchased from Sigma Aldrich and used as received.
Concentrated hydrochloric acid (37 wt.%) and sulfuric acid (98 wt.%) were purchased from Sigma
Aldrich and Fluka respectively, and used to prepare their respective aqueous solutions. Nitrogen and
oxygen gases were purchased in cylinders by SIAD with purity ≥99.999%. Ethanol (99.5% purity)
was purchased from Panreac. MWCNT (average length 5 m, outer diameter 6–9 nm) and Nafion
(5 wt.% hydro-alcoholic solution) were purchased from Sigma Aldrich. All aqueous solutions were
prepared using deionized water obtained from a Millipore Milli-Q system with resistivity >18 MΩ
cm–1.
2.2. Catalysts synthesis
Commercial multi-walled carbon nanotubes were used as carbon support material to prepare the Co-
N/MWCNT catalysts. The synthesis method consists in a wet impregnation followed by one or two
subsequent heat treatments.
Typically, an amount of 300 mg of MWCNT was dispersed in 150 mL of a 1:1 vol. deionized water
and ethanol solution under ultrasonic bath for 30 minutes (130 W, Soltec 2200 M 3S sonicator), and
left stirring for 1 hour. At the same time, 502 mg of TPTZ ligand molecule, used as a nitrogen source,
was dissolved in about 300 mL of deionized water, and the pH was adjusted to 1 by addition of 1 M
HCl solution under stirring. Then, 58 mg of Co(NO3)26H2O was added to the TPTZ solution, with
the immediate formation of a red-colored complex. The Co:TPTZ molar ratio in this complex was of
1:6. The greater quantity of TPTZ in the synthesis should assure a stoichiometric excess of ligand
molecule to favor the chemical equilibrium of the Co ion complexation. Moreover, the excess of
83
TPTZ (and therefore of N atoms) should lead to higher doping level of the MWCNT surface with N
atoms, favoring thus the formation of active sites. The solution was left stirring at room temperature
for 6 hours and then it was added to the MWCNT dispersion. This mixture was stirred overnight, and
therefore the solvent was evaporated by heating, and the recovered powder was grinded in a mortar.
The Co:MWCNT mass ratio in this powder was expected to be 0.05.
The first catalyst, named Co-N/MWCNT-1, was heat-treated in a tubular quartz furnace under
nitrogen atmosphere (N2 gas flux set at 150 N mL min–1 with a mass flow controller from Bronkhorst,
ELFLOW series) with a heating rate of 5 °C min–1 until 800 °C, keeping this temperature constant
for 3 hours, and then the furnace was switched-off leaving the apparatus cooling down naturally to
room temperature.
For the second catalyst, named Co-N/MWCNT-2, this heat treatment was repeated twice in the same
conditions, starting again from room temperature.
Before testing, both catalysts were acid-washed in 1 M HCl solution for 3 hours at 60 °C under reflux,
to remove any instable or unbounded acid-soluble cobalt, or cobalt oxide moiety [20,23,24].
Afterwards powders were filtered, washed thoroughly with deionized water until pH was 7, and dried
overnight at ambient conditions.
2.3. Physico-chemical characterization
Morphology of bare MWCNT and of synthesized catalyst samples were investigated using a field
emission scanning electron microscope (FESEM, model JEOL JSM 6700F).
Energy dispersive X-ray spectroscopy (EDX, FEI-Quanta Inspect 200 with EDAX PV 9900
instrument working at 15 kV) was used to determine the average bulk chemical composition of the
catalysts.
Nitrogen adsorption isotherms were recorded by an ASAP 2020 Instrument (Micromeritics) at –196
°C. Before the analysis, all of the samples were placed into the cell and degassed under vacuum for
3 hours at 150 °C. The specific surface area of the samples was calculated using the Brunauer–
Emmett–Teller (BET) method within the relative pressure range of 0–1. The pore size distribution
was obtained with the Barrett–Joyner–Halenda (BJH) method.
X-ray photoelectron spectroscopy (XPS) was performed to determine the elemental surface
composition of the catalysts samples. The analysis was carried out using a Physical Electronics PHI
5000 Versa Probe electron spectrometer system with monochromated Al Kα X-ray source (1486.60
eV) run at 15 kV and 1 mA anode current. Survey scans as well as narrow scans (high resolution
spectra) were recorded with a spot of 100 nm size. The survey spectra were collected from 0 to 1200
eV. The narrow N1s spectra were collected from 396 to 405 eV, the narrow Co 2p spectra from 765

84
to 815 eV, and the narrow C1s spectra from 280 to 293 eV. All of the spectra related to the two
samples were obtained under identical conditions, with the samples placed in an ultrahigh vacuum
chamber at 210–10 mmHg, and calibrated against a value of the C1s binding energy of 284.5 eV.
Multipak 9.0 software was used for obtaining semi-quantitative atomic percentage compositions,
using Gauss-Lorentz equations with Shirley background.
To determine the crystallographic structure of the bare MWCNT and of the Co-N/MWCNT catalysts,
X-ray powder diffraction (XRD) patterns were collected with a X’Pert PRO diffractometer
(PANalytical) using a Bragg-Brentano geometry and a Cu Kα radiation (λ=0,15418 nm). The X'Pert
HighScore software (PANalytical) was used to determine the crystallographic phases associated with
the peaks that appear in the XRD patterns.
Thermogravimetric analysis (TGA) measurements were carried out using a NETZSCH TG 209 F1
analyzer. The measurements were performed under a continuous flow of N2 (20 Ncm3 min−1) with a
heating rate of 5 °C min−1 between 25 and 800 °C. The heating rate is the same used in the pyrolysis
treatments during the catalysts synthesis.
For Fourier transform infrared spectroscopy (FTIR) measurements, powder samples were
mechanically mixed with KBr and pressed, self-supporting wafers are transparent to the IR radiation.
IR spectra were collected in air at 2 cm−1 resolution on a Bruker Equinox 55 FT-IR
spectrophotometer, equipped with a MCT (Mercury Cadmium Telluride) detector.
2.4. Electrochemical measurements
2.4.1. RDE tests
In RDE tests, the electrocatalytic activity towards ORR for the two Co-N/MWCNT catalysts was
tested in a conventional three-electrodes electrochemical cell configuration. The cell was equipped
with a glassy carbon disk working electrode (0.0707 cm2 geometric area), a Pt helical wire counter
electrode, and a saturated calomel (SCE) reference electrode. All of the electrode potentials were
corrected and referred to the reversible hydrogen electrode (RHE).
Cyclic voltammetries (CV) and linear sweep voltammetries (LSV) were performed using a rotating
disk electrode equipment (RRDE-3A ALS) and a multi-potentiostat (Bio-Logic SP-150).
The catalyst ink was prepared by mixing 15 mg of catalyst powder with 65 μL of Nafion® 5% wt.
solution and 600 μL of ethanol under sonication for 1 hour to achieve a good dispersion. 3 μL of ink
was taken with a micro-pipette and deposited on the working electrode, resulting in a catalyst loading
of 65 g which corresponds to 0.95 mg cm–2 referred to the geometrical area of the working electrode.
All of the current densities were thus normalized per geometric area of the electrode.

85
The electrolyte was a 0.5 M H2SO4 aqueous solution saturated with either N2 or O2 by direct gas
bubbling into the solution. The flux was carefully controlled and maintained constant through a mass
flow controller (Bronkhorst, ELFLOW series) fixed at 4.5 mL min–1, considering a constant volume
of 80 mL of solution.
Prior to start tests, to electrochemically clean the working electrode, 80 CV cycles were performed
from 0.0 to 1.2 V vs RHE in N2 saturated electrolyte at 100 mV s–1 scan rate.
For each catalyst, cyclic voltammograms were recorded between 0.0 and 1.2 V vs RHE in N2-
saturated electrolyte at 10 mV s–1 scan rate to determine the capacitive current contribution. Then,
the solution was saturated with O2, the RDE rotation speed was set to 1600 rpm, and the LSV were
recorded again in the same conditions (at 10 mV s–1 scan rate). The faradic current densities used to
calculate the ORR activity were obtained by subtracting the cathodic sweep scan capacitive currents
recorded in N2-saturated electrolyte from the cathodic sweep scan currents obtained in O2-saturated
electrolyte [47]. All of the measurements were performed at room temperature and ambient pressure.
2.4.2. GDE cell tests
The catalysts were tested in a cell equipped with a gas-diffusion working electrode, accessible to gas
reactants. The GDE cell consisted in a transparent acrylic box, provided with a cylindrical slot (11
mm diameter) where a small GDL disk can be inserted. The GDE working electrode was kept closed
with a metal plate provided with a seal gasket, which was tightened to the plastic structure of the cell
by means of four bolts. In the metal plate, a chamber with two small holes connected with sealed
plastic tubes allows gas inlet and outlet. This chamber is in contact with the back side of the GDL.
Fig. 1 shows a scheme and a picture of the GDE cell. The cell was equipped with a saturated Ag/AgCl
reference electrode and a Pt plate counter electrode. The GDE working electrode geometric area was
of 0.95 cm2. A 0.5 M H2SO4 aqueous solution was used as electrolyte.
For the GDE preparation, 18 cm2 of a carbon cloth GDL (HT-ELAT from E-TEK, USA) was coated
with the catalyst ink by brush deposition to obtain a catalyst loading of 1 mg cm–2, referred to the
geometrical area of the working electrode. Then a small disk of 11 mm diameter was cut and inserted
in the cell. The catalyst ink was prepared by mixing 18 mg of catalyst powder with 618 μL of Nafion®
5% wt. solution, 230 μL of deionized water and 290 μL of ethanol. The ink was kept under sonication
for 30 minutes and then under stirring for 1 hour.

86
Fig. 1. Scheme (A) and picture (B) of the GDE cell.
CVs and LSVs were performed using the same multi-potentiostat used for RDE tests. Gaseous N2
was first fluxed at a flow rate of 1500 NmL min–1 for the measurement of capacitive currents, then
the gas flux was switched to pure O2 for the measurement of the ORR activity. The faradic current
densities were calculated as described in section 2.4.1.
An electrochemical impedance spectroscopy measurement was taken at OCV, with a wave amplitude
of 10 mV and frequencies in the range of 10 kHz – 100 mHz, for the evaluation of the high frequency
resistance (R). The R value was used to subtract the ohmic drop contribution from the polarization
curve [47].
2.4.3. Chronoamperometry test
The stability of the two Co-N/MWCNT catalysts was investigated by means of a chronoamperometry
performed both with the RDE and the GDE cell setups. In RDE the chronoamperometry was
performed at a fixed potential of +0.55 V vs RHE for 17 hours in O2-saturated 0.5 M H2SO4, with the
working electrode rotating at 900 rpm. In GDE cell the chronoamperometry was also performed for
17 hours at the fixed potential of +0.55 V vs RHE. Gaseous oxygen was fluxed into the GDE at a
constant flow rate of 1500 NmL min–1. All of the current densities were normalized per geometric
area of the electrode.
3. Results
3.1. Physico-chemical characterization
3.1.1. BET analysis
Nitrogen adsorption/desorption analysis performed on pristine MWCNT support and on Co-
N/MWCNT catalysts shows that all three samples exhibit the same isotherm shape (Fig. 2A), with
the presence of a steep adsorption step in the high relative pressure range (0.9–1.0) and of an

87
adsorption/desorption hysteresis. This suggests that after pyrolysis treatments the original MWCNT
structure does not change. Fig. 2B shows the pore size distributions of pristine MWCNT support and
Co-N/MWCNT catalysts.
According to the International Union of Pure and Applied Chemistry (IUPAC) classification, the
pristine MWCNT isotherm belongs to Type II, with the presence of a hysteresis loop, associated with
capillary condensation taking place in mesopores [48]. As the adsorption and desorption branches are
almost vertical and nearly parallel over an appreciable range of quantity of gas adsorbed, the
hysteresis loop can be classified as H1-type. This is often associated with porous materials consisting
of agglomerates [48], that could correspond to MWCNT aggregated felt-like morphology [49].
Fig. 2. Nitrogen adsorption/desorption isotherms (A) and pore size distribution (B) of pristine MWCNT and Co-N/MWCNT catalysts.
The adsorption of nitrogen on carbon nanotubes is remarkably different from the adsorption on other
porous carbons in several aspects. First, due to their one-dimensional tubular structure, CNTs have a
high aspect ratio and the external surface available for adsorption is considerably larger than the
surface area available in the inner cavities. The adsorption on the external surface of CNTs is greater
than the adsorption inside the micro/mesoporous cavities [49].
After the first heat-treatment, the BET specific surface area suffers a slight decrease in comparison
to pristine MWCNT (from 259.1 to 222.8 m2 g–1, Table 1), while the micropore surface area increases
significantly, passing from 26.0 to 90.7 m2 g–1. The same trend is observed for micropore volume.
On the other hand, after the second heat-treatment, a small increase of BET specific surface area is
registered, with a simultaneous increase of micropore area and volume. These results suggest that the
first pyrolysis process, in which the incorporation of N and Co onto the MWCNT support structure
takes place, leads to the formation of a great amount of new micropores. During the second heat
treatment, further micropores are formed, probably due to the rearrangement of the MWCNT support
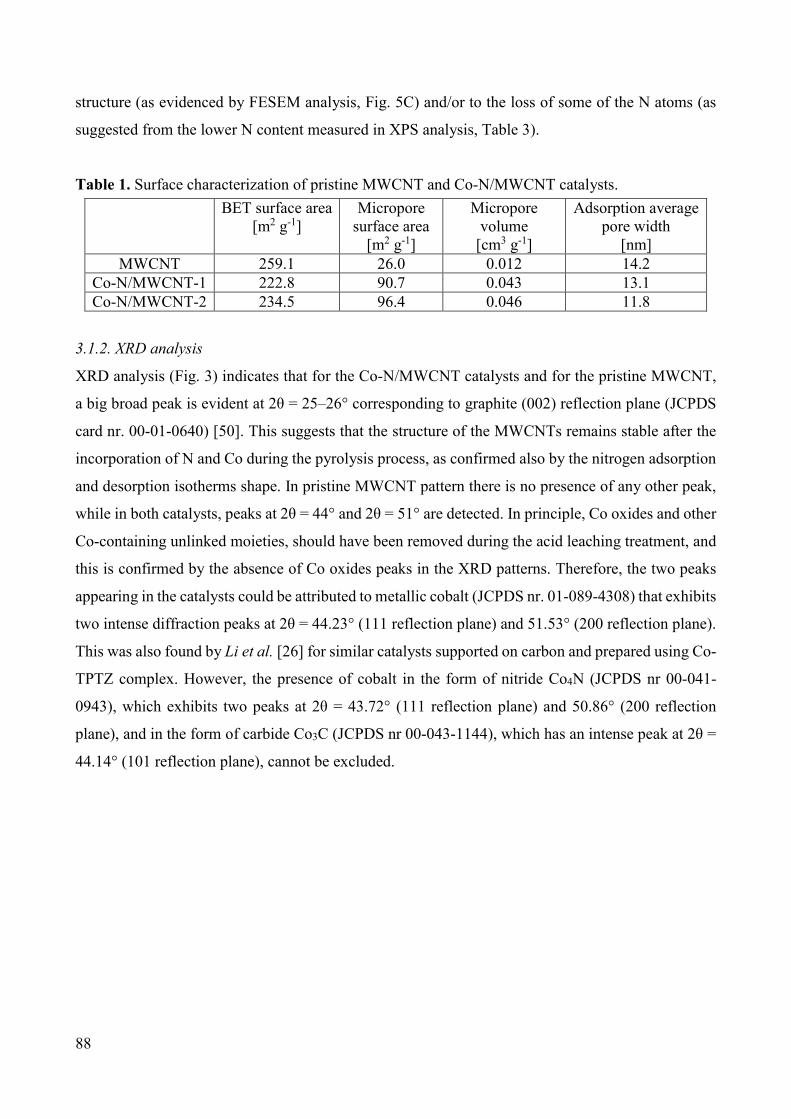
88
structure (as evidenced by FESEM analysis, Fig. 5C) and/or to the loss of some of the N atoms (as
suggested from the lower N content measured in XPS analysis, Table 3).
Table 1. Surface characterization of pristine MWCNT and Co-N/MWCNT catalysts.
3.1.2. XRD analysis
XRD analysis (Fig. 3) indicates that for the Co-N/MWCNT catalysts and for the pristine MWCNT,
a big broad peak is evident at 2θ = 25–26° corresponding to graphite (002) reflection plane (JCPDS
card nr. 00-01-0640) [50]. This suggests that the structure of the MWCNTs remains stable after the
incorporation of N and Co during the pyrolysis process, as confirmed also by the nitrogen adsorption
and desorption isotherms shape. In pristine MWCNT pattern there is no presence of any other peak,
while in both catalysts, peaks at 2θ = 44° and 2θ = 51° are detected. In principle, Co oxides and other
Co-containing unlinked moieties, should have been removed during the acid leaching treatment, and
this is confirmed by the absence of Co oxides peaks in the XRD patterns. Therefore, the two peaks
appearing in the catalysts could be attributed to metallic cobalt (JCPDS nr. 01-089-4308) that exhibits
two intense diffraction peaks at 2θ = 44.23° (111 reflection plane) and 51.53° (200 reflection plane).
This was also found by Li et al. [26] for similar catalysts supported on carbon and prepared using Co-
TPTZ complex. However, the presence of cobalt in the form of nitride Co4N (JCPDS nr 00-041-
0943), which exhibits two peaks at 2θ = 43.72° (111 reflection plane) and 50.86° (200 reflection
plane), and in the form of carbide Co3C (JCPDS nr 00-043-1144), which has an intense peak at 2θ =
44.14° (101 reflection plane), cannot be excluded.
BET surface area [m2 g-1]
Micropore surface area
[m2 g-1]
Micropore volume
[cm3 g-1]
Adsorption average pore width
[nm] MWCNT 259.1 26.0 0.012 14.2
Co-N/MWCNT-1 222.8 90.7 0.043 13.1 Co-N/MWCNT-2 234.5 96.4 0.046 11.8

89
Fig. 3. XRD patterns of pristine MWCNT and Co-N/MWCNT catalysts.
3.1.3. EDX analysis
EDX analysis performed on the Co-N-based catalysts before and after acid leaching is used to
estimate cobalt, carbon and oxygen content. The atomic percentages measured are summarized in
Table 2. The cobalt content before acid treatment for Co-N/MWCNT-1 and Co-N/MWCNT-2 is 3.67
and 3.58 wt. %, respectively (equivalent to 0.78% and 0.76% atomic). This is a good match with the
value designed during the synthesis process (nominal 5.0 wt. %). Acid treatment is effective in
removing not linked Co–Nx moieties as well as cobalt compounds not strongly linked with the
MWCNT structure. This leads to a final Co content of 0.76 and 1.09 wt. % for Co-N/MWCNT-1 and
Co-N/MWCNT-2, respectively (equivalent to 0.15 and 0.23 at. %).
Table 2. Elemental compositions from EDX (atomic %) for the two Co-N/MWCNT catalysts.
Acid washing Total C
[atomic %]
Total O
[atomic %]
Total Co
[atomic %]
Co-N/MWCNT-1 No 94.52 4.70 0.78
Co-N/MWCNT-2 No 95.20 4.04 0.76
Co-N/MWCNT-1 Yes 95.52 4.32 0.15
Co-N/MWCNT-2 Yes 95.98 3.79 0.23
3.1.4. XPS analysis
XPS analysis was conducted on Co-N/MWCNT catalysts after acid washing treatment, to complete
the elemental composition characterization. Results obtained prove further evidence of the
incorporation of Co and N in the MWCNT carbon structure after the pyrolysis heat treatments and

90
acid leaching. Fig. 4 shows wide XPS scan spectra for Co-N/MWCNT-1 (Fig. 4A) and Co-
N/MWCNT-2 (Fig. 4B). The peaks reveal the presence of C, O, N and Co in both catalysts surface.
The predominant C1s peak is centered at 284.5 eV, and its asymmetric pattern can be due to the
presence of C–N bonds in the carbon structure, which indicates that nitrogen atoms are successfully
incorporated into the MWCNT support [27,51]. The peak at 532 eV is attributed to oxygen (O1s),
and the peak at about 400 eV is the nitrogen peak (N1s). The peak at about 780 eV can be assigned
to cobalt (Co2p), suggesting that also cobalt is incorporated onto MWCNT. However, the
deconvolution of the high resolution of Co2p (Fig. 4G and 4H for Co-N/MWCNT-1 and Co-
N/MWCNT-2, respectively) is too weak to determine Co valence state. The surface elemental
composition is summarized in Table 3. The second heat-treatment on the Co-N/MWCNT-2 causes a
decrease in O, N and Co contents. A significant loss of nitrogen after high-temperature pyrolysis was
also found by Nallathambi et al. [52].
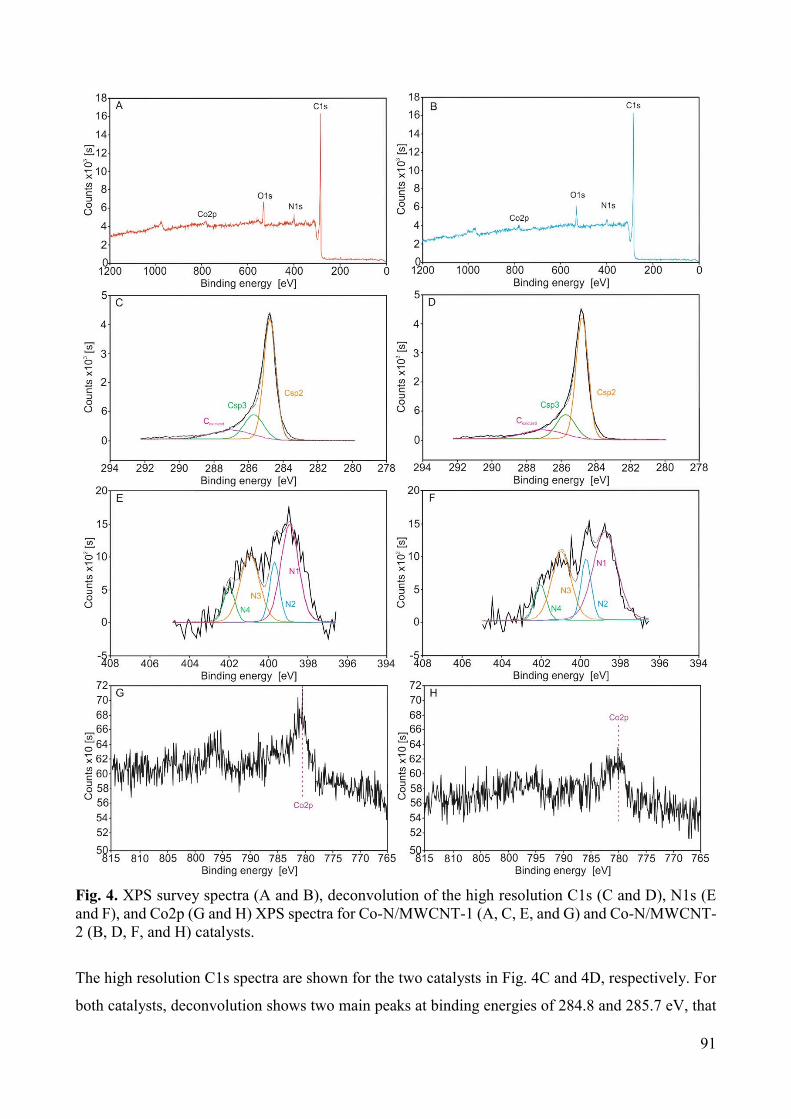
91
Fig. 4. XPS survey spectra (A and B), deconvolution of the high resolution C1s (C and D), N1s (E and F), and Co2p (G and H) XPS spectra for Co-N/MWCNT-1 (A, C, E, and G) and Co-N/MWCNT-2 (B, D, F, and H) catalysts.
The high resolution C1s spectra are shown for the two catalysts in Fig. 4C and 4D, respectively. For
both catalysts, deconvolution shows two main peaks at binding energies of 284.8 and 285.7 eV, that

92
are respectively assigned to graphitic-like carbon (sp2) and diamond-like carbon (sp3) [53,54]. The
smaller broad peak at higher binding energy values is related to chemical shifts due to C-O and/or C-
N bonds [55–59]. Comparing the C1s spectra of the two samples, sp2, sp3 and oxidized carbon
relative contents remain almost equal.
The high resolution N1s spectra of Co-N/MWCNT catalysts are shown in Fig. 4E and 4F. These
spectra are fitted into four different components: pyridinic-N (N1, with peak maximum at 398.8 eV),
cyanide-N and/or M-Nx bonding, with M = transition metal (N2, with peak maximum at 399.7 eV),
pyrrolic-N and/or graphitic-N bonded to two C atoms and one H atom (N3, with peak maximum at
400.9 eV), and graphitic-N bonded to three C atoms (N4, with peak maximum at 402.0 eV). There
are no peaks at higher binding energies (related with N oxidized groups) [21,24,27].
Table 3. Elemental surface compositions from XPS (atomic %) and N/C, O/C and Co/C atomic ratios for the two Co-N/MWCNT catalysts after acid washing treatment.
Table 4 shows the relative percent contents of the four different above mentioned N-types. The
relative amounts are roughly similar in both catalysts, and only some marginal differences can be
observed. In Co-N/MWCNT-2 the relative amount of pyridinic nitrogen (N1) is about 5% higher than
in Co-N/MWCNT-1, and the amounts of the other three N-types (N2, N3, N4) are slightly lower in
the former than in the latter. In particular, the lower amount of Co-N in Co-N/MWCNT-2 could be
related with the slightly lower total Co surface content (Table 3). Moreover, according to the finding
of Dodelet’s group [16–18], the pyridinic-N (N1) is usually situated in micropores, which are more
abundant in Co-N/MMWCNT-2 (Table 1). This could explain the higher pyridinic-N relative content
found in this catalyst. The amount of nitrogen incorporated onto the nanotubes is influenced by the
heat treatments, and it decreases after the second pyrolysis step. On the other hand, the nature of
nitrogen species created onto the C-network of nanotubes is not significantly influenced by the heat
treatment, and both catalysts have similar type of relative proportion of N-species. Regarding the
relative abundance of pyridinic and pyrrolic-N, the amounts found in our samples are comparable to
the values found by Pérez-Alonso et al. [20] for similar MWCNT-supported catalysts doped with N
and Fe.
atomic % atomic ratios
C N O Co N/C O/C Co/C
Co-N/MWCNT-1 87.3 6.7 5.2 0.8 0.077 0.060 0.009
Co-N/MWCNT-2 90.6 5.4 3.4 0.6 0.060 0.038 0.007

93
Table 4. Nitrogen contents with relative intensities and binding energies of N1s peaks from XPS analysis of the Co-N/MWCNT catalysts (N1: pyridinic N; N2: nitrile and/or or Co-Nx; N3: pyrrolic N and/or graphitic N1 position; N4: graphitic and/or oxidized N.)
Atomic % N1 N2 N3 N4
Binding energy [eV] 398.8 399.7 400.9 402.0 Co-N/MWCNT-1 42.7 15.1 32.3 10.0 Co-N/MWCNT-2 47.4 13.8 29.6 9.1
3.1.5. FESEM analysis
The morphological structure of the multi-walled carbon nanotubes can be clearly observed (Fig. 5A)
for the MWCNT bare support. Brighter zones could correspond to MWCNT cross-linking contacts
zones and to MWCNT terminations: EDX analyses in these areas revealed the presence of carbon
only. The MWCNT external diameter is approximately between 20 and 10 nm.
Figure 5B show Co-N/MWCNT-1 evidences unchanged framework structure after the first pyrolysis.
Co-containing crystallites are sometimes observed on the surface of nanotubes. After the second
pyrolysis, on catalyst Co-N/MWCNT-2 (Fig. 5C), the MWCNT structure appears partially collapsed.
Co-containing crystallites are still evident. However, they appear to be smaller and deeper
conglobated into the carbon nanotubes agglomerates, compared to Co-N/MWCNT-1. The presence
of crystallites of Co-containing species is confirmed by the results of the XRD analysis (Fig. 3).
Fig. 5. FESEM pictures of pristine MWCNT (A), Co-N/MWCNT-1 (B) and Co-N/MWCNT-2 (C) catalysts.

94
3.1.6. TGA analysis
TGA analysis was conducted on the MWCNT impregnated with the Co-TPTZ complex, to investigate
the behavior during the thermal treatment (Fig. 6). For comparison, TGA analysis was also conducted
on unsupported Co-TPTZ complex and pure TPTZ.
The curve of pure TPTZ shows that this molecule rapidly decomposes in the temperature range
between 250 and 345 °C. The Co-TPTZ complex has a more complicated behavior. There is a first
mass decrease in the temperature range from 40 to 220 °C, that could correspond to the loss of
physisorbed and coordinated water molecules [25,60]. A second steep weight loss is observed starting
from 250 °C, until 400 °C. This can be related to TPTZ decomposition. Unlike the pure TPTZ, at
temperatures higher than 400 °C the mass does not go to zero: an almost flat zone is observed from
400 to 650 °C, probably related to a partial graphitization of the C and N atoms of TPTZ. Similar
behavior was also found by Tian et al. [14] for TPTZ in presence of Fe and Zn. Further mass loss is
observed above 650 °C, until almost 3% at 750 °C. This quantity could correspond to the residual
metallic cobalt. This residual mass, in fact, well matches with the initial Co content in the Co-TPTZ
complex. The curve of the MWCNT impregnated with Co-TPTZ complex follows the same trend of
the unsupported complex curve (Fig. 6). The lower mass decrease is therefore due to the presence of
the MWCNT, which are more stable at high temperatures.
Fig. 6. TGA analysis under inert atmosphere of TPTZ, Co-TPTZ complex, and MWCNT impregnated with Co-TPTZ complex before the pyrolysis treatment.
3.1.7. FTIR analysis
FTIR spectra (Fig. 7) were recorded on the MWCNT impregnated with the Co-TPTZ complex before
and after the pyrolysis heat treatment. Co-TPTZ complex, TPTZ alone, and pristine MWCNT were
also analyzed for comparison.
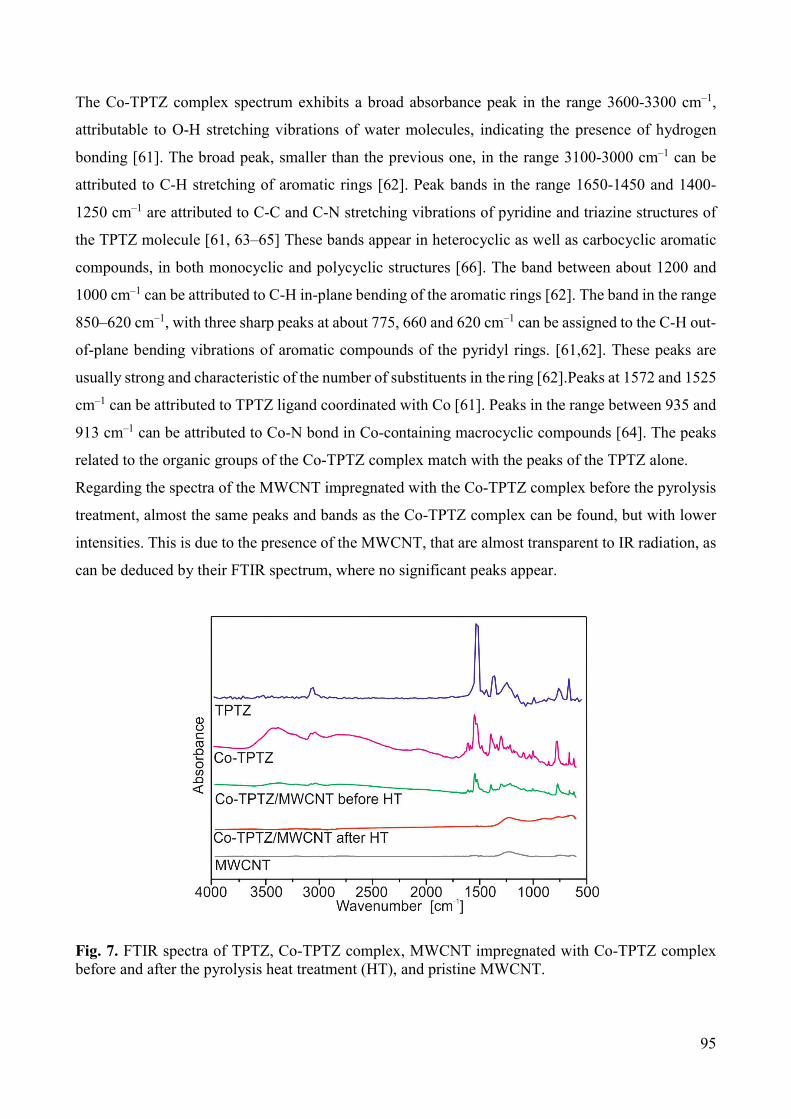
95
The Co-TPTZ complex spectrum exhibits a broad absorbance peak in the range 3600-3300 cm–1,
attributable to O-H stretching vibrations of water molecules, indicating the presence of hydrogen
bonding [61]. The broad peak, smaller than the previous one, in the range 3100-3000 cm–1 can be
attributed to C-H stretching of aromatic rings [62]. Peak bands in the range 1650-1450 and 1400-
1250 cm–1 are attributed to C-C and C-N stretching vibrations of pyridine and triazine structures of
the TPTZ molecule [61, 63–65] These bands appear in heterocyclic as well as carbocyclic aromatic
compounds, in both monocyclic and polycyclic structures [66]. The band between about 1200 and
1000 cm–1 can be attributed to C-H in-plane bending of the aromatic rings [62]. The band in the range
850–620 cm–1, with three sharp peaks at about 775, 660 and 620 cm–1 can be assigned to the C-H out-
of-plane bending vibrations of aromatic compounds of the pyridyl rings. [61,62]. These peaks are
usually strong and characteristic of the number of substituents in the ring [62].Peaks at 1572 and 1525
cm–1 can be attributed to TPTZ ligand coordinated with Co [61]. Peaks in the range between 935 and
913 cm–1 can be attributed to Co-N bond in Co-containing macrocyclic compounds [64]. The peaks
related to the organic groups of the Co-TPTZ complex match with the peaks of the TPTZ alone.
Regarding the spectra of the MWCNT impregnated with the Co-TPTZ complex before the pyrolysis
treatment, almost the same peaks and bands as the Co-TPTZ complex can be found, but with lower
intensities. This is due to the presence of the MWCNT, that are almost transparent to IR radiation, as
can be deduced by their FTIR spectrum, where no significant peaks appear.
Fig. 7. FTIR spectra of TPTZ, Co-TPTZ complex, MWCNT impregnated with Co-TPTZ complex before and after the pyrolysis heat treatment (HT), and pristine MWCNT.

96
The MWCNT impregnated with the Co-TPTZ complex after pyrolysis at 800 °C (that is, the Co-
N/MWCNT-1 catalyst) exhibits a FTIR spectrum very similar to the pristine MWCNT, and none of
the peaks observed before the pyrolysis can be found, as also observed by Wang et al. [65]. Vibrations
found between 500 and 1500 cm–1 can be attributed to the KBr (not reported here). The disappearance
of the characteristic peaks of the Co-TPTZ complex after the pyrolysis can be caused by two reasons.
First, the complete disappearance of the original Co-TPTZ chelate structure during the pyrolysis,
confirming the instability of this molecule at temperatures above 650 °C, as also evidenced by the
TGA analysis results (Fig 6). Second, the relative amount of Co-N complexes after the pyrolysis is
too small to be detected by the instrument, also due to the MWCNT high relative abundance and their
transparency to infrared radiation.
3.2. Electrochemical characterization
3.2.1. Cyclic voltammetries
The voltammograms recorded in presence of inert gas exhibit similar shapes in both RDE (Fig. 8A)
and GDE cell (Fig. 8B), and the current density values are of the same order of magnitude.
The two catalysts have specific mass capacitance values between 28 and 47 F g–1, similarly to other
non-noble metal electrocatalysts on porous carbon support [21].
Fig. 8. Cyclic voltammograms of MWCNT support and Co-N/MWCNT catalysts recorded at 10 mV s–1 scan rate in N2-saturated 0.5 M H2SO4 solution for RDE (A) and fluxing N2 gas in the working electrode for GDE cell (B).
The higher capacitive current exhibited by the catalysts in comparison with the pristine MWCNT,
could be attributed to a series of redox processes involving the functional groups created during the
incorporation of N and Co-Nx groups, or even to the presence of C-oxidized functional groups on the
MWCNT structure [67]. Oxygen presence, in fact, is revealed by XPS and EDX analyses (see Tables
2 and 3).

97
3.2.2. ORR activities
The ORR activity of the electrocatalysts is highly enhanced in comparison with the pristine MWCNT
support, which shows practically no activity towards ORR in acidic conditions (not reported here).
Co-N/MWCNT-2 catalyst is more active than Co-N/MWCNT-1. Apparently, the second heat
treatment on Co-N/MWCNT-2 catalyst seems to be useful to increase the catalytic ORR activity.
Observing the curves recorded in RDE test (Fig. 9), no well-developed diffusion limited plateau
current zone is present for both catalysts, sign that the current density at high overpotential values
could be still in a mixed kinetic and mass- or charge-transport limited zone [36,68]. The value of the
limiting current densities, for Co-N/MWCNT-1 and Co-N/MWCNT-2, can be taken as 3.3 and 4.0
mA cm–2, respectively. Moreover, Co-N/MWCNT-2 exhibits a steeper current increase in the
intermediate overpotential region (0.5–0.7 V vs RHE).
Fig. 9. ORR activity expressed as current density vs electrode potential (RHE) measured with RDE in O2-saturated 0.5 M H2SO4 solution at a rotational speed of 1600 rpm for Co-N/MWCNT-1 (A) and Co-N/MWCNT-2 (B): experimental curve (dashed lines), mass-transfer and iR corrected kinetic current density (continuous lines). The inset shows the Tafel behavior of the corrected kinetic current density. The Tafel slope of the linear portion of this graph allows the determination of the charge transfer coefficient α for the ORR. Potential scan rate: 10 mV s–1.
The ORR electro-reduction kinetic activity was calculated from mass-transport-corrected kinetic
current density: ik = iLi/(iL-i), where i is the faradaic current density and iL is the limiting diffusion
current-density of the catalyst. A semi-empirical model similar to the model developed by Spinelli et
al. [69] for PEM fuel cells, is used to evaluate the catalytic activity. The value of the electrical
resistance is considered to account for ohmic drop in the electronic conductors, and for phenomena
which require a more sophisticated treatment, such as non-ohmic effects due to the porous 3D nature
of the electrodes, as the diffusion of the reactant through the porous layer and the solubility of the
reactant in the porous layer, taking into account surface segregation, as reported by Chlistunoff [70].
A correction for the ohmic drop was applied to determine the ORR kinetic activity, shown in Fig. 9.

98
Such a correction was based on the resistance values obtained by the impedance measurements as
indicated in the experimental section, taking into account the trend of the computed kinetic current
curve.
The electrocatalytic activity of the Co-N/MWCNT catalysts was also tested in GDE cell. The current
trend at high overpotentials (0.0 – 0.4 V vs RHE, Fig. 10) obtained in the GDE cell seems to linearly
increase, suggesting the presence of an important ohmic drop limitation. For this reason, corrected
values for the ohmic drop contribution are also reported. This kind of iR-limitation behavior was also
observed for similar GDE cell setups by other groups [38,39]. Like previously observed in RDE tests,
also in GDE cell tests the Co-N/MWCNT-2 catalyst exhibits higher electroactivity in comparison
with Co-N/MWCNT-1.
Fig. 10. ORR activity (original and iR-corrected) measured in GDE cell in 0.5 M H2SO4 solution fluxing gaseous oxygen in the working electrode for Co-N/MWCNT catalysts. Potential scan rate: 10 mV s–1.
3.2.3. Chronoamperometry tests
Chronoamperometries in both RDE and GDE cell were also performed for the two Co-N/MWCNT
catalysts, to investigate their behavior in time during operation at a fixed potential, and to assess
electroactivity decay.
Fig. 11 show the chronoamperometric curves of the two catalysts recorded at +0.55 V vs RHE
potential in RDE and in GDE cell, respectively. In RDE, the sample pyrolyzed twice exhibits a lower
percent current density loss (about 21% after 950 minutes test) in comparison to the catalyst pyrolyzed
only once (which exhibits about 34% loss after 950 minutes). A similar ORR current decay behavior
was also observed in chronoamperometry test in acid conditions for similar types of catalysts by other
groups [23,24,27].

99
In GDE cell, a similar current decay is observed. In this case, the difference between the losses of the
two catalysts is lower, being of about 26% for Co-N/MWCNT-1 and 23% for Co-N/MWCNT-2 after
950 minutes.
Fig. 11. Chronoamperometric curves of Co-N/MWCNT catalysts for ORR activity at a potential of +0.55 V vs. RHE in O2-saturated 0.5 M H2SO4 solution in RDE at a rotational speed of 900 rpm (A), and fluxing O2 gas in the working electrode in GDE cell (B). Potential scan rate: 10 mV s–1.
4. Discussion
4.1. Physico-chemical characterization
XPS is a surface sensitive technique (the depth of the analysis being about 5–6 nm) [20], while the
probe depth for EDX (≥1 µm) makes possible to consider the results of this analysis as bulk
composition [71]. Thus, the comparison between the Co content obtained from XPS analysis (surface
composition, Table 3) and the results obtained from EDX analysis (bulk composition, Table 2),
suggests that Co is predominantly situated on the MWCNT support surface. This is as expected from
the wet impregnation with the Co(II)-TPTZ complex.
The overall N/C atomic ratios calculated on the basis of the results of XPS analysis, and summarized
in Table 3, are similar to the values found by Geng et al. [72] for nitrogen-doped carbon nanotubes
containing the same overall N amount. The N/C values found by Byon et al. [24] and Domínguez et
al. [25] for Fe-N/MWCNT were also similar. However, N/C and transition metal/C atomic ratios of
our catalysts are higher than in similar Me-N/MWCNT catalysts found by other research groups
[13,20,24,25,35].
Nitrogen doping has repeatedly been reported to increase the catalytic activity of graphitic carbon.
However, the role of the real “electrocatalytically active sites” is still not clear. Regarding the
different types of N bonding, in some studies, the electrocatalytic activity is attributed to pyridinic-N

100
and/or pyrrolic-N [36,57]. On the contrary, other studies suggest that graphitic-N is more important
for the electrocatalytic activity of nitrogen-doped carbon [58,59]. Nitrogen-doping in a basal plane of
carbon may be more favorable than in edge sites because the number of available doping sites is
greater in the basal plane than in the edge [73].
Concerning the overall surface nitrogen content, Jaouen et al. [21] have observed its influence for
nine different NPMC, and no relation was found between N content and catalyst electroactivity
towards ORR. The same conclusion was drawn restricting the analysis to pyridinic or pyrrolic-N
types. This could mean that, even if nitrogen atoms are known to be part of active sites, their amount
is not the limiting factor for activity, compared to other factors. Regarding the relationship between
the transition metal content and the catalytic activity, Jaouen et al. [74] observed that the activity
increases only up to a Co (or Fe) content of about 1 wt. %. Then, for higher metal contents the activity
starts to decrease, due to the concomitant decrease of the microporous area of the catalysts caused by
the excessive metal coverage.
Even though the exact structure of the active site cannot clearly be identified by means of the
performed physicochemical analysis techniques, it is evident that some of the nitrogen and cobalt
atoms from the Co-TPTZ complex are incorporated onto the MWCNT surface during the pyrolysis.
Therefore, during the catalysts synthesis, the surface of MWCNT has been modified, as confirmed
by the XPS analysis (N and Co are effectively detected on the catalysts surface). Furthermore, the
electrochemical analyses evidenced a great enhancement of electroactivity towards ORR.
4.2. Electrochemical characterization
Different factors could influence the capacitance of carbon materials: pore geometry, pore size
distribution, electrical conductivity, wettability, and presence of surface electroactive species
[67,75,76]. Additionally, pseudo-capacitance effect of surface redox-sites must be considered. At the
carbon surface, in fact, apart from the electrostatic double layer capacitance, a significant pseudo-
capacitance is often present. This can be due to chemisorption phenomena with partial charge transfer,
or to redox processes (e.g. involving quinone-hydroquinone functional groups). These pseudo-
capacitance effects related with the faradaic reactions of surface groups enhance the value of the
capacitance [67]. Therefore, the increase of the capacitance of the Co-N/MWCNT catalysts in
comparison with the pristine MWCNT could be related to the described phenomena.
Rigorous and correct analysis of the data from RDE experiments can be complicated in presence of
a porous, not very thin catalyst film. In fact, with porous electrodes, the depth of oxygen penetration
inside the electrode structure changes with the electrode potential. If the electrocatalyst is Pt, oxygen
reduction is fast enough that at high overpotential, the reaction is limited only on the outer part of the
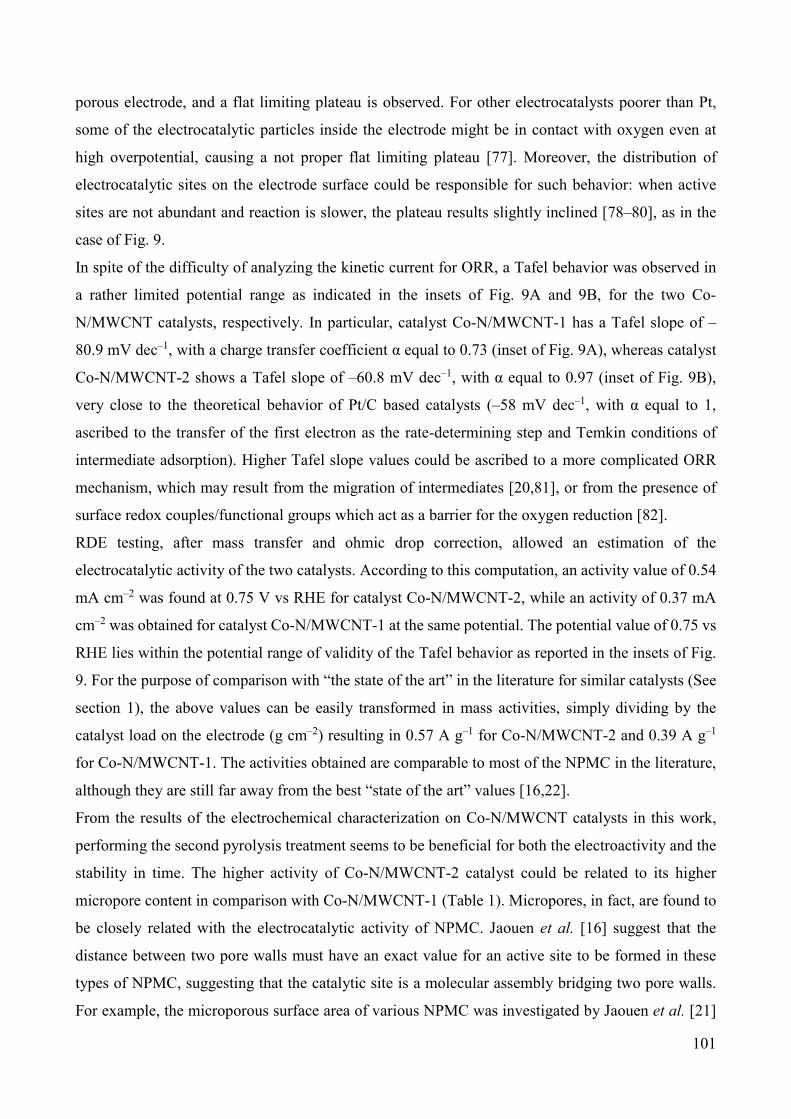
101
porous electrode, and a flat limiting plateau is observed. For other electrocatalysts poorer than Pt,
some of the electrocatalytic particles inside the electrode might be in contact with oxygen even at
high overpotential, causing a not proper flat limiting plateau [77]. Moreover, the distribution of
electrocatalytic sites on the electrode surface could be responsible for such behavior: when active
sites are not abundant and reaction is slower, the plateau results slightly inclined [78–80], as in the
case of Fig. 9.
In spite of the difficulty of analyzing the kinetic current for ORR, a Tafel behavior was observed in
a rather limited potential range as indicated in the insets of Fig. 9A and 9B, for the two Co-
N/MWCNT catalysts, respectively. In particular, catalyst Co-N/MWCNT-1 has a Tafel slope of –
80.9 mV dec–1, with a charge transfer coefficient α equal to 0.73 (inset of Fig. 9A), whereas catalyst
Co-N/MWCNT-2 shows a Tafel slope of –60.8 mV dec–1, with α equal to 0.97 (inset of Fig. 9B),
very close to the theoretical behavior of Pt/C based catalysts (–58 mV dec–1, with α equal to 1,
ascribed to the transfer of the first electron as the rate-determining step and Temkin conditions of
intermediate adsorption). Higher Tafel slope values could be ascribed to a more complicated ORR
mechanism, which may result from the migration of intermediates [20,81], or from the presence of
surface redox couples/functional groups which act as a barrier for the oxygen reduction [82].
RDE testing, after mass transfer and ohmic drop correction, allowed an estimation of the
electrocatalytic activity of the two catalysts. According to this computation, an activity value of 0.54
mA cm–2 was found at 0.75 V vs RHE for catalyst Co-N/MWCNT-2, while an activity of 0.37 mA
cm–2 was obtained for catalyst Co-N/MWCNT-1 at the same potential. The potential value of 0.75 vs
RHE lies within the potential range of validity of the Tafel behavior as reported in the insets of Fig.
9. For the purpose of comparison with “the state of the art” in the literature for similar catalysts (See
section 1), the above values can be easily transformed in mass activities, simply dividing by the
catalyst load on the electrode (g cm–2) resulting in 0.57 A g–1 for Co-N/MWCNT-2 and 0.39 A g–1
for Co-N/MWCNT-1. The activities obtained are comparable to most of the NPMC in the literature,
although they are still far away from the best “state of the art” values [16,22].
From the results of the electrochemical characterization on Co-N/MWCNT catalysts in this work,
performing the second pyrolysis treatment seems to be beneficial for both the electroactivity and the
stability in time. The higher activity of Co-N/MWCNT-2 catalyst could be related to its higher
micropore content in comparison with Co-N/MWCNT-1 (Table 1). Micropores, in fact, are found to
be closely related with the electrocatalytic activity of NPMC. Jaouen et al. [16] suggest that the
distance between two pore walls must have an exact value for an active site to be formed in these
types of NPMC, suggesting that the catalytic site is a molecular assembly bridging two pore walls.
For example, the microporous surface area of various NPMC was investigated by Jaouen et al. [21]
102
for nine different NPMC, showing a trend of increasing activity with increased micropore surface
area.
The catalysts activity losses noticed in the chronoamperometry tests, could be due to many different
reasons. The loss in the carbon conductivity plays a crucial role because of carbon corrosion due to
radicals attack [83–85]. Another reason could be the unstable nitrogen fixation. In particular,
pyridinic and pyrrolic nitrogen can be protonated in acidic medium, leading to loss of stability with
time, whereas stability could be attributed to the presence of stable N groups, mainly graphitic-like
[27,86,87]. Therefore, the activity losses of the Co-N/MWCNT catalysts could be attributed to their
relatively high content of both pyridinic and pyrrolic nitrogen, and relatively low content of graphitic
nitrogen (Table 4). The higher stability of Co-N/MWCNT-2 could be ascribed to a higher degree of
graphitization of the carbon support [88,89].
The Co-N/MWCNT catalysts developed in this work, can also be considered as starting point for
further optimization of the different synthesis parameters such as the precursors quantities, the
number of heat treatments and their temperatures and duration. Moreover, impregnations with further
quantity of Co and N-containing molecules, using these catalysts as C-supports can be considered, to
improve the final catalyst performances [90,91].
5. Conclusions
Two cobalt-nitrogen catalysts were synthesized by wet impregnation of multi walled carbon
nanotubes (MWCNT) with a complex formed between Co(II) ions and the nitrogen-containing
molecule 2,4,6-tris(2-pyridyl)-1,3,5-triazine (TPTZ), followed by one or two identical heat treatments
in N2 atmosphere at 800 °C for 3 hours. The physicochemical characterization confirmed the
incorporation of N and Co in the MWCNT structure. This is related with the formation of active sites
for ORR, even if the nature of the active site is still unknown.
The electrocatalytic activity towards ORR of the catalysts in acid conditions was assessed by RDE
apparatus and a GDE cell. In both testing approaches, the catalyst heat-treated twice (Co-N/MWCNT-
2) exhibited higher electroactivity than the catalyst heat-treated once (Co-N/MWCNT-1).
Chronoamperometries performed at 0.55 V vs RHE on both RDE and GDE cell showed less
electroactivity decay and better current performance for the catalyst heat-treated twice, as if the
second heat-treatment allowed a better stabilization of the active sites. The higher electroactivity and
stability of the Co-N/MWCNT-2, heat-treated twice, could be ascribed to an increase of the
microporosity. The activities obtained are comparable to most of the NPMC in the literature.

103
References
[1] N. Alonso-Vante, Y. Feng, Phys. Stat. Sol. b 9 (2008) 1792–1806.
[2] S. Specchia, C. Francia, P. Spinelli in: J. Zhang, L. Zhang, H. Liu, A. Sun, R.S. Liu (Eds.),
Electrochemical Technologies for Energy Storage and Conversion, Wiley-VCH, Weinheim, 2011,
pp. 601–670.
[3] P. Trogadas, T.F. Fuller, P. Strasser, Carbon 75 (2014) 5–42.
[4] R. Othman, A.L. Dicks, Z. Zhu, Int. J. Hydrogen Energy 37 (2012) 357–352.
[5] Y. Kyros, Int. J. Electrochem. Sci. 2 (2007) 285–300.
[6] R. Jasinski, Nature 201 (1964) 1212–1213.
[7] E. Negro, M.A. De Vries, R. Latsuzbai, G.J.M. Koper, Fuel Cells 14 (2014) 350–356.
[8] D. Sebastián, M.J. Lázaro, I. Suelves, R. Moliner, V. Baglio, A. Stassi, A.S. Aricò, Int. J.
Hydrogen Energy 37 (2012) 6253–6260.
[9] D. Sebastián, I. Suelves, R. Moliner, M.J. Lázaro, Carbon 48 (2010) 4421–4431.
[10] M.J. Lázaro, D. Sebastián, I. Suelves, R. Moliner, J. Nanosci. Nanotechnol. 9 (2009) 4353–4359.
[11] A. Di Blasi, V. Baglio, T. Denaro, V. Antonucci, A.S. Aricò, J. New Mater. Electrochem. Syst.
11 (2008) 165–174.
[12] A.H.A. Monteverde Videla, L. Zhang, J. Kim, J. Zeng, C. Francia, J. Zhang, S. Specchia, J. Appl.
Electrochem. 43 (2013) 159–169.
[13] M. Bron, J. Radnik, M. Fieber-Erdmann, P. Bogdanoff, S. Fiechter, J. Electroanal. Chem. 535
(2002) 113–119.
[14] J. Tian, A. Morozan, M.T. Sougrati, M. Lefèvre, R. Chenitz, J.P. Dodelet, D. Jones, F. Jaouen,
Angewandte Chemie Int. Ed. 52 (2013) 6867–6870.
[15] C.W.B. Bezerra, L. Zhang, K. Lee, Hansan Liu, A.L.B. Marques, E.P. Marques, H. Wang, J.
Zhang Electrochim. Acta 53 (2008) 4937–4951.
[16] F. Jaouen, E. Proietti, M. Lefèvre, R. Chenitz, J.P. Dodelet, G. Wu, H.T. Chung, C.M. Johnston
P. Zelenay, Energy Environ. Sci. 4 (2011) 114–130.
[17] M. Lefèvre, E. Proietti, F. Jaouen, J.P. Dodelet, Science 324 (2009) 71–74.
[18] F. Jaouen, M. Lefèvre, J.P. Dodelet, M. Cai, J. Phys. Chem. B 110 (2006) 5553–5558.
[19] J.P. Dodelet in: M.Shao (Ed.), Electrocatalysis in Fuel Cells, Springer, London, 2013, pp. 271–
275.
[20] F.J. Pérez-Alonso, M. Abdel Salam, T. Herranz, J.L. Gómez de la Fuente, S.A. Al-Thabaiti, S.N.
Basahel, M.A. Peña, J.L.G. Fierro, S. Rojas, J. Power Sources 240 (2013) 494–502.

104
[21] F. Jaouen, J. Herranz, M. Lefèvre, J.P. Dodelet, U.I. Kramm, I. Herrmann, P. Bogdanoff, J.
Maruyama,T. Nagaoka, A. Garsuch, J.R. Dahn, T. Olson, S. Pylypenko, P. Atanassov, E.A. Ustinov,
ACS Appl. Mater. Interfaces 1 (2009) 1623–1639.
[22] J.Y. Cheon, T. Kim, Y. Choi, H.Y. Jeong, M.G. Kim, Y.J. Sa, J. Kim, Z. Lee, T. Yang, K. Kwon,
O. Terasaki, G. Park, R.R. Adzic, S.H. Joo, Scientific Reports 3 (2013) 2715.
[23] A.H.A. Monteverde Videla, S. Ban, S. Specchia, L. Zhang, J. Zhang, Carbon 76 (2014) 386–
400.
[24] H.R. Byon, J. Suntivich, E.J. Crumlinac and Y.Shao-Horn, Phys. Chem. Chem. Phys. 13 (2011)
21437–21445.
[25] C. Domínguez, F.J. Pérez-Alonso, M.A. Salam, S.A. Al-Thabaiti, A.Y. Obaid, A.A. Alshehri,
J.L. Gómez de la Fuente, J.L.G. Fierro, Sergio Rojas, Appl. Catal. B: Environ., 162 (2015) 420–429.
[26] S. Li, L. Zhang, H. Liu, M. Pan, L. Zan, J. Zhang, Electrochim. Acta 55 (2010) 4403–4411.
[27] H.R. Byon, J. Suntivich, Y. Shao-Horn, Chem. Mater. 23 (2011) 3421–3428.
[28] C.H. Choi, M.W. Chung, H.C. Kwon, J.H. Chung, S.I. Woo, Appl. Catal. B: Environ. 144 (2014)
760–766.
[29] E. Negro, A.H.A. Monteverde Videla, V. Baglio, A.S. Aricò, S. Specchia, G.J.M. Koper, Appl.
Catal. B: Environ. 166–167 (2015) 75–83.
[30] A. Dorjgotov, J. Ok, Y. Jeon, S. Yoon, Y.G. Shul, J. Appl. Electrochem. 43 (2013) 387–397.
[31] Y. Cheng, H. Zhang, C.V. Varanasi, J. Liu, Sci. Reports 3 (2013) 3195–3200.
[32] B. Merzougui, A. Hachimi, A. Akinpelu, S. Bukola, M. Shaob, Electrochim. Acta 107 (2013)
126–132.
[33] L.N. Ramavathu, K.K. Maniam, K. Gopalram, R. Chetty, J. Appl. Electrochem. 42 (2012) 945–
951.
[34] P.T. Yu, W. Gu, J. Zhang, R. Makharia, F.T. Wagner, H.A. Gasteiger in: F.N. Buchi, M. Inaba,
T.J. Schmidt (Eds.), Polymer Electrolyte Fuel Cell Durability, Springer, New York, 2009, pp. 29–53.
[35] T. Schilling, M. Bron, Electrochim. Acta 53 (2008) 5379–5385.
[36] H.A. Gasteiger, S.S. Kocha, B. Sompalli, F.T. Wagner, Appl. Catal. B: Environ. 56 (2005) 9–
35.
[37] F. Jaouen, V. Goellner, M. Lefèvre, J. Herranz, E. Proietti, J.P. Dodelet, Electrochim. Acta 87
(2013) 619–628.
[38] A.S. Aricò, V. Antonucci, V. Alderucci, E. Modica, N. Giordano, J. Appl. Electrochem. 23
(1993) 1107–1116.
[39] S. Tang, W. Lin, P.A. Christensen, G.M. Haarberg, Chin. J. Catal. 34 (2013) 1105–1111.
[40] L. Zhang, J. Kim, S. Singh, K. Tsay, J. Zhang, Int. J. Green Energy, 11 (2013) 1–11.
105
[41] U.A. Paulus, T.J. Schmidt, H.A. Gasteiger, R.J. Behm J. Electroanal. Chem. 495 (2001) 134–
145.
[42] S.L. Gojkovic, S.K. Zecevic, R.F. Savinell, J. Electrochem. Soc. 145 (1998) 3713–3720.
[43] S. Babanova, K. Artyushkova, Y. Ulyanova, S. Singhal, P. Atanassov, J. Power Sources 245
(2014) 389–397.
[44] S. Shleev, G. Shumakovich, O. Morozova, A. Yaropolov, Fuel Cells 10 (2010) 726–733.
[45] C. Lau, E. Adkins, R. Ramasamy, H. Lauckarift, G. Johnson, P. Atanassov, Adv. Energy Mater.
2 (2012) 162–168.
[46] E.C. Kumbur, K.V. Sharp, and M.M. Mench, J. Electrochem. Soc. 154 (2007) B1305 - B1314.
[47] D. van der Vliet, D.S. Strmcnik, C. Wang, V.R. Stamenkovic, N.M. Markovic, M.T.M. Koper,
J. Electroanal. Chem. 647 (2010) 29–34.
[48] K.S.W. Sing, D.H. Everett, R.A.W. Haul, L. Moscou, R. A. Pierotti, J. Rouquerol, T.
Siemieniewska, Pure & Appl. Chem. 57 (1985) 603—619.
[49] Z. Li, Z. Pan, S. Dai, J. Colloid Interface Sci. 277 (2004) 35–42.
[50] G. Sun, X. Li, Y. Qu, X. Wang, H. Yan, Y. Zhang, Mater. Lett. 62 (2008) 703–706.
[51] H. Li, W. Kang, L. Wang, Q. Yue, S. Xu, H. Wang, J. Liu, Carbon 54 (2013) 249–257.
[52] V. Nallathambi, J.W. Lee, S.P. Kumaraguru, G. Wu, B.N. Popov, J. Power Sources 183 (2008)
[53] J. Filik, P.W. May, S.R.J. Pearce, R.K. Wild, K.R. Hallam, Diamond Related Mater. 12 (2003)
974–978.
[54] M. Castellino, V. Stolojan, A. Virga, M. Rovere, K. Cabiale, M.R. Galloni, A. Tagliaferro, Anal.
Bioanal. Chem. 405 (2013) 321–329.4–42.
[55] S.W. Lee, B.S. Kim, S. Chen, Y. Shao-Horn, P.T. Hammond, J. Am. Chem. Soc. 131 (2009)
671–679.
[56] S.M. Lyth, Y. Nabae, S.Moriya, S. Kuroki, M. Kakimoto, J. Ozaki, S. Miyata, J. Phys. Chem. C
113 (2009) 20148–20151.
[57] P.H. Matter, L. Zhang, U.S. Ozkan, J. Catal. 239 (2006) 83–96.
[58] R. Arrigo, M. Hävecker, R. Schlögla, D.S. Su, Chem. Commun. 40 (2008) 4891–4893.
[59] H. Niwa, K. Horiba, Y. Harada, M. Oshima, T. Ikeda, K. Terakura, J.Ozaki, S. Miyata, J. Power
Sources 187 (2009) 93–97.
[60] K.S. Patel, J.C. Patel, H.R. Dholariya, V.K. Patel, K.D. Patel, Open J. Metal 2 (2012) 49–59.
[61] A Majumder, C.R Choudhury, S. Mitra, C. Marschner, J. Baumgartner. Z. Naturforsch. 60b
(2005) 99–105.
[62] B. Stuart, Infrared Spectroscopy: Fundamentals and Applications, Wiley, 2004, pp. 74–75.
[63] X. Liu, H. Wu, F. Ren, G. Qiu, M. Tang, Mater. Chem. Phys. 109 (2008) 5–9.

106
[64] Z. Xu, H. Li, G. Cao, Q. Zhang, K. Li, X. Zhao, J Molec. Catal. A: Chem. 335 (2011) 89–96.
[65] M.Q. Wang, W.H. Yang, H.H. Wang, C. Chen, Z.Y. Zhou, S.G. Sun, ACS Catal. 4 (2014) 3928–
3936.
[66] A.A Schilt, R.C. Taylor, J. Inorg. Nucl. Chem. 9 (1959) 211–221.
[67] E. Frackowiak, F. Béguin, Carbon 39 (2001) 937–950.
[68] Y. Garsany, O.A. Baturina, K.E. Swider-Lyons, S.S. Kocha, Anal. Chem. 82 (2010) 6321–6328.
[69] P. Spinelli, C. Francia , E.P. Ambrosio, M. Lucariello, J. Power Sources 178 (2008) 517–524.
[70] J. Chlistunoff. J. Phys. Chem. C 115 (2011) 6496–6507.
[71] D. Susac, A. Sode, L. Zhu, P.C. Wong, M. Teo, D. Bizzotto, K.A.R. Mitchell, R.R. Parsons, S.A.
Campbell, J. Phys. Chem. B 110 (2006) 10762–10770.
[72] D. Geng, H. Liu, Y. Chen, R. Li, X. Sun, S. Ye, S. Knights, J. Power Sources 196 (2011) 1795–
1801.
[73] Y. Okamoto, Appl. Surf. Sci. 256 (2009) 335–341.
[74] F. Jaouen, J.-P. Dodelet, Electrochim. Acta 52 (2007) 5975–5984.
[75] J. Wang, G. Yin, Y. Shao, S. Zhang, Z. Wang, Y. Gao, J. Power Sources 171 (2007) 331–339.
[76] H. Shi, Electrochim. Acta 41 (1996) 1633–1639.
[77] L. Lai, J.R. Potts, D. Zhan, L. Wang, C. Kok Poh, C. Tang, H. Gong, H.Z. Shen, J. Lin, R.S.
Ruoff, Energy Environ. Sci. 5 (2012) 7936–7942.
[78] J. Perez, E.R. Gonzalez, E.A. Ticianelli, Electrochim. Acta 44 (1998) 1329–1339.
[79] S. Ye, A.K. Vijh, Int. J. Hydrogen Energy 30 (2005) 1011–1015.
[80] H.-J. Zhang, Q.-Z. Jiang, L. Sun, X. Yuan, Z. Shao, Z.-F. Ma, Int. J. Hydrogen Energy 35 (2010)
8295–8302.
[81] G. Wu, K.L. More, C.M. Johnston, P. Zelenay, Science 332 (2011) 443–447.
[82] A. Kapałka, G. Foti, C. Comninellis, Electrochem. Commun. 10 (2008) 607–610.
[83] H.J. Zhang, X. Yuan, L. Sun, X. Zeng, Q.Z. Jiang, Z. Shao, Z.F. Ma, Int. J. Hydrogen Energy,
35 (2010) 2900–2903.
[84] Y.J. Choi, D. Higgins, Z. Chen, J. Electrochem. Soc. 159 (2012) B87–9B0.
[85] Y. Shao, S. Zhang, C. Wang, Z. Nie, J. Liu, Y. Wang, Y. Lin, J. Power Sources 195 (2010)
4600–4605.
[86] G. Liu, X. Li, P. Ganesan, B.N. Popov, Electrochim. Acta 55 (2010) 2853–2858.
[87] G. Liu, X. Li, P. Ganesan, B.N. Popov, Appl. Catal. B: Environ. 93 (2009) 156–165.
[88] F. Charreteur, F. Jaouen, S. Ruggeri, J.P. Dodelet, Electrochim. Acta 53 (2008) 2925–2938.
[89] H.S. Oh, J.G. Oh, B. Roh, I. Hwang, H. Kim, Electrochem. Commun. 13 (2011) 879–881.

107
[90] M. Ferrandon, A.J. Kropf, D.J. Myers, K. Artyushkova, U. Kramm, P. Bogdanoff, G. Wu, C.M.
Johnston, P. Zelenay, J. Phys. Chem. C, 116 (2012) 16001−16013.
[91] M. Ferrandon, X. Wang, A.J Kropf, D.J. Myers, G. Wu, C.M. Johnston, P. Zelenay, Electrochim.
Acta, 110 (2013) 282–291.

108
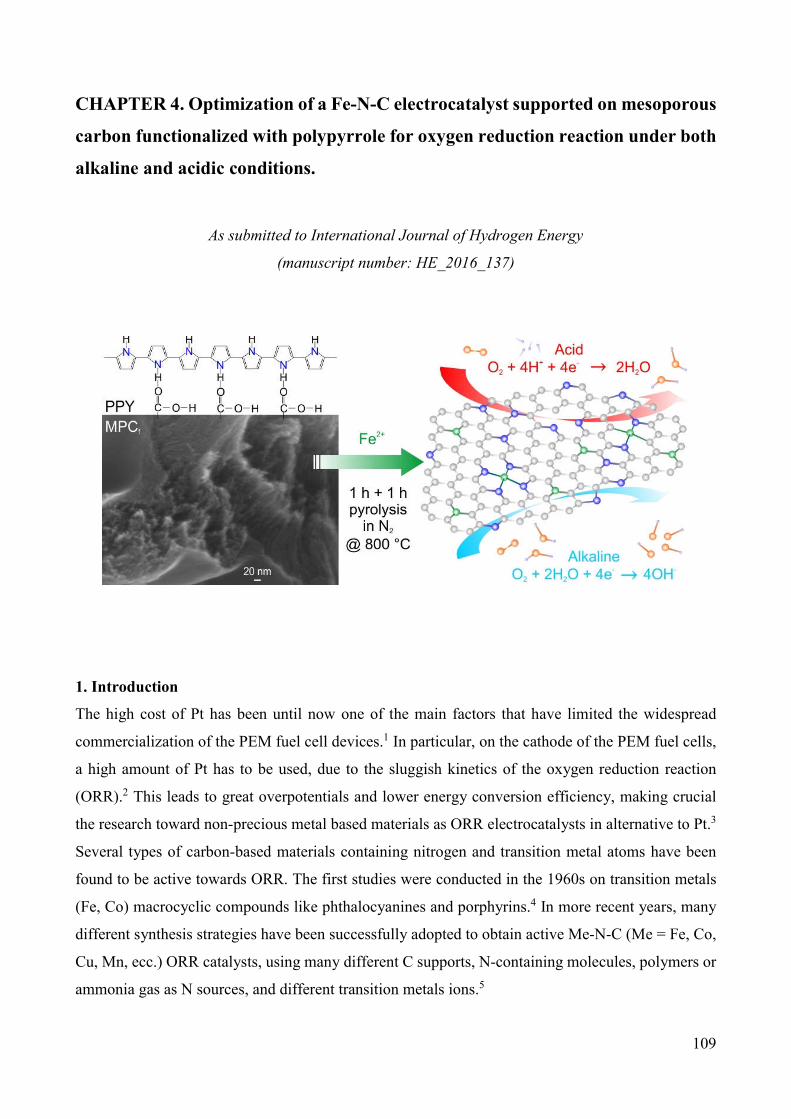
109
CHAPTER 4. Optimization of a Fe-N-C electrocatalyst supported on mesoporous
carbon functionalized with polypyrrole for oxygen reduction reaction under both
alkaline and acidic conditions.
As submitted to International Journal of Hydrogen Energy
(manuscript number: HE_2016_137)
1. Introduction
The high cost of Pt has been until now one of the main factors that have limited the widespread
commercialization of the PEM fuel cell devices.1 In particular, on the cathode of the PEM fuel cells,
a high amount of Pt has to be used, due to the sluggish kinetics of the oxygen reduction reaction
(ORR).2 This leads to great overpotentials and lower energy conversion efficiency, making crucial
the research toward non-precious metal based materials as ORR electrocatalysts in alternative to Pt.3
Several types of carbon-based materials containing nitrogen and transition metal atoms have been
found to be active towards ORR. The first studies were conducted in the 1960s on transition metals
(Fe, Co) macrocyclic compounds like phthalocyanines and porphyrins.4 In more recent years, many
different synthesis strategies have been successfully adopted to obtain active Me-N-C (Me = Fe, Co,
Cu, Mn, ecc.) ORR catalysts, using many different C supports, N-containing molecules, polymers or
ammonia gas as N sources, and different transition metals ions.5
110
Heat treatment at temperatures between 600 and 1000 °C in inert (Ar, N2) or reactive (NH3)
atmosphere has also been found to be very effective in increasing the ORR activity and stability of
these materials.6 Performing a second heat treatment seems also to have a positive effect.7,8
Regarding the C support characterisitics, it should have good electrical conductivity properties in
order to assure a fast electron delivery to the active site.9 It should also have high specific surface
area and good pore size distribution properties in order to provide a sufficiently high number of active
sites per unit area of the electrode, and at the same time favour the reactants and products transport
to and from the active sites.10
The use of N-containing polymers like polyaniline and polypyrrole, has been proved to be an effective
and cheap way to functionalize the surface of a carbon support with nitrogen atoms11, or even to
directly produce N-doped carbon materials without using any additional carbon support.12,13 N-
containing electroconductive polymers (i.e. polyaniline, polypyrrole, polythiophene) were found to
be active toward ORR even without performing any heat treatment.14–16 However, after having heat
treated at high temperature under inert atmosphere, the ORR electroactivity improves significantly,
as well as the stability.7,17–19
In this work, the synthesis of a noble metal-free Fe-N-C catalyst for ORR is optimized in order to
obtain a more active catalyst. Inexpensive molecules (in comparison with Pt and more costly N-
containing organic macrocyclic complexes) like sucrose and pyrrole are used as C and N sources,
respectively. The first part of the optimization was the investigation of the effect of the addition of
the N-containing surfactant polyvinylpyrrolidone (PVP) during the wet impregnation of the MPC-
PPY support with Fe(II) ions. The use of surfactants in solution in synthesis procedures involving
metal ions reduction and deposition with or without C-based supports has been found to be useful to
achieve a better metal particles dispersion and distribution in different literature studies.20–22
However, to the best of our knowledge, the effect of the use of PVP (as well as of other surfactants)
in syntheses involving metal ions impregnation or complexation with N-containing molecules has
not been investigated yet. The effect of performing a preliminary heat treatment before the wet
impregnation with Fe ions was also investigated. Afterwards, in the second part, a further
optimization was done, using the best catalyst obtained in the first part as support. The influence of a
second pyrolysis treatment performed with or without further impregnation with different amounts
of Fe was investigated. The activities towards ORR in acid and alkaline conditions were measured
using a rotating disk electrode (RDE) equipment. The catalysts activity vary depending on the
different synthesis parameters. An evident ORR activity increase after the second heat treatment was
found, and a direct correlation between the electroactivity and the catalyst surface area and
micropores content was observed.

111
2. Experimental
2.1. Chemicals
Tetraethyl orthosilicate (TEOS, ≥ 98% purity), Hydrochloric acid (37 wt. %), Pluronic P123® triblock
copolymer, Nitric acid (70 wt. %), Sulfuric acid (98 wt. %), Sucrose (≥ 99.0% purity), Hydrofluoric
acid (≥ 40 wt. %), Pyrrole (≥ 98% purity), Ethanol (≥ 99.8% purity), Acetone (≥ 99.8% purity),
Perchloric acid (70 wt. %), Ammonium persulfate (APS, ≥ 99.8% purity), Nafion® 5 wt. %
hydroalcoholic solution, Iron(II) Acetate (≥ 99.99% purity) and Polyvinylpyrrolidone (PVP, mw
10000) were purchased from Sigma Aldrich. Nitrogen and oxygen gases were supplied in cylinders by
SIAD with 99.999% purity. All aqueous solutions were prepared using ultrapure deionized water
obtained from a Millipore Milli-Q system with resistivity >18 MΩ cm-1.
2.2. Synthesis
2.2.1. Synthesis of silica template
Mesoporous silica SBA-15 was prepared following the procedure reported by Zeng et al.23, using the
triblock copolymer EO20PO70EO20 (Pluronic P123) as surfactant and TEOS as silica source.
In detail, 8.3 g of P123 was dissolved into 312 mL of 1.6 M HCl solution under stirring at 40 °C.
Then, 19 mL of TEOS was added and the solution was stirred for 20 h keeping the temperature
constant at 40 °C. Then, the temperature was increased at 100°C and maintained constant for 24 h.
The product was filtered, washed with deionized water, and calcined in oven at 550 °C for 10 h under
air in order to completely remove the surfactant.
2.2.2. Synthesis of mesoporous carbon
Mesoporous carbon (MPC) was synthesized using mesoporous silica SBA-15 via hard templating
method.23 Sucrose was used as the carbon source and the synthesis method consists on impregnating
the SBA-15 silica with a solution containing sucrose and sulphuric acid. More in detail, a solution
containing 10 mL of deionized water, 0.152 mL of H2SO4 and 2.5 g of sucrose was pipetted drop by
drop onto 2 g of SBA-15. Then the temperature was increased at 100°C on a hot plate, and kept
constant for 6 hours. Subsequently the temperature was increased to 160 °C and kept constant for 6
h more. This two-steps heating procedure is repeated after pipetting drop by drop a solution
containing 10 mL of deionized water, 0.098 mL of H2SO4 and 1.6 g of sucrose. This further addition
of solution was done in order to completely fill the internal pores of the SBA-15 silica with the carbon
precursor. Then, the carbon-silica mixture was heat-treated in a quartz-tube reactor at 830 °C for 6 h
under nitrogen flow. To completely remove the silica template, the mixture was dispersed in 110 mL

112
of 5 % wt. HF solution. Finally, MPC was filtered under vacuum, washed with abundant deionized
water and acetone, and dried in air.
In the following step, MPC was functionalized by reaction with concentrated sulphuric and nitric acid
mixture, in order to introduce oxygen-containing functional groups (e.g. carbonyls, hydroxyls and
carboxylic groups) on the MPC surface. 750 mg of MPC were introduced together with 120 mL of
1:1 vol. mixture of 98% wt. H2SO4 and 65% wt. HNO3 into a triangular flask connected to a reflux
apparatus. They were kept in reflux under stirring for 2 hours. Then 400 mL of deionized water was
added (this causes a fast temperature increase). The mixture was stirred and kept under reflux
overnight. Then the functionalized MPC were filtered under vacuum, washed with abundant
deionized water until neutral pH and dried in air. This surface functionalization should favour the
pyrrole polymerization to preferentially take place on the MPC surface, due to the formation of
hydrogen bonds between the oxygen-containing functional groups and the -NH groups of pyrrole.11
2.2.3. Synthesis of Fe-N-C catalysts – First optimization step
In the following step of the synthesis, 350 mg of functionalized MPC were dispersed into 100 mL of
1:1 vol. solution of 1 M HClO4 and ethanol. Then 90.2 µL of pyrrole monomer was added (pyrrole:
MPC wt. ratio 1:4) and the mixture was left under stirring for 2 hours. Afterwards, 0.298 g of APS
(pyrrole:APS molar ratio 1:1), used as oxidant for the polymerization of pyrrole,24,25 was dissolved
in 10 mL deionized water and added slowly drop by drop to the MPC-pyrrole mixture. After leaving
the reaction under stirring for 12 hours, the suspension was filtered, washed with 500 mL deionized
water and 50 mL acetone, and dried in air at room temperature overnight.
Afterwards, 100 mg of MPC-PPY composite was added to 100 mL of 1:1 deionized water - ethanol
solution and stirred for 30 min. Then, 8.95 mL of 0.01 M Fe(II) acetate solution was added, and the
dispersion was placed into an ultrasonic bath (130W, Soltec 2200M3S sonicator) for 30 min. and left
under stirring overnight. Then the solvent was evaporated by heating, and the recovered powder was
pounded in a mortar. This first sample was named S1.
Another sample was obtained in the same way but with the addition of 20 mg of PVP (0.1 wt. % in
the solution) as surfactant (S2).
Two more samples were prepared in the same way as the previous ones, but heat-treating the MPC-
PPY support at 800°C under N2 flow for 3 hours (same heat treatment procedure described below)
before the impregnation with Fe(II) ions (S3 and S4).
The Fe:MPC-PPY ratio in all these samples was expected to be 5% wt. All of the samples were heat
treated in a tubular quartz furnace under nitrogen atmosphere (N2 gas flux set at 80 NmL min-1 with
a mass flow controller from Bronkhorst, ELFLOW series). The heating rate was 10 °C min-1. When
the temperature reached 800°C, it was kept constant for 1 h. Then the furnace was switched-off,

113
leaving the apparatus cooling down naturally to room temperature. Then, to remove any unbounded
Fe moiety, all of the samples were washed with 75 mL of 1 M HCl solution under stirring for 3 h,
filtered and dried at room temperature overnight.
The MPC-PPY support without Fe impregnation before (S5) and after pyrolysis (S6) was also tested
for comparison.
A summary of the samples synthesized in the first optimization step and subsequently analyzed is
presented in Table 1.
Table 1. Summary of the catalysts synthesized in the first optimization step.
Sample name Preliminary pyrolysis Impregnation with Fe2+ ions
Use of PVP during Fe2+ impregnation
S1 No Yes No S2 No Yes Yes S3 Yes Yes No S4 Yes Yes Yes S5 No No - S6 Yes No -
2.2.4. Synthesis of Fe-N-C catalysts – Second optimization step
In the second optimization step, the most active catalyst obtained in the first part was used as C-N
support. Four more catalysts were produced. The first one was obtained simply after a second
pyrolysis in N2 atmosphere at 800°C preformed exactly in the same conditions as in the first step,
without impregnation with more Fe (S7). For the other three catalysts, before performing the second
heat treatment, a further impregnation of the support with different Fe(II) ions amounts (5 – 15 – 30
wt. % for S8 – S9 – S10 respectively) was performed, using the same impregnation procedure that
led to obtain the more active catalyst in the first optimization step (i.e. without PVP addition). Table
2 shows a summary of the samples prepared in the second optimization step.
Table 2. Summary of the catalysts synthesized in the second optimization step.
Sample name Impregnation with Fe2+ ions before 2nd pyrolysis
Fe wt. % on C support
S7 No - S8 Yes 5 S9 Yes 15 S10 Yes 30
As a purpose of clarity, the whole synthesis process is schematized in Figure S7 in the Supporting
Information.
114
2.3. Physical characterization
Nitrogen adsorption and desorption isotherms of SBA-15 silica, MPC, MPC-PPY supports, and Fe-
N-C catalysts were recorded using an ASAP 2020 Instrument (Micromeritics) at –196 °C, within the
relative pressure range of 0 – 1. Before the analysis, all of the samples were placed into the cell and
degassed under vacuum for 3 hours at 150 °C. The specific surface area of the samples was calculated
using the Brunauer–Emmett–Teller (BET) method within the relative pressure range 0.1 – 0.3. The
pore size distribution for mesopores was obtained with the Barrett–Joyner–Halenda (BJH) method.
The micropores area and volume were obtained by the t-plot method and by a Density Functional
Theory (DFT) model.
Scanning electron microscopy coupled with energy-dispersive X-ray spectroscopy (SEM-EXD FEI-
QuantaTM Inspect 200 with EDAX PV 9900 instrument working at 15 kV), was performed to analyze
the chemical composition of the samples, detecting the presence of Fe in the bulk of Fe-N-C catalysts.
Morphology of SBA-15 silica, MPC, MPC-PPY, and Fe-N-C catalysts (S1 and S7) were investigated
using a field emission scanning electron microscope (FESEM, model JEOL JSM 6700F).
Transmission electron microscopy (TEM) was performed on the most performing Fe-N-C catalyst
(S7) using a FEI Monochromated Tecnai 200STEM-FEG microscope with a point resolution of 0.2
nm, information limit of 0.1 nm, which was operated at 200 kV, coupled with a boron EDS (Energy
Dispersive Spectroscopy), in which images were acquired with CCD camera (4096x4096). Samples
to be examined were prepared by immersing a Quantifoil R copper microgrid in a dispersion of the
catalyst in ethanol (5 mg mL-1).
X-ray photoelectron spectroscopy (XPS) was performed to determine the elemental surface
composition of the catalysts samples, detecting the presence of N and Fe. The analysis was carried
out using a Physical Electronics PHI 5000 Versa Probe electron spectrometer system with mono-
chromated Al Kα X-ray source (1486.60 eV) run at 15 kV and 1 mA anode current. Survey scans as
well as narrow scans (high resolution spectra) were recorded with a spot of 100 nm size. The survey
spectra were collected from 0 to 1200 eV. The narrow N 1s spectra were collected from 390 to 412
eV, the narrow Fe 2p spectra from 700 to 740 eV, and the narrow C 1s spectra from 278 to 298 eV.
Before the measurements, all of the samples were placed in an ultrahigh vacuum chamber at 2·10-10
mmHg, and calibrated against a value of the C 1s binding energy of 284.5 eV. CasaXPS software was
used for obtaining the N 1s and C 1s peaks deconvolution and the semi-quantitative atomic percentage
compositions, using Gauss – Lorentz equations with Shirley-type background. A 70% Gaussian /
30% Lorentzian line shape was used to evaluate peaks position and areas.

115
For Fourier transform infrared spectroscopy (FTIR) measurements, powder samples were
mechanically mixed with KBr and pressed. IR spectra were collected in air at 2 cm-1 resolution on a
Bruker Equinox 55 FTIR spectrophotometer, equipped with a MCT (Mercury Cadmium Telluride)
detector.
2.4. Electrochemical measurements
The electrochemical tests were conducted in a conventional three-electrodes electrochemical cell
configuration, using a rotating disk electrode equipment (RRDE-3A ALS) and a multi-potentiostat
(Bio-Logic SP-150). The cell was equipped with a glassy carbon disk working electrode (0.07 cm2
geometric area), a Pt helical wire counter electrode, and a saturated calomel reference electrode
(SCE). The electrolyte was 0.5 M H2SO4 solution for tests in acidic conditions and 0.1 M KOH
solution for tests in alkaline conditions. The electrolytes were saturated with N2 for cyclic
voltammetries (CV) and with O2 for ORR activity linear sweep voltammetries (LSV) analyses, by
direct gas bubbling into the solution.
For the catalyst deposition on the working electrode surface, a catalyst ink was prepared. A typical
ink preparation consists in mixing 10 mg of sample powder with 43 μL of Nafion® 5% wt. solution
and 400 μL of ethanol. The ink was kept under sonication for 1 hour to achieve a good dispersion.
Afterwards, 1 μL of ink was taken with a micro-pipette and deposited on the working electrode,
resulting in a catalyst loading of 0.0225 mg, which corresponds to 0.318 mg cm–2 referred to the
geometrical area of the disk working electrode. The electrode potentials were corrected and referred
to the reversible hydrogen electrode (RHE).
Prior to start tests, 50 CV cycles at 100 mV s–1 scan rate and 20 more cycles at 10 mV s-1 scan rate
were performed from 0.0 to 1.2 V vs RHE in N2 saturated electrolyte, in order to obtain an
electrochemically clean and stable working electrode surface.26
For each sample, CV were recorded between 0.0 and 1.2 V vs RHE in N2-saturated electrolyte at 10
mV s–1 scan rate.
For the ORR measurements, LSV were recorded at 5 mV s–1 scan rate and with a RDE rotation speed
of 900 rpm. This scan rate value should be sufficiently low to consider the background capacitive
current contribution negligible and sufficiently high to allow neglecting the possible effects of
impurities in the cell.27 An electrochemical impedance spectroscopy measurement was done at OCV,
with a wave amplitude of 10 mV and frequencies in the range of 10 kHz – 100 mHz, for the evaluation
of the high frequency resistance value. This value was used to subtract the ohmic drop contribution
from the linear sweep voltammetry curves.28,29

116
3. Results and discussion
3.1. Electrochemical characterization
3.1.1. First optimization step
All of the catalysts obtained in the first synthesis optimization part (see Table 1) have been
electrochemically tested. The MPC-PPY support without Fe impregnation before and after pyrolysis
(S5 and S6, respectively) is also examined for comparison, in order to investigate the effect of the
iron presence during the heat treatment. The CV recorded in N2 saturated acidic and alkaline
electrolyte are shown in Fig. 1A and 1C, respectively.
All of the samples exhibit almost the same capacitive current values and CV shape in both acidic and
alkaline conditions, except for S5. This could be due to its surface functionalization with polypyrrole,
which undergoes to surface oxidation-reduction processes during the potential cycling.30 This is
evidenced by the presence of broad oxidation-reduction peaks, especially for the CV in acid
conditions. The surface functionalization, in fact, is responsible of surface pseudo-capacitive
phenomena that dramatically increase the capacitive currents in etheroatom-doped carbon materials.31
For the catalysts synthesized with Fe impregnation (S1-2-3-4), no evident presence of Fe
reduction/oxidation peaks is detected. This could be due to the low amount of Fe on the catalysts
surface, as evidenced by XPS analyses (see Section 3.2). Most of the Fe-containing moieties should
have been removed during the acid leaching treatment with 1 M HCl.
The ORR activities are shown in the LSV plots in Fig. 1B (acid conditions) and Fig. 1D (alkaline
conditions). First of all, it is evident that the ORR overpotential is lower in alkaline than in acid
conditions, as usually observed for this type of Me-N-C catalysts.32,33 The catalysts synthesized
without the addition of PVP during the impregnation with Fe(II) ions (S1 and S3) are more active in
both acidic and alkaline conditions than the respective ones obtained in presence of PVP (S2 and S4).
Thus, the use of PVP in this type of wet impregnation synthesis is not useful. In spite of being PVP a
N-containing organic molecule, its presence in the solution could cause a covering of the carbon
support surface after solvent evaporation. Therefore, the incomplete PVP removal during the
pyrolysis heat treatment could have hindered the formation of the active sites.34,35
The other aspect of the synthesis that was considered was the pyrolysis of the MPC-PPY support
before the impregnation with Fe(II) ions. As shown in Fig. 1B and 1D, S3 and S4 are less active than
S1 and S2 in terms of onset potential. This suggests that the preliminary heat treatment is not useful
in order to increase the ORR activity. In this preliminary pyrolysis, only C- and N-containing material
undergo to the pyrolysis, without the presence of any transition metal sources. Moreover, during this
heat treatment at high temperature, all the N initially present in the form of PPY is most likely
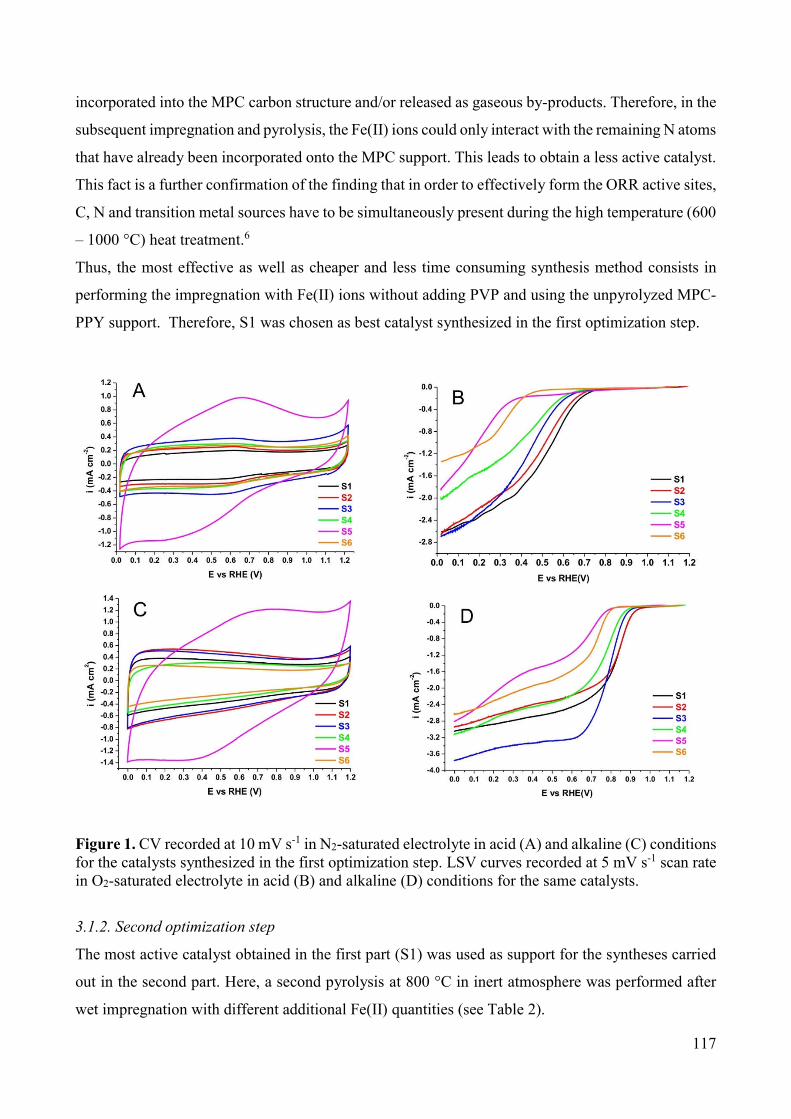
117
incorporated into the MPC carbon structure and/or released as gaseous by-products. Therefore, in the
subsequent impregnation and pyrolysis, the Fe(II) ions could only interact with the remaining N atoms
that have already been incorporated onto the MPC support. This leads to obtain a less active catalyst.
This fact is a further confirmation of the finding that in order to effectively form the ORR active sites,
C, N and transition metal sources have to be simultaneously present during the high temperature (600
– 1000 °C) heat treatment.6
Thus, the most effective as well as cheaper and less time consuming synthesis method consists in
performing the impregnation with Fe(II) ions without adding PVP and using the unpyrolyzed MPC-
PPY support. Therefore, S1 was chosen as best catalyst synthesized in the first optimization step.
Figure 1. CV recorded at 10 mV s-1 in N2-saturated electrolyte in acid (A) and alkaline (C) conditions for the catalysts synthesized in the first optimization step. LSV curves recorded at 5 mV s-1 scan rate in O2-saturated electrolyte in acid (B) and alkaline (D) conditions for the same catalysts.
3.1.2. Second optimization step
The most active catalyst obtained in the first part (S1) was used as support for the syntheses carried
out in the second part. Here, a second pyrolysis at 800 °C in inert atmosphere was performed after
wet impregnation with different additional Fe(II) quantities (see Table 2).

118
As found in the first optimization step, the CV recorded in N2-saturated electrolytes for the samples
synthesized in the second step have similar shapes and capacitive current densities (see Fig. 2A and
C for tests in acid and alkaline conditions, respectively).
Regarding the ORR electroactivity, as shown in Fig. 2B (acid conditions) and Fig. 2D (alkaline
conditions), the most active catalyst was obtained after a second heat treatment without a further
impregnation with Fe(II) ions (S7).
Comparing Fig. 1B and Fig. 2B, it is evident how the second heat treatment at 800°C under inert
atmosphere is beneficial in order to get a better catalytic performance in acidic conditions, regardless
of the amount of Fe deposited on the support in the second impregnation. However, the relative wt.
% of Fe has an influence on the electroactivity. In particular, the best catalytic performance is obtained
with a simple heat treatment of the support, without any Fe addition (S7). A further impregnation
with 15 and 30 wt. % of Fe(II) ions leads to a similar activity (S9 and S10). A lower performance was
found for the catalyst impregnated with only 5 wt. % Fe(II) (S8).
The ORR activity increase caused by the second heat treatment is less evident in alkaline conditions,
as can be seen comparing Fig. 1D and Fig. 2D. Also under alkaline pH, the highest activity increase
is observed without any further Fe addition (S7). An improvement in terms of limiting current density,
also occurred for the samples impregnated with the different Fe(II) ions amounts.
In conclusion, performing a second pyrolysis is beneficial for the catalyst performance in both acidic
and alkaline conditions. On the contrary, the further impregnation with Fe(II) ions before the second
pyrolysis is limiting, or at least, it is not useful to get a better electrocatalytic activity.
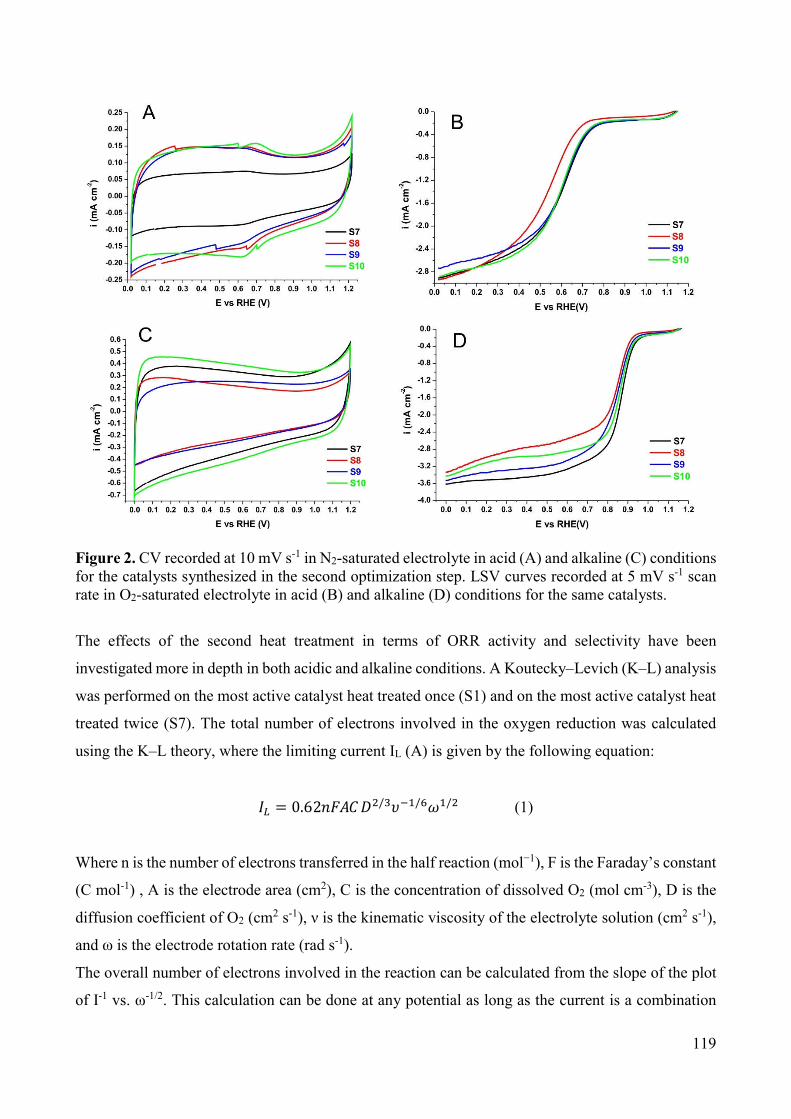
119
Figure 2. CV recorded at 10 mV s-1 in N2-saturated electrolyte in acid (A) and alkaline (C) conditions for the catalysts synthesized in the second optimization step. LSV curves recorded at 5 mV s-1 scan rate in O2-saturated electrolyte in acid (B) and alkaline (D) conditions for the same catalysts.
The effects of the second heat treatment in terms of ORR activity and selectivity have been
investigated more in depth in both acidic and alkaline conditions. A Koutecky–Levich (K–L) analysis
was performed on the most active catalyst heat treated once (S1) and on the most active catalyst heat
treated twice (S7). The total number of electrons involved in the oxygen reduction was calculated
using the K–L theory, where the limiting current IL (A) is given by the following equation:
= 0.62 // / (1)
Where n is the number of electrons transferred in the half reaction (mol−1), F is the Faraday’s constant
(C mol-1) , A is the electrode area (cm2), C is the concentration of dissolved O2 (mol cm-3), D is the
diffusion coefficient of O2 (cm2 s-1), ν is the kinematic viscosity of the electrolyte solution (cm2 s-1),
and ω is the electrode rotation rate (rad s-1).
The overall number of electrons involved in the reaction can be calculated from the slope of the plot
of I-1 vs. ω-1/2. This calculation can be done at any potential as long as the current is a combination
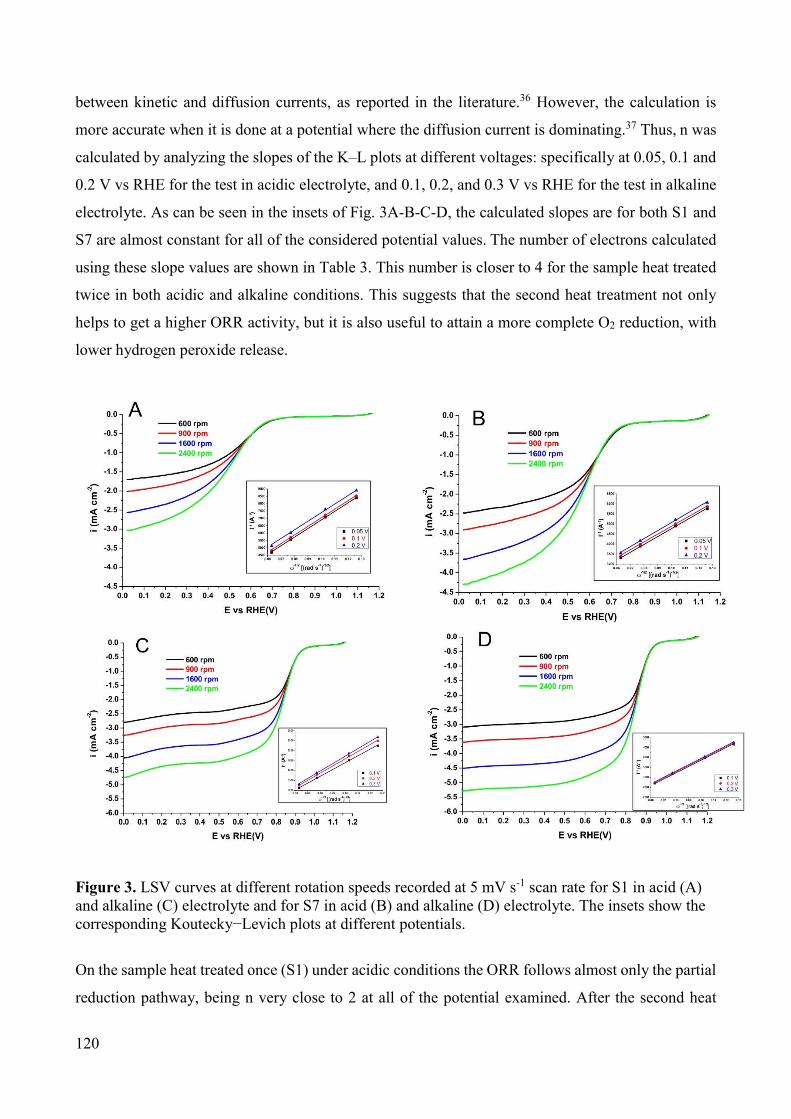
120
between kinetic and diffusion currents, as reported in the literature.36 However, the calculation is
more accurate when it is done at a potential where the diffusion current is dominating.37 Thus, n was
calculated by analyzing the slopes of the K–L plots at different voltages: specifically at 0.05, 0.1 and
0.2 V vs RHE for the test in acidic electrolyte, and 0.1, 0.2, and 0.3 V vs RHE for the test in alkaline
electrolyte. As can be seen in the insets of Fig. 3A-B-C-D, the calculated slopes are for both S1 and
S7 are almost constant for all of the considered potential values. The number of electrons calculated
using these slope values are shown in Table 3. This number is closer to 4 for the sample heat treated
twice in both acidic and alkaline conditions. This suggests that the second heat treatment not only
helps to get a higher ORR activity, but it is also useful to attain a more complete O2 reduction, with
lower hydrogen peroxide release.
Figure 3. LSV curves at different rotation speeds recorded at 5 mV s-1 scan rate for S1 in acid (A) and alkaline (C) electrolyte and for S7 in acid (B) and alkaline (D) electrolyte. The insets show the corresponding Koutecky−Levich plots at different potentials.
On the sample heat treated once (S1) under acidic conditions the ORR follows almost only the partial
reduction pathway, being n very close to 2 at all of the potential examined. After the second heat

121
treatment (S7), the number of electrons significantly increases, corresponding to a H2O2 production
between 42.7 % and 47.6 %.
In alkaline conditions, the catalyst S1 exhibits a number of electrons in the range between 3.27 and
3.60 at the different potentials examined. This still corresponds to a considerably high H2O2
production (between 20.2 and 36.4 %). With the second heat treatment process the production of
H2O2 dramatically decreases to 3.01% at 0.1 V vs RHE potential and to 9.60 % at 0.3 V vs RHE.
Therefore, an almost complete 4-electrons oxygen reduction reaction pathway is attained in alkaline
conditions at the end of the synthesis optimization.
Table 3. Total number of electrons involved in the ORR and corresponding hydrogen peroxide generation (molar %) resulting from the K–L analysis for catalysts S1 and S7 in acid and alkaline conditions.
Acidic conditions Sample N° of
pyrolysis 0.05 V vs RHE 0.1 V vs RHE 0.2 V vs RHE
N° of e- % H2O2 N° of e- % H2O2 N° of e- % H2O2
S1 1 2.08 96.14 2.07 94.44 2.03 98.43 S7 2 3.15 42.74 3.11 44.65 3.05 47.63
Alkaline conditions Sample N° of
pyrolysis 0.1 V vs RHE 0.2 V vs RHE 0.3 V vs RHE
N° of e- % H2O2 N° of e- % H2O2 N° of e- % H2O2
S1 1 3.60 20.20 3.41 29.33 3.27 36.37 S7 2 3.94 3.01 3.87 6.30 3.81 9.60
The ORR performances of the two best catalysts resulting from the first and the second optimization
steps (S1 and S7) are shown in Fig. 4A and B for acid and alkaline conditions, respectively.
The limiting current densities values were used to calculate the mass-transport corrected ORR electro-
reduction kinetic activity by the following equation:
= −∙
(2)
where ik is the mass transport-corrected current density, i is the measured current density, and iL is
the limiting current density. A correction for the ohmic drop was also done, based on the resistance
values obtained by the impedance measurements as described in the experimental section. The as-
calculated ik values can be transformed into specific mass current densities (A g-1) simply dividing
by the catalyst loading on the electrode (mg cm-2).

122
Figure 4. Ohmic drop and mass-transport corrected Tafel plot for catalysts S1 and S7 in acid (A) and alkaline (B) conditions.
3.2. Physico-chemical characterization
A complete characterization of the morphology of the materials obtained at the end of each step of
the synthesis was done by FESEM. Pictures are shown in Figure S1, S2 and S3. The SBA-15 silica
template exhibits the typical uniform rod-like morphology.38 These short rods, with average length
and thickness of about 1μm and 200 nm respectively, are joined together to form larger agglomerates
(Fig. S1 A-B-C-D). The MPC have the same rod-like morphology as the SBA-15. Moreover, by the
higher magnification picture, it is evident the presence of a uniform channel-like structure. This
indicates that a complete filling of the inner space of the SBA-15 channels occurred during the
negative replica synthesis method39 (Fig. S2 A-B). Thus, an ordered mesoporous carbon material was
successfully obtained after the removal of the SBA-15 template.
The functionalization with concentrated HNO3 and H2SO4 induces an evident modification of the
MPC surface, which becomes more irregular (Fig. S2 C-D). The following step of the synthesis
consisted in the pyrrole polymerization. As it was hypothesized, and as it is suggested by Fig. S2 E-
F, this polymerization took place onto the MPC support surface. In fact, there is no presence of
unlinked PPY flakes and the channels and pores on the MPC structure are no more evident. They
have most likely been covered by a uniform PPY layer, which forms due to the presence of hydrogen
bonds between the oxygen-containing groups on the functionalized MPC surface and the N–H groups
of PPY.
Fig. S3 A-B show the aspect of the best catalyst obtained after the first optimization step (S1). It is
evident that a huge structure modification occurred in comparison with the MPC covered with PPY.
The pyrolysis at 800°C after the impregnation with Fe(II) ions causes the PPY layer rupture and
rearrangement onto the MPC surface, which appears now more irregular, with less presence of the

123
rod-like structures with ordered channels, although still slightly evident. A highly irregular zone, with
aspect similar to a nanotubes agglomerate, is evident in the high magnification picture (Fig. S3 B).
The morphology of the most performing catalyst resulting from the second optimization step (S7) is
shown in Fig. S3 C-D. A further change in the catalyst aspect occurred during the second pyrolysis.
Nevertheless, also in this case the channel-like structure is still partially evident at high magnification,
(Fig. S3 D).
The morphology of S7 catalyst was investigated more in detail by TEM analysis (Fig. 5). From the
picture taken at lower magnification (Fig. 5A), it can be noticed that the catalyst morphology seems
to be like a combination of two different zones. One appears like agglomerates of filamentous
particles, similar to carbon nanotubes11, while the other has the aspect 2-D flat structure, similar to
graphene-like flakes.40,41 The presence of carbon nanotubes structures is confirmed by the picture at
higher magnification (Fig. 5B). The 2-D planar structures, attributable to graphene-like flakes, can be
observed in Fig. 5C and 5D. Small dark nanoparticles, typical of metal containing compounds, are
also visible in Fig. 5C. These could correspond to Fe-containing crystallites (i.e. metallic Fe, iron
oxides, carbides, nitrides)40,42, confirming the Fe presence detected by EDX analysis.

124
Figure 5. TEM images of catalyst S7 at different magnifications.
FTIR spectra (Fig. 6) were measured for the S1 and S7 catalysts. MPC coated with PPY before (S5)
and after (S6) pyrolysis were also analysed for comparison. The FTIR spectrum of S5 shows
absorbance peaks and bands typical of the pyrrolic structure43, as expected due to the presence of
PPY. This confirms what observed in the FESEM pictures. Peaks and bands typical of oxygenated
organic functional groups are also observed, due to the functionalization of the MPC surface before
pyrrole polymerization. In particular, the big band in the wavenumber range 1650–1470 cm-1 can be
attributed to the C–C stretching vibrations of aromatic rings and N–H bend vibrations. The band in
the range 1350–1000 cm-1 is attributable to C–N stretching vibrations in the N-containing aromatic

125
rings, as well as to the C–H in-plane vibrations of the aromatic rings. The broad peak at 3200–3300
cm-1 is characteristic of the N–H stretching vibration of the pyrrolic ring.44,45 The peaks and bands
characteristic of oxygenated functional groups are in the range 1760–1670 cm-1 (C=O stretching
vibration in carbonyls), 990–840 cm-1 (O–H bending vibrations of carboxylic acid), and the two small
peaks (more evident in the spectra of S1 catalyst) in the range 2950–2800 cm-1 (O–H stretching
vibrations of carboxylic acid). The small band at 820–750 cm-1 can be assigned to the C–H bending
vibrations of aromatic rings.44 These results confirm the presence of PPY on the surface of MPC
support, and the high degree of functionalization attained after the reaction with concentrated HNO3–
H2SO4 mixture. After pyrolysis, most of the peaks characteristics of the pyrrolic and of the
oxygenated functional groups disappear. Therefore, the spectra become more similar to the spectra
typical of carbonaceous materials, which are highly transparent to the IR radiation in the region
between 400 and 4000 cm-1.12 In fact, the FTIR spectra of catalysts S6, S1 and S7 exhibit only two
broad absorbance peaks in the ranges 1690–1490 cm-1 and 1350–950 cm-1, which are attributable to
C=N bonding (i.e. pyridine-type) and N–H bonding found on N-containing carbon materials.46
Similar results are reported in the literature for different types of pyrolyzed Me-N-C
electrocatalysts.8,17,47 This finding suggests that the original PPY structure of the precursor is totally
decomposed during the pyrolysis at 800°C, with a substantial recombination of the chemical
bonding.12,46
Figure 6. FTIR spectra of catalysts S1, S5, S6, and S7.
4000 3500 3000 2500 2000 1500 1000 500
Wavenumber (cm-1)
S5 S6 S1 S7
Ab
so
rba
nce
(a
.u.)
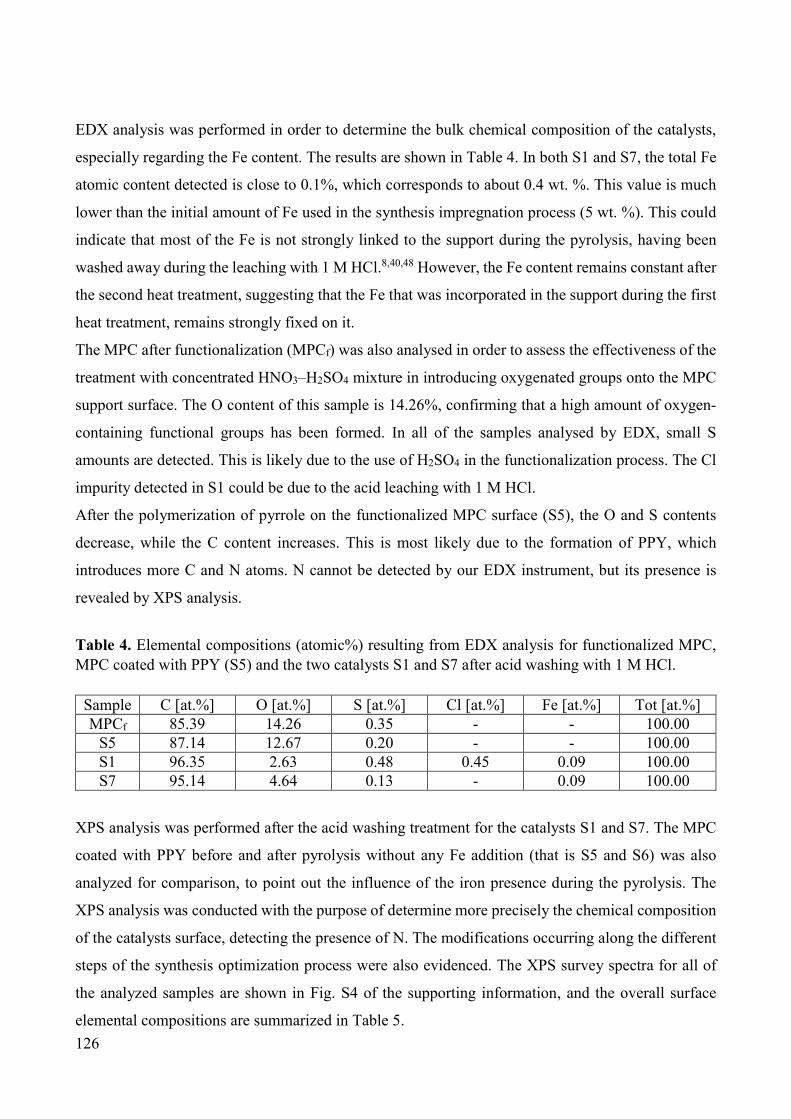
126
EDX analysis was performed in order to determine the bulk chemical composition of the catalysts,
especially regarding the Fe content. The results are shown in Table 4. In both S1 and S7, the total Fe
atomic content detected is close to 0.1%, which corresponds to about 0.4 wt. %. This value is much
lower than the initial amount of Fe used in the synthesis impregnation process (5 wt. %). This could
indicate that most of the Fe is not strongly linked to the support during the pyrolysis, having been
washed away during the leaching with 1 M HCl.8,40,48 However, the Fe content remains constant after
the second heat treatment, suggesting that the Fe that was incorporated in the support during the first
heat treatment, remains strongly fixed on it.
The MPC after functionalization (MPCf) was also analysed in order to assess the effectiveness of the
treatment with concentrated HNO3–H2SO4 mixture in introducing oxygenated groups onto the MPC
support surface. The O content of this sample is 14.26%, confirming that a high amount of oxygen-
containing functional groups has been formed. In all of the samples analysed by EDX, small S
amounts are detected. This is likely due to the use of H2SO4 in the functionalization process. The Cl
impurity detected in S1 could be due to the acid leaching with 1 M HCl.
After the polymerization of pyrrole on the functionalized MPC surface (S5), the O and S contents
decrease, while the C content increases. This is most likely due to the formation of PPY, which
introduces more C and N atoms. N cannot be detected by our EDX instrument, but its presence is
revealed by XPS analysis.
Table 4. Elemental compositions (atomic%) resulting from EDX analysis for functionalized MPC, MPC coated with PPY (S5) and the two catalysts S1 and S7 after acid washing with 1 M HCl.
Sample C [at.%] O [at.%] S [at.%] Cl [at.%] Fe [at.%] Tot [at.%] MPCf 85.39 14.26 0.35 - - 100.00
S5 87.14 12.67 0.20 - - 100.00 S1 96.35 2.63 0.48 0.45 0.09 100.00 S7 95.14 4.64 0.13 - 0.09 100.00
XPS analysis was performed after the acid washing treatment for the catalysts S1 and S7. The MPC
coated with PPY before and after pyrolysis without any Fe addition (that is S5 and S6) was also
analyzed for comparison, to point out the influence of the iron presence during the pyrolysis. The
XPS analysis was conducted with the purpose of determine more precisely the chemical composition
of the catalysts surface, detecting the presence of N. The modifications occurring along the different
steps of the synthesis optimization process were also evidenced. The XPS survey spectra for all of
the analyzed samples are shown in Fig. S4 of the supporting information, and the overall surface
elemental compositions are summarized in Table 5.

127
In the pyrolyzed samples, the main component is C (96.7–93.7 at. %). O is also detected in
percentages between 3.9 and 2.9 at. %. The N content is higher for S6 and it decreased for S1 and S7.
For the two catalysts impregnated with Fe2+ ions before the pyrolysis (S1 and S7), the Fe quantity
detected was lower than 0.1 at. %. Consequently, the signal of the Fe 2p peaks are too weak to allow
the determination of the Fe valence state via deconvolution of the high-resolution peak analysis (not
reported here). In S5, the O and N amounts are considerably higher than in the other samples. In
particular, the higher oxygen content is due to the functionalization of the MPC support, as was also
found by EDX and FTIR analyses. The higher N surface content is attributable to the PPY coating,
and it is a further confirmation that the polymerization of pyrrole takes preferentially place onto the
surface of MPCf. Small S, Cl and F impurities are also detected in some samples. This is attributable
to some of the different steps of the synthesis, i.e. the functionalization of MPC with concentrated
H2SO4, the washing with 1 M HCl after the pyrolysis, and the silica template removal by reaction
with HF.
Table 5. Elemental composition in atomic % of S5, S6, S1 and S7 from XPS analysis.
Sample C O N Fe S Cl F Tot S5 80.7 13.8 4.5 - 0.3 - 0.7 100.0 S6 93.7 3.9 2.4 - - - - 100.0 S1 95.7 3.4 0.5 < 0.1 0.3 0.1 - 100.0 S7 96.7 2.9 0.4 < 0.1 - - - 100.0
The N 1s high-resolution spectra were recorded and deconvoluted into five different components (see
Fig. S5 in the supporting material), corresponding to pyridinic, nitrile and/or N bonded to Fe atom,
pyrrolic, graphitic and N-oxidized species, respectively. The relative amounts of each different
nitrogen bond type are shown in Table 6, with their respective binding energy. As expected, the most
abundant N type on S5 is pyrrolic nitrogen, due to the presence of the PPY coating on the MPCf
surface. After heat treatment without presence of Fe(II) ions (S6), most of the pyrrolic-type N
disappears, suggesting that the typical PPY structure is strongly modified during the pyrolysis. N is
incorporated in S6 structure mainly in form of pyridinic and graphitic N. A considerably high percent
of oxidized-type N is also detected on S6, probably due to the reaction with the oxidized functional
groups on the MPCf. Concerning S1, the overall N amount detected on its surface (see Table 5) is
considerably lower than for S6. However, the relative proportion of the different N-types is also
remarkably different. In particular, a high amount of pyrrolic N is still detected (26.43 at. %), as well
as a not negligible amount of nitrile and/or Fe-Nx N type. Therefore, from these results, the Fe(II)
presence seems to favor the formation of more pyridinic and pyrrolic N relative content, limiting the
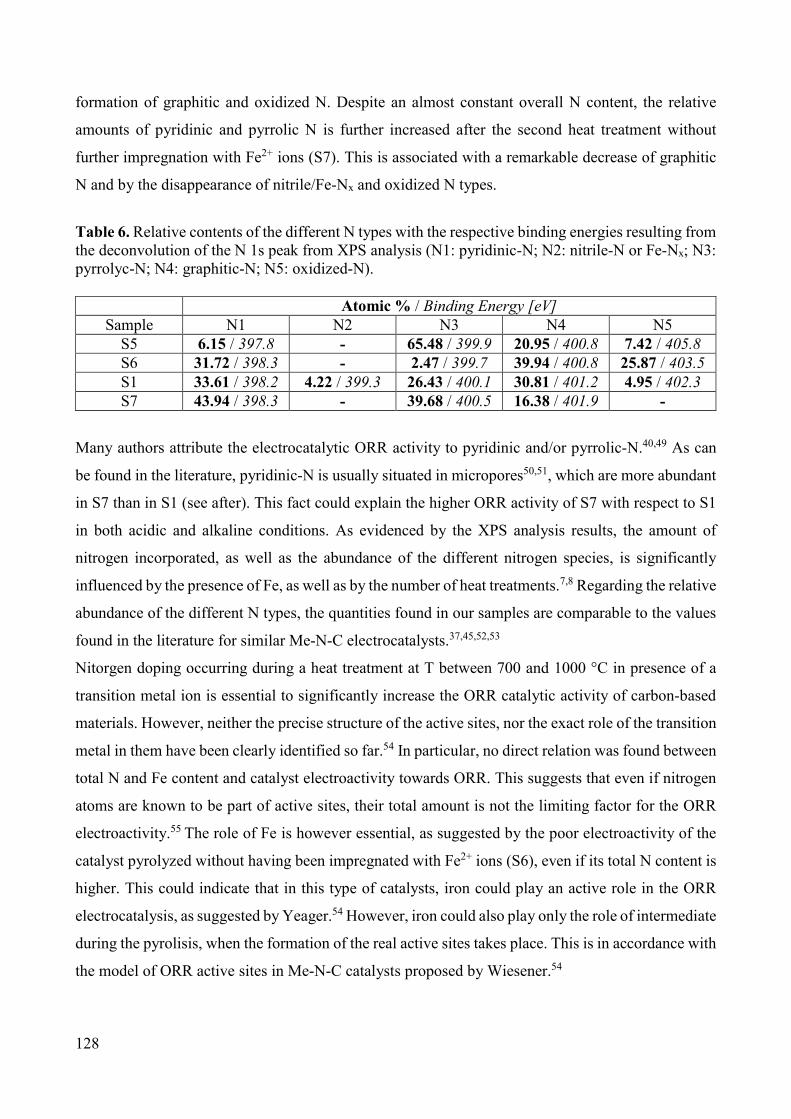
128
formation of graphitic and oxidized N. Despite an almost constant overall N content, the relative
amounts of pyridinic and pyrrolic N is further increased after the second heat treatment without
further impregnation with Fe2+ ions (S7). This is associated with a remarkable decrease of graphitic
N and by the disappearance of nitrile/Fe-Nx and oxidized N types.
Table 6. Relative contents of the different N types with the respective binding energies resulting from the deconvolution of the N 1s peak from XPS analysis (N1: pyridinic-N; N2: nitrile-N or Fe-Nx; N3: pyrrolyc-N; N4: graphitic-N; N5: oxidized-N). Atomic % / Binding Energy [eV]
Sample N1 N2 N3 N4 N5 S5 6.15 / 397.8 - 65.48 / 399.9 20.95 / 400.8 7.42 / 405.8
S6 31.72 / 398.3 - 2.47 / 399.7 39.94 / 400.8 25.87 / 403.5
S1 33.61 / 398.2 4.22 / 399.3 26.43 / 400.1 30.81 / 401.2 4.95 / 402.3
S7 43.94 / 398.3 - 39.68 / 400.5 16.38 / 401.9 -
Many authors attribute the electrocatalytic ORR activity to pyridinic and/or pyrrolic-N.40,49 As can
be found in the literature, pyridinic-N is usually situated in micropores50,51, which are more abundant
in S7 than in S1 (see after). This fact could explain the higher ORR activity of S7 with respect to S1
in both acidic and alkaline conditions. As evidenced by the XPS analysis results, the amount of
nitrogen incorporated, as well as the abundance of the different nitrogen species, is significantly
influenced by the presence of Fe, as well as by the number of heat treatments.7,8 Regarding the relative
abundance of the different N types, the quantities found in our samples are comparable to the values
found in the literature for similar Me-N-C electrocatalysts.37,45,52,53
Nitorgen doping occurring during a heat treatment at T between 700 and 1000 °C in presence of a
transition metal ion is essential to significantly increase the ORR catalytic activity of carbon-based
materials. However, neither the precise structure of the active sites, nor the exact role of the transition
metal in them have been clearly identified so far.54 In particular, no direct relation was found between
total N and Fe content and catalyst electroactivity towards ORR. This suggests that even if nitrogen
atoms are known to be part of active sites, their total amount is not the limiting factor for the ORR
electroactivity.55 The role of Fe is however essential, as suggested by the poor electroactivity of the
catalyst pyrolyzed without having been impregnated with Fe2+ ions (S6), even if its total N content is
higher. This could indicate that in this type of catalysts, iron could play an active role in the ORR
electrocatalysis, as suggested by Yeager.54 However, iron could also play only the role of intermediate
during the pyrolisis, when the formation of the real active sites takes place. This is in accordance with
the model of ORR active sites in Me-N-C catalysts proposed by Wiesener.54
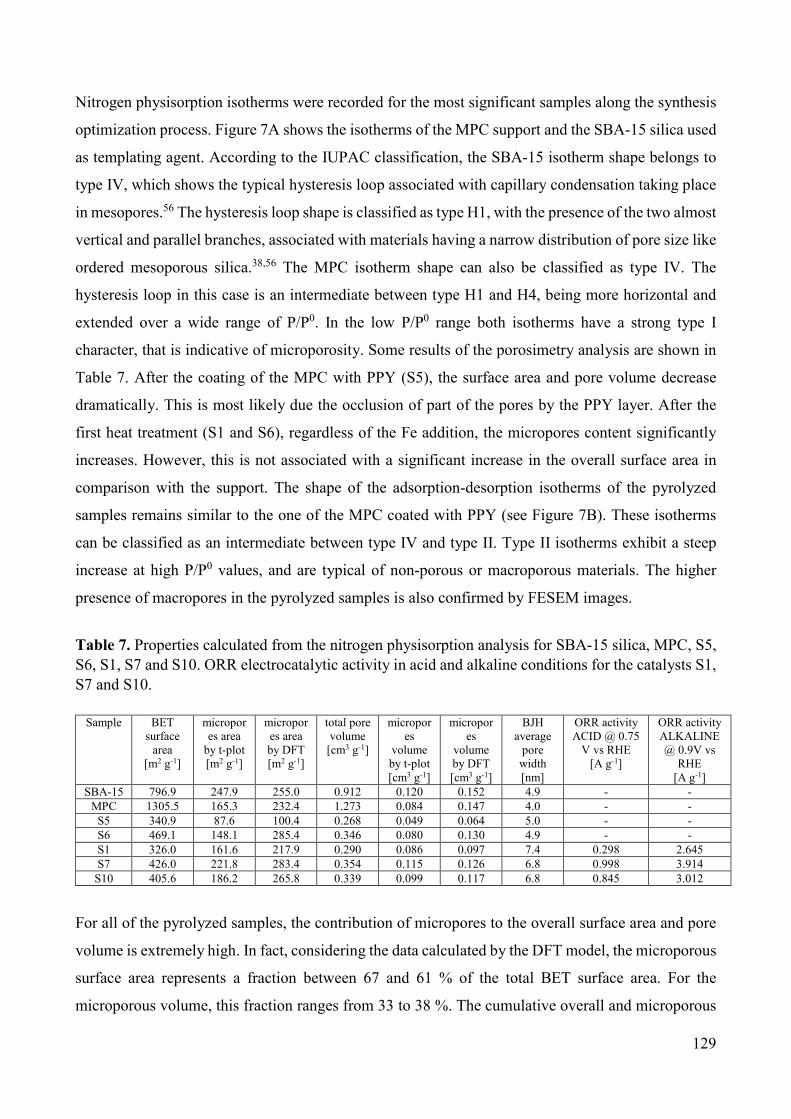
129
Nitrogen physisorption isotherms were recorded for the most significant samples along the synthesis
optimization process. Figure 7A shows the isotherms of the MPC support and the SBA-15 silica used
as templating agent. According to the IUPAC classification, the SBA-15 isotherm shape belongs to
type IV, which shows the typical hysteresis loop associated with capillary condensation taking place
in mesopores.56 The hysteresis loop shape is classified as type H1, with the presence of the two almost
vertical and parallel branches, associated with materials having a narrow distribution of pore size like
ordered mesoporous silica.38,56 The MPC isotherm shape can also be classified as type IV. The
hysteresis loop in this case is an intermediate between type H1 and H4, being more horizontal and
extended over a wide range of P/P0. In the low P/P0 range both isotherms have a strong type I
character, that is indicative of microporosity. Some results of the porosimetry analysis are shown in
Table 7. After the coating of the MPC with PPY (S5), the surface area and pore volume decrease
dramatically. This is most likely due the occlusion of part of the pores by the PPY layer. After the
first heat treatment (S1 and S6), regardless of the Fe addition, the micropores content significantly
increases. However, this is not associated with a significant increase in the overall surface area in
comparison with the support. The shape of the adsorption-desorption isotherms of the pyrolyzed
samples remains similar to the one of the MPC coated with PPY (see Figure 7B). These isotherms
can be classified as an intermediate between type IV and type II. Type II isotherms exhibit a steep
increase at high P/P0 values, and are typical of non-porous or macroporous materials. The higher
presence of macropores in the pyrolyzed samples is also confirmed by FESEM images.
Table 7. Properties calculated from the nitrogen physisorption analysis for SBA-15 silica, MPC, S5, S6, S1, S7 and S10. ORR electrocatalytic activity in acid and alkaline conditions for the catalysts S1, S7 and S10.
Sample BET surface
area [m2 g-1]
micropores area
by t-plot [m2 g-1]
micropores area by DFT [m2 g-1]
total pore volume
[cm3 g-1]
micropores
volume by t-plot [cm3 g-1]
micropores
volume by DFT [cm3 g-1]
BJH average
pore width [nm]
ORR activity ACID @ 0.75
V vs RHE [A g-1]
ORR activity ALKALINE @ 0.9V vs
RHE [A g-1]
SBA-15 796.9 247.9 255.0 0.912 0.120 0.152 4.9 - - MPC 1305.5 165.3 232.4 1.273 0.084 0.147 4.0 - -
S5 340.9 87.6 100.4 0.268 0.049 0.064 5.0 - - S6 469.1 148.1 285.4 0.346 0.080 0.130 4.9 - - S1 326.0 161.6 217.9 0.290 0.086 0.097 7.4 0.298 2.645 S7 426.0 221.8 283.4 0.354 0.115 0.126 6.8 0.998 3.914
S10 405.6 186.2 265.8 0.339 0.099 0.117 6.8 0.845 3.012
For all of the pyrolyzed samples, the contribution of micropores to the overall surface area and pore
volume is extremely high. In fact, considering the data calculated by the DFT model, the microporous
surface area represents a fraction between 67 and 61 % of the total BET surface area. For the
microporous volume, this fraction ranges from 33 to 38 %. The cumulative overall and microporous

130
pore volume vs. pore size distribution calculated by the DFT model are shown in Figure 7C and 7D,
respectively. The high microporosity of these materials is confirmed by the strong type I isotherm
character at low P/P0 range (see Figure 7B). The hysteresis loops do not exhibit any limiting
adsorption at high P/P0 values. Therefore, they can be classified as type H3 hysteresis. This is usually
associated with aggregates of plate-like particles giving rise to slit-shaped pores, typical characteristic
of graphene-like platelets40,41,46,57, as confirmed also by the results of TEM analysis.
Furthermore, it is evident that performing the second heat treatment leads to increase both overall and
micropores surface area and volume. The formation of a microporous structure during the heat
treatment is favorable to host the active sites for ORR, as mentioned in several literature works.5,50,55
In particular, an interesting correlation must be pointed out between the overall and microporous
surface area (and volume) and the ORR electroactivities of these Fe-N-C catalysts in both acidic and
alkaline conditions (Table 7). The ORR electroactivity increases with the total and microporous
surface area and volume, and the second pyrolysis causes an increase of both these factors. Analogous
results were found by Jaouen et al. for different types of Me-N-C (Me = Fe, Co, Cu) electrocatalyst
for ORR in acidic conditions. They found a direct correlation between the surface area of pores with
diameter lower than 2 nm and the ORR activity in RDE.55 Similarly to our results, there was not any
relations between catalysts electroactivity and total N content. Moreover, there was a direct
correlation between the bulk Fe content and the ORR electroactivity only up to a maximum Fe content
of 0.1 wt. %.58 This quantity is considerably lower than the Fe amount employed in the second
optimization step of our synthesis procedure. This fact could confirm the uselessness of performing
a further impregnation with Fe2+ ions before the second heat treatment.

131
Figure 7. (A) Nitrogen adsorption/desorption isotherms of SBA-15 silica, MPC and MPCf coated with PPY (S5). (B) Nitrogen adsorption/desorption isotherms of some of the pyrolyzed samples (S6, S1, S7 and S10). (C) Cumulative total pore volume vs. pore size by DFT model. (D) Cumulative pore volume vs. pore size restricted to the microporous zone.
4. Conclusions An optimization in two parts has been performed on the synthesis method of a Fe-N-C electrocatalyst
for ORR using polypyrrole as N source, MPC as C support and Fe(II) acetate as Fe2+ ions source. In
the first part, the addition of a N-containing surfactant (PVP) during the wet impregnation with Fe(II)
ions, and the pyrolysis of the MPC support coated with PPY before the impregnation were
investigated. These two synthesis parameters were found to not be useful to get an ORR activity
improvement in both acid and alkaline conditions. In the second part, the effect of a second pyrolysis
at 800°C in inert atmosphere was evaluated, together with the effect of the impregnation with more
Fe in different quantities. The second heat treatment was found to be beneficial for the catalyst ORR
activity. Otherwise, the addition of further Fe(II) before the second pyrolysis was found to be not
necessary. In fact, the catalyst pyrolyzed twice without any further Fe addition was the most active
one under both acidic and alkaline medium. The catalysts morphology, physical properties and

132
chemical composition were characterized by many instrumental methods. In particular, the formation
of an interesting structure containing carbon nanotubes-like and graphene-like structures in the heat-
treated catalysts was detected. The presence of Fe-containing structures was also detected in the form
of nanoparticles. The nitrogen fixation on the carbonaceous support under different binding types was
also revealed by XPS analysis. The total N and Fe contents, were not found to be the limiting factor
for the ORR activity in this type of catalysts. However, the ORR activity seems to be related to the
relative amounts of both pyridinc and pyrrolic nitrogen, which are more abundant after the second
pyrolysis. The results of the nitrogen physisorption and porosimetry analysis evidenced that the first
heat treatment significantly increases the micropores content. Performing a second heat treatment
causes an increase of both total and micropores surface area and volume. All of the pyrolyzed samples
exhibit a very high amount of microporous surface area (between 50 and 65% of the total surface
area). The increase of the microporosity in these Fe-N-C catalysts is in strict relation with the increase
in ORR electrocatalytic activity.
References (1) Specchia, S.; Francia, C.; Spinelli, P. In: Electrochemical Technologies for Energy Storage and Conversion; Zhang, J.; Zhang, L.; Liu, H.; Sun, A.; Liu, R. S., Eds.; Wiley-VCH: Weinheim, 2011; Chapter 13, pp 601–670. (2) Trogadas, P.; Fuller, T. S.; Strasser, P. Carbon as Catalyst and Support for Electrochemical Energy Conversion. Carbon 2014, 75, 5–42. (3) Othman, R.; Dicks, A. L.; Zhu, Z. Non Precious Metal Catalysts for the PEM Fuel Cell Cathode. Int. J. Hydrogen Energy 2012, 37, 357–372. (4) Kiros, Y. Metal Porphyrins for Oxygen Reduction in PEMFC. Int. J. Electrochem. Sci. 2007, 2, 285–300. (5) Chen, Z.; Higgins, D.; Yu, A.; Zhang, L.; Zhang, J. A Review on Non-Precious Metal Electrocatalysts for PEM Fuel Cells. Energy Environ. Sci. 2011, 4, 3167–3192. (6) Jaouen, F.; Proietti, E.; Lefèvre, M.; Chenitz, R.; Dodelet, J.; Wu, G.; Chung, H. T.; Johnston, C. M.; Zelenay, P. Recent Advances in Non-Precious Metal Catalysis for Oxygen-Reduction Reaction in Polymer Electrolyte Fuel Cells. Energy Environ. Sci. 2011, 4, 114–130. (7) Ferrandon, M.; Kropf, A. J.; Myers, D. J.; Kramm, U.; Bogdanoff, P.; Wu, G.; Johnston, C. M.; Zelenay, P.; Multitechnique Characterization of a Polyaniline–Iron–Carbon Oxygen Reduction Catalyst. J. Phys. Chem. C 2012, 116, 16001−16013. (8) Osmieri, L.; Monteverde Videla, A. H. A.; Specchia, S. Activity of Co–N Multi Walled Carbon Nanotubes Electrocatalysts for Oxygen Reduction Reaction in Acid Conditions. J. Power Sources 2015, 278, 296–307. (9) Schilling, T.; Bron, M. Oxygen Reduction at Fe–N-Modified Multi-Walled Carbon Nanotubes in Acidic Electrolyte. Electrochim. Acta 2008, 53, 5379–5385. (10) Jaouen, F.; Lindbergh, G.; Sundholmb, G.; Investigation of Mass-Transport Limitations in the Solid Polymer Fuel Cell Cathode - I. Mathematical model. J. Electrochem. Soc. 2002, 149, A437–A447.

133
(11) Zhang, B.; Xu, Y.; Zheng, Y.; Dai, L.; Zhang, M.; Yang, J.; Chen, Y.; Chen, X.; Zhou, J. A Facile Synthesis of Polypyrrole/Carbon Nanotube Composites with Ultrathin, Uniform and Thickness-Tunable Polypyrrole Shells. Nanoscale Res. Lett. 2011, 6, 431–439. (12) Shrestha, S.; Mustain, W. E. Properties of Nitrogen-Functionalized Ordered Mesoporous Carbon Prepared Using Polypyrrole Precursor. J. Electrochem. Soc. 2010, 11, B1665–B1672. (13) Vinu, A.; Anandan, S.; Anand, C.; Srinivasu, P.; Ariga, K.; Mori, T. Fabrication of Partially Graphitic Three-Dimensional Nitrogen-Doped Mesoporous Carbon Using Polyaniline Nanocomposite Through Nanotemplating Method. Microp. Mesop. Mater. 2008, 109, 398–404. (14) Khomenko, V. G.; Barsukov, V. Z.; Katashinskii, A. S. The Catalytic Activity of Conducting Polymers Toward Oxygen Reduction. Electrochim. Acta 2005, 50, 1675–1683. (15) Rita Sulub, S.; Martínez-Millán, W.; Smit, M. A. Study of the Catalytic Activity for Oxygen Reduction of Polythiophene Modified with Cobalt or Nickel. Int. J. Electrochem. Sci. 2009, 4, 1015–1027. (16) Martínez-Millán, W.; Smit, M. A. Study of Electrocatalysts for Oxygen Reduction Based on Electroconducting Polymer and Nickel. J. Appl. Polym. Sci. 2009, 112, 2959–2967. (17) Wu, G.; More, K. L.; Johnston, C. M.; Zelenay, P. High-Performance Electrocatalysts for Oxygen Reduction Derived from Polyaniline, Iron, and Cobalt. Science 2011, 332, 443–447. (18) Nguyen-Thanh, D.; Frenkel, A. I.; Wang, J.; O’Brien, S.; Akins, D. L.; Cobalt–Polypyrrole–Carbon Black (Co–PPY–CB) Electrocatalysts for the Oxygen Reduction Reaction (ORR) in Fuel Cells: Composition and Kinetic Activity. Appl. Catal., B 2011, 105, 50–60. (19) Oh, H. S.; Oh, J. G.; Roh, B.; Hwang, I.; Kim, H. Development of Highly Active and Stable Non-Precious Oxygen Reduction Catalysts for PEM Fuel Cells Using Polypyrrole and a Chelating Agent. Electrochem. Commun. 2011, 13, 879–881. (20) Jung, J. W.; Kim, C. Y.; Jung, G. E.; Shim, K. B.; Jeong, S. H.; Yi, S. Study of the Factors Influencing the Immobilization of Platinum Nanoparticles on Multi-Walled Carbon Nanotubes by a Polyol Process. J. Ceramic Processing Res. 2011, 12, 96–101. (21) Alipour Moghadam Esfahani, R.; Monteverde Videla, A. H. A.; Vankova, S.; Specchia, S.; Stable and Methanol Tolerant Pt/TiOx-C Electrocatalysts for the Oxygen Reduction Reaction. Int. J. Hydrogen Energy 2015, DOI: 10.1016/j.ijhydene.2015.05.131. (22) Long, N. V.; Hien, T. D.; Asak, T.; Ohtaki, M.; Nogami, M. Synthesis and Characterization of Pt–Pd alloy and Core-Shell Bimetallic Nanoparticles for Direct Methanol Fuel Cells (DMFCs): Enhanced Electrocatalytic Properties of Well-Shaped Core-Shell Morphologies and Nanostructures. Int. J. Hydrogen Energy 2011, 36, 8478–8491. (23) Zeng, J.; Francia, C.; Dumitrescu, M. A.; Monteverde Videla, A. H. A.; Ijeri, V. S.; Specchia, S.; Spinelli, P.; Electrochemical Performance of Pt-based Catalysts Supported on Different Ordered Mesoporous Carbons (Pt/OMCs) for Oxygen Reduction Reaction, Ind. & Eng. Chem. Res. 2012, 51, 7500–7509. (24) Sha, H. D.; Yuan, X.; Hu, X. X.; Lin, H.; Wen, W.; Ma, Z. F. Effects of Pyrrole Polymerizing Oxidant on the Properties of Pyrolysed Carbon-Supported Cobalt-Polypyrrole as Electrocatalysts for Oxygen Reduction Reaction. J. Electrochem. Soc. 2013, 160, F507–F513. (25) Hyun, K.; Lee, J. H.; Yoon, C. W.; Cho, Y. H.; Kim, L. H.; Kwon, Y. Improvement in Oxygen Reduction Activity of Polypyrrole-Coated PtNi Alloy Catalyst Prepared for Proton Exchange Membrane Fuel Cells. Synth. Met. 2014, 190, 48–55. (26) Muthukrishnan, A.; Nabae, Y.; Hayakawa, T; Okajima, T.; Ohsaka, T. Fe-Containing Polyimide-Based High-Performance ORR Catalysts in acidic medium: a kinetic approach to study the durability of Catalysts. Catal. Sci. & Tech. 2015, 5, 457–483. (27) Garsany, Y.; Ge, J.; St-Pierre, J.; Rocheleau, R.; Swider-Lyons, K. E. Analytical Procedure for Accurate Comparison of Rotating Disk Electrode Results for the Oxygen Reduction Activity of Pt/C. J. Electrochem. Soc. 2014, 161, F628–F640.

134
(28) van der Vliet, D.; Strmcnik, D. S.; Wang, C.; Stamenkovic, V. R.; Markovic, N. M.; Koper, M. T. M. On the Importance of Correcting for the Uncompensated Ohmic Resistance in Model Experiments of the Oxygen Reduction Reaction. J. Electroanal. Chem. 2010, 647, 29–34. (29) Paulus, U. A.; Schmidt, T. J.; Gasteiger, H. A.; Behm, R. J. Oxygen Reduction on a High-Surface Area Pt/Vulcan Carbon Catalyst: a Thin-Film Rotating Ring-Disk Electrode Study. J. Electroanal. Chem. 2001, 495, 134–145. (30) Martínez M., W.; Toledano Thompson, T.; Smit, M. A. Characterization and Electrocatalytic Activity of Carbon-Supported Polypyrrole-Cobalt-Platinum Compounds. Int. J. Electrochem. Sci. 2010, 5, 931–943. (31) Frackowiak, E.; Béguin, F. Carbon Materials for the Electrochemical Storage of Energy in Capacitors. Carbon 2001, 39, 937–950. (32) Gojkovic, S. L.; Gupta, S.; Savinell, R. F. Heat-Treated Iron(III) Tetramethoxyphenyl Porphyrin Chloride Supported on High-Area Carbon as an Electrocatalyst for Oxygen Reduction Part II. Kinetics of Oxygen Reduction. J. Electroanal. Chem. 1999, 462, 63–72. (33) Ramaswamy, N.; Mukerjee, S. Fundamental Mechanistic Understanding of Electrocatalysis of Oxygen Reduction on Pt and Non-Pt Surfaces: Acid versus Alkaline Media. Adv. Phys. Chem. 2012, DOI: 10.1155/2012/491604. (34) Kim, W. Y.; Hayashi, H.; Kishida, M.; Nagata, H.; Wakabayashi. K. Methanol Synthesis from Syngas over Supported Palladium Catalysts Prepared Using Water-in-Oil Microemulsion. Appl. Catal., A 1998, 169, 157–164. (35) Esmaeilifar, A.; Rowshanzamir, S.; Eikani, M. H.; Ghazanfari, E. Synthesis Methods of Low-Pt-Loading Electrocatalysts for Proton Exchange Membrane Fuel Cell Systems. Energy 2010, 35, 3941–3957. (36) Stassi, A.; D’Urso, C.; Baglio, V.; Di Blasi, A.; Antonucci, V.; Aricò, A. S.; Castro Luna , A. M.; Bonesi, A.; Triaca, W. E. Electrocatalytic Behaviour for Oxygen Reduction Reaction of Small Nanostructured Crystalline Bimetallic Pt–M Supported Catalysts. J. Appl. Electrochem. 2006, 36, 1143–1149. (37) Monteverde Videla, A. H. A.; Zhang, L.; Kim, J.; Zeng, J.; Francia, C.; Zhang, J.; Specchia, S. Mesoporous Carbons Supported Non-Noble Metal Fe–NX Electrocatalysts for PEM Fuel Cell Oxygen Reduction Reaction. J. Appl. Electrochem. 2013, 43, 159–169. (38) Zhao, D.; Feng, J.; Huo, Q.; Melosh, N.; Fredrickson, G. H.; Chmelka, B. F.; Stucky, G. D. Triblock Copolymer Syntheses of Mesoporous Silica with Periodic 50 to 300 Angstrom Pores. Science 1998, 279, 548–552. (39) Xu, J.; Zhao, Y.; Shen, C.; Guan, L. Sulfur- and Nitrogen-Doped, Ferrocene-Derived Mesoporous Carbons with Efficient Electrochemical Reduction of Oxygen. ACS Appl. Mater. Interfaces 2013, 5, 12594–12601. (40) Monteverde Videla, A. H. A.; Ban, S.; Specchia, S.; Zhang, L.; Zhang, J. Non-Noble Fe–NX Electrocatalysts Supported on the Reduced Graphene Oxide for Oxygen Reduction Reaction. Carbon 2014, 76, 386–400. (41) Wei, W.; Tao, Y.; Lv, W.; Su, F. Y.; Ke, L.; Li, J.; Wang, D. W.; Li, B.; Kang, F.; Yang, Q. H. Unusual High Oxygen Reduction Performance in All-Carbon Electrocatalysts. Sci. Rep. 2014, 4, 1–7. (42) Bezerra, C. W. B.; Zhang, L.; Lee, K.; Liu, H.; Zhang, J.; Shi, Z.; Marques, A. L. B.; Marques, E. P.; Wu, S.; Zhang, J. Novel Carbon-Supported Fe–N Electrocatalysts Synthesized Through Heat Treatment of Iron Tripyridyl Triazine Complexes for the PEM Fuel Cell Oxygen Reduction Reaction. Electrochim. Acta 2008, 53, 7703–7710. (43) Fu, Y.; Su, Y. S.; Manthiram, A. Sulfur-Polypyrrole Composite Cathodes for Lithium-Sulfur Batteries. J. Electrochem. Soc. 2012, 159, A1420–A1424. (44) Stuart, B. Infrared Spectroscopy: Fundamentals and Applications; John Wiley & Sons, 2004; pp 74–75.
135
(45) Monteverde Videla, A. H. A.; Osmieri, L.; Armandi, M.; Specchia, S.; Varying the Morphology of Fe-N-C Electrocatalysts by Templating Iron Phthalocyanine Precursor with Different Porous SiO2 to Promote the Oxygen Reduction Reaction. Electrochim. Acta 2015, DOI: 10.1016/j.electacta.2015.01.165 (46) Zheng, F.; Yang, Y.; Chen, Q. High Lithium Anodic Performance of Highly Nitrogen-Doped Porous Carbon Prepared from a Metal-Organic Framework. Nat. Comm. 2014, 5, 5261–5270. (47) Wang, M. Q.; Yang, W. H.; Wang, H. H.; Chen, C.; Zhou, Z. Y.; Sun, S. G. Pyrolyzed Fe–N–C Composite as an Efficient Non-Precious Metal Catalyst for Oxygen Reduction Reaction in Acidic Medium. ACS Catal. 2014, 4, 3928–3936. (48) Byon, H. R.; Suntivich, J.; Shao-Horn, Y. Graphene-Based Non-Noble-Metal Catalysts for Oxygen Reduction Reaction in Acid. Chem. Mater. 2011, 23, 3421–3428. (49) Matter, P. H.; Zhang, L.; Ozkan, U. S. The Role of Nanostructure in Nitrogen-Containing Carbon Catalysts for the Oxygen Reduction Reaction. J. Catal. 2006, 239, 83–96. (50) Lefèvre, M.; Proietti, E.; Jaouen, F.; Dodelet, J. Iron-Based Catalysts with Improved Oxygen Reduction Activity in Polymer Electrolyte Fuel Cells. Science 2009, 324, 71–74. (51) Jaouen, F.; Lefèvre, E.; Dodelet, J.; Cai, M. Heat-Treated Fe/N/C Catalysts for O2 Electroreduction: Are Active Sites Hosted in Micropores?. J. Phys. Chem. B 2006, 110, 5553–5558. (52) Lee, K.; Zhang, L.; Lui, H.; Shi, Z.; Zhang, J. Oxygen Reduction Reaction (ORR) Catalyzed by Carbon-Supported Cobalt Polypyrrole (Co-PPy/C) Electrocatalysts. Electrochim.Acta 2009, 54, 4704–4711. (53) Peng, H.; Mo, Z.; Liao, S.; Liang, H.; Yang, L.; Luo, F.; Song, H.; Zhong, Y.; Zhang, B. High Performance Fe- and N- Doped Carbon Catalyst with Graphene Structure for Oxygen Reduction. Sci. Rep. 2013, 3, 1–7. (54) Dodelet, J.-P. In: Electrocatalysis in Fuel Cells; Shao, M., Ed.; Springer-Verlag: London, 2013; Chapter 10, pp 271–338. (55) Jaouen, F.; Herranz, J.; Lefèvre, M; Dodelet, J.-P.; Kramm, U. I.; Herrmann, I.; Bogdanoff, P.; Maruyama, J.; Nagaoka, T.; Garsuch, A.; Dahn, J. R.; Olson, T.; Pylypenko, S.; Atanassov, P.; Ustinov, E. A. Cross-Laboratory Experimental Study of Non-Noble-Metal Electrocatalysts for the Oxygen Reduction Reaction. ACS Appl. Mater. Interfaces 2009, 1, 1623–1639. (56) Sing, K. S. W.; Everett, D. H.; Haul, R. A. W.; Moscou, L.; Pierotti, R. A.; Rouquérol, J.; Siemieniewska, T. Reporting Physisorption Data for Gas/Solid Systems with Special Reference to the Determination of Surface Area and Porosity. Pure & Appl. Chem. 1985, 57, 603–619. (57) Kaniyoor, A.; Baby, T. T.; Arockiadoss, T.; Rajalakshmi, N.; Ramaprabhu, S. Wrinkled Graphenes: A Study on the Effects of Synthesis Parameters on Exfoliation-Reduction of Graphite Oxide. J. Phys. Chem. C 2011, 115, 17660–17669. (58) Jaouen, F.; Dodelet, J.-P. Average Turn-Over Frequency of O2 Electro-Reduction for Fe/N/C and Co/N/C Catalysts in PEFCs. Electrochim. Acta 2007, 52, 5975–5984.

136
Supporting Information
Figure S1. FESEM pictures at different magnifications of SBA-15 silica used for the synthesis.

137
Figure S2. FESEM pictures at different magnifications of MPC (A-B), MPCf (C-D) and MPC-PPY (E-F).

138
Figure S3. FESEM pictures at different magnifications of the catalysts S1 (A-B) and S7 (C-D).
Figure S4. XPS survey spectra of S5 (A), S6 (B), S1 (C) and S7 (D).
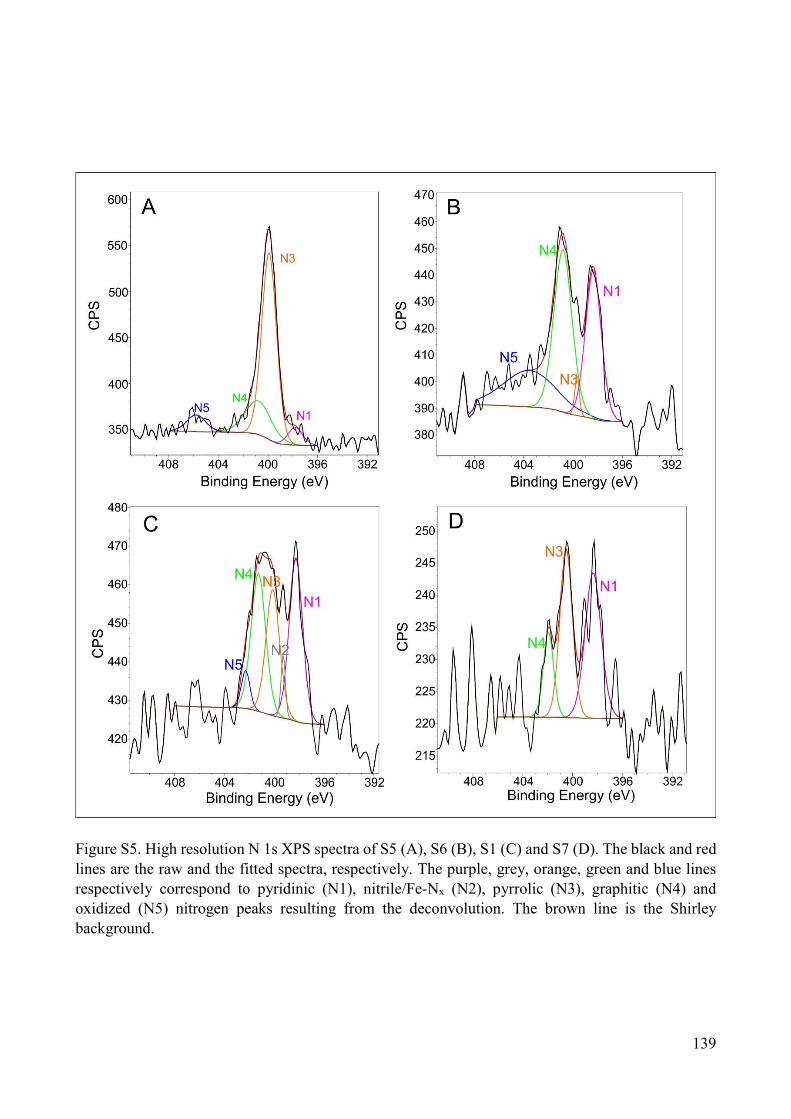
139
Figure S5. High resolution N 1s XPS spectra of S5 (A), S6 (B), S1 (C) and S7 (D). The black and red
lines are the raw and the fitted spectra, respectively. The purple, grey, orange, green and blue lines respectively correspond to pyridinic (N1), nitrile/Fe-Nx (N2), pyrrolic (N3), graphitic (N4) and oxidized (N5) nitrogen peaks resulting from the deconvolution. The brown line is the Shirley background.

140
Figure S6. ORR comparison of the most performing catalyst synthesized in this work (S7) with a commercial Pt-based catalyst (20% Pt on Vulcan – Quintech) in acid (A) and alkaline (B) conditions. LSV recorded at 5 mV s-1 scan rate and with RDE rotation speed 900 rpm. For acid conditions the electrolyte was 0.5 M H2SO4 for our catalyst and 0.1 M HClO4 for Pt-based catalyst. For alkaline conditions the electrolyte was 0.1 KOH for both catalysts.

141
Figure S7. Scheme of the synthesis procedures for all of the different samples.

142

143
CHAPTER 5. Varying the morphology of Fe-N-C electrocatalysts by templating
Iron Phthalocyanine precursor with different porous SiO2 to promote the Oxygen
Reduction Reaction.
As published in Electrochimica Acta, 177 (2015) 43–50
DOI: 10.1016/j.electacta.2015.01.165
1. Introduction
Platinum is one of the most effective element used in polymer electrolyte membrane fuel cell
(PEMFC) catalysts due its unique electrocatalytic properties (low binding energy to O bond)
promoting the oxygen reduction reaction (ORR) and oxidation of alcohols [1]. Unfortunately, its high
cost for the preparation of cathodic ORR electrocatalysts makes PEMFC commercialization very
difficult. It is proved that almost the 55% of the total cost of PEMFC is directly related to the catalyst-
based electrode components [2,3]. One of the possible solutions to reduce the catalyst cost, is the use
of non-noble electrocatalysts, such as transition metals chelates and macro cyclic complexes [4].
Typically catalysts such as Iron (III) tetra(pentafluorophenyl) (FeTPFPP), cobalt fluoro-
phthalocyanine (CoHFPC), cobalt tetramethoxyphenylporphyrin (CoTMPP) and non-noble
chalcogenide ORR electrocatalysts have been used during the last years because of their good
electroactivity, but they are still far away from the performance of Pt-based catalysts [5–7]. One of
the big challenge of non-noble catalyst is to determine the nature of the active sites as well as the
mechanism how O=O bridge is broken, making difficult to achieve rational design of M-N-C
144
electrocatalysts for ORR [8]. Apart from the advanced research in this field, from several hundred
millions of years nature performs the ORR process in a simple and elegant way, i.e., in green plants
enzymes metabolizing oxygen [9]. Another natural process is the transport of dioxygen into human
bodies through cytochrome C oxidase (CcO) reaction cycle, where a heme-Fe/O2 and heme-Cu/O2
couple (a mixture of FeII-tetrakis(2,6-diflurorophenyl)porphyrinate with CuI-N,N-bis2-[2-(N′,N′-4-
dimethylamino)pyridyl]ethylmethylamine) reduces oxygen without peroxide production, located in
the terminal oxidase of cellular respiration system [10]. This biological system presents a complex
interaction, where five coordinated metal structures with an axial ligand from the back site are
combined together. Several bio-inspired electrocatalysts for ORR have been studied including
copper/heme-binuclear CcO model [11], multicopper complexes [12] and iron phthalocyanines
[9,13]. In the case of the most used Pt-based electrocatalysts oxygen is reduced by breaking dioxygen
(O=O bond, 498 kJ mol–1) by a “bridge cis” mechanism having 4 electron pathway and low
overpotential [14].
Typically, electrocatalysts are produced by mixing an external carbon source, which acts as
support, with a precursor of the active sites. Mesoporous carbons, carbons nano-network or nano-
tubes, or carbon xerogels can be used as support [15–18]. The precursor could be either a
macromolecule containing N, Fe and C, or a simple gaseous molecule as ammonia [19]. The use of
an external carbon source implies that this carbon must undergo to a graphitization process, which
proceeds in parallel with the graphitization of the carbon belonging to the Fe-N precursor. The
different nature of the two types of carbon could have an influence on the overall graphitization
process during the pyrolysis step, producing different morphological carbons. The morphology could
negatively affects the electro-activity by reducing the accessibility of oxygen to the reactive sites
during the ORR [20].
In this work, the use a non-noble metal catalyst based on a rich iron-nitrogen molecule, the iron
phthalocyanine (FePc: C32H16FeN8), containing a Fe–N bridge, is used for the preparation of active
electrocatalysts for ORR. The influence of the temperature and the morphology are studied to obtain
a uniform structure able to increase the electroactivity and to reduce the peroxide production during
the ORR. Considering the highly carbon content of the FePc molecule, the electrocatalysts are
prepared without using any other external carbonaceous support to preserve their homogeneity and
favor an homogeneous graphitization during the thermal treatment [21,22]. Here the morphology of
the electrocatalysts is varied by means of different mesoporous silica templating agents to evaluate
the effects on the porosity, electrocatalytic activity and stability [23].

145
2. Experimental part
2.1. Chemicals
Iron Phthalocyanine C32H16FeN8 (FePc), mesoporous Silica (mSiO2), Isopropanol with 99.5 wt.
%, Hydrofluoric acid 48 wt. %, Hydrochloric acid 37 wt. %. Sulphuric acid with 97 wt. %, Nafion®
solution containing 5 wt. % Nafion®, tetraethyl orthosilicate 98% and Pluronic® P123 were
purchased from Sigma Aldrich. Nitrogen and Oxygen gases were supply in cylinders by SIAD with
99.999% purity. All aqueous solutions were prepared using ultrapure water obtained from a Millipore
Milli-Q system with resistivity >18 mΩ cm–1.
2.2. Electrocatalysts synthesis
2.2.1. Synthesis of based Fe-N electrocatalysts
FePc was thermal treated in an inert atmosphere (N2) using a tubular quartz reactor. Different
samples were prepared by varying the temperature from 600 to 900 °C. The desired temperature was
reached with a heating rate of 2.5 °C min–1, and maintained constant for 2 h. Then the furnace was
switched-off and left cooling down naturally at room temperature. After the pyrolysis process, the
catalysts prepared were acid washed with 1 M HCl under reflux at 80 °C for 3 h.
2.2.2. Synthesis of silica template
Porous silica (SBA 15) was synthesized as described by Zeng et al. [24]. Typically, Pluronic®
P123, deionized (DI) water, and HCl were added to an aqueous solution, and the mixture was stirred
at 35 °C. After P123 was completely dissolved, tetraethyl orthosilicate was added and the solution
was stirred for 24 h. The solution was heated at 150 °C for 24 h. The resulting white-colored
precipitate was filtered and washed twice with DI water, and then dried in an oven at 60 °C for 24 h.
Finally, the dried sample was calcined at 550 °C for 5 h in calm air.
2.2.3. Synthesis of modified Fe-N-C electrocatalysts
Commercial mesoporous Silica (mSiO2) and SBA 15 in house prepared were used as template for
altering the structure of basic Fe-N-C electrocatalysts. Silicon oxides were used in a 30 wt. % respect
to the FePc, followed by a mixing process by with a mixer apparatus (Retsch Mixer Mill MM 200)
for 1 h at 10 Hz. The precursors were thermal treated under the same conditions of basic Fe-N-C
electrocatalysts, using a fixed temperature of 850 °C for 2 h. After pyrolysis, the powders were
grounded and leached with 5 wt. % HF in order to remove the templating agent. A second acid
treatment was conducted at 80 °C in 1 M HCl reflux bath in order to remove any other oxide and to
functionalize the electrocatalysts, as well.
146
2.3 Chemical-physical characterization of the electrocatalysts
Specific surface areas (SBET) were determined using the Brunauer-Emmet-Teller (BET) method
within the relative pressure range of 0.1–0.3 on an ASAP 2020 C Micromeritics Instrument. Nitrogen
adsorption isotherms were recorded at –196 °C within the relative pressure range of 0–1. Prior to
adsorption, samples were placed in the cell and evacuated at 130 °C for 3 h under high vacuum. Field-
emission scanning electron microscopy (FESEM JEOL-JSM-6700F instrument coupled with an
Energy Dispersive X-ray Spectrometry (EDS) Detector (OXFORD INCA) were performed to analyze
the morphology and EDS. Fourier transform infrared spectroscopy (FTIR) measurements were
performed on catalysts mechanically mixed with KBr and pressed. IR spectra were collected in air at
2 cm–1 resolution on a Bruker Equinox 55 FTIR spectrophotometer, equipped with a MCT (Mercury
Cadmium Telluride) detector.
X-ray photoelectron spectroscopy (XPS) was performed to determine the elemental surface
composition of the catalysts. The analysis was carried out using a Physical Electronics PHI 5000
Versa Probe electron spectrometer system with monochromated Al Kα X-ray source (1486.60 eV)
run at 15 kV and 1 mA anode current. The survey spectra were collected from 0 to 1200 eV. The
narrow N 1s spectra were collected from 396 to 405 eV, the narrow Fe 2p spectra from 700 to 740
eV, and the narrow C 1s spectra from 280 to 293 eV. All of the spectra were calibrated against a value
of the C 1s binding energy of 284.5 eV. Multipak 9.0 software was used for obtaining semi-
quantitative atomic percentage compositions, using Gauss-Lorentz equations with Shirley-type
background. A 70%/30% Gaussian/Lorentzian line shape was used to evaluate peaks position and
areas of the high resolution N 1s spectra.
2.4. Electrochemical characterization of the electrocatalysts
The electrochemical evaluation of the electrocatalysts prepared was carried out in a conventional
three-compartment electrochemical cell using a multi-potentiostat (Bio-Logic SP150), a
Bipotentiostat (CH760E), and a rotating ring disk electrode instrument (RRDE-3A ALS Model 2323).
The electrolyte was a 0.5 M H2SO4 aqueous solution saturated with either N2 or O2 by direct bubbling
the gas into the solution. For RDE measurements, the cell was equipped with a glassy carbon (GC)
disk working electrode (0.1256 cm2 geometric area), a Pt helical wire counter electrode, and a
saturated calomel (SCE) reference electrode. All of the electrode potentials were corrected and
referred to the reversible hydrogen electrode (RHE). Different GC disk electrodes were arranged by
preparing the ink using an ionomer-to-catalyst ITC mass ratio (mg of Nafion® over mg of catalyst)
equal to 0.2 and a catalyst quantity of 80 μg cm–2 [4]. The RDE rotation speed was set at 900 rpm.
For RRDE measurements, a Pt ring-Glassy Carbon (rGC) disk electrode was employed. The ring
147
potential was kept at 1.2 V and the disk potential was scanned at a rate of 5 mV s–1. The working
electrode was polished with 1 and 0.06 μm alumina powders to mirror-like finish its surface and
sonicated to remove alumina particles before each experiment. The ORR onset potential was defined
as a potential required for generating an ORR current density of 0.01 mA cm−2. The following
equation was used to calculate the percentage of hydrogen peroxide released during ORR:
% = /
(
) (1)
where ID [mA cm–2] is the Faradaic current at the disk, IR [mA cm–2] the Faradaic current at the
ring and N is the H2O2 collection coefficient at the ring (37%). The ORR kinetic current Ik was
calculated taking into account the mass transport by using the relationship established by the
Koutecky–Levich (K-L) theory:
=
() (2)
where Ik [mA cm–2] is the Faradic current, Ilim [mA cm–2] is the limiting current density, and I
[mA cm–2] is the current density measured.
The best catalyst was tested also in a cell equipped with a gas diffusion working electrode (GDE),
accessible to gaseous reactants. The GDE cell apparatus, fully described in Osmieri et al. [25], was
equipped with a saturated Ag/AgCl reference electrode and a Pt plate counter electrode. The GDE
working electrode geometric area was of 0.95 cm2. A 0.5 M H2SO4 aqueous solution was used as
electrolyte.
For the GDE preparation, small disks of 11 mm diameter of carbon cloth GDL (HT-ELAT from
E-TEK, USA) were coated with the catalyst ink with an ITC mass ratio equal to 0.2 by brush
deposition to obtain a catalyst loading of 2 mg cm–2, and referred to the geometrical area of the
working electrode. An electrochemical impedance spectroscopy measurement was taken at OCV to
quantify the resistance of the cell.
148
3. Results and discussion
3.1. Heat-treatment temperature optimization for the preparation of basic Fe-N-C catalyst.
To study the effect of temperature on the preparation of the catalysts, cyclic voltammograms (CV)
and linear sweep voltammetries (LSV) were employed.
Five different temperatures, 600, 700, 800, 850, and 900 °C, respectively, were selected and
evaluated with the RDE apparatus. The potentiodynamic responses in acid medium of basic Fe-N-C
electrocatalysts prepared at different temperatures (Fig. 1A) show that Fe-N-C catalysts pyrolyzed at
temperatures higher than 700 °C exhibit a pair of well-defined redox peaks in the range 0.64–0.68 V
in the anodic scan direction, and 0.55–0.60 V in the cathodic scan direction. The half-height width of
these peaks is 100 mV. This is the value expected for a quasi-reversible one-electron process
involving surface species [26,27]. The observed redox behavior can be ascribed to two different
possible surface processes. The first one is the reduction/oxidation of the surface quinone-
hydroquinone groups [28,29]. The second one is FeIII/FeII reduction/oxidation process [30]. As
mentioned in the literature, different factors could influence the capacitance of carbon materials: pore
geometry, pore size distribution, electrical conductivity, wettability, and presence of surface
electroactive species [31,32]. A clear increase in their capacity can be attributed to microporosity
formation and graphitization of the carbon framework due to the thermal treatment, as mentioned
even by other research groups [33,34]. Pseudo-capacitance effect of surface redox-sites must also be
considered. In fact, at the carbon surface, apart from the electrostatic double layer capacitance, a
significant pseudo-capacitance is often present. This can be due to both chemisorption phenomena
with partial charge transfer and redox processes [35].
Figure 1B shows the influence of the temperature on promoting the ORR. The pyrolysis treatment
at higher temperature improves the catalytic activity, resulted in more positive onset potential,
showing the maximum shift at 850 °C. For heat treatment temperatures lower than 800 °C, the ORR
activity is poor. Also for the sample heat-treated at 900 °C there is an important decrease in the
activity. This suggests that the heat-treatment temperature is an important parameter to be optimized
during the synthesis, existing a range between 700 and 900 °C where the optimum temperature is
situated [19].

149
Figure 1. Basic Fe-N-C electrocatalysts synthesised at different temperatures. (A) CV recorded at 10 mV s–1. (B) LSV recorded at 5 mV s–1. Rotational speed set at 900 rpm. Experimental conditions for both series of tests: 0.5 M H2SO4, 0.2 ITC mass ratio, 80 g cm–2 catalyst loading.
3.2 Optimization of Fe-N-C/850 catalyst through the use of porous silica.
Selected the best Fe-N-C/850 catalyst, the influence of an external agent to modify its morphology
was evaluated. Thus, new catalysts prepared by mixing FePc and the templating agents were prepared
and pyrolyzed at 850 °C. Nitrogen adsorption/desorption analysis was performed on the Fe-N-C/850
on the modified catalysts. The two different silica templates (SBA15 and mSiO2) were also analyzed
for comparison. The use of different porous silica as templating agent induces the formation of a
different porous structure in the catalyst after the heat treatment (Fig.2A and Table 1), that could lead
to increase the accessibility of the electrocatalyst.

150
Table 1. Surface characterization of F-N-C/850 catalysts and templating silica agents (n.d.: not detectable).
SBET [m2 g–1]
Micropore area [m2 g–1]
Pore volume [cm3 g–1]
Average pore size [nm]
F-N-C/850 102 2 0.2 9 F-N-C/850_SBA15 221 31 0.8 3 F-N-C/850_mSiO2 601 70 0.9 5 SBA15 806 157 1.3 4.5 mSiO2 1148 n.d. 0.9 4.4
According to the International Union of Pure and Applied Chemistry (IUPAC) classification [36], the
basic Fe-N-C/850 catalyst exhibits a Type II isotherm shape, with a very limited hysteresis loop. The
Fe-N-C/850_mSiO2 exhibits a Type IV isotherm shape due to the presence of a more pronounced
hysteresis loop. However, the limiting uptake at high p/p0 values is shorter compared to the shape of
the sole mSiO2 (isotherm assigned to Type IV, hysteresis loop H1 type), making the curve more
similar to Type II. The hysteresis loop type can be classified as intermediate between H3 and H4. The
type H3 loop does not exhibit any limiting adsorption at high p/p0 and is observed with aggregates of
plate-like particles giving rise to slit-shaped pores. The type H4 loop is often associated with narrow
slit-like pores, but with higher level of microporosity, as confirmed by the micropore area. Unlike the
previous sample, the Fe-N-C/850_SBA15 catalyst isotherm shape belongs to type II, which is
commonly obtained with more macroporous materials. For this sample, the hysteresis loop is broader
compared to the shape of the SBA15 (isotherm assigned to Type IV, hysteresis loop H2 type), but
can also be classified as intermediate between H3 and H4 types.
The SBET, the pore volume and the micropore area increase by employing the silica, reaching the
maximum values with the mesoporous SiO2 (Fig. 2A and Table 1). The formation of a microporous
structure is favorable to host the iron coordinated with nitrogen, as mentioned by several groups
[5,19].
FTIR spectra (Fig. 2B) were recorded on the two templated catalysts. FePc without thermal
treatment was also analyzed for comparison. The FTIR spectrum of FePc shows stretching and
bending vibration bands typical of metal phthalocyanines [37], including C–H (3054 cm–1) and C–C
(1607 cm–1) stretching of aromatic rings, stretching of –N= mesoatoms (1513 cm–1), isoindole (1422
cm–1), and pyrrole (1331 cm–1) stretching plane (1287, 1163, 1081 cm–1) and out-of-plane (734, 780
cm–1) bending of CArom–H. The bands attributed to the characteristic –N–H stretching (3240–3300
cm–1) and in-plane bending (1005 cm–1) vibration of pyrrolic nitrogen atoms, at 3240–3300 cm–1,
typical of the pure Pc, are not detected [38]. The absence of the N–H bonds vibration is due to the
complexation of Fe. In fact, in FePc the two pyrrolic hydrogens in the center of the molecule are not
present, and all the four N atoms are bonded with the Fe atom [39]. The peaks and bands detected in

151
the wavenumber range 800–1800 cm–1 could be ascribed to the coordination of Fe(II) in the center of
the molecule [37].
Figure 2. (A) Nitrogen adsorption/desorption isotherms for basic and templated Fe-N-C/850 electrocatalysts. (B) FTIR spectra of FePc precursor and templated Fe-N-C/850 electrocatalysts after the pyrolysis heat treatment at 850 °C.
For the Fe-N-C/850_SBA15 and Fe-N-C/850_mSiO2 catalysts, regardless of the silica template the
characteristic peaks of FePc completely disappear after the pyrolysis at 850°C. In fact, both catalysts
exhibit almost flat spectra, very similar to the spectrum of a carbonaceous material. Similar features
are reported in the literature [25,27,40], and suggest that total decomposition of the original molecule
structure of the precursor occurred during the thermal treatment, with a substantial recombination of
the chemical bonding. Indeed, FTIR spectra of both catalysts exhibit only weak and broad adsorption
152
bands at ca. 1600 and 1210 cm–1 previously observed in N-containing carbon materials [41,42] and
assigned to the pyridine-type C–N bonds.
Thus, the pyrolysis process favors the graphitization process, with a nitrogen-iron reengagement
entailing a significant improvement in activity. This is evidenced by electrochemical evaluation in a
three electrode configuration. An increase of currents density (Fig. 3A: from –1.85 to –2.65 mA cm–
2 at 0.6 V) as well by the positive shifts of the onset (from 0.683 to 0.726 V at OCV). Therefore, the
starting nitrogen-carbon structure of the FePc precursor is helpful to synthesize F-N-C catalysts able
to decrease overpotentials in ORR [27,40]. The reasonable explanation for this improvement could
be the formation of pyridinic nitrogen and quaternary nitrogen-doped carbon after pyrolysis, which
was proved by FTIR analysis, and also by XPS analysis (see following Section 3.4). However, the
interactions of N with C cannot fully improve the electroreduction selectivity from O2 to H2O through
the expected four-electron route. The hydrogen peroxide production, measured with a series of RRDE
measurements (Fig. 3B), diminished from 6 to 0.5 % at 0.3 V by templating the Fe-N-C/850 catalyst.
In particular, the best selectivity was obtained with the mesoporous SiO2.

153
Figure 3. (A) LSVs from RRDE with H2O2 formation (B) recorded at 5 mV s–1. Experimental conditions: 0.5 M H2SO4, 0.2 ITC, 80 µg cm–2 catalyst loading, ring potential 1.2 V vs SHE. Rotational speed set at 900 rpm.
3.3 Activity and stability of the Fe-N-C/850_mSiO2 catalyst.
Furthermore, the activity and stability of the Fe-N-C/850_mSiO2 catalyst were assessed in the
GDE cell (Fig. 4). This specific type of cell allows the use of higher amount of catalyst compared to
the RDE configuration, bypassing the limitations of thin electrode layers. In fact, the main advantage
of the GDE cell is the direct supply of gaseous oxygen to the cathode, avoiding losses due to oxygen
diffusion through the liquid electrolyte, thus increasing the amount of accessible oxygen. The Fe-N-
C/850_mSiO2 catalyst shows an OCV of 0.79 V vs RHE with a catalyst loading of 2 mg cm–2 (Fig.
4A). The current density of the catalyst was –2.8 mA cm–2 at 0.8 V, corresponding to a mass activity
of –1.4 mA mg–1, under IR corrected conditions. This value is comparable to the activity of similar
electrocatalysts in the literature [23,43,44].

154
In terms of stability (Fig. 4B), during the chronoamperometry at 0.47 V the catalyst shows a
relatively fast decay of the current density during the first 5 h of the test, then it reaches a rather stable
performance up to 60 h, mainly attributed to pyridinic and pyrrolic nitrogen like fixation [19], as
described in Section 3.4.
Figure 4. Fe-N-C/850_mSiO2 catalyst. (A) ORR activity (original and iR-corrected) measured in GDE cell at 5 mV s–1. Experimental conditions: 0.5 M H2SO4, 0.2 ITC mass ratio, 2 mg cm–2 catalyst loading. (B) ORR stability at a potential of +0.47 V vs SHE in O2-saturated 0.5 M H2SO4 solution in the GDE cell.
3.4 Physico-chemical characterization of the Fe-N-C/850 electrocatalysts.
EDX and XPS analyses were used to investigate the elemental composition of the Fe-N-C/850
catalysts (Table 2). The wide XPS scan spectra for the three catalysts (not reported here) reveal the

155
presence of C, O, N and Fe on catalysts’ surface. The iron content is very low, close to the detection
limit of the instrument, similarly to the values of other Fe-N/C catalysts mentioned in the literature
[43–45]. The low Fe atomic percentages are confirmed by EDX analysis. This is expected considering
that the FePc precursor contains a theoretical Fe content equal to 1.75 at.%, and not all of the iron
remains on the structure of the final electrocatalysts. No residual silica is detected, sign that the acid
washing was effective in completely removing the templating agent.
Table 2. Elemental composition of Fe-N-C/850 catalysts from EXD and XPS analyses. From the deconvolution of the high resolution N 1s spectra Nitrogen contents with relative intensities and binding energies are listed (N1: nitrile; N2: pyridinic-N; N3: Nx-Fe; N4: pyrrolic-N; N5: quaternary-N; N6: graphitic-N; n.d.: not detected).
EDX
[at.%]
XPS [at.%; eV]
Fe Fe 2p C 1s O 1s N 1s N1 N2 N3 N4 N5 N6
F-N-C/850 0.5 0.9 89.3 8.3 1.5 7.5
397.6
32.1
398.3
6.9
399.4
20.6
400.2
32.9
401.1
n.d.
F-N-C
/850_SBA15
0.2 <0.1 93.0 6.0 0.9 9.3
397.9
31.1
398.7
2.8
400.0
50.3
400.7
n.d. 6.5
403.3
F-N-C
/850_mSiO2
0.1 <0.1 88.0 10.0 2.0 18.5
398.1
22.8
398.9
0.7
400.0
53.3
400.8
n.d. 4.7
403.1
The high resolution N 1s spectra of the catalysts (Fig. 5) are fitted into six peaks correspond to
six types of nitrogen, such as nitrile N1 (398 eV), pyridinic N2 (398.6 eV), Nx-Fe N3 (399.6 eV),
pyrrolic-N N4 (400.7 eV), quaternary N5 (401.8 eV) and graphitic N6 (403 eV) [45]. The peak with
the lowest binding energy (398.7 eV) is due to the imine-like (=N–) structure, and the peak centered
at 399.8 eV is attributed to the amine-like nitrogen atoms (–NH–). The peak centered at 401.6 eV can
be assigned to cationic nitrogen atoms on the polymer backbone, and the peak with highest binding
energy (402.8 eV) is due to the protonated amine units [46]. The high content of pyrrolic-like N4
(Table 2), belonging to the catalyst Fe-N-C/850_mSiO2, can be attributed to the first to electrons
responsible of the reduction of oxygen [45]. The pyridinic N2 and the pyrrolic N4, which are
predominant in this catalyst, have the nitrogen atoms bonded to two adjacent carbon atoms in the
graphene lattice with one/two p-electron(s) localized in the π conjugated system [47,48]. According
to the literature, the electrocatalytic ORR activity can be attributed to pyridinic-N (N2) and/or
pyrrolic-N (N4) [49–53], whereas other authors suggested that graphitic-N (N6) is more important
for the electrocatalytic activity of N-doped carbon based electrocatalysts [54,55]. In our case, both

156
catalysts templated with porous silica, shows higher content of pyrrolic-N (N4), more than the double
compared to the basic F-N-C/850 catalyst.
Figure 5. XPS deconvolution of the high resolution N 1s spectra of Fe-N-C/850 (A), Fe-N-C-/850_SBA15 (B), and Fe-N-C/850_mSiO2 (C) catalysts.
The effects of the use of different templating agents on the morphology of the catalysts surface after
the heat treatment at 850 °C are evaluated by FESEM analysis (Fig. 6). The F-N-C/850 catalyst (Fig.
6A) presents a block-like structure, with iron finely dispersed on the surface in an inhomogeneous
way, showing various agglomerates, as enlightened by the higher magnification backscattered image.
The use of the in house SBA15, which presents a typical rod-shape morphology, caused the
modification in the shape of the F-N-C/850_SBA15 catalyst (Fig. 6B) to a worm-like structure that
favored a better distribution of the iron, without the formation of agglomerates. The commercial
mSiO2, presenting a typical spherical-shape of the structure, favored a globular shape mixed with
root-likes filaments of the F-N-C/850_mSiO2 particles (Fig. 6C). Here the mixed structure could be
due to the 3:1 weight ratio between the FePc precursor and the mSiO2 templating agent. The presence
of the spheres-like particles could explain the higher SBET of this catalyst (Table 1), avoiding the
agglomeration of the iron, not seen even in other parts of the sample examined.

157
Figure 6. FESEM images of Fe-N-C/850 (A), Fe-N-C-/850_SBA15 (B), and Fe-N-C/850_mSiO2 (C) at low and high (backscattered) magnification.
By concluding, when comparing the activity of different Fe-N-C catalysts templating with
different types of silica, the well-defined limited current density plateau of the Fe-N-C/850_mSiO2
(Fig. 3A) suggests that more catalytic sites, or better distributed catalytic sites, were available for the
ORR. Generally, the current plateau in RRDE measurements for ORR is dependent on the distribution
of the electrocatalytic sites on the electrode surface [56]. In fact, when the distribution of active sites
is less uniform and the electrocatalytic reaction is slower, the current plateau would become more
inclined [4,34,56] and not a plateau value as expected. More active sites, or better distributed active
sites, can be formed during the heat treatment. This could be due to the possible interactions between
iron and nitrogen or iron and carbon during the pyrolysis process. Therefore on the Fe-N-
C/850_mSiO2 catalyst the presence of micropores (Table 1), that is accessibility, and a uniform
distribution of iron (Fig. 6), not only significantly improved the catalytic activity for ORR (Fig. 3A),
but also reduced the percentage of hydrogen peroxide production (Fig. 3B), letting the reaction
proceed through an almost four-electron pathway.
4. Conclusions
Fe-N-C catalysts were synthesized by pyrolysis treatment of iron phthalocyanine at various
temperatures under inert atmosphere. The heat treatment at 850 °C favored the preparation of a
catalyst with the highest activity towards ORR. The morphology of this catalyst was on purpose
modified with the use of different porous silica (SBA15 in house prepared and commercial
mesoporous SiO2) as templating agent during synthesis. The physico-chemical characterization

158
confirmed the presence of both Fe and N in the catalysts prepared. The use of the templating agent
allowed to drastically increase the specific surface area and the microporosity the catalysts, especially
with the use of the commercial mesoporous SiO2.
The electrocatalytic activity towards ORR of the catalysts in acid conditions was assessed by
RRDE apparatus and a GDE cell. In both testing approaches, the Fe-N-C/850_mSiO2 catalyst
exhibited higher electroactivity. In particular, in the GDE configuration this catalyst reached a current
density of–2.8 mA cm–2 at 0.8 V, corresponding to a mass activity of –1.4 mA mg–1, under IR
corrected conditions. The chronoamperometry performed at 0.47 V vs SHE up to 4500 min showed
relatively good stability values. The higher electroactivity and stability of the Fe-N-C/850_mSiO2
catalyst could be ascribed to an increase of the microporosity.
References
[1] H. Gasteiger, N. Markovic, Just a dream-or future reality? Sience 324 (2009) 5923.
[2] F. Jaouen, M. Lefèvre , J-P. Dodelet, M. Cai, J. Phys. Chem. B, Heat-Treated Fe/N/C Catalysts
for O2 electroreduction: Are active sites hosted in micropores? J. Phys. Chem. B 110 (2006) 5553.
[3] S. Specchia, C. Francia, P. Spinelli, Polymer Electrolyte Membrane Fuel Cells, in: R.S. Liu, L.
Zhang, X. Sun, H. Liu, Zhang J (Eds.), Electrochemical Technologies for Energy Storage and
Conversion, Vol. 1, Ch. 13, Wiley, Weinheim, 2010, p. 601.
[4] A.H.A. Monteverde Videla, S. Ban, S. Specchia, L. Zhang, J. Zhang, Non-noble Fe–NX
electrocatalysts supported on the reduced graphene oxide for oxygen reduction reaction, Carbon 76
(2014) 386.
[5] Z. Chen, D. Higgins, A. Yu, L. Zhang, J. Zhang, A review on non-precious metal electrocatalysts
for PEM fuel cells, Energy Environ. Sci. 4 (2011) 3167.
[6] H. Zhu, S.J. Paddison, T.A. Zawodzinski Jr, The effects of the ligand, central metal, and solvent
on the O2 binding of non-precious metal catalyst model systems: An ab initio study, Electrochim.
Acta 101 (2013) 293.
[7] F. Jaouen, E. Proietti, M. Lefèvre, R. Chenitz, J.-P. Dodelet, G. Wu, H.T. Chung, C.M. Johnston,
P. Zelenay, Recent advances in non-precious metal catalysis for oxygen-reduction reaction in
polymer electrolyte fuel cells, Energy Environ. Sci. 4 (2011) 114.
[8] R. Cao, R. Thapa, H. Kim, X. Xu, M.G. Kim, Q. Li, N. Park, M. Liu, J. Cho, Promotion of oxygen
reduction by a bio-inspired tethered iron phthalocyanine carbon nanotube-based catalyst, Nature
Commun. 4 (2013) 2076.

159
[9] J. Masa, K.I. Ozoemena, W. Schuhmann, J.H. Zagal, Fundamental studies on the electrocatalytic
properties of metal macrocyclis and other complexes for the electroreduction of O2, in: M. Shao (Ed.),
Electrocatalysis in Fuel Cells, Vol. 9, Ch.7, Springer, London, 2013, p. 157.
[10] E. Kim, M.E. Helton, I.M. Wasser, K.D. Karlin, S. Lu, H.-W. Huang, P. Moënne-Loccoz, C.D.
Incarvito, A.L. Rheingold, M. Honecker, S. Kaderli, A.D. Zuberbühler, Superoxo, μ-peroxo, and μ-
oxo complexes from heme/O2 and heme-Cu/O2 reactivity: Copper ligand influences in cytochrome c
oxidase models, Proc. Natl. Acad. Sci. 100 (2003) 3623.
[11] J.P. Collman, N.K. Devaraj, R.A. Decrau, Y.Yang, Y.-L. Yan, W. Ebina, T.A. Eberspacher, C.E.
Chidsey, A cytochrome c oxidase model catalyzes oxygen to water reduction under rate-limiting
electron flux, Science 315 (2007) 1565.
[12] M.S. Thorum, J. Yadav, A.A. Gewirth, Oxygen reduction activity of a copper complex of 3,5-
diamino-1,2,4-triazole supported on carbon black, Angew. Chem. 48 (2009) 165.
[13] W. Li, A. Yu, D. C. Higgins, B. G. Llanos, Z. Chen, Biologically inspired highly durable Iron
Phthalocyanine catalysts for oxygen reduction reaction in polymer electrolyte membrane fuel cells,
J. Am. Chem. Soc. 132 (2010) 17056.
[14] J.-H. Jang, E. Lee, J. Park, G. Kim, S. Hong, Y.-U. Kwon, Rational syntheses of core-shell
Fex@Pt nanoparticles for the study of electrocatalytic oxygen reduction reaction, Sci. Rep. 3 (2013)
2872.
[15] J. Zeng, C. Francia, C. Gerbaldi, V. Baglio, S. Specchia, A.S. Aricò, P. Spinelli, Hybrid ordered
mesoporous carbons doped with tungsten trioxide as supports for Pt electrocatalysts for methanol
oxidation reaction, Electrochim. Acta 94 (2013) 80.
[16] D. Sebastián, M.J. Lázaro, R. Moliner, I. Suelves, A.S. Aricò, V. Baglio, Oxidized carbon
nanofibers supporting PtRu nanoparticles for direct methanol fuel cells, Int. J. Hydrogen Energy 39
(2014) 5414.
[17] C. Alegre, M.E. Gálvez, R. Moliner, V. Baglio, A.S. Aricò, M.J. Lázaro, Towards an optimal
synthesis route for the preparation of highly mesoporous carbon xerogel-supported Pt catalysts for
the oxygen reduction reaction, Appl. Catal. B: Environ. 147 (2014) 947.
[18] E. Negro, A.H.A. Monteverde Videla, V. Baglio, A.S. Aricò, S. Specchia, G.J.M. Koper, Fe–N
supported on graphitic carbon nano-networks grown from cobalt as oxygen reduction catalysts for
low-temperature fuel cells, Appl. Catal. B: Environ. 75 (2015) 166.
[19] J.-P. Dodelet, The controversial role of the metal in Fe- or Co-based electrocatalysts for the
oxygen reduction reaction in acid medium, in: M. Shao (Ed.), Electrocatalysis in Fuel Cells, Vol. 9,
Ch.10, Springer, London, 2013, p. 271.

160
[20] G. Liu, X. Li, P. Ganesan, B.N. Popov, Studies of oxygen reduction reaction active sites and
stability of nitrogen-modified carbon composite catalysts for PEM fuel cells, Electrochim. Acta 55
(2010) 2853.
[21] Y. Qin, J. Li, J. Yuan, Y. Kong, Y. Tao, F. Lin, S. Li, Hollow mesoporous carbon nitride
nanosphere/three-dimensional graphene composite as high efficient electrocatalyst for oxygen
reduction reaction, J. Power Sources 272 (2014) 696.
[22] C.-T. Hung, N. Yu, C.-T. Chen, P.-H. Wu, X. Han, Y.-S. Kao, T.-C. Liu, Y. Chu, F. Deng, A.
Zheng, S.-B. Liu. Highly nitrogen-doped mesoscopic carbons as efficient metal-free electrocatalysts
for oxygen reduction reactions, J. Mater. Chem. A 2 (2014) 20030.
[23] J.Y. Cheon, T. Kim, Y.M. Choi, H.Y. Jeong, M.G. Kim, Y.J. Sa, J. Kim, Z. Lee, T.-H. Yang, K.
Kwon, O. Terasaki, G.-G. Park, R.R. Adzic, S.H. Joo, Ordered mesoporous porphyrinic carbons with
very high electrocatalytic activity for the oxygen reduction reaction Sci Rep. 3 (2013) 2715.
[24] J. Zeng, C. Francia, A.M. Dumitrescu, A.H.A. Monteverde Videla, V.S. Ijeri, S. Specchia, P.
Spinelli, Electrochemical performance of Pt-based catalysts supported on different ordered
mesoporous carbons (Pt/OMCs) for oxygen reduction reaction, Ind. Eng. Chem. Res. 51 (2012) 7500.
[25] L. Osmieri, A.H.A. Monteverde Videla, S. Specchia, Activity of Co-N multi walled carbon
nanotubes electrocatalysts for oxygen reduction reaction in acid conditions, J. Power Sources 278
(2015) 296.
[26] E. Laviron, Surface linear potential sweep voltammetry. Equation of the peaks for a reversible
reaction when interactions between the adsorbed molecule are taken into account, J. Electroanal.
Chem. 52 (1974) 395.
[27] G. Wu, K.L. More, C.M. Johnston, and P. Zelenay, High-performance electrocatalysts for
oxygen reduction derived from polyaniline, Iron, and Cobalt, Science 322 (2011) 443.
[28] K. Kinoshita, J.A.S. Bett, Potentiodynamic analysis of surface oxides on carbon blacks, Carbon
11 (1973) 403.
[29] E. Frackowiak, F. Beguin, Carbon materials for the electrochemical storage of energy in
capacitors, Carbon 39 (2001) 937.
[30] J.H. Zagal, F.J. Recio, C.A. Gutierrez, C. Zuñiga, M.A. Páez, C.A. Caro, Towards a unified way
of comparing the electrocatalytic activity MN4 macrocyclic metal catalysts for O2 reduction on the
basis of the reversible potential of the reaction, Electrochem. Commun. 41 (2014) 24.
[31] J. Wang, G. Yin, Y. Shao, S. Zhang, Z. Wang, Y. Gao, Effect of carbon black support corrosion
on the durability of Pt/C catalyst, J. Power Sources 171 (2007) 331.
[32] H. Shi, Activated carbons and double layer capacitance, Electrochim. Acta 41 (1996) 1633.

161
[33] H.D. Sha, X. Yuan, L. Li, Z. Ma, Z. Ma, L. Zhang, J. Zhang, Experimental identification of the
active sites in pyrolyzed carbon-supported cobalt-polypyrrole-4-toluenesulfinic acid as
electrocatalysts for oxygen reduction reaction, J. Power Sources 255 (2014) 76.
[34] G. Wu, C.M. Johnston, N.H. MacK, K. Artyushkova, M. Ferrandon, M. Nelson, J.S, Lezama-
Pacheco, S.D Conradson, K.LF More, D.J. Myers, P. Zelenay, Synthesis-structure-performance
correlation for polyaniline-Me-C non-precious metal cathode catalysts for oxygen reduction in fuel
cells, J. Mater. Chem. 21 (2011) 11392.
[35] F. Jaouen, V. Goellner, M. Lefèvre, J. Herranz, E. Proietti, J.P. Dodelet, Oxygen reduction
activities compared in rotating-disk electrode and proton exchange membrane fuel cells for highly
active Fe-N-C catalysts, Electrochim. Acta 87 (2013) 619.
[36] K.S.W. Sing, D.H. Everett, R.A.W. Haul, L. Moscou, R.A. Pierotti, J. Rouquerol, T.
Siemieniewska, Reporting physisorption data for gas/solid systems with special reference to the
determination of surface area and porosity, Pure Appl. Chem. 57 (1985) 603.
[37] A.V. Ziminov, S.M. Ramsh, E.I. Terukov, I.N. Trapeznikova, V.V. Shamanin, T.A. Yurr,
Correlation dependences in infrared spectra of metal phthalocyanines, Semiconductors 40 (2006)
1131.
[38] F. Lupo, C. Tudisco, F. Bertani, E. Dalcanale, G.G. Condorelli, In situ metalation of free base
phthalocyanine covalently bonded to silicon surfaces, Beilstein J. Nanotechnol, 5 (2014) 2222.
[39] J. Leclaire, R. Dagiral, A. Pla-Quintana, A.-M.Caminade, J.-P. Majoral, Metallated
phthalocyanines as the core of dendrimers – Synthesis and spectroscopic studies, Eur. J. Inorg. Chem.
18 (2007) 2890.
[40] M. Wang, W. Yang, H. Wang, C. Chen, Z. Zhou, and S. Sun, Pyrolyzed Fe–N–C composite as
an efficient non-precious metal catalyst for oxygen reduction reaction in acidic medium, ACS Catal.
4 (2014) 3928.
[41] H. Peng, Z. Mo, S. Liao, H. Liang, L. Yang, F. Luo, H. Song, Y. Zhong, B. Zhang, High
performance Fe- and N- doped carbon catalyst with graphene structure for oxygen reduction, Sci.
Rep. 3 (2013) 1.
[42] S. Biniak, G. Szymansky, J. Siedlewsky; A. Swiatkowsky, The Characterization of Activated
Carbons with oxygen and nitrogen surface groups, Carbon 35 (1997) 1799.
[43] G. Liu, X. Li, P. Ganesan, B. N. Popov, Development of non-precious metal oxygen-reduction
catalysts for PEM fuel cells based on N-doped ordered porous carbon, Appl. Catal. B: Environ. 93
(2009) 156.
162
[44] M. H. Robson, A. Serov, K. Artyushkova, P. Atanassov, A mechanistic study of 4-
aminoantipyrine and iron derived non-platinum group metal catalyst on the oxygen reduction
reaction, Electrochim. Acta 90 (2013) 656.
[45] A. Serov, U. Tylus, K.a Artyushkova, S. Mukerjee, P. Atanassov, Mechanistic studies of oxygen
reduction on Fe-PEI derived non-PGM electrocatalysts. Appl. Catal. B: Environ. 179 (2014) 150.
[46] K.L. Tan, B.T.G Tan, E.T. Kang, K.G. Neoh. X-ray photoelectron spectroscopy studies for the
chemical structure of polyaniline, Phys. Rev. B 39 (1989) 8070.
[47] W. Qian, X. Cui, R. Hao, Y. Hou, Z. Zhang. Facile preparation of nitrogen-doped few-layer
graphene via supercritical reaction, ACS Appl. Mater. Interfaces 3 (2011) 22259.
[48] S. Yang, X. Feng, X. Wang, K. Müllen, Graphene-based carbon nitride nanosheets as efficient
metal-free electrocatalysts for oxygen reduction reactions, Angew. Chem. 50 (2011) 5339.
[49] D. Scherson, A.A. Tanaka, S.L Gupta, D. Tryk, C. Fierro, R. Holze, E.B Yeager, R.P. Lattimer.
Transition metal macrocycles supported on high area carbon: Pyrolysis—mass spectrometry Studies,
Electrochim. Acta 31 (1986) 1247.
[50] J. Herranz, F. Jaouen, M. Lefèvre, U.I. Kramm, E. Proietti, J.P. Dodelet, P. Bogdanoff, S.
Fiechter, I. Abs-Wurmbach, P. Bertrand, T.M. Arruda, S. Mukerjee. Unveiling N-protonation and
anion-binding effects on Fe/N/C catalysts for O2 reduction in proton-exchange-membrane fuel cells,
J. Phys. Chem. C 115 (2011) 16087.
[51] F. Jaouen, J. Herranz, M. Lefèvre, J.P. Dodelet, U.I. Kramm, I. Herrmann, P. Bogdanoff, J.
Maruyama, T. Nagaoka, A. Garsuch, J.R. Dahn, T. Olson, S. Pylypenko, P.Atanassov, E.A. Ustinov,
Cross-laboratory experimental study of non-noble-metal electrocatalysts for the oxygen reduction
reaction, ACS Appl. Mater. Interfaces 8 (2009) 1623.
[52] H.A. Gasteiger, S.S. Kocha, B. Sompalli, F.T. Wagner. Activity benchmarks and requirements
for Pt, Pt-alloys, and non-Pt oxygen reduction catalysts for PEMFC, Appl. Catal. B: Environ. 56
(2005) 9.
[53] P.H. Matter, L. Zhang, U.S. Ozkan. The role of nano-structure in nitrogen-containing carbon
catalysts for the oxygen reduction reaction, J. Catal. 239 (2006) 83.
[54] R. Arrigo, M. Hävecker, R. Schlögl, D.S. Su, Dynamic surface rearrangement and thermal
stability of nitrogen functional groups on carbon nanotubes, Chem. Commun. 40 (2008) 4891.
[55] H. Niwa, K. Horiba, Y. Harada, M. Oshima, T. Ikeda, K. Terakura, J. Ozaki, S. Miyata. X-ray
absorption analysis of nitrogen contribution to oxygen reduction reaction in carbon alloy cathode
catalysts for polymer electrolyte fuel cells, J. Power Sources 187 (2009) 93.
[56] G. Wu, C. Z. Chen, K. Artyushkova, F. H. Garzon, P. Zelenay, Polyaniline-derived non-precious
catalyst for the polymer electrolyte fuel cell cathode, ECS Trans. 16 (2008) 159.

163
CHAPTER 6. The influence of different transition metals (Me = Fe, Co, Cu, Zn)
on the properties and ORR electroactivity of Me-N-C catalysts synthesized from
Me(II)-Phthalocyanine precursors.
1. Introduction.
Several efforts have been made recently to synthesize new non-precious metal catalysts without using
a carbonaceous support [1,2]. The basic idea lies in the use of sacrificial supports, to be mixed with
macromolecules containing nitrogen, carbon, and the transition metal together. The template is
removed during or after the pyrolyzation step, resulting in a self-supported Me-N-C catalyst with high
pore volume and, consequently, high density of active ensembles.
The porosity can be tuned by using the sacrificial supports (silica, alumina, zirconia, etc.) as
templating agents [3,4], with an approach similar to that used when producing mesoporous carbon by
hard templating method [5]. In general, the templating agent hosts N-C, or Me-N-C precursors, inside
its structure, as illustrated in Figure 0. The templating agent, SBA-15 silica as an example, can be
imagined as a series of ordered packed tubular (or hexagonal) open “microreactors”, which is hosting
the precursors complex. When the pyrolysis starts, the decomposition process of the precursors takes
place inside each SBA-15 “micro-reactor”: the temperature raises, decomposition gases are released,
and contemporary pressure increases locally as well, forming a very porous carbon structure and
favoring its nitrogen-iron doping. The templating agent is then removed by strong acid leaching. The
resulting non-precious metal catalyst is self-supported, highly porous and homogeneous, with better
accessibility to reactants, and densely populated of active ensembles.

164
Figure 0. Schematic representation of the formation of self-supported non-precious metal catalysts
by hard templating method using SBA-15 as sacrificial agent, and Fe-phthalocyanine as Fe-N-C
source.
2. Experimental
2.1. Chemicals.
Tetraethyl orthosilicate (TEOS, ≥ 98% purity), Hydrochloric acid (HCl, 37 wt. %), Pluronic P123®
triblock copolymer, Perchloric acid (HClO4, 70 wt. %), Sulfuric acid (H2SO4, 98 wt. %), Hydrofluoric
acid (HF, ≥ 40 wt. %), Potassium Hydroxide (KOH, 99.0% purity), Ethanol (≥ 99.8% purity), Acetone
(≥ 99.8% purity), Isopropanol (≥ 99.7% purity), Nafion® 5 wt. % hydroalcoholic solution, Iron(II)
Phthalocyanine C32H16N8Fe (Fe-Pc, 90% purity), Cobalt(II) Phthalocyanine C32H16N8Co (Co-Pc,
97% purity), Copper(II) Phthalocyanine C32H16N8Cu (Cu-Pc, 90% purity), Zinc(II) Phthalocyanine
C32H16N8Zn (Zn-Pc, 97% purity) and 29H,31H-Phthalocyanine C32H18N8 (H-Pc, 98% purity) were
purchased from Sigma Aldrich. Methanol (≥ 99.9% purity) and Hydrogen Peroxide (33 wt. %) were
purchased by Panreac. Nitrogen and oxygen gases were supplied in cylinders by SIAD with 99.999%
purity. All aqueous solutions were prepared using ultrapure deionized water obtained from a
Millipore Milli-Q system with resistivity >18 MΩ cm-1.
2.2. Synthesis.
2.2.1. Synthesis of silica template.
Mesoporous silica SBA-15 was prepared following the procedure reported by Zeng et al. [5,6], using
the triblock copolymer EO20PO70EO20 (Pluronic P123) as surfactant and TEOS as silica source.
In detail, 8.3 g of P123 was dissolved into 312 mL of 1.6 M HCl solution under stirring at 40 °C.
Then, 19 mL of TEOS was added and the solution was stirred for 20 h keeping the temperature
constant at 40 °C. Then, the temperature was increased at 100°C and maintained constant for 24 h.
165
The product was filtered, washed with deionized water, and calcined in oven at 550 °C for 10 hours
in air to completely remove the residuals of Pluronic surfactant.
2.2.2. Synthesis of Me-N-C catalysts.
Four different Me-N-C catalysts were prepared, using four different Me(II)-phthalocyanine (MePc)
precursors (Me = Fe, Co, Cu, Zn). As a comparison, a further catalyst was prepared in the same way
using as precursor the phthalocyanine molecule without metal center (29H,31H-Phthalocyanine,
HPc).
First, 500 mg of Me(II)-phthalocyanine was dissolved in 7.8 mL of an ethanol-water 1:1 vol. solution
and left under stirring for 1 hour.
SBA-15 silica was used as template for the synthesis of the Me-N-C electrocatalysts in a 1:1 wt. ratio
with respect to the phthalocyanine precursor. In detail, 500 mg of SBA-15 silica was wet-
impregnated by slowly pipetting the Me(II)-phthalocyanine solution on it. Then, a viscous slurry was
formed, and it was left under mild stirring at room temperature overnight, to let the phthalocyanine
precursor to completely fill the SBA-15 silica pores. Subsequently, the slurry was heated on a hot
plate at 100°C until complete evaporation of the solvent. The precursor powder was recovered and
homogenized in a mortar and it was placed in quartz boat to perform the pyrolysis heat treatment.
The pyrolysis treatment consisted in heating the sample in a tubular quartz furnace under nitrogen
atmosphere (N2 gas flux set at 80 NmL min-1 with a mass flow controller from Bronkhorst, ELFLOW
series) with a heating rate of 10 °C min-1 until 800 °C. The temperature was kept constant at this value
until 3 hours have passed from the starting of the heat treatment. Then the furnace was switched-off
leaving the apparatus cooling down naturally to room temperature.
The catalysts synthesized from FePc, CoPc, CuPc, ZnPc and HPc were named Fe-N-C, Co-N-C, Cu-
N-C, Zn-N-C and H-N-C, respectively.
2.3. Physico-chemical characterization.
Nitrogen adsorption-desorption isotherms for all of the Me-N-C catalysts and for SBA-15 silica, were
recorded using an ASAP 2020 Instrument (Micromeritics) at 77 K, within the relative pressure range
of 0 – 1. Before the analysis, all of the samples were placed into a glass burette and degassed under
vacuum for 3 hours at 150 °C. The specific surface area of the samples was calculated using the
Brunauer–Emmett–Teller (BET) method within the relative pressure range 0.1 – 0.3. The average
pore size was obtained with the Barrett–Joyner–Halenda (BJH) method. The micropores area and
volume and the differential surface area distribution were obtained by a Density Functional Theory
(DFT) model calculation included in the Micromeritics ASAP 2020 instrument software.
166
Scanning electron microscopy coupled with energy-dispersive X-ray spectroscopy (SEM-EXD FEI-
QuantaTM Inspect 200 with EDAX PV 9900 instrument working at 15 kV), was performed to detect
the presence of the transition metal (Fe, Co, Cu or Zn) in the bulk of the Me-N-C catalysts.
A field emission scanning electron microscope (FESEM, model JEOL JSM 6700F) was used to
investigate the morphology of the SBA-15 silica and the Me-N-C catalysts.
Fourier transform infrared spectroscopy (FTIR) analysis was conducted on all of the Me-N-C
catalysts samples. Before the measurements, powder samples were mechanically mixed with KBr
and pressed. IR spectra were collected in air at 2 cm-1 resolution on a Bruker Equinox 55 FTIR
spectrophotometer, equipped with a MCT (Mercury Cadmium Telluride) detector.
X-ray photoelectron spectroscopy (XPS) was performed to determine the elemental surface
composition of the catalysts samples, in particular to detect the presence of N and transition metals.
The analysis was carried out using a Physical Electronics PHI 5000 Versa Probe electron
spectrometer system with mono-chromated Al Kα X-ray source (1486.60 eV) run at 15 kV and 1 mA
anode current. Survey scans as well as narrow scans (high resolution spectra) were recorded with a
spot of 100 nm size. For all of the samples, the survey spectra were collected from 0 to 1200 eV and
the narrow N 1s spectra were collected from 390 to 412 eV. Before the measurements, all of the
samples were placed in an ultrahigh vacuum chamber at 2·10-10 mmHg, and calibrated against a value
of the C 1s binding energy of 284.5 eV. CasaXPS software was used to obtain the N 1s peaks
deconvolution and the semi-quantitative atomic percentage compositions, using Gauss – Lorentz
equations with Shirley-type background. A 70% Gaussian / 30% Lorentzian line shape was used to
evaluate peaks position and areas.
Raman spectroscopy was performed for the Fe-N-C, Co-N-C and Cu-N-C catalysts (being these
samples the ones which show the best ORR activities) to evaluate the ordered/disorder degree of their
carbon-based crystalline structure. The instrument used was a μ-Raman Spectroscopy (μRS Renishaw
InVia spectrometer equipped with a Leica DMLM confocal microscope and a CCD detector with an
excitation wavelength of 785 nm, Renishaw plc, Gloucestershire, United Kingdom). The Raman
scattered light was collected in the spectral range 100–1000 cm−1. At least ten scans were accumulated
in four different positions of the catalyst to ensure a sufficient signal to noise ratio.
Thermogravimetric analysis (TGA/SDTA 851e - Mettler Toledo) coupled to mass spectrometry
(Blazers Prisma QME 200 - Pfeifer vacuum) were performed under Ar flow (50 NmL min-1) in the
25-800°C temperature range. The heating rate (10°C min-1) and dwell time (1h) were the same used
in the pyrolysis treatment carried out during the synthesis of the catalysts.

167
2.4. RDE-RRDE measurements.
2.4.1. Ink formulations.
For the RDE test of Me-N-C catalysts the ink was prepared by dispersing a given mass of catalyst
(mcat, typically around 10 mg) in a solution obtained mixing known volumes of isopropanol,
deionized water and a 5% wt. Nafion ionomer hydro-alcoholic solution. An ink formulation is
characterized by its mass ratio of Nafion ionomer to catalyst, or Nafion-to-catalyst-ratio (NCR). The
volumes (in µL) of Nafion solution, deionized water and isopropanol to use to prepare the ink are
calculated as follows:
= ∙ ∙
0.05
= 15 ∙
= 50 ∙ − −
Where mcat is expressed in mg and dnaf is the density of the Nafion 5% wt. solution expressed in g
mL-1. With this formulation, the catalyst density in the ink is 0.02 mg µL-1. The ink is kept under
sonication (130W, Soltec 2200M3S sonicator) for 30 min to achieve a good dispersion. To have the
desired catalyst loading, a proportional volume of ink is pipetted on the RDE electrode surface.
As a purpose of comparison, a Pt-based catalyst was also tested. The catalyst used was a commercial
20 wt. % Pt supported on Vulcan XC-72 carbon black (QuinTech, Göppingen, Germany). For this
catalyst, the ink prepared by dispersing 10 mg of catalyst (mass of Pt and C), 33 µL of 5 wt% Nafion
solution, 734 µL of isopropanol and 20 µL of deionized water. This formulation led to have 2.5 µg
of Pt per µL of ink. After 30 minutes under sonication, a proportional volume of ink was pipetted to
have a Pt loading on the electrode of 38 µg cm-2.
2.4.2. Electrochemical characterization.
The electrochemical tests were conducted in a conventional three-electrodes electrochemical cell
configuration, using a rotating disk electrode equipment (RRDE-3A ALS) and a multi-potentiostat
(Bio-Logic SP-150). The cell was equipped with a glassy carbon disk – Pt ring working electrode
(disk diameter 4 mm, ring outer diameter 7 mm, ring inner diameter 5 mm), a Pt helical wire counter
electrode, and a saturated calomel reference electrode (SCE). For tests in acidic conditions the
electrolyte was an aqueous solution of H2SO4 in different concentrations depending on the test. For
tests in alkaline conditions, a 0.1 M KOH solution was used. The electrolytes were saturated with
pure N2, pure O2 or with mixtures of both gases in different proportions, depending on the type of
test, by direct gas bubbling into the solution. The N2 and O2 flows were carefully controlled through
two mass flow controllers (Bronkhorst, ELFLOW series), maintaining constant the total flow rate at
150 NmL min-1. Once the saturation was achieved, the gas inlet tube was lifted above the electrolyte

168
solution level. For the RRDE measurements, the ring potential was kept at 1.2 V vs RHE. At this
potential, the H2O2 oxidation reaction is under diffusion control [7]. The RRDE tests were conducted
using a bi-potentiostat (Mod. CH760E). The background current measured at the ring at potentials
higher than the reaction onset (above ∼ 0.8 V vs RHE for acid conditions and ∼ 0.9 V vs RHE for
alkaline conditions) was subtracted from the ring signal throughout the whole scanned potential range
[8].
Prior to start tests, 50 cyclic voltammetry (CV) cycles at 100 mV s–1 scan rate were performed in the
potential window 0.0 - 1.2 V vs RHE in N2 saturated electrolyte, in order to obtain an
electrochemically clean and stable working electrode surface [9].
For the ORR activity measurements, staircase voltammetries were recorded from 1.2 to 0.0 V vs RHE
in oxygen-saturated electrolyte with a potential step of 0.01 V and a holding time at each potential of
30 s. After this time, the background capacitive current had passed, and a steady-state value of the
faradaic current was measured. In this way steady-state polarization curves were obtained [10]. The
RDE rotation speed was set at 900 rpm.
For the Koutecky-Levich experiment, linear sweep voltammetries (LSV) were recorded at different
RDE rotation speeds (200 – 500 – 900 – 1600 – 2500 and 3600 rpm ) and 5 mV s–1 scan rate.
For activation energy calculation experiments, LSV were recorded at 5 mV s–1 scan rate and with a
RDE rotation speed of 900 rpm at different temperatures (10 – 15 – 20 – 25 – 32 – 40 – 50 °C) by
placing the cell inside a thermostatic bath, which temperature was regulated and controlled by a water
heating-cooling system (Mod. CRIOTERM 190, I.S.CO. s.r.l., Italy).
The methanol tolerance tests were carried out in a three-electrodes electrochemical cell configuration
at room temperature. The electrolyte was a 0.5 M H2SO4 solution saturated with O2. Methanol was
progressively added to the solution to reach different concentrations (0.01 – 0.1 – 1 and 2 M). The
electrochemical cell was equipped with a saturated Ag/AgCl reference electrode and a graphite rod
counter electrode. A rotating disk electrode (PINE) with a glassy carbon disk diameter of 5 mm was
used as working electrode. An AutoPG potentiostat-galvanostat (Mod. EG&G273A) was used to
control the electrode potential.
A LSV at 5 mVs-1 scan rate and 900 rpm was recorded without methanol and with methanol in the
solution for each methanol concentration.
At the end of each test, an electrochemical impedance spectroscopy measurement was done at the
open circuit voltage (OCV), with a wave amplitude of 10 mV and frequencies in the range of 10 kHz
– 100 mHz. The high frequency resistance value was used to subtract the ohmic drop contribution
from the linear sweep voltammetry curves [7,11].
169
The electrode potentials hereafter were corrected and referred to the reversible hydrogen electrode
(RHE). The current densities were normalized to the geometric area of the glassy carbon disk
electrodes.
2.5. Single fuel cell measurements.
2.5.1. Acid-DMFC test.
The Fe-N-C catalyst performance as ORR cathodic catalyst was evaluated in a 4 cm2 active area
DMFC single cell. A commercial Nafion 117 membrane (Dupont) was used as electrolyte. Before
use, the membrane was cleaned by boiling in 3 wt% hydrogen peroxide solution for 1 hour and then
rinsed in boiling deionized water for 1 hour. Then, to be adequately protonated, the membrane was
boiled in 0.5 M H2SO4 solution for 1 hour and rinsed in boiling deionized water for 1 h [12]. A
commercial Pt-Ru/C catalyst (Johnson Matthey, 30 wt% Pt-Ru, Pt:Ru 1:1 atomic ratio) was used as
anodic catalyst. As a purpose of comparison, the performance of a DMFC using a commercial Pt/C
catalyst (Johnson Matthey, 40 wt % Pt) at the cathode was also evaluated.
The electrodes were prepared by spraying the catalyst ink onto a Teflon-treated carbon cloth (ELAT
GDL-LT 1200 W) gas diffusion layer (GDL) by means of an air-brush. The inks were prepared by
mixing the catalysts powder with an isopropanol/deionized water solution (2:1 vol.) and a Nafion
ionomer solution (5 wt. %) under sonication until getting a homogeneous suspension. The Nafion
solution amount was in accordance to the desired amount of Nafion in the dry catalytic layer.
Different Fe-N-C cathodes were prepared varying the Nafion content on the dry electrode and the
catalyst loading. Electrodes with a Nafion content of 4 – 35 – 50 and 66 wt. % were prepared, while
the Fe-N-C catalyst loadings used were 2.5 and 5 mg cm2. For preparing the Pt-Ru and Pt based
electrodes, the Pt loading on the electrodes was set to 1 mg cm-2, with a Nafion content of 4 wt. %.
The MEA was obtained by hot pressing the anode and the cathode on the membrane at 100 °C
temperature and 60 bar pressure for 3 minutes.
For the DMFC test, the MEA vas mounted into a 5 cm2 single cell (Electrochem Inc.). A 5 cm2 carbon
cloth backing layer (ELAT GDL-LT 1200 W, the same used as GDL) was also placed on both anode
and cathode before closing the bipolar plates. The fuel cell hardware was then connected to a fuel cell
test bench (MITS Pro-FCTS, Arbin Instruments). For the polarization experiments, the cell was
controlled with an electrical load system. The DMFC anodic compartment was fed with 2 M methanol
solution preheated at 80 °C with a flow rate of 1 min-1 and a pressure of 0.33 bar (relative). The
cathodic compartment was fed with a 200 NmL min-1 pure O2 flow preheated at 80 °C with no
humidification. The O2 backpressure was set to 3 bar. The temperature of the cell was maintained at
90 °C during the experiments. The cell is let at open circuit potential (OCP) while reactants flow at

170
the electrodes for about 15 min until the OCP stabilizes. The polarization curve is recorded by
scanning the cell potential starting down to 0.0 V at a scan rate of 10 mV s−1.
The DMFC is activated by recording successive polarization curves until they show no significant
variation.
A short-term durability test was carried out to test the stability of the MEA fabricated with the most
performing cathodic formulation. The test consisted into a 2 or 3 hours chronoamperometric
experiment at 0.4 V conducted in the same operating conditions described above for the polarization
curve experiments with a flow rate of the methanol solution at the anode of 5 mL min-1 [12]. A
polarization curve is recorded regularly every 30 minutes, to evaluate the performance variation with
time.
2.5.2. Acid H2 / O2 PEMFC test.
A further test of Fe-N-C catalyst was made in PEMFC using H2 as fuel. The same 4 cm2 active area
single cell described in section 2.5.1 was used. In this case a commercial Nafion 112 membrane
(Dupont) was used as electrolyte. Before use, the membrane was submitted to the same treatment
described previously for Nafion 117 membranes.
Fe-N-C cathode was prepared using a Nafion content on the dry electrode of 50 wt. % and a catalyst
loading of 2.5 mg cm-2. At the FC anode, a commercial Pt/C catalyst (Johnson Matthey, 40 wt% Pt)
with a Pt loading of 0.3 mg cm-2 was used. As a purpose of comparison, the performance of a PEMFC
prepared using a commercial Pt/C catalyst (Johnson Matthey, 40 wt % Pt) with a Pt loading of 0.6
mg cm-2 at the cathode was also evaluated [13]. In the case of Pt/C catalytic layer preparation, the
Nafion content on the dry electrode was 4 wt. % for both anode and cathode. For the MEA
preparation, the same hot pressing procedure described before was used. Anodic and cathodic
compartment were fed with a 200 NmL min-1 pure H2 and pure O2 flow, respectively. Both gas flows
were preheated at 80 °C with and fed with a backpressure of 3 bar (relative). H2 flow was fully
humidified, while O2 was fed without humidification. The temperature of the cell was maintained at
60 °C during the experiments.
2.5.3. Alkaline DEFC test.
Fe-N-C was also tested as ORR catalyst in a direct ethanol fuel cell (DEFC) with an alkaline
electrolyte membrane. In this case the single cell active area was 2.89 cm2. A commercial
polybenzimidazole (PBI) membrane (Danish Power Systems) was used as electrolyte. In order to
dope the membrane with OH- functionalities to induce in it the anionic conductivity, it was treated
during 7 days into 6 M KOH solution. After this treatment, the membrane ionic conductivity get a
value of around 0.01 S cm-1 [14].
After the treatment in 6 M KOH, the PBI structure is modified as show in Figure 1.
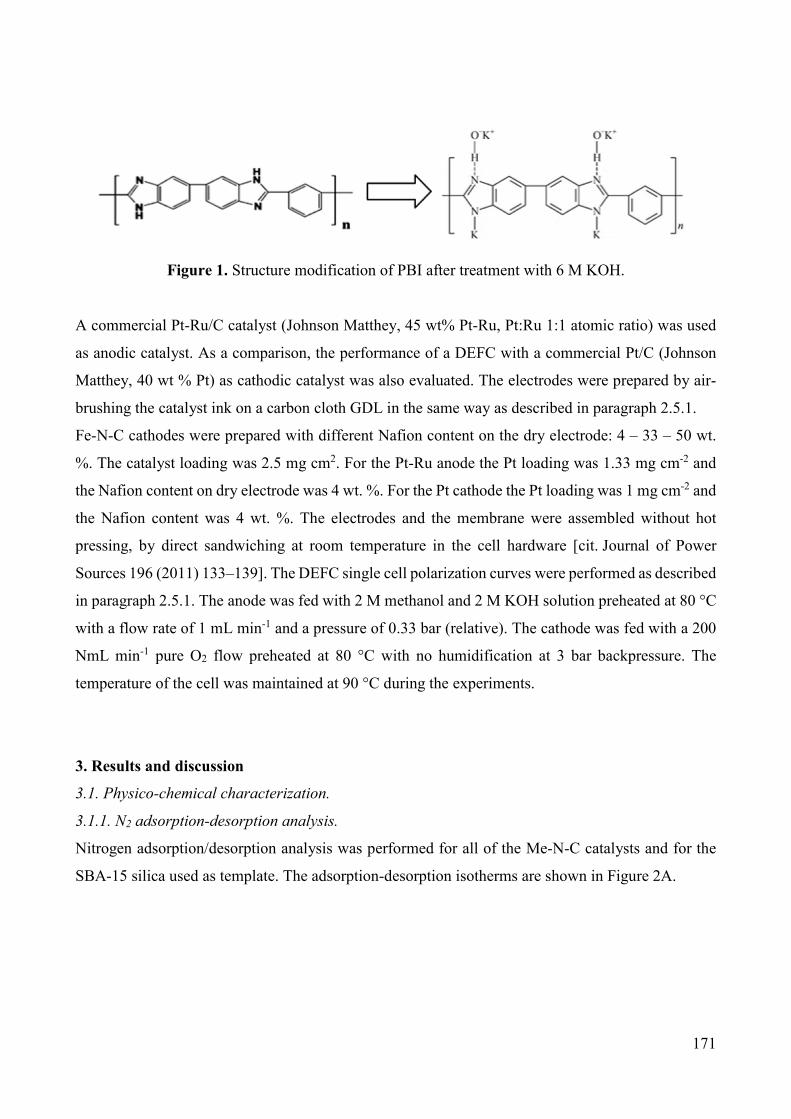
171
Figure 1. Structure modification of PBI after treatment with 6 M KOH.
A commercial Pt-Ru/C catalyst (Johnson Matthey, 45 wt% Pt-Ru, Pt:Ru 1:1 atomic ratio) was used
as anodic catalyst. As a comparison, the performance of a DEFC with a commercial Pt/C (Johnson
Matthey, 40 wt % Pt) as cathodic catalyst was also evaluated. The electrodes were prepared by air-
brushing the catalyst ink on a carbon cloth GDL in the same way as described in paragraph 2.5.1.
Fe-N-C cathodes were prepared with different Nafion content on the dry electrode: 4 – 33 – 50 wt.
%. The catalyst loading was 2.5 mg cm2. For the Pt-Ru anode the Pt loading was 1.33 mg cm-2 and
the Nafion content on dry electrode was 4 wt. %. For the Pt cathode the Pt loading was 1 mg cm-2 and
the Nafion content was 4 wt. %. The electrodes and the membrane were assembled without hot
pressing, by direct sandwiching at room temperature in the cell hardware [cit. Journal of Power
Sources 196 (2011) 133–139]. The DEFC single cell polarization curves were performed as described
in paragraph 2.5.1. The anode was fed with 2 M methanol and 2 M KOH solution preheated at 80 °C
with a flow rate of 1 mL min-1 and a pressure of 0.33 bar (relative). The cathode was fed with a 200
NmL min-1 pure O2 flow preheated at 80 °C with no humidification at 3 bar backpressure. The
temperature of the cell was maintained at 90 °C during the experiments.
3. Results and discussion
3.1. Physico-chemical characterization.
3.1.1. N2 adsorption-desorption analysis.
Nitrogen adsorption/desorption analysis was performed for all of the Me-N-C catalysts and for the
SBA-15 silica used as template. The adsorption-desorption isotherms are shown in Figure 2A.

172
0.0 0.1 0.2 0.3 0.4 0.5 0.6 0.7 0.8 0.9 1.00
5
10
15
20
25
30
35
40
Qu
an
tity
ad
so
rbe
d (
mm
ol
g-1)
P / P0
SBA-15 Fe-N-C Co-N-C Cu-N-C Zn-N-C H-N-C
A
1 10
0
1000
2000
3000
4000
5000
6000
7000
8000
9000B
dif
fere
nti
al s
urf
ac
e a
rea
(m
2 g
-1)
pore width (nm)
SBA-15 Fe-N-C Co-N-C Cu-N-C Zn-N-C H-N-C
Figure 2. (A) N2 adsorption and desorption isotherms of Me-N-C catalysts and SBA-15 silica. (B) Differential surface area distribution by DFT model.
According to the International Union of Pure and Applied Chemistry (IUPAC) classification, the
SBA-15 isotherm shape belongs to type IV (a), which shows the typical hysteresis loop associated
with capillary condensation taking place in mesopores [15,16]. The hysteresis loop shape can be
classified as type H1, with the presence of the two almost vertical and parallel branches, associated
with materials having a narrow distribution of pore size like ordered mesoporous silica.
The Me-N-C isotherms shape is typical of carbonaceous materials comprising all types of pores [17].
The isotherms can be calssified of type I(b) at P/P0 < 0.05, where filling of the micropores by the
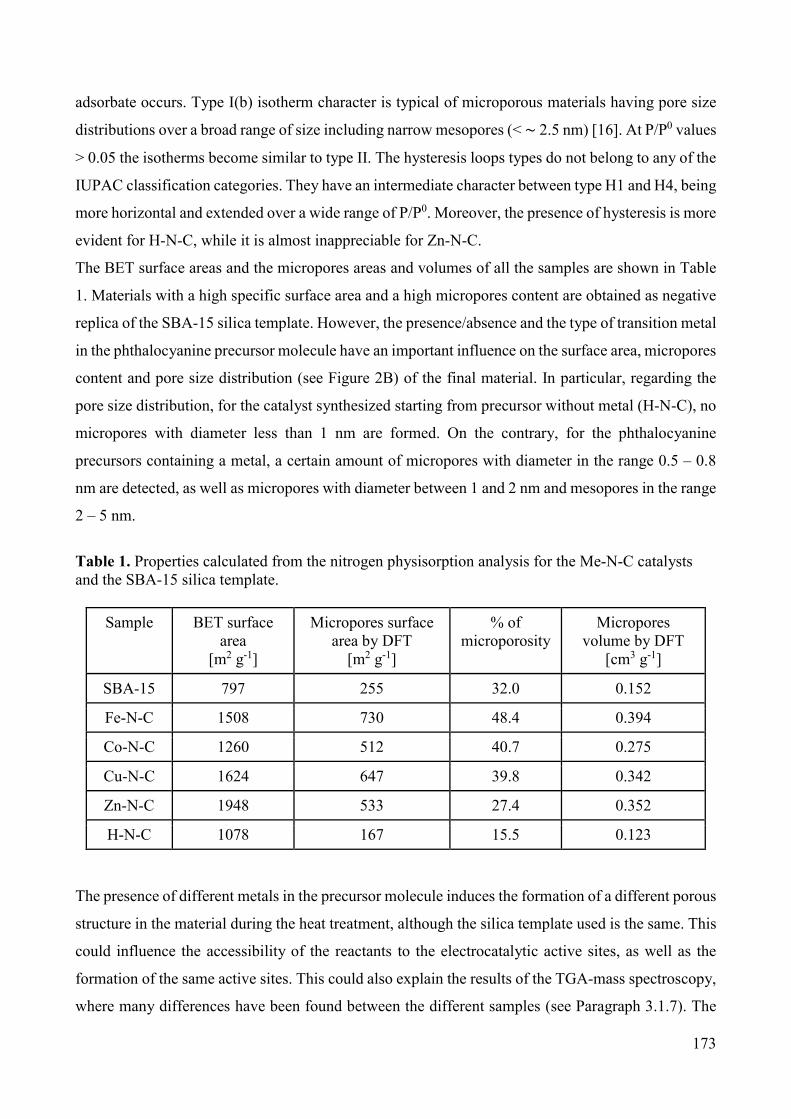
173
adsorbate occurs. Type I(b) isotherm character is typical of microporous materials having pore size
distributions over a broad range of size including narrow mesopores (< ∼ 2.5 nm) [16]. At P/P0 values
> 0.05 the isotherms become similar to type II. The hysteresis loops types do not belong to any of the
IUPAC classification categories. They have an intermediate character between type H1 and H4, being
more horizontal and extended over a wide range of P/P0. Moreover, the presence of hysteresis is more
evident for H-N-C, while it is almost inappreciable for Zn-N-C.
The BET surface areas and the micropores areas and volumes of all the samples are shown in Table
1. Materials with a high specific surface area and a high micropores content are obtained as negative
replica of the SBA-15 silica template. However, the presence/absence and the type of transition metal
in the phthalocyanine precursor molecule have an important influence on the surface area, micropores
content and pore size distribution (see Figure 2B) of the final material. In particular, regarding the
pore size distribution, for the catalyst synthesized starting from precursor without metal (H-N-C), no
micropores with diameter less than 1 nm are formed. On the contrary, for the phthalocyanine
precursors containing a metal, a certain amount of micropores with diameter in the range 0.5 – 0.8
nm are detected, as well as micropores with diameter between 1 and 2 nm and mesopores in the range
2 – 5 nm.
Table 1. Properties calculated from the nitrogen physisorption analysis for the Me-N-C catalysts and the SBA-15 silica template.
Sample BET surface area
[m2 g-1]
Micropores surface area by DFT
[m2 g-1]
% of microporosity
Micropores volume by DFT
[cm3 g-1]
SBA-15 797 255 32.0 0.152
Fe-N-C 1508 730 48.4 0.394
Co-N-C 1260 512 40.7 0.275
Cu-N-C 1624 647 39.8 0.342
Zn-N-C 1948 533 27.4 0.352
H-N-C 1078 167 15.5 0.123
The presence of different metals in the precursor molecule induces the formation of a different porous
structure in the material during the heat treatment, although the silica template used is the same. This
could influence the accessibility of the reactants to the electrocatalytic active sites, as well as the
formation of the same active sites. This could also explain the results of the TGA-mass spectroscopy,
where many differences have been found between the different samples (see Paragraph 3.1.7). The

174
importance of the pore size for the kinetic activity in this type of NPMC was outlined in several works
[17,18]. In particular, the formation of a microporous structure is favorable to host the ORR active
sites [19–22]. However, no direct relation between the ORR activity and the BET surface area or the
microporous surface area were found. In this case, the ORR activity in both acidic and alkaline
conditions (see Paragraphs 3.2.2 and 3.3.1) seems to increase as the % of microporosity (calculated
as ratio between the microporous surface area and the overall BET surface area) of the sample
increases.
3.1.2. FESEM pictures.
The morphology of all the Me-N-C catalysts and the SBA-15 silica template was investigated by
FESEM analysis. The SBA-15 silica exhibits the typical uniform rod-like morphology [23]. These
short rod-like particles have an average length of about 1μm and an average thickness of about 200
nm, and they are joined together to form larger agglomerates (see Figure S1 A-B-C-D in Chapter 4).
Pictures of the Me-N-C catalysts are shown in Figure 3 – 4 – 5 – 6 and 7. As can be seen, all of the
samples exhibit a rod-like / agglomerate morphology, similarly to the silica template.
Similar morphologies were obtained by other groups for materials obtained by hard-templating
method of SBA-15 silica [24,25].
However, considering the dimensions, one can notice that the average thickness of the particles is
similar to the SBA-15 (about 200 nm). Otherwise, the average length of the particles appears to be
lower in comparison with the SBA-15 template. The channel-like pores of the SBA-15 silica lie along
the length direction. Therefore, the lower length of the Me-N-C catalysts particles can be explained
as an incomplete filling of the empty space inside the channels by the Me-phthalocyanine precursor
during the wet-impregnation. In this way, the negative replica of the template occurred only partially
along the channel-like pores length direction, giving rise to shorter carbonaceous particles the
removal of the SBA-15 template.
The effect of the use of different Me-phthalocyanines (Me = Fe, Co, Cu, Zn, or no metal) precursors
on the morphology is also evident. The Fe-N-C catalyst has a composite morphology where different
zones can be identified (see Figure 3 A). The rod-like particles originated from the SBA-15 structure
replica are surrounded and interconnected by a less uniform and disordered structure. Observing the
pictures taken at higher magnification, this disordered region appears to be formed by two different
parts. The first one, shown in Figure 3 B, has the shape of root-like filaments. The second one are
tangled carbon nanotubes that originate from the surface of the filaments and the rod-like particles.
The average diameter of these nanotubes is of about 10 nm (see Figure 3 C).

175
Figure 3. FESEM images of Fe-N-C catalyst at different magnification.
The surface of the Co-N-C catalyst appears to be covered by short worm-like shaped carbon
nanotubes. The average diameter of these nanotubes is greater (about 20 nm) in comparison with the
nanotubes present in Fe-N-C catalyst.
Figure 4. FESEM images of Co-N-C catalyst at different magnifications.
As reported in the literature, transition metals such as Fe, Co and Ni, are often used as catalysts for
the controlled formation of various forms of carbon nanostructures [26].
Unlike the two previous samples, the Cu-N-C catalyst does not exhibit any presence of nanotubes or
disordered structures other than the agglomerates of rod-like particles, as evidenced in Figure 5 A.
Observing the pictures at higher magnifications (Figure 5 B-C), only the presence of small punctual
and angular-shapes irregularities can be observed on the catalyst surface.
Figure 5. FESEM images of Cu-N-C catalyst at different magnifications.

176
Almost no irregularities are present on the surface of the Zn-N-C catalyst. The rod-like particles in
this catalyst are more regular and round-shaped (see Figure 6 A), and the surface appears to be
smoother in comparison with the previous samples. In the pictures taken at higher magnifications
(Figure 6 B-C), traces of the regular channel-like structure typical of the SBA-15 silica template can
be observed.
Figure 6. FESEM images of Zn-N-C catalyst at different magnifications.
Finally, analyzing the morphology of the catalysts synthesized starting from the metal-free
phtahalocyanine (H-N-C), we can notice that the particles agglomerates shapes are regular, similarly
to Zn-C-N, and do not show the presence of nanotubes or other different structures. However, unlike
the Zn-N-C, the surface is more wrinkled and rough, being the channel-like structure more evident.
Moreover, unlike all the other samples, the presence of pores on the surface is more evident.
Therefore, these surface pores should be of bigger size in comparison with the ones of the other Me-
N-C catalysts. This fact could confirm the lower microporosity of this sample (Table 1), as well as
the results of the pore size distribution analysis (Figure 2B).
Figure 7. FESEM images of H-N-C catalyst at different magnifications.

177
3.1.3. EDX analysis.
All of the catalysts synthesized using a phthalocyanine molecule containing a metal were analysed
by EDX. The purpose of the analysis was to determine the metal content in each sample. The probe
depth for EDX (≥ 1 µm) makes it possible to consider the results of this analysis as bulk composition
[28]. The results are shown in Table 2. For all of the samples the transition metal atomic content is
lower than in the Me(II)-phthalocyanine molecule precursor (1.75 atomic %). This indicates that not
all of the initial metal content remains stably incorporated into the final catalyst structure. Some of
the metal in the form of moieties not strongly linked to the catalysts structure, could have been washed
away during the HF washing for the silica template removal. No Si or F impurities have been detected,
sign that the HF washing is very effective in removing the silica template and it does not alter the
chemical composition of the catalysts. However, all of the samples exhibit a not negligible oxygen
content, despite no oxygen is contained in the Me(II)-phthalocyanines precursors molecules. This fact
can be attributed to two different reasons. First, considering that the only oxygen source present into
the pyrolysis reactor is the silica template, some of its O atoms could have been incorporated into the
catalysts structure due to the high temperatures reached during the pyrolysis. The second reason could
be the presence of some leaching in the sealing system of the tubular reactor used for the pyrolysis,
from which atmospheric air could have entered, causing a partial oxidation of the carbonaceous
material.
Table 2. Elemental analysis by XPS (surface composition) and EDX (bulk composition) of the Me-
N-C catalysts.
Chemical composition – XPS / EDX [atomic %]
Sample C O N M Tot
Fe-N-C 89.5 / 93.10 5.4 / 6.26 5.0 / - 0.1 / 0.64 100.0 / 100.00
Co-N-C 90.1 / 92.37 4.4 / 7.11 5.1 / - 0.4 / 0.52 100.0 / 100.00
Cu-N-C 87.3 / 93.80 4.7 / 5.95 7.9 / - 0.1 / 0.25 100.0 / 100.00
Zn-N-C 89.0 / 95.62 2.2 / 3.82 8.3 / - 0.5 / 0.56 100.0 / 100.00
H-N-C 92.9 / - 3.6 / - 3.5 / - 0.0 / - 100.0 / 100.00
3.1.4. XPS analysis.
All of the samples were analyzed by XPS after the removal of the SBA-15 silica template by HF
washing. The XPS analysis was conducted in order to determine more precisely the chemical
composition of the catalysts surface, detecting the presence of nitrogen. The influence of the different

178
transition metals in the MePc precursor on the composition of the catalyst can be also noticed. The
XPS survey spectra are shown in Figure 8, and the overall surface elemental compositions are
summarized in Table 2.
In all of the samples, the main component is C (total content of about 90 at. %, total C content in the
precursor molecule is 56 at. %) confirming a good carbonization of the precursor occurring during
the pyrolysis. O was also detected in not negligible percentages even if lower in comparison with
EDX results. N was detected in all the five samples, and its content varies form 3.5 to 8.3 at. %. These
amounts are lower than the original N content of the precursor molecule (14 at. %). Therefore, some
of the nitrogen is loss during the pyrolysis in the form of N-containing gas molecules (see discussion
in Paragraph 3.1.7). It is evident how the different transition metals seem to have the capacity of fix
different quantities of nitrogen during the pyrolysis under inert atmosphere, leading to the obtainment
of different levels of N-doping in the final carbonaceous material. More in detail, the “ability” of
fixing the nitrogen seems to decrease in the order Zn > Cu > Co > Fe. The presence of a metal seems
to be beneficial in any case. In fact, using the H-Pc molecule as a precursor, the lower N-doping level
was obtained.
Concerning the transition metal content, in Fe-, Co- and Cu-N-C catalysts the amount detected by
XPS is lower than the amount detected by EDX. Considering that XPS is a surface sensitive technique
(the depth of the analysis being about 5 – 6 nm) [29], these results suggest that a certain quantity of
the metal remains incorporated in the bulk of the carbonaceous structure of the catalysts, not being
exposed to the surface. On the contrary, for the Zn-N-C catalyst, there is a good matching between
the Zn amounts detected by EDX and XPS. This could suggest that Zn is mainly located on the
catalyst surface or close to the surface.
However, the transition metals contents detected are too low to allow the determination of the metal
valence state via deconvolution of the high-resolution Me 2p peaks (not reported here). Therefore,
the valence state of the metals in these catalysts remains unclear. We can hypothesize some of the
metal atoms being coordinated to N atoms in the form of Me-Nx moieties, forming some of the ORR
catalytic active sites [21]. For example, for the Fe-N-C catalysts, some presence of Fe-Nx bonds
results from the N 1s peak deconvolution analysis. The transition metals could also be present in the
form of Me-nitrides or Me-carbides encapsulated inside the carbon structure of the catalysts [30–32].
No impurities of other elements such as Si or F are detected, confirming the goodness of the washing
treatment with 5 wt. % HF solution for the removal of the templating agent.

179
Figure 8. XPS survey spectra of Fe-N-C (A), Co-N-C (B), Cu-N-C (C), Zn-N-C (D) and H-N-C (E) catalysts.
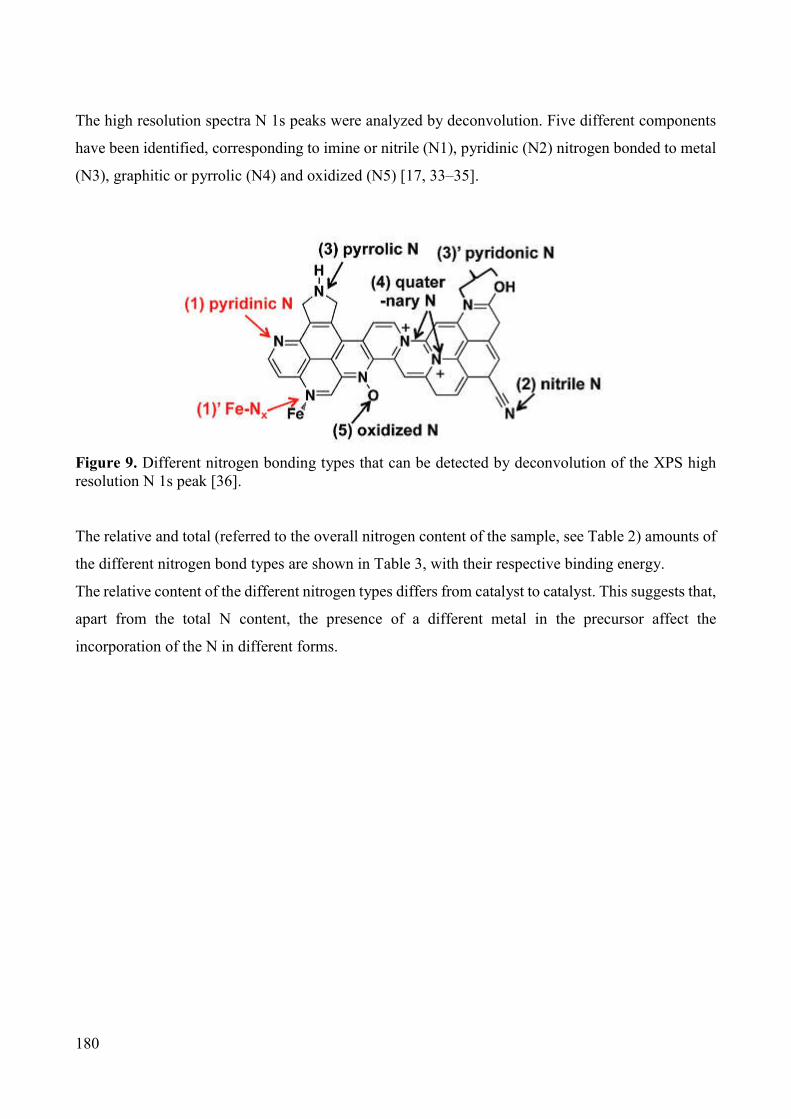
180
The high resolution spectra N 1s peaks were analyzed by deconvolution. Five different components
have been identified, corresponding to imine or nitrile (N1), pyridinic (N2) nitrogen bonded to metal
(N3), graphitic or pyrrolic (N4) and oxidized (N5) [17, 33–35].
Figure 9. Different nitrogen bonding types that can be detected by deconvolution of the XPS high resolution N 1s peak [36]. The relative and total (referred to the overall nitrogen content of the sample, see Table 2) amounts of
the different nitrogen bond types are shown in Table 3, with their respective binding energy.
The relative content of the different nitrogen types differs from catalyst to catalyst. This suggests that,
apart from the total N content, the presence of a different metal in the precursor affect the
incorporation of the N in different forms.

181
Table 3. Relative and total contents of the different N types with their respective peak binding energies resulting from the deconvolution of the high-resolution N 1s peak from XPS analysis (N1: nitrile-N; N2: pyridinic-N; N3: Me-Nx; N4: graphitic- or pyrrolic-N; N5: oxidized-N).
Binding energy [eV] Relative content [atomic %]
Total content [atomic %]
Sample N1 N2 N3 N4 N5
Fe-N-C 397.9 12.5 0.6
398.6 26.9 1.3
399.6 2.0 0.1
400.5 41.6 2.1
403.4 17.0 0.9
Co-N-C 398.3 31.3 1.6
399.1 14.2 0.7
- - -
400.8 43.1 2.2
404.2 11.5 0.6
Cu-N-C 398.1 31.8 2.5
399.2 8.5 0.7
- - -
400.6 36.6 2.9
403.0 23.1 1.8
Zn-N-C 398.0 29.8 2.5
398.6 2.2 0.2
- - -
400.0 67.7 5.3
404.1 4.2 0.3
H-N-C 398.1 33.6 1.2
399.1 5.1 0.2
- - -
400.6 61.3 2.1
- - -
In particular, Fe-N-C is the catalyst with the highest content of pyridinic-N, in both relative and
absolute terms. On the contrary, its relative content of nitrile or imide-like N is the lowest (12.6 %),
while for the other catalysts it is around 30 %. Fe-, Co- and Cu-N-C catalysts have a similar relative
content of graphitic-N (around 40 %). For Zn- and H-N-C the graphitic-N is more abundant (67.7 and
61.3 % respectively). A certain amount of oxidized N is detected in all the samples, except for H-N-
C. For Co-N-C the amount of pyridinic-N is still remarkably high (14.2 %), but it tends to decrease
in Cu-N-C (8.5 %), and even more in Zn-N-C and H-N-C.
Therefore, the different metals seem to favor the formation of pyridinic-N defects in the order Fe >
Co > Cu > Zn. This order reflects the % of microporosity of the samples.
Nitrogen-doping is with an increase of the ORR catalytic activity of carbon based materials in both
acidic and alkaline conditions [37–39]. However, the role of the real “electrocatalytically active sites”
is still not clear [21]. Regarding the different types of N bonding, in many studies, the electrocatalytic
activity is attributed to pyridinic-N [18,26,40].
The number of available doping sites for N-doping is greater in the basal plane of graphitic carbon
than in the edge. Therefore, the nitrogen-doping occurring in a basal plane of carbon should be more
favorable than in edge sites [41]. The different transition metals actuate each one in a different way
during the pyrolysis process, when the N is actually incorporated into the carbon structure of the

182
catalysts. Each metal seems to favor in a different way the formation of the different nitrogen bonds
types. This, together with the final catalyst morphology and porous structure, have an important
influence on the formation of effective ORR catalytic sites. For example, the location of the ORR
active sites in micropores, as proposed by many groups [17,18,22], being the active site a pyridinic-
N atom in the edge-of-plane coordinated or not with a transition metal, could be confirmed by these
results. In fact Fe-N-C is the most active catalyst, and also the catalyst with the highest microporosity
and the highest pyridinic-N content.
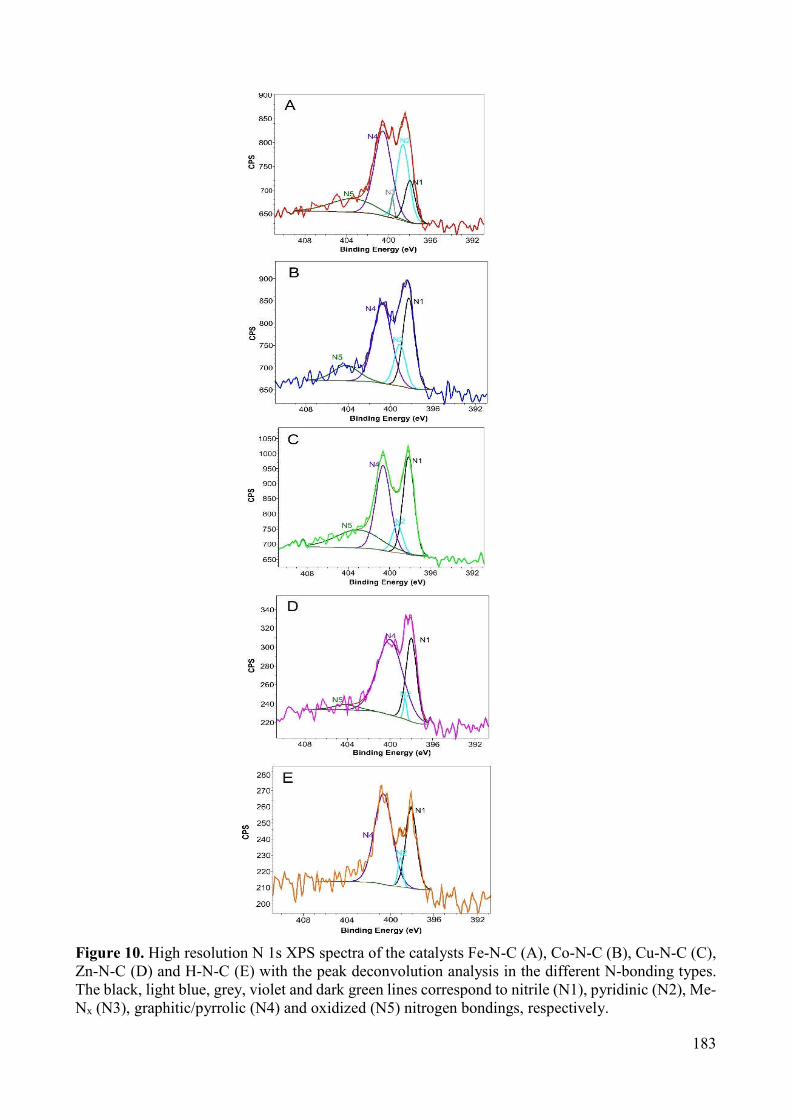
183
Figure 10. High resolution N 1s XPS spectra of the catalysts Fe-N-C (A), Co-N-C (B), Cu-N-C (C), Zn-N-C (D) and H-N-C (E) with the peak deconvolution analysis in the different N-bonding types. The black, light blue, grey, violet and dark green lines correspond to nitrile (N1), pyridinic (N2), Me-Nx (N3), graphitic/pyrrolic (N4) and oxidized (N5) nitrogen bondings, respectively.

184
By concluding, using Fe- and Co-phthalocyanine precursors, more active ORR catalysts are obtained.
These catalysts exhibit a lower total N content detected by XPS. Nevertheless, they have a higher
relative and total content of pyridinc-N, and this could be related with their enhanced ORR
electroactivity. The pyridinic-N is located on the edge of a carbon plane and a carbon vacancy and it
has a lone electron pair in the plane of the carbon matrix. This can increase the electron-donor
property of the catalyst which will weaken the O–O bond via the bonding between oxygen and
nitrogen and/or the adjacent carbon atom, facilitating the ORR [42].
Cu- and Zn-phthalocyanine precursors are able to incorporate more N, but mainly in form of graphitic,
nitrile and oxidized type. These N types are less likely to be involved in ORR active sites [43,44]. Cu
presence gives rise to a catalyst with a lower ORR activity, especially in acidic conditions (see
Paragraph 3.2.2). The influence of Zn on the formation of ORR active sites in particular seems to be
insignificant, being Zn-N-C activity almost identical to the activity of H-N-C catalyst in both acid
and alkaline media (see Electrochemical characterization results in Paragraphs 3.2.2 and 3.3.1).
3.1.5. FTIR analysis.
FTIR analysis was performed for all the five catalysts after the silica template removal, and the
resulting spectra are shown in Figure 8. After pyrolysis, most of the peaks characteristic of the
phthalocyanine molecule in the “fingerprint” wavenumber region between 1700 and 700 cm-1 (not
reported here, see Figure 2B in Chapter 5) disappear. All of the pyrolyzed Me-N-C catalysts spectra
have a similar shape, resembling the typical spectrum of carbonaceous materials, which are highly
transparent to the IR radiation in the region between 400 and 4000 cm-1 [25]. The FTIR spectra of
Me-N-C catalysts exhibit only two broad absorbance peaks in the ranges 1650–1500 cm-1 and 1350–
1150 cm-1. These peaks can be attributed to C=N bonding (i.e. pyridine-type) and N–H bonding found
on N-containing carbon materials [45]. Similar results are reported in the literature for different types
of pyrolyzed Me-N-C electrocatalysts [46,47]. This finding suggests that the original phthalocyanine
structures of the precursors are totally decomposed during the pyrolysis process, with a substantial
recombination of the chemical bonding. A small peak at about 2300 cm-1 is detected in some samples,
and it can be attributed to the presence of nitrile C≡N functional groups [48], as also found by XPS
analysis (see Paragraph 3.1.4). However, no significant differences are observed between the spectra
of the different Me-N-C catalysts with this analysis technique.
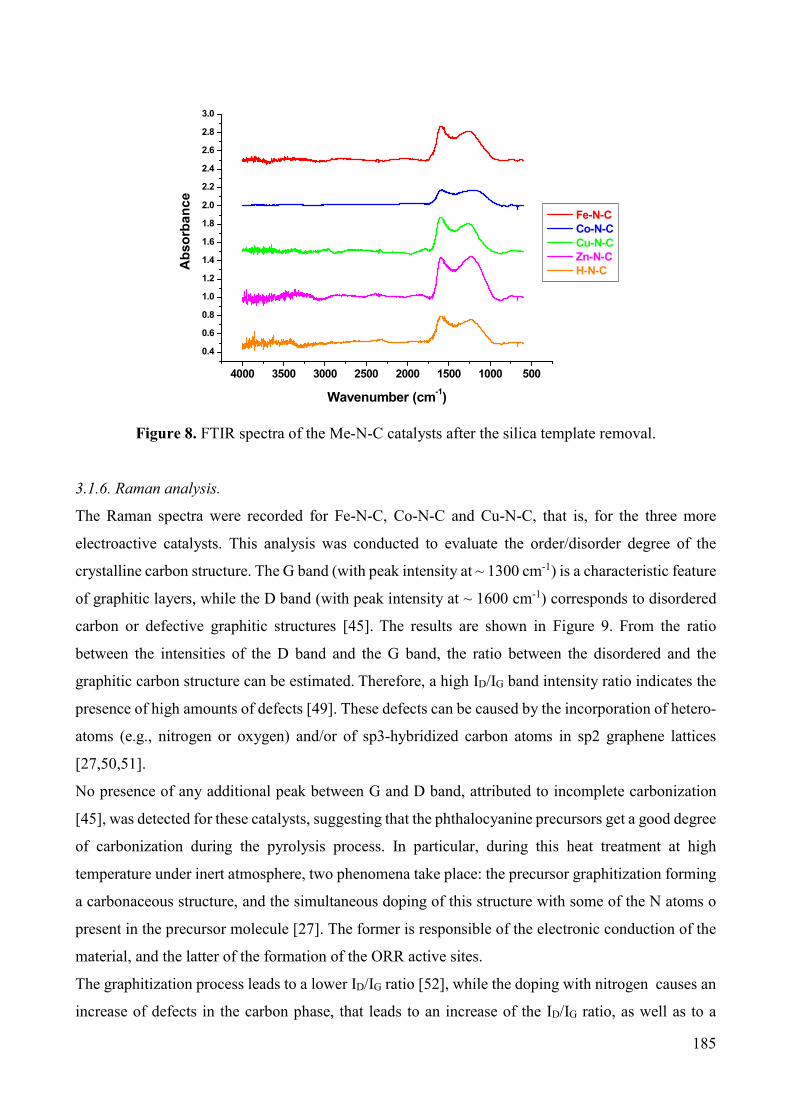
185
Figure 8. FTIR spectra of the Me-N-C catalysts after the silica template removal.
3.1.6. Raman analysis.
The Raman spectra were recorded for Fe-N-C, Co-N-C and Cu-N-C, that is, for the three more
electroactive catalysts. This analysis was conducted to evaluate the order/disorder degree of the
crystalline carbon structure. The G band (with peak intensity at ~ 1300 cm-1) is a characteristic feature
of graphitic layers, while the D band (with peak intensity at ~ 1600 cm-1) corresponds to disordered
carbon or defective graphitic structures [45]. The results are shown in Figure 9. From the ratio
between the intensities of the D band and the G band, the ratio between the disordered and the
graphitic carbon structure can be estimated. Therefore, a high ID/IG band intensity ratio indicates the
presence of high amounts of defects [49]. These defects can be caused by the incorporation of hetero-
atoms (e.g., nitrogen or oxygen) and/or of sp3-hybridized carbon atoms in sp2 graphene lattices
[27,50,51].
No presence of any additional peak between G and D band, attributed to incomplete carbonization
[45], was detected for these catalysts, suggesting that the phthalocyanine precursors get a good degree
of carbonization during the pyrolysis process. In particular, during this heat treatment at high
temperature under inert atmosphere, two phenomena take place: the precursor graphitization forming
a carbonaceous structure, and the simultaneous doping of this structure with some of the N atoms o
present in the precursor molecule [27]. The former is responsible of the electronic conduction of the
material, and the latter of the formation of the ORR active sites.
The graphitization process leads to a lower ID/IG ratio [52], while the doping with nitrogen causes an
increase of defects in the carbon phase, that leads to an increase of the ID/IG ratio, as well as to a
4000 3500 3000 2500 2000 1500 1000 500
0.4
0.6
0.8
1.0
1.2
1.4
1.6
1.8
2.0
2.2
2.4
2.6
2.8
3.0
Fe-N-C Co-N-C Cu-N-C Zn-N-C H-N-CA
bso
rba
nc
e
Wavenumber (cm-1)

186
broadening of D and G peaks [53]. Thus, the final value of the ID/IG ratio is the net effect of the sum
of its decrease due to further graphitization and its increase due to nitrogen introduction in the
structure. The ID/IG ratios calculated from Figure 9 are 1.22 , 1.19 and 1.11 for Fe-N-C, Co-N-C, and
Cu-N-C, respectively. These values are very similar to each other, suggesting that Fe, Co and Cu have
a similar influence on the graphitization and N-doping level during the pyrolysis, as also confirmed
by XPS and FTIR results.
Figure 9. Raman spectra of Fe-N-C, Co-N-C and Cu-N-C catalysts.
3.1.7. Thermogravimetric analysis coupled with mass spectroscopy.
A thermogravimetric analysis (TGA) was conducted under inert atmosphere on all of the Me-
phthalocyanine samples after the impregnation on the SBA-15 silica. The outlet of the TGA chamber
was connected to a mass-spectroscopy analyzer. The purpose was to simulate the pyrolysis process
[54] and investigate the behavior of the different Me-Pc precursors during the thermal treatment,
detecting the weight loss as well as the type and amounts of gases evolved. In order to get semi-
quantitative data from the mass-spectroscopy analysis, a fixed amount of each sample was introduced
in the TGA chamber at the beginning of the experiment.
If we observe the integral TGA curves in Figure 10 A, and the respective differential plots (Figure 10
B-C-D-E-F) we can approximately identify four main different weight loss regions, corresponding to
the main differential peaks.
800 1000 1200 1400 1600 1800 20000
5000
10000
15000
20000
25000
30000
35000
40000
45000
50000
Inte
nsit
y (
a.u
.)
Wavenumber (cm-1)
Fe-N-C Co-N-C Cu-N-C
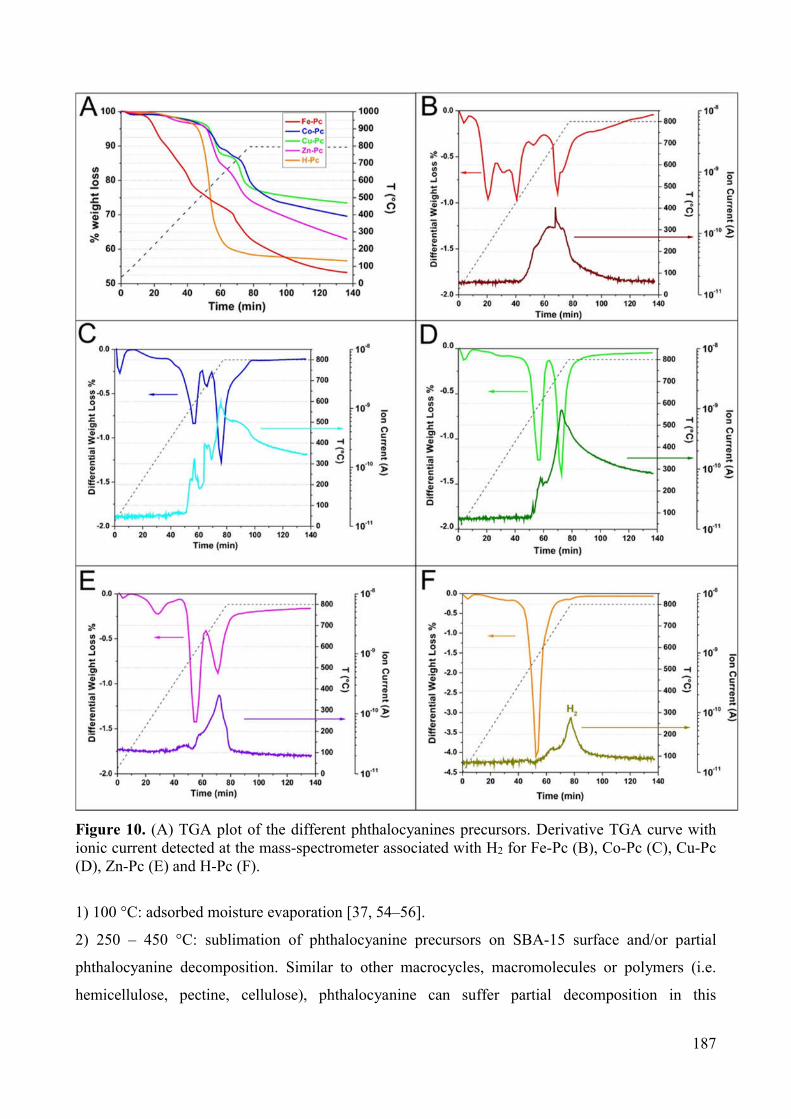
187
Figure 10. (A) TGA plot of the different phthalocyanines precursors. Derivative TGA curve with ionic current detected at the mass-spectrometer associated with H2 for Fe-Pc (B), Co-Pc (C), Cu-Pc (D), Zn-Pc (E) and H-Pc (F).
1) 100 °C: adsorbed moisture evaporation [37, 54–56].
2) 250 – 450 °C: sublimation of phthalocyanine precursors on SBA-15 surface and/or partial
phthalocyanine decomposition. Similar to other macrocycles, macromolecules or polymers (i.e.
hemicellulose, pectine, cellulose), phthalocyanine can suffer partial decomposition in this

188
temperature range [55,56,58]. Molecules at lower molecular weight can be formed, with the possible
formation of a sort of char [59,60].
3) 500 – 600 °C: sublimation of phthalocyanine precursors inside SBA-15 pore channels and / or
further phthalocyanine decomposition. Decomposition of organic macromolecules and polymers like
lignin can occur in this range of temperature, also overlapping with the previous stage [54]. Also the
char formed at lower temperatures could undergo volatilization [56]. The evolution of H2 and other
gaseous molecules containing nitrogen (i.e. NH3 and HCN, see Figure 12) occurs.
4) 650 – 800 °C: formation of cracking products due to reducing conditions. In this last decomposition
step, further dehydrogenation and elimination of nitrogen containing molecules takes place.
Aromatization of the carbonaceous structure (graphitization process) is occurring in this step [56]. At
temperatures around 700 °C, the pyrolysis of Me-phthalocyanines can produce fragments containing
transition metal bound to C and N on the catalyst surface. Some of these fragments may be involved
in the N-4 ORR active sites [61,62].
Figure 11. Proposed moiety of the ORR catalytic site formed at high temperature [61].
Despite this basic general classification, some differences have been detected between the different
Me-phthalocyanines precursors in the TGA diagram shape and in the evolution of pyrolysis gas
products as well. This fact confirm that this pyrolysis process under inert atmosphere is strongly
dependent on the transition metal coordinated in the macrocycle precursor center.
Considering the differential TGA curve of the H-Pc precursor (Figure 10 F), it exhibit only one very
sharp peak at 550 °C, suggesting that in the absence of any coordinated transition metal ion, H-Pc
rapidly decomposes and / or sublimates in the temperature range between 500 and 600 °C. This
behavior is similar to other macrocycles and nitrogen containing ligand molecules without
coordinated metal ion [37,63]. The hypothesis of the sublimation is supported by the general decrease
of the carrier gas flow (Ar) detected by the mass-spectrometer analyzer in correspondence of the
differential TGA peak (not reported here). The sublimated molecules, in fact, could have condensate
inside the mass-spectrometer inlet tube, causing a partial occlusion and a consequent decrease of the
total inlet flow.

189
Considering the Me-phthalocyanine molecule structure (C32H18N8Me) the pyrolysis gas products that
have been considered for the detection by the mass-spectrometer are H2, N2, NH3, HCN and CH4, that
is, low molecular weight molecules containing C, N and H atoms. However, the ionic currents
associated with NH3 and HCN masses registered by the mass-spectrometer are of about one order of
magnitude lower than the currents associated to H2. The carrier gas (Ar) and H2O coming from the
adsorbed moisture have also to be considered.
In the case of H-Pc, HCN and NH3 peaks have been detected in correspondence of the weight loss
peak at 550 °C (see Figure 12), while H2 generation has been detected between 700 and 800 °C,
corresponding to the dehydrogenation – graphitization process occurring in this temperature range.
If one looks at the differential TGA curve of the phthalocyanines precursors containing a transition
metal, they have a more complicated behavior. In these samples, the weight loss occurs in different
steps more evidently. Examining more in detail the TGA for each Me-Pc it can be noticed that all of
them exhibit the peak of adsorbed water release at about 100°C. Regarding the weight loss in the
range 250 – 450 °C, Co-, Cu- and Zn-Pc show a lower mass loss of less than 5 %. On the contrary,
the mass loss of Fe-Pc in this zone is more marked, reaching about 20 %. For all of these samples,
as also for H-Pc, no peaks related with the formation of NH3 and HCN (see Figure 12) and H2 (see
Figure 10) have been detected. This confirms that the weight loss in this region could be related to
the decomposition / sublimation of the phthalocyanine.
Some differences are noticed also in the temperature range 550 – 800 °C. In particular, for Zn-Pc
(Figure 10 E), two major weight loss peaks are observed at 550 and 700 °C. The first peak is higher,
and associated with the formation of H2 and few NH3, while during the second one H2, NH3 and HCN
is detected.
Cu-Pc (Figure 10 D) exhibits the two major differential weight loss peaks at 600 and 750 °C with
almost the same intensity. The peak at 600 °C is associated with the formation of H2 and NH3. The
peak at 750 °C is associated with the presence of H2, NH3 and HCN (big peack) formation detected
by the mass spectrometer.
Co-Pc (Figure 10 C) shows three peaks corresponding to 600, 700 and 800 °C. All these three peaks
are associated with evolution of H2, as evident in Figure 10 C. No peaks associated with the
production of other gases are detected.
Regarding Fe-Pc (Figure 10 B), its behavior is similar to Co-Pc, with the presence of three differential
peaks. Nevertheless, in this case, a first intense peak is registered at 450 °C, the second smaller peak
is detected at 550 °C, while the third peak, having almost the same intensity of the first one, is
registered at 700 °C. At the same time, a broad H2 generation peak is registered starting from 450 °C
until about 800 °C. An intense top-peak is detected exactly in correspondence with the 700 °C
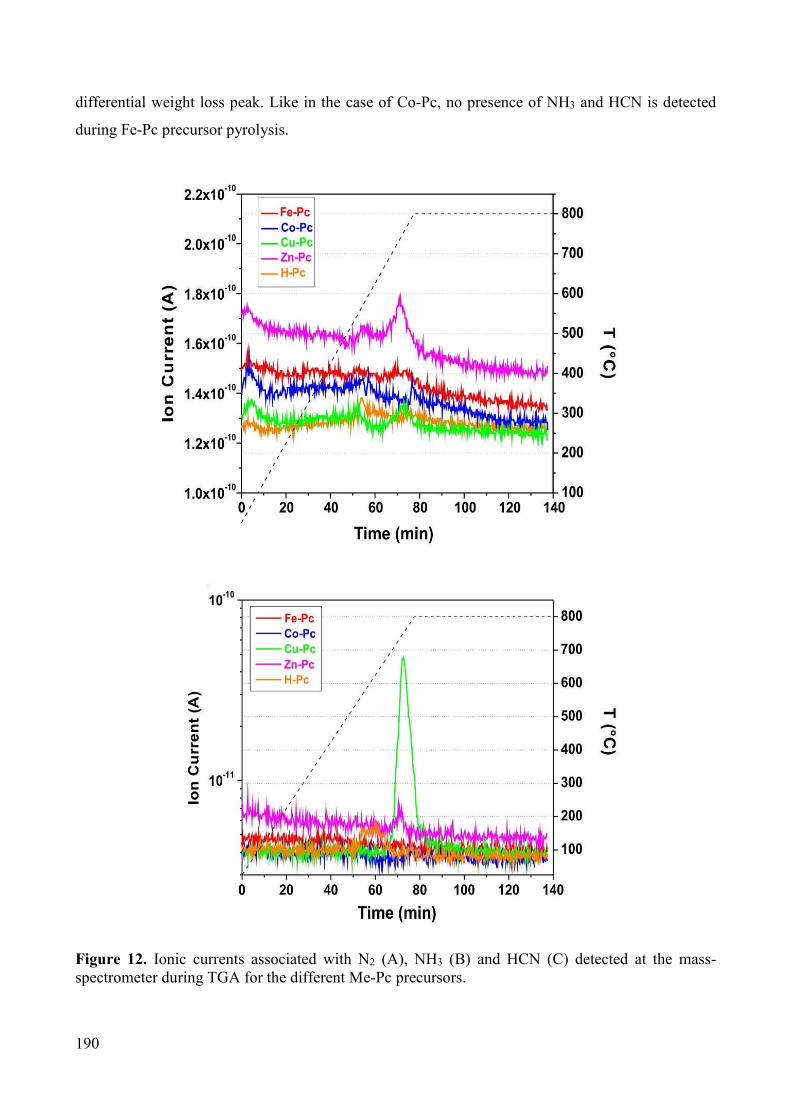
190
differential weight loss peak. Like in the case of Co-Pc, no presence of NH3 and HCN is detected
during Fe-Pc precursor pyrolysis.
Figure 12. Ionic currents associated with N2 (A), NH3 (B) and HCN (C) detected at the mass-spectrometer during TGA for the different Me-Pc precursors.

191
By concluding, the presence of the different transition metals ions coordinated with N atoms in the
phthalocyanine macrocycle center influences the morphology, the chemical composition and the
ORR catalytic activity of the final catalysts. These properties are related with different trends of the
weight loss and with the formation of gaseous products in different amounts and at different
temperatures during the pyrolysis. However, until now there is a lack in the literature about detailed
in-situ studies of the pyrolyzation of C-, N- and transition metals-containing precursors for the
preparation of NPMC for ORR. Therefore, further investigation on other precursors is necessary in
order to understand if the behavior during the pyrolysis in terms of weight loss and gas products is a
key factor towards the synthesis of more active M-N-C catalysts.
More generally, some considerations can be made about the decomposition during the pyrolysis
process of Me-N-C containing macromolecules used as precursor. To produce active ORR non-
precious metal catalysts, it is crucial to have a clear understanding of the process forming active
ensembles during pyrolyzation (decomposing of the macromolecules). The macrocyclic complex can
generally contain atoms of transition metal (Fe, Co, etc.), nitrogen, hydrogen, carbon. Sulfur and
oxygen atoms could also be present in some precursors. During the decomposition of a
macromolecule complex, for example a Me-Pc, different reactions occur in presence of an inert gas
[30,57,64].
T: 20 – 150 °C ∙ → + (A)
T: 120 – 700 °C → # + ↑ + ↑ + ↑ + ↑ (B)
T: 400 – 600 °C # → − / + ↑ (C)
T: 450 – 800 °C # + − / → ↑ (D)
T: 550 – 800 °C # + − / → ↑ (E)
T: 550 – 800 °C # + − / → ↑ (F)
In a first step, reaction (A), the water adsorbed by the macromolecule is released by evaporation in
the temperature range of 20-150 °C.
After water evaporation, sublimation of the macromolecule complex occurs, in a temperature range
depending on the nature of the macromolecule itself. Contemporary to the sublimation, the
macromolecule undergoes to a partial decomposition of its structure in the range of 120-700 °C,
reaction (B), with the release of gases as ammonia, HCN, hydrogen, volatile short hydrocarbons
(CxHy like compounds).
In parallel to reaction (B), various recombinations of carbon and nitrogen (and oxygen if present in
the starting macromolecule) give rise to different nitrogen-doped carbon structures, generally
indicated as MeCN#.

192
According to the literature [32,64], the formation of Fe-NX/C active ensembles require the
coordination of Me(II) with pyridinic nitrogen over a - type carbon sheet in the range of 400 – 600
°C, reaction (C). The decomposition of the nitrogen-doped carbon structures FeCN# continues even
at higher temperatures, with the release of hydrogen in the range of 450 – 800 °C, reaction (D), of
HCN in the range of 550 – 800 °C, reaction (E), of ammonia in the range 550 – 800 °C, reaction (F).
These steps are experimentally visible by the differential thermogravimetric plus mass spectroscopy
analysis (TGA-MS) of Me-Pc macrocyclic complexes pyrolyzed under inert atmosphere up to 800
°C (Figure 10 and 12).
The structural rearrangement of the catalyst at high temperature as per reactions (D) to (F) involves
the partial loss of active ensembles already formed. Since forming active ensembles is the major task
in the synthesis of these NPMC, a natural question arises: why do not stop the pyrolyzation in the
range of 400 – 600 °C, as per reaction (C) ? The answer is not obvious. The forthcoming processes
in the temperature range of 450 – 800 °C, reactions (D) to (F), release gases that actually can perforate
the nitrogen-doped carbon matrix of the forming catalyst, by further increasing porosity on the
catalyst itself. This is a crucial step to increase accessibility of the reactants for ORR. Thus, the
compromise between increasing accessibility through the raise of the porosity, and destroying part of
the already formed active ensembles is a key-factor to have good electrochemical activity. In an ideal
situation, the formation of active ensembles should be concurrent with porosity formation. A good
approach to preserve as much as possible active ensembles should be the use of macromolecules able
to form the pores at lower temperatures, to reduce the temperature of the pyrolyzation process.
Considering the morphology of the catalyst, a variety of carbon structures/configurations can be
obtained during the pyrolyzation, because of the action of the gases released. The carbon growing
mechanism depends upon to the graphitization process, the metal used, and the pyrolyzation
temperature as well, as shown in the literature [19]. The use of various metals (Fe, Co, Zn, Cu, etc.)
influences the formation of the active ensembles, as well: each metal can act as a “catalyst” itself, to
enhance or depress the release of gases during the pyrolysis, leading to a final catalyst structure with
higher or lower porosity, and more or less active toward ORR.
Another process that can occur during the pyrolyzation is the metal carbide formation, together with
metal encapsulation into carbon sheets, as reported by [31,32,64,65]. This process takes place in the
range of 520 – 650 °C, as shown in reaction (F), if oxygen atoms are already available in the starting
macromolecule used to synthesize the catalyst:
T: 520 – 650 °C + → ↓ + / + ↑ (F)
Metal carbides do not play an active role in the ORR reaction mechanisms, whereas encapsulated
metal nanoparticles MeNP/C can be considered as active ensembles as well, together with Me-N4/C

193
active ensembles, in acid environment. Specifically, according to the literature, on Fe-Nx-C catalysts,
the Fe(II)-N4/C active ensemble is involved in the starting process of oxygen adsorption [66–68]. If
on this site the partial 2 electrons reduction to H2O2 occurs, the intermediate H2O2 requires a second
active site, to ensure the subsequent reduction to the 4 electrons product (H2O), otherwise H2O2
desorbs directly [68]. This site can be the encapsulated FeNP/C, which must be adjacent to a Fe(II)-
N4/C active ensemble.
Furthermore, the particle size of the FeNP metal in the catalyst can be controlled by tuning the heating
scan rate during the pyrolyzation [69]. In fact, the particle site (iron in this case) results smaller if fast
heating is applied (usually more than 10 °C min–1), as reported in the literature [1,18,46,68,70].
3.2. RDE measurements – Acid medium.
3.2.1. Preliminary electrode optimization: catalyst loading on the electrode and Nafion-to-catalyst
ratio in the ink.
A preliminary test on the preparation of the working electrode for RDE tests was performed using the
Fe-N-C catalyst. The first part of the optimization was the testing of different catalyst loadings
deposited on the glassy carbon surface of the RDE. The chosen amounts were determined form the
ink density, that is, the catalyst mass content per volume of ink (mg mL-1). The catalyst ink was
prepared as described in the experimental section (Paragraph 2.4.1). Therefore, according to this ink
formulation, five different electrodes were prepared, by pipetting 1 – 2 – 3 – 4 and 5 µL of ink on the
RDE. These ink volumes result in 0.16 – 0.32 – 0.48 – 0.64 and 0.80 mg of ink per cm2 geometric
electrode area. Then, electrode polarization curves were recorded in O2-saturated electrolyte with a
rotation speed of 900 rpm. As shown in Figure 13 A, better results were obtained with increasing the
catalyst loading from 0.16 to 0.64 mg cm-2. Then, no more improvement was obtained with a further
increase to 0.80 mg cm-2.
To eliminate the effects of the mass transport limitations, the kinetic currents were calculated using
equation (1) [39,71]:
= −∙
(1)
Where: ik is mass transport-corrected current density, i is the measured current density, and iL is the
limiting current density measured in the plateau region of the polarization curve at high overpotential.
A correction for the ohmic drop was also done, based on the resistance values obtained by the
impedance measurements as described in the experimental section. The as-calculated ik values can be
transformed in specific mass current densities (A g-1), simply dividing by the catalyst loading on the
electrode (mg cm-2). The as calculated potential vs logarithm of specific mass current density plot is
shown in Figure 13 B.

194
Figure 13. (A) Staircase voltammetries (10 mV potential step, 30 s holding time) of Fe-N-C catalyst in O2-saturated 0.5 M H2SO4 at 900 rpm with different catalyst loadings and catalyst ink with NCR = 0.2. (B) Tafel plot obtained from polarization curves in Figure 13 A after mass-transport correction and normalization per mass of catalyst deposited on the electrode.
It can be noticed that the differences found in the ORR measurements with different catalyst loadings
(Fig. 13A) was reduced after the mass transport correction and the current density normalization per
mass of catalyst, see Figure 13B. These results are also found by Chlistunoff [72], and will be
explained more in detail afterwards in Paragraph 3.2.2. However, observing Figure 13 B, the results
with 0.64 mg cm2 catalyst loading are still slightly better than the others. Therefore, if not differently
stated, the catalyst loading used hereafter for the RDE experiments will be 0.64 mg cm2.
In the second part of the optimization study, the effect of the Nafion-to-Catalyst ratio (NCR) was
investigated, maintaining fixed at 0.64 mg cm2 the catalyst loading on the electrode. Different inks
were prepared, as it was described in the experimental section, according to the desired NCR. Four
different NCR were used: 0.1 – 0.2 – 0.33 and 0.5. As shown in Figure 14, in spite of the constant
catalyst loading, the capacitive currents vary changing the NCR, having a maximum for NCR = 0.2.
The influence of the Nafion ionomer on the capacitive current could be linked to the pseudo-
capacitance phenomena, to modifications of the contact interface between the carbon surface and the
electrolyte [73,74]. However, the Nafion ionomer not only provides proton conductivity but, and
maybe more importantly in the RDE system, also acts as a binder for the catalytic particles, causing
modifications of the percolating network for electrons and/or protons within the catalyst layer [74].
Therefore, the decrease in the capacitive current density with the increase of NCR can be explained
by the formation of a thick Nafion film which encapsulate some of the catalytic particles, causing a
loss of electrical contact with the electrolyte. Similar results were also found in the literature [38].
0.0 0.1 0.2 0.3 0.4 0.5 0.6 0.7 0.8 0.9 1.0 1.1 1.2
-4.0
-3.5
-3.0
-2.5
-2.0
-1.5
-1.0
-0.5
0.0
i (m
A c
m-2)
E vs RHE (V)
0.16 mg cm-2
0.32 mg cm-2
0.48 mg cm-2
0.64 mg cm-2
0.80 mg cm-2
0.01 0.1 1 10 1000.4
0.5
0.6
0.7
0.8
0.9 0.16 mg cm-2
0.32 mg cm-2
0.48 mg cm-2
0.64 mg cm-2
0.80 mg cm-2
E v
s R
HE
(V
)
imass
(A g-1)
A B

195
Figure 14. CV of Fe-N-C catalyst with ink prepared with different NCR recorded in N2-saturated 0.5 M H2SO4 solutions at 10 mVs-1 potential scan rate. Catalyst loading 0.64 mg cm-2.
The ORR tests (Figure 15) show that the different NCR also cause variations in the ORR activity of
the Fe-N-C catalyst. The better performance is obtained with NCR = 0.2. The mass-transport
corrected kinetic current density was also calculated using equation (1) as described before. The
results are shown in Figure 15 B. The differences between the different NCR are less evident in the
kinetically controlled region (low overpotentials), but they become more evident in the mixed kinetic-
diffusion controlled region and in the diffusion-limited current density region at higher overpotentials.
By increasing the NCR to 0.33 and 0.5, the diffusion-limited current density slightly decreases. This
effect can be explained by the formation of a thick Nafion film around catalytic particles, which limits
adsorption/desorption phenomena [38]. Also with a lower NCR of 0.1, the performance was worse.
This fact could be likely related with the binding-effect of the Nafion in the catalyst layer. In the
literature, the effect of NCR on ink formulation has been studied, with the NCR mass ratio varying
from 0.1 to 1.5 [36,38,74–76]. The optimum NCR for ORR activity depends on the nature of the
different catalysts characteristics (i.e. active sites, porosity), which play a crucial role in the final
activity.
Since the highest activity for this Fe-N-C catalyst was obtained with a NCR value of 0.2, this NCR
was used for all of the tests in the present work, considering that the other Me-N-C catalysts have
similar morphological characteristics.
0.0 0.1 0.2 0.3 0.4 0.5 0.6 0.7 0.8 0.9 1.0 1.1 1.2-1.5
-1.0
-0.5
0.0
0.5
1.0
1.5
i (m
A c
m-2)
E vs RHE (V)
NCR = 0.1 NCR = 0.2 NCR = 0.33 NCR = 0.5
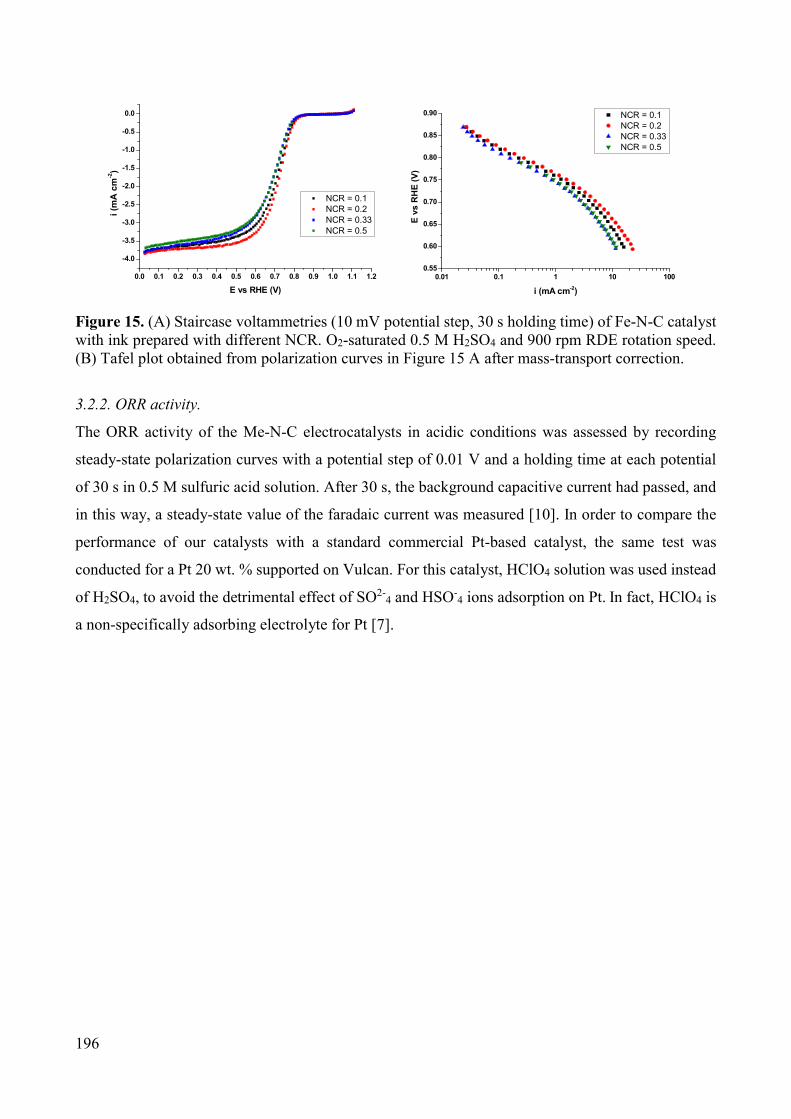
196
Figure 15. (A) Staircase voltammetries (10 mV potential step, 30 s holding time) of Fe-N-C catalyst with ink prepared with different NCR. O2-saturated 0.5 M H2SO4 and 900 rpm RDE rotation speed. (B) Tafel plot obtained from polarization curves in Figure 15 A after mass-transport correction.
3.2.2. ORR activity.
The ORR activity of the Me-N-C electrocatalysts in acidic conditions was assessed by recording
steady-state polarization curves with a potential step of 0.01 V and a holding time at each potential
of 30 s in 0.5 M sulfuric acid solution. After 30 s, the background capacitive current had passed, and
in this way, a steady-state value of the faradaic current was measured [10]. In order to compare the
performance of our catalysts with a standard commercial Pt-based catalyst, the same test was
conducted for a Pt 20 wt. % supported on Vulcan. For this catalyst, HClO4 solution was used instead
of H2SO4, to avoid the detrimental effect of SO2-4 and HSO-
4 ions adsorption on Pt. In fact, HClO4 is
a non-specifically adsorbing electrolyte for Pt [7].
0.0 0.1 0.2 0.3 0.4 0.5 0.6 0.7 0.8 0.9 1.0 1.1 1.2
-4.0
-3.5
-3.0
-2.5
-2.0
-1.5
-1.0
-0.5
0.0
NCR = 0.1 NCR = 0.2 NCR = 0.33 NCR = 0.5
i (m
A c
m-2)
E vs RHE (V)
0.01 0.1 1 10 1000.55
0.60
0.65
0.70
0.75
0.80
0.85
0.90 NCR = 0.1 NCR = 0.2 NCR = 0.33 NCR = 0.5
E v
s R
HE
(V
)
i (mA cm-2)

197
Figure 16. Staircase voltammetries (10 mV potential step, 30 s holding time) of the Me-N-C catalysts (Me = Fe, Co, Cu, Zn, H) recorded in O2-saturated 0.5 M H2SO4 at 900 rpm RDE rotation speed. The staircase voltammetry of a commercial Pt catalyst (Pt 20 wt. % on Vulcan, Quintech®) in both cathodic and anodic scan directions is also shown for comparison. For Pt catalyst the electrolyte solution was 1 M HClO4.
Starting from the data in Figure 16, Tafel slopes, after correction for mas-transport limitation (as
described in Paragraph 3.2.1), cathodic transfer coefficients and exchange current densities of the
different catalysts were calculated and these results are summarized in Table 4.
According to the IUPAC definition [77,78] the cathodic transfer coefficient αc is defined as follows:
= −
||
(2)
Where: E is the applied potential, R is the gas constant, T is the absolute temperature, F is the Faraday
constant and ic is the cathodic current density. Since the symbol ln|ic| implies that the argument of the
logarithm is of dimension one, the ic value is ideally divided by the corresponding unit, e.g., ln(|ic| /
mA cm–2). Therefore, in practice, αc is defined as the reciprocal of the corresponding Tafel slope, –
dE/dln|ic|, made dimensionless by the multiplying factor RT/F [cit. IUPAC recommendation].
Other important parameters which define the performance of an ORR catalyst are the onset potential
(Eon) and the half-wave potential (E1/2). Eon is defined as the potential required to generate a current
density of 0.1 mAcm-2 in a steady-state RDE experiment [46]. E1/2 is the potential required to have
half the maximum current density in the polarization curve.
0.0 0.1 0.2 0.3 0.4 0.5 0.6 0.7 0.8 0.9 1.0 1.1 1.2-4.0
-3.5
-3.0
-2.5
-2.0
-1.5
-1.0
-0.5
0.0
i (m
A c
m-2)
E vs RHE (V)
Fe-N-C Co-N-C Cu-N-C Zn-N-C H-N-C Pt anod scan Pt cath scan
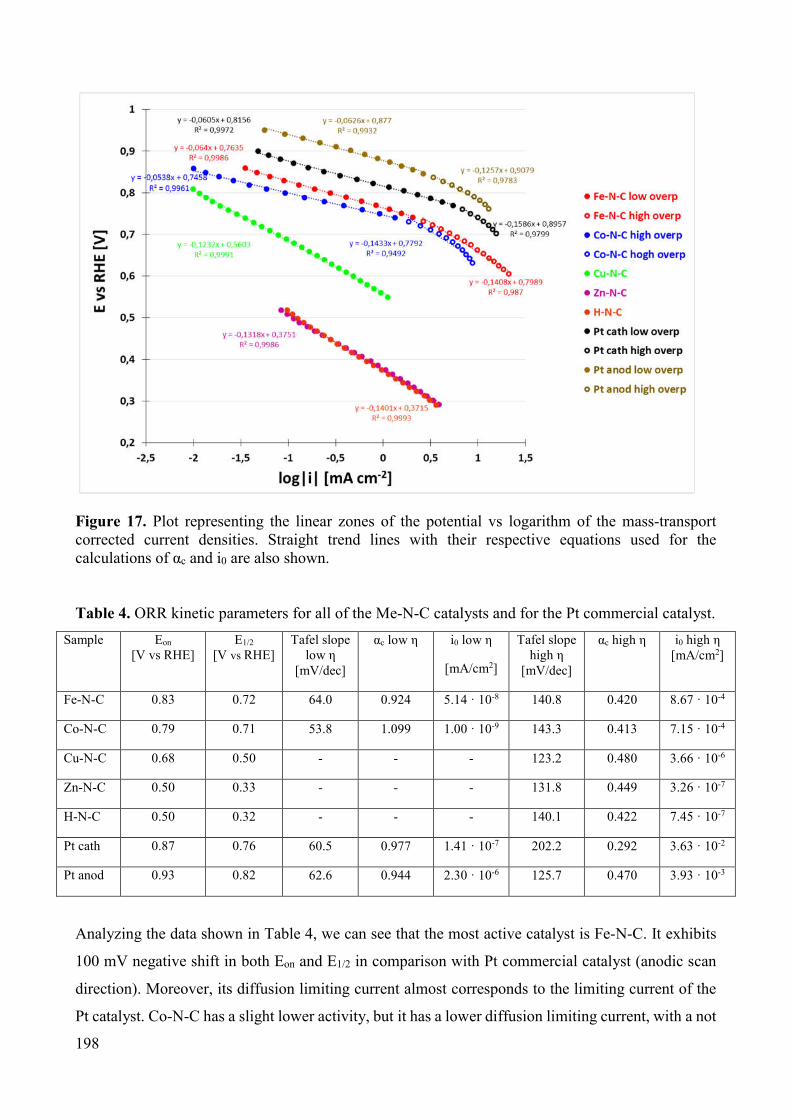
198
Figure 17. Plot representing the linear zones of the potential vs logarithm of the mass-transport corrected current densities. Straight trend lines with their respective equations used for the calculations of αc and i0 are also shown. Table 4. ORR kinetic parameters for all of the Me-N-C catalysts and for the Pt commercial catalyst.
Sample Eon [V vs RHE]
E1/2 [V vs RHE]
Tafel slope low η
[mV/dec]
αc low η i0 low η
[mA/cm2]
Tafel slope high η
[mV/dec]
αc high η i0 high η [mA/cm2]
Fe-N-C 0.83 0.72 64.0 0.924 5.14 · 10-8 140.8 0.420 8.67 · 10-4
Co-N-C 0.79 0.71 53.8 1.099 1.00 · 10-9 143.3 0.413 7.15 · 10-4
Cu-N-C 0.68 0.50 - - - 123.2 0.480 3.66 · 10-6
Zn-N-C 0.50 0.33 - - - 131.8 0.449 3.26 · 10-7
H-N-C 0.50 0.32 - - - 140.1 0.422 7.45 · 10-7
Pt cath 0.87 0.76 60.5 0.977 1.41 · 10-7 202.2 0.292 3.63 · 10-2
Pt anod 0.93 0.82 62.6 0.944 2.30 · 10-6 125.7 0.470 3.93 · 10-3
Analyzing the data shown in Table 4, we can see that the most active catalyst is Fe-N-C. It exhibits
100 mV negative shift in both Eon and E1/2 in comparison with Pt commercial catalyst (anodic scan
direction). Moreover, its diffusion limiting current almost corresponds to the limiting current of the
Pt catalyst. Co-N-C has a slight lower activity, but it has a lower diffusion limiting current, with a not

199
well-developed plateau region. Cu-N-C catalyst is considerably less active than the two previous
catalysts, having about 250 mV lower Eon and 320 mV lower E1/2 than the Pt commercial catalyst.
Zn-N-C and H-N-C have a very poor activity in acid medium, both showing 430 mV lower Eon and
about 500 mV lower E1/2 in comparison with Pt catalyst.
It is remarkable that Zn-N-C and H-N-C catalysts exhibit almost the same ORR activity, being their
polarization curves praxctically superimposed (see Figure 16). This suggest that even if the Zn
presence leads to considerable modifications in the final catalyst chemical-physical properties (e.g.
the total amount of N incorporated), this will have practically no influence on the ORR activity in
acidic medium. This finding confirms the important role played by the most effective transition metals
(Fe and Co) in the formation of the ORR active sites during the heat treatment. Copper also has certain
effectiveness in active sites formation, but considerably lower than cobalt and iron.
In the Tafel plots (see Figure 17), for both Fe-N-C and Co-N-C two different Tafel slope zones have
been identified. One at low overpotentials (approximately between 0.85 and 0.75 V vs RHE) and a
second one at higher overpotentials (approximately between 0.75 and 0.60 V vs RHE). At low
overpotentials the Tafel slope is lower, being approximately of 60 mV dec-1. At high overpotentials
the slope becomes higher, and the linear trend is less evident, suggesting a changing in the reaction
mechanism occurring in this zone [72]. However, a linearization was made also in this zone, in spite
of the lower coefficient of determination (R2). The Tafel slopes are around 140 mV dec-1. An
analogous two slope behavior can be found in the literature for C-N based NPMC in acid conditions
[72].
This behavior of the Fe-N-C and Co-N-C catalysts can be compared with the Pt-based catalysts. In
fact, it is widely reported in the literature that the measured Tafel slope for single crystal Pt electrodes
[79], polycrystalline Pt [80] and carbon supported Pt catalysts [81] suffers a shift from about 60 mV
dec-1 at low overpotential to 120 mV dec-1 at higher overpotential [7,82]. This effect is explained for
Pt in terms of surface active site partial blocking by oxygen-containing reaction intermediates varying
with the potential. It influences the reaction rate at small overpotentials even when the removal of the
intermediates involves fast quasi-equilibrium steps, and if the initial electron transfer is the rate
determining step (RDS) of the reaction over the whole potential range considered. In particular, the
change of the Tafel slope from 60 to 120 mV dec-1 at high currents at Pt surface (both Pt smooth
surface and small Pt particles) was explained by the change in Temkin to Langmuir adsorption
conditions (i.e., by the decrease in the surface coverage) but not to the change in rate-determining
step [83–87].
The coupling of such equilibrium processes to the rate-limiting step leads to a coverage-dependent,
and hence potential-dependent apparent Tafel slope [82].

200
When estimating ORR activity for Pt-based catalysts, usually anodic scan direction is analyzed as, in
this case, activity is not affected by oxide layer which is slowly removed when potential is decreasing.
Analyzing both anodic and cathodic sweep directions, a certain hysteresis is observed. This is
commonly ascribed to slow removal of surface oxides which hinders ORR during negative going
sweep [88].
Considering the exchange current densities in the low overpotential region, Fe-N-C has an almost
double i0 value than Co-N-C- These values are two orders of magnitude lower than for Pt catalyst
(anodic scan direction). Comparable results can be found in the literature [89]. In the high
overpotential region the i0 values for Fe-N-C and Co-N-C are closer, and still almost one order of
magnitude lower than for Pt catalyst.
Otherwise, Cu-N-C catalyst does not exhibit this double-solpe behavior. For this catalyst, a single
linear region with a slope value of about 123 mV dec-1 is observed along all the potential range from
0.8 to 0.55 V vs RHE. Comparing the exchange current density of Cu-N-C with the values in the high
overpotential region for Fe- and Co-N-C, the former is almost two orders of magnitude lower than
the latter.
Zn-N-C and H-N-C catalysts also show a single-slope behavior in the potential range 0.5 – 0.3 V vs
RHE, with a Tafel slope of 132 and 140 mV dec-1, respectively. In terms of exchange current
densities, their values are one order of magnitude lower than for Cu-N-C.
Since the ORR activity of Zn-N-C and H-N-C catalysts is very poor and therefore they are not
interesting for being used as cathode materials in PEMFC, hereafter we will not consider these two
catalysts for the investigation of the other kinetic aspects of the ORR in acid medium.
To investigate more in detail the effect of the catalyst loading on the ORR kinetic, we recorded the
polarization curve in RDE at 900 rpm rotation speed with two different ink quantities deposited on
the electrode for each one of Fe-, Co- and Cu-N-C catalyst. These polarization curves are shown in
Figure 16 for all of the catalysts (at 0.64 mg cm2 loading) and in Figure 13 A for Fe-N-C with 0.16
mg cm2 loading. For Co- and Cu-N-C with 0.32 mg cm2 loading the polarization curves are not
reported here. The respective Tafel plots are shown in Figure 18.
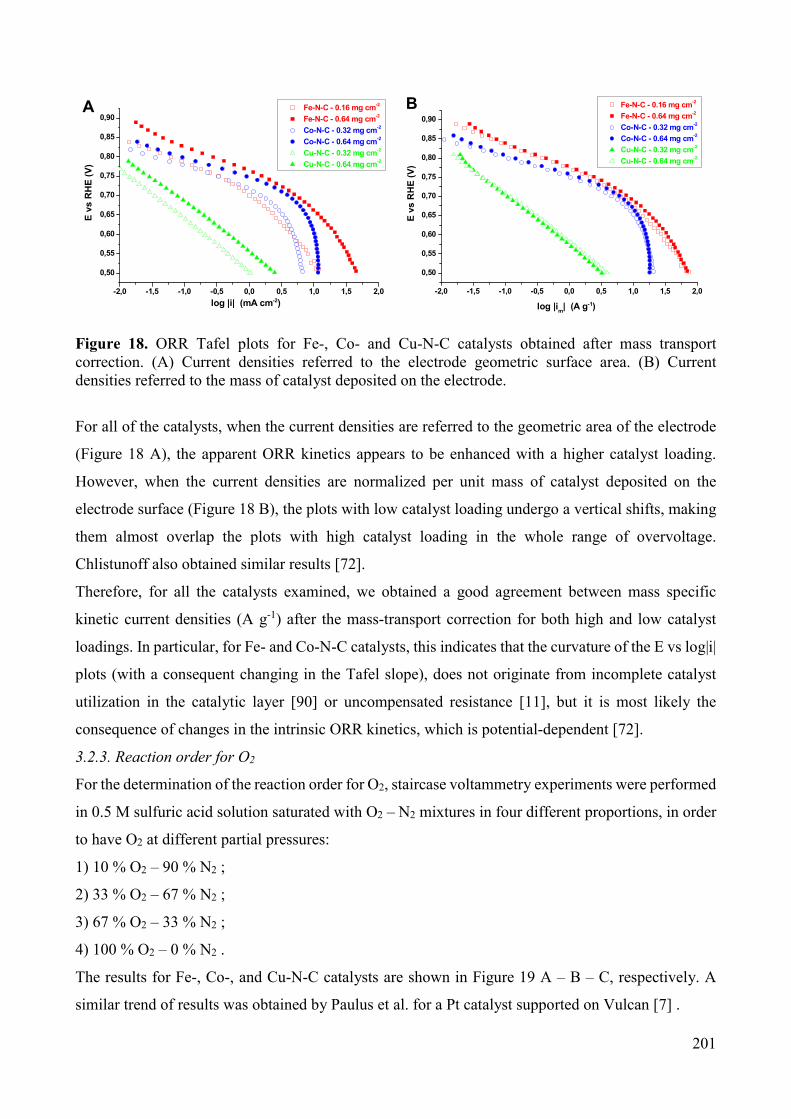
201
Figure 18. ORR Tafel plots for Fe-, Co- and Cu-N-C catalysts obtained after mass transport correction. (A) Current densities referred to the electrode geometric surface area. (B) Current densities referred to the mass of catalyst deposited on the electrode.
For all of the catalysts, when the current densities are referred to the geometric area of the electrode
(Figure 18 A), the apparent ORR kinetics appears to be enhanced with a higher catalyst loading.
However, when the current densities are normalized per unit mass of catalyst deposited on the
electrode surface (Figure 18 B), the plots with low catalyst loading undergo a vertical shifts, making
them almost overlap the plots with high catalyst loading in the whole range of overvoltage.
Chlistunoff also obtained similar results [72].
Therefore, for all the catalysts examined, we obtained a good agreement between mass specific
kinetic current densities (A g-1) after the mass-transport correction for both high and low catalyst
loadings. In particular, for Fe- and Co-N-C catalysts, this indicates that the curvature of the E vs log|i|
plots (with a consequent changing in the Tafel slope), does not originate from incomplete catalyst
utilization in the catalytic layer [90] or uncompensated resistance [11], but it is most likely the
consequence of changes in the intrinsic ORR kinetics, which is potential-dependent [72].
3.2.3. Reaction order for O2
For the determination of the reaction order for O2, staircase voltammetry experiments were performed
in 0.5 M sulfuric acid solution saturated with O2 – N2 mixtures in four different proportions, in order
to have O2 at different partial pressures:
1) 10 % O2 – 90 % N2 ;
2) 33 % O2 – 67 % N2 ;
3) 67 % O2 – 33 % N2 ;
4) 100 % O2 – 0 % N2 .
The results for Fe-, Co-, and Cu-N-C catalysts are shown in Figure 19 A – B – C, respectively. A
similar trend of results was obtained by Paulus et al. for a Pt catalyst supported on Vulcan [7] .
-2,0 -1,5 -1,0 -0,5 0,0 0,5 1,0 1,5 2,0
0,50
0,55
0,60
0,65
0,70
0,75
0,80
0,85
0,90 Fe-N-C - 0.16 mg cm
-2
Fe-N-C - 0.64 mg cm-2
Co-N-C - 0.32 mg cm-2
Co-N-C - 0.64 mg cm-2
Cu-N-C - 0.32 mg cm-2
Cu-N-C - 0.64 mg cm-2
E v
s R
HE
(V
)
log |i| (mA cm-2)
A
-2,0 -1,5 -1,0 -0,5 0,0 0,5 1,0 1,5 2,0
0,50
0,55
0,60
0,65
0,70
0,75
0,80
0,85
0,90
B Fe-N-C - 0.16 mg cm-2
Fe-N-C - 0.64 mg cm-2
Co-N-C - 0.32 mg cm-2
Co-N-C - 0.64 mg cm-2
Cu-N-C - 0.32 mg cm-2
Cu-N-C - 0.64 mg cm-2
E v
s R
HE
(V
)
log |im| (A g-1)

202
Figure 19. Staircase voltammetries (10 mV potential step, 10 s holding time) of Fe-N-C (A), Co-N-C (B), Cu-N-C (C) catalysts recorded in 0.5 M H2SO4 at 900 rpm RDE rotation speed at different O2 partial pressures at 25°C. The O2 solubility in moderately concentrated sulfuric acid aqueous solutions follows the Henry’s
law [91,92], and therefore is decreasing linearly with the O2 partial pressure.
The reaction order for oxygen can be defined as follows:
=
| |
,, (3)
Where: RO2 is the reaction order for oxygen, im is the mass-transport corrected current density, C is
the O2 concentration in the electrolyte solution, E is the electrode potential, T is the temperature.
0.0 0.1 0.2 0.3 0.4 0.5 0.6 0.7 0.8 0.9 1.0 1.1 1.2-4.0
-3.5
-3.0
-2.5
-2.0
-1.5
-1.0
-0.5
0.0
i (m
A c
m-2)
E vs RHE (V)
10% O2
33% O2
67% O2
100% O2
A
0.0 0.1 0.2 0.3 0.4 0.5 0.6 0.7 0.8 0.9 1.0 1.1 1.2-4.0
-3.5
-3.0
-2.5
-2.0
-1.5
-1.0
-0.5
0.0B
i (m
A c
m-2)
E vs RHE (V)
10% O2
33% O2
67% O2
100% O2
0.0 0.1 0.2 0.3 0.4 0.5 0.6 0.7 0.8 0.9 1.0 1.1 1.2-4.0
-3.5
-3.0
-2.5
-2.0
-1.5
-1.0
-0.5
0.0C
i (m
A c
m-2)
E vs RHE (V)
10% O2
33% O2
67% O2
100% O2

203
Therefore, the reaction order can be determined from the slope of a double-logarithmic plot of im vs.
C*, where C* is defined as the O2 concentration normalized to the O2 saturation concentration in the
electrolyte for pure O2 at 1 bar, C0 (being C0 = 1.05 mM in 0.5 M H2SO4 aqueous solution). As
shown in the plots of Figure 20 and summarized in Table 5, for all the three catalysts the reaction
order for O2 seems not to be constant in the mixed kinetic-diffusion control potential range.
Figure 20. Double-logarithmic plots of mass transport corrected current density in function of O2 concentration in the electrolyte for Fe-N-C (A), Co-N-C (B) and Cu-N-C (C) catalysts.
In particular, for potentials more close to the onset potential, the reaction order is about 0.5. Then,
as the overpotential increases, the reaction order increases as well. Considering the most active
catalysts, that is Fe-N-C, the reaction order reaches 1 at 0.55 V vs RHE, where the purely diffusion
limited current “plateau” starts. For Co-N-C and Cu-N-C catalysts, the reaction order increase is
less marked, getting a value close to 0.8 at 0.55 and 0.45 V vs RHE, respectively.
Some studies about reaction order for oxygen have been done for Pt-based catalysts in RDE [7,93].
The reaction order values are all close to unity in all the studied potential ranges.
Table 5. Reaction orders for oxygen calculated at different potentials in the mixed kinetic-diffusion control zone for Fe-N-C, Co-N-C and Cu-N-C catalysts.
Catalyst E vs RHE [V] Fe-N-C Co-N-C Cu-N-C
0.75 0.48 0.61 - 0.70 0.59 0.75 - 0.65 0.75 0.80 0.47 0.60 0.89 0.83 0.58 0.55 0.99 0.85 0.63 0.50 - - 0.71 0.45 - - 0.78
Unfortunately in the literature there is a lack of studies reporting the reaction order for O2 for this
type of carbon-nitrogen-transition metal based NPMC in acidic conditions. Chlistunoff reported a
0.1 10.1
1
10
100A 0.75 V 0.70 V 0.65 V 0.60 V
0.55 V
i m (
mA
cm
-2)
C* (mM)0.1 1
0.1
1
10
100B
i m (
mA
cm
-2)
C* (mM)
0.75 V 0.70 V 0.65 V 0.60 V 0.55 V
0.1 1
0.1
1
10
C 0.65 V 0.60 V 0.55 V 0.50 V 0.45 V
i m (
mA
cm
-2)
C* (mM)

204
reaction order of 1 for a pyrolyzed Fe-Polyaniline catalyst which activity was tested in oxygen and
air-saturated electrolyte [72].
3.2.4. Reaction order for H+
H+ ion, in addition to O2, is the other reactant of the ORR in acid conditions. For the determination of
the reaction order for H+, ORR activity experiments have to be performed at different H+
concentrations, that is, at different electrolyte solution pH. This is in contrast to the fact that the
determination of the order of an electrochemical reaction for one of its reactants has to be performed
at a constant electrode potential. In fact, if we use the RHE as potential reference scale, we have to
consider that this reference varies with the electrolyte solution pH of about 60 mV per pH unit.
However, the reaction order for H+ (RH+) can be expressed by the following approximate equation
[72]:
R ≅
+
.
(4)
where: i is the current density, CH+ is the molar concentration of H+ ion, ERHE is the potential measured
vs RHE, αc is the cathodic transfer coefficient, R is the gas constant and T is the absolute temperature.
Therefore, we recorded the polarization curves in RDE with three different H2SO4 concentrations:
0.1, 0.25 and 0.5 M. Since the second dissociation of H2SO4 in water at these concentrations is almost
negligible, the corresponding pH values are 1, 0.6 and 0.3, respectively. The results are shown in
Figure 21.
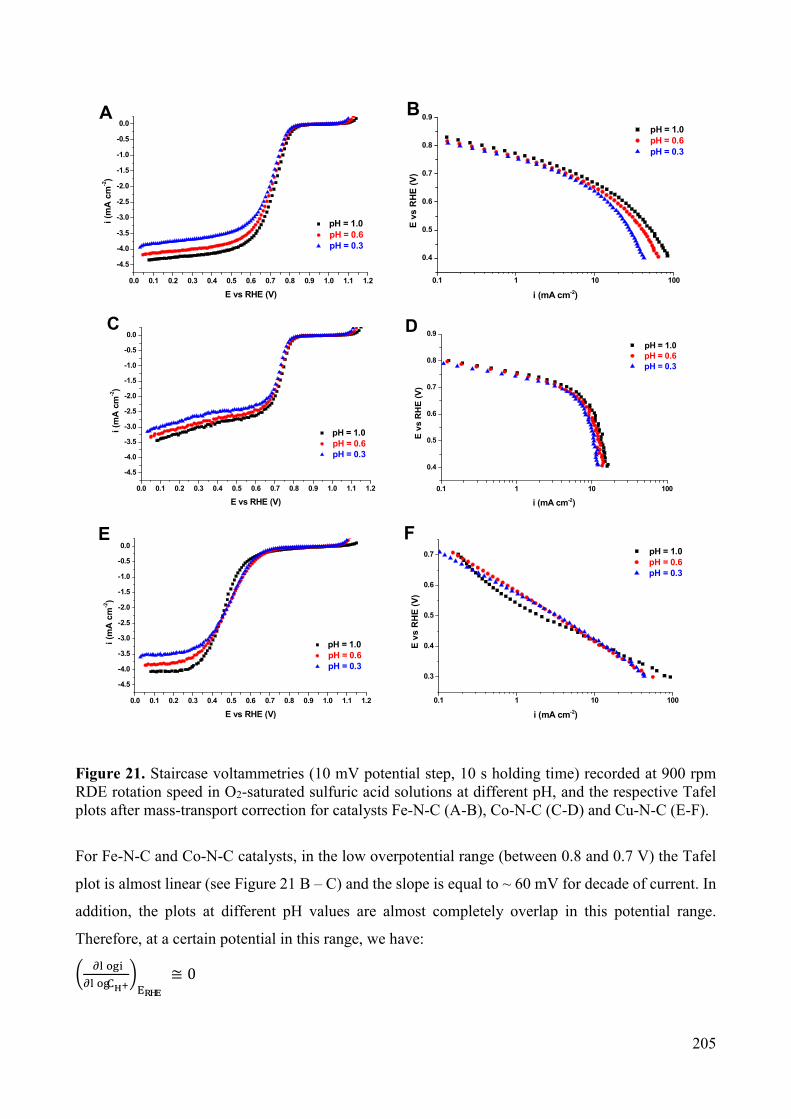
205
Figure 21. Staircase voltammetries (10 mV potential step, 10 s holding time) recorded at 900 rpm RDE rotation speed in O2-saturated sulfuric acid solutions at different pH, and the respective Tafel plots after mass-transport correction for catalysts Fe-N-C (A-B), Co-N-C (C-D) and Cu-N-C (E-F).
For Fe-N-C and Co-N-C catalysts, in the low overpotential range (between 0.8 and 0.7 V) the Tafel
plot is almost linear (see Figure 21 B – C) and the slope is equal to ~ 60 mV for decade of current. In
addition, the plots at different pH values are almost completely overlap in this potential range.
Therefore, at a certain potential in this range, we have:
≅ 0
0.0 0.1 0.2 0.3 0.4 0.5 0.6 0.7 0.8 0.9 1.0 1.1 1.2
-4.5
-4.0
-3.5
-3.0
-2.5
-2.0
-1.5
-1.0
-0.5
0.0
pH = 1.0 pH = 0.6 pH = 0.3
i (m
A c
m-2)
E vs RHE (V)
A
0.1 1 10 100
0.4
0.5
0.6
0.7
0.8
0.9B
pH = 1.0 pH = 0.6 pH = 0.3
E v
s R
HE
(V
)
i (mA cm-2)
0.0 0.1 0.2 0.3 0.4 0.5 0.6 0.7 0.8 0.9 1.0 1.1 1.2
-4.5
-4.0
-3.5
-3.0
-2.5
-2.0
-1.5
-1.0
-0.5
0.0C
pH = 1.0 pH = 0.6 pH = 0.3
i (m
A c
m-2)
E vs RHE (V)
0.1 1 10 100
0.4
0.5
0.6
0.7
0.8
0.9D
pH = 1.0 pH = 0.6 pH = 0.3
E v
s R
HE
(V
)
i (mA cm-2)
0.0 0.1 0.2 0.3 0.4 0.5 0.6 0.7 0.8 0.9 1.0 1.1 1.2
-4.5
-4.0
-3.5
-3.0
-2.5
-2.0
-1.5
-1.0
-0.5
0.0E
pH = 1.0 pH = 0.6 pH = 0.3
i (m
A c
m-2)
E vs RHE (V)
0.1 1 10 100
0.3
0.4
0.5
0.6
0.7
F pH = 1.0 pH = 0.6 pH = 0.3
E v
s R
HE
(V
)
i (mA cm-2)

206
. =
≅
≅ 60 mV dec
Therefore, the reaction order for H+ is almost equal to 1. In the same way, considering approximately
no variations of the plots with pH, the reaction order for H+ suffers a decrease as the cathodic
overpotential increase, due to the changes in the Tafel slope (see Table 4). As for the reaction order
for O2, also in this case the literature studies are scarce. Chlistunoff [72] performed a similar study
for a pyrolyzed Fe-Polyaniline catalyst, which exhibited a similar behavior. If we look at the Tafel
plots at different pH (Figure 21 B – D – F), we notice that they are not completely overlapping each
other, especially at higher overpotentials. This is most likely due to the decrease of O2 solubility with
decreasing pH in sulfuric acid solutions [91,94]. A correction for O2 solubility in solutions with
different H2SO4 concentrations should be necessary to eliminate this discrepancy. For Cu-N-C
catalyst, the same considerations can be made. It exhibits a constant Tafel slope of about 120 mV dec-
1 in the potential range between 0.60 and 0.40 V vs RHE. Thus, in this potential range, the reaction
order for H+ is 0.5.
3.2.5. Activation Energy calculation for ORR
The activation energies (Ea) are evaluated at different fixed potentials using the Arrhenius equation
in a temperature range between 10 °C and 60 °C. In performing the RDE experiments at different
temperatures two different effects must be taken into account. The first one is the enhancing effect of
the temperature increase on ORR activity, and second one is the decreasing in O2 concentration with
increased temperature. In particular, the O2 concentration in the electrolyte solution is reported to
vary from 1.38 mM at 20 °C to 0.61 mM at 60 °C [95]. Thus, to take into account this effect, the
current densities measured at different temperatures have been corrected according to the following
equation [74]:
i∗ = i ∙exp
.
(5)
Where: im is the original mass-transport corrected current density, CO2 is the actual oxygen
concentration in the liquid electrolyte at the temperature at which the measurement was done, and im*
is the corresponding current density for an oxygen concentration of 1 mM. Then, Arrhenius plots
(logarithm of current density vs. the inverse of the absolute temperature) can be made. The activation
energy can be calculated from the linearization of the Arrhenius law:
207
i∗ (T) = i
∗ (T)∙exp
. (6)
where T is the actual temperature at which the measure was done (in K), and im*(T∞) is a constant
value. The slope of the Arrhenius plots is equal to –Ea / (2.3 R).
The Tafel plots at different temperatures with the aforementioned corrections are shown in Figure 22
together with their respective Arrhenius plots, for Fe-, Co- and Cu-N-C catalysts.
The Arrhenius plots were calculated at different potentials in the kinetic and mixed kinetic-diffusion
control potential regions for the three different catalysts. The corresponding calculated activation
energies are reported in Table 6. These values are comparable with the values found in the literature
for ORR on Pt-based catalysts [7,74, 96–98]. Unfortunately, also for activation energy as well as for
the reaction order for O2 and H+, there is a lack in the literature for this type of Me-N-C
electrocatalysts. Jaouen et al. calculated the activation energy at 0.9 V for a series of pyrolyzed Fe-
N-C catalysts synthesized from carbon black, iron acetate and 1,10 phenanthroline. They obtained
values around 9 kJ mol-1 [74].
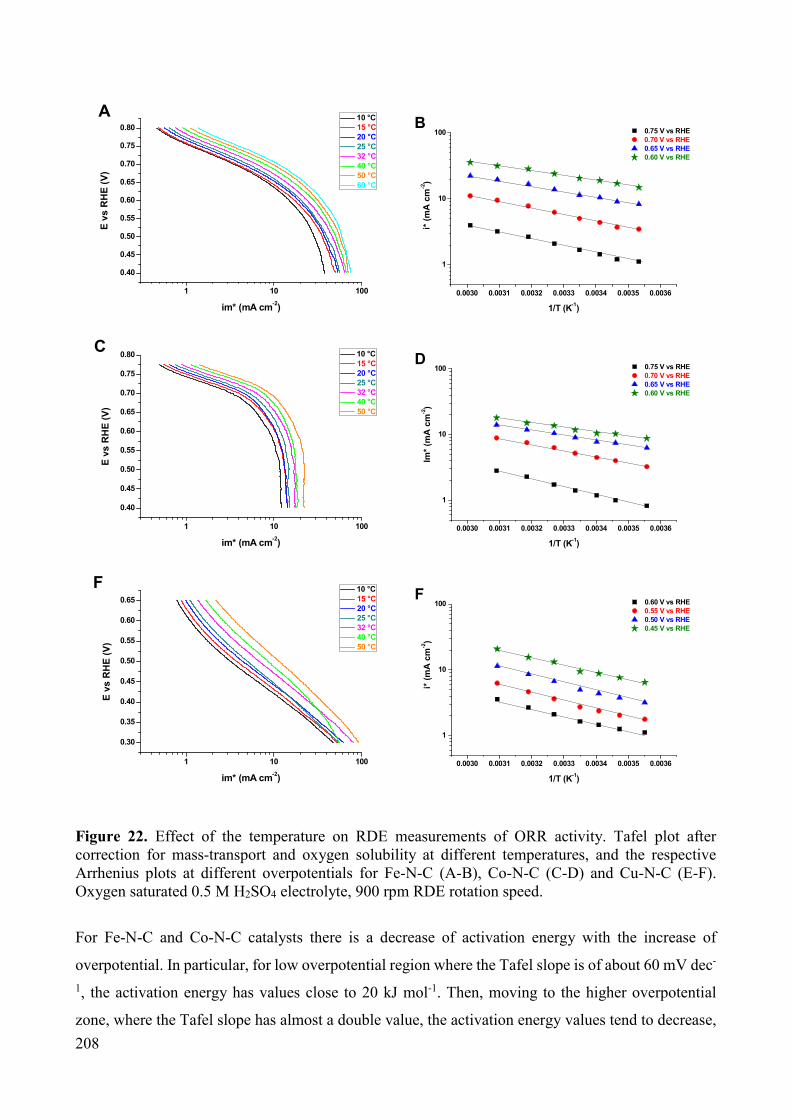
208
Figure 22. Effect of the temperature on RDE measurements of ORR activity. Tafel plot after correction for mass-transport and oxygen solubility at different temperatures, and the respective Arrhenius plots at different overpotentials for Fe-N-C (A-B), Co-N-C (C-D) and Cu-N-C (E-F). Oxygen saturated 0.5 M H2SO4 electrolyte, 900 rpm RDE rotation speed.
For Fe-N-C and Co-N-C catalysts there is a decrease of activation energy with the increase of
overpotential. In particular, for low overpotential region where the Tafel slope is of about 60 mV dec-
1, the activation energy has values close to 20 kJ mol-1. Then, moving to the higher overpotential
zone, where the Tafel slope has almost a double value, the activation energy values tend to decrease,
1 10 100
0.40
0.45
0.50
0.55
0.60
0.65
0.70
0.75
0.80
E v
s R
HE
(V
)
im* (mA cm-2)
10 °C 15 °C 20 °C 25 °C 32 °C 40 °C 50 °C 60 °C
A
0.0030 0.0031 0.0032 0.0033 0.0034 0.0035 0.0036
1
10
100B
0.75 V vs RHE 0.70 V vs RHE 0.65 V vs RHE 0.60 V vs RHE
i* (
mA
cm
-2)
1/T (K-1)
1 10 100
0.40
0.45
0.50
0.55
0.60
0.65
0.70
0.75
0.80C
E v
s R
HE
(V
)
im* (mA cm-2)
10 °C 15 °C 20 °C 25 °C 32 °C 40 °C 50 °C
0.0030 0.0031 0.0032 0.0033 0.0034 0.0035 0.0036
1
10
100D
0.75 V vs RHE 0.70 V vs RHE 0.65 V vs RHE 0.60 V vs RHE
Im*
(mA
cm
-2)
1/T (K-1)
1 10 100
0.30
0.35
0.40
0.45
0.50
0.55
0.60
0.65
F
E v
s R
HE
(V
)
im* (mA cm-2)
10 °C 15 °C 20 °C 25 °C 32 °C 40 °C 50 °C
0.0030 0.0031 0.0032 0.0033 0.0034 0.0035 0.0036
1
10
100F
0.60 V vs RHE 0.55 V vs RHE 0.50 V vs RHE 0.45 V vs RHE
i* (
mA
cm
-2)
1/T (K-1)
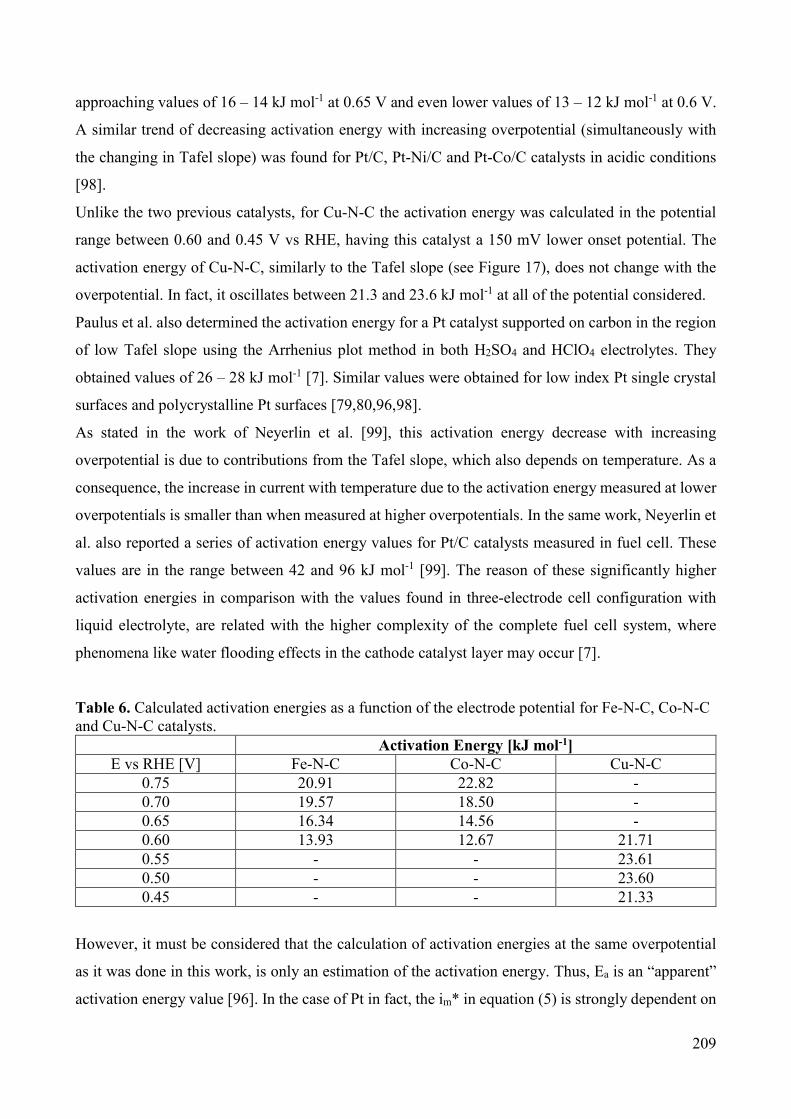
209
approaching values of 16 – 14 kJ mol-1 at 0.65 V and even lower values of 13 – 12 kJ mol-1 at 0.6 V.
A similar trend of decreasing activation energy with increasing overpotential (simultaneously with
the changing in Tafel slope) was found for Pt/C, Pt-Ni/C and Pt-Co/C catalysts in acidic conditions
[98].
Unlike the two previous catalysts, for Cu-N-C the activation energy was calculated in the potential
range between 0.60 and 0.45 V vs RHE, having this catalyst a 150 mV lower onset potential. The
activation energy of Cu-N-C, similarly to the Tafel slope (see Figure 17), does not change with the
overpotential. In fact, it oscillates between 21.3 and 23.6 kJ mol-1 at all of the potential considered.
Paulus et al. also determined the activation energy for a Pt catalyst supported on carbon in the region
of low Tafel slope using the Arrhenius plot method in both H2SO4 and HClO4 electrolytes. They
obtained values of 26 – 28 kJ mol-1 [7]. Similar values were obtained for low index Pt single crystal
surfaces and polycrystalline Pt surfaces [79,80,96,98].
As stated in the work of Neyerlin et al. [99], this activation energy decrease with increasing
overpotential is due to contributions from the Tafel slope, which also depends on temperature. As a
consequence, the increase in current with temperature due to the activation energy measured at lower
overpotentials is smaller than when measured at higher overpotentials. In the same work, Neyerlin et
al. also reported a series of activation energy values for Pt/C catalysts measured in fuel cell. These
values are in the range between 42 and 96 kJ mol-1 [99]. The reason of these significantly higher
activation energies in comparison with the values found in three-electrode cell configuration with
liquid electrolyte, are related with the higher complexity of the complete fuel cell system, where
phenomena like water flooding effects in the cathode catalyst layer may occur [7].
Table 6. Calculated activation energies as a function of the electrode potential for Fe-N-C, Co-N-C and Cu-N-C catalysts.
Activation Energy [kJ mol-1] E vs RHE [V] Fe-N-C Co-N-C Cu-N-C
0.75 20.91 22.82 - 0.70 19.57 18.50 - 0.65 16.34 14.56 - 0.60 13.93 12.67 21.71 0.55 - - 23.61 0.50 - - 23.60 0.45 - - 21.33
However, it must be considered that the calculation of activation energies at the same overpotential
as it was done in this work, is only an estimation of the activation energy. Thus, Ea is an “apparent”
activation energy value [96]. In the case of Pt in fact, the im* in equation (5) is strongly dependent on

210
the amount of oxides on the Pt surface which, in turn, is temperature-dependent, even though the
oxide coverage is considered as a preexponential term in equation (5) [96].
If one wants to make an analogy between the Pt-based catalysts and our Fe-N-C and Co-N-C catalyst,
we can speculate that the reaction mechanism could be the same:
where the first step is the adsorption of O2 on the catalyst active site: O2 O2*
followed by the first electron transfer, which is the rate determining step: O2* O2*-.
Surface coverage effects have been proposed as the reason of changes in ORR kinetic behavior on Pt
surfaces. These have been noted to accompany changes in the surface coverage of adsorbed oxygen-
containing groups, such as OH species, which can originate from both H2O and O2 [82]. These can
control the availability of the adsorption sites for of molecular O2 [96]. A clear overlap between the
onset potential of ORR and the removal of these oxygen containing species from the Pt surface is
observed [82] looking at Pt CV in de-aerated solutions and in ORR experiments in RDE. In this region
the Tafel slope change also occurs.
We can try to make a parallelism between the Pt-based catalysts and the NPMC. For example in Fe-
N-C catalysts, the presence of a redox peak in the CV (i.e. related to the Fe2+/Fe3+ couple) [72,100]
could be compared to the Pt-oxides reduction peak in the CV of Pt surface. The onset of ORR on Pt
surface is associated with the appearance of the Pt-oxides reduction peak in the CV recorded in
dearated solution, as discussed in the literature [82]. Therefore, the onset of the ORR on these NPMC
could be associated to the potential at which the redox peak starts to appear [72,100,101].
However, in our catalysts, these peaks characteristic of oxygen-containing species removal are not as
evident as for Pt in de-aerated solutions (see Figure 14). In particular, their presence could be
“masked” by the very high capacitive currents (e.g. in comparison with Vulcan, which is the usual
carbon support for Pt-based catalysts) [100] which are due to the very high specific surface area and
surface functionalization (pseudo-capacitive effects) [73] of these catalysts. However, the presence
of a broad peak in the potential range between 0.8 and 0.4 V vs RHE is detected, and it could be

211
related to phenomena analogous to the ones occurring in Pt-based catalysts, as described before. We
can state this is a way to justify the analogies between the behavior of these non-precious metal based
catalysts and the Pt-based catalysts.
3.2.6. Koutecky-Levich analysis, RRDE test and hydrogen peroxide oxidation-reduction.
In order to have some indication about the ORR reaction pathway, i.e., if the oxygen is reduced
directly to water via a direct 4 e- mechanism or via a two-step 2 e- + 2 e- mechanism with the
formation of a peroxide intermediate, or only partially to hydrogen peroxide via 2 e- mechanism, we
performed a series of electrochemical tests.
Koutecky-Levich analysis.
The first test was the Koutecky-Levich analysis. LSV were recorded in O2 saturated electrolyte at
different RDE rotation speed for Fe-, Co-, and Cu-N-C catalysts. The results are shown in Figure 23.
Looking at the LSV at different rotation speeds, for all the three catalysts the limiting current densities
are lower than those predicted by the Levich equation [102]. The variation of the current density with
the rotation speed is a direct means to investigate if the reaction occurring is under mass-transport
control of reactants diffusing from the bulk solution or under kinetic control [102]. As expected, for
all of the catalysts, there is a noticeable increase of the diffusion-limited current density with the RDE
speed. However, no one of the catalysts exhibits a perfect “plateau” in the diffusion-limited region at
high overpotentials. This effect is more evident for Co-N-C catalyst. However, a straight line trend
was obtained for the Koutecky-Levich plots of all of the catalysts, with an almost parallel slope at
different potentials [39]. Therefore we calculated the number of electrons involved in the ORR for
these catalysts. The values are summarized in Table 7.
First of all, it must be taken into account that the Koutecky-Levich theory was developed for a smooth
electrode surface [100]. However, when the catalyst loading is on the order of hundred micrograms
per cm2 geometric area of the electrode (as typically used in the literature for NPMC and also in our
tests), we cannot affirm that the catalyst film deposited on the electrode is so thin to be under the
hypothesis of validity of the K-L theory [72,103]. Therefore, some correction should be made to
consider the roughness and the thickness shortcomings of the catalyst film on the RDE [104].
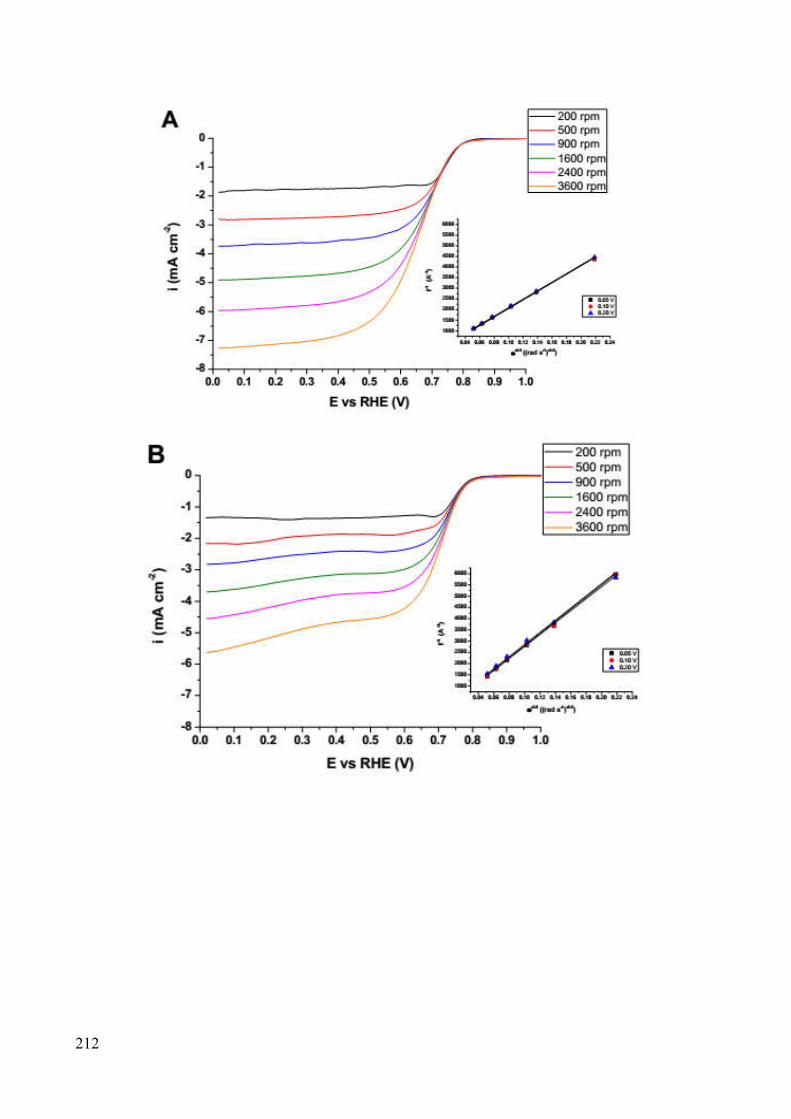
212

213
Figure 23. LSV recorded at different rotation speeds and 5 mV s-1 scan rate in O2-saturated 0.5 M H2SO4 after background capacitive current subtraction for Fe-N-C (A), Co-N-C (B) and Cu-N-C (C) catalysts. The insets show the corresponding Koutecky−Levich plots at different potentials in the diffusion-limited region. Looking at the results in Table 7, Fe-N-C seems to be the catalyst with the better performance in
terms of selectivity towards a complete 4 e- oxygen reduction, exhibiting a hydrogen peroxide
generation of about 15 molar %. Co-N-C catalyst, despite having an onset potential very close to the
Fe-N-C one, has a considerably lower selectivity, generating about 60% of H2O2. Slight lower
peroxide amounts (about 50%) are obtained for Cu-N-C, but this catalyst has a remarkably lower
onset potential in comparison to the previous two.
Table 7. Total number of electrons involved in the ORR and corresponding hydrogen peroxide generation (molar % of the reduced oxygen) for Fe-, Co- and Cu-N-C catalysts resulting from the Koutecky–Levich analysis in Figure 23.
Sample 0.05 V vs RHE 0.1 V vs RHE 0.2 V vs RHE N° of e- % H2O2 N° of e- % H2O2 N° of e- % H2O2
Fe-N-C 3.73 13.4 3.70 14.8 3.64 17.9 Co-N-C 2.71 64.6 2.75 62.5 2.87 56.4 Cu-N-C 3.09 45.4 3.05 47.3 2.97 51.3

214
H2O2 oxidation-reduction.
To investigate more in detail which is the predominant reaction pathway for ORR in these catalysts,
their activity toward the electroreduction of H2O2 in absence of O2 was assessed. LSV were performed
in deaerated electrolyte solution after the addition of hydrogen peroxide in a concentration of 1 mM,
which is very close to the concentration of O2 in saturated 0.5 M H2SO4 solution (about 1.05 mM
[94]). Moreover, this concentration is about the maximum H2O2 concentration that can be found
during ORR experiments in RDE [105].
As shown in Figure 24, in spite of almost the same concentration of hydrogen peroxide than that of
oxygen, the currents due to oxygen reduction are almost 3 times higher for Fe-N-C and Cu-N-C and
almost 2 times higher for Co-N-C in comparison to those resulting from hydrogen peroxide reduction.
The increase in H2O2 reduction current with cathodic potential is almost linear, and the maximum
reduction current is smaller than the diffusion limited currents expected for 1 mM H2O2 from the
Levich equation. Similar results have been reported in the literature [72,102,106] for heat-treated Fe-
N-C ORR catalysts. This suggests that H2O2 reduction is under kinetic control within all the scanned
potential range. In comparison with the ORR, the kinetics of H2O2 reduction is sluggish, since it is
never fast enough to completely reduce all the available flux of H2O2, even at high overpotentials. It
has also to be considered that part of the reduction current could originate also from H2O2 chemical
disproportionation [102,107]. However, this possibility is most likely excluded, as explained by
Jaouen and Dodelet [102,105], letting us to deduce that the observed current is most likely due to
H2O2 reduction.

215
Figure 24. LSV performed at 5 mV s-1 and 1600 rpm in N2-saturated 0.5 M H2SO4 with the addition of 1 mM H2O2 for Fe-N-C, Co-N-C and Cu-N-C catalysts. LSV in O2-saturated 0.5 M H2SO4 in the same conditions are also shown for comparison.
RRDE test.
As a further means to better investigate the ORR path, RRDE test was performed. The results are
shown in Figure 25. The following equation was used to calculate the percentage of hydrogen
peroxide produced during ORR:
% H O = 100 ∙/
(6)
Where Id is the current at the disk, Ir is the current at the ring and N is the ring collection efficiency
(44%) [108].
Considering the Me-N-C catalysts, it is evident that Co-N-C is the catalysts which exhibits the higher
hydrogen peroxide production, which gets a maximum molar % value of about 15 % at 0.4 V vs RHE.
Cu-N-C, in spite of having a lower electroactivity in terms of onset and half-wave potentials, leads to
the formation of a considerably lower amount of H2O2, with a maximum of 3.5 molar % at 0.5 V vs
RHE. Fe-N-C is the catalysts that shows the lower formation of H2O2 (between 0.5 and 2 molar %),
confirming that it is the best catalysts not only in terms of activity but also in terms of selectivity.
Values of ring currents in the same order of magnitude, and consequently of peroxide % production
were measured by other groups for similar Fe-N-C pyrolyzed catalysts in acidic conditions
[72,100,102].
0.0 0.1 0.2 0.3 0.4 0.5 0.6 0.7 0.8 0.9 1.0 1.1 1.2-6.0
-5.5
-5.0
-4.5
-4.0
-3.5
-3.0
-2.5
-2.0
-1.5
-1.0
-0.5
0.0
0.5
1.0
1.5
2.0
i (m
A c
m-2)
E vs RHE (V)
Fe - O2
Fe - H2O
2 1 mM
Co - O2
Co - H2O
2 1 mM
Cu - O2
Cu - H2O
2 1 mM

216
Figure 25. RRDE test measurements performed in 0.5 M H2SO4 for Fe-N-C, Co-N-C and Cu-N-C and in 0.1 M HClO4 for Pt/C: (A) disk currents, (B) ring currents and (C) hydrogen peroxide molar proportion. Ring potential 1.2 V vs RHE, electrode rotation speed 900 rpm, disk potential scan rate 5 mV s-1.
0.0 0.1 0.2 0.3 0.4 0.5 0.6 0.7 0.8 0.9 1.0 1.1 1.2-0.7
-0.6
-0.5
-0.4
-0.3
-0.2
-0.1
0.0
A
I d
isk (
mA
)
E vs RHE (V)
Fe-N-C Co-N-C Cu-N-C Pt cath Pt anod
0.0 0.1 0.2 0.3 0.4 0.5 0.6 0.7 0.8 0.9 1.0 1.1 1.20.000
0.002
0.004
0.006
0.008
0.010
0.012
0.014
0.016B
I ri
ng
(m
A)
E vs RHE (V)
Fe-N-C Co-N-C Cu-N-C Pt cath Pt anod
0.0 0.1 0.2 0.3 0.4 0.5 0.6 0.7 0.8 0.9 1.0 1.1 1.20
2
4
6
8
10
12
14
16
H2O
2 (
mo
lar
%)
E vs RHE (V)
Fe-N-C Co-N-C Cu-N-C Pt cath Pt anod
C
217
A commercial Pt-based catalyst (Pt 20 wt. % on Vulcan) was also analyzed for comparison. For this
catalyst, at lower overpotentials the peroxide generation is considerably lower than for our Me-N-C
catalysts, especially in the anodic potential scan direction. In the low overpotential region (between
0.85 and 0.60 V vs RHE) the peroxide generation is higher in the cathodic scan direction, due to the
presence of oxides on the Pt surface at these potentials, which hinder in some way the complete 4 e-
oxygen reduction, leading to a higher peroxide production. This behavior is typical of Pt in acidic
conditions [7,11,100] However, a significant increase in the ring current for Pt/C catalyst was detected
when the disk potential approaches the H-underpotential deposition region [100].
The hydrogen peroxide generation results obtained with RRDE technique are considerably lower than
the values calculated by the Koutecky-Levich analysis. In order to justify this discrepancy, we have
to consider that the RRDE technique is a direct means of detection of H2O2, while the K-L method is
an indirect one, and it is based on a number of theoretical hypotheses under which it is valid, as the
smooth electrode surface. Thus, this results discrepancy is a further confirmation that most likely the
conditions of validity of the K-L model are not verified in this test, as previously hypothesized.
By concluding, from the results of these three tests conducted in order to determine the ORR path,
we can deduce that these Me-N-C catalysts are able to electroreduce O2 to H2O and H2O2, but much
less able to electroreduce H2O2 to H2O. Therefore, since H2O2 reduction kinetics is considerably
slower than the total (4 e-) and partial (2 e-) O2 reduction kinetics, we can conclude that the sequential
2e- + 2e- reduction mechanism with intermediate formation of H2O2 is not the main catalytic ORR
path on these catalysts. If it is occurring, it will be only marginal. If the sequential mechanism was
the predominant one, the H2O2 reduction kinetics should have been higher, or at least comparable to
the ORR, but this is not the case, as demonstrated by the results in Figure 24. Therefore, the direct 4
e- reduction mechanism is predominant. The partial 2 e- reduction of O2 to H2O2 is also occurring, as
demonstrated by RRDE test, and it is not negligible, especially for Co-N-C catalyst.
These results underline how, in order to improve the catalyst performance toward a complete
reduction of oxygen to H2O, minimizing the hydrogen peroxide generation, the presence of at least
one of the two following active sites is essential:
- effective H2O2 reduction active sites, in order to enhance at maximum the reduction of the
peroxide generated by the partial 2 e- mechanism, via the sequential 2e- + 2e- mechanism.
- dimeric active sites that simultaneously bind both oxygen atoms in order to stabilize the H2O2
intermediate in acidic media, to favor the direct 4 e- pathway [100].

218
3.2.7. Methanol tolerance test.
For DMFC application, one of the most important characteristic of an ORR electrocatalyst is to be
tolerant to the presence of methanol. As a matter of fact, the permeation of fuel from the anode to the
cathode through the Nafion proton-conducting membranes (crossover effect), is one of the major
impediments to the wide-scale commercialization of DMFC devices [109]. If a Pt-based catalyst is
used at the cathode, and a relevant methanol crossover effect is present, an important decrease in the
DMFC performance is observed. This is due to the high activity of Pt towards methanol oxidation
reaction (MOR), which can easily occur at the high potentials usually present at the cathode of the
fuel cell. This causes a considerable decrease of the cell open circuit potential and poisoning of the
cathodic catalyst, due the poisoning effect of Pt catalyst by the MOR intermediates, especially CO
[110–114]. As a consequence, the overall power density that the DMFC can generate remarkably
decreases during operation [12,115]. The use of methanol-tolerant cathode catalysts is a good strategy
to minimize this effect, and therefore increase the performance and the durability of DMFC.
As already demonstrated in the literature [68, 116–119], this type of Me-N-C NPMC do not exhibit
any activity towards MOR. Therefore, we tested the ORR activity of our most active catalyst, that is
Fe-N-C, in presence of various methanol concentrations. The methanol concentrations were chosen
in the range form 10 mM to 2 M, that is the concentration of the methanol solution we used to feed
the anode in the DMFC tests (see Paragraph 3.4). The results are shown in Figure 26. The behavior
of a commercial Pt-based catalyst is also shown for comparison.
Figure. 26. LSV recorded in RDE at 900 rpm rotation speed and 5 mV s-1 scan rate for Fe-N-C catalyst and for a commercial Pt/C catalyst (20 wt. % Pt on Vulcan). The electrolyte was O2-saturated 0.5 M H2SO4 with different methanol (MeOH) concentrations, as indicated in the legend.
0.0 0.1 0.2 0.3 0.4 0.5 0.6 0.7 0.8 0.9 1.0 1.1 1.2
-4
-3
-2
-1
0
1
2
3
4
i (m
A c
m-2)
E vs RHE (V)
Fe-N-C no MeOH Fe-N-C 10 mM MeOH Fe-N-C 100 mM MeOH Fe-N-C 1 M MeOH Fe-N-C 2 M MeOH Pt no MeOH Pt 100 mM MeOH

219
For the Fe-N-C catalyst, there is almost no difference between the LSV curve without presence of
methanol and the curve in presence of 10 mM to 2 M methanol concentrations. This confirms the
high methanol tolerance of this catalyst, and that the ORR is the predominant process at the Fe-N-C
electrodes over the whole potential range. Only a very small negative shift of about 10 mV is observed
in the mixed kinetic-diffusion control zone. This could be due to a slight interaction between methanol
and ORR active sites [116].
Otherwise, for the Pt catalyst, the effect of the presence of methanol on the LSV curve is much more
evident and severe decrease in the performance was observed. The MOR, rather than the ORR, was
the preferred reaction on the Pt/C electrode.
Consequently, in spite of the almost 200 mV higher half-wave potential of the Pt catalyst in
comparison with Fe-N-C in absence of methanol, with a methanol concentration of 0.1 M (that is 20
times lower that the solution fed at the anode), a big peak of methanol oxidation appears. This causes
a remarkable 400 mV decrease in the E1/2 of the ORR, making the performance of Fe-N-C much
better than the one of Pt catalyst in these conditions.
3.3. RDE meaurements – Alkaline medium.
3.3.1. Tafel analysis.
The ORR activity of the Me-N-C electrocatalysts in alkaline conditions was assessed by recording
steady-state polarization curves with a potential step of 0.01 V and a holding time at each potential
of 30 s in 0.1 M KOH solution, as described in Paragraph 3.2.2 for acid conditions.
In order to compare the performance of our samples with a standard commercial Pt-based catalyst,
the same test was conducted for a Pt 20 wt. % supported on Vulcan. The SV polarization curves are
shown in Figure 27 A. From these data, after mass-transport limitation correction, Tafel plots were
made (see Figure 27 B).
For the Me-N-C catalysts, only the zone with linear trend of potential vs mass-transport corrected
current density in the low overpotential region can be clearly identified. In fact, for potentials lower
than 0.85 V vs RHE for Fe-N-C, 0.80 V for Co- and Cu-N-C, and 0.75 V for Zn- and H-N-C, the
change in Tafel slope with potential is too fast to allow its calculation in the high-overpotential zone
(e.g. as done previously for Fe- and Co-N-C in acid conditions). For all of the Me-N-C catalysts, at
high overpotentials the Tafel plots are strongly affected by the mass transport effects, as suggested
by the change in concavity of the Tafel plot profiles at high overpotentials [106]. This is not the case
for Pt/C catalyst, where the double Tafel slope region can be appreciated more clearly, and allow the
calculation in both the low and high overpotential regions.

220
Starting from the data in Figure 27 B, Tafel slopes were calculated, allowing the determination of the
cathodic transfer coefficients and exchange current densities of the different catalysts. The results are
shown in Table 8 for all of the Me-N-C catalysts and for Pt/C catalyst in bot cathodic and anodic scan
directions, together with the respective onset potentials (Eon) and the half-wave potentials (E1/2).
The most active catalyst Me-N-C is Fe-N-C. It only exhibits 30 - 40 mV negative shift in Eon and E1/2
respectively, in comparison with Pt commercial catalyst (anodic scan direction). Its diffusion limiting
current value almost corresponds to the limiting current of the Pt catalyst, even if it is slightly higher.
Co-N-C and Cu-N-C have about 100 mV lower activity in terms of Eon and E1/2 in comparison with
the Pt commercial catalyst. Co-N-C has a lower diffusion limiting current, while Cu-N-C has a
limiting current almost equal to the Pt/C catalyst. However, unlike the Pt/C, the “plateau” region at
high overpotentials is not so well-developed.
Zn-N-C and H-N-C are much less active than the previous catalysts, showing almost 150 mV negative
shift in Eon. Like in the case of test in acidic conditions (see Paragraph 3.2.2), these two catalysts
show practically the same activity, being their polarization curves almost superimposed in the whole
potential range, especially in the kinetic-controlled zone. This fact confirms that even if the two
catalysts have different chemical-physical properties in terms of morphology and chemical
composition, these have no influence on the final electrocatalytic activity, confirming that Zn is a
non-effective transition metal for the formation of ORR active sites. However, unlike in acid
conditions, the Zn-N-C and H-N-C catalysts have a non negligible ORR activity in alkaline
conditions, as typical for all carbonaceous materials and in particular for N-doped carbon materials
[120].
Figure 27. (A) Staircase voltammetries (10 mV potential step, 30 s holding time) of the Me-N-C catalysts (Me = Fe, Co, Cu, Zn, H) recorded in O2-saturated 0.1 M KOH at 900 rpm RDE rotation speed. The curve of a commercial Pt catalyst (Pt 20 wt. % on Vulcan, Quintech®) in both cathodic and anodic scan directions is also shown for comparison. (B) Tafel plots after correction for mass-transport contribution derived from the SV in (A).
0.0 0.1 0.2 0.3 0.4 0.5 0.6 0.7 0.8 0.9 1.0 1.1 1.2-5.0
-4.5
-4.0
-3.5
-3.0
-2.5
-2.0
-1.5
-1.0
-0.5
0.0A
i (m
A c
m-2)
E vs RHE (V)
Fe-N-C Co-N-C Cu-N-C Zn-N-C H-N-C Pt anod. scan Pt cath. scan
0.1 1 10 1000.55
0.60
0.65
0.70
0.75
0.80
0.85
0.90
0.95
1.00
1.05
E v
s R
HE
(V
)
i - mass transport corrected (mA cm-2)
Fe-Pc
Co-Pc
Cu-Pc
Zn-Pc
H-Pc
Pt/C anod scan
Pt/C cath scan
B

221
Fe-N-C catalyst exhibit a slope of about 63 mV dec-1 (almost the same that in acidic conditions) and
an i0 value about 3 orders of magnitude higher than in acid conditions. Similar results for iron and
nitrogen containing C-based catalysts can be found in the literature [121,122]. Higher Tafel slope
values between 70 and 80 mV dec-1 were measured in other works [123,124].
The Co- and Cu-N-C catalysts have a lower Tafel slope, of about 45 mV dec-1. Lower Tafel slopes
of about 35 mV dec-1 were typically observed for surface area carbon in alkaline solution [125]. These
low values of Tafel slopes are explained in terms of production of peroxide ion intermediate.
Figure 28. Plot representing the linear zones of the potential vs logarithm of the mass-transport corrected current densities in Figure 27. Straight trend lines with their respective equations used for the calculations of αc and i0 are also shown.

222
These results could confirm the results of the RRDE analysis, that show a higher amount of H2O2
production for Co- and Cu-N-C catalysts than for Fe-N-C (which exhibits almost no H2O2).
For Zn- and H-N-C catalysts the Tafel slope is of about 50 mV dec-1. Regarding the Pt/C catalyst it
exhibit the typical behavior of the Pt polycrystalline electrodes in alkaline conditions, which shows
two Tafel regions with slopes of 60 and 120 mV dec-1 for low and high overpotentials, respectively
[126]. For Pt, as in acid conditions, the existence of these two slopes regions is explained in terms of
the coverage of the electrode surface by adsorbed oxygen, which follows a Temkin isotherm at low
overpotentials (where the Pt surface is highly covered by adsorbed OH) and a Langmuir isotherm at
higher overpotentials (where the Pt surface is free from adsorbed OH species).
Table 8. ORR kinetic parameters in alkaline conditions for all of the Me-N-C catalysts and for the Pt/C commercial catalyst (for Pt/C Tafel slope, αc and i0 are calculated in low and high overpotential regions).
Sample Eon [V vsRHE]
E1/2 [V vsRHE]
Tafel slope [mV/dec]
αc i0 [mA/cm2]
Fe-N-C 0.98 0.87 63.2 0.94 1.14 · 10-5 Co-N-C 0.92 0.84 47.2 1.25 2.72 · 10-8 Cu-N-C 0.89 0.82 44.6 1.33 4.03 · 10-9 Zn-N-C 0.85 0.75 53.3 1.11 9.79 · 10-9 H-N-C 0.84 0.75 49.2 1.20 2.00 · 10-9 Pt cath 1.00 0.89 67.5 / 116 0.88 / 0.51 7.72 · 10-4 / 6.09 · 10-3 Pt anod 1.01 0.92 58.2 / 128 1.02 / 0.46 2.71 · 10-5/ 5.27 · 10-3
Fe-N-C catalyst has an exchange current density value of about 3 – 4 orders of magnitude higher than
the other Me-N-C catalysts. This value is almost comparable with the one of Pt/C catalyst in the low
overpotential region (in both anodic and cathodic scan directions). Therefore we can conclude that
the ORR catalytic behavior of Fe-N-C catalyst in alkaline conditions is very close to the Pt/C catalyst,
underlying the advantage in using these types of Me-N-C non-precious metal catalysts as cathodic
catalysts for alkaline exchange membrane fuel cells.
Interestingly, it was found by Perez et al. [125] that the Tafel slope obtained on Pt/C catalysts
increases from a value of 35 mV dec-1 for the carbon support without Pt, to a value close to
60 mV dec-1 for a Pt wt. % of 30 %. At the same time the number of electrons involved in the ORR
changes from a value close to two to a value close to four. This behavior can be interpreted by a
combined participation of the carbon and the platinum particles in the catalysis of the ORR. For the
lower Pt/C ratios, the contribution of the carbon is higher and the values are closer to the typical
values for pure carbon, wich is a catalyst of O2 reduction to H2O2 in alkaline conditions. Otherwise,
for higher Pt contents, the contribution of Pt, and therefore the complete reduction to H2O is

223
predominant [87]. Comparing the results obtained in alkaline and acid conditions, we can observe
that the most active catalyst, that is Fe-N-C, shows almost 150 mV lower Eon in alkaline media. As
consequence, the mixed kinetic-diffusion region is less well-defined in acid than in alkaline solution,
suggesting that in acid conditions the reaction is under kinetic control even at high overpotentials.
Comparing the i0 value of Fe-N-C in the low overpotential region,(see Table 4 and Table 8), it is
almost 3 orders of magnitude higher in 0.1 M KOH than in 0.5 M H2SO4. Concerning the Tafel slopes,
they are almost the same in both pH conditions, suggesting that the rate determining step is the same
in both cases.
3.3.2. RRDE analysis
In order to explain these differences (and analogies) between the catalyst behavior in the two different
electrolytes, we further analyze the ORR by performing a RRDE test also in alkaline conditions. The
results are shown in Figure 29. For Fe-N-C the measured ring current is surprisingly almost zero over
the whole disk scanned potential range, suggesting that no H2O2 is generated by this catalyst in
alkaline conditions. A very low hydrogen peroxide generation for Fe-N/C catalyst was reported by
Ramaswamy and Mukerjee [101] and by Chung et al. [124] in 0.1 M NaOH solution. This low
hydrogen peroxide generation at lower overpotentials is a noteworthy result in comparison with what
obtained for other NPMC, and also with Pt-based catalysts in alkaline conditions. It could be
explained by the fact that this catalyst is not supported on C material but it is “self-supported” (no
external source of carbon other than C atoms contained in the Fe-phthalocyanine molecule precursor
was added during the synthesis). Therefore the additional hydrogen peroxide generation contribution
due to C support is not present, or, however, it is lower in comparison with other Me-N/C catalysts
reported in the literature. In alkaline conditions, for NPMC in which the onset potential of complete
ORR to H2O and H2O2 coincide, the total H2O2 generation could seem higher. In this case, the ORR
onset potential is much higher than the usual onset potential for H2O2 generation in alkaline conditions
(~ 0.8 V vs RHE) [120]. Thus, due to the enhanced stability of HO2- ion on the Fe-N-C catalyst active
sites in alkaline conditions as reported by Mukerjee [100,101], the generated peroxide could be faster
reduced to H2O without being desorbed in the bulk of the electrolyte solution.
Co- and Cu-N-C catalysts lead to higher generation of H2O2, showing a peak of about 7 % at the
potential of 0.7 and 0.525 V vs RHE, respectively. Then, as the disk electrode potential decrease, the
peroxide generation decreases, reaching values around 3 – 4 %. Similar values can be found in the
literature for Me-N-C catalysts [124]. Zn- and H-N-C catalysts generate considerably higher
quantities of H2O2, showing the same trend with disk potential. They have a first peak around 0.75 V
vs RHE, and a second peak (higher than the previous one) at 0.5 V vs RHE. For Zn-N-C catalyst the

224
two peaks are of 17 and 19 H2O2 % respectively. The values for H-N-C are even higher, being of 21
and 25 H2O2 % respectively.
These peaks in ring current at 0.50 V are most likely due to the carbonaceous structure of the catalysts.
At higher overpotentials the ORR process becomes more efficient and consequently the peroxide
production decreases.
Comparing the RRDE tests results in acid and alkaline conditions (Figure 25 C and 29 C,
respectively), we can noticed than the most active Me-N-C catalysts, that is Fe-N-C and Co-N-C,
exhibit a much higher peroxide generation in acid than in alkaline conditions. For Pt/C catalyst
exactly the opposite behavior is observed [101].
0.0 0.1 0.2 0.3 0.4 0.5 0.6 0.7 0.8 0.9 1.0 1.1 1.2
-0.6
-0.5
-0.4
-0.3
-0.2
-0.1
0.0
I dis
k (
mA
)
E vs RHE (V)
Fe-Pc Co-Pc Cu-Pc Zn-Pc H-Pc Pt/C anodic scan Pt/C cathodic scan
A
0.0 0.1 0.2 0.3 0.4 0.5 0.6 0.7 0.8 0.9 1.0 1.1 1.20.000
0.005
0.010
0.015
0.020
0.025
0.030B
I rin
g (
mA
)
E vs RHE (V)
Fe-Pc Co-Pc Cu-Pc Zn-Pc H-Pc Pt/C anodic scan Pt/C cathodic scan

225
Figure 29. RRDE test measurements performed in 0.1 M KOH for Fe-, Co-, Cu-, Zn- and H-N-C and for a commercial Pt/C catalyst: (A) disk currents, (B) ring currents and (C) hydrogen peroxide molar proportion. Ring potential 1.2 V vs RHE, electrode rotation speed 900 rpm, disk potential scan rate 5 mV s-1.
This was explained by the fact that the onset potential of peroxide reduction is higher than the onset
potential of ORR in alkaline media. Therefore the former reaction is kinetically favored such that any
peroxide intermediate formed during ORR in 0.1 M KOH will be immediately reduced to water.
Otherwise, in acid conditions, the peroxide reduction is a slower reaction than the ORR, (as
demonstrated by the results in Figure 24) due to weak binding of H2O2 on the active site, leading to
its desorption into the bulk electrolyte [100,101]. This fact suggests that the higher stabilization of
the peroxide intermediate on the active site is crucial for the enhanced complete 4 e- reduction in
alkaline conditions. The reasons for the stability of peroxide intermediate on the active site in alkaline
but not in acidic media is explained in terms of electrostatic interaction between the positive charge
on the cathode surface and the anionic nature of the peroxide intermediate in alkaline media. The
cationic nature of the Fe2+ / Fe3+ (that is one of the possible ORR active sites) also favor this
electrostatic stabilization of the HO2- (which is the stable form of hydrogen peroxide at pH > 12 )
species in alkaline media. This stabilization leads to the complete 4 e- ORR in alkaline media [127].
This electrostatic “advantage” is not present in acidic media due to the neutral charge on H2O2.
Comparing the results of RRDE tests on Pt/C catalyst in acid and alkaline media (see Figure 25 and
Figure 29), higher ring currents, and consequently higher peroxide molar % generation are obtained
in alkaline medium over the whole potential range. In acid conditions, as previously discussed, the
ring current shows a noticeable increase only at high overpotentials, where the hydrogen
0.0 0.1 0.2 0.3 0.4 0.5 0.6 0.7 0.8 0.9 1.0 1.1 1.20
2
4
6
8
10
12
14
16
18
20
22
24
26C
% H
2O
2
E vs RHE (V)
Fe-Pc Co-Pc Cu-Pc Zn-Pc H-Pc Pt/C anodic scan Pt/C cathodic scan

226
underpotential deposition phenomena start to occur. This is particularly evident in the anodic scan
direction.
Otherwise, in alkaline conditions, a considerable detection of peroxide formation at the ring takes
place at about 200 mV more positive potentials, considering the anodic scan. This is related to Pt-OH
formation from specific adsorption of hydroxide anions, which favors the peroxide formation via the
“outer-sphere” electron transfer mechanism at –OH-covered Pt sites (see Figure 30), as described in
detail by Mukerjee [100].
Therefore, in alkaline media, the –OH species present on Pt surface promote the “outer-sphere”
reaction mechanism, which is likely to be faster than the “inner-sphere” mechanism, which also
occurs in parallel. In acid media instead, only the “inner-sphere” mechanism is occurring, limiting
the peroxide formation. The presence of the similar Tafel slopes for ORR for Pt in both acid and
alkaline media suggests that the rate determining step is still the first electron transfer to adsorbed O2
via the inner-sphere mechanism at an oxide-free Pt site (being the “outer-sphere mechanism” faster).
In their comprehensive review, Ramaswamy and Mukerjee state that on Fe-N-C catalysts the direct
adsorption of molecular O2 on the Fe2+ active site is facilitated, because the specifically adsorbed
OH− species on the Fe2+ site acts as a labile ligand, which can be easily displaced by the molecular
O2. This causes the successful 4 e− reduction of O2 with a minimal occurrence of the “outer-sphere”
electron transfer mechanism, as confirmed by the almost-zero ring current detected in our RRDE
experiment with the Fe-N-C catalyst.
For the other Me-N-C catalysts, where the Fe2+ active center is not present, the higher ring currents
detected are primarily originated from the 2 e- reduction of O2 to HO2- promoted by the carbon
support [128]. Carbon support promotes the outer-sphere electron transfer via mediation by the
quinone/hydroquinone surface functional groups, which act similarly to the surface hydroxide species
on Pt.

227
Figure 30. Schematic of the double-layer structure during ORR in acidic (left) and alkaline (right) conditions. Insets (a) and (b) respectively illustrate the “inner-sphere” and “outer-sphere” electron transfer processes occurring in the two different pH conditions [101].
3.4. Single cell measurements.
As discussed in detail in the previous section, Fe-N-C is the catalyst that exhibits the most interesting
properties in terms of activity and selectivity in both acid and alkaline media. Therefore, its
performance as cathode catalyst has been evaluated in different types of exchange membrane fuel
cells. With a proton conducing electrolyte membrane (acid conditions), the examined fuels were
hydrogen and methanol. In alkaline conditions (OH- conducing electrolyte membrane), the cell was
fed with ethanol.
3.4.1. Acid DMFC test.
The performance of Fe-N-C catalyst was analyzed in a single DMFC fed with 2 M methanol and pure
oxygen at 90 °C temperature. The first part of this study consisted in the optimization of the cathode
catalyst layer. The parameters considered for the optimization were: the Nafion ionomer content in
the dry catalytic layer, the total catalyst loading and the Vulcan carbon black quantity mixed with Fe-
N-C catalyst before deposition on the GDL.

228
First, some tests were done using pure Fe-N-C catalyst (without mixing with Vulcan) with different
loadings and amounts of Nafion. The results are shown in Figure 31. The fuel cell performance is low
with the smaller amount of Nafion (4 wt. %). This was the same amount used for the anode catalyst
layer preparation [115]. Increasing the amount of Nafion to quantities more similar to the typical used
in the literature for similar Fe-N/C NPMC (i.e. 35 and 50 wt. %) the performances increase
considerably. In particular, comparing the results obtained with the same catalyst loading (2.5 mg cm-
2), the performances are better with the higher Nafion content (50 wt. %). With this Nafion amount,
two tests were made with different catalyst loadings (2.5 and 5 mg cm-2), showing almost the same
performance. Even better, a slightly better performance was obtained with the lower catalyst loading,
showing that using higher loadings of catalyst is not useful for increasing the DMFC performance.
This suggests that the catalyst layer is affected by mass transport limitations. Possibly, in presence of
a thicker catalyst layer, the tortuosity of the electrons, protons and oxygen path increased too much,
making the presence of more catalyst totally useless. Such type of mass transport problematics were
typically found in the literature for NMPC synthesized with a silica template method [17].
Figure 31. DMFC performances at 90 °C with different loadings of Fe-N-C and different Nafion wt. % contents on the dry cathode. Polarization curves (open symbols) and power density curves (closed symbols). In parallel, we also tested the DMFC using the Fe-N-C catalysts mixed in 1:1 wt. proportion with
Vulcan. These tests were done to investigate the cathode behavior in presence of additional carbon.
0 20 40 60 80 100 120 140 160 180 200 220 2400.0
0.1
0.2
0.3
0.4
0.5
0.6
0.7
0.8
Po
wer
den
sit
y (
mW
cm
-2)
Vo
ltag
e (
V)
Current density (mA cm-2)
4% Nafion - 5 mg cm-2
50% Nafion - 5 mg cm-2
50% Nafion - 2.5 mg cm-2
35% Nafion - 2.5 mg cm-2
0
2
4
6
8
10
12
14
16
18
20
22

229
In facts, some studies have been published in the literature with both Pt-based and non-precious-based
catalysts showing an improvement in fuel cell performance with the addition of carbon in different
proportions to the catalytic layer [129–131]. These improvements in performance could be due to the
changes the hydrophobicity of the catalyst layer, affecting water transport properties [131,132].
Another reason could be ascribed to the increasing in the electronic conductivity provided by the
additional carbon. In fact, the better performances for MEA prepared using NPMC as cathodic
catalysts have been obtained with Nafion ionomer contents between 25 and 75 wt. % [116,131]. Such
high ionomer contents could cause separation of the catalyst particles, breaking the electronic
pathway leading to loss of electronic conductivity. One way of compensation is to add conductive
material, such as carbon, to the catalyst before deposition onto the GDL. Carbon can act as a bridge,
interconnecting catalyst particles and reestablishing a continuous electronic pathway.
Comparing the results of these tests (see Figure 32), with the results obtained without the addition of
Vulcan (Figure 31), we can see that there is no any improvement, suggesting that for our Fe-N-C
catalyst the Vulcan addition is not useful to get better cell performances. In fact, considering the same
total loading on the GDL and the same Nafion % content (Vulcan + Fe-N-C catalyst), the results
obtained with the pure Fe-N-C are always better in terms of open circuit potential, power density and
current density. This could be explained by the presence of more catalyst (the double quantity) on the
electrode for the case of pure Fe-N-C tests.
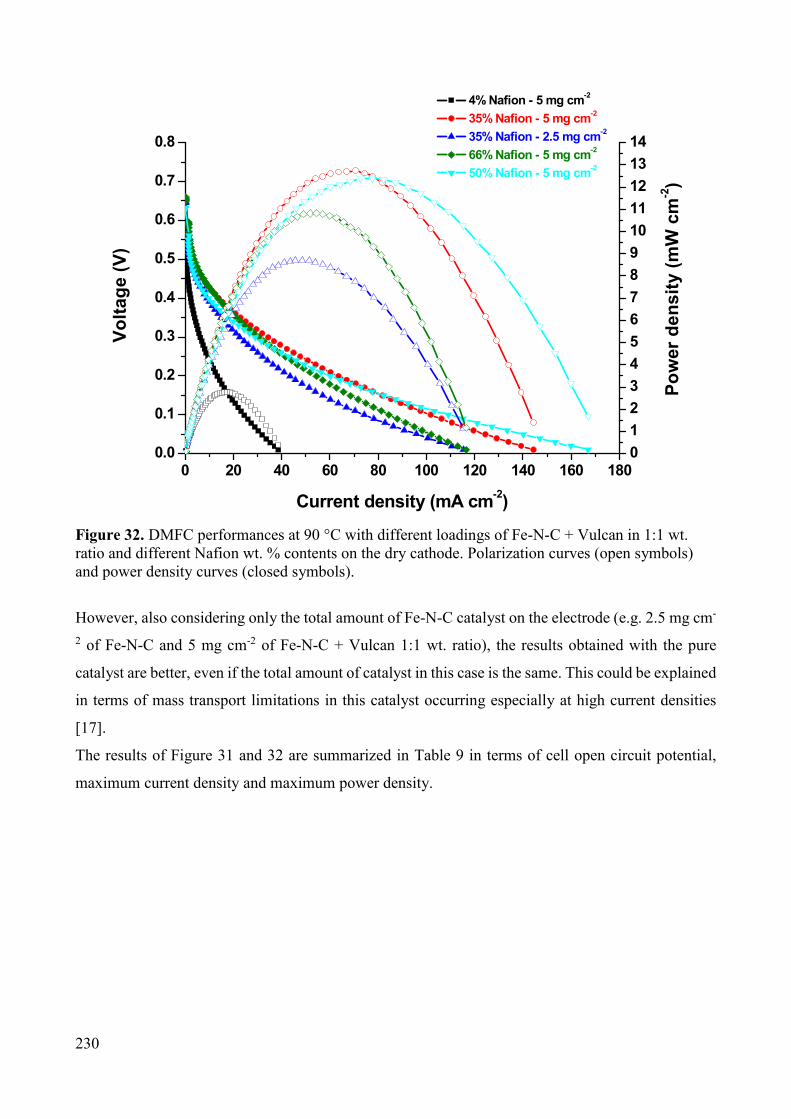
230
Figure 32. DMFC performances at 90 °C with different loadings of Fe-N-C + Vulcan in 1:1 wt. ratio and different Nafion wt. % contents on the dry cathode. Polarization curves (open symbols) and power density curves (closed symbols).
However, also considering only the total amount of Fe-N-C catalyst on the electrode (e.g. 2.5 mg cm-
2 of Fe-N-C and 5 mg cm-2 of Fe-N-C + Vulcan 1:1 wt. ratio), the results obtained with the pure
catalyst are better, even if the total amount of catalyst in this case is the same. This could be explained
in terms of mass transport limitations in this catalyst occurring especially at high current densities
[17].
The results of Figure 31 and 32 are summarized in Table 9 in terms of cell open circuit potential,
maximum current density and maximum power density.
0 20 40 60 80 100 120 140 160 1800.0
0.1
0.2
0.3
0.4
0.5
0.6
0.7
0.8
Po
wer
den
sit
y (
mW
cm
-2)
Vo
ltag
e (
V)
Current density (mA cm-2)
4% Nafion - 5 mg cm-2
35% Nafion - 5 mg cm-2
35% Nafion - 2.5 mg cm-2
66% Nafion - 5 mg cm-2
50% Nafion - 5 mg cm-2
0
1
2
3
4
5
6
7
8
9
10
11
12
13
14
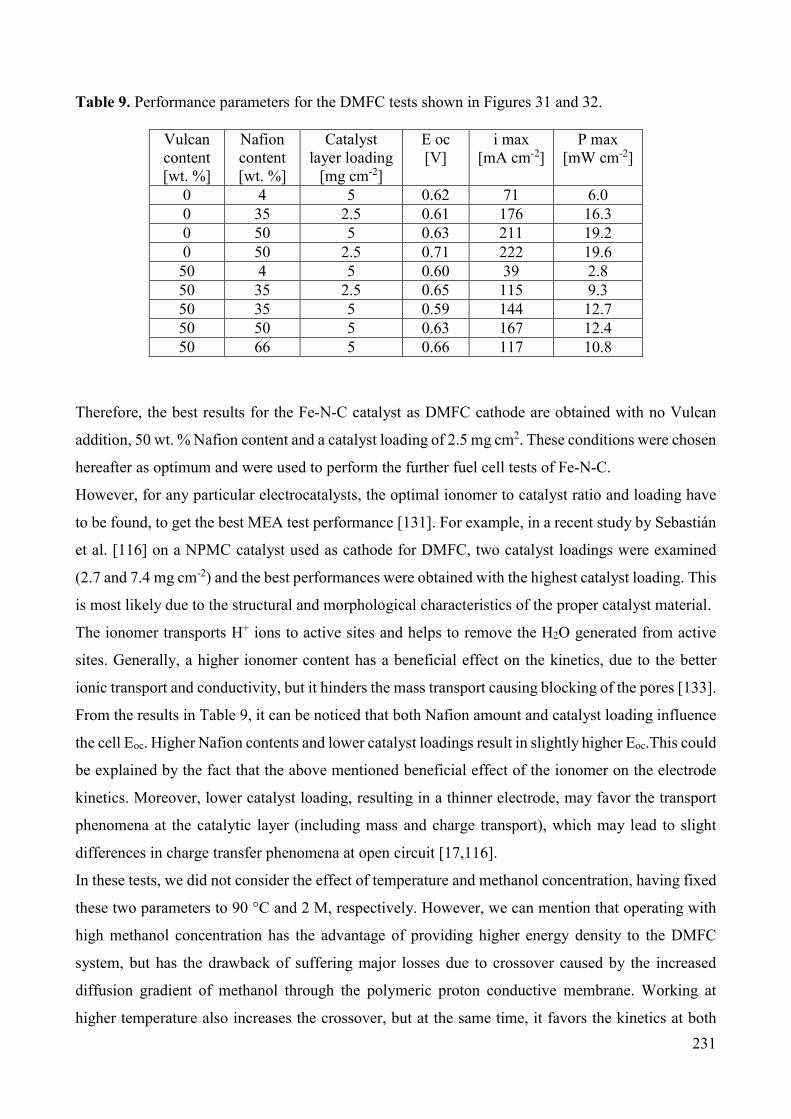
231
Table 9. Performance parameters for the DMFC tests shown in Figures 31 and 32.
Vulcan content [wt. %]
Nafion content [wt. %]
Catalyst layer loading
[mg cm-2]
E oc [V]
i max [mA cm-2]
P max [mW cm-2]
0 4 5 0.62 71 6.0 0 35 2.5 0.61 176 16.3 0 50 5 0.63 211 19.2 0 50 2.5 0.71 222 19.6 50 4 5 0.60 39 2.8 50 35 2.5 0.65 115 9.3 50 35 5 0.59 144 12.7 50 50 5 0.63 167 12.4 50 66 5 0.66 117 10.8
Therefore, the best results for the Fe-N-C catalyst as DMFC cathode are obtained with no Vulcan
addition, 50 wt. % Nafion content and a catalyst loading of 2.5 mg cm2. These conditions were chosen
hereafter as optimum and were used to perform the further fuel cell tests of Fe-N-C.
However, for any particular electrocatalysts, the optimal ionomer to catalyst ratio and loading have
to be found, to get the best MEA test performance [131]. For example, in a recent study by Sebastián
et al. [116] on a NPMC catalyst used as cathode for DMFC, two catalyst loadings were examined
(2.7 and 7.4 mg cm-2) and the best performances were obtained with the highest catalyst loading. This
is most likely due to the structural and morphological characteristics of the proper catalyst material.
The ionomer transports H+ ions to active sites and helps to remove the H2O generated from active
sites. Generally, a higher ionomer content has a beneficial effect on the kinetics, due to the better
ionic transport and conductivity, but it hinders the mass transport causing blocking of the pores [133].
From the results in Table 9, it can be noticed that both Nafion amount and catalyst loading influence
the cell Eoc. Higher Nafion contents and lower catalyst loadings result in slightly higher Eoc.This could
be explained by the fact that the above mentioned beneficial effect of the ionomer on the electrode
kinetics. Moreover, lower catalyst loading, resulting in a thinner electrode, may favor the transport
phenomena at the catalytic layer (including mass and charge transport), which may lead to slight
differences in charge transfer phenomena at open circuit [17,116].
In these tests, we did not consider the effect of temperature and methanol concentration, having fixed
these two parameters to 90 °C and 2 M, respectively. However, we can mention that operating with
high methanol concentration has the advantage of providing higher energy density to the DMFC
system, but has the drawback of suffering major losses due to crossover caused by the increased
diffusion gradient of methanol through the polymeric proton conductive membrane. Working at
higher temperature also increases the crossover, but at the same time, it favors the kinetics at both

232
anode and cathode, and the polymeric membrane ionic conductivity [116]. The operative temperature
of our tests (90 °C) was sufficiently low to ensure the structural stability for the Nafion membrane.
In order to assess the durability of Fe-N-C catalyst, a short-term durability test was performed on the
MEA prepared with the cathode in the optimal conditions. The cell potential was kept constant to 0.4
V, and a polarization curve was recorded every 30 minutes. The methanol flow rate was set to 5 mL
min-1 (5 times higher than the flow rate used for the polarization curves recorded in Figure 31 and
32). The use of a higher flow rate, should generally lead to an increase of the kinetics due to a higher
flux of reactants to the anodic compartment [115]. However, this also causes an increase of the water
and methanol diffusion through the Nafion 117 membrane. The results of this test are shown in Figure
33-A. The curve recorded with 1 mL min-1 methanol flow rate (taken from Figure 31) is also shown
for comparison. The cell performance parameters at different time along the test are reported in Table
10. The cell performance show a considerable decrease at the beginning of the test (t=0) just with the
increase of the methanol flow rate. The maximum power density decreases of about 30% and the
open circuit potential has a negative shift of 150 mV. Even if the Fe-N-C catalyst exhibit a high
methanol tolerance (see Section 3.2.7), the increase of the diffusion of both methanol and water
through the membrane could cause problems of water removal form the cathode (cathode flooding),
especially at high current density values, where a higher amount of water is also generated at the
cathode.
After the first 30 minutes of test, a further important performance decrease is observed, with the
maximum power density decreasing to 46.5 % of the initial value. However, the Eoc further decreases
only 40 mV. Continuing along the test, the cell shows a slower performance decrease, losing about
64% of its maximum power density after 3 h of test. Interestingly, the Eoc remains almost constant,
showing only a 60 mV negative shift between 0.5 and 2 h of tests, and remaining almost constant
during the last hour. This could indicate that the fuel cell deactivation is mainly due to problems not
related to the formation of a mixed potential due to the methanol oxidation occurring at the cathode,
as suggested by the methanol tolerance test. As previously discussed, these deactivation is most likely
due to water management problems.
In particular, the higher flow rate of methanol leads to a significant performance loss for the DMFC
even if the cathode catalyst is highly methanol tolerant, probably due to a severe flooding [134]
occurring in particular the catalyst micropores, where the majority of the ORR active sites are most
probably located.
Sebastián et al. performed a 10 h stability test on a NPMC obtained by pyrolysis of Fe, N and C
precursors, and obtained a similar trend in performance decay, detecting the major decrease within
the first 3 h. Afterwards, the performance loss decelerates with time [116].

233
Figure 33. (A) Performances at 90 °C of the DMFC prepared with Fe-N-C catalyst at the cathode along the durability test (potential kept constant at 0.4 V for 3 h) with 5 mL min-1 methanol flow. The polarization curve with 1 mL min-1 methanol flow is also shown for comparison. (B) Performances at of the DMFC prepared with commercial Pt/C catalyst at the cathode in the same conditions of (A). As a comparison, the same test was conducted for a MEA prepared using a standard Pt/C commercial
catalyst at the cathode (Pt loading 1 mg cm-2). The results are shown in Figure 33 B. The performance
0 20 40 60 80 100 120 140 160 180 200 220 2400.0
0.1
0.2
0.3
0.4
0.5
0.6
0.7
0.8
Po
we
r d
en
sit
y (
mW
cm
-2)
Vo
lta
ge
(V
)
Current density (mA cm-2)
1 mL min-1; t=0
5 mL min-1; t=0
5 mL min-1; t=0.5h
5 mL min-1; t=1h
5 mL min-1; t=1.5h
5 mL min-1; t=2h
5 mL min-1; t=3h
A
0
2
4
6
8
10
12
14
16
18
20
0 20 40 60 80 100 120 140 160 180 200 220 240 260 2800.0
0.1
0.2
0.3
0.4
0.5
0.6
0.7
0.8B
Po
wer
den
sit
y (
mW
cm
-2)
Vo
ltag
e (
V)
Current density (mA cm-2)
1 mL min-1; t=0
5 mL min-1; t=0
5 mL min-1; t=2h
0
2
4
6
8
10
12
14
16
18
20
22
24
26
28
30
32

234
of the DMFC with Pt/C catalyst at the cathode exhibits a considerably higher performance in
comparison with the MEA prepared with Fe-N-C catalyst at the beginning of the experiment with a
methanol flow of 1 mL min-1 (30.9 vs 19.6 mW cm-2 maximum power density). However, it is worth
noting that the initial Eoc of the MEA with Pt/C catalyst at the cathode is about 100 mV lower than
the Eoc of the MEA prepared with Fe-N-C (see Table 10), despite the ORR onset potential of Pt/C
catalyst in acidic conditions is considerably higher than for Fe-N-C. This confirms that the having
Pt/C as cathodic catalyst, the DMFC suffers the presence of a mixed potential at the cathode due to
methanol oxidation, causing an important performance decrease [135]. Simply by increasing the
methanol flow rate, the performance of the Pt/C cathode-based MEA shows a decrease of about 40%
in maximum power density, but remaining still better than the Fe-N-C results in the same conditions.
The Eoc also shows a considerably high decrease of about 110 mV, being lower than the one of the
Fe-N-C baaed MEA in the same conditions. After 2 hours of test, the performance decrease of the
DMFC with Pt/C is even more evident. The maximum power density decreased of 85% in comparison
to its initial value, being well low than for the Fe-N-C. In addition, the Eoc value drop down to 0.42
V, that is, 80 mV lower than for Fe-N-C.
In spite of not showing a very high stability, the performance of the DMFC single cell test with Fe-
N-C is better in terms of durability than that of Pt/C. The superior tolerance to methanol crossover of
Fe-N-C is clearly observed working at 5 mL min-1 methanol feed rate. Even after 3 h test, the
polarization and power density curves for the DMFC prepared with Fe-N-C are better than the ones
of the DMFC prepared with Pt/C after only 2 h test. In particular, the drop in Eoc for the DMFC based
on Pt/C cathode highlights the very detrimental effect of methanol cross-over.
Table 10. Performance parameters for DMFC stability tests in Figures 33 A-B for Fe-N-C and Pt/C catalysts used at the cathode.
Cathode catalyst
MeOH flow [mL min-1]
time [h]
E oc [V]
i max [mA cm-2]
P max [mW cm-2]
P max per g of Pt [W gPt
-1]
P decrease [%]
Fe-N-C 1 0 0.71 222 19.6 19.6 - Fe-N-C 5 0 0.56 180 13.8 13.8 29.6 Fe-N-C 5 0.5 0.52 155 10.5 10.5 46.5 Fe-N-C 5 1 0.52 142 9.2 9.2 53.1 Fe-N-C 5 1.5 0.51 132 8.3 8.3 57.7 Fe-N-C 5 2 0.50 124 7.5 7.5 61.8 Fe-N-C 5 3 0.50 117 7.0 7.0 64.3 Pt/C 1 0 0.61 274 30.9 15.5 - Pt/C 5 0 0.52 163 18.7 9.4 39.5 Pt/C 5 2 0.42 54 4.5 2.3 85.5
235
The use of a NPMC at the cathode of DMFC is convenient not only in terms of durability
performances, but also from the economical point of view. As suggested by the maximum power
density per g of total Pt used for the MEA fabrication (see Table 10), the use Fe-N-C catalyst leads
to a considerable decrease of the total MEA cost, considering that the main contribution to the total
MEA cost is due to the Pt total content (Ru is about one order of magnitude cheaper than Pt, and the
NPMC catalyst is about two orders of magnitude cheaper than Pt [116]). In fact, the MEA fabricated
with Pt/C as cathodic catalyst contains the double amount of Pt than the MEA fabricated with Fe-N-
C (2 mg of total Pt per cm2 and 1 mg of total Pt per cm2, respectively).
Nevertheless, the performance of this Fe-N-C catalyst in DMFC are still lower than what expected,
leaving open space for future work in performance improvement. From these results, this could be
achieved improving the structural features of the catalyst, providing better mass-transport properties,
which could avoid or a least limit the flooding of the micropores.
3.4.2. H2 / O2 PEMFC test.
The performance of Fe-N-C catalyst was also tested in a PEMFC fed with pure H2 and O2 at anode
and cathode, respectively. Otherwise than methanol, the H2 crossover through the Nafion membrane
is not so high. Therefore, we used a thinner membrane (Nafion 112 instead of Nafion 117 used for
DMFC) in order to minimize the ionic conduction resistance.
The polarization and power density curves resulting from these tests are shown in Figure 34, together
with the results of the same test conducted on a MEA fabricated using a commercial Pt/C catalyst at
the cathode. The maximum power density recorded for Fe-N-C was 105 mW cm-2, which is about
1/3 than the maximum power density obtained with the Pt/C catalyst (335 mW cm-2) in the same
testing conditions.
However, if we normalize the maximum power density per g of total Pt used for the MEA fabrication,
with Fe-N-C catalyst at the cathode we obtain 350 W gPt-1 (considering the 0.3 mgPt cm-2 used at the
anode). For the MEA fabricated with Pt/C cat the cathode, this value is 372 W gPt-1 (considering the
0.3 mgPt cm-2 used at the anode and the 0.6 mgPt cm-2 used at the cathode).
Concerning the open circuit potential, for Pt/C catalyst it is around 0.96 V, while for our Fe-N-C
catalysts its value is about 140 mV lower, being around 0.82 V. This value well matches with the
ORR onset potential of 0.83 V found by the SV test in RDE (see Table 4). In fact, the anodic
overpotential is very low (usually lower than 10 mV), being the kinetics of HOR on Pt/C catalyst
very fast [7,17].
It is difficult to compare the performance of Fe-N-C catalyst in this test with the results reported in
the literature for similar NPMC due to the non-uniformity of the experimental conditions adopted by
the different work groups. For instance, we can make a comparison with the best “state of the art”

236
results that are reported in Table 1 in Chapter 1. There we can see how the highest power density
performance values obtained for NPMC as cathodic catalysts are as high as 700 mW cm-2. It is
important to consider that these values were obtained at 80 – 90 °C, while our tests were performed
at 60 °C. However, lower performing PEMFC results (around 150 mW cm-2) more similar to the ones
obtained with our Fe-N-C catalyst, can also found in the literature [17, 136–139]. The structural
properties of the catalyst such as surface area and porosity appear to play important roles in promoting
effective mass transfer, especially at higher current densities [140].
Figure 34. Polarization (filled symbols) and power density curves (open symbols) of PEMFC prepared using commercial Pt/C (0.6 mgPt cm-2) and Fe-N-C (2.5 mg cm-2) as cathode catalysts. Cell temperature 60 °C. The anode catalyst was a commercial Pt/C. Pt loadings on anode was 0.3 mg cm−2.
3.4.3. Alkaline DEFC test.
As the Fe-N-C catalyst exhibits very good activity toward ORR in alkaline conditions (see Paragraph
3.3), we performed a test in an AEMFC fueled with ethanol at the anode. To improve the cell
performance, the anodic compartment must be fed with an alkaline pH solution. In particular, as
mentioned in the experimental section, the solution fed at the DEFC anode was 2 M ethanol and 2 M
KOH aqueous solution. As mentioned in the literature, if the ethanol is dissolved in a non-alkaline
solution, the cell performance results to be considerably lower due to the ionic conductivity of the
0 200 400 600 800 1000 1200 14000.0
0.1
0.2
0.3
0.4
0.5
0.6
0.7
0.8
0.9
1.0
Po
we
r d
en
sit
y (
mW
cm
-2)
Vo
lta
ge (
V)
Current density (mA cm-2)
Pt Fe-N-C
0
50
100
150
200
250
300
350
400
237
ionomer is much lower than that of KOH solution. Therefore, providing an excess of OH- ions in
contact with the membrane helps to enhance the membrane conductivity and consequently, the
reaction kinetics [141].
The results of the tests are shown in Figure 35, together with a comparative test on the same cell
prepared with a standard Pt/C catalyst at the cathode. Three different cathodic layers were prepared,
with different Nafion contents. Obviously, the Nafion ionomer used in the preparation of the catalytic
layer of an AMEFC does not play the role of favor the ionic conductivity. However, it is commonly
reported in the literature the use of a PTFE-based ionomer in the preparation of the electrodes for
alkaline membrane fuel cells in wt. % on the dry electrode typically between 10 and 50% [141–144].
In the electrode, in fact, the presence of a binder is required to bind the catalyst particles together, and
preserve them from progressive crumbling during the flushing of the reactants. Otherwise, without a
binder, the cell performance will quickly degrade [141].
The performance of the alkaline DEFC prepared with the lower ionomer content (4 wt. %, the same
used at the anode) was the worst. Increasing the Nafion content to 35 % the cell performances
improve, becoming even better than for the cell with Pt/C catalyst at the cathode in the low current
density region. The open circuit potential was also higher than for the Pt/C (0.90 vs 0.86 V). With a
further increase of the Nafion content (50 wt. %), the performance of the cell in the low current region
decreased. On the contrary, in the high currents region, the performances increased, allowing to get
a maximum power density of 62 mW cm-2. However, the shape of the polarization curve immediately
after the maximum power density became convex, and the current density decreased with the decrease
of the cell potential. This behavior suggest that the electrode was highly affected by mass transport
problems, much more than in the case of 35 % Nafion content, where the polarization curve at low
potentials shows a steep vertical decrease typical of the fuel cells affected by moderate-heavy mass
transport limitations [132]. These mass transport limitations could be ascribed to the diffusion of the
oxygen into the cathode catalyst layer, which could be hindered by the high ionomer content and by
the highly microporous structure of the Fe-N-C catalyst. Similar results in terms of polarization curve
shape and maximum power densities can be found in the literature for alkaline DEFC using different
types of non-noble ORR electrocatalysts [143,144]. For the cell made with Pt/C catalyst these mass
transport problems are much less evident, especially in the intermediate-high current density region.
This characteristic of the Pt/C catalyst lead to obtain a considerably higher maximum power density
(about 90 mW cm-2), in spite of almost the same Eoc (or even worse in the case of 35 % Nafion test).

238
Figure 35. Polarization (filled symbols) and power density (open symbols) curves for alkaline DEFC prepared using Fe-N-C as cathode catalyst with different Nafion contents in the catalytic layer. The curves for a DEFC prepared using a Pt/C commercial catalyst are also shown for comparison. In these direct ethanol AEMFC tests, the crossover problems due to the diffusion of ethanol from
anode to cathode are mitigated primarily by the lower permeability of the PBI membrane in
comparison with Nafion membrane [14], and in addition by the OH- transport direction, which is
opposite than the alcohol diffusion through the membrane. This is confirmed by the remarkably high
Eoc showed especially by the Pt/C catalyst. Therefore, the lower performances obtained by the Fe-N-
C catalyst in comparison to Pt, can be mainly ascribed to its morphological-structural properties,
which cause important mass transport and water removal problems (i.e. flooding).
3.4.4. Concluding remarks about the fuel cell tests of Fe-N-C.
The importance of performing fuel cell test for the ORR catalysts has been clearly evidenced by the
results presented in this chapter. In fact, the obtainment of good catalytic performances in RDE-
RRDE tests in terms of Eon, E1/2 and peroxide selectivity are not sufficient to define an ORR catalyst
as “good” to be used to fabricate a polymer exchange membrane fuel cell stack. The “goodness” of
the catalyst has to be validate by means of the obtainment of good performances in fuel cell test in
terms of both activity and durability.
0 50 100 150 200 250 300 3500.0
0.1
0.2
0.3
0.4
0.5
0.6
0.7
0.8
0.9
1.0
Po
wer
den
sit
y (
mW
cm
-2)
Vo
ltag
e (
V)
Current density (mA cm-2)
Pt
Fe-N-C 50% Naf
Fe-N-C 35% Naf
Fe-N-C 4% Naf
0
10
20
30
40
50
60
70
80
90
100
239
One of the main problems that have limited until now the use of the Me-N-C NPMC in these types
of fuel cells are the mass transport problems. In particular, the catalysts fabricated with a hard
templating method (i.e. using a silica as template) were found to be more affected by these problems,
as well as those that show large particles or flake-like morphology. On the contrary, the catalysts
synthesized starting from a carbon support with the addition of an external nitrogen and transition
metal source, and the ones larger pore diameters and finest particle size usually exhibit better mass
transport properties [17]. Our Fe-N-C catalyst belongs to the first group, and its structure is highly
microporous (see Table 1). Moreover, as shown by the pore size distribution plot in Figure 2B, a big
quantity of the micropores have a diameter between 0.6 and 0.9 nm, and between 1 and 2 nm. These
values are almost 2 – 6 times the diameter of the water and oxygen molecules (about 0.3 nm)
[145,146]. As demonstrated in previous studies [17,147], these are the dimensions where the majority
of the ORR active sites in NPMC synthesized without a preexisting C support are hosted.
It is evident how, if these pores are becoming completely filled by the water due to the flooding
phenomena, their accessibility to the ORR reactants, especially O2, becomes very difficult. Therefore,
the dominant microporous structure of the support resulting in a serious water flooding, will lead to
an irreversible damage of the cathode catalyst layer, as also reported in the literature [72,148].
In conclusion, from all the results obtained in this chapter, we got important indications and
confirmations. Having a catalyst with a very high surface area and microporosity is essential to have
a ORR electroactivity in RDE, especially in acidic conditions. In alkaline conditions, these properties
have more influence on the selectivity toward a complete 4 e- oxygen reduction to water.
However, when operating in a polymer exchange membranes fuel cell, this high microporosity may
result in serious mass transport and water flooding problems.
Therefore, the surface area, pore size distribution and microporosity properties of a Me-N-C
electrocatalyst for ORR, have to be accurately tuned in order to obtain the better performances in fuel
cell in terms of both activity and durability. This could be achieved during the catalyst synthesis
operating on different parameters, such as the structure of template (in the case of hard templating
synthesis method) [19,149], the use of expansion agents [17,150,151] or variables of the pyrolysis
heat treatment (time, heating ramp speed, temperature, pressure, type of gas used).
4. Conclusions.
Using Me(II)phthalocyanines (Me = Fe, Co, Cu, Zn) as single Me, C and N precursors, and SBA-15
silica as template, we produced a series of Me-N-C electrocatalysts for ORR with extremely high
specific surface area and high microporosity.

240
The presence of the different transition metals ions coordinated with N atoms in the phthalocyanine
macrocycle center influences the morphology, the chemical composition and the ORR behavior in
terms of catalytic activity and selectivity towards a complete 4 e- O2 electroreduction to H2O.
These properties are related with different trends of the weight loss and with the formation of gaseous
products in different amounts and at different temperatures during the pyrolysis, as evidenced by the
TGA-mass spectroscopy analysis.
Fe-N-C is the catalyst with higher activity and selectivity toward a complete 4e- ORR pathway. We
speculate that this behavior in terms of weight loss and gaseous products during the pyrolysis is a key
factor towards the synthesis of more active non-precious metal based catalysts.
However, further investigation is necessary with other catalysts precursors, in order to corroborate
this hypothesis.
As evidenced by the electrochemical tests performed at different temperatures, the catalyst showing
a higher activity, that is Fe-N-C, exhibits certain analogies with the standard Pt-based catalysts in
acid conditions, in terms of activation energy values, and their variation with overpotential.
The performance of Fe-N-C catalyst in alkaline conditions is very close to Pt/C catalyst in terms of
onset potential, and considerably better in terms of selectivity (almost null peroxide production), due
to the good stabilization of the peroxide anion intermediate on the active site in alkaline conditions.
These results underline the advantages in the use of such types of Fe-N-C catalysts for alkaline fuel
cells applications.
The results of the tests of Fe-N-C catalyst in single fuel cell with both acidic (DMFC and H2/O2) and
alkaline (DEFC) membrane electrolyte evidenced how this catalyst, is spite of showing a good ORR
activity, is highly affected by deactivation mainly ascribed to the flooding of the micropores, which
could lead to irreversible loss of catalytic activity.
References.
[1] J.Y. Cheon, T.Y. Kim, Y.M. Choi, H.Y. Jeong, M.G. Kim, Y.J. Sa, J. Kim, Z.H. Lee, T.H. Yang,
K.J. Kwon, O. Terasaki, G.-G. Park, R.R. Adzic, S.H. Joo. Ordered mesoporous porphyrinic carbons
with very high electrocatalytic activity for the oxygen reduction reaction. Scientific Reports 3 (2013)
2715.
[2] S. Yuan, J.-L. Shui, L. Grabstanowicz, C. Chen, S. Commet, B. Reprogle, T. Xu, L. Yu, D.-J. Liu.
A highly active and support-free oxygen reduction catalyst prepared from ultrahigh-surface-area
porous polyporphyrin. Angew. Chem. Int. Ed. 52 (2013) 8349–8353.

241
[3] W. Wu, Z. Wan, W. Chen, M. Zhu, D. Zhang. Synthesis of mesoporous alumina with tunable
structural properties. Microporous Mesoporous Mater. 217 (2015) 12–20.
[4] S. Badoga, R.V. Sharma, A.K. Dalai, J. Adjaye. Synthesis and characterization of mesoporous
aluminas with different pore sizes: Application in NiMo supported catalyst for hydrotreating of heavy
gas oil. Appl. Catal. A: Gen. 489 (2015) 86–97.
[5] J. Zeng, C. Francia, M.A. Dumitrescu, A.H.A. Monteverde Videla, V.S. Ijeri, S. Specchia, P.
Spinelli. Electrochemical performance of Pt-based catalysts supported on different ordered
mesoporous carbons (Pt/OMCs) for oxygen reduction reaction. Ind. Eng. Chem. Res. 51 (2012)
7500–7509.
[6] S. Jun, S.H. Joo, R. Ryoo, M. Kruk, M. Jaroniec, Z. Liu, T. Ohsuna, O. Terasaki. Synthesis of
New, Nanoporous Carbon with Hexagonally Ordered Mesostructure. J. Am. Chem. Soc. 122 (2000)
10712-10713.
[7] U.A. Paulus, T.J. Schmidt, H.A. Gasteiger, R.J. Behm. Oxygen reduction on a high-surface area
Pt/Vulcan carbon catalyst: a thin-film rotating ring-disk electrode study. J. Electroanal. Chem. 495
(2001) 134 – 145.
[8] A. Serov, U. Tylus, K. Artyushkova, S. Mukerjee, P. Atanassov. Mechanistic studies of oxygen
reduction on Fe-PEI derived non-PGM electrocatalysts. Appl. Catal. B: Environ. 150–151 (2014)
179–186.
[9] A. Muthukrishnan, Y. Nabae, T. Hayakawa, T. Okajima, T. Ohsaka. Fe-Containing Polyimide-
Based High-Performance ORR Catalysts in acidic medium: a kinetic approach to study the durability
of Catalysts. Catal. Sci. & Tech. 5 (2015) 457–483.
[10] M. Ferrandon, A.J. Kropf, D.J. Myers, U. Kramm, P. Bogdanoff, G. Wu, C.M. Johnston, P.
Zelenay. Multitechnique Characterization of a Polyaniline−Iron−Carbon Oxygen Reduction Catalyst.
J. Phys. Chem. C 2012, 116, 16001−16013.
[11] D. van der Vliet, D.S. Strmcnik, C. Wang, V.R. Stamenkovic, N.M. Markovic, M.T.M. Koper.
On the Importance of Correcting for the Uncompensated Ohmic Resistance in Model Experiments of
the Oxygen Reduction Reaction. J. Electroanal. Chem. 647 (2010) 29–34.
[12] R. Escudero-Cid, P. Hernández-Fernández, J.C. Pérez-Flores, S. Rojas, S. Garcia-Rodríguez, E.
Fatás, P. Ocón. Analysis of performance losses of direct methanol fuel cell with methanol tolerant
PtCoRu/C cathode electrode. Int. J. Hydrogen Energy 37 (2012) 7119–7130.
[13] P. Hernández-Fernández, M. Montiel, P. Ocón, J.L. Gómez de la Fuente, S. García-Rodríguez,
S. Rojas, J.L.G. Fierro. Functionalization of multi-walled carbon nanotubes and application as
supports for electrocatalysts in proton-exchange membrane fuel cell. Appl. Catal. B: Environ. 99
(2010) 343–352.
242
[14] R. Escudero-Cid, Ph.D. Thesis, Estudio de Durabilidad de Pilas de Combustible de Metanol
Directo, Universidad Autónoma de Madrid, Spain (2015).
[15] K.S.W. Sing, D.H. Everett; R.A.W. Haul; L. Moscou; R.A. Pierotti; J. Roquerol; T.
Siemieniewska. Reporting Physisorption Data for Gas/Solid Systems with Special Reference to the
Determination of Surface Area and Porosity (Recommendations 1984). Pure Appl. Chem. 57 (1985)
603–619.
[16] M. Thommes, K. Kaneko, A.V. Neimark, J.P. Olivier, F. Rodriguez-Reinoso, J. Rouquerol
K.S.W. Sing. Physisorption of gases, with special reference to the evaluation of surface area and pore
size distribution (IUPAC Technical Report). Pure Appl. Chem. 2015. DOI 10.1515/pac-2014-1117.
[17] F. Jaouen, J. Herranz, M. Lefèvre, J-P. Dodelet, U.I. Kramm, I. Herrmann, P. Bogdanoff, J.
Maruyama, T. Nagaoka, A. Garsuch, J.R. Dahn, T. Olson, S. Pylypenko, P. Atanassov, E.A. Ustinov.
Cross-Laboratory Experimental Study of Non-Noble-Metal Electrocatalysts for the Oxygen
Reduction Reaction. ACS Appl. Mater. Interfaces 1 (2009) 1623–1639.
[18] M. Lefèvre, E. Proietti, F. Jaouen, J-P. Dodelet. Iron-based catalysts with improved oxygen
reduction activity in polymer electrolyte fuel cells. Science 324 (2009) 71–74.
[19] A.H.A. Monteverde Videla, L. Osmieri, M. Armandi, S. Specchia. Varying the morphology of
Fe-N-C electrocatalysts by templating Iron Phthalocyanine precursor with different porous SiO2 to
promote the Oxygen Reduction Reaction. Electrochimica Acta 177 (2015) 43–50.
[20] Z. Chen, D. Higgins, A. Yu, L. Zhang, J. Zhang, A review on non-precious metal electrocatalysts
for PEM fuel cells, Energy Environ. Sci. 4 (2011) 3167.
[21] J.-P. Dodelet, The controversial role of the metal in Fe- or Co-based electrocatalysts for the
oxygen reduction reaction in acid medium, in: M. Shao (Ed.), Electrocatalysis in Fuel Cells, Vol. 9,
Springer, London, 2013, pp. 271 Ch.10.
[22] F. Jaouen, M. Lefèvre, J.-P. Dodelet, M. Cai. Heat-Treated Fe/N/C Catalysts for O2
Electroreduction: Are Active Sites Hosted in Micropores? J. Phys. Chem. B 110 (2006) 5553–5558.
[23] D. Zhao, J. Feng, Q. Huo, N. Melosh, G.H. Fredrickson, B.F. Chmelka, G.D. Stucky. Triblock
Copolymer Syntheses of Mesoporous Silica with Periodic 50 to 300 Angstrom Pores. Science 279
(1998) 548–552.
[24] J. Xu, Y. Zhao, C. Shen, L. Guan. Sulfur- and Nitrogen-Doped, Ferrocene-Derived Mesoporous
Carbons with Efficient Electrochemical Reduction of Oxygen. ACS Appl. Mater. Interfaces 5 (2013)
12594−12601.
[25] S. Shrestha, W.E. Mustain. Properties of Nitrogen-Functionalized Ordered Mesoporous Carbon
Prepared Using Polypyrrole Precursor. J. Electrochem. Soc. 157 (2010) B1665–B1672.
243
[26] P.H. Matter, L. Zhang, U.S. Ozkan. The role of nanostructure in nitrogen-containing carbon
catalysts for the oxygen reduction reaction. Journal of Catalysis 239 (2006) 83–96.
[27] E. Negro, A.H.A. Monteverde Videla, V. Baglio, A.S. Aricò, S. Specchia, G.J.M. Koper. Fe–N
supported on graphitic carbon nano-networks grown from cobalt as oxygen reduction catalysts for
low-temperature fuel cells. Appl. Catal. B: Environ. 166–167 (2015) 75–83.
[28] D. Susac, A. Sode, L. Zhu, P.C. Wong, M. Teo, D. Bizzotto, K.A.R. Mitchell, R.R. Parsons, S.A.
Campbell. A Methodology for Investigating New Nonprecious Metal Catalysts for PEM Fuel Cells.
J. Phys. Chem. B 110 (2006) 10762–10770.
[29] F.J. Perez-Alonso, M. Abdel Salam, T. Herranz, J.L. Gomez de la Fuente, S.A. Al-Thabaiti, S.N.
Basahel, M.A. Peña, J.L.G. Fierro, S. Rojas. Effect of carbon nanotube diameter for the synthesis of
Fe/N/multiwall carbon nanotubes and repercussions for the oxygen reduction reaction. J. Power
Sources 240 (2013) 494–502.
[30] U.I. Kramm, I. Herrmann-Geppert, S. Fiechter, G. Zehl, I. Zizak, I. Dorbandt, D. Schmeißerb,
P. Bogdanoff. Effect of iron-carbide formation on the number of active sites in Fe–N–C catalysts for
the oxygen reduction reaction in acidic media. J. Mater. Chem. A. 2 (2014) 2663–2670.
[31] Y. Hu, J.O. Jensen, W. Zhang, S. Martin, R. Chenitz, C. Pan, W. Xing, N.J. Bjerrum, Q. Li.
Fe3C-based oxygen reduction catalysts: synthesis, hollow spherical structures and applications in fuel
cells. J. Mater. Chem. A 3 (2015) 1752–1760.
[32] U.I. Kramm, J. Herranz, N. Larouche, T.M. Arruda, M. Lefèvre, F. Jaouen, P. Bogdanoff, S.
Fiechter, I. Abs-Wurmbach, S. Mukerjee, J.-P. Dodelet, Structure of the catalytic sites in Fe/N/C-
catalysts for O2-reduction in PEM fuel cells. Phys. Chem. Chem. Phys. 14 (2012) 11673–11688.
[33] A. Serov, K. Artyushkova, N.I. Andersen, S. Stariha, P. Atanassov. Original Mechanochemical
Synthesis of Non-Platinum Group Metals Oxygen Reduction Reaction Catalysts Assisted by
Sacrificial Support Method. Electrochimica Acta 179 (2015) 154–160.
[34] M.H. Robson, A. Serov, K. Artyushkova, P. Atanassov. A mechanistic study of 4-
aminoantipyrine and iron derived non-platinum group metal catalyst on the oxygen reduction
reaction. Electrochimica Acta 90 (2013) 656– 665.
[35] K. Artyushkova, S. Pylypenko, T.S. Olson, J.E. Fulghum, P. Atanassov. Predictive Modeling of
Electrocatalyst Structure Based on Structure-to-Property Correlations of X-ray Photoelectron
Spectroscopic and Electrochemical Measurements. Langmuir 24 (2008) 9082–9088.
[36] H.R. Byon, J. Suntivich, Y. Shao-Horn. Graphene-Based Non-Noble-Metal Catalysts for
Oxygen Reduction Reaction in Acid. Chem. Mater. 23 (2011) 3421 –3428.

244
[37] L. Osmieri, A.H.A. Monteverde Videla, S. Specchia. Activity of Co-N multi walled carbon
nanotubes electrocatalysts for oxygen reduction reaction in acid conditions. J. Power Sources 278
(2015) 296–307.
[38] A.H.A. Monteverde Videla, S. Ban, S. Specchia, L. Zhang, J. Zhang. Non-noble Fe–NX
electrocatalysts supported on the reduced graphene oxide for oxygen reduction reaction. Carbon 76
(2014) 386–400.
[39] A.H. A. Monteverde Videla, L. Zhang, J. Kim, J. Zeng, C. Francia, J. Zhang, S. Specchia.
Mesoporous carbons supported non-noble metal Fe–NX electrocatalysts for PEM fuel cell oxygen
reduction reaction. J. Appl. Electrochem. 43 (2013) 159–169.
[40] H.A. Gasteiger, S.S. Kocha, B. Sompalli, F.T. Wagner. Activity benchmarks and requirements
for Pt, Pt-alloy, and non-Pt oxygen reduction catalysts for PEMFCs. Appl. Catal. B Environ. 56
(2005) 9–35.
[41] Y. Okamoto. First-principles molecular dynamics simulation of O2 reduction on nitrogen-doped
carbon. Appl. Surf. Sci. 256 (2009) 335–341.
[42] G. Liu, X. Li, P. Ganesan, B.N. Popov. Development of non-precious metal oxygen-reduction
catalysts for PEM fuel cells based on N-doped ordered porous carbon. Applied Catalysis B:
Environmental 93 (2009) 156–165.
[43] N.P. Subramanian, X. Li, V. Nallathambi, S.P. Kumaraguru, H. Colon-Mercado, G. Wu, J.-W.
Lee, B.N. Popov. Nitrogen-modified carbon-based catalysts for oxygen reduction reaction in polymer
electrolyte membrane fuel cells. J. Power Sources 188 (2009) 38–44.
[44] G. Faubert, R. Côté, J.-P. Dodelet, M. Lefèvre, P. Bertrand. Oxygen Reduction Catalysts for
Polymer Electrolyte Fuel Cells from the Pyrolysis of Iron Acetate Adsorbed on Various Carbon
Supports J. Phys. Chem. B 2003, 107, 1376-1386.
[45] F. Zheng, Y. Yang, Q. Chen. High Lithium Anodic Performance of Highly Nitrogen-Doped
Porous Carbon Prepared from a Metal-Organic Framework. Nat. Comm. 5 (2014) 5261–5270.
[46] G. Wu, K.L. More, C.M. Johnston, P. Zelenay. High-Performance Electrocatalysts for Oxygen
Reduction Derived from Polyaniline, Iron, and Cobalt. Science 2011, 332, 443–447.
[47] M.Q. Wang, W.H. Yang, H.H. Wang, C. Chen, Z.Y. Zhou, S.G. Sun. Pyrolyzed Fe–N–C
Composite as an Efficient Non-Precious Metal Catalyst for Oxygen Reduction Reaction in Acidic
Medium. ACS Catal. 4 (2014) 3928–3936.
[48] L.G. Bulusheva, A.V. Okotrub, A.G. Kurenya, H. Zhang, H. Zhang, X. Chen, H. Song.
Electrochemical properties of nitrogen-doped carbon nanotube anode in Li-ion batteries. Carbon 49
(2011) 4013–4023.

245
[49] A.C. Ferrari, D.M. Basko. Raman spectroscopy as a versatile tool for studying the properties of
graphene. Nat. Nanotech. 8 (2013) 235–246.
[50] I.Y. Jeon, D. Yu, S.Y. Bae, H.J. Choi, D.W. Chang, L. Dai, J.-B. Baek. Formation of large-area
nitrogen-doped graphene film prepared from simple solution casting of edge-selectively
functionalized graphite and its electrocatalytic activity. Chem Mater 23 (2011) 3987–3992.
[51] H. Li, W. Kang, L. Wang, Q. Yue, S. Xu S, H. Wang, J. Liu. Synthesis of three-dimensional
flowerlike nitrogen-doped carbons by a copyrolysis route and the effect of nitrogen species on the
electrocatalytic activity in oxygen reduction reaction. Carbon 54 (2013) 249–57.
[52] J.-z. Zou, X.-r. Zeng, X.-b. Xiong, H.-I. Tang, L. Li, Q. Liu, Z.-q. Li. Preparation of vapor grown
carbon fibers by microwave pyrolysis chemical vapor deposition. Carbon 45 (2007) 828–832.
[53] F. Jaouen, A.M. Serventi, M. Lefèvre, J.-P. Dodelet, P. Bertrand. Non-Noble Electrocatalysts
for O2 Reduction: How Does Heat Treatment Affect Their Activity and Structure? Part II. Structural
Changes Observed by Electron Microscopy, Raman, and Mass Spectroscopy. J. Phys. Chem. C 111
(2007) 5971–5976.
[54] C. Domínguez, F.J. Pérez-Alonso, M. Abdel Salam, J.L. Gómez de la Fuente, S.A. Al-Thabaiti,
S.N. Basahel, M.A. Peña, J.L.G. Fierro, S. Rojas. Effect of transition metal (M: Fe, Co or Mn) for the
oxygen reduction reaction with non-precious metal catalysts in acid medium. Int. J. Hydrogen Energy
39 (2014) 5309–5318.
[55] G. Lalande, R. Côté, G. Tamizhmani, D. Guay, J.-P. Dodelet, L. Dignard-Bailey, L.T. Weng, P.
Bertrand. Physical, chemical and electrochemical characterization of heat-treated tetracarboxylic
cobalt phthalocyanine adsorbed on carbon black as electrocatalyst for oxygen reduction in polymer
electrolyte fuel cells. Electrochim. Acta. 40 (1995) 2635–2646.
[56] A. Gómez-Siurana, A. Marcilla, M. Beltrán, D. Berenguer, I. Martínez-Castellanos, S.
Menargues. TGA/FTIR study of tobacco and glycerol–tobacco mixtures. Thermochimica Acta 573
(2013) 146–157.
[57] C.W.B. Bezerra, L. Zhang, K. Lee, H. Liu, A.L.B. Marques, E.P. Marques, H. Wang, J. Zhang.
A review of Fe–N/C and Co–N/C catalysts for the oxygen reduction reaction. Electrochimica Acta
53 (2008) 4937–4951.
[58] S.-F. Pop, R.-M. Ion, M.C. Corobea, V. Raditoiu. Spectral and thermal investigations of
porphyrin and phthalocyanine nanomaterials. J. Optoelectronics Adv. Mater. 13 (2011) 906–911.
[59] Y. Li, Z.-H. Wang, Z.-Y. Huang, J.-Z. Liu, J.-H. Zhou, K.-F. Cen. Effect of pyrolysis temperature
on lignite char properties and slurrying ability. Fuel Processing Technology 134 (2015) 52–58.

246
[60] R. Alipour Moghadam, S. Yusup, W. Azlina, S. Nehzati, A. Tavasoli. Investigation on syngas
production via biomass conversion through the integration of pyrolysis and air–steam gasification
processes. Energy Conversion and Management 87 (2014) 670–675.
[61] M. Lefèvre, J.-P. Dodelet, P. Bertrand. Molecular Oxygen Reduction in PEM Fuel Cells:
Evidence for the Simultaneous Presence of Two Active Sites in Fe-Based Catalysts. J. Phys. Chem.
B 106 (2002) 8705–8713.
[62] A.L. Bouwkamp-Wijnoltz, W. Visscher, J.A.R. Van Veen, E. Boellaard, A.M. Van der Kraan,
S.C. Tang. On Active-Site Heterogeneity in Pyrolyzed Carbon-Supported Iron Porphyrin Catalysts
for the Electrochemical Reduction of Oxygen: An In Situ Mossbauer Study. J. Phys. Chem. B 106
(2002) 12993–13001.
[63] J. Tian, A. Morozan, M.T. Sougrati, M. Lefèvre, R. Chenitz, J.-P. Dodelet, D. Jones, F. Jaouen.
Optimized Synthesis of Fe/N/C Cathode Catalysts for PEM Fuel Cells: A Matter of Iron–Ligand
Coordination Strength. Angewandte Chemie 52 (2013) 6867–6870.
[64] U.I. Kramm, M. Lefèvre, N. Larouche, D. Schmeisser, J.-P. Dodelet. Correlations between mass
activity and physicochemical properties of Fe/N/C catalysts for the ORR in PEM fuel cell via 57Fe
Mössbauer spectroscopy and other techniques. J. Am. Chem. Soc. 136 (2013) 978–985.
[65] J.-P. Dodelet, R. Chenitz, L. Yang, M. Lefèvre. A new catalytic site for the electroreduction of
Oxygen? Chem. Cat. Chem. 7 (2014) 1866–1867.
[66] J.H. Zagal, S. Griveau, J.F. Silva, T. Nyokong, F. Bedioui. Metallophthalocyanine-based
molecular materials as catalysts for electrochemical reactions. Coord. Chem. Rev. 23-24, 2010, 2755–
2791.
[67] J. Masa, K. Ozoemena, W. Schuhmann, J.H. Zagal. Oxygen reduction reaction using N4-
metallomacrocyclic catalysts: Fundamentals on rational catalyst design. J. Porphyrins
Phthalocyanines. 16 (2012) 761–784.
[68] U. Tylus, Q. Jia, K. Strickland, N. Ramaswamy, A. Serov, P. Atanassov, S. Mukerjee.
Elucidating oxygen reduction active sites in pyrolyzed metal−nitrogen coordinated non-precious-
metal electrocatalyst systems. J. Phys. Chem. C 118 (2014) 8999−9008.
[69] H. Tüysüz, F. Schüth, L. Zhi, K. Müllen, M, Comotto. Ammonia decomposition over iron
phthalocyanine-based materials. Chem. Cat. Chem. 7 (2015) 1453–1459.
[70] K. Strickland, E. Miner, Q. Jia, U. Tylus, N. Ramaswamy, W. Liang, M.-T. Sougrati, F. Jaouen,
S. Mukerjee. Highly active oxygen reduction non-platinum group metal electrocatalyst without direct
metal–nitrogen coordination. Nature Communications 6 (2015) 7343.
[71] Y.C. Wu, D. Feng, W.F. Koch. Evaluation of liquid junction potentials and determination of pH
values of strong acids at moderate ionic strengths. J. Sol. Chem. 18 (1989) 641–649.

247
[72] J. Chlistunoff. RRDE and Voltammetric Study of ORR on Pyrolyzed Fe/Polyaniline Catalyst.
On the Origins of Variable Tafel Slopes. J. Phys. Chem. C 155 (2011) 6496–6507.
[73] E. Frackowiak, F Béguin. Carbon materials for the electrochemical storage of energy in
capacitors. Carbon 39 (2001) 937–950
[74] F. Jaouen, V. Goellner, M. Lefèvre, J. Herranz, E. Proietti, J.P. Dodelet. Oxygen reduction
activities compared in rotating-disk electrode and proton exchange membrane fuel cells for highly
active Fe N C catalysts. Electrochimica Acta 87 (2013) 619– 628
[75] C.-W.Tsai, H.-M. Tu, C.-J. Chen, T.-F. Hung, R.-S. Liu, W.-R. Liu, M.-Y. Lo, Y.-M. Peng, L.
Zhang, J. Zhang, D.-S. Shy, X.-K. Xing. Nitrogen-doped graphene nanosheet-supported non-
precious iron nitride nanoparticles as an efficient electrocatalyst for oxygen reduction. RSC Adv. 1
(2011) 1349–1357.
[76] L. Zhang, J. Kim, E. Dya, S. Ban, K.-c. Tsay, H. Kawai, Z. Shi, J. Zhang. Synthesis of novel
mesoporous carbon spheres and their supported Fe-based electrocatalysts for PEM fuel cell oxygen
reduction reaction. Electrochim. Acta 108 (2013) 480–485.
[77] R. Guidelli, R.G. Compton, J.M. Feliu, E. Gileadi, J. Lipkowski, W. Schmickler, S. Trasatti.
Defining the transfer coefficient in electrochemistry: An assessment (IUPAC Technical Report). Pure
Appl. Chem. 86 (2014) 245–258.
[78] R. Guidelli, R.G. Compton, J.M. Feliu, E. Gileadi, J. Lipkowski, W. Schmickler, S. Trasatti.
Definition of the transfer coefficient in electrochemistry (IUPAC Recommendations 2014). Pure
Appl. Chem. 86 (2014) 259–262.
[79] B.N. Grgur, N.M. Markovic, P.N. Ross Jr. Temparature-dependent oxygen electrochemistry on
platinum low-index single crystal surfaces in acid solutions. Can. J. Chem. 75 (1997) 1465.
[80] A. Damjanovic, D.B. Sepa. An analysis of the pH dependence of enthalpies and Gibbs energies
of activation for O2 reduction at Pt electrodes in acid solutions. Electrochim. Acta 35 (1990) 1157–
1162.
[81] J. Bett, J. Lundquist, E. Washington, P. Stonehart. Platinum crystallite size considerations for
electrocatalytic oxygen reduction. Electrochim. Acta 18 (1973) 343–348.
[82] A. Holewinski, S. Linic. Elementary Mechanisms in Electrocatalysis: Revisiting the ORR Tafel
Slope. J. Electrochem. Soc. 159 (2012) H864-H870.
[83] S.L. Gojkovic, S.K. Zecevic, R.F. Savinell. O2 Reduction on an Ink-Type Rotating Disk
Electrode Using Pt Supported on High-Area Carbons. J. Electrochem. Soc., 145 (1998) 3713–3720.
[84] G. Sasi Kumar, M. Raja, S. Parthasarathy. High performance electrodes with very low platinum
loading for polymer electrolyte fuel cells. Electrochim. Acta 40 (1995) 285

248
[85] Q. He, S. Mukerjee. Electrocatalysis of oxygen reduction on carbon-supported PtCo catalysts
prepared by water-in-oil micro-emulsion. Electrochim. Acta 55 (2010) 1709–1719.
[86] N.M. Markovic, T.J. Schmidt, V. Stamenkovic, P.N. Ross. Oxygen Reduction Reaction on Pt
and Pt Bimetallic Surfaces: A Selective Review. Fuel Cells 1 (2001) 105–116.
[87] J. Perez, E.R. Gonzalez, E.A. Ticianelli. Oxygen electrocatalysis on thin porous coating rotating
platinum electrodes. Electrochim. Acta 44 (1998) 1329–1339.
[88] I.A. Pasti, N. M. Gavrilov, S.V. Mentus. Potentiodynamic investigation of oxygen reduction
reaction on polycrystalline platinum surface in acidic solutions: The effect of the polarization rate on
the kinetic parameters. Int. J. Electrochem. Sci. 7 (2012) 11076–11090.
[89] A. Muthukrishnan, Y. Nabae, T. Hayakawa, T. Okajima, T. Ohsaka. Fe-containing polyimide-
based high-performance ORR catalysts in acidic medium: a kinetic approach to study the durability
of catalysts. Catal. Sci. Technol. 5 (2015) 475–483.
[90] M.L. Perry, J. Newman, E.J. Cairns. Mass Transport in Gas-Diffusion Electrodes: A Diagnostic
Tool for Fuel-Cell Cathodes. J. Electrochem. Soc. 145 (1998) 5–15.
[91] W. Cai, X. Zhao, C. Liu, W. Xing, J. Zhang (2014) Electrode kinetics of electron-transfer and
reactant transport in electrolyte solution. Chapter 2 in: Rotating Electrode Methods and Oxygen
Reduction Electrocatalysis. W. Xing, G. Yin and J. Zhang (Eds.), Elsevier, pp. 33–65.
[92] T. Kaskiala. Determination of oxygen solubility in aqueous sulphuric acid media. Minerals
Engineering 15 (2002) 853–857.
[93] A. Damjanovic, M.A. Genshaw, J.O.M. Bockris. The Role of Hydrogen Peroxide in Oxygen
Reduction at Platinum in H2SO4 Solution. J. Electrochem Soc. 114 (1967) 466–472.
[94] K.E. Gubbins, R.D. Walker, Jr. The Solubility and Diffusivity of Oxygen in Electrolytic
Solutions. J. Electrochem. Soc. 112 (1965) 469-471.
[95] N. Wakabayashi, M. Takeichi, M. Itagaki, H. Uchida, M. Watanabe. Temperature-dependence
of oxygen reduction activity at a platinum electrode in an acidic electrolyte solution investigated with
a channel flow double electrode. J. Electroanal. Chem. 574 (2005) 339–346.
[96] U.A. Paulus, A. Wokaun, G.G. Scherer, T.J. Schmidt, V. Stamenkovic, V. Radmilovic, N.M.
Markovic, P.N. Ross. Oxygen Reduction on Carbon-Supported Pt - Ni and Pt - Co Alloy Catalysts.
J. Phys. Chem. B 106 (2002) 4181–4191.
[97] V. Stamenkovic, T.J. Schmidt, P.N. Ross, N.M. Markovic. Surface Composition Effects in
Electrocatalysis: Kinetics of Oxygen Reduction on Well-Defined Pt 3 Ni and Pt 3 Co Alloy Surfaces.
J. Phys. Chem. B 106 (2002) 11970–11979.
249
[98] A.B. Anderson, J. Roques, S. Mukerjee, V.S. Murthi, N.M. Markovic, V. Stamenkovic.
Activation Energies for Oxygen Reduction on Platinum Alloys: Theory and Experiment. J. Phys.
Chem. B 109 (2005) 1198–1203.
[99] K.C. Neyerlin, W. Gu, J. Jorne, H.A. Gasteiger. Determination of Catalyst Unique Parameters
for the Oxygen Reduction Reaction in a PEMFC. J. Electrochem. Soc. 153 (2006) A1955-A1963.
[100] N. Ramaswamy, S. Mukerjee. Fundamental Mechanistic Understanding of Electrocatalysis of
Oxygen Reduction on Pt and Non-Pt Surfaces: Acid versus Alkaline Media. Advances in Physical
Chemistry (2012) 1–17, doi:10.1155/2012/491604.
[101] N. Ramaswamy, S. Mukerjee. Influence of inner- and outer-sphere electron transfer
mechanisms during electrocatalysis of oxygen reduction in alkaline media. J. Phys. Chem. C 115
(2011) 18015–18026.
[102] F. Jaouen, J.-P. Dodelet. O2 Reduction Mechanism on Non-Noble Metal Catalysts for PEM
Fuel Cells. Part I: Experimental Rates of O2 Electroreduction, H2O2 Electroreduction, and H2O2
Disproportionation. J. Phys. Chem. C 113 (2009) 15422–15432.
[103] L. Lai, J.R. Potts, D. Zhan, L. Wang, C.K. Poh, C. Tang, H. Gong, Z. Shen, J. Lin, R.S. Ruoff.
Exploration of the active center structure of nitrogen-doped graphene-based catalysts for oxygen
reduction reaction. Energy Environ. Sci., 5 (2012) 7936–7942.
[104] J. Masa, C. Batchelor-McAuley, W. Schuhmann, R.G. Compton. Koutecky-Levich analysis
applied to nanoparticle modified rotating disk electrodes: Electrocatalysis or misinterpretation. Nano
Research 7 (2014) 71–78.
[105] F. Jaouen. O2 Reduction Mechanism on Non-Noble Metal Catalysts for PEM Fuel Cells. Part
II: A Porous-Electrode Model To Predict the Quantity of H2O2 Detected by Rotating Ring-Disk
Electrode. J. Phys. Chem. C 113 (2009) 15433–15443.
[106] S.L. Gojkovic, S. Gupta, R.F. Savinell. Heat-treated iron(III) tetramethoxyphenyl porphyrin
chloride supported on high-area carbon as an electrocatalyst for oxygen reduction Part II. Kinetics of
oxygen reduction. J. Electroanal. Chem. 462 (1999) 63–72.
[107] K.-L. Hsueh, D.-T. Chin, S. Srinivasan. Electrode kinetics of oxygen reduction: A theoretical
and experimental analysis of the rotating ring-disc electrode method. J. Electroanal. Chem, 153
(1983) 79–75.
[108] P. Xu, W. Chen, Q. Wang, T. Zhu, M. Wu, J. Qiao, Z. Chen, J. Zhang. Effects of transition
metal precursors (Co, Fe, Cu, Mn, or Ni) on pyrolyzed carbon supported metal-aminopyrine
electrocatalysts for oxygen reduction reaction. RSC Adv. 5 (2015) 6195–6206.

250
[109] D. Sebastián,V. Baglio, S. Sun, A.C. Tavares, A.S. Aricò. Graphene-Supported
Substoichiometric Sodium Tantalate as a Methanol-Tolerant, Non-Noble-Metal Catalyst for the
Electroreduction of Oxygen. ChemCatChem (2015) DOI: 10.1002/cctc.201403026.
[110] A. Velázquez-Palenzuela, Francesc Centellas, José Antonio Garrido, Conchita Arias, Rosa
María Rodríguez, Enric Brillas, Pere-Lluís CabotKinetic analysis of carbon monoxide and methanol
oxidation on high performance carbon-supported Pt–Ru electrocatalyst for direct methanol fuel cells.
J. Power Sources 196 (2011) 3503–3512.
[111] R. Alipour Moghadam Esfahani, A.H.A. Monteverde Videla, S. Vankova, S. Specchia. Stable
and methanol tolerant Pt/TiOx-C electrocatalysts for the oxygen reduction reaction. Int. J. Hydrogen
Energy 40 (2015) 1–11.
[112] D.-J. Guo, X.-P. Qiu, W.-T. Zhu, L.-Q. Chen. Synthesis of sulfated ZrO2/MWCNT composites
as new supports of Pt catalysts for direct methanol fuel cell application. Appl. Catal. B: Environ. 89
(2009) 597–601.
[113] A.H.A. Monteverde Videla, L. Osmieri, R. Alipour Moghadam Esfahani, J. Zeng, C. Francia,
S. Specchia. The Use of C-MnO2 as Hybrid Precursor Support for a Pt/C-MnxO1+x Catalyst with
Enhanced Activity for the Methanol Oxidation Reaction (MOR). Catalysts 5 (2015) 1399–1416.
[114] R. Escudero-Cid, A.S. Varela, P. Hernández-Fernández, E. Fatás, P. Ocón. The effect of
functionalised multi-walled carbon nanotubes in the hydrogen electrooxidation reaction in reactive
currents impurified with CO. Int. J. Hydrogen Energy 39 (2014) 5063–5073.
[115] R. Escudero-Cid, M. Montiel, L. Sotomayor, B. Loureiro, E. Fatás, P. Ocón. Evaluation of
polyaniline-Nafion® composite membranes for direct methanol fuel cells durability tests. Int. J.
Hydrogen Energy 40 (2015) 8182–8192.
[116] D. Sebastián, V. Baglio, A.S. Aricò, A. Serov, P. Atanassov. Performance analysis of a non-
platinum group metal catalyst based on iron-aminoantipyrine for direct methanol fuel cells. Appl.
Catal. B: Environ. 182 (2016) 297–305.
[117] B. Piela, T.S. Olson, P. Atanassov, P. Zelenay.Highly methanol-tolerant non-precious metal
cathode catalysts for direct methanol fuel cell. Electrochim. Acta 55 (2010) 7615–7621.
[118] A. Serov, M.H. Robson, B. Halevi, K. Artyushkova, P. Atanassov. Highly active and durable
templated non-PGM cathode catalysts derived from iron and aminoantipyrine. Electrochem. Comm.
22 (2012) 53–56.
[119] A. Serov, M.H. Robson, M. Smolnik, P. Atanassov. Tri-metallic transition metal–nitrogen–
carbon catalysts derived by sacrificial support method synthesis. Electrochim. Acta 109 (2013) 433–
439.
251
[120] Kinoshita K, Carbon – Electrochemical and Physicochemical Properties, Wiley Interscience,
1988.
[121] Z. Chen, D. Higgins, Z. Chen. Electrocatalytic activity of nitrogen doped carbon nanotubes
with different morphologies for oxygen reduction reaction. Electrochim. Acta 55 (2010) 4799–4804.
[122] X. Fu, Y. Liu, X. Cao, J. Jin, Q. Liu, J. Zhang. FeCo–Nx embedded graphene as high
performance catalysts for oxygen reduction reaction. Appl. Catal. B: Environmental 130–131 (2013)
143–151.
[123] W.Y. Wong, W.R.W. Daud, A.B. Mohamad, A.A.H. Kadhum, K.S. Loh, E.H. Majlan, K.L.
Lim. The Impact of Loading and Temperature on the Oxygen Reduction Reaction at Nitrogen-doped
Carbon Nanotubes in Alkaline Medium. Electrochimica Acta 129 (2014) 47–54.
[124] H.T. Chung, J.H. Won, P. Zelenay. Active and stable carbon nanotube/nanoparticle composite
electrocatalyst for oxygen reduction. Nature comm. 4 (2013) 1922.
[125] J. Perez, A.A. Tanaka, E.R. Gonzalez, E.A. Ticianelli. Application of the Flooded-Agglomerate
Model to Study Oxygen Reduction on Thin Porous Coating Rotating Disk Electrode. J. Electrochem.
Soc. 141 (1994) 431–436.
[126] N.M. Markovic, H.A. Gasteiger, P.N. Ross (Jr.). Oxygen Reduction on Platinum Low-Index
Single-Crystal Surfaces in Alkaline Solution: Rotating Ring DiskPt(hkl) Studies. J. Phys. Chem. 100
(1996) 6715–6721.
[127] A.J. Appleby (1983) Electrocatalysis. Chapter 7 in: Comprehensive Treatise of
Electrochemistry. B.E. Conway, J.O.M. Bockris, E. Yeager, S.U.M. Khan, R.E. white (Eds.),
Springer, 173–239.
[128] E. Yeager. Electrocatalysts for O2 reduction. Electrochim. Acta 29 (1984) 1527–1537.
[129] Z. Yang, M.R. Berber, N. Nakashima. Design of Polymer-Coated Multi-Walled Carbon
Nanotube/Carbon Black-based Fuel Cell Catalysts with High Durability and Performance Under
Non-humidified Condition. Electrochimica Acta 170 (2015) 1–8.
[130] S.-Y. Lin, M.-H. Chang. Effect of microporous layer composed of carbon nanotube and
acetylene black on polymer electrolyte membrane fuel cell performance. Int. J. Hydrogen Energy 40
(2015) 7879–7885.
[131] S. Stariha, K. Artyushkova, A. Serov, P. Atanassov. Non-PGM membrane electrode
assemblies: Optimization for performance. Int. J. Hydrogen Energy 40 (2015) 14676–14682.
[132] H. Li, Y. Tang, Z. Wang, Z Shi, S. Wua, D. Song, J. Zhang, K. Fatih, J. Zhang, H. Wang, Z.
Liu, R. Abouatallah, A. Mazza. A review of water flooding issues in the proton exchange membrane
fuel cell. J. Power Sources 178 (2008) 103–117.

252
[133] J. Xie, F. Xu, D.L. Wood III, K.L. More, T.A. Zawodzinski, W.H. Smith. Influence of ionomer
content on the structure and performance of PEFC membrane electrode assemblies. Electrochimica
Acta 55 (2010) 7404–7412.
[134] R. Escudero Cid, J.L Gómez de la Fuente, S. Rojas, J.L. García Fierro, P. Ocón. Polypyrrole-
Modified-Carbon-Supporte d Ru-Pt Nanoparticles as Highly Methan ol-Tolerant Electrocatalysts for
the Oxygen-Reduction Reaction. ChemCatChem 5 (2013) 3680–3689.
[135] R. Escudero-Cid, J.C. Pérez-Flore, E. Fatás, P. Ocón. Degradation of DMFC using a New Long-
Term Stability Cycle. International J. Green Energy 00 (2015) 1–13.
DOI:10.1080/15435075.2013.867269.
[136] A.L.M. Reddy, N. Rajalakshmi, S. Ramaprabhu. Cobalt-polypyrrole-multiwalled carbon
nanotube catalysts for hydrogen and alcohol fuel cells. Carbon 46 (2008) 2–11.
[137] R. Bashyam, P. Zelenay. A class of non-precious metal composite catalysts for fuel cells.
Nature 443 (2006) 63–66.
[138] M. Ferrandon, X, Wang, A.J. Kropf, D.J. Myers, G. Wu, C.M. Johnston, P. Zelenay. Stability
of iron species in heat-treated polyaniline–iron–carbon polymer electrolyte fuel cell cathode catalysts.
Electrochimica Acta 110 (2013) 282–291.
[139] A. Velázquez-Palenzuela, L. Zhang, L. Wang, P.L. Cabot, E. Brillas, K. Tsay, J. Zhang. Fe–
Nx/C electrocatalysts synthesized by pyrolysis of Fe(II)–2,3,5,6-tetra(2-pyridyl)pyrazine complex for
PEM fuel cell oxygen reduction reaction. Electrochimica Acta 56 (2011) 4744–4752.
[140] D. Zhao, J.-L. Shui, L.R. Grabstanowicz, C. Chen, S.M. Commet, T. Xu, J. Lu, D.-J. Liu.
Highly efficient non-precious metal electrocatalyst prepared from one-pot synthesized zeolitic
imidazolate. Adv. Mater. 26 (2014) 1093–1097.
[141] Y.S. Li, T.S. Zhao, Z.X. Liang. Effect of polymer binders in anode catalyst layer on
performance of alkaline direct ethanol fuel cells J. Power Sources 190 (2009) 223–229.
[142] A .N. Geraldes, D.F. da Silva, L. Gondim de Andrade e Silva, E.V. Spinacé, A. Oliveira Neto,
M. Coelho dos Santos. Binary and ternary palladium based electrocatalysts for alkaline direct glycerol
fuel cell. J. Power Sources 275 (2015) 189–199.
[143] M. Zhiani, H.A. Gasteiger, M. Piana, S. Catanorchi. Comparative study between platinum
supported on carbon and non-noble metal cathode catalyst in alkaline direct ethanol fuel cell
(ADEFC). Int. J. Hydrogen Energy 36 (2011) 5110–5116.
[144] A.C. Garcia, J.J. Linares. M. Chatenet, E.A. Ticianelli. NiMnOx/C: A Non-noble Ethanol-
Tolerant Catalyst for Oxygen Reduction in Alkaline Exchange Membrane DEFC. Electrocatalysis 5
(2014) 41–49.
[145] http://www1.lsbu.ac.uk/water/water_molecule.html , accessed on 12/01/2016
253
[146] D.E. Makarov, Single Molecule Science: Physical Principles and Models, CRC Press, 2015.
[147] F. Charreteur, F. Jaouen, S. Ruggeri, J.-P. Dodelet. Fe/N/C non-precious catalysts for PEM fuel
cells: Influence of the structural parameters of pristine commercial carbon blacks on their activity for
oxygen reduction. Electrochim. Acta 53 (2008) 2925–2938.
[148] G. Wu, K. Artyushkova, M. Ferrandon, J. Kropf, D. Myers, P. Zelenay. Performance Durability
of Polyaniline-derived Non-Precious Cathode Catalysts. ECS Transactions 25 (2009) 1299–1311.
[149] R. Janarthanan, A. Serov, S.K. Pilli, D.A. Gamarra, P. Atanassov, M.R. Hibbs, A.M. Herring.
Direct Methanol Anion Exchange Membrane Fuel Cell with a Non-Platinum Group Metal Cathode
based on Iron-Aminoantipyrine Catalyst. Electrochimica Acta 175 (2015) 202–208.
[150] P. Bogdanoff, I. Herrmann, G. Schmithals, S. Fiechter. Influence of the Molecular and
Mesoscopic Structure on the Electrocatalytic Activity of Pyrolysed CoTMPP in the Oxygen
Reduction. ECS Trans. 3 (2006) 211–219.
[151] F. He, J. Yang, R. Li, B.H. Liu, Z.P. Li. Performance of nitrogen-containing macroporous
carbon supported cobalt catalyst synthesized through in-situ construction of catalytic sites for
oxygen reduction reaction. J. Power Sources 274 (2015) 48–55.

254

255
CHAPTER 7. Fe-N-C electrocatalysts for oxygen reduction reaction derived from
the impregnation of Fe – 1,10-phenanthroline complex on different carbon
supports.
1. Introduction.
1,10-phenanthroline is a nitrogen-containing organic molecule which in water solution is capable to
form complexes with Fe ion [1,2]. Due to the fact that they contain Fe, N and C, with nitrogen atoms
coordinating the metal, these iron-phenanthroline complexes have been used as precursors for the
synthesis of heat treated non-precious metal based Fe-N-C electrocatalysts for ORR since many years
[3–5]. Recently, the use of Fe-phenanthroline complexes has aroused again the interest of researchers
in the field of ORR catalysts alternative to Pt-based ones [6–9].
The importance of the different carbon support in getting a good ORR activity was underlined by
several works [10–12].
In this work, four different carbon supports have been used for the impregnation of the Fe-
phenanthroline complex.
1 – A mesoporous carbon (MPC) synthesized in our laboratory via a hard-templating method of a
commercial mesoporous silica.
2 – A carbon (CNS) synthesized in our laboratory via a hard-templating method of a commercial
silica nanopowder with homogeneous particle size of 12 nm.
3 – Commercial multi-walled carbon nanotubes (MWCNT).
4 – Commercial Shawinigan AB50 acetylene black (SHAW).
After impregnation with the Fe-phenanthroline complex, the four different samples were pyrolyzed
in inert atmosphere at 800 °C. Their electroactivity toward ORR was tested in RDE in acidic and
alkaline conditions. The catalyst synthesized starting from the MPC support was found to have the
better activity in both acid and alkaline conditions. Therefore, to further improve its activity, it was
submitted to a second pyrolysis at 800°C in inert atmosphere (in the same conditions used for the first
heat treatment). In fact, performing a second heat treatment was found to have a positive influence in
improving the ORR activity o such this type of Me-N-C catalysts [4,13–15] as also demonstrated in
Chapter 3 and Chapter 4.

256
The structural properties of the five catalysts were characterized by nitrogen physisorption analysis.
An XPS analysis was performed to determine the surface elemental composition of the catalysts,
particularly regarding the N and Fe contents.
Finally, the performances of the catalysts were tested in H2 and methanol fueled PEMFC, and in an
ethanol fueled alkaline membrane fuel cell.
2. Experimental.
2.1. Chemicals.
Commercial multi-walled carbon nanotubes (MWCNT, average length 5 m, outer diameter 6–9 nm,
> 95% carbon) were purchased from Sigma-Aldrich. Shawinigan AB50 acetylene black (SHAW)
was purchased from Chevron Phillips Chemical Company.
Silica mesoporous nanoparticles (200 nm particle size, 4 nm pore size) and silica nanopowder (12 nm
primary particle size) were purchased by Sigma-Aldrich.
Hydrochloric acid (HCl, 37 wt. %), Sulfuric acid (H2SO4, 98 wt. %), Hydrofluoric acid (HF, ≥ 40 wt.
%), Potassium Hydroxide (KOH, 99.0% purity), Sucrose (≥ 99.0% purity), Ethanol (≥ 99.8% purity),
Acetone (≥ 99.8% purity), Isopropanol (≥ 99.7% purity), Nafion® 5 wt. % hydroalcoholic solution,
1,10-Phenanthroline C12H8N2 (Phen, ≥99 % purity), Iron(III) chloride (FeCl3, ≥97 % purity) were
purchased from Sigma-Aldrich. Nitrogen and oxygen gases were supplied in cylinders by SIAD with
99.999% purity. All aqueous solutions were prepared using ultrapure deionized water obtained from
a Millipore Milli-Q system with resistivity >18 MΩ cm-1.
2.2. Synthesis.
2.2.1. Synthesis of the MPC and CNS carbon supports.
MPC mesoporous carbon and CNS carbon were synthesized via hard templating method [16]. The
templates used were the commercial silica mesoporous nanoparticles and the silica nanopowder,
respectively. The synthesis method consists on impregnating the silica with a solution containing
sucrose (used as the carbon source) and sulphuric acid. More in detail, a solution containing 10 mL
of deionized water, 0.152 mL of H2SO4 and 2.5 g of sucrose was pipetted drop by drop onto 2 g of
silica. Then the temperature was increased at 100°C on a hot plate, and kept constant for 6 hours.
Subsequently the temperature was increased to 160 °C and kept constant for 6 hours more. This two-
steps heating procedure is repeated after pipetting drop by drop a solution containing 10 mL of
deionized water, 0.098 mL of H2SO4 and 1.6 g of sucrose. Then, after becoming completely dry, the
carbon-silica mixture was heat-treated in a quartz-tube reactor at 830 °C for 6 hours under nitrogen
atmosphere. To completely remove the silica template, the mixture was put in 110 mL of 5 % wt. HF

257
solution. Finally, the as obtained MPC and CNS were filtered under vacuum, washed with abundant
deionized water and acetone, and dried in air.
2.2.2. Synthesis of the Fe-N/C catalysts.
Before their use, all of the C-supports (MPC, CNS, MWCNT and SHAW) were washed with 1 M
HCl solution for 3 h under stirring, filtered under vacuum, washed with abundant deionized water
and dried at room temperature. Four different catalysts were obtained from these different C-supports,
exactly following the same synthesis procedure, as described below.
Typically, for 120 mg of C-support, 130 mg of 1,10-phenanthroline (Phen) ligand molecule, used as
a nitrogen source, was dissolved in 80 mL of ethanol – deionized water solution (70 mL ethanol + 10
mL deionized water), leaving under stirring until complete dissolution of Phen (about 2 h). Then, 35
mg of FeCl3 was added to the solution, with the immediate formation of a reddish-orange complex
(see Figure 1). According to these quantities, Fe:C-support mass ratio was set to 1:10, and the Fe:Phen
molar ratio was of 1:3.35. Since each Fe ion coordinates with 3 Phen molecules [1,2], the slightly
greater quantity of Phen used in the synthesis should assure a stoichiometric excess of ligand molecule
to favor the chemical equilibrium of the Fe ion complexation. Moreover, this excess of Phen (and
therefore of N atoms) may help to get a higher doping level of the C-support surface with N atoms,
favoring the formation of active sites. The solution was left stirring at room temperature for 3 hours
and afterwards the C-support was added to it. This dispersion was put in an ultrasonic bath for 30
minutes (130 W, Soltec 2200 M 3S sonicator) for allowing a better dispersion of the C-support. Then,
it was left under stirring overnight and therefore the solvent was evaporated by heating on a hot plate,
and the recovered powder was grinded in a mortar. Therefore, it was pyrolyzed in a tubular quartz
furnace under nitrogen atmosphere (N2 gas flux set at 150 N mL min–1 with a mass flow controller
from Bronkhorst, ELFLOW series) at 800 °C. The heating rate was set to 10 °C min–1. The
temperature was kept constant for 1 hours at 800 °C, and then the furnace was switched-off leaving
the apparatus cooling down naturally to room temperature. The 4 catalysts obtained from the different
C-supports (SHAW, MWCNT, CNS and MPC) were named Fe-N/SHAW, Fe-N/MWCNT, Fe-
N/CNS and Fe-N/MPC1, respectively. For the Fe-N/MPC1 catalyst, the pyrolysis was repeated one
more time in the same conditions, starting again from room temperature, and the final catalyst was
named Fe-N/MPC2.
Before testing, all of the catalysts were washed in 1 M HCl solution for 3 hours at 60 °C under reflux,
to remove any instable or unbounded acid-soluble Fe, or Fe oxide moiety [13,17,18]. Afterwards the
powders were filtered, washed with abundant deionized water until neutral pH, and dried overnight
at room temperature.

258
2.3. Physico-chemical characterization.
2.3.1. XPS analysis.
The X-ray photoelectron spectra (XPS) of the samples were acquired with a VG Escalab 200R
spectrometer fitted with a Mg Kα (hυ =1253.6 eV) 120 W X-ray source. Samples were placed in a
pretreatment chamber, and degassed at 10−5 mbar at room temperature and for 1 hour prior to be
transferred to the analysis chamber. Residual pressure was maintained below 3.0·10−8 mbar. The 50
eV energy regions of the photoelectrons of interest were scanned a number of times to obtain an
acceptable signal-to-noise ratio. Intensities were estimated by calculating the integral of each peak,
determined by subtraction of the Shirley-type background and fitting of the experimental curve to a
combination of Lorentzian and Gaussian lines of variable proportions. Accurate binding energies
(±0.2 eV) were determined by referencing to the C 1s peak at 284.6 eV [19].
2.3.2. N2 physisorption analysis.
Nitrogen adsorption and desorption isotherms were recorded by an ASAP 2020 Instrument
(Micromeritics) at –196 °C. Before being analyzed all of the samples were degassed at 150 °C under
vacuum for 24 h. The specific surface areas were calculated by the Brunauer–Emmett–Teller (BET)
method within the relative pressure range P/P0 = 0.05 - 0.30 [17]. The pore size distribution was
obtained with the Barrett–Joyner–Halenda (BJH) method.
2.4. RDE tests.
The ORR activity of the Fe-N/C was preliminary checked in 3-electrode configuration in the RDE
cell apparatus. The catalysts the ink was prepared by dispersing a given mass of catalyst in a solution
containing known volumes of isopropanol, deionized water and a 5% wt. Nafion ionomer hydro-
alcoholic solution. The complete ink preparation procedure is described in Paragraph 2.4.1 of Chapter
6. The RDE cell was equipped with a glassy carbon disk working electrode (disk diameter 4 mm), a
Pt helical wire counter electrode, and a saturated calomel reference electrode (SCE). For tests in acidic
conditions the electrolyte was a 0.5 M H2SO4 solution. For tests in alkaline conditions the electrolyte
was a 0.1 M KOH solution. Prior to start tests, the electrolytes were saturated with pure N2, and 50
cyclic voltammetry (CV) cycles at 100 mV s–1 scan rate were performed in the potential window 0.0
- 1.2 V vs RHE, in order to obtain an electrochemically clean and stable working electrode surface.
Afterwards, the solution was saturated with pure O2 and the RDE rotation speed was set at 900 rpm.
Then, staircase voltammetries were recorded with a potential step of 0.01 V and a holding time at
each potential of 10 s. After this time, the background capacitive current had passed, and a steady-
state value of the faradaic current was measured. In this way steady-state polarization curves can be
obtained [14].

259
2.5. Single fuel cell tests.
2.5.1. Acid-DMFC test.
The performance of Fe-N/MWCNT, Fe-N/MPC1 and Fe-N/MPC2 as ORR cathodic catalyst was
evaluated in a 4 cm2 active area DMFC single cell. A commercial Nafion 117 membrane (Dupont)
was used as electrolyte. Before use, the membrane was cleaned as described in Paragraph 2.5.1 of
Chapter 6. A commercial Pt-Ru/C catalyst (Johnson Matthey, 30 wt% Pt-Ru, Pt:Ru 1:1 atomic ratio)
was used as anodic catalyst. As a purpose of comparison, the performance of a DMFC using a
commercial Pt/C catalyst (Johnson Matthey, 40 wt % Pt) at the cathode was also evaluated.
The electrodes were prepared by spraying the catalyst ink onto a Teflon-treated carbon cloth (ELAT
GDL-LT 1200 W) gas diffusion layer (GDL) by means of an air-brush. The inks were prepared by
mixing the catalysts powder with an isopropanol/deionized water solution (2:1 vol.) and a Nafion
ionomer solution (5 wt. %) under sonication until getting a homogeneous suspension. The Nafion
solution amount was calculated in order to have a 50 wt. % of Nafion in the dry catalytic layer. The
total catalyst loading on the electrode was 2.5 mg cm-2. These Nafion content and catalyst loading
were used because they were the optimum conditions found in Chapter 6. For preparing the Pt-Ru
and Pt based electrodes, the Pt loading on the electrodes was set to 1 mg cm-2, with a Nafion content
of 4 wt. %. For the MEAs preparation and for the DMFC tests, we used the same procedure described
in Paragraph 2.5.1 of Chapter 6, at a cell constant temperature of 80 °C, with a methanol 2 M solution
at a flow rate of 1 min-1.
A short-term durability test was performed for Fe-N/MPC2 catalyst. The test consisted of a 3 hours
chronoamperometric experiment at 0.4 V conducted in the same operating conditions described in
Chapter 6, with a flow rate of the methanol solution at the anode of 5 mL min-1 [20]. A polarization
curve is recorded regularly every 30 minutes, to evaluate the performance variation with time.
2.5.2. Acid H2 / O2 PEMFC test.
Fe-N/MWCNT and Fe-N/MPC2 catalysts were also tested in PEMFC using H2 as fuel. The same 4
cm2 active area single cell described in section 2.5.1 was used. In this case, a commercial Nafion 112
membrane (Dupont) was used as electrolyte. The testing was done in the same conditions described
in Paragraph 2.5.2 of Chapter 6. The Nafion content on the dry electrode was 50 wt. % and the catalyst
loading was 2.5 mg cm-2.

260
2.5.3. Alkaline DEFC test.
Fe-N/MPC2 catalyst was also tested as ORR catalyst in a direct ethanol fuel cell (DEFC) with an
alkaline electrolyte membrane, in the same conditions described in Paragraph 2.5.3 of Chapter 6
concerning the MEA preparation and the fuel cell testing parameters.
The Fe-N/MPC2 cathodes were prepared with a Nafion content on the dry electrode of 50 wt. %, and
with a catalyst loading of 2.5 mg cm2.
3. Results and discussion.
3.1. BET and pore size distribution analysis.
The nitrogen adsorption/desorption analysis was performed for all of the Fe-N/C catalysts. The
adsorption-desorption isotherms and the BJH desorption pore-size distribution are shown in Figure
1A and 1B, respectively. The BET surface areas and the BJH total pore volume and average pore
diameter are summarized in Table 1. As evident, the structure of the final catalyst strongly depends
on the C-supports, which are very different from each other.
The Fe-N/SHAW and Fe-N/MWCNT catalysts have a strong macroporous character, as suggested
by the shapes of their isotherms, belonging to type II – type III of the IUPAC classification [21,22].
At relative pressure values lower than 0.05, the shape of the isotherms suggest the presence of a low
quantity of micropores [21,22]. For Fe-N/SHAW, almost no presence of hysteresis loop is observed.
Otherwise, Fe-N/MWCNT exhibits a hysteresis loop with almost vertical adsorption and desorption
branches, which are nearly parallel over an appreciable range of quantity of gas adsorbed. This
hysteresis loop belongs to the H1-type of the IUPAC classification, which is typical of porous
materials consisting of agglomerates [21], and can be associated with carbon nanotubes aggregated
felt-like morphology [13,23].
The Fe-N/CNS isotherm shape is an intermediate between type II and type III, similarly to Fe-
N/MWCNT, but with a less steep vertical increase at high relative pressures. A well-evident
hysteresis loop is also present.
The Fe-N/MPC1 and Fe-N/MPC2 catalysts show identical isotherm shape, with the latter showing
higher quantities of adsorbed N2, due to its higher surface area. The shape of the isotherms belongs
to type IV, with the presence of type H4 hysteresis loop, which is typical of micro-mesoporous
carbons. However, the hysteresis loop is not very big, indicating the presence of small width
mesopores. In fact, the presence of a big hysteresis loop in type IV isotherms is usually associated
with a pore width exceeding a certain critical width, which is dependent on the adsorption system and
temperature (e.g., for nitrogen adsorption in cylindrical pores at 77 K, hysteresis starts to occur for

261
pores wider than ∼ 4 nm). As evident by the pore size distribution analysis in Figure 1B, the majority
of the pores in the Fe-N/MPC1 and Fe-N/MPC2 catalysts are between 2 and 4 nm).
Figure 1. (A) N2 adsorption – desorption isotherms and (B) BJH desorption pore-size distributions of the different Fe-N/C catalysts.
The results of the pore size distribution (Figure 1B) confirm the previous considerations. In fact, it is
evident that the catalysts prepared using MWCNT and SHAW supports are mainly constituted by
macropores and mesopores with diameter > 20 nm. Fe-N/CNS catalyst exhibits the higher amount of
0.0 0.1 0.2 0.3 0.4 0.5 0.6 0.7 0.8 0.9 1.0
5
10
15
20
25
30
35
40
Qu
an
tity
ad
so
rbed
(m
mo
l g
-1)
Relative pressure
Fe-N/SHAW Fe-N/MWCNT Fe-N/CNS Fe-N/MPC1 Fe-N/MPC2
A
1 10 100
0.0
0.5
1.0
1.5
2.0
2.5
3.0
B
dif
fere
nti
al
po
re v
olu
me (
cm
3 g
-1 n
m-1)
pore diameter (nm)
Fe-N/SHAW Fe-N/MWCNT Fe-N/CNS Fe-N/MPC1 Fe-N/MPC2
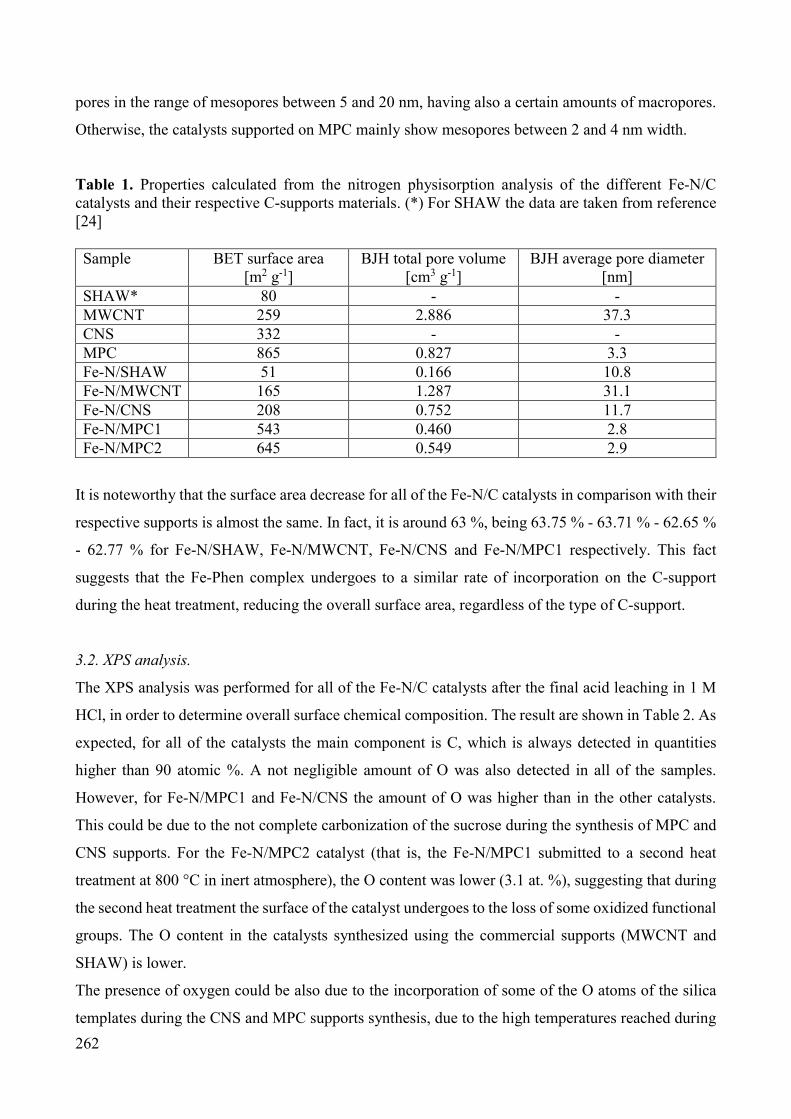
262
pores in the range of mesopores between 5 and 20 nm, having also a certain amounts of macropores.
Otherwise, the catalysts supported on MPC mainly show mesopores between 2 and 4 nm width.
Table 1. Properties calculated from the nitrogen physisorption analysis of the different Fe-N/C catalysts and their respective C-supports materials. (*) For SHAW the data are taken from reference [24] Sample BET surface area
[m2 g-1] BJH total pore volume
[cm3 g-1] BJH average pore diameter
[nm] SHAW* 80 - - MWCNT 259 2.886 37.3 CNS 332 - - MPC 865 0.827 3.3 Fe-N/SHAW 51 0.166 10.8 Fe-N/MWCNT 165 1.287 31.1 Fe-N/CNS 208 0.752 11.7 Fe-N/MPC1 543 0.460 2.8 Fe-N/MPC2 645 0.549 2.9
It is noteworthy that the surface area decrease for all of the Fe-N/C catalysts in comparison with their
respective supports is almost the same. In fact, it is around 63 %, being 63.75 % - 63.71 % - 62.65 %
- 62.77 % for Fe-N/SHAW, Fe-N/MWCNT, Fe-N/CNS and Fe-N/MPC1 respectively. This fact
suggests that the Fe-Phen complex undergoes to a similar rate of incorporation on the C-support
during the heat treatment, reducing the overall surface area, regardless of the type of C-support.
3.2. XPS analysis.
The XPS analysis was performed for all of the Fe-N/C catalysts after the final acid leaching in 1 M
HCl, in order to determine overall surface chemical composition. The result are shown in Table 2. As
expected, for all of the catalysts the main component is C, which is always detected in quantities
higher than 90 atomic %. A not negligible amount of O was also detected in all of the samples.
However, for Fe-N/MPC1 and Fe-N/CNS the amount of O was higher than in the other catalysts.
This could be due to the not complete carbonization of the sucrose during the synthesis of MPC and
CNS supports. For the Fe-N/MPC2 catalyst (that is, the Fe-N/MPC1 submitted to a second heat
treatment at 800 °C in inert atmosphere), the O content was lower (3.1 at. %), suggesting that during
the second heat treatment the surface of the catalyst undergoes to the loss of some oxidized functional
groups. The O content in the catalysts synthesized using the commercial supports (MWCNT and
SHAW) is lower.
The presence of oxygen could be also due to the incorporation of some of the O atoms of the silica
templates during the CNS and MPC supports synthesis, due to the high temperatures reached during

263
the pyrolysis. Another reason could be the presence of some leaching in the sealing system of the
tubular reactor used for the pyrolysis (in both supports and catalysts synthesis), from which
atmospheric air could have entered, causing a partial oxidation of the carbonaceous material.
Table 2. Overall surface elemental composition of the different Fe-N/C catalysts determined by XPS anlaysis. Sample C [at. %] O [at. %] N [at. %] Fe [at. %] Tot [at. %] Fe-N/SHAW 91.9 4.5 3.3 0.3 100 Fe-N/MWCNT 95.3 2.5 2.1 0.1 100 Fe-N/CNS 91.8 5.2 2.8 0.2 100 Fe-N/MPC1 92.6 5.3 1.8 0.3 100 Fe-N/MPC2 95.1 3.1 1.5 0.3 100
A certain amount of N has been incorporated. The catalyst with the lower N content was the Fe-
N/MPC2, which is the only catalyst heat treated twice. The decrease of N content detected by XPS
after the second heat treatment in this types of metal-nitrogen-carbon catalysts was also found in
Chapter 3 and 4. This could be associated with the release of N-containing gases, which in turn
contributes to the increase of the surface area and pore volume after the second pyrolysis Similarly,
also the decrease of the O content, associated with the release of O-containing gas molecules, could
contribute to the surface area increasing after the second pyrolysis.
For the catalysts heat treated once, the N at. % content varies from a minimum of 1.8 % for Fe-
N/MPC1 to a maximum of 3.3 % for Fe-N/SHAW. Therefore, the overall N content is not related to
the ORR electroactivity of the catalysts, as also found in Chapter 2, 3 ,4 and 6, and as reported in the
literature [25].
The high resolution N 1s peaks were analyzed by deconvolution. The four different components
identified were pyridinic-N (N1) pyrrolic-N (N2), graphitic-N (N3) and oxidized-N (N4) [25–28].
The relative and total (referred to the overall nitrogen content of the sample, see Table 2) amounts of
the different nitrogen bond types are shown in Table 3, with their respective binding energy.
In particular, the pyridinic-N type is the most abundant in all of the samples, ranging from 42 to 51
at. %. The pyrrolic-N is detected in percentages between 32 and 39 %, and the graphitic-N in lower
amounts (10 – 17 %). In catalysts Fe-N/CNS and Fe-N/MPC1, a certain amount of oxidized-type N
is also detected. This is in accordance to the fact that these two catalysts were also the ones where the
higher amounts of O were detected. Therefore, part of the O in these catalysts should be bounded
directly with N.

264
Table 3. Relative and total contents of the different N types with their respective peak binding energies resulting from the deconvolution of the high-resolution N 1s peak from XPS analysis (N1: pyridinic-N; N2: pyrrolic-N; N3: graphitic-N; N4: oxidized-N).
Binding energy [eV] Relative content [atomic %]
Total content [atomic %]
Sample N1 N2 N3 N4
Fe-N/SHAW 398.8
49 1.62
400.5 37
1.22
402.1 14
0.46
- - -
Fe-N/MWCNT 398.9
51 1.07
400.6 39
0.82
402.3 10
0.21
- - -
Fe-N/CNS 398.8
42 1.18
400.5 32
0.90
402.3 12
0.34
407.5 14
0.39
Fe-N/MPC1 398.8
44 0.79
400.5 34
0.61
402.3 10
0.18
407.7 12
0.22
Fe-N/MPC2 398.7
45 0.68
400.7 38
0.57
402.5 17
0.25
- - -
Trying to put in relation the different relative and total % of the different N-types with the ORR
activity of the different catalysts, it is not possible to find out any direct relation. However, in many
studies, the electrocatalytic activity towards ORR was attributed to pyridinic-N and pyrrolic-N
[4,13,29,30]. Despite the real structure of the ORR active sites is still not clear and therefore under
debate [31], many authors agree in the conclusions that the N atoms which are part of the active sites
are located in the micropores [22]. Therefore, this explain the lack of existence of any direct
correlation between the total or relative amount of the different N-types and the ORR activity for
these catalysts. On the contrary, the electroactivity seems to be related with the surface area and the
pore size distribution of the catalysts.

265
Figure 2. High resolution N 1s XPS spectra of the catalysts Fe-N/SHAW (A), Fe-N/MWCNT (B), Fe-N/CNS (C), Fe-N/MPC1 (D) and Fe-N/MPC2 (E) with the peak deconvolution analysis in the different N-bonding types. The black line is the overall N 1s peak. Red, blue, green and pink lines correspond to the deconvolution into pyridinic-N (N1), pyrrolic-N (N2), graphitic-N (N3) and oxidized-N (N4) peaks, respectively. 3.3. ORR electroactivity test in RDE.
The ORR activity of the five electrocatalysts was tested in both acidic and alkaline media by a RDE
equipment, recording staircase voltammetries. The results are shown in Figure 3 A-B. The
406 404 402 400 398 396 394
A
N1
N1
cou
nts
per
seco
nd
(au)
BE (eV)
N1
406 404 402 400 398 396 394
B
N3
N2
cou
nts
per
sec
ond
(au
)
BE (eV)
N1
410 405 400 395
N4 N3
N2
N1
cou
nts
per
sec
ond
(au
)
BE (eV)
C
410 405 400 395
D
N4 N3
N2
cou
nts
per
sec
on
d (
au)
BE (eV)
N1
408 406 404 402 400 398 396 394
N3
N2
E
coun
ts p
er s
econ
d (a
u)
BE (eV)
N1

266
performances of the different catalysts towards the ORR are summarized in Table 4 in terms of onset
(Eon) and half-wave (E1/2) potentials. Eon is defined as the potential required to generate a current
density of 0.1 mAcm-2 in a steady-state RDE experiment [33] and E1/2 is the potential required to get
half the maximum current density in the polarization curve.
Figure 3. Staircase voltammetries (10 mV potential step, 10 s holding time) of the different Fe-N/C catalysts recorded in RDE at 900 rpm rotation speed in O2-saturated electrolyte: (A) 0.5 M H2SO4 and (B) 0.1 M KOH. In acidic medium, the activities of the catalysts pyrolyzed once are considerably different from one
another. The most active is Fe-N/MPC1. It shows 100 mV higher Eon and 190 mV higher E1/2 in
0.0 0.1 0.2 0.3 0.4 0.5 0.6 0.7 0.8 0.9 1.0 1.1 1.2-4.0
-3.5
-3.0
-2.5
-2.0
-1.5
-1.0
-0.5
0.0
i (m
A c
m-2)
E vs RHE (V)
Fe-N/SHAW Fe-N/MWCNT Fe-N/C Fe-N/MPC1 Fe-N/MPC2
A
0.0 0.1 0.2 0.3 0.4 0.5 0.6 0.7 0.8 0.9 1.0 1.1 1.2
-5.0
-4.5
-4.0
-3.5
-3.0
-2.5
-2.0
-1.5
-1.0
-0.5
0.0B
i (m
A c
m-2)
E vs RHE (V)
Fe-N/SHAW Fe-N/MWCNT Fe-N/C Fe-N/MPC1 Fe-N/MPC2

267
comparison with the less active catalyst, that is Fe-N/SHAW. Considering that all of the catalysts
were synthesized exactly in the same way, it is evident how the C-support plays a crucial role in the
final ORR electroactivity. The use of a micro-mesoporous C-support, with a high specific surface
area, seems to be useful to allow the formation of a higher number of active sites and to favor their
accessibility to the reactants.
Concerning the effect of the second pyrolysis, comparing Fe-N/MPC1 and Fe-N/MPC2, a slight
increase of 10 mV in Eon and of 20 mV in E1/2 was obtained. Probably mainly due to the increase of
the catalysts surface area.
Table 4. Onset potentials (Eon) and Half-wave potentials (E1/2) of the Fe-N/C catalysts in acid and alkaline conditions. 0.5 M H2SO4 0.1 M KOH Sample Eon [V vs RHE] E1/2 [V vs RHE] Eon [V vs RHE] E1/2 [V vs RHE]
Fe-N/SHAW 0.71 0.49 0.92 0.81 Fe-N/MWCNT 0.74 0.53 0.97 0.84 Fe-N/CNS 0.77 0.60 0.96 0.85 Fe-N/MPC1 0.81 0.68 0.98 0.86 Fe-N/MPC2 0.82 0.70 1.00 0.88
The catalysts exhibit a much higher ORR activity in alkaline conditions than in acid conditions. In
particular the onset potentials are almost 200 mV higher. This is typical for this type of transition
metal-N-C cataysts.
In alkaline conditions, the differences in the catalysts electroactivities are less evident. Fe-N-
/MWCNT, Fe-N/CNS and Fe-N/MPC1 exhibit practically the same activity, being their Eon and E1/2
only 10 mV different from each other. Fe-N/MWCNT catalyst shows a higher diffusion-limited
current density. This could be due to the higher macroporous character of this catalysts. Its average
pore diameter in fact is considerably higher than for the other catalysts, and this could favor the mass
transport, allowing to get higher current density values in the mass-transport limited zone of the
polarization curve. Another reason could be the fact that the Fe-N/MWCNT catalyst deposition on
the RDE surface was less homogeneous, resulting in the formation of some agglomerates. This could
locally enhance the turbulence in proximity of the RDE surface, increasing the mass transport of the
O2 and resulting in a higher limiting current value [34].
Fe-N/SHAW is the catalyst which shows the lower activity also in alkaline conditions.
The effect of the second pyrolysis on the ORR activity in alkaline conditions is similar than in acidic
condition, that is, a slight increase of 20 mV in Eon and E1/2 was obtained.
268
The less evident differences between the activities of the different catalysts in alkaline conditions are
probably partially due to the intrinsic ORR catalytic activity of the carbonaceous and nitrogen-doped
cabonaceous materials, which promotes the 2 e- reduction of O2 to HO2- in alkaline medium [35].
As described in Chapter 6, another reason could be ascribed to the fact that ORR partially occurs by
the “outer-sphere” mechanism, which is promoted by the presence of the carbon support in alkaline
conditions (i.e. by mediation by the quinone/hydroquinone surface functional groups).
These effects “mitigate” the differences between the activities of the different catalysts, which are
more evident in acid medium.
However, to better complete these considerations, performing both a RRDE test and a H2O2 reduction
test for the different catalysts in both acid and alkaline conditions is necessary.
The performances of the best catalysts (Fe-N/MPC1 and Fe-N/MPC2) are equal to the ones of a Pt/C
commercial catalyst (see Table 8 in Chapter 6), making their use in the cathode catalytic layer of an
AEMFC very interesting.
3.4. Fuel cell tests.
To better put in evidence the differences between the different C-supports on the characteristics of
the final catalyst form a more applicative point of view, the performance of the different Fe-N/C
catalysts were evaluated in different types of fuel cells. In acidic conditions, that is in a fuel cell
equipped with a proton conducing membrane, we performed the test using both hydrogen and
methanol as fuels. In alkaline conditions, that is, in a fuel cell equipped with an OH- conducing
membrane, ethanol was used as a fuel.
3.4.1. Acid DMFC test.
The performance of Fe-N/MWCNT, Fe-N/MPC1 and Fe-N/MPC2 were tested in a DMFC. The
cathodes were prepared with a catalyst loading of 2.5 mg cm-2 and a Nafion content of 50 wt. %. The
cell temperature was set to 90°C. The anode of the cell was fed with a 2 M methanol solution with a
flow rate of 1 mL min-1 and a backpressure of 0.33 bar. The cathodic compartment was fed with a
200 NmL min-1 pure O2 flow preheated at 80 °C with no humidification and a backpressure of 3 bar.
The polarization curves and power density curves are shown in Figure 4, in comparison with the
curves obtained for a DMFC prepared with a commercial Pt/C catalyst at the cathode (the same shown
in Chapter 6). The main performance parameters are summarized in Table 5.
The most performing results in terms of power density were obtained with the Pt/C catalyst.
Regarding our catalysts, unlike expected, the Fe-N/MPC1 catalyst was more performing than Fe-
N/MPC2, which exhibited better performances in RDE. Considering the Eoc, the values of our
catalysts were almost the same of the Pt/C. However, in RDE the Eon for ORR of Pt/C catalyst was
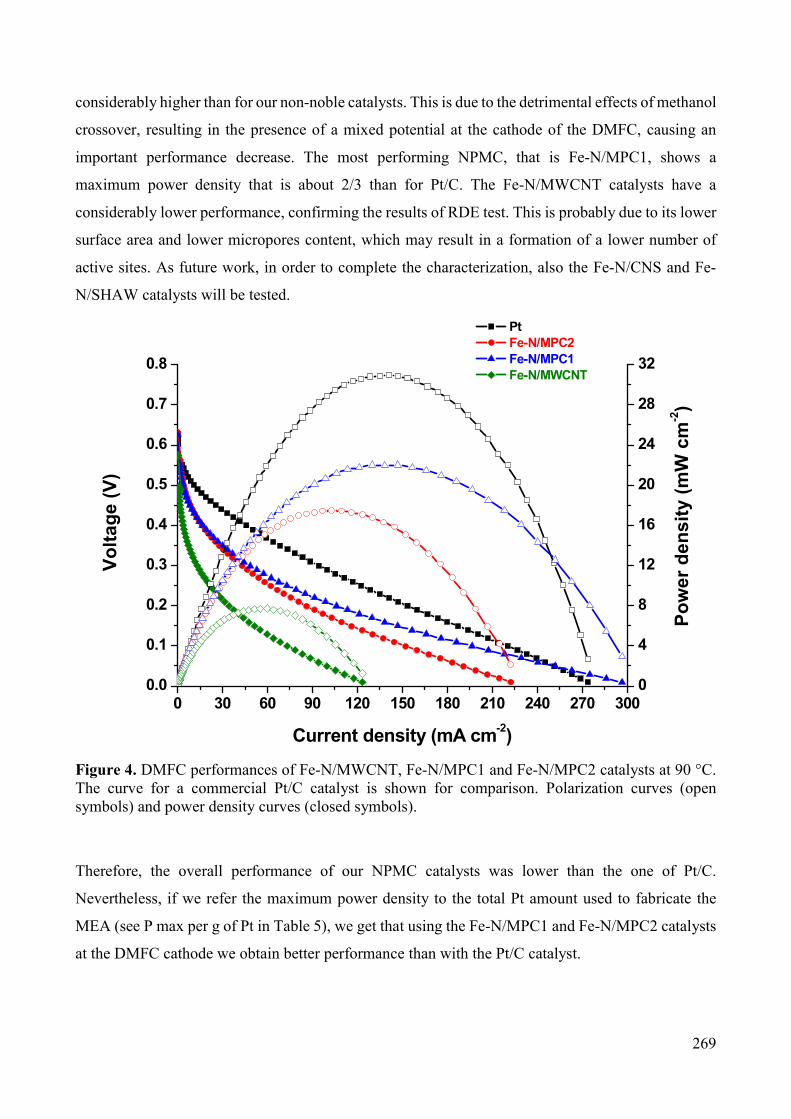
269
considerably higher than for our non-noble catalysts. This is due to the detrimental effects of methanol
crossover, resulting in the presence of a mixed potential at the cathode of the DMFC, causing an
important performance decrease. The most performing NPMC, that is Fe-N/MPC1, shows a
maximum power density that is about 2/3 than for Pt/C. The Fe-N/MWCNT catalysts have a
considerably lower performance, confirming the results of RDE test. This is probably due to its lower
surface area and lower micropores content, which may result in a formation of a lower number of
active sites. As future work, in order to complete the characterization, also the Fe-N/CNS and Fe-
N/SHAW catalysts will be tested.
Figure 4. DMFC performances of Fe-N/MWCNT, Fe-N/MPC1 and Fe-N/MPC2 catalysts at 90 °C. The curve for a commercial Pt/C catalyst is shown for comparison. Polarization curves (open symbols) and power density curves (closed symbols).
Therefore, the overall performance of our NPMC catalysts was lower than the one of Pt/C.
Nevertheless, if we refer the maximum power density to the total Pt amount used to fabricate the
MEA (see P max per g of Pt in Table 5), we get that using the Fe-N/MPC1 and Fe-N/MPC2 catalysts
at the DMFC cathode we obtain better performance than with the Pt/C catalyst.
0 30 60 90 120 150 180 210 240 270 3000.0
0.1
0.2
0.3
0.4
0.5
0.6
0.7
0.8
Po
we
r d
en
sit
y (
mW
cm
-2)
Vo
lta
ge
(V
)
Current density (mA cm-2)
Pt Fe-N/MPC2
Fe-N/MPC1 Fe-N/MWCNT
0
4
8
12
16
20
24
28
32

270
Table 5. Performance parameters for DMFC tests in Figure 4 (for FE-N-MWCNT, Fe-N/MPC1, Fe-N/MPC2 and Pt/C) and for DMFC short-term durability test in Figure 5 (for Fe-N/MPC2 and Pt/C). Cathode catalyst
MeOH flow
[mL min-1]
time [h]
E oc [V]
i max [mA cm-2]
P max [mW cm-2]
P max per g of Pt
[W gPt-1]
P max decrease
[%]
Fe-N/MWCNT 1 0 0.57 123 7.7 7.7 - Fe-N/MPC1 1 0 0.63 297 22.0 22.0 - Fe-N/MPC2 1 0 0.63 222 17.5 17.5 - Fe-N/MPC2 5 0 0.61 196 15.2 15.2 13.2
Fe-N/MPC2 5 3 0.56 139 8.9 8.9 49.2 Pt/C 1 0 0.62 274 30.9 15.5 - Pt/C 5 0 0.52 163 18.7 9.4 39.5 Pt/C 5 2 0.42 54 4.5 2.3 85.5
A short-term durability test was performed on the DMFC containing the MEA prepared with Fe-
N/MPC2 catalyst on the cathode. The durability test was performed for this catalyst because it was
the one that showed better ORR activity in RDE. The same test for Fe-N/MPC1 catalyst, which has
a better performance in DMFC has not been performed yet at the moment of the writing of this
chapter, but it is going to be performed.
The short-term durability test was the same described in Chapter 6. Figure 5 shows the polarization
and power density curves of the Fe-N/MPC2 catalyst at the beginning of the test (t = 0) with a
methanol flow rate of 1 and 5 mL min-1, and at the end of the test (t = 3h) with a flow rate of 5 mL
min-1. The polarization and power density curves obtained for a Pt/C catalyst (in this case the test
duration was 2 hours) are also shown for comparison. The performance parameters are also
summarized in Table 5.

271
Figure 5. Comparison between the performances at 90 °C of the DMFC prepared with Fe-N/MPC2 and with commercial Pt/C as cathode catalysts at the beginning and at the end of the durability test (potential kept constant at 0.4 V for 3 h) with 5 mL min-1 methanol flow. The polarization curves with 1 mL min-1 methanol flow are also shown for comparison.
For the Pt/C catalyst, the cell performance suffers a remarkable decrease simply by increasing the
flow rate. The Eoc immediately decreased by 90 mV and the maximum power density by 39.5 % from
its initial value. Then, after 2 hours test, the maximum power density decreased by 85.5 % and the
Eoc further decreased of 100 mV.
The use of a higher flow rate, should lead to an increase of the kinetics due to a higher flux of reactants
to the anodic compartment [36]. However, at the same time, this also causes an increase of the water
and methanol diffusion through the membrane, enhancing the methanol crossover detrimental effects
on Pt/C cathodic catalyst.
For Fe-N/MPC2 catalyst, this negative effect of the methanol flow rate increase are much less evident.
In fact, the Eoc only suffered a 20 mV decrease and the maximum power density only decreased by
13.2 % in comparison with the test at 1 mL min-1. After 3 h test, the cell performance only decreased
by 49.2 %, being the maximum power density the double than the one of the Pt/C catalyst after only
2 hours of test. If we refer the maximum power density to the total amount of Pt in the MEA, the
0 20 40 60 80 100 120 140 160 180 200 220 240 260 2800.0
0.1
0.2
0.3
0.4
0.5
0.6
0.7
0.8
Po
wer
den
sit
y (
mW
cm
-2)
Vo
ltag
e (
V)
Current density (mA cm-2)
Pt; 1mL min-1; t=0
Pt; 5mL min-1; t=0
Pt; 5mL min-1; t=2h
Fe-N/MPC2; 1mL min-1; t=0
Fe-N/MPC2; 5mL min-1; t=0
Fe-N/MPC2; 5mL min-1; t=3h
0
5
10
15
20
25
30
35

272
performance of the Fe-N/MPC2 catalyst after 3 hours test is almost 4 times higher than that of Pt/C
after 2 hours test (8.9 against 2.3 W gPt-1). These results put in evidence the advantage of using this
type of non-Pt based electrocatalysts for ORR in DMFC. In addition to their lower cost, they show a
considerably higher stability and tolerance to the methanol crossover. Therefore, they can represent
a good alternative to Pt-based catalysts, which, due to their low methanol tolerance, have been until
now one of the biggest impediments to the wide commercialization of DMFC powered decvices
[37,38]. However, their electroactivity and mass transport properties (such as flooding resistance)
have to be furtherly improved.
3.4.2. Acid H2 / O2 PEMFC test.
The performances of Fe-N/MPC2 and Fe-N/MWCNT catalysts were tested in a PEMFC fed with
pure H2 and O2 at anode and cathode, respectively, both with a backpressure of 3 bar(g) and preheated
at 80 °C. H2 flow was fed with 100% relative humidity, while O2 was fed without humidification.
The temperature of the cell was kept at 60 °C during the experiments. The polarization and power
density curves results are shown in Figure 6, together with the results obtained in the same conditions
but with a commercial Pt/C catalyst at the cathode.
The maximum power density for Fe-N/MPC2 was 145 mW cm-2, which is about 43 % of the
maximum power density obtained with the Pt/C catalyst (335 mW cm-2). With Fe-N/MWCNT the
cell performance is considerably lower, being almost ½ than for Fe-N/MPC2, in spite of showing
practically the same Eoc. This trend of results is very close to what obtained in the DMFC tests.

273
Figure 6. Polarization (filled symbols) and power density curves (open symbols) of PEMFC prepared using commercial Pt/C (0.6 mgPt cm-2), Fe-N/MPC2 (2.5 mg cm-2) and Fe-N/MWCNT (2.5 mg cm-
2) as cathode catalysts. Cell temperature 60 °C. The anode catalyst was a commercial Pt/C. Pt loadings on anode was 0.3 mg cm−2.
As shown in Table 6, if we refer the maximum power density to the total mass of Pt used for the MEA
fabrication, with Fe-N/MPC2 catalyst at the cathode we obtain 483.3 W gPt-1 (considering the 0.3
mgPt cm-2 used at the anode). For the MEA fabricated with Pt/C at the cathode, we obtain a lower
value of 371.8 W gPt-1 (considering the 0.3 mgPt cm-2 used at the anode and the 0.6 mgPt cm-2 used at
the cathode). Concerning the open circuit potential, for Pt/C catalyst it is around 0.96 V, while for
our catalysts its value is about 230 mV lower. This is the main cause of the lower fuel cell performance
of our catalysts in comparison to Pt, being the kinetics of oxygen electroreduction on Pt in acidic
conditions much faster, as also found in the RDE experiments.
Table 6. Performance parameters for PEMFC tests in Figure 6.
Cathode catalyst E oc [V] i max [mA cm-2]
P max [mW cm-2]
P max per g of Pt [W gPt
-1]
Fe-N/MWCNT 0.72 669 76.8 256.0 Fe-N/MPC2 0.73 1120 145.0 483.3 Pt/C 0.96 1307 334.6 371.8
0 200 400 600 800 1000 1200 14000.0
0.1
0.2
0.3
0.4
0.5
0.6
0.7
0.8
0.9
1.0
Po
we
r d
en
sit
y (
mW
cm
-2)
Vo
lta
ge
(V
)
Current density (mA cm-2)
Pt Fe-N/MPC2
Fe-N/MWCNT
0
50
100
150
200
250
300
350

274
The H2 / O2 PEMFC test needs to be completed with the test of the other three catalysts of the series,
(Fe-N/MPC1, Fe-N/CNS and Fe-N/SHAW) in order to better understand the influence of the catalyst
structure, which for these catalysts is mainly provided by the C-support, on their performance in
PEMFC.
3.4.3. Alkaline DEFC test.
The performance of Fe-N/MPC2 as ORR catalyst were also tested in an alkaline DEFC fed with a 2
M methanol – 2 M KOH solution preheated at 80 °C with a flow rate of 1 mL min-1 and a backpressure
of 0.33 bar. KOH was added to the ethanol solution to provide an excess of OH- ions in contact with
the membrane. This helps to enhance both the membrane conductivity and the reaction kinetics [39].
At the DEFC cathode, a flux of 200 NmL min-1 of pure O2 was fed with 3 bar backpressure. The
temperature of the cell was kept constant at 90 °C during the experiments.
The Fe-N/MPC2 cathode was prepared with a 2.5 mg cm-2 catalyst loading, and a Nafion content on
the dry electrode of 50 wt. %. The polarization and power density curves resulting from this test,
together with the results of the same test on a DEFC with a Pt/C commercial catalyst at the cathode,
are shown in Figure 7.
The performance of the alkaline DEFC prepared with the Fe-N/MPC2 cathode is better than the one
of the Pt/C cathode in the low current density region, until about 200 mA cm-2. The Eoc is also better,
being 30 mV higher.
On the contrary, for current densities higher than 200 mA cm-2, the cell performances decreased very
rapidly. Immediately after the attainment of the maximum power density, the polarization curve
steeply decreases. This behavior suggest that the electrode was highly affected by mass transport
problems [40]. These mass transport limitations could be ascribed to the diffusion of the oxygen into
the cathode catalyst layer, which could be hindered by the high ionomer content and by the
microporous structure of the catalyst.

275
Figure 7. Comparison between the polarization (filled symbols) and power density (open symbols) curves obtained for alkaline DEFCs prepared using Fe-N/MPC2 and a commercial Pt/C as cathode catalyst.
These results, in terms of power density and polarization curve shape are similar to the state-of-the-
art that can be found in the literature for alkaline membrane DEFC with the use of NPMC at the
cathode [41,42].
To complete the tests, and therefore fully understand the influence of the C-support in the real
performance of this series of catalysts in alkaline DEFC, the other 4 catalysts of the series have to be
tested.
Also in this case, as previously found for H2 / O2 PEMFC and DEFC tests in acidic conditions,
referring the maximum power density to the to the total mass of Pt used for the MEA fabrication, the
performance of Fe-N/MPC2 catalyst are better than the performance of the Pt/C catalyst. With Fe-
N/MPC2 catalyst at the cathode we obtain 56.2 W gPt-1 (considering the 1.33 mgPt cm-2 used at the
anode). For the MEA fabricated with the commercial Pt/C catalyst at the cathode, we obtain 38.2 W
gPt-1 (considering 1.33 mgPt cm-2 at the anode and 1 mgPt cm-2 at the cathode).
0 50 100 150 200 250 300 3500.0
0.1
0.2
0.3
0.4
0.5
0.6
0.7
0.8
0.9
1.0
Po
wer
den
sit
y (
mW
cm
-2)
Vo
ltag
e (
V)
Current density (mA cm-2)
Pt Fe-N/MPC2
0
10
20
30
40
50
60
70
80
90
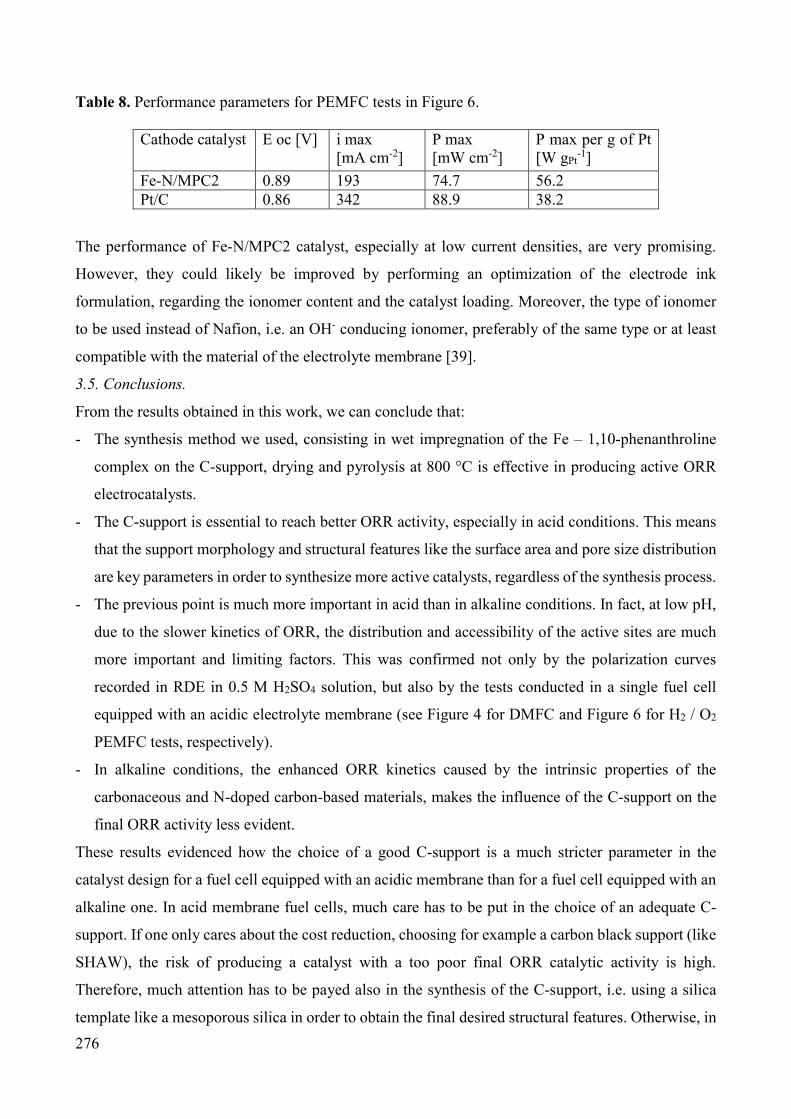
276
Table 8. Performance parameters for PEMFC tests in Figure 6.
Cathode catalyst E oc [V] i max [mA cm-2]
P max [mW cm-2]
P max per g of Pt [W gPt
-1]
Fe-N/MPC2 0.89 193 74.7 56.2 Pt/C 0.86 342 88.9 38.2
The performance of Fe-N/MPC2 catalyst, especially at low current densities, are very promising.
However, they could likely be improved by performing an optimization of the electrode ink
formulation, regarding the ionomer content and the catalyst loading. Moreover, the type of ionomer
to be used instead of Nafion, i.e. an OH- conducing ionomer, preferably of the same type or at least
compatible with the material of the electrolyte membrane [39].
3.5. Conclusions.
From the results obtained in this work, we can conclude that:
- The synthesis method we used, consisting in wet impregnation of the Fe – 1,10-phenanthroline
complex on the C-support, drying and pyrolysis at 800 °C is effective in producing active ORR
electrocatalysts.
- The C-support is essential to reach better ORR activity, especially in acid conditions. This means
that the support morphology and structural features like the surface area and pore size distribution
are key parameters in order to synthesize more active catalysts, regardless of the synthesis process.
- The previous point is much more important in acid than in alkaline conditions. In fact, at low pH,
due to the slower kinetics of ORR, the distribution and accessibility of the active sites are much
more important and limiting factors. This was confirmed not only by the polarization curves
recorded in RDE in 0.5 M H2SO4 solution, but also by the tests conducted in a single fuel cell
equipped with an acidic electrolyte membrane (see Figure 4 for DMFC and Figure 6 for H2 / O2
PEMFC tests, respectively).
- In alkaline conditions, the enhanced ORR kinetics caused by the intrinsic properties of the
carbonaceous and N-doped carbon-based materials, makes the influence of the C-support on the
final ORR activity less evident.
These results evidenced how the choice of a good C-support is a much stricter parameter in the
catalyst design for a fuel cell equipped with an acidic membrane than for a fuel cell equipped with an
alkaline one. In acid membrane fuel cells, much care has to be put in the choice of an adequate C-
support. If one only cares about the cost reduction, choosing for example a carbon black support (like
SHAW), the risk of producing a catalyst with a too poor final ORR catalytic activity is high.
Therefore, much attention has to be payed also in the synthesis of the C-support, i.e. using a silica
template like a mesoporous silica in order to obtain the final desired structural features. Otherwise, in

277
alkaline fuel cells, since the difference in ORR electroactivity induced by the C-support is lower, a
good choice could be using a support that assure a good activity, but at the same time does not cost
too much. In this case for example the MWCNT. This fact put in evidence once more the great
potentialities in the use of alkaline fuel cells, especially in terms of the reduction of the costs due to
the catalytic materials.
References.
[1] J. Burgess, R.I. Haines. Solubilities of 1,10-Phenanthroline and Substituted Derivatives in Water
and in Aqueous Methanol. J. Chemical Engineering Data 23 (1978) 196–197.
[2] J. Tian, A. Morozan, M.T. Sougrati, M. Lefèvre, R. Chenitz, J.-P. Dodelet, D. Jones, F. Jaouen.
Optimized Synthesis of Fe/N/C Cathode Catalysts for PEM Fuel Cells: A Matter of Iron–Ligand
Coordination Strength. Angewandte Chemie 52 (2013) 6867–6870.
[3] M. Bron, J. Radnik, M. Fieber-Erdmann, P. Bogdanoff, S. Fiechter. EXAFS, XPS and
electrochemical studies on oxygen reduction catalysts obtained by heat treatment of iron
phenanthroline complexes supported on high surface area carbon black. J. Electroanal. Chem. 535
(2002) 113–119.
[4] M. Lefèvre, E. Proietti, F. Jaouen, J-P. Dodelet. Iron-based catalysts with improved oxygen
reduction activity in polymer electrolyte fuel cells. Science 324 (2009) 71–74.
[5] C.-W. Tsai, M.-H. Tu, C.-J. Chen, T.-F. Hung, et al. Nitrogen-doped graphene nanosheet-
supported non-precious iron nitride nanoparticles as an efficient electrocatalyst for oxygen reduction.
RSC Advances 1 (2011) 1349–1357.
[6] K. Strickland, E. Miner, Q. Jia, U. Tylus, N. Ramaswamy, W. Liang, M.-T. Sougrati, F. Jaouen,
S. Mukerjee. Highly active oxygen reduction non-platinum group metal electrocatalyst without direct
metal–nitrogen coordination. Nature Comm. 6 (2015) 7343.
[7] U.I. Kramm, M. Lefèvre, N. Larouche, D. Schmeisser, J.-P. Dodelet. Correlations between mass
activity and physicochemical properties of Fe/N/C catalysts for the ORR in PEM fuel cell via 57Fe
Mössbauer spectroscopy and other techniques. J. Am. Chem. Soc. 136 (2013) 978–985.
[8] D. Zhao, J.-L. Shui, L.R. Grabstanowicz, C. Chen, S.M. Commet, T. Xu, J. Lu, D.-J. Liu. Highly
efficient non-precious metal electrocatalyst prepared from one-pot synthesized zeolitic imidazolate.
Adv. Mater. 26 (2014) 1093–1097.
[9] V. Armel, J. Hannauer, F. Jaouen. Effect of ZIF-8 Crystal Size on the O2 Electro-Reduction
Performance of Pyrolyzed Fe–N–C Catalysts. Catalysts 5 (2015) 1333–1351.

278
[10] F. Jaouen, F. Charreteur, J.P. Dodelet. Fe-Based Catalysts for Oxygen Reduction in PEMFCs
Importance of the Disordered Phase of the Carbon Support. J. Electrochem. Soc. 153 (2006) A689-
A698.
[11] A.H. A. Monteverde Videla, L. Zhang, J. Kim, J. Zeng, C. Francia, J. Zhang, S. Specchia.
Mesoporous carbons supported non-noble metal Fe–NX electrocatalysts for PEM fuel cell oxygen
reduction reaction. J. Appl. Electrochem. 43 (2013) 159–169.
[12] A. Santasalo-Aarnio, M. Borghei, I.V. Anoshkin, A.G. Nasibulin, E.I. Kauppinen, V. Ruiz, T.
Kallio. Durability of different carbon nanomaterial supports with PtRu catalyst in a direct methanol
fuel cell. Int. J. Hydrogen Energy 37 (2012) 3415–3424.
[13] L. Osmieri, A.H.A. Monteverde Videla, S. Specchia. Activity of Co-N multi walled carbon
nanotubes electrocatalysts for oxygen reduction reaction in acid conditions. J. Power Sources 278
(2015) 296–307.
[14] M. Ferrandon, A.J. Kropf, D.J. Myers, U. Kramm, P. Bogdanoff, G. Wu, C.M. Johnston, P.
Zelenay. Multitechnique Characterization of a Polyaniline−Iron−Carbon Oxygen Reduction Catalyst.
J. Phys. Chem. C 2012, 116, 16001−16013.
[15] F. Jaouen, V. Goellner, M. Lefèvre, J. Herranz, E. Proietti, J.P. Dodelet. Oxygen reduction
activities compared in rotating-disk electrode and proton exchange membrane fuel cells for highly
active Fe N C catalysts. Electrochimica Acta 87 (2013) 619– 628
[16] J. Zeng, C. Francia, M.A. Dumitrescu, A.H.A. Monteverde Videla, V.S. Ijeri, S. Specchia, P.
Spinelli. Electrochemical performance of Pt-based catalysts supported on different ordered
mesoporous carbons (Pt/OMCs) for oxygen reduction reaction. Ind. Eng. Chem. Res. 51 (2012)
7500–7509.
[17] F.J. Perez-Alonso, M. Abdel Salam, T. Herranz, J.L. Gomez de la Fuente, S.A. Al-Thabaiti, S.N.
Basahel, M.A. Peña, J.L.G. Fierro, S. Rojas. Effect of carbon nanotube diameter for the synthesis of
Fe/N/multiwall carbon nanotubes and repercussions for the oxygen reduction reaction. J. Power
Sources 240 (2013) 494–502.
[18] A.H.A. Monteverde Videla, S. Ban, S. Specchia, L. Zhang, J. Zhang. Non-noble Fe–NX
electrocatalysts supported on the reduced graphene oxide for oxygen reduction reaction. Carbon 76
(2014) 386–400.
[19] M. Montiel, S. García-Rodríguez, P. Hernández-Fernández, R. Díaz, S. Rojas, J.L. Ga Fierro, E.
Fatás, P. Ocón. Relevance of the synthesis route of Se-modified Ru/C as methanol tolerant
electrocatalysts for the oxygen reduction reaction. J. Power Sources 195 (2010) 2478–2487.

279
[20] R. Escudero-Cid, P. Hernández-Fernández, J.C. Pérez-Flores, S. Rojas, S. Garcia-Rodríguez, E.
Fatás, P. Ocón. Analysis of performance losses of direct methanol fuel cell with methanol tolerant
PtCoRu/C cathode electrode. Int. J. Hydrogen Energy 37 (2012) 7119–7130.
[21] K.S.W. Sing, D.H. Everett; R.A.W. Haul; L. Moscou; R.A. Pierotti; J. Roquerol; T.
Siemieniewska. Reporting Physisorption Data for Gas/Solid Systems with Special Reference to the
Determination of Surface Area and Porosity (Recommendations 1984). Pure Appl. Chem. 57 (1985)
603–619.
[22] M. Thommes, K. Kaneko, A.V. Neimark, J.P. Olivier, F. Rodriguez-Reinoso, J. Rouquerol
K.S.W. Sing. Physisorption of gases, with special reference to the evaluation of surface area and pore
size distribution (IUPAC Technical Report). Pure Appl. Chem. 2015. DOI 10.1515/pac-2014-1117.
[23] Z. Li, Z. Pan, S. Dai. Nitrogen adsorption characterization of aligned multiwalled carbon
nanotubes and their acid modification. J. Colloid Interf. Sci. 277 (2004) 35–42.
[24] C-C. Yang, C-T. Lin. Preparation and Characterization of the PVA/TiO2 Composite Polymer
Membrane and its Application on Alkaline DMFC. ECS Transactions 13 (2008) 21–40.
[25] F. Jaouen, J. Herranz, M. Lefèvre, J-P. Dodelet, U.I. Kramm, I. Herrmann, P. Bogdanoff, J.
Maruyama, T. Nagaoka, A. Garsuch, J.R. Dahn, T. Olson, S. Pylypenko, P. Atanassov, E.A. Ustinov.
Cross-Laboratory Experimental Study of Non-Noble-Metal Electrocatalysts for the Oxygen
Reduction Reaction. ACS Appl. Mater. Interfaces 1 (2009) 1623–1639.
[26] A. Serov, K. Artyushkova, N.I. Andersen, S. Stariha, P. Atanassov. Original Mechanochemical
Synthesis of Non-Platinum Group Metals Oxygen Reduction Reaction Catalysts Assisted by
Sacrificial Support Method. Electrochimica Acta 179 (2015) 154–160.
[27] M.H. Robson, A. Serov, K. Artyushkova, P. Atanassov. A mechanistic study of 4-
aminoantipyrine and iron derived non-platinum group metal catalyst on the oxygen reduction
reaction. Electrochimica Acta 90 (2013) 656– 665.
[28] K. Artyushkova, S. Pylypenko, T.S. Olson, J.E. Fulghum, P. Atanassov. Predictive Modeling of
Electrocatalyst Structure Based on Structure-to-Property Correlations of X-ray Photoelectron
Spectroscopic and Electrochemical Measurements. Langmuir 24 (2008) 9082–9088.
[29] P.H. Matter, L. Zhang, U.S. Ozkan. The role of nanostructure in nitrogen-containing carbon
catalysts for the oxygen reduction reaction. Journal of Catalysis 239 (2006) 83–96.
[30] A.H. A. Monteverde Videla, L. Zhang, J. Kim, J. Zeng, C. Francia, J. Zhang, S. Specchia.
Mesoporous carbons supported non-noble metal Fe–NX electrocatalysts for PEM fuel cell oxygen
reduction reaction. J. Appl. Electrochem. 43 (2013) 159–169.

280
[31] J.-P. Dodelet, The controversial role of the metal in Fe- or Co-based electrocatalysts for the
oxygen reduction reaction in acid medium, in: M. Shao (Ed.), Electrocatalysis in Fuel Cells, Vol. 9,
Springer, London, 2013, pp. 271 Ch.10.
[32] F. Jaouen, M. Lefèvre, J.-P. Dodelet, M. Cai. Heat-Treated Fe/N/C Catalysts for O2
Electroreduction: Are Active Sites Hosted in Micropores? J. Phys. Chem. B 110 (2006) 5553–5558.
[33] G. Wu, K.L. More, C.M. Johnston, P. Zelenay. High-Performance Electrocatalysts for Oxygen
Reduction Derived from Polyaniline, Iron, and Cobalt. Science 2011, 332, 443–447.
[34] J. Masa, C. Batchelor-McAuley, W. Schuhmann, R.G. Compton. Koutecky-Levich analysis
applied to nanoparticle modified rotating disk electrodes: Electrocatalysis or misinterpretation. Nano
Research 7 (2014) 71–78.
[35] Kinoshita K, Carbon – Electrochemical and Physicochemical Properties, Wiley Interscience,
1988.
[36] R. Escudero-Cid, M. Montiel, L. Sotomayor, B. Loureiro, E. Fatás, P. Ocón. Evaluation of
polyaniline-Nafion® composite membranes for direct methanol fuel cells durability tests. Int. J.
Hydrogen Energy 40 (2015) 8182–8192.
[37] X. Xu, Y. Zhou, J. Lu, X. Tian, H. Zhu, J. Liu. Single-step synthesis of PtRu/N-doped graphene
for methanol electrocatalytic oxidation. Electrochim. Acta 120 (2014) 439–451.
[38] H. Liu, C. Song, L. Zhang, J. Zhang, H. Wang, D.P. Wilkinson. A review of anode catalysis in
the direct methanol fuel cell. J. Power Sources 155 (2006) 95–110.
[39] Y.S. Li, T.S. Zhao, Z.X. Liang. Effect of polymer binders in anode catalyst layer on performance
of alkaline direct ethanol fuel cells. J. Power Sources 190 (2009) 223–229.
[40] H. Li, J. Y. Tang, Z. Wang, Z Shi, S. Wua, D. Song, J. Zhang, K. Fatih, J. Zhang, H. Wang, Z.
Liu, R. Abouatallah, A. Mazza. A review of water flooding issues in the proton exchange membrane
fuel cell. Power Sources 178 (2008) 103–117.
[41] M. Zhiani, H.A. Gasteiger, M. Piana, S. Catanorchi. Comparative study between platinum
supported on carbon and non-noble metal cathode catalyst in alkaline direct ethanol fuel cell
(ADEFC). Int. J. Hydrogen Energy 36 (2011) 5110–5116.
[42] A.C. Garcia, J.J. Linares. M. Chatenet, E.A. Ticianelli. NiMnOx/C: A Non-noble Ethanol-
Tolerant Catalyst for Oxygen Reduction in Alkaline Exchange Membrane DEFC. Electrocatalysis 5
(2014) 41–49.

281
CHAPTER 8. Conclusions.
8.1. General findings from the experimental work.
A series of interesting conclusions can be drawn from the results presented in each of the chapters of
this thesis.
In Chapter 2, reduced graphene oxide was prepared in three different ways starting from graphite
oxide. The influence of the synthesis method on the exfoliation and reduction degrees of rGO was
evidenced. Starting from these three different rGO, three Fe-N/rGO catalysts for ORR were obtained.
The final physicochemical properties of the catalysts and ORR activity in alkaline conditions depend
on the initial properties of the rGO, underlying the important influence that the reduction-exfoliation
process in rGO synthesis has on the final Fe-N/rGO catalyst.
In Chapter 3, a complex between Co(II) ions and the nitrogen-containing ligand molecule TPTZ and
multi-walled carbon nanotubes were used as precursor for the preparation of an electrocatalyst for
ORR. After a first pyrolysis, a good electroactivity in acid conditions was obtained. Then, a second
pyrolysis was performed, and the catalyst performances increased in terms of both current density
performance and stability. These improvements can be ascribed to the increase of the microporosity
and better stabilization of the active sites induced by the second pyrolysis.
In Chapter 4, the synthesis of a Fe-N-C catalyst using pyrrole, iron acetate and mesoporous carbon
as precursors was optimized. It was found that using a surfactant (polyvinylpyrrolidone) during the
Fe ions impregnation and performing a preliminary heat treatment on the support before the Fe ions
impregnation was not useful to obtain a higher activity. Performing a second pyrolysis lead to an
activity and selectivity improvement, while the addition of further Fe amounts before this second
pyrolysis does not lead to improve the ORR activity. These results provide an insight on how to
synthesize a more active ORR catalyst.
The results of the physico-chemical characterization and RDE tests show that the total N and Fe
contents are not the limiting factors for the ORR activity. However, the ORR activity improvement
attained after the second pyrolysis is related to the higher relative amounts of pyridinc and pyrrolic
nitrogen, and to the significant increase of the microporosity.
In Chapter 5, iron phthalocyanine was used as unique precursor for the synthesis of a Fe-N-C catalyst.
The pyrolysis was performed at different temperature to find out an optimum. Then, two different
mesoporous silica (SBA-15 and a commercial mesoporous silica) were used as hard templates to
modify morphology of the final catalyst. The type of silica used as templating agent strongly
influences the catalyst morphology, which in turn influences the catalyst ORR activity, depending on

282
the structural properties, in particular the total surface area and the micropores content. These results
underline the importance of the choice of a templating agent with an adequate structure in order to
produce a catalyst with good performances via the hard-templating method.
In Chapter 6, different Me(II)phthalocyanines (Me = Fe, Co, Cu, Zn) were used as unique transition
metal, C and N precursor, to investigate the influence of the different metals in the final catalyst
properties. A TGA coupled with a mass spectroscopy analysis evidenced how these properties are in
relation with different trends of the weight loss and with the formation of gaseous products in different
amounts and at different temperatures, which are induced by the different transition metals during the
pyrolysis. These results show a new insight on what occurs during the pyrolysis process during the
synthesis of these types of Me-N-C derived ORR. Fe-phthalocyanine is the precursor which lead to
obtain the catalyst with higher activity and selectivity toward a complete 4e- ORR in both acid and
alkaline conditions. In acid conditions, it exhibits interesting analogies with the standard Pt-based
catalysts in terms of activation energy values, and their variation with overpotential. In alkaline
conditions, this catalyst shows a performance very close to the Pt/C catalyst in terms of onset
potential, and an almost null peroxide production.
The results of the different single fuel cell tests evidenced how this catalyst, is spite of its good ORR
activity in RDE, is highly affected by deactivation mainly ascribed to the flooding of the micropores.
This fact provide an important evidence of the importance of performing a fuel cell test for the ORR
catalysts. Good catalytic performances in RDE-RRDE tests are not sufficient to define an ORR
catalyst as a good candidate to be used in a fuel cell stack. The “goodness” of the catalyst has to be
validate by means of the obtainment of good performances in fuel cell test in terms of both activity
and durability.
In Chapter 7, different C-supports were used to obtain Fe-N/C catalysts using Fe – 1,10-
phenanthroline complex as precursor. The results evidence the importance of the C-support
characteristics in order to obtain a good catalyst performance. This is especially important in acid
conditions, where the slower kinetics of ORR renders the distribution and accessibility of the active
sites to be very limiting factors. In alkaline conditions the enhanced ORR kinetics due to the intrinsic
properties of the Fe-N-C materials, makes the C-support structure itself a less strict parameter.
8.2. Resume of catalysts activities measured in RDE in both acid and alkaline conditions.
To give an overall idea of the results obtained, the RDE performances of the most active catalyst
developed in each of the chapters of this thesis are shown in Figure 1. It is evident that activity
improvements were obtained throughout the experimental work performed during the development
of the thesis.

283
Figure 1. Polarization curves recorded in RDE at 900 rpm in acid (A) and alkaline (B) conditions for the most significant catalysts developed in this thesis. For each catalyst are indicated a reference to the composition, the nitrogen precursor molecule and the chapter of the thesis where it is presented.
0.0 0.1 0.2 0.3 0.4 0.5 0.6 0.7 0.8 0.9 1.0 1.1 1.2-4.5
-4.0
-3.5
-3.0
-2.5
-2.0
-1.5
-1.0
-0.5
0.0
i (m
A c
m-2)
E vs RHE (V)
Fe-N-C (FePc, impregn.) Chapt 6 Fe-N/MWCNT (Phen) Chapt 7 Fe-N/MPC1 (Phen) Chapt 7 Fe-N/MPC2 (Phen) Chapt 7 Co-N/MWCNT (TPTZ) Chapt 3 Fe-N/MPC (PPY, S7) Chapt 4 Fe-N-C (FePc, ball mill.) Chapt 5 Pt/C anodic scan Pt/C cathodic scan
A
0.0 0.1 0.2 0.3 0.4 0.5 0.6 0.7 0.8 0.9 1.0 1.1 1.2-5.0
-4.5
-4.0
-3.5
-3.0
-2.5
-2.0
-1.5
-1.0
-0.5
0.0
Fe-N-C (FePc, impregn.) Chapt 6 Fe-N/MWCNT (Phen) Chapt 7 Fe-N/MPC1 (Phen) Chapt 7 Fe-N/MPC2 (Phen) Chapt 7 Fe-N/rGOsonic (TPTZ) Chapt 2 Co-N/MWCNT (TPTZ) Chapt 3 Fe-N/MPC (PPY, S7) Chapt 4 Pt/C cathodic scan Pt/C anodic scan
B
i (m
A c
m-2)
E vs RHE (V)
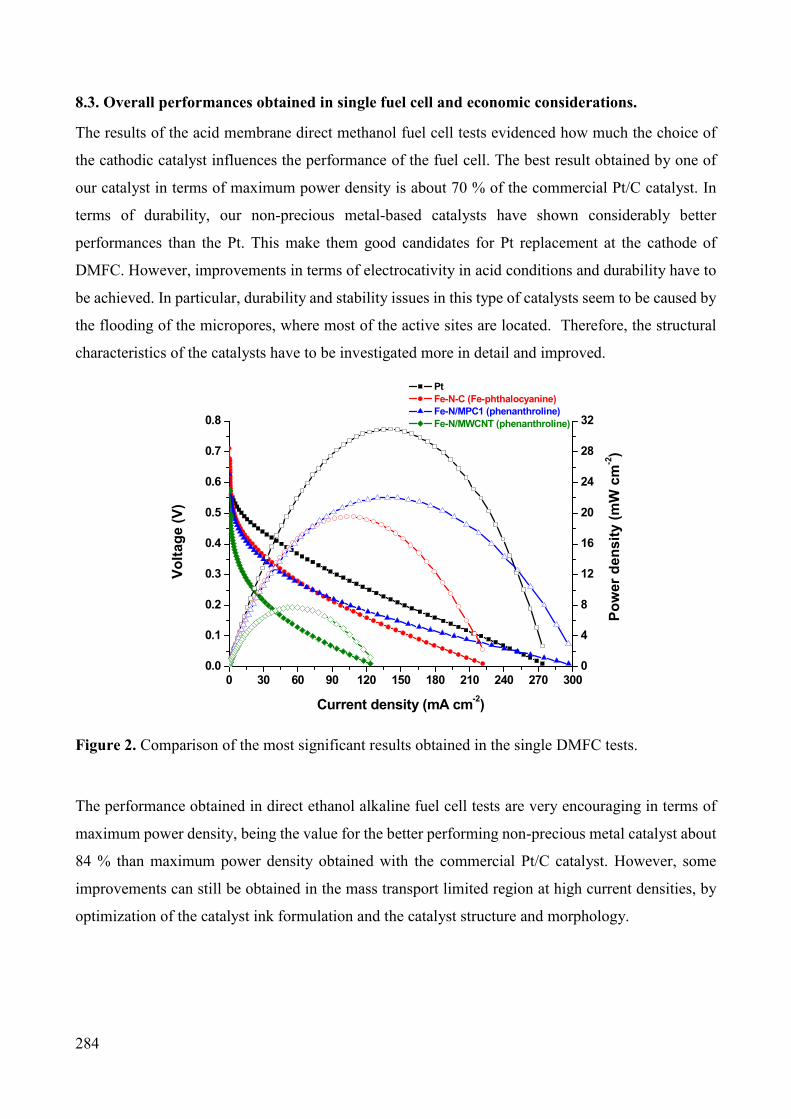
284
8.3. Overall performances obtained in single fuel cell and economic considerations.
The results of the acid membrane direct methanol fuel cell tests evidenced how much the choice of
the cathodic catalyst influences the performance of the fuel cell. The best result obtained by one of
our catalyst in terms of maximum power density is about 70 % of the commercial Pt/C catalyst. In
terms of durability, our non-precious metal-based catalysts have shown considerably better
performances than the Pt. This make them good candidates for Pt replacement at the cathode of
DMFC. However, improvements in terms of electrocativity in acid conditions and durability have to
be achieved. In particular, durability and stability issues in this type of catalysts seem to be caused by
the flooding of the micropores, where most of the active sites are located. Therefore, the structural
characteristics of the catalysts have to be investigated more in detail and improved.
Figure 2. Comparison of the most significant results obtained in the single DMFC tests.
The performance obtained in direct ethanol alkaline fuel cell tests are very encouraging in terms of
maximum power density, being the value for the better performing non-precious metal catalyst about
84 % than maximum power density obtained with the commercial Pt/C catalyst. However, some
improvements can still be obtained in the mass transport limited region at high current densities, by
optimization of the catalyst ink formulation and the catalyst structure and morphology.
0 30 60 90 120 150 180 210 240 270 3000.0
0.1
0.2
0.3
0.4
0.5
0.6
0.7
0.8
Po
wer
de
ns
ity
(m
W c
m-2)
Vo
lta
ge (
V)
Current density (mA cm-2)
Pt
Fe-N-C (Fe-phthalocyanine) Fe-N/MPC1 (phenanthroline)
Fe-N/MWCNT (phenanthroline)
0
4
8
12
16
20
24
28
32

285
Figure 3. Comparison of the most significant results obtained in the single alkaline DEFC tests.
Therefore, we demonstrated how the non-precious metal catalysts for ORR developed in this thesis
are potential candidates for application as cathodic catalysts for direct alcohol fuel cells, in both acid
and alkaline conditions. Nevertheless, so far, the commercialization of these technologies is still not
widely developed. Comprehensive studies about the impact of the replacement of the standard Pt-
based catalysts with this type of non-noble metal catalysts on the final cost of direct alcohol fuel cell
devices are not available in the literature. However, one can state that the replacement of Pt with such
a this type of catalysts will provide undoubted advantages in terms of decreasing the dependence on
Pt (noble metal with high cost, price volatility and scarcity of reserves), without affecting too much
the performances (especially in alkaline conditions), and also in terms of durability, especially in
DMFC, due to the better resistance to methanol crossover.
Concerning the application in a PEMFC fueled with H2, the performance of the best electrocatalyst
developed and tested in this thesis, reaches a value close to 43 % of the maximum power density
obtained with a commercial Pt/C catalyst at cathode in the comparative test. The use of this
technology is more widely-developed, especially in the automotive sector, and some cost analyses
can be found in the literature. In particular, different research centers and companies, and between
them the U.S. Department of Energy have published some studies [1,2,3].
0 50 100 150 200 250 300 3500.0
0.1
0.2
0.3
0.4
0.5
0.6
0.7
0.8
0.9
1.0
Po
we
r d
en
sit
y (
mW
cm
-2)
Vo
lta
ge
(V
)
Current density (mA cm-2)
Pt Fe-N/MPC2 (Phenanthroline) Fe-N-C (Fe-Phthalocyanine)
0
10
20
30
40
50
60
70
80
90

286
Figure 4. Comparison of the most significant results obtained in the single H2 / O2 PEMFC tests.
For example, the Los Alamos National Laboratory calculated the cost of the catalyst per kW of power
generated by a 80 kW fuel cell stack based on a non-precious metal cathodic catalyst able to generate
a maximum power density of 370 mW cm-2. The value varies with the number of stacks (and therefore
of fuel cell powered vehicles) produced per year. For a minimum value of 1000 stacks per year, the
cost of the catalyst was esteemed to be 0.62 U.S.$ kW-1. Under the hypothesis of the maximum
number of stacks production considered (500,000 stacks per year), the cost decreases to 0.35 U.S.$
kW-1 [1]. Under these hypotheses, considering a non-noble metal catalyst loading of 4 mg cm-2 and
the cost of the other components of the stack, they calculated a total cost of the non-precious metal
based stack of 30 U.S.$ kW-1.
The same calculation mad for a Pt-based stack by the U.S. Department of Energy [2] lead to a cost of
55 U.S.$ kW-1, considering a total Pt loading in the MEA of 0.153 mg cm-2, a maximum power density
of 692 mW cm-2 and an average Pt price of 1500 U.S.$ per troy ounce.
However, we cannot provide such a this type of calculation on the basis of the cost of production of
our more performing catalyst. In fact we could only base our calculation on the prices of the reagents
that we can purchase at laboratory scale (order of magnitude of few grams), and this could lead to
meaningless results. Moreover, the scale-up of the synthesis process from lab-scale to industrial scale
is not trivial.
0 200 400 600 800 1000 1200 14000.0
0.1
0.2
0.3
0.4
0.5
0.6
0.7
0.8
0.9
1.0
Po
we
r d
en
sit
y (
mW
cm
-2)
Vo
lta
ge
(V
)
Current density (mA cm-2)
Pt Fe-N/MPC2 (phenanthroline)
Fe-N/MWCNT (phenanthroline) Fe-N-C (Fe-phthalocyanine)
0
50
100
150
200
250
300
350

287
On the basis of the Los Alamos National Laboratory calculations [1], more than one stack has to be
mounted on the vehicle to assure an adequate power if the maximum power density achieved is lower
than 600 mW cm-2. The presence of more than one stack causes a remarkable cost rising, in addition
to problems of space on board and of total weight of the vehicle.
Therefore, the remaining major challenges and barriers to be overcome in order to make the non-
precious metal-based ORR electrocatalysts for PEMFC powered vehicles a viable technology are:
• ORR activity of non-PGM catalysts (required to lower cost of stack components).
• Long-term stability and performance durability of non-PGM catalysts.
• Understanding of the active-site and reaction mechanism to help the catalyst design.
• Electrode integration optimization to allow sufficient ionic and electronic conductivity in thick
catalytic layers and efficient mass transport of reactants / products to / from the active reaction sites.
• Scale-up of non-PGM catalyst synthesis.
• Water management at high current densities.
• Optimization of ionomer distribution in the electrode layer.
• MEA design, optimization, fabrication, and scale-up.
• Integration with existing automotive fuel cell stack and system technology.
8.4. Suggestions for future work.
From the results presented in this thesis, new possibilities and ideas for a future work can be
suggested.
The kinetic studies performed in RDE for the Me-N-C catalysts in acid conditions and
presented in Chapter 6 could be conducted also in alkaline conditions: electrode ink and
loading optimization in RDE, calculation of the reaction orders for oxygen and OH-,
calculation of the activation energy, hydrogen peroxide reduction test.
The importance of the use of a templating agent able to give to the C-support or directly to
the catalyst certain structural features was evidenced, especially in acid conditions. However,
the cost of structured templating agents, such as a mesoporous silica, is still high at the present
state of the art, and this could result in a too much high cost of the final non-precious metal
catalyst. Therefore, the use of other methods for increasing the porosity and the surface area,
especially for the self-supported catalysts (which do not make use of a C-support during the
synthesis) could be considered for a future work. For example, the addition of foaming and
expansion agents before the pyrolysis.
Completion of the single fuel cell tests the catalyst presented in Chapter 7.

288
Further tests in single fuel cell to find out the optimum catalyst ink formulation in order to
obtain better performances.
Further investigation via the TGA coupled with mass spectroscopy on catalysts prepared
starting from different precursors, in order to compare the role played by the different
transition metals during the pyrolysis process, as done in Chapter 6.
References.
[1] P. Zelenay. Non-precious metal fuel cell cathodes: Catalyst development and electrode structure
design. http://www.hydrogen.energy.gov/pdfs/review15/fc107_zelenay_2015_o.pdf (accessed on
January 2016).
[2] DOE Fuel Cell Technologies Office Record # 13012, (2013),
http://energy.gov/sites/prod/files/2014/03/f11/13012_fuel_cell_system_cost_2013.pdf (accessed on
January 2016).
[3] W. Bernhart, S. Riederle, M. Yoon.
https://www.rolandberger.com/media/pdf/Roland_Berger_Fuel_cells_20140113.pdf (accessed on
January 2016).

289
List of Publications L. Osmieri, A.H.A. Monteverde Videla, S. Specchia. Activity of Co–N multi walled carbon
nanotubes electrocatalysts for oxygen reduction reaction in acid conditions. Journal of Power
Sources 278 (2015) 299–307.
DOI: 10.1016/j.jpowsour.2014.12.080
A.H.A. Monteverde Videla , L. Osmieri, M. Armandi, S. Specchia. Varying the morphology of Fe-
N-C electrocatalysts by templating Iron Phthalocyanine precursor with different porous SiO2 to
promote the Oxygen Reduction Reaction. Electrochimica Acta 177 (2015) 43–50.
DOI: 10.1016/j.electacta.2015.01.165
A.H.A. Monteverde Videla, L. Osmieri, R. Alipour Moghadam Esfahani, J. Zeng, C. Francia. S.
Specchia. The Use of C-MnO2 as Hybrid Precursor Support for a Pt/C-MnxO1+x Catalyst with
Enhanced Activity for the Methanol Oxidation Reaction (MOR). Catalysts 5 (2015) 1399–1416.
DOI: 10.3390/catal5031399
L. Osmieri, A.H.A. Monteverde Videla, S. Specchia. Optimization of a Fe-N-C electrocatalyst
supported on mesoporous carbon functionalized with polypyrrole for oxygen reduction reaction
under both alkaline and acidic conditions. Submitted to: International Journal of Hydrogen Energy
(manusctipt number: HE_2016_137) – Under revision.
Alessandro H. A. Monteverde Videla, Luigi Osmieri, Stefania Specchia. Non-noble metal (NNM)
catalysts for Fuel Cells: tuning the activity by a rational step by step single variable evolution. Book
Chapter in: Fethi Bedioui, Jose H. Zagal (Editors). Electrochemistry of N4 Macrocyclic Metal
Complexes, Volume1: Energy. Springer International Publishing AG, Cham. – In Press
ISBN 978-3-319-31170-8.
290
List of Abstracts or Proceedings of Congresses.
Osmieri L., Monteverde Videla A.H.A., Armandi M., Specchia S. (2015). A micro-silica reactor
(µSiO2–R) able to produce highly porous non-noble catalysts for oxygen reduction reaction under
alkaline conditions. In: EFCD2015 – Challenges Towards Zero Pt for Oxygen Reduction, La Grande
Motte (France), 13/09/2015 – 16/09/2015. attended (poster ptresentation).
Osmieri L., Alipour Moghadam Esfahani R., Monteverde Videla A.H.A., Vasile N.S., Specchia S.
(2015). Kinetic analysis of oxygen reduction reaction on different self-supported C-N-Me (Me = Fe,
Co, Cu) catalysts in acidic medium. In: ECS Conference on Electrochemical Energy Conversion &
Storage with SOFC-XIV, Glasgow (United Kingdom), 26/07/2015 - 31/07/2015. # C-0622.
Monteverde Videla A.H.A., Osmieri L., Ercolino G., Stelmachowski P., Kotarba A., Specchia S.
(2015). “Mesoporous Cobalt Oxide for Oxygen Evolution Reaction under alkaline conditions: a
comparative study of three synthesis methods”. In: International Conference on Electrochemical
Energy Science and Technology EEST2015, Vancouver (BC, Canada), 16/08/2015 – 22/08/2015.
Osmieri L., Monteverde Videla A.H.A., Alipour Moghadam Esfahani R., Vankova S., Armandi M.,
Specchia S. (2015). Zinc(II)-phtalocyanine as precursor for preparation of extremely high surface
area N-doped carbon for potential applications in electrochemical devices. In: II Italian Meeting on
Porphyrins and Phtalocyanines, Roma (Italy), 06/07/2015 - 08/07/2015. attended (poster
presentation)
Osmieri L., Monteverde Videla A.H.A., Specchia S. (2015). Optimization of a Fe-N-C
electrocatalyst supported on ordered mesoporous carbon functionalized with polypyrrole for oxygen
reduction reaction. In: V Iberian Symposium on Hydrogen, Fuel Cells and Advanced Batteries
HYTELTEC2015, Tenerife (Spain), 05/07/2015 - 08/07/2015.
Monteverde Videla A.H.A., Zeng J., Osmieri L., Francia C., Specchia S. (2014). MnO2/C supported
Pt nanoparticles with enhanced activity for methanol oxidation. In: 2nd Euro-Mediterranean
Hydrogen Technologies Conference EmHyTech, Taormina (Italy), 9/12/2014 - 12/12/2014. pp. 97-
98.

291
Monteverde Videla A.H.A., Osmieri L., Specchia S. (2014). Varying the morphology of Fe-TMPPCl
electrocatalysts by using different SiO2 template promoting the oxygen reduction reaction. In: The
International Conference on Electrochemical Energy Science and Technology EEST2014, Shanghai
(P.R. China), 31/10/2014 - 4/11/2014.
Osmieri L., Monteverde Videla A.H.A., Spinelli P., Specchia S. (2014). Activity of Co-Nx-multi-
walled carbon nanotubes electrocatalysts for oxygen reduction reaction in acid conditions: a
comparison between tests in rotating disk electrode and in gas-diffusion electrode half-cell. In: 14th
Ulm ElecroChemical Talks 14-UECT, Ulm (Germany), 24/06/2014 - 26/06/2014. attended
(poster presentation).
Monteverde Videla A.H.A., Osmieri L., Specchia S. (2014). The use of different types of reduced
graphene oxide (rGO) on the reduction oxygen reaction (ORR) under alkaline conditions. In: 6th
Forum on New Materials - CIMTEC2014, Montecatini Terme (Italy), 15/06/2014 - 19/06/2014.
attended (oral presentation).