Noble gas films on a decagonal AlNiCo quasicrystal
20
arXiv:cond-mat/0610642v3 [cond-mat.mtrl-sci] 11 Dec 2006 Noble gas films on a decagonal AlNiCo quasicrystal W Setyawan 1 , R D Diehl 2 , N Ferralis 3 , M W Cole 2 and S Curtarolo 1 1 Department of Mechanical Engineering and Materials Science, Duke University, Durham, NC 27708 2 Department of Physics and Materials Research Institute, Penn State University, University Park, PA 16801 3 Department of Chemical Engineering, University of California, Berkeley, CA 94720 E-mail: [email protected] Abstract. Thermodynamic properties of Ne, Ar, Kr, and Xe adsorbed on an Al-Ni- Co quasicrystalline surface (QC) are studied with Grand Canonical Monte Carlo by employing Lennard-Jones interactions with parameter values derived from experiments and traditional combining rules. In all the gas/QC systems, a layer-by-layer film growth is observed at low temperature. The monolayers have regular epitaxial fivefold arrangements which evolve toward sixfold close-packed structures as the pressure is increased. The final states can contain either considerable or negligible amounts of defects. In the latter case, there occurs a structural transition from five to sixfold symmetry which can be described by introducing an order parameter, whose evolution characterizes the transition to be continuous or discontinuous as in the case of Xe/QC (first-order transition with associated latent heat). By simulating fictitious noble gases, we find that the existence of the transition is correlated with the size mismatch between adsorbate and substrate’s characteristic lengths. A simple rule is proposed to predict the phenomenon. 1. Introduction A tremendous interest in surface structures and phase transitions grew out of the fact that surface systems are ideal for exploring the effects of competing interactions [1, 2]. A form of competing interactions seen in adsorption involves either a length scale or a symmetry mismatch between the adsorbate-adsorbate interaction and the adsorbate-substrate interaction [3, 4]. Some consequences of such mismatches include density modulations [5, 6], domain walls [7], epitaxial rotation in the adsorbed layer [8, 9, 10, 11, 12, 13], and a disruption of the normal periodicity and growth in the film [14, 15, 16]. Domain wall systems in monolayers can be thought of as some of the first examples of ordering at the nanoscale, where the length scale is defined by the lattice mismatch, and interestingly, mismatched systems are now designed and used for growing nanostructure arrays having specific symmetries and spacings. After the discovery of quasicrystals, an interest grew in the possibility of using quasicrystal surfaces as substrates to grow quasicrystalline films of a single element,
-
Upload
independent -
Category
Documents
-
view
1 -
download
0
Transcript of Noble gas films on a decagonal AlNiCo quasicrystal

arX
iv:c
ond-
mat
/061
0642
v3 [
cond
-mat
.mtr
l-sc
i] 1
1 D
ec 2
006
Noble gas films on a decagonal AlNiCo quasicrystal
W Setyawan1, R D Diehl2, N Ferralis3, M W Cole2 and S
Curtarolo1
1 Department of Mechanical Engineering and Materials Science, Duke University,
Durham, NC 277082 Department of Physics and Materials Research Institute, Penn State University,
University Park, PA 168013 Department of Chemical Engineering, University of California, Berkeley, CA 94720
E-mail: [email protected]
Abstract. Thermodynamic properties of Ne, Ar, Kr, and Xe adsorbed on an Al-Ni-
Co quasicrystalline surface (QC) are studied with Grand Canonical Monte Carlo by
employing Lennard-Jones interactions with parameter values derived from experiments
and traditional combining rules. In all the gas/QC systems, a layer-by-layer film
growth is observed at low temperature. The monolayers have regular epitaxial fivefold
arrangements which evolve toward sixfold close-packed structures as the pressure is
increased. The final states can contain either considerable or negligible amounts of
defects. In the latter case, there occurs a structural transition from five to sixfold
symmetry which can be described by introducing an order parameter, whose evolution
characterizes the transition to be continuous or discontinuous as in the case of Xe/QC
(first-order transition with associated latent heat). By simulating fictitious noble gases,
we find that the existence of the transition is correlated with the size mismatch between
adsorbate and substrate’s characteristic lengths. A simple rule is proposed to predict
the phenomenon.
1. Introduction
A tremendous interest in surface structures and phase transitions grew out of the
fact that surface systems are ideal for exploring the effects of competing interactions
[1, 2]. A form of competing interactions seen in adsorption involves either a length
scale or a symmetry mismatch between the adsorbate-adsorbate interaction and the
adsorbate-substrate interaction [3, 4]. Some consequences of such mismatches include
density modulations [5, 6], domain walls [7], epitaxial rotation in the adsorbed layer
[8, 9, 10, 11, 12, 13], and a disruption of the normal periodicity and growth in the film
[14, 15, 16]. Domain wall systems in monolayers can be thought of as some of the first
examples of ordering at the nanoscale, where the length scale is defined by the lattice
mismatch, and interestingly, mismatched systems are now designed and used for growing
nanostructure arrays having specific symmetries and spacings.
After the discovery of quasicrystals, an interest grew in the possibility of using
quasicrystal surfaces as substrates to grow quasicrystalline films of a single element,

Noble gas films on a decagonal AlNiCo quasicrystal 2
which do not occur in nature [17]. Such a system necessarily has a lattice mismatch
between the adsorbate and the substrate, and the effects are seen in the diverse examples
of film structures and growth modes that occur for these systems [14, 15, 16, 18, 19,
20, 21]. There is now interest in being able to design and produce quasiperiodic arrays
of nanoclusters on quasicrystal surfaces, but the complex interactions involved in the
adsorbate-substrate interactions make it difficult to design specific nanostructures.
Recently, our group has begun to explore the behavior of simple gases physisorbed
on quasicrystalline surfaces [22, 23, 24, 25]. The key questions motivating these studies
are analogous to those for periodic substrates; for example, what are the energy scales
of the adsorbed film and what is the resulting structure of the film? The latter problem
includes a specific question: under what conditions, if any, of temperature (T ) and vapor
pressure (P ) does the film form an epitaxial phase on the surface and when does it form
an alternative structure, a hexagonal, close-packed array of atoms or molecules (i.e., the
film’s ground state within the two-dimensional (2D) approximation). One expects the
low P , submonolayer behavior to be that of a film conforming to the substrate, attracted
to the sites offering the highest binding energies. The hypothetical behavior at high P
includes several possibilities, e.g. bulk-like film growth, amorphous structures, island
formation or the absence of any multilayer film. Which of these scenarios (or others)
actually occurs is a function of the gas-surface and gas-gas interactions.
In this article, we report the results of Grand Canonical Monte Carlo (GCMC)
[26, 27] simulations of Ne, Ar, Kr, and Xe adsorbed on the tenfold surface of a decagonal
Al73Ni10Co17 quasicrystal [28, 29]. We organize our article as follows. In Section 2 we
discuss briefly the method. Section 3 is devoted to the results of Ne, Ar, Kr, and Xe
adsorbed on the AlNiCo. In Section 4 we compare the results of all gases. Section 5
contains conclusions and comments on strategies for future research in this area.
2. Method
By using the Grand Canonical Monte Carlo (GCMC) simulation method [2, 26, 27]
we study the adsorption of noble gases: Ne, Ar, Kr, and Xe on the tenfold surface
of a decagonal Al73Ni10Co17 quasicrystal [28, 29] (He is omitted because it requires a
quantum treatment and Rn is omitted because it is not convenient experimentally).
In this article, we use the abbreviation QC to refer to this particular quasicrystalline
substrate. GCMC, a widely used method, is described in detail in references
[23, 24, 25, 30]. Only a brief overview is given here.
2.1. Grand Canonical Monte Carlo
At constant temperature, T , and volume, V , the GCMC method explores the
configurational phase space using the Metropolis algorithm and finds the equilibrium
number of adsorbed atoms (adatoms), N , as a function of the chemical potential, µ, of
the gas. The adsorbed atoms are in equilibrium with the coexisting gas: the chemical

Noble gas films on a decagonal AlNiCo quasicrystal 3
potential of the gas is constant throughout the system. In addition, the coexisting gas
is taken to be ideal. With this method we determine adsorption isotherms, ρN , and
density profiles, ρ(x, y), as a function of the pressure, P (T, µ). For each data point in
an isotherm, we perform at least 18 million GCMC steps to reach equilibrium. Each
step is an attempted displacement, creation, or deletion of an atom with execution
probabilities equal to 0.2, 0.4, and 0.4, respectively [24, 25, 30]. At least 27 million
steps are performed in the subsequent data-gathering and -averaging phase.
2.2. Unit cell
The unit cell is tetragonal. We take a square section of the surface, A, of side 5.12 nm,
to be the (x, y) part of the unit cell in the simulation, for which we assume periodic
boundary conditions along the basal directions. Although this assumption limits the
accuracy of the long range QC structure, it is numerically necessary for these simulations.
Since the size of the cell is relatively large compared to that of the noble gases, the cell
is accurately representative of order on short-to-moderate length scales. A hard wall
at 10 nm above the surface along z is used to confine the coexisting vapor phase. The
simulation results for Xe over QC, presented below, are consistent with both our results
from experiments [31] and virial calculations [32]. Hence, the calculations may also be
accurate for other systems.
2.3. Gas-gas and gas-surface interactions
The gas-gas potentials are taken to be Lennard-Jones (LJ) 12-6 interactions, with the
parameter values ǫgg and σgg listed in table 1. The gas-surface potentials are based on
a summation of two-body interactions between the gas and the individual constituent
atoms of the substrate: Al, Ni and Co [22, 28, 32]. The gas-surface pair interactions are
also assumed to have LJ form, with parameter values taken from traditional combining
rules, using atomic sizes derived from bulk crystalline lattice constants [31, 32, 33, 34].
The LJ gas-surface parameters are ǫgas−Al and σgas−Al for Al, and ǫgas−TM and σgas−TM
for the two transition metals Ni and Co. All these values are listed in the upper part
of table 1. In the calculation of the adsorption potential, we assume a structure of the
unrelaxed surface taken from the empirical fit to LEED data [29].
2.4. Adsorption potentials
Figures 1(a), (c), (e), and (g) show the function Vmin(x, y) of Ne, Ar, Kr, and Xe on the
QC, respectively, which is calculated by minimizing the adsorption potentials, V (x, y, z),
along the z direction at every value of the coordinates (x, y):
Vmin(x, y) ≡ min {V (x, y, z)}|along z . (1)
The figures reveal the fivefold rotational symmetry of the substrate. Dark spots
correspond to the most attractive regions of the substrate. By choosing appropriate

Noble gas films on a decagonal AlNiCo quasicrystal 4
Table 1. Parameter values for the 12-6 Lennard-Jones interactions. TM is the label
for Ni or Co. The prefixes i and d refer to hypothetical inflated and deflated variants
of real atoms, as discussed in the text.
ǫgg σgg ǫgas−Al σgas−Al ǫgas−TM σgas−TM
(meV) (nm) (meV) (nm) (meV) (nm)
Ne 2.92 0.278 9.40 0.264 9.01 0.249
Ar 10.32 0.340 17.67 0.295 16.93 0.280
Kr 14.73 0.360 21.11 0.305 20.23 0.290
Xe 19.04 0.410 24.00 0.330 23.00 0.315
iNe(1) 2.92 0.410 5.45 0.330 5.22 0.315
dXe(1) 19.04 0.278 41.39 0.264 39.67 0.249
dXe(2) 19.04 0.390 25.88 0.320 24.80 0.305
iXe(1) 19.04 0.550 14.96 0.400 14.34 0.385
iXe(2) 19.04 0.675 10.52 0.462 10.08 0.447
sets of five dark spots, we can identify pentagons, whose sizes follow the inflationary
property of the QC. Note the pentagon at the center of each figure: it will be used to
extract the geometrical parameters λs and λc used in Section 4.
To characterize the corrugation, not well-defined for aperiodic surfaces, we calculate
the distribution function f(Vmin), the average 〈Vmin〉 and standard deviation SD of
Vmin(x, y) as:
f(Vmin)dVmin ≡ probability{
Vmin ∈ [Vmin, Vmin + dVmin[}
(2)
〈Vmin〉 ≡∫ ∞
−∞f(Vmin)Vmin dVmin, (3)
SD2 ≡∫ ∞
−∞f(Vmin)(Vmin − 〈Vmin〉)
2 dVmin. (4)
Figures 1(b), (d), (f), and (h) show f(Vmin) of the adsorption potential for Ne, Ar,
Kr, and Xe on the QC, respectively. Vmin(x, y) extends by more than 2·SD around
its average, revealing the high corrugation of the gas-surface interaction in these four
systems. The average and SD of Vmin(x, y) for these systems are listed in the upper part
of table 2.
2.5. Effective parameters
For every gas-surface interaction we define two effective parameters σgs and Dgs. σgs
represents the averaged LJ size parameter of the interaction, calculated following the
traditional combining rules [33]:
σgs ≡ xAlσg−Al + xNiσg−Ni + xCoσg−Co, (5)
where xAl, xNi, and xCo are the concentrations of Al, Ni, and Co in the QC, respectively.
Dgs represents the well depth of the laterally averaged potential V (z):
Dgs ≡ −min {V (z)}|along z . (6)

Noble gas films on a decagonal AlNiCo quasicrystal 5
Figure 1. (color online). Computed adsorption potentials for (a) Ne, (c) Ar,
(e) Kr, and (g) Xe on the quasicrystal, obtained by minimizing V (x, y, z) with
respect to z. The distribution of the minimum value of these potentials is
plotted in ((b), (d), (f), and (h)) respectively: the solid line marks the average
value 〈Vmin〉, the dashed lines mark the values at 〈Vmin〉±SD.
In addition, we normalize the σgs and Dgs with respect to the gas-gas interactions:
σ⋆gs ≡ σgs/σgg, (7)
D⋆gs ≡ Dgs/ǫgg. (8)
The values of the effective parameters σgs, Dgs, σ⋆gs, and D⋆
gs for the four gas-surface
interactions are listed in the upper part of table 2. We also include the well depth for
Ne, Ar, Kr, and Xe on graphite, as comparison [35].

Noble gas films on a decagonal AlNiCo quasicrystal 6
Table 2. Range, average (〈Vmin〉), and standard deviation (SD) of the interaction
Vmin(x.y) on the QC. Effective parameters of the gas-surface interactions (Dgs, σgs,
D⋆gs, σ⋆
gs), and, for comparison, the best estimated well depths DGrgs on graphite [35].
Vmin range 〈Vmin〉 SD Dgs σgs D⋆gs σ⋆
gs DGrgs
(meV) (meV) (meV) (meV) (nm) (Dgs/ǫgg) (σgs/σgg) (meV)Ne -71 to -33 -47.43 6.63 43.89 0.260 15.03 0.935 33Ar -181 to -85 -113.32 13.06 108.37 0.291 10.50 0.856 96Kr -225 to -111 -145.71 15.68 140.18 0.301 9.52 0.836 125Xe -283 to -155 -195.46 17.93 193.25 0.326 10.15 0.795 162
iNe(1) -65 to -36 -45.11 4.08 43.89 0.326 15.03 0.795
dXe(1) -305 to -150 -207.55 29.18 193.25 0.260 10.15 0.935
dXe(2) -295 to -155 -199.40 19.33 193.25 0.316 10.15 0.810
iXe(1) -248 to -170 -195.31 11.21 193.25 0.396 10.15 0.720
iXe(2) -230 to -180 -194.25 7.77 193.25 0.458 10.15 0.679
2.6. Fictitious gases
As shown in tables 1 and 2, Ne is the smallest atom and has the weakest gas-gas and
gas-surface interactions (minima of σgg, σgs, ǫgg and Dgs). In addition, Xe is the largest
atom and has the strongest gas-gas and gas-surface interactions (maxima of σgg, σgs,
ǫgg and Dgs). Therefore, for our analysis, it is useful to consider two “fictitious” gases,
iNe(1) and dXe(1), which are combinations of Ne and Xe parameters.
iNe(1) represents an “inflated” version of Ne, having the same gas-gas and average gas-
surface interactions of Ne but the geometrical dimensions of Xe:
{ǫgg, Dgs, D⋆gs}[iNe(1)] ≡ {ǫgg, Dgs, D
⋆gs}[Ne], (9)
{σgg, σgs, σ⋆gs}[iNe(1)] ≡ {σgg, σgs, σ
⋆gs}[Xe]. (10)
dXe(1) represents a “deflated” version of Xe, having the same gas-gas and average gas-
surface interactions of Xe but the geometrical dimensions of Ne:
{ǫgg, Dgs, D⋆gs}[dXe(1)] ≡ {ǫgg, Dgs, D
⋆gs}[Xe], (11)
{σgg, σgs, σ⋆gs}[dXe(1)] ≡ {σgg, σgs, σ
⋆gs}[Ne]. (12)
The resulting LJ parameters for iNe(1) and dXe(1) are summarized in the central parts of
tables 1 and 2. Furthermore, we also define three other fictitious versions of Xe: dXe(2),
iXe(1), and iXe(2) which have the same gas-gas and average gas-surface interactions
of Xe but deflated or inflated geometrical parameters. The last three fictitious gases
will be used in Section 4. The LJ parameters for these gases are summarized in the
lower parts of tables 1 and 2. In simulating fictitious gases, we implicitly rescale the
substrate’s strengths so that the resulting adsorption potentials have the same Dgs as
the non-inflated or non-deflated ones (equations 9 and 11).
2.7. Chemical potential, order parameter, and ordering transition
To appropriately characterize the evolution of the adsorption processes of the gases we
define a reduced chemical potential µ⋆, as:
µ⋆ ≡µ − µ1
µ2 − µ1, (13)

Noble gas films on a decagonal AlNiCo quasicrystal 7
where µ1 and µ2 are the chemical potentials at the onset of the first and second layer
formation, respectively. In addition, as done in reference [24, 25], we introduce the order
parameter ρ5−6, defined as the probability of existence of fivefold defect:
ρ5−6 ≡N5
N5 + N6, (14)
where N5 and N6 are the numbers of atoms having 2D coordination equal to 5 and 6,
respectively. The 2D coordination is the number of neighboring atoms within a cutoff
radius of aNN · 1.366 where aNN is the first nearest neighbor (NN) distance of the gas
in the solid phase and 1.366 = cos(π/6) + 1/2 is the average of the first and the second
NN distances in a triangular lattice.
In a fivefold ordering, most arrangements are hollow or filled pentagons with atoms
having mostly five neighbors. Hence, the particular choice of ρ5−6 is motivated by the
fact that such pentagons can become hexagons by gaining additional atoms with five
or six neighbors. Definition: the five to sixfold ordering transition is defined as a
decrease of the order parameter to a small or negligible final value. The phenomenon
can be abrupt (first-order) or continuous. Within this framework, ρ5−6 and (1 − ρ5−6)
can be considered as the fractions of pentagonal and triangular phases in the film,
respectively.
3. RESULTS
3.1. Adsorption isotherms
Figure 2 shows the adsorption isotherms of Ne, Ar, Kr, and Xe on the QC. The
plotted quantities are the densities of adatoms per unit area, ρN , as a function of
pressure at various temperatures. The simulated ranges and the experimental triple
point temperatures (Tt) for Ne, Ar, Kr, and Xe are listed in table 3. A layer-by-layer
film growth is visible at low temperatures. A complete wetting behavior is observed as
indicated by a continuous film growth at temperatures above Tt (isotherms at T > Tt
are shown as dotted curves). This behavior, observed in spite of the high corrugation, is
interesting as corrugation has been shown to be capable of preventing wetting [36, 37].
Although vertical steps corresponding to layers’ formation are evident in the
isotherms, the slopes of the isotherms’ plateaus at the same normalized temperatures
(T ⋆ ≡ T/ǫgg = 0.35) differ between systems. To characterize this, we calculate the
increase of each layer density, ∆ρN , from the formation to the onset of the subsequent
layer. ∆ρN is defined as ∆ρN ≡ (ρB − ρA)/ρA and the values are reported in table 3
(points (A) and (B) are specified in figure 2). We observe that, as the size of noble gas
increases ∆ρN become smaller, indicating that the substrate corrugation has a more
pronounced effect on smaller adsorbates, as expected since they penetrate deeper into
the corrugation pockets. However, Xe/QC does not follow this trend. This arises
from the complex interplay between the corrugation energy and length of the potential
with respect to the parameters of the gas (σgg, ǫgg) in determining the density of the

Noble gas films on a decagonal AlNiCo quasicrystal 8
adsorbed layers. In the case of Ne, Ar, and Kr on QC, the densities at points (A) are
approximately the same (ρA = 5.4 atoms/nm2), whereas that of Xe/QC is considerably
smaller (ρA = 4.2 atoms/nm2), because the Xe dimension σgg becomes comparable to
the characteristic length (corrugation) of the potential. This effect is clarified by the
density profile of the films, ρ(x, y), shown in figures 3 and 4. As can be seen at points
(A), the density profiles of Ne, Ar, and Kr on QC are the same, i.e. the same set
of dark spots appear in their plots. For Xe, some spots are separated with distances
smaller than its core radius (σgg), causing repulsive interactions. Hence these spots will
not likely appear in the density profile, resulting in a lower ρA. More discussion on
how interaction parameters affect the shape of the isotherms is presented in Section 4.
Note that the second layer in each system has a smaller ∆ρN than the first one. The
explanation will be given when we discuss the evolution of density profiles.
Figure 2. Computed adsorption isotherms for all the gas/QC systems. The
ranges of temperatures under study are: Ne: T = 14 K to 46 K in 2 K steps,
Ar: 45 K to 155 K in 5 K steps, Kr: 65 K to 225 K in 5 K steps, Xe: 80 K
to 280 K in 10 K steps. Additional isotherms are shown with solid circles at
T ⋆ = 0.35: T = 11.8 K (Ne), T = 41.7 K (Ar), T = 59.6 K (Kr), and T = 77
K (Xe). Isotherms above the triple point temperatures are shown as dotted
curves.

Noble gas films on a decagonal AlNiCo quasicrystal 9
Table 3. Results for Ne, Ar, Kr, and Xe adsorbed on the QC. Tt is taken from
reference[38]. The density increase (∆ρN ) in the first and second layers is calculated
at T ⋆ = 0.35 from point (A) to (B) and (C) to (D) in figure 2, respectively.
simulated T T ⋆ ≡ T/ǫgg Tt ∆ρN at T ⋆ = 0.35 θr
(K) (K) for 1st layer for 2nd layerNe 11.8 → 46 0.35 → 1.36 24.55 (12.2-5.3)/5.3=1.30 (11.1-10.2)/10.2=0.09 6◦
Ar 41.7 → 155 0.35 → 1.29 83.81 (7.3-5.5)/5.5=0.33 (6.9-6.4)/6.4=0.08 30◦
Kr 59.6 → 225 0.35 → 1.32 115.76 (6.9-5.5)/5.5=0.25 (6.6-6.3)/6.3=0.05 42◦
Xe 77 → 280 0.35 → 1.27 161.39 (5.8-4.2)/4.2=0.38 (5.2-5.2)/5.2=0 54◦
3.2. Density profiles
Figures 3 and 4 show the density profiles ρ(x, y) at T ⋆ = 0.35 for the outer layers of
Ne, Ar, Kr, and Xe adsorbed on the QC at the pressures corresponding to points (A)
through (F) of the isotherms in figure 2.
Ne/QC system. Figure 3(a) shows the evolution of adsorbed Ne. At the
formation of the first layer, adatoms are arranged in a pentagonal manner following
the order of the substrate, as shown by the discrete spots of the Fourier transform
(FT) having tenfold symmetry (point (A)). As the pressure increases, the arrangement
gradually loses its pentagonal character. In fact, at point (B) the adatoms are arranged
in patches of triangular lattices and the FT consists of uniformly-spaced concentric rings
with hexagonal resemblance. The absence of long-range ordering in the density profile
is indicated by the lack of discrete spots in the FT. This behavior persists throughout
the formation of the second layer (points (C) and (D)) until the appearance of the
third layer (point (E)). At this and higher pressures, the FT shows patterns oriented as
hexagons rotated by θr = 6◦, indicating the presence of short-range triangular order on
the outer layer (point (F)). In summary, between points (A) and (F) the arrangement
evolves from pentagonal fivefold to triangular sixfold with considerable disorder, as the
upper part of the density profile at point (F) shows. The transformation of the density
profile, from a lower-packing-density (pentagonal) to a higher-packing-density structure
(irregular triangular), occurs mostly in the monolayer from points (A) to (B), causing
the largest density increase of the first layer with respect to that of the other layers (see
the end of Section 3.2 for more discussion). Due to the considerable amount of disorder
in the final state Ne/QC does not satisfy the requirements for the transition as defined
in Section 2.7.
Ar/QC and Kr/QC systems. Figures 3(b) and 4(a) show the evolutions of
Ar/QC and Kr/QC: they are similar to the Ne/QC system. For Ar/QC, the pentagonal
structure at the formation of the first layer is confirmed by the FT showing discrete
spots having tenfold symmetry (point (A)). The quasicrystal symmetry strongly affects
the overlayers’ structures up to the third layer by preventing the adatoms from forming
a triangular lattice (point (E)). This appears, finally, in the lower part of the density
profile at the formation of the fourth layer as confirmed by the FT showing discrete
spots with sixfold symmetry (point (F)). Similarly to the Ne/QC system, disorder does
not disappear but remain present in the middle of the density profile corresponding to

Noble gas films on a decagonal AlNiCo quasicrystal 10
Figure 3. Density profiles and Fourier transforms of the outer layer at T ⋆ = 0.35
for Ne/QC (T = 11.8 K) and Ar/QC (T = 41.7 K), corresponding to points
(A) through (F) of figure 2.

Noble gas films on a decagonal AlNiCo quasicrystal 11
the highest coverage before saturation (point (F)). Similar situation occurs also for the
evolution of Kr/QC as shown in figure 4(a).
Xe/QC system. Figure 4(b) shows the evolution of adsorbed Xe. At the
formation of the first layer, adatoms are arranged in a fivefold ordering similar to that
of the substrate as shown by the discrete spots of the FT having tenfold symmetry
(point (A)). At point (B), the density profile shows a well-defined triangular lattice not
present in the other three systems: the FT shows discrete spots arranged in regular and
equally-spaced concentric hexagons with the smallest containing six clear spots. Thus,
at point (B) and at higher pressures, the Xe overlayers can be considered to have a
regular closed-packed structure with negligible irregularities.
It is interesting to compare the orientation of the hexagons on FT for these four
adsorbed gases at the highest available pressures before saturation (point (F) for Ne, Ar,
and Kr, and point (D) for Xe). We define the orientation angles as the smallest of the
possible clockwise rotations to be applied to the hexagons to obtain one side horizontal,
as shown in figures 3 and 4. Such angles are θr = 6◦, 30◦, 42◦, and 54◦, for adsorbed
Ne, Ar, Kr, and Xe, respectively. These orientations, induced by the fivefold symmetry
of the QC, can differ only by multiples of n · 12◦ [24, 25]. Since hexagons have sixfold
symmetry, our systems can access only five possible orientations (6, 18, 30, 42, 54◦), and
the final angles are determined by the interplay between the adsorbate solid phase lattice
spacing, the periodic simulation cell size, and the potential corrugation. For systems
without periodic boundary conditions, the ground state has been found to be fivefold
degenerate, as should be the case [24, 25].
In every system, the increase of the density for each layer is strongly correlated to
the commensurability with its support: the more similar they are, the more flat the
adsorption isotherm will be (note that the support for the (N + 1)th-layer is the N th-
layer). For example, the Xe/QC system has an almost perfect hexagonal structure at
point (B) (due to its first-order five to sixfold ordering transition as described in the
next section). Hence, all the further overlayers growing on the top of the monolayer will
be at least “as regular” as the first layer, and have the negligible density increase as
listed in table 3.
3.3. Order parameters
The evolution of the order parameter ρ5−6 is shown in figure 5 as a function of the
normalized chemical potential, µ⋆, at T ⋆=0.35 for all the noble gases/QC systems.
Ne/QC, Ar/QC, and Kr/QC systems. The ρ5−6 plots for the first four
layers observed before bulk condensation are shown in panels (a)−(c). As the chemical
potential µ⋆ increases, ρ5−6 decreases continuously reaching a constant value only for
Kr/QC. At bulk condensation, the values of ρ5−6 are still high, approximately 0.35 ∼
0.45. Data at higher temperatures shows a similar behavior (up to T=24 K (T ⋆=0.71)
for Ne, T =70 K (T ⋆=0.58) for Ar, and T=90 K (T ⋆=0.53) for Kr). Thus, we conclude
that these systems do not undergo the ordering transition.

Noble gas films on a decagonal AlNiCo quasicrystal 12
Figure 4. Density profiles and Fourier transforms of the outer layer at T ⋆ = 0.35
for of Kr/QC (T = 59.6 K) and Xe/QC (T = 77 K), corresponding to points
(A) through (F) of figure 2.
Noble gas films on a decagonal AlNiCo quasicrystal 13
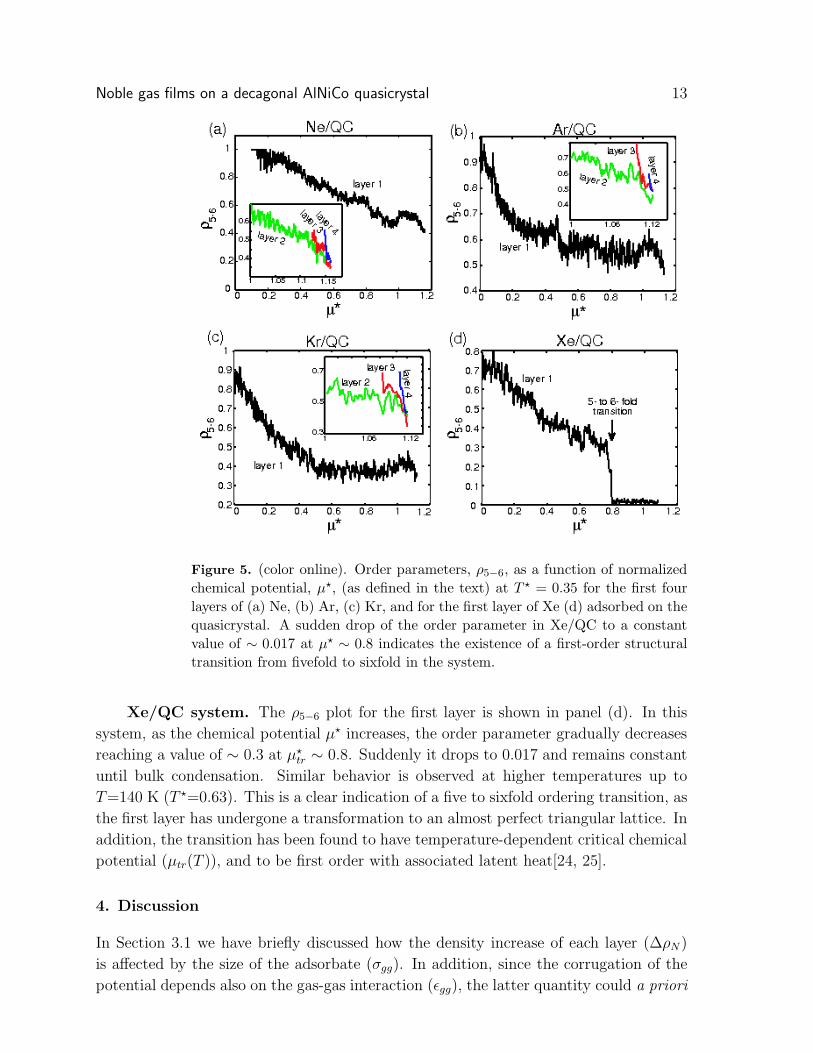
Figure 5. (color online). Order parameters, ρ5−6, as a function of normalized
chemical potential, µ⋆, (as defined in the text) at T ⋆ = 0.35 for the first four
layers of (a) Ne, (b) Ar, (c) Kr, and for the first layer of Xe (d) adsorbed on the
quasicrystal. A sudden drop of the order parameter in Xe/QC to a constant
value of ∼ 0.017 at µ⋆ ∼ 0.8 indicates the existence of a first-order structural
transition from fivefold to sixfold in the system.
Xe/QC system. The ρ5−6 plot for the first layer is shown in panel (d). In this
system, as the chemical potential µ⋆ increases, the order parameter gradually decreases
reaching a value of ∼ 0.3 at µ⋆tr ∼ 0.8. Suddenly it drops to 0.017 and remains constant
until bulk condensation. Similar behavior is observed at higher temperatures up to
T=140 K (T ⋆=0.63). This is a clear indication of a five to sixfold ordering transition, as
the first layer has undergone a transformation to an almost perfect triangular lattice. In
addition, the transition has been found to have temperature-dependent critical chemical
potential (µtr(T )), and to be first order with associated latent heat[24, 25].
4. Discussion
In Section 3.1 we have briefly discussed how the density increase of each layer (∆ρN )
is affected by the size of the adsorbate (σgg). In addition, since the corrugation of the
potential depends also on the gas-gas interaction (ǫgg), the latter quantity could a priori

Noble gas films on a decagonal AlNiCo quasicrystal 14
have an effect on the density increase. To decouple the effects of σgg and ǫgg on ∆ρN we
calculate ∆ρN while keeping one parameter constant, σgg or ǫgg, and varying the other.
For this purpose, we introduce two fictitious gases iNe(1) and dXe(1), which represent
“inflated” or “deflated” versions of Ne and Xe, respectively (parameters are defined in
equations 9-12 and listed in tables 1 and 2). Then we perform four tests summarized as
the following:
(1) constant strength ǫgg, size σgg increases [Ne→iNe(1)]: ∆ρN reduces,
(2) constant strength ǫgg, size σgg decreases [Xe→dXe(1)]: ∆ρN increases,
(3) constant size σgg, strength ǫgg decreases [Xe→iNe(1)]: ∆ρN ∼ constant,
(4) constant size σgg, strength ǫgg increases [Ne→dXe(1)]: enhanced agglomeration.
Figure 6 shows the adsorption isotherms at T ⋆=0.35 for Ne, iNe(1), Xe, and dXe(1) on
the QC. By keeping the strength constant and varying the size of the adsorbates, tests 1
and 2 ([Ne→iNe(1)] and [Xe→dXe(1)]), we find that we can reduce or increase the value
of the density increase (when ∆ρN decreases the continuous growth tends to become
stepwise and vice versa). These two tests indicate that the larger the size, the smaller the
∆ρN . By keeping the size constant and decreasing the strength, test 3 ([Xe→iNe(1)]), we
find that ∆ρN does not change appreciably. An interesting phenomenon occurs in test
4 where we keep the size constant and increase the strength ([Ne→dXe(1)]). In this test
the film’s growth loses its step-like shape. We suspect that this is caused by an enhanced
agglomeration effect as follows. Ne and dXe(1) have the same size which is the smallest
of the simulated gases, allowing them to easily follow the substrate corrugation, in which
case, the corrugation helps to bring adatoms closer to each other [32] (agglomeration
effect). The stronger gas-gas self interaction of dXe(1) compared to Ne will further
enhance this agglomeration effect, resulting in a less stepwise film growth of dXe(1) than
Ne. As can be seen, dXe(1) grows continuously, suggesting a strong enhancement of
the agglomeration. In summary, the last two tests (3 and 4) indicate that the effect of
varying the interaction strength of the adsorbates (while keeping the size constant) is
negligible on large gases but significant on small gases.
Strength ǫgg and size σgg of the adsorbates also affect the existence of the first-order
transition (present in Xe/QC, but absent in Ne/QC, Ar/QC, and Kr/QC). Hence we
perform the same four tests described before and observe the evolution of the order
parameter. The results are the following:
(1) constant strength ǫgg, size σgg increases [Ne→iNe(1)]: transition appears,
(2) constant strength ǫgg, size σgg decreases [Xe→dXe(1)]: transition disappears,
(3) constant size σgg, strength ǫgg decreases [Xe→iNe(1)]: transition remains,
(4) constant size σgg, strength ǫgg increases [Ne→dXe(1)]: no transition appears.
The strength ǫgg has no effect on the existence of the transition (tests 3 and 4), which
instead is controlled by the size of the adsorbates (tests 1 and 2). To further characterize
such dependence, we add three additional fictitious gases with the same strength ǫgg of
Xe but different sizes σgg. The three gases are denoted as dXe(2), iXe(1), and iXe(2)

Noble gas films on a decagonal AlNiCo quasicrystal 15
Figure 6. (color online). Computed adsorption isotherms for Ne, Xe, iNe(1),
and dXe(1) on the quasicrystal at T ⋆=0.35. iNe(1) and dXe(1) are fictitious
noble gases having potential parameters described in the text and in tables 1
and 2. The effect of varying the interaction strength of the adsorbates on the
density increase ∆ρN (while keeping the size constant) is negligible on large
gases but significant on small gases.
(the prefixes d- and i- stand for deflated and inflated, respectively). The interaction
parameters, defined in the following equations, are listed in tables 1 and 2:
{ǫgg, Dgs, σgg} [dXe(2)] ≡ {ǫgg, Dgs, 0.95σgg}[Xe], (15)
{ǫgg, Dgs, σgg}[iXe(1)] ≡ {ǫgg, Dgs, 1.34σgg}[Xe], (16)
{ǫgg, Dgs, σgg}[iXe(2)] ≡ {ǫgg, Dgs, 1.65σgg}[Xe]. (17)
Figure 7 shows the evolutions of the order parameter as a function of the normalized
chemical potential for the first layer of dXe(2), iNe(1), iXe(1), and iXe(2) adsorbed on the
QC at T ⋆=0.35. All these systems undergo a transition, except dXe(2)/QC, i.e. the
transition occurs only in systems with σgg ≥ σgg[Xe] indicating the existence of a critical
value for the appearance of the phenomenon. Furthermore, as σgg increases (iNe(1) →
iXe(1) → iXe(2)), the transition shifts towards smaller critical chemical potentials.
The critical value of σgg can be related to the characteristic length of the QC by
introducing a gas-QC mismatch parameter defined as
δm ≡k · σgg − λr
λr
. (18)
where k = 0.944 is the distance between rows in a close-packed plane of a bulk LJ gas
(calculated at T = 0 K with σ = 1 [39]), and λr is the characteristic spacing of the

Noble gas films on a decagonal AlNiCo quasicrystal 16
Figure 7. (color online). Order parameters as a function of normalized chemical
potential (as defined in the text) for the first layer of dXe(2), iNe(1), iXe(1), and
iXe(2) adsorbed on the quasicrystal at T ⋆ = 0.35. A first-order fivefold to sixfold
structural transition occurs in the last three systems, but not in dXe(2)/QC.
QC, determined from the momentum transfer analysis of LEED patterns [31] (our QC
surface has λr=0.381 nm [31]). With such ad hoc definition, δm measures the mismatch
between an adsorbed {111} fcc plane of adatoms and the QC surface. In table 4 we
show that δm perfectly correlates with the presence of the transition in our test cases
(transition exists ⇔ δm > 0).
Table 4. Summary of adsorbed noble gases on the QC that undergo a first-order
fivefold to sixfold structural transition and those that do not.
δm transition
Ne -0.311 No
Ar -0.158 No
Kr -0.108 No
Xe 0.016 Yes
iNe(1) 0.016 Yes
dXe(1) -0.311 No
dXe(2) -0.034 No
iXe(1) 0.363 Yes
iXe(2) 0.672 Yes
k = 0.944 [39]
λr = 0.381 nm [31]
δm ≡ (k · σgg − λr)/λr
The definition of a gas-QC mismatch parameter is not unique. For example, one
can substitute k · σgg with the first NN distance of the bulk gas, and λr with one of the

Noble gas films on a decagonal AlNiCo quasicrystal 17
following characteristic lengths: a) side length of the central pentagon in the potential
plots in fig. 1 (λs = 0.45nm), b) distance between the center of the central pentagon
and one of its vertices (λc = 0.40nm), c) L = τ · S = 0.45 nm, where τ = 1.618 is the
golden ratio of the QC and S = 0.243 nm is the side length of the rhombic Penrose tiles
[28]. Although there is no a priori reason to choose one definition over the others, the
one that we select (equation 18) has the convenience of being perfectly correlated with
the presence of the transition, and of using reference lengths commonly determined in
experimental measurements (λr) or quantities easy to extract (k · σgg).
In figure 1 we can observe that near the center of each potential there is a set of
five points with the highest binding interaction (the dark spots constituting the central
pentagons). A real QC surface contains an infinite number of these very attractive
positions which are located at regular distances and with five fold symmetry. Due to
the limited size and shape of the simulation cell, our surface contains only one set
of these points. Therefore, it is of our concern to check if the results regarding the
existence of the transition are real or artifacts of the method. We perform simulation
tests by mitigating the effect of the attractive spots through a Gaussian smoothing
function which reduces the corrugation of the original potential. The definitions are the
following:
G(x, y, z) ≡ AGe−(x2+y2+z2)/2σ2G , (19)
V (z) ≡ 〈V (x, y, z)〉(x,y) , (20)
Vmod(x, y, z) ≡ V (x, y, z) · [1 − G(x, y, z)] + V (z) · G(x, y, z). (21)
where G(x, y, z) is the Gaussian smoothing function (centered on the origin and with
parameters AG and σG), V (z) is the average over (x, y) of the original potential
V (x, y, z), and Vmod(x, y, z) is the final smoothed interaction. An example is shown
in figure 8(a) where we plot the minimum of the adsorption potential for a Ne/QC
modified interaction (smoothed using AG = 0.5 and σG = 0.4 nm). In addition, in panel
(b) we show the variations of the minimum adsorption potentials along line x = 0 for
the modified and original interactions (solid and dotted curves, respectively).
Using the modified interactions (with AG = 0.5 and σG = 0.4 nm) we simulate
all the noble gases of table 4. The results regarding the phase transition on modified
surfaces do not differ from those on unmodified ones, confirming that the observed
transition behavior is a consequence of competing interactions between the adsorbate
and the whole QC substrate rather than just depinning of the monolayer epitaxially
nucleated. Therefore, the simple criterion for the existence of the transition (δm > 0)
might also be relevant for predicting such phenomena on other decagonal quasicrystal
substrates.
5. Conclusions
We have presented the results of GCMC simulations of noble gas films on QC. Ne, Ar,
Kr, and Xe grow layer-by-layer at low temperatures up to several layers before bulk

Noble gas films on a decagonal AlNiCo quasicrystal 18
Figure 8. (color online). (a) The minimum of adsorption potential, Vmin(x, y),
for Ne on a smoothed QC as described in the text. (b) The variations of the
minimum adsorption potentials along the line at x = 0 shown in (a), for the
modified and original interactions (solid and dotted curves).
condensation. We observe interesting phenomena that can only be attributed to the
quasicrystallinity and/or corrugation of the substrate, including structural evolution
of the overlayer films from commensurate pentagonal to incommensurate triangular,
substrate-induced alignment of the incommensurate films, and density increase in each
layer with the largest one observed in the first layer and in the smallest gas. Two-
dimensional quasicrystalline epitaxial structures of the overlayer form in all the systems
only in the monolayer regime and at low pressure. The final structure of the films is a
triangular lattice with a considerable amount of defects except in Xe/QC. Here a first-
order transition occurs in the monolayer regime resulting in an almost perfect triangular
lattice. The subsequent layers of Xe/QC have hexagonal close-packed structures. By
simulating fictitious systems with various sizes and strengths, we find that the dimension
of the noble gas, σgg, is the most crucial parameter in determining the existence of the
phenomenon which is found only in systems with σgg ≥ σgg[Xe]. The results of this study
will be investigated in future experiments carried out in this laboratory, analogous to
those already performed with Xe.
This work stimulates more comprehensive studies of adsorption heterogeneities on
QC to understand the fundamental factors controlling the structure of single-element
films by elucidating phenomena that are due exclusively to the quasiperiodicity of the
substrate, as opposed to chemical interactions between the adsorbates and the surface.
Acknowledgments
We wish to acknowledge helpful discussions with L W Bruch, M Widom, A N
Kolmogorov, C Henley, L Howle, D Rabson and R A Trasca. We acknowledge the San
Diego Supercomputer Center for computing time under Proposal Number MSS060002.
This research was supported by NSF grant DMR-0505160.

Noble gas films on a decagonal AlNiCo quasicrystal 19
References
[1] Schick M 1981 Progress in Surf. Sci. 11 245
[2] Bruch L W, Cole M W and Zaremba E 1997 Physical Adsorption (Oxford: Oxford U P)
[3] Sander L M and Hautman J 1984 Pys. Rev. B 29 2171
[4] Fairobent D K, Saam W F and Sander L M 1982 Phys. Rev. B 26 179
[5] Smith A R, Chao K-J, Niu Q and Shih C K 1996 Science 273 226
[6] Ebert P, Chao K-J, Niu Q and Shih C K 1996 Phys. Rev. Lett. 83 3222
[7] Grimm B, Hovel H, Pollmann M and Reihl B 1999 Phys. Rev. Lett. 83 991
[8] Leatherman G S and Diehl R D 1996 Phys. Rev. B 53 4939
[9] Leatherman G S, Karimi M, Vidali D and Diehl R D 1997 Phys. Rev. B 56 6970
[10] D’Amico K L, Moncton D E, Specht E D, Birgeneau R J, Nagler S E and Horn P M 1984 Phys.
Rev. Lett. 53 2250
[11] Fain Jr S C, Chinn M D and Diehl R D 1980 Phys. Rev. B 21 4170
[12] Novaco A D and McTague J P 1977 Phys. Rev. Lett. 38 1286
[13] Tkatchenko A Phys. Rev. B 2006 74 035428
[14] Noakes T C Q, Bailey P, Draxler M, McConville C F, Ross A R, Lograsso T A, Leung L, Smerdon
J A and McGrath R 2006 J. Phys.: Condens. Matt. 18 5017
[15] Cai T, Ledieu J, McGrath R, Fournee V, Lograsso T, Ross A and Thiel P 2003 Surf. Sci. 526 115
[16] Ledieu J, Hoeft J T, Reid D E, Smerdon J A, Diehl R D, Lograsso T A, Ross A R and McGrath
R 2004 Phys. Rev. Lett. 92 135507
[17] McGrath, Ledieu J, Cox E J and Diehl R D 2002 J. Phys.: Condens. Matt. 14 R119
[18] Fournee V, Sharma H R, Shimoda M, Tsai A P, Unal B, Ross A R, Lograsso T A and Thiel P A
2005 Phys. Rev. Lett. 95 155504
[19] Franke K J, Sharma H R, Theis W, Gille P, Ebert Ph and Rieder K H 2002 Phys Rev. Lett. 89
156104
[20] Bolliger B, Dmitrienko V E, Erbudak M, Luscher R and Nissen H -U 2001 Phys. Rev. B 63 052203
[21] Fournee V, Cai T C, Ross A R, Lograsso T A, Evans J W and Thiel P A 2003 Phys. Rev. B 67
033406
[22] Curtarolo S, Setyawan W, Ferralis N, Diehl R D and Cole M W 2005 Phys. Rev. Lett. 95 136104
[23] Diehl R D, Ferralis N, Pussi K, Cole M W, Setyawan W and Curtarolo S 2006 Phil. Mag. 86 863
[24] Setyawan W, Ferralis N, Diehl R D, Cole M W and Curtarolo S 2006 Phys. Rev. B 74 125425
[25] R D Diehl, W Setyawan, N Ferralis, R A Trasca, M W Cole and S Curtarolo 2006 Phil. Mag. at
press
[26] Frenkel D and Smith B 2002 Understanding Molecular Simulations: From Algorithms to
Application (New York: Academic)
[27] Allen M P and Tildesley D J 1987 Computer Simulation of Liquids (Oxford: Oxford U P)
[28] Ferralis N, Pussi K, Gierer M, Cox E J, Ledieu J, Fisher I R, Jenks C J, Lindroos M, McGrath R
and Diehl R D 2004 Phys. Rev. B 69 153404
[29] Pussi K, Ferralis N, Mihalkovic M, Widom M, Curtarolo S, Gierer M, Jenks C J, Fisher I R and
Diehl R D 2006 Phys. Rev. B 73 184203
[30] Bojan M J, Stan G, Curtarolo S, Steele W A and Cole M W 1999 Phys. Rev. E 59 864
[31] Ferralis N, Diehl R D, Pussi K, Lindroos M, Fisher I R and Jenks C J 2004 Phys. Rev. B 69
075410
[32] Trasca R A, Ferralis N, Diehl R D and Cole M W 2004 J. Phys.: Condens. Matt. 16 S2911
[33] Reference [2]: p. 67.
[34] Zeppenfeld P 2001 Physics of Covered Surfaces in Landolt-Bornstein New Series Group III 42 ed
Bonzel H P (Berlin: Springer) p 67
[35] Vidali G, Ihm G, Kim H -Y and Cole M W 1991 Surf. Sci. Rep. 12 135
[36] Curtarolo S, Stan G, Cole M W, Bojan M J and Steele W A 1999 Phys. Rev. E 59 4402
[37] Curtarolo S, Stan G, Bojan M J, Cole M W and Steele W A 2000 Phys. Rev. E 61 1670

Noble gas films on a decagonal AlNiCo quasicrystal 20
[38] Crawford R K 1977 Rare Gas Solids 2 ed Klein M L and Venables J A (London: Academic) p 663
[39] Bruch L W, Cohen P I and Webb M B 1976 Surf. Sci. 59 1