THE "BIG FIVE" PERSONALITY FACTORS IN THE IPI AND MMPI: PREDICTORS OF POLICE PERFORMANCE
Upload
khangminh22Category
view
3download
0
IPI Research Topics No. 20
Potassium Status andCrop Response to Potassiumon the Soils of AgroecologicalRegions of India
2nd revised edition
2011
INTERNATIONALPOTASH INSTITUTE
IPI Research Topics No. 20 2nd revised edition
Potassium Status and
Crop Response to Potassium
on the Soils of Agroecological
Regions of India
A. Subba Rao
Indian Institute of Soil Science
Nabi Bagh, Berasia Road
Bhopal-462 038
Madhya Pradesh
India
Ch. Srinivasarao
Central Research Institute for Dryland Agriculture
Santoshnagar
Hyderabad-500 059
Andhra Pradesh
India
S. Srivastava
Indian Institute of Soil Science
Nabi Bagh, Berasia Road
Bhopal-462 038
Madhya Pradesh
India
2
Citation: Subba Rao, A., Ch. Srinivasarao, and S. Srivastava. 2010.
Potassium Status and Crop Response to Potassium on the Soils of
Agroecological Regions of India. IPI Research Topics No. 20, International
Potash Institute, Horgen, Switzerland, 185 p.
© All rights held by: International Potash Institute
Baumgärtlistrasse 17
P.O. Box 569
CH-8810 Horgen, Switzerland
Tel: +41 43 810 49 22
Fax: +41 43 810 49 25
E-mail: [email protected]
www.ipipotash.org
2011
ISBN 978-3-905887-02-0
DOI 10.3235/978-3-905887-02-0
Printing: Imprimerie de Saint-Louis, France
Layout: Martha Vacano, IPI, Horgen/Switzerland
Foreword to the 2nd
Revised Edition
Agriculture is the back bone of Indian economy with about two thirds of the
population residing in rural areas directly or associated it for their livelihood
and contributing to 19% of the Gross Domestic Product. With the initiation
of green revolution in late seventies, India has made remarkable progress in
food security, poverty reduction and per capita income. Even though India
has made considerable progress over the years in increasing the food grain
production to a recent 231 mt in 2007-2008, the performance over the last ten
years has been unsatisfactory. The growth rate in agriculture has not kept
pace with the phenomenal growth rate in industrial and services sectors.
Obviously a concerted effort is required to improve the condition of Indian
Agriculture, which involves policy intervention, frontier research, public-
private partnership, and involvement of farmers at different stages starting
from technology generation to its adoption. Soil fertility and its evaluation is
one area which needs immediate attention since it is now established that an
arrest in the productivity of several crops is due to ever decreasing soil
fertility on one hand and an imbalanced application of plant nutrients on the
other. The deficiency of several major and minor plant nutrients such as K, S,
Ca, Zn. Fe and B are emerging in time and space. Among the essential plant
nutrients, potassium assumes greater significance since it is required in
relatively larger quantities by plants and besides increasing the yield, it
immensely improves the quality of the crop produce.
The three estimates (Ramamurthy and Bajaj, 1967; Hasan and Ghosh, 1979;
Motsara, 2002) of soil fertility for K based on information generated from
soil testing laboratories in the country indicated discrepancies in the
percentage of samples testing high, though the overall soil K fertility
declined. It could quite possibly be due to poor representative character of
sampling, noncognizance of pedological classification of soils, and lack of
control over the choice of sampling sites. It is worthwhile to note that even in
the most progressive states like Punjab and Haryana, the two big contributors
to the national buffer stock, have the most skewed N:P2O5:K2O ratios. The
focus has been on nitrogen followed by phosphorus and very little potassium
application resulting in a huge imbalance. In the year 2020, the deficit of K in
Indian agriculture has been projected to be around 8.1 million tonnes/annum
while the estimates of N and P balances are positive. There is obviously an
urgent need in delineating the K deficient areas and expected responses both
in terms of quantity and quality in different agroclimatic regions of the
country.
The first attempt in this direction was made way back in 1996 in the form of
a publication “Potassium Status and Crop Response to Potassium on the Soils
3
4
of Agroecological Regions of India” brought out by International Potash
Institute, Switzerland. Since then, however, significant changes have taken
place both in the available information on the subject and agricultural
evolution as a whole. The revision of the bulletin is therefore, timely and
much needed. This revised edition gives state-of-the-art information on K
status and the responses to applied K in different agroclimatic zones of the
country. The new edition has also incorporated the frontier concepts in K
fertility assessment and the possibility of obtaining the K responses to
applied fertilizer K. This involves incorporating the salient findings on K
release rates, interrelationship between K replenishment rates and clay
mineralogy, characterization of soil K based on K supplying minerals, which
is primarily biotite mica, and characterization of soils based on non-
exchangeable K release. I am confident that this information will go a long
way in the better understanding and assessment of the K status of soils and
correction of K deficiencies in the important agricultural production zones
leading to a significant enhancement in crop productivity. I am sure this
revised edition will be of immense help for all the stakeholders be it planners,
researchers, fertilizer industries, other related business enterprises and finally
the educated and innovative farmers.
I compliment the International Potash Institute, Switzerland for this timely
initiative in bringing out the revised edition of the bulletin. The authors
deserve special appreciation for working hard in compiling all the
information and presenting it in a meaningful manner.
A.K. Singh
Deputy Director General (NRM)
Indian Council of Agricultural Research
5
Contents Page
Foreword to the 2nd
Revised Edition ........................................................... 3
List of Tables …… ........................................................................................ 6
List of Figures …. ......................................................................................... 9
1. Introduction .. ..................................................................................... 11
1.1. Agroecological regions of India (see also Map 1.1, page 14) .............. 12
2. Properties of Soils in the Agroecological Regions of India ............. 15
3. Potassium Status of Soils ................................................................... 57
4. New Concepts in Soil K Fertility ....................................................... 94
4.1. Release rates ......................................................................................... 94
4.2. Step and constant K rates ..................................................................... 96
4.3. K replenishment rate and clay mineralogy ........................................... 96
4.4. Sub soil potassium ................................................................................ 97
4.5. Minimal exchangeable K ...................................................................... 98
4.6. Categorization of soils based on biotite ................................................ 98
4.7. Categorization of soils based on potassium reserves:
Implication in K management .............................................................109
5. Predominant Crops and Cropping Systems ....................................118
6. Crop Response to Potassium and Economies of K Application ....122
7. Critical Limits Calculation and K Recommendation .....................158
8. Conclusion …………………………………………………………..164
9. References …………………………………………………………..167
6
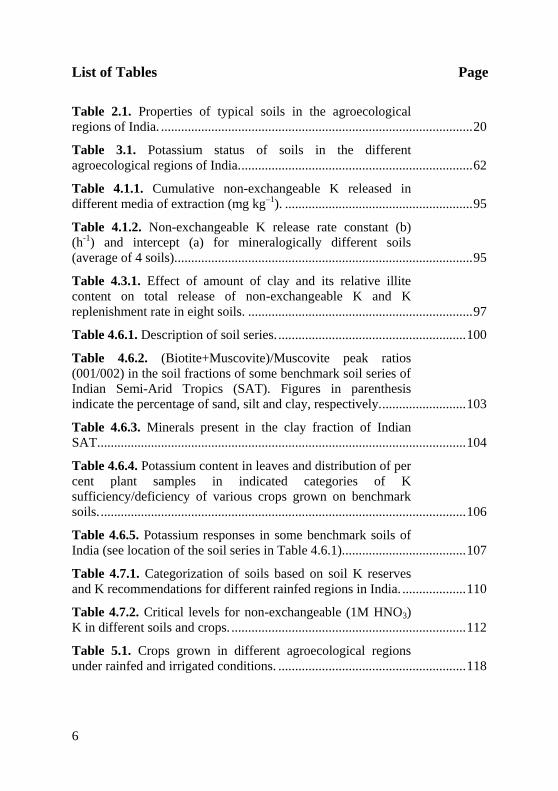
List of Tables Page
Table 2.1. Properties of typical soils in the agroecological
regions of India. ............................................................................................. 20
Table 3.1. Potassium status of soils in the different
agroecological regions of India. ..................................................................... 62
Table 4.1.1. Cumulative non-exchangeable K released in
different media of extraction (mg kg–1). ........................................................ 95
Table 4.1.2. Non-exchangeable K release rate constant (b)
(h-1) and intercept (a) for mineralogically different soils
(average of 4 soils). ........................................................................................ 95
Table 4.3.1. Effect of amount of clay and its relative illite
content on total release of non-exchangeable K and K
replenishment rate in eight soils. ................................................................... 97
Table 4.6.1. Description of soil series. ........................................................ 100
Table 4.6.2. (Biotite+Muscovite)/Muscovite peak ratios
(001/002) in the soil fractions of some benchmark soil series of
Indian Semi-Arid Tropics (SAT). Figures in parenthesis
indicate the percentage of sand, silt and clay, respectively. ......................... 103
Table 4.6.3. Minerals present in the clay fraction of Indian
SAT. ............................................................................................................. 104
Table 4.6.4. Potassium content in leaves and distribution of per
cent plant samples in indicated categories of K
sufficiency/deficiency of various crops grown on benchmark
soils. ............................................................................................................. 106
Table 4.6.5. Potassium responses in some benchmark soils of
India (see location of the soil series in Table 4.6.1). .................................... 107
Table 4.7.1. Categorization of soils based on soil K reserves
and K recommendations for different rainfed regions in India. ................... 110
Table 4.7.2. Critical levels for non-exchangeable (1M HNO3)
K in different soils and crops. ...................................................................... 112
Table 5.1. Crops grown in different agroecological regions
under rainfed and irrigated conditions. ........................................................ 118
7
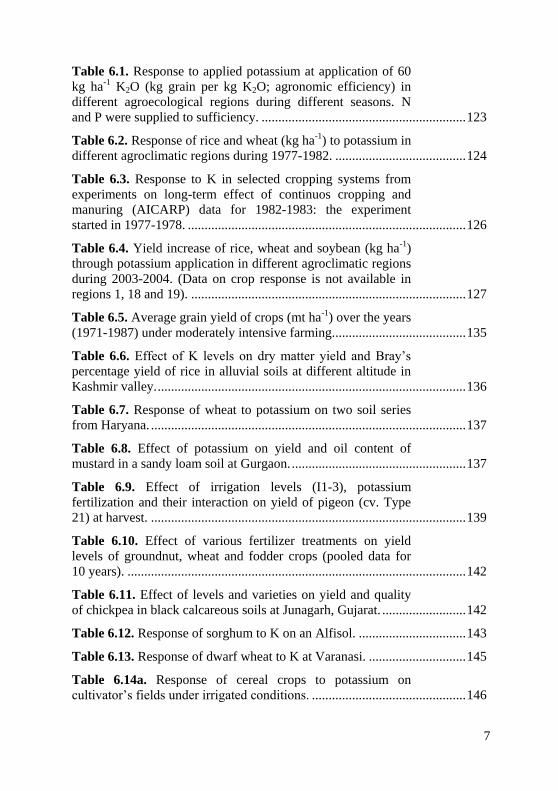
Table 6.1. Response to applied potassium at application of 60
kg ha-1 K2O (kg grain per kg K2O; agronomic efficiency) in
different agroecological regions during different seasons. N
and P were supplied to sufficiency. ............................................................. 123
Table 6.2. Response of rice and wheat (kg ha-1) to potassium in
different agroclimatic regions during 1977-1982. ....................................... 124
Table 6.3. Response to K in selected cropping systems from
experiments on long-term effect of continuos cropping and
manuring (AICARP) data for 1982-1983: the experiment
started in 1977-1978. ................................................................................... 126
Table 6.4. Yield increase of rice, wheat and soybean (kg ha-1)
through potassium application in different agroclimatic regions
during 2003-2004. (Data on crop response is not available in
regions 1, 18 and 19). .................................................................................. 127
Table 6.5. Average grain yield of crops (mt ha-1) over the years
(1971-1987) under moderately intensive farming. ....................................... 135
Table 6.6. Effect of K levels on dry matter yield and Bray’s
percentage yield of rice in alluvial soils at different altitude in
Kashmir valley. ............................................................................................ 136
Table 6.7. Response of wheat to potassium on two soil series
from Haryana. .............................................................................................. 137
Table 6.8. Effect of potassium on yield and oil content of
mustard in a sandy loam soil at Gurgaon. .................................................... 137
Table 6.9. Effect of irrigation levels (I1-3), potassium
fertilization and their interaction on yield of pigeon (cv. Type
21) at harvest. .............................................................................................. 139
Table 6.10. Effect of various fertilizer treatments on yield
levels of groundnut, wheat and fodder crops (pooled data for
10 years). ..................................................................................................... 142
Table 6.11. Effect of levels and varieties on yield and quality
of chickpea in black calcareous soils at Junagarh, Gujarat. ......................... 142
Table 6.12. Response of sorghum to K on an Alfisol. ................................ 143
Table 6.13. Response of dwarf wheat to K at Varanasi. ............................. 145
Table 6.14a. Response of cereal crops to potassium on
cultivator’s fields under irrigated conditions. .............................................. 146
8
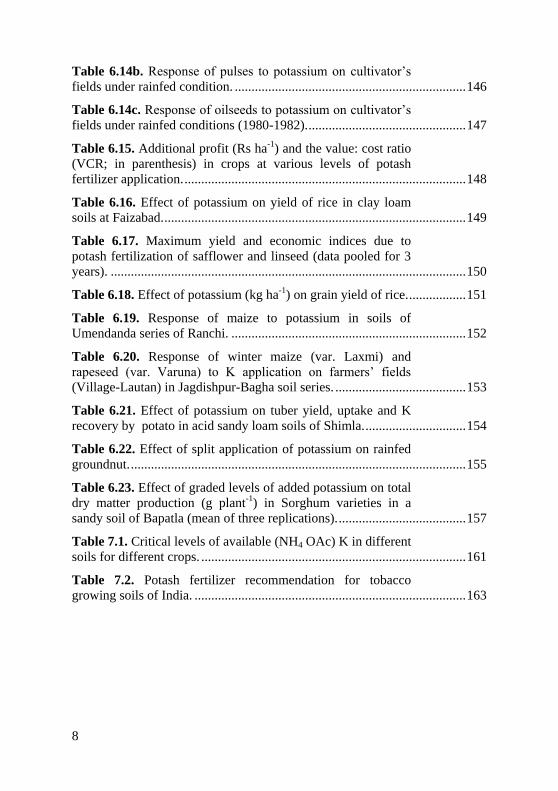
Table 6.14b. Response of pulses to potassium on cultivator’s
fields under rainfed condition. ..................................................................... 146
Table 6.14c. Response of oilseeds to potassium on cultivator’s
fields under rainfed conditions (1980-1982). ............................................... 147
Table 6.15. Additional profit (Rs ha-1) and the value: cost ratio
(VCR; in parenthesis) in crops at various levels of potash
fertilizer application. .................................................................................... 148
Table 6.16. Effect of potassium on yield of rice in clay loam
soils at Faizabad. .......................................................................................... 149
Table 6.17. Maximum yield and economic indices due to
potash fertilization of safflower and linseed (data pooled for 3
years). .......................................................................................................... 150
Table 6.18. Effect of potassium (kg ha-1) on grain yield of rice. ................. 151
Table 6.19. Response of maize to potassium in soils of
Umendanda series of Ranchi. ...................................................................... 152
Table 6.20. Response of winter maize (var. Laxmi) and
rapeseed (var. Varuna) to K application on farmers’ fields
(Village-Lautan) in Jagdishpur-Bagha soil series. ....................................... 153
Table 6.21. Effect of potassium on tuber yield, uptake and K
recovery by potato in acid sandy loam soils of Shimla. .............................. 154
Table 6.22. Effect of split application of potassium on rainfed
groundnut. .................................................................................................... 155
Table 6.23. Effect of graded levels of added potassium on total
dry matter production (g plant-1) in Sorghum varieties in a
sandy soil of Bapatla (mean of three replications). ...................................... 157
Table 7.1. Critical levels of available (NH4 OAc) K in different
soils for different crops. ............................................................................... 161
Table 7.2. Potash fertilizer recommendation for tobacco
growing soils of India. ................................................................................. 163
9
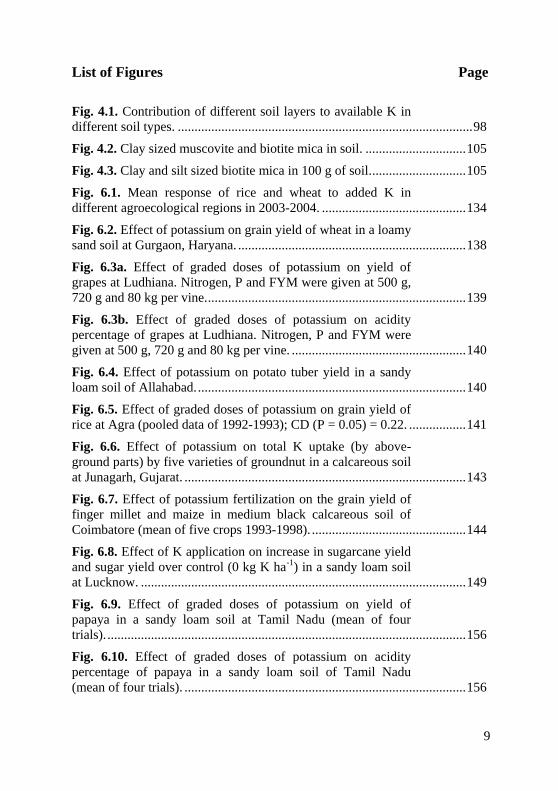
List of Figures Page
Fig. 4.1. Contribution of different soil layers to available K in
different soil types. ........................................................................................ 98
Fig. 4.2. Clay sized muscovite and biotite mica in soil. .............................. 105
Fig. 4.3. Clay and silt sized biotite mica in 100 g of soil. ............................ 105
Fig. 6.1. Mean response of rice and wheat to added K in
different agroecological regions in 2003-2004. ........................................... 134
Fig. 6.2. Effect of potassium on grain yield of wheat in a loamy
sand soil at Gurgaon, Haryana. .................................................................... 138
Fig. 6.3a. Effect of graded doses of potassium on yield of
grapes at Ludhiana. Nitrogen, P and FYM were given at 500 g,
720 g and 80 kg per vine. ............................................................................. 139
Fig. 6.3b. Effect of graded doses of potassium on acidity
percentage of grapes at Ludhiana. Nitrogen, P and FYM were
given at 500 g, 720 g and 80 kg per vine. .................................................... 140
Fig. 6.4. Effect of potassium on potato tuber yield in a sandy
loam soil of Allahabad. ................................................................................ 140
Fig. 6.5. Effect of graded doses of potassium on grain yield of
rice at Agra (pooled data of 1992-1993); CD (P = 0.05) = 0.22. ................. 141
Fig. 6.6. Effect of potassium on total K uptake (by above-
ground parts) by five varieties of groundnut in a calcareous soil
at Junagarh, Gujarat. .................................................................................... 143
Fig. 6.7. Effect of potassium fertilization on the grain yield of
finger millet and maize in medium black calcareous soil of
Coimbatore (mean of five crops 1993-1998). .............................................. 144
Fig. 6.8. Effect of K application on increase in sugarcane yield
and sugar yield over control (0 kg K ha-1) in a sandy loam soil
at Lucknow. ................................................................................................. 149
Fig. 6.9. Effect of graded doses of potassium on yield of
papaya in a sandy loam soil at Tamil Nadu (mean of four
trials). ........................................................................................................... 156
Fig. 6.10. Effect of graded doses of potassium on acidity
percentage of papaya in a sandy loam soil of Tamil Nadu
(mean of four trials). .................................................................................... 156
10
Fig. 7.1. The correlation between water-soluble K in the soil to
the wheat grain yield response to K2O ha-1. ................................................. 158
Fig. 7.2. Crop response curve to soil K. ...................................................... 159
11
1. Introduction
Many different types of soil occur in different regions of India. Their
potassium content varies according to parent material, particle size
distribution, degree of weathering and management practices. Potassium
status of illitic soils depends largely on clay mineral content but in smectitic
soils, it depends on the relative abundance of associated minerals and particle
size (Srinivasarao et al, 2006).
Red, lateritic and acidic alluvial soils (Rhodustalfs, Paleustalfs, Haplustalfs,
Haplaquepts, Ustifluvents, Ustochrepts, Dystropepts, Tropaquepts) occur in
the Eastern Ghat, Tamil Nadu uplands, Deccan Plateau, Eastern (Chhota
Nagpur) Plateau, Western Ghat and Coastal Plains. These tend to be low in
exchangeable and non-exchangeable K.
Swell-shrink soils comprising Pellusterts, Chromusterts, and Vertic
Ustochrepts are found in the Central Highlands (Malwa, Budelkhand and
E. Satpura), Gujarat Plains, Kathiawar Peninsula, Daccan, Eastern Ghats:
they are high in exchangeable and medium to high in non-exchangeable K.
Within these regions, there are red soils low to medium in exchangeable and
non-exchangeable K.
A range of alluvial soils (Ustochrepts, Haplustalfs, Ustrothents, Eutrochrepts,
etc.) in the Northern Plains, Central Highlands, Assam and West Bengal
Plains are medium to high in exchangeable and medium to very high in non-
exchangeable K.
Brown forest and podzolic soils (Dystrochrepts and Inceptisols) in the
Western Himalayas are variable (low to high) in both exchangeable and non-
exchangeable K. Coastal alluvial soils (Vertic Halaquepts, Fluventic
Ustochrepts, Udic Chromusterts) in Manipur are high in exchangeable but
low in non-exchangeable K.
The National Bureau of Soil Survey and Land Use Planning established
twenty agroecological regions (AER) based on physiography, soil,
agroclimatic conditions, length of growing season and land use (Map 1.1)
and issues discussed here relate to this classification.
Indian soils have been characterised on the basis of potassium fertility by
Ramamoorthy and Bajaj (1969), Ghosh and Hasan (1976) and Sekhon et al.
(1992). But no comprehensive study of potassium dynamics has been done in
each region. Similarly, there has been no study of important crops or
cropping systems in relation to plant-available K, response to K and K
fertilizer management on a regional basis. Hence in recent years, much
12
research work done on these aspects at several national institutes like Indian
Institutute of Soil Science, Bhopal, Central Research Institute for Dryland
Agriculture, Hyderabad and several other Research Instittues and agricultural
universities in India (Subba Rao and Srinivasa Rao, 1996, Srinivasa Rao
et al., 1997, 1998, 1999, 2000, 2001, 2002, 2004, 2006, 2007, 2010). Present
publication includes the recent information on various aspects of potassium
fertility management in different agroecological regions and production
systems.
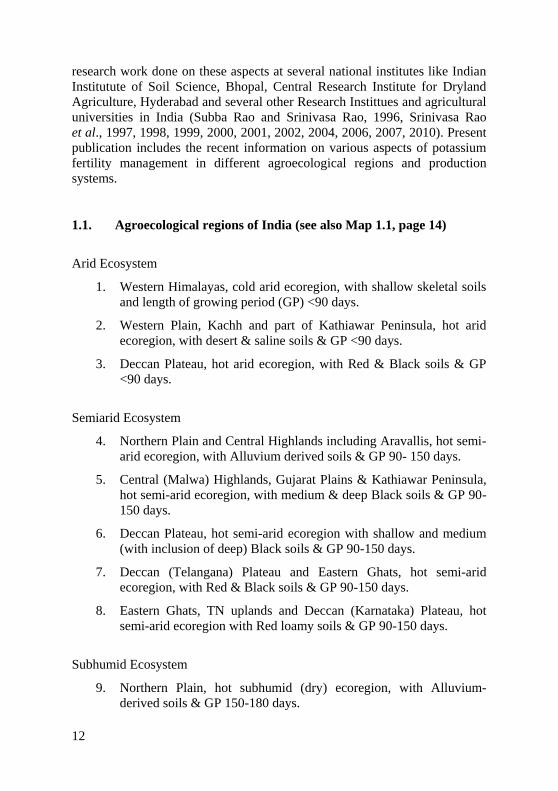
1.1. Agroecological regions of India (see also Map 1.1, page 14)
Arid Ecosystem
1. Western Himalayas, cold arid ecoregion, with shallow skeletal soils
and length of growing period (GP) <90 days.
2. Western Plain, Kachh and part of Kathiawar Peninsula, hot arid
ecoregion, with desert & saline soils & GP <90 days.
3. Deccan Plateau, hot arid ecoregion, with Red & Black soils & GP
<90 days.
Semiarid Ecosystem
4. Northern Plain and Central Highlands including Aravallis, hot semi-
arid ecoregion, with Alluvium derived soils & GP 90- 150 days.
5. Central (Malwa) Highlands, Gujarat Plains & Kathiawar Peninsula,
hot semi-arid ecoregion, with medium & deep Black soils & GP 90-
150 days.
6. Deccan Plateau, hot semi-arid ecoregion with shallow and medium
(with inclusion of deep) Black soils & GP 90-150 days.
7. Deccan (Telangana) Plateau and Eastern Ghats, hot semi-arid
ecoregion, with Red & Black soils & GP 90-150 days.
8. Eastern Ghats, TN uplands and Deccan (Karnataka) Plateau, hot
semi-arid ecoregion with Red loamy soils & GP 90-150 days.
Subhumid Ecosystem
9. Northern Plain, hot subhumid (dry) ecoregion, with Alluvium-
derived soils & GP 150-180 days.
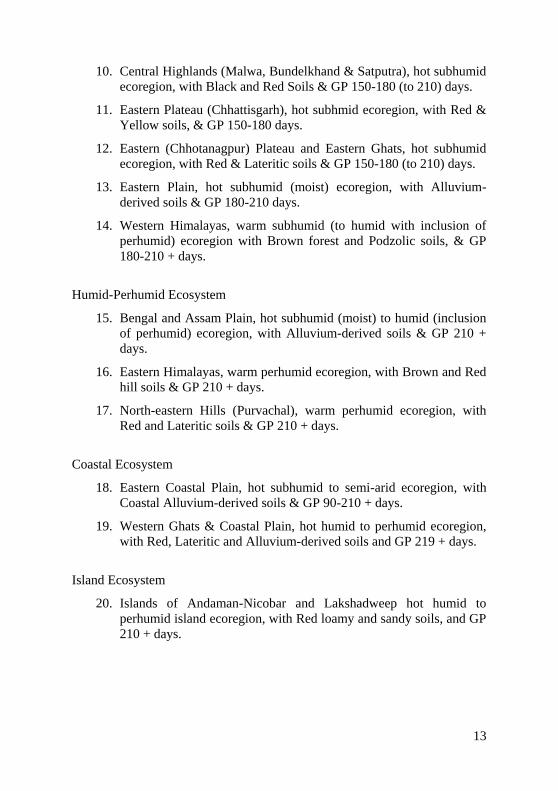
13
10. Central Highlands (Malwa, Bundelkhand & Satputra), hot subhumid
ecoregion, with Black and Red Soils & GP 150-180 (to 210) days.
11. Eastern Plateau (Chhattisgarh), hot subhmid ecoregion, with Red &
Yellow soils, & GP 150-180 days.
12. Eastern (Chhotanagpur) Plateau and Eastern Ghats, hot subhumid
ecoregion, with Red & Lateritic soils & GP 150-180 (to 210) days.
13. Eastern Plain, hot subhumid (moist) ecoregion, with Alluvium-
derived soils & GP 180-210 days.
14. Western Himalayas, warm subhumid (to humid with inclusion of
perhumid) ecoregion with Brown forest and Podzolic soils, & GP
180-210 + days.
Humid-Perhumid Ecosystem
15. Bengal and Assam Plain, hot subhumid (moist) to humid (inclusion
of perhumid) ecoregion, with Alluvium-derived soils & GP 210 +
days.
16. Eastern Himalayas, warm perhumid ecoregion, with Brown and Red
hill soils & GP 210 + days.
17. North-eastern Hills (Purvachal), warm perhumid ecoregion, with
Red and Lateritic soils & GP 210 + days.
Coastal Ecosystem
18. Eastern Coastal Plain, hot subhumid to semi-arid ecoregion, with
Coastal Alluvium-derived soils & GP 90-210 + days.
19. Western Ghats & Coastal Plain, hot humid to perhumid ecoregion,
with Red, Lateritic and Alluvium-derived soils and GP 219 + days.
Island Ecosystem
20. Islands of Andaman-Nicobar and Lakshadweep hot humid to
perhumid island ecoregion, with Red loamy and sandy soils, and GP
210 + days.
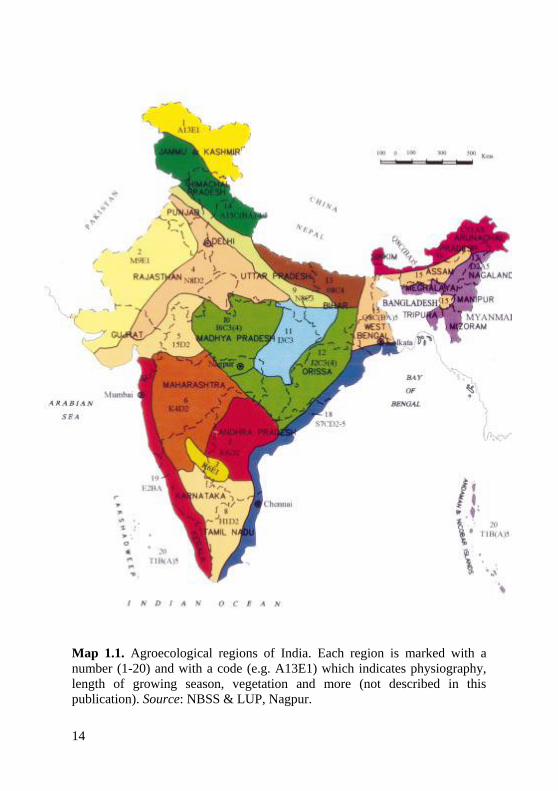
14
Map 1.1. Agroecological regions of India. Each region is marked with a
number (1-20) and with a code (e.g. A13E1) which indicates physiography,
length of growing season, vegetation and more (not described in this
publication). Source: NBSS & LUP, Nagpur.
15
2. Properties of Soils in the Agroecological Regions of India
A brief description of the soils occurring in each of the different regions is
given in Table 2.1. Between 300 to 400 soil samples, broadly representing
the major soil types and cropping systems in each region, were used for this
description.
Agroecological region 1
Most of the soils in this region are classified as Inceptisols covering medium
to deep alluvial soils with varying texture, non-saline, neutral to alkaline in
regions with medium in organic carbon content. The dominant clay mineral is
mica with vermiculite, smectice and cholorite as associate minerals.
Agroecological region 2
The soils in this region are Torripsamments, Torrifluvents, Ustochrepts,
Calciorthids and Haplargids. These are coarse textured, saline/non-saline,
moderately to highly alkaline in reaction and very low to low in organic
matter. They have variable clay mineralogical composition depending upon
the state in which they occur.
Agroecological region 3
The important soil type in this region is shallow to medium deep red soils
belonging to Alfisols. Soils are acidic to neutral in reaction, non-saline and
low in organic matter. Kaolinite is the dominant clay mineral with smectite
and mica as associated minerals.
Agroecological region 4
The important great groups of soils in this area are Ustochrepts and
Haplustalfs followed by Natraqualfs. These are coarse to fine loamy in
texture, neutral to highly alkaline in reaction, calcareous/non-calcareous and
low to high in organic matter. Clay mineralogy is smectitic in Rajasthan and
Gujarat regions and illitic in the IGP of Punjab and Uttar Pradesh.
16
Agroecological region 5
Swell-shrink soils are the dominant group in this region with loam to clayey
Vertic Ustochrepts and clayey Chromusterts. High clay content and smectitic
mineralogy is the main characteristic of these soils. Soils are slightly to
moderately alkaline, both calcareous and non-calcareous and low to high in
organic matter.
Agroecological region 6
Soils in region 6 are also represented by swell-shrink soils with great groups
Ustorthents, Chromusterts, and Ustropepts. Soils are loamy to clayey in
texture (mostly clayey), calcareous, neutral to moderately alkaline and
medium to high in organic matter. The clay mineralogy is dominated by
smectite clay mineral.
Agroecological region 7
In this region, both red and black soils occur with dominant great groups of
Vertic Ustochrepts, Chromusterts, Pellusterts and Paleustalfs. Swell-shrink
soils are neutral to highly alkaline and calcareous whereas red soils are acidic
to neutral, low to medium in organic matter and non-calcareous. The
dominant clay mineralogy is kaolinitic in Alfisols and smectitic in Vertisols.
Agroecological region 8
The soils in this reqion are Ustorthents, Haplustalfs and paleustalfs. These
soils are loamy sand to sand in texture, mostly non-calcareous, slightly acidic
to neutral in reaction and low to medium in organic matter.
Agroecological region 9
The dominant soils representing the northern plains are Ustochrepts and
Haplustalfs. There are some soil groups under orders Entisols and Mollisols
also. These soils are neutral to alkaline and mostly low in organic matter.
Agroecological region 10
In this region, medium and deep black soils are interspersed in patches of red
soil. The dominant great groups are Ustorthrepts, Ustochrepts, Chromusterts
17
and Hapustalfs. Black soils are calcareous, slightly to moderately alkaline
and low to high in organic matter. The soils are fine textured and smectite is
the dominant clay mineral.
Agroecological region 11
The dominant soil groups are medium to deep black soils belonging to Vertic
sub groups, alluvial and red soils in pockets. Soils are neutral and mostly
non-saline and low in organic carbon.
Agroecological region 12
The dominant great groups in this area are Ustochrepts, Haplaquepts and
other red soils. These soils are loamy sand to silt loam, acidic to near neutral,
non-calcareous and low to medium in organic matter.
Agroecological region 13
These are alluvial soils with dominance of Ustifluvents and Eutrochrepts.
These soils are loam to clay loam, neutral to alkaline, highly calcareous and
low to high in organic matter.
Agroecological region 14
These represent brown forest and podzolic soils classified under the great
groups: Eutrochrepts, Dystrochrepts and other acidic brown hill soils. These
are fine textured, acidic to neutral and medium to generally high in organic
matter content.
Agroecological region 15
The dominant soils are acidic alluvial soils and Alfisols represented by
Halaqualfs and Eutrochrepts. These are slightly to strongly acidic, low to
moderate in base status and high in organic matter, have kaolinite and illite as
dominant clay minerals.
18
Agroecological region 16
The soils generally represent Inceptisols, Alfisols, Entisols and Mollisols.
These are loamy to clayey, have acidic reaction and high organic matter.
Agroecological region 17
The major soils are red and lateritic and red and yellow soils. They occur
both at high and low altitudes. They are acidic and high in organic matter.
Agroecological region 18
These are coastal alluvial derived soils classified under Chromusterts, Vertic
Halaquepts, Fluventic Ustochrepts etc. These are medium to fine textured,
acidic to alkaline and low to medium in organic matter.
Agroecological region 19
In this region, red lateritic and alluvial derived soils are dominant. They
belong to great groups: Ustropepts, Fluventic Ustrochrepts and Tropaquepts.
They are kaolinite dominant, acidic, porous, poor in the base status and
fertility and high to very high in organic matter.
Agroecological region 20
These are red loamy soils, sandy soils derived from marine alluvium and
acidic hill soils. They are acidic in nature and low to moderate in their base
saturation.
19
Table 2.1. Properties of typical soils in the agroecological regions of India.
Notes:
(a) Number of agroecological regions or states, or locations sampled.
(b) Calc. = calcareous; Non-calc. = non-calcareous; when there is no
value, it means that no analysis is available.
(c) The symbols used for the minerals are: Amorphous (A), Beidellite
(Be), Calcite (Ca), Chlorite (Ch), Feldspars (F), Illite (I), Kaolinite
(K), Mica (M), Mixed (Mix), Montmorillonite (Mo), Quartz (Q),
Smectite (S) and Vermiculite (V). Numerical value against the
mineral is the content of mineral in percentage; dominance by order.
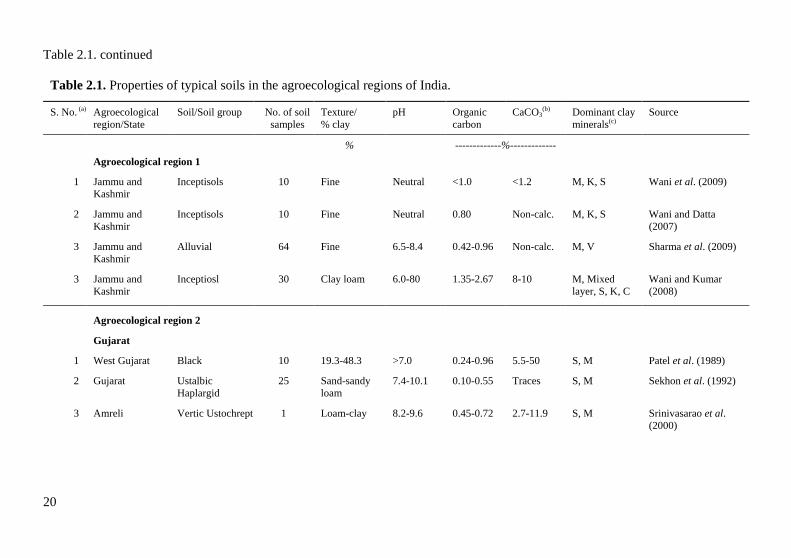
Table 2.1. continued
20
Table 2.1. Properties of typical soils in the agroecological regions of India.
S. No. (a) Agroecological
region/State
Soil/Soil group No. of soil
samples
Texture/
% clay
pH Organic
carbon
CaCO3(b) Dominant clay
minerals(c)
Source
% -------------%-------------
Agroecological region 1
1 Jammu and
Kashmir
Inceptisols 10 Fine Neutral <1.0 <1.2 M, K, S Wani et al. (2009)
2 Jammu and
Kashmir
Inceptisols 10 Fine Neutral 0.80 Non-calc. M, K, S Wani and Datta
(2007)
3 Jammu and
Kashmir
Alluvial 64 Fine 6.5-8.4 0.42-0.96 Non-calc. M, V Sharma et al. (2009)
3 Jammu and
Kashmir
Inceptiosl 30 Clay loam 6.0-80 1.35-2.67 8-10 M, Mixed
layer, S, K, C
Wani and Kumar
(2008)
Agroecological region 2
Gujarat
1 West Gujarat Black 10 19.3-48.3 >7.0 0.24-0.96 5.5-50 S, M Patel et al. (1989)
2 Gujarat Ustalbic
Haplargid
25 Sand-sandy
loam
7.4-10.1 0.10-0.55 Traces S, M Sekhon et al. (1992)
3 Amreli Vertic Ustochrept 1 Loam-clay 8.2-9.6 0.45-0.72 2.7-11.9 S, M Srinivasarao et al.
(2000)
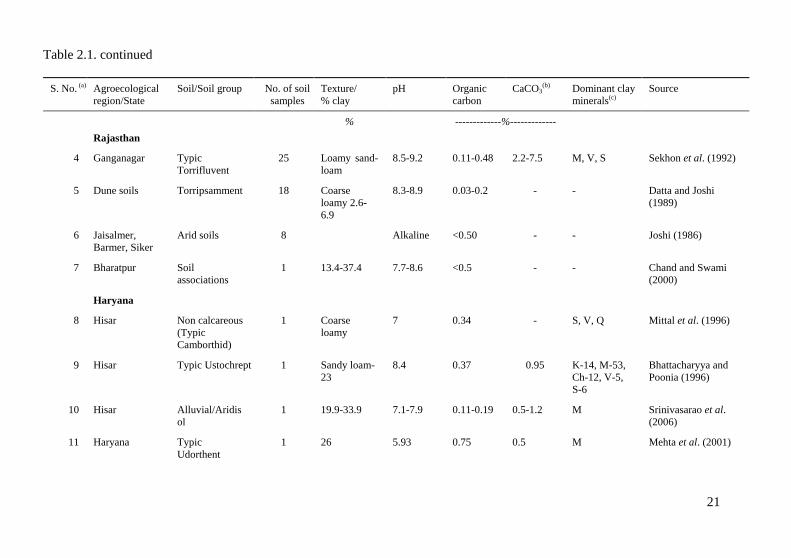
Table 2.1. continued
21
S. No. (a) Agroecological
region/State
Soil/Soil group No. of soil
samples
Texture/
% clay
pH Organic
carbon
CaCO3(b) Dominant clay
minerals(c)
Source
% -------------%-------------
Rajasthan
4 Ganganagar Typic
Torrifluvent
25 Loamy sand-
loam
8.5-9.2 0.11-0.48 2.2-7.5 M, V, S Sekhon et al. (1992)
5 Dune soils Torripsamment 18 Coarse
loamy 2.6-
6.9
8.3-8.9 0.03-0.2 - - Datta and Joshi
(1989)
6 Jaisalmer,
Barmer, Siker
Arid soils 8 Alkaline <0.50 - - Joshi (1986)
7 Bharatpur Soil
associations
1 13.4-37.4 7.7-8.6 <0.5 - - Chand and Swami
(2000)
Haryana
8 Hisar Non calcareous
(Typic
Camborthid)
1 Coarse
loamy
7 0.34 - S, V, Q Mittal et al. (1996)
9 Hisar Typic Ustochrept 1 Sandy loam-
23
8.4 0.37 0.95 K-14, M-53,
Ch-12, V-5,
S-6
Bhattacharyya and
Poonia (1996)
10 Hisar Alluvial/Aridis
ol
1 19.9-33.9 7.1-7.9 0.11-0.19 0.5-1.2 M Srinivasarao et al.
(2006)
11 Haryana Typic
Udorthent
1 26 5.93 0.75 0.5 M Mehta et al. (2001)
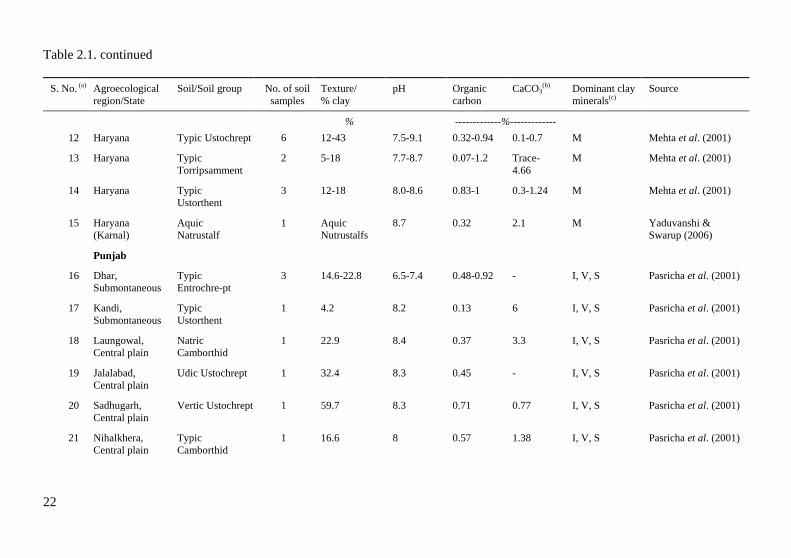
Table 2.1. continued
22
S. No. (a) Agroecological
region/State
Soil/Soil group No. of soil
samples
Texture/
% clay
pH Organic
carbon
CaCO3(b) Dominant clay
minerals(c)
Source
% -------------%-------------
12 Haryana Typic Ustochrept 6 12-43 7.5-9.1 0.32-0.94 0.1-0.7 M Mehta et al. (2001)
13 Haryana Typic
Torripsamment
2 5-18 7.7-8.7 0.07-1.2 Trace-
4.66
M Mehta et al. (2001)
14 Haryana Typic
Ustorthent
3 12-18 8.0-8.6 0.83-1 0.3-1.24 M Mehta et al. (2001)
15 Haryana
(Karnal)
Aquic
Natrustalf
1 Aquic
Nutrustalfs
8.7 0.32 2.1 M Yaduvanshi &
Swarup (2006)
Punjab
16 Dhar,
Submontaneous
Typic
Entrochre-pt
3 14.6-22.8 6.5-7.4 0.48-0.92 - I, V, S Pasricha et al. (2001)
17 Kandi,
Submontaneous
Typic
Ustorthent
1 4.2 8.2 0.13 6 I, V, S Pasricha et al. (2001)
18 Laungowal,
Central plain
Natric
Camborthid
1 22.9 8.4 0.37 3.3 I, V, S Pasricha et al. (2001)
19 Jalalabad,
Central plain
Udic Ustochrept 1 32.4 8.3 0.45 - I, V, S Pasricha et al. (2001)
20 Sadhugarh,
Central plain
Vertic Ustochrept 1 59.7 8.3 0.71 0.77 I, V, S Pasricha et al. (2001)
21 Nihalkhera,
Central plain
Typic
Camborthid
1 16.6 8 0.57 1.38 I, V, S Pasricha et al. (2001)
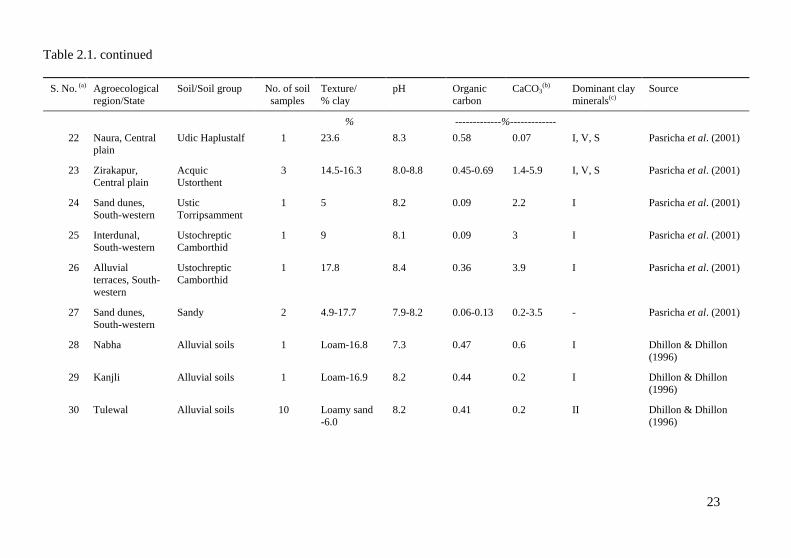
Table 2.1. continued
23
S. No. (a) Agroecological
region/State
Soil/Soil group No. of soil
samples
Texture/
% clay
pH Organic
carbon
CaCO3(b) Dominant clay
minerals(c)
Source
% -------------%-------------
22 Naura, Central
plain
Udic Haplustalf 1 23.6 8.3 0.58 0.07 I, V, S Pasricha et al. (2001)
23 Zirakapur,
Central plain
Acquic
Ustorthent
3 14.5-16.3 8.0-8.8 0.45-0.69 1.4-5.9 I, V, S Pasricha et al. (2001)
24 Sand dunes,
South-western
Ustic
Torripsamment
1 5 8.2 0.09 2.2 I Pasricha et al. (2001)
25 Interdunal,
South-western
Ustochreptic
Camborthid
1 9 8.1 0.09 3 I Pasricha et al. (2001)
26 Alluvial
terraces, South-
western
Ustochreptic
Camborthid
1 17.8 8.4 0.36 3.9 I Pasricha et al. (2001)
27 Sand dunes,
South-western
Sandy 2 4.9-17.7 7.9-8.2 0.06-0.13 0.2-3.5 - Pasricha et al. (2001)
28 Nabha Alluvial soils 1 Loam-16.8 7.3 0.47 0.6 I Dhillon & Dhillon
(1996)
29 Kanjli Alluvial soils 1 Loam-16.9 8.2 0.44 0.2 I Dhillon & Dhillon
(1996)
30 Tulewal Alluvial soils 10 Loamy sand
-6.0
8.2 0.41 0.2 II Dhillon & Dhillon
(1996)
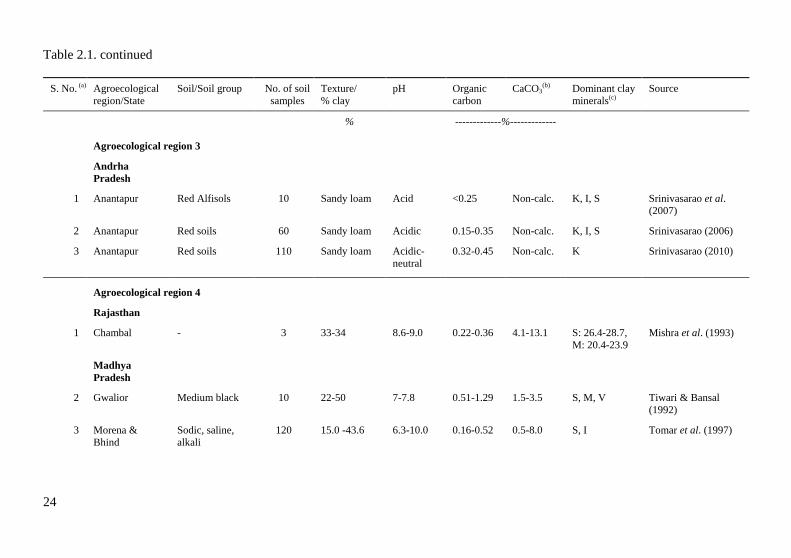
Table 2.1. continued
24
S. No. (a) Agroecological
region/State
Soil/Soil group No. of soil
samples
Texture/
% clay
pH Organic
carbon
CaCO3(b) Dominant clay
minerals(c)
Source
% -------------%-------------
Agroecological region 3
Andrha
Pradesh
1 Anantapur Red Alfisols 10 Sandy loam Acid <0.25 Non-calc. K, I, S Srinivasarao et al.
(2007)
2 Anantapur Red soils 60 Sandy loam Acidic 0.15-0.35 Non-calc. K, I, S Srinivasarao (2006)
3 Anantapur Red soils 110 Sandy loam Acidic-
neutral
0.32-0.45 Non-calc. K Srinivasarao (2010)
Agroecological region 4
Rajasthan
1 Chambal - 3 33-34 8.6-9.0 0.22-0.36 4.1-13.1 S: 26.4-28.7,
M: 20.4-23.9
Mishra et al. (1993)
Madhya
Pradesh
2 Gwalior Medium black 10 22-50 7-7.8 0.51-1.29 1.5-3.5 S, M, V Tiwari & Bansal
(1992)
3 Morena &
Bhind
Sodic, saline,
alkali
120 15.0 -43.6 6.3-10.0 0.16-0.52 0.5-8.0 S, I Tomar et al. (1997)
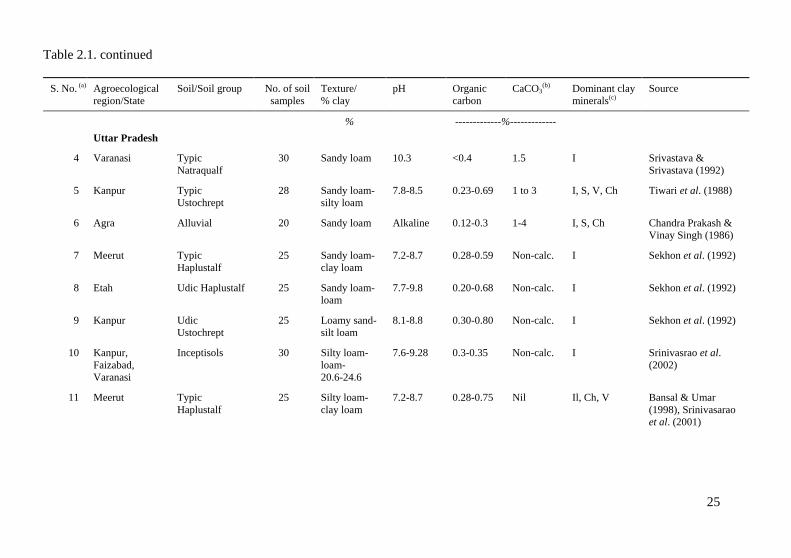
Table 2.1. continued
25
S. No. (a) Agroecological
region/State
Soil/Soil group No. of soil
samples
Texture/
% clay
pH Organic
carbon
CaCO3(b) Dominant clay
minerals(c)
Source
% -------------%-------------
Uttar Pradesh
4 Varanasi Typic
Natraqualf
30 Sandy loam 10.3 <0.4 1.5 I Srivastava &
Srivastava (1992)
5 Kanpur Typic
Ustochrept
28 Sandy loam-
silty loam
7.8-8.5 0.23-0.69 1 to 3 I, S, V, Ch Tiwari et al. (1988)
6 Agra Alluvial 20 Sandy loam Alkaline 0.12-0.3 1-4 I, S, Ch Chandra Prakash &
Vinay Singh (1986)
7 Meerut Typic
Haplustalf
25 Sandy loam-
clay loam
7.2-8.7 0.28-0.59 Non-calc. I Sekhon et al. (1992)
8 Etah Udic Haplustalf 25 Sandy loam-
loam
7.7-9.8 0.20-0.68 Non-calc. I Sekhon et al. (1992)
9 Kanpur Udic
Ustochrept
25 Loamy sand-
silt loam
8.1-8.8 0.30-0.80 Non-calc. I Sekhon et al. (1992)
10 Kanpur,
Faizabad,
Varanasi
Inceptisols 30 Silty loam-
loam-
20.6-24.6
7.6-9.28 0.3-0.35 Non-calc. I Srinivasrao et al.
(2002)
11 Meerut Typic
Haplustalf
25 Silty loam-
clay loam
7.2-8.7 0.28-0.75 Nil Il, Ch, V Bansal & Umar
(1998), Srinivasarao
et al. (2001)
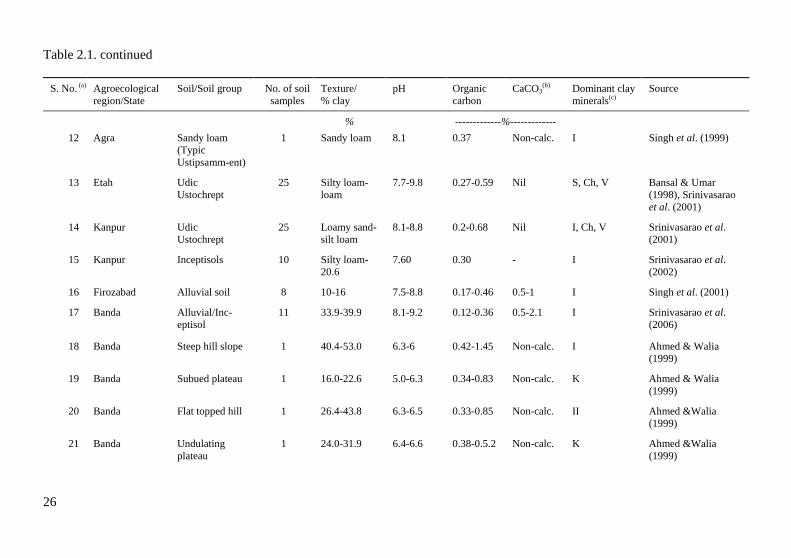
Table 2.1. continued
26
S. No. (a) Agroecological
region/State
Soil/Soil group No. of soil
samples
Texture/
% clay
pH Organic
carbon
CaCO3(b) Dominant clay
minerals(c)
Source
% -------------%-------------
12 Agra Sandy loam
(Typic
Ustipsamm-ent)
1 Sandy loam 8.1 0.37 Non-calc. I Singh et al. (1999)
13 Etah Udic
Ustochrept
25 Silty loam-
loam
7.7-9.8 0.27-0.59 Nil S, Ch, V Bansal & Umar
(1998), Srinivasarao
et al. (2001)
14 Kanpur Udic
Ustochrept
25 Loamy sand-
silt loam
8.1-8.8 0.2-0.68 Nil I, Ch, V Srinivasarao et al.
(2001)
15 Kanpur Inceptisols 10 Silty loam-
20.6
7.60 0.30 - I Srinivasarao et al.
(2002)
16 Firozabad Alluvial soil 8 10-16 7.5-8.8 0.17-0.46 0.5-1 I Singh et al. (2001)
17 Banda Alluvial/Inc-
eptisol
11 33.9-39.9 8.1-9.2 0.12-0.36 0.5-2.1 I Srinivasarao et al.
(2006)
18 Banda Steep hill slope 1 40.4-53.0 6.3-6 0.42-1.45 Non-calc. I Ahmed & Walia
(1999)
19 Banda Subued plateau 1 16.0-22.6 5.0-6.3 0.34-0.83 Non-calc. K Ahmed & Walia
(1999)
20 Banda Flat topped hill 1 26.4-43.8 6.3-6.5 0.33-0.85 Non-calc. II Ahmed &Walia
(1999)
21 Banda Undulating
plateau
1 24.0-31.9 6.4-6.6 0.38-0.5.2 Non-calc. K Ahmed &Walia
(1999)
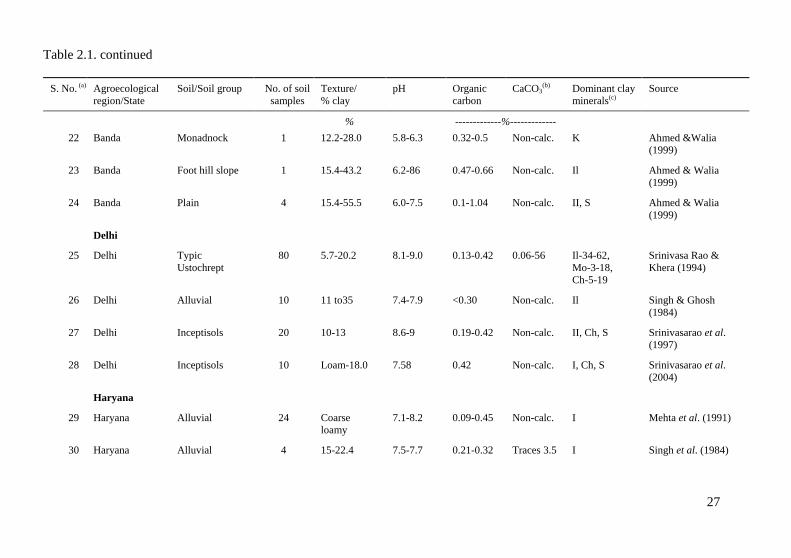
Table 2.1. continued
27
S. No. (a) Agroecological
region/State
Soil/Soil group No. of soil
samples
Texture/
% clay
pH Organic
carbon
CaCO3(b) Dominant clay
minerals(c)
Source
% -------------%-------------
22 Banda Monadnock 1 12.2-28.0 5.8-6.3 0.32-0.5 Non-calc. K Ahmed &Walia
(1999)
23 Banda Foot hill slope 1 15.4-43.2 6.2-86 0.47-0.66 Non-calc. Il Ahmed & Walia
(1999)
24 Banda Plain 4 15.4-55.5 6.0-7.5 0.1-1.04 Non-calc. II, S Ahmed & Walia
(1999)
Delhi
25 Delhi Typic
Ustochrept
80 5.7-20.2 8.1-9.0 0.13-0.42 0.06-56 Il-34-62,
Mo-3-18,
Ch-5-19
Srinivasa Rao &
Khera (1994)
26 Delhi Alluvial 10 11 to35 7.4-7.9 <0.30 Non-calc. Il Singh & Ghosh
(1984)
27 Delhi Inceptisols 20 10-13 8.6-9 0.19-0.42 Non-calc. II, Ch, S Srinivasarao et al.
(1997)
28 Delhi Inceptisols 10 Loam-18.0 7.58 0.42 Non-calc. I, Ch, S Srinivasarao et al.
(2004)
Haryana
29 Haryana Alluvial 24 Coarse
loamy
7.1-8.2 0.09-0.45 Non-calc. I Mehta et al. (1991)
30 Haryana Alluvial 4 15-22.4 7.5-7.7 0.21-0.32 Traces 3.5 I Singh et al. (1984)
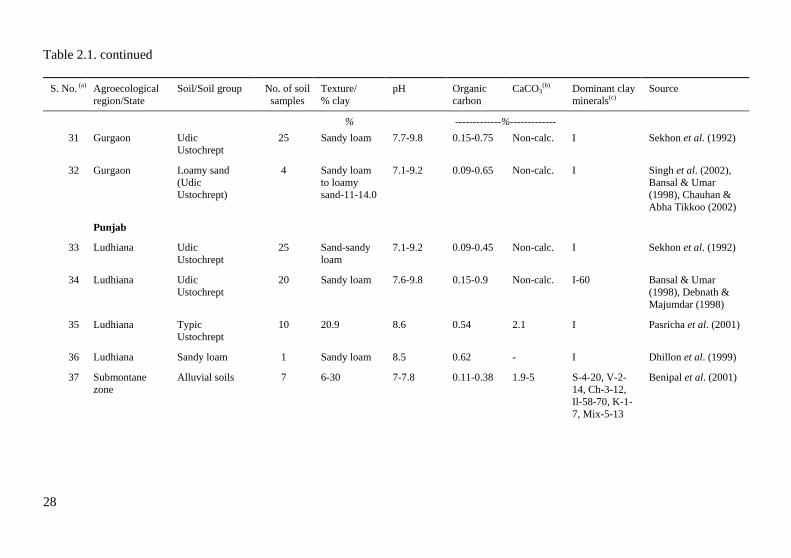
Table 2.1. continued
28
S. No. (a) Agroecological
region/State
Soil/Soil group No. of soil
samples
Texture/
% clay
pH Organic
carbon
CaCO3(b) Dominant clay
minerals(c)
Source
% -------------%-------------
31 Gurgaon Udic
Ustochrept
25 Sandy loam 7.7-9.8 0.15-0.75 Non-calc. I Sekhon et al. (1992)
32 Gurgaon Loamy sand
(Udic
Ustochrept)
4 Sandy loam
to loamy
sand-11-14.0
7.1-9.2 0.09-0.65 Non-calc. I Singh et al. (2002),
Bansal & Umar
(1998), Chauhan &
Abha Tikkoo (2002)
Punjab
33 Ludhiana Udic
Ustochrept
25 Sand-sandy
loam
7.1-9.2 0.09-0.45 Non-calc. I Sekhon et al. (1992)
34 Ludhiana Udic
Ustochrept
20 Sandy loam 7.6-9.8 0.15-0.9 Non-calc. I-60 Bansal & Umar
(1998), Debnath &
Majumdar (1998)
35 Ludhiana Typic
Ustochrept
10 20.9 8.6 0.54 2.1 I Pasricha et al. (2001)
36 Ludhiana Sandy loam 1 Sandy loam 8.5 0.62 - I Dhillon et al. (1999)
37 Submontane
zone
Alluvial soils 7 6-30 7-7.8 0.11-0.38 1.9-5 S-4-20, V-2-
14, Ch-3-12,
Il-58-70, K-1-
7, Mix-5-13
Benipal et al. (2001)
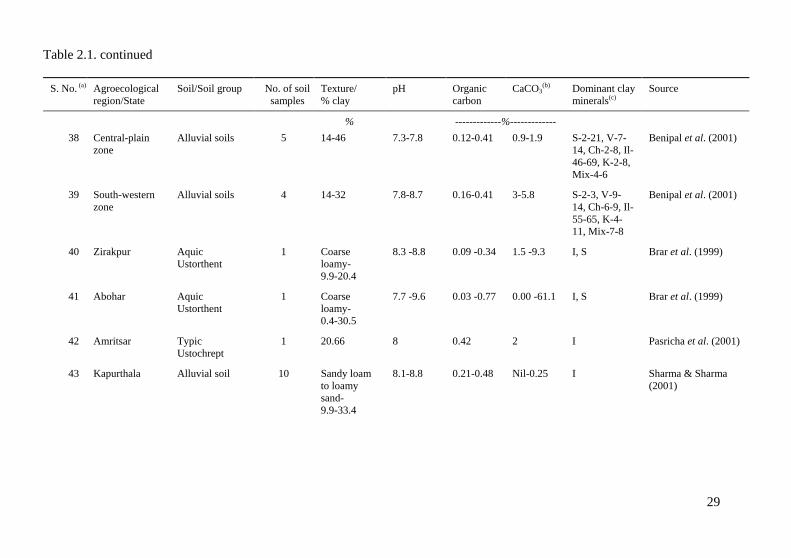
Table 2.1. continued
29
S. No. (a) Agroecological
region/State
Soil/Soil group No. of soil
samples
Texture/
% clay
pH Organic
carbon
CaCO3(b) Dominant clay
minerals(c)
Source
% -------------%-------------
38 Central-plain
zone
Alluvial soils 5 14-46 7.3-7.8 0.12-0.41 0.9-1.9 S-2-21, V-7-
14, Ch-2-8, Il-
46-69, K-2-8,
Mix-4-6
Benipal et al. (2001)
39 South-western
zone
Alluvial soils 4 14-32 7.8-8.7 0.16-0.41 3-5.8 S-2-3, V-9-
14, Ch-6-9, Il-
55-65, K-4-
11, Mix-7-8
Benipal et al. (2001)
40 Zirakpur Aquic
Ustorthent
1 Coarse
loamy-
9.9-20.4
8.3 -8.8 0.09 -0.34 1.5 -9.3 I, S Brar et al. (1999)
41 Abohar Aquic
Ustorthent
1 Coarse
loamy-
0.4-30.5
7.7 -9.6 0.03 -0.77 0.00 -61.1 I, S Brar et al. (1999)
42 Amritsar Typic
Ustochrept
1 20.66 8 0.42 2 I Pasricha et al. (2001)
43 Kapurthala Alluvial soil 10 Sandy loam
to loamy
sand-
9.9-33.4
8.1-8.8 0.21-0.48 Nil-0.25 I Sharma & Sharma
(2001)
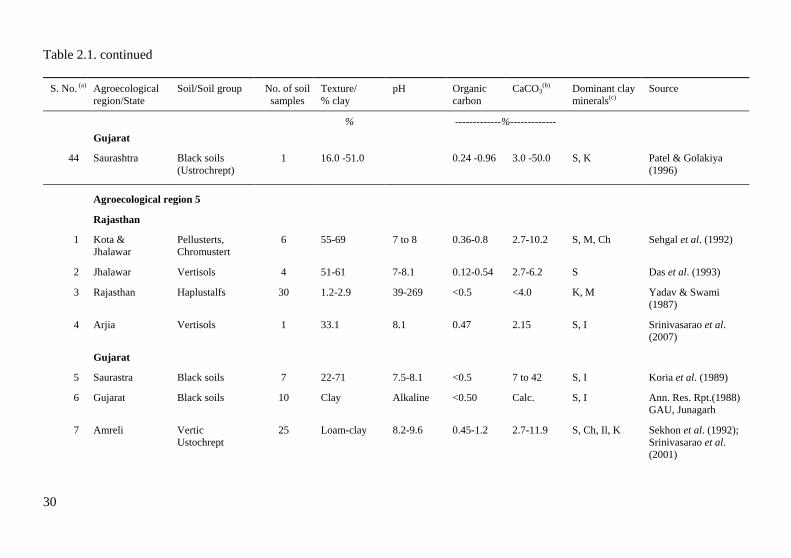
Table 2.1. continued
30
S. No. (a) Agroecological
region/State
Soil/Soil group No. of soil
samples
Texture/
% clay
pH Organic
carbon
CaCO3(b) Dominant clay
minerals(c)
Source
% -------------%-------------
Gujarat
44 Saurashtra Black soils
(Ustrochrept)
1 16.0 -51.0 0.24 -0.96 3.0 -50.0 S, K Patel & Golakiya
(1996)
Agroecological region 5
Rajasthan
1 Kota &
Jhalawar
Pellusterts,
Chromustert
6 55-69 7 to 8 0.36-0.8 2.7-10.2 S, M, Ch Sehgal et al. (1992)
2 Jhalawar Vertisols 4 51-61 7-8.1 0.12-0.54 2.7-6.2 S Das et al. (1993)
3 Rajasthan Haplustalfs 30 1.2-2.9 39-269 <0.5 <4.0 K, M Yadav & Swami
(1987)
4 Arjia Vertisols 1 33.1 8.1 0.47 2.15 S, I Srinivasarao et al.
(2007)
Gujarat
5 Saurastra Black soils 7 22-71 7.5-8.1 <0.5 7 to 42 S, I Koria et al. (1989)
6 Gujarat Black soils 10 Clay Alkaline <0.50 Calc. S, I Ann. Res. Rpt.(1988)
GAU, Junagarh
7 Amreli Vertic
Ustochrept
25 Loam-clay 8.2-9.6 0.45-1.2 2.7-11.9 S, Ch, Il, K Sekhon et al. (1992);
Srinivasarao et al.
(2001)
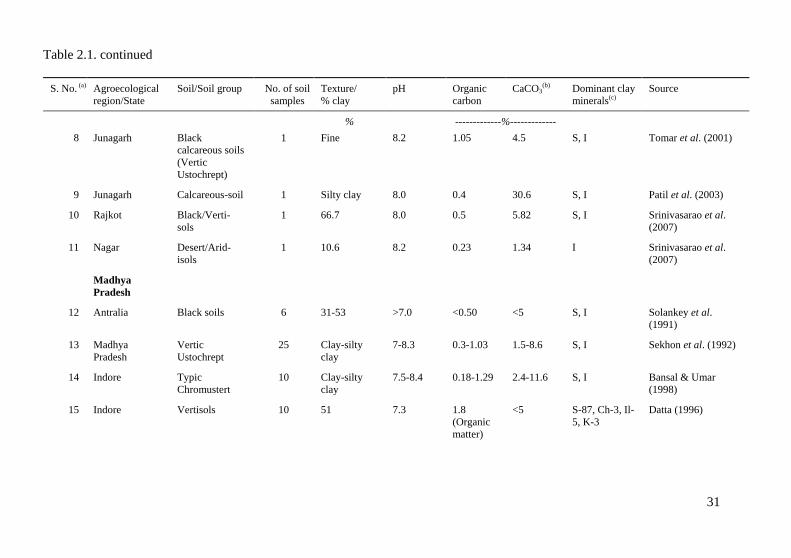
Table 2.1. continued
31
S. No. (a) Agroecological
region/State
Soil/Soil group No. of soil
samples
Texture/
% clay
pH Organic
carbon
CaCO3(b) Dominant clay
minerals(c)
Source
% -------------%-------------
8 Junagarh Black
calcareous soils
(Vertic
Ustochrept)
1 Fine 8.2 1.05 4.5 S, I Tomar et al. (2001)
9 Junagarh Calcareous-soil 1 Silty clay 8.0 0.4 30.6 S, I Patil et al. (2003)
10 Rajkot Black/Verti-
sols
1 66.7 8.0 0.5 5.82 S, I Srinivasarao et al.
(2007)
11 Nagar Desert/Arid-
isols
1 10.6 8.2 0.23 1.34 I Srinivasarao et al.
(2007)
Madhya
Pradesh
12 Antralia Black soils 6 31-53 >7.0 <0.50 <5 S, I Solankey et al.
(1991)
13 Madhya
Pradesh
Vertic
Ustochrept
25 Clay-silty
clay
7-8.3 0.3-1.03 1.5-8.6 S, I Sekhon et al. (1992)
14 Indore Typic
Chromustert
10 Clay-silty
clay
7.5-8.4 0.18-1.29 2.4-11.6 S, I Bansal & Umar
(1998)
15 Indore Vertisols 10 51 7.3 1.8
(Organic
matter)
<5 S-87, Ch-3, Il-
5, K-3
Datta (1996)
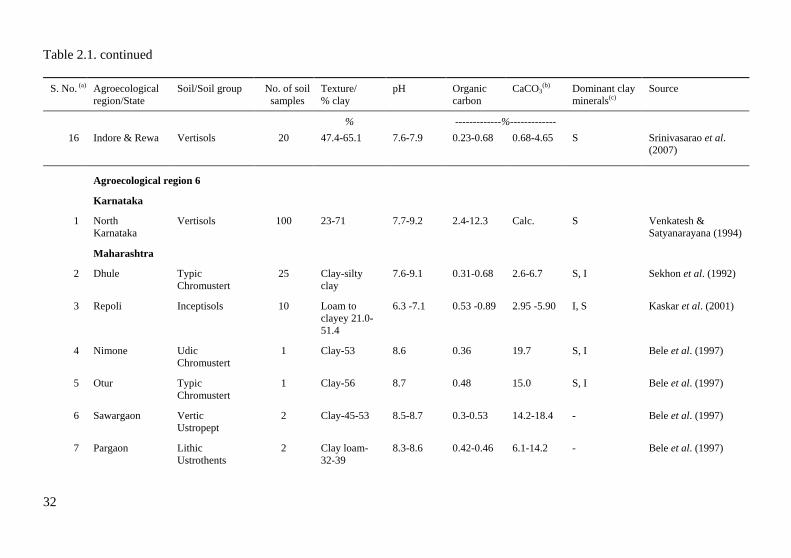
Table 2.1. continued
32
S. No. (a) Agroecological
region/State
Soil/Soil group No. of soil
samples
Texture/
% clay
pH Organic
carbon
CaCO3(b) Dominant clay
minerals(c)
Source
% -------------%-------------
16 Indore & Rewa Vertisols 20 47.4-65.1 7.6-7.9 0.23-0.68 0.68-4.65 S Srinivasarao et al.
(2007)
Agroecological region 6
Karnataka
1 North
Karnataka
Vertisols 100 23-71 7.7-9.2 2.4-12.3 Calc. S Venkatesh &
Satyanarayana (1994)
Maharashtra
2 Dhule Typic
Chromustert
25 Clay-silty
clay
7.6-9.1 0.31-0.68 2.6-6.7 S, I Sekhon et al. (1992)
3 Repoli Inceptisols 10 Loam to
clayey 21.0-
51.4
6.3 -7.1 0.53 -0.89 2.95 -5.90 I, S Kaskar et al. (2001)
4 Nimone Udic
Chromustert
1 Clay-53 8.6 0.36 19.7 S, I Bele et al. (1997)
5 Otur Typic
Chromustert
1 Clay-56 8.7 0.48 15.0 S, I Bele et al. (1997)
6 Sawargaon Vertic
Ustropept
2 Clay-45-53 8.5-8.7 0.3-0.53 14.2-18.4 - Bele et al. (1997)
7 Pargaon Lithic
Ustrothents
2 Clay loam-
32-39
8.3-8.6 0.42-0.46 6.1-14.2 - Bele et al. (1997)
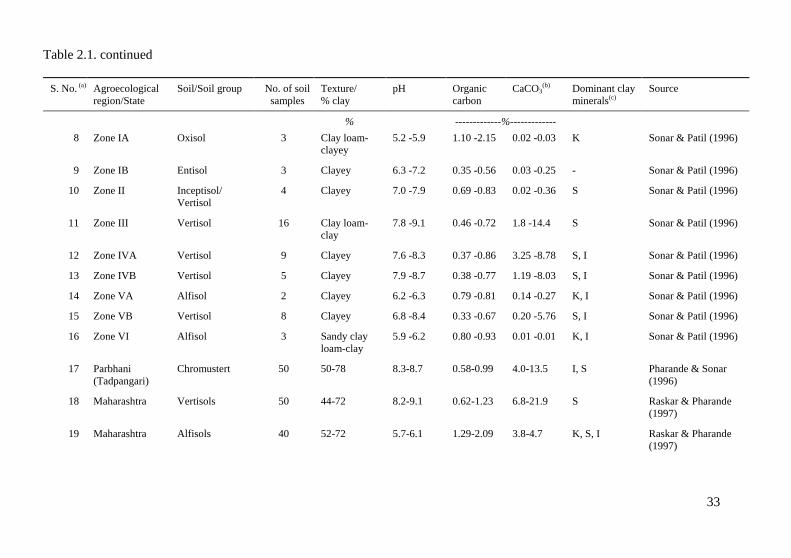
Table 2.1. continued
33
S. No. (a) Agroecological
region/State
Soil/Soil group No. of soil
samples
Texture/
% clay
pH Organic
carbon
CaCO3(b) Dominant clay
minerals(c)
Source
% -------------%-------------
8 Zone IA Oxisol 3 Clay loam-
clayey
5.2 -5.9 1.10 -2.15 0.02 -0.03 K Sonar & Patil (1996)
9 Zone IB Entisol 3 Clayey 6.3 -7.2 0.35 -0.56 0.03 -0.25 - Sonar & Patil (1996)
10 Zone II Inceptisol/
Vertisol
4 Clayey 7.0 -7.9 0.69 -0.83 0.02 -0.36 S Sonar & Patil (1996)
11 Zone III Vertisol 16 Clay loam-
clay
7.8 -9.1 0.46 -0.72 1.8 -14.4 S Sonar & Patil (1996)
12 Zone IVA Vertisol 9 Clayey 7.6 -8.3 0.37 -0.86 3.25 -8.78 S, I Sonar & Patil (1996)
13 Zone IVB Vertisol 5 Clayey 7.9 -8.7 0.38 -0.77 1.19 -8.03 S, I Sonar & Patil (1996)
14 Zone VA Alfisol 2 Clayey 6.2 -6.3 0.79 -0.81 0.14 -0.27 K, I Sonar & Patil (1996)
15 Zone VB Vertisol 8 Clayey 6.8 -8.4 0.33 -0.67 0.20 -5.76 S, I Sonar & Patil (1996)
16 Zone VI Alfisol 3 Sandy clay
loam-clay
5.9 -6.2 0.80 -0.93 0.01 -0.01 K, I Sonar & Patil (1996)
17 Parbhani
(Tadpangari)
Chromustert 50 50-78 8.3-8.7 0.58-0.99 4.0-13.5 I, S Pharande & Sonar
(1996)
18 Maharashtra Vertisols 50 44-72 8.2-9.1 0.62-1.23 6.8-21.9 S Raskar & Pharande
(1997)
19 Maharashtra Alfisols 40 52-72 5.7-6.1 1.29-2.09 3.8-4.7 K, S, I Raskar & Pharande
(1997)
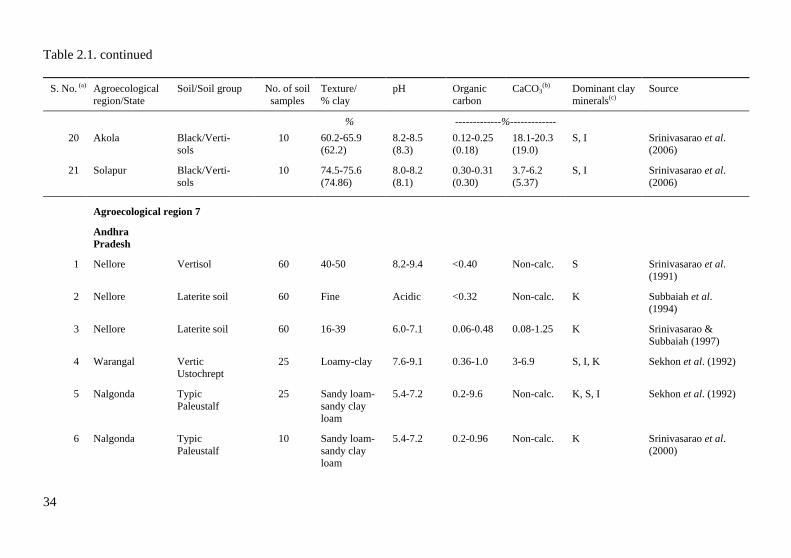
Table 2.1. continued
34
S. No. (a) Agroecological
region/State
Soil/Soil group No. of soil
samples
Texture/
% clay
pH Organic
carbon
CaCO3(b) Dominant clay
minerals(c)
Source
% -------------%-------------
20 Akola Black/Verti-
sols
10 60.2-65.9
(62.2)
8.2-8.5
(8.3)
0.12-0.25
(0.18)
18.1-20.3
(19.0)
S, I Srinivasarao et al.
(2006)
21 Solapur Black/Verti-
sols
10 74.5-75.6
(74.86)
8.0-8.2
(8.1)
0.30-0.31
(0.30)
3.7-6.2
(5.37)
S, I Srinivasarao et al.
(2006)
Agroecological region 7
Andhra
Pradesh
1 Nellore Vertisol 60 40-50 8.2-9.4 <0.40 Non-calc. S Srinivasarao et al.
(1991)
2 Nellore Laterite soil 60 Fine Acidic <0.32 Non-calc. K Subbaiah et al.
(1994)
3 Nellore Laterite soil 60 16-39 6.0-7.1 0.06-0.48 0.08-1.25 K Srinivasarao &
Subbaiah (1997)
4 Warangal Vertic
Ustochrept
25 Loamy-clay 7.6-9.1 0.36-1.0 3-6.9 S, I, K Sekhon et al. (1992)
5 Nalgonda Typic
Paleustalf
25 Sandy loam-
sandy clay
loam
5.4-7.2 0.2-9.6 Non-calc. K, S, I Sekhon et al. (1992)
6 Nalgonda Typic
Paleustalf
10 Sandy loam-
sandy clay
loam
5.4-7.2 0.2-0.96 Non-calc. K Srinivasarao et al.
(2000)
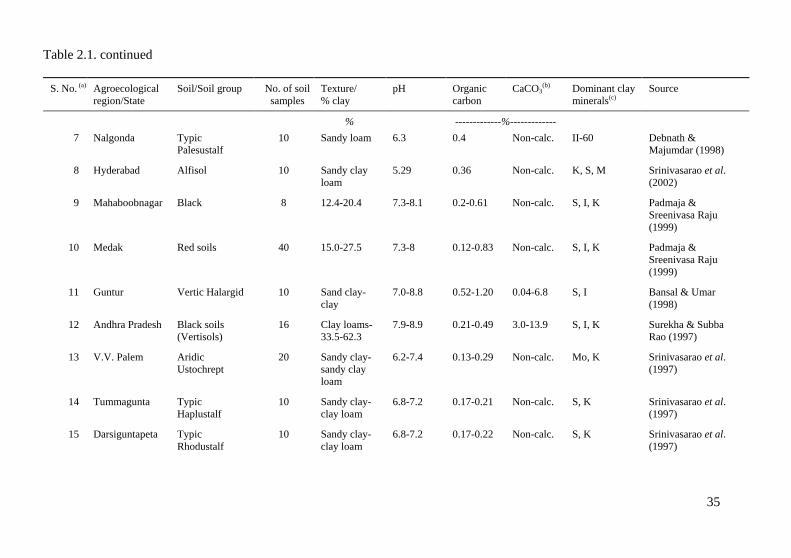
Table 2.1. continued
35
S. No. (a) Agroecological
region/State
Soil/Soil group No. of soil
samples
Texture/
% clay
pH Organic
carbon
CaCO3(b) Dominant clay
minerals(c)
Source
% -------------%-------------
7 Nalgonda Typic
Palesustalf
10 Sandy loam 6.3 0.4 Non-calc. II-60 Debnath &
Majumdar (1998)
8 Hyderabad Alfisol 10 Sandy clay
loam
5.29 0.36 Non-calc. K, S, M Srinivasarao et al.
(2002)
9 Mahaboobnagar Black 8 12.4-20.4 7.3-8.1 0.2-0.61 Non-calc. S, I, K Padmaja &
Sreenivasa Raju
(1999)
10 Medak Red soils 40 15.0-27.5 7.3-8 0.12-0.83 Non-calc. S, I, K Padmaja &
Sreenivasa Raju
(1999)
11 Guntur Vertic Halargid 10 Sand clay-
clay
7.0-8.8 0.52-1.20 0.04-6.8 S, I Bansal & Umar
(1998)
12 Andhra Pradesh Black soils
(Vertisols)
16 Clay loams-
33.5-62.3
7.9-8.9 0.21-0.49 3.0-13.9 S, I, K Surekha & Subba
Rao (1997)
13 V.V. Palem Aridic
Ustochrept
20 Sandy clay-
sandy clay
loam
6.2-7.4 0.13-0.29 Non-calc. Mo, K Srinivasarao et al.
(1997)
14 Tummagunta Typic
Haplustalf
10 Sandy clay-
clay loam
6.8-7.2 0.17-0.21 Non-calc. S, K Srinivasarao et al.
(1997)
15 Darsiguntapeta Typic
Rhodustalf
10 Sandy clay-
clay loam
6.8-7.2 0.17-0.22 Non-calc. S, K Srinivasarao et al.
(1997)
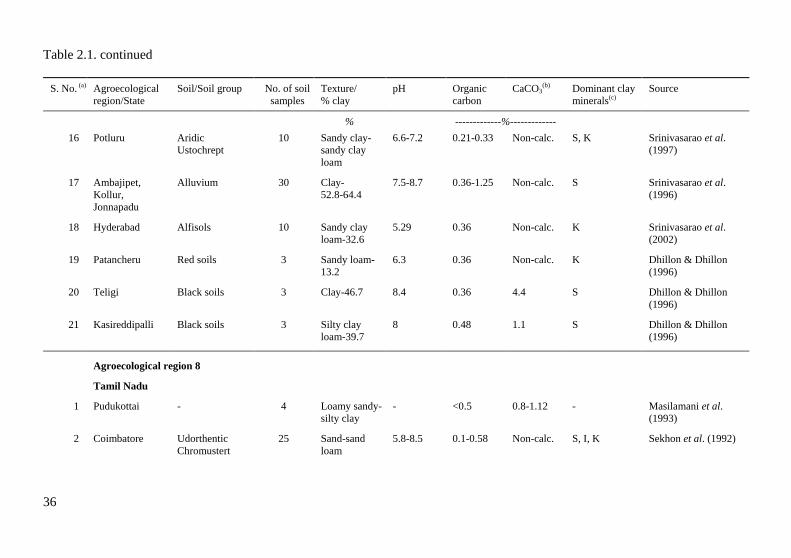
Table 2.1. continued
36
S. No. (a) Agroecological
region/State
Soil/Soil group No. of soil
samples
Texture/
% clay
pH Organic
carbon
CaCO3(b) Dominant clay
minerals(c)
Source
% -------------%-------------
16 Potluru Aridic
Ustochrept
10 Sandy clay-
sandy clay
loam
6.6-7.2 0.21-0.33 Non-calc. S, K Srinivasarao et al.
(1997)
17 Ambajipet,
Kollur,
Jonnapadu
Alluvium 30 Clay-
52.8-64.4
7.5-8.7 0.36-1.25 Non-calc. S Srinivasarao et al.
(1996)
18 Hyderabad Alfisols 10 Sandy clay
loam-32.6
5.29 0.36 Non-calc. K Srinivasarao et al.
(2002)
19 Patancheru Red soils 3 Sandy loam-
13.2
6.3 0.36 Non-calc. K Dhillon & Dhillon
(1996)
20 Teligi Black soils 3 Clay-46.7 8.4 0.36 4.4 S Dhillon & Dhillon
(1996)
21 Kasireddipalli Black soils 3 Silty clay
loam-39.7
8 0.48 1.1 S Dhillon & Dhillon
(1996)
Agroecological region 8
Tamil Nadu
1 Pudukottai - 4 Loamy sandy-
silty clay
- <0.5 0.8-1.12 - Masilamani et al.
(1993)
2 Coimbatore Udorthentic
Chromustert
25 Sand-sand
loam
5.8-8.5 0.1-0.58 Non-calc. S, I, K Sekhon et al. (1992)
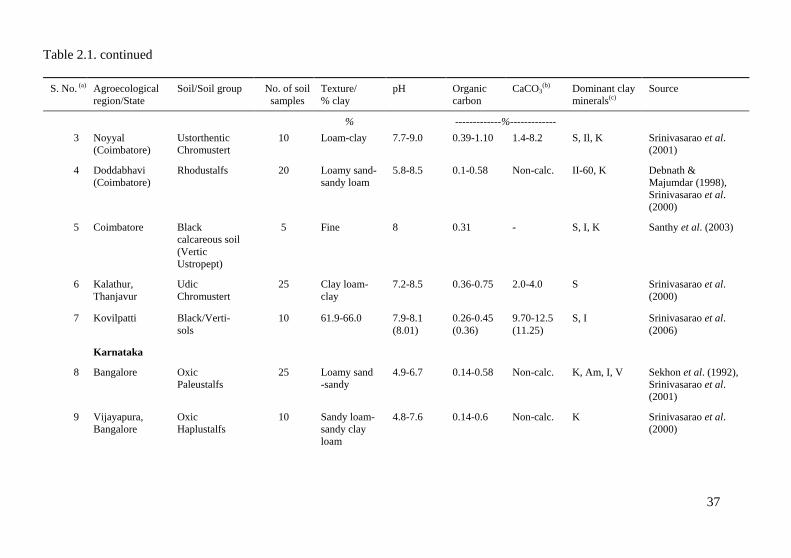
Table 2.1. continued
37
S. No. (a) Agroecological
region/State
Soil/Soil group No. of soil
samples
Texture/
% clay
pH Organic
carbon
CaCO3(b) Dominant clay
minerals(c)
Source
% -------------%-------------
3 Noyyal
(Coimbatore)
Ustorthentic
Chromustert
10 Loam-clay 7.7-9.0 0.39-1.10 1.4-8.2 S, Il, K Srinivasarao et al.
(2001)
4 Doddabhavi
(Coimbatore)
Rhodustalfs 20 Loamy sand-
sandy loam
5.8-8.5 0.1-0.58 Non-calc. II-60, K Debnath &
Majumdar (1998),
Srinivasarao et al.
(2000)
5 Coimbatore Black
calcareous soil
(Vertic
Ustropept)
5 Fine 8 0.31 - S, I, K Santhy et al. (2003)
6 Kalathur,
Thanjavur
Udic
Chromustert
25 Clay loam-
clay
7.2-8.5 0.36-0.75 2.0-4.0 S Srinivasarao et al.
(2000)
7 Kovilpatti Black/Verti-
sols
10 61.9-66.0 7.9-8.1
(8.01)
0.26-0.45
(0.36)
9.70-12.5
(11.25)
S, I Srinivasarao et al.
(2006)
Karnataka
8 Bangalore Oxic
Paleustalfs
25 Loamy sand
-sandy
4.9-6.7 0.14-0.58 Non-calc. K, Am, I, V Sekhon et al. (1992),
Srinivasarao et al.
(2001)
9 Vijayapura,
Bangalore
Oxic
Haplustalfs
10 Sandy loam-
sandy clay
loam
4.8-7.6 0.14-0.6 Non-calc. K Srinivasarao et al.
(2000)
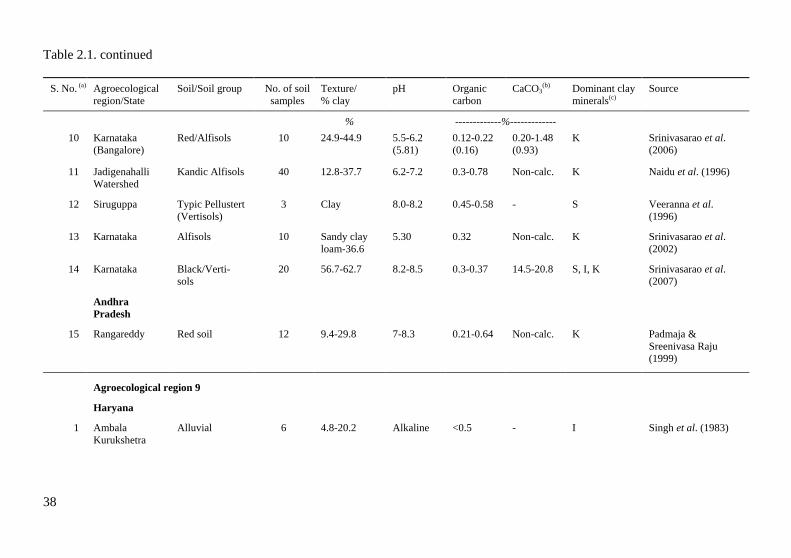
Table 2.1. continued
38
S. No. (a) Agroecological
region/State
Soil/Soil group No. of soil
samples
Texture/
% clay
pH Organic
carbon
CaCO3(b) Dominant clay
minerals(c)
Source
% -------------%-------------
10 Karnataka
(Bangalore)
Red/Alfisols 10 24.9-44.9 5.5-6.2
(5.81)
0.12-0.22
(0.16)
0.20-1.48
(0.93)
K Srinivasarao et al.
(2006)
11 Jadigenahalli
Watershed
Kandic Alfisols 40 12.8-37.7 6.2-7.2 0.3-0.78 Non-calc. K Naidu et al. (1996)
12 Siruguppa Typic Pellustert
(Vertisols)
3 Clay 8.0-8.2 0.45-0.58 - S Veeranna et al.
(1996)
13 Karnataka Alfisols 10 Sandy clay
loam-36.6
5.30 0.32 Non-calc. K Srinivasarao et al.
(2002)
14 Karnataka Black/Verti-
sols
20 56.7-62.7 8.2-8.5 0.3-0.37 14.5-20.8 S, I, K Srinivasarao et al.
(2007)
Andhra
Pradesh
15 Rangareddy Red soil 12 9.4-29.8 7-8.3 0.21-0.64 Non-calc. K Padmaja &
Sreenivasa Raju
(1999)
Agroecological region 9
Haryana
1 Ambala
Kurukshetra
Alluvial 6 4.8-20.2 Alkaline <0.5 - I Singh et al. (1983)
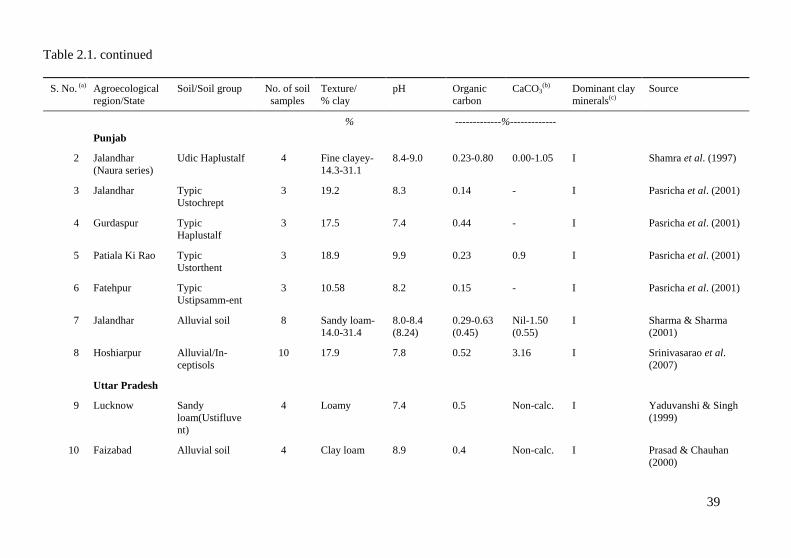
Table 2.1. continued
39
S. No. (a) Agroecological
region/State
Soil/Soil group No. of soil
samples
Texture/
% clay
pH Organic
carbon
CaCO3(b) Dominant clay
minerals(c)
Source
% -------------%-------------
Punjab
2 Jalandhar
(Naura series)
Udic Haplustalf 4 Fine clayey-
14.3-31.1
8.4-9.0 0.23-0.80 0.00-1.05 I Shamra et al. (1997)
3 Jalandhar Typic
Ustochrept
3 19.2 8.3 0.14 - I Pasricha et al. (2001)
4 Gurdaspur Typic
Haplustalf
3 17.5 7.4 0.44 - I Pasricha et al. (2001)
5 Patiala Ki Rao Typic
Ustorthent
3 18.9 9.9 0.23 0.9 I Pasricha et al. (2001)
6 Fatehpur Typic
Ustipsamm-ent
3 10.58 8.2 0.15 - I Pasricha et al. (2001)
7 Jalandhar Alluvial soil 8 Sandy loam-
14.0-31.4
8.0-8.4
(8.24)
0.29-0.63
(0.45)
Nil-1.50
(0.55)
I Sharma & Sharma
(2001)
8 Hoshiarpur Alluvial/In-
ceptisols
10 17.9 7.8 0.52 3.16 I Srinivasarao et al.
(2007)
Uttar Pradesh
9 Lucknow Sandy
loam(Ustifluve
nt)
4 Loamy 7.4 0.5 Non-calc. I Yaduvanshi & Singh
(1999)
10 Faizabad Alluvial soil 4 Clay loam 8.9 0.4 Non-calc. I Prasad & Chauhan
(2000)
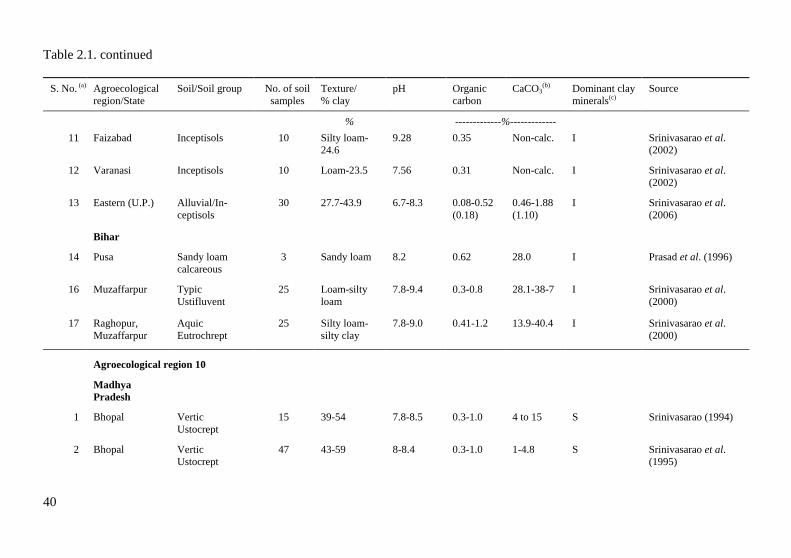
Table 2.1. continued
40
S. No. (a) Agroecological
region/State
Soil/Soil group No. of soil
samples
Texture/
% clay
pH Organic
carbon
CaCO3(b) Dominant clay
minerals(c)
Source
% -------------%-------------
11 Faizabad Inceptisols 10 Silty loam-
24.6
9.28 0.35 Non-calc. I Srinivasarao et al.
(2002)
12 Varanasi Inceptisols 10 Loam-23.5 7.56 0.31 Non-calc. I Srinivasarao et al.
(2002)
13 Eastern (U.P.) Alluvial/In-
ceptisols
30 27.7-43.9 6.7-8.3 0.08-0.52
(0.18)
0.46-1.88
(1.10)
I Srinivasarao et al.
(2006)
Bihar
14 Pusa Sandy loam
calcareous
3 Sandy loam 8.2 0.62 28.0 I Prasad et al. (1996)
16 Muzaffarpur Typic
Ustifluvent
25 Loam-silty
loam
7.8-9.4 0.3-0.8 28.1-38-7 I Srinivasarao et al.
(2000)
17 Raghopur,
Muzaffarpur
Aquic
Eutrochrept
25 Silty loam-
silty clay
7.8-9.0 0.41-1.2 13.9-40.4 I Srinivasarao et al.
(2000)
Agroecological region 10
Madhya
Pradesh
1 Bhopal Vertic
Ustocrept
15 39-54 7.8-8.5 0.3-1.0 4 to 15 S Srinivasarao (1994)
2 Bhopal Vertic
Ustocrept
47 43-59 8-8.4 0.3-1.0 1-4.8 S Srinivasarao et al.
(1995)
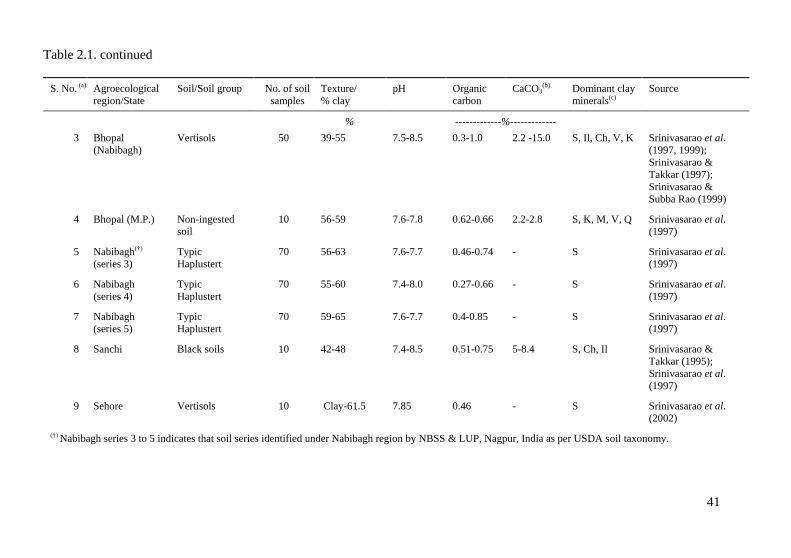
Table 2.1. continued
41
S. No. (a) Agroecological
region/State
Soil/Soil group No. of soil
samples
Texture/
% clay
pH Organic
carbon
CaCO3(b) Dominant clay
minerals(c)
Source
% -------------%-------------
3 Bhopal
(Nabibagh)
Vertisols 50 39-55 7.5-8.5 0.3-1.0 2.2 -15.0 S, Il, Ch, V, K Srinivasarao et al.
(1997, 1999);
Srinivasarao &
Takkar (1997);
Srinivasarao &
Subba Rao (1999)
4 Bhopal (M.P.) Non-ingested
soil
10 56-59 7.6-7.8 0.62-0.66 2.2-2.8 S, K, M, V, Q Srinivasarao et al.
(1997)
5 Nabibagh(†)
(series 3)
Typic
Haplustert
70 56-63 7.6-7.7 0.46-0.74 - S Srinivasarao et al.
(1997)
6 Nabibagh
(series 4)
Typic
Haplustert
70 55-60 7.4-8.0 0.27-0.66 - S Srinivasarao et al.
(1997)
7 Nabibagh
(series 5)
Typic
Haplustert
70 59-65 7.6-7.7 0.4-0.85 - S Srinivasarao et al.
(1997)
8 Sanchi Black soils 10 42-48 7.4-8.5 0.51-0.75 5-8.4 S, Ch, Il Srinivasarao &
Takkar (1995);
Srinivasarao et al.
(1997)
9 Sehore Vertisols 10 Clay-61.5 7.85 0.46 - S Srinivasarao et al.
(2002)
(†) Nabibagh series 3 to 5 indicates that soil series identified under Nabibagh region by NBSS & LUP, Nagpur, India as per USDA soil taxonomy.
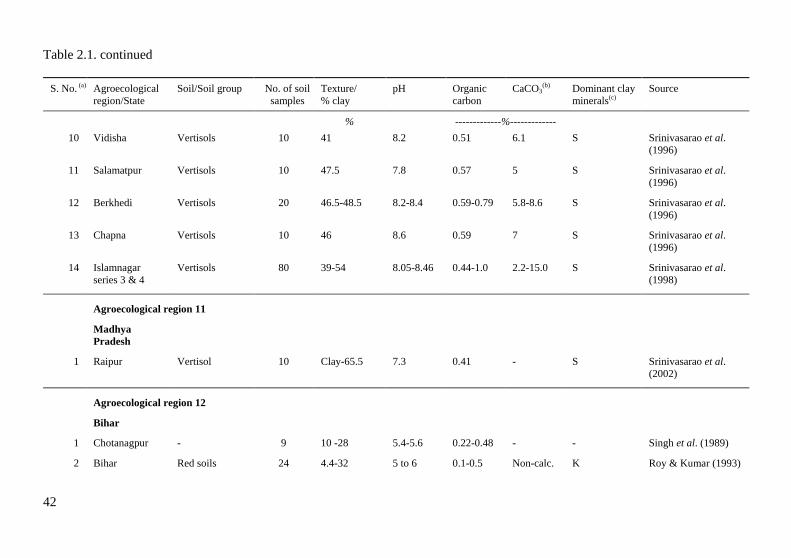
Table 2.1. continued
42
S. No. (a) Agroecological
region/State
Soil/Soil group No. of soil
samples
Texture/
% clay
pH Organic
carbon
CaCO3(b) Dominant clay
minerals(c)
Source
% -------------%-------------
10 Vidisha Vertisols 10 41 8.2 0.51 6.1 S Srinivasarao et al.
(1996)
11 Salamatpur Vertisols 10 47.5 7.8 0.57 5 S Srinivasarao et al.
(1996)
12 Berkhedi Vertisols 20 46.5-48.5 8.2-8.4 0.59-0.79 5.8-8.6 S Srinivasarao et al.
(1996)
13 Chapna Vertisols 10 46 8.6 0.59 7 S Srinivasarao et al.
(1996)
14 Islamnagar
series 3 & 4
Vertisols 80 39-54 8.05-8.46 0.44-1.0 2.2-15.0 S Srinivasarao et al.
(1998)
Agroecological region 11
Madhya
Pradesh
1 Raipur Vertisol 10 Clay-65.5 7.3 0.41 - S Srinivasarao et al.
(2002)
Agroecological region 12
Bihar
1 Chotanagpur - 9 10 -28 5.4-5.6 0.22-0.48 - - Singh et al. (1989)
2 Bihar Red soils 24 4.4-32 5 to 6 0.1-0.5 Non-calc. K Roy & Kumar (1993)
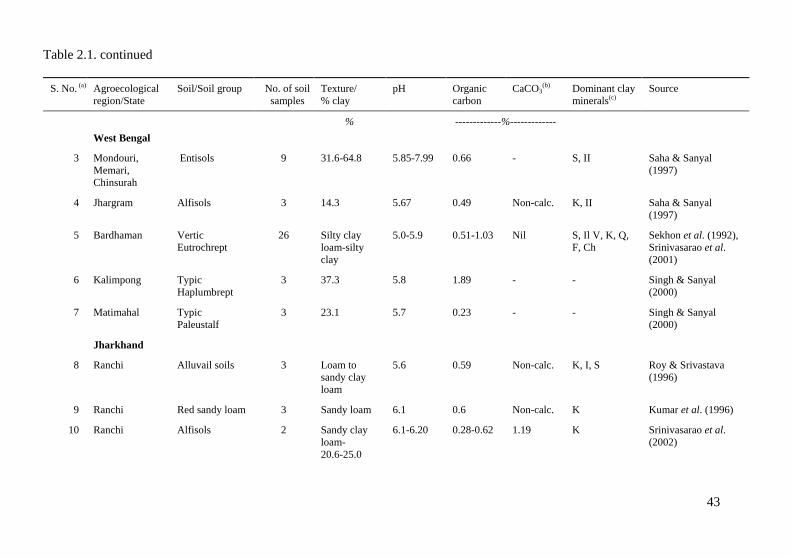
Table 2.1. continued
43
S. No. (a) Agroecological
region/State
Soil/Soil group No. of soil
samples
Texture/
% clay
pH Organic
carbon
CaCO3(b) Dominant clay
minerals(c)
Source
% -------------%-------------
West Bengal
3 Mondouri,
Memari,
Chinsurah
Entisols 9 31.6-64.8 5.85-7.99 0.66 - S, II Saha & Sanyal
(1997)
4 Jhargram Alfisols 3 14.3 5.67 0.49 Non-calc. K, II Saha & Sanyal
(1997)
5 Bardhaman Vertic
Eutrochrept
26 Silty clay
loam-silty
clay
5.0-5.9 0.51-1.03 Nil S, Il V, K, Q,
F, Ch
Sekhon et al. (1992),
Srinivasarao et al.
(2001)
6 Kalimpong Typic
Haplumbrept
3 37.3 5.8 1.89 - - Singh & Sanyal
(2000)
7 Matimahal Typic
Paleustalf
3 23.1 5.7 0.23 - - Singh & Sanyal
(2000)
Jharkhand
8 Ranchi Alluvail soils 3 Loam to
sandy clay
loam
5.6 0.59 Non-calc. K, I, S Roy & Srivastava
(1996)
9 Ranchi Red sandy loam 3 Sandy loam 6.1 0.6 Non-calc. K Kumar et al. (1996)
10 Ranchi Alfisols 2 Sandy clay
loam-
20.6-25.0
6.1-6.20 0.28-0.62 1.19 K Srinivasarao et al.
(2002)
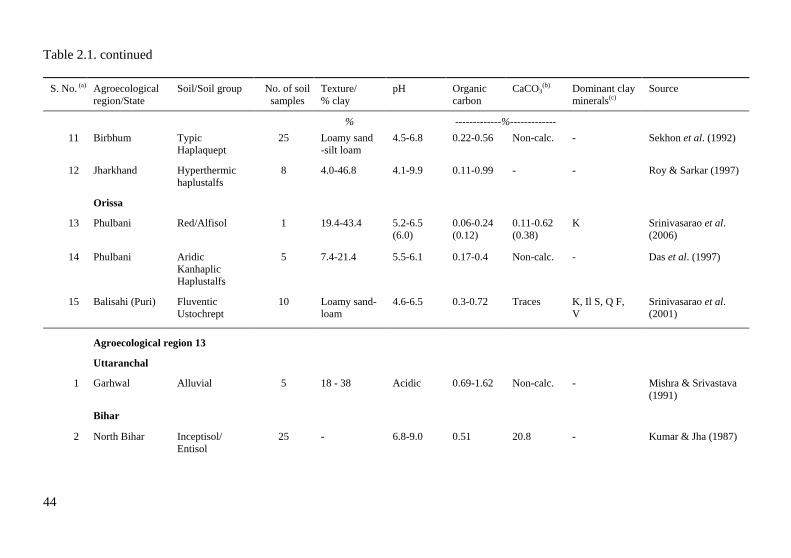
Table 2.1. continued
44
S. No. (a) Agroecological
region/State
Soil/Soil group No. of soil
samples
Texture/
% clay
pH Organic
carbon
CaCO3(b) Dominant clay
minerals(c)
Source
% -------------%-------------
11 Birbhum Typic
Haplaquept
25 Loamy sand
-silt loam
4.5-6.8 0.22-0.56 Non-calc. - Sekhon et al. (1992)
12 Jharkhand Hyperthermic
haplustalfs
8 4.0-46.8 4.1-9.9 0.11-0.99 - - Roy & Sarkar (1997)
Orissa
13 Phulbani Red/Alfisol 1 19.4-43.4 5.2-6.5
(6.0)
0.06-0.24
(0.12)
0.11-0.62
(0.38)
K Srinivasarao et al.
(2006)
14 Phulbani Aridic
Kanhaplic
Haplustalfs
5 7.4-21.4 5.5-6.1 0.17-0.4 Non-calc. - Das et al. (1997)
15 Balisahi (Puri) Fluventic
Ustochrept
10 Loamy sand-
loam
4.6-6.5 0.3-0.72 Traces K, Il S, Q F,
V
Srinivasarao et al.
(2001)
Agroecological region 13
Uttaranchal
1 Garhwal Alluvial 5 18 - 38 Acidic 0.69-1.62 Non-calc. - Mishra & Srivastava
(1991)
Bihar
2 North Bihar Inceptisol/
Entisol
25 - 6.8-9.0 0.51 20.8 - Kumar & Jha (1987)
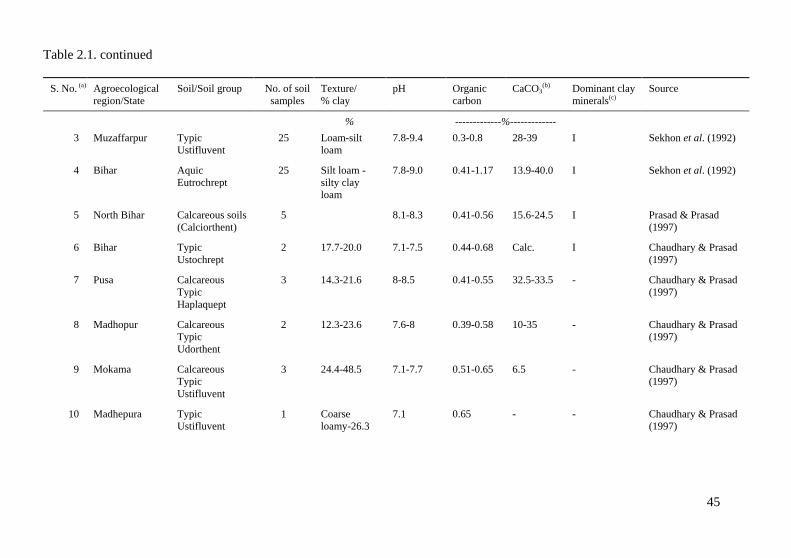
Table 2.1. continued
45
S. No. (a) Agroecological
region/State
Soil/Soil group No. of soil
samples
Texture/
% clay
pH Organic
carbon
CaCO3(b) Dominant clay
minerals(c)
Source
% -------------%-------------
3 Muzaffarpur Typic
Ustifluvent
25 Loam-silt
loam
7.8-9.4 0.3-0.8 28-39 I Sekhon et al. (1992)
4 Bihar Aquic
Eutrochrept
25 Silt loam -
silty clay
loam
7.8-9.0 0.41-1.17 13.9-40.0 I Sekhon et al. (1992)
5 North Bihar Calcareous soils
(Calciorthent)
5 8.1-8.3 0.41-0.56 15.6-24.5 I Prasad & Prasad
(1997)
6 Bihar Typic
Ustochrept
2 17.7-20.0 7.1-7.5 0.44-0.68 Calc. I Chaudhary & Prasad
(1997)
7 Pusa Calcareous
Typic
Haplaquept
3 14.3-21.6 8-8.5 0.41-0.55 32.5-33.5 - Chaudhary & Prasad
(1997)
8 Madhopur Calcareous
Typic
Udorthent
2 12.3-23.6 7.6-8 0.39-0.58 10-35 - Chaudhary & Prasad
(1997)
9 Mokama Calcareous
Typic
Ustifluvent
3 24.4-48.5 7.1-7.7 0.51-0.65 6.5 - Chaudhary & Prasad
(1997)
10 Madhepura Typic
Ustifluvent
1 Coarse
loamy-26.3
7.1 0.65 - - Chaudhary & Prasad
(1997)
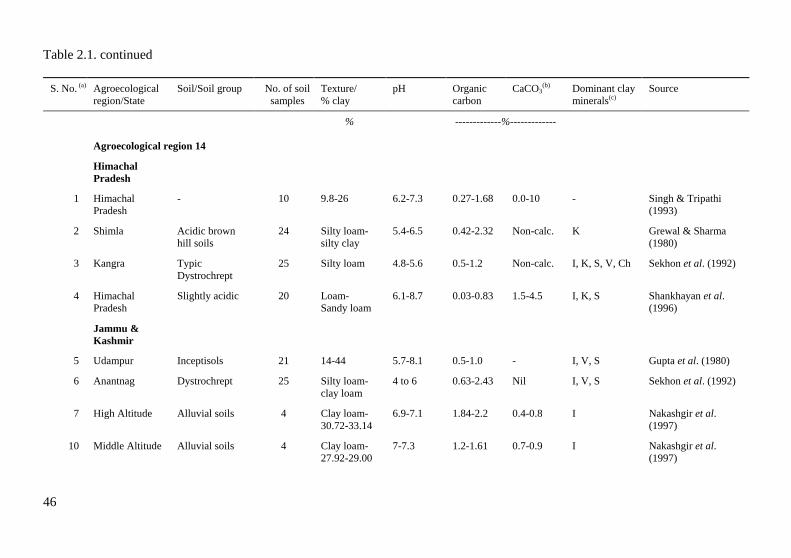
Table 2.1. continued
46
S. No. (a) Agroecological
region/State
Soil/Soil group No. of soil
samples
Texture/
% clay
pH Organic
carbon
CaCO3(b) Dominant clay
minerals(c)
Source
% -------------%-------------
Agroecological region 14
Himachal
Pradesh
1 Himachal
Pradesh
- 10 9.8-26 6.2-7.3 0.27-1.68 0.0-10 - Singh & Tripathi
(1993)
2 Shimla Acidic brown
hill soils
24 Silty loam-
silty clay
5.4-6.5 0.42-2.32 Non-calc. K Grewal & Sharma
(1980)
3 Kangra Typic
Dystrochrept
25 Silty loam 4.8-5.6 0.5-1.2 Non-calc. I, K, S, V, Ch Sekhon et al. (1992)
4 Himachal
Pradesh
Slightly acidic 20 Loam-
Sandy loam
6.1-8.7 0.03-0.83 1.5-4.5 I, K, S Shankhayan et al.
(1996)
Jammu &
Kashmir
5 Udampur Inceptisols 21 14-44 5.7-8.1 0.5-1.0 - I, V, S Gupta et al. (1980)
6 Anantnag Dystrochrept 25 Silty loam-
clay loam
4 to 6 0.63-2.43 Nil I, V, S Sekhon et al. (1992)
7 High Altitude Alluvial soils 4 Clay loam-
30.72-33.14
6.9-7.1 1.84-2.2 0.4-0.8 I Nakashgir et al.
(1997)
10 Middle Altitude Alluvial soils 4 Clay loam-
27.92-29.00
7-7.3 1.2-1.61 0.7-0.9 I Nakashgir et al.
(1997)
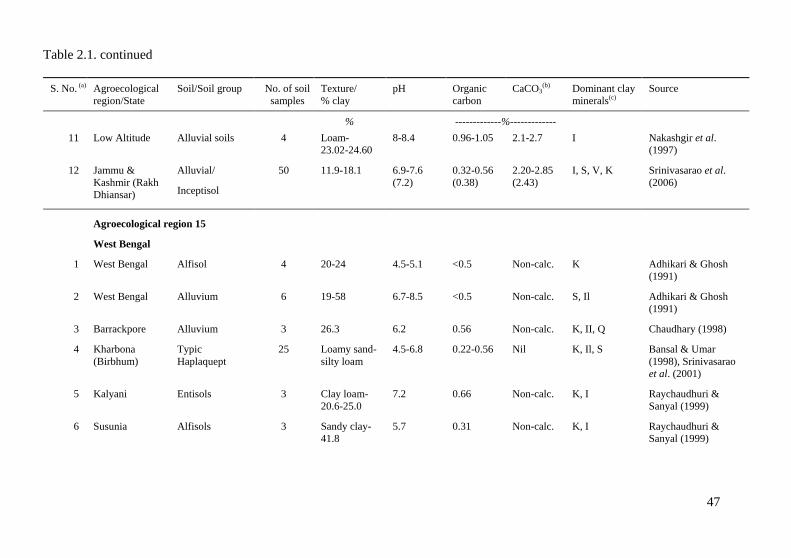
Table 2.1. continued
47
S. No. (a) Agroecological
region/State
Soil/Soil group No. of soil
samples
Texture/
% clay
pH Organic
carbon
CaCO3(b) Dominant clay
minerals(c)
Source
% -------------%-------------
11 Low Altitude Alluvial soils 4 Loam-
23.02-24.60
8-8.4 0.96-1.05 2.1-2.7 I Nakashgir et al.
(1997)
12 Jammu &
Kashmir (Rakh
Dhiansar)
Alluvial/
Inceptisol
50 11.9-18.1 6.9-7.6
(7.2)
0.32-0.56
(0.38)
2.20-2.85
(2.43)
I, S, V, K Srinivasarao et al.
(2006)
Agroecological region 15
West Bengal
1 West Bengal Alfisol 4 20-24 4.5-5.1 <0.5 Non-calc. K Adhikari & Ghosh
(1991)
2 West Bengal Alluvium 6 19-58 6.7-8.5 <0.5 Non-calc. S, Il Adhikari & Ghosh
(1991)
3 Barrackpore Alluvium 3 26.3 6.2 0.56 Non-calc. K, II, Q Chaudhary (1998)
4 Kharbona
(Birbhum)
Typic
Haplaquept
25 Loamy sand-
silty loam
4.5-6.8 0.22-0.56 Nil K, Il, S Bansal & Umar
(1998), Srinivasarao
et al. (2001)
5 Kalyani Entisols 3 Clay loam-
20.6-25.0
7.2 0.66 Non-calc. K, I Raychaudhuri &
Sanyal (1999)
6 Susunia Alfisols 3 Sandy clay-
41.8
5.7 0.31 Non-calc. K, I Raychaudhuri &
Sanyal (1999)
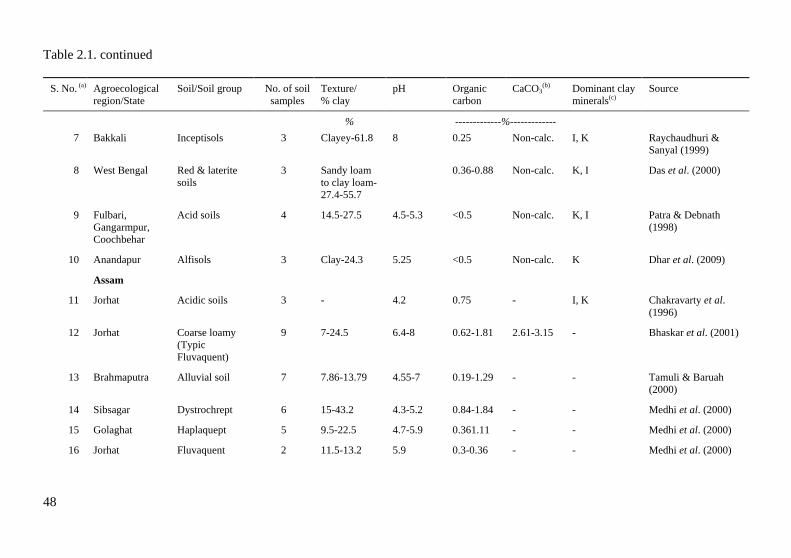
Table 2.1. continued
48
S. No. (a) Agroecological
region/State
Soil/Soil group No. of soil
samples
Texture/
% clay
pH Organic
carbon
CaCO3(b) Dominant clay
minerals(c)
Source
% -------------%-------------
7 Bakkali Inceptisols 3 Clayey-61.8 8 0.25 Non-calc. I, K Raychaudhuri &
Sanyal (1999)
8 West Bengal Red & laterite
soils
3 Sandy loam
to clay loam-
27.4-55.7
0.36-0.88 Non-calc. K, I Das et al. (2000)
9 Fulbari,
Gangarmpur,
Coochbehar
Acid soils 4 14.5-27.5 4.5-5.3 <0.5 Non-calc. K, I Patra & Debnath
(1998)
10 Anandapur Alfisols 3 Clay-24.3 5.25 <0.5 Non-calc. K Dhar et al. (2009)
Assam
11 Jorhat Acidic soils 3 - 4.2 0.75 - I, K Chakravarty et al.
(1996)
12 Jorhat Coarse loamy
(Typic
Fluvaquent)
9 7-24.5 6.4-8 0.62-1.81 2.61-3.15 - Bhaskar et al. (2001)
13 Brahmaputra Alluvial soil 7 7.86-13.79 4.55-7 0.19-1.29 - - Tamuli & Baruah
(2000)
14 Sibsagar Dystrochrept 6 15-43.2 4.3-5.2 0.84-1.84 - - Medhi et al. (2000)
15 Golaghat Haplaquept 5 9.5-22.5 4.7-5.9 0.361.11 - - Medhi et al. (2000)
16 Jorhat Fluvaquent 2 11.5-13.2 5.9 0.3-0.36 - - Medhi et al. (2000)
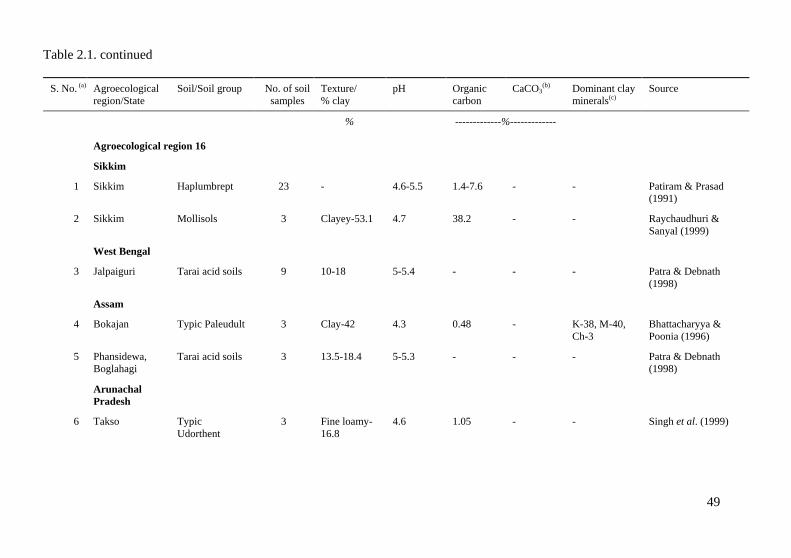
Table 2.1. continued
49
S. No. (a) Agroecological
region/State
Soil/Soil group No. of soil
samples
Texture/
% clay
pH Organic
carbon
CaCO3(b) Dominant clay
minerals(c)
Source
% -------------%-------------
Agroecological region 16
Sikkim
1 Sikkim Haplumbrept 23 - 4.6-5.5 1.4-7.6 - - Patiram & Prasad
(1991)
2 Sikkim Mollisols 3 Clayey-53.1 4.7 38.2 - - Raychaudhuri &
Sanyal (1999)
West Bengal
3 Jalpaiguri Tarai acid soils 9 10-18 5-5.4 - - - Patra & Debnath
(1998)
Assam
4 Bokajan Typic Paleudult 3 Clay-42 4.3 0.48 - K-38, M-40,
Ch-3
Bhattacharyya &
Poonia (1996)
5 Phansidewa,
Boglahagi
Tarai acid soils 3 13.5-18.4 5-5.3 - - - Patra & Debnath
(1998)
Arunachal
Pradesh
6 Takso Typic
Udorthent
3 Fine loamy-
16.8
4.6 1.05 - - Singh et al. (1999)
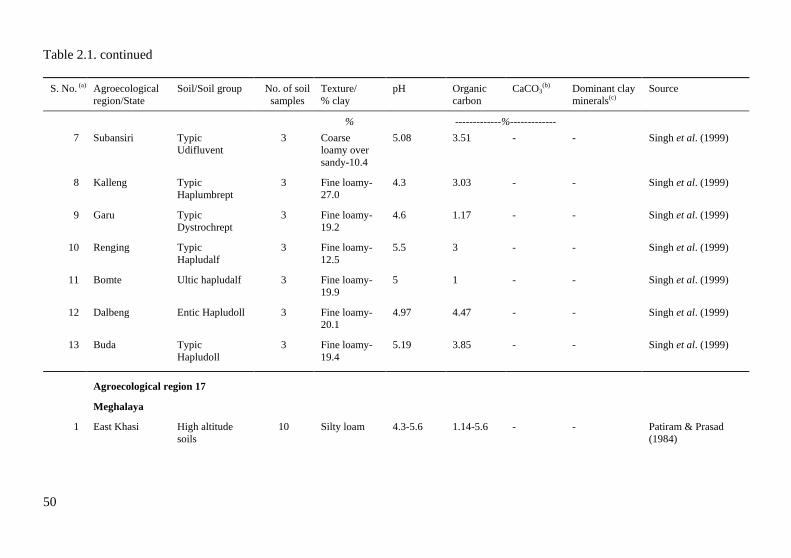
Table 2.1. continued
50
S. No. (a) Agroecological
region/State
Soil/Soil group No. of soil
samples
Texture/
% clay
pH Organic
carbon
CaCO3(b) Dominant clay
minerals(c)
Source
% -------------%-------------
7 Subansiri Typic
Udifluvent
3 Coarse
loamy over
sandy-10.4
5.08 3.51 - - Singh et al. (1999)
8 Kalleng Typic
Haplumbrept
3 Fine loamy-
27.0
4.3 3.03 - - Singh et al. (1999)
9 Garu Typic
Dystrochrept
3 Fine loamy-
19.2
4.6 1.17 - - Singh et al. (1999)
10 Renging Typic
Hapludalf
3 Fine loamy-
12.5
5.5 3 - - Singh et al. (1999)
11 Bomte Ultic hapludalf 3 Fine loamy-
19.9
5 1 - - Singh et al. (1999)
12 Dalbeng Entic Hapludoll 3 Fine loamy-
20.1
4.97 4.47 - - Singh et al. (1999)
13 Buda Typic
Hapludoll
3 Fine loamy-
19.4
5.19 3.85 - - Singh et al. (1999)
Agroecological region 17
Meghalaya
1 East Khasi High altitude
soils
10 Silty loam 4.3-5.6 1.14-5.6 - - Patiram & Prasad
(1984)
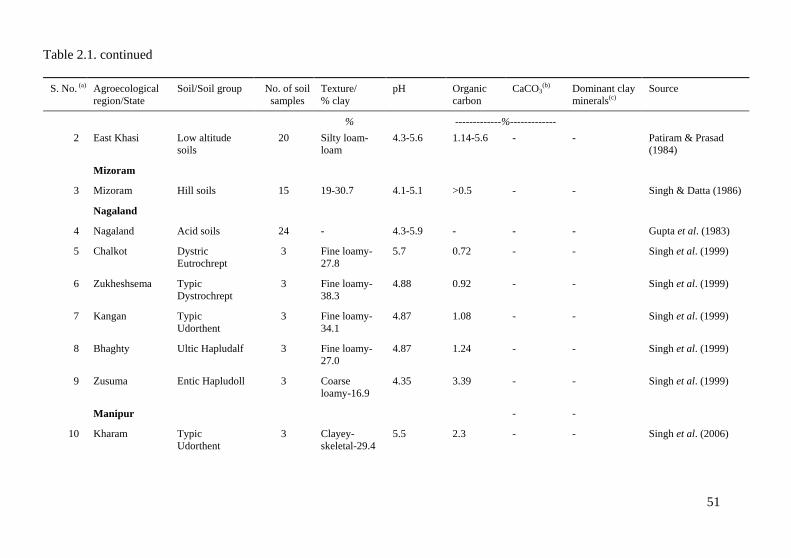
Table 2.1. continued
51
S. No. (a) Agroecological
region/State
Soil/Soil group No. of soil
samples
Texture/
% clay
pH Organic
carbon
CaCO3(b) Dominant clay
minerals(c)
Source
% -------------%-------------
2 East Khasi Low altitude
soils
20 Silty loam-
loam
4.3-5.6 1.14-5.6 - - Patiram & Prasad
(1984)
Mizoram
3 Mizoram Hill soils 15 19-30.7 4.1-5.1 >0.5 - - Singh & Datta (1986)
Nagaland
4 Nagaland Acid soils 24 - 4.3-5.9 - - - Gupta et al. (1983)
5 Chalkot Dystric
Eutrochrept
3 Fine loamy-
27.8
5.7 0.72 - - Singh et al. (1999)
6 Zukheshsema Typic
Dystrochrept
3 Fine loamy-
38.3
4.88 0.92 - - Singh et al. (1999)
7 Kangan Typic
Udorthent
3 Fine loamy-
34.1
4.87 1.08 - - Singh et al. (1999)
8 Bhaghty Ultic Hapludalf 3 Fine loamy-
27.0
4.87 1.24 - - Singh et al. (1999)
9 Zusuma Entic Hapludoll 3 Coarse
loamy-16.9
4.35 3.39 - - Singh et al. (1999)
Manipur - -
10 Kharam Typic
Udorthent
3 Clayey-
skeletal-29.4
5.5 2.3 - - Singh et al. (2006)
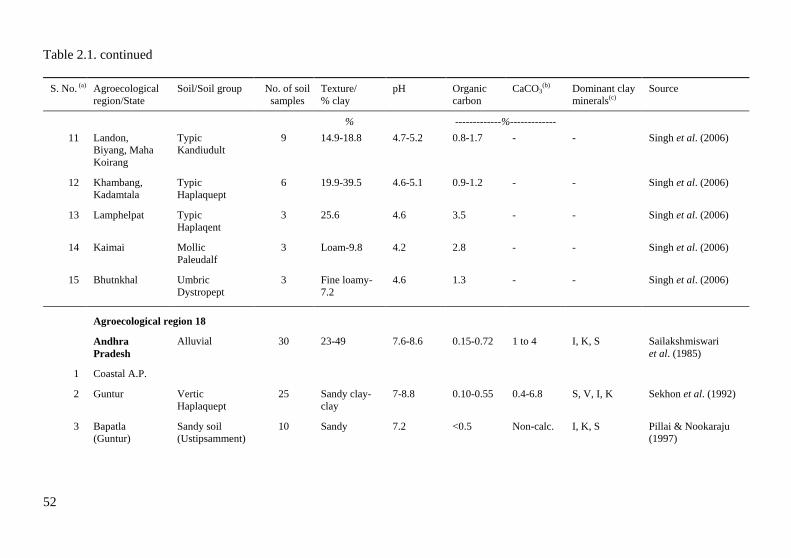
Table 2.1. continued
52
S. No. (a) Agroecological
region/State
Soil/Soil group No. of soil
samples
Texture/
% clay
pH Organic
carbon
CaCO3(b) Dominant clay
minerals(c)
Source
% -------------%-------------
11 Landon,
Biyang, Maha
Koirang
Typic
Kandiudult
9 14.9-18.8 4.7-5.2 0.8-1.7 - - Singh et al. (2006)
12 Khambang,
Kadamtala
Typic
Haplaquept
6 19.9-39.5 4.6-5.1 0.9-1.2 - - Singh et al. (2006)
13 Lamphelpat Typic
Haplaqent
3 25.6 4.6 3.5 - - Singh et al. (2006)
14 Kaimai Mollic
Paleudalf
3 Loam-9.8 4.2 2.8 - - Singh et al. (2006)
15 Bhutnkhal Umbric
Dystropept
3 Fine loamy-
7.2
4.6 1.3 - - Singh et al. (2006)
Agroecological region 18
Andhra
Pradesh
Alluvial 30 23-49 7.6-8.6 0.15-0.72 1 to 4 I, K, S Sailakshmiswari
et al. (1985)
1 Coastal A.P.
2 Guntur Vertic
Haplaquept
25 Sandy clay-
clay
7-8.8 0.10-0.55 0.4-6.8 S, V, I, K Sekhon et al. (1992)
3 Bapatla
(Guntur)
Sandy soil
(Ustipsamment)
10 Sandy 7.2 <0.5 Non-calc. I, K, S Pillai & Nookaraju
(1997)
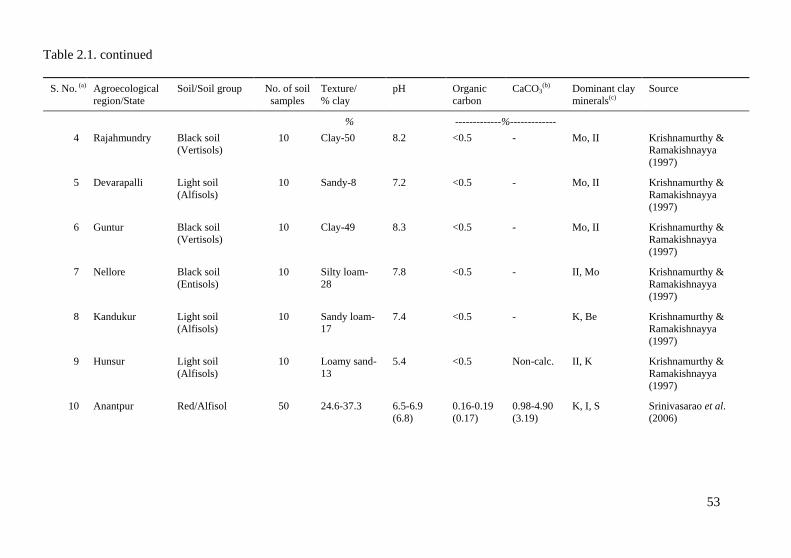
Table 2.1. continued
53
S. No. (a) Agroecological
region/State
Soil/Soil group No. of soil
samples
Texture/
% clay
pH Organic
carbon
CaCO3(b) Dominant clay
minerals(c)
Source
% -------------%-------------
4 Rajahmundry Black soil
(Vertisols)
10 Clay-50 8.2 <0.5 - Mo, II Krishnamurthy &
Ramakishnayya
(1997)
5 Devarapalli Light soil
(Alfisols)
10 Sandy-8 7.2 <0.5 - Mo, II Krishnamurthy &
Ramakishnayya
(1997)
6 Guntur Black soil
(Vertisols)
10 Clay-49 8.3 <0.5 - Mo, II Krishnamurthy &
Ramakishnayya
(1997)
7 Nellore Black soil
(Entisols)
10 Silty loam-
28
7.8 <0.5 - II, Mo Krishnamurthy &
Ramakishnayya
(1997)
8 Kandukur Light soil
(Alfisols)
10 Sandy loam-
17
7.4 <0.5 - K, Be Krishnamurthy &
Ramakishnayya
(1997)
9 Hunsur Light soil
(Alfisols)
10 Loamy sand-
13
5.4 <0.5 Non-calc. II, K Krishnamurthy &
Ramakishnayya
(1997)
10 Anantpur Red/Alfisol 50 24.6-37.3 6.5-6.9
(6.8)
0.16-0.19
(0.17)
0.98-4.90
(3.19)
K, I, S Srinivasarao et al.
(2006)
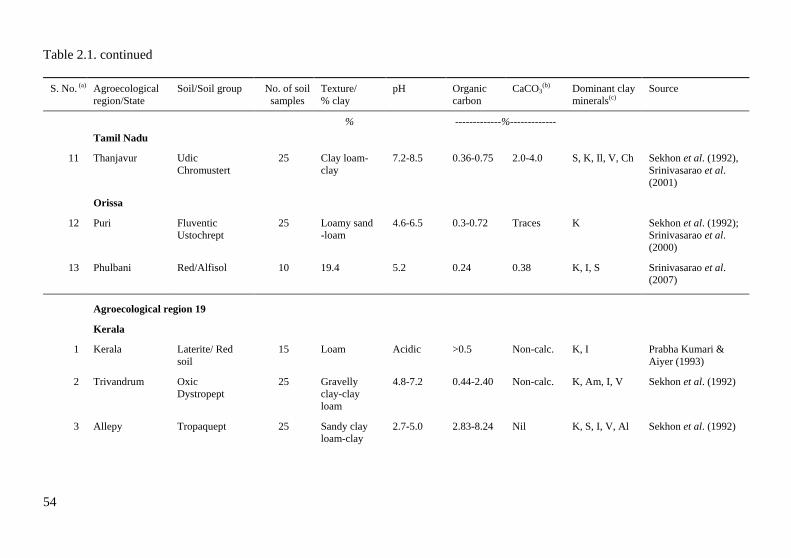
Table 2.1. continued
54
S. No. (a) Agroecological
region/State
Soil/Soil group No. of soil
samples
Texture/
% clay
pH Organic
carbon
CaCO3(b) Dominant clay
minerals(c)
Source
% -------------%-------------
Tamil Nadu
11 Thanjavur Udic
Chromustert
25 Clay loam-
clay
7.2-8.5 0.36-0.75 2.0-4.0 S, K, Il, V, Ch Sekhon et al. (1992),
Srinivasarao et al.
(2001)
Orissa
12 Puri Fluventic
Ustochrept
25 Loamy sand
-loam
4.6-6.5 0.3-0.72 Traces K Sekhon et al. (1992);
Srinivasarao et al.
(2000)
13 Phulbani Red/Alfisol 10 19.4 5.2 0.24 0.38 K, I, S Srinivasarao et al.
(2007)
Agroecological region 19
Kerala
1 Kerala Laterite/ Red
soil
15 Loam Acidic >0.5 Non-calc. K, I Prabha Kumari &
Aiyer (1993)
2 Trivandrum Oxic
Dystropept
25 Gravelly
clay-clay
loam
4.8-7.2 0.44-2.40 Non-calc. K, Am, I, V Sekhon et al. (1992)
3 Allepy Tropaquept 25 Sandy clay
loam-clay
2.7-5.0 2.83-8.24 Nil K, S, I, V, Al Sekhon et al. (1992)
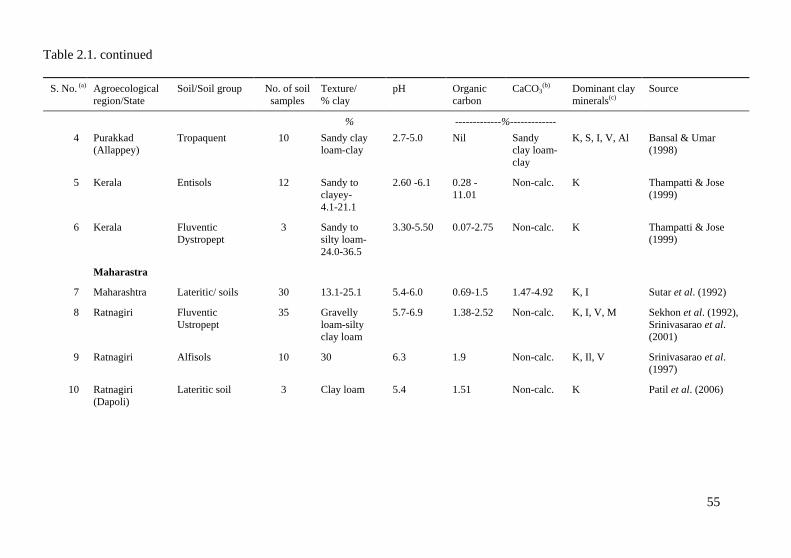
Table 2.1. continued
55
S. No. (a) Agroecological
region/State
Soil/Soil group No. of soil
samples
Texture/
% clay
pH Organic
carbon
CaCO3(b) Dominant clay
minerals(c)
Source
% -------------%-------------
4 Purakkad
(Allappey)
Tropaquent 10 Sandy clay
loam-clay
2.7-5.0 Nil Sandy
clay loam-
clay
K, S, I, V, Al Bansal & Umar
(1998)
5 Kerala Entisols 12 Sandy to
clayey-
4.1-21.1
2.60 -6.1 0.28 -
11.01
Non-calc. K Thampatti & Jose
(1999)
6 Kerala Fluventic
Dystropept
3 Sandy to
silty loam-
24.0-36.5
3.30-5.50 0.07-2.75 Non-calc. K Thampatti & Jose
(1999)
Maharastra
7 Maharashtra Lateritic/ soils 30 13.1-25.1 5.4-6.0 0.69-1.5 1.47-4.92 K, I Sutar et al. (1992)
8 Ratnagiri Fluventic
Ustropept
35 Gravelly
loam-silty
clay loam
5.7-6.9 1.38-2.52 Non-calc. K, I, V, M Sekhon et al. (1992),
Srinivasarao et al.
(2001)
9 Ratnagiri Alfisols 10 30 6.3 1.9 Non-calc. K, Il, V Srinivasarao et al.
(1997)
10 Ratnagiri
(Dapoli)
Lateritic soil 3 Clay loam 5.4 1.51 Non-calc. K Patil et al. (2006)
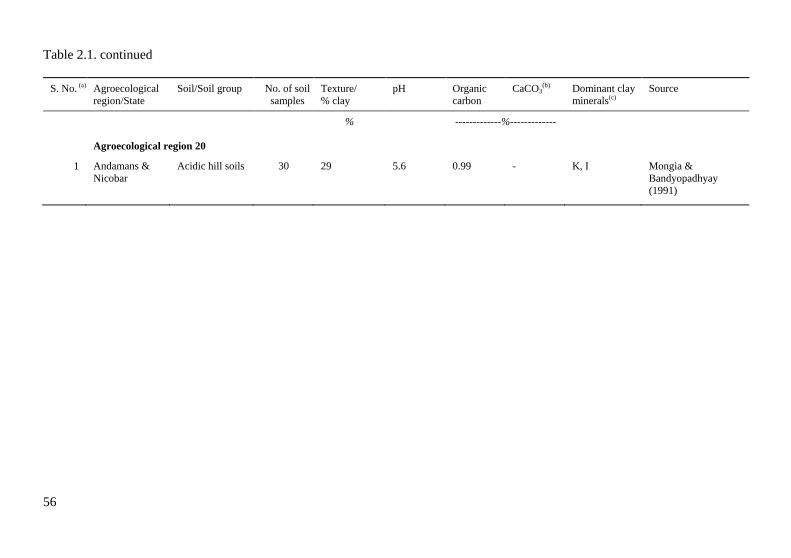
Table 2.1. continued
56
S. No. (a) Agroecological
region/State
Soil/Soil group No. of soil
samples
Texture/
% clay
pH Organic
carbon
CaCO3(b) Dominant clay
minerals(c)
Source
% -------------%-------------
Agroecological region 20
1 Andamans &
Nicobar
Acidic hill soils 30 29 5.6 0.99 - K, I Mongia &
Bandyopadhyay
(1991)
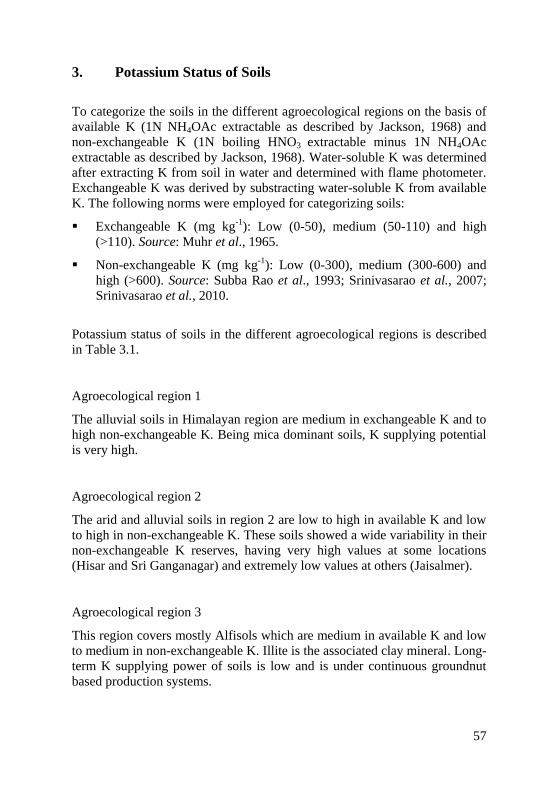
57
3. Potassium Status of Soils
To categorize the soils in the different agroecological regions on the basis of
available K (1N NH4OAc extractable as described by Jackson, 1968) and
non-exchangeable K (1N boiling HNO3 extractable minus 1N NH4OAc
extractable as described by Jackson, 1968). Water-soluble K was determined
after extracting K from soil in water and determined with flame photometer.
Exchangeable K was derived by substracting water-soluble K from available
K. The following norms were employed for categorizing soils:
Exchangeable K (mg kg-1): Low (0-50), medium (50-110) and high
(>110). Source: Muhr et al., 1965.
Non-exchangeable K (mg kg-1): Low (0-300), medium (300-600) and
high (>600). Source: Subba Rao et al., 1993; Srinivasarao et al., 2007;
Srinivasarao et al., 2010.
Potassium status of soils in the different agroecological regions is described
in Table 3.1.
Agroecological region 1
The alluvial soils in Himalayan region are medium in exchangeable K and to
high non-exchangeable K. Being mica dominant soils, K supplying potential
is very high.
Agroecological region 2
The arid and alluvial soils in region 2 are low to high in available K and low
to high in non-exchangeable K. These soils showed a wide variability in their
non-exchangeable K reserves, having very high values at some locations
(Hisar and Sri Ganganagar) and extremely low values at others (Jaisalmer).
Agroecological region 3
This region covers mostly Alfisols which are medium in available K and low
to medium in non-exchangeable K. Illite is the associated clay mineral. Long-
term K supplying power of soils is low and is under continuous groundnut
based production systems.
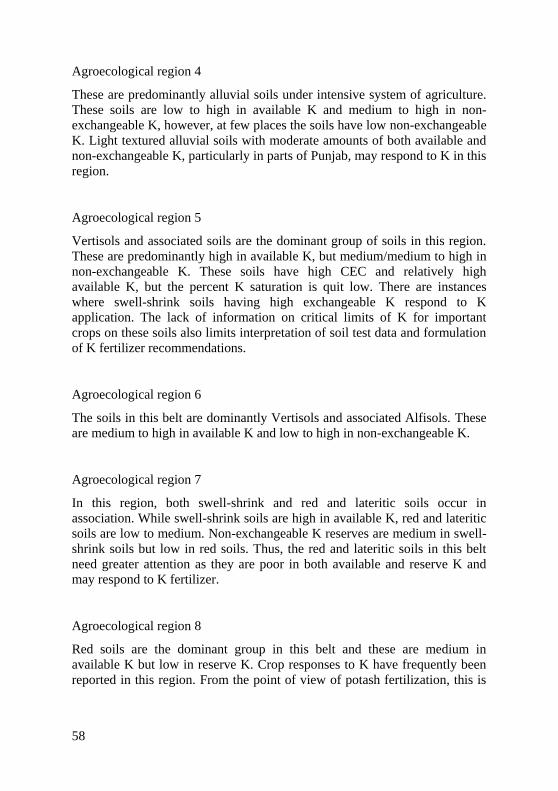
58
Agroecological region 4
These are predominantly alluvial soils under intensive system of agriculture.
These soils are low to high in available K and medium to high in non-
exchangeable K, however, at few places the soils have low non-exchangeable
K. Light textured alluvial soils with moderate amounts of both available and
non-exchangeable K, particularly in parts of Punjab, may respond to K in this
region.
Agroecological region 5
Vertisols and associated soils are the dominant group of soils in this region.
These are predominantly high in available K, but medium/medium to high in
non-exchangeable K. These soils have high CEC and relatively high
available K, but the percent K saturation is quit low. There are instances
where swell-shrink soils having high exchangeable K respond to K
application. The lack of information on critical limits of K for important
crops on these soils also limits interpretation of soil test data and formulation
of K fertilizer recommendations.
Agroecological region 6
The soils in this belt are dominantly Vertisols and associated Alfisols. These
are medium to high in available K and low to high in non-exchangeable K.
Agroecological region 7
In this region, both swell-shrink and red and lateritic soils occur in
association. While swell-shrink soils are high in available K, red and lateritic
soils are low to medium. Non-exchangeable K reserves are medium in swell-
shrink soils but low in red soils. Thus, the red and lateritic soils in this belt
need greater attention as they are poor in both available and reserve K and
may respond to K fertilizer.
Agroecological region 8
Red soils are the dominant group in this belt and these are medium in
available K but low in reserve K. Crop responses to K have frequently been
reported in this region. From the point of view of potash fertilization, this is
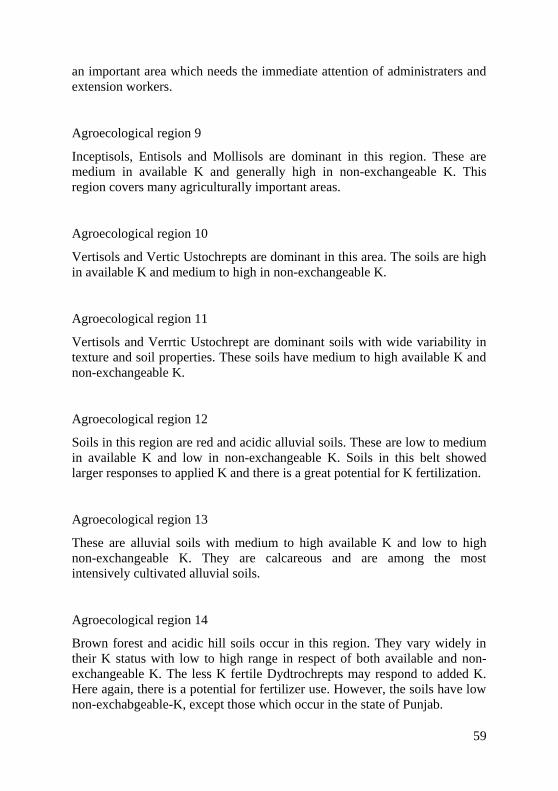
59
an important area which needs the immediate attention of administraters and
extension workers.
Agroecological region 9
Inceptisols, Entisols and Mollisols are dominant in this region. These are
medium in available K and generally high in non-exchangeable K. This
region covers many agriculturally important areas.
Agroecological region 10
Vertisols and Vertic Ustochrepts are dominant in this area. The soils are high
in available K and medium to high in non-exchangeable K.
Agroecological region 11
Vertisols and Verrtic Ustochrept are dominant soils with wide variability in
texture and soil properties. These soils have medium to high available K and
non-exchangeable K.
Agroecological region 12
Soils in this region are red and acidic alluvial soils. These are low to medium
in available K and low in non-exchangeable K. Soils in this belt showed
larger responses to applied K and there is a great potential for K fertilization.
Agroecological region 13
These are alluvial soils with medium to high available K and low to high
non-exchangeable K. They are calcareous and are among the most
intensively cultivated alluvial soils.
Agroecological region 14
Brown forest and acidic hill soils occur in this region. They vary widely in
their K status with low to high range in respect of both available and non-
exchangeable K. The less K fertile Dydtrochrepts may respond to added K.
Here again, there is a potential for fertilizer use. However, the soils have low
non-exchabgeable-K, except those which occur in the state of Punjab.
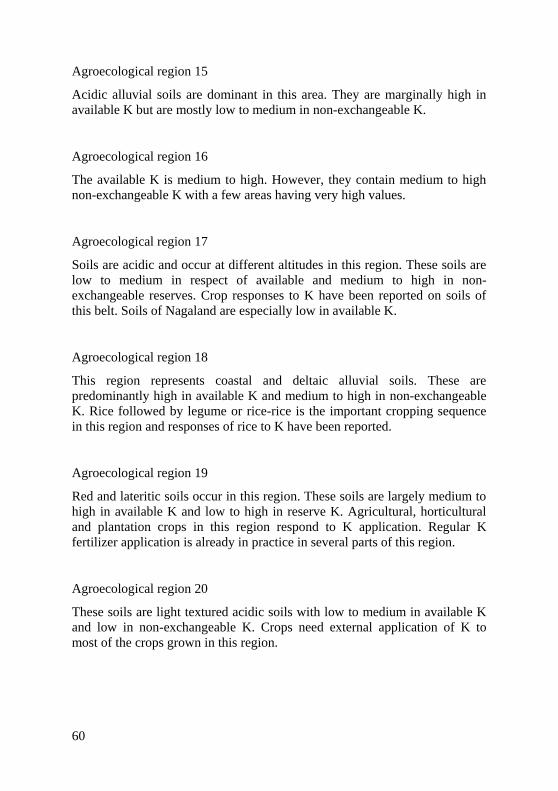
60
Agroecological region 15
Acidic alluvial soils are dominant in this area. They are marginally high in
available K but are mostly low to medium in non-exchangeable K.
Agroecological region 16
The available K is medium to high. However, they contain medium to high
non-exchangeable K with a few areas having very high values.
Agroecological region 17
Soils are acidic and occur at different altitudes in this region. These soils are
low to medium in respect of available and medium to high in non-
exchangeable reserves. Crop responses to K have been reported on soils of
this belt. Soils of Nagaland are especially low in available K.
Agroecological region 18
This region represents coastal and deltaic alluvial soils. These are
predominantly high in available K and medium to high in non-exchangeable
K. Rice followed by legume or rice-rice is the important cropping sequence
in this region and responses of rice to K have been reported.
Agroecological region 19
Red and lateritic soils occur in this region. These soils are largely medium to
high in available K and low to high in reserve K. Agricultural, horticultural
and plantation crops in this region respond to K application. Regular K
fertilizer application is already in practice in several parts of this region.
Agroecological region 20
These soils are light textured acidic soils with low to medium in available K
and low in non-exchangeable K. Crops need external application of K to
most of the crops grown in this region.
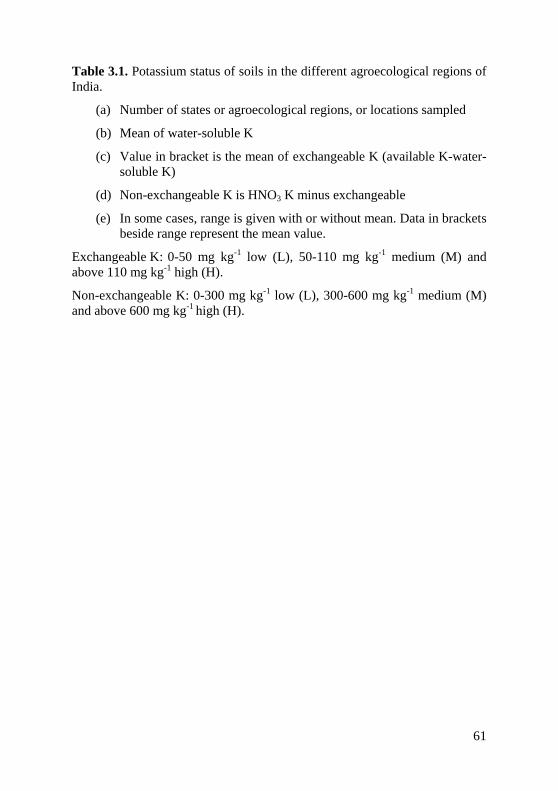
61
Table 3.1. Potassium status of soils in the different agroecological regions of
India.
(a) Number of states or agroecological regions, or locations sampled
(b) Mean of water-soluble K
(c) Value in bracket is the mean of exchangeable K (available K-water-
soluble K)
(d) Non-exchangeable K is HNO3 K minus exchangeable
(e) In some cases, range is given with or without mean. Data in brackets
beside range represent the mean value.
Exchangeable K: 0-50 mg kg-1 low (L), 50-110 mg kg-1 medium (M) and
above 110 mg kg-1 high (H).
Non-exchangeable K: 0-300 mg kg-1 low (L), 300-600 mg kg-1 medium (M)
and above 600 mg kg-1 high (H).
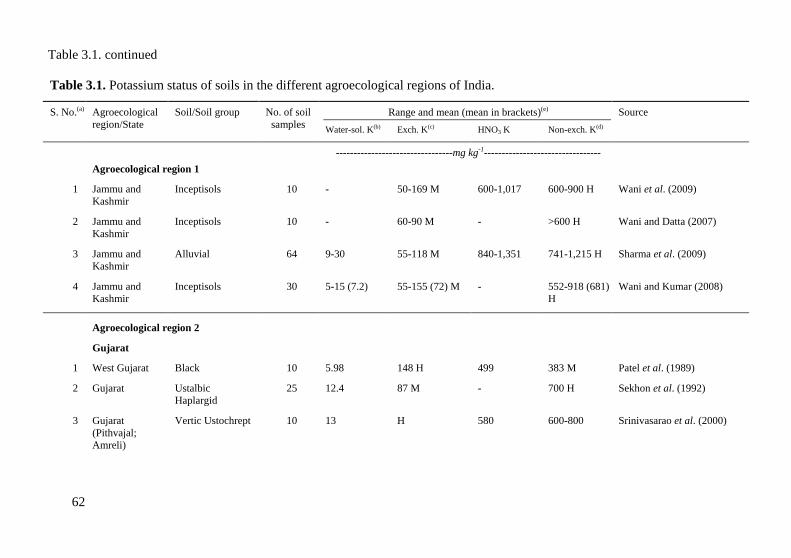
Table 3.1. continued
62
Table 3.1. Potassium status of soils in the different agroecological regions of India.
S. No.(a) Agroecological
region/State
Soil/Soil group No. of soil
samples
Range and mean (mean in brackets)(e) Source
Water-sol. K(b) Exch. K(c) HNO3 K Non-exch. K(d)
---------------------------------mg kg-1---------------------------------
Agroecological region 1
1 Jammu and
Kashmir
Inceptisols 10 - 50-169 M 600-1,017 600-900 H Wani et al. (2009)
2 Jammu and
Kashmir
Inceptisols 10 - 60-90 M - >600 H Wani and Datta (2007)
3 Jammu and
Kashmir
Alluvial 64 9-30 55-118 M 840-1,351 741-1,215 H Sharma et al. (2009)
4 Jammu and
Kashmir
Inceptisols 30 5-15 (7.2) 55-155 (72) M - 552-918 (681)
H
Wani and Kumar (2008)
Agroecological region 2
Gujarat
1 West Gujarat Black 10 5.98 148 H 499 383 M Patel et al. (1989)
2 Gujarat Ustalbic
Haplargid
25 12.4 87 M - 700 H Sekhon et al. (1992)
3 Gujarat
(Pithvajal;
Amreli)
Vertic Ustochrept 10 13 H 580 600-800 Srinivasarao et al. (2000)
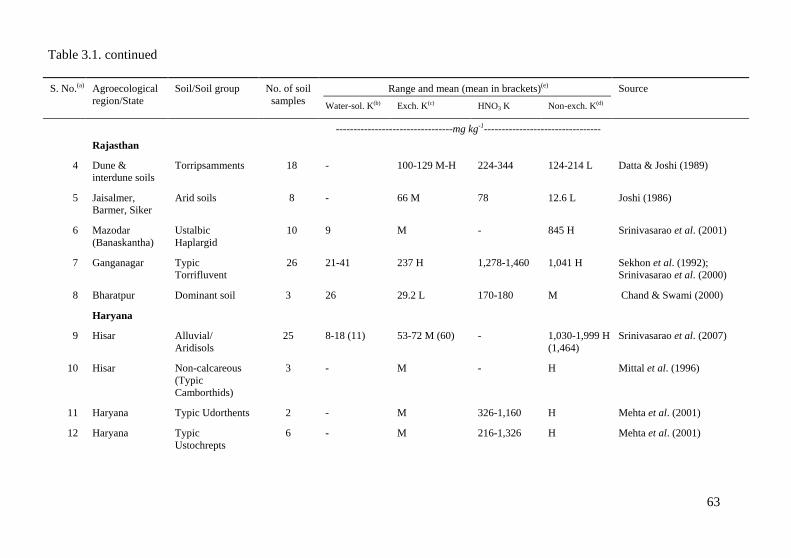
Table 3.1. continued
63
S. No.(a) Agroecological
region/State
Soil/Soil group No. of soil
samples
Range and mean (mean in brackets)(e) Source
Water-sol. K(b) Exch. K(c) HNO3 K Non-exch. K(d)
---------------------------------mg kg-1---------------------------------
Rajasthan
4 Dune &
interdune soils
Torripsamments 18 - 100-129 M-H 224-344 124-214 L Datta & Joshi (1989)
5 Jaisalmer,
Barmer, Siker
Arid soils 8 - 66 M 78 12.6 L Joshi (1986)
6 Mazodar
(Banaskantha)
Ustalbic
Haplargid
10 9 M - 845 H Srinivasarao et al. (2001)
7 Ganganagar Typic
Torrifluvent
26 21-41 237 H 1,278-1,460 1,041 H Sekhon et al. (1992);
Srinivasarao et al. (2000)
8 Bharatpur Dominant soil 3 26 29.2 L 170-180 M Chand & Swami (2000)
Haryana
9 Hisar Alluvial/
Aridisols
25 8-18 (11) 53-72 M (60) - 1,030-1,999 H
(1,464)
Srinivasarao et al. (2007)
10 Hisar Non-calcareous
(Typic
Camborthids)
3 - M - H Mittal et al. (1996)
11 Haryana Typic Udorthents 2 - M 326-1,160 H Mehta et al. (2001)
12 Haryana Typic
Ustochrepts
6 - M 216-1,326 H Mehta et al. (2001)
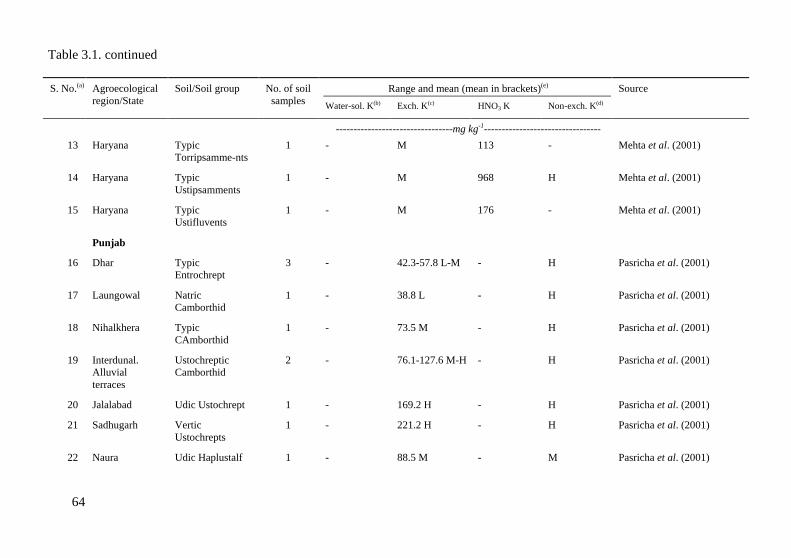
Table 3.1. continued
64
S. No.(a) Agroecological
region/State
Soil/Soil group No. of soil
samples
Range and mean (mean in brackets)(e) Source
Water-sol. K(b) Exch. K(c) HNO3 K Non-exch. K(d)
---------------------------------mg kg-1---------------------------------
13 Haryana Typic
Torripsamme-nts
1 - M 113 - Mehta et al. (2001)
14 Haryana Typic
Ustipsamments
1 - M 968 H Mehta et al. (2001)
15 Haryana Typic
Ustifluvents
1 - M 176 - Mehta et al. (2001)
Punjab
16 Dhar Typic
Entrochrept
3 - 42.3-57.8 L-M - H Pasricha et al. (2001)
17 Laungowal Natric
Camborthid
1 - 38.8 L - H Pasricha et al. (2001)
18 Nihalkhera Typic
CAmborthid
1 - 73.5 M - H Pasricha et al. (2001)
19 Interdunal.
Alluvial
terraces
Ustochreptic
Camborthid
2 - 76.1-127.6 M-H - H Pasricha et al. (2001)
20 Jalalabad Udic Ustochrept 1 - 169.2 H - H Pasricha et al. (2001)
21 Sadhugarh Vertic
Ustochrepts
1 - 221.2 H - H Pasricha et al. (2001)
22 Naura Udic Haplustalf 1 - 88.5 M - M Pasricha et al. (2001)
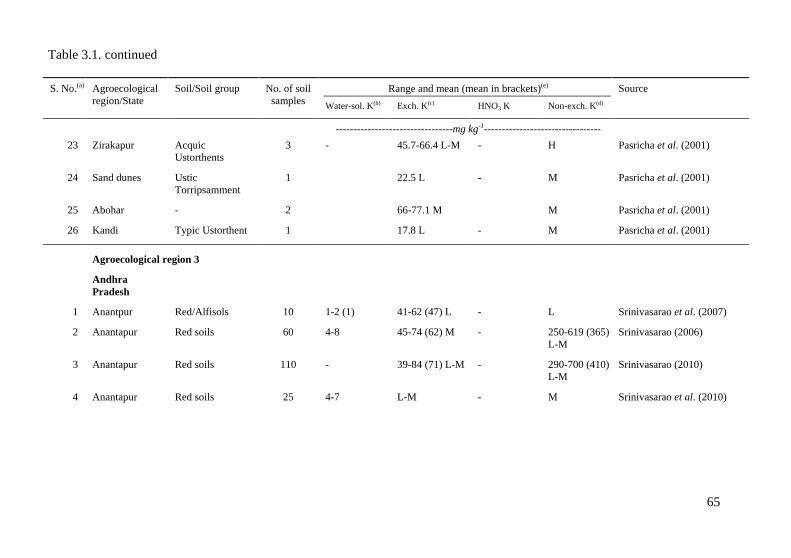
Table 3.1. continued
65
S. No.(a) Agroecological
region/State
Soil/Soil group No. of soil
samples
Range and mean (mean in brackets)(e) Source
Water-sol. K(b) Exch. K(c) HNO3 K Non-exch. K(d)
---------------------------------mg kg-1---------------------------------
23 Zirakapur Acquic
Ustorthents
3 - 45.7-66.4 L-M - H Pasricha et al. (2001)
24 Sand dunes Ustic
Torripsamment
1 22.5 L - M Pasricha et al. (2001)
25 Abohar - 2 66-77.1 M M Pasricha et al. (2001)
26 Kandi Typic Ustorthent 1 17.8 L - M Pasricha et al. (2001)
Agroecological region 3
Andhra
Pradesh
1 Anantpur Red/Alfisols 10 1-2 (1) 41-62 (47) L - L Srinivasarao et al. (2007)
2 Anantapur Red soils 60 4-8 45-74 (62) M - 250-619 (365)
L-M
Srinivasarao (2006)
3 Anantapur Red soils 110 - 39-84 (71) L-M - 290-700 (410)
L-M
Srinivasarao (2010)
4 Anantapur Red soils 25 4-7 L-M - M Srinivasarao et al. (2010)
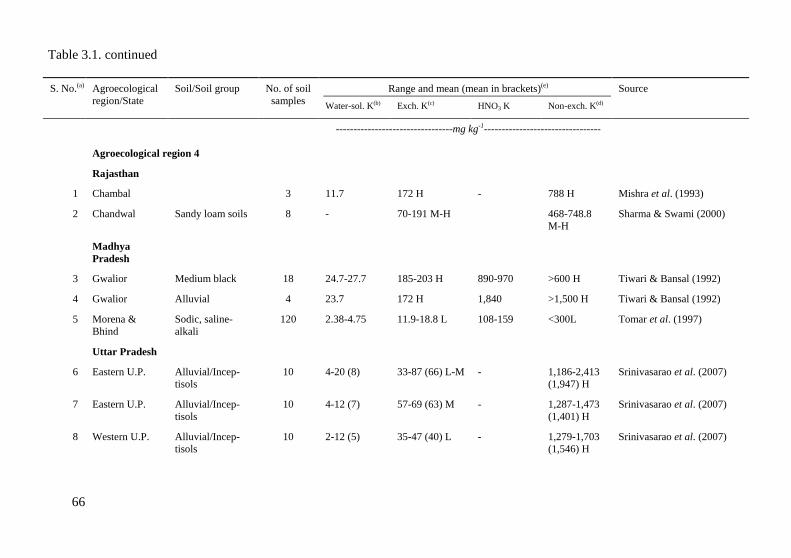
Table 3.1. continued
66
S. No.(a) Agroecological
region/State
Soil/Soil group No. of soil
samples
Range and mean (mean in brackets)(e) Source
Water-sol. K(b) Exch. K(c) HNO3 K Non-exch. K(d)
---------------------------------mg kg-1---------------------------------
Agroecological region 4
Rajasthan
1 Chambal 3 11.7 172 H - 788 H Mishra et al. (1993)
2 Chandwal Sandy loam soils 8 - 70-191 M-H 468-748.8
M-H
Sharma & Swami (2000)
Madhya
Pradesh
3 Gwalior Medium black 18 24.7-27.7 185-203 H 890-970 >600 H Tiwari & Bansal (1992)
4 Gwalior Alluvial 4 23.7 172 H 1,840 >1,500 H Tiwari & Bansal (1992)
5 Morena &
Bhind
Sodic, saline-
alkali
120 2.38-4.75 11.9-18.8 L 108-159 <300L Tomar et al. (1997)
Uttar Pradesh
6 Eastern U.P. Alluvial/Incep-
tisols
10 4-20 (8) 33-87 (66) L-M - 1,186-2,413
(1,947) H
Srinivasarao et al. (2007)
7 Eastern U.P. Alluvial/Incep-
tisols
10 4-12 (7) 57-69 (63) M - 1,287-1,473
(1,401) H
Srinivasarao et al. (2007)
8 Western U.P. Alluvial/Incep-
tisols
10 2-12 (5) 35-47 (40) L - 1,279-1,703
(1,546) H
Srinivasarao et al. (2007)
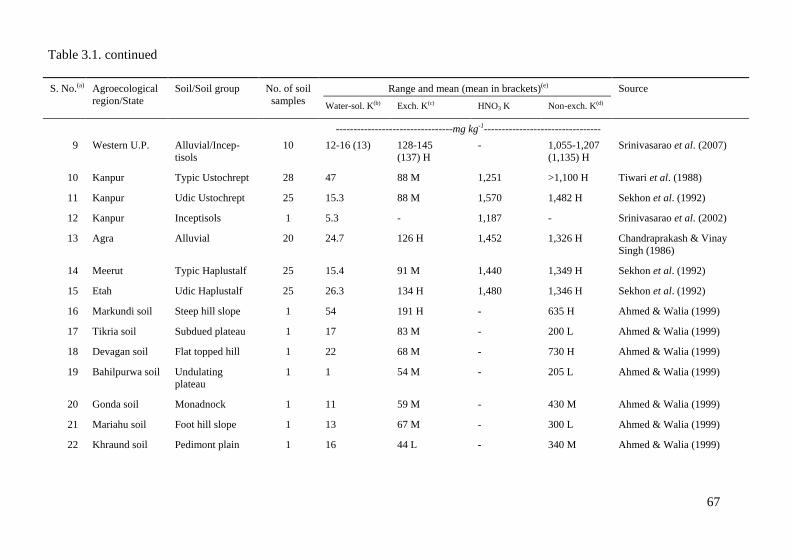
Table 3.1. continued
67
S. No.(a) Agroecological
region/State
Soil/Soil group No. of soil
samples
Range and mean (mean in brackets)(e) Source
Water-sol. K(b) Exch. K(c) HNO3 K Non-exch. K(d)
---------------------------------mg kg-1---------------------------------
9 Western U.P. Alluvial/Incep-
tisols
10 12-16 (13) 128-145
(137) H
- 1,055-1,207
(1,135) H
Srinivasarao et al. (2007)
10 Kanpur Typic Ustochrept 28 47 88 M 1,251 >1,100 H Tiwari et al. (1988)
11 Kanpur Udic Ustochrept 25 15.3 88 M 1,570 1,482 H Sekhon et al. (1992)
12 Kanpur Inceptisols 1 5.3 - 1,187 - Srinivasarao et al. (2002)
13 Agra Alluvial 20 24.7 126 H 1,452 1,326 H Chandraprakash & Vinay
Singh (1986)
14 Meerut Typic Haplustalf 25 15.4 91 M 1,440 1,349 H Sekhon et al. (1992)
15 Etah Udic Haplustalf 25 26.3 134 H 1,480 1,346 H Sekhon et al. (1992)
16 Markundi soil Steep hill slope 1 54 191 H - 635 H Ahmed & Walia (1999)
17 Tikria soil Subdued plateau 1 17 83 M - 200 L Ahmed & Walia (1999)
18 Devagan soil Flat topped hill 1 22 68 M - 730 H Ahmed & Walia (1999)
19 Bahilpurwa soil Undulating
plateau
1 1 54 M - 205 L Ahmed & Walia (1999)
20 Gonda soil Monadnock 1 11 59 M - 430 M Ahmed & Walia (1999)
21 Mariahu soil Foot hill slope 1 13 67 M - 300 L Ahmed & Walia (1999)
22 Khraund soil Pedimont plain 1 16 44 L - 340 M Ahmed & Walia (1999)
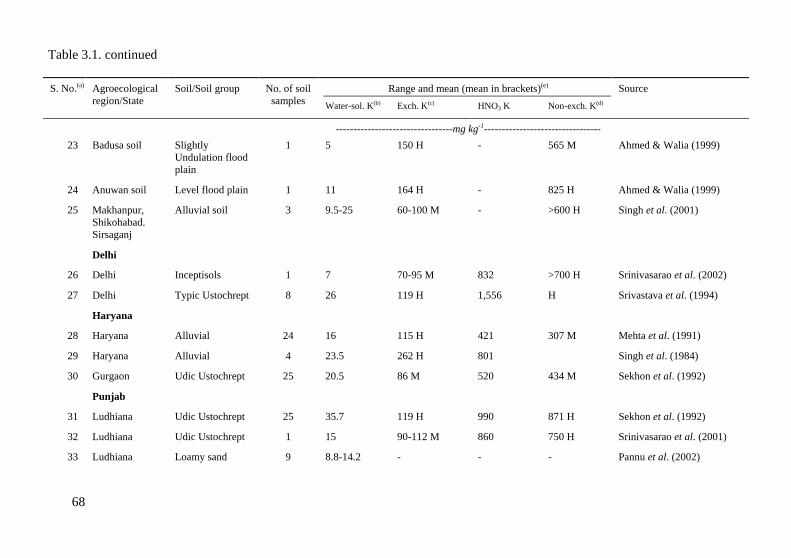
Table 3.1. continued
68
S. No.(a) Agroecological
region/State
Soil/Soil group No. of soil
samples
Range and mean (mean in brackets)(e) Source
Water-sol. K(b) Exch. K(c) HNO3 K Non-exch. K(d)
---------------------------------mg kg-1---------------------------------
23 Badusa soil Slightly
Undulation flood
plain
1 5 150 H - 565 M Ahmed & Walia (1999)
24 Anuwan soil Level flood plain 1 11 164 H - 825 H Ahmed & Walia (1999)
25 Makhanpur,
Shikohabad.
Sirsaganj
Alluvial soil 3 9.5-25 60-100 M - >600 H Singh et al. (2001)
Delhi
26 Delhi Inceptisols 1 7 70-95 M 832 >700 H Srinivasarao et al. (2002)
27 Delhi Typic Ustochrept 8 26 119 H 1,556 H Srivastava et al. (1994)
Haryana
28 Haryana Alluvial 24 16 115 H 421 307 M Mehta et al. (1991)
29 Haryana Alluvial 4 23.5 262 H 801 Singh et al. (1984)
30 Gurgaon Udic Ustochrept 25 20.5 86 M 520 434 M Sekhon et al. (1992)
Punjab
31 Ludhiana Udic Ustochrept 25 35.7 119 H 990 871 H Sekhon et al. (1992)
32 Ludhiana Udic Ustochrept 1 15 90-112 M 860 750 H Srinivasarao et al. (2001)
33 Ludhiana Loamy sand 9 8.8-14.2 - - - Pannu et al. (2002)
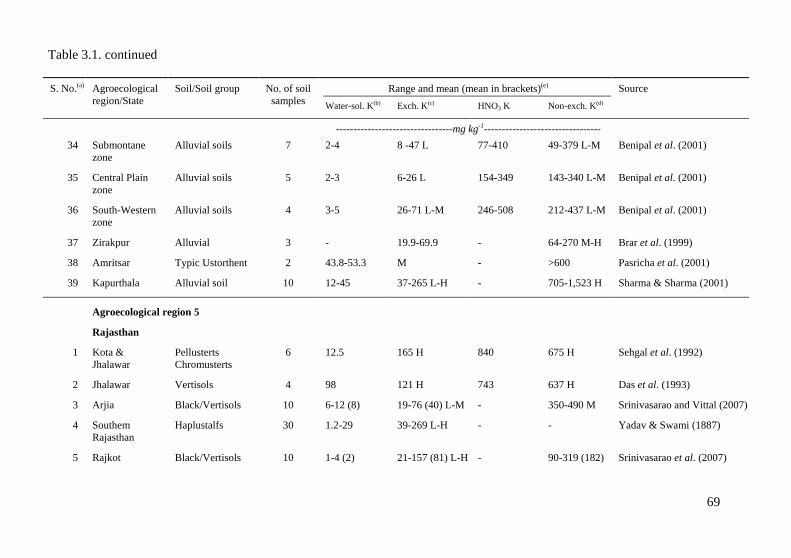
Table 3.1. continued
69
S. No.(a) Agroecological
region/State
Soil/Soil group No. of soil
samples
Range and mean (mean in brackets)(e) Source
Water-sol. K(b) Exch. K(c) HNO3 K Non-exch. K(d)
---------------------------------mg kg-1---------------------------------
34 Submontane
zone
Alluvial soils 7 2-4 8 -47 L 77-410 49-379 L-M Benipal et al. (2001)
35 Central Plain
zone
Alluvial soils 5 2-3 6-26 L 154-349 143-340 L-M Benipal et al. (2001)
36 South-Western
zone
Alluvial soils 4 3-5 26-71 L-M 246-508 212-437 L-M Benipal et al. (2001)
37 Zirakpur Alluvial 3 - 19.9-69.9 - 64-270 M-H Brar et al. (1999)
38 Amritsar Typic Ustorthent 2 43.8-53.3 M - >600 Pasricha et al. (2001)
39 Kapurthala Alluvial soil 10 12-45 37-265 L-H - 705-1,523 H Sharma & Sharma (2001)
Agroecological region 5
Rajasthan
1 Kota &
Jhalawar
Pellusterts
Chromusterts
6 12.5 165 H 840 675 H Sehgal et al. (1992)
2 Jhalawar Vertisols 4 98 121 H 743 637 H Das et al. (1993)
3 Arjia Black/Vertisols 10 6-12 (8) 19-76 (40) L-M - 350-490 M Srinivasarao and Vittal (2007)
4 Southem
Rajasthan
Haplustalfs 30 1.2-29 39-269 L-H - - Yadav & Swami (1887)
5 Rajkot Black/Vertisols 10 1-4 (2) 21-157 (81) L-H - 90-319 (182) Srinivasarao et al. (2007)
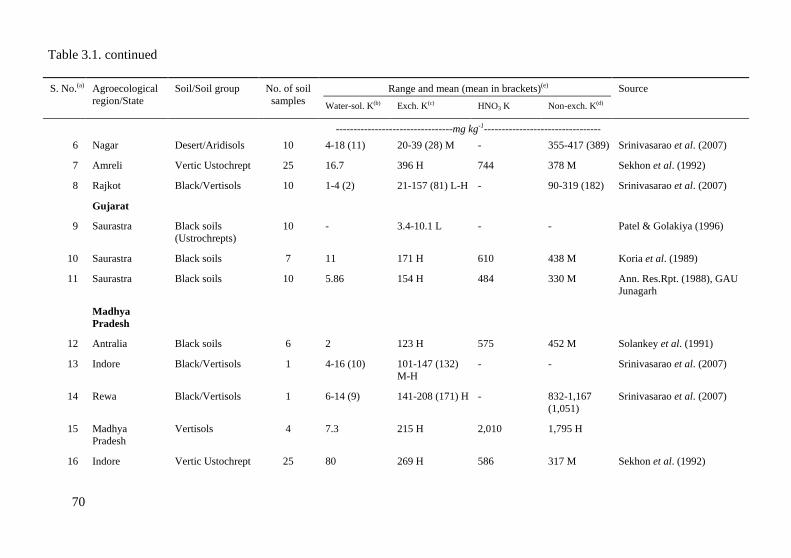
Table 3.1. continued
70
S. No.(a) Agroecological
region/State
Soil/Soil group No. of soil
samples
Range and mean (mean in brackets)(e) Source
Water-sol. K(b) Exch. K(c) HNO3 K Non-exch. K(d)
---------------------------------mg kg-1---------------------------------
6 Nagar Desert/Aridisols 10 4-18 (11) 20-39 (28) M - 355-417 (389) Srinivasarao et al. (2007)
7 Amreli Vertic Ustochrept 25 16.7 396 H 744 378 M Sekhon et al. (1992)
8 Rajkot Black/Vertisols 10 1-4 (2) 21-157 (81) L-H - 90-319 (182) Srinivasarao et al. (2007)
Gujarat
9 Saurastra Black soils
(Ustrochrepts)
10 - 3.4-10.1 L - - Patel & Golakiya (1996)
10 Saurastra Black soils 7 11 171 H 610 438 M Koria et al. (1989)
11 Saurastra Black soils 10 5.86 154 H 484 330 M Ann. Res.Rpt. (1988), GAU
Junagarh
Madhya
Pradesh
12 Antralia Black soils 6 2 123 H 575 452 M Solankey et al. (1991)
13 Indore Black/Vertisols 1 4-16 (10) 101-147 (132)
M-H
- - Srinivasarao et al. (2007)
14 Rewa Black/Vertisols 1 6-14 (9) 141-208 (171) H - 832-1,167
(1,051)
Srinivasarao et al. (2007)
15 Madhya
Pradesh
Vertisols 4 7.3 215 H 2,010 1,795 H
16 Indore Vertic Ustochrept 25 80 269 H 586 317 M Sekhon et al. (1992)
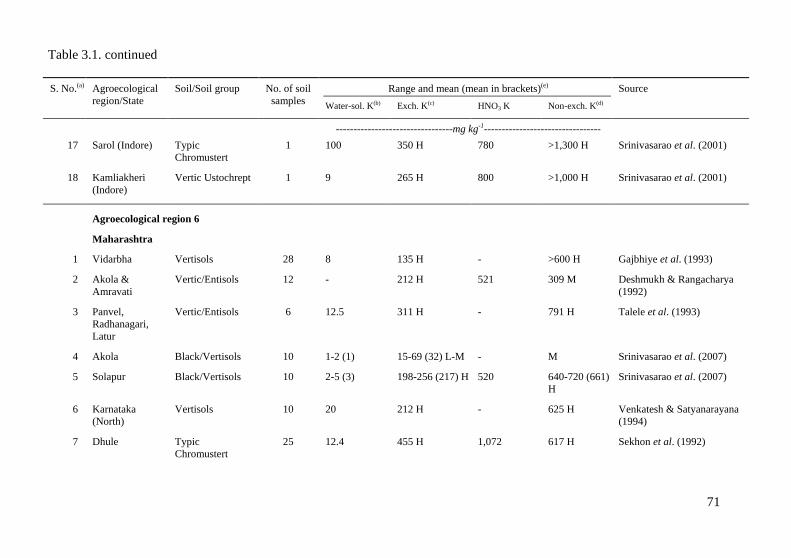
Table 3.1. continued
71
S. No.(a) Agroecological
region/State
Soil/Soil group No. of soil
samples
Range and mean (mean in brackets)(e) Source
Water-sol. K(b) Exch. K(c) HNO3 K Non-exch. K(d)
---------------------------------mg kg-1---------------------------------
17 Sarol (Indore) Typic
Chromustert
1 100 350 H 780 >1,300 H Srinivasarao et al. (2001)
18 Kamliakheri
(Indore)
Vertic Ustochrept 1 9 265 H 800 >1,000 H Srinivasarao et al. (2001)
Agroecological region 6
Maharashtra
1 Vidarbha Vertisols 28 8 135 H - >600 H Gajbhiye et al. (1993)
2 Akola &
Amravati
Vertic/Entisols 12 - 212 H 521 309 M Deshmukh & Rangacharya
(1992)
3 Panvel,
Radhanagari,
Latur
Vertic/Entisols 6 12.5 311 H - 791 H Talele et al. (1993)
4 Akola Black/Vertisols 10 1-2 (1) 15-69 (32) L-M - M Srinivasarao et al. (2007)
5 Solapur Black/Vertisols 10 2-5 (3) 198-256 (217) H 520 640-720 (661)
H
Srinivasarao et al. (2007)
6 Karnataka
(North)
Vertisols 10 20 212 H - 625 H Venkatesh & Satyanarayana
(1994)
7 Dhule Typic
Chromustert
25 12.4 455 H 1,072 617 H Sekhon et al. (1992)
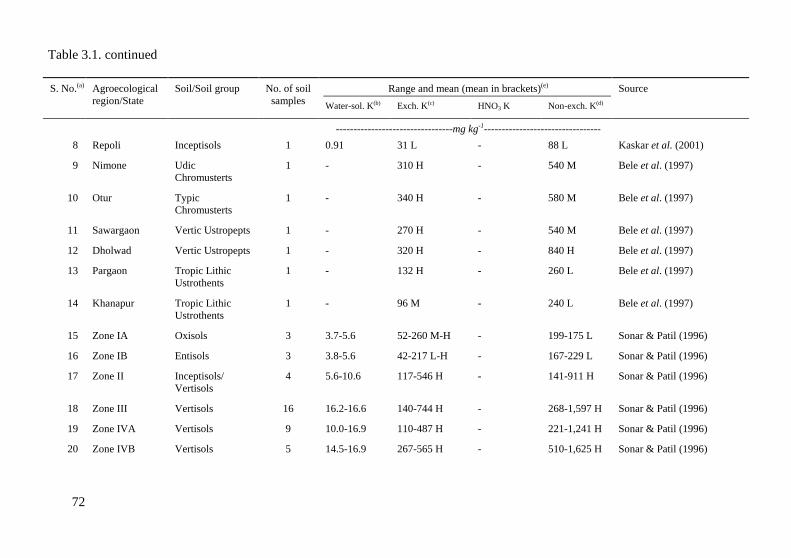
Table 3.1. continued
72
S. No.(a) Agroecological
region/State
Soil/Soil group No. of soil
samples
Range and mean (mean in brackets)(e) Source
Water-sol. K(b) Exch. K(c) HNO3 K Non-exch. K(d)
---------------------------------mg kg-1---------------------------------
8 Repoli Inceptisols 1 0.91 31 L - 88 L Kaskar et al. (2001)
9 Nimone Udic
Chromusterts
1 - 310 H - 540 M Bele et al. (1997)
10 Otur Typic
Chromusterts
1 - 340 H - 580 M Bele et al. (1997)
11 Sawargaon Vertic Ustropepts 1 - 270 H - 540 M Bele et al. (1997)
12 Dholwad Vertic Ustropepts 1 - 320 H - 840 H Bele et al. (1997)
13 Pargaon Tropic Lithic
Ustrothents
1 - 132 H - 260 L Bele et al. (1997)
14 Khanapur Tropic Lithic
Ustrothents
1 - 96 M - 240 L Bele et al. (1997)
15 Zone IA Oxisols 3 3.7-5.6 52-260 M-H - 199-175 L Sonar & Patil (1996)
16 Zone IB Entisols 3 3.8-5.6 42-217 L-H - 167-229 L Sonar & Patil (1996)
17 Zone II Inceptisols/
Vertisols
4 5.6-10.6 117-546 H - 141-911 H Sonar & Patil (1996)
18 Zone III Vertisols 16 16.2-16.6 140-744 H - 268-1,597 H Sonar & Patil (1996)
19 Zone IVA Vertisols 9 10.0-16.9 110-487 H - 221-1,241 H Sonar & Patil (1996)
20 Zone IVB Vertisols 5 14.5-16.9 267-565 H - 510-1,625 H Sonar & Patil (1996)
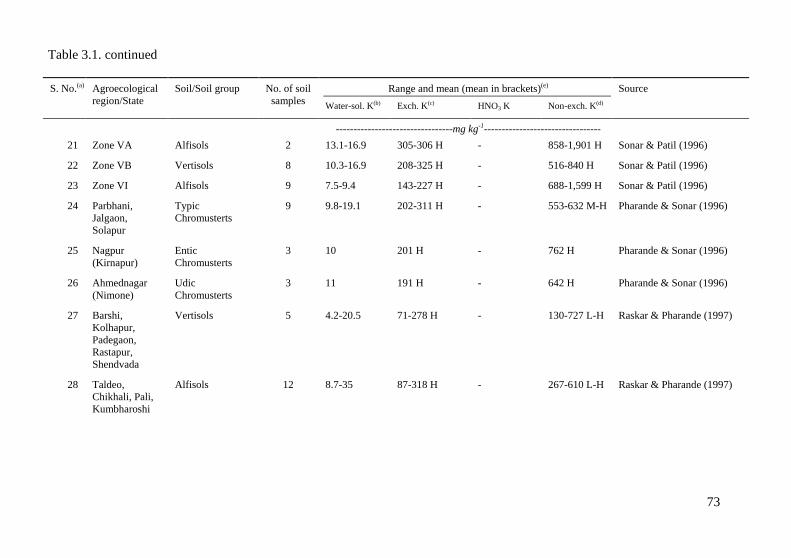
Table 3.1. continued
73
S. No.(a) Agroecological
region/State
Soil/Soil group No. of soil
samples
Range and mean (mean in brackets)(e) Source
Water-sol. K(b) Exch. K(c) HNO3 K Non-exch. K(d)
---------------------------------mg kg-1---------------------------------
21 Zone VA Alfisols 2 13.1-16.9 305-306 H - 858-1,901 H Sonar & Patil (1996)
22 Zone VB Vertisols 8 10.3-16.9 208-325 H - 516-840 H Sonar & Patil (1996)
23 Zone VI Alfisols 9 7.5-9.4 143-227 H - 688-1,599 H Sonar & Patil (1996)
24 Parbhani,
Jalgaon,
Solapur
Typic
Chromusterts
9 9.8-19.1 202-311 H - 553-632 M-H Pharande & Sonar (1996)
25 Nagpur
(Kirnapur)
Entic
Chromusterts
3 10 201 H - 762 H Pharande & Sonar (1996)
26 Ahmednagar
(Nimone)
Udic
Chromusterts
3 11 191 H - 642 H Pharande & Sonar (1996)
27 Barshi,
Kolhapur,
Padegaon,
Rastapur,
Shendvada
Vertisols 5 4.2-20.5 71-278 H - 130-727 L-H Raskar & Pharande (1997)
28 Taldeo,
Chikhali, Pali,
Kumbharoshi
Alfisols 12 8.7-35 87-318 H - 267-610 L-H Raskar & Pharande (1997)
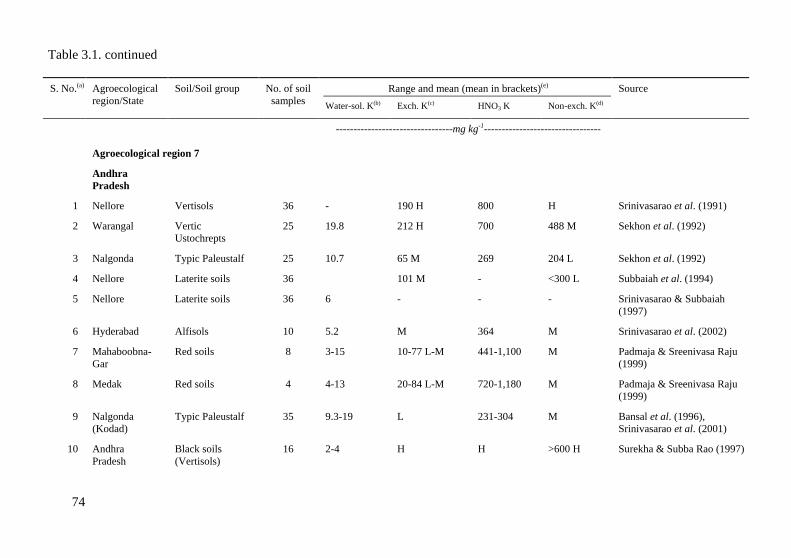
Table 3.1. continued
74
S. No.(a) Agroecological
region/State
Soil/Soil group No. of soil
samples
Range and mean (mean in brackets)(e) Source
Water-sol. K(b) Exch. K(c) HNO3 K Non-exch. K(d)
---------------------------------mg kg-1---------------------------------
Agroecological region 7
Andhra
Pradesh
1 Nellore Vertisols 36 - 190 H 800 H Srinivasarao et al. (1991)
2 Warangal Vertic
Ustochrepts
25 19.8 212 H 700 488 M Sekhon et al. (1992)
3 Nalgonda Typic Paleustalf 25 10.7 65 M 269 204 L Sekhon et al. (1992)
4 Nellore Laterite soils 36 101 M - <300 L Subbaiah et al. (1994)
5 Nellore Laterite soils 36 6 - - - Srinivasarao & Subbaiah
(1997)
6 Hyderabad Alfisols 10 5.2 M 364 M Srinivasarao et al. (2002)
7 Mahaboobna-
Gar
Red soils 8 3-15 10-77 L-M 441-1,100 M Padmaja & Sreenivasa Raju
(1999)
8 Medak Red soils 4 4-13 20-84 L-M 720-1,180 M Padmaja & Sreenivasa Raju
(1999)
9 Nalgonda
(Kodad)
Typic Paleustalf 35 9.3-19 L 231-304 M Bansal et al. (1996),
Srinivasarao et al. (2001)
10 Andhra
Pradesh
Black soils
(Vertisols)
16 2-4 H H >600 H Surekha & Subba Rao (1997)
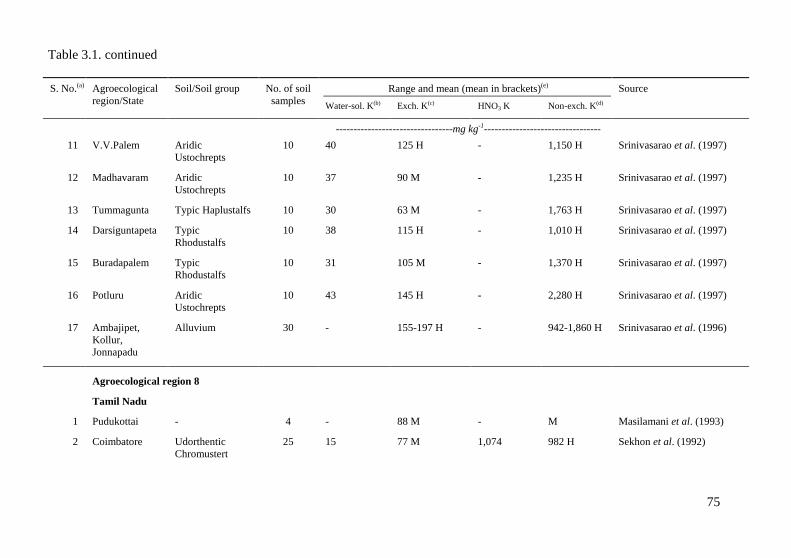
Table 3.1. continued
75
S. No.(a) Agroecological
region/State
Soil/Soil group No. of soil
samples
Range and mean (mean in brackets)(e) Source
Water-sol. K(b) Exch. K(c) HNO3 K Non-exch. K(d)
---------------------------------mg kg-1---------------------------------
11 V.V.Palem Aridic
Ustochrepts
10 40 125 H - 1,150 H Srinivasarao et al. (1997)
12 Madhavaram Aridic
Ustochrepts
10 37 90 M - 1,235 H Srinivasarao et al. (1997)
13 Tummagunta Typic Haplustalfs 10 30 63 M - 1,763 H Srinivasarao et al. (1997)
14 Darsiguntapeta Typic
Rhodustalfs
10 38 115 H - 1,010 H Srinivasarao et al. (1997)
15 Buradapalem Typic
Rhodustalfs
10 31 105 M - 1,370 H Srinivasarao et al. (1997)
16 Potluru Aridic
Ustochrepts
10 43 145 H - 2,280 H Srinivasarao et al. (1997)
17 Ambajipet,
Kollur,
Jonnapadu
Alluvium 30 - 155-197 H - 942-1,860 H Srinivasarao et al. (1996)
Agroecological region 8
Tamil Nadu
1 Pudukottai - 4 - 88 M - M Masilamani et al. (1993)
2 Coimbatore Udorthentic
Chromustert
25 15 77 M 1,074 982 H Sekhon et al. (1992)
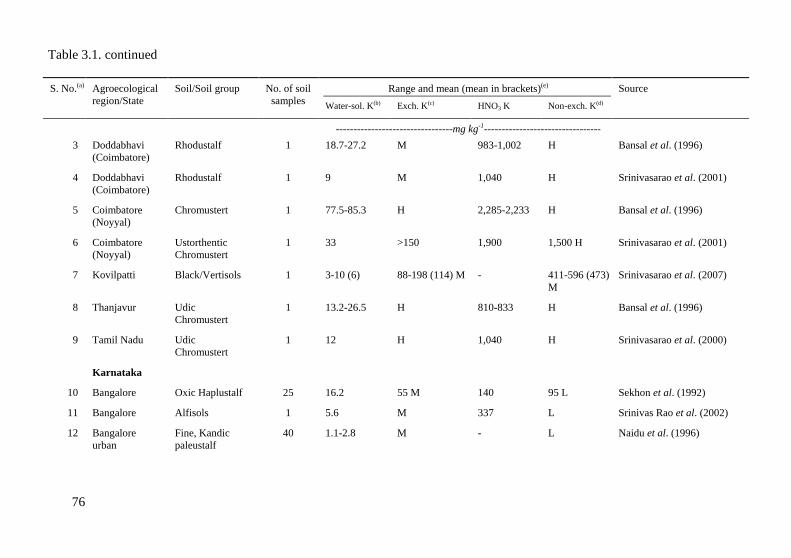
Table 3.1. continued
76
S. No.(a) Agroecological
region/State
Soil/Soil group No. of soil
samples
Range and mean (mean in brackets)(e) Source
Water-sol. K(b) Exch. K(c) HNO3 K Non-exch. K(d)
---------------------------------mg kg-1---------------------------------
3 Doddabhavi
(Coimbatore)
Rhodustalf 1 18.7-27.2 M 983-1,002 H Bansal et al. (1996)
4 Doddabhavi
(Coimbatore)
Rhodustalf 1 9 M 1,040 H Srinivasarao et al. (2001)
5 Coimbatore
(Noyyal)
Chromustert 1 77.5-85.3 H 2,285-2,233 H Bansal et al. (1996)
6 Coimbatore
(Noyyal)
Ustorthentic
Chromustert
1 33 >150 1,900 1,500 H Srinivasarao et al. (2001)
7 Kovilpatti Black/Vertisols 1 3-10 (6) 88-198 (114) M - 411-596 (473)
M
Srinivasarao et al. (2007)
8 Thanjavur Udic
Chromustert
1 13.2-26.5 H 810-833 H Bansal et al. (1996)
9 Tamil Nadu Udic
Chromustert
1 12 H 1,040 H Srinivasarao et al. (2000)
Karnataka
10 Bangalore Oxic Haplustalf 25 16.2 55 M 140 95 L Sekhon et al. (1992)
11 Bangalore Alfisols 1 5.6 M 337 L Srinivas Rao et al. (2002)
12 Bangalore
urban
Fine, Kandic
paleustalf
40 1.1-2.8 M - L Naidu et al. (1996)
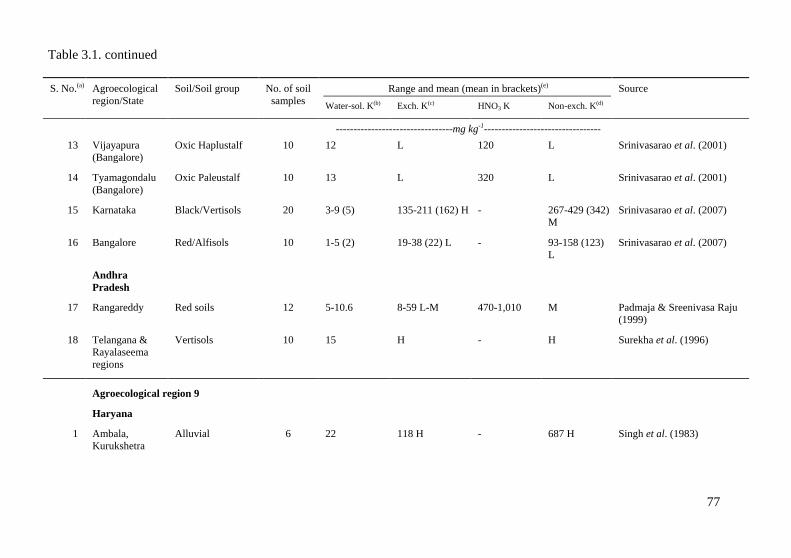
Table 3.1. continued
77
S. No.(a) Agroecological
region/State
Soil/Soil group No. of soil
samples
Range and mean (mean in brackets)(e) Source
Water-sol. K(b) Exch. K(c) HNO3 K Non-exch. K(d)
---------------------------------mg kg-1---------------------------------
13 Vijayapura
(Bangalore)
Oxic Haplustalf 10 12 L 120 L Srinivasarao et al. (2001)
14 Tyamagondalu
(Bangalore)
Oxic Paleustalf 10 13 L 320 L Srinivasarao et al. (2001)
15 Karnataka Black/Vertisols 20 3-9 (5) 135-211 (162) H - 267-429 (342)
M
Srinivasarao et al. (2007)
16 Bangalore Red/Alfisols 10 1-5 (2) 19-38 (22) L - 93-158 (123)
L
Srinivasarao et al. (2007)
Andhra
Pradesh
17 Rangareddy Red soils 12 5-10.6 8-59 L-M 470-1,010 M Padmaja & Sreenivasa Raju
(1999)
18 Telangana &
Rayalaseema
regions
Vertisols 10 15 H - H Surekha et al. (1996)
Agroecological region 9
Haryana
1 Ambala,
Kurukshetra
Alluvial 6 22 118 H - 687 H Singh et al. (1983)
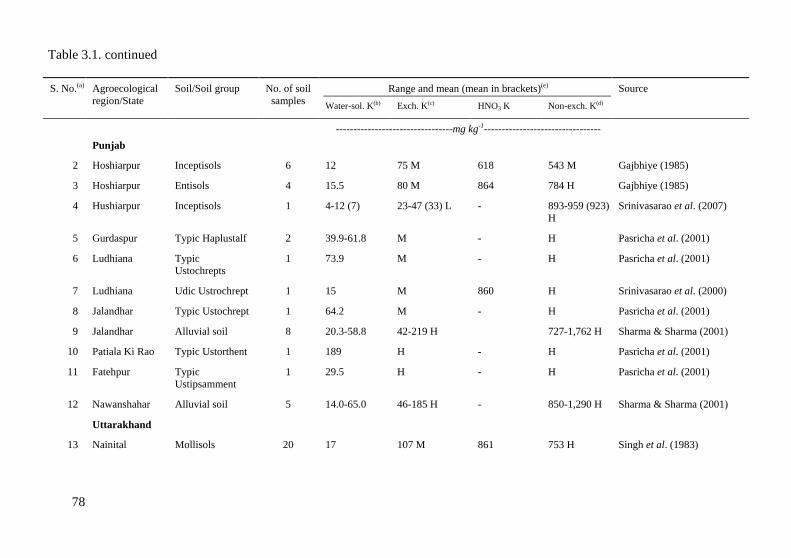
Table 3.1. continued
78
S. No.(a) Agroecological
region/State
Soil/Soil group No. of soil
samples
Range and mean (mean in brackets)(e) Source
Water-sol. K(b) Exch. K(c) HNO3 K Non-exch. K(d)
---------------------------------mg kg-1---------------------------------
Punjab
2 Hoshiarpur Inceptisols 6 12 75 M 618 543 M Gajbhiye (1985)
3 Hoshiarpur Entisols 4 15.5 80 M 864 784 H Gajbhiye (1985)
4 Hushiarpur Inceptisols 1 4-12 (7) 23-47 (33) L - 893-959 (923)
H
Srinivasarao et al. (2007)
5 Gurdaspur Typic Haplustalf 2 39.9-61.8 M - H Pasricha et al. (2001)
6 Ludhiana Typic
Ustochrepts
1 73.9 M - H Pasricha et al. (2001)
7 Ludhiana Udic Ustrochrept 1 15 M 860 H Srinivasarao et al. (2000)
8 Jalandhar Typic Ustochrept 1 64.2 M - H Pasricha et al. (2001)
9 Jalandhar Alluvial soil 8 20.3-58.8 42-219 H 727-1,762 H Sharma & Sharma (2001)
10 Patiala Ki Rao Typic Ustorthent 1 189 H - H Pasricha et al. (2001)
11 Fatehpur Typic
Ustipsamment
1 29.5 H - H Pasricha et al. (2001)
12 Nawanshahar Alluvial soil 5 14.0-65.0 46-185 H - 850-1,290 H Sharma & Sharma (2001)
Uttarakhand
13 Nainital Mollisols 20 17 107 M 861 753 H Singh et al. (1983)
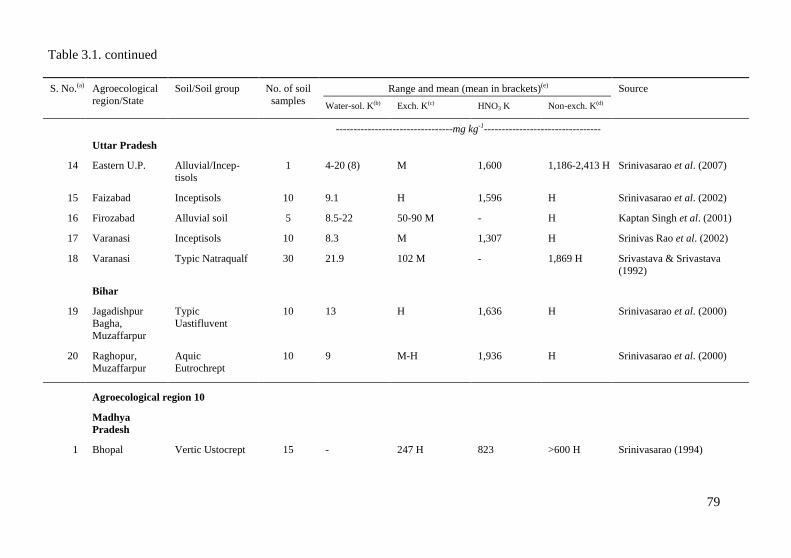
Table 3.1. continued
79
S. No.(a) Agroecological
region/State
Soil/Soil group No. of soil
samples
Range and mean (mean in brackets)(e) Source
Water-sol. K(b) Exch. K(c) HNO3 K Non-exch. K(d)
---------------------------------mg kg-1---------------------------------
Uttar Pradesh
14 Eastern U.P. Alluvial/Incep-
tisols
1 4-20 (8) M 1,600 1,186-2,413 H Srinivasarao et al. (2007)
15 Faizabad Inceptisols 10 9.1 H 1,596 H Srinivasarao et al. (2002)
16 Firozabad Alluvial soil 5 8.5-22 50-90 M - H Kaptan Singh et al. (2001)
17 Varanasi Inceptisols 10 8.3 M 1,307 H Srinivas Rao et al. (2002)
18 Varanasi Typic Natraqualf 30 21.9 102 M - 1,869 H Srivastava & Srivastava
(1992)
Bihar
19 Jagadishpur
Bagha,
Muzaffarpur
Typic
Uastifluvent
10 13 H 1,636 H Srinivasarao et al. (2000)
20 Raghopur,
Muzaffarpur
Aquic
Eutrochrept
10 9 M-H 1,936 H Srinivasarao et al. (2000)
Agroecological region 10
Madhya
Pradesh
1 Bhopal Vertic Ustocrept 15 - 247 H 823 >600 H Srinivasarao (1994)
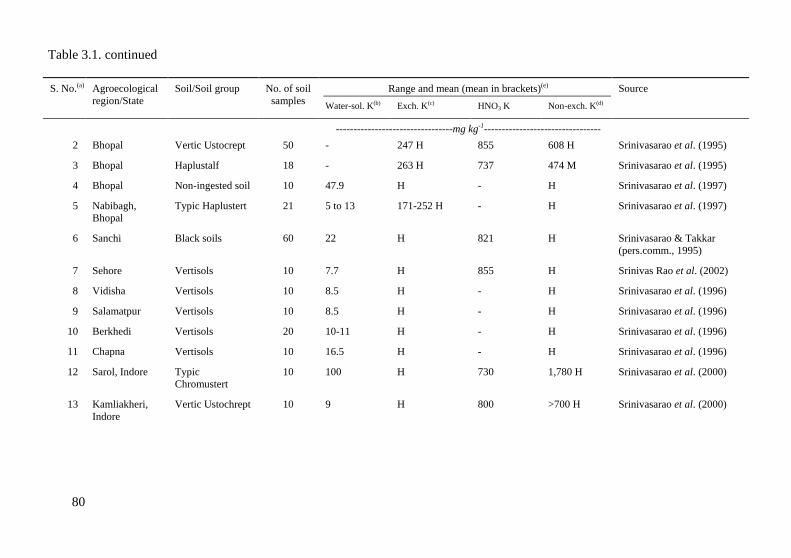
Table 3.1. continued
80
S. No.(a) Agroecological
region/State
Soil/Soil group No. of soil
samples
Range and mean (mean in brackets)(e) Source
Water-sol. K(b) Exch. K(c) HNO3 K Non-exch. K(d)
---------------------------------mg kg-1---------------------------------
2 Bhopal Vertic Ustocrept 50 - 247 H 855 608 H Srinivasarao et al. (1995)
3 Bhopal Haplustalf 18 - 263 H 737 474 M Srinivasarao et al. (1995)
4 Bhopal Non-ingested soil 10 47.9 H - H Srinivasarao et al. (1997)
5 Nabibagh,
Bhopal
Typic Haplustert 21 5 to 13 171-252 H - H Srinivasarao et al. (1997)
6 Sanchi Black soils 60 22 H 821 H Srinivasarao & Takkar
(pers.comm., 1995)
7 Sehore Vertisols 10 7.7 H 855 H Srinivas Rao et al. (2002)
8 Vidisha Vertisols 10 8.5 H - H Srinivasarao et al. (1996)
9 Salamatpur Vertisols 10 8.5 H - H Srinivasarao et al. (1996)
10 Berkhedi Vertisols 20 10-11 H - H Srinivasarao et al. (1996)
11 Chapna Vertisols 10 16.5 H - H Srinivasarao et al. (1996)
12 Sarol, Indore Typic
Chromustert
10 100 H 730 1,780 H Srinivasarao et al. (2000)
13 Kamliakheri,
Indore
Vertic Ustochrept 10 9 H 800 >700 H Srinivasarao et al. (2000)
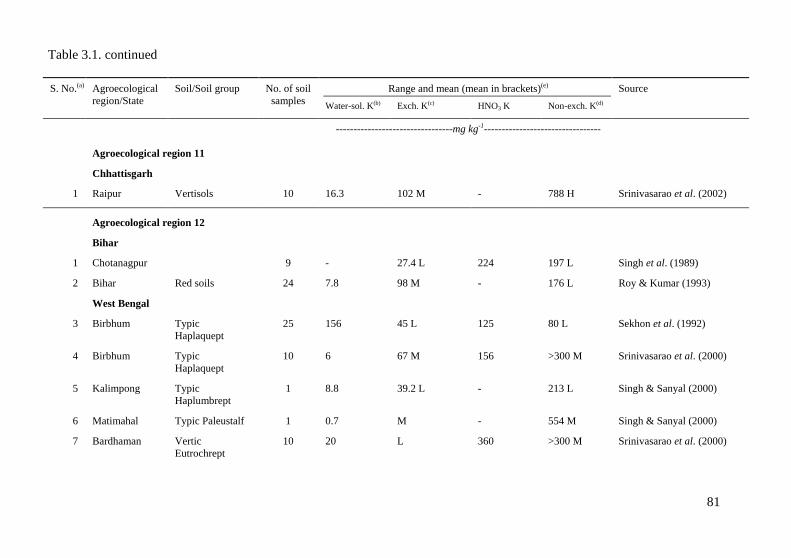
Table 3.1. continued
81
S. No.(a) Agroecological
region/State
Soil/Soil group No. of soil
samples
Range and mean (mean in brackets)(e) Source
Water-sol. K(b) Exch. K(c) HNO3 K Non-exch. K(d)
---------------------------------mg kg-1---------------------------------
Agroecological region 11
Chhattisgarh
1 Raipur Vertisols 10 16.3 102 M - 788 H Srinivasarao et al. (2002)
Agroecological region 12
Bihar
1 Chotanagpur 9 - 27.4 L 224 197 L Singh et al. (1989)
2 Bihar Red soils 24 7.8 98 M - 176 L Roy & Kumar (1993)
West Bengal
3 Birbhum Typic
Haplaquept
25 156 45 L 125 80 L Sekhon et al. (1992)
4 Birbhum Typic
Haplaquept
10 6 67 M 156 >300 M Srinivasarao et al. (2000)
5 Kalimpong Typic
Haplumbrept
1 8.8 39.2 L - 213 L Singh & Sanyal (2000)
6 Matimahal Typic Paleustalf 1 0.7 M - 554 M Singh & Sanyal (2000)
7 Bardhaman Vertic
Eutrochrept
10 20 L 360 >300 M Srinivasarao et al. (2000)
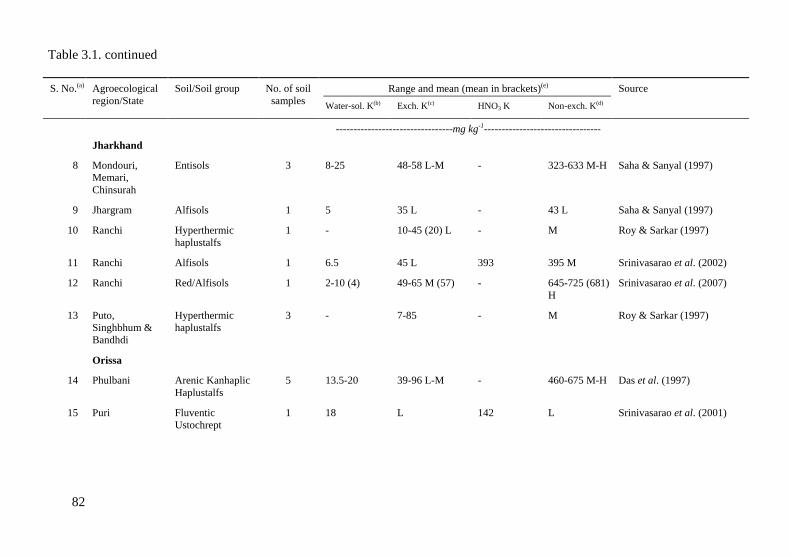
Table 3.1. continued
82
S. No.(a) Agroecological
region/State
Soil/Soil group No. of soil
samples
Range and mean (mean in brackets)(e) Source
Water-sol. K(b) Exch. K(c) HNO3 K Non-exch. K(d)
---------------------------------mg kg-1---------------------------------
Jharkhand
8 Mondouri,
Memari,
Chinsurah
Entisols 3 8-25 48-58 L-M - 323-633 M-H Saha & Sanyal (1997)
9 Jhargram Alfisols 1 5 35 L - 43 L Saha & Sanyal (1997)
10 Ranchi Hyperthermic
haplustalfs
1 - 10-45 (20) L - M Roy & Sarkar (1997)
11 Ranchi Alfisols 1 6.5 45 L 393 395 M Srinivasarao et al. (2002)
12 Ranchi Red/Alfisols 1 2-10 (4) 49-65 M (57) - 645-725 (681)
H
Srinivasarao et al. (2007)
13 Puto,
Singhbhum &
Bandhdi
Hyperthermic
haplustalfs
3 - 7-85 - M Roy & Sarkar (1997)
Orissa
14 Phulbani Arenic Kanhaplic
Haplustalfs
5 13.5-20 39-96 L-M - 460-675 M-H Das et al. (1997)
15 Puri Fluventic
Ustochrept
1 18 L 142 L Srinivasarao et al. (2001)
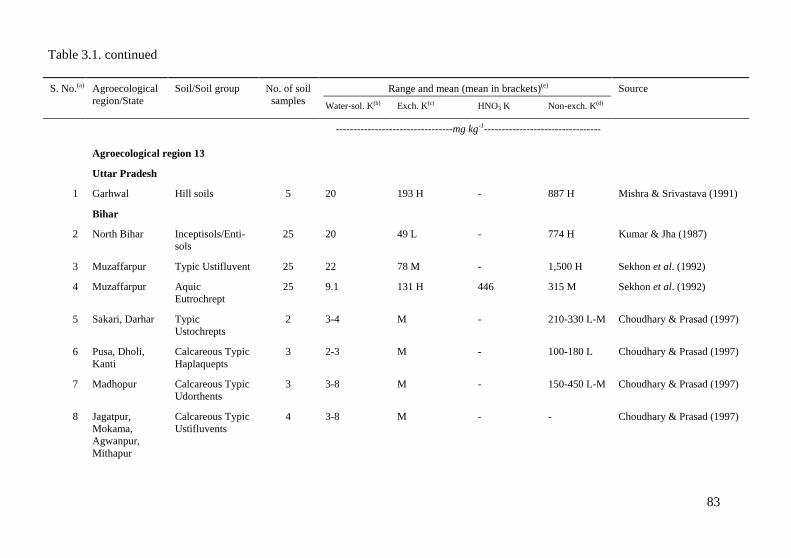
Table 3.1. continued
83
S. No.(a) Agroecological
region/State
Soil/Soil group No. of soil
samples
Range and mean (mean in brackets)(e) Source
Water-sol. K(b) Exch. K(c) HNO3 K Non-exch. K(d)
---------------------------------mg kg-1---------------------------------
Agroecological region 13
Uttar Pradesh
1 Garhwal Hill soils 5 20 193 H - 887 H Mishra & Srivastava (1991)
Bihar
2 North Bihar Inceptisols/Enti-
sols
25 20 49 L - 774 H Kumar & Jha (1987)
3 Muzaffarpur Typic Ustifluvent 25 22 78 M - 1,500 H Sekhon et al. (1992)
4 Muzaffarpur Aquic
Eutrochrept
25 9.1 131 H 446 315 M Sekhon et al. (1992)
5 Sakari, Darhar Typic
Ustochrepts
2 3-4 M - 210-330 L-M Choudhary & Prasad (1997)
6 Pusa, Dholi,
Kanti
Calcareous Typic
Haplaquepts
3 2-3 M - 100-180 L Choudhary & Prasad (1997)
7 Madhopur Calcareous Typic
Udorthents
3 3-8 M - 150-450 L-M Choudhary & Prasad (1997)
8 Jagatpur,
Mokama,
Agwanpur,
Mithapur
Calcareous Typic
Ustifluvents
4 3-8 M - - Choudhary & Prasad (1997)
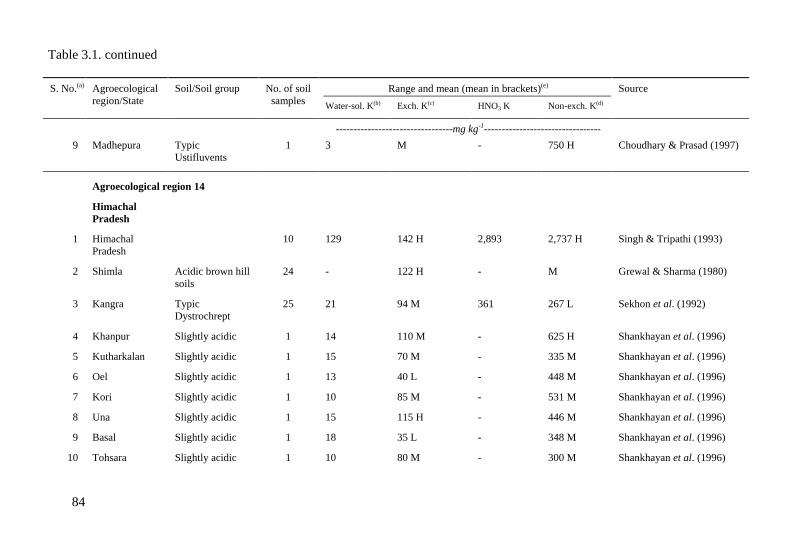
Table 3.1. continued
84
S. No.(a) Agroecological
region/State
Soil/Soil group No. of soil
samples
Range and mean (mean in brackets)(e) Source
Water-sol. K(b) Exch. K(c) HNO3 K Non-exch. K(d)
---------------------------------mg kg-1---------------------------------
9 Madhepura Typic
Ustifluvents
1 3 M - 750 H Choudhary & Prasad (1997)
Agroecological region 14
Himachal
Pradesh
1 Himachal
Pradesh
10 129 142 H 2,893 2,737 H Singh & Tripathi (1993)
2 Shimla Acidic brown hill
soils
24 - 122 H - M Grewal & Sharma (1980)
3 Kangra Typic
Dystrochrept
25 21 94 M 361 267 L Sekhon et al. (1992)
4 Khanpur Slightly acidic 1 14 110 M - 625 H Shankhayan et al. (1996)
5 Kutharkalan Slightly acidic 1 15 70 M - 335 M Shankhayan et al. (1996)
6 Oel Slightly acidic 1 13 40 L - 448 M Shankhayan et al. (1996)
7 Kori Slightly acidic 1 10 85 M - 531 M Shankhayan et al. (1996)
8 Una Slightly acidic 1 15 115 H - 446 M Shankhayan et al. (1996)
9 Basal Slightly acidic 1 18 35 L - 348 M Shankhayan et al. (1996)
10 Tohsara Slightly acidic 1 10 80 M - 300 M Shankhayan et al. (1996)
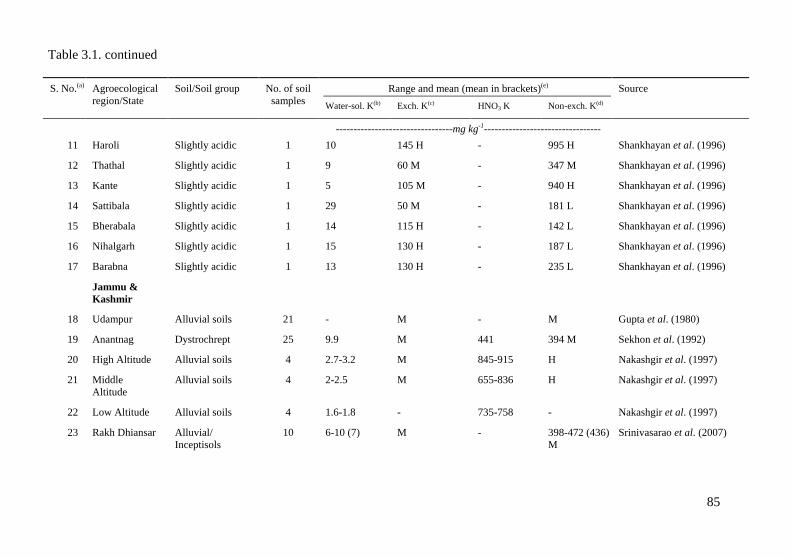
Table 3.1. continued
85
S. No.(a) Agroecological
region/State
Soil/Soil group No. of soil
samples
Range and mean (mean in brackets)(e) Source
Water-sol. K(b) Exch. K(c) HNO3 K Non-exch. K(d)
---------------------------------mg kg-1---------------------------------
11 Haroli Slightly acidic 1 10 145 H - 995 H Shankhayan et al. (1996)
12 Thathal Slightly acidic 1 9 60 M - 347 M Shankhayan et al. (1996)
13 Kante Slightly acidic 1 5 105 M - 940 H Shankhayan et al. (1996)
14 Sattibala Slightly acidic 1 29 50 M - 181 L Shankhayan et al. (1996)
15 Bherabala Slightly acidic 1 14 115 H - 142 L Shankhayan et al. (1996)
16 Nihalgarh Slightly acidic 1 15 130 H - 187 L Shankhayan et al. (1996)
17 Barabna Slightly acidic 1 13 130 H - 235 L Shankhayan et al. (1996)
Jammu &
Kashmir
18 Udampur Alluvial soils 21 - M - M Gupta et al. (1980)
19 Anantnag Dystrochrept 25 9.9 M 441 394 M Sekhon et al. (1992)
20 High Altitude Alluvial soils 4 2.7-3.2 M 845-915 H Nakashgir et al. (1997)
21 Middle
Altitude
Alluvial soils 4 2-2.5 M 655-836 H Nakashgir et al. (1997)
22 Low Altitude Alluvial soils 4 1.6-1.8 - 735-758 - Nakashgir et al. (1997)
23 Rakh Dhiansar Alluvial/
Inceptisols
10 6-10 (7) M - 398-472 (436)
M
Srinivasarao et al. (2007)
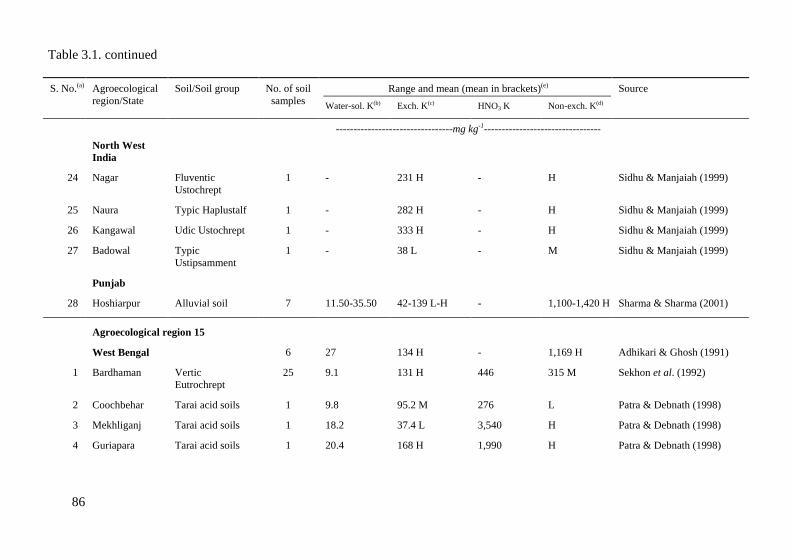
Table 3.1. continued
86
S. No.(a) Agroecological
region/State
Soil/Soil group No. of soil
samples
Range and mean (mean in brackets)(e) Source
Water-sol. K(b) Exch. K(c) HNO3 K Non-exch. K(d)
---------------------------------mg kg-1---------------------------------
North West
India
24 Nagar Fluventic
Ustochrept
1 - 231 H - H Sidhu & Manjaiah (1999)
25 Naura Typic Haplustalf 1 - 282 H - H Sidhu & Manjaiah (1999)
26 Kangawal Udic Ustochrept 1 - 333 H - H Sidhu & Manjaiah (1999)
27 Badowal Typic
Ustipsamment
1 - 38 L - M Sidhu & Manjaiah (1999)
Punjab
28 Hoshiarpur Alluvial soil 7 11.50-35.50 42-139 L-H - 1,100-1,420 H Sharma & Sharma (2001)
Agroecological region 15
West Bengal 6 27 134 H - 1,169 H Adhikari & Ghosh (1991)
1 Bardhaman Vertic
Eutrochrept
25 9.1 131 H 446 315 M Sekhon et al. (1992)
2 Coochbehar Tarai acid soils 1 9.8 95.2 M 276 L Patra & Debnath (1998)
3 Mekhliganj Tarai acid soils 1 18.2 37.4 L 3,540 H Patra & Debnath (1998)
4 Guriapara Tarai acid soils 1 20.4 168 H 1,990 H Patra & Debnath (1998)
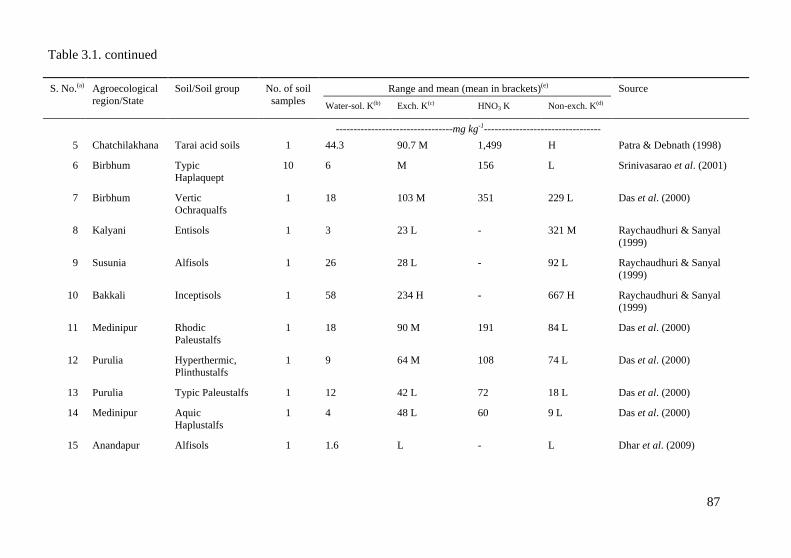
Table 3.1. continued
87
S. No.(a) Agroecological
region/State
Soil/Soil group No. of soil
samples
Range and mean (mean in brackets)(e) Source
Water-sol. K(b) Exch. K(c) HNO3 K Non-exch. K(d)
---------------------------------mg kg-1---------------------------------
5 Chatchilakhana Tarai acid soils 1 44.3 90.7 M 1,499 H Patra & Debnath (1998)
6 Birbhum Typic
Haplaquept
10 6 M 156 L Srinivasarao et al. (2001)
7 Birbhum Vertic
Ochraqualfs
1 18 103 M 351 229 L Das et al. (2000)
8 Kalyani Entisols 1 3 23 L - 321 M Raychaudhuri & Sanyal
(1999)
9 Susunia Alfisols 1 26 28 L - 92 L Raychaudhuri & Sanyal
(1999)
10 Bakkali Inceptisols 1 58 234 H - 667 H Raychaudhuri & Sanyal
(1999)
11 Medinipur Rhodic
Paleustalfs
1 18 90 M 191 84 L Das et al. (2000)
12 Purulia Hyperthermic,
Plinthustalfs
1 9 64 M 108 74 L Das et al. (2000)
13 Purulia Typic Paleustalfs 1 12 42 L 72 18 L Das et al. (2000)
14 Medinipur Aquic
Haplustalfs
1 4 48 L 60 9 L Das et al. (2000)
15 Anandapur Alfisols 1 1.6 L - L Dhar et al. (2009)
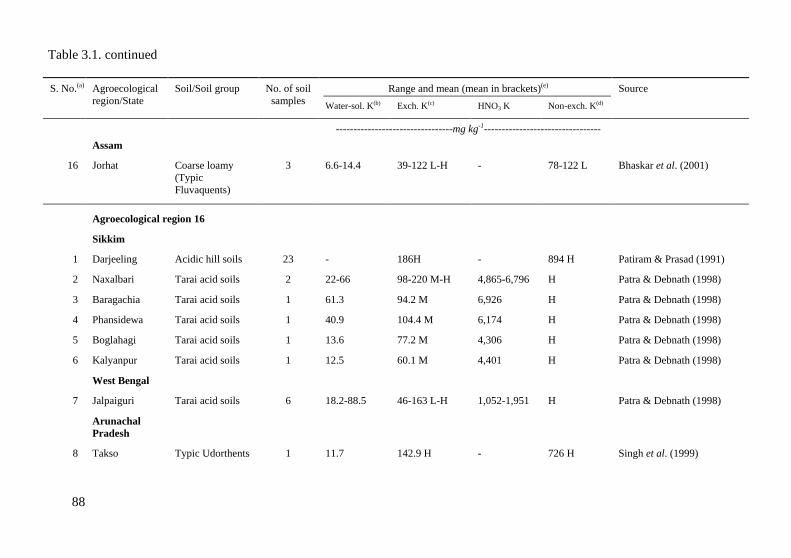
Table 3.1. continued
88
S. No.(a) Agroecological
region/State
Soil/Soil group No. of soil
samples
Range and mean (mean in brackets)(e) Source
Water-sol. K(b) Exch. K(c) HNO3 K Non-exch. K(d)
---------------------------------mg kg-1---------------------------------
Assam
16 Jorhat Coarse loamy
(Typic
Fluvaquents)
3 6.6-14.4 39-122 L-H - 78-122 L Bhaskar et al. (2001)
Agroecological region 16
Sikkim
1 Darjeeling Acidic hill soils 23 - 186H - 894 H Patiram & Prasad (1991)
2 Naxalbari Tarai acid soils 2 22-66 98-220 M-H 4,865-6,796 H Patra & Debnath (1998)
3 Baragachia Tarai acid soils 1 61.3 94.2 M 6,926 H Patra & Debnath (1998)
4 Phansidewa Tarai acid soils 1 40.9 104.4 M 6,174 H Patra & Debnath (1998)
5 Boglahagi Tarai acid soils 1 13.6 77.2 M 4,306 H Patra & Debnath (1998)
6 Kalyanpur Tarai acid soils 1 12.5 60.1 M 4,401 H Patra & Debnath (1998)
West Bengal
7 Jalpaiguri Tarai acid soils 6 18.2-88.5 46-163 L-H 1,052-1,951 H Patra & Debnath (1998)
Arunachal
Pradesh
8 Takso Typic Udorthents 1 11.7 142.9 H - 726 H Singh et al. (1999)
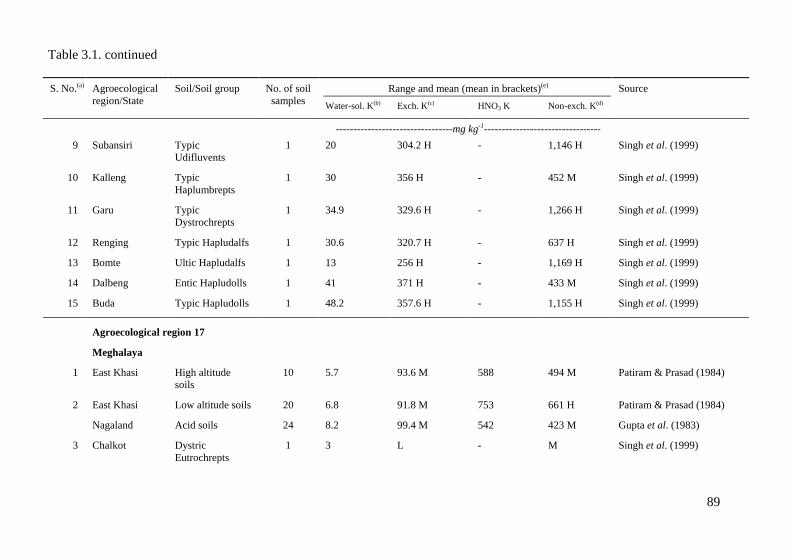
Table 3.1. continued
89
S. No.(a) Agroecological
region/State
Soil/Soil group No. of soil
samples
Range and mean (mean in brackets)(e) Source
Water-sol. K(b) Exch. K(c) HNO3 K Non-exch. K(d)
---------------------------------mg kg-1---------------------------------
9 Subansiri Typic
Udifluvents
1 20 304.2 H - 1,146 H Singh et al. (1999)
10 Kalleng Typic
Haplumbrepts
1 30 356 H - 452 M Singh et al. (1999)
11 Garu Typic
Dystrochrepts
1 34.9 329.6 H - 1,266 H Singh et al. (1999)
12 Renging Typic Hapludalfs 1 30.6 320.7 H - 637 H Singh et al. (1999)
13 Bomte Ultic Hapludalfs 1 13 256 H - 1,169 H Singh et al. (1999)
14 Dalbeng Entic Hapludolls 1 41 371 H - 433 M Singh et al. (1999)
15 Buda Typic Hapludolls 1 48.2 357.6 H - 1,155 H Singh et al. (1999)
Agroecological region 17
Meghalaya
1 East Khasi High altitude
soils
10 5.7 93.6 M 588 494 M Patiram & Prasad (1984)
2 East Khasi Low altitude soils 20 6.8 91.8 M 753 661 H Patiram & Prasad (1984)
Nagaland Acid soils 24 8.2 99.4 M 542 423 M Gupta et al. (1983)
3 Chalkot Dystric
Eutrochrepts
1 3 L - M Singh et al. (1999)
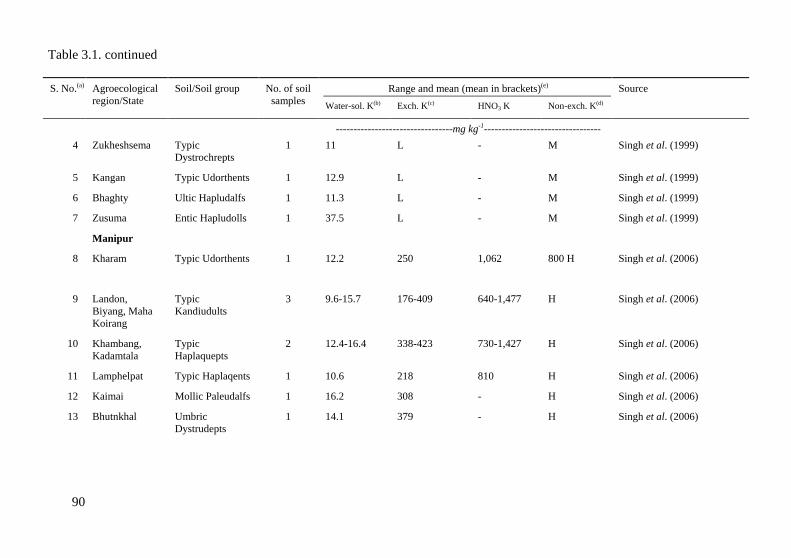
Table 3.1. continued
90
S. No.(a) Agroecological
region/State
Soil/Soil group No. of soil
samples
Range and mean (mean in brackets)(e) Source
Water-sol. K(b) Exch. K(c) HNO3 K Non-exch. K(d)
---------------------------------mg kg-1---------------------------------
4 Zukheshsema Typic
Dystrochrepts
1 11 L - M Singh et al. (1999)
5 Kangan Typic Udorthents 1 12.9 L - M Singh et al. (1999)
6 Bhaghty Ultic Hapludalfs 1 11.3 L - M Singh et al. (1999)
7 Zusuma Entic Hapludolls 1 37.5 L - M Singh et al. (1999)
Manipur
8 Kharam Typic Udorthents 1 12.2 250 1,062 800 H Singh et al. (2006)
9 Landon,
Biyang, Maha
Koirang
Typic
Kandiudults
3 9.6-15.7 176-409 640-1,477 H Singh et al. (2006)
10 Khambang,
Kadamtala
Typic
Haplaquepts
2 12.4-16.4 338-423 730-1,427 H Singh et al. (2006)
11 Lamphelpat Typic Haplaqents 1 10.6 218 810 H Singh et al. (2006)
12 Kaimai Mollic Paleudalfs 1 16.2 308 - H Singh et al. (2006)
13 Bhutnkhal Umbric
Dystrudepts
1 14.1 379 - H Singh et al. (2006)
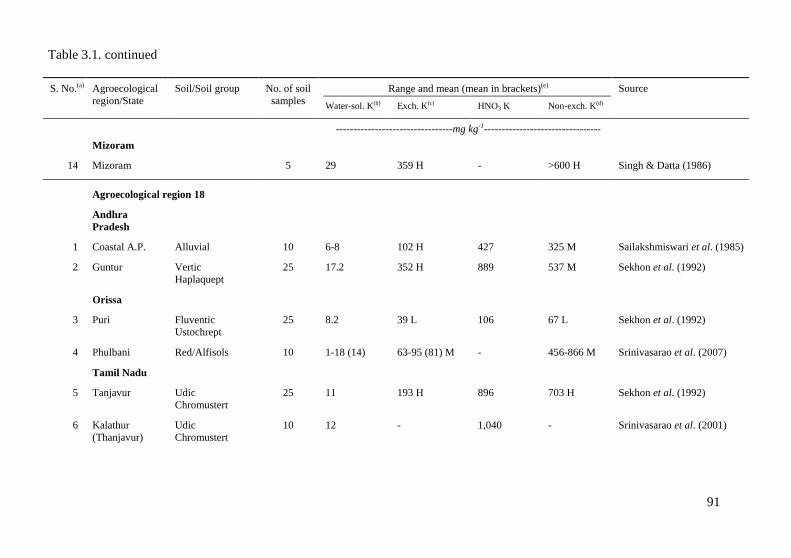
Table 3.1. continued
91
S. No.(a) Agroecological
region/State
Soil/Soil group No. of soil
samples
Range and mean (mean in brackets)(e) Source
Water-sol. K(b) Exch. K(c) HNO3 K Non-exch. K(d)
---------------------------------mg kg-1---------------------------------
Mizoram
14 Mizoram 5 29 359 H - >600 H Singh & Datta (1986)
Agroecological region 18
Andhra
Pradesh
1 Coastal A.P. Alluvial 10 6-8 102 H 427 325 M Sailakshmiswari et al. (1985)
2 Guntur Vertic
Haplaquept
25 17.2 352 H 889 537 M Sekhon et al. (1992)
Orissa
3 Puri Fluventic
Ustochrept
25 8.2 39 L 106 67 L Sekhon et al. (1992)
4 Phulbani Red/Alfisols 10 1-18 (14) 63-95 (81) M - 456-866 M Srinivasarao et al. (2007)
Tamil Nadu
5 Tanjavur Udic
Chromustert
25 11 193 H 896 703 H Sekhon et al. (1992)
6 Kalathur
(Thanjavur)
Udic
Chromustert
10 12 - 1,040 - Srinivasarao et al. (2001)
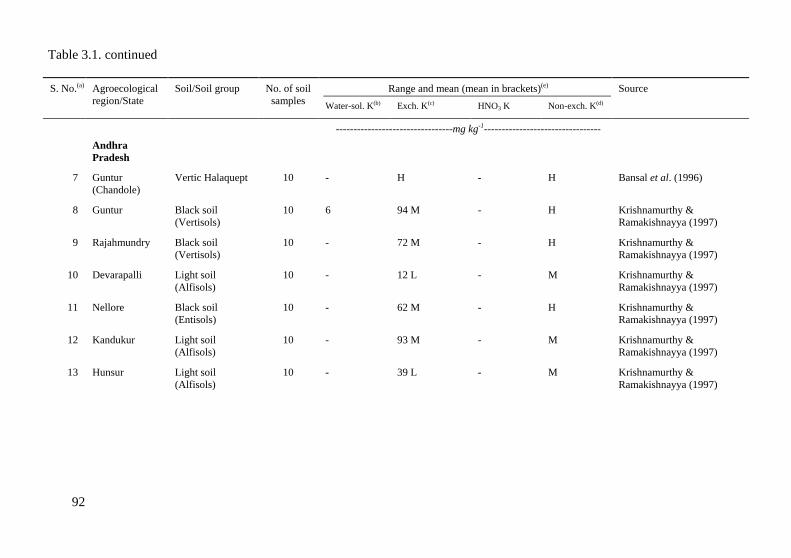
Table 3.1. continued
92
S. No.(a) Agroecological
region/State
Soil/Soil group No. of soil
samples
Range and mean (mean in brackets)(e) Source
Water-sol. K(b) Exch. K(c) HNO3 K Non-exch. K(d)
---------------------------------mg kg-1---------------------------------
Andhra
Pradesh
7 Guntur
(Chandole)
Vertic Halaquept 10 - H - H Bansal et al. (1996)
8 Guntur Black soil
(Vertisols)
10 6 94 M - H Krishnamurthy &
Ramakishnayya (1997)
9 Rajahmundry Black soil
(Vertisols)
10 - 72 M - H Krishnamurthy &
Ramakishnayya (1997)
10 Devarapalli Light soil
(Alfisols)
10 - 12 L - M Krishnamurthy &
Ramakishnayya (1997)
11 Nellore Black soil
(Entisols)
10 - 62 M - H Krishnamurthy &
Ramakishnayya (1997)
12 Kandukur Light soil
(Alfisols)
10 - 93 M - M Krishnamurthy &
Ramakishnayya (1997)
13 Hunsur Light soil
(Alfisols)
10 - 39 L - M Krishnamurthy &
Ramakishnayya (1997)
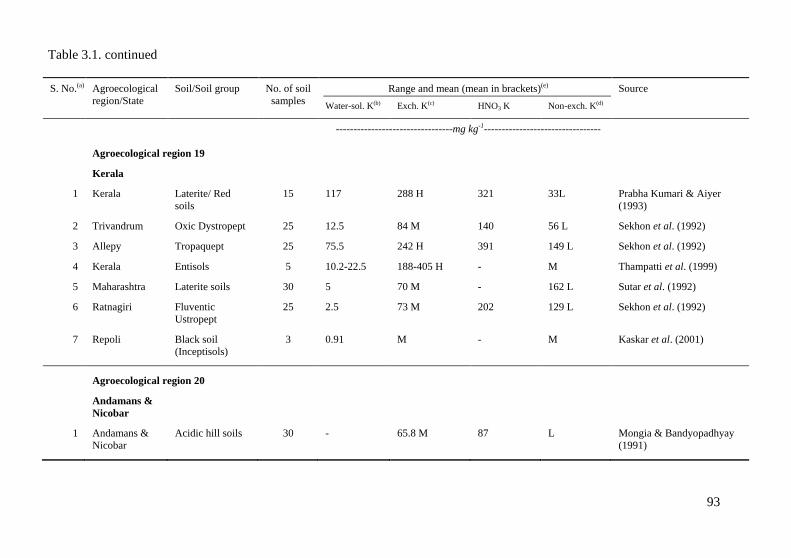
Table 3.1. continued
93
S. No.(a) Agroecological
region/State
Soil/Soil group No. of soil
samples
Range and mean (mean in brackets)(e) Source
Water-sol. K(b) Exch. K(c) HNO3 K Non-exch. K(d)
---------------------------------mg kg-1---------------------------------
Agroecological region 19
Kerala
1 Kerala Laterite/ Red
soils
15 117 288 H 321 33L Prabha Kumari & Aiyer
(1993)
2 Trivandrum Oxic Dystropept 25 12.5 84 M 140 56 L Sekhon et al. (1992)
3 Allepy Tropaquept 25 75.5 242 H 391 149 L Sekhon et al. (1992)
4 Kerala Entisols 5 10.2-22.5 188-405 H - M Thampatti et al. (1999)
5 Maharashtra Laterite soils 30 5 70 M - 162 L Sutar et al. (1992)
6 Ratnagiri Fluventic
Ustropept
25 2.5 73 M 202 129 L Sekhon et al. (1992)
7 Repoli Black soil
(Inceptisols)
3 0.91 M - M Kaskar et al. (2001)
Agroecological region 20
Andamans &
Nicobar
1 Andamans &
Nicobar
Acidic hill soils 30 - 65.8 M 87 L Mongia & Bandyopadhyay
(1991)
94
4. New Concepts in Soil K Fertility
4.1. Release rates
Soil potassium supply to crop plants is a complex phenomenon involving
relationships among its various chemical forms. The dynamic equilibrium
among the forms directs the release of K from non-exchangeable to slowly
available forms to available forms under K stress environment. Srinivasarao
et al. (1999) reported that continuous cropping for 20 years reduced the
release rates significantly and stated that many plants feed on non-
exchangeable source of K, particularly the monocots. Therefore, current
interest in K fertility of soils has switched from simple measurement of the
amounts of exchangeable or non-exchangeable K to determination of the rate
at which K+ is supplied from these forms during the crop growth
(Srinivasarao et al., 1996, 2003, 2004, 2008).
Non-exchangeable K release kinetics of six major benchmark soil series of
India as affected by mineralogy of clay and silt fractions, soil depth and
extraction media was investigated (Srinivasarao et al., 1997, 2006, 2010;
Srinivasarao, 2010). Organic acids were used to extract non-exchageable K
from soil to represent plant root extraction of soil K under intensive cropping.
The cumulative release of non-exchangeable K was greater in smectitic soils
(353 mg K kg-1 at 0-15 cm depth and 296 mg K kg-1 at 15-30 cm depth,
averaged for two soils and 3 extractants) as compared to illitic (151 mg K
kg-1 at 0-15 cm depth and 112 mg K kg-1 at 15-30 cm depth) and kaolinitic
(194 mg K kg-1 at 0-15 cm depth and 167 mg K kg-1 at 15-30 cm depth) soils.
This work shows that surface soils exhibited larger cumulative K release in
smectitic and illitic soils whereas sub-surface soils had larger K release in
kaolinitic soils. Among the extractants, 0.01 M citric acid extracted larger
amount of non-exchangeable K followed by 0.01 M CaCl2 and 0.01 M HCl.
The efficiency of citric acid extractant was greater in illitic soils as compared
to smectitic and kaolinitic soils (Table 4.1.1). Release kinetics of non-
exchangeable K conformed well to parabolic and first-order kinetic models.
Fit of the data to the parabolic diffusion model suggested diffusion controlled
kinetics in all the soils with a characteristic initial fast rate up to 7 hours,
followed by a slower rate. Greater non-exchangeable K release rates in
smectitic soils, calculated from the first-order equation (b = 91.13 x 10⁻⁴ h-1),
suggested that the layer edge and wedge zones and swelling nature of clay
facilitated the easier exchange (Table 4.1.2). In contrast to smectitic soils,
higher release rate constants (b = 39.23 x 10⁻³ h-1) obtained from parabolic
diffusion equation in illitic soils revealed that the low amount of
exchangeable K on clay surface and larger amount of interlayer K allowed
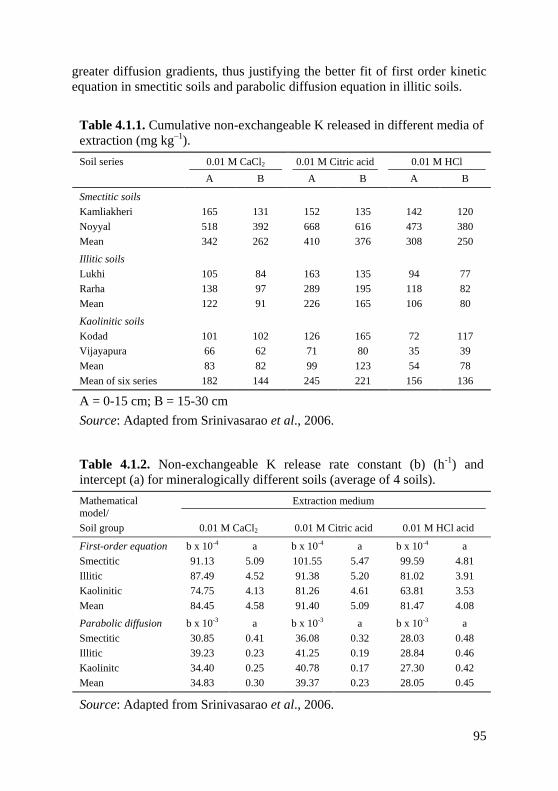
95
greater diffusion gradients, thus justifying the better fit of first order kinetic
equation in smectitic soils and parabolic diffusion equation in illitic soils.
Table 4.1.1. Cumulative non-exchangeable K released in different media of
extraction (mg kg–1).
Soil series 0.01 M CaCl2 0.01 M Citric acid 0.01 M HCl
A B A B A B
Smectitic soils
Kamliakheri 165 131 152 135 142 120
Noyyal 518 392 668 616 473 380
Mean 342 262 410 376 308 250
Illitic soils
Lukhi 105 84 163 135 94 77
Rarha 138 97 289 195 118 82
Mean 122 91 226 165 106 80
Kaolinitic soils
Kodad 101 102 126 165 72 117
Vijayapura 66 62 71 80 35 39
Mean 83 82 99 123 54 78
Mean of six series 182 144 245 221 156 136
A = 0-15 cm; B = 15-30 cm
Source: Adapted from Srinivasarao et al., 2006.
Table 4.1.2. Non-exchangeable K release rate constant (b) (h-1) and
intercept (a) for mineralogically different soils (average of 4 soils).
Mathematical
model/
Extraction medium
Soil group 0.01 M CaCl2 0.01 M Citric acid 0.01 M HCl acid
First-order equation b x 10-4 a b x 10-4 a b x 10-4 a
Smectitic 91.13 5.09 101.55 5.47 99.59 4.81
Illitic 87.49 4.52 91.38 5.20 81.02 3.91
Kaolinitic 74.75 4.13 81.26 4.61 63.81 3.53
Mean 84.45 4.58 91.40 5.09 81.47 4.08
Parabolic diffusion b x 10-3 a b x 10-3 a b x 10-3 a
Smectitic 30.85 0.41 36.08 0.32 28.03 0.48
Illitic 39.23 0.23 41.25 0.19 28.84 0.46
Kaolinitc 34.40 0.25 40.78 0.17 27.30 0.42
Mean 34.83 0.30 39.37 0.23 28.05 0.45
Source: Adapted from Srinivasarao et al., 2006.
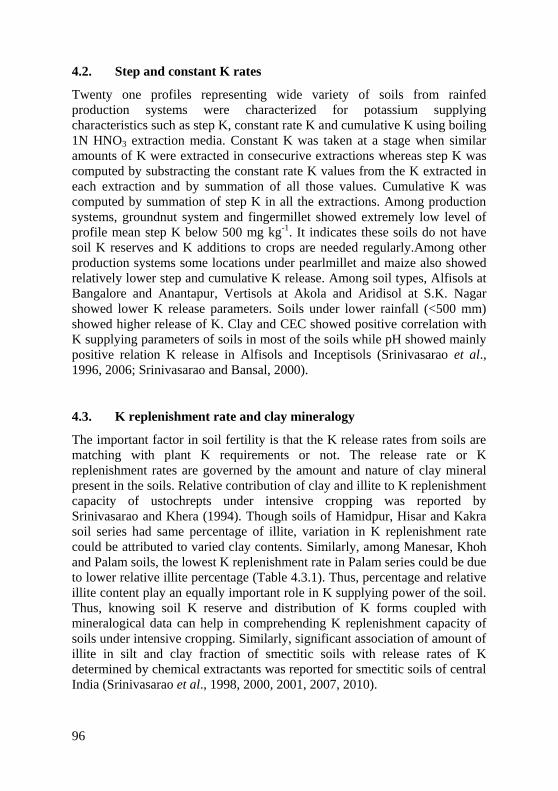
96
4.2. Step and constant K rates
Twenty one profiles representing wide variety of soils from rainfed
production systems were characterized for potassium supplying
characteristics such as step K, constant rate K and cumulative K using boiling
1N HNO3 extraction media. Constant K was taken at a stage when similar
amounts of K were extracted in consecurive extractions whereas step K was
computed by substracting the constant rate K values from the K extracted in
each extraction and by summation of all those values. Cumulative K was
computed by summation of step K in all the extractions. Among production
systems, groundnut system and fingermillet showed extremely low level of
profile mean step K below 500 mg kg-1. It indicates these soils do not have
soil K reserves and K additions to crops are needed regularly.Among other
production systems some locations under pearlmillet and maize also showed
relatively lower step and cumulative K release. Among soil types, Alfisols at
Bangalore and Anantapur, Vertisols at Akola and Aridisol at S.K. Nagar
showed lower K release parameters. Soils under lower rainfall (<500 mm)
showed higher release of K. Clay and CEC showed positive correlation with
K supplying parameters of soils in most of the soils while pH showed mainly
positive relation K release in Alfisols and Inceptisols (Srinivasarao et al.,
1996, 2006; Srinivasarao and Bansal, 2000).
4.3. K replenishment rate and clay mineralogy
The important factor in soil fertility is that the K release rates from soils are
matching with plant K requirements or not. The release rate or K
replenishment rates are governed by the amount and nature of clay mineral
present in the soils. Relative contribution of clay and illite to K replenishment
capacity of ustochrepts under intensive cropping was reported by
Srinivasarao and Khera (1994). Though soils of Hamidpur, Hisar and Kakra
soil series had same percentage of illite, variation in K replenishment rate
could be attributed to varied clay contents. Similarly, among Manesar, Khoh
and Palam soils, the lowest K replenishment rate in Palam series could be due
to lower relative illite percentage (Table 4.3.1). Thus, percentage and relative
illite content play an equally important role in K supplying power of the soil.
Thus, knowing soil K reserve and distribution of K forms coupled with
mineralogical data can help in comprehending K replenishment capacity of
soils under intensive cropping. Similarly, significant association of amount of
illite in silt and clay fraction of smectitic soils with release rates of K
determined by chemical extractants was reported for smectitic soils of central
India (Srinivasarao et al., 1998, 2000, 2001, 2007, 2010).
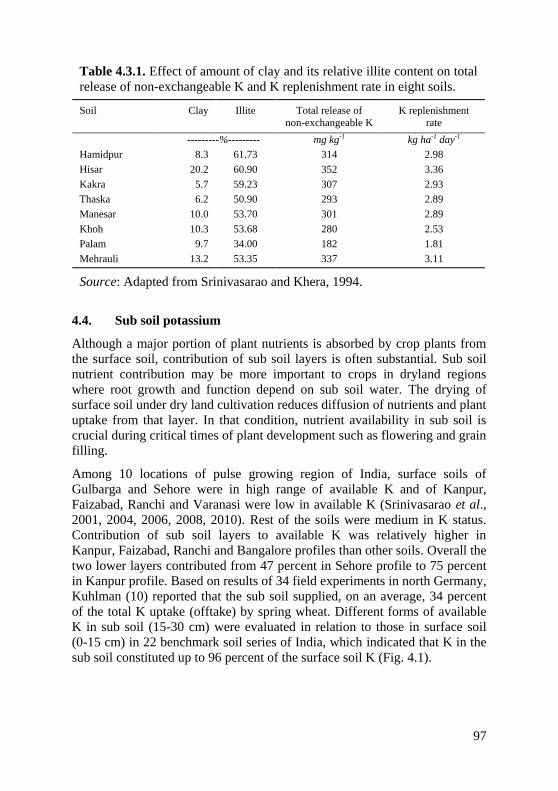
97
Table 4.3.1. Effect of amount of clay and its relative illite content on total
release of non-exchangeable K and K replenishment rate in eight soils.
Soil Clay Illite Total release of
non-exchangeable K
K replenishment
rate
---------%--------- mg kg-1 kg ha-1 day-1
Hamidpur 8.3 61.73 314 2.98
Hisar 20.2 60.90 352 3.36
Kakra 5.7 59.23 307 2.93
Thaska 6.2 50.90 293 2.89
Manesar 10.0 53.70 301 2.89
Khoh 10.3 53.68 280 2.53
Palam 9.7 34.00 182 1.81
Mehrauli 13.2 53.35 337 3.11
Source: Adapted from Srinivasarao and Khera, 1994.
4.4. Sub soil potassium
Although a major portion of plant nutrients is absorbed by crop plants from
the surface soil, contribution of sub soil layers is often substantial. Sub soil
nutrient contribution may be more important to crops in dryland regions
where root growth and function depend on sub soil water. The drying of
surface soil under dry land cultivation reduces diffusion of nutrients and plant
uptake from that layer. In that condition, nutrient availability in sub soil is
crucial during critical times of plant development such as flowering and grain
filling.
Among 10 locations of pulse growing region of India, surface soils of
Gulbarga and Sehore were in high range of available K and of Kanpur,
Faizabad, Ranchi and Varanasi were low in available K (Srinivasarao et al.,
2001, 2004, 2006, 2008, 2010). Rest of the soils were medium in K status.
Contribution of sub soil layers to available K was relatively higher in
Kanpur, Faizabad, Ranchi and Bangalore profiles than other soils. Overall the
two lower layers contributed from 47 percent in Sehore profile to 75 percent
in Kanpur profile. Based on results of 34 field experiments in north Germany,
Kuhlman (10) reported that the sub soil supplied, on an average, 34 percent
of the total K uptake (offtake) by spring wheat. Different forms of available
K in sub soil (15-30 cm) were evaluated in relation to those in surface soil
(0-15 cm) in 22 benchmark soil series of India, which indicated that K in the
sub soil constituted up to 96 percent of the surface soil K (Fig. 4.1).
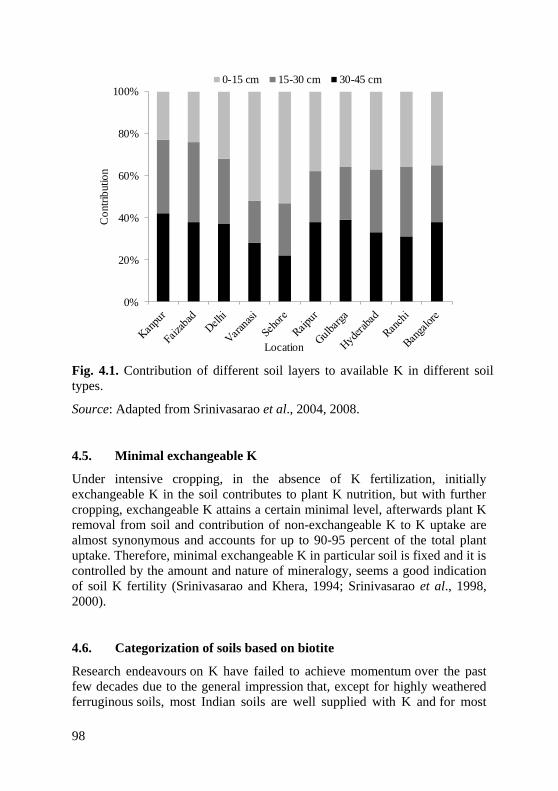
98
Fig. 4.1. Contribution of different soil layers to available K in different soil
types.
Source: Adapted from Srinivasarao et al., 2004, 2008.
4.5. Minimal exchangeable K
Under intensive cropping, in the absence of K fertilization, initially
exchangeable K in the soil contributes to plant K nutrition, but with further
cropping, exchangeable K attains a certain minimal level, afterwards plant K
removal from soil and contribution of non-exchangeable K to K uptake are
almost synonymous and accounts for up to 90-95 percent of the total plant
uptake. Therefore, minimal exchangeable K in particular soil is fixed and it is
controlled by the amount and nature of mineralogy, seems a good indication
of soil K fertility (Srinivasarao and Khera, 1994; Srinivasarao et al., 1998,
2000).
4.6. Categorization of soils based on biotite
Research endeavours on K have failed to achieve momentum over the past
few decades due to the general impression that, except for highly weathered
ferruginous soils, most Indian soils are well supplied with K and for most
0%
20%
40%
60%
80%
100%C
ontr
ibutio
n
Location
0-15 cm 15-30 cm 30-45 cm
99
crops, there is a little need for K fertilizers (Sekhon and Ghosh, 1982).
Although widespread responses to K fertilizer have been noticed (Sekhon and
Ghosh, 1982) due to intensive agricultural activities during 1970-1980,
comprehensive information on crop response to K fertilizers has not been
available. In subsequent years, it was observed that crops do not respond to K
fertilizers in many of these soils even over a long period of time (Pal and
Mondal, 1980; Pal and Durge, 1987; Ghosh and Biswas, 1978; Rego et al.,
1986). The prime K-bearing minerals in alluvial, black and ferruginous soils
of India are micas that are concentrated mainly in their silt and clay
fractions (Ghosh and Bhattacharyya, 1984; Pal and Durge, 1987; Pal et al.,
1993). Despite this favourable natural mineral endowment, crop response to
K fertilizers in many of these soils has been anomalous (Pal and Durge, 1987;
Pal et al., 1993). Both di- and trioctahedral micas, which are mainly
muscovite and biotite, are very common in these soils (Kapoor et al., 1981;
Pal et al., 1987; Pal and Durge, 1987; Pal et al., 1993). Lack of crop response
to K fertilizers has been ascribed to the rapid release of K from biotite,
whereas response to K has been attributed to the much reduced rate of
K release of mica with muscovitic character (Pal and Durge, 1993; Pal and
Srinivasarao, 2001). The X-ray intensity ratio of 001 and 002 basal
reflections of mica has been found to be an effective diagnostic parameter to
find out the quality of mica and therefore to judge the K releasing potential of
soils (Srinivasarao et al., 1994, 1998, 2000). However, actual quantification
of fine-grained mica of soils is possible by following chemical procedures.
A project was undertaken at Indian institute of Soil Science, Bhopal to assess
the relative content of biotite and muscovite mica and relate them with K
release and crop responses. Twenty-two benchmark soil series were selected
for the study. The soils selected covered the semi-arid tropical region of India
and included alluvial, red and black soils (Table 4.6.1). As per the soil orders
they representated Inceptisols (11), Alfisols (8), Vertisols (2) and Entisols
(1). The Inceptisols mostly represented the Indo-Gangetic Plain (IGP) with
an exception of Chandole, Kamliakheri, PN Palayam and Irugur. Chandole
soils represent the coastal region in central-western Andhra Pradesh and
Kamliakheri, though classified as Inceptisol, has properties very similar to
Vertisols. PN Palayam and Irugur soil series are extensive in Tamil Nadu and
both are developed on grainite gneiss parent material. Alfisols are mostly red
in colour with an exception of Kaseridipalli (black) and are developed on
gneissic parent material. Kaseriddipalli has been developed on basalt.
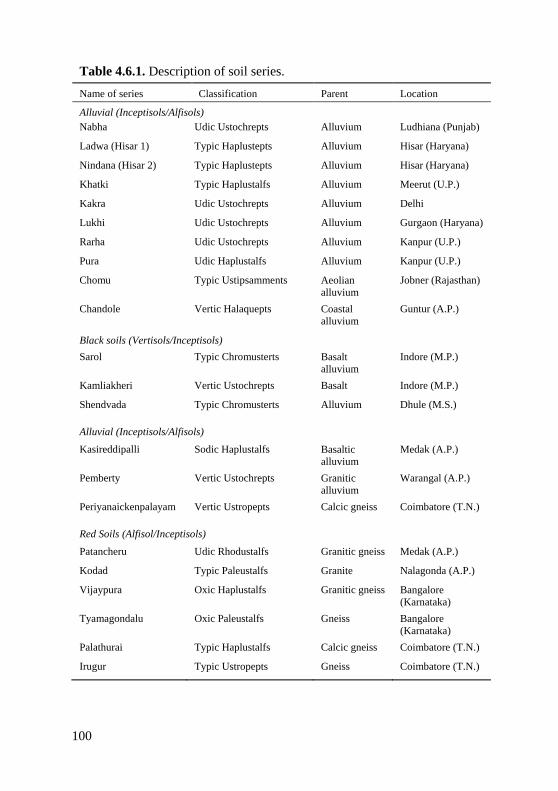
100
Table 4.6.1. Description of soil series.
Name of series Classification Parent Location
Alluvial (Inceptisols/Alfisols)
Nabha Udic Ustochrepts Alluvium Ludhiana (Punjab)
Ladwa (Hisar 1) Typic Haplustepts Alluvium Hisar (Haryana)
Nindana (Hisar 2) Typic Haplustepts Alluvium Hisar (Haryana)
Khatki Typic Haplustalfs Alluvium Meerut (U.P.)
Kakra Udic Ustochrepts Alluvium Delhi
Lukhi Udic Ustochrepts Alluvium Gurgaon (Haryana)
Rarha Udic Ustochrepts Alluvium Kanpur (U.P.)
Pura Udic Haplustalfs Alluvium Kanpur (U.P.)
Chomu Typic Ustipsamments Aeolian
alluvium
Jobner (Rajasthan)
Chandole Vertic Halaquepts Coastal
alluvium
Guntur (A.P.)
Black soils (Vertisols/Inceptisols)
Sarol Typic Chromusterts Basalt
alluvium
Indore (M.P.)
Kamliakheri Vertic Ustochrepts Basalt Indore (M.P.)
Shendvada Typic Chromusterts Alluvium Dhule (M.S.)
Alluvial (Inceptisols/Alfisols)
Kasireddipalli Sodic Haplustalfs Basaltic
alluvium
Medak (A.P.)
Pemberty Vertic Ustochrepts Granitic
alluvium
Warangal (A.P.)
Periyanaickenpalayam Vertic Ustropepts Calcic gneiss Coimbatore (T.N.)
Red Soils (Alfisol/Inceptisols)
Patancheru Udic Rhodustalfs Granitic gneiss Medak (A.P.)
Kodad Typic Paleustalfs Granite Nalagonda (A.P.)
Vijaypura Oxic Haplustalfs Granitic gneiss Bangalore
(Karnataka)
Tyamagondalu Oxic Paleustalfs Gneiss Bangalore
(Karnataka)
Palathurai Typic Haplustalfs Calcic gneiss Coimbatore (T.N.)
Irugur Typic Ustropepts Gneiss Coimbatore (T.N.)
101
The 001/002 peak ratio of mica in different size fractions is shown in
Table 4.6.2. It can be seen that the soil series like Chandole, PN Palayam,
Sarol, Shendwada and Kamaliakeri (001/002 ranging from 1.3 to 2.35) had
relatively less proportion of biotite mica, while the soil series like Hisar,
Rarha, Khatki, Palathurai and Tymagondalu (001/002 >3.0) were relatively
richer in biotite mica. Other soil series were intermediate. The sand fraction
of almost all the soils is dominated by quartz mineral followed by feldspars
(data not shown). The Sarol series contained large quantities of calcite
minerals. M minerals were present in the series like Hisar, Kakra, Lukhi,
Nabha, Khatki, Pura and Rarha in the sand fraction. This shows that in the
soils of Indo-gangetic alluvium, the mica minerals are present even in sand
fraction. M minerals are absent in the sand fraction in the red and black soils
of Indian semi-arid tropics (SAT). The silt fraction of the alluvial soils of
Indo-Gangetic alluvium contained high mica content ranging from 53% to
70%. The black soils were poor in mica, the content ranging from 3% to 36%
with most of the soils falling below 10%. In the red soils it ranged from 8 to
30%. The minerals present in clay fraction are shown in Table 4.6.3 and
4.6.4. In the clay fraction the mica content ranged from 58 to 88% in the
Indo-Gangetic alluvial soils followed by 4 to 45% in red soils. The black
soils contained 2 to 34% mica. The actual clay sized biotite and muscovite
mica content in the different soil series is shown in Fig. 4.2. The soils of
Hisar contained the highest amount of biotite mica i.e. anound 8% followed
by the soils of middle Indo-Gangetic plains (Pura and Rarha). These soils are
very rich in K stock and so they have a very long-term K supplying power
among all the soil series studied. The soils series like Kakra, Nabha, Lukhi
and Khatki (upper Indo-gangetic alluvium) also contained high amount of
biotite mica that was generally more than 4%. Palathurai soil series which is
in Coimbatore, TN, and is a red soil, contained exceptionally high amount of
biotite mica that was around 5%. The other two soil series (PN Palayam and
Irugur) in Coimbatore region contained little amount of biotite mica. The two
red soils in the Bangalore region differ considerably in their biotite content. It
was higher in Tymagondalu soil series than in Vijaypura soils series. This
explains the striking K response obtained in Vijaypura soil series in many
experiments including the Long-Term Fertilizer Experiment of ICAR. The
biotite mica content was also measured in silt fraction (Fig. 4.3). Fig. 4.3
reveals that in the soil series like Irugur, Kamliakheri, Kasireddipalli and
Khatki, the biotite mica is mainly concentrated in the silt fraction indicating
the presence of silt size biotite and in these soils, crop requirement of K may
be met from the K supply from the silt fraction. In addition to measurement
of K in clay fraction, efforts should be made to measure K in silt fraction to
get comprehensive knowledge of K supply from a particular soil
(Srinivasarao et al., 2000).
102
The K response data were compiled from secondary sources and presented in
Tables 4.6.4 and 4.6.5. Nabha series contains >4% biotite mica (clay sized)
and hence does supply sufficient K to rice crop. Both Pemberty and Kodad
contain less than 2.5% biotite but K supply to rice in Kodad soils may be
more restricted due to the presence of iron oxides that serve as coatings on
clay particles. Chandole soil series might be supplying K due to the presence
of zeolites and soluble salts. Wheat crop generally appears to be deficient and
more responsive to K than rice. Sorgum crop growing in Vijayapura and
Tymagondalu soils was deficient in K, however, the deficiency was less in
Tymagondalu soils. Vijaypura soils are extremely deficient in biotite mica
(less than 1%) compared to Tymagondalu series hence most of the sorghum
samples fell in the deficient category in Vijaypurs soil series. In another
study, the response to K application in fodder maize was higher in
Vijayapura than in Tymagondalu. Soybean plants growing on Vertisols were
found deficient in K but more percentage of samples were falling in deficient
category in Kamliakheri series than in Sarol series since Sarol contained
more than 2% biotite mica as against Kamliakheri that contained less than
1% biotite mica. Thus knowing soil K reserves and distribution of K forms
coupled with mineralogical data can help in comprehending more about K
replenishment capacity of soils under intensive cropping. There is no
response to applied K in the soils of Hisar which matches with the
mineralogical investigation i.e. high biotite content.
In Irugur series rice crop responded upto K3 level and in pearl millet, a
significant increase in yield was obtained due to K application. This is
expected since Irugur series contains very little biotite. However, sorghum
crop did not respond to K application. Tomato has responded to K
application in PN Palayam. PN Palayam contains less than 1% clay sized
biotite. In Patancheru, maize crop responded to K application upto 60 kg K2O
ha-1 and in Kasireddipalli, it responded upto 30 kg K2O ha-1. Both the soils
contain less than 1% biotite mica. The data base of crop responses to applied
K in all the soil series investigated is limited and calls for more studies on
these soils. The limited K response data available, however, shows a clear
trend of crop response to K wherever the soil biotite reserves are low. The
response is not spectacular in soils rich in biotite. There is an urgent need for
broad based field studies in the areas where the biotite reserves are low or the
K release reached the limiting values.
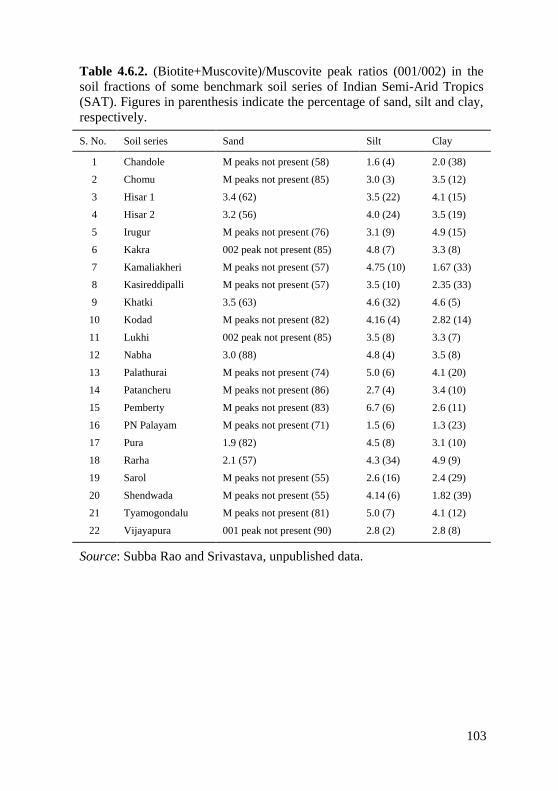
103
Table 4.6.2. (Biotite+Muscovite)/Muscovite peak ratios (001/002) in the
soil fractions of some benchmark soil series of Indian Semi-Arid Tropics
(SAT). Figures in parenthesis indicate the percentage of sand, silt and clay,
respectively.
S. No. Soil series Sand Silt Clay
1 Chandole M peaks not present (58) 1.6 (4) 2.0 (38)
2 Chomu M peaks not present (85) 3.0 (3) 3.5 (12)
3 Hisar 1 3.4 (62) 3.5 (22) 4.1 (15)
4 Hisar 2 3.2 (56) 4.0 (24) 3.5 (19)
5 Irugur M peaks not present (76) 3.1 (9) 4.9 (15)
6 Kakra 002 peak not present (85) 4.8 (7) 3.3 (8)
7 Kamaliakheri M peaks not present (57) 4.75 (10) 1.67 (33)
8 Kasireddipalli M peaks not present (57) 3.5 (10) 2.35 (33)
9 Khatki 3.5 (63) 4.6 (32) 4.6 (5)
10 Kodad M peaks not present (82) 4.16 (4) 2.82 (14)
11 Lukhi 002 peak not present (85) 3.5 (8) 3.3 (7)
12 Nabha 3.0 (88) 4.8 (4) 3.5 (8)
13 Palathurai M peaks not present (74) 5.0 (6) 4.1 (20)
14 Patancheru M peaks not present (86) 2.7 (4) 3.4 (10)
15 Pemberty M peaks not present (83) 6.7 (6) 2.6 (11)
16 PN Palayam M peaks not present (71) 1.5 (6) 1.3 (23)
17 Pura 1.9 (82) 4.5 (8) 3.1 (10)
18 Rarha 2.1 (57) 4.3 (34) 4.9 (9)
19 Sarol M peaks not present (55) 2.6 (16) 2.4 (29)
20 Shendwada M peaks not present (55) 4.14 (6) 1.82 (39)
21 Tyamogondalu M peaks not present (81) 5.0 (7) 4.1 (12)
22 Vijayapura 001 peak not present (90) 2.8 (2) 2.8 (8)
Source: Subba Rao and Srivastava, unpublished data.
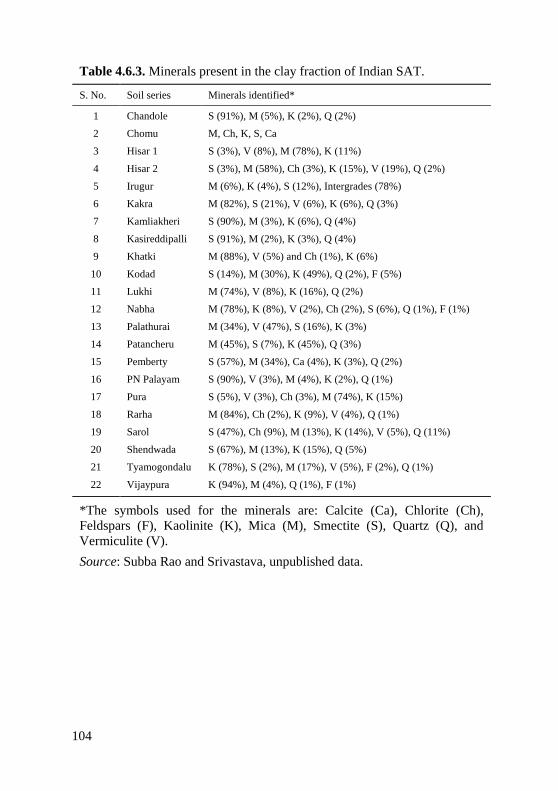
104
Table 4.6.3. Minerals present in the clay fraction of Indian SAT.
S. No. Soil series Minerals identified*
1 Chandole S (91%), M (5%), K (2%), Q (2%)
2 Chomu M, Ch, K, S, Ca
3 Hisar 1 S (3%), V (8%), M (78%), K (11%)
4 Hisar 2 S (3%), M (58%), Ch (3%), K (15%), V (19%), Q (2%)
5 Irugur M (6%), K (4%), S (12%), Intergrades (78%)
6 Kakra M (82%), S (21%), V (6%), K (6%), Q (3%)
7 Kamliakheri S (90%), M (3%), K (6%), Q (4%)
8 Kasireddipalli S (91%), M (2%), K (3%), Q (4%)
9 Khatki M (88%), V (5%) and Ch (1%), K (6%)
10 Kodad S (14%), M (30%), K (49%), Q (2%), F (5%)
11 Lukhi M (74%), V (8%), K (16%), Q (2%)
12 Nabha M (78%), K (8%), V (2%), Ch (2%), S (6%), Q (1%), F (1%)
13 Palathurai M (34%), V (47%), S (16%), K (3%)
14 Patancheru M (45%), S (7%), K (45%), Q (3%)
15 Pemberty S (57%), M (34%), Ca (4%), K (3%), Q (2%)
16 PN Palayam S (90%), V (3%), M (4%), K (2%), Q (1%)
17 Pura S (5%), V (3%), Ch (3%), M (74%), K (15%)
18 Rarha M (84%), Ch (2%), K (9%), V (4%), Q (1%)
19 Sarol S (47%), Ch (9%), M (13%), K (14%), V (5%), Q (11%)
20 Shendwada S (67%), M (13%), K (15%), Q (5%)
21 Tyamogondalu K (78%), S (2%), M (17%), V (5%), F (2%), Q (1%)
22 Vijaypura K (94%), M (4%), Q (1%), F (1%)
*The symbols used for the minerals are: Calcite (Ca), Chlorite (Ch),
Feldspars (F), Kaolinite (K), Mica (M), Smectite (S), Quartz (Q), and
Vermiculite (V).
Source: Subba Rao and Srivastava, unpublished data.
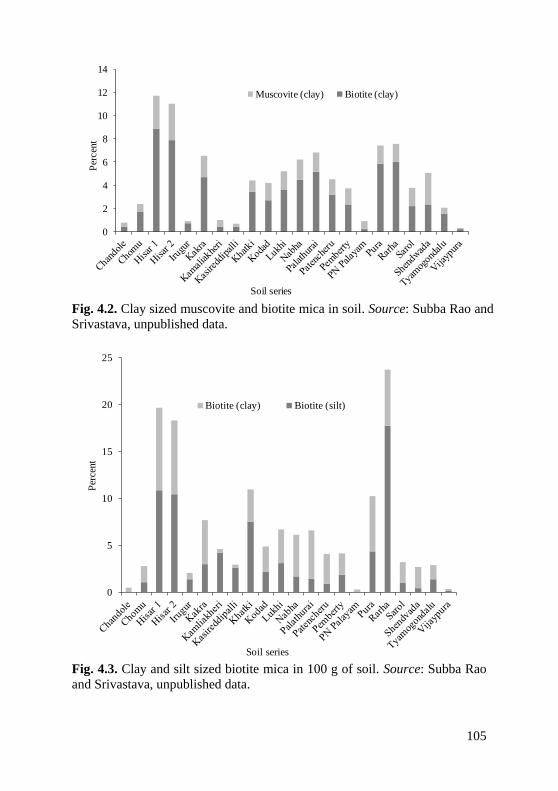
105
Fig. 4.2. Clay sized muscovite and biotite mica in soil. Source: Subba Rao and
Srivastava, unpublished data.
Fig. 4.3. Clay and silt sized biotite mica in 100 g of soil. Source: Subba Rao
and Srivastava, unpublished data.
0
2
4
6
8
10
12
14
Per
cen
t
Soil series
Muscovite (clay) Biotite (clay)
0
5
10
15
20
25
Per
cent
Soil series
Biotite (clay) Biotite (silt)
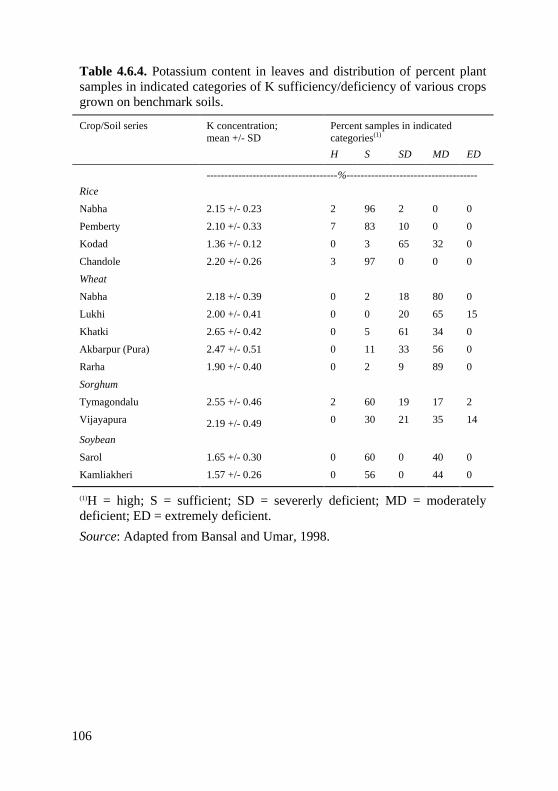
106
Table 4.6.4. Potassium content in leaves and distribution of percent plant
samples in indicated categories of K sufficiency/deficiency of various crops
grown on benchmark soils.
Crop/Soil series K concentration;
mean +/- SD
Percent samples in indicated
categories(1)
H S SD MD ED
-------------------------------------%-------------------------------------
Rice
Nabha 2.15 +/- 0.23 2 96 2 0 0
Pemberty 2.10 +/- 0.33 7 83 10 0 0
Kodad 1.36 +/- 0.12 0 3 65 32 0
Chandole 2.20 +/- 0.26 3 97 0 0 0
Wheat
Nabha 2.18 +/- 0.39 0 2 18 80 0
Lukhi 2.00 +/- 0.41 0 0 20 65 15
Khatki 2.65 +/- 0.42 0 5 61 34 0
Akbarpur (Pura) 2.47 +/- 0.51 0 11 33 56 0
Rarha 1.90 +/- 0.40 0 2 9 89 0
Sorghum
Tymagondalu 2.55 +/- 0.46 2 60 19 17 2
Vijayapura 2.19 +/- 0.49 0 30 21 35 14
Soybean
Sarol 1.65 +/- 0.30 0 60 0 40 0
Kamliakheri 1.57 +/- 0.26 0 56 0 44 0
(1)H = high; S = sufficient; SD = severerly deficient; MD = moderately
deficient; ED = extremely deficient.
Source: Adapted from Bansal and Umar, 1998.
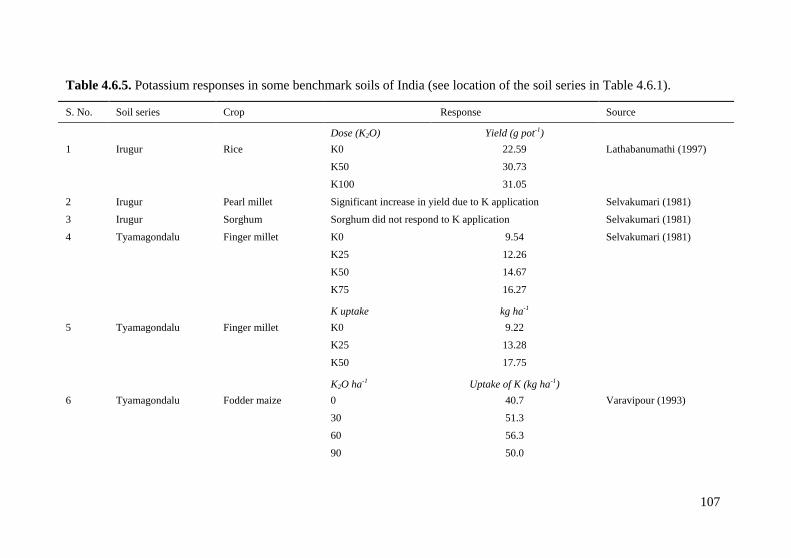
Table 4.6.5. continued
107
Table 4.6.5. Potassium responses in some benchmark soils of India (see location of the soil series in Table 4.6.1).
S. No. Soil series Crop Response Source
Dose (K2O) Yield (g pot-1)
1 Irugur Rice K0 22.59 Lathabanumathi (1997)
K50 30.73
K100 31.05
2 Irugur Pearl millet Significant increase in yield due to K application Selvakumari (1981)
3 Irugur Sorghum Sorghum did not respond to K application Selvakumari (1981)
4 Tyamagondalu Finger millet K0 9.54 Selvakumari (1981)
K25 12.26
K50 14.67
K75 16.27
K uptake kg ha-1
5 Tyamagondalu Finger millet K0 9.22
K25 13.28
K50 17.75
K2O ha-1 Uptake of K (kg ha-1)
6 Tyamagondalu Fodder maize 0 40.7 Varavipour (1993)
30 51.3
60 56.3
90 50.0
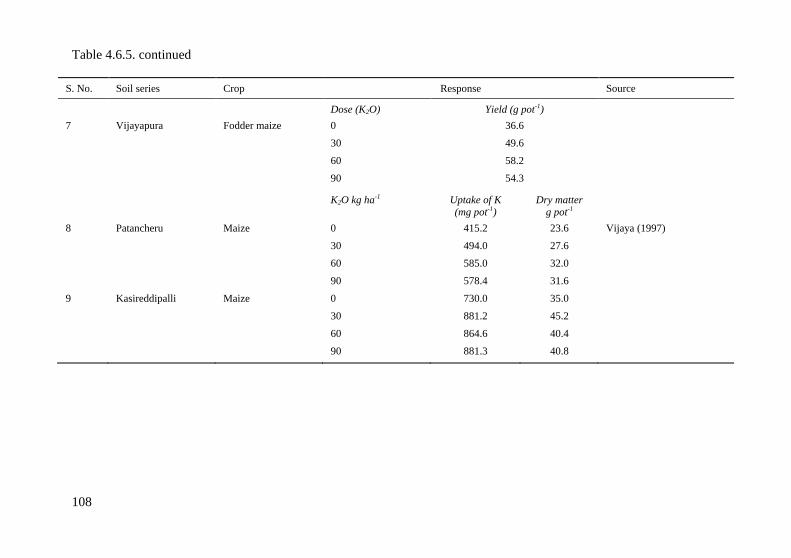
Table 4.6.5. continued
108
S. No. Soil series Crop Response Source
Dose (K2O) Yield (g pot-1)
7 Vijayapura Fodder maize 0 36.6
30 49.6
60 58.2
90 54.3
K2O kg ha-1 Uptake of K
(mg pot-1)
Dry matter
g pot-1
8 Patancheru Maize 0 415.2 23.6 Vijaya (1997)
30 494.0 27.6
60 585.0 32.0
90 578.4 31.6
9 Kasireddipalli Maize 0 730.0 35.0
30 881.2 45.2
60 864.6 40.4
90 881.3 40.8
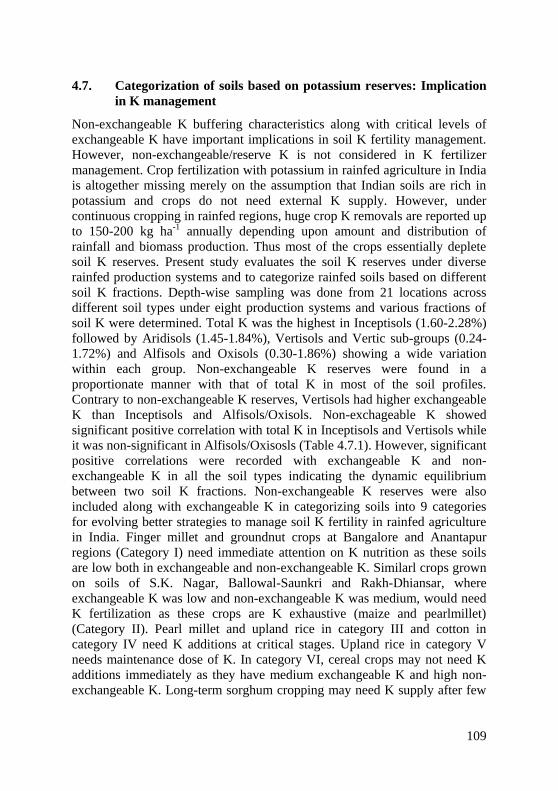
Table 4.7.1. continued
109
4.7. Categorization of soils based on potassium reserves: Implication
in K management
Non-exchangeable K buffering characteristics along with critical levels of
exchangeable K have important implications in soil K fertility management.
However, non-exchangeable/reserve K is not considered in K fertilizer
management. Crop fertilization with potassium in rainfed agriculture in India
is altogether missing merely on the assumption that Indian soils are rich in
potassium and crops do not need external K supply. However, under
continuous cropping in rainfed regions, huge crop K removals are reported up
to 150-200 kg ha-1 annually depending upon amount and distribution of
rainfall and biomass production. Thus most of the crops essentially deplete
soil K reserves. Present study evaluates the soil K reserves under diverse
rainfed production systems and to categorize rainfed soils based on different
soil K fractions. Depth-wise sampling was done from 21 locations across
different soil types under eight production systems and various fractions of
soil K were determined. Total K was the highest in Inceptisols (1.60-2.28%)
followed by Aridisols (1.45-1.84%), Vertisols and Vertic sub-groups (0.24-
1.72%) and Alfisols and Oxisols (0.30-1.86%) showing a wide variation
within each group. Non-exchangeable K reserves were found in a
proportionate manner with that of total K in most of the soil profiles.
Contrary to non-exchangeable K reserves, Vertisols had higher exchangeable
K than Inceptisols and Alfisols/Oxisols. Non-exchageable K showed
significant positive correlation with total K in Inceptisols and Vertisols while
it was non-significant in Alfisols/Oxisosls (Table 4.7.1). However, significant
positive correlations were recorded with exchangeable K and non-
exchangeable K in all the soil types indicating the dynamic equilibrium
between two soil K fractions. Non-exchangeable K reserves were also
included along with exchangeable K in categorizing soils into 9 categories
for evolving better strategies to manage soil K fertility in rainfed agriculture
in India. Finger millet and groundnut crops at Bangalore and Anantapur
regions (Category I) need immediate attention on K nutrition as these soils
are low both in exchangeable and non-exchangeable K. Similarl crops grown
on soils of S.K. Nagar, Ballowal-Saunkri and Rakh-Dhiansar, where
exchangeable K was low and non-exchangeable K was medium, would need
K fertilization as these crops are K exhaustive (maize and pearlmillet)
(Category II). Pearl millet and upland rice in category III and cotton in
category IV need K additions at critical stages. Upland rice in category V
needs maintenance dose of K. In category VI, cereal crops may not need K
additions immediately as they have medium exchangeable K and high non-
exchangeable K. Long-term sorghum cropping may need K supply after few
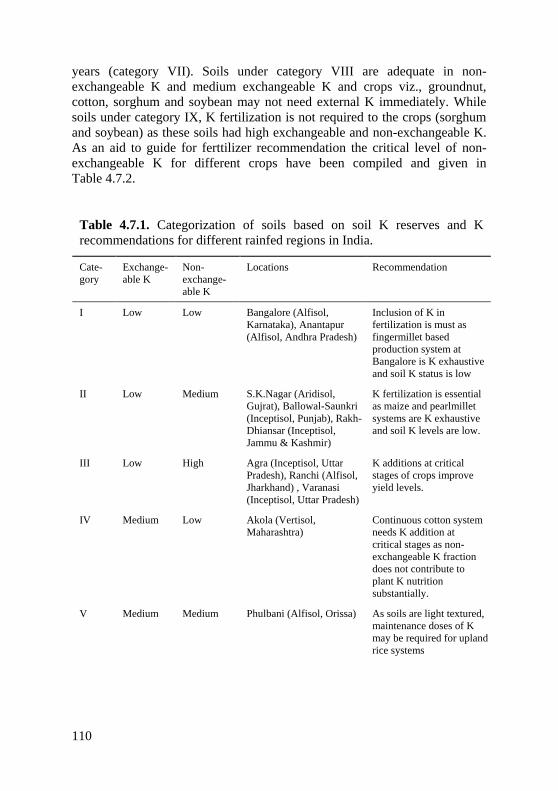
110
years (category VII). Soils under category VIII are adequate in non-
exchangeable K and medium exchangeable K and crops viz., groundnut,
cotton, sorghum and soybean may not need external K immediately. While
soils under category IX, K fertilization is not required to the crops (sorghum
and soybean) as these soils had high exchangeable and non-exchangeable K.
As an aid to guide for ferttilizer recommendation the critical level of non-
exchangeable K for different crops have been compiled and given in
Table 4.7.2.
Table 4.7.1. Categorization of soils based on soil K reserves and K
recommendations for different rainfed regions in India.
Cate-
gory
Exchange-
able K
Non-
exchange-
able K
Locations Recommendation
I Low Low Bangalore (Alfisol,
Karnataka), Anantapur
(Alfisol, Andhra Pradesh)
Inclusion of K in
fertilization is must as
fingermillet based
production system at
Bangalore is K exhaustive
and soil K status is low
II Low Medium S.K.Nagar (Aridisol,
Gujrat), Ballowal-Saunkri
(Inceptisol, Punjab), Rakh-
Dhiansar (Inceptisol,
Jammu & Kashmir)
K fertilization is essential
as maize and pearlmillet
systems are K exhaustive
and soil K levels are low.
III Low High Agra (Inceptisol, Uttar
Pradesh), Ranchi (Alfisol,
Jharkhand) , Varanasi
(Inceptisol, Uttar Pradesh)
K additions at critical
stages of crops improve
yield levels.
IV Medium Low Akola (Vertisol,
Maharashtra)
Continuous cotton system
needs K addition at
critical stages as non-
exchangeable K fraction
does not contribute to
plant K nutrition
substantially.
V Medium Medium Phulbani (Alfisol, Orissa) As soils are light textured,
maintenance doses of K
may be required for upland
rice systems
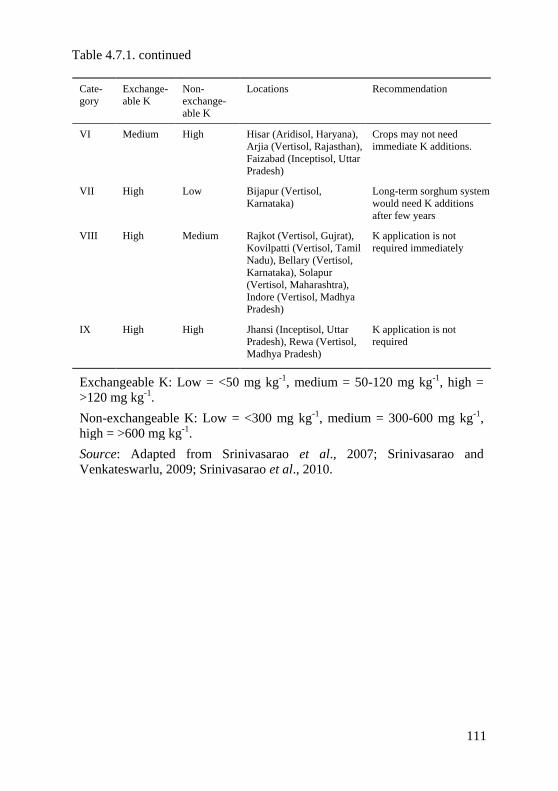
Table 4.7.1. continued
111
Cate-
gory
Exchange-
able K
Non-
exchange-
able K
Locations Recommendation
VI Medium High Hisar (Aridisol, Haryana),
Arjia (Vertisol, Rajasthan),
Faizabad (Inceptisol, Uttar
Pradesh)
Crops may not need
immediate K additions.
VII High Low Bijapur (Vertisol,
Karnataka)
Long-term sorghum system
would need K additions
after few years
VIII High Medium Rajkot (Vertisol, Gujrat),
Kovilpatti (Vertisol, Tamil
Nadu), Bellary (Vertisol,
Karnataka), Solapur
(Vertisol, Maharashtra),
Indore (Vertisol, Madhya
Pradesh)
K application is not
required immediately
IX High High Jhansi (Inceptisol, Uttar
Pradesh), Rewa (Vertisol,
Madhya Pradesh)
K application is not
required
Exchangeable K: Low = <50 mg kg-1, medium = 50-120 mg kg-1, high =
>120 mg kg-1.
Non-exchangeable K: Low = <300 mg kg-1, medium = 300-600 mg kg-1,
high = >600 mg kg-1.
Source: Adapted from Srinivasarao et al., 2007; Srinivasarao and
Venkateswarlu, 2009; Srinivasarao et al., 2010.
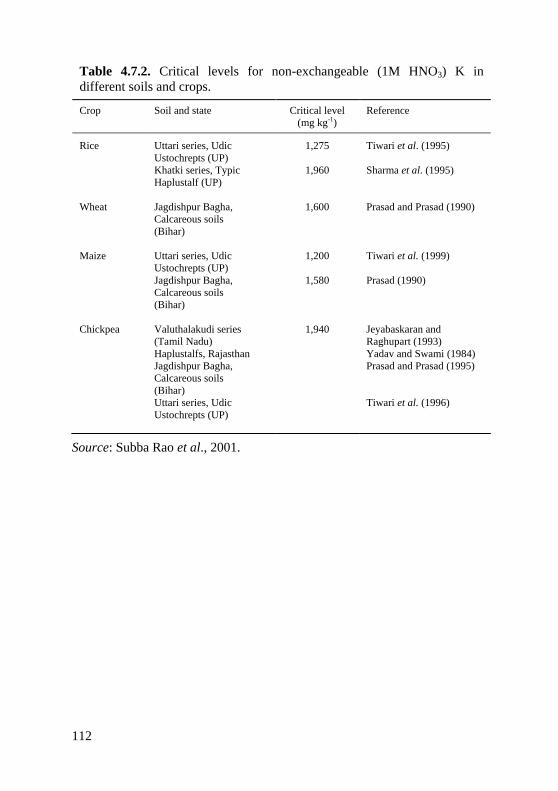
112
Table 4.7.2. Critical levels for non-exchangeable (1M HNO3) K in
different soils and crops.
Crop Soil and state Critical level
(mg kg-1)
Reference
Rice
Wheat
Maize
Chickpea
Uttari series, Udic
Ustochrepts (UP)
Khatki series, Typic
Haplustalf (UP)
Jagdishpur Bagha,
Calcareous soils
(Bihar)
Uttari series, Udic
Ustochrepts (UP)
Jagdishpur Bagha,
Calcareous soils
(Bihar)
Valuthalakudi series
(Tamil Nadu)
Haplustalfs, Rajasthan
Jagdishpur Bagha,
Calcareous soils
(Bihar)
Uttari series, Udic
Ustochrepts (UP)
1,275
1,960
1,600
1,200
1,580
1,940
Tiwari et al. (1995)
Sharma et al. (1995)
Prasad and Prasad (1990)
Tiwari et al. (1999)
Prasad (1990)
Jeyabaskaran and
Raghupart (1993)
Yadav and Swami (1984)
Prasad and Prasad (1995)
Tiwari et al. (1996)
Source: Subba Rao et al., 2001.
113
4.7.1. Categorization of districts based on non-exchangeable and
exchangeable K
Recommendations of potassic fertilizer are made based on available
(exchangeable + water-soluble) K status of soils in different soil testing
laboratories in India. However, recent studies employing a variety of
measures of non-exchangeable K indicated a very substantial contribution of
non-exchangeable fraction of soil K to crop K uptake. An attempt was made
to examine the information generated in the last 30 years on the status of non-
exchangeable K in Indian soils, its contribution to crop K needs,
categorization of Indian soils based on exchangeable and non-exchangeable
K fractions and K recommendations considering both the fractions of soil K.
Inclusion of non-exchangeable K in the soil testing aids in predicting
immediate K needs of crop plants as well as long-term K needs of intensive
cropping systems. Based on published information on Indian soils, district
wise maps were prepared for both exchangeable and non-exchangeable K and
K deficient districts of the country were identified where K application is a
must (Srinivasarao et al., 2010)
4.7.2. Geographical Information System (GIS) based maps for
Exchangeable K and Non-exchangeable K
Geographic information systems (GIS) was used for categorizing Indian
districts into low, medium and high in terms of exchangeable and non-
exchageable K based on published information on K status in Indian soils
during last 30 years, across districts and tried to derive the patterns or relation
of the same with reference to AERs, AESR maps (NBSS & LUP, Nagpur
10). Using Arcview 3.1, district wise maps of exchangeable and non-
exchangeable K and boundaries of agroecological regions on these maps
were imposed.
4.7.3. Categorization of districts as per their K reserves and availability
Data for exchangeable and non-exchangeable potassium (K) (mg kg-1) of
different soil groups of various regions in India are obtained in excel tabular
format. A new field “District id” for each region is added to the tables and
converted into “dbf format” compatible for Arcview GIS and saved. The
resulting tables were added to Arcview tables and linked to the table of
Districts shapefile using common field “Districts id”. Using “Legend Editor”
property districts shapefile is classified into three categories low, medium
and high by taking exchangeable K and non-exchangeable K as fields of
114
classification. For deriving the maps for AESR and AERs for exchangeable
K and non-exchangeable K, weighted average approach was followed for
deriving a single unit valuefor for the whole sub region, region as the case
may be by unioning the maps of districts with sub region/region. For
categorizing soils for exchangeable K three levels were used viz., low (<50
mg kg-1), medium (50-120 mg kg-1) and high (>120 mg kg-1). For non-
exchangeable K, the categories used were low (<300 mg kg-1), medium (300-
600 mg kg-1) and high (>600 mg kg-1) (Srinivasarao et al., 2007, 2010).
4.7.4. Identification of K efficient districts for K fertilizer
Based on above maps, districts were identified with low, medium and high in
exchangeable as well as non-exchangeable K fractions (Map 4.7.4.1 and
4.7.4.2) (Srinivasarao et al., 2010). Nine categories of districts were
identified in combination of exchangeable and non-exchangeable K fractions
(Mengel, 1985; Srinivasarao et al. 1994, 1997, 2000, 2006, 2010). Fifteen
districts were identified where both exchangeable and non-exchangeable K
status was low (Category I). These districts represent mostly red, lateritic
soils, light textured and shallow soils. Since both the K fractions were low, K
supply to crops grown on these soils is a must and therefore regular K
fertilization should be done considering crop K removal and the
recommendations generated in the local university or ICAR institutes.
Another 18 districts are categorized under Category II where exchangeable K
was low while non-exchangeable K was medium. These soils also represent
light textured and acidic alluvial soils. As exchangeable K was low and
medium K reserves, regular K application is essential. Two districts under
Category III, where exchangeable was low and non-exchangeable K was
high, K addition at critical stages is required to improve the crop yields.
Category IV covers 58 districts where exchangeable K medium and non-
exchangeable low. These districts represent light textured alluvial, red and
lateritic, acid sulfate and sandy soils. These soils need considerable attention
from K management point of view. Continuous cropping on these soils result
in depletion of soil reserve K, therefore, K addition at critical stages is
required. If K demanding cropping systems are like rice-wheat, rice-wheat-
fodder, sunflower based, potato and other tuber crops, banana, intensive
fodder and vegetables based systems are grown regular additions of K is
essential. Category V covers 115 districts of India, where both exchangeable
and non-exchangeable K fractions were medium. These regions represents
various types of soils from acid to alkaline, red, medium to deep black and
alluvial. As both the fractions were medium, K additions are required for
high value, quality (tobacco) and K exhaustive crops (sugarcane, potato etc.).
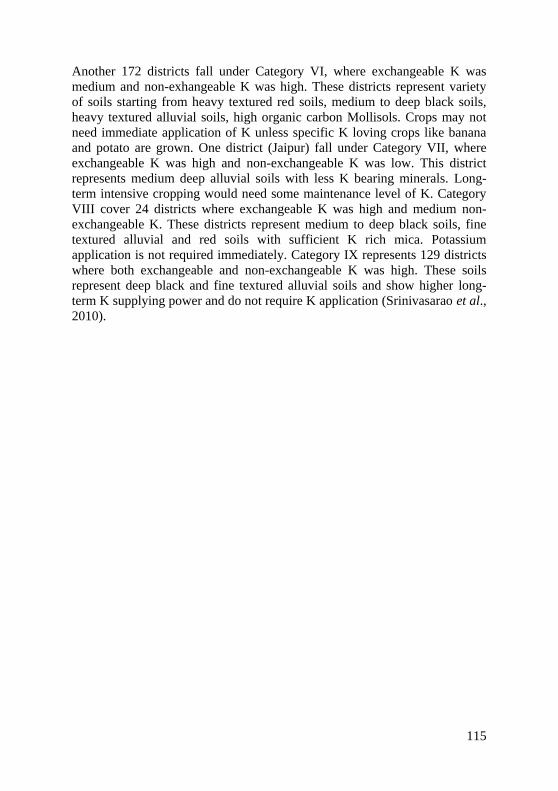
115
Another 172 districts fall under Category VI, where exchangeable K was
medium and non-exhangeable K was high. These districts represent variety
of soils starting from heavy textured red soils, medium to deep black soils,
heavy textured alluvial soils, high organic carbon Mollisols. Crops may not
need immediate application of K unless specific K loving crops like banana
and potato are grown. One district (Jaipur) fall under Category VII, where
exchangeable K was high and non-exchangeable K was low. This district
represents medium deep alluvial soils with less K bearing minerals. Long-
term intensive cropping would need some maintenance level of K. Category
VIII cover 24 districts where exchangeable K was high and medium non-
exchangeable K. These districts represent medium to deep black soils, fine
textured alluvial and red soils with sufficient K rich mica. Potassium
application is not required immediately. Category IX represents 129 districts
where both exchangeable and non-exchangeable K was high. These soils
represent deep black and fine textured alluvial soils and show higher long-
term K supplying power and do not require K application (Srinivasarao et al.,
2010).
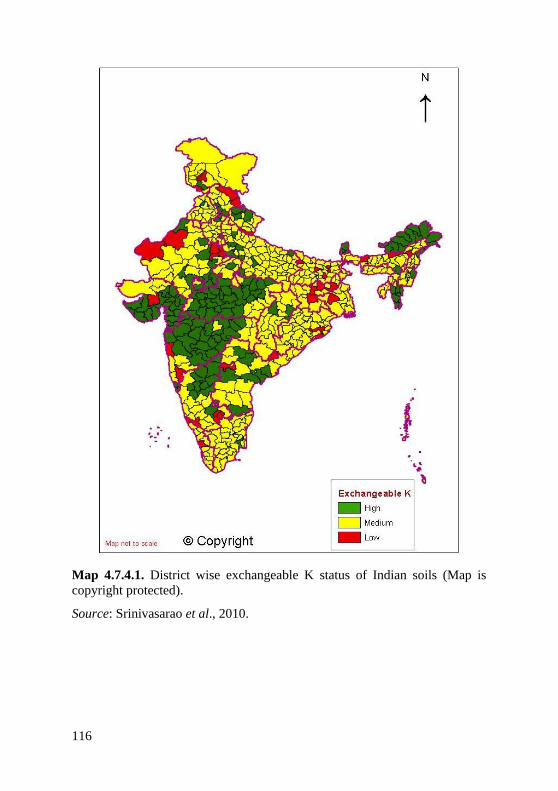
116
Map 4.7.4.1. District wise exchangeable K status of Indian soils (Map is
copyright protected).
Source: Srinivasarao et al., 2010.
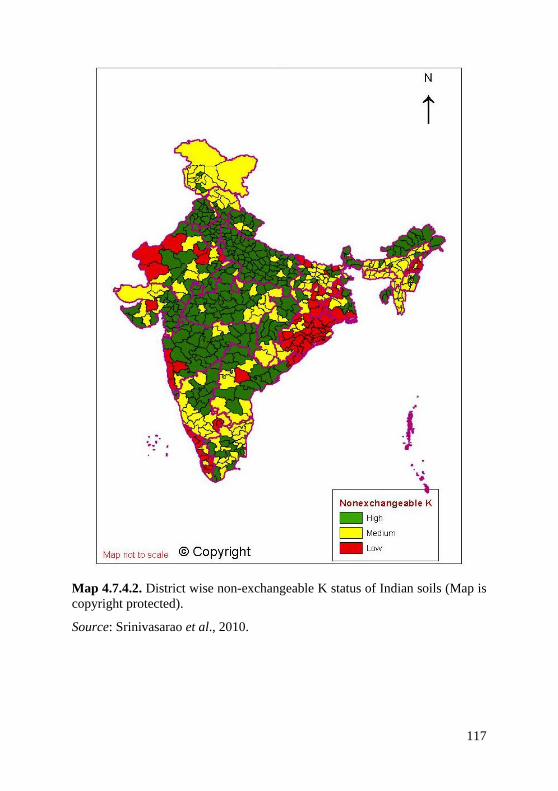
117
Map 4.7.4.2. District wise non-exchangeable K status of Indian soils (Map is
copyright protected).
Source: Srinivasarao et al., 2010.
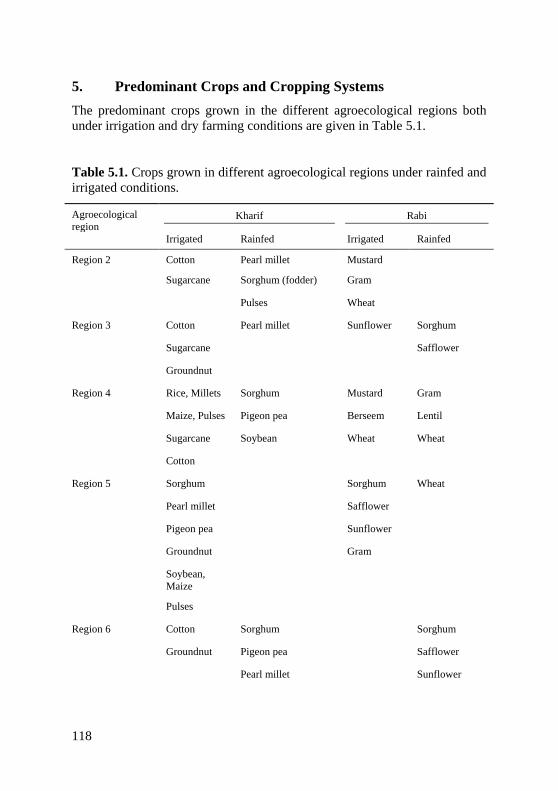
Table 5.1. continued
118
5. Predominant Crops and Cropping Systems
The predominant crops grown in the different agroecological regions both
under irrigation and dry farming conditions are given in Table 5.1.
Table 5.1. Crops grown in different agroecological regions under rainfed and
irrigated conditions.
Agroecological
region Kharif Rabi
Irrigated Rainfed Irrigated Rainfed
Region 2 Cotton Pearl millet Mustard
Sugarcane Sorghum (fodder) Gram
Pulses Wheat
Region 3 Cotton Pearl millet Sunflower Sorghum
Sugarcane Safflower
Groundnut
Region 4 Rice, Millets Sorghum Mustard Gram
Maize, Pulses Pigeon pea Berseem Lentil
Sugarcane Soybean Wheat Wheat
Cotton
Region 5 Sorghum Sorghum Wheat
Pearl millet Safflower
Pigeon pea Sunflower
Groundnut Gram
Soybean,
Maize
Pulses
Region 6 Cotton Sorghum Sorghum
Groundnut Pigeon pea Safflower
Pearl millet Sunflower
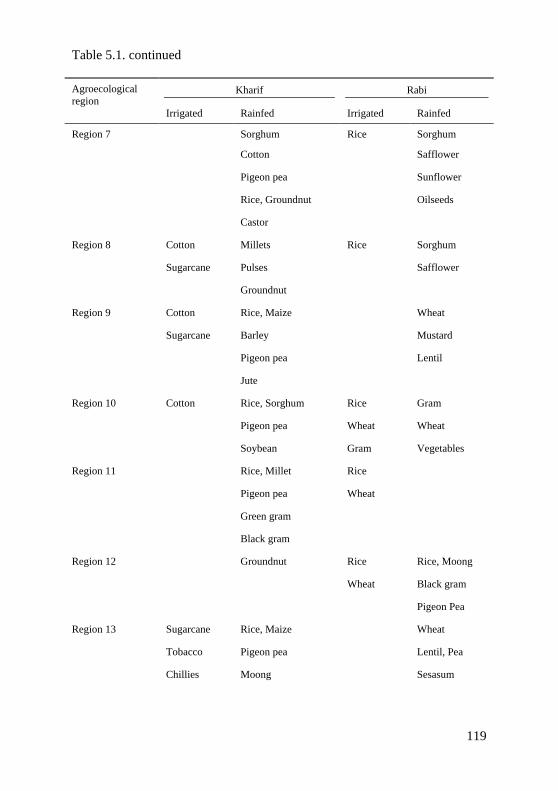
Table 5.1. continued
119
Agroecological
region Kharif Rabi
Irrigated Rainfed Irrigated Rainfed
Region 7 Sorghum Rice Sorghum
Cotton Safflower
Pigeon pea Sunflower
Rice, Groundnut Oilseeds
Castor
Region 8 Cotton Millets Rice Sorghum
Sugarcane Pulses Safflower
Groundnut
Region 9 Cotton Rice, Maize Wheat
Sugarcane Barley Mustard
Pigeon pea Lentil
Jute
Region 10 Cotton Rice, Sorghum Rice Gram
Pigeon pea Wheat Wheat
Soybean Gram Vegetables
Region 11 Rice, Millet Rice
Pigeon pea Wheat
Green gram
Black gram
Region 12 Groundnut Rice Rice, Moong
Wheat Black gram
Pigeon Pea
Region 13 Sugarcane Rice, Maize Wheat
Tobacco Pigeon pea Lentil, Pea
Chillies Moong Sesasum
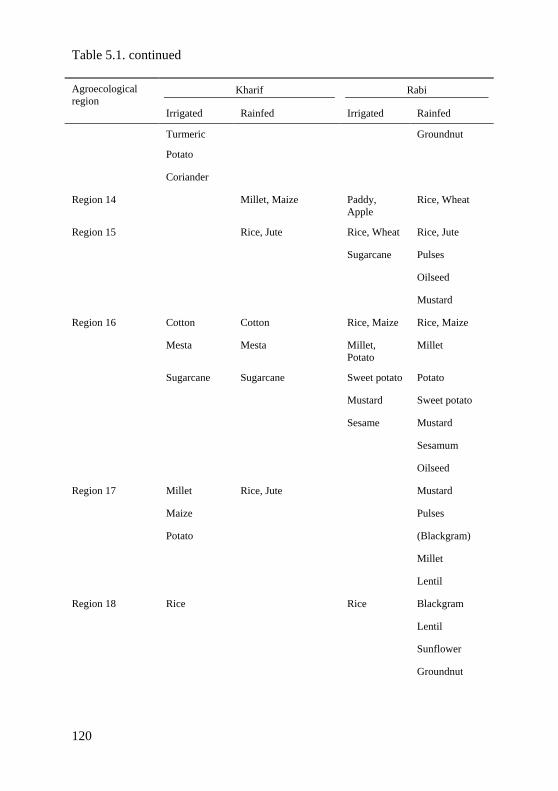
Table 5.1. continued
120
Agroecological
region Kharif Rabi
Irrigated Rainfed Irrigated Rainfed
Turmeric Groundnut
Potato
Coriander
Region 14 Millet, Maize Paddy,
Apple
Rice, Wheat
Region 15 Rice, Jute Rice, Wheat Rice, Jute
Sugarcane Pulses
Oilseed
Mustard
Region 16 Cotton Cotton Rice, Maize Rice, Maize
Mesta Mesta Millet,
Potato
Millet
Sugarcane Sugarcane Sweet potato Potato
Mustard Sweet potato
Sesame Mustard
Sesamum
Oilseed
Region 17 Millet Rice, Jute Mustard
Maize Pulses
Potato (Blackgram)
Millet
Lentil
Region 18 Rice Rice Blackgram
Lentil
Sunflower
Groundnut
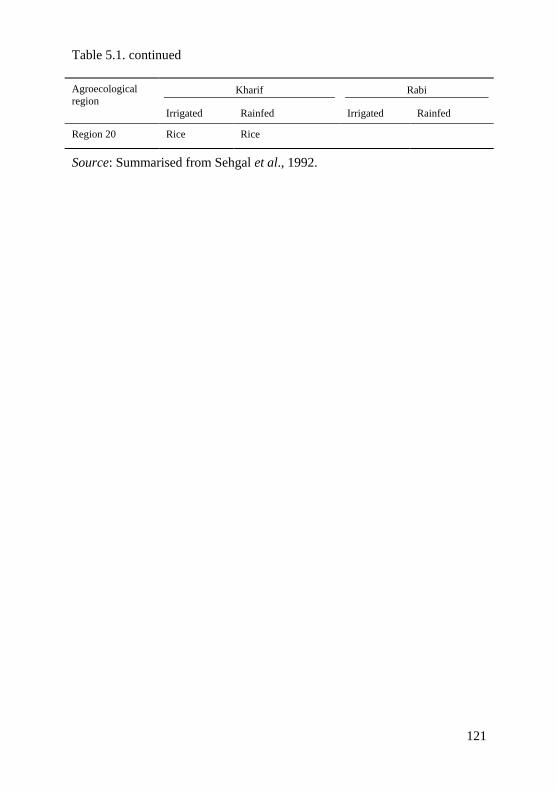
Table 5.1. continued
121
Agroecological
region Kharif Rabi
Irrigated Rainfed Irrigated Rainfed
Region 20 Rice Rice
Source: Summarised from Sehgal et al., 1992.
122
6. Crop Response to Potassium and Economies of K
Application
Bhargava et al. (1985) employed time series analysis to trace the trends in the
response of rice and wheat crops in different agroclimatic regions
(Table 6.1). With a few exceptions, in all the regions there was progressive
build up in crop response to 60 kg ha-1 K2O. The increasing trend in response
over the years could be due to progressive intensification of agriculture with
the introduction of high yielding varieties, high inputs of other nutrients
especially N and P, irrigation and use of improved crop production
technologies. Table 6.2 summarises the response of rice (irrigated and
rainfed) and wheat (irrigated) in different agroclimatic regions during the
period 1977 to 1982. The response of rice both under irrigated and rainfed
condition increased at 20, 40 and 60 kg ha-1 K2O rates of application over
N40P20, N80 P40 and N120 P60. Pillai et al. (1987) summarised the response of
crops to K in selected cropping systems in long-term experiments in progress
at various centers in different regions of India (Table 6.3). Rice responded to
K both in rice-rice and rice-wheat systems at several centres.Wheat
responded to K in 3 systems at all locations except Rudrur and Siruguppa.
Sorghum responded to K at Akola and Siruguppa and failed to respond at
Gwalior and Sehore. The data of mean response to added K at different levels
for rice, wheat and soybean crops is shown in Fig. 6.1 and calculated from
Table 6.4. The data is from experiments conducted in different
agroecological regions by PDCSR, Modipuram. Very high response to added
K is found in regions 8, 9, 13, and 16 whereas regions 2, 5, and 14 showed a
response which was relatively lower in magnitude. Nambiar and Abrol
(1989) summarised the average yields of crops over the years 1971-1987
under intensive cropping systems at different locations (Table 6.5). Average
yield over the years showed positive responses to K in maize and wheat at
Ludhiana and Palampur, rice and wheat at Pantnagar and kharif (rainy
season) rice at Bhubaneswar. The yields computed over the last 3 years
showed increased responses in maize at Coimbatore, soybean at Jabalpur,
soybean and wheat at Ranchi and rice at Bhubaneswar. Similarly, crop
response to K application after 5 to 10 years intensive cropping was obtained
in several long-term fertilizer experiments under All India Coordinated
Research Project on Long-Term Fertilizer Experiments (Swarup and
Srinivasarao, 1999).
Crop response to K application in some selected regions is presented in Table
6.1. In this chapter not all the tables cover the same extend of data.
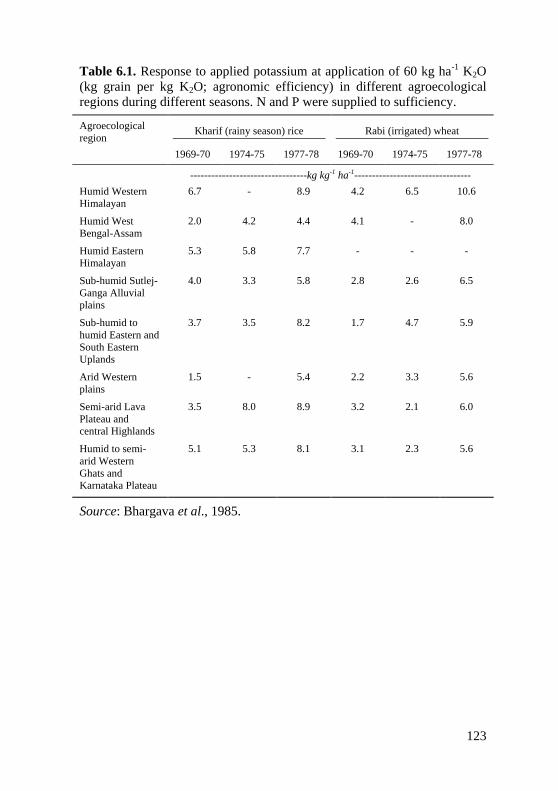
123
Table 6.1. Response to applied potassium at application of 60 kg ha-1 K2O
(kg grain per kg K2O; agronomic efficiency) in different agroecological
regions during different seasons. N and P were supplied to sufficiency.
Agroecological
region Kharif (rainy season) rice Rabi (irrigated) wheat
1969-70 1974-75 1977-78 1969-70 1974-75 1977-78
---------------------------------kg kg-1 ha-1---------------------------------
Humid Western
Himalayan
6.7 - 8.9 4.2 6.5 10.6
Humid West
Bengal-Assam
2.0 4.2 4.4 4.1 - 8.0
Humid Eastern
Himalayan
5.3 5.8 7.7 - - -
Sub-humid Sutlej-
Ganga Alluvial
plains
4.0 3.3 5.8 2.8 2.6 6.5
Sub-humid to
humid Eastern and
South Eastern
Uplands
3.7 3.5 8.2 1.7 4.7 5.9
Arid Western
plains
1.5 - 5.4 2.2 3.3 5.6
Semi-arid Lava
Plateau and
central Highlands
3.5 8.0 8.9 3.2 2.1 6.0
Humid to semi-
arid Western
Ghats and
Karnataka Plateau
5.1 5.3 8.1 3.1 2.3 5.6
Source: Bhargava et al., 1985.
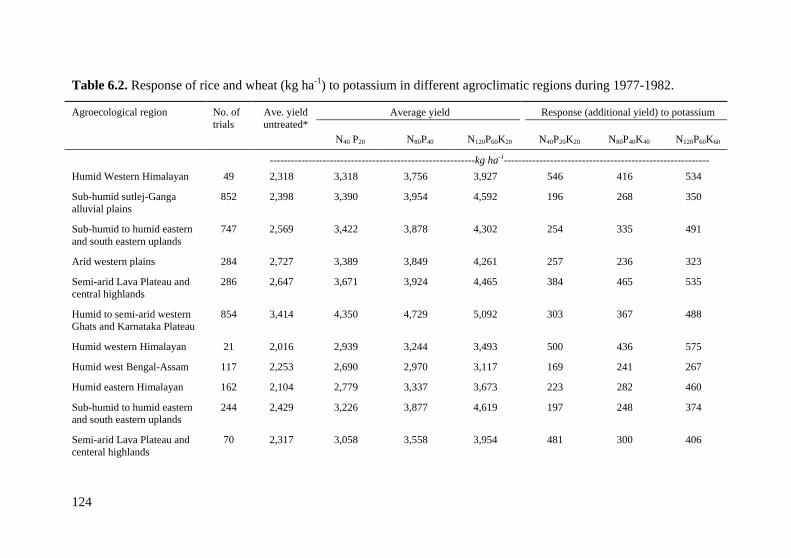
Table 6.2. continued
124
Table 6.2. Response of rice and wheat (kg ha-1) to potassium in different agroclimatic regions during 1977-1982.
Agroecological region No. of
trials
Ave. yield
untreated*
Average yield Response (additional yield) to potassium
N40 P20 N80P40 N120P60K20 N40P20K20 N80P40K40 N120P60K60
----------------------------------------------------------kg ha-1----------------------------------------------------------
Humid Western Himalayan 49 2,318 3,318 3,756 3,927 546 416 534
Sub-humid sutlej-Ganga
alluvial plains
852 2,398 3,390 3,954 4,592 196 268 350
Sub-humid to humid eastern
and south eastern uplands
747 2,569 3,422 3,878 4,302 254 335 491
Arid western plains 284 2,727 3,389 3,849 4,261 257 236 323
Semi-arid Lava Plateau and
central highlands
286 2,647 3,671 3,924 4,465 384 465 535
Humid to semi-arid western
Ghats and Karnataka Plateau
854 3,414 4,350 4,729 5,092 303 367 488
Humid western Himalayan 21 2,016 2,939 3,244 3,493 500 436 575
Humid west Bengal-Assam 117 2,253 2,690 2,970 3,117 169 241 267
Humid eastern Himalayan 162 2,104 2,779 3,337 3,673 223 282 460
Sub-humid to humid eastern
and south eastern uplands
244 2,429 3,226 3,877 4,619 197 248 374
Semi-arid Lava Plateau and
centeral highlands
70 2,317 3,058 3,558 3,954 481 300 406
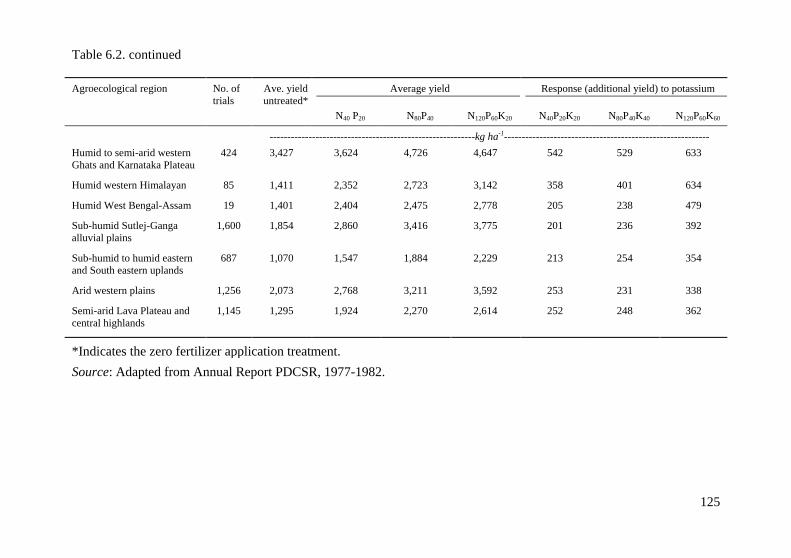
Table 6.2. continued
125
Agroecological region No. of
trials
Ave. yield
untreated*
Average yield Response (additional yield) to potassium
N40 P20 N80P40 N120P60K20 N40P20K20 N80P40K40 N120P60K60
----------------------------------------------------------kg ha-1----------------------------------------------------------
Humid to semi-arid western
Ghats and Karnataka Plateau
424 3,427 3,624 4,726 4,647 542 529 633
Humid western Himalayan 85 1,411 2,352 2,723 3,142 358 401 634
Humid West Bengal-Assam 19 1,401 2,404 2,475 2,778 205 238 479
Sub-humid Sutlej-Ganga
alluvial plains
1,600 1,854 2,860 3,416 3,775 201 236 392
Sub-humid to humid eastern
and South eastern uplands
687 1,070 1,547 1,884 2,229 213 254 354
Arid western plains 1,256 2,073 2,768 3,211 3,592 253 231 338
Semi-arid Lava Plateau and
central highlands
1,145 1,295 1,924 2,270 2,614 252 248 362
*Indicates the zero fertilizer application treatment.
Source: Adapted from Annual Report PDCSR, 1977-1982.
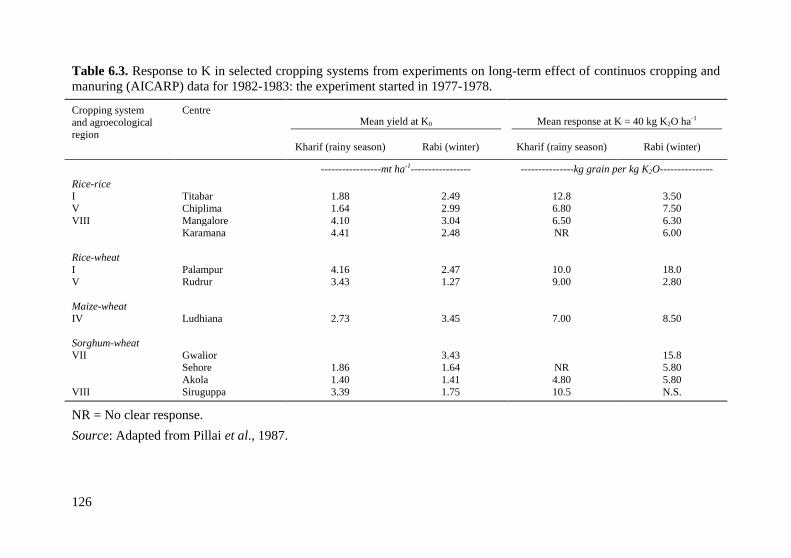
126
Table 6.3. Response to K in selected cropping systems from experiments on long-term effect of continuos cropping and
manuring (AICARP) data for 1982-1983: the experiment started in 1977-1978.
Cropping system
and agroecological
region
Centre Mean yield at K0 Mean response at K = 40 kg K2O ha-1
Kharif (rainy season) Rabi (winter) Kharif (rainy season) Rabi (winter)
-----------------mt ha-1----------------- ---------------kg grain per kg K2O---------------
Rice-rice
I Titabar 1.88 2.49 12.8 3.50
V Chiplima 1.64 2.99 6.80 7.50
VIII Mangalore 4.10 3.04 6.50 6.30
Karamana 4.41 2.48 NR 6.00
Rice-wheat
I Palampur 4.16 2.47 10.0 18.0
V Rudrur 3.43 1.27 9.00 2.80
Maize-wheat
IV Ludhiana 2.73 3.45 7.00 8.50
Sorghum-wheat
VII Gwalior 3.43 15.8
Sehore 1.86 1.64 NR 5.80
Akola 1.40 1.41 4.80 5.80
VIII Siruguppa 3.39 1.75 10.5 N.S.
NR = No clear response.
Source: Adapted from Pillai et al., 1987.
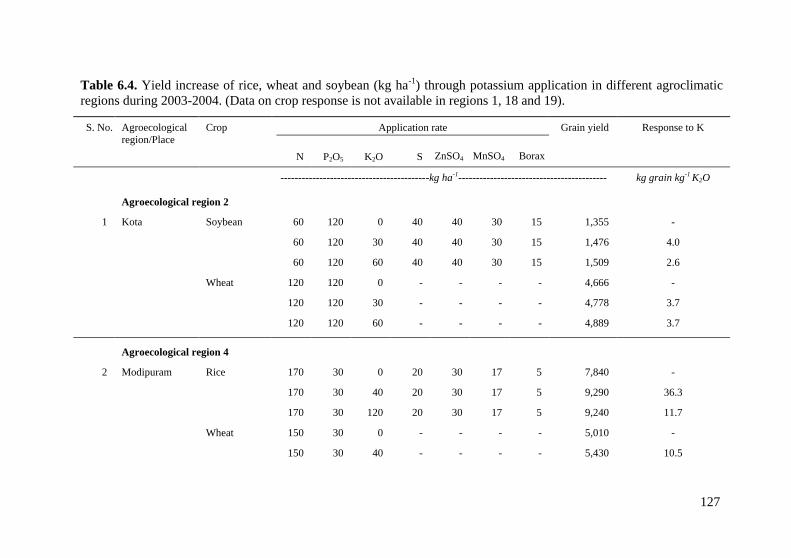
Table 6.4. continued
127
Table 6.4. Yield increase of rice, wheat and soybean (kg ha-1) through potassium application in different agroclimatic
regions during 2003-2004. (Data on crop response is not available in regions 1, 18 and 19).
S. No. Agroecological
region/Place
Crop Application rate Grain yield Response to K
N P2O5 K2O S ZnSO4 MnSO4 Borax
------------------------------------------kg ha-1------------------------------------------ kg grain kg-1 K2O
Agroecological region 2
1 Kota Soybean 60 120 0 40 40 30 15 1,355 -
60 120 30 40 40 30 15 1,476 4.0
60 120 60 40 40 30 15 1,509 2.6
Wheat 120 120 0 - - - - 4,666 -
120 120 30 - - - - 4,778 3.7
120 120 60 - - - - 4,889 3.7
Agroecological region 4
2 Modipuram Rice 170 30 0 20 30 17 5 7,840 -
170 30 40 20 30 17 5 9,290 36.3
170 30 120 20 30 17 5 9,240 11.7
Wheat 150 30 0 - - - - 5,010 -
150 30 40 - - - - 5,430 10.5
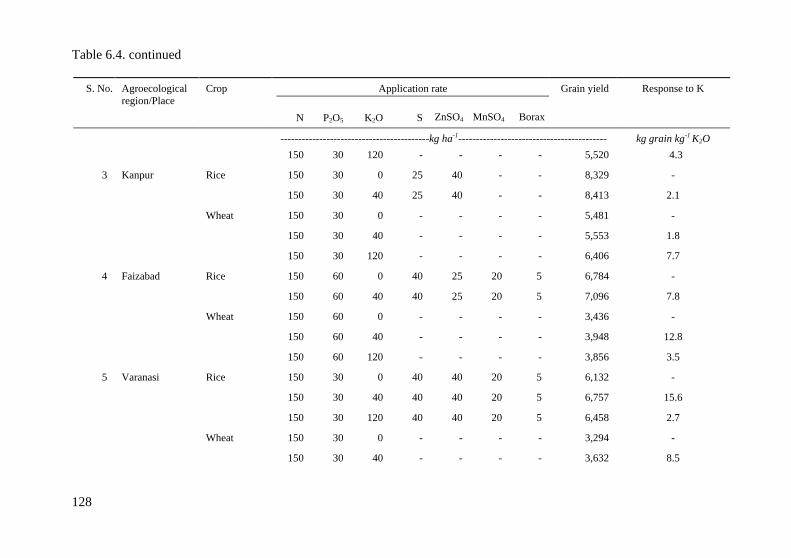
Table 6.4. continued
128
S. No. Agroecological
region/Place
Crop Application rate Grain yield Response to K
N P2O5 K2O S ZnSO4 MnSO4 Borax
------------------------------------------kg ha-1------------------------------------------ kg grain kg-1 K2O
150 30 120 - - - - 5,520 4.3
3 Kanpur Rice 150 30 0 25 40 - - 8,329 -
150 30 40 25 40 - - 8,413 2.1
Wheat 150 30 0 - - - - 5,481 -
150 30 40 - - - - 5,553 1.8
150 30 120 - - - - 6,406 7.7
4 Faizabad Rice 150 60 0 40 25 20 5 6,784 -
150 60 40 40 25 20 5 7,096 7.8
Wheat 150 60 0 - - - - 3,436 -
150 60 40 - - - - 3,948 12.8
150 60 120 - - - - 3,856 3.5
5 Varanasi Rice 150 30 0 40 40 20 5 6,132 -
150 30 40 40 40 20 5 6,757 15.6
150 30 120 40 40 20 5 6,458 2.7
Wheat 150 30 0 - - - - 3,294 -
150 30 40 - - - - 3,632 8.5
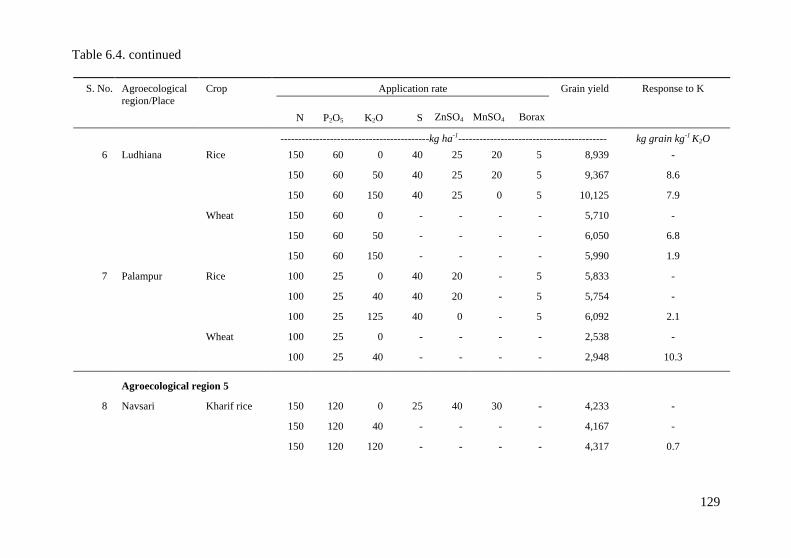
Table 6.4. continued
129
S. No. Agroecological
region/Place
Crop Application rate Grain yield Response to K
N P2O5 K2O S ZnSO4 MnSO4 Borax
------------------------------------------kg ha-1------------------------------------------ kg grain kg-1 K2O
6 Ludhiana Rice 150 60 0 40 25 20 5 8,939 -
150 60 50 40 25 20 5 9,367 8.6
150 60 150 40 25 0 5 10,125 7.9
Wheat 150 60 0 - - - - 5,710 -
150 60 50 - - - - 6,050 6.8
150 60 150 - - - - 5,990 1.9
7 Palampur Rice 100 25 0 40 20 - 5 5,833 -
100 25 40 40 20 - 5 5,754 -
100 25 125 40 0 - 5 6,092 2.1
Wheat 100 25 0 - - - - 2,538 -
100 25 40 - - - - 2,948 10.3
Agroecological region 5
8 Navsari Kharif rice 150 120 0 25 40 30 - 4,233 -
150 120 40 - - - - 4,167 -
150 120 120 - - - - 4,317 0.7
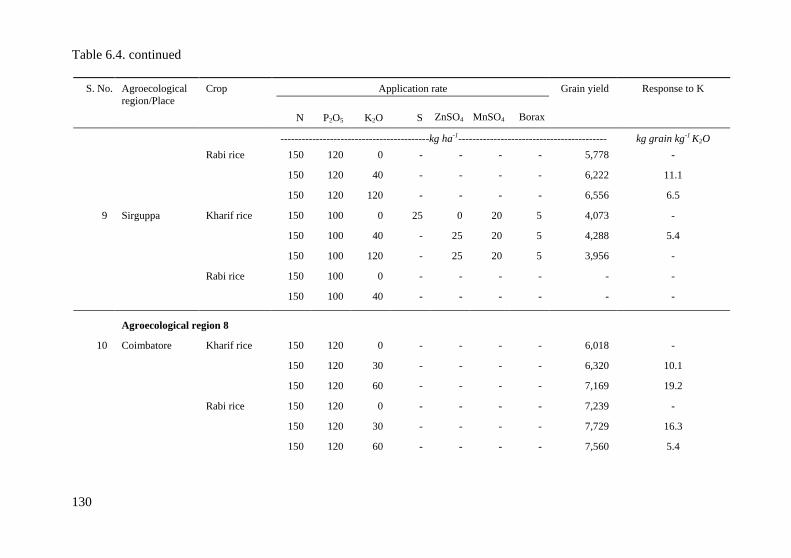
Table 6.4. continued
130
S. No. Agroecological
region/Place
Crop Application rate Grain yield Response to K
N P2O5 K2O S ZnSO4 MnSO4 Borax
------------------------------------------kg ha-1------------------------------------------ kg grain kg-1 K2O
Rabi rice 150 120 0 - - - - 5,778 -
150 120 40 - - - - 6,222 11.1
150 120 120 - - - - 6,556 6.5
9 Sirguppa Kharif rice 150 100 0 25 0 20 5 4,073 -
150 100 40 - 25 20 5 4,288 5.4
150 100 120 - 25 20 5 3,956 -
Rabi rice 150 100 0 - - - - - -
150 100 40 - - - - - -
Agroecological region 8
10 Coimbatore Kharif rice 150 120 0 - - - - 6,018 -
150 120 30 - - - - 6,320 10.1
150 120 60 - - - - 7,169 19.2
Rabi rice 150 120 0 - - - - 7,239 -
150 120 30 - - - - 7,729 16.3
150 120 60 - - - - 7,560 5.4
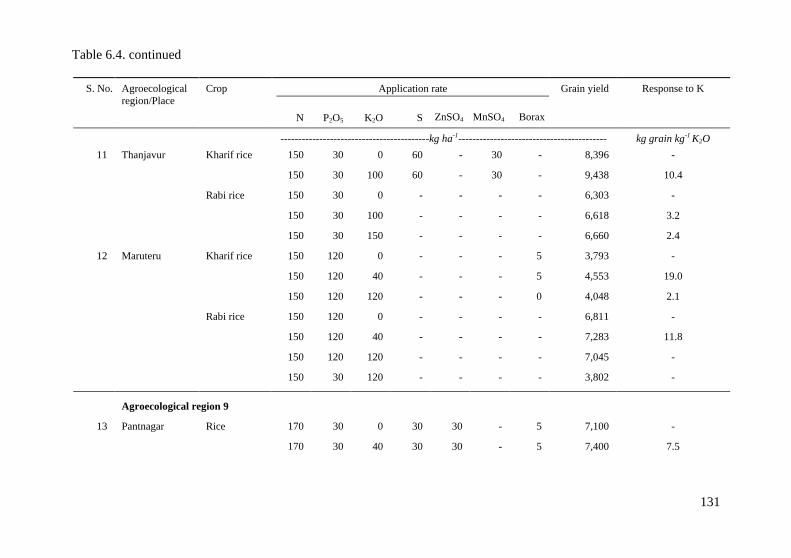
Table 6.4. continued
131
S. No. Agroecological
region/Place
Crop Application rate Grain yield Response to K
N P2O5 K2O S ZnSO4 MnSO4 Borax
------------------------------------------kg ha-1------------------------------------------ kg grain kg-1 K2O
11 Thanjavur Kharif rice 150 30 0 60 - 30 - 8,396 -
150 30 100 60 - 30 - 9,438 10.4
Rabi rice 150 30 0 - - - - 6,303 -
150 30 100 - - - - 6,618 3.2
150 30 150 - - - - 6,660 2.4
12 Maruteru Kharif rice 150 120 0 - - - 5 3,793 -
150 120 40 - - - 5 4,553 19.0
150 120 120 - - - 0 4,048 2.1
Rabi rice 150 120 0 - - - - 6,811 -
150 120 40 - - - - 7,283 11.8
150 120 120 - - - - 7,045 -
150 30 120 - - - - 3,802 -
Agroecological region 9
13 Pantnagar Rice 170 30 0 30 30 - 5 7,100 -
170 30 40 30 30 - 5 7,400 7.5
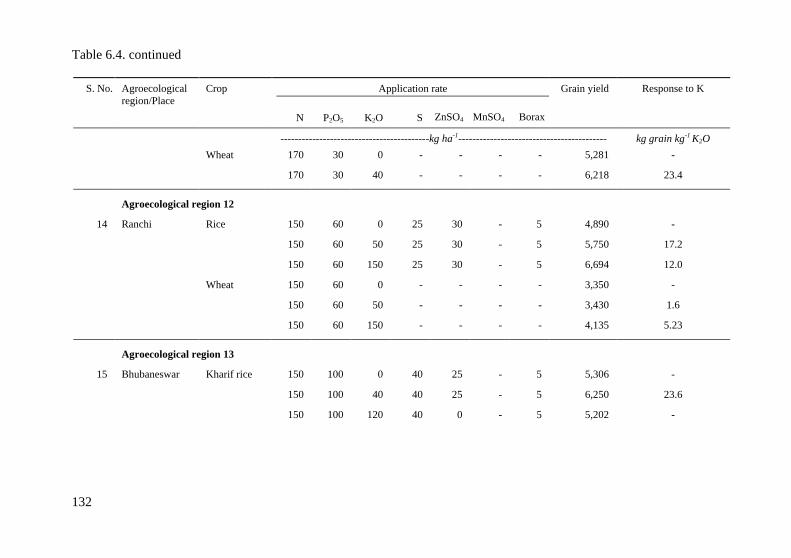
Table 6.4. continued
132
S. No. Agroecological
region/Place
Crop Application rate Grain yield Response to K
N P2O5 K2O S ZnSO4 MnSO4 Borax
------------------------------------------kg ha-1------------------------------------------ kg grain kg-1 K2O
Wheat 170 30 0 - - - - 5,281 -
170 30 40 - - - - 6,218 23.4
Agroecological region 12
14 Ranchi Rice 150 60 0 25 30 - 5 4,890 -
150 60 50 25 30 - 5 5,750 17.2
150 60 150 25 30 - 5 6,694 12.0
Wheat 150 60 0 - - - - 3,350 -
150 60 50 - - - - 3,430 1.6
150 60 150 - - - - 4,135 5.23
Agroecological region 13
15 Bhubaneswar Kharif rice 150 100 0 40 25 - 5 5,306 -
150 100 40 40 25 - 5 6,250 23.6
150 100 120 40 0 - 5 5,202 -
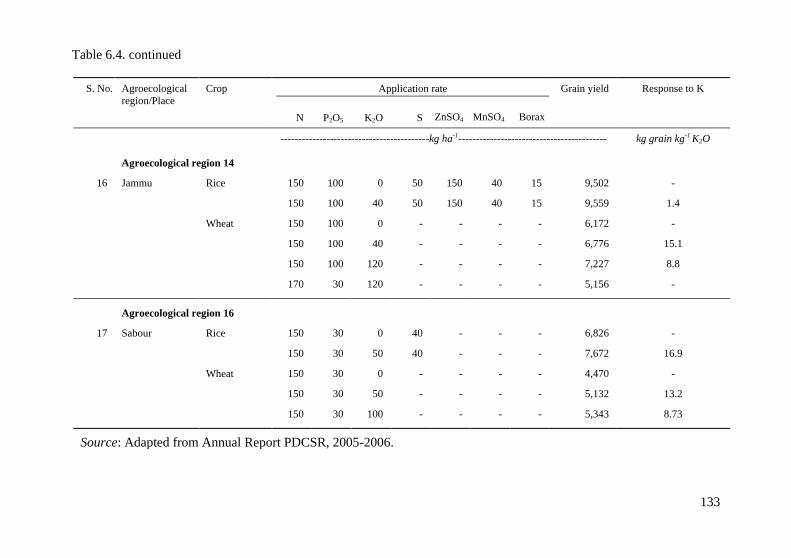
Table 6.4. continued
133
S. No. Agroecological
region/Place
Crop Application rate Grain yield Response to K
N P2O5 K2O S ZnSO4 MnSO4 Borax
------------------------------------------kg ha-1------------------------------------------ kg grain kg-1 K2O
Agroecological region 14
16 Jammu Rice 150 100 0 50 150 40 15 9,502 -
150 100 40 50 150 40 15 9,559 1.4
Wheat 150 100 0 - - - - 6,172 -
150 100 40 - - - - 6,776 15.1
150 100 120 - - - - 7,227 8.8
170 30 120 - - - - 5,156 -
Agroecological region 16
17 Sabour Rice 150 30 0 40 - - - 6,826 -
150 30 50 40 - - - 7,672 16.9
Wheat 150 30 0 - - - - 4,470 -
150 30 50 - - - - 5,132 13.2
150 30 100 - - - - 5,343 8.73
Source: Adapted from Annual Report PDCSR, 2005-2006.
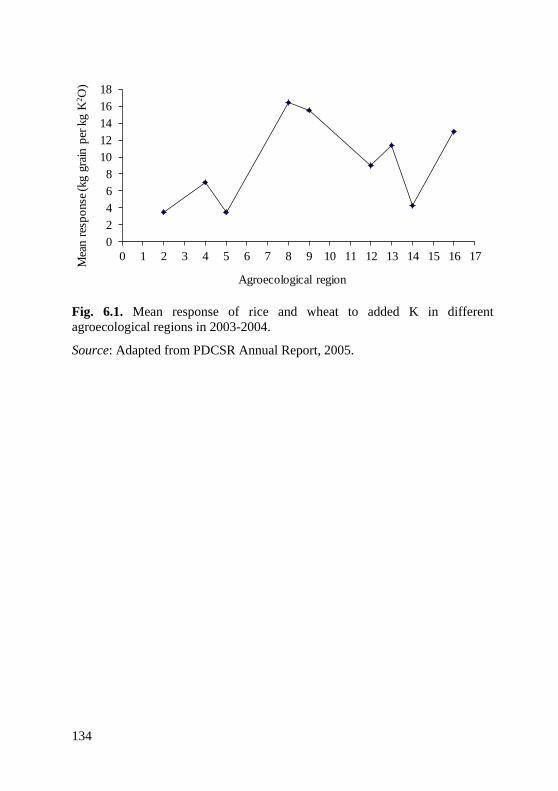
134
Fig. 6.1. Mean response of rice and wheat to added K in different
agroecological regions in 2003-2004.
Source: Adapted from PDCSR Annual Report, 2005.
0
2
4
6
8
10
12
14
16
18
0 1 2 3 4 5 6 7 8 9 10 11 12 13 14 15 16 17
Mea
n r
esp
onse
(kg g
rain
per
kg K
2O
)
Agroecological region
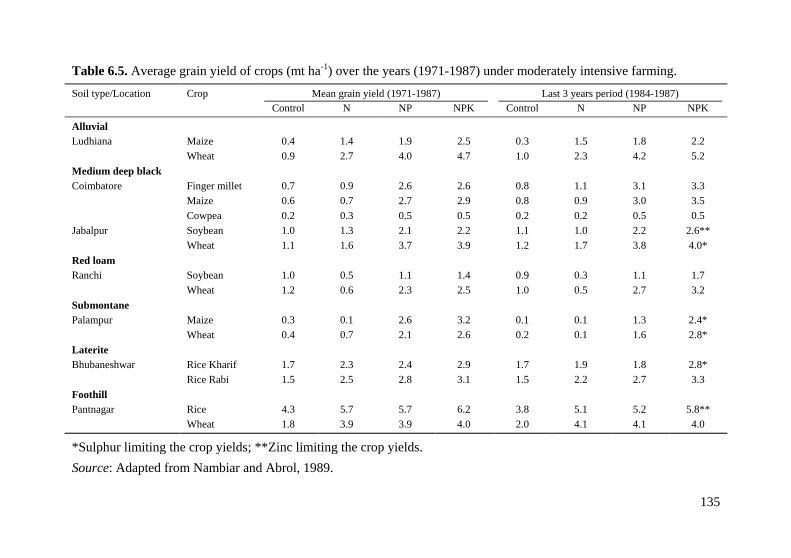
135
Table 6.5. Average grain yield of crops (mt ha-1) over the years (1971-1987) under moderately intensive farming.
Soil type/Location Crop Mean grain yield (1971-1987) Last 3 years period (1984-1987)
Control N NP NPK Control N NP NPK
Alluvial
Ludhiana Maize 0.4 1.4 1.9 2.5 0.3 1.5 1.8 2.2
Wheat 0.9 2.7 4.0 4.7 1.0 2.3 4.2 5.2
Medium deep black
Coimbatore Finger millet 0.7 0.9 2.6 2.6 0.8 1.1 3.1 3.3
Maize 0.6 0.7 2.7 2.9 0.8 0.9 3.0 3.5
Cowpea 0.2 0.3 0.5 0.5 0.2 0.2 0.5 0.5
Jabalpur Soybean 1.0 1.3 2.1 2.2 1.1 1.0 2.2 2.6**
Wheat 1.1 1.6 3.7 3.9 1.2 1.7 3.8 4.0*
Red loam
Ranchi Soybean 1.0 0.5 1.1 1.4 0.9 0.3 1.1 1.7
Wheat 1.2 0.6 2.3 2.5 1.0 0.5 2.7 3.2
Submontane
Palampur Maize 0.3 0.1 2.6 3.2 0.1 0.1 1.3 2.4*
Wheat 0.4 0.7 2.1 2.6 0.2 0.1 1.6 2.8*
Laterite
Bhubaneshwar Rice Kharif 1.7 2.3 2.4 2.9 1.7 1.9 1.8 2.8*
Rice Rabi 1.5 2.5 2.8 3.1 1.5 2.2 2.7 3.3
Foothill
Pantnagar Rice 4.3 5.7 5.7 6.2 3.8 5.1 5.2 5.8**
Wheat 1.8 3.9 3.9 4.0 2.0 4.1 4.1 4.0
*Sulphur limiting the crop yields; **Zinc limiting the crop yields.
Source: Adapted from Nambiar and Abrol, 1989.
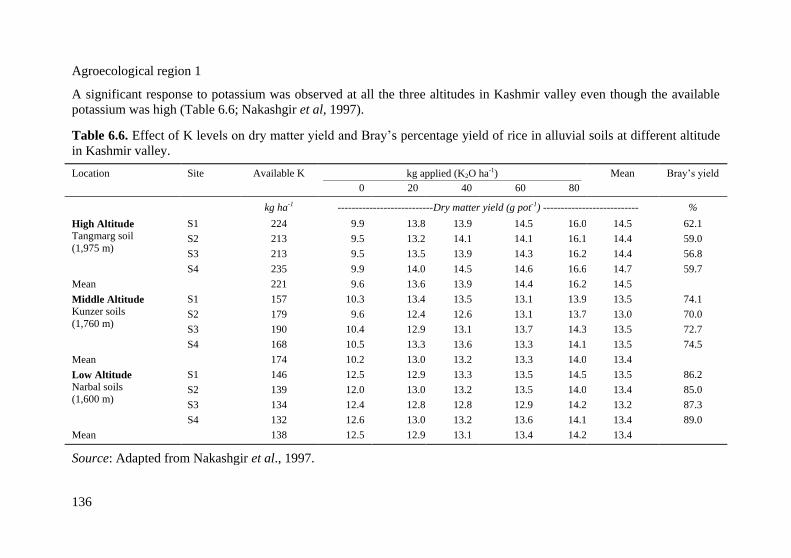
136
Agroecological region 1
A significant response to potassium was observed at all the three altitudes in Kashmir valley even though the available
potassium was high (Table 6.6; Nakashgir et al, 1997).
Table 6.6. Effect of K levels on dry matter yield and Bray’s percentage yield of rice in alluvial soils at different altitude
in Kashmir valley.
Location Site Available K kg applied (K2O ha-1) Mean Bray’s yield
0 20 40 60 80
kg ha-1 ---------------------------Dry matter yield (g pot-1) --------------------------- %
High Altitude
Tangmarg soil
(1,975 m)
S1 224 9.9 13.8 13.9 14.5 16.0 14.5 62.1
S2 213 9.5 13.2 14.1 14.1 16.1 14.4 59.0
S3 213 9.5 13.5 13.9 14.3 16.2 14.4 56.8
S4 235 9.9 14.0 14.5 14.6 16.6 14.7 59.7
Mean 221 9.6 13.6 13.9 14.4 16.2 14.5
Middle Altitude
Kunzer soils
(1,760 m)
S1 157 10.3 13.4 13.5 13.1 13.9 13.5 74.1
S2 179 9.6 12.4 12.6 13.1 13.7 13.0 70.0
S3 190 10.4 12.9 13.1 13.7 14.3 13.5 72.7
S4 168 10.5 13.3 13.6 13.3 14.1 13.5 74.5
Mean 174 10.2 13.0 13.2 13.3 14.0 13.4
Low Altitude
Narbal soils
(1,600 m)
S1 146 12.5 12.9 13.3 13.5 14.5 13.5 86.2
S2 139 12.0 13.0 13.2 13.5 14.0 13.4 85.0
S3 134 12.4 12.8 12.8 12.9 14.2 13.2 87.3
S4 132 12.6 13.0 13.2 13.6 14.1 13.4 89.0
Mean 138 12.5 12.9 13.1 13.4 14.2 13.4
Source: Adapted from Nakashgir et al., 1997.
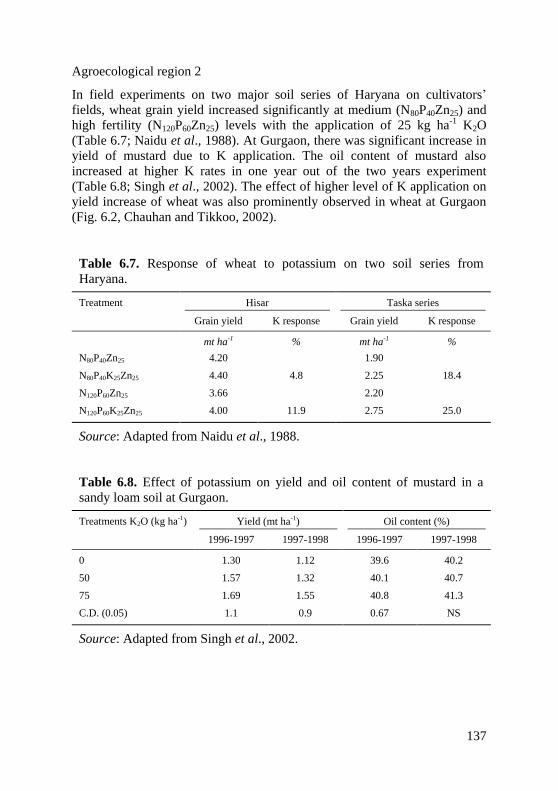
137
Agroecological region 2
In field experiments on two major soil series of Haryana on cultivators’
fields, wheat grain yield increased significantly at medium (N80P40Zn25) and
high fertility (N120P60Zn25) levels with the application of 25 kg ha-1 K2O
(Table 6.7; Naidu et al., 1988). At Gurgaon, there was significant increase in
yield of mustard due to K application. The oil content of mustard also
increased at higher K rates in one year out of the two years experiment
(Table 6.8; Singh et al., 2002). The effect of higher level of K application on
yield increase of wheat was also prominently observed in wheat at Gurgaon
(Fig. 6.2, Chauhan and Tikkoo, 2002).
Table 6.7. Response of wheat to potassium on two soil series from
Haryana.
Treatment Hisar Taska series
Grain yield K response Grain yield K response
mt ha-1 % mt ha-1 %
N80P40Zn25 4.20 1.90
N80P40K25Zn25 4.40 4.8 2.25 18.4
N120P60Zn25 3.66 2.20
N120P60K25Zn25 4.00 11.9 2.75 25.0
Source: Adapted from Naidu et al., 1988.
Table 6.8. Effect of potassium on yield and oil content of mustard in a
sandy loam soil at Gurgaon.
Treatments K2O (kg ha-1) Yield (mt ha-1) Oil content (%)
1996-1997 1997-1998 1996-1997 1997-1998
0 1.30 1.12 39.6 40.2
50 1.57 1.32 40.1 40.7
75 1.69 1.55 40.8 41.3
C.D. (0.05) 1.1 0.9 0.67 NS
Source: Adapted from Singh et al., 2002.
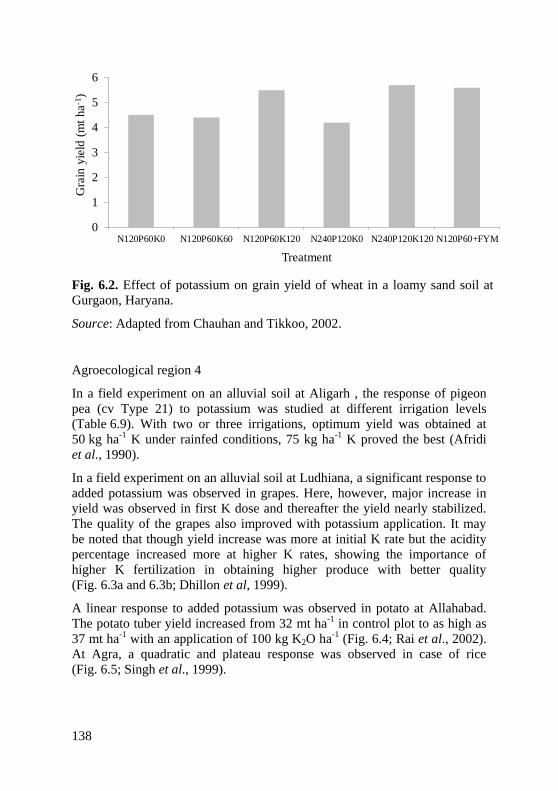
138
Fig. 6.2. Effect of potassium on grain yield of wheat in a loamy sand soil at
Gurgaon, Haryana.
Source: Adapted from Chauhan and Tikkoo, 2002.
Agroecological region 4
In a field experiment on an alluvial soil at Aligarh , the response of pigeon
pea (cv Type 21) to potassium was studied at different irrigation levels
(Table 6.9). With two or three irrigations, optimum yield was obtained at
50 kg ha-1 K under rainfed conditions, 75 kg ha-1 K proved the best (Afridi
et al., 1990).
In a field experiment on an alluvial soil at Ludhiana, a significant response to
added potassium was observed in grapes. Here, however, major increase in
yield was observed in first K dose and thereafter the yield nearly stabilized.
The quality of the grapes also improved with potassium application. It may
be noted that though yield increase was more at initial K rate but the acidity
percentage increased more at higher K rates, showing the importance of
higher K fertilization in obtaining higher produce with better quality
(Fig. 6.3a and 6.3b; Dhillon et al, 1999).
A linear response to added potassium was observed in potato at Allahabad.
The potato tuber yield increased from 32 mt ha-1 in control plot to as high as
37 mt ha-1 with an application of 100 kg K2O ha-1 (Fig. 6.4; Rai et al., 2002).
At Agra, a quadratic and plateau response was observed in case of rice
(Fig. 6.5; Singh et al., 1999).
0
1
2
3
4
5
6
N120P60K0 N120P60K60 N120P60K120 N240P120K0 N240P120K120 N120P60+FYM
Gra
in y
ield
(m
t ha
-1)
Treatment
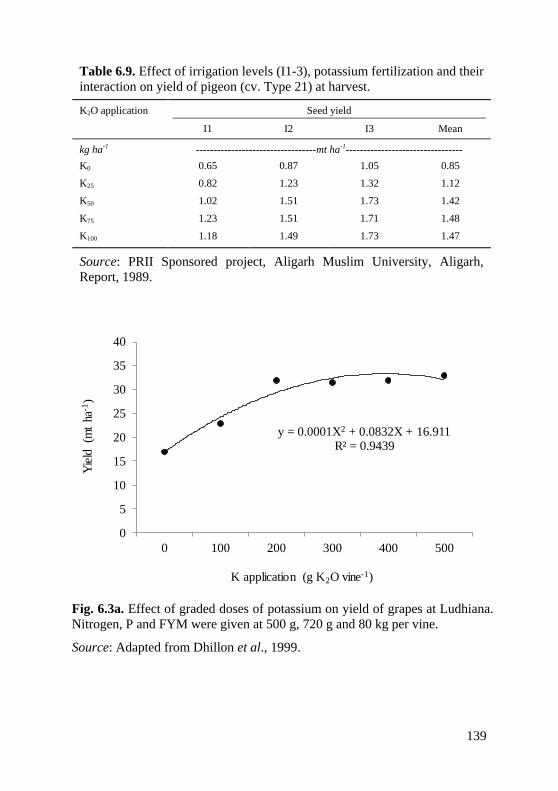
139
Table 6.9. Effect of irrigation levels (I1-3), potassium fertilization and their
interaction on yield of pigeon (cv. Type 21) at harvest.
K2O application Seed yield
I1 I2 I3 Mean
kg ha-1 ----------------------------------mt ha-1---------------------------------
K0 0.65 0.87 1.05 0.85
K25 0.82 1.23 1.32 1.12
K50 1.02 1.51 1.73 1.42
K75 1.23 1.51 1.71 1.48
K100 1.18 1.49 1.73 1.47
Source: PRII Sponsored project, Aligarh Muslim University, Aligarh,
Report, 1989.
Fig. 6.3a. Effect of graded doses of potassium on yield of grapes at Ludhiana.
Nitrogen, P and FYM were given at 500 g, 720 g and 80 kg per vine.
Source: Adapted from Dhillon et al., 1999.
y = 0.0001X2 + 0.0832X + 16.911R² = 0.9439
0
5
10
15
20
25
30
35
40
0 100 200 300 400 500
Yie
ld
(mt
ha-1
)
K application (g K2O vine-1)
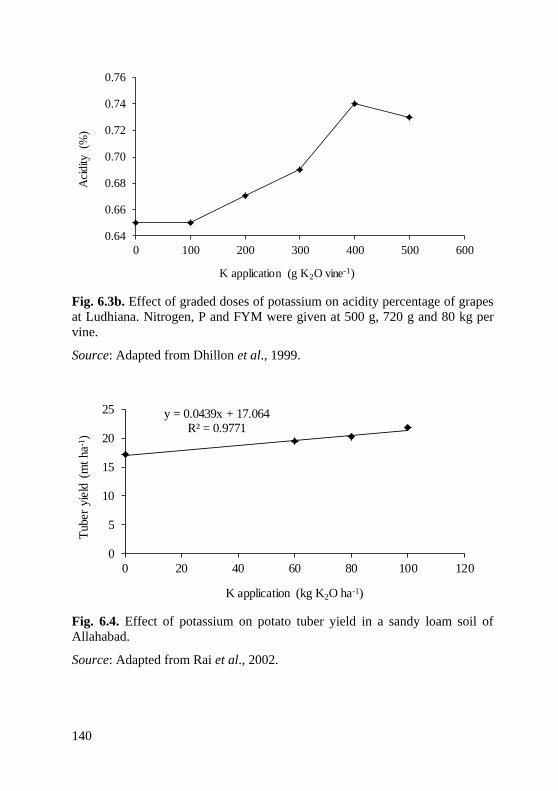
140
Fig. 6.3b. Effect of graded doses of potassium on acidity percentage of grapes
at Ludhiana. Nitrogen, P and FYM were given at 500 g, 720 g and 80 kg per
vine.
Source: Adapted from Dhillon et al., 1999.
Fig. 6.4. Effect of potassium on potato tuber yield in a sandy loam soil of
Allahabad.
Source: Adapted from Rai et al., 2002.
0.64
0.66
0.68
0.70
0.72
0.74
0.76
0 100 200 300 400 500 600
Aci
dity
(%
)
K application (g K2O vine-1)
y = 0.0439x + 17.064R² = 0.9771
0
5
10
15
20
25
0 20 40 60 80 100 120
Tuber
yie
ld (
mt
ha
-1)
K application (kg K2O ha-1)
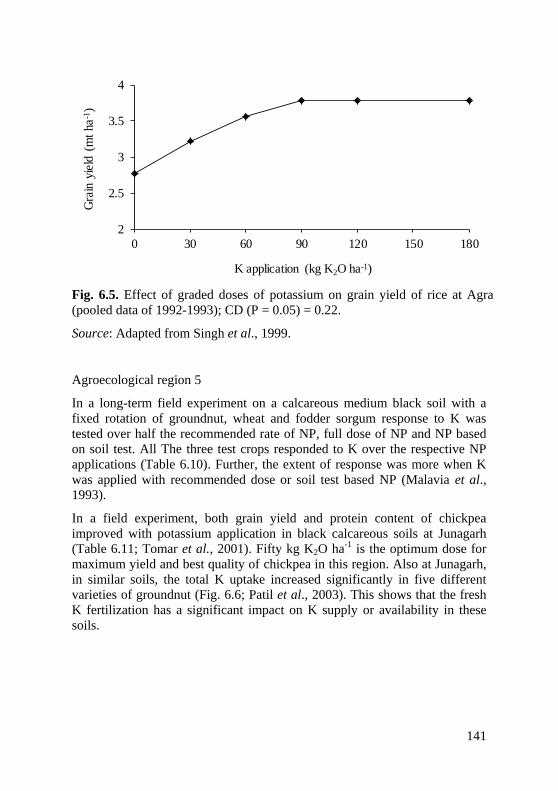
141
Fig. 6.5. Effect of graded doses of potassium on grain yield of rice at Agra
(pooled data of 1992-1993); CD (P = 0.05) = 0.22.
Source: Adapted from Singh et al., 1999.
Agroecological region 5
In a long-term field experiment on a calcareous medium black soil with a
fixed rotation of groundnut, wheat and fodder sorgum response to K was
tested over half the recommended rate of NP, full dose of NP and NP based
on soil test. All The three test crops responded to K over the respective NP
applications (Table 6.10). Further, the extent of response was more when K
was applied with recommended dose or soil test based NP (Malavia et al.,
1993).
In a field experiment, both grain yield and protein content of chickpea
improved with potassium application in black calcareous soils at Junagarh
(Table 6.11; Tomar et al., 2001). Fifty kg K2O ha-1 is the optimum dose for
maximum yield and best quality of chickpea in this region. Also at Junagarh,
in similar soils, the total K uptake increased significantly in five different
varieties of groundnut (Fig. 6.6; Patil et al., 2003). This shows that the fresh
K fertilization has a significant impact on K supply or availability in these
soils.
2
2.5
3
3.5
4
0 30 60 90 120 150 180
Gra
in y
ield
(m
t ha
-1)
K application (kg K2O ha-1)
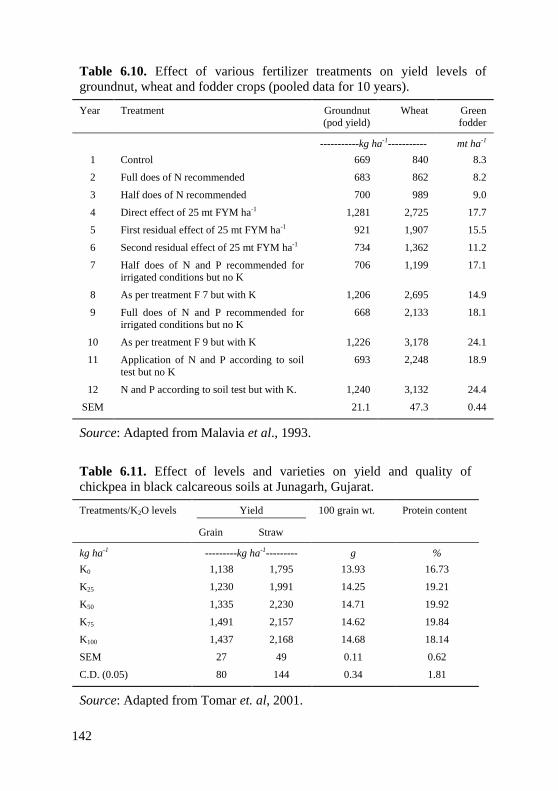
142
Table 6.10. Effect of various fertilizer treatments on yield levels of
groundnut, wheat and fodder crops (pooled data for 10 years).
Year Treatment Groundnut
(pod yield)
Wheat Green
fodder
-----------kg ha-1----------- mt ha-1
1 Control 669 840 8.3
2 Full does of N recommended 683 862 8.2
3 Half does of N recommended 700 989 9.0
4 Direct effect of 25 mt FYM ha-1 1,281 2,725 17.7
5 First residual effect of 25 mt FYM ha-1 921 1,907 15.5
6 Second residual effect of 25 mt FYM ha-1 734 1,362 11.2
7 Half does of N and P recommended for
irrigated conditions but no K
706 1,199 17.1
8 As per treatment F 7 but with K 1,206 2,695 14.9
9 Full does of N and P recommended for
irrigated conditions but no K
668 2,133 18.1
10 As per treatment F 9 but with K 1,226 3,178 24.1
11 Application of N and P according to soil
test but no K
693 2,248 18.9
12 N and P according to soil test but with K. 1,240 3,132 24.4
SEM 21.1 47.3 0.44
Source: Adapted from Malavia et al., 1993.
Table 6.11. Effect of levels and varieties on yield and quality of
chickpea in black calcareous soils at Junagarh, Gujarat.
Treatments/K2O levels Yield 100 grain wt. Protein content
Grain Straw
kg ha-1 ---------kg ha-1--------- g %
K0 1,138 1,795 13.93 16.73
K25 1,230 1,991 14.25 19.21
K50 1,335 2,230 14.71 19.92
K75 1,491 2,157 14.62 19.84
K100 1,437 2,168 14.68 18.14
SEM 27 49 0.11 0.62
C.D. (0.05) 80 144 0.34 1.81
Source: Adapted from Tomar et. al, 2001.
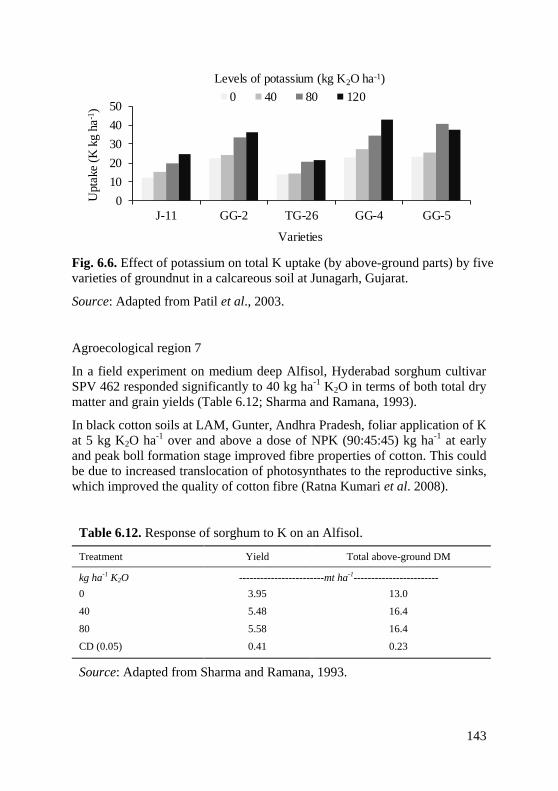
143
Fig. 6.6. Effect of potassium on total K uptake (by above-ground parts) by five
varieties of groundnut in a calcareous soil at Junagarh, Gujarat.
Source: Adapted from Patil et al., 2003.
Agroecological region 7
In a field experiment on medium deep Alfisol, Hyderabad sorghum cultivar
SPV 462 responded significantly to 40 kg ha-1 K2O in terms of both total dry
matter and grain yields (Table 6.12; Sharma and Ramana, 1993).
In black cotton soils at LAM, Gunter, Andhra Pradesh, foliar application of K
at 5 kg K2O ha-1 over and above a dose of NPK (90:45:45) kg ha-1 at early
and peak boll formation stage improved fibre properties of cotton. This could
be due to increased translocation of photosynthates to the reproductive sinks,
which improved the quality of cotton fibre (Ratna Kumari et al. 2008).
Table 6.12. Response of sorghum to K on an Alfisol.
Treatment Yield Total above-ground DM
kg ha-1 K2O ------------------------mt ha-1------------------------
0 3.95 13.0
40 5.48 16.4
80 5.58 16.4
CD (0.05) 0.41 0.23
Source: Adapted from Sharma and Ramana, 1993.
0
10
20
30
40
50
J-11 GG-2 TG-26 GG-4 GG-5
Upta
ke (
K k
g h
a-1
)
Varieties
0 40 80 120
Levels of potassium (kg K2O ha-1)
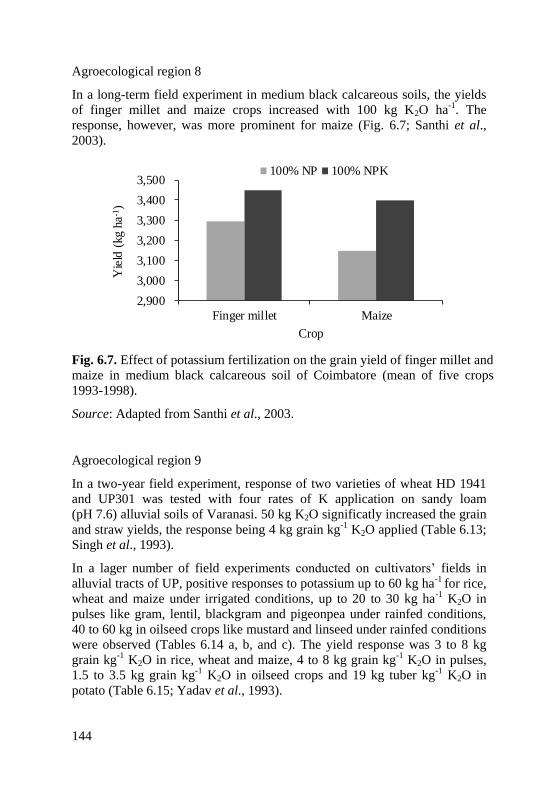
144
Agroecological region 8
In a long-term field experiment in medium black calcareous soils, the yields
of finger millet and maize crops increased with 100 kg K2O ha-1. The
response, however, was more prominent for maize (Fig. 6.7; Santhi et al.,
2003).
Fig. 6.7. Effect of potassium fertilization on the grain yield of finger millet and
maize in medium black calcareous soil of Coimbatore (mean of five crops
1993-1998).
Source: Adapted from Santhi et al., 2003.
Agroecological region 9
In a two-year field experiment, response of two varieties of wheat HD 1941
and UP301 was tested with four rates of K application on sandy loam
(pH 7.6) alluvial soils of Varanasi. 50 kg K2O significatly increased the grain
and straw yields, the response being 4 kg grain kg-1 K2O applied (Table 6.13;
Singh et al., 1993).
In a lager number of field experiments conducted on cultivators’ fields in
alluvial tracts of UP, positive responses to potassium up to 60 kg ha-1 for rice,
wheat and maize under irrigated conditions, up to 20 to 30 kg ha-1 K2O in
pulses like gram, lentil, blackgram and pigeonpea under rainfed conditions,
40 to 60 kg in oilseed crops like mustard and linseed under rainfed conditions
were observed (Tables 6.14 a, b, and c). The yield response was 3 to 8 kg
grain kg-1 K2O in rice, wheat and maize, 4 to 8 kg grain kg-1 K2O in pulses,
1.5 to 3.5 kg grain kg-1 K2O in oilseed crops and 19 kg tuber kg-1 K2O in
potato (Table 6.15; Yadav et al., 1993).
2,900
3,000
3,100
3,200
3,300
3,400
3,500
Finger millet Maize
Yie
ld (
kg h
a-1
)
Crop
100% NP 100% NPK
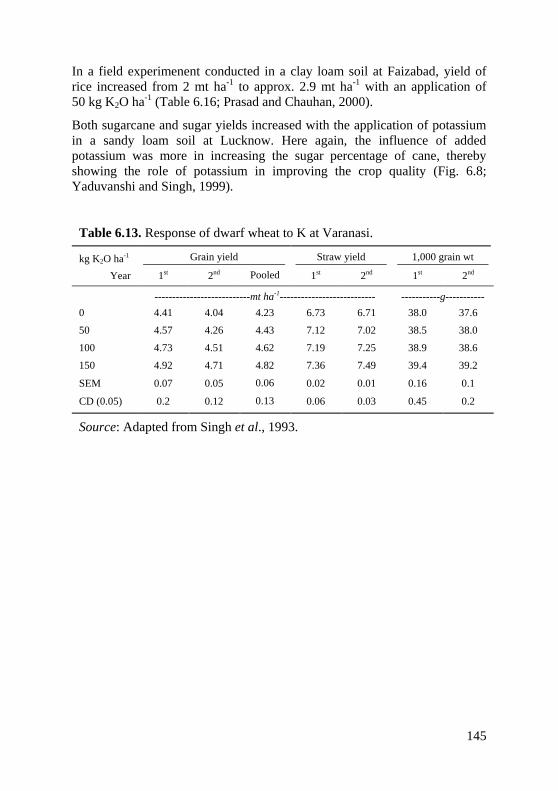
145
In a field experimenent conducted in a clay loam soil at Faizabad, yield of
rice increased from 2 mt ha-1 to approx. 2.9 mt ha-1 with an application of
50 kg K2O ha-1 (Table 6.16; Prasad and Chauhan, 2000).
Both sugarcane and sugar yields increased with the application of potassium
in a sandy loam soil at Lucknow. Here again, the influence of added
potassium was more in increasing the sugar percentage of cane, thereby
showing the role of potassium in improving the crop quality (Fig. 6.8;
Yaduvanshi and Singh, 1999).
Table 6.13. Response of dwarf wheat to K at Varanasi.
kg K2O ha-1 Grain yield Straw yield 1,000 grain wt
Year 1st 2nd Pooled 1st 2nd 1st 2nd
---------------------------mt ha-1--------------------------- -----------g-----------
0 4.41 4.04 4.23 6.73 6.71 38.0 37.6
50 4.57 4.26 4.43 7.12 7.02 38.5 38.0
100 4.73 4.51 4.62 7.19 7.25 38.9 38.6
150 4.92 4.71 4.82 7.36 7.49 39.4 39.2
SEM 0.07 0.05 0.06 0.02 0.01 0.16 0.1
CD (0.05) 0.2 0.12 0.13 0.06 0.03 0.45 0.2
Source: Adapted from Singh et al., 1993.
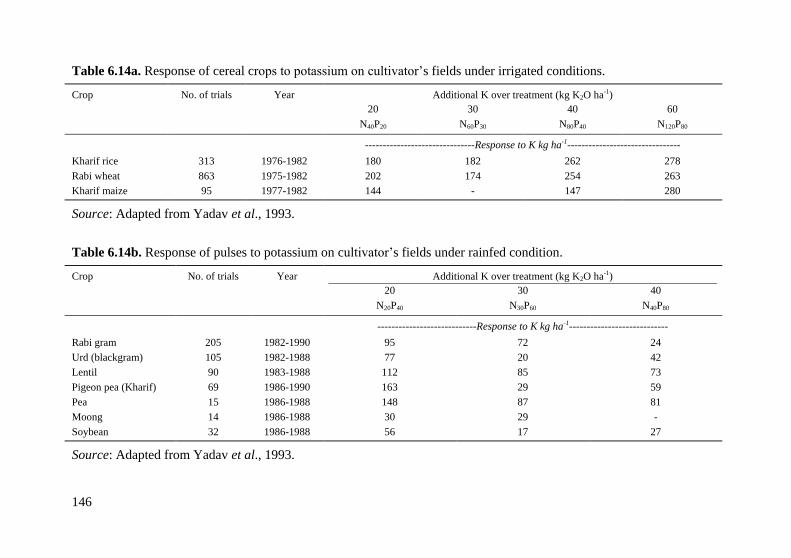
146
Table 6.14a. Response of cereal crops to potassium on cultivator’s fields under irrigated conditions.
Crop No. of trials Year Additional K over treatment (kg K2O ha-1)
20 30 40 60
N40P20 N60P30 N80P40 N120P80
-------------------------------Response to K kg ha-1--------------------------------
Kharif rice 313 1976-1982 180 182 262 278
Rabi wheat 863 1975-1982 202 174 254 263
Kharif maize 95 1977-1982 144 - 147 280
Source: Adapted from Yadav et al., 1993.
Table 6.14b. Response of pulses to potassium on cultivator’s fields under rainfed condition.
Crop No. of trials Year Additional K over treatment (kg K2O ha-1)
20 30 40
N20P40 N30P60 N40P80
----------------------------Response to K kg ha-1----------------------------
Rabi gram 205 1982-1990 95 72 24
Urd (blackgram) 105 1982-1988 77 20 42
Lentil 90 1983-1988 112 85 73
Pigeon pea (Kharif) 69 1986-1990 163 29 59
Pea 15 1986-1988 148 87 81
Moong 14 1986-1988 30 29 -
Soybean 32 1986-1988 56 17 27
Source: Adapted from Yadav et al., 1993.
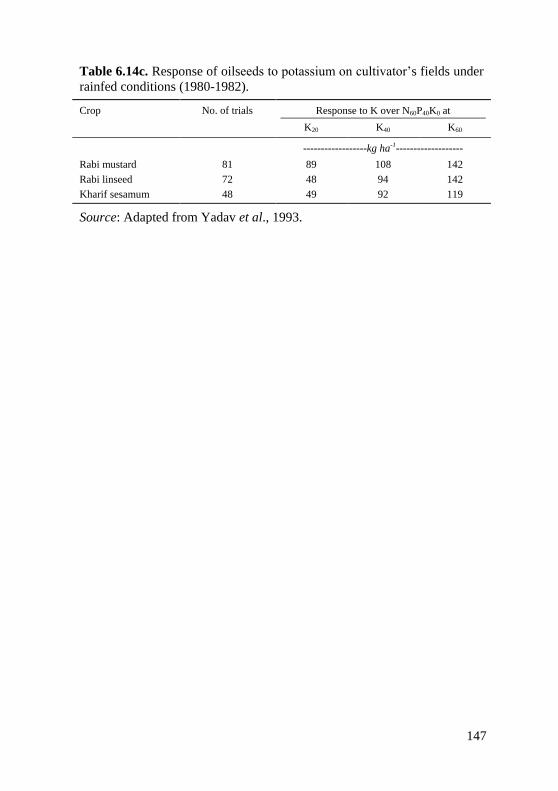
147
Table 6.14c. Response of oilseeds to potassium on cultivator’s fields under
rainfed conditions (1980-1982).
Crop No. of trials Response to K over N60P40K0 at
K20 K40 K60
------------------kg ha-1-------------------
Rabi mustard 81 89 108 142
Rabi linseed 72 48 94 142
Kharif sesamum 48 49 92 119
Source: Adapted from Yadav et al., 1993.
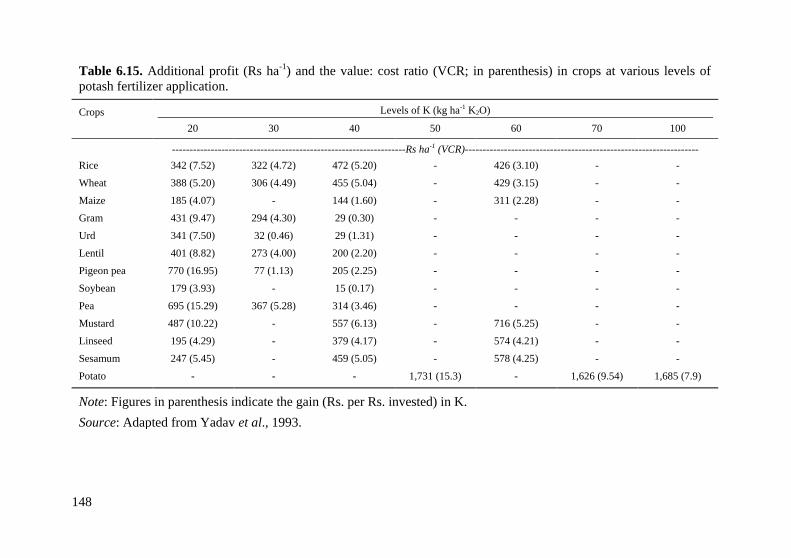
148
Table 6.15. Additional profit (Rs ha-1) and the value: cost ratio (VCR; in parenthesis) in crops at various levels of
potash fertilizer application.
Crops Levels of K (kg ha-1 K2O)
20 30 40 50 60 70 100
------------------------------------------------------------------Rs ha-1 (VCR)------------------------------------------------------------------
Rice 342 (7.52) 322 (4.72) 472 (5.20) - 426 (3.10) - -
Wheat 388 (5.20) 306 (4.49) 455 (5.04) - 429 (3.15) - -
Maize 185 (4.07) - 144 (1.60) - 311 (2.28) - -
Gram 431 (9.47) 294 (4.30) 29 (0.30) - - - -
Urd 341 (7.50) 32 (0.46) 29 (1.31) - - - -
Lentil 401 (8.82) 273 (4.00) 200 (2.20) - - - -
Pigeon pea 770 (16.95) 77 (1.13) 205 (2.25) - - - -
Soybean 179 (3.93) - 15 (0.17) - - - -
Pea 695 (15.29) 367 (5.28) 314 (3.46) - - - -
Mustard 487 (10.22) - 557 (6.13) - 716 (5.25) - -
Linseed 195 (4.29) - 379 (4.17) - 574 (4.21) - -
Sesamum 247 (5.45) - 459 (5.05) - 578 (4.25) - -
Potato - - - 1,731 (15.3) - 1,626 (9.54) 1,685 (7.9)
Note: Figures in parenthesis indicate the gain (Rs. per Rs. invested) in K.
Source: Adapted from Yadav et al., 1993.
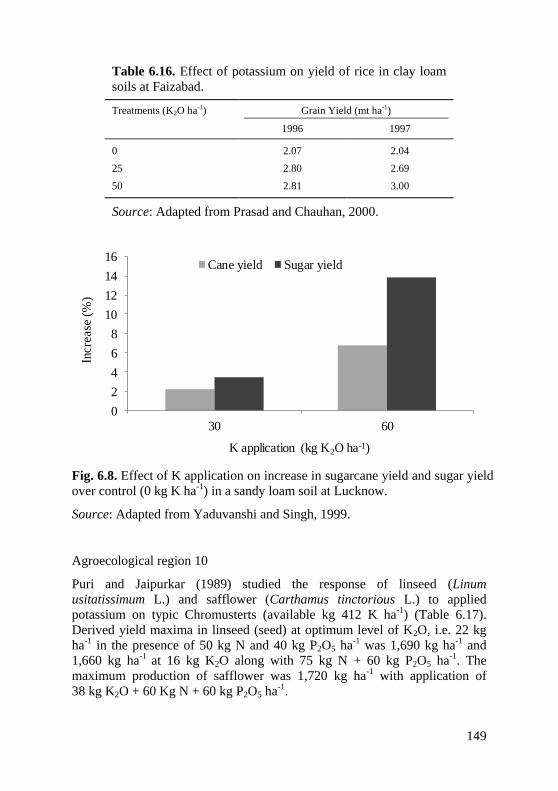
149
Table 6.16. Effect of potassium on yield of rice in clay loam
soils at Faizabad.
Treatments (K2O ha-1) Grain Yield (mt ha-1)
1996 1997
0 2.07 2.04
25 2.80 2.69
50 2.81 3.00
Source: Adapted from Prasad and Chauhan, 2000.
Fig. 6.8. Effect of K application on increase in sugarcane yield and sugar yield
over control (0 kg K ha-1) in a sandy loam soil at Lucknow.
Source: Adapted from Yaduvanshi and Singh, 1999.
Agroecological region 10
Puri and Jaipurkar (1989) studied the response of linseed (Linum
usitatissimum L.) and safflower (Carthamus tinctorious L.) to applied
potassium on typic Chromusterts (available kg 412 K ha-1) (Table 6.17).
Derived yield maxima in linseed (seed) at optimum level of K2O, i.e. 22 kg
ha-1 in the presence of 50 kg N and 40 kg P2O5 ha-1 was 1,690 kg ha-1 and
1,660 kg ha-1 at 16 kg K2O along with 75 kg N + 60 kg P2O5 ha-1. The
maximum production of safflower was 1,720 kg ha-1 with application of
38 kg K2O + 60 Kg N + 60 kg P2O5 ha-1.
0
2
4
6
8
10
12
14
16
30 60
Incre
ase
(%
)
K application (kg K2O ha-1)
Cane yield Sugar yield
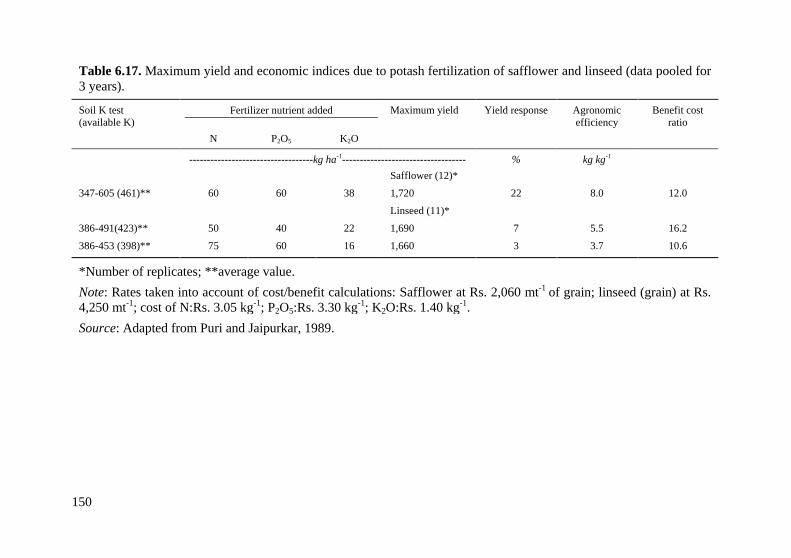
150
Table 6.17. Maximum yield and economic indices due to potash fertilization of safflower and linseed (data pooled for
3 years).
Soil K test
(available K)
Fertilizer nutrient added Maximum yield Yield response Agronomic
efficiency
Benefit cost
ratio
N P2O5 K2O
-----------------------------------kg ha-1----------------------------------- % kg kg-1
Safflower (12)*
347-605 (461)** 60 60 38 1,720 22 8.0 12.0
Linseed (11)*
386-491(423)** 50 40 22 1,690 7 5.5 16.2
386-453 (398)** 75 60 16 1,660 3 3.7 10.6
*Number of replicates; **average value.
Note: Rates taken into account of cost/benefit calculations: Safflower at Rs. 2,060 mt-1 of grain; linseed (grain) at Rs.
4,250 mt-1; cost of N:Rs. 3.05 kg-1; P2O5:Rs. 3.30 kg-1; K2O:Rs. 1.40 kg-1.
Source: Adapted from Puri and Jaipurkar, 1989.
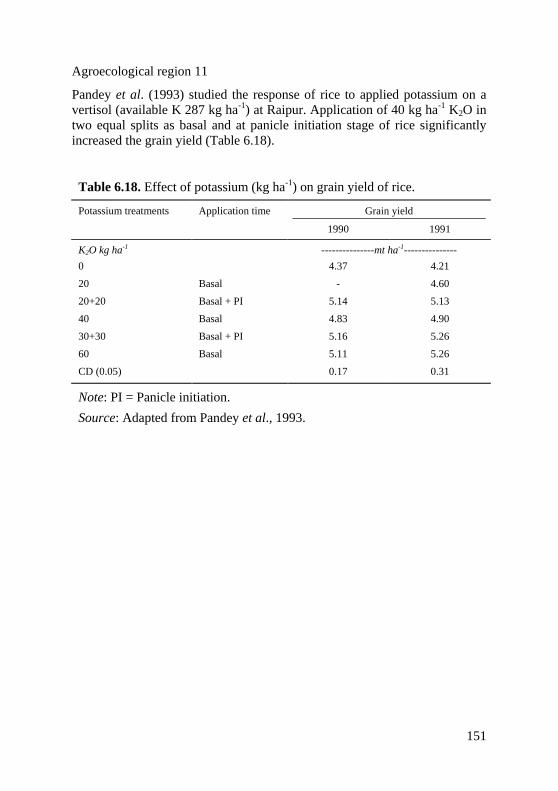
151
Agroecological region 11
Pandey et al. (1993) studied the response of rice to applied potassium on a
vertisol (available K 287 kg ha-1) at Raipur. Application of 40 kg ha-1 K2O in
two equal splits as basal and at panicle initiation stage of rice significantly
increased the grain yield (Table 6.18).
Table 6.18. Effect of potassium (kg ha-1) on grain yield of rice.
Potassium treatments Application time Grain yield
1990 1991
K2O kg ha-1 ---------------mt ha-1---------------
0 4.37 4.21
20 Basal - 4.60
20+20 Basal + PI 5.14 5.13
40 Basal 4.83 4.90
30+30 Basal + PI 5.16 5.26
60 Basal 5.11 5.26
CD (0.05) 0.17 0.31
Note: PI = Panicle initiation.
Source: Adapted from Pandey et al., 1993.
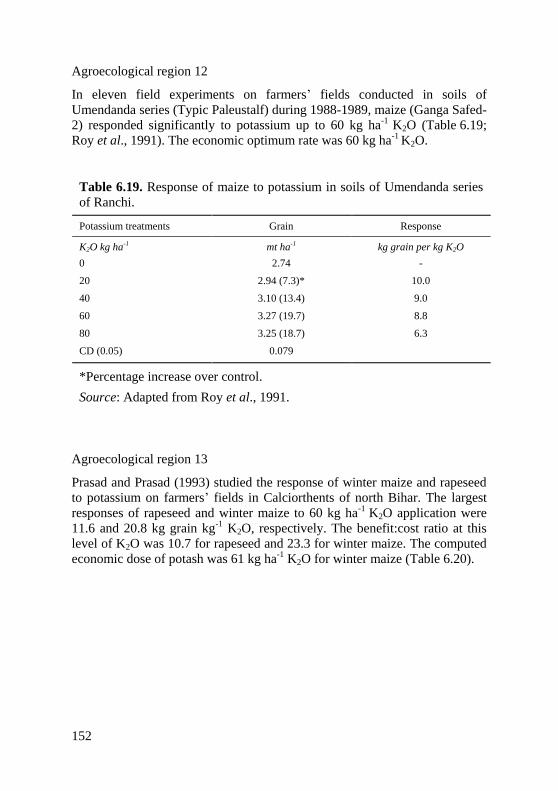
152
Agroecological region 12
In eleven field experiments on farmers’ fields conducted in soils of
Umendanda series (Typic Paleustalf) during 1988-1989, maize (Ganga Safed-
2) responded significantly to potassium up to 60 kg ha-1 K2O (Table 6.19;
Roy et al., 1991). The economic optimum rate was 60 kg ha-1 K2O.
Table 6.19. Response of maize to potassium in soils of Umendanda series
of Ranchi.
Potassium treatments Grain Response
K2O kg ha-1 mt ha-1 kg grain per kg K2O
0 2.74 -
20 2.94 (7.3)* 10.0
40 3.10 (13.4) 9.0
60 3.27 (19.7) 8.8
80 3.25 (18.7) 6.3
CD (0.05) 0.079
*Percentage increase over control.
Source: Adapted from Roy et al., 1991.
Agroecological region 13
Prasad and Prasad (1993) studied the response of winter maize and rapeseed
to potassium on farmers’ fields in Calciorthents of north Bihar. The largest
responses of rapeseed and winter maize to 60 kg ha-1 K2O application were
11.6 and 20.8 kg grain kg-1 K2O, respectively. The benefit:cost ratio at this
level of K2O was 10.7 for rapeseed and 23.3 for winter maize. The computed
economic dose of potash was 61 kg ha-1 K2O for winter maize (Table 6.20).
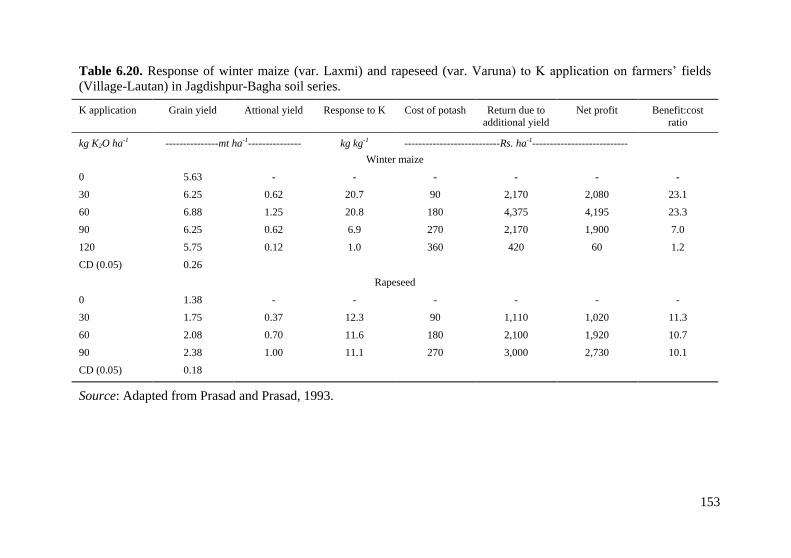
153
Table 6.20. Response of winter maize (var. Laxmi) and rapeseed (var. Varuna) to K application on farmers’ fields
(Village-Lautan) in Jagdishpur-Bagha soil series.
K application Grain yield Attional yield Response to K Cost of potash Return due to
additional yield
Net profit Benefit:cost
ratio
kg K2O ha-1 ---------------mt ha-1--------------- kg kg-1 ---------------------------Rs. ha-1---------------------------
Winter maize
0 5.63 - - - - - -
30 6.25 0.62 20.7 90 2,170 2,080 23.1
60 6.88 1.25 20.8 180 4,375 4,195 23.3
90 6.25 0.62 6.9 270 2,170 1,900 7.0
120 5.75 0.12 1.0 360 420 60 1.2
CD (0.05) 0.26
Rapeseed
0 1.38 - - - - - -
30 1.75 0.37 12.3 90 1,110 1,020 11.3
60 2.08 0.70 11.6 180 2,100 1,920 10.7
90 2.38 1.00 11.1 270 3,000 2,730 10.1
CD (0.05) 0.18
Source: Adapted from Prasad and Prasad, 1993.
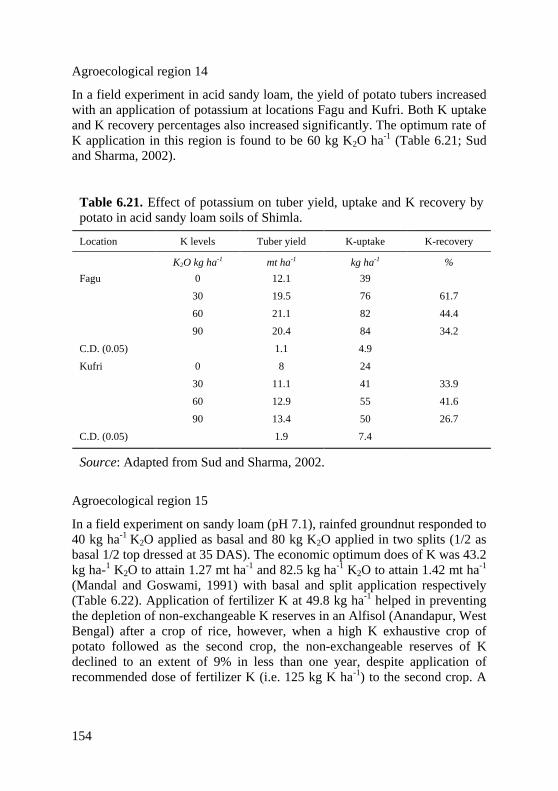
154
Agroecological region 14
In a field experiment in acid sandy loam, the yield of potato tubers increased
with an application of potassium at locations Fagu and Kufri. Both K uptake
and K recovery percentages also increased significantly. The optimum rate of
K application in this region is found to be 60 kg K2O ha-1 (Table 6.21; Sud
and Sharma, 2002).
Table 6.21. Effect of potassium on tuber yield, uptake and K recovery by
potato in acid sandy loam soils of Shimla.
Location K levels Tuber yield K-uptake K-recovery
K2O kg ha-1 mt ha-1 kg ha-1 %
Fagu 0 12.1 39
30 19.5 76 61.7
60 21.1 82 44.4
90 20.4 84 34.2
C.D. (0.05) 1.1 4.9
Kufri 0 8 24
30 11.1 41 33.9
60 12.9 55 41.6
90 13.4 50 26.7
C.D. (0.05) 1.9 7.4
Source: Adapted from Sud and Sharma, 2002.
Agroecological region 15
In a field experiment on sandy loam (pH 7.1), rainfed groundnut responded to
40 kg ha-1 K2O applied as basal and 80 kg K2O applied in two splits (1/2 as
basal 1/2 top dressed at 35 DAS). The economic optimum does of K was 43.2
kg ha-1 K2O to attain 1.27 mt ha-1 and 82.5 kg ha-1 K2O to attain 1.42 mt ha-1
(Mandal and Goswami, 1991) with basal and split application respectively
(Table 6.22). Application of fertilizer K at 49.8 kg ha-1 helped in preventing
the depletion of non-exchangeable K reserves in an Alfisol (Anandapur, West
Bengal) after a crop of rice, however, when a high K exhaustive crop of
potato followed as the second crop, the non-exchangeable reserves of K
declined to an extent of 9% in less than one year, despite application of
recommended dose of fertilizer K (i.e. 125 kg K ha-1) to the second crop. A
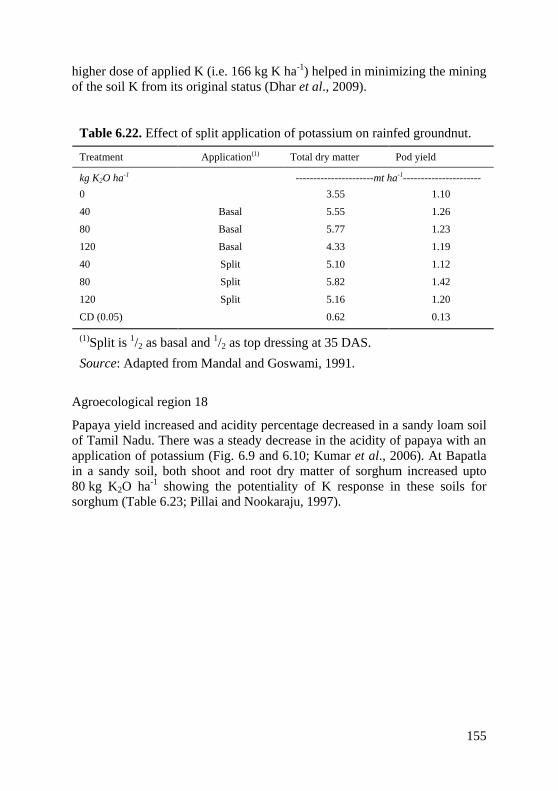
155
higher dose of applied K (i.e. 166 kg K ha-1) helped in minimizing the mining
of the soil K from its original status (Dhar et al., 2009).
Table 6.22. Effect of split application of potassium on rainfed groundnut.
Treatment Application(1) Total dry matter Pod yield
kg K2O ha-1 ----------------------mt ha-1----------------------
0 3.55 1.10
40 Basal 5.55 1.26
80 Basal 5.77 1.23
120 Basal 4.33 1.19
40 Split 5.10 1.12
80 Split 5.82 1.42
120 Split 5.16 1.20
CD (0.05) 0.62 0.13
(1)Split is 1/2 as basal and 1/2 as top dressing at 35 DAS.
Source: Adapted from Mandal and Goswami, 1991.
Agroecological region 18
Papaya yield increased and acidity percentage decreased in a sandy loam soil
of Tamil Nadu. There was a steady decrease in the acidity of papaya with an
application of potassium (Fig. 6.9 and 6.10; Kumar et al., 2006). At Bapatla
in a sandy soil, both shoot and root dry matter of sorghum increased upto
80 kg K2O ha-1 showing the potentiality of K response in these soils for
sorghum (Table 6.23; Pillai and Nookaraju, 1997).
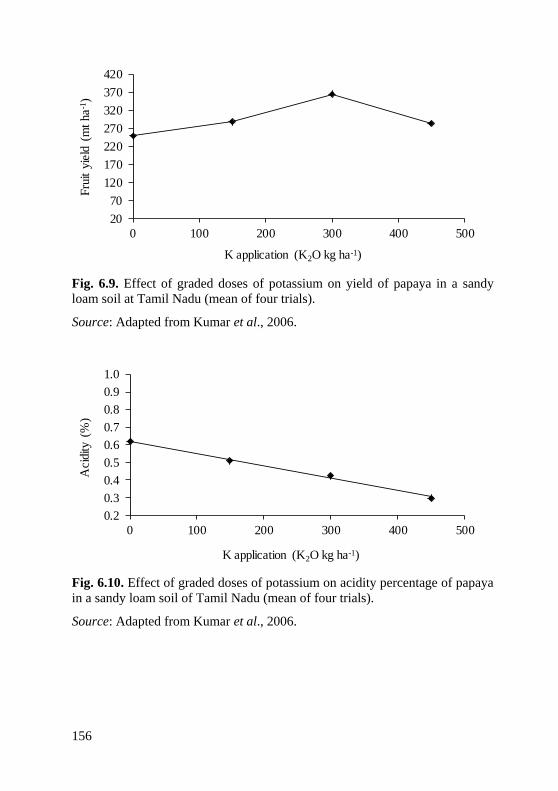
156
Fig. 6.9. Effect of graded doses of potassium on yield of papaya in a sandy
loam soil at Tamil Nadu (mean of four trials).
Source: Adapted from Kumar et al., 2006.
Fig. 6.10. Effect of graded doses of potassium on acidity percentage of papaya
in a sandy loam soil of Tamil Nadu (mean of four trials).
Source: Adapted from Kumar et al., 2006.
20
70
120
170
220
270
320
370
420
0 100 200 300 400 500
Fru
it y
ield
(m
t ha
-1)
K application (K2O kg ha-1)
0.2
0.3
0.4
0.5
0.6
0.7
0.8
0.9
1.0
0 100 200 300 400 500
Acid
ity (
%)
K application (K2O kg ha-1)
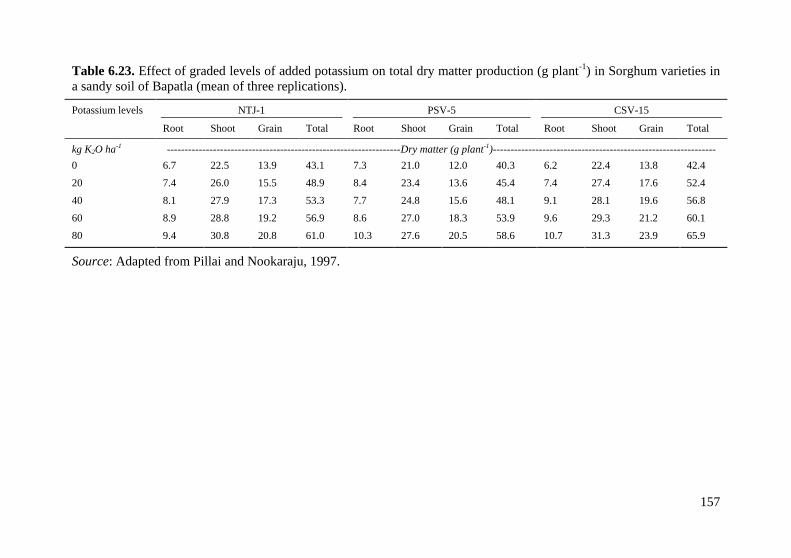
157
Table 6.23. Effect of graded levels of added potassium on total dry matter production (g plant-1) in Sorghum varieties in
a sandy soil of Bapatla (mean of three replications).
Potassium levels NTJ-1 PSV-5 CSV-15
Root Shoot Grain Total Root Shoot Grain Total Root Shoot Grain Total
kg K2O ha-1 ------------------------------------------------------------------Dry matter (g plant-1)---------------------------------------------------------------
0 6.7 22.5 13.9 43.1 7.3 21.0 12.0 40.3 6.2 22.4 13.8 42.4
20 7.4 26.0 15.5 48.9 8.4 23.4 13.6 45.4 7.4 27.4 17.6 52.4
40 8.1 27.9 17.3 53.3 7.7 24.8 15.6 48.1 9.1 28.1 19.6 56.8
60 8.9 28.8 19.2 56.9 8.6 27.0 18.3 53.9 9.6 29.3 21.2 60.1
80 9.4 30.8 20.8 61.0 10.3 27.6 20.5 58.6 10.7 31.3 23.9 65.9
Source: Adapted from Pillai and Nookaraju, 1997.
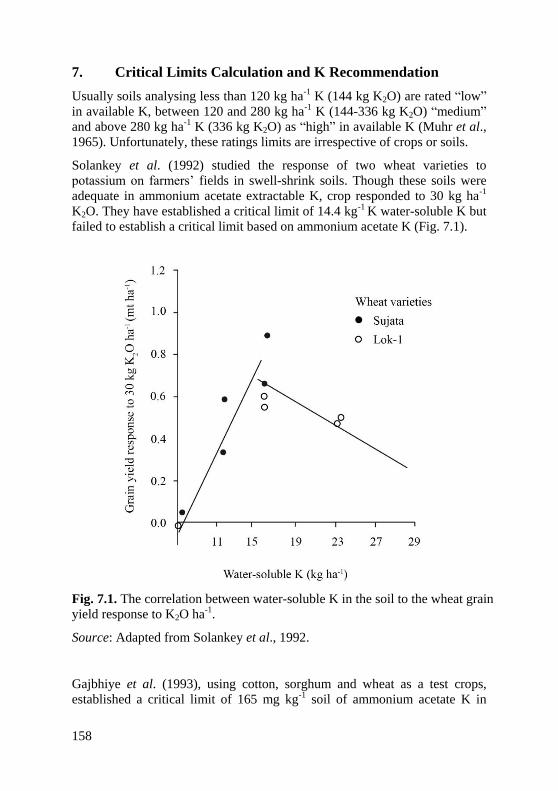
158
7. Critical Limits Calculation and K Recommendation
Usually soils analysing less than 120 kg ha-1 K (144 kg K2O) are rated “low”
in available K, between 120 and 280 kg ha-1 K (144-336 kg K2O) “medium”
and above 280 kg ha-1 K (336 kg K2O) as “high” in available K (Muhr et al.,
1965). Unfortunately, these ratings limits are irrespective of crops or soils.
Solankey et al. (1992) studied the response of two wheat varieties to
potassium on farmers’ fields in swell-shrink soils. Though these soils were
adequate in ammonium acetate extractable K, crop responded to 30 kg ha-1
K2O. They have established a critical limit of 14.4 kg-1 K water-soluble K but
failed to establish a critical limit based on ammonium acetate K (Fig. 7.1).
Fig. 7.1. The correlation between water-soluble K in the soil to the wheat grain
yield response to K2O ha-1.
Source: Adapted from Solankey et al., 1992.
Gajbhiye et al. (1993), using cotton, sorghum and wheat as a test crops,
established a critical limit of 165 mg kg-1 soil of ammonium acetate K in
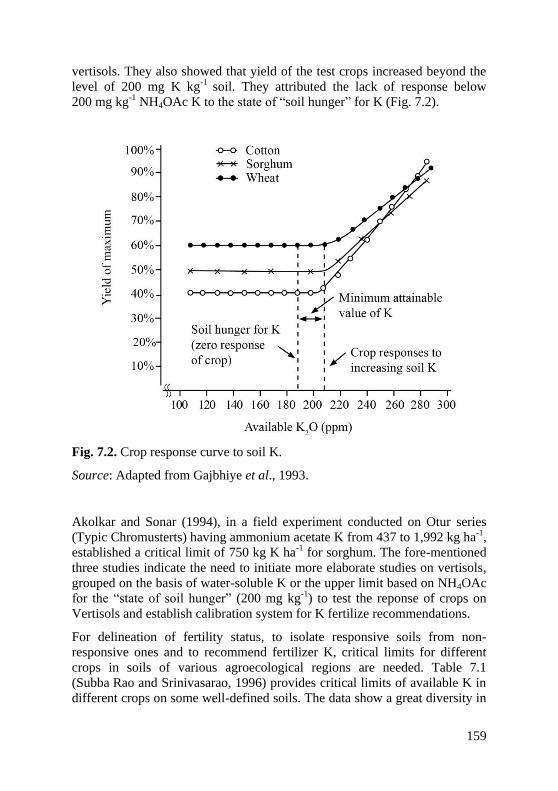
159
vertisols. They also showed that yield of the test crops increased beyond the
level of 200 mg K kg-1 soil. They attributed the lack of response below
200 mg kg-1 NH4OAc K to the state of “soil hunger” for K (Fig. 7.2).
Fig. 7.2. Crop response curve to soil K.
Source: Adapted from Gajbhiye et al., 1993.
Akolkar and Sonar (1994), in a field experiment conducted on Otur series
(Typic Chromusterts) having ammonium acetate K from 437 to 1,992 kg ha-1,
established a critical limit of 750 kg K ha-1 for sorghum. The fore-mentioned
three studies indicate the need to initiate more elaborate studies on vertisols,
grouped on the basis of water-soluble K or the upper limit based on NH4OAc
for the “state of soil hunger” (200 mg kg-1) to test the reponse of crops on
Vertisols and establish calibration system for K fertilize recommendations.
For delineation of fertility status, to isolate responsive soils from non-
responsive ones and to recommend fertilizer K, critical limits for different
crops in soils of various agroecological regions are needed. Table 7.1
(Subba Rao and Srinivasarao, 1996) provides critical limits of available K in
different crops on some well-defined soils. The data show a great diversity in
160
the critical limits ranging from 48 to 137 mg kg-1 soil. It is also seen that
there is lack of information on critical limits for K on vertisols for important
crops. Table 7.2 shows the potash fertilizer recommendations for some
tobacco growing soils of India. Table 4.7.1 (presented earlier) shows the K
fertilizer recommendations based on critical limits of exchangeable and non-
exchangeable K for different soils of India. Non-exchangeable K reserves
were included along with exchangeable K in categorising soils into 9 groups
for evolving better strategies to manage soil K fertility in rainfed agriculture
in India. Finger millet and groundnut crops at Bangalore and Anantapur
regions (category I) need immediate attention on K nutrition, as these soils
are low in both exchangeable and non-exchangeable K. Similarly, crops
grown on soils of S.K. Nagar, Ballowal-Saunkri, and Rakh-Dhiansar, with
low exchangeable K and medium non-exchangeable K, would need K
fertilisation as these crops (maize and pearlmillet) are K-exhaustive (category
II). Pearl millet and upland rice in category III and cotton in category IV need
K additions at critical stages. Upland rice in category V needs a maintenance
dose of K. In category VI, cereal crops may not need K additions
immediately as they have medium exchangeable K and high non-
exchangeable K. Long-term sorghum cropping may need K supply after few
years (category VII). Soils in category VIII are adequate in non-exchangeable
K and medium exchangeable K and with the crops, groundnut, cotton,
sorghum, and soybean, application of K can be planned according to market
conditions with no immediate risk of yield loss. For soils in category IX, K
fertilisation is not required to the crops (sorghum and soybean) as these soils
have high exchangeable and non-exchangeable K (Srinivasarao et al., 2007).
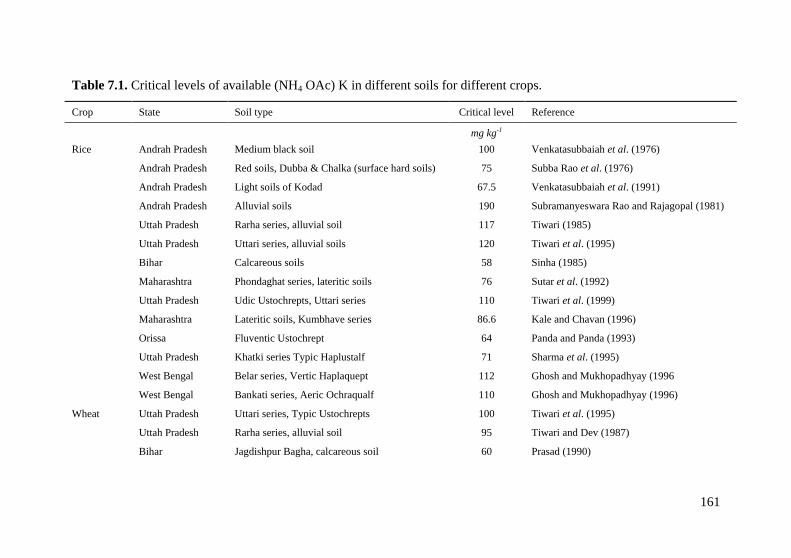
Table 7.1. continued
161
Table 7.1. Critical levels of available (NH4 OAc) K in different soils for different crops.
Crop State Soil type Critical level Reference
mg kg-1
Rice Andrah Pradesh Medium black soil 100 Venkatasubbaiah et al. (1976)
Andrah Pradesh Red soils, Dubba & Chalka (surface hard soils) 75 Subba Rao et al. (1976)
Andrah Pradesh Light soils of Kodad 67.5 Venkatasubbaiah et al. (1991)
Andrah Pradesh Alluvial soils 190 Subramanyeswara Rao and Rajagopal (1981)
Uttah Pradesh Rarha series, alluvial soil 117 Tiwari (1985)
Uttah Pradesh Uttari series, alluvial soils 120 Tiwari et al. (1995)
Bihar Calcareous soils 58 Sinha (1985)
Maharashtra Phondaghat series, lateritic soils 76 Sutar et al. (1992)
Uttah Pradesh Udic Ustochrepts, Uttari series 110 Tiwari et al. (1999)
Maharashtra Lateritic soils, Kumbhave series 86.6 Kale and Chavan (1996)
Orissa Fluventic Ustochrept 64 Panda and Panda (1993)
Uttah Pradesh Khatki series Typic Haplustalf 71 Sharma et al. (1995)
West Bengal Belar series, Vertic Haplaquept 112 Ghosh and Mukhopadhyay (1996
West Bengal Bankati series, Aeric Ochraqualf 110 Ghosh and Mukhopadhyay (1996)
Wheat Uttah Pradesh Uttari series, Typic Ustochrepts 100 Tiwari et al. (1995)
Uttah Pradesh Rarha series, alluvial soil 95 Tiwari and Dev (1987)
Bihar Jagdishpur Bagha, calcareous soil 60 Prasad (1990)
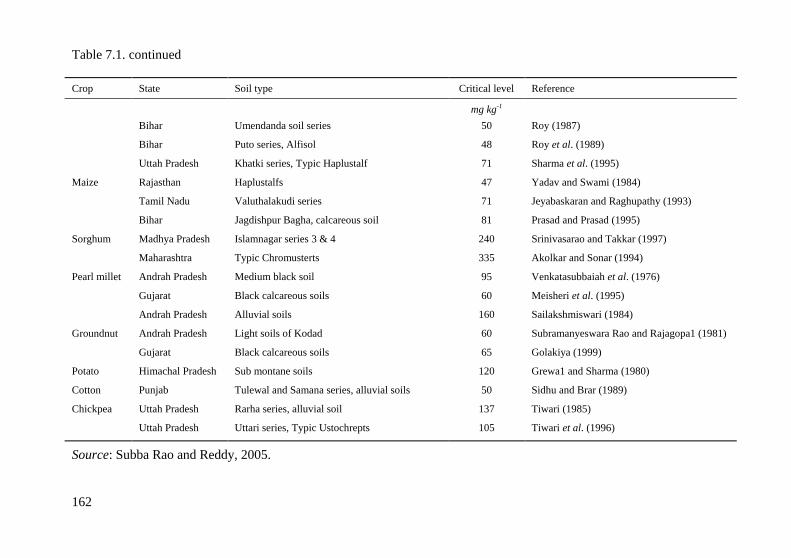
Table 7.1. continued
162
Crop State Soil type Critical level Reference
mg kg-1
Bihar Umendanda soil series 50 Roy (1987)
Bihar Puto series, Alfisol 48 Roy et al. (1989)
Uttah Pradesh Khatki series, Typic Haplustalf 71 Sharma et al. (1995)
Maize Rajasthan Haplustalfs 47 Yadav and Swami (1984)
Tamil Nadu Valuthalakudi series 71 Jeyabaskaran and Raghupathy (1993)
Bihar Jagdishpur Bagha, calcareous soil 81 Prasad and Prasad (1995)
Sorghum Madhya Pradesh Islamnagar series 3 & 4 240 Srinivasarao and Takkar (1997)
Maharashtra Typic Chromusterts 335 Akolkar and Sonar (1994)
Pearl millet Andrah Pradesh Medium black soil 95 Venkatasubbaiah et al. (1976)
Gujarat Black calcareous soils 60 Meisheri et al. (1995)
Andrah Pradesh Alluvial soils 160 Sailakshmiswari (1984)
Groundnut Andrah Pradesh Light soils of Kodad 60 Subramanyeswara Rao and Rajagopa1 (1981)
Gujarat Black calcareous soils 65 Golakiya (1999)
Potato Himachal Pradesh Sub montane soils 120 Grewa1 and Sharma (1980)
Cotton Punjab Tulewal and Samana series, alluvial soils 50 Sidhu and Brar (1989)
Chickpea Uttah Pradesh Rarha series, alluvial soil 137 Tiwari (1985)
Uttah Pradesh Uttari series, Typic Ustochrepts 105 Tiwari et al. (1996)
Source: Subba Rao and Reddy, 2005.
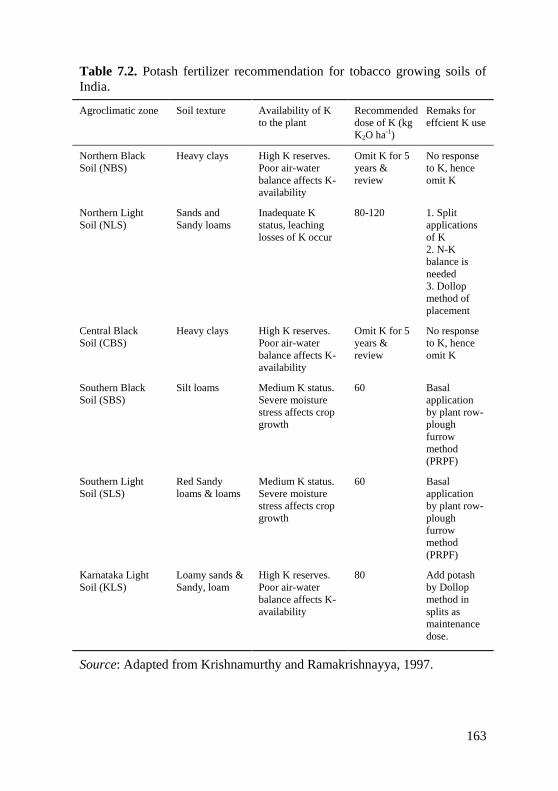
163
Table 7.2. Potash fertilizer recommendation for tobacco growing soils of
India.
Agroclimatic zone Soil texture Availability of K
to the plant
Recommended
dose of K (kg
K2O ha-1)
Remaks for
effcient K use
Northern Black
Soil (NBS)
Heavy clays High K reserves.
Poor air-water
balance affects K-
availability
Omit K for 5
years &
review
No response
to K, hence
omit K
Northern Light
Soil (NLS)
Sands and
Sandy loams
Inadequate K
status, leaching
losses of K occur
80-120 1. Split
applications
of K
2. N-K
balance is
needed
3. Dollop
method of
placement
Central Black
Soil (CBS)
Heavy clays High K reserves.
Poor air-water
balance affects K-
availability
Omit K for 5
years &
review
No response
to K, hence
omit K
Southern Black
Soil (SBS)
Silt loams Medium K status.
Severe moisture
stress affects crop
growth
60 Basal
application
by plant row-
plough
furrow
method
(PRPF)
Southern Light
Soil (SLS)
Red Sandy
loams & loams
Medium K status.
Severe moisture
stress affects crop
growth
60 Basal
application
by plant row-
plough
furrow
method
(PRPF)
Karnataka Light
Soil (KLS)
Loamy sands &
Sandy, loam
High K reserves.
Poor air-water
balance affects K-
availability
80 Add potash
by Dollop
method in
splits as
maintenance
dose.
Source: Adapted from Krishnamurthy and Ramakrishnayya, 1997.
164
8. Conclusion
The available information on potassium status in soils and crop responses to
applied K in soils of the different agroecological zones indicate that crops
may respond to K fertilizer in the following conditions:
Alluvial soils in Himalayan regions (Jammu and Kashmir and Himachal
Pradesh) have medium in exchangeable and medium to high non-
exchangeable K. High K demanding cropping systems based on potato
need regular K application.
Some soils in the agroecological region 2 have high amount of biotite
mica (e.g. in Hisar) but others (e.g. Gurgaon), showed more prominent
responses to K and need K fertilization.
Red shallow soils in the agroecological region 3 are low to medium in
exchangeable K and low to medium in non-exchangeable K, and hence
regular application of K is needed for groundnut and finger millet based
cropping systems.
Light textured alluvial soils with moderate amounts of both available and
non-exchangeable K in the agroecological region 4 sub-soils (Rajasthan,
Uttar Pradesh) are relatively low in available K and this could be a
reason for prominent responses observed at some places under intensive
cropping. Hence K application to K loving cropping systems in this
agroecological region (rice-wheat, potato or sugarcan based systems) is
required.
Red and lateritic soils with medium amount of available K but low
reserve K are found in the agroecological region 7 (Andra Pradesh and
Karnataka). The predominant cropping systems like groundnut,
fingermillet and horticulture based - all need K application. Moreover,
commertial crops like tobacco needs special attention as per as K
nutrition is concerned.
Red soils with medium available K but low reserve K are found in the
agroecological region 8 (Tamil Nadu and Karnataka). Since soil reserves
are low in some of these red soils, cotton, finger millet and other crops
grown in this agroecological region require K fertilization.
In the agroecological region 9 (U.P, Bihar), where K deficient Alfisols
and Inceptisols prevail, crops like sugarcane and potato need frequent K
application. Special care should be taken on K nutrition of crops on
highly calcareous soils of Bihar.
165
The K deficient red and acidic alluvial soils with low to medium
available K and low non-exchangeable K in the agroecological region 12
and in the agroecological region 13 (Orissa, Chattisgadh, West Bengal),
require frequent K application for improving crop yields. Potassium
application is also essential in soils where iron toxicity is found,
particularly in Orissa.
The agroecological region 14 is characterized with brown forest and
acidic hill soils with low to high available and non-exchangeable K.
Potash loving crops like potato may be recommended K application.
Acidic alluvial soils with marginally high available K but low to medium
non-exchangeable K are found in the agroecological region 15. K
application is needed to only K loving crops like potato and plantation
crops based soil K deficiency.
Soils of the agroecological region 16 (West Bengal and North-East Hills
states like Assam Mizoram and Manipur) have low to high available and
reserve K. Crops grown on the low K soils of West Bengal require
regular K additions.
In the acidic soils of the agroecological region 17 (Arunachal Pradesh),
soils with medium level of available and reserve K require crop specific
K recommendation K deficient soils.
In eed and lateritic soils with medium level of available K but low
reserve K in the agroecological region 19 (Coastal regions of Eastern
India), K application is needed on site specific K deficient locations.
Further studies are needed on these soils to work out the magnitude of
responses, economics and the fertilizer recommendations for crops grown in
these agroecological regions.
It is observed that there are variations in crop responses even within an
agroclimatic region. This may be due to differential prior exhaustion of K
under varrying management conditions. The information generated has
shown a better way of assessing fertilizer responses when chemical extraction
is supplemented with mineralogical investigations. Smectitic soils have
higher K release rates than illitic soils but the reserves are not sufficient if the
cropping continues without adequate K supplementation for long period.
Some soils have high amount of K supplying minerals in the silt fraction and
this also need to be accounted while assessing the K fertilizer requirements.
The K recommendations by taking both exchangeable and non-exchangeable
K reserves simultaneously as shown in Table 4.7.1 are also promising. There
is a need to generate several such informations. Such type of soil test
166
calibration system has to be established for important soils and crops in each
agroecological region to prescribe location specific K fertilizer
recommendations.
At present, under rice-wheat cropping system in the Indo-Gangetic plains,
with intensive cropping, soil K depletion is continuing. These intesive rice-
wheat systems require K application at critical crop stages. Most of the crops
grown on red and lateritic soils and acidic alluvial soils need regular K
application. Oil seed crops mostly grown under rainfed conditions need K
fertilization based on the extent of K deficiency. For K loving crops like
potato, cassava, sugarcane and banana, potassium application should be a
regular practice. Commercial crops like tobacco and many horticultural
crops, grown on K deficient red and lateritic soils of southern India, need
regular K application.
167
9. References
Adhikari, M., and T.K. Ghosh. 1991. Potash resources and quantity/intensity
relationships of different soils of West Bengal. Journal of Potassium
Research 7:161-170.
Afridi, M.M.R.K., A. lnam, Samiullah, and Md. Yahiya. 1990.
Morphological studies on mustard and pigeon pea with special reference
to K nutrition under irrigated and un-irrigated conditions. Third progress
report, Potash Research Institute of India Dept.of Botany, Aligarh Muslim
University, Aligarh.
Ahmed, N., and C.S. Walia. 1999. Profile distribution of various forms of
potassium in some landforms of Bundelkhand region. Journal of
Potassium Research 15:1-4.
Akolkar, R.D., and K.R. Sonar. 1994. Calibration of soil test methods for
available potassium in Vertisols for sorghum. Journal of Potassium
Research 10:63-68.
Annual Report. 2005-2006. AICRP on Cropping Systems. Project Directorate
for Cropping Systems Research, Modipuram.
Annual Research Report. 1988. Dept. of Agricultural Chemistry and Soil
Science. Gujarat Agricultural University, Junagarh.
Bansal, S.K., and S. Umar. 1998. Nutrient indexing of crop plants grown on
twenty six benchmark soil series of India. Journal of Potassium Research
15:7-18.
Bansal, S.K., G. Debnath, and S. Umar. 1996. Monitoring changes in
Potassium Fertility of Five Bench Mark Soil Series from Southern India.
Journal of Potassium Research 12:337-344.
Bele, Nilima R., K.R. Sonar, and Y.M. Patil. 1997. Quantity-intensity
parameters of potassium in six dominant soil series of western
Maharashtra. Journal of Potassium Research 131:31-36.
Benipal. D.S., R. Kumar, and N.S. Pasricha. 2001. Fractional distribution of
potassium and its relationship with clay mineralogy in alluvial soils of
Punjab. Journal of Potassium Research 17:28-33.
Bhargava, P.N., H.C. Jain, and A.K. Bhatia. 1985. Response of rice and
wheat to potassium. Journal of Potassium Research 1:45-61.
Bhaskar, B.P., S. Vadivelu, U. Baruah, P.S. Butte, D.P. Dutta, and J.P.
Mishra. 2001. Distribution of potassium forms in chars and marshy soils
of Brahmaputra valley, Jorhat District, Assam. Journal of Potassium
Research 17:39-47.
Bhattacharyya, D., and S.R. Poonia. 1996. Kinetics of potassium release in
ammonium acetate in some soils of semi-arid and humid regions. Journal
of Potassium Research 44:44-48.
168
Brar, M.S., B.D. Sharma, R. Singh, and P.S. Sidhu. 1999. Potassium status of
Abohar and Zirakpur soil series in Punjab. Journal of Research Punjab
Agricultural Univiversity 36:163-68.
Chakarvarty, B.K., D. Borgohain, and M.C. Talukdar. 1996. Effect of levels
of potassium and growth and yield of banana cv. Barjahaji (AAA).
Journal of Potassium Research 12:174-179.
Chand, S., and B.N. Swami. 2000. Different forms of potassium in some
important soil associations of Bharatpur district of Rajasthan. Journal of
Potassium Research 16:59-61.
Chandra, P., and V. Singh. 1986. Evaluation of soil test methods for available
potassium in alluvial soils. Journal of the Indian Society of Soil Science
34:425-27.
Chaudhary, J. 1997. Quantity-intensity relationship of potassium in
Barrackpore soils. Journal of Potassium Research 15:93-99.
Chaudhary, K., and B. Prasad. 1997. Distribution of different forms of
potassium in alluvial soils of Bihar. Journal of Potassium Research
13:233-238.
Chauhan, D.R., and A. Tikkoo. 2002. Response of varying levels of
potassium and sulphur on yield and oil content in Indian mustard, Brasica
juncea L. Journal of Potassium Research 18:64-67.
Das, K., D. Sarkar, and D.C. Nayak. 2000. Forms of potassium and their
distribution in some soils representing red and lateritic ecosystem of West
Bengal. Journal of Potassium Research 16:1-6.
Das, P.K., G.C. Saha, and N. Das. 1997. Vertical distribution and release
characteristics of potassium in some lateritic soils of Orissa. I. Vertical
distribution of potassium. Journal of Potassium Research 13:105-110.
Das. K., S.K. Singh, and R.L. Shyampura. 1993. Forms of potassium in
relation to land form and soil properties of Basaltic Terrain. Journal of the
Indian Society of Soil Science 41:557-559.
Datta, B.K., and D.C. Joshi. 1989. Influence of soil properties on forms of
potassium in Dune and Interdune soils of arid Rajasthan. Journal of
Potassium Research 6:61-69.
Datta, M. 1996. Potassium changes in soil upon incorporation of leaf
prunings of multipurpose tree species in an acid soils of Tripura. Journal
Indian Society of Soil Science 44:398-401.
Datta, S.C. 1996. Determination of threshold level of K fixation:plateau of
labile K and its practical imlication. Journal of Potassium Research
12:14-22.
Debnath, G., and K. Majumdar. 1998. Potassium adsorption kinetics in some
benchmark soils differing in mineralogy. Journal of Potassium Research
151:19-24.
169
Deshmukh, V.N., and R.P. Rangacharya. 1992. Potassium supplying power
of soils of Western Vidharbha. Journal of potassium Research 8:26-30.
Dhar, A., A. Debnath, and S.K. Sanyal. 2009. Planning judicious potassium
fertilization for maintaining native soil potassium reserves in an Ultic
Paleustalf in relation to its uptake by rice and potato. Journal Indian
Society of Soil Science 57:58-61.
Dhillon, S.K., and K.S. Dhillon. 1996. Effect of total electrolute
concentration on K+-Ca2+ exchange in some benchmark soils of India.
Journal of Potassium Research 133-145.
Dhillon, W.S., A.S. Bindra, and B.S. Brar. 1999. Response of grapes to
potassium fertilization in relation to fruit yield, quality and petiole
nutrient status. Journal of the Indian Society of Soil Science 47:89-94.
Gajbhiye, K.S. 1985. Forms of potassium in some Inceptisols and Entisols.
Journal of the Indian Society of Soil Science 33:412-415.
Gajbhiye, K.S., S.T. Gaikawad, J.L. Seghal, K.S. Bhaskar, and R. Gupta.
1993. Studies of available potassium and crop response in soils of
Sawangi watershed in Vertisol region of Vidarbha. Journal of Potassium
Research 9:233-240.
Ghosh, A.B., and R. Hasan. 1976. Available potassium status of Indian soils.
Indian Society of Soil Science. Bulletin No. 10:1-5.
Ghosh, A.B., and C.R. Biswas. 1978. Potassium responses and changes in
soil potassium status with time. Potassium in Soils and Crops. Potash
Research Institute of India, New Delhi. p. 379-390.
Ghosh, B.N., and A.K. Mukhopadhyaya. 1996. Critical limit of potassium in
rice plant in Belar and Bankati series of West Bengal. Journal of the
Indian Society of Soil Science 44:286-289.
Ghosh, S.K., and T. Bhattacharyya. 1984. Mineralogy of soils of Bihar, Uttar
Pradesh, Gujarat and Rajasthan. Mineralogy of Soil Potassium. PRII
Research Review Series, vol. 1, Potash Research Institute of India,
Gurgaon, India. p. 15-29.
Golakia, B.A. 1999. Potassium fertilization of groundnut in Saurashtra
region, India. Proceedings of workshop organized by the International
Potash Institute at the 16th World Congress of Soil Science, Montpellier,
France, 20-26 August 1998.
Grewal, J.S., and R.C. Sharma. 1980. Evaluation of soil test methods for
potassium in acidic brown hill soils for recommending fertilizer doses for
potatoes. Journal of the Indian Society of Soil Science 28:355-360.
Gupta, R.D., K.K. Jha, P.K. Sharma, and R.D. Sud. 1980. Distribution of
microorganisms in relation to physico-chemical properties of soils of
Jammu and Kashmir. Journal of the Indian Society of Soil Science
28:259-262.
170
Gupta, R.K., M. Datta, and S. Sharma. 1983. Different forms and Q/1
parameters of potassium in acid soils of Nagaland. Journal of the Indian
Society of Soil Science 31:305-307.
Jackson, M.L. 1968. Soil Chemical Analysis, Prentice Hall of India Private
Limited, New Delhi.
Jeyabaskaran, K.J., and B.J. Raghupathy. 1993. Critical limits of potassium
for maize in Valuthalakudi series. Journal of Potassium Research
9:353-359.
Joshi, D.C. 1986. Potassium release behaviour of some arid soils. Journal of
the Indian Society of Soil Science 34:56-63.
Kale, V.B., and A.S. Chavan. 1996. Critical limit of potassium in relation to
paddy yield in Kumbhave soil series of Konkan, India, Punjabrao
Krishividyapeeth research Journal 20:90-93.
Kapoor, B.S., H.B. Singh, S.C. Goswami, I.P. Abrol, G.P. Bhargava, and
D.K. Pal. 1981. Weathering of micaceous minerals in some salt-affected
soils. Journal of the Indian Society of Soil Science 29:486–492.
Kaskar, D.R., V.G. Salvi, B.S. Mayekar, and D.J. Dabke. 2001. Forms of
potassium, their inter relationship and relationships with other soil
properties of inceptisols of west coast of Maharashtra. Journal of
Potassium Research 17:23-27.
Koria, R.G., M.S. Patel, and B.S. Yadav. 1989. Vertical distribution of forms
of potassium in some soil profiles of dry farming areas of Saurastra
region of Gujarat. Journal of potassium Research 5:47-52.
Krishnamurthy, V., and B.V. Ramakrishnayya. 1997. Potassium fertility of
flue-cured tobacco growing soils of India. Journal of Potassium Research
13:159-169.
Kumar, Binod, and S.N. Jha. 1987. Index of availability and critical limits of
potassium in soils of North Bihar. Journal of Potassium Research 3:17-25.
Kumar, N., N. Meenakshi, J. Suresh, and V. Nosov. 2006. Effect of
potassium nutrition on growth, yield and quality of papaya, Carica papaya
L. Indian Journal of Fertilizers 2:43-47.
Kumar, Ram, S.C. Kotur, and H.P. Singh. 1996. Response of Guava (Psidium
guajava L.) cv. Allahabad safeda to potassium on a Sandy Loam soil.
Journal of Potassium Research 12:59-64.
Lathabanumathi, G. 1997. Studies on dynamics of potssium in Irugur and
Noyyal soil series of Coimbatore and Periyar districts. MSc. thesis,
Department of Soil Science and Agricultural Chemistry, Tamil Nadu
Agricultural University, Coimbatore.
Malavia, D.D., J.C. Patel, K.P. Patel, and V.B. Ramani. 1993. Response to
potassium application under intensive cropping systems in Saurastra
region. Proceedings of Workship on Potassium in Gujarat Agriculture.
Junagarh. p. 94-106.
171
Mandal, S.S., and S.B. Goswami. 1991. Effect of split application of
potassium on rainfed groundnut. Journal of Potassium Research
7:304-308.
Masilamani, S. Durairaj, N. Muthiah, and K. Vijaya Lakshmi. 1993.
potassium fixation studies in major soil series of Pudukottai district in
Tamil Nadu. Journal of Potassium Research 9:228-232.
Medhi, M., D.K. Borah, and T.C. Baruah. 2000. Effect of sources and levels
of lime on available potassium in soils from different agroecological
situations of Assam. Journal of Potassium Research 16:27-31.
Mehta, S.C., N. Singh, and M. Singh. 1991. Critical limit of potassium in soil
and response of pearl millet in Lukhi soil series. Journal of potassium
Research 7:102-108.
Mehta, S.C., Robert S. Shiel, K.S. Grewal, and S.B. Mittal. 2001. Relative
efficiency of different extractants for non-exchangeable K release in soils.
Journal of Potassium Research 17:48-51.
Meisheri, M.B., G.J. Hadvani., B.P. Talavia, and M.K. Shiroya. 1995.
Potassium response and its critical limit for pearl millet in calcareous
soils. Gujarat Agricultural University Research journal 21:41-46.
Mishra, M.K., and P.C. Srivastava. 1991. Depthwise distribution of forms of
potassium in some profiles of Garhwal Himalaya. Journal of Potassium
Research 7:75-84.
Mishra, M.K., P.C. Srivastava, and D. Ghosh. 1993. Forms of potassium in
relation to soil properties and clay minerology in some profiles of
Chambal command area, Rajasthan. Journal of Potassium Research
9:187-194.
Mittal, S.B., Raghbir Singh, M.L. Dixit, S.C. Mehta, and O.P. Yadav. 1996.
Potassium fertilization of pearl-millet and wheat: Results of a long-term
field experiment at Hisar. Journal of Potassium Research 12:160-168.
Mongia, A.D., and A.K. Bandyopadhyay. 1991. Forms of potassium in the
acidic hill soils of Andamans. Journal of the Indian Society of Soil
Science 39:573-76.
Muhr, G.R., N.P. Datta, H. Shankara Subramoney, V.K. Leley, and
R.L. Donahu. 1965. Soil Testing in India. USAID, New Delhi. p. 120.
Naidu, L.G.K., R. S. Reddy, E.V.S. Prakasa Rao, P. Krishan, and R.A. Nasre.
1996. Potassium deficiency in crops- an emerging problem in red and
lateritic soils. Journal of Potassium Research 12:23-29.
Naidu, L.G.K., C.B. Sachedev, and K.P.C. Rana. 1988. Response of wheat to
potassium and zinc on two major soil series of Haryana. Journal of
Potassium Research 4:129-133.
Nakashgir, G.H., M.A. Peer, M.M. Rafique, and C.L. Arora. 1997. Critical
limits of potassium for rice in soils of Kashmir Valley as influenced by
altitude of the region. Journal of Potassium Research 13:249-256.
172
Nambiar, K.K.M., and I.P. Abrol. 1989. Long-term fertilizer experiments in
India. Fertilizer News 34:11-20.
Padmaja. G., and A. Sreenivasa Raju. 1999. Status of potassium found in
Alfisols of southern Telangana zone of Andhra Pradesh. Journal of
Potassium Research 151:15-24.
Pal, D.K., and S.L. Durge. 1987. Potassium release and fixation reactions in
some benchmark Vertisols of India in relation to their mineralogy.
Pedologie 37:103-116.
Pal, D.K., and S.L. Durge. 1993. Potassium release from clay micas. Journal
of the Indian Society of Soil Science 41:67-69.
Pal, D.K., and R.C. Mondal. 1980. Crops response to potassium in sodic soils
in relation to potassium release behaviour in salt solutions. Journal of the
Indian Society of Soil Science 28:247-254.
Pal, D.K., S.B. Deshpande, and S.L. Durge. 1987. Weathering of biotite in
some alluvial soils of different agroclimatic zones. Clay Research
6:69-75.
Pal, D.K., S.B. Deshpande, and S.L. Durge. 1993. Potassium release and
adsorption reactions in two ferruginous & polygenetic.soils of southern
India in relation to their mineralogy. Pedologie 43:403-415.
Pal, D.K., and Ch. Srinivasa Rao 2001. Role of minerals in potassium
management of Indian soils. Invited Lead paper in International Seminar
on “Importance of potassium in nutrient management for sustainable
production in India during 3-5th Dec. 2001. International Potash Institute,
New Delhi. p. 151-166.
Panda, M., and A.K. Panda. 1993. Evaluation of some potassium soil tests for
rice in Fluventic Ustochrept. Journal of the Indian Society of Soil Science
41:188-189.
Pandey, N., S.S. Tuteja, R. Lakpale, and R.S. Tripathi. 1993. Effect of
potassium and nitrogen on grain yield, K content and uptake of rice in
vertisol. Journal of Potassium Research 9:262-265.
Pannu, R.P.S, Y. Singh, B. Singh, and C.S. Khind. 2002. Long-term effects
of organic materials oon depthwise distributionof different K fractions in
soil profile under rice-wheat cropping system. Journal of Potassium
Research 18:1-5.
Pasricha, N.S., B.D. Sharma, C.L. Arora, and P.S. Singh. 2001. Potassium
distribution in soils and ground waters of Punjab. Journal of Potassium
Research 17:1-13.
Patel, M.S., and B.A. Golakia. 1996. Potassium in soils and crops of Gujarat.
Journal of Potassium Research 12:48-58.
Patel, M.S., G.J. Hadvani, and B.S. Yadav. 1989. Fixation of potassium in
important soil groups of Western Gujarat. Journal of Potassium Research
5:134-142.
173
Patil, P.S., J.V. Polara, and N.B. Babaria. 2003. Potassium uptake of different
varieties of groundnut under varying K levels. Journal of Potassium
Research 19:78-81.
Patil, R.R., M.H. Khanvilkar, D.R. Kaskar, and S.S. Prabudesai. 2006. Effect
of potassium nutrition on dry matter accumulation, sugars, starch and
nutrient concentration in sweet potato. Indian Journal of Fertilizers
22:29-31.
Patiram, and R.N. Prasad. 1984. Forms of potassium in the soils of East
Khasi Hills, Meghalaya. Journal of the Indian Society of Soil Science
32:168-171.
Patiram, and R.N. Prasad. 1991. Release of non-exchangeable potassium and
its relation to potassium supplying power of soils. Journal of the Indian
Society of Soil Science 39:488-493.
Patra, S.K., and A. Debnath. 1998. Potassium fixation and releasing power of
tarai acid soils of West Bengal. Journal of Potassium Research
15:109-114.
Pharande, A.L., and K.R. Sonar. 1996. Depthwise distribution of different
forms of potassium in important Vertisol soil series of Maharashtra.
Journal of Potassium Research 12:127-134.
Pillai, K.G., L. Sushila Devi, M.V. Sholapurkar, and M.K. Jagannath. 1987.
Effect of continuous cropping and manuring in selected cropping systems.
Fertilizer News 32:31-37.
Pillai, P.N., and Y. Nookaraju. 1997. Effect of graded levels of applied
potassium on dry matter production and Nutrient uptake in Sorghum.
Journal of Potassium Research 13:239-244.
Prabha Kumari, P., and R.S. Aiyer. 1993. Soil test and crop response studies
for potassium in laterite/red loam soils of Kerala. Journal of Potassium
Research 9:62-66.
Prasad, B. 1990. Availability and critical limits of potassium in wheat in
Jagdishpur Bagha soil series (calciorthents) of Bihar. Journal of Potssium
Research 6:62-65.
Prasad, B., and J. Prasad. 1990. Critical limits of soil K for rice in Jagdishpur
Bagha soil series. Annual report, Potash Research Institute of India,
Gurgaon, Haryana. p. 30.
Prasad, B., and J. Prasad. 1993. Potassium for winter maize and rapeseed in
calciorthent of north Bihar. Journal of Potassium Research 9:365-369.
Prasad, B., and J. Prasad. 1995. Critical limits of potassium for winter maize
in calcareous soil. Journal of Potassium Research 11:319-326.
Prasad, B., and J. Prasad. 1997. Response of rice to potassium application in
calcareous soils . Journal of Potassium Research 13:50-57.
174
Prasad, Kanti, and R.P.S. Chauhan. 2000. Rice response to rate and time of
application of potassium in an upland ecosystem. Journal of Potassium
Research 16:32-34.
Prasad, R., U.S. Prasad, and R. Sakal. 1996. Effect of potassium and sulphur
on yield and quality of sugarcane grown in calcareous soils . Journal of
Potassium Research 12:29-38.
Puri, G., and S.A. Jaipurkar. 1989. Potassic fertilization of linseed (Linum
usitatissimum L.) and safflower (Carthamus tinctorious L.) yield response
and utilization of soil potassium in a Vertisol. Journal of Potassium
Research 5:26-34.
Rai, G.K., M.M. Verma, J. Singh, and K.P. Singh. 2002. Effect of nitrogen
and potassium on crop growth, tuber yield and nutrient uptake in potato
Solanum tuberosum L. Journal of Potassium Research 18:75-78.
Rajeswar, M., Ch. Sujini Rao, D. Balaguravaiah, and M.A. Aariff Khan.
2009. Distribution of available macro and micronutrients in soils of
Garikapadu of Krishna district of Andhra Pradesh. Journal of Indian
Society of Soil Science 57:210-213.
Ramamoorthy, B., and J.C. Bajaj. 1969. Available nitrogen, phosphorus and
potassium status of Indian soils. Fertilizer News 14:24-36.
Raskar, B.N, and A.L. Pharande. 1997. Different forms of potassium and
their distribution in some important soil series of vertisol and alfisol of
Western Maharashtra. Journal of Potassium Research 131:21-30.
Ratna Kumari, S., P. Subbaravamma, K. Hema, and D.H.D Prasad. 2008.
Effect of potassium on production, quality and nutrient uptake in cotton
(Gossypium hirsutum). Indian Journal of Agricultural Sciences
78:1053-1057.
Raychaudhuri, M., and S.K. Sanyal. 1999. Potassium Release Characteristics
of some soils of West Bengal and Sikkim. Journal of the Indian Society of
Soil Science 47:45-49.
Rego, T.J., K.L. Sahrawat, and J.R. Burford. 1986. Depletion of
soil potassium in an Alfisol under improved rainfed cereal-
legume cropping system in the Indian SAT. Transactions of 13th
International Congress of Soil Science 3:928-929.
Roy K., and V.C. Srivastava. 1996. Effect of Potassium on Potato + wheat
Intercropping system. Journal of Potassium Research 12:169-173.
Roy, H.K. 1987. Soil and fertilizer potassium in relation to crop growth.
Potash Research Institute of India Annual Report 1986-87, Gurgaon,
India.
Roy, H.K., and A.K. Sarkar. 1997. Status, forms and Q/I parameters of
potassium in some major soil series of Chhotanagpur region. Journal of
Potassium Research 131:37-44.
175
Roy, H.K., and A. Kumar. 1993. Quantity/Intensity relations of potassium in
texturally different acid red loam soils. Journal of the Indian Society of
Soil Science 41:356-358.
Roy, H.K., A. Kumar, and A.K. Sarkar. 1989. Critical limits of potassium in
soil and plant and response of wheat in soils of Puto series (Alfisol) of
Ranchi. Journal of Potassium Research 5:157-163.
Roy, H.K., A. Kumar, and A.K. Sarkar. 1991. Response of maize (Zea mays)
to potassium in soils of Umendanda series of Ranchi .Journal of
Potassium Research 7:285-292.
Saha, S.N., and S.K. Sanyal. 1997. Quantity/intensity relations of soil
potassium in four West Bengal soils. Journal of Potassium Research
2:117-122.
Sailakshmiswari, Y., A. Subha Roa, and R.N. Pillai. 1985. An assessment of
potassium release characteristics of some deltaic alluvial soils. Journal of
Potassium Research 1:109-116.
Santhy, P., D. Selvi, M. Dhakshinamoorthy, and P.K. Karthikeyan. 2003.
Effect of continuous application of potassium on crop yields, K uptake
and soil K status in a long-term fertilizer experiment. Journal of
Potassium Research 19:49-54.
Sarmah, A.C., and H.C. Baruah. 1997. Response of summer rice (Oryza
sativa) to potassium application in Barak Valley zone of Assam. Journal
of Potassium Research 13:143-147.
Sehgal, J.L., D.K. Mandal, C. Mandal, and S. Vadivedu. 1992.
Agroecological regions of India. National Bureau of Soil Survey and
Land Use Planning, ICAR, Nagpur, India.
Sehgal, J.L., R.L. Shyampura, S.K. Singh, and K. Das. 1992. Forms of
potassium in relation to geology and physiography of black soils in South
eastern Rajasthan. Journal of Potassium Research 8:200-210.
Sekhon, G.S., and A.B. Ghosh. 1982. Potassium. Review of Soil Research in
India. International Congress on Soil Science, 12th, Part 1. p. 331-341.
Sekhon, G.S., M.S. Brar, and A. Subba Rao. 1992. Potassium in some
benchmark soils of India. Potash Research Institute of India, Gurgaon,
Haryana, India. p. 1-82.
Selvakumari, G. 1981. Studies on the effect of P, K and FYM on soil
properties, nutrition and yield of crops viz. sorghum, pearl millet grown
in a fixed crop rotation. PhD. Thesis, Division of Soil Science and
Agricultural Chemistry, TNAU, Coimbatore.
Shankhayan, S.D., H.R. Sharma, and S.K. Bhrdwaj. 1996. Response of wheat
potassium application in soils of Una and Paonta Valleys of Himachal
Pradesh. Journal of Potassium Research 12:290-297.
176
Sharma, A., V.K. Jalali, V.M. Arya, and P. Rai. 2009. Distribution of various
forms of potassium in soils representing intermediatezone of Jammu
region. Journal of Indian Society of Soil Science 57:205-208
Sharma, B.D., R. Singh, M.S. Brar, and P.S. Sidhu. 1997. Forms of
potassium in typic haplustalfs of Punjab II. Naura soil series. Journal of
Potassium Research 13:195-202.
Sharma, P.S., and S. Ramana. 1993. Response of sorghum to nitrogen and
potassium in an Alfisol. Journal of Potassium Research 9:171-175.
Sharma, R.D., A. Sikander, and S. Ali. 1995. Potssium critical limit and
response to rice and wheat in Khataki soil series of Uttar Pradesh. Journal
of Potassium Research 11:143-153.
Sharma, R.K., and B.N. Swami. 2000. Kinetics of potassium release from
important soil series of western Rajasthan of India. Journal of Potassium
Research 16:20-26.
Sharma, V.K., M. Singh, G.S. Sidhu, S.T. Gaikwad, C.B. Sachdev, and
K.P.C. Rana. 1995. A comparison of conventional estimates with electro-
ultrafiltration measurements of soil potassium in some illitic and smectitic
soils. Journal of Potassium Research 11:15-22.
Sharma, V., and K.N. Sharma. 2001. Distribution of different forms of
potassium in potato growing soils of Punjab. Journal of Potassium
Research 17:112-115.
Sharma, A., V.K. Jalali, V.M. Arya, and P. Rai. 2009. Distribution of various
forms of potassium in soils representing intermediate zone of Jammu
region. Journal of Indian Society of Soil Science 57:205-2007.
Sidhu, G.S., and K.M. Manjaiah. 1999. Quantity-intensity and kinetic
parameters of potassium in relation to K nutrition of crops in four
benchmark soils from sub-tropical north west India. Journal Potassium
Research 15:55-65.
Sidhu, P.S., and M.S. Brar. 1989. Native soil potassium and crop response to
potassium. Potash Research Institute of India Annual Report 1988-89,
Gurgaon, India. p. 30-33.
Singh, B.P., M. Singh, and V.C. Shukla. 1983. Forms of potassium in some
soils of different agroclimatic regions of eastern Haryana. Journal of the
Indian Society of Soil Science 31:31-37.
Singh, B.P., V. Kumar, and M. Singh. 1984. Potassium fixation and release
behaviour in some soil series of Inceptisols of Haryana. Journal of the
Indian Society of Soil Science 32:740-43.
Singh, D., and A.B. Ghosh. 1984. Removal of non-exchangeable potassium
through intensive cropping in greenhouse study with alluvial soils.
Journal of Indian Society of Soil Society 32:303-308.
177
Singh, D., V. Singh, and R. Singh. 1999. Potassium status of soils and
response of rice to applied potassium. Journal of Potassium Research
151:83-87.
Singh, D., V. Singh, and R. Singh. 1999. Response of rice to nitrogen and
potassium levels in alluvial soil. Journal of Potassium Research 151:88-
92.
Singh, G.B., and N.P.S. Yaduvanshi. 1999. Effect of nitrogen and potassium
on germination, yield and nutrients uptake in sugarcane. Journal of
Potassium Research 15:93-102.
Singh, H.R., T.A. Singh, and S. Singh. 1993. Potassium forms in Mollisols of
Nainital Tarai. Joural of Potassium Research 9:8-15.
Singh, J., H.L. Sharma, A. Singh, R. Singh and A. Singh. 1997. Effect of
potassium application on growth and production efficiency of lentil in
different agroclimatic zones of H.P. Journal of Potassium Research
13:68-73.
Singh, K., R.V.S. Malik, and V. Singh. 2001. Distribution of forms of
potassium in alluvial soils. Journal of Potassium Research 17:116-118.
Singh, K., and D. Tripathi. 1993. Different forms of potassium and their
distribution in some representative soil groups of Himachal Pradesh.
Journal of Potassium Research 9:196-205.
Singh, K., S.K. Bansal, and Moinuddin. 2002. Effect of potassium
fertilization on build-up/depletion of NPK in a long-term fodder
sorghum-wheat cropping system on an Inceptisol. Journal of Potassium
Research 18:16-22.
Singh, O.P., and B. Datta. 1986. Forms of potassium in some soils of
Mizoram. Journal of the Indian Society of Soil Science 34:87-190.
Singh, R.N., V.N. Singh, and J.P. Singh. 1993. Response of dwarf wheat to
phosphorus and potassium. Journal of Potassium Research 9:384-387.
Singh, R.S., P.N. Dubey, T.K. Sen, and A.K. Maji. 2006. Distribution of
potassium in soils of Manipur encompassing physiographic and
hydrothermal variations. Journal of Potassium Research 54:197-202.
Singh, S.P., N. Singh, A.L. Das, and J. Ram. 1989. Potassium distribution in
some dominant soils of Chotanagpur region of Bihar. Journal of
Potassium Research 5:53-60.
Singh, S.P., R. Jagar, N. Singh, and D. Sarkar. 1999. Distribution of
potassium in soils of Arunachal Pradesh. Journal of Potassium Research
151:15-24.
Singh, U. Kumar, and S.K. Sanyal. 2000. Potassium and aluminum dynamics
in acidic soils under different rates of lime application. Journal of the
Indian Society of Soil Science 48:64-70.
178
Singh, Y.P., M. Singh, and R. Singh. 1985. Forms of soil potassium in
western part of Haryana. Journal of the Indian Society of Soil Science
33:284-291.
Sinha, M.K. 1985. Response of crops in the recommended and locally
practiced cropping systems in selected soil associations differing in
mineralogy, physical and chemical properties. In: Annual Report PRII,
Gurgaon (Haryana) for the year 1984-85. p. 35-36.
Solankey, B.S., D.A. Shinde, K.S. Yadav, and J. Singh. 1992. Response of
wheat to K application in swell-shrink soils in relation to water-soluble K
contents. Journal of Potassium Research 7:9-19.
Solankey, B.S., D.A. Shinde and A.K. Mahajan. 1991. Potassium status of
Antralia and Panchderia swell-shrink soil series of Madhya Pradesh.
Journal of Potassium Research 7:9-19.
Sonar, K.R., and Y.M. Patil. 1996. Forms of potassium as influenced by
geology and physiography of soils in Maharashtra. Journal of Potassium
Research 12:230-236.
Srinivasarao, Ch., A. Subba Rao, K.V. Rao, B. Venkateswarlu, and
A.K. Singh. 2010. Categorization of Districts Based on Non-
exchangeable Potassium: Implications in Efficient K Fertility
Management in Indian Agriculture. Indian Journal of Fertilizers
6(7):1-15.
Srinavasarao, Ch., and A. Subba Rao. 1999. Impact of farmyard manure and
phosphorus application on soil potassium status and K uptake in a vertisol
under soybean-wheat system. Journal of the Indian Society of Soil
Science 47:176-178.
Srinivasa Rao, Ch., and S.K. Bansal. 2000. Potassium dynamics in calcareous
soils of India. Proceedings of National Seminar on Balanced Nutrition of
groundnut and other field crops grown on calcareous soils of India held at
GAU, Junagadh during 19 to 22nd September 2000. p. 85-98.
Srinivasarai, Ch., M. Ali., A.N. Ganeshamurthy, and R.N. Singh. 2003.
Potassium availability, releasing power and uptake by chickpea and
rajmash in different soil types of pulse growing regions of India. Indian
Journal of Pulses Research 16:128-132.
Srinivasarao, Ch., K.P.R. Vittal, G.R. Chary, P.N. Gajbhiye, and
B. Venkateswarlu. 2006. Characterization of available major nutrients in
dominant soils of rainfed crop production systems of India. Indian Journal
of Dryland Agricultural Research and Development 21:5105-113.
Srinivasarao, Ch., and K.P.R. Vittal. 2007. Emerging nutrient deficiencies in
different soil types in rainfed regions of India. Indian Journal of
Fertilizers 3:37-46.
179
Srinivasarao, Ch., S.C. Datta, and M.S. Khera. 2004. Degradation of illite as
a consequence of potassium depletion under intensive cropping. Indian
Journal of Fertilizers 49(5):11-17.
Srinivasarao, Ch., and G.V. Subbaiah. 1997. Association of some forms of
potassium with soil acidity and mica content in six profiles of laterite
soils. Journal of Potassium Research 13:12-20.
Srinivasarao, Ch. 1994. Crop response to applied potassium in Islamnagar
series in relation to soil K status. National Seminar on “Developments in
Soil Science”. Indian Society of Soil Science. New Delhi. p. 501-502.
Srinivasarao, Ch. 1997. Kinetics of potassium release by exhaustive cropping
from some illitic soils. Journal of Potassium Research 13:227-232.
Srinivasarao, Ch. 2006. Assessing Soil Phosphorus and Potassium Supplying
Power Under Major Rainfed Production Systems of India and Yield
Maximization of Some Dryland Crops by Optimum Nutrient Supply.
Final report of Central Research Institute for Dryland Agriculture
collaborative project. Potash and Phosphate Institute of Canada (India
programme). p. 210.
Srinivasarao, Ch. 2010. Rationalizing potassium fertilizer recommendations
in Indian agriculture. XIV Sukumar Basu Memorial Lecture, Indian
Agricultural Research Institute, New Delhi, Feb 13th, 2010.
Srinivasarao, Ch., and M.S. Khera. 1994. Potassium replenishment capacity
of illitic soils at their minimal exchangeable K in relation to clay
mineralogy. Z. pflanzenernahr Bodenk 157:467-470.
Srinivasarao, Ch., and M.S. Khera. 1994. Effect of exhaustive cropping on
various potassium forms. Journal of Potassium Research 10:109-116.
Srinivasarao, Ch., and M.S. Khera. 1994. Potassium replenishment capacity
of illitic soils at their minimal exchangeable K in relation to clay
mineralogy. Journal of Plant Nutrition and Soil Science 157:467-470.
Srinivasarao, Ch., and M.S. Khera. 1995. Potassium fixation characteristics
and fertilizer K requirements of illitic alluvial soils by two-step alternate
method. Journal of the Indian Society of Soil Science 43:186-191.
Srinivasarao, Ch., and M.S. Khera. 1997. Response to potassium in K-
depleted Ustochrepts in relation to K fixation. Journal of Potassium
Research 12:351-357.
Srinivasarao, Ch., and P.N. Takkar. 1997. Evaluation of different extractants
for measuring the soil potassium and determination of critical levels for
plant available K in smectitic soils for sorghum. Journal of the Indian
Society of Soil Science 45:113-119.
Srinivasarao, Ch., and P.N. Takkar. 1995. Personal communication.
180
Srinivasarao, Ch., and B. Venkateswarlu. 2009. Nutrient ratio and crop
response to potassium in relation to exchangeable and non-exchangeable
potassium in different agroecological regions of India. Proceedings of
Workshop on nutrient ratio and crop response. National Academy of
Agricultural Sciences, May, 2010, New Delhi. p. 45-56.
Srinivasarao, Ch., A. Subba Rao, and P.N. Takkar. 1997. Potassium
availability and release behaviour in earthwork casts and non-ingested
soils. Journal of the Indian Society of Soil Science 45:310-314.
Srinivasarao, Ch., A. Subba Rao, and A.N. Ganeshamurthy. 1995. Status and
desorption kinetics of potassium in some swell-shrink soils. Journal of the
Indian Society of Soil Science 43:356-360.
Srinivasarao, Ch., A. Subba Rao, and S.K. Bansal. 2000. Relationship of
some forms of potassium with neutral normal ammonium acetate
extractable K in minerlogically different benchmark soil series of India
Journal of the Indian Society of Soil Science 48:27-32.
Srinivasarao, Ch., A. Subba Rao, and S.P. Singh. 2000. Extraction of non-
exchangeable potassium from soils with boiling one molar nitric
acid:Evaluation of different modes of boiling the soil-acid suspension.
Communication in Soil Science and Plant Analysis 31:905-911.
Srinivasarao, Ch., A. Swarup, A. Subba Rao, and V. Rajagopal. 1999.
Kinetics of non-exchangeable potassium release from a Tropaquept as
influenced by long-term cropping, fertilization and manuring. Australian
Journal of Soil Research 37:317-328.
Srinivasarao, Ch., A.N. Ganeshamurthy, Masood Ali, R.N. Singh, and
K.K. Singh. 2002. Distribution of forms of potassium in different soil
types of pulse growing regions of India. Journal of Potassium Research
18:23-30.
Srinivasarao, Ch., A. Subba Rao, and T.R. Rupa. 2001. Need for inclusion of
non-exchangeable potassium as a measure in soil test calibration and K
recommendations. Fertilizer News 46(5):31-38.
Srinivasarao, Ch., D.K. Pal, and P.N. Takkar. 1998. Mathematical models to
study the kinetics of potassium release from swell-shrink soils of central
India in relation to their mineralogy. Journal of Plant Nutrition and Soil
Science 161:67-71.
Srinivasarao, Ch., D.K. Pal, A. Subba Rao, and P.N. Takkar. 1996. Potassium
supplying characteristics of some swell-shrink soils from different
elevations of Sanchi area in relation to their mineralogy. Clay Research
15:4-14.
Srinivasarao, Ch., G.V. Subbaiah, and R.N. Pillai. 1991. Nutrient status of
black soils of Telugu Ganga Protect area in Nellore district of A.P. The
Andhra Agricultural Journal 38:201-205.
181
Srinivasarao, Ch., J. Prasad, S.P. Singh, and P.N. Takkar. 1997. Distribution
of forms of potassium and K release kinetics in some Vertisol profiles.
Journal of the Indian Society of Soil Science
45:465-468.
Srinivasarao, Ch., K.P.R. Vittal, B. Venkateswarlu, K.N. Tiwari, G.R. Chary,
and J.V.N.S. Prasad. 2008. Emerging nutrient deficiencies in different
soil types under rainfed production systems of India. Lead paper
presented at National Seminar on Integrated Nutrient management in
rainfed agro-ecosystems held at CRIDA, during March 3-4, 2008,
Hyderabad.
Srinivasarao, Ch., K.P.R. Vittal, B. Venkateswarlu, K.N. Tiwari, G.R. Chary,
and J.V.N.S. Prasad. 2008. Emerging nutrient deficiencies in different
soil types under rainfed production systems of India. Lead paper
presented at National Seminar on Integrated Nutrient management in
rainfed agro-ecosystems held at CRIDA, during March 3-4, 2008,
Hyderabad .
Srinivasarao, Ch., K.P.R. Vittal, K.N. Tiwari, P.N. Gajbhiye, S. Kundu, A.L.
Pharande, Y. Yellamanda Reddy, and M.A. Shankar. 2007. Potassium
supplying characteristics of twenty one soil profiles under diverse rainfed
production systems. Journal of the Indian Society of Soil Science 55:14-
22.
Srinivasarao, Ch., M. Ali, A.N. Ganeshamurthy, R.N Singh, and K.K. Singh.
2004. Sub soil nutrient availability in different soil types of pulse growing
regions of India. Indian Journal of Fertilizers 49:55-59.
Srinivasarao, Ch., M.S. Khera, and A. Subba Rao. 1994. Soil potassium
depletion and K replenishment capacity of soils under intensive cropping.
Journal of Potassium Research 10:229-235.
Srinivasarao, Ch., P.R.K. Prasad, P.N. Takkar, and S.K. Bansal. 1996.
Minerology, Potassium status and K releasing power of some black soils
in Krishna, Godavari delta in A.P Journal of Potassium Research
12(3):245-252
Srinivasarao, Ch., S.P. Datta, A. Subba Rao, S.P. Singh, and P.N. Takkar.
1997. Kinetics of non-exchangeable potassium release by organic acids
from mineralogically different soils. Journal of the Indian Society of Soil
Science 45:728-734.
Srinivasarao, Ch., T.R. Rupa, A. Subba Rao, and S.K. Bansal. 2000.
Potassium fixation characteristics of major benchmark soils of India.
Journal of the Indian Society of Soil Science 48:220-228.
Srinivasarao, Ch., T.R. Rupa, A. Subba Rao, and S.K. Bansal. 2001. Sub soil
potassium availability in twenty-two benchmark soil series of India.
Communication in Soil Science and Plant Analysis 32:863-876.
182
Srinivasarao, Ch., T.R. Rupa, A. Subba Rao, S.P. Singh, and S.K. Bansal.
2006. Kinetics of non-exchangeable potassium release from important
benchmark soils of India: Effects of mineralogy, soil depth and extraction
media. Communications in Soil Science and Plant Analysis 36:1-19.
Srinivasarao, Ch., V.B. Prasad, P.R.K. Prasad, S.K. Bansal, A. Subba Rao,
and P.N. Takkar. 1997. An assessment of potassium reserves and K
desorption in macaceous Alfisols and Inceptisols using conventional
estimates and electroultrafiltration. Journal of Indian Society of Soil
Science 45:44-47.
Srinivasarao, Ch., K.P.R. Vittal, S. Kundu, P.N. Gajbhiye, and
M. Vijayasankarbabu. 2010. Twenty Years of Continuous Cropping,
Fertilization and Organic Manure Application Effects on Forms of
Potassium and Kinetics of Non-exchangeable K Release in the Profile of
an Alfisol Under Arid Conditions. Communications in Soil Science and
Plant Analysis 41(6):783-796.
Srinivasarao, Ch., K.P.R. Vittal, K.N. Tiwar, P.N. Gajbhiye, and S. Kundu.
2007. Categorization of soils based on potassium reserves and production
systems: Implications in K management. Australian Journal of Soil
Research 45:438-447.
Srinivasarao, Ch., A. Subba Rao, A. Swarup, S.K. Bansal, and V. Rajagopal.
2000. Monitoring the changes in soil potassium by extraction procedures
and electroultrafiltraiton (EUF) in a Tropaquept under twenty years of
rice-rice cropping. Nutrient Cycling in Agro-ecosystems 56:277-282.
Srinivasarao, Ch., and A. Subba Rao. 2000. Minimal exchangeable potassium
status of fifteen smectitic soils in relation to soil mineralogy and K
uptake. Communications in Soil Science and Plant Analysis
31(7&8):913-921.
Srinivasarao, Ch. 2010. Analysing nitrogen use efficiency in relation to
potassium in long-term manurial trials in dryland agriculture. IPI-FAI
Round Table Discussion on “Analyzing Nutrient Use Efficiency in
Relation to Potassium” Fertilizer Association of India, New Delhi 9-6-
2010, New Delhi.
Srivastava, A.K., and O.P. Srivastava. 1992. Distribution of various forms of
potassium in salt affected soils and changes after reclamation. Journal of
Potassium Research 8:31-37.
Subba Rao, A., and Ch. Srinivasarao. 1996. Potassium status and crop
response to potassium on the soils of Agroecological regions of India. IPI
Research Topics No.20. International Potash Institute, Basel, Switzerland.
p. 57.
Subba Rao, A. 1993. Analysis of soils for major nutrients. In: Methods of
Analysis of Soils, Plants, Waters and Fertilizers Ed. HLS Tandon, FDCO,
New Delhi. p. 143.
183
Subba Rao, A., and K.S. Reddy. 2005. Analysis of soils for pH, EC and
available major nutrient. In: H.L.S. Tandon (ed.). Methods of analysis of
soils, plant, waters, fertilizers and organic manures. Fertilizer
Development and Consultant Organization, New Delhi, India: 21-59.
Subba Rao, A., M.V.R. Sesha Sai, and S.K. Pal. 1993. Non-exchangeable
potassium reserves and thier categorization in some soils of India. Journal
of the Indian Society of Soil Science 41:667-673.
Subba Rao, A., T.R. Rupa, and S. Srivastava. 2001. Assessing potassium
availability in Indian Soils. In: N.S. Pasricha and S.K. Banasal (ed.)
Potassium in Indian Agriculture, special publication: Potash Research
Institute of India, Gurgaon, Haryana: 125-157.
Subba Rao, I.V., J. Venkateswarlu, V. Seetharamana Rao, A. Srinivasa Raju,
and N. Mukhlis. 1976. Potassium fertilization in Pochampad project area.
Potassium in Soils, Crop and Fertilizers. Indian Society of Soil Science,
Bulletin No. 10, New Delhi. p. 195-199.
Subbaiah, G.V., G. Venkateswar Rao, and Ch. Srinivasarao. 1994. Profile
distribution of macro- and micro-nutrients in some lateritic soils. The
Andhra Agricultural Journal Communicated.
Subramaneyeswara Rao, A., and V. Rajagopal. 1981. The Andhra
Agriculture Journal 28:200.
Sud, K.C., and R.C. Sharma. 2002. Role of potassium in potato nutrition
under rainfed agriculture in state of Himachal Pradesh, Journal Potassium
Research 18:79-83.
Surekha, K., and I.V. Subba Rao. 1997. Differential Response of Maize to
Potassium in Vertisols. Journal of Potassium Research 13:261-265.
Surekha, K., I.V. Subba Rao, A. Prasad Rao, and V. Adinarayana. 1996.
Long-term potassium releasing power of Vertisols of Andhra Pradesh.
Journal Potassium Research 12:345-350.
Sutar, V.S., J.H. Dongale, and A.S. Chavan. 1992. Forms of potassium and
evaluation of soil K test methods along with critical limits of K in lateritic
soils. Journal Potassium Research 8:187-199.
Swarup, A., and Ch. Srinivasa Rao. 1999. Current status of crop responses to
nutrients. Experiences from All India Coordinated Research Project on
Long-Term Fertilizer Experiments. Fertilizer News 44(4):27-43.
Talele, P.E., G.K. Zende, Y.M. Patil, K.R. Sonar, and B.D. Tamboli. 1993.
Effect of added K and incubation time on transformation of available K
and non-exchangeable K in different soils of Maharastra. Journal of the
Indian Society of Soil Science 41:238-242.
Tamuli, A., and T.C. Baruah. 2000. Effect of lime sludge on Q/I parameters
of potassium in some soils of upper Brahmaputra Valley Zone of Assam.
Journal of Potassium Research 16:62-64.
184
Thampatti, M.K.C., and A.I. Jose. 1999. Vertical distribution and dynamics
of potassium in acid sulphate rice soils of south India. Journal of
Potassium Research 15:39-47.
Tiwari, A., K.N. Tiwari, and A.N. Pathak. 1988. Evaluation of some soil test
methods for potassium and assessment of critical limits for wheat under
greenhouse conditions. Journal of Potassium Research 4:110-121.
Tiwari, A., K.N. Tiwari, and S.G. Mishra. 1999. Comparison of soil test
methods and potassium critical limits for rice in Udic ustochrepts of
Kanpur: Uttari series. Journal of Potassium Research 15:75-82.
Tiwari, A., S.G. Mishra, and R. Tiwari. 1996. Calibration of soil test methods
and assessment of critical limits of potassium and soils and plants of
chickpea. Journal of the Indian Society of Soil Science 43:408-413.
Tiwari, A.K., and K.N. Bansal. 1992. Vertical distribution of forms of
potassium in some soil series of northern Madhya Pradesh. Journal of
Potassium Research 8:223-230.
Tiwari, K.N. 1985. Changes in potassium status of alluvial soils under
intensive cropping. Fertilizer News 30:17-23.
Tiwari, K.N., and G. Dev. 1987. Potassium availability in soils growing
wheat. Potash Research Institute of India, Gurgaon, India, Research
Review Series 4:29-44.
Tiwari, R.C., U.N. Verma, and A.K. Mishra. 1995. Effect of long-term
cropping systems on chemical characteristics of soil profiles. Journal of
the Indian Society of Soil Science 43:278-279.
Tomar, R.A.S., R.S. Verma, P.S. Tomar, and K.N. Bansal. 1997. Vertical
distribution of forms of potassium in some normal and salt affected soil
series of grid region of Madhya Pradesh. Journal of Potassium Research
13:203-208.
Tomar, R.S., M.V. Kanzaria, and V.K. Jain. 2001. Response of chickpea to
potassium in a calcareous soil. Journal of Potassium Research 17:98-100.
Varavipour, M. 1993. The response of fodder maize (Zea mays L.) to
potassium and sulphur in two selected soil series of south India. MSc.
Thesis submitted to the University of Agricultural Sciences, Bangalore.
Veeranna, V.S., S. Panchaksharaiah, T.S. Vageesh, R.A. Shetty, and
K.M.S. Sharma. 1996. Potassium application for sustained productivity of
sorghum -wheat sequence under long-term fertilizer management Journal
of Potassium Research 12:39-47.
Venkatasubbaiah, V., A. Sreenivasaraju., M.B. Rao, T.P. Geoffrey, L.
Nageswara Rao, and B.R. Bhaskara Rao. 1991. Paper presented in
seminar on potassium held in Nov. 91 at Hyderabad.
185
Venkatasubbaiah, V., J. Venkateswarlu, and V.V.K. Sastry. 1976. Potssium
supplying power of black soils of West Godavari, Andhra Pradesh.
Potassium in Soils, Crops and Fertilizers, Indian Society of Soil Science,
Bulletin No. 10, New Delhi, 219-226.
Venkatesh, M.S., and T. Satyanarayana. 1994. Status and distribution of
potassium in vertisols of north Karnataka. Journal of the Indian Society of
Soil Science 42:239-233.
Vijayabhaskar, M. 1997. Nature, distribution and availability of potassiumin
in benchmark soils of Andhra Pradesh. MSc. Thesis, Department of Soil
Science and Agricultural Chemistry, Andhra Pradesh Agricultural
University, Rajendranagar, Hyderabad.
Wani, M., and R. Kumar. 2008. Distribution of potassium and clay minerals
assemblage in some paddy soils of Lesser Himalyas. Agropedology
18:98-105.
Wani, M.A. 2009. Kinetics of non-exchangeable potassium release from soil
soils and their separates of lessor Himalayas of India. Journal of Indian
Society of Soil Science 57:137-144.
Wani, M.A., and S.C. Datta. 2007. Non-exchangeable potassium release of
H+ saturated resin and its diffusion characteristics in some soils of lessor
Himalayas. Soil Science 172:546-552.
Yadav, B.S., and B.N. Swami. 1987. Studies on potassium in some red soils
Haplustalfs of southern Rajasthan. Journal of Potassium Research 3:1-9.
Yadav, B.S., and B.N. Swami. 1984. Critical limits of soil potssium for maize
crop in red soils (Haplustalfs) of Dungarpur district of Rajasthan.
Proceedings of International Symposium on Soil Test Crop Response
Correlation Studies, Dhaka, Bangladesh. p. 84-96.
Yadav, D.S., A. Kumar, and V.K. Singh. 1993. Response of different of
crops to potassium on cultivators’ fields in UP under irrigated and rainfed
conditions. Journal of Potassium Research 9:253-261.
Yaduvanshi, N.P.S., and A. Swarup. 2006. Effect of long-term fertilization
and manuring on potassium balance and non-exchangeable K release in a
reclaimed sodic soil. Journal of Potassium Research
54:203-207.
Yaduvanshi, N.P.S., and G.B. Singh. 1999. Effects of nitrogen and potassium
on germination, yield and nutrients uptake in sugarcane. Journal of
Potassium Research 15:93-102.

IPI Research Topics No. 20
Potassium Status andCrop Response to Potassiumon the Soils of AgroecologicalRegions of India
2nd revised edition
2011
INTERNATIONALPOTASH INSTITUTE
Copyright © 2022 FDOKUMEN


![S2-22-367-2001] BETWEEN REPCO (MALAYSIA) SDN BHD](https://static.fdokumen.com/doc/165x107/63157415c72bc2f2dd04b62d/s2-22-367-2001-between-repco-malaysia-sdn-bhd.jpg)