Revisiting the recurrence risk of nonsyndromic cleft lip with or without cleft palate
Upload
khangminh22Category
view
7download
0
r, lz
dtictl of"OR
te d 'Lip- -5
intemat onal Potash Ins itu 97
Fertilizer Use and Production of Carbohydrates and Lipids
Fertilizer Use andProduction ofCarbohydrates and Lipids
Proceedings of the 13th Colloquium of the International Potash Institute held inYork/United Kingdom 1977
Contents
Page
Opening and Session 1
Cooke, G. W. Fertilisers, carbohydrates and lipids - Anintroduction to the Colloquium II
Carter, E. S. Research and development for UnitedKingdom agriculture 25
Bracco, U., Wenner, V. A review of sources of carbohydrates andand Wfirsch, P. lipids used as food for man and animals:
prospects for improvement 43
Session 2 Biochemical and Physiological Aspectsof the Production of CarbohydratesUsed as Food for Man and Animals:Prospects for Improvement
Mengel, K. Energy absorption, energy conversion, andenergy storage of crops in relation to endog-enous and exogenous factors 61
Barber, J. Energy conversion and ion fluxes in chloro-plasts 83
Pfliiger, R. and Cassier, Angelika Influence of monovalent cations on photo-synthetic CO, fixation 95
Marschner, H. and Ddring, H. W. Effect of K+ and Na+ on ADPG-Starchsynthetase 101
Haeder, H. E. Effects of potassium on phloem loadingand transport 115
5
Beringer, H. Effects of temperature on the synthesis ofessential fatty acids and vitamin E in oilcrops 123
Bach, R. Co-ordinator's Report on the 2nd Session 135
Session 3 The Needs of Humans and Animals forCarbohydrates and Lipids
Klatzmann, J. Present ideas and evidence on the amountsof energy that are regarded as essential forpeople when setting nutritional standards 141
Crawford, M.A. Are certain lipids and phospholipids essen-tial for man and animals? 149
Sohns, J. Sensory qualities of carbohydrates and lipids 157
Cooke, G. W. Co-ordinator's Report on the 3rd Session 169
Session 4 Effects of Fertilizers on theProduction of Carbohydrates
Mercier, Christiane, The effects of production conditions andAunaitre, A. and Thivend, P. post-harvest treatments of plants on the
composition and nutritive value of carbo-hydrates in animal feeding 175
Ezeilo, W. N. 0. The effect of fertilizers and other inputs onyield and nutritive value of cassava andother tropical root crops 193
KOchI, A. The effects of nitrogen and potassiumnutrition on yield and quality of sugar beet 209
Benvenuti, A. and Miele, S. The effect of potash fertilizer on sugar beetyield: comparison of solid and fluid fertilizer 221
Miltcheva, Milka Effect of potassium fertilizer on yield andquality of sugar beet 227
Evans, S.A. The place of fertilizers in 'Blueprints' forthe production of potatoes and cereals 231
Stewart, B.A. The effects of fertilizers and other agricul-tural inputs on quality criteria of wheatneeded for milling and baking 243
Walsh, Th. Co-ordinator's Report on the 4th Session 251
6
Session 5 Effects of Fertilizers on the Production of Lipids
Appelqvist, L... Relationship between the use of fertilizersand the production of lipids 257
Ochs, R. and Ollagnier, M. The effect of fertilizers on the yield andcomposition of lipids in some tropical crops 269
Klein, I. and Lavee, S. The effect of nitrogen and potassium fertil-izers on olive production 295
Forster, H. Influence of N and K fertilizers on thequality and yield of oil from old and newvarieties of rapeseed (Brassica napus, ssp.oleifera) 305
Davidescu, D., Cri~an, I., Relationship between environmental con-Davidescu, Velicica and Borza, J. ditions and oil content in sunflower and
soyabean 311
Chevalier, H. The response of soyabean to potassiumfertilizer 329
Arnon, I. Co-ordinator's Report on the 5th Session 335
Session 6 General Discussion
Gasser, J. K. R. The efficiency of energy used in the produc-tion of carbohydrates and lipids 341
Cooke, G. W. Conclusions from the Colloquium 353
7

Chairman of the ColloquiumDr. G. W. Cooke C.B.E., Ph.D., F.R.I.C., F.R.S., Chief Scientific
Officer, Agricultural Research Council, London]United Kingdom; Member of the ScientificBoard of the International Potash Institute

Fertilisers, Carbohydrates and Lipids -
An Introduction to the Colloquium
G. W.Cooke, C.B.E., Ph.D., F.R.I.C., F.R.S.,*Chief Scientific Officer, Agricultural Research Council, London/United Kingdom; Member ofthe Scientific Board of the International Potash Institute
Summary
The purpose of the Colloquium is to relate fertiliser use to carbohydrate and lipid productionand to indicate the needs for future research and development.Cereals occupy 70% of the World's arable land and provide more than half of the energyfoods. Fats and oils provide 9%, root crops 7% and livestock products 11% of the caloriesavailable. Nearly a third of all the lipids are from animals; the other important single sourceis soyabean oil, giving 17% of the total. Differences in the diets of people in developing anddeveloped countries are discussed in relation to agricultural, social and economic conditions.In developing countries there are less total calories available, much less animal protein andfat is eaten than in developed countries. The composition of the average British diet is describedin relation to current debates on the effects of total calories, the nature of the fats and thefibre eaten, on health. Fertiliser use is related to food production in different systems. Indeveloping countries with relatively sparse populations improved nutrition depends first onrelieving ill-health, poverty and ignorance; fertilisers will have a later part to play in develop-ment. In densely populated countries and in developed countries with intensive agriculturalsystems fertilisers are essential to produce sufficient food and to make production economic.In affluent countries the forms of production are settled by the kinds of food desired and bythe requirements of modern packaging and processing industries producing 'convenience'foods. Fertilisers influence quantity and quality of produce and are essential to maximiseyield and maintain soil fertility in these systems. Similar factors affect the use of fertilisersin the tropics to produce carbohydrate and oilseed crops for sale. Intensive animal productionin temperate countries depends on high-quality forages for ruminants and on concentratedfeeds based on cereals and protein for other stock. Fertilisers have a vital role in producingsufficient of these foods cheaply. Many developing countries have large livestock populationswhich now produce little milk and meat. Work now being done to improve the health andnutrition of this stock will increase output of animal lipids and protein in future.Modern agricultural systems require much fossil fuel to provide fertilisers and power, aproblem discussed at the end of the Colloquium.
1. Introduction
In the Colloquium held in 1975 on the island of Bornholm/DK we discussed the effects
of fertilisers on protein production. This meeting in the ancient city of York deals with
* Dr. G. W. Cooke, Agricultural Research Council, 160 Great Portland Street, LondonWIN 6DT/United Kingdom
I1
the effects of crop nutrition on the other two components of our diet - carbohydratesand lipids. The amounts of these foods produced, whether derived directly from plants,or indirectly from plants fed to animals, depend on the nutrients available to the cropsgrown. This is clear enough in the developed countries where present high productionis totally dependent on the extra nutrients that fertilisers provide. In developingcountries with large populations and limited land, strenuous efforts are being made toprovide fertilisers and to show farmers how to use them efficiently. In other developingcountries with more land suitable for agriculture, acute starvation for whole popula-tions is not so serious a risk but many of the people suffer from malnutrition and morefood of better quality is needed. Better living for these people will only be achievedby alleviating poverty and by educational programmes which show how to produceand use a better diet. In these countries too, fertilisers will have an essential role in thedevelopments needed to grow larger yields of more nutritious crops.
2. Sources of the World's energy foods
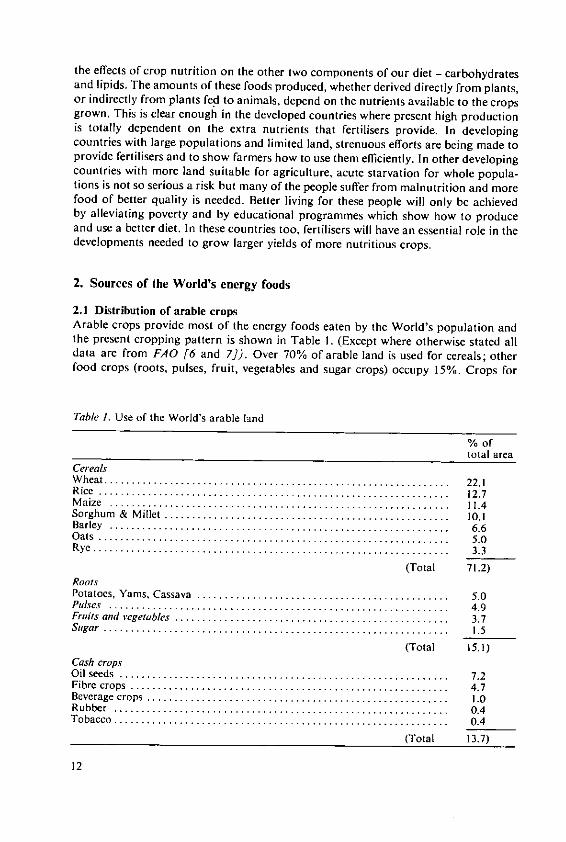
2.1 Distribution of arable cropsArable crops provide most of the energy foods eaten by the World's population andthe present cropping pattern is shown in Table I. (Except where otherwise stated alldata are from FAO [6 and 7]). Over 70% of arable land is used for cereals; otherfood crops (roots, pulses, fruit, vegetables and sugar crops) occupy 15%. Crops for
Table I. Use of the World's arable land
% oftotal area
CerealsW heat ............................................................... 22.1R ice ................................................................ 12.7M a ize .............................................................. 11.4Sorghum & M illet ............................... ..................... 1.IBarley .............................................................. 6 .6O ats ................................................................ 5.0R y e .. .. .. ... .. .. .. .. .. .. .. . . . .. .. .. ... .. . .. ... .. .. .. ... .. .. .. .. .. . .. 3 .3
(Total 71.2)RootsPotatoes, Yam s, Cassava .............................................. 5.0P ulses ....................... ....................................... 4 .9Fruits and vegetables .................................................. 3.7S ugar ............................................................... 1.5
(Total 15.1)Cash cropsO il seed s ............................................................ 7.2Fibre crops .......................................................... 4.7Beverage crops ....................................................... 1.0R ubber ............................................................. 0.4T obacco ............................................................. 0.4
(Total 13.7)
12
sale, which are of vital importance to many developing countries, include oil seeds,fibres, beverages, rubber and tobacco; these occupy nearly 14% of the arable land.
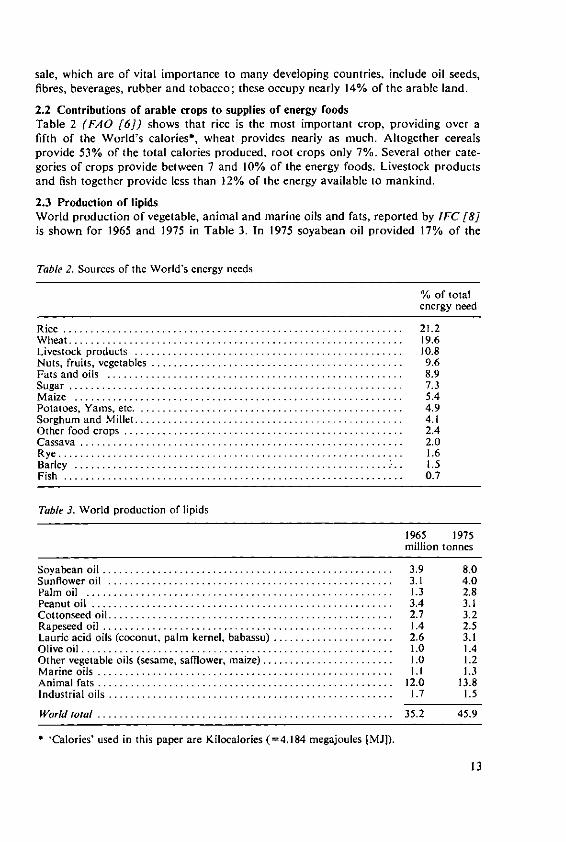
2.2 Contributions of arable crops to supplies of energy foodsTable 2 (FAO [6]) shows that rice is the most important crop, providing over afifth of the World's calories*, wheat provides nearly as much. Altogether cerealsprovide 53% of the total calories produced, root crops only 7%. Several other cate-gories of crops provide between 7 and 10% of the energy foods. Livestock productsand fish together provide less than 12% of the energy available to mankind.
2.3 Production of lipidsWorld production of vegetable, animal and marine oils and fats, reported by IFC [8is shown for 1965 and 1975 in Table 3. In 1975 soyabean oil provided 17% of the
Table 2. Sources of the World's energy needs
% of totalenergy need
R ice .............................................................. 2 1.2W heat ............................................................. 19.6Livestock products ................................................. 10.8N uts, fruits, vegetables .............................................. 9.6Fats and oils ...................................................... 8.9S ugar ............................................................. 7.3M a ize ............................................................ 5.4Potatoes, Y am s, etc . ................................................ 4.9Sorghum and M illet .............................................. 4.1O ther food crops ................................................... 2.4C assava ........................................................... 2.0R ye ............................................................... 1.6B arley ......................................................... . 1.5F ish .............................................................. 0 .7
Table 3. World production of lipids
1965 1975million tonnes
Soyabean oil ..................................................... 3.9 8.0Sunflower oil .................................................... 3.1 4.0Palm oil ........................................................ 1.3 2.8Peanut oil ....................................................... 3.4 3.1Cottonseed oil .................................................... 2.7 3.2R apeseed oil ..................................................... 1.4 2.5Lauric acid oils (coconut, palm kernel, babassu) ...................... 2.6 3.1Olive oil ........ ............................................ 1.0 1.4Other vegetable oils (sesame, safflower, maize) ................... ..... 1.0 1.2M arine oils ................... .................................. l.1 1.3A nim al fats ...................................................... 12.0 13.8Industrial oils .................................................... 1.7 1.5
W orld total ...................................................... 35.2 45.9
* 'Calories' used in this paper are Kilocalories (=4.184 megajoules jMJJ).
13
World's total supply of lipids; production in U.S.A. alone of this commodity wasresponsible for 5.6 million tonnes, or 12% of the World's supply. Brazil's productionwas important too, providing 19% of the total supply of soyabean oil. Only animalfats (13.8 million tonnes, or 30% of the World total) exceeded the quantity of lipidprovided by soyabean. The U.S.A. produced 23% of all the fats that were recorded inthis survey.Later in this session Dr. Wenner and his colleagues will review sources of carbohydratesand lipids in more detail and will discuss future potential.
3. How energy foods are now used
Plans for agricultural development, and our assessment of the inputs needed, dependon the targets set for production. The difficult questions of the present distribution offood, the extra amounts now needed for underfed people, and the increases needed tokeep pace with expanding populations have been discussed at international conferences.I shall not go over the topic again; but I will remind you that it is generally agreedthat one-tenth of the World's population now has too little food for good health andsatisfactory growth of young people and for adequate intellectual and physical per-formance by adults.
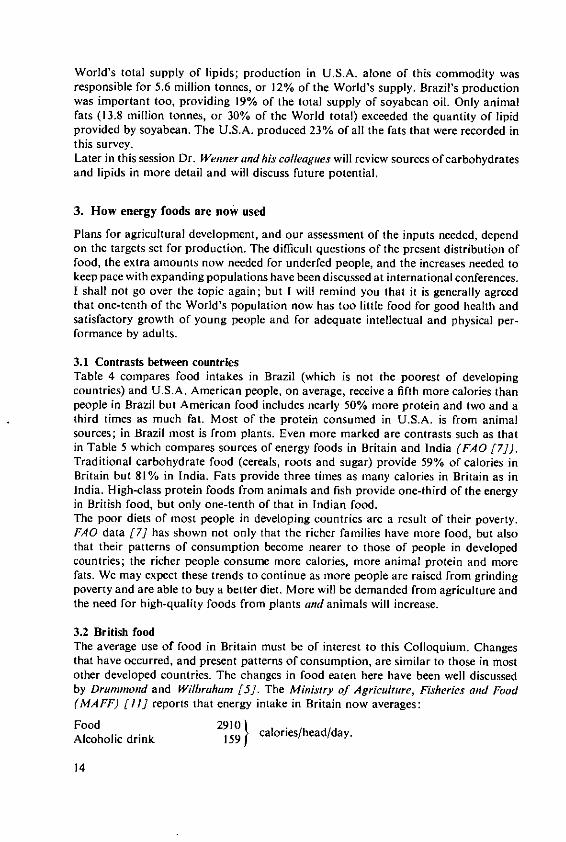
3.1 Contrasts between countriesTable 4 compares food intakes in Brazil (which is not the poorest of developingcountries) and U.S.A. American people, on average, receive a fifth more calories thanpeople in Brazil but American food includes nearly 50% more protein and two and athird times as much fat. Most of the protein consumed in U.S.A. is from animalsources; in Brazil most is from plants. Even more marked are contrasts such as thatin Table 5 which compares sources of energy foods in Britain and India (FAO [7]).Traditional carbohydrate food (cereals, roots and sugar) provide 59% of calories inBritain but 81% in India. Fats provide three times as many calories in Britain as inIndia. High-class protein foods from animals and fish provide one-third of the energyin British food, but only one-tenth of that in Indian food.The poor diets of most people in developing countries are a result of their poverty.FAO data [7] has shown not only that the richer families have more food, but alsothat their patterns of consumption become nearer to those of people in developedcountries; the richer people consume more calories, more animal protein and morefats. We may expect these trends to continue as more people are raised from grindingpoverty and are able to buy a better diet. More will be demanded from agriculture andthe need for high-quality foods from plants and animals will increase.
3.2 British foodThe average use of food in Britain must be of interest to this Colloquium. Changesthat have occurred, and present patterns of consumption, are similar to those in mostother developed countries. The changes in food eaten here have been well discussedby Drummond and Wilbraham [5]. The Ministry of Agriculture, Fisheries and Food(MAFF) [U/] reports that energy intake in Britain now averages:
Food 2910 IAlcoholic drink 159 calories/head/day.
14
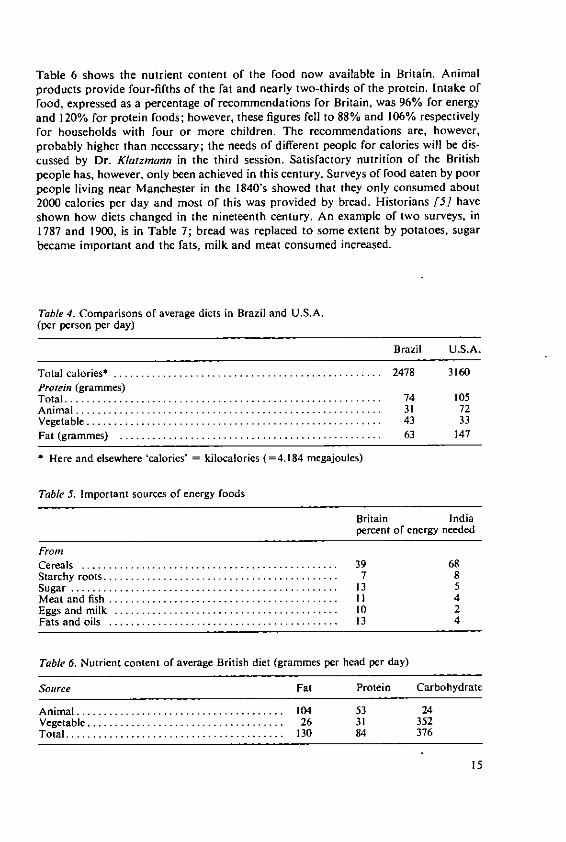
Table 6 shows the nutrient content of the food now available in Britain. Animalproducts provide four-fifths of the fat and nearly two-thirds of the protein. Intake offood, expressed as a percentage of recommendations for Britain, was 96% for energyand 120% for protein foods; however, these figures fell to 88% and 106% respectivelyfor households with four or more children. The recommendations are, however,probably higher than necessary; the needs of different people for calories will be dis-cussed by Dr. Klatzmann in the third session. Satisfactory nutrition of the Britishpeople has, however, only been achieved in this century. Surveys of food eaten by poorpeople living near Manchester in the 1840's showed that they only consumed about2000 calories per day and most of this was provided by bread. Historians [5 haveshown how diets changed in the nineteenth century. An example of two surveys, in1787 and 1900, is in Table 7; bread was replaced to some extent by potatoes, sugarbecame important and the fats, milk and meat consumed increased.
Table 4. Comparisons of average diets in Brazil and U.S.A.
(per person per day)
Brazil U.S.A.
Total calories* ................................................. 2478 3160Protein (grammes)T otal .......................................................... 74 105A nim al ........................................................ 31 72V egetable ...................................................... 43 33Fat (gram m es) ................................................ 63 147
* Here and elsewhere 'calories' = kilocalories (=4.184 megajoules)
Table 5. Important sources of energy foods
Britain Indiapercent of energy needed
FromC ereals ............................................... 39 68Starchy roots ........................................... 7 8Sugar ................................................. 13 5M eat and fish .......................................... 11 4Eggs and m ilk ......................................... 10 2Fats and oils .......................................... 13 4
Table 6. Nutrient content of average British diet (grammes per head per day)
Source Fat Protein Carbohydrate
A nim al ...................................... 104 53 24Vegetable .................................... 26 31 352Total ........................................ 130 84 376
15
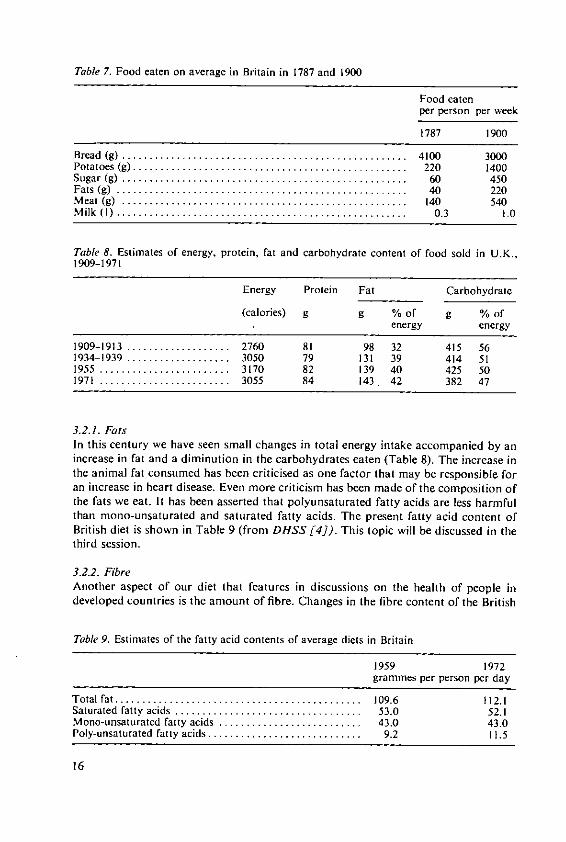
Table 7. Food eaten on average in Britain in 1787 and 1900
Food eatenper person per week
1787 1900
Bread (g) ...... .............................................. 4100 3000Potatoes (g) .............. .. ............................... . 220 1400Sugar (g) .................................................... 60 450Fats (g) ..................................................... 40 220M eat (g) .................................................... 140 540M ilk (I) ..................................................... 0.3 1.0
Table 8. Estimates of energy, protein, fat and carbohydrate content of food sold in U.K.,
1909-1971
Energy Protein Fat Carbohydrate
(calories) g g % of g % ofenergy energy
1909-1913 ................... 2760 81 98 32 415 561934-1939 ................... 3050 79 131 39 414 511955 ........................ 3170 82 139 40 425 501971 ........................ 3055 84 143. 42 382 47
3.2.1. FatsIn this century we have seen small changes in total energy intake accompanied by anincrease in fat and a diminution in the carbohydrates eaten (Table 8). The increase inthe animal fat consumed has been criticised as one factor that may be responsible foran increase in heart disease. Even more criticism has been made of the composition ofthe fats we eat. It has been asserted that polyunsaturated fatty acids are less harmfulthan mono-unsaturated and saturated fatty acids. The present fatty acid content ofBritish diet is shown in Table 9 (from DHSS [4]). This topic will be discussed in thethird session.
3.2.2. FibreAnother aspect of our diet that features in discussions on the health of people indeveloped countries is the amount of fibre. Changes in the fibre content of the British
Table 9. Estimates of the fatty acid contents of average diets in Britain
1959 1972grammes per person per day
Total fat .................... ......... 109.6 112.1Saturated fatty acids .................................. 53.0 52.1Mono-unsaturated fatty acids .......................... 43.0 43.0Poly-unsaturated fatty acids ............................ 9.2 11.5
16
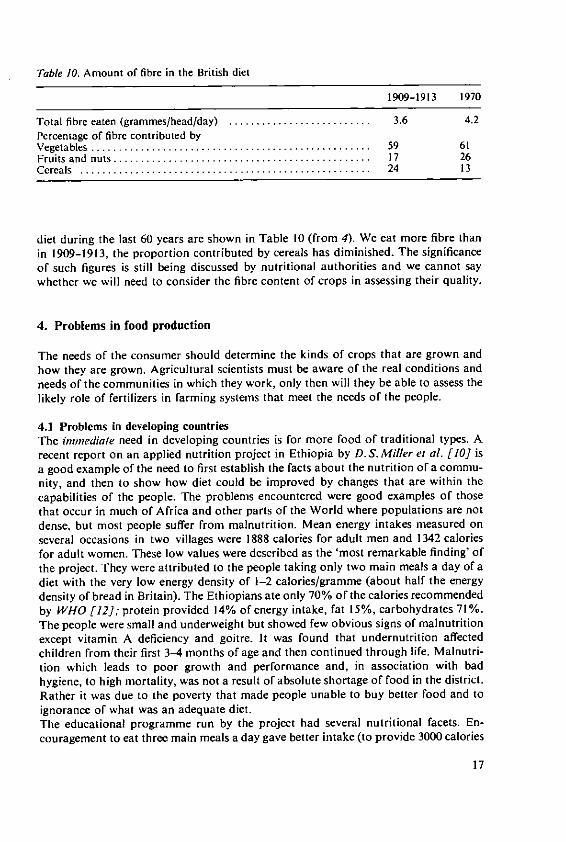
Table 10. Amount of fibre in the British diet
1909-1913 1970
Total fibre eaten (grammes/head/day) .......................... 3.6 4.2Percentage of fibre contributed byV egetables ................................................... 59 61Fruits and nuts ............................................... 17 26Cereals .................................................... 24 13
diet during the last 60 years are shown in Table 10 (from 4). We eat more fibre thanin 1909-1913, the proportion contributed by cereals has diminished. The significanceof such figures is still being discussed by nutritional authorities and we cannot saywhether we will need to consider the fibre content of crops in assessing their quality.
4. Problems in food production
The needs of the consumer should determine the kinds of crops that are grown andhow they are grown. Agricultural scientists must be aware of the real conditions andneeds of the communities in which they work, only then will they be able to assess thelikely role of fertilizers in farming systems that meet the needs of the people.
4.1 Problems in developing countriesThe immediate need in developing countries is for more food of traditional types. Arecent report on an applied nutrition project in Ethiopia by D.S.Miller el al. [10] isa good example of the need to first establish the facts about the nutrition of a commu-nity, and then to show how diet could be improved by changes that are within thecapabilities of the people. The problems encountered were good examples of thosethat occur in much of Africa and other parts of the World where populations are notdense, but most people suffer from malnutrition. Mean energy intakes measured onseveral occasions in two villages were 1888 calories for adult men and 1342 caloriesfor adult women. These low values were described as the 'most remarkable finding' ofthe project. They were attributed to the people taking only two main meals a day of adiet with the very low energy density of 1-2 calories/gramme (about half the energydensity of bread in Britain). The Ethiopians ate only 70% of the calories recommendedby WHO [12]; protein provided 14% of energy intake, fat 15%, carbohydrates 71%.The people were small and underweight but showed few obvious signs of malnutritionexcept vitamin A deficiency and goitre. It was found that undernutrition affectedchildren from their first 3-4 months of age and then continued through life. Malnutri-tion which leads to poor growth and performance and, in association with badhygiene, to high mortality, was not a result of absolute shortage of food in the district.Rather it was due to the poverty that made people unable to buy better food and toignorance of what was an adequate diet.The educational programme run by the project had several nutritional facets. En-couragement to eat three main meals a day gave better intake (to provide 3000 calories
17
a day of the low energy diet, 1 kg was needed at each of the two main meals!). Vege-table growing was promoted and succeeded in eliminating vitamin A deficiency.Encouragement to improve the local poultry gave more high-class protein. Peoplewere encouraged to vary their diet. These simple proposals were accepted by a pro-portion of the people and in a short time improved the growth of young children.This project has been discussed in details because it shows that in many areas of thedeveloping world the community is not yet ready to make use of sophisticated agri-cultural techniques or to reap the benefits that fertilisers could undoubtedly give. Theyneed first advice and example to improve hygiene and diet and help to make better useof the resources they have, and to apply new techniques that are within their means.More intensive agricultural systems, needing fertilizers to support them, will be neededat a later stage in development when mortality rates fall and populations increase.
4.2 Problems in intensive agricultureThe developed countries have one characteristic in common with developing countrieswith large populations and little land. Both need large output per unit area. In thedeveloped world this is to give an adequate return on the investment in intensivemechanised farming; in the developing world high output is essential to feed the localpopulation. Both kinds of communities must use modern aids to high production ofwhich the most common are new varieties of crops which have been bred to make themaximum use of the local environment and to respond well to fertilizers.In the developed countries the common form of malnutrition is eating too much! Dowe really need more than an average intake of 2200 calories per day? That this amountcould be supplied by 675 grammes of sugar or by 225 grammes of animal fat remindsus that we do not know the best balance for health between carbohydrates and lipids.Currently a finger is pointed accusingly at animal fats; this is seen as a threat by ourfarmers who produce beef, milk, mutton and pig products. Should we produce moreoil seeds of suitable types and less meat? The answers to these questions will affectfuture agricultural policy.More urgent are problems raised by the packaging and processing industries whichnow handle so much of farm produce in developed countries. In the last 25 yearspackaged 'convenience foods', largely based on traditional materials, have come todominate domestic purchases. Now, increasingly, new materials are introduced inprocessing; the best example is the replacement of expensive meat by cheaper vegetableprotein. If such novel foods are to be well accepted they have to be camouflaged toimitate traditional foods in structure and flavour. Undoubtedly these trends willcontinue and farmers will be asked to produce products with physical and chemicalproperties that aid processing. An example is Mr. Stewart's paper in the fourth sessionwhich discusses the agricultural inputs needed to secure wheat with properties thatsuit modern milling and baking processes. The effects of fertilisers on the quality ofbeet for sugar extraction will be discussed in the same session. We still need to knowmuch more about the physical structure of food materials and the chemical basis offlavour. For this reason we are to have Professor Sohn's paper in the third session onthe organoleptic qualities of energy foods.The changing needs of food manufacturers, and advances in our knowledge of nutri-tion for health, will make new demands on the types of crops we grow, and on culturalconditions. For example production of oil-seed rape is now being expanded in thisand other countries; we require seed containing little erucic acid and glucinolates - a
18
topic discussed in relation to fertilizer use in the fifth session. Other papers in thissession deal with effects of fertilizers on the oil content of olives and sunflower seed.When we attempt to survey these subjects we find good information about the effectsof fertilizers on amount and quality of protein but much less information from fieldexperiments'about the effects of fertilizers on carbohydrate composition, or on amountand type of lipid in many of the crops we grow. The requirements of industry and ofconsumer for certain qualities in food often conflict with the farmer's desire to growlarge yields. If yield has to be restricted to secure certain qualities in produce, thepurchaser must expect to pay more for the crop. Otherwise farmers should aim tomaximise their yields so that the effects of overhead and production costs on cost ofunit produce are least. There is great interest in Britain in seeking ways of obtainingaverage yields that are much nearer to the known potentials of our crops. 'Blueprints'are being devised to aid farmers in applying all our scientific information on cropproduction and Mr. Stanley Evans' paper in the fourth session is an important exampleof this approach.
4.3 Intensive agriculture in the tropicsWhere fertilisers are used to establish intensive farming systems in the tropics, theproblems to be faced will become similar to those which we are trying to solve intemperate countries. We have two main papers which deal with the effects of fertilizerson yield and quality of tropical crops. That in the fifth session by Drs. Ochs andOllagnier deals with lipid production which is well established in plantations run onmodern intensive lines and where fertilizers are accepted inputs. Dr. Ezeilo's paper inthe fourth session deals with carbohydrate crops which are not yet grown on a largescale for sale. He concentrates on cassava which is almost a pure carbohydrate crop,containing little protein. Althouth it is currently a survival crop of the small subsistencefarmer in Africa, Latin America, and parts of Asia, its importance is increasing rapidly.It is becoming an important export crop, cassava chips for animal feed are nowimported into Western European countries. In developing countries cassava couldbecome an even more important carbohydrate source if people will develop theirprotein foods to supplement it. When grown and fertilized well cassava is said toyield more starch than maize and much more than rice or wheat. The crop justifiesincreased research and much is being done at the International Centre for TropicalAgriculture (CIAT) in Columbia. When cassava is sold it removes some P, much Nand even larger amounts of K. These quantities must be replaced to maintain soilfertility and where cassava is to be grown intensively we may expect large quantitiesof fertilisers to be essential for the success of the system.
4.4 The role of animals as sources of lipidsAnimal produce is the major part of the value of agricultural output in many developedcountries; in Britain about two-thirds of the total value of our output is from animalfarming. Animal fats supply 30% of the World's supply of lipids; 40% of the energyin British diets is from lipids and four-fifths of this is from animal sources. In mostdeveloped countries cattle, pigs and poultry are all kept intensively. The high levels ofproduction that are achieved by these modern methods depend, particularly with pigsand poultry, on 'concentrated' feeding stuffs made from oil seeds and their residues(imported from warm countries to supply protein) with temperate cereals supplyingenergy plus more protein. Table II shows the proportions of cereals fed to livestock,
19
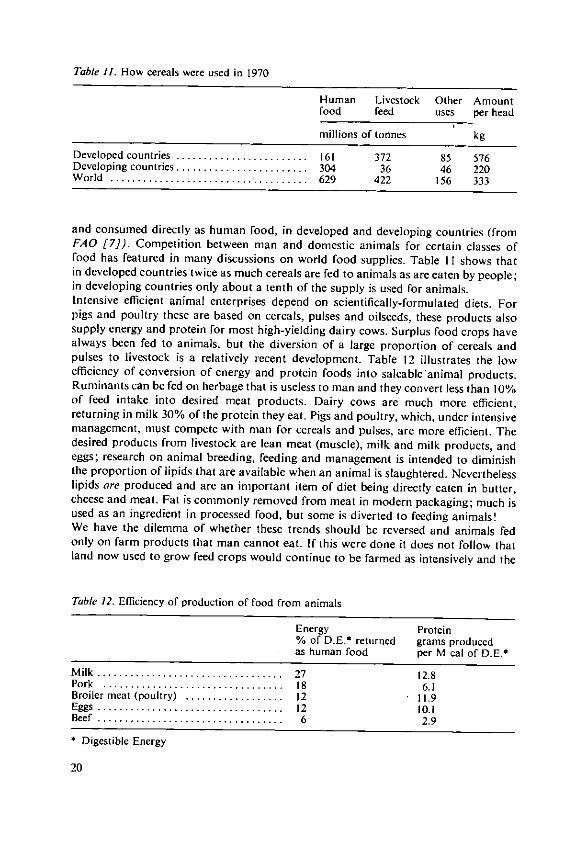
Table 11. How cereals were used in 1970
Human Livestock Other Amountfood feed uses per head
millions of tonnes kg
Developed countries ........................ 161 372 85 576Developing countries ........................ 304 36 46 220W orld ............................ ...... 629 422 156 333
and consumed directly as human food, in developed and developing countries (fromFAO [7]). Competition between man and domestic animals for certain classes offood has featured in many discussions on world food supplies. Table I I shows thatin developed countries twice as much cereals are fed to animals as are eaten by people;in developing countries only about a tenth of the supply is used for animals.Intensive efficient animal enterprises depend on scientifically-formulated diets. Forpigs and poultry these are based on cereals, pulses and oilseeds, these products alsosupply energy and protein for most high-yielding dairy cows. Surplus food crops havealways been fed to animals, but the diversion of a large proportion of cereals andpulses to livestock is a relatively recent development. Table 12 illustrates the lowefficiency of conversion of energy and protein foods into saleable animal products.Ruminants can be fed on herbage that is useless to man and they convert less than 10%of feed intake into desired meat products. Dairy cows are much more efficient,returning in milk 30% of the protein they eat. Pigs and poultry, which, under intensivemanagement, must compete with man for cereals and pulses, are more efficient. Thedesired products from livestock are lean meat (muscle), milk and milk products, andeggs; research on animal breeding, feeding and management is intended to diminishthe proportion of lipids that are available when an animal is slaughtered. Neverthelesslipids are produced and are an important item of diet being directly eaten in butter,cheese and meat. Fat is commonly removed from meat in modern packaging; much isused as an ingredient in processed food, but some is diverted to feeding animals!We have the dilemma of whether these trends should be reversed and animals fedonly on farm products that man cannot eat. If this were done it does not follow thatland now used to grow feed crops would continue to be farmed as intensively and the
Table 12. Efficiency of production of food from animals
Energy Protein% of D.E.* returned grams producedas human food per M cal of D.E.*
M ilk .................................. 27 12.8Pork ................................. IS 6.1Broiler meat (poultry) .................. 12 11.9Eggs .................................. 12 10.1B eef .................................. 6 2.9
* Digestible Energy
20
produce diverted to hungry people in distant developing countries. Another point isoften forgotten: the developing countries do have large livestock populations but theseproduce relatively little meat or milk because of underfeeding, disease and parasiticinfestations; in addition the genetic quality of the animals must be improved. Thiswas pointed out on Bornholm in 1975 [3]. The quality and quantity of diets indeveloping countries could be (and will be) improved by applying scientific knowledgeto the breeding nutrition, health and management of livestock in these countries. Thisis already recognised in the International Institutes. Much research is done at CIA T(Columbia) on improved beef production systems which will make much better use ofthe vast areas of latosols in the savannah regions of the world. Two Institutes inAfrica, ILRAD and ILCA (CGIAR [2]) are concerned with animal disease andmanagement in the tropics.Intensive poultry and pig enterprises are already being established in some developingcountries; supplies of cereal-based feeds will be essential for these farms.Ruminants will derive most of their feed from grassland and leguminous forages. Wehave shown in previous Colloquia how essential fertilizers are for increasing produc-tion of these crops; we have also shown that large cereal yields depend entirely onadequate fertilizer use. These earlier studies will be extended by a main paper byDrs. Mercier, Aunaltre and Thivend in the fourth session on the effects of fertilizersand other growth factors on the composition and nutritive value of forages and otheranimal feed crops.
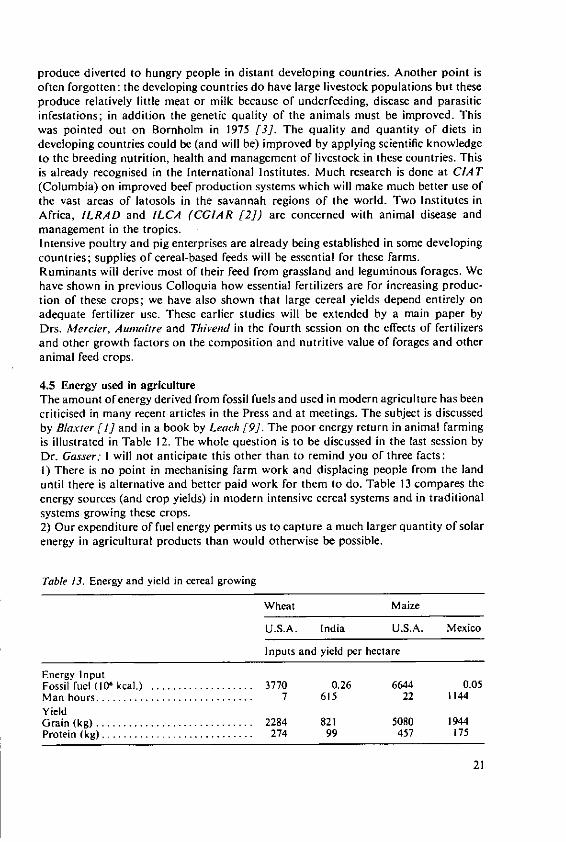
4.5 Energy used in agricultureThe amount of energy derived from fossil fuels and used in modern agriculture has beencriticised in many recent articles in the Press and at meetings. The subject is discussedby Blaxter [I] and in a book by Leach [91. The poor energy return in animal farmingis illustrated in Table 12. The whole question is to be discussed in the last session byDr. Gasser; I will not anticipate this other than to remind you of three facts:I) There is no point in mechanising farm work and displacing people from the landuntil there is alternative and better paid work for them to do. Table 13 compares theenergy sources (and crop yields) in modern intensive cereal systems and in traditionalsystems growing these crops.2) Our expenditure of fuel energy permits us to capture a much larger quantity of solarenergy in agricultural products than would otherwise be possible.
Table 13. Energy and yield in cereal growing
Wheat Maize
U.S.A. India U.S.A. Mexico
Inputs and yield per hectare
Energy InputFossil fuel (106 kcal.) ................... 3770 0.26 6644 0.05M an hours............................. 7 615 22 1144YieldGrain (kg) ............................. 2284 821 5080 1944Protein (kg) ............................ 274 99 457 175
21
3) Half of the energy used in developed agriculture is needed to produce nitrogenfertilizers. It is therefore prudent to intensify research on a) using these fertilizers moreefficiently, b) alternative methods for the biological fixation of nitrogen, and c) thedevelopment of methods for the integrated control of the nutrition of our crops.
5. Pattern for the Colloquium
The overall purpose of the Colloquium is to relate fertilizer use to the production ofcarbohydrates and lipids in ways that will aid our future research and development.In two and a half days we can only discuss a few of the subjects that I have mentioned.In the background of our discussions are the problems of one-tenth of the World'spopulation who have too little of their accepted traditional foods. There is probablylittle that agricultural chemists can do immediately for the many people in countrieswhere land shortage is not the most serious and immediate problem; their difficultiesare caused by poverty, ill-health and lack of education. Social, economic, nutritionaland medical studies will provide the first help needed. However agricultural sciencewill help the people of all developing countries to a better life by showing how theircrops may be made more productive. It is not however sufficient to show that fertilizersincrease yields; the social and economic factors involved in fertilizer use must also bestudied. The direct transfer of our technology to developing countries only succeedswhere it can be applied in a well-capitalised industry producing crops that have aready market. Elsewhere, when the existing agricultural and social systems have beenadequately studied, the farmers may be offered a package of improved practices thatfit their technical ability, soil and climate, and which are adapted to family and socialconditions. Only by the 'package' approach is it possible to get an adequate returnfrom investment in fertilizers by realising the interactions between nutrition, improvedvariety of crop, and pest, disease and weed control. Means must also be found forpeople to purchase the inputs needed to raise yields.Photosynthesis is the basis of crop yield. The physiological and biochemical mecha-nisms involved in capture of sun's energy and transfer and storage of photosynthateare all affected by nutrition. This fundamental subject is the topic of our second session.Professor Mengel's comprehensive paper is followed by more detailed papers on theeffects of nutrition and other factors on energy conversion, synthesis of fats and starchand their transport to storage organs.The third session deals with some of the background questions on the amounts offood needed by people, the roles of lipids in nutrition and factors of taste and texturethat make foods acceptable and appreciated.The fourth and fifth sessions are given to papers dealing with many aspects of the roleof fertilizers in producing carbohydrates and lipids. We will be concerned with bothquantity and quality of produce. Of the two main papers in each of these sessions, onewill deal with research applicable to developed agricultural systems; the other paperis on subjects important in the tropics. After treating energy problems in agriculturethe sixth session will co-ordinate the conclusions reached earlier in the Colloquium.I hope that from this last discussion we will be able to indicate the subjects wherefurther work on crop nutrition is needed to increase the production of carbohydratesand lipids and to improve their quality.
22
References
I. Blaxer, K.L.: The limits to agricultural improvement. Journal of the University ofNewcastle upon Tyne Agricultural Society, 25, pp. 3-12 (1974)
2. C.G.I.A.R. (Consultative Group on International Agricultural Research): InternationalResearch in Agriculture. New York, 1977
3. Cooke, G. W.: Sources of protein for people and livestock; the amounts now availableand future prospects. Proceedings of 11th Colloquium of the International PotashInstitute, Bornholm/DK, pp. 29-51 (1975)
4. D.H.S.S. (Department of Health and Social Security): Diet and coronary heart disease.Report on health and social subjects No. 7. London: HMSO, 1974
5. Drummond, J.C. and Wilbraham, A.: The Englishman's food. London: JohnathanCape. 2nd Ed., 1957
6. FAO: Production Year books for 1970 to 1975, Vols. 24-29. Food and AgricultureOrganisation of the United Nations, Rome (1970-1975)
7. FAO: The state of food and agriculture, volumes for 1970 to 1975. Food and AgricultureOrganisation of the United Nations, Rome (1970-1975)
8. IFC: International Fertiliser Correspondent (I.P.I.), No. 1496, quoting from ForeignAgriculture, U.S.D.A., I Sept. (1975)
9. Leach, G.: Energy and food production. I.P.C. Science and Technology Press, Guildford,1976
10. Miller, D.S. et al.: The Ethiopia applied nutrition project. Proc. R. Soc. Lond. B. 194,23-48 (1976)
II. MAFF (Ministry of Agriculture, Fisheries and Food): Food Facts No. 3. (1977)12. WHO: Energy and protein requirements. World Health Organisation Technical Report,
Series No. 522. Geneva (1973)
23
Research and Developmentfor United Kingdom Agriculture
E.S. Carter, B. Sc. (Agric.) F. il.Biol., Agricultural Development and Advisory Service,Ministry of Agriculture, Fisheries and Food, London/United Kingdom-
Summary
This paper gives details of the total area of agricultural land in the United Kingdom and showsthe amount devoted to crops, grass and forage. The numbers of livestock are shown and trendsin the size of farms and the size of enterprise are considered and discussed. The relation of agri-cultural production to soil type, climate, rainfall and altitude is also considered. Some detailedinformation is given about the MAFF land classification system and the pressures on land useand loss of land is discussed.The conference meets in York and attention is drawn to the fact that the area around York is amicrocosm of United Kingdom farming where virtually all aspects may be seen.Details are given of the organisation of the United Kingdom agricultural industry indicatinghow it has developed since the last war and how policy issues are considered. The organisationsconcerned with research, advice and education are specified and briefly described.The arrangements for identifying the R&D needs for United Kingdom agriculture are dealtwith and the R & D needs are discussed in relation to the long term requirements of the agricul-tural industry and the position of the United Kingdom in relation to the EEC and world mar-kets.
Introduction
Agricultural activities are governed in large measure by relief, soil and climate andeven to the casual observer it is obvious that there are marked differences in agricultur-al activity throughout the United Kingdom. The purpose of this paper is to set out thepresent state of the agricultural industry and to show how this is influenced by soilsand climate, to describe the organisation of the industry and the way in which its re-
quirements for research and development are recognised and provided for.Being an island subject to the westerly Atlantic winds, the main features are an ade-
quate and well distributed rainfall and mild temperatures with only occasional violentfluctuations to extreme cold or drought. Although Eastern England is drier and has
colder winters than the west, conditions are still far from the extremes often experi-enced in Continental Europe.The soils too are very variable from the older often acid soil derived from igneousrocks in the west to newer sedimentary soils in the east and so in a small country consid-
* f.S. Carter, Agricultural Development and Advisory Service, Ministry of Agriculture,Fisheries and Food, Great Westminster House, Horseferry Road, London S.W. I P 2AE/United Kingdom
25
erable variations in farming systems can be seen. Although there are areas where cer-tain crops predominate, marked changes can occur in quite short distances and there isa strong tendency to a mixed farming economy in most parts of the country, but withthe west and north predominantly grass and stock rearing and the east arable crops.
Crops and stock
Crop areas and livestock numbers are shown in Table I (source: Annual Review ofAgriculture [1977]).The total area of the United Kingdom is 18 946 000 hectares, a declining figure due tothe use of land for other purposes; some indication of this is shown by comparisonwith the average for 1965-67 of 19 '/ million hectares. Of this total some 4 800 000 hect-ares are under arable crops with a further 2 156 000 sown to short term grasses or leysin the arable rotation so that the total arable area amounts to 6 956 000 hectares orabout 36% of the total land available for farming. The bulk of this is devoted to cerealcrops, 3 676 000 hectares or more than 50% of the total cropped land. Barley is thepredominant cereal, some 2 million hectares, and about twice the area of land sown towheat. Crops such as rye and maize, which are so important in parts of the rest ofEurope, occupy only a small area in the United Kingdom.Potatoes and sugar beet are the most important crops after cereals with a slightly largerpotato area at 223 000 hectares than sugar beet at 207 000 hectares. Oilseed rape, acrop of fairly recent introduction, has moved from 7000 hectares in 1972 to 48000 hect-ares in 1976. This crop is having an important influence on rotations especially onfarms where the land is not suitable for potatoes or sugar beet.Vegetables, including the important pea crop for freezing and field vegetables such asbrussels sprouts, cabbage and cauliflower, occupy 203 000 hectares which is some50 000 hectares more than in the 1965-67 period.Orchards and soft fruit are important in selected areas of the United Kingdom; Kent iswell known for its apples and Scotland now grows most of the raspberries. Orchardshave declined from 79 000 hectares in 1965-67 to 52 000 hectares today, but the softfruit area has remained more or less stable.One important feature of United Kingdom agriculture is the land classified as perma-nent grass and rough grazing. Grassland is predominant in the west and the north inthe wetter areas unsuitable for cropping due to high rainfall, steep slopes and soil type;some 5 million hectares of this type of grassland offers considerable potential for live-stock production. In addition there are 6 500 000 hectares of rough grazing - moor-land, heath and upland - with short grazing seasons and extensive sheep and cattleproduction systems. Permanent grass accounts for 28% of the total area with roughgrazing nearly the same as the total arable at around 36%.With such a large area of grassland and a climate which encourages a long grass grow-ing season, it is not surprising that ruminant livestock play an important role in theUnited Kingdom farming. The most important is the dairy herd now predominantly ofthe Friesian breed and with 14 million head in 1976. This is smaller than the herd in1974 when it reached over 15 million, but still larger than 1965-67 when it wasjust over12 million. The beef breeding herd is quite small, only 13/ million cows, but large num-bers of calves from the dairy herd are finished for beef each year and a not inconsider-able number are exported to Europe for meat production.
26
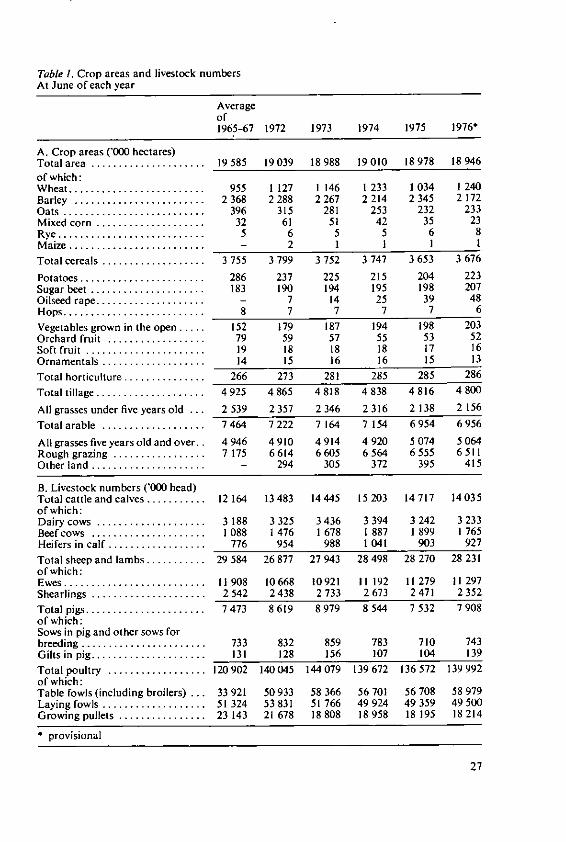
Table 1. Crop areas and livestock numbersAt June of each year
Averageof1965-67 1972 1973 1974 1975 1976"
A. Crop areas ('000 hectares)Total area ..................... 19585 19039 18988 19010 18978 18946
of which:W heat ......................... 955 1 127 1 146 I 233 1034 1 240Barley ........................ 2368 2288 2267 2214 2345 2 172Oats .......................... 396 315 281 253 232 233Mixed corn .................... 32 61 51 42 35 23Rye ........................... 5 6 5 5 6 8M aize ......................... - 2 1 1 I 1
Total cereals .................... 3 755 3 799 3 752 3 747 3 653 3 676
Potatoes ....................... 286 237 225 215 204 223Sugar beet ..................... 183 190 194 195 198 207Oilseed rape .................... - 7 14 25 39 48Hops .......................... 8 7 7 7 7 6
Vegetables grown in the open ..... 152 179 187 194 198 203Orchard fruit .................. 79 59 57 55 53 52Soft fruit ...................... 19 18 18 18 17 16Ornamentals ................... 14 15 16 16 15 13
Total horticulture ............... 266 273 281 285 285 286
Total tillage .................... 4925 4865 4818 4838 4816 4800
All grasses under five years old ... 2 539 2357 2346 2316 2 138 2 156
Total arable ................... 7464 7222 7 164 7 154 6954 6956
All grasses five years old and over.. 4946 4910 4914 4920 5074 5064Rough grazing ................. 7175 6614 6605 6564 6555 6511Other land ..................... - 294 305 372 395 415
B. Livestock numbers ('000 head)Total cattle and calves ........... 12 164 13483 14445 15203 14717 14035of which:Dairy cows .................... 3 188 3325 3436 3 394 3242 3 233Ber cows ..................... 1 088 1 476 1 678 1 887 1899 1 765Heifers in calf .................. 776 954 988 1 041 903 927
Total sheep and lambs ........... 29 584 26 877 27 943 28 498 28 270 28 231of which:Ewes .......................... 11 908 10668 10921 11 192 11 279 11 297Shearlings ...................... 2 542 2438 2 733 2 673 2 471 2 352
Total pigs ...................... 7473 8619 8979 8544 7532 7908of which:Sows in pig and other sows forbreeding ....................... 733 832 859 783 710 743Gilts in pig ..................... 131 128 156 107 104 139
Total poultry .................. 120902 140045 144079 139672 136572 139992of which:Table fowls (including broilers) ... 33 921 50933 58 366 56 701 56708 58 979Laying fowls ................... 51 324 53 831 51 766 49924 49359 49500Growing pullets ................ 23 143 21 678 18808 18958 18 195 18 214
* provisional
27
Sheep have always played an important part in United Kingdom agriculture and in-deed in large areas in the past prosperity depended on wool. Today sheep are of lesserimportance but are kept for meat production, wool forming only a small part of totaloutput. The majority are kept in hill and upland areas providing a valuable source ofstock for further breeding and fattening in the lowlands. The sheep flock is over 28 mil-lion, about I million fewer than 1965-67.Pig production as in most countries has moved away from small scale enterprises aspart of a mixed farming economy to large specialised units located close to foodsources of grain or urban swill. The total pig population is just under 8 million with743 000 breeding sows. The numbers vary according to the general level of profitabilityof the pig industry, the main trend being towards larger units and today 60% of allbreeding pigs are in herds of 50 or over.Poultry production has long since moved into large units with 75% of all laying hens inflocks of 5000 and over although there are still a few flocks left on some general farms.The laying flock is around 50 million, smaller than it was in 1972 by some 3 million andthere has been a substantial increase in table fowl production from 34 million in1965-67 to 59 million in 1976.The overall picture is of a country with a substantial grassland area, largely in the westand north, and an important arable area producing cereals for animal feed, milling andfor the maltster to use for beer and whisky and with vegetables for direct consumptionand for freezing becoming more important. Milk production predominates the live-stock scene with important intensive pig and poultry units using home produced ce-reals with imported proteins. It is of interest that the total arable area is about the samenow as it was 100 years ago when there was substantially more land available. Thecountryside must therefore be more intensively farmed and this can lead to problems ina small country where only about 3% of the population is directly engaged in farmingand the remainder with an urban outlook are keen to use land for recreation andsport.
Soils and climate
The farming described is not of course evenly distributed over the United Kingdomand some variations occur. In most of lowland United Kingdom differences in reliefare less important than soil differences. Flat or gently undulating land is most suitablefor cultivation, but few areas are too steep to plough. Some land which is not ploughedis too low lying or has a high water table. The area liable to flooding is comparativelysmall and largely confined to river valleys and coastal marshes. Only the peats in theFens lie below sea level and rely for their cultivation on pumped main drainage. Thechief reason for non-ploughing of lowlands is the prevalence of heavy soils rather thanrelief. Some 3 million hectares are artificially drained through clay tiles or plastic pipesand a further 3 million hectares would benefit from such drainage. Each year about100 000 hectares are drained by farmers or landowners.In the uplands of the west and north relief plays an important part. Much of the landsuffers from poor drainage and the valleys are steep sided and difficult to plough. Thereare rapid changes of climate through elevation resulting in a shortened growing sea-son and high humidity. These are the areas of rough grazing and permanent grassland.
28
Despite the small area of the United Kingdom and the limited range of elevation, cli-matic differences are very important in accounting for differences in the kind of agri-culture practised. Rainfall is clearly important, both the total amount and its distribu-tion. Wales, the Lake District, the West of Scotland and the South West have over100 cm of rain a year, in parts over 250 cm. In contrast parts of Eastern England haveonly 75 cm, in some areas 50 cm or less. East of a line drawn from the Wash to Dorsetcrops would benefit from irrigation 7 to 9 years in 10, west and north of this line irriga-tion need is much less frequent.The United Kingdom can show a wide range of soil types, but in the hills or uplandsmost of the lands are podsols which suffer from impeded drainage, in North Wales andthe Pennines there are areas of peat. The lower hills are composed of acid brown forestsoils suffering impeded drainage, but in some areas, notably Derbyshire, there are freedraining calcareous soils. Rendzinas and other calcareous soils are found on the out-crops of the magnesian limestone and on the Jurassic limestones especially on the Cots-wolds and on the chalklands of Lincolnshire and the Yorkshire Wolds and a the Downsin Hampshire, Wiltshire, Dorset and Berkshire. These are thin soils but easily ploughedand made useful by modern understanding of fertilizer needs. Man made drainage hasconverted lowland peats to highly productive soils notably in the Fens and in otherplaces and the main areas of alluvial soils in the Fens, the Humber Estuary and Rom-ney Marsh owe their high agricultural value to man made drainage channels and coas-tal embankment. Much of the remaining lowland soils suffer impeded drainage and areeither gleyed, podsolic soils of the Midlands or Northern England or brown forest soilsin the valleys flanking the escarpments. They give productive arable with adequatedrainage. Free draining soils are found in the Trent valley, Hereford and Norfolk de-rived from old red sandstone or Triassic rocks. The rainfall, soil type and topographyhave resulted in livestock rearing and milk production in the North West, South Westand Midlands, sheep and cattle on the hills and uplands and arable farming in the Eastand South Central England. Generally more intensive arable crops, such as vegetables,potatoes and sugar beet are grown further east in the drier climate but there are smallerareas of similar cropping in the West Midlands and South Lancashire. Sugar beetprocessing factories are concentrated in Eastern England as also are the major vege-table processing plants.Although milk production is more concentrated in the west and north west, the MilkMarketing Board through its equalisation of transport costs has tended to encouragedairying over most of the country and large efficient herds are to be found in the ara-ble areas of Eastern England (Table 2).The rearing and fattening of pigs for pork and bacon is an intensive form of produc-tion not related to the nature of the land itself. Intensive units are largely dependent onconcentrates with some use being made of surplus food and urban swill close to largetowns. Pigs are concentrated in Lancashire, Humberside, Suffolk and parts of Corn-wall (Table 3).Like pig keeping, poultry for eggs and meat is an intensive form of agricultural produc-tion in which the nature of the land plays little part. Poultry are fairly evenly distribut-ed apart from the hills and uplands but with concentrations in Lancashire, parts of theMidlands and East Anglia.It is not surprising that a small acreage of horticultural crops should be grown overmost of the country in view of the distribution of the population and the wide range ofcrops produced. Four major areas stand out: the Fenland silts, Kent, Worcestershire
29
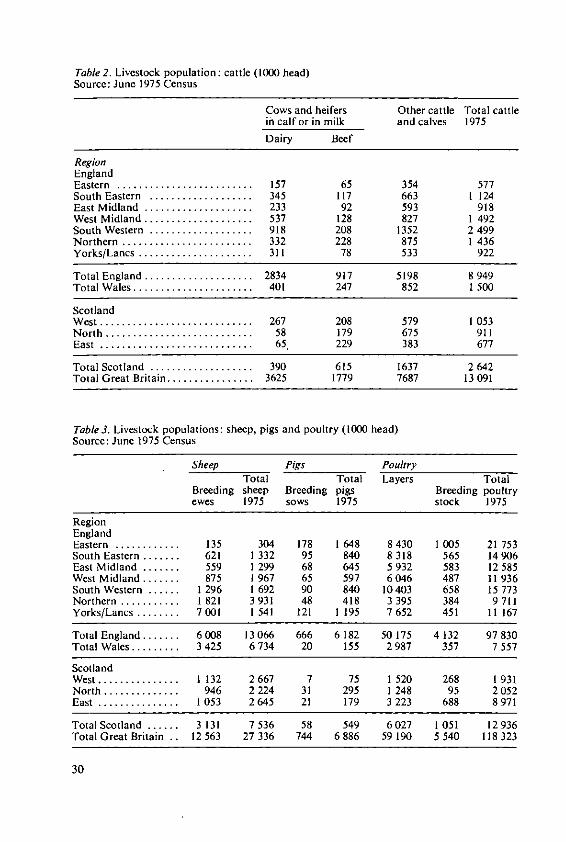
Table 2. Livestock population: cattle (1000 head)Source: June 1975 Census
Cows and heifers Other cattle Total cattlein calf or in milk and calves 1975
Dairy Beef
RegionEnglandEastern ......................... 157 65 354 577South Eastern ................... 345 117 663 I 124East Midland .................... 233 92 593 918West Midland .................... 537 128 827 1 492South Western ................... 918 208 1352 2499Northern ........................ 332 228 875 I 436Yorks/Lancs ..................... 311 78 533 922
Total England .................... 2834 917 5198 8949Total Wales ...................... 401 247 852 1 500
ScotlandW est ............................ 267 208 579 1 053N orth ........................... 58 179 675 911East ............................ 65. 229 383 677
Total Scotland ................... 390 615 1637 2642Total Great Britain ................ 3625 1779 7687 13091
Table 3. Livestock populations: sheep, pigs and poultry (1000 head)Source: June 1975 Census
Sheep Pigs PoultryTotal Total Layers Total
Breeding sheep Breeding pigs Breeding poultryewes 1975 sows 1975 stock 1975
RegionEnglandEastern ............ 135 304 178 1 648 8430 1 005 21 753South Eastern ....... 621 1 332 95 840 8318 565 14906East Midland ....... 559 1 299 68 645 5932 583 12585West Midland ....... 875 1 967 65 597 6 046 487 11 936South Western ...... 1 296 1 692 90 840 10403 658 15 773Northern ........... 1 821 3931 48 418 3 395 384 9711Yorks/Lancs ........ 7001 1 541 121 1 195 7652 451 11 167
Total England ....... 6008 13066 666 6182 50175 4132 97830Total Wales ......... 3425 6734 20 155 2987 357 7557
ScotlandWest ............... 1 132 2667 7 75 1 520 268 1931North .............. 946 2224 31 295 1 248 95 2052East ............... 1 053 2645 21 179 3 223 688 8971
Total Scotland ...... 3 131 7 536 58 549 6027 1 051 12936Total Great Britain .. 12563 27 336 744 6886 59 190 5 540 118 323
30
and Bedfordshire. Other important centres are South West Lancashire, Humberside,West Cornwall and North East Scotland.
Crop yields
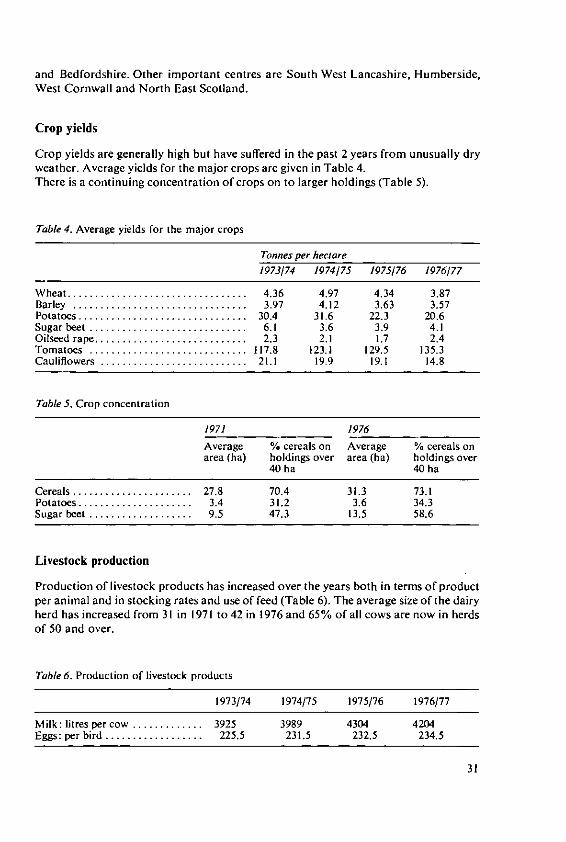
Crop yields are generally high but have suffered in the past 2 years from unusually dryweather. Average yields for the major crops are given in Table 4.There is a continuing concentration of crops on to larger holdings (Table 5).
Table 4. Average yields for the major crops
Tonnes per hectare
1973/74 1974/75 1975/76 1976/77
W heat ................................. 4.36 4.97 4.34 3.87Barley ................................ 3.97 4.12 3.63 3.57Potatoes ............................... 30.4 31.6 22.3 20.6Sugar beet ............................. 6.1 3.6 3.9 4.1Oilseed rape ............................ 2.3 2.1 1.7 2.4Tomatoes ............................. 117.8 123.1 129.5 135.3Cauliflowers ........................... 21.1 19.9 19.1 14.8
Table 5. Crop concentration
1971 1976
Average % cereals on Average % cereals onarea (ha) holdings over area (ha) holdings over
40 ha 40ha
Cereals ...................... 27.8 70.4 31.3 73.1Potatoes ..................... 3.4 31.2 3.6 34.3Sugar beet ................... 9.5 47.3 13.5 58.6
Livestock production
Production of livestock products has increased over the years both in terms of productper animal and in stocking rates and use of feed (Table 6). The average size of the dairyherd has increased from 31 in 1971 to 42 in 1976 and 65% of all cows are now in herdsof 50 and over.
Table 6. Production of livestock products
1973/74 1974/75 1975/76 1976177
Milk: litres per cow ............. 3925 3989 4304 4204Eggs: per bird .................. 225.5 231.5 232.5 234.5
31
Home production now accounts for 52.8% of United Kingdom food supplies and64.9% of the types of food that could be grown here. Agriculture contributes 2.5% ofthe Gross Domestic Product worth some £ 2355 million.
Manpower
Only 2.7% of the total manpower is engaged in agriculture having fallen from 3.5% in1966-68. The small labour force operates in a highly mechanised agriculture, indeed itis probably the most highly mechanised in the World. The total employed labour forceis 375 000 with a further 289 000 whole time or part time farmers. This labour forcehas the use of 360 000 tractors and 50 000 combine harvesters besides other equip-ment. The total labour force of 664 000 is one to every 28.5 hectares.
Farm size
The number of farms continues to decline; the total number of holdings at 270 000 isabout 9% lower than in 1971. The number of full time farms- 166 000- is 10% lower,the small full time farm showing the biggest decline. Average farm size is increasing,full time farmers averaged 101 hectares in 1976 compared with 94 in 1971. Sixty-twoper cent of holdings were wholly or mainly owner occupied - an increase of 8% in justover 10 years- and these holdings represent 56% of the total land area.
Markets
The United Kingdom farmer has close at hand a large market for his produce - a pop-ulation of some 56 million. Farming is organised to supply this market either throughstatutory marketing boards or by close links and contracts with food processing firms.The Milk Marketing Board is the best known and besides purchasing all milk fromfarms to supply the distributors and manufacturers, it also undertakes some manufac-turing itself and provides services to farmers such as artificial insemination, milk re-cording and bull performance testing. Other boards do not have such a wide involve-ment but operate to rationalise the production of commodities to meet market needsand undertake advertising and promotional campaigns. Pig production, poultry andeggs, vegetables and fruit for processing are often contracted with companies who willmarket the final product to the long term advantage of the producer and the consu-mer.There has been a growth in co-operation between producers leading to the develop-ment of groups owning expensive harvesting equipment for peas for freezing and oper-ating linked production systems for pigs and lambs.The presence of a large urban population provides markets but also gives rise to prob-lems of access to the countryside for recreation. These pressures are greatest near largetowns and also in those areas designated as National Parks in areas such as the PeakDistrict of Derbyshire, the Pennines, Exmoor and parts of Wales, where farming has tocarry on with considerable numbers of visitors and resistance to change in the appear-ance of the countryside through land improvement or erecting new buildings.
32
Quality of land
The Ministry of Agriculture Fisheries and Food (MAFF) has through the Land Serviceof the Agricultural Development and Advisory Service (ADAS) carried out a survey ofland in England and Wales which has been classified into 5 categories.
Grade I - land with very minor or no physical limitationsGrade 1I - land with minor limitations, yields lower than Grade I and cropping op-tions more restrictedGrade I[ - land with moderate limitations due to soil, relief or climate restrictingtiming of cultivations or level of yield; soil may have structural defectsGrade lV - land with severe limitations, relief and climatic restrictions, high rainfalland exposureGrade V - land of poorest quality, permanent grass or rough grazings, most landabove 300 metres
Of England and Wales the land resources fall into these categories:
Grade I - 2.8%Grade 11 - 14.6%Grade Il1 - 48.8%Grade IV 33.8%Grade V
82.6% is in the lower three grades.
Land is lost to agriculture through the development of new buildings and roads whichincreases the pressure on the remaining land area. In the last 10 years the total area hasfallen from 19 585 000 hectares to 18 946 000 hectares, some 3.3%.
Yorkshire and Humberside
This conference is meeting in York and this is fortunate for the delegates in that thispart of the United Kingdom which forms the old county of Yorkshire is able to shownearly all the features of United Kingdom farming. Reorganisation of counties a fewyears ago has changed the names and the three Ridings of Yorkshire are now broadlyNorth Humberside, North Yorkshire, West Yorkshire and South Yorkshire on mod-ern maps. This area - mostly within an hour or so motor car ride from York - canshow cereals, potatoes and sugar beet for a factory here in York, vegetables for mar-keting and processing, intensive horticulture - there are large areas of heated glass atHull - and most of the United Kingdom rhubarb is grown near Leeds. The only farm-ing not represented in Yorkshire is top fruit and hop production.The millstone grit of the Pennines, its high rainfall and altitude has produced spectacu-lar scenery and an area of upland sheep farming, although with some cattle and dairy-ing. The Vale of York is a famous arable area and specialised crops for processing areproduced on the silts and esturine soils of the rivers Trent, Ouse and Humber. TheWolds are well suited to barley and wheat production and with some production ofseed potatoes.
33
Pigs and poultry feature in the area, the pig industry being concentrated in the east to-wards Hull with a number of intensive poultry units in various parts of the region.Dairy farming has developed from originally supplying the towns and cities of the in-dustrial Pennines to the production of milk in bulk for wider use, although there is stillan important number of small producers retailing their milk locally.
Organisation of United Kingdom agriculture
The MAFF is responsible for the agricultural and fisheries industries in the UnitedKingdom, that is England and Wales, Scotland and Northern Ireland. There are sepa-rate Departments in Scotland and Northern Ireland implementing policy decisions andcarrying out the functions of the Ministry in those countries. These Departments areconsulted on all matters of policy formation.MAFF is concerned with all aspects of the agricultural industry, usually on its own butoften in association with other Government Departments. There is, for example, closeco-operation with the Department of the Environment on matters of land use and effectsof agricultural practice on the environment. The Ministry is largely concerned with theoverall development of the agricultural industry, its well being and the contribution itcan make to the national economy by making the most economic use of the availableresources. The broad policy is discussed and as far as possible agreed with the NationalFarmers Unions. For many years from the passing of the Agriculture Acts of 1947 and1957 a review of the industry held each year was followed by an announcement of theguaranteed prices of the main commodities to be paid for the coming year. This reviewis still held, but prices are settled in Brussels now that the United Kingdom is a mem-ber of the EEC. There is close co-operation between the National Farmers Union andMAFFand there is a regular dialogue and exchange of information between officials ofboth organisations. A recent example of discussion on broad policy is the White Paper'Foodfrom our own Resources' published in the spring of 1975 which sets out the gener-al pattern for United Kingdom agriculture for 5 to 8 years ahead.MAFF is also responsible for Animal and Plant Health Regulations and control ofsuch animal diseases as Foot and Mouth and Rabies and plant diseases and pests likePlum Pox and Colorado Beetle. Agricultural workers wages, land use and planning,regulations covering milk production, the operation of slaughter houses, flood controland many others are also the responsibility of MAFF. Other responsibilities includethe Royal Botanic Gardens at Kew and owning and managing the Laxton Estate inNottinghamshire, which is a working example of a mediaeval open field system.During the 1939-45 war United Kingdom agriculture was closely controlled and regu-lated to obtain maximum output of basic foods whilst using scarce resources as pro-ductively as possible. Much land was brought back into cultivation and reclaimed andmany thousands of hectares drained. The 40s and 50s were years of maximum foodproduction with little regard for costs, but towards the end of the 1950s and in the1960s much greater regard was paid to costs of production and many of the regulationsand controls were eased or brought to an end. Free marketing replaced purchases byState agencies and farmers operated again in a competitive situation. The industry wasprotected from the effects of world food surpluses often of a temporary nature by a sys-tem of deficiency payments which allowed the country to buy food in the world marketbut ensured that United Kingdom farmers received a reasonable return for home
34
grown produce. Various grants for drainage, fertilizer and lime, and building and landimprovement helped the industry to continue its changes to modern agricultural prac-tices and gave farmers new buildings and farm reorganisation leading towards thestructure of today. During the 1950s and early 1960s crop yields improved steadily andthere were advances in animal husbandry and livestock yields. The rate of progress hasperhaps inevitably slowed down somewhat, but there is still considerable potential forimprovement in raising performance levels to those achieved by the more progressivefarmers.At the present time the agricultural industry is adapting to membership of the EEC,the effects of a wider European policy and price structure with MAFF concerned as be-fore with UK farming but fully engaged in the EEC CAP organisation.
Research, advice and education
The United Kingdom has well established organisations dealing with research, adviceand education. These differ somewhat between England and Wales and Scotland, butall farmers have available to them a comprehensive, free advisory service on all aspectsof agriculture, backed by a research organisation.The Agricultural Research Council (ARC) was formed in 1931 to advise MAFFand theDepartment of Agriculture and Fisheries for Scotland (DAFS) on the work of the ex-isting institutes like Rothamsted, National Institute for Research in Dairying, NationalInstitute for Agricultural Botany, Rowett and others. The ARC has also established anumber of its own institutes such as Letcombe Laboratory and the Animal Breeding Re-search Organisation. The pattern of growth has been like that of the industry, somesmall encouragement in the 1930s and then expansion to provide the knowledge for thedevelopment and modernisation of the industry. The ARC also provides funds for spe-cific research projects at certain universities. The research centres for which the ARC isresponsible have become known informally as the Agricultural Research Service(A RS).If a sound financial structure is the life blood of agriculture and research services thebrain, advisory or extension services are the nerves between research and the farmers.Before the last war advice was provided, in a somewhat uneven way between counties,by local authorities. In 1946 the National Agricultural Advisory Service (NAAS) wasset up in England and Wales whilst in Scotland and Northern Ireland the advisoryservice is an extension from the agricultural colleges and there is a closer and formalconnection between education and advice.NAAS dealt with husbandry and farm management advice and provided specialists inmany areas such as soil science, nutrition, plant pathology, entomology and mechani:sation. A number of experimental husbandry farms and horticulture stations were es-tablished covering a wide range of soil types and production systems, their functionbeing to carry out field research and investigate local problems.The MAFF had other professional services: Land, dealing with land management andplanning and buildings; Land Drainage, covering water movement from farms to mainrivers; and the Veterinary Service, concerned with animal health and investigationsinto livestock problems at central and regional laboratories. In 1971 these were allbrought together with NAAS to form ADAS and in 1974 the Plant Pathology Labora-tory and the Pest Infestation Control Laboratory were added. ADAS thus covers all
35
MAFF professional, scientific and technical services providing advice to the industry,investigating problems and developing new techniques and providing professional ad-vice to MAFF to enable it to carry out its work and formulate policies.Education is provided by II universities with agricultural departments. Agriculturalcolleges, such as the Royal Agricultural College, Seale Hayne Agricultural College andHarper Adams Agricultural College, and county colleges of agriculture - nearly everycounty has one - provide an education service for the farming community. There arethus several tiers of agricultural education. In England and Wales there is close liaisonbetween colleges and advisory services, and in Scotland and Northern Ireland the col-leges also provide the advisory service and the specialist support.Those companies providing the industry with basic materials such as fertilizers, herbi-cides, varieties of seeds, machinery and equipment, also carry out research and devel-opment and many have advisers operating in the field. The Milk Marketing Boardprovides advice and operates a Low Cost Milk Production Service. There is close liai-son and co-operation between ADAS and other organisations, often involving the ex-change of information and data in early stages of development of new projects. Thishelps to prevent conflicting advice and what could be a confusing situation for farmers.All the organisations really do have a common aim: the improvement of United King-dom agriculture and whilst maintaining their independence, they work together quiteclosely.
The organisation of research and development (R & D)
The agriculture, food and fishery industries are fundamental to the well being of thecountry and it is the responsibility of the Ministry of Agriculture Fisheries & Food tolook after their interests and promote their development. To fulfil that general respon-sibility and to carry out more specific statutory duties, the Ministry must be able tosponsor research and development on a wide range of problems which affect farmers,growers, food manufacturers and consumers. For many years the Ministry's funds forresearch and development were spent internally where major R & D programmes werecarried out in fisheries, animal and plant health, pest infestation control, food scienceand the development of systems of agricultural and horticultural production. Since1971 the Ministry has been responsible for paying the Government's contribution tothe 4 food research associations and as a result of a reorganisation based upon a reportprepared by Lord Rothschildthe Ministry took on as from 1973 major new responsibil-ities for R & D and the funds to carry them out. The objective of the reorganised Gov-ernment R & D is to secure a closer integration of work supported from public fundscarried out by the Ministry, the Department of Agriculture and Fisheries for Scotland,the Agricultural and Natural Environment Research Councils, and other organisationsincluding the universities and the food research associations. The over-riding principlewhich dominates this national effort is that the momentum of the on-going researchand development must be maintained.The Ministry has major statutory and regulatory functions such as the inspection andcontrol of plant and animal diseases and the maintenance of the quality, purity andsafety of agricultural and food products. This work is carried out by sectors of ADASwhich rely on the immediate support of well equipped laboratories. These laboratoriescarry out important R & D for the better conduct of the statutory tasks and provide ad-
36
vice both to the administrative, professional and technical staff concerned and to theindustries which the Ministry serves.In addition ADAS has 22 Experimental Husbandry Farms and Horticulture Stations fordeveloping production systems suited to the different soil and climatic conditionsthroughout England and Wales. These use the results of research and ideas from pro-gressive farmers and undertake studies of alternative systems to develop new methodsof production. There is close collaboration between them and the advisory staff of theService and they are one of the main means by which the findings of research are trans-lated into farming terms. They play a critical part in the effectiveness of the nationalR & D effort for agriculture. The work of the centres is supplemented by a comprehen-sive range of experiments and trials carried out by the regional staff of ADAS with theactive co-operation of leading farmers and growers.The main R & D effort in support of the agriculture and food industries is made in the30 research institutes and 10 university research institutes of the Agricultural ResearchService; these employ something over 4000 scientists. The work is funded by 3 mainsources: the Department of Education and Science supplies part of the funds to theARC from the science budget; the Department of Agriculture and Fisheries for Scotlandfunds the 8 institutes in Scotland; and the Ministry supplies the bulk of the remainingfunds in the form of research commissions placed with the ARC. Because of the im-portance to the Ministry of the work carried out by the ARC, strong links exist be-tween workers in the Agricultural Research Service and those Ministry staff who arethemselves involved in research and development or in providing technical advice tothe farming and food industries.The combined annual cost of the ARCandADAS is some £ 68 million; some of this ex-penditure is related to the administration of statutory functions, but many of these aredesigned to foster the improvement of agriculture.The National Environnent Research Council obtains funds from the Ministry to con-duct research and to support the Ministry's substantial responsibilities for flood pro-tection and arterial drainage, for coastal defences against tidal surges and for supportfor the Thames Barrier construction.Many of the larger industrial enterprises concerned with the processing of agriculturalproducts for sale as food maintain their own laboratories for improvement of theirown branded products. There are 4 food research associations which the Governmentsupports in conjunction with industry and they provide central laboratories where re-search and development on food problems can be carried out in the national interest.Table 7 shows the distribution of expenditure on R & D in 1975/76.
Development of R & D policy
The Chief Scientist of the MAFF is responsible for framing the Ministry's R & D pro-gramme for agriculture and food whether in-house or external, for commissioning thework and allocating funds to it and for keeping it under review. He also provides gen-eral scientific advice to the Minister over the broad range of Ministry policy. The Min-istry's internal R & D organisation has been devised to make possible close collabora-tion between the Ministry in the role of a customer and all its contractors whether itsown establishments, the research councils or other research organisations.
37
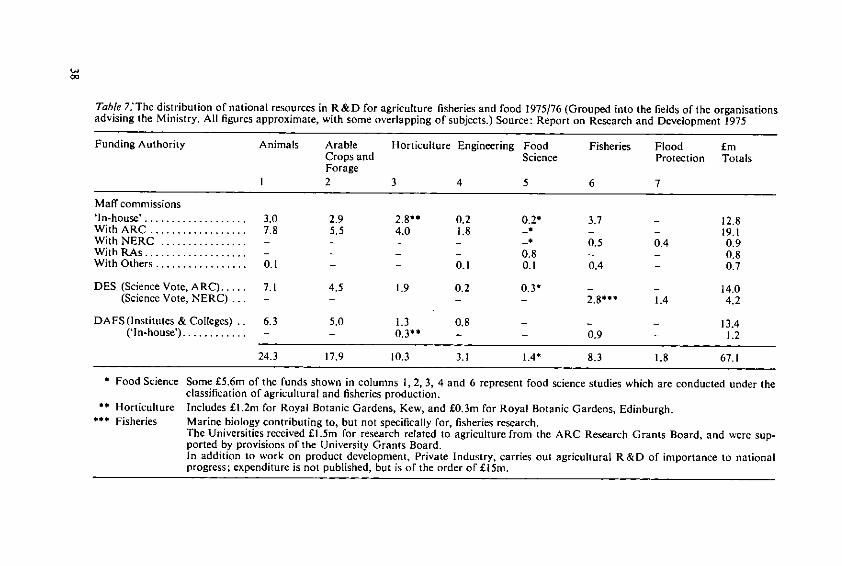
Table 7.'The distribution of national resources in R&D for agriculture fisheries and food 1975/76 (Grouped into the fields of the organisationsadvising the Ministry. All figures approximate, with some overlapping of subjects.) Source: Report on Research and Development 1975
Funding Authority Animals Arable Horticulture Engineering Food Fisheries Flood EmCrops and Science Protection TotalsForage
1 2 3 4 5 6 7
Maff commissions'In-house'.................... 3.0 2.9 2.8** 0.2 0.2* 3.7 - 12.8W ith ARC .................. 7.8 5.5 4.0 1.8 -* - - 19.1With NERC ................ - - - - - 0.5 0.4 0.9W ith RAs ................... - - 0.8 - - 0.8W ith Others ................. 0.1 - - 0.1 0.1 0.4 - 0.7
DES (Science Vote, ARC) ..... 7.1 4.5 1.9 0.2 0.3- - - 14.0(Science Vote, NERC) ... - - 2.8 *** 1.4 4.2
DAFS(Institutes & Colleges) 6.3 5.0 1.3 0,8 - - 13.4('In-house') ............ - 0.3** - - 0.9 - 1.2
24.3 17.9 10.3 3.1 1.4" 8.3 1.8 67.1
Food Science Some £5.6m of the funds shown in columns 1, 2, 3, 4 and 6 represent food science studies which are conducted under theclassification of agricultural and fisheries production.
** Horticulture Includes £I.2m for Royal Botanic Gardens, Kew, and £0.3m for Royal Botanic Gardens, Edinburgh.* Fisheries Marine biology contributing to, but not specifically for, fisheries research.
The Universities received l.5m for research related to agriculture from the ARC Research Grants Board, and were sup-ported by provisions of the University Grants Board.In addition to work on product development, Private Industry, carries out agricultural R&D of importance to nationalprogress; expenditure is not published, but is of the order of £15m.
To integrate more closely all the work supported by public funds and directed towardsthe needs of the agriculture and food industries and the Ministry's responsibilities,leading members of both the farming and food processing industries play a significant
role together with research scientists, Ministry advisers, administrators and econo-
mists. They must be able to influence the decisions to be taken on priorities and on the
programmes that should be carried out. There is now a single consultative organisation
for R & D in which the Ministry has joined with the ARC and the Department of Agri-
culture and Fisheries for Scotland. On it are members of the farming and food indus-
tries, scientists, economists and members of the Department's professional, technical
and administrative services chosen not to represent sectors but because of the contri-
butions they can make as individuals. This Joint Consultative Organisation provides
advice on priorities for all state-aided R & D in food and agriculture in England and
Wales and Scotland, and the advice it gives goes equally to the Ministry, the ARC and
the Department of Agriculture and Fisheries for Scotland.The organisation has 5 advisory boards covering animals, arable crops and forage,
horticulture, food science and technology, engineering and buildings. Each deals with
the production of the basic product right through to the preparation of the final prod-
uct and is actively concerned with development work as it is with research. All the
boards are supported by specialist committees responsible for considering in detail re-
search and development within specialised fields and they can set up ad hoc working
parties for subjects that straddle more than one board.The Ministry has a responsibility to make known the results of the research and devel-
opment work it commissions to those, whether they are agricultural advisers, practis-
ing farmers or food manufacturers, who can put such findings to practical use and also
to make full use of them in its own thinking and activity. For many years the farming
industry has been helped to achieve its present standard of technical attainment by the
dissemination of research findings by ADAS and by the research institutes themselves.
ADAS has a major function to interpret and develop research results for use in farm-
ing practice. This it does by incorporating them in general technical advice which is
available to farmers and which it publicises through technical conferences, discussion
groups and other meetings and also through the media of the press, radio and televi-
sion. There must exist therefore close liaison between the Chief Scientist and the Direc-
tor General of ADAS which will always ensure that the dissemination of the results of
research and development continue to be effective.Within the overall R & D effort the MAFF has the particular responsibility of commis-
sioning work which is most directly relevant to national needs. In this direction of sub-
jects for commissioning the guiding principle must be that much agricultural research
is long term, for example in the breeding of improved strains of cattle or of fruit trees it
is pointless to expect results in 3 or 4 years. The development of modern production
techniques may also call for exploration or re-examination of basic fields of research.
In deciding what work to commission the Ministry is concerned not only to help farm-
ers and food processors to find practical answers to immediate problems, but also to
support long term research which will include the acquisition of new basic scientific
knowledge which will be needed for the future solution of practical problems. Much of
the work which is supported is on applied subjects, but roughly one-third of the com-
mission funds are for projects which are classified as strategic.R & D in agriculture and food has been divided into 18 commissioned fields based pri-
marily on the commodities. Each commission has a number of subcommissions which
39
are again divided into objectives which cover a discrete aspect of the field and these inturn are broken down into sub-objectives and topics describing in more detail the na-ture and aims of the work to be undertaken. A particular topic may cover work at anumber of different locations with the aim of effective co-ordination of the workwhich is being supported. The contractors actually undertaking the work, mainly ARCand ADAS, have their descriptions structured on similar lines in order to facilitatecomparison and co-ordination.With the introduction of project descriptions, the opportunity has been presented tobring together a national picture of the allocation of publicly funded research re-sources which of course provide an essential background to decisions within MAFF onthe funding of R &D.It is of course necessary for those carrying out the research to describe their objectivesin customer terms and this is a sound discipline which coupled with a costing systemand the need to report progress at intervals becomes an essential component of theeffective operation of the customer/contractor principle. The operation of this princi-ple has encouraged the organisation of multi-disciplinary teams and this has empha-sised a trend which is very characteristic of modern science.The commissions run initially for 3 years before they are reviewed unless new findingsor changed circumstances lead both the customer and the contractor to agree that a re-view is desirable. Work is reviewed under the commissions on a regular basis and in-volves the research workers preparing a summary of their activities in order to presentit in a clear and readily understood form. Basically the reviews are made by the ChiefScientist to fulfil his obligations to the Ministry, but they also give the opportunity toallow co-ordinated studies to be made by reviewing together the complementary com-missions of ARC and ADAS on the same subject and through receiving a summary ofthe progress of work in relevant non commissioned areas of the same field.The consultative boards have assessed the priorities of the technical problems whichare currently the subject of R & D and the overall aim has been that of increasing theproductivity of the country's limited natural resources of land and sea and of improv-ing the efficiency of use of increasingly expensive inputs of labour, fuel and feed, muchof which has to be imported and of the investment of capital equipment. Decisionswhich are taken on research today cannot be expected to yield practical advantages be-fore the decade of the 1980s. For long term decisions there must therefore be a con-tinuing examination of what the United Kingdom will need from her agricultural in-dustry in the 1980s taking note of economic reports and forecasts, of our position inthe Common Market and of both United Kingdom and EEC requirements for importsfrom a World in which food supplies have in recent years become a major issue. Such aforward look must of course be kept under review since with an increasingly sensitivebalance between world population and food supplies the trend of world harvests mustcritically affect the position of a country which imports nearly half its food.The long term research policy is directed towards improving the ability of the UnitedKingdom to become more self-sufficient in food supplies. This view follows from theconclusions of the White Paper 'Food from our own Resources' published in 1975 andfrom a more recent Cabinet Paper 'Future World Trends' which was produced in 1976.The influence of cereal harvests in Russia and the entry of that country into the worldmarket for grain has had a considerable influence on grain reserves in store and theprice of grain entering the world market. The real cost of food and feed imports intoBritain has been raised by the decline in sterling exchange rates. These events reinforce
40

the importance of agricultural production in the United Kingdom. This country reallyneeds improvements in many parallel sectors of the industry and it is difficult to estab-lish absolute ranking of priorities across widely different fields. The agricultural indus-try is not yet exploiting fully the advantages of the British climate for growing grassand forages so that improvement in production and conservation of feeds for rumi-nants is an outstanding requirement. The main food crops - cereals, potatoes, sugarbeet and field vegetables - are still yielding far below their experimentally demonstrat-ed potentials and work is being undertaken to improve our knowledge of the compo-nents of yield and limitations to full potential production on farms. The output of rum-inant livestock products, milk and milk products, beef from the dairy herd, sheep meatand wool from our marginal lands all have the potential for substantial improvementswhich could come from further R & D. The pig and poultry industries both show howvaluable the results of science can be when they are applied skillfully, but there is scopefor more emphasis on home grown feeds and the use of by-products.The control of pests and diseases is of continuing importance and much effort is beingdevoted to improved forecasting methods so making better use of control measures.This country is in the process of producing a national water policy and since agricul-ture occupies most of the catchment areas on which rain falls, the farming policieswhich minimise pollution and control flooding are in need of study. Better drainagehas for a long time been recognised as an essential component of farm improvementprogrammes and the Ministry's responsibilities for flood protection, both coastal andinland, involve more extensive studies which are the subject of MAFF commissionedresearch.Science and technology play an important part in modern farming - providing and im-proving the basic knowledge needed to carry out farming practice to produce highquality food and to control diseases and pests of plants and animals. The pressure toproduce food from a shrinking area of land at competitive prices encourages the searchfor new production systems designed to use resources as economically as possible. Re-search into the use of waste materials, nitrification, energy conservation, novel proteinsources and others may not be of immediate need, but have important implications inthe long term. The United Kingdom has the soils and climate, the farming skills andfarm structure to be able to continue to take advantage of the investment in research,development and advice. The build up of scientific investment and knowledge in thepast decades has yet to be fully released into farming practice and the rate of advanceof technology will certainly be maintained, probably increased.
41
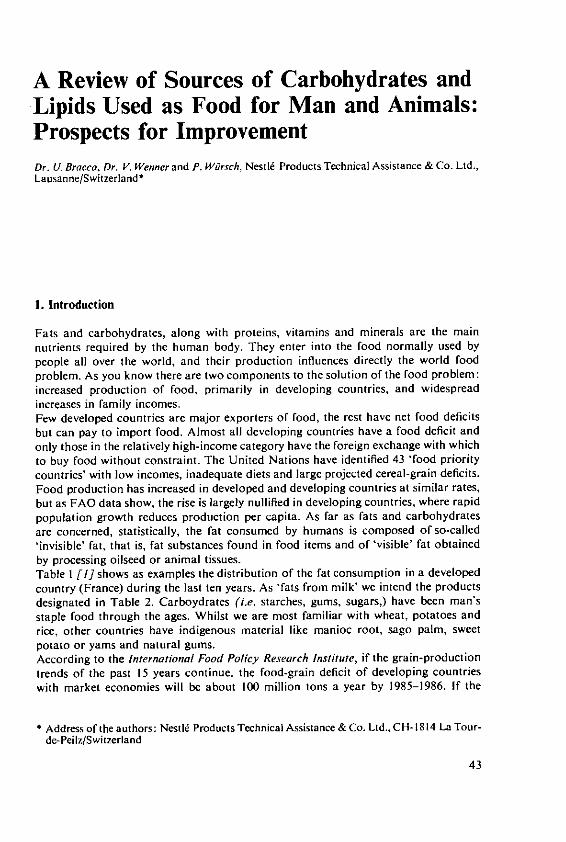
A Review of Sources of Carbohydrates andLipids Used as Food for Man and Animals:Prospects for ImprovementDr. U. Bracco, Dr. V. Wenner and P. Wfirsch, Nestld Products Technical Assistance & Co. Ltd.,Lausanne/Switzerland*
1. Introduction
Fats and carbohydrates, along with proteins, vitamins and minerals are the mainnutrients required by the human body. They enter into the food normally used bypeople all over the world, and their production influences directly the world foodproblem. As you know there are two components to the solution of the food problem:increased production of food, primarily in developing countries, and widespreadincreases in family incomes.Few developed countries are major exporters of food, the rest have net food deficitsbut can pay to import food. Almost all developing countries have a food deficit andonly those in the relatively high-income category have the foreign exchange with whichto buy food without constraint. The United Nations have identified 43 'food prioritycountries' with low incomes, inadequate diets and large projected cereal-grain deficits.Food production has increased in developed and developing countries at similar rates,but as FAO data show, the rise is largely nullified in developing countries, where rapidpopulation growth reduces production per capita. As far as fats and carbohydratesare concerned, statistically, the fat consumed by humans is composed of so-called'invisible' fat, that is, fat substances found in food items and of 'visible' fat obtainedby processing oilseed or animal tissues.Table 1 [I] shows as examples the distribution of the fat consumption in a developedcountry (France) during the last ten years. As 'fats from milk' we intend the productsdesignated in Table 2. Carboydrates (i.e. starches, gums, sugars,) have been man'sstaple food through the ages. Whilst we are most familiar with wheat, potatoes andrice, other countries have indigenous material like manioc root, sago palm, sweetpotato or yams and natural gums.According to the International Food Policy Research Institute, if the grain-productiontrends of the past 15 years continue, the food-grain deficit of developing countrieswith market economies will be about 100 million tons a year by 1985-1986. If the
Address of the authors: Nestle Products Technical Assistance & Co. Ltd.. CH- 1814 La Tour-
de-Peilz/Switzerland
43
Table I. Visible and invisible fat consumption
Year Animal+vegetable Butter Fats from Other Fats from Totalfats and oils milk sources meats g/day/
head
1965 41.7 20.4 18.1 13.7 42.5 136.41966 45.3 20.3 18.4 13.7 43.2 14091967 446 21.4 18.9 13.7 44.4 143.01968 44.1 20.6 19.1 13.7 45.6 143.11969 46.4 21.4 16.0 13.8 45.2 142.71970 48.5 20.5 16.0 13.8 46.0 144.81971 52.8 19.0 15.8 13.8 47.0 148.41972 51.6 19.7 15.8 13.8 47.8 148.71973 51.0 20.3 15.9 13.8 48.4 149.41974 51.8 21.3 15.5 13.8 49.1 151.5
Table 2. Fats from milk
Whole Skim- Cream Condensed Whole Cheese Butter Totalmilk milk milk milk powder g/day/head
1964 10.1 - 0.4 0.3 0.4 6.5 19.6 37.31965 10.0 - 0.4 0.4 0.5 6.8 20.4 38.51966 10.1 - 0.5 0.4 0.5 6.9 20.3 38.71967 10.2 - 0.5 0.4 0.5 7.3 21.4 40.31968 10.2 - 0.5 0.4 0.5 7.5 20.6 39.71969 6.6 - 0.5 0.5 0.5 7.9 21.4 37.41970 6.5 0.1 0.5 0.4 0.4 8.1 20.5 36.51971 6.4 0.1 0.4 0.4 0.5 8.0 19.0 34.81972 6.3 0.1 0.4 0.3 0.4 8.3 19.7 35.51973 6.1 0.1 0.6 0.4 0.1 8.6 20.3 36.21974 5.4 0.2 0.7 0.4 0.2 8.6 21.3 36.8
rather lower rate of increase achieved over the past seven years prevails instead, theirannual deficit could reach a staggering 200 million tons.
2. Fats
The share in production of wheat, rice and corn by the nations principally involved ingrowing those crops is shown in Table 3 [2]. The annual production of thirty majorfat and carbohydrate crops is listed in Table 4; seven crops have annual harvests of100 million tons or more.Moreover invisible fat is provided by seven major sources giving a total of more than110 million metric tons of meat according to FAO statistics (Table 5).We will discuss separately some problems on fats and carbohydrates starting frombasic aspects, economic considerations, technological improvement, new trends intheir production and use. Fat performs a variety of functions. First and foremost it isa highly concentrated source of energy. Weight for weight it provides nearly two and
44
Table 3. Share of production
Country Wheat Rice Corn
of total world production
U.S.S.R ........ 30 - 4.2U.S . .......... 12.7 1.3 46China ......... 7.6 33.1 8.0India .......... 6.7 - -
Canada ....... 4.5 - -
Pakistan ....... 2.1 -
Turkey ........ 2.2 - -
France ......... 4.9 - 3,4Japan .......... - 4.9 -
Tailand ....... - 3.9 -
Brazil ......... - 2.0 4.8South Korea ... 1.9 -Italy ........... .- 3.3 -
Sri Lanka ..... 4.6 -
Bangladesh ... 5.9 -South Africa ... 3.5Argentina ..... 3.2Rumania ........- - 2.2Others ......... 29.3 10.7 23.6
Table 4. Thirty major crops (fats and carbohydrates)
Annual Production Mio Metric Tons Annual Production Mio Metric Tons
W heat ........................ 360 Sugar Beets ................... 30R ice ......................... 320 R ye .......................... 30M aize ....................... 300 O ranges ...................... 30Potato ....................... 300 Coconut ...................... 30Barley ....................... 170 Cottonseed Oil ................ 25Sweet Potato .................. 130 A pples ........................ 20Cassava ...................... 100 Yam ......................... 20G rapes ....................... 60 Peanut ........................ 20Soya-ben ..................... 60 W atermelon .................. 20Oats ......................... 50 Cabbage ...................... 15Sorghum ..................... 50 O nion ........................ 15Sugar-cane ................... 50 Beans ........................ 10M illets ....................... 45 Pear ......................... 10Banana ...................... 35 Sunflower Seed ................ 10Tomato ...................... 35 M anioc ....................... 10
Table 5. Major sources of meat
Million Metric Tons
Pork ............... 42.5Beef ............... 42Poultry ............. 20.7Lamb .............. 5.4G oat ............... 1.4Buffalo ............ 1.1Horse .............. 7
45
Table 6. Fat-soluble vitamins: characteristics
RDA mg Sources Functions Deficiency Excess
Vitamin A I Provitamin A (beta- Constituent of Xerophthalmia (keratinization Headache, vomiting,(Retinol) carotene) widely dis- rhodopsin (visual of ocular tissue), night blind- peeling of skin,
tributed in green pigment). Maintenance ness, permanent blindness anorexia, swellingvegetables. Retinol of epithelial tissues. of long bonespresent in milk, butter, Role in mucopoly-cheese, fortified margarine saccharide synthesis
Vitamin D 01 Cod-liver oil, eggs, Promotes growth and Rickets (bone deformities) in Vomiting, diarrhoea,dairy products, fortified mineralization of bones, children. Osteomalacia in loss of weight,milk and margarine Increases absorption adults kidney damage
of calcium
Vitamin E 15 Seeds, green leafy vege- Functions as an anti- Possibly anaemia Relatively nontoxic(Tocopherol) tables, margarines, toxidant to prevent cell-
shortenings membrane damageVitamin K 03 Green leafy vegetables, Important in blood Conditioned deficiencies Relatively nontoxic.(Phylloquinone) small amount in cereals, clotting (involved in associated with severe bleeding, Synthetic forms at
fruits and meats formation of active internal haemorrhages high doses may causeprothrombin) jaundice.

a half times as many calories as carbohydrate; secondly fats are carriers of vitamins A,D, E and K (Table 6).The third function of fat is to supply certain substances called essential fatty acids.These are essential in the sense that the body needs them, but cannot synthesize them,so they must be present in the diet. Because of their chemical composition they areusually referred to as polyunsaturated fatty acids, and the chief member of the groupis linoleic acid.The precise functions of essential fatty acids have inspired considerable research sincethe 1970's, when fat-free diets were fed to rats and the resulting defects noted (decreasedbody weight, dermatosis, decreased capillary resistance, hematuria, increased fatcontent and enlarged liver and kidney).
2.1 Structure of fatsCrude fats are mainly composed of triglycerides, esters derived from one molecule ofglycerol and three molecules of fatty acids: these are long chain compounds, mainlymethylene-groups, normally straight and ending in an acidic group. Stearic acid,common in both plant and animal fat, provides a typical example of a saturated acid.If there are insufficient hydrogen atoms to occupy all the carbon bounds separately,double or triple bounds will occur between adjoining carbon atoms, giving the unsat-urated series of fatty acids.Fatty acids are the 'finger prints' of fats and oils and characterize and influence theirphysical and physicochemical properties.As far as the essential fatty acids activity is concerned we should consider five mainlyacids to have activity
linoleica-linoleicarachidonicdocosahexaenoiclinusic acid (hexahydroxy C,, anoxidation product of linolenic acid)
Bioassay carried out in several laboratories led to the hypothesis that activity dependsin some manner on two structural aspects: one the system of polyunsaturation in thealiphatic chain and the other the position of the system relative to the terminal group.It seems that of the two terminals, the CH 3 reference provides the more consistentpattern. It was suggested that, for EFA activity in a naturally occurring fatty acid,there should be unsaturation at both sixth and ninth terms counting from the methylend. This became known as w 6/9 hypothesis.The various acids tested by Thomasson [14] are set out with their assayed activitiesrelative to linoleic acid in the Table 7. A serie of four essential fatty acids have beenidentified which in fact form a biosynthetic pathway in the animal organism
linoleic acid -- y linoleic - homo-y-linolenic - arachidonic
Of these, only linoleic acid is readily available from plant sources and therefore itranks - according to definition - as the prime essential fatty acid which must be presentin the diet. Figure I shows the bioconversion of linoleic acid to arachidonic which isthe starting point in the formation of prostaglandins having physiological significancein ischaemic heart diseases.
47
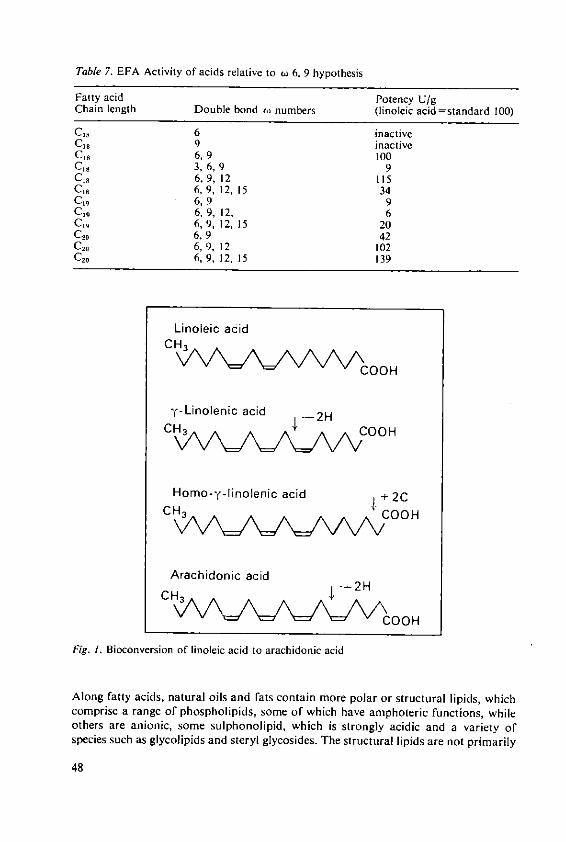
Table 7. EFA Activity of acids relative to o 6, 9 hypothesis
Fatty acid Potency U/gChain length Double bond to numbers (linoleic acid =standard 100)
C,8 6 inactiveC18 9 inactiveCB8 6, 9 100C18 3,6, 9 9C1. 6,9, 12 115CB 6, 9, 12, 15 34CO 6, 9 9C.9 6, 9, 12, 6CO, 6,9, 12, 15 20C2. 6,9 42C2. 6, 9, 12 102C2, 6, 9, 12, 15 139
Linoleic acidCH 3
y-Linolenic acid 2H
CH COOH
Homo-y-linolenic acid + 2CCH3 COOH
Arachidonic acid
CH 32H
" ':= "CO'OH
Fig. I. Bioconversion of linoleic acid to arachidonic acid
Along fatty acids, natural oils and fats contain more polar or structural lipids, whichcomprise a range of phospholipids, some of which have amphoteric functions, whileothers are anionic, some sulphonolipid, which is strongly acidic and a variety ofspecies such as glycolipids and steryl glycosides. The structural lipids are not primarily
48
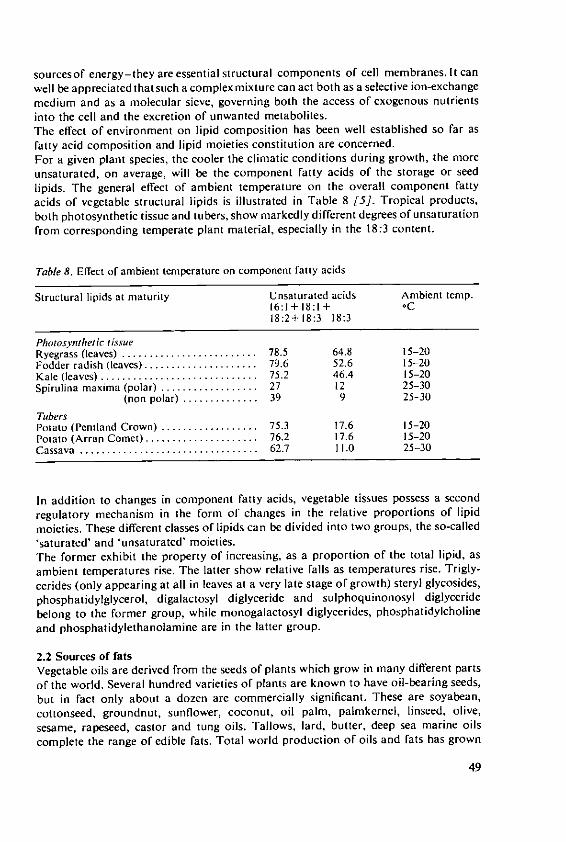
sourcesof energy-they are essential structural components of cell membranes. It canwell be appreciated that such a complex mixture can act both as a selective ion-exchangemedium and as a molecular sieve, governing both the access of exogenous nutrientsinto the cell and the excretion of unwanted metabolites.The effect of environment on lipid composition has been well established so far asfatty acid composition and lipid moieties constitution are concerned.For a given plant species, the cooler the climatic conditions during growth, the moreunsaturated, on average, will be the component fatty acids of the storage or seedlipids. The general effect of ambient temperature on the overall component fattyacids of vegetable structural lipids is illustrated in Table 8 [5]. Tropical products,both photosynthetic tissue and tubers, show markedly different degrees of unsaturationfrom corresponding temperate plant material, especially in the 18:3 content.
Table 8. Effect of ambient temperature on component fatty acids
Structural lipids at maturity Unsaturated acids Ambient temp.16:1+18:1+ oC18:2+ 18:3 18:3
Photosynthetic tissueRyegrass (leaves) ......................... 78.5 64.8 15-20Fodder radish (leaves) ..................... 79.6 52.6 15-20Kale (leaves) ............................. 75.2 46.4 15-20Spirulina maxima (polar) .................. 27 12 25-30
(non polar) .............. 39 9 25-30
TubersPotato (Pentland Crown) .................. 75.3 17.6 15-20Potato (Arran Comet) ..................... 76.2 17.6 15-20Cassava ................................. 62.7 11.0 25-30
In addition to changes in component fatty acids, vegetable tissues possess a secondregulatory mechanism in the form of changes in the relative proportions of lipidmoieties. These different classes of lipids can be divided into two groups, the so-called'saturated' and 'unsaturated' moieties.The former exhibit the property of increasing, as a proportion of the total lipid, asambient temperatures rise. The latter show relative falls as temperatures rise. Trigly-
cerides (only appearing at all in leaves at a very late stage of growth) steryl glycosides,phosphatidylglycerol, digalactosyl diglyceride and sulphoquinonosyl diglyceridebelong to the former group, while monogalactosyl diglycerides, phosphatidylcholineand phosphatidylethanolamine are in the latter group.
2.2 Sources of fatsVegetable oils are derived from the seeds of plants which grow in many different partsof the world. Several hundred varieties of plants are known to have oil-bearing seeds,but in fact only about a dozen are commercially significant. These are soyabean,cottonseed, groundnut, sunflower, coconut, oil palm, palmkernel, linseed, olive,sesame, rapeseed, castor and tung oils. Tallows, lard, butter, deep sea marine oilscomplete the range of edible fats. Total world production of oils and fats has grown
49
exponentially over the past 20 years and has now reached 48 million tons (30 milliontons of vegetable origin). If we could distribute this amount of visible vegetable fatevenly to the total world population, it would mean a daily ration of 22 g of vegetablefat or the equivalent of ca. 200 calories for each human being. Vegetable oils areexpected to increase most, up to 25% above present levels by 1995 whilst, in contrast,animal fats are expected to decrease by 10% by 1985 and then remain steady: onmedian values a decrease of 25% is forecast also for marine oils from current species.As far as the trends in the oil and fat consumption are concerned, the change consideredmost likely is an increase in the average level of polyunsaturated fatty acids in fats:a 60% increase in utilization of oils and fats as texture and flavour modifiers forvegetable protein and simulated meat is foreseen, but practically no increase isanticipated in regard to their use as cooking medium.Fats and oils, in addition to being important nutrients, play a vital role in the function-al, organoleptic or textural properties of many foods. Without them high fat productssuch as butter, margarine or mayonnaise would be non existent. Other productssuch as chocolate, confectionery, coatings, cookies and cakes would be drasticallyaltered in their characteristics.Other foods which are formulated or blended may require the addition of specialityfats to provide desirable properties.
2.3 TechnologyWithout going into the specific problems of fat refining (neutralizing, bleaching,deodorizing) some new technical modifications of oils should be mentioned after abrief look at fat technology.Extraction is done by solvent, expeller systems or even pressing (see cocoa butter):animal fats are obtained from animal tissues by wet and dry rendering. The purifi-cation of fats is undertaken for the purpose of removing the following constituentspresent in crude oils:
- suspended and colloidal dissolved matter (settling, degumming, acid wash)- free fatty acids (de-acidification)- colour (bleaching)- odour (deodorizing)- saturated glycerides commonly known as 'stearines' (winterizing)
Selective hydrogenation can be used to improve the oxidative stability of an unsat-urated oil such as soya bean, while maintaining liquidity [6]. Partial hydrogenationunder non selective conditions can be used to impart properties of plasticity. Thehydrogenation reactions have been studied extensively regarding selectivity, isomer-ization and the mechanism of catalysis.When reduction was incomplete it was found that the polyethenoid centers wereeliminated before appreciable amounts of fully saturated components were formed.Simultaneously with this selective hydrogenation there proceeds isomerization, partic-ularly pronounced regarding conversion from cis- to trans-isomers. Hydrogenation orpartial hydrogenation of fatty oils is carried out on a large scale particularly inprocessing shortenings, margarine and soap fats.Thermomechanical approaches such as distillation and crystallisation will be enhancedfor the use of standard oils, by giving the possibility to obtain modified fats and fatfractions for specific purposes.
50
Fractional crystallisation is a thermomechanical separation process, where componenttriglycerides of fats and oils are crystallised from either a melt or a solution in anorganic solvent. When fractionation is accomplished via partial solidification andmechanical separation (centrifuging or pressing) the process is termed 'dry fraction-ation', when an organic solvent is used, the process is commonly referred as 'solventfractionation'[7]. Fractionated products are the so-called 'hard butters' giving com-pound coatings with melt characteristics and hardness comparing favourably withchocolate.Cow milk fat and palm oil also leave after crystallisation some interesting fractionsfor specific use in foods. Physical and chemical characteristics of palm oil, for instance,allow it to be used in a wide variety of applications [18]. Considerable research workhas been done and additional work is underway to enhance the quality of palm oiland improve the properties desired in end - use markets [8].Palm oil is solid at room temperature. It has a melting point of 40.50 C. The smokepoint is 221°C, which makes it desirable for deep fat frying operations such as potatochips or other snack type foods. Shortenings made from palm oil may be hydrogenatedto decrease unsaturation and improve oxidative stability for a longer shelf life.Shortenings made with palm oil have excellent plasticity and yield high quality endproducts.Using palm oil as a major food ingredient, fat systems have been designed for use inbakery products, icings, filling creams, cookies, cakes, puff pastry, and general purposeshortening uses as well as frying. Palm oil has also been used as a minor ingredient inmargarine oil, coffee whitener fats, hard butters, and pan lubricants.The steam refining processes developed in the U.S. when applied to crude palm oilhave resulted in major improvements in the quality of palm oil.They have had a beneficial effect both on flavour and colour of palm oil.This refiningtreatment now gives palm oil a bland flavour and a more desirable colour than waspreviously possible. These were formerly two major weaknesses of palm oil and pre-vented wider use in shortening and margarine.Recent work has successfully fractionated palm oil [9], resulting in a liquid oilcomparable to peanut or olive oil in consistency and melting characteristics. Manu-facturers are able to produce a liquid palm oil with specific desirable characteristicsat low temperatures. This is being done in Europe at the present time and could spreadto the U.S. in the near future. This enables palm oil to penetrate the cooking andsalad oil market, a major market area from which it was previously excluded. Theseliquid palm oils will have applications as frying oils, margarine oils, cracker sprayoils, and consumer salad oils.One inherent drawback of palm oil, even though it is a vegetable oil, is that it is asaturated oil. Consumer groups and health oriented groups are concerned about thepossible increase in saturated fat intake raising the cholesterol level in the diet andthereby possibly increasing liability to heart attack. Because of consumers' desiresto avoid this potential danger the Food and Drug Administration recently issued aregulation requiring that beginning on January 1, 1978, all fats and oils contained infood must be identified by source, not merely categorized as vegetable oils or animalfats.The saturated versus unsaturated issue is not as important in shortening as it is inother major edible fat products. All of the oil used in manufacturing vegetable short-ening and much of the oil used in making margarine must be hardened to produce
51
these semisolid plastic products. Therefore, the use of unsaturated oils to producethese products becomes less relevant. At the present time, shortening is by far thelargest use of palm oil and palm oil's saturation should not be a barrier to its use inthe market.However, many people do not realize that oils are hardened by the hydrogenationprocess, which adds hydrogen to the unsaturated fatty acids and makes them intomore saturated fatty acids. Hydrogenation improves the stability and color as wellas achieving varying degrees of firmness. Oil products produced in this manner arelabeled hydrogenated or partially hydrogenated.For other fat food products which are liquid, such as cooking oil and salad oil dressing,the degree of unsaturation of the vegetable oil from which the product is manufacturedis an important consideration to persons seeking to avoid highly saturated foods.Liquid oils which are not hydrogenated are also used in making some margarines.In these uses, soyabean oil would be more beneficial than palm or coconut oil. Saf-flower, sunflower, and corn oil would be even more beneficial than soybean oil. Ifbecause of price or other factors it becomes advantageous to use large quantities ofpalm oil in cooking and salad oils and margarine, its high saturation may have asignificant restraining effect on its use.
2.4 CultureUnder technological improvement new developments in the growing of oil seedsshould be mentioned, namely the development of varieties with increased resistanceto pests, the control of fatty acid composition of oils from advances in breedingtechniques [15] the use of potassium fertilizers to increase the resistance of somevegetable oil materials to diseases.The study of the variability of fatty acid composition within origins and hybridsshows that it is possible to obtain rapid improvement in the unsaturated fatty acidcontent. The correlations between fatty acids, the relationships between fatty acidsand the oil yield components and the estimation of the heritability of the differentfatty acids provide the bases for a selection programme for seed production and long-term improvement.The variability of E. guineeisis is limited, and it seems indispensable to resort tohybridization with E. melanococcato obtain almost fluid oils. A programmealong theselines is now being implemented [/0].Moreover the use of potassium fertilizers can reduce the severity of attack by Fusarianoxysporum as demonstrated by fertilizer experiments carried out in the Ivory Coast.At high rates of potassium fewer trees were attacked by Fusaritm than at low rates.Leaf analysis which enables measurement of the uptake of potassium shows that alevel of 0.9% K is equally critical both for yield and resistance to Fusarium.Moreover significant variation in fatty acid composition occurs within the seed oilsof the Brassica genus, which includes the mustards and rapeseed [11]. Research intothe inheritance and biosynthesis of fatty acids has shown that at least two biosyntheticpathways exist in the developing rapeseed and some of the steps are under directgenetic control. The plant breeder has the basic knowledge in this oilseed crop toproduce seed oils with defined fatty acid composition, ard a practical example is thecommercial development of Canbra oil, the rapeseed oil from which erucic acid hasbeen eliminated.
52
Advances in crop management and plant breeding have resulted in a 40 to 50%increase in seed yield over the past 25 years. In the next 10 to 15 years, application ofnewer plant-breeding techniques will result in varieties even higher in yield and seedwith improved oil and meal quality. Some of the quality improvements will be newpatterns in fatty acid composition, higher oil and better organoleptic qualities.
3. Carbohydrates
Starches, gums and sugars are the most important food carbohydrates. Native starchesnormally occur in cereals and roots together with variable amounts of protein, saltsand cellulose fibre and as such are either used directly, as for example wheat inwholemeal bread, barley in brewing, maize in grain whisky, or are separated by wetmilling to recover the native starch in a condition as pure as possible, for examplemaize starch (corn flour) and potato starch.Reliable statistics on world production and trade in starch, starch-derived productsand by-products are not available. An attempt to obtain data on a country basis hasproven difficult, due either to the absence of the statistics or because of legislationprohibiting their release. Annual world starch production has been estimated at22 900 million pounds [12], the United States is the largest starch producing countryof the world followd by Japan, the Netherlands and the United Kingdom.On a per capita basis, production of starch and starch-derived products in mostcountries ranges from 5 to 35 pounds per year with industrialized countries generallyreporting higher output. The Netherlands export large quantities of starch andstarch-derived products which account for its relatively high per capita productionfigure. Thailand, the only less developed country on the list, also reports large exports.
3.1 Sources of starchStarch can be extracted commercially from many raw materials including maize,cassava root, potatoes, and wheat [16]. The manufacture of starch from these rawmaterials usually represents less than 5% of their total usage. Because of the wideavailability of raw materials and the interchangeability of starch, the raw material isless important than the establishment of a starch industry using indigenous rawmaterials.World production of starch is based largely on maize because this cereal is widelyavailable as an economic source of raw material. In the United States alone approxi-mately 275 million bushels of maize were used by the American cornstarch industryin 1970.Corn starch industries also exist in most European and Latin American countries andin Canada. In most cases, these industries use domestically produced maize.Potatoes follow maize as the most important source of starch. The Netherlands,Japan, France and Poland are important producers of potato starch. While the situationis unclear in Poland, government policies in Japan, the Netherlands, and France haveencouraged the production of starch from potatoes at the expense of more economicalraw materials such as maize. Small quantities of potato starch are produced in NorthAmerica.Starch is produced from wheat in several countries including Australia and NewZealand where it is the major source. In north America small quantities of wheat
53
starch are produced; because of the higher cost of wheat compared to maize as a rawmaterial and the demand for wheat gluten (a joint product in the separation of starchfrom wheat) production is limited. Several European countries also produce smallquantities of wheat starch.The cassava plant [14], which originated in South America, has spread to many otherparts of the world. The major countries producing cassava are Brazil, Thailand,Indonesia, Madagascar, Malaysia, the Philippines and some African countries. Theplant is known as manioca, yuca, or cassava; the starch is known as tapioca. Thestarch occurs in the tuberous root which consists largely of starch (32%) and water(65%) with small amounts of protein, fat, fibre, and ash (all 1% or less). Starchseparation is simple and inexpensive and generally is carired out as a rural industry.In most areas of production, the cassava root serves as a dietary staple. Except forThailand only a small proportion of cassava root production actually enters thestarch industry.
3.2 TechnologyStarch is modified by chemical or physical treatments, i.e. degradation of macromo-lecules - to enable increased solids without high viscosity - or oxidation of a few sidechains in the molecule to interfere with retrogradation, and in more recent times theformation of ester or ether linkages - the so-called cross bonded starches for specialuses in frozen foods, sauces, foodstuffs with low pH, condensed soup, fillings. Manygums, moreover, have a synergistic effect on starch systems; pectins alginates orcarageenan/locust bean combinations have interesting properties. By adding 10%alginate to selected starches with a small amount of calcium salt and a phosphatechelating agent, gels with superior properties are obtained. Splitting starch moleculesenables us to obtain the most important class of carbohydrates other than starchesand gums, namely the sugars.The principal commercial sugars with annual production over 75 million tons [12]are, of course, sucrose (from cane and subsequently from beet) with natural honeyand invert sugar (essentially dextrose and laevulose familiar to all). Over the next fiveyears, four key factors will determine their prices and use namely: Internationalagreements, consumer resistance to high prices, consumer and industrial hoarding,competitive influence of other natural or synthetic sweeteners, i.e., high fructose cornsyrup [13].Production of starch sweeteners is shifting from acid to enzyme hydrolysis. Totalproduction from both types increased steadily, for example in Japan, during the midsixties from 1201 million pounds in 1963 to 1693 million pounds in 1968. It is inter-esting to note that starch sweeteners accounted for 25.2% of total sweetener productionin Japan in 1969 while the comparable percentage in Canada was 7.4.In the past 20 years tremendous technological achievements have been and are stillbeing made using first acid/enzyme and later enzyme/enzyme systems to control thehydrolysis and produce almost any combination of mono-, di-, tri-higher saccharides.The action of alpha-amylase enzyme on starch is essentially one of liquefaction andis followed bybeta-amylase, accordingto the time and temperature of conversion, theresulting syrup can have a high proportion of nialtose. Amyloglucosidase (glucamylase)can convert starch to essentially dextrose.More recently, due to continued discovery and application of new enzymes, more andmore sugars are becoming available. Enzymic production of fructose (glucose iso-
54
merase) [13] has allowed the economic production from starch of syrups containinghigh amounts of laevulose and it is reported that 1.9 million tons/year are producedby this route. Other alternative techniques (divinylbenzene resin - oxidation togluconic acid and separation of calcium salts) allow us to obtain fructose from invertsyrup or dextrose.The economic production of dextrose, fructose, maltose and xylose, either collectivelyin syrups or as individual sugars, allows further developments by hydrogenation.Dextrose yields sorbitol, maltose-maltitol, xylose-xylitol, lactose-lactitol and fructose-mannitol etc. These are of course no longer carbohydrates, but are being activelyinvestigated as diabetic foods, low calorie foods and anticarcinogenic sweets.We should mention here the starch hydrolysates which have wide applications in
many food industries: e.g. confectionery (30%), baking (16%) canning (15%), etc.Glucose syrup made from starch is called 'corn syrup'. The corn industry definitionplaces a lower limit of 20 DE on the syrup. The lower conversion products are called
maltodextrins. The dextrose equivalent (DE) is defined as the percentage of reducing
sugars in the syrup calculated as dextrose on a dry weight basis but the compositionof two syrups with the same DE can be completely different, depending on the methodof preparation.High fructose corn syrup [13] obtained by partial enzymatic isomerization of glucosewas introduced three years ago and has proved to be an economical and functionalreplacement for sucrose and invert sugar (sucrose hydrolysate). Its composition is 42%fructose, 50% glucose, 8% isomaltose (mostly). Isomerose can be interchanged with
sucrose or invert sugar on a solid weight basis without change in sweetness. Estimated
production in America (1978:2 350 000 tons dry weight.High fructosecornsyrupdoes not possess the same functionality as crystalline fructose.
The unique physical, chemical, and metabolic properties of pure fructose presentspecialty application possibilities not feasible with high-fructose corn syrup (HFCS).While HFCS is about as sweet as sucrose, pure fructose is about 50% sweeter and can
be used at lower levels to give the same sweetness. HFCS competes primarily on a
direct cost basis with liquid sugars in a variety of traditional food uses and is presentlyused in liquid processes, whereas pure fructose can be used in either dry or liquid
form, primarily in special dietary foods and pharmaceutical applications. Pure fructoseis being used in dietetic candy and ice cream, and can supplement HFCS in beverages.The average fructose content in common fruits is given in Table 9. Fructose is the
most water-soluble of all sugars and dissolves readily even in cool media. In addition,it is very hygroscopic, a property which makes it an excellent humectant for use in
baked goods and confectionery. Fructose is also soluble in ethyl alcohol at up to
6.71 ml at 18'C. The viscosity of fructose solutions is markedly lower than that of
sucrose solutions. Water solutions of fructose are thus technically quite easily handled
over a wide range of temperatures and concentrations. Compared with either sucrose
or dextrose, fructose also has a fairly wide metastable range; this is advantageous in
processes where high sugar concentrations are desired, since it will not crystallize outof solution during shipment and storage.
3.3 Culture
3.3.1 Sugar beetBreeding of monogerm varieties, precision seed, chemical weed control, mechanicalharvest are factors to be considered as technical improvements in the starch and sugar
55
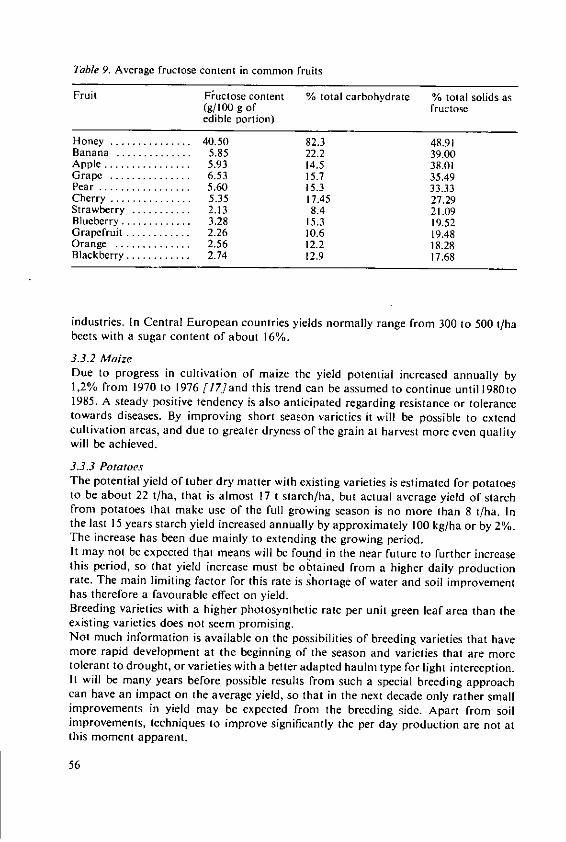
Table 9. Average fructose content in common fruits
Fruit F'uctose content % total carbohydrate % total solids as(g/100 g of fructoseedible portion)
Honey ............... 40.50 82.3 48.91Banana .............. 5.85 22.2 39.00Apple ................ 5.93 14.5 38.01Grape ............... 6.53 15.7 35.49Pear ................. 5.60 15.3 33.33Cherry ............... 5.35 17.45 27.29Strawberry ........... 2.13 8.4 21.09Blueberry ............. 3.28 15.3 19.52Grapefruit ............ 2.26 10.6 19.48Orange .............. 2.56 12.2 18.28Blackberry ............ 2.74 12.9 17.68
industries. In Central European countries yields normally range from 300 to 500 t/habeets with a sugar content of about 16%.
3.3.2 MaizeDue to progress in cultivation of maize the yield potential increased annually by1,2% from 1970 to 1976 fI7Jand this trend can be assumed to continue until 1980to1985. A steady positive tendency is also anticipated regarding resistance or tolerancetowards diseases. By improving short season varieties it will he possible to extendcultivation areas, and due to greater dryness of the grain at harvest more even qualitywill be achieved.
3.3.3 PotatoesThe potential yield of tuber dry matter with existing varieties is estimated for potatoesto be about 22 t/ha, that is almost 17 t starch/ha, but actual average yield of starchfrom potatoes that make use of the full growing season is no more than 8 t/ha. Inthe last 15 years starch yield increased annually by approximately 100 kg/ha or by 2%.The increase has been due mainly to extending the growing period.It may not be expected that means will be found in the near future to further increasethis period, so that yield increase must be obtained from a higher daily productionrate. The main limiting factor for this rate is shortage of water and soil improvementhas therefore a favourable effect on yield.Breeding varieties with a higher photosynthetic rate per unit green leaf area than theexisting varieties does not seem promising.Not much information is available on the possibilities of breeding varieties that havemore rapid development at the beginning of the season and varieties that are moretolerant to drought, or varieties with a better adapted haulm type for light interception.It will be many years before possible results from such a special breeding approachcan have an impact on the average yield, so that in the next decade only rather smallimprovements in yield may be expected from the breeding side. Apart from soilimprovements, techniques to improve significantly the per day production are not atthis moment apparent.
56
3.3.4 WheatHigh standards in breeding and production technology have raised wheat productionover the past twenty years. Wheat varieties were successfully bred for every techno-logical purpose. At the same time, cultivation systems were designed to take thesevarieties to the highest productivity.Wheat production for the Common Market Countries was at 24.4 million tons in1958-1961, which corresponds to an area yield of 2.29 t/ha. In 1970 production wentup to 29.7 million tons at a yield of 3.05 t/ha. The 1975 crop brought a production of33 million tons at an area yield of 3.75 t/ha. Individual regions have yields - 5-6 t/haannually. So, over the indicated period of time, area productivity was increased bymore than 60%. This makes the Common Market Countries twice as successful asthe classical wheat production countries of the USA and Canada.The figures as mentioned above show the enormous production reserves inherent inthe species of wheat. Novel breeds and new knowledge in production technologylead to expectations of a production increase of approximately 2%. There are alreadywheat varieties which give yields of more than 10 t/ha under practical conditions,their genetic potential being only exhausted by 50%.Under current conditions, approx. 2.8 to 3.0 t/ha starch can be produced from wheat.However, there are regions of cultivation which could produce 4 to 6 t/ha starch.This makes wheat an intruder into yield ranges of other starch carriers, such aspotatoes and maize.Upward trend of yields of rice and wheat in several Asian 'green revolution' countriesis due primarily to the introduction of high yielding varieties, more fertilization andbetter farming practices.
Conclusion
It is clear that there is no area of human health in which research is more urgentlyneeded than in the nutritional requirements of representative human populations overthe full range of both health and disease.Clearly we need an adequate knowledge of the amount and kind of food required,and improvement in both agricultural practice and industrial technology to assurenot only the right level of food but also its nutritional and organoleptic characteristics.
References
I. Feron, R.: Ann. Nutr. Alim. 30, 141 (1976)2. Harlan, J.: Scientific American 235 (3), 103 (1976)3. Schrimshaw, N.: Scientific American 235 (3), 51 (1976)4. Thomasson, H.J.: Nature 194, 973 (1962)5. Hudson, B.J.: Chemistry and Industry 18, 763 (1976)6. List, G.R.: J. Am. Oil Ch. Soc. 51, 239 (1974)7. Thomas, A.E.: Chemistry and Industry 18, 774 (1976)8. Baltes, J.: Revue Fse. Corps Gras 22 305 (1976)9. Tirtiaux, F.: Filtration in the refinery and fractionation of oils and fats, Brussels 1976
10. Meunier. J.: Olagineux 31, 519 (1976)II. Downey. R.K.: J. Am. Oil Chem. Soc. 46, 121 (1969)12. FAO: Production Year Book (1975)
57

13. Junk, M.R. et D.: Handbook Sugars. The AVI Publishing 60, 197314. Nestel, B:. Monograph IDRC, 010e, I1, 197315. Faure, M.F.: World Farming 24, (2) 197616. Haynes, P. H.: SPAN, /7 (3) 116 (1974)17. Carr, W.: SPAN 19 (2) 65 (1976)18. McGuire, E.: Foreign Agriculture 13, (32) 1 (1975)
58
2nd Session
Biochemical and Physiological Aspects ofthe Production of CarbohydratesUsed as Food for Man and Animals:Prospects for ImprovementCo-ordinator: Prof. Dr. R. Bach,
Department of Food Science, Swiss FederalInstitute of Technology, Zurich/Switzerland;Member of the Scientific Board of the Inter-national Potash Institute
Energy Absorption, Energy Conversion, andEnergy Storage of Crops in Relationto Endogenous and Exogenous FactorsK. Mengel, Institut fOr Pflanzenernahrung der Justus-Liebig-Universit~t, Giessen/FederalRepublic of Germany-
Contents
Introduction ............................................................... 62Light absorption.. .............................. ............. ....... . . 63Energy conversion in the photosynthetic process .............................. 66Conversion of photosynthates ................................................ 71Energy storage ............................................................. 73Long distance transport of energy ............................................. 77C onclusion ................................................................ 79
Summary
Not light absorption per se but the conversion of the absorbed light into chemical energy isthe unique feature of photosynthetic organisms. The absorbed light induces an up hill flowof electrons which results in a separation of protons across the thylakoid membrane (osmoticenergy) and in the reduction of NADP + to NADPH (chemical energy). The proton separationbrought about in the thylakoid results in the synthesis of ATP (photo-phosphorylation).Thus the primary energy rich compounds, in which light energy is trapped, are NADPH andATP. The synthesis of both is promoted by potassium. Most important factors influencinglight absorption are the concentration of chloroplasts in leaves, the leaf area and the lightintensity.NADPH and ATP are required for the synthesis of photosynthates (sugars and amino acids).These are the precursors of the reserve material stored in seeds, fruits, tubers, and roots. Thestorage process itself needs energy in form of ATP, NADPH, and similar coenzymes. Therate of storage of chemical energy in storage organs depends on their supply with photo-synthates and energy, but it is also controlled by processes proceeding in the storage organs.The growth of storage organs is much related to the level and turn over of phytohormones.Hence the metabolism of phytohormones is of crucial importance for the storage of chemicalenergy in plants. Endogenous factors, mainly genetically fixed, as well as exogenous factors,which affect the phytohormone turn over, have therefore a bearing on the energy storageprocess. Most important exogenous factors of this kind are water, temperature, and nitrogen.The synthesis of storage material is related to CO, assimilation by a feed back mechanism.High storage rates improve the CO, assimilation. The latter as well as the synthesis of amino
* Prof. Dr. K. Mengeel, Braugasse 7, D-63 Giessen/Federal Republic of Germany,
Institut fOr Pflanzenernihrung der Justus-Liebig-Universitat
61
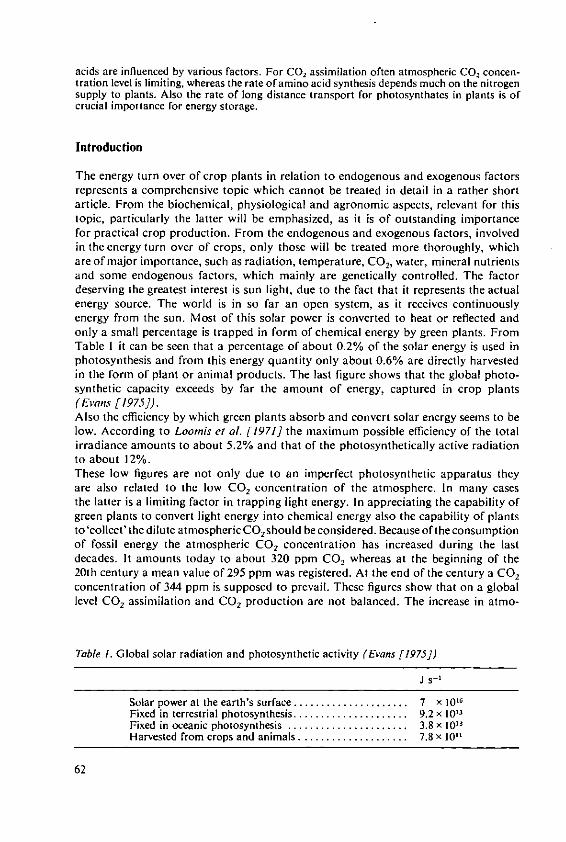
acids are influenced by various factors. For CO2 assimilation often atmospheric CO2 concen-tration level is limiting, whereas the rate of amino acid synthesis depends much on the nitrogensupply to plants. Also the rate of long distance transport for photosynthates in plants is ofcrucial importance for energy storage.
Introduction
The energy turn over of crop plants in relation to endogenous and exogenous factorsrepresents a comprehensive topic which cannot be treated in detail in a rather shortarticle. From the biochemical, physiological and agronomic aspects, relevant for thistopic, particularly the latter will be emphasized, as it is of outstanding importancefor practical crop production. From the endogenous and exogenous factors, involvedin the energy turn over of crops, only those will be treated more thoroughly, whichare of major importance, such as radiation, temperature, CO 2, water, mineral nutrientsand some endogenous factors, which mainly are genetically controlled. The factordeserving the greatest interest is sun light, due to the fact that it represents the actualenergy source. The world is in so far an open system, as it receives continuouslyenergy from the sun. Most of this solar power is converted to heat or reflected andonly a small percentage is trapped in form of chemical energy by green plants. FromTable I it can be seen that a percentage of about 0.2% of the solar energy is used inphotosynthesis and from this energy quantity only about 0.6% are directly harvestedin the form of plant or animal products. The last figure shows that the global photo-synthetic capacity exceeds by far the amount of energy, captured in crop plants(Evans [1975]).Also the efficiency by which green plants absorb and convert solar energy seems to below. According to Loomis et at. [1971] the maximum possible efficiency of the totalirradiance amounts to about 5.2% and that of the photosynthetically active radiationto about 12%.These low figures are not only due to an imperfect photosynthetic apparatus theyare also related to the low CO2 concentration of the atmosphere. In many casesthe latter is a limiting factor in trapping light energy. In appreciating the capability ofgreen plants to convert light energy into chemical energy also the capability of plantsto'collect' the dilute atmospheric CO, should be considered. Because of the consumptionof fossil energy the atmospheric CO2 concentration has increased during the lastdecades. It amounts today to about 320 ppm CO2 whereas at the beginning of the20th century a mean value of 295 ppm was registered. At the end of the century a CO2concentration of 344 ppm is supposed to prevail. These figures show that on a globallevel CO2 assimilation and CO, production are not balanced. The increase in atmo-
Table 1. Global solar radiation and photosynthetic activity (Evans [1975])
J s- 1
Solar power at the earth's surface ..................... 7 X 10⁶Fixed in terrestrial photosynthesis ..................... 9.2 x 10'WFixed in oceanic photosynthesis .................... 3.8 x t 3
Harvested from crops and animals .................... 7.8 x 10¹¹
62
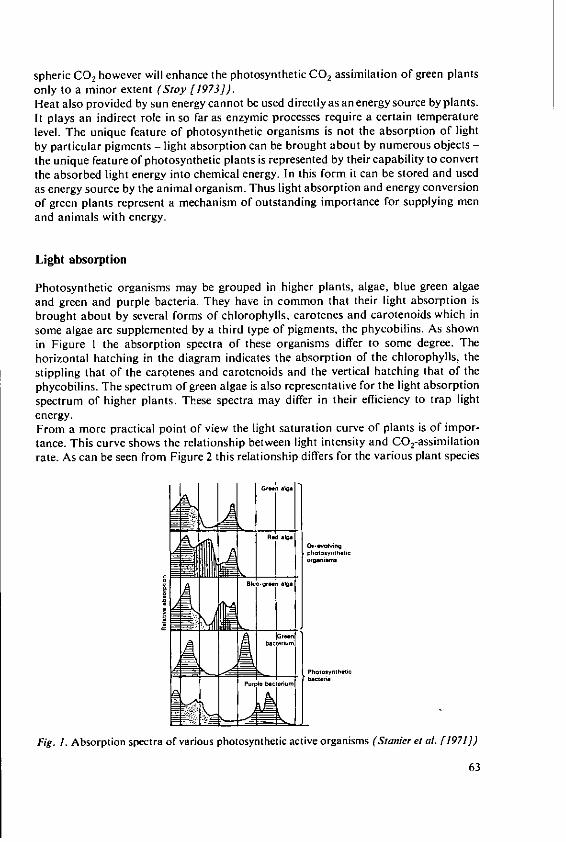
spheric CO2 however will enhance the photosynthetic CO2 assimilation of green plantsonly to a minor extent (Stoy [1973]).Heat also provided by sun energy cannot be used directly as an energy source by plants.It plays an indirect role in so far as enzymic processes require a certain temperaturelevel. The unique feature of photosynthetic organisms is not the absorption of lightby particular pigments - light absorption can be brought about by numerous objects -the unique feature of photosynthetic plants is represented by their capability to convertthe absorbed light energy into chemical energy. In this form it can be stored and usedas energy source by the animal organism. Thus light absorption and energy conversionof green plants represent a mechanism of outstanding importance for supplying menand animals with energy.
Light absorption
Photosynthetic organisms may be grouped in higher plants, algae, blue green algaeand green and purple bacteria. They have in common that their light absorption isbrought about by several forms of chlorophylls, carotenes and carotenoids which insome algae are supplemented by a third type of pigments, the phycobilins. As shownin Figure I the absorption spectra of these organisms differ to some degree. Thehorizontal hatching in the diagram indicates the absorption of the chlorophylls, thestippling that of the carotenes and carotenoids and the vertical hatching that of thephycobilins. The spectrum of green algae is also representative for the light absorptionspectrum of higher plants. These spectra may differ in their efficiency to trap lightenergy.From a more practical point of view the light saturation curve of plants is of impor-tance. This curve shows the relationship between light intensity and CO-assimilationrate. As can be seen from Figure 2 this relationship differs for the various plant species
Sphotosynthetic
allil~m
Photosyttheic
Fig. 1. Absorption spectra of various photosynthetic active organisms (Starter et al. [1971])
63
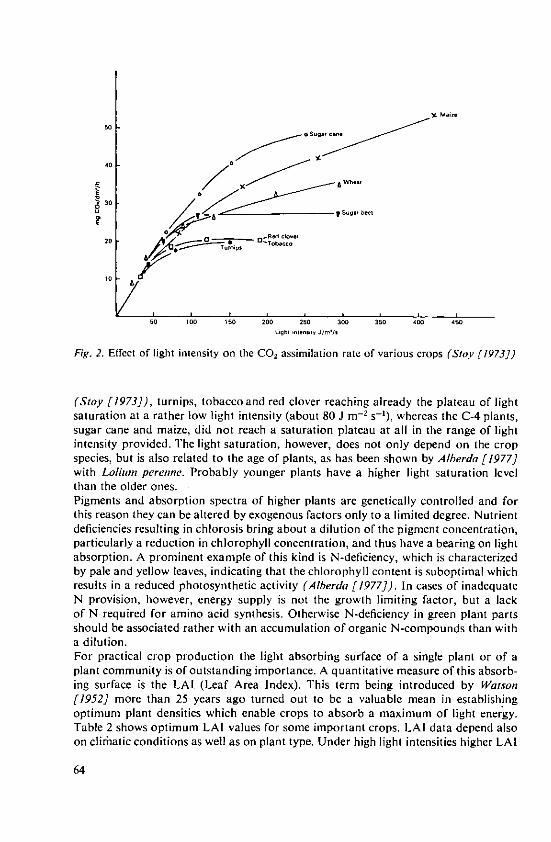
6 30
-Red coe
20 D< t 0Tobacco
1.0
50 100 150 200 25 300 350 4W0 *50
Fig. 2. Effect of light intensity on the CO, assimilation rate of various crops (Stoy [1973])
(Stoy [1973]), turnips, tobacco and red clover reaching already the plateau of lightsaturation at a rather low light intensity (about 80 J m- 2 s-'), whereas the C-4 plants,sugar cane and maize, did not reach a saturation plateau at all in the range of lightintensity provided. The light saturation, however, does not only depend on the cropspecies, but is also related to the age of plants, as has been shown by Alberda [1977]with Lolium perenne. Probably younger plants have a higher light saturation levelthan the older ones.Pigments and absorption spectra of higher plants are genetically controlled and forthis reason they can be altered by exogenous factors only to a limited degree. Nutrientdeficiencies resulting in chlorosis bring about a dilution of the pigment concentration,particularly a reduction in chlorophyll concentration, and thus have a bearing on lightabsorption. A prominent example of this kind is N-deficiency, which is characterizedby pale and yellow leaves, indicating that the chlorophyll content is suboptimal whichresults in a reduced photosynthetic activity (Alberda [1977]). In cases of inadequateN provision, however, energy supply is not the growth limiting factor, but a lackof N required for amino acid synthesis. Otherwise N-deficiency in green plant partsshould be associated rather with an accumulation of organic N-compounds than witha dilution.For practical crop production the light absorbing surface of a single plant or of aplant community is of outstanding importance. A quantitative measure of this absorb-ing surface is the LAI (Leaf Area Index). This term being introduced by Watson[1952] more than 25 years ago turned out to be a valuable mean in establishingoptimum plant densities which enable crops to absorb a maximum of light energy.Table 2 shows optimum LAI values for some important crops. LAI data depend alsoon clitriatic conditions as well as on plant type. Under high light intensities higher LAI
64
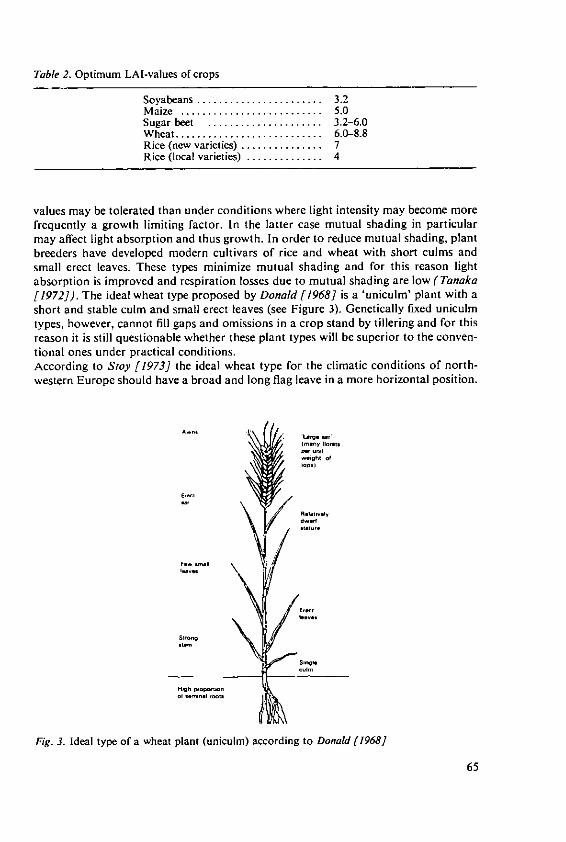
Table 2. Optimum LA-values of crops
Soyabeans ....................... 3.2M aize .......................... 5.0Sugar beet ..................... 3.2-6.0W heat ........................... 6.0-8.8Rice (new varieties) ............... 7Rice (local varieties) .............. 4
values may be tolerated than under conditions where light intensity may become morefrequently a growth limiting factor. In the latter case mutual shading in particularmay affect light absorption and thus growth. In order to reduce mutual shading, plantbreeders have developed modern cultivars of rice and wheat with short culms andsmall erect leaves. These types minimize mutual shading and for this reason lightabsorption is improved and respiration losses due to mutual shading are low (Tanaka[1972]). The ideal wheat type proposed by Donald [1968] is a 'uniculm' plant with ashort and stable culm and small erect leaves (see Figure 3). Genetically fixed uniculmtypes, however, cannot fill gaps and omissions in a crop stand by tillering and for thisreason it is still questionable whether these plant types will be superior to the conven-tional ones under practical conditions.According to Stoy [1973] the ideal wheat type for the climatic conditions of north-western Europe should have a broad and long flag leave in a more horizontal position.
.1.. ' -
I ~
Fig. 3. Ideal type of a wheat plant (uniculm) according to Donald [1968]
65
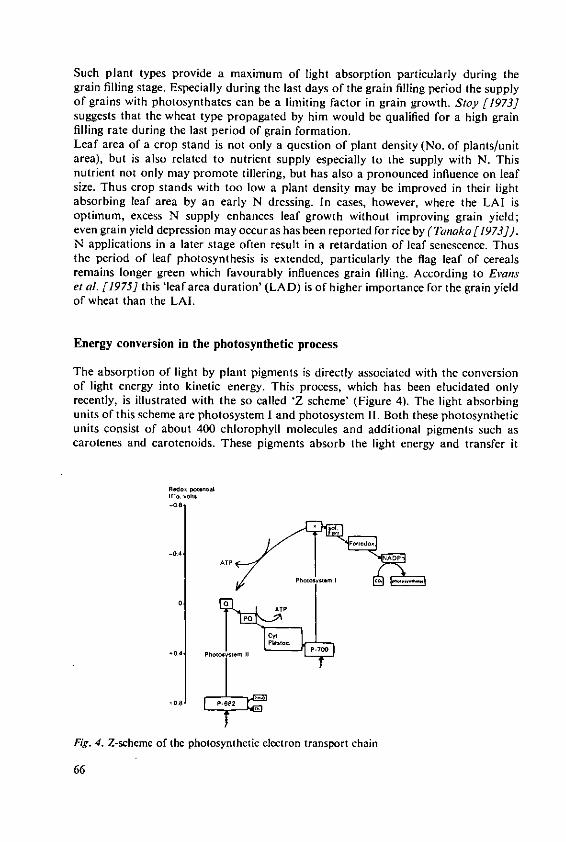
Such plant types provide a maximum of light absorption particularly during thegrain filling stage. Especially during the last days of the grain filling period the supplyof grains with photosynthates can be a limiting factor in grain growth. Stoy [1973]suggests that the wheat type propagated by him would be qualified for a high grainfilling rate during the last period of grain formation.Leaf area of a crop stand is not only a question of plant density (No. of plants/unitarea), but is also related to nutrient supply especially to the supply with N. Thisnutrient not only may promote tillering, but has also a pronounced influence on leafsize. Thus crop stands with too low a plant density may be improved in their lightabsorbing leaf area by an early N dressing. In cases, however, where the LAI isoptimum, excess N supply enhances leaf growth without improving grain yield;even grain yield depression may occur as has been reported for rice by (Tanaka [1973]).N applications in a later stage often result in a retardation of leaf senescence. Thusthe period of leaf photosynthesis is extended, particularly the flag leaf of cerealsremains longer green which favourably influences grain filling. According to Evanset al. [1975] this 'leaf area duration' (LAD) is of higher importance for the grain yieldof wheat than the LAI.
Energy conversion in the photosynthetic process
The absorption of light by plant pigments is directly associated with the conversionof light energy into kinetic energy. This process, which has been elucidated onlyrecently, is illustrated with the so called Z scheme' (Figure 4). The light absorbingunits of this scheme are photosystem I and photosystem I1. Both these photosyntheticunits consist of about 400 chlorophyll molecules and additional pigments such ascarotenes and carotenoids. These pigments absorb the light energy and transfer it
Redo, pot.tial
-08
-04 NADP
ATP
Phnts. I
0ATP
Pa
Cyl
0140+04 Photo,trnI
+ 08 P82
Fig. 4. Z-scheme of the photosynthetic electron transport chain
66
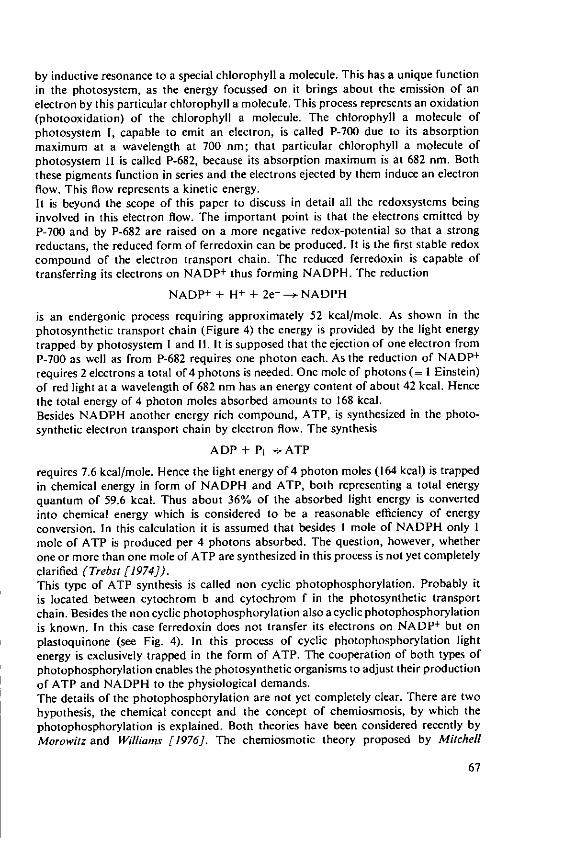
by inductive resonance to a special chlorophyll a molecule. This has a unique functionin the photosystem, as the energy focussed on it brings about the emission of anelectron by this particular chlorophyll a molecule. This process represents an oxidation(photooxidation) of the chlorophyll a molecule. The chlorophyll a molecule ofphotosystem I, capable to emit an electron, is called P-700 due to its absorptionmaximum at a wavelength at 700 nm; that particular chlorophyll a molecule ofphotosystem 11 is called P-682, because its absorption maximum is at 682 nm. Boththese pigments function in series and the electrons ejected by them induce an electronflow. This flow represents a kinetic energy.It is beyond the scope of this paper to discuss in detail all the redoxsystems beinginvolved in this electron flow. The important point is that the electrons emitted byP-700 and by P-682 are raised on a more negative redox-potential so that a strongreductans, the reduced form of ferredoxin can be produced. It is the first stable redoxcompound of the electron transport chain. The reduced ferredoxin is capable oftransferring its electrons on NADP+ thus forming NADPH. The reduction
NADP+ + H+ + 2e--- NADPH
is an endergonic process requiring approximately 52 kcal/mole. As shown in thephotosynthetic transport chain (Figure 4) the energy is provided by the light energytrapped by photosystem I and 11. It is supposed that the ejection of one electron fromP-700 as well as from P-682 requires one photon each. As the reduction of NADP±requires 2 electrons a total of 4 photons is needed. One mole of photons (= I Einstein)of red light at a wavelength of 682 nm has an energy content of about 42 kcal. Hencethe total energy of 4 photon moles absorbed amounts to 168 kcal.Besides NADPH another energy rich compound, ATP, is synthesized in the photo-synthetic electron transport chain by electron flow. The synthesis
ADP + Pi--:ATP
requires 7.6 kcal/mole. Hence the light energy of 4 photon moles (164 kcal) is trappedin chemical energy in form of NADPH and ATP, both representing a total energyquantum of 59.6 kcal. Thus about 36% of the absorbed light energy is convertedinto chemical energy which is considered to be a reasonable efficiency of energyconversion. In this calculation it is assumed that besides I mole of NADPH only Imole of ATP is produced per 4 photons absorbed. The question, however, whetherone or more than one mole of ATP are synthesized in this process is not yet completelyclarified (Trebst [1974]).This type of ATP synthesis is called non cyclic photophosphorylation. Probably itis located between cytochrom b and cytochrom f in the photosynthetic transportchain. Besides the non cyclic photophosphorylation also acyclic photophosphorylationis known. In this case ferredoxin does not transfer its electrons on NADP + but onplastoquinone (see Fig. 4). In this process of cyclic photophosphorylation lightenergy is exclusively trapped in the form of ATP. The cooperation of both types ofphotophosphorylation enables the photosynthetic organisms to adjust their productionof ATP and NADPH to the physiological demands.The details of the photophosphorylation are not yet completely clear. There are twohypothesis, the chemical concept and the concept of chemiosmosis, by which thephotophosphorylation is explained. Both theories have been considered recently byMorowitz and Williamns [1976]. The cheriosmotic theory proposed by Mitchell
67
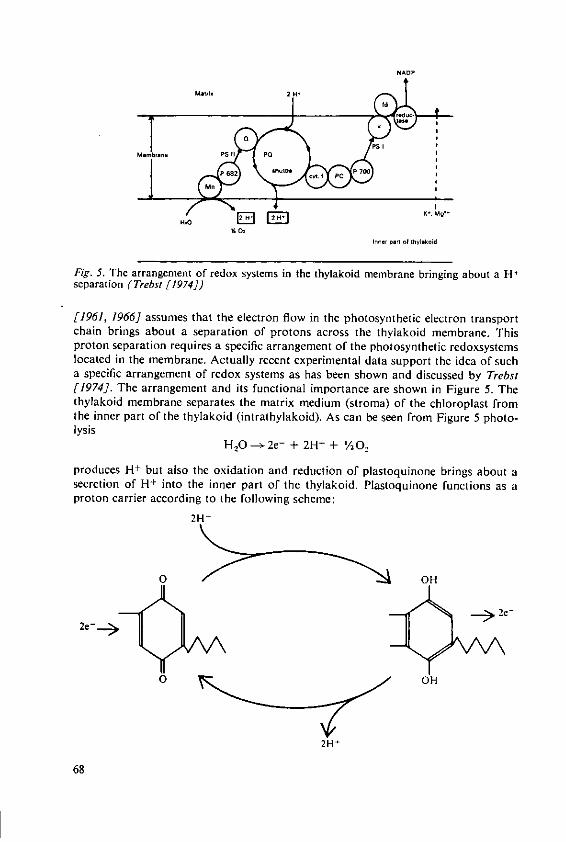
NAOP
MIr1b pa PS I1
I p-
H4 0
Inner pnrt of thyltkoid
Fig. 5. The arrangement of redox systems in the thylakoid membrane bringing about a H +
separation (Trebst [1974])
[1961, 1966] assumes that the electron flow in the photosynthetic electron transportchain brings about a separation of protons across the thylakoid membrane. Thisproton separation requires a specific arrangement of the photosynthetic redoxsystemslocated in the membrane. Actually recent experimental data support the idea of sucha specific arrangement of redox systems as has been shown and discussed by Trebst[1974]. The arrangement and its functional importance are shown in Figure 5. Thethylakoid membrane separates the matrix medium (stroma) of the chloroplast fromthe inner part of the thylakoid (intrathylakoid). As can be seen from Figure 5 photo-lysis
H 2 0- 2e- + 2H + + 1/02
produces H but also the oxidation and reduction of plastoquinone brings about asecretion of H+ into the inner part of the thylakoid. Plastoquinone functions as aproton carrier according to the following scheme:
2H+
O OH
2-
o OH
2H-
68
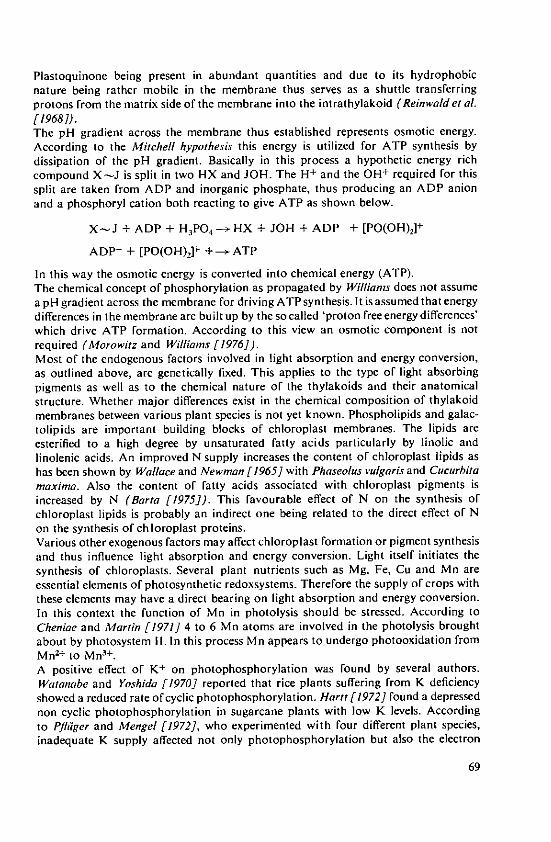
Plastoquinone being present in abundant quantities and due to its hydrophobicnature being rather mobile in the membrane thus serves as a shuttle transferringprotons from the matrix side of the membrane into the intrathylakoid (Reinwaldet al.[1968]).The pH gradient across the membrane thus established represents osmotic energy.According to the Mitchell hypothesis this energy is utilized for ATP synthesis bydissipation of the pH gradient. Basically in this process a hypothetic energy richcompound X-J is split in two HX and JOH. The H+ and the OH + required for thissplit are taken from ADP and inorganic phosphate, thus producing an ADP anionand a phosphoryl cation both reacting to give ATP as shown below.
X-J + ADP + H3PO 4 -+HX + JOH + ADP + [PO(OH)2]+
ADP- + [PO(OH) 2]+ +--ATP
In this way the osmotic energy is converted into chemical energy (ATP).The chemical concept of phosphorylation as propagated by Williams does not assumea pH gradient across the membrane for driving ATP synthesis. It is assumed that energydifferences in the membrane are built up by the so called 'proton free energy differences'which drive ATP formation. According to this view an osmotic component is notrequired (Morowitz and Williams [1976]).Most of the endogenous factors involved in light absorption and energy conversion,as outlined above, are genetically fixed. This applies to the type of light absorbingpigments as well as to the chemical nature of the thylakoids and their anatomicalstructure. Whether major differences exist in the chemical composition of thylakoidmembranes between various plant species is not yet known. Phospholipids and galac-tolipids are important building blocks of chloroplast membranes. The lipids areesterified to a high degree by unsaturated fatty acids particularly by linolic andlinolenic acids. An improved N supply increases the content of chloroplast lipids ashas been shown by Wallace and Newman [1965] with Phaseolus vulgaris and Cucurbitamaxima. Also the content of fatty acids associated with chloroplast pigments isincreased by N (Barta [1975]). This favourable effect of N on the synthesis ofchloroplast lipids is probably an indirect one being related to the direct effect of Non the synthesis of chloroplast proteins.Various other exogenous factors may affect chloroplast formation or pigment synthesisand thus influence light absorption and energy conversion. Light itself initiates thesynthesis of chloroplasts. Several plant nutrients such as Mg, Fe, Cu and Mn areessential elements of photosynthetic redoxsystems. Therefore the supply of crops withthese elements may have a direct bearing on light absorption and energy conversion.In this context the function of Mn in photolysis should be stressed. According toCheniae and Martin [1971] 4 to 6 Mn atoms are involved in the photolysis broughtabout by photosystem II. In this process Mn appears to undergo photooxidation fromMnZ+ to Mns+.
A positive effect of K+ on photophosphorylation was found by several authors.Watanabe and Yoshida [1970] reported that rice plants suffering from K deficiencyshowed a reduced rate of cyclic photophosphorylation. Hartt [1972] found a depressednon cyclic photophosphorylation in sugarcane plants with low K levels. Accordingto Pfliger and Mengel [1972], who experimented with four different plant species,inadequate K supply affected not only photophosphorylation but also the electron
69
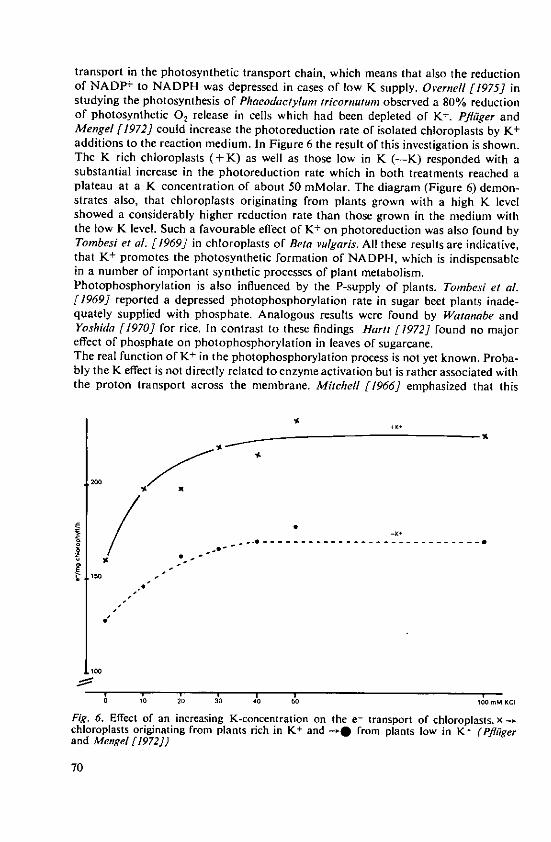
transport in the photosynthetic transport chain, which means that also the reductionof NADP + to NADPH was depressed in cases of low K supply. Overnell [1975] instudying the photosynthesis of Phaeodactylumn tricornutumn observed a 80% reductionof photosynthetic 02 release in cells which had been depleted of K+ . Pfliiger andMengel [1972] could increase the photoreduction rate of isolated chloroplasts by K+
additions to the reaction medium. In Figure 6 the result of this investigation is shown.The K rich chloroplasts (+K) as well as those low in K (-K) responded with asubstantial increase in the photoreduction rate which in both treatments reached aplateau at a K concentration of about 50 mMolar. The diagram (Figure 6) demon-strates also, that chloroplasts originating from plants grown with a high K levelshowed a considerably higher reduction rate than those grown in the medium withthe low K level. Such a favourable effect of K+ on photoreduction was also found byTombesi et al. [1969] in chloroplasts of Beta vulgaris. All these results are indicative,that K+ promotes the photosynthetic formation of NADPH, which is indispensablein a number of important synthetic processes of plant metabolism.Photophosphorylation is also influenced by the P-supply of plants. Tombesi et al.[1969] reported a depressed photophosphorylation rate in sugar beet plants inade-quately supplied with phosphate. Analogous results were found by Watanabe andYoshida [1970] for rice. In contrast to these findings Hartt [1972] found no majoreffect of phosphate on photophosphorylation in leaves of sugarcane.The real function of K+ in the photophosphorylation process is not yet known. Proba-bly the K effect is not directly related to enzyme activation but is rather associated withthe proton transport across the membrane. Mitchell [1966] emphasized that this
t
2W0
I .. ~..------------
0 10 20 30 40 60 100 m M
Fig. 6. Effect of an increasing K-concentration on the e- transport of chloroplasts. xchloroplasts originating from plants rich in K+ and -O from plants low in KI (Pflfigerand Mengel [1972))
70
proton transport represents also a transport of electrical charges which could resultin extremely high electrical potential differences with detrimental effects on themembrane, if the electrical potential difference were not counterbalanced by cationsbeing translocated in an opposite direction. This assumption is supported by experi-mental data of Pfliiger [1974] who found, that isolated chloroplasts, submitted to
light, release H+ and absorb cations in almost equivalent quantities. The cationsabsorbed were mainly K+ and Nat. The experiment was carried out with spinach chloro-plasts and as spinach is a natrophilic plant species it is assumed that in this particularspecies besides K+ also Na+ may play a major role in balancing the protons trans-
located across the thylakoid membrane. Also Mg2 + is considered as an importantcation species for balancing the protons released into the intrathylakoid. As the K+
concentration in chloroplasts generally is several times higher than the concentrationof Mg 2 , K+ probably is of higher importance than Mg 2+.
In cases where K+ is deficient a high electropotential difference across the membranemay well slow down the separation of H+ due to the fact that the positive H+ mustbe translocated against a more positively charged medium. Under such conditionsthe rate of ATP and of NADPH synthesis should be reduced.
Conversion of photosynthates
ATP and NADPH are the first stable products in which the absorbed light energy is
trapped. Both products, however, are intermediary compounds of the metabolism.They have a high turn over and thus they are not suitable for energy storage. Thebiochemical reactions, in which ATP and NADPH are involved, have a direct bearingon the synthesis and conversion of photosynthates. The most prominent example ofthis kind is the assimilation of CO2, which requires an ATP/NADPH ratio of 3/2.In addition also for the synthesis of fatty acids and thus of lipids ATP and NADPHare indispensable, the latter being required in relatively large amounts for the synthesisof fatty acids. The assimilation of inorganic N in form of nitrate, ammonium, molecularnitrogen as well as the assimilation of sulphate are directly related to the photosyn-thetic electron transport (Hewitt [1975], Winter and Burris [1976], Schiff and Hodson[1973]), as the electrons required for the nitrite and sulphate reduction are providedby the ferredoxin of the thylakoids.The nitrate reduction depends on the provision of NADPH or NADH (Shen et al.
[1976]) as well as the glutamate dehydrogenase, the latter bringing about the synthesisof glutamate and thus playing a crucial role in the synthesis of amino acids. Theglutamine synthetase requires ATP and the glutamate synthase electrons provided byferredoxin. Both enzymes, glutamine synthetase and glutamate synthase are the mostimportant enzymes for the de novo synthesis of amino acids in leaves (Miflin [1975]).This short outline may demonstrate that the photosynthetically produced ATP andNADPH are indispensable for the synthesis of low molecular compounds such as
sugars, amino acids and fatty acids, which are the monomeric building blocks requiredfor the synthesis of the polymeric energy storage compounds: polysaccharides, fatsand proteins.Numerous endogenous and exogenous factors have an impact on these processesrelated to the conversion of photosynthates. The endogenous factors are geneticallyfixed. They control mainly the type of storage material produced, such as starch,
71
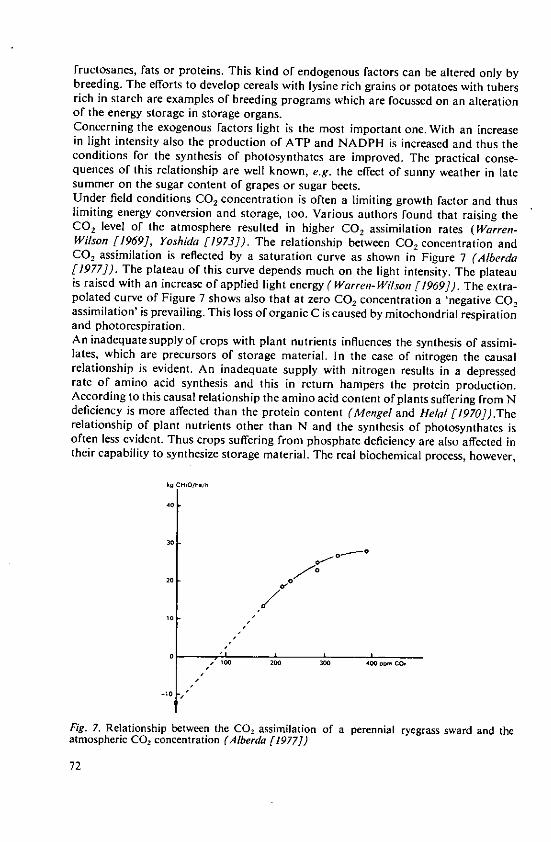
fructosanes, fats or proteins. This kind of endogenous factors can be altered only bybreeding. The efforts to develop cereals with lysine rich grains or potatoes with tubersrich in starch are examples of breeding programs which are focussed on an alterationof the energy storage in storage organs.Concerning the exogenous factors light is the most important one. With an increasein light intensity also the production of ATP and NADPH is increased and thus theconditions for the synthesis of photosynthates are improved. The practical conse-quences of this relationship are well known, e.g. the effect of sunny weather in latesummer on the sugar content of grapes or sugar beets.Under field conditions CO, concentration is often a limiting growth factor and thuslimiting energy conversion and storage, too. Various authors found that raising theCO, level of the atmosphere resulted in higher CO 2 assimilation rates (Warren-Wilson [1969], Yoshida [1973]). The relationship between CO, concentration andCO, assimilation is reflected by a saturation curve as shown in Figure 7 (Alberda[1977]). The plateau of this curve depends much on the light intensity. The plateauis raised with an increase of applied light energy ( Warren-Wilson [1969]). The extra-polated curve of Figure 7 shows also that at zero CO, concentration a 'negative CO,assimilation' is prevailing. This loss of organic C is caused by mitochondrial respirationand photorespiration.An inadequate supply of crops with plant nutrients influences the synthesis of assimi-lates, which are precursors of storage material. In the case of nitrogen the causalrelationship is evident. An inadequate supply with nitrogen results in a depressedrate of amino acid synthesis and this in return hampers the protein production.According to this causal relationship the amino acid content of plants suffering from Ndeficiency is more affected than the protein content (Mengel and Helal [1970]).Therelationship of plant nutrients other than N and the synthesis of photosynthates isoften less evident. Thus crops suffering from phosphate deficiency are also affected intheir capability to synthesize storage material. The real biochemical process, however,
kg CH.OAha/g
40
30
20 00 °
10 -
1. 4W 20 0 OPo CO.
-t0
Fig. 7. Relationship between the CO, assimilation of a perennial ryegrass sward and theatmospheric CO, concentration (Alberda [1977])
72

which is limiting in this particular case, is not yet known. For K+ and Mg2+ the situationis similar. Both nutrients are known to have a favourable influence on CO, assimilation(Peaslee and Moss [1966]). In the case of K+, however, it is not yet clear, whether K+promotes directly the CO2 fixation or whether its favourable influence on CO, assimi-lation is related to the effect of K+ on ATP synthesis. As K+ may promote starchsynthesis, protein synthesis (Koch and Mengel [1974]) and also the synthesis oflipids (Mengel and Forster [1976]) it seems probable that this overall effect ismainly due to the higher provision of ATP and NADPH in plants well supplied withK+.
Energy storage
The storage of chemical energy in form of polysaccharides, lipids and proteins intubers, roots, grains, and seeds is controlled by the particular biochemical reactionsin these physiological sinks which in return are dependent on the supply with photo-synthates. Their transport from the source to the sink is considered to be a mass flowdepending on the 'push' exerted by the physiological source and on the 'pull' exertedby the metabolic processes in the physiological sink (Geiger [1975]). The physiologicalsource is represented by the green plant parts, mainly the leaves, and the most impor-tant process located in them is CO 2 assimilation. For vegetative growth, such as theproduction of leaves and stems CO2 assimilation seems to be the most importantprocess and measurements which improve CO2 assimilation have often also a directbearing on growth. But also in cases where mainly vegetative plant material is pro-duced CO2 assimilation depends also on endogenous factors, particularly on plantage. This has been recently shown by Alberda [1977] in field experiments withperennial ryegrass. It was found that the net assimilation of a three week old swardwas considerably higher than the CO, assimilation of a 7 or II weeks old sward.Thus although the older sward had a larger leaf area its assimilation rate was inferioras compared with the younger sward. It is known that older grasses are richer instorage carbohydrates (Hehl and Mengel [1972]), mainly deposited in stems, stubblesand roots. These stored carbohydrates probably slow down the export of assimilatesout of the leaves. It is argued that in cases where the translocation of photosynthatesout of the leaves is hampered the resulting accumulation of starch in the chloroplastsreduces the rate of CO2 assimilation. Such a feed back mechanism was shown inpotatoes by Moorby [1968] and in soya bean by Egli et al. [1976]. Obviously the CO 2assimilation rate may adjust to some degree to the demand of photosynthates. Thiswas shown by Rd, mer [1970] in experiments with barley and mustard. The findinghowever should not lead to the general assumption that the rate of CO2 assimilationplays only a minor role in crop production. Recent investigations of Egli et al. [1976],who removed leaves from soya bean plants, clearly demonstrate that a reducedphysiological source had a detrimental effect on seed production. In this particularcase not only the size of the seeds was reduced, which resulted from a lack of photo-synthates especially during the last period of seed filling, but also the number of pods/plant was affected. In the treatment with 2/3 of the leaf area removed the plantsaborted some of the already set pods. This example shows that the reduced source/sink ratio is not only important for the provision of photosynthates but may alsoaffect the development of the physiological sinks. The removal of 2/3 of the leaf area,
73
as in the above cited experiment, is a drastic measurement and certainly not represen-tative for cases in which the 'source' is not reduced to such an extent. Generally thephotosynthetic rate of crops may well adjust to the physiological demand of photo-synthates. Extremely high demands may lead to a premature mobilization of leafproteins and thus accelerate leaf senescence (Evans [1975]). Such a premature senes-cence of leaves does not always impair crop production. Moreshet et al. [1977] inapplying kaolinite to sorghum leaves, in order to reduce water losses by transpiration,induced an earlier leaf senescence which was associated with a higher grain yield.The authors suggest, that in this particular case the decay of leaf proteins contributedto grain formation.Whether the metabolism of the source or that of the sink is a limiting step in cropproduction seems to be an idle question which cannot be answered generally. Itdepends much on the crop in question and also on the prevailing conditions. Tanaka[1973] holds the view that in high yielding rice varieties not the source but the sinkis mainly limiting grain yield. This means that the number of grains/unit area is themost important component of grain yield and that the photosynthetic capacity ofleaves is high enough to provide sufficient photosynthates also in cases where a highnumber of grains/unit area is set. High CO, assimilation rates, however, particularlyduring the period of grain filling, often have a favourable effect on grain size and maythus increase grain yield significantly. This statement is in agreement with the findingthat with an CO, concentration twice as high as normal the grain yield of wheat wasraised by 20% (Evans et al. [1975]). Haeder and Mengel [1974] found, that higherCO 2 assimilation rates during the grain filling period due to a better K supply resultedin significantly higher grain yields of wheat. Grain size was the yield component,which was the most increased one by the higher CO, assimilation rate. Yoshida [1973]applying to rice enhanced CO 2 levels at various stages of plant growth found that theCO, treatment after flowering mainly increased the percentage of filled grains thusresulting in an increased grain yield. The above cited experimental data support theassumption of Stoy [1973] and of Evans [1975] who suggest that especially duringthe milk stage the provision of assimilates can bea limiting factor in grain production.The importance of biochemical processes in the physiological sink for yield productionare still less understood than those of the physiological source. Whereas the latter ischaracterized mainly by the synthesis of sugars and amino acids, the biochemistry ofthe physiological sink is more multifarious due to the fact that physiologically differentplant organs (seeds, fruits, tubers, roots) are involved and due to the fact that thestorage material may differ considerably in its chemical nature. It is supposed thatthe growth rate of the sink is of crucial importance for the production rate. This growthrate of storage organs depends on the supply with building blocks, mainly sucroseand amino acids, as well as on the supply with energy carriers such as ATP, NADPHand NADH. Also sugars function to some extent as energy carriers, as a proportionof them translocated into the physiological sink is respired and thus providing NADHand ATP for the synthesis of storage material.The growth rate of the physiological sink is controlled by phytohormones and it is forthis reason that endogenous and exogenous factors may influence the energy storagein physiological sinks by influencing the synthesis and the turn over of phytohormones.As already emphasized above the endogenous factors are genetically controlled. ThusMichael and Seiler-Kelbitsch [1972] found substantial differences in the cytokinincontent of grains between three different barley cultivars. These cytokinin contents
74
were positively correlated with the grain size. According to these and additionalexperimental data (Michael [1973]) suggests that the cytokinin supply of grains is ofdecisive importance for grain growth and thus grain production. In this respectcytokinins may not only influence the metabolic processes in developing grains butalso their supply with photosynthates, as was shown by Aufharnner and Solansky[1976] by kinetin applications to barley.The cytokinin content of grains depends also on exogenous factors. Cytokinins aremainly synthesized in the root tips and from there they are translocated to the upperplant parts. Root metabolism has a substantial impact on the synthesis of cytokinins.Michael and Seiler-Kelbitsch [1972] found that under anaerobic conditions in theroot medium, the cytokinin synthesis was slowed down and the grain filling of barleyaffected.The synthesis of cytokinins is closely related to the nitrogen metabolism, inadequate Nsupply resulting in a reduced rate of cytokinin synthesis ( Wagner and Michael [1971]).Thus it appears that nitrogen supply may influence growth rate and energy storagenot only by the function of N as an elementary constituent of N containing molecules,but also by promoting the synthesis of cytokinins.Besides cytokinins other phytohormones control the metabolism of physiologicalsinks. Mounla and Michael [1973] found a clear relationship between the content offree gibberellic acid in developing barley grains and grain growth. It is supposed thatthe gibberellins in grains are mainly produced in the embryo and that the size of theembryo is related to the gibberellin production. Abscisic acid exerts an antagonisticeffect on gibberellins and cytokinins. Generally its content increases in fruits duringthe maturation process. Thus Dfiring [1973] found a steady increase of the abscisicacid content in grape fruits with the advance of the growth period. A similar relation-ship between the content of abscisic acid and the development of barley grains hasbeen found by Goldbach and Michael [1976]. These experimental findings justifythe conclusion that the growth rate of fruits is controlled by their content of abscisicacid in a sense that increasing contents of abscisic acid result in an enhanced growthretardation and a promotion of the maturation process. Abscisic acid synthesis andABA content are also related to exogenous factors. Thus relatively low temperatureconditions (180 C) during the grain filling period of barley resulted in a retarded syn-thesis of abscisic acid which was paralleled by a longer grain filling period as comparedwith higher temperature (260C). The thus extended grain filling period brought abouta substantial increase in the single grain weight (Goldbach and Michael [1976]). Thiseffect of temperature on the content of abscisic acid in grains may also explain experi-mental results of Beringer [1967], who found a 30 to 40% higher grain yield of oatsin a treatment with 12'C temperature during grain filling as compared with a tempera-ture of 30'C. Water stress (Hsiao [1973]) and salt stress (Mizrahi et al. [1972]) aswell as N-deficiency (Goldbach et al. (1975]) lead to a considerable increase inabscisic acid content thus accelerating the maturation process and depressing theyield level.It is feasible that also light intensity influences the storage of chemical energy notonly by its effect on CO, assimilation but probably also by influencing synthesis andturn over of phytohormones. Mengel and Haeder [1976], in studying the effect oflight intensity on CO, assimilation and grain production of spring wheat, observed apoor grain filling in the treatment with the reduced light intensity. This yield reduction,however, did not mainly result from a lack of photosynthates, because in the treatment
75
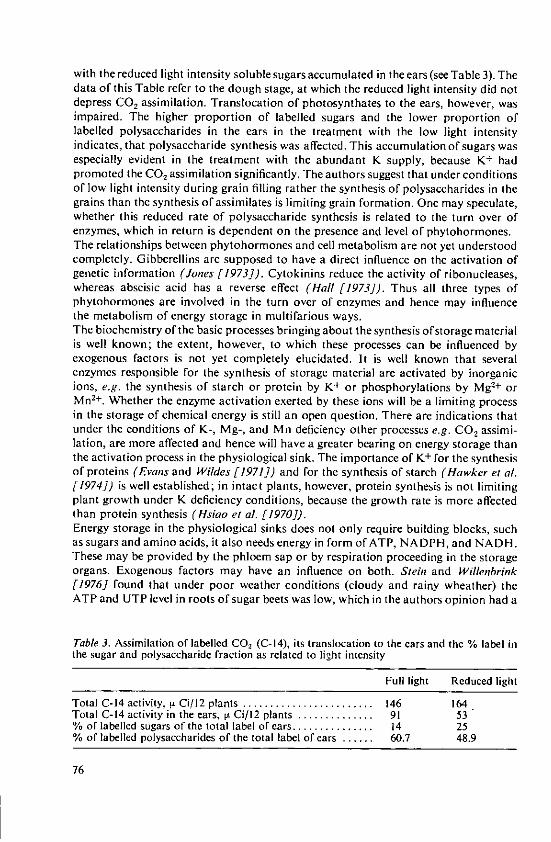
with the reduced light intensity soluble sugars accumulated in the ears (see Table 3). Thedata of this Table refer to the dough stage, at which the reduced light intensity did notdepress CO2 assimilation. Translocation of photosynthates to the ears, however, wasimpaired. The higher proportion of labelled sugars and the lower proportion oflabelled polysaccharides in the ears in the treatment with the low light intensityindicates, that polysaccharide synthesis was affected. This accumulation of sugars wasespecially evident in the treatment with the abundant K supply, because K+ hadpromoted the CO 2 assimilation significantly. The authors suggest that under conditionsof low light intensity during grain filling rather the synthesis of polysaccharides in thegrains than the synthesis of assimilates is limiting grain formation. One may speculate,whether this reduced rate of polysaccharide synthesis is related to the turn over ofenzymes, which in return is dependent on the presence and level of phytohormones.The relationships between phytohormones and cell metabolism are not yet understoodcompletely. Gibberellins are supposed to have a direct influence on the activation ofgenetic information (Jones [1973]). Cytokinins reduce the activity of ribonucleases,whereas abscisic acid has a reverse effect (Hall [1973]). Thus all three types ofphytohormones are involved in the turn over of enzymes and hence may influencethe metabolism of energy storage in multifarious ways.The biochemistry of the basic processes bringing about the synthesis of storage materialis well known; the extent, however, to which these processes can be influenced byexogenous factors is not yet completely elucidated. It is well known that severalenzymes responsible for the synthesis of storage material are activated by inorganicions, e.g. the synthesis of starch or protein by K+ or phosphorylations by Mg2+ orMn+. Whether the enzyme activation exerted by these ions will be a limiting processin the storage of chemical energy is still an open question. There are indications thatunder the conditions of K-, Mg-, and Mn deficiency other processes e.g. CO2 assimi-lation, are more affected and hence will have a greater bearing on energy storage thanthe activation process in the physiological sink. The importance of K+ for the synthesisof proteins (Evans and Wildes [1971]) and for the synthesis of starch (Hawker et al.[1974]) is well established; in intact plants, however, protein synthesis is not limitingplant growth under K deficiency conditions, because the growth rate is more affectedthan protein synthesis (Hsiao et al. [1970]).Energy storage in the physiological sinks does not only require building blocks, suchas sugars and amino acids, it also needs energy in form of ATP, NADPH, and NADH.These may be provided by the phloem sap or by respiration proceeding in the storageorgans. Exogenous factors may have an influence on both. Stein and Willenbrink[1976] found that under poor weather conditions (cloudy and rainy wheather) theATP and UTP level in roots of sugar beets was low, which in the authors opinion had a
Table 3. Assimilation of labelled CO2 (C-14), its translocation to the ears and the % label in
the sugar and polysaccharide fraction as related to light intensity
Full light Reduced light
Total C-14 activity, It Ci/12 plants ........................ 146 164Total C-14 activity in the ears, [t Ci/12 plants .............. 91 53% of labelled sugars of the total label of ears ............... 14 25% of labelled polysaccharides of the total label of ears ...... 60.7 48.9
76
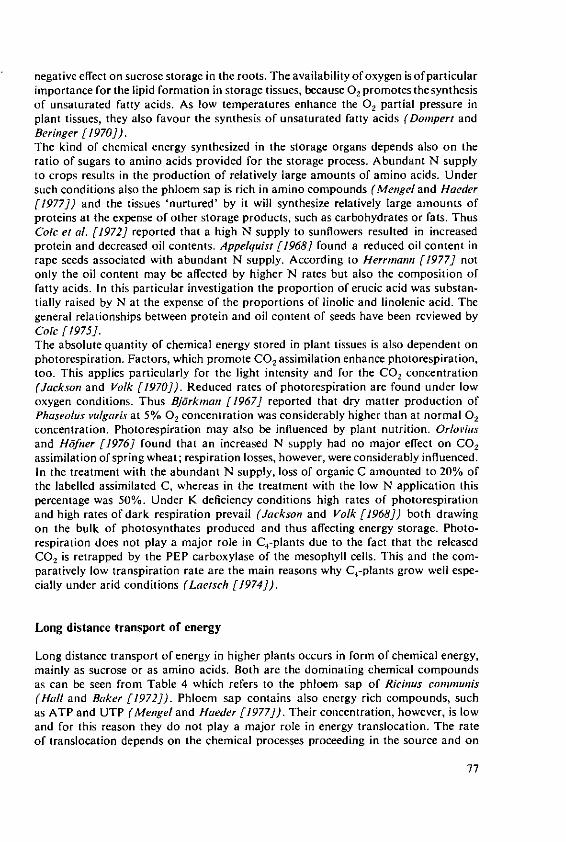
negative effect on sucrose storage in the roots. The availability of oxygen is of particularimportance for the lipid formation in storage tissues, because 02 promotes the synthesisof unsaturated fatty acids. As low temperatures enhance the 02 partial pressure inplant tissues, they also favour the synthesis of unsaturated fatty acids (Dompert andBeringer [1970]).The kind of chemical energy synthesized in the storage organs depends also on theratio of sugars to amino acids provided for the storage process. Abundant N supplyto crops results in the production of relatively large amounts of amino acids. Undersuch conditions also the phloem sap is rich in amino compounds (Mengel and Raeder[1977]) and the tissues 'nurtured' by it will synthesize relatively large amounts ofproteins at the expense of other storage products, such as carbohydrates or fats. ThusCorc et al. [1972] reported that a high N supply to sunflowers resulted in increasedprotein and decreased oil contents. Appelquist [1968] found a reduced oil content inrape seeds associated with abundant N supply. According to Herrmann [1977] notonly the oil content may be affected by higher N rates but also the composition offatty acids. In this particular investigation the proportion of erucic acid was substan-tially raised by N at the expense of the proportions of linolic and linolenic acid. Thegeneral relationships between protein and oil content of seeds have been reviewed byCore [1975].The absolute quantity of chemical energy stored in plant tissues is also dependent onphotorespiration. Factors, which promote CO2 assimilation enhance photorespiration,too. This applies particularly for the light intensity and for the CO, concentration(Jackson and Volk [1970]). Reduced rates of photorespiration are found under lowoxygen conditions. Thus Bjdrkmnan [1967. reported that dry matter production ofPhaseolus vulgaris at 5% 02 concentration was considerably higher than at normal 02concentration. Photorespiration may also be influenced by plant nutrition. Orloviusand I-6fner [1976] found that an increased N supply had no major effect on CO 2assimilation of spring wheat; respiration losses, however, were considerably influenced.In the treatment with the abundant N supply, loss of organic C amounted to 20% ofthe labelled assimilated C, whereas in the treatment with the low N application thispercentage was 50%. Under K deficiency conditions high rates of photorespirationand high rates of dark respiration prevail (Jackson and Volk [1968]) both drawingon the bulk of photosynthates produced and thus affecting energy storage. Photo-respiration does not play a major role in C4-plants due to the fact that the releasedCO2 is retrapped by the PEP carboxylase of the mesophyll cells. This and the com-paratively low transpiration rate are the main reasons why C4-plants grow well espe-cially under arid conditions (Laetsch [1974]).
Long distance transport of energy
Long distance transport of energy in higher plants occurs in form of chemical energy,mainly as sucrose or as amino acids. Both are the dominating chemical compoundsas can be seen from Table 4 which refers to the phloem sap of Ricinus conununis(Hall and Baker [1972]). Phloem sap contains also energy rich compounds, suchas ATP and UTP (Mengel and Haeder [1977]). Their concentration, however, is lowand for this reason they do not play a major role in energy translocation. The rateof translocation depends on the chemical processes proceeding in the source and on
77
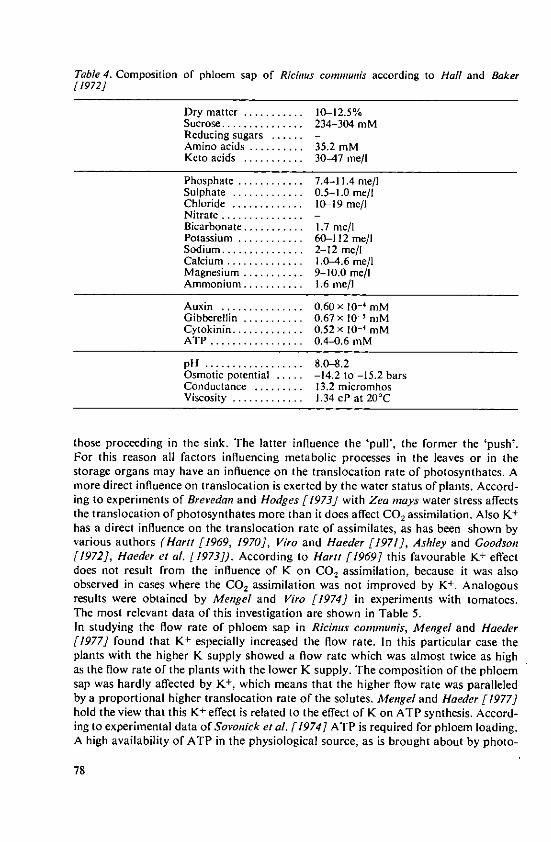
Table 4. Composition of phloem sap of Ricinus coninunis according to Hall and Baker[1972]
Dry matter ........... 10-12.5%Sucrose ............... 234-304 mMReducing sugars ...... -Amino acids .......... 35.2 mMKeto acids ........... 30-47 me/I
Phosphate ............ 7.4-11.4 me/ISulphate ............. 0.5-1.0 me/IChloride ............. 10-19 me/iN itrate ...............Bicarbonate ........... 1.7 me/lPotassium ............ 60-112 me/iSodium ............... 2-12 me/ICalcium .............. 1.0-4.6 me/lMagnesium ........... 9-10.0 me/IAmmonium ........... 1.6 me/i
Auxin ............... 0.60 x 10⁻⁴ mMGibberellin ........... 0.67 x 10- 5 mMCytokinin ............. 0.52 x 10
-4 mM
ATP ................. 0.4-0.6 mM
pH .................. 8.0-8.2Osmotic potential ..... -14.2 to -15.2 barsConductance ......... 13.2 micromhosViscosity ............. 1.34 cP at 20°C
those proceeding in the sink. The latter influence the 'pull', the former the 'push'.For this reason all factors influencing metabolic processes in the leaves or in thestorage organs may have an influence on the translocation rate of photosynthates. Amore direct influence on translocation is exerted by the water status of plants. Accord-ing to experiments of Brevedan and Hodges [1973] with Zea mays water stress affectsthe translocation of photosynthates more than it does affect CO 2 assimilation. Also K+
has a direct influence on the translocation rate of assimilates, as has been shown byvarious authors (Hartt [1969, 1970], Viro and Haeder [1971], Ashley and Goodson[1972], Haeder et al. [1973]). According to Hart [1969] this favourable K+ effectdoes not result from the influence of K on CO2 assimilation, because it was alsoobserved in cases where the CO2 assimilation was not improved by K+. Analogousresults were obtained by Mengel and Viro [1974] in experiments with tomatoes.The most relevant data of this investigation are shown in Table 5.In studying the flow rate of phloem sap in Ricinus comnaunis, Mengel and Haeder[1977] found that K+ especially increased the flow rate. In this particular case theplants with the higher K supply showed a flow rate which was almost twice as highas the flow rate of the plants with the lower K supply. The composition of the phloemsap was hardly affected by K+, which means that the higher flow rate was paralleledby a proportional higher translocation rate of the solutes. Mengel and Haeder [1977]hold the view that this K+ effect is related to the effect of K on ATP synthesis. Accord-ing to experimental data of Sovonick et al. [1974] ATP is required for phloem loading.A high availability of ATP in the physiological source, as is brought about by photo-
78
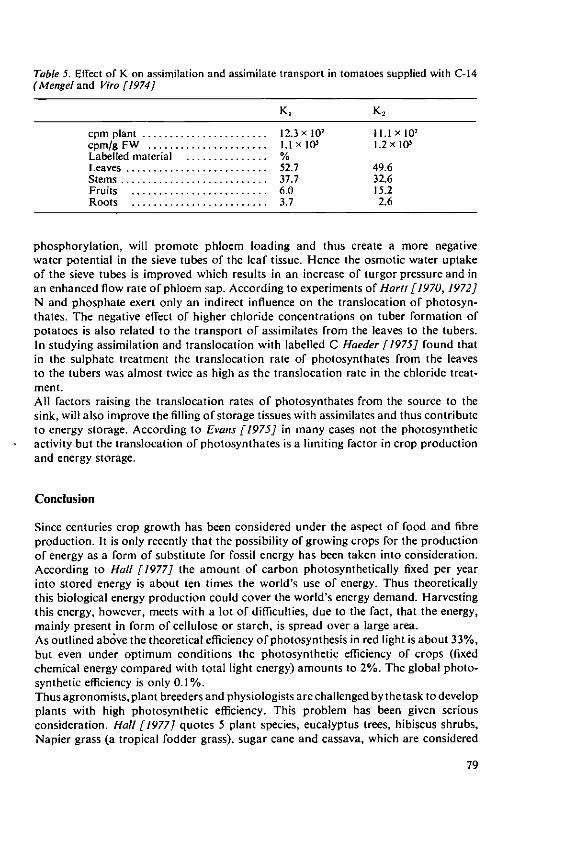
Table 5. Effect of K on assimilation and assimilate transport in tomatoes supplied with C-14
(Mengel and Jiro [1974]
K, K,
cpm plant ....................... 12.3 x 10⁷ 11.1 X 10'cpm/g FW ...................... 1.lx 1' 1.2× 10Labelled material ............... %Leaves .......................... 52.7 49.6Stem s ........................... 37.7 32.6Fruits ......................... 6.0 15.2R oots ......................... 3.7 2.6
phosphorylation, will promote phloem loading and thus create a more negativewater potential in the sieve tubes of the leaf tissue. Hence the osmotic water uptakeof the sieve tubes is improved which results in an increase of turgor pressure and inan enhanced flow rate of phloem sap. According to experiments of Hartt [1970, 1972]N and phosphate exert only an indirect influence on the translocation of photosyn-thates. The negative effect of higher chloride concentrations on tuber formation ofpotatoes is also related to the transport of assimilates from the leaves to the tubers.In studying assimilation and translocation with labelled C Haeder [1975] found thatin the sulphate treatment the translocation rate of photosynthates from the leavesto the tubers was almost twice as high as the translocation rate in the chloride treat-ment.All factors raising the translocation rates of photosynthates from the source to thesink, will also improve the filling of storage tissues with assimilates and thus contributeto energy storage. According to Evans [1975] in many cases not the photosyntheticactivity but the translocation of photosynthates is a limiting factor in crop productionand energy storage.
Conclusion
Since centuries crop growth has been considered under the aspect of food and fibreproduction. It is only recently that the possibility of growing crops for the productionof energy as a form of substitute for fossil energy has been taken into consideration.According to Hall [1977] the amount of carbon photosynthetically fixed per yearinto stored energy is about ten times the world's use of energy. Thus theoreticallythis biological energy production could cover the world's energy demand. Harvestingthis energy, however, meets with a lot of difficulties, due to the fact, that the energy,mainly present in form of cellulose or starch, is spread over a large area.As outlined above the theoretical efficiency of photosynthesis in red light is about 33%,but even under optimum conditions the photosynthetic efficiency of crops (fixedchemical energy compared with total light energy) amounts to 2%. The global photo-synthetic efficiency is only 0.1%.Thus agronomists, plant breeders and physiologists are challenged by the task to developplants with high photosynthetic efficiency. This problem has been given seriousconsideration. Hall [1977] quotes 5 plant species, eucalyptus trees, hibiscus shrubs,Napier grass (a tropical fodder grass), sugar cane and cassava, which are considered
79
to be suitable for 'sun energy harvesting'. The chemical energy produced is present inform of cellulose or starch which can be pyrolyzed or fermented respectively. Inthis way solid char, oil, gasses and alcohols are produced. According to the presentstate of technology fermenting of cassava starch to alcohol, is competitive withindustrial alcohol.The photosynthetic efficiency of plants, however, can be improved only to a certaindegree, because of physiological barriers, The limiting step of energy conversion inphotosynthesis is located within the redox carrier chain connecting the two photo-systems (Lien and San Pietro [1976]).It is for this reason that efforts are made, to mimic natural photosynthesis, excludingthe physiological barriers cited above. The target of these efforts is to produce hydrogengas. The principle of the H, production is based on the splitting of water into 02,electrons and H+ by artificial chlorophyll containing membranes. The electronsproduced are used for the reduction of H+ thus forming H2, the process being catalyzedby a hydrogenase.These prospects of future energy production are promising and the problem meritsserious efforts of researchers.
References
Alberda, Th.: 3. Perennial rye grass, p. 4-11, Agr. Res. Rep. 865, Centre for AgriculturalPublishing and Documentation, Wageningen (1977)
Appelqvist, L.A.: Physiol. Plant. 21, 455-465 (1968)Ashley, D.A. and Goodson, R.D.: Crop Sci. 12, 686-690 (1972)Aufhanmer, W. and Solansky, S.: Z. Pflanzenern. Bodenk., H. 4, 503-515 (1976)Barta, A.L.: Crop Sci. 15, 169-171 (1975)Beringer, H.: Z. Pflanzenern. Bodenk. 116, 45-53 (1967)Bjiirkman, 0.: Carnegie Inst. Washington. Yearb. 66, 220-232 (1967)Brevedan, E.R. and Hodges, H.F.: Plant Physiol. 52, 436-439 (1973)Cheniae, G.M. and Martin, J.: Plant Physiol. 47, 568-575 (1971)Core, Y.: Fertilizer Use and Protein Production, p. 161-168, Int. Potash Inst., Berne 1975Core, Y., Tendille, and Lesaint, C.: Agrochimica 16, 254-263 (1972)Dompert, W. and Beringer, H.: Die Naturwissenschaften 57, 40 (1970)Donald, C.M.: Euphytia 17, 385-403 (1968)Dfiring, H.: Die Naturwissenschaften 60, 301-302 (1973)Egli, D.B., Gossett, D.R. and Leggett, J.E.: Crop. Sci. 16, 791-794 (1976)Evans, L. T.: The physiological basis of crop yield. In: Crop Physiology, p. 327-355, Cambridge
University Press, 1975Evans, L.T., Ward/aw, I.F. and Fischer, R.A.: Wheat. In: Crop Physiology, p. 101-149,
Cambridge University Press, 1975Evans, H.J. and Wices, R.A.: Potassium and its role in enzyme activation, p. 13-39. In:
Potassium in Biochemistry and Physiology, Proc. 8th Colloqu., Int. Potash Inst., Berne(1971)
Geiger, D.R.: Phloem loading, p. 396-431. In: M.H. Zimmermann and J.A.Milburn: Transportin Plants I, Phloen Transport. Springer-Verlag, Berlin, Heidelberg, New York, 1975
Goldbach, E., Goldbach, H., Wagner, H. and Michael, G.: Physiol. Plant. 34, 138-140 (1975)Goldbach, H. and Michael, G.: Crop Sci. 16, 797-799 (1976)Haeder, H.E. and Mengel, L.: Proceedings of the 7th Int. Colloquium on Plant Analysis and
Fertilizer Problems, p. 135-145, Hannover (1974)Haeder, H.E.: Landw. Forsch. 3211. Sonderh., 122-131 (1975)Haeder, H.E., Mengel, K. and Forster, H.: J. Sci. Fd. Agric. 24, 1479-1487 (1973)Hall, D.O.: TIBS 2, 99-101 (1977)Hall, R.H.: Ann. Rev. Plant Physiol. 24, 415-444 (1973)
80
Hall, S.M. and Baker, D.A.: Planta 106, 131-140 (1972)Hart, C.E.: Plant Physiol. 44, 1461-1469 (1969)Hartt, C.E.: Plant Physiol. 45, 183-187 (1970)Hart:, C.E.: Plant Physiol. 46, 419-422 (1970)Hartt, C.E.: Plant Physiol. 49, 569-571 (1972)Hawker, J.S., Marschner, H. and Downton, W.J.S.: Aust. J. Plant Physiol. 1, 491-501 (1974)Hehl, G. and Mengel, K.: Landw. Forsch. 27/11. Sonderh., 117-129 (1972)Herrmann, B.: Arch. Acker- u. Pflanzenbau u. Bodenkd. 21, 141-148 (1977)Hewitt, E.J: Ann. Rev. Plant Physiol. 26, 73-100 (1975)Hsiao, T.C.: Ann. Rev. Plant Physiol. 24, 519-570 (1973)Hsiao, T.C., Hageman, R.H. and Tyner, E.H.: Crop Sci. 10, 78-82 (1970)Jackson, W.A. and Volk, R.J.: The Role of Potassium in Agriculture, p. 109-145, Madison,
Wisconsin USA, 1968Jackson, W.A. and Volk, R.J.: Ann. Rev. Plant Physiol. 21, 385-432 (1970)Jones, R.L.: Ann. Rev. Plant Physiol. 24, 571-598 (1973)Koch, K. and Mengel, K.: Proceedings of the 7th Int. Colloquium on Plant Analysis and
Fertilizer Problems, p. 209-218, Hannover, 1974Laetsch, W.M.: Ann. Rev. Plant Physiol. 25, 27-52 (1974)Lien, S. and San Pietro, A.: Report, Grant GI 40 253 Indiana University, Bloomington, USA
(1976)Loomis, R.S., Williams, W.A. and Hall, A.E.: Ann. Rev. Plant Physiol. 22, 431-463 (1971)Mengel K. and Forster, H.: Kali-Briefe, Fachgeb. 3, 1. Folge (1976)Mengel, K. and Haeder, H.E.: 4th Int. Colloquium on the Control of Plant Nutrition, p. 463-
475, Gent, 1976Mengel, K. and Haeder, H.E.: Plant Physiol. 59, 282-284 (1977)Mengel, K. and Helal, M.: In: E.A. Kirkby: Nitrogen Nutrition of the Plant. The University
of Leeds, p. 162-173 (1970)Mengel, K. and Viro, M.: Physiol. Plant. 30, 295-300 (1974)Michael, G.: Vortrage C. Pflanzenzfichter 13, 186-198 (1973)Michael, G. and Seiler-Kelbitsch, H.: Crop Sci. 12, 162-165 (1972)Miflin, B.J.: In: Fertilizer Use and Protein Production, p. 4 1-62 , Int. Potash Institute, Berne
(1975)Mitchell, P.: Nature 191, 144-148 (1961)Mitchell, P.: Biol. Rev. 41, 445-502 (1966)Mizrahi, Y., Blumenfeld, A. and Richmond, A.E.: Plant Cell Physiol. 13, 15-21 (1972)Moorby, J.: Ann. Hot. 32, 57-68 (1968)Moreshet, S., Stanhill, G. and Fuchs, M.: Agron. J. 69 (2), 246-250 (1977)Morowitz, H. and Williams, R.J.P.: TIES, Vol. 1, N 222-N 224 (1976)Mounla, M.A. Kh. and Michael, G.: Physiol. Plant 29, 274-276 (1973)Orlovius, K. and Hiifner, W.: Z. Pflanzenern5hr. Bodenkd., Heft 5, 631-640 (1976)Overnell, J.: Physiol. Plant. 35, 217-224 (1975)Pflflger, R.: Ber. Deutsch. Bot. Ges. 87, 383-388 (1974)Pfjiger, R. and Mengel, K.: Plant and Soil 36, 417-425 (1972)Peaslee, D.E. and Moss, D.N.: Soil Sci. Soc. Amer. Proc. 30, 220-223 (1966)Reinwald, E., Stiehl, H. and Romberg, H.: Z. Naturf. 23b, 1616-1617 (1968)Rdmer, W.: Untersuchungen fiber die Auslastung des Photosyntheseapparates bei Gerste
(Hordeum distichon L.) und Senf (Sinapis alba L.), durchgeftihrt mit Hilfe " C-markierterVerbindungen. Dissertation Jena, 1970
Schiff, J.A. and Hodson, R.C.: Ann. Rev. Plant Physiol. 24, 381-414 (1973)Shen, T.C.. Funkhouser, E.A. and Guerrero, M.G.: Plant Physiol. 58, 292-294 (1976)Sovonick, S.A., Geiger, D.R. and Fellows, R.J.: Plant Physiol. 54, 886-891 (1974)Stonier, R. Y., Doudoroff, M. and Adelberg, E.A.: General Microbiology, 3rd ed., 1971Stein, M. and Willenbrink, J.: Z. Pflanzenphysiol. 79, 310-322 (1976)Stay, V.: Vortr. f. Pflanzenzfichter 13, 34-51 (1973)Tanaka, A.: ASPAC, Technical Bulletin No. 6, 1-18 (1972)Tanaka, A.: In: Potassium in Tropical Crops and Soils, p. 147-167, Proc. 10th Colloqu. Int.
Potash Institute, Berne (1973)Tombesi, L., Cale, M.T. and Tiborne, B.: Plant and Soil 31, 65-76 (1969)Trebst, A.: Ann. Rev. Plant Physiol. 25, 423-458 (1974)
81
Viro, M. and Haeder, H.E.: In: Potassium in Biochemistry and Physiology, p. 118-124,Int. Potash Institute, Berne (1971)
Wagner, H. and Michael, G.: Biochem. Physiol. Pfianzen (BPP) 162, 147-158 (1971)Wallace, J.W. and Newman, D.W.: Phytochemistry 4, 43-47 (1965)Warren- Wilson, J.: In: Transition from Extensive to Intensive Agriculture with Fertilisers,
p. 34-56. Ptoc. 7th Colloqu. Int. Potash Institute Berne (1969)Watanahe, H. and Yoshida, S.: Soil Sci. Plarh Nut. 16, 163-166 (1970)Watson, D.J.: Advances in Agronomy 4, 101-145 (1952)Winter, H.C. and Burris, R.H.: Ann. Rev. Biochemistry 45, 409426 (1976)Yoshida, S.: Soil Sci. Plant Nutr. 19 (4), 311-316 (1973)
82
Energy Conversionand Ion Fluxes in Chloroplasts*
J. Barber, Department of Botany, Imperial College of Science and Technology, London/United Kingdom-*
Summary
Studies from several different laboratories involving measurements of changes of chlorophyllfluorescence, electron transport and absorption of metallochromic indicator Erichrome Blue,indicated that within the intact chloroplast Mg 2 + acts as the main counterion to light inducedproton pumping between the stroma and the intrathylakoid compartment. The preference forMg 2 + over Kt as the counterion can be explained in terms of the Gouy-Chapman double layertheory by realising that the thylakoid membrane surface is both negatively charged and exten-sive in area, coupled to the fact that chloroplast level of Kt and Mg 2 seem to be about thesame. The consequence of the light induced H+/Mg 2+ exchange across the in situ thylakoids isdiscussed in terms of its control on the CO, fixation cycle, phosphorylation and quantal distri-bution to the two photosystems.
1. Introduction
Perhaps the most striking feature of recent developments in photosynthesis research is
the realisation that this process is very much dependent on the properties of the chloro-plast membranes. The inner chloroplast membranes or thylakoids are the sites for the
photosynthetic pigments and associated electron carriers and the separation of chargeacross their lipid structure is not only intimately involved in primary energy conversion
[22,32] but also in controlling other photochemical and biochemical processes whichmake up the overall reactions of photosynthesis [1, 2]. The outer membranes which
form an envelope around the thylakoids and stromal phase represents an additionalbarrier for metabolites and almost certainly for inorganic ions. It is becoming increas-ingly clear that the presence of this envelope is a necessary requirement for completebiochemical activity of chloroplasts and almost certainly functions to maintain andcarefully control the ionic content of the stroma so that the photosynthetic machinery
* AbbreviationsATP: Adenosine triphosphateNADP: Nicotinamide adenine dinucleotide phosphate
Dr. J. Barber, Dept. of Botany, Imperial College of Science and Technology, London SW 7/
United Kingdom
83
can operate efficiently. In this article I want to discuss what is known about ionic regu-lation in the intact chloroplast and discuss how this regulation interplays with variousprocesses of photosynthesis.
2. Chloroplast structure and its significance to ionic distribution
The chloroplast is essentially a two compartment system. The envelope encloses thestromal compartment while the inner thylakoid membranes give rise to the intrathyla-koid or granal space. Any discussion of ionic regulation in this organelle must recog-nise this fact and also take into account the very significant amount of thylakoid mem-brane area. The high surface area to volume ratio of the thylakoids is most certainly animportant feature of the photosynthetic apparatus. This property will greatly influencethe distribution of ions within the organelle particularly if the membrane surface ischarged. In fact it has been shown by several workers that the thylakoids are negativelycharged [7,10,24]. Such a surface would attract cations so as to maintain electroneu-trality but the cations will remain in a diffuse layer adjacent to the membrane surface[3, 4]. The actual cation composition of the diffuse electrical layer will depend on theelectrolyte composition of the medium in which the membranes are suspended, that is,in the case of the thylakoids the physiological medium is the stroma. However, as ex-plained in more detail below, the ionic composition of the diffuse layer adjacent to thethylakoid membrane may be quite different to the ionic composition of the bulk strom-al phase.Although the theory of electrical double layers can be quite complex a simple andwidely adopted approach was developed by Gouy and Chapman [4]. The Gouy-Chap-man theory links the Boltzmann and Poisson equations and leads to an expression whichrelates the membrane surface potential (IF) to the surface charge density (q) and theelectrolyte concentration of the bulk solution C. for a Z-Z type electrolyte
q=+ RTE iCi exp RZ)T ] A 1
where F is the Faraday, R is the Gas Constant, e is the permittivity of water and T isthe absolute temperature. Given a value of q this equation can be used tocalculate '.for any particular mixture of electrolytes. For example, if the bathing medium containsa mixture of a monovalent electrolyte of concentration C', and divalent electrolyte ofconcentration C". then equation 1 yields the quadratic
2C". cosh2 (Kl) + C'. cosh (FT-)(2C"_ + +' q + .(2)
knowing 'I, and applying the Boltzmann expression:
C0 = CM exp ( (3)
the surface monovalent (C'.) and divalent (C".) cation concentrations can be calculat-ed. The results of such calculations are shown in Figure I for various values of C', andC". and emphasise the preferential accumulation of divalent cations at the membrane
84
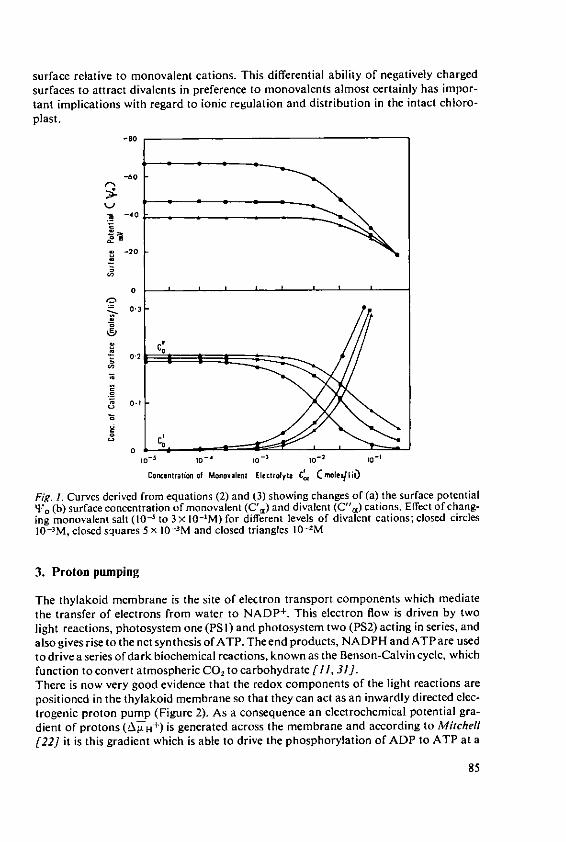
surface relative to monovalent cations. This differential ability of negatively chargedsurfaces to attract divalents in preference to monovalents almost certainly has impor-tant implications with regard to ionic regulation and distribution in the intact chloro-plast.
_11o
-60
-40
-20
0
0 3
01
0
10 10o-, l -,1-
Concentration of Monovalent Electrolyte C_ Cnoleqlil )
Fig. 1. Curves derived from equations (2) and (3) showing changes of (a) the surface potentialt[% (b) surface concentration of monovalent (C'.) and divalent (C".) cations. Effect of chang-ing monovalent salt (10-3 to 3 x 10-M) for different levels of divalent cations; closed circles10-3M, closed squares 5 x 10⁻³M and closed triangles 10-
2 M
3. Proton pumping
The thylakoid membrane is the site of electron transport components which mediatethe transfer of electrons from water to NADP. This electron flow is driven by twolight reactions, photosystem one (PSI) and photosystem two (PS2) acting in series, andalso gives rise to the net synthesis of ATP. The end products, NADPH and ATP are usedto drive a series of dark biochemical reactions, known as the Benson-Calvin cycle, whichfunction to convert atmospheric CO2 to carbohydrate [11, 31].There is now very good evidence that the redox components of the light reactions arepositioned in the thylakoid membrane so that they can act as an inwardly directed elec-trogenic proton pump (Figure 2). As a consequence an electrochemical potential gra-dient of protons (AIH) is generated across the membrane and according to Mitchell[22] it is this gradient which is able to drive the phosphorylation of ADP to ATP at a
85
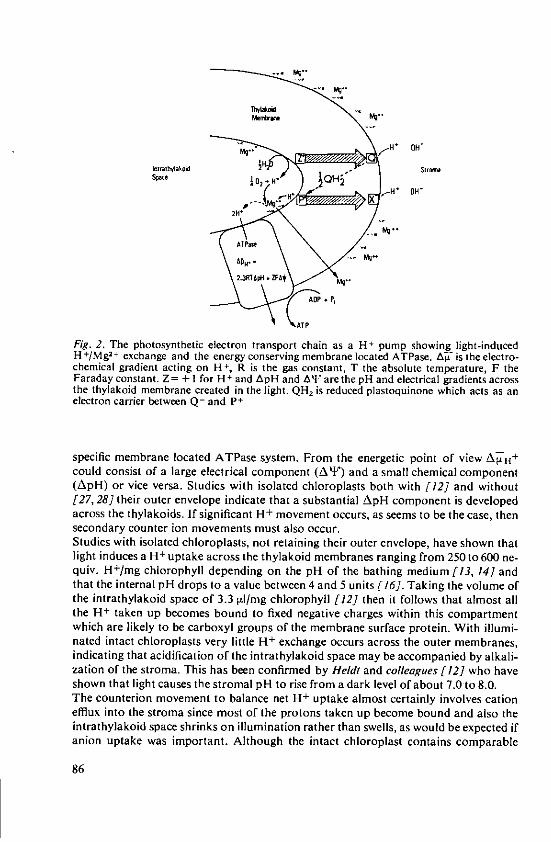
Itioo
M9*- 1 , H* OH"
chmialg adientatn on Ht stegscntat h boueteratr, h
e ~ 1 0+H/
2H
AIN.~
ATP
Fig. 2. The photosynthetic electron transport chain as a H + pump showing light-inducedH +/Mg a + exchange and the energy conserving membrane located ATPase. b: - is the electro-chemical gradient acting on H +, R is the gas constant, T the absolute temperature, F theFaraday constant. Z = + 1 for H + and ApH and At. are the pH and electrical gradients acrossthe thylakoid membrane created in the light. QH is reduced plastoquinone which acts as anelectron carrier between Q- and Pt
specific membrane located ATPase system. From the energetic point of view A;- +could consist of a large electrical component (A') and a small chemical component(ApH) or vice versa. Studies with isolated chloroplasts both with [12] and without[27, 28] their outer envelope indicate that a substantial ApH component is developedacross the thylakoids. If significant H+ movement occurs, as seems to be the case, thensecondary counter ion movements must also occur.Studies with isolated chloroplasts, not retaining their outer envelope, have shown thatlight induces a H + uptake across the thylakoid membranes ranging from 250 to 600 ne-quiv. H+/mg chlorophyll depending on the pH of the bathing medium [13, 14] andthat the internal pH drops to a value between 4 and 5 units [16]. Taking the volume ofthe intrathylakoid space of 3.3 il/mg chlorophyll [12] then it follows that almost allthe H+ taken up becomes bound to fixed negative charges within this compartmentwhich are likely to be carboxyl groups of the membrane surface protein. With illumi-nated intact chloroplasts very little H+ exchange occurs across the outer membranes,indicating that acidification of the intrathylakoid space may be accompanied by alkali-zation of the stroma. This has been confirmed by Heldt and colleagues [12] who haveshown that light causes the stromal pH to rise from a dark level of about 7.0 to 8.0.The counterion movement to balance net H+ uptake almost certainly involves cationeffiux into the stroma since most of the protons taken up become bound and also theintrathylakoid space shrinks on illumination rather than swells, as would he expected ifanion uptake was important. Although the intact chloroplast contains comparable
86
Table 1. Ionic content of isolated intact pea chloroplasts
Ion zmole/mg chl.
Na 0.25K 2.23Mg 2.33Ca 0.84Mn 0.02Cl 0.36
Values determined on the same chloroplast sample by neutron activation. Irradiation flux 1012thermal neutrons/sec/cm' for 8 minsChloroplasts were 85% intact and were washed with 0.33M sorbitol and brought to pH 7.5with Tris base. (ref 23)
amounts of K+ and MgZ+ (see Table 1), it seems that Mg2+ acts as the main counterionfor the H+ pump. At first sight this seems unexpected but bearing in mind that the in-ward pumping of protons probably displaces cations which are in the diffuse electricallayer on the inner side of the membrane, then divalent cations are the more likely can-didates (Figure 1). Assuming 250 to 600 nequivs H+/mg chlorophyll are taken up intothe intrathylakoid space then 125 to 300 nmoles Mg2+/mg chlorophyll would be dis-placed into the stroma. It has been convincingly shown that the envelope is normallyimpermeable to this divalent cation [9,25] and assuming the stromal volume is about22 Vl/mg chlorophyll [12] then the H+/Mgl + exchange would increase the stromalMg 2 + content by about 6 to 14 mM.
4. Evidence for H+/Mg+ exchange across the thylakoid membrane
Early experiments carried out with isolated broken chloroplasts had indicated the pos-sible importance of Mg2+ as the counterion for H+ pumping [8, 18]. However, in1974, Hind et al. [13] carried out a comprehensive set of experiments which showedthat even when chloroplasts were suspended in a medium containing equal concentra-tions of K + and Mg2+, the latter cation was found to exchange with H + . Only whenthe level of K+ was significantly greater than the Mg2+ level in the medium was K + ef-flux observed.Evidence for the involvement of Mg2+ as the major counterion to light induced protonpumping in the intact chloroplast has come from several different types of studies. Bar-ber and his colleagues [5,6] have used ion specific ionophores to dissipate the protongradient as indicated by changes in chlorophyll fluorescence. Isolated intact chloro-plasts show a slow light induced quenching of chlorophyll fluorescence similar to thatseen with intact leaves and algae [1] which is both dependent on the presence of metalcations and the establishment of ApH [6, 16]. It seems that the exchange of metal ca-tions and protons across the thylakoids induces conformational changes in the mem-brane which results in a quenching of the chlorophyll fluorescence yield [20]. Thisfluorescence quenching can be reversed by collapsing ApH using appropriate ionopho-rous antibiotics [5]. By using the cation specific ionophores valinomycin (for K+),
87
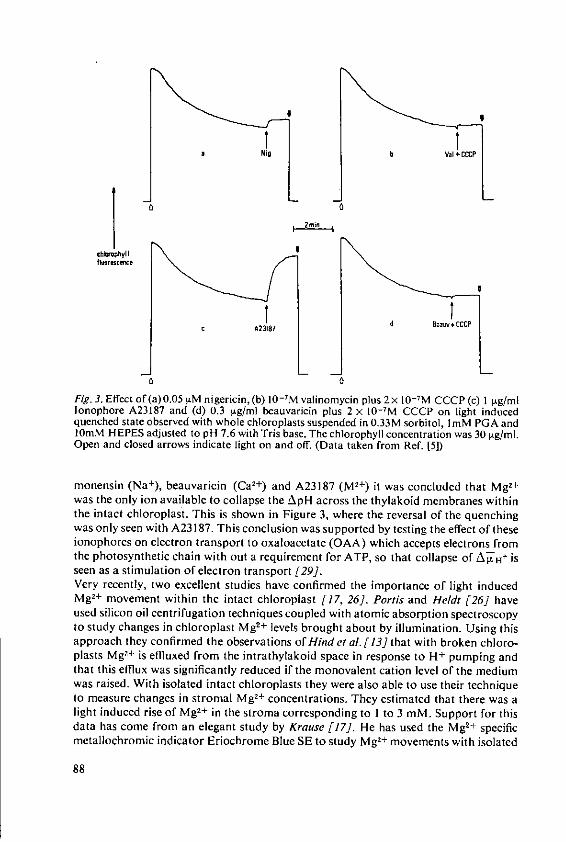
Nig b U CP
aa
I IC A23187d
Fig. 3. Effect of (a)0.05 rzM nigericin, (b) 10-7M valinomycin plus 2 x 10⁻⁷ M CCCP (c) I zg/mllonophore A23187 and (d) 0.3 Itg/ml beauvaricin plus 2 x 10⁻⁷M CCCP on light inducedquenched state observed with whole chloroplasts suspended in 0.33 M sorbitol, I mM PGA and
OmM HEPES adjusted to pH 7.6 with Tris base. The chlorophyll concentration was 30 vg/ml.Open and closed arrows indicate light on and off. (Data taken from Ref. [51)
monensin (Na+), beauvaricin (Cal +) and A23187 (M 2+ ) it was concluded that Mg2+
was the only ion available to collapse the ApH across the thylakoid membranes withinthe intact chloroplast. This is shown in Figure 3, where the reversal of the quenchingwas only seen with A23187. This conclusion was supported by testing the effect of theseionophores on electron transport to oxaloacetate (OAA) which accepts electrons fromthe photosynthetic chain with out a requirement for ATP, so that collapse of AltH isseen as a stimulation of electron transport [29].Very recently, two excellent studies have confirmed the importance of light inducedMg2+ movement within the intact chloroplast [17, 26]. Portis and Heldt [26] haveused silicon oil centrifugation techniques coupled with atomic absorption spectroscopyto study changes in chloroplast Mg 2+ levels brought about by illumination. Using thisapproach they confirmed the observations of Hind et al. [13] that with broken chloro-plasts Mg 2t is effluxed from the intrathylakoid space in response to H+ pumping andthat this efflux was significantly reduced if the monovalent cation level of the mediumwas raised. With isolated intact chloroplasts they were also able to use their techniqueto measure changes in stromal Mg 2+ concentrations. They estimated that there was alight induced rise of Mg2+ in the stroma corresponding to I to 3 mM. Support for thisdata has come from an elegant study by Krause [17]. He has used the Mg2+ specificmetallochromic indicator Eriochrome Blue SE to study Mg2t movements with isolated
88
broken and intact chloroplasts. Absorption changes are seen at 554 nm when this dyecomplexes with free Mg2 . With this approach he has given support both for light in-duced MgI+/H± exchange across the in sitit thylakoids and for a rise in the stromal lev-el of Mgz+ by about 5 mM. As with the chlorophyll fluorescence studies [5] neitherPortis and Heldt nor Krause found evidence for CaZ+ and K+ movement.Although several workers have implicated K+ as an important counterion for protonpumping in the intact chloroplast [9,30] it now seems that there is strong evidence thatMg2+ is the major exchange cation. The decrease in the Mgz+ level on the inner side ofthe thylakoid membrane together with an increase in its stromal concentration maywell have important implications in the regulation of photosynthetic activity.
5. The significance of H+/Mg 2+ exchange across the thylakoids
5.1. CO 2 fixation
It is possible that CO 2 fixation could occur within the chloroplast with out illumina-tion since the NADPH and ATP necessary to drive the Benson-Calvin cycle could besupplied to the stroma from the cytoplasm. Such a process would give rise to a futilecycle since under these conditions the ATP and NADPH have been derived from theoxidation of substrates originally produced by normal photosynthetic CO 2 fixation. Infact there is considerable evidence that such a process does not normally occur andthat the overall enzymic activity of the CO 2 fixation cycle is triggered into action onlywhen the chloroplast has been illuminated. It has been suggested that one possiblemechanism for activating the Benson-Calvin cycle could be the light induced rise in thestromal MgZ+ concentration [15] since studies with isolated enzymes of this cycle haverevealed that the activity of several of them is stimulated by Mg2+ . In particular hexo-se diphosphatase (EC 3.1.3.11), ribulose bisphosphate carboxylase (EC 4.1.1.39) andsedoheptulose bisphosphatase (EC 3.1.3.11) have all been shown to be Mg2+ sensitive(see ref. [31]). Moreover, it has also been found that CO 2 fixation by a reconstitutedbroken chloroplast system can be stimulated by raising the Mg2+ level [19]. RecentlyPortis and Held; [26] have investigated the Mg2+ sensitivity of CO 2 fixation of isolatedintact chloroplasts. They have shown that when the ionophore A23187 is added to aCO 2 fixing preparation of isolated intact chloroplasts there is a net loss of stromalMg2+ across the envelope and a concomitant inhibition of CO 2 fixation (Figure 4). If,however, the Mg+ level is raised in the suspending medium there is a recovery in theCO, fixation rate. On the other hand, as Figure 4 shows, if Ca 2+ is added in the pres-ence of A23187 then CO 2 fixation is inhibited. In the absence of A23187, neither Mg2+
nor Ca 2+ effect the rate of CO 2 fixation (Figure 4). When phosphoglycerate (PGA) wasused as an electron acceptor instead of CO, the leakage of Mg2+ from the stroma in-duced by A23187 addition had very little effect on electron flow. From these observa-tions it seems that the MgZ± dependent step in the reaction sequence of CO, fixation isthe activities of ribulose bisphosphate carboxylase and hexose diphosphatase. The inhi-bition of CO 2 fixation by Ca2+ is likely to be hexosediphosphatase since it is alreadyknown that Ca 2+ is a potent inhibitor of this enzyme [26].The work of Portis and Heldi gives credibility to the idea that a rise of stromal Mg2+ by3 to 5 mM is sufficient to allow CO 2 fixation to proceed at the maximum rate. Workfrom the same laboratory has also shown that the increase of stromal pH from about7.0 to 8.0 due to proton pumping across the thylakoids also serves to stimulate CO 2
fixation with fructose-I ,6-biphosphatase being the pH sensitive enzyme.
89
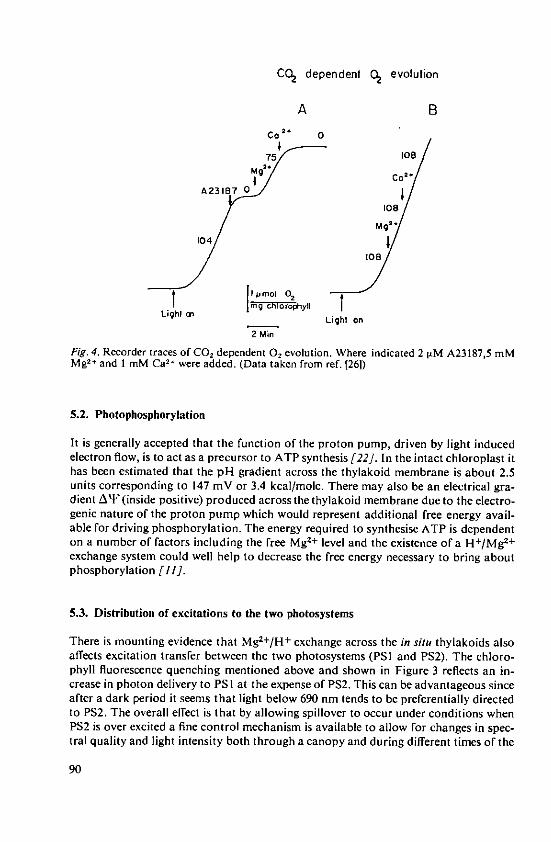
CO2 dependent 02 evolution
A B
Cc" 0
75 108
Mg Co 2
A2318 0
108,ogjg 2 ,
04 40
I 0mol 0,
Light an ILight on
2 Min
Fig. 4. Recorder traces of CO, dependent 02 evolution. Where indicated 2 tVM A23187,5 mMMg2 and 1 mM Ca24 were added. (Data taken from ref. f261)
5.2. Photophosphorylation
It is generally accepted that the function of the proton pump, driven by light inducedelectron flow, is to act as a precursor to ATP synthesis [22]. In the intact chloroplast ithas been estimated that the pH gradient across the thylakoid membrane is about 2.5units corresponding to 147 mV or 3.4 kcal/mole. There may also be an electrical gra-dient AM' (inside positive) produced across the thylakoid membrane due to the electro-genie nature of the proton pump which would represent additional free energy avail-able for driving phosphorylation. The energy required to synthesise ATP is dependenton a number of factors including the free Mg2+ level and the existence of a H+/Mg2+
exchange system could well help to decrease the free energy necessary to bring aboutphosphorylation [11].
5.3. Distribution of excitations to the two photosystems
There is mounting evidence that Mg2+/H+ exchange across the in situ thylakoids alsoaffects excitation transfer between the two photosystems (PSI and PS2). The chloro-phyll fluorescence quenching mentioned above and shown in Figure 3 reflects an in-crease in photon delivery to PSI at the expense of PS2. This can be advantageous sinceafter a dark period it seems that light below 690 nm tends to be preferentially directedto PS2. The overall effect is that by allowing spillover to occur under conditions whenPS2 is over excited a fine control mechanism is available to allow for changes in spec-tral quality and light intensity both through a canopy and during different times of the
90
day. That is, no spill-over will occur when the light is rich in far red (above 690 nm)since PSI would receive more quanta than PS2. The exact way this regulatory mecha-nism works is not clear, but it does seem to involve the Mg2+/H+ exchange between theintrathylakoid and stromal compartments. Further discussion of this topic can befound in a recent review [1].
6. Conclusions
Although chloroplasts contain K + at levels comparable with Mg2+, the existence of alarge negatively charged surface area due to the extensive thylakoid membrane systemfavours divalent cations as the exchange counterion for the light induced proton pump.Several lines of evidence implicate Mg2+ rather than Ca2+ . The displacement of Mg2+
from the electrical diffuse layer on the inner side of the thylakoid by H+ uptake andbinding results in an increase of the Mg2+ level in the stromal compartment. Portis andHeldt [26] have noted from their experiments that the change in free stromal Mg2+
due to illumination represents only a small portion of the total MgZ+ in the chloro-plast. This is not surprising bearing in mind that much of the Me + in the chloroplast isalmost certainly closely associated with membrane surfaces as well as with stromalproteins. Careful isolation of thylakoid membranes into cation free medium using iso-lated intact chloroplasts produce preparations which are rich in Mg2+ and show a highchlorophyll fluorescence state indicative of divalent cations at the membrane surface[21]. Thus there is every indication that the outer thylakoid membrane surface nor-mally has a high level of Mg2+ associated with it and that the light induced efflux ofMg2+ from the intrathylakoid space results in a significant increase in the 'free' Mgcontent of the stroma. It would be expected that when thylakoid membrane prepara-tions (broken chloroplasts) are suspended in different electrolyte media then the ioniccomposition of the diffuse electrical layer should change in a predictable manner. Re-cently Nakatani and Barber [23] have demonstrated by direct multielemental analysesusing neutron activation, that the ions associated with the thylakoid membranes are in-deed determined by the pretreatment condition in line with the diffuse double layerconcept. Clearly then, with isolated broken chloroplasts the nature of the exchange co-ion for proton pumping will be determined by the suspending medium and it is this factwhich has been the cause of past conflicting results. The stroma is the physiologicalmedium for the thylakoids and although K + is present and does not diffuse readilyacross the envelope[9], its level is such that Mg2+ is able to act as the major counterionfor proton pumping.
Acknowledgements
I wish to thank the Science Research Council and the EEC Solar Energy Research andDevelopment Programme for financial support.
References
I. Barber, J.: Ionic regulation in intact chloroplasts and its effect on primary photosyntheticprocesses. In 'The Intact Chloroplast'. Vol. 1 of Topics in Photosynthesis. Ed. J. Barber,pp. 89-134 Pub. Elsevier, 1976
91
2. Barber, J.: Cation control of photosynthesis. Trends in Biochem. Sci. 1,33-36(1976)3. Barber, J. and Mills, J.: Control of chlorophyll fluorescence by the diffuse double layer.
FEBS Letters 68, 288-292 (1976)4. Barber, J., Mills, J. and Love, A.: Electrical diffuse layers and their influence on photosyn-
thetic processes. FEBS Letters 74. 174-181 (1977)5. Barber, J., Mills, J. and Nicolson, J.: Studies with cation specific ionophores show that
with intact chloroplasts Mg 2+ acts as the main counterion for H + pumping. FEBS Letters49, 106-110 (1974)
6. Barber, J., Telfer, A., Mills, J. and Nicolson, J.: Slow chlorophyll fluorescence changes inisolated intact chloroplasts: Evidence for cation control. Proc. of 3rd. Int. Cong. on Pho-tosynthesis. Vol. 1, Ed. M. Avron. pp 53-63 Pub. Elsevier (1974)
7. Berg, S., Dodge, S., Krogniann, D. W. and Dilley, R.A.: Chloroplast grana membrane car-boxyl groups. Their involvement in membrane association. Plant Physiol. 53, 619-627(1974)
8. Dilley, R.A. and Vernon, L.P.: Ion and water transport processes related to the light de-pendent shrinkage of spinach chloroplasts. Arch. Biochem, Biophys. Ill, 365-375 (1965)
9. Ginnler, H., Schafer, G. and Heber, U.: Low permeability of the chloroplast envelope to-wards cations. In Proc. of 3rd Int. Congr. on Photosynthesis Ed. M. Avron, Vol. 11.pp. 1381-1392. Pub. Elsevier (1974)
10. Gross, E.L. and Hess, S.C.: Correlation between calcium ion binding to chloroplastmembranes and divalent cation induced structural changes and changes in chlorophyll afluorescence. Biochim. Biophys. Acta 339, 334-346 (1974)
11. Hall, D. 0.: The coupling of photophosphorylation to electron transport in isolated chlo-roplasts. In 'The Intact Chloroplast' Vol. I. Topics in Photosynthesis. Ed. J. Barber,pp. 135-170, Pub. Elsevier, 1976
12. Heldt, H. W., Werdan, K., Milovancev, M. and Geller, G.: Alkalization of the chloroplaststroma caused by light-dependent proton flux into the thylakoid space. Biochem. Biophys.Acta 314, 224-241 (1973)
13. Hind, G., Nakatani, H, Y. and Izawa, S.: Light dependent redistribution of ions in suspen-sions of chloroplast thylakoid membranes. Proc. Nat. Acad. Sci. U.S. 11, 1484-1488(1974)
14. Hope, A.B., Chow, W.S. and Wagner, G.: Ionic exchange in chloroplasts: Membranetransport and membrane adsorption. In Proc. Int. Workshop on Transmembrane IonicExchanges in Plants, held in Rouen, France, 1976, in press
15. Jensen, R.G. and Basshan, J.A.: Photosynthesis by isolated chloroplasts. I1. Light acti-vation of the carboxylation reaction. Biochim. Biophys. Acta 153, 227-234 (1968)
16. Krause, G.H.: Changes in chlorophyll fluorescence in relation to light-dependent cationtransfer across thylakoid membranes. Biochim. Biophys. Acta 333, 301-313 (1974)
17. Krause, G. H.: Light-induced movement of magnesium ions in intact chloroplasts. Spec-troscopic determination with Eriochrome Blue SE. Biochim. Biophys. Acta, 460, 500-510(1977).
18. Lin, D.C. and Nobel, P.S.: Control of photosynthesis by Mg 2+. Arch. Biochem. Biophys.145, 622-632 (1971)
19. Lilley, R.McC., Holborow, K. and Walker, D.A.: Magnesium activation of photosyn-thetic CO-flxation in a reconstituted chloroplast system. New Phytol. 73, 657-662 (1974)
20. Mills, J. and Barber, J.: Energy dependent cation induced control of chlorophyll a fluo-rescence in isoltated intact chloroplasts. Arch. Biochem. Biophys. 170, 306-314 (1975)
21. Mills, J., Telfer, A. and Barber, J.: Cation control of chlorophyll a fluorescence yield inchloroplasts: Location of cation sensitive sites Biochim. Biophys. Acta 440, 495-505(1976)
22. Mitchell, P.: Chemiosmotic coupling in oxidative and photosynthetic phosphorylation.Biol. Rev. 41, 445-502 (1966)
23. Nakatani, H. Y. and Barber, J.: unpublished24. Nobel, P.S. and Mel, H.C.: Electrophoretic studies of light induced charge in spinach
chloroplasts. Arch. Biochem. Biophys. 113, 695-702 (1966)25. Pflfiger, R.: Investigations into ion fluxes of chloroplasts with an intact envelope. Z. Na-
turforsch. 28c, 779-780 (1973)26. Portis, A. R. and Heldt, H. W.: Light-dependent changes of the Mg 2+ concentration in the
stroma in relation to the Mg 2+ dependency of CO2 fixation in intact chloroplasts. Bio-chim. Biophys. Acta 449, 434-446 (1976)
92
27. Rotenberg, H.,Grunwald, T. and Avron, M.:Determinations of ApH inchloroplasts.Dis-tribution of "4C methylamine. Eur. J. Biochem. 25, 54-63 (1972)
28. Schuldiner, S., Rottenberg, H. and Avron, M.: Determination of ApH in chloroplasts.Fluorescent amines as a probe for the determination of ApH in chloroplasts. Eur. J.Biochem. 25, 64-70 (1972)
29. Tel/er, A., Barber, J. and Nicolson, J.: Availability of monovalent and divalent cationswithin intact chloroplasts for the action of ionophores: Nigericin and A23187. Biochim.Biophys. Acta 396, 301-309 (1975)
30. Bulychev, A.A. and Vredenberg, W.J.: The effect of cations and membrane permeabilitymodifying agents on the dark kinetics of the photoelectric response in isolated chloro-plasts. Biochim. Biophys. Acta 423, 548-556 (1976)
31. Walker, D.A.: CO, fixation by intact chloroplasts. Photosynthetic induction and its rela-tion to transport phenomena and control mechanisms. In 'The Intact Chloroplast' Vol. 1.Topics in Photosynthesis. pp. 235-278, Ed. J. Barber, Pub. Elsevier. 1976
32. Witt, H. T.: Coupling of quanta, electrons, fields, ions and phosphorylation in the func-tional membrane of photosynthesis. Results by pulse spectroscopic methods. Q. Rev. Bio-phys. 4, 365-477 (1971)
93
Influence of Monovalent Cationson Photosynthetic CO, Fixation
Dr. R. Pflfiger and Angelika Cassier, Botanisches Institut der Tierarztlichen Hochschule,Hannover/Federal Republic of Germany-
Summary
Experiments were done to study the influence of the potassium nutritional status upon CO2fixation in intact chloroplasts of Spinacea oleracea and Vicia faba. Increasing the K supplyto plants increased the rate of CO2 incorporation in chloroplasts of both species. Additionsof K+ or Na ions to the reaction medium increased the rates of CO, fixation. Thesestimulating effects were greater in chloroplasts from plants with a high potassium status.Comparing the influence of K+ and Na+ ions, K- was more effective than Na + in thisrespect except in the one case of chloroplasts from spinach poorly supplied with potassiumwhere Na+ ions exhibited a better stimulation. This result may demonstrate a possible func-tion of sodium in the physiology of plants requiring the element for good growth. The ratesof CO, reduction are drastically lowered by the addition of the ionophore valinomycin. Thiseffect was reversible by adding K+ ions to the reaction mixture. In addition to the influenceof a good potassium status in optimising phosphorylation and photoreduction it is assumedthat the favourable effect of monovalent cations, especially K+, upon photosynthetic CO2fixation is brought about by higher activities and efficiencies of enzymes involved in CO2reduction.
Introduction
The importance of potassium for plant growth is indisputable. Potassium is anessential element for all plants. Very important among its many roles in plant meta-bolism is its influence on photosynthetic CO2 reduction and the following steps ofstarch synthesis (Jones [9], Hawker et al. [6]). In several plants potassium can bepartially replaced by sodium with regard to its physiological functions (Marschner[11]). This is especially the case for the Chenopodiaceae, e.g. spinach, in whichconsiderable amounts of potassium can be replaced by sodium. Sodium seems to havespecific functions in such species (El Sheikh et al. [4]).The photosynthetic processes of the plant are located in the chloroplasts of the cells.Separation of the reactions of photosynthetic CO 2 fixation from other metabolicprocesses is brought about by isolating these cell organelles. In order to obtain more
Dr. R. Pflkger, Botanisches Institut der Tierdrztlichen Hochschule, Bcjnteweg 17d, D-3Hannover-Kirchrode 71/Fed. Rep. of Germany
95
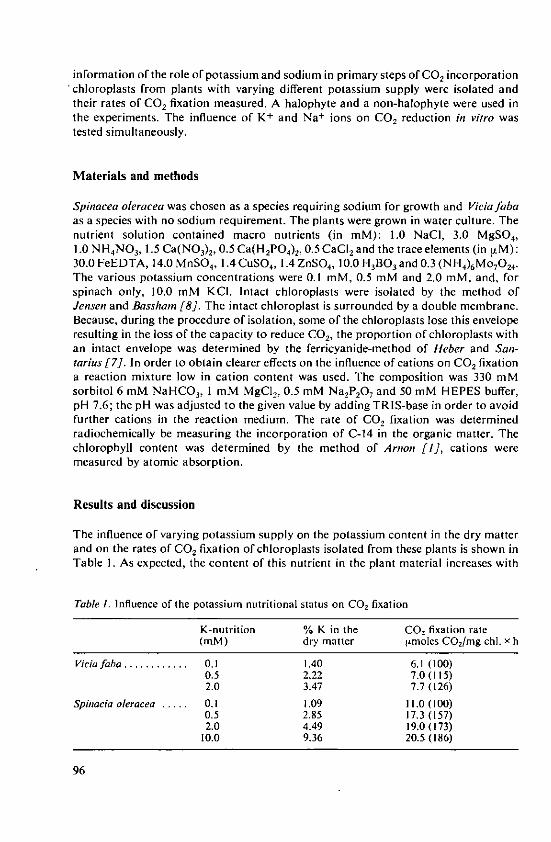
information of the role of potassium and sodium in primary steps of CO2 incorporationchloroplasts from plants with varying different potassium supply were isolated andtheir rates of CO2 fixation measured. A halophyte and a non-halophyte were used inthe experiments. The influence of K+ and Na+ ions on CO2 reduction in vitro wastested simultaneously.
Materials and methods
Spinacea oleracea was chosen as a species requiring sodium for growth and Viciafabaas a species with no sodium requirement. The plants were grown in water culture. Thenutrient solution contained macro nutrients (in mM): 1.0 NaCI, 3.0 MgSO4,1.0 NH 4NO3, 1.5 Ca(NO3 )2 , 0.5 Ca(H 2PO4), 0.5 CaCI2 and the trace elements (in j.M) :30.0 FeEDTA, 14.0 MnSO 4, 1.4 CuSO4, 1.4 ZnSO 4, 10.0 H 3BO3 and 0.3 (NH4)6 Mo7 0 2 4.The various potassium concentrations were 0.1 mM, 0.5 mM and 2.0 mM, and, forspinach only, 10.0 mM KCI. Intact chloroplasts were isolated by the method ofJensen and Basshani [8]. The intact chloroplast is surrounded by a double membrane.Because, during the procedure of isolation, some of the chloroplasts lose this enveloperesulting in the loss of the capacity to reduce CO2, the proportion of chloroplasts withan intact envelope was determined by the ferricyanide-method of Heber and San-tarius [7]. In order to obtain clearer effects on the influence of cations on CO2 fixationa reaction mixture low in cation content was used. The composition was 330 mMsorbitol 6 mM NaHCO3, I mM MgCI2 , 0.5 mM Na2P2O, and 50 mM HEPES buffer,pH 7.6; the pH was adjusted to the given value by adding TRIS-base in order to avoidfurther cations in the reaction medium. The rate of CO2 fixation was determinedradiochemically be measuring the incorporation of C-14 in the organic matter. Thechlorophyll content was determined by the method of Arnon [/], cations weremeasured by atomic absorption.
Results and discussion
The influence of varying potassium supply on the potassium content in the dry matterand on the rates of CO, fixation of chloroplasts isolated from these plants is shown inTable 1. As expected, the content of this nutrient in the plant material increases with
Table I. Influence of the potassium nutritional status on CO, fixation
K-nutrition % K in the CO, fixation rate(mM) dry matter timoles CO/mg chl. x h
Viciafaba ............ 0.1 1.40 6.1 (100)0.5 2.22 7.0 (15)2.0 3.47 7.7 (126)
Spinacia oleracea ..... 0.1 1.09 11.0 (100)0.5 2.85 17.3 (157)2.0 4.49 19.0 (173)
10.0 9.36 20.5 (186)
96
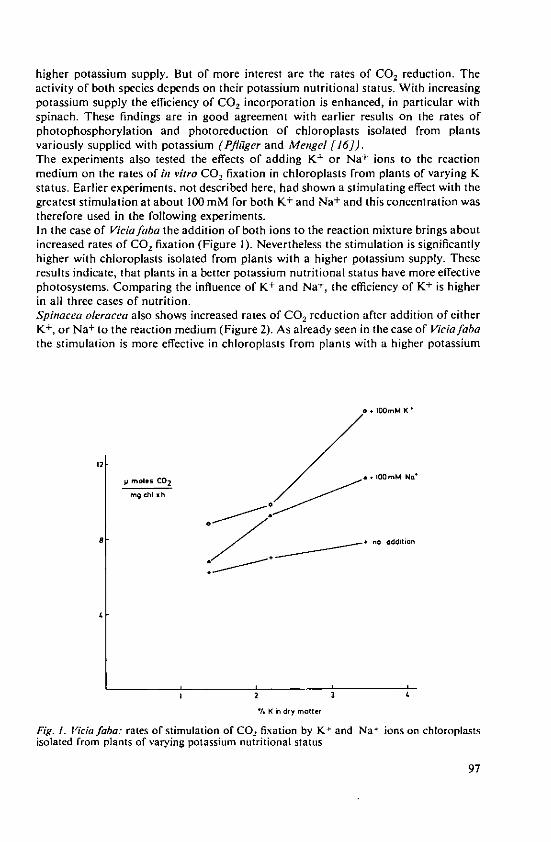
higher potassium supply. But of more interest are the rates of CO2 reduction. Theactivity of both species depends on their potassium nutritional status. With increasingpotassium supply the efficiency of CO2 incorporation is enhanced, in particular withspinach. These findings are in good agreement with earlier results on the rates ofphotophosphorylation and photoreduction of chloroplasts isolated from plantsvariously supplied with potassium (Pflfiger and Mengel [16]).The experiments also tested the effects of adding K+ or Na+ ions to the reactionmedium on the rates of in vitro CO2 fixation in chloroplasts from plants of varying Kstatus. Earlier experiments, not described here, had shown a stimulating effect with thegreatest stimulation at about 100 mM for both K+ and Na+ and this concentration wastherefore used in the following experiments.In the case of Viciafaba the addition of both ions to the reaction mixture brings aboutincreased rates of CO 2 fixation (Figure 1). Nevertheless the stimulation is significantlyhigher with chloroplasts isolated from plants with a higher potassium supply. Theseresults indicate, that plants in a better potassium nutritional status have more effectivephotosystems. Comparing the influence of K+ and Na+, the efficiency of K+ is higherin all three cases of nutrition.Spinacea oleracea also shows increased rates of CO2 reduction after addition of eitherK+ , or Na± to the reaction medium (Figure 2). As already seen in the case of Viciafabathe stimulation is more effective in chloroplasts from plants with a higher potassium
0 + I00mM K
12
00, .a .100m M No'
mgchl xh
8 . no addition
1 2 3 4
. K im d'y motte,
Fig. I. Iicia faba: rates of stimulation of CO, fixation by K+ and Na ions on chloroplastsisolated from plants of varying potassium nutritional status
97
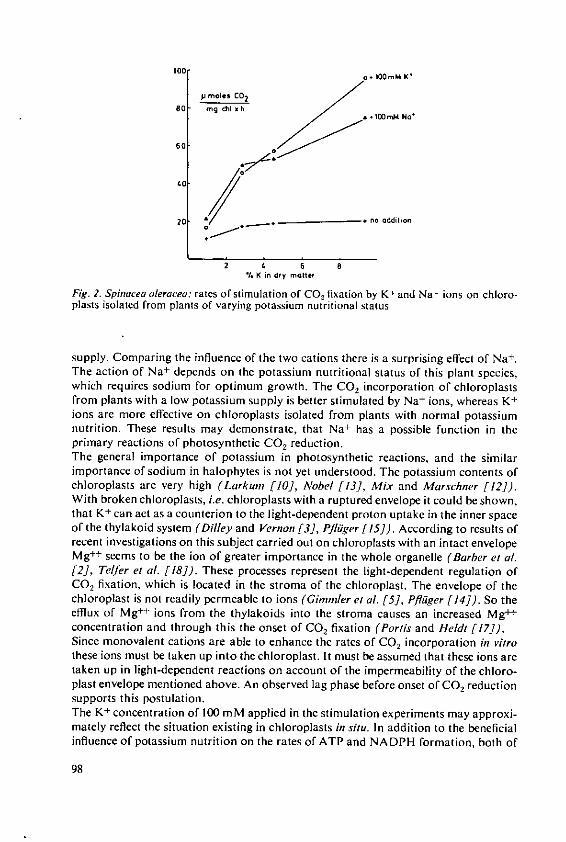
100o 100mM K'
P moles CO2
80 mg &Ii xh
60
40
20 a __ no additiOn
2 t 6 8/ K in dry mQteF
Fig. 2. Spinacea oleracea: rates of stimulation of CO, fixation by K + and Na+
ions on chloro-plasts isolated from plants of varying potassium nutritional status
supply. Comparing the influence of the two cations there is a surprising effect of Na+ .
The action of Na+ depends on the potassium nutritional status of this plant species,which requires sodium for optimum growth. The CO, incorporation of chloroplastsfrom plants with a low potassium supply is better stimulated by Na+ ions, whereas K+
ions are more effective on chloroplasts isolated from plants with normal potassiumnutrition. These results may demonstrate, that Na+ has a possible function in theprimary reactions of photosynthetic CO, reduction.The general importance of potassium in photosynthetic reactions, and the similarimportance of sodium in halophytes is not yet understood. The potassium contents ofchloroplasts are very high (Larkum [10], Nobel [13], Mix and Marsehner [12]).With broken chloroplasts, i.e. chloroplasts with a ruptured envelope it could be shown,that K+ can act as a counterion to the light-dependent proton uptake in the inner spaceof the thylakoid system (Dilley and Vernon [3], Pfliiger [15]). According to results ofrecent investigations on this subject carried out on chloroplasts with an intact envelopeMgl+ seems to be the ion of greater importance in the whole organelle (Barber et al.[2], Telfer et al. [18]). These processes represent the light-dependent regulation ofCO 2 fixation, which is located in the stroma of the chloroplast. The envelope of thechloroplast is not readily permeable to ions (Ghnunler el al. [5], Pfliger [14]). So theefflux of Mg++ ions from the thylakoids into the stroma causes an increased Mgl+
concentration and through this the onset of CO2 fixation (Portis and Heldt [17]).Since monovalent cations are able to enhance the rates of CO2 incorporation in vitrothese ions must be taken up into the chloroplast. It must be assumed that these ions aretaken up in light-dependent reactions on account of the impermeability of the chloro-plast envelope mentioned above. An observed lag phase before onset of CO, reductionsupports this postulation.The K+ concentration of 100 mM applied in the stimulation experiments may approxi-mately reflect the situation existing in chloroplasts in situ. In addition to the beneficialinfluence of potassium nutrition on the rates of ATP and NADPH formation, both of
98
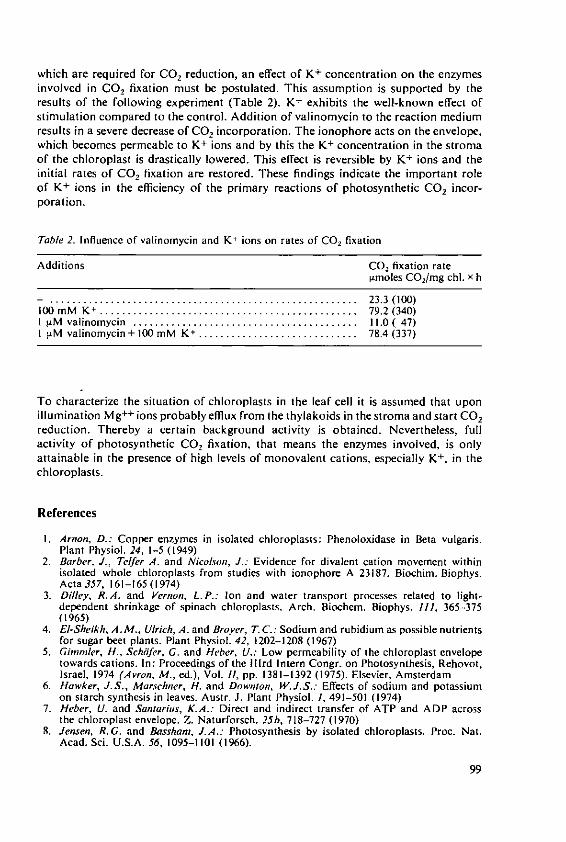
which are required for CO, reduction, an effect of K+ concentration on the enzymesinvolved in CO, fixation must be postulated. This assumption is supported by theresults of the following experiment (Table 2). K+ exhibits the well-known effect ofstimulation compared to the control. Addition of valinomycin to the reaction mediumresults in a severe decrease of CO, incorporation. The ionophore acts on the envelope,which becomes permeable to K+ ions and by this the K+ concentration in the stromaof the chloroplast is drastically lowered. This effect is reversible by K + ions and theinitial rates of CO2 fixation are restored. These findings indicate the important roleof K+ ions in the efficiency of the primary reactions of photosynthetic CO 2 incor-poration.
Table 2. Influence of valinomycin and K+ ions on rates of CO2 fixation
Additions CO, fixation ratevmoles COj/mg chl. x h
-. ........................................................ 23.3 (100 )100 m M K I ............................................... 79.2 (340)I -M valinom ycin ......................................... 11.0 ( 47)1 itM valinomycin + 100 mM K + ............................. 78.4 (337)
To characterize the situation of chloroplasts in the leaf cell it is assumed that uponillumination Mg++ ions probably efflux from the thylakoids in the stroma and start CO2reduction. Thereby a certain background activity is obtained. Nevertheless, fullactivity of photosynthetic CO, fixation, that means the enzymes involved, is onlyattainable in the presence of high levels of monovalent cations, especially K+, in thechloroplasts.
References
I. Arnon, D.: Copper enzymes in isolated chloroplasts: Phenoloxidase in Beta vulgaris.Plant Physiol. 24, 1-5 (1949)
2. Barber, J., Telfer A. and Nicolson, J.: Evidence for divalent cation movement withinisolated whole chloroplasts from studies with ionophore A 23187. Biochim. Biophys.Acta 357, 161-165 (1974)
3. Dilley, R. A. and Vernon, L.P.: Ion and water transport processes related to light-dependent shrinkage of spinach chloroplasts. Arch. Biochem. Biophys. III, 365-375(1965)
4. EI-Sheikh, A.M., Ulrich, A. and Broyer, T.C.: Sodium and rubidium as possible nutrientsfor sugar beet plants. Plant Physiol. 42, 1202-1208 (1967)
5. Gimmler, H., Schifer, G. and Heber, U.: Low permeability of the chloroplast envelopetowards cations. In: Proceedings of the II Ird Intern Congr. on Photosynthesis, Rehovot,Israel, 1974 (Avron, M., ed.), Vol. II, pp. 1381-1392 (1975). Elsevier, Amsterdam
6. Hawker, J.S., Marschner, H. and Downton, W.J.S.: Effects of sodium and potassiumon starch synthesis in leaves. Austr. J. Plant Physiol. J, 491-501 (1974)
7. Heber, U. and Santarius, K.A.: Direct and indirect transfer of ATP and ADP acrossthe chloroplast envelope. Z. Naturforsch. 25b, 718-727 (1970)
8. Jensen, R.G. and Bassham, JLA.: Photosynthesis by isolated chloroplasts. Proc. Nat.Acad. Sci. U.S.A. 56, 1095-1101 (1966).
99
9. Jones, L.H.: Carbon-14 studies of intermediary metabolism in potassium deficienttomato plants. Canad. J. Bo(. 44, 297-307 (1966)
10. Larktun, A. W.D.: Ionic relations of chloroplasts in vivo. Nature 218, 447-449 (1968)II. Marschner, H.: Why can sodium replace potassium in plants. 8th Colloq. Int. Potash
Inst., Uppsala, pp. 50-63 (1971)12. Mix, G. and Marschner, H.: Mineralstoffverteilung zwischen Chloroplasten und Uibrigem
Blattgewebe. Z. Pflanzenphysiol. 73, 307-312 (1974)13. Nobel, P.S.: Light-induced changes in the ionic content of chloroplasts in Piston sativun.
Biochim. Biophys. Acta 172, 134-143 (1969)14. Pfluiger, R.: Investigations on ion fluxes of chloroplasts with an intact envelope. Z.
Naturforsch. 28c, 779-780 (1973)15. Pfliiger, R.: Unlersuchungen von lichtinduzierten Kationenfluxen an isolierlen Chloro-
plasten. Ber. Dt. Bot. Ges. 87, 383-388 (1974)16. Pfliiger, R. and Mengel, K.: Die photochenische Aktivitat von Chloroplasten aus unter-
schiedlich mit Kalium erntihrten Pflanzen. Plant and Soil 36, 417-425 (1972)17. Porris Jr., A. R. and Held, It. W.: Light dependent changes of the Mg2+ concentration
in the stroma in relation to the Mg'- dependency of CO, fixation in intact chloroplasts.Biochim. Biophys. Acta 449, 434-446 (1976)
18. Telfer, A., Barber, J. and Nicolson, J.: Availability of monovalent and divalent cationswithin intact chloroplasts for the action of ionophores nigericin and A 23187. Biochim.Biophys. Acta 396, 301-309 (1975)
100
Effect of K' and Naon ADPG-Starch Synthetase
H. Marschner and H.-W. Doring, Institute of Crop Science -Plant Nutrition - of the Tech-nical University of Berlin-
Sununary
In plants, principally two enzyme systems are directly involved in starch synthesis: ADP-gluco-se-glucosyltransferase (starch synthetase) and phosphorylase. The relative importance of thesetwo enzyme systems seems to differ, e.g., between plant species or between organs of a plant.Starch synthetase is particularly activated by K . Maximum activation occurs between 50 and100 mM K+; at a normal potassium nutritional status, a K + concentration within this rangecan be expected within the plastids. Compared with K +, the activation by Na + is small. A shiftin the K+/Na ratio in plant tissue in favour of Na + decreases the starch and increases the su-crose content. Induction of succulenceby Na + seems to be causally related to this change in car-bohydrate composition.In storage organs in which starch is the main storage product, a high K+ but low Na contentis therefore necessary for high rates of starch synthesis. Plants have developed effective regula-tive systems to restrict the long-distance transport of Na + in the phloem into these storage org-ans, whereas the long-distance transport of K- into these organs is particularly favoured.
Starch synthesis in plants takes place in the pastids (chloroplasts, amyloplasts, proplas-
tides) and primarily two enzymes are directly involved in this biosynthesis: starch syn-
thetase (Recondo and Leloir [1961]) and phosphorylase (Figure 1).
For both enzyme systems, G-I-P is the basic substrate. Phosphorylase, however, is
able to transfer the glucosyl group directly to the starch molecule, whereas the direct
substrate for both soluble and granule-bound starch synthetase is either UDPG or
ADPG. UDPG-pyrophosphorylase or ADPG-pyrophosphorylase are therefore essen-
tially involved in starch synthesis via starch synthetase. As ADPG seems to be the sub-
strate which is preferred (Murata et al. [1964]; Sanwal et al. [1968]; Rees and Duncan
[1972]; Lavintnan and Cardini [1972]) or exclusively used (Perez et al. [1971]) by
starch synthetase, this enzyme is commonly defined as ADP-glucose: c-1.4-glucon-glu-
cosyl-transferase (Cardini and Frydman [1966]).However, generalizations are not possible since there are not only differences between
plant species and different organs of a plant; even within an organ, for example the po-
tato tuber, the preference of starch synthetase for ADPG or UDPG depends upon the
Prof.Dr.H.Alarschner, University Hohenheim, P.O.Box 106, D-7 Stuttgart 70/Fed. Rep.
of Germany; Prof. Dr. H. W. Dring, Lentzeallee 55-57, D- I Berlin 33
101
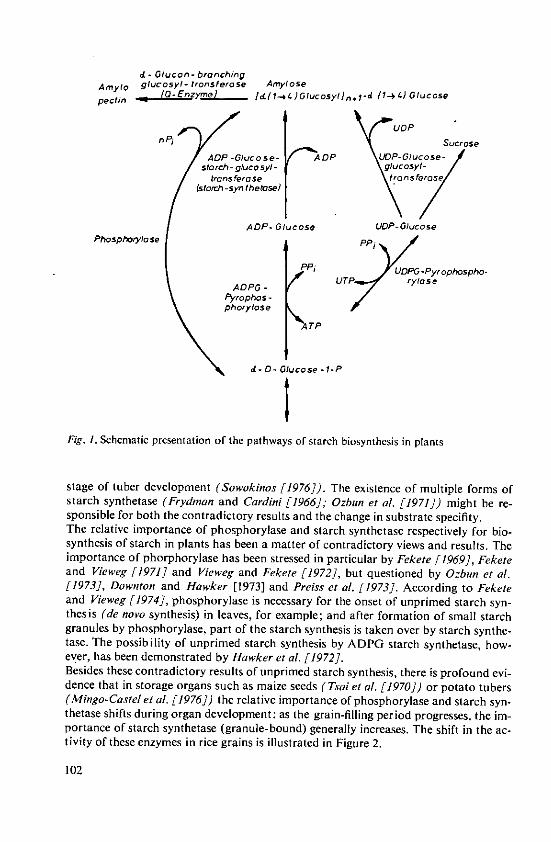
d - Glucon- branchingAmylo glucosyl- tronsferose Amylose
pectin lQ-Enyme) Id{ll_,t)Gucosyl),.y-d (14-) Glucose
c/OPi Sucrose
AOP-Glucose- AOP UOP-Glucose-storch-glucosyl- glucosyt-t,'onsfetose Irns frsstocr -syn thetosel
ADP- Glucose UOP-OlucosePhosphorylose PP
Pi UDPG -Pyi'ophospho.
ADO- (1, U7yloXjsePyrophos -phorylose
4 - D - Gluco se - I-P
IFig. 1. Schematic presentation of the pathways of starch biosynthesis in plants
stage of tuber development (Sowokinos [1976]). The existence of multiple forms ofstarch synthetase (Frydman and Cardini [1966]; Ozbun et at. [1971]) might be re-sponsible for both the contradictory results and the change in substrate specifity.The relative importance of phosphorylase and starch synthetase respectively for bio-synthesis of starch in plants has been a matter of contradictory views and results. Theimportance of phorphorylase has been stressed in particular by Fekete [1969], Feketeand Vieweg [1971] and Vieweg and Fekete [1972], but questioned by Ozbun et al.[1973], Downton and Hawker [1973] and Preiss et al. [1973]. According to Feketeand Vieweg [1974], phosphorylase is necessary for the onset of unprimed starch syn-thesis (de nova synthesis) in leaves, for example; and after formation of small starchgranules by phosphorylase, part of the starch synthesis is taken over by starch synthe-tase. The possibility of unprimed starch synthesis by ADPG starch synthetase, how-ever, has been demonstrated by Hawker et al. [1972].Besides these contradictory results of unprimed starch synthesis, there is profound evi-dence that in storage organs such as maize seeds (Tsai et al. [1970]) or potato tubers(Mingo-Castel et al. [1976]) the relative importance of phosphorylase and starch syn-thetase shifts during organ development: as the grain-filling period progresses, the im-portance of starch synthetase (granule-bound) generally increases. The shift in the ac-tivity of these enzymes in rice grains is illustrated in Figure 2.
102
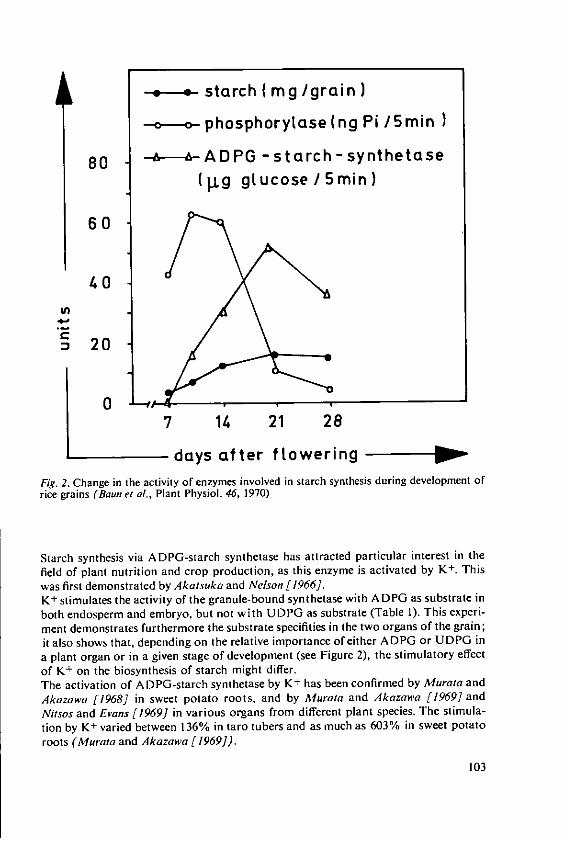
- starch (mg/grain)
-o-- phosphorylase(ng Pi/5min)
80 -&-----ADPG -starch- synthetase(tjg gLucose/Smin)
60
40
&n2
20
7 14 21 28
days after ftowering
Fig. 2. Change in the activity of enzymes involved in starch synthesis during development ofrice grains (Baun et al., Plant Physiol. 46, 1970)
Starch synthesis via ADPG-starch synthetase has attracted particular interest in thefield of plant nutrition and crop production, as this enzyme is activated by K+ . Thiswas first demonstrated by Akatsuka and Nelson [1966].K + stimulates the activity of the granule-bound synthetase with ADPG as substrate in
both endosperm and embryo, but not with UDPG as substrate (Table 1). This experi-ment demonstrates furthermore the substrate specifities in the two organs of the grain;
it also shows that, depending on the relative importance of either ADPG or UDPG ina plant organ or in a given stage of development (see Figure 2), the stimulatory effectof K+ on the biosynthesis of starch might differ.The activation of ADPG-starch synthetase by K+ has been confirmed by Murata and
Akazawa [1968] in sweet potato roots, and by Murata and Akazawa [1969] andNitsos and Evans [1969] in various organs from different plant species. The stimula-tion by K+ varied between 136% in taro tubers and as much as 603% in sweet potatoroots (Murata and Akazawa [1969]).
103
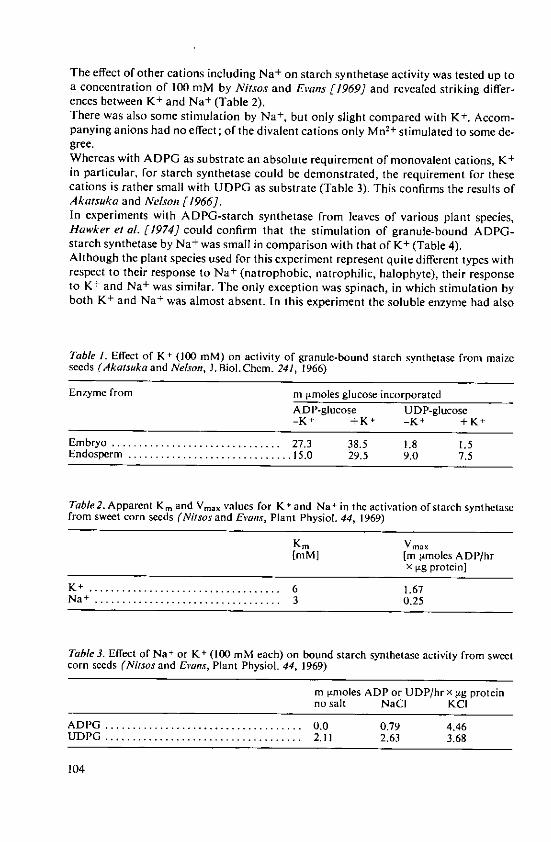
The effect of other cations including Na+ on starch synthetase activity was tested up toa concentration of 100 mM by Nitsas and Evans [1969] and revealed striking differ-ences between K+ and Na+ (Table 2).There was also some stimulation by Na+ , but only slight compared with K+. Accom-panying anions had no effect; of the divalent cations only Mn 2+ stimulated to some de-gree.Whereas with ADPG as substrate an absolute requirement of monovalent cations, K+in particular, for starch synthetase could be demonstrated, the requirement for thesecations is rather small with UDPG as substrate (Table 3). This confirms the results ofAkatsuka and Nelson [1966].In experiments with ADPG-starch synthetase from leaves of various plant species,Hawker et al. [1974] could confirm that the stimulation of granule-bound ADPG-starch synthetase by Na+ was small in comparison with that of K+ (Table 4).Although the plant species used for this experiment represent quite different types withrespect to their response to Na+ (natrophobic, natrophilic, halophyte), their responseto Kt and Na+ was similar. The only exception was spinach, in which stimulation byboth K + and Na + was almost absent. In this experiment the soluble enzyme had also
Table 1. Effect of KT (100 mM) on activity of granule-bound starch synthelase from maizeseeds (Akatsuka and Nelson, J.Biol.Chem. 241, 1966)
Enzyme from m timoles glucose incorporatedADP-glucose UDP-glucose-K + +K -K + +K +
Em bryo ............................... 27.3 38.5 1.8 1.5Endosperm .............................. 15.0 29.5 9.0 7.5
Table 2. Apparent Km and Vmax values for K+ and NaT in the activation of starch synthetasefrom sweet corn seeds (Nitsos and Evans, Plant Physiol. 44, 1969)
Km Vmax[mM] [m itmoles ADP/hr
x Vg protein]
K . ................................... 6 1.67N aT .................................. 3 0.25
Table 3. Effect of Na+ or KT (100 mM each) on bound starch synthetase activity from sweetcorn seeds (Nitsos and Evans, Plant Physiol. 44, 1969)
m vmoles ADP or UDP/hr x gg proteinno salt NaCI KCI
AD PG .................................... 0.0 0.79 4.46UD PG .................................... 2.11 2.63 3.68
104
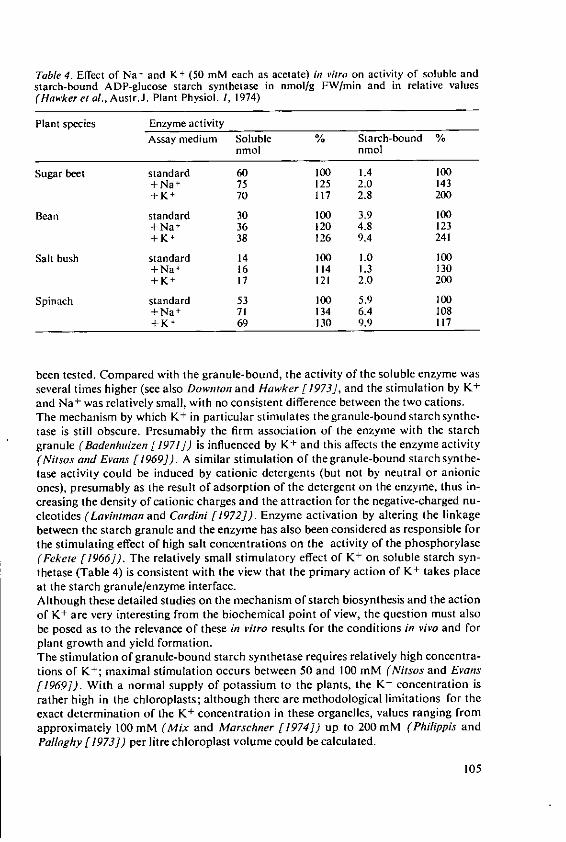
Table 4. Effect of Na + and K+ (50 mM each as acetate) in vitro on activity of soluble andstarch-bound ADP-glucose starch synthetase in nmol/g FW/min and in relative values(Hawkeretal.,Austr.J. Plant Physiol. /, 1974)
Plant species Enzyme activityAssay medium Soluble % Starch-bound %
nmol nmol
Sugar beet standard 60 100 1.4 100+Na + 75 125 2.0 143+K 70 117 2.8 200
Bean standard 30 100 3.9 100+Na + 36 120 4.8 123+K 38 126 9.4 241
Salt bush standard 14 100 1.0 100+Na + 16 114 1.3 130+K + 17 121 2.0 200
Spinach standard 53 100 5.9 100+Na + 71 134 6.4 108+K + 69 130 9.9 117
been tested. Compared with the granule-bound, the activity of the soluble enzyme wasseveral times higher (see also Downton and Hawker [1973], and the stimulation by K+and Na+ was relatively small, with no consistent difference between the two cations.The mechanism by which K+ in particular stimulates the granule-bound starch synthe-tase is still obscure. Presumably the firm association of the enzyme with the starchgranule (Badenhuizen [1971]) is influenced by K + and this affects the enzyme activity(Nitsos and Evans [1969]). A similar stimulation of thegranule-bound starch synthe-tase activity could be induced by cationic detergents (but not by neutral or anionicones), presumably as the result of adsorption of the detergent on the enzyme, thus in-creasing the density of cationic charges and the attraction for the negative-charged nu-cleotides (Lavinman and Cardini [1972]). Enzyme activation by altering the linkagebetween the starch granule and the enzyme has also been considered as responsible forthe stimulating effect of high salt concentrations on the activity of the phosphorylase(Fekete [1966]). The relatively small stimulatory effect of K+ on soluble starch syn-thetase (Table 4) is consistent with the view that the primary action of K+ takes placeat the starch granule/enzyme interface.Although these detailed studies on the mechanism of starch biosynthesis and the actionof K+ are very interesting from the biochemical point of view, the question must alsobe posed as to the relevance of these in vitro results for the conditions in vivo and forplant growth and yield formation.The stimulation of granule-bound starch synthetase requires relatively high concentra-tions of K+; maximal stimulation occurs between 50 and 100 mM (Nitsos and Evans[1969]). With a normal supply of potassium to the plants, the K + concentration israther high in the chloroplasts; although there are methodological limitations for theexact determination of the K+ concentration in these organelles, values ranging fromapproximately 100 mM (Mix and Marschner [1974]) up to 200 mM (Philippis andPallaghy [1973]) per litre chloroplast volume could be calculated.
105
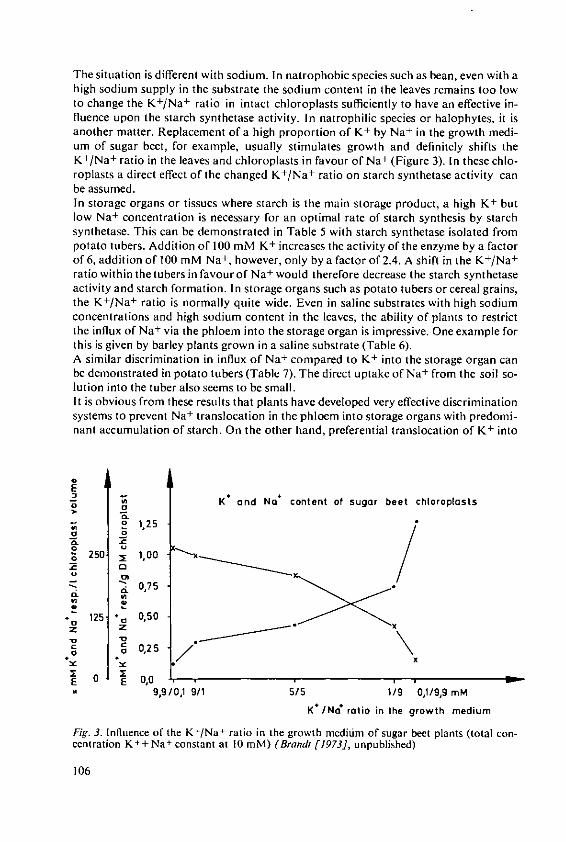
The situation is different with sodium. In natrophobic species such as bean, even with ahigh sodium supply in the substrate the sodium content in the leaves remains too lowto change the K+/Na+ ratio in intact chloroplasts sufficiently to have an effective in-fluence upon the starch synthetase activity. In natrophilic species or halophytes, it isanother matter. Replacement of a high proportion of K+ by Na+ in the growth medi-um of sugar beet, for example, usually stimulates growth and definitely shifts theK+/Na+ ratio in the leaves and chloroplasts in favour of Na± (Figure 3). In these chlo-roplasts a direct effect of the changed K+/Na+ ratio on starch synthetase activity canbe assumed.In storage organs or tissues where starch is the main storage product, a high K + butlow Na+ concentration is necessary for an optimal rate of starch synthesis by starchsynthetase. This can be demonstrated in Table 5 with starch synthetase isolated frompotato tubers. Addition of 100 mM K + increases the activity of the enzyme by a factorof 6, addition of 100 mM Na+ , however, only by a factor of 2.4. A shift in the K+/Na +
ratio within the tubers in favour of Na+ would therefore decrease the starch synthetaseactivity and starch formation. In storage organs such as potato tubers or cereal grains,the K+/Na+ ratio is normally quite wide. Even in saline substrates with high sodiumconcentrations and high sodium content in the leaves, the ability of plants to restrictthe influx of Na+ via the phloem into the storage organ is impressive. One example forthis is given by barley plants grown in a saline substrate (Table 6).A similar discrimination in influx of Na+ compared to K+ into the storage organ canbe demonstrated in potato tubers (Table 7). The direct uptake of Na+ from the soil so-lution into the tuber also seems to be small.It is obvious from these results that plants have developed very effective discriminationsystems to prevent Na+ translocation in the phloem into storage organs with predomi-nant accumulation of starch. On the other hand, preferential translocation of K± into
EoK* and No* content of sugar beet chloroplastso 0.
C!
0,75•,
0o 125' * 0,50
a
U
Z 0,7z Z X
I E 0,09,9/0,1 9/1 5/5 1/9 0,1/9,9 mM
K*/No ratio in the growth medium
Fig. 3. Influence of the K /Na ratio in the growth mediim of sugar beet plants (total con-centration K +Na + constant at 10 MM) (Brandt [1973], unpublished)
106
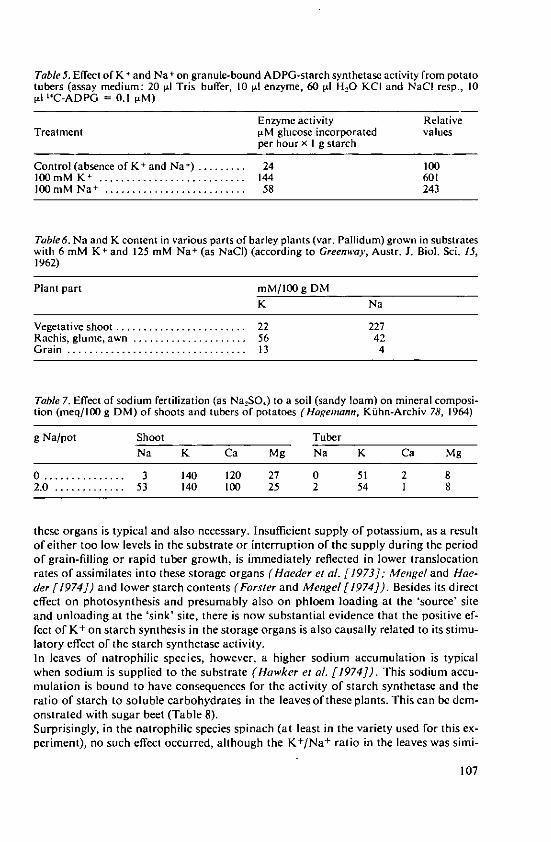
Table 5. Effect of K I and Na4 on granule-bound ADPG-starch synthetase activity from potatotubers (assay medium: 20 l1 Tris buffer, 10 V1 enzyme, 60 p1d H,0 KCI and NaCI resp., 10[l 1C-ADPG = 0.1 [M)
Enzyme activity RelativeTreatment [LM glucose incorporated values
per hour x I g starch
Control (absence of K+ and Na4 ) ......... 24 100100mM K4 ... . . . . . . . . . . . . . . . . . . . . . . . . 144 601100 m M Na. .......................... 58 243
Table 6. Na and K content in various parts of barley plants (var. Pallidum) grown in substrateswith 6 mM K and 125 mM Na + (as NaCI) (according to Greenway, Austr. J. Biol. Sci. 15,1962)
Plant part mM/100 g DMK Na
Vegetative shoot ........................ 22 227Rachis, glume, awn ..................... 56 42G rain ................................. 13 4
Table 7. Effect of sodium fertilization (as Na2SO4 ) to a soil (sandy loam) on mineral composi-tion (meq/100 g DM) of shoots and tubers of potatoes (Hagemann, Kiihn-Archiv 78, 1964)
g Na/pot Shoot TuberNa K Ca Mg Na K Ca Mg
0 ............... 3 140 120 27 0 51 2 82.0 ............. 53 140 110 25 2 54 1 8
these organs is typical and also necessary. Insufficient supply of potassium, as a resultof either too low levels in the substrate or interruption of the supply during the periodof grain-filling or rapid tuber growth, is immediately reflected in lower translocationrates of assimilates into these storage organs (Haeder el al. [1973]; Mengel and Hae-der [1974]) and lower starch contents (Forster and Mengel [1974]). Besides its directeffect on photosynthesis and presumably also on phloem loading at the 'source' siteand unloading at the 'sink' site, there is now substantial evidence that the positive ef-fect of K+ on starch synthesis in the storage organs is also causally related to its stimu-latory effect of the starch synthetase activity.In leaves of natrophilic species, however, a higher sodium accumulation is typicalwhen sodium is supplied to the substrate (Hawker et al. [1974]). This sodium accu-mulation is bound to have consequences for the activity of starch synthetase and theratio of starch to soluble carbohydrates in the leaves of these plants. This can be dem-onstrated with sugar beet (Table 8).Surprisingly, in the natrophilic species spinach (at least in the variety used for this ex-periment), no such effect occurred, although the K+/Na+ ratio in the leaves was simi-
107
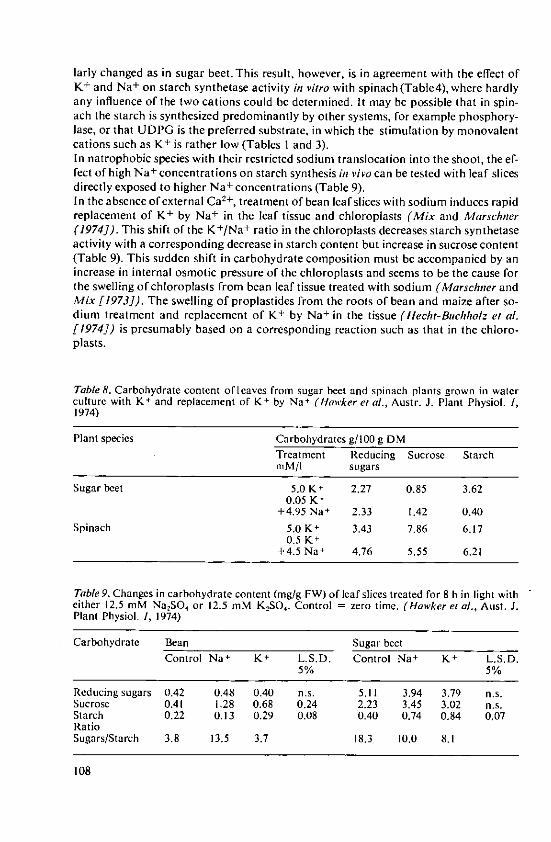
larly changed as in sugar beet. This result, however, is in agreement with the effect ofK+ and Na+ on starch synthetase activity in vitro with spinach (Table4), where hardlyany influence of the two cations could be determined. It may be possible that in spin-ach the starch is synthesized predominantly by other systems, for example phosphory-lase, or that UDPG is the preferred substrate, in which the stimulation by monovalentcations such as K+ is rather low (Tables I and 3).In natrophobic species with their restricted sodium translocation into the shoot, the ef-fect of high Na+ concentrations on starch synthesis in vivo can be tested with leaf slicesdirectly exposed to higher Na+ concentrations (Table 9).In the absence of external Cal+, treatment of bean leaf slices with sodium induces rapidreplacement of K+ by Na+ in the leaf tissue and chloroplasts (Mix and Marschner(1974]). This shift of the K+/Na+ ratio in the chloroplasts decreases starch synthetaseactivity with a corresponding decrease in starch content but increase in sucrose content(Table 9). This sudden shift in carbohydrate composition must be accompanied by anincrease in internal osmotic pressure of the chloroplasts and seems to be the cause forthe swelling of chloroplasts from bean leaf tissue treated with sodium (Marschner andMix [1973]). The swelling of proplastides from the roots of bean and maize after so-dium treatment and replacement of K+ by Na+ in the tissue (Hecht-Buchholz el al.[1974]) is presumably based on a corresponding reaction such as that in the chloro-plasts.
Table 8. Carbohydrate content of leaves from sugar beet and spinach plants grown in waterculture with K + and replacement of K4 by Na + (Hawker et al., Austr. J. Plant Physiol. 1,1974)
Plant species Carbohydrates g/100 g DM
Treatment Reducing Sucrose StarchmM/I sugars
Sugar beet 5.0 K 2.27 0.85 3.620.05 K+
+4.95 Na 2.33 1.42 0.40
Spinach 5.0 K- 3.43 7.86 6.170.5 K +
+4.5 Na1 4.76 5.55 6.21
Table 9. Changes in carbohydrate content (mg/g FW) of leaf slices treated for 8 h in light with -
either 12.5 mM Na2 SO4 or 12.5 mM KSO. Control = zero time. (Hawker et al., Aust. J.Plant Physiol. 1, 1974)
Carbohydrate Bean Sugar beetControl Na + K' L.S.D. Control Na' K+ L.S.D.
5% 5%
Reducing sugars 0.42 0.48 0.40 n.s. 5.11 3.94 3.79 n.s.Sucrose 0.41 1.28 0.68 0.24 2.23 3.45 3.02 n.s.Starch 0.22 0.13 0.29 0.08 0.40 0.74 0.84 0.07RatioSugars/Starch 3.8 13.5 3.7 18.3 10.0 8.1
108
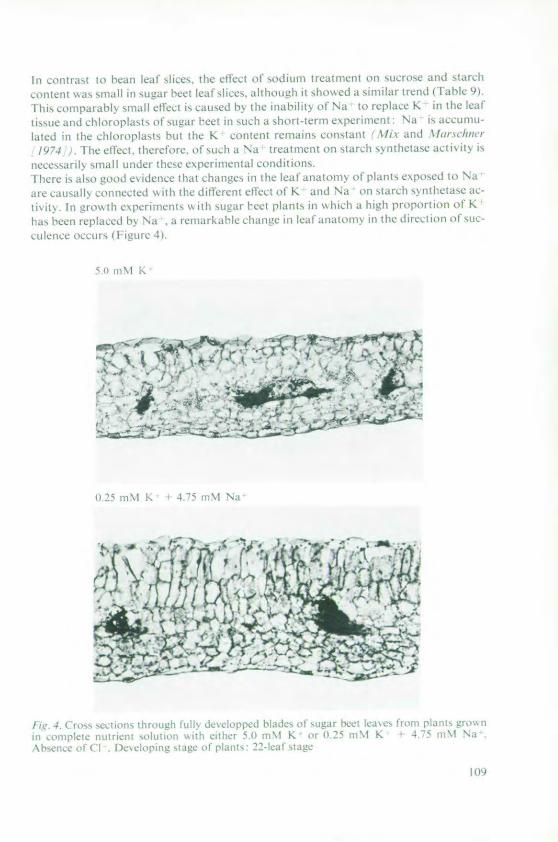
InI contrast to heanl leafl slice,, the effect Of sntlirii>1i trat iICIII OH SiUCtOsI il 'tarch
c(ItC t ias st, all it I t t ' i g eaet l iflice,. tlIhoug h it h .h k ed a i ilrI trIend (I itbe 9)
1 hi comparably small efcmt is, cuwd ; the nahbility of Na to tcplace K in he leaf
tissue and hlmorplasts l of 'at Mi int such a shor-tern'pci uncut 'Na is acn\a aumu-
tcd in the chloroplasts but tlic K content remainsc onstant %.k and /lal tolai
/974 ,Tfhe effect. theIre Cfo,i- ,_I of suc \Ni reatnienlt on' si I'll s n Iheltse a.ti i iIs
ecssirilv sm all under thsCe (,pIC h cital conditio n,
Tier also 20od esidntce hat changes in the Ilf aitatom;n of plants expAsed to Na
are causall, connecit "uh tlt. dtlu-rcnt OAkct of K an 'Ni on starch s' [thtae-
tis it I, I glo h c perm cit, hth fet pacc n p lt in M itc a hih pro.porti on of K
bas en irplaced h; Na .a icmidarklle chatnuc in leal anmtn in the directOItI s11 0 L-IUICIIl tC OCCLIS 0 ile 4IJ
0e5 c II- mut 4
10 it :Y0
. It2
T alc r 1 !0 [)I K ,r o' 11\oN K 47 n\1'N
NI>m t inm my M i m Q 2M c"
O ll
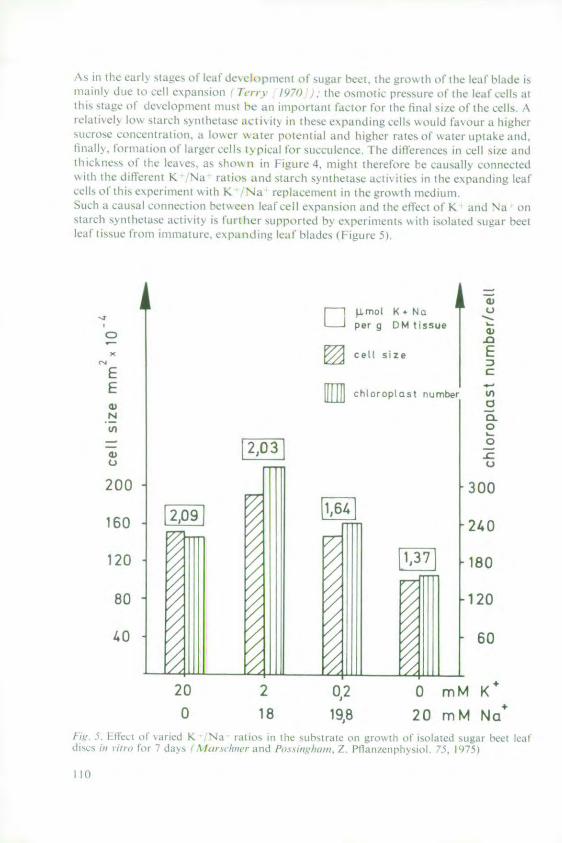
\ I te lCt' 1i "1 J f A' de " iitct s ! sttctet , t 1hc 4rt;illth h le lea lde isl It td lo c 'c yleptllol 1i, /'T ylt the 1t11it K 'feitfc ot Il Ithe Cl ce lla
thi, '[la", o f iiCi o llt n Iuin- ble jill ill'O tttltl lttI tor Il the aill sI/C o(f Ihe eel,\ItClaile II ' t' 5 I C h 5, litII is a t. , i\. ItS P thIese C ptalidIllgC eQCIS ol l IaN (it I itlheis110c11C ctttvcnttrltixn is. t l pownn iik and h1"ichr rate .f ssIt upaiike and,ihlnalll ltot t lo tot " I ,g Cr elI I s ial lit tIlet+ec I he dillcrcene in cell size aindthicknes l J v . i0" 15,, Il1 i; I-tuctC 4, mitiht thclore he catallk onte!CIedt\Ith Il
+d
IItllttcti K N I t 01 l 01d SI O h 1) titi) 1tM , iS Il Cs i m he C xpa tdln lCafcel I.sl tIt Ih - t c\,tcr Ct )t s I Ih K Na I tltt s 'Itll h e h rov~h ie t diui
0uch a ctlctl evt)lIlCtIlII l tset-t liaf'el C\pal tont and the ClC lio K alld \a onstarch \nyhCt wCa1IItis h 'lcl atp'p1orte'.l 2 elJ ritrCIteIt \ its isolated shear bet[leaf tissue: f10tts imaur.epanldllt, leaf blades ,- [Itr I3.4J
Ii Jmol K. Nc
per g DM tissueO .0
x [] cell size
E CE chlorpisl number i
wdNa
0-- i-0
4) F2,0 3
200 300
160 . 2,0 9]i6 240
120 F13 180I L
80 .120
40 60
20 2 0,2 0 mM K +
0 18 19,8 20 mM NaI 1 ,I bt jl o I slii K Na tanhj s Iii [hIe btll"ittf ot gio'1. ,i t osiutted swegat it CI
ai f ir 1 l ss W .....t.o 1t1'.lIism /t; 1. 'disepiiso 3 9
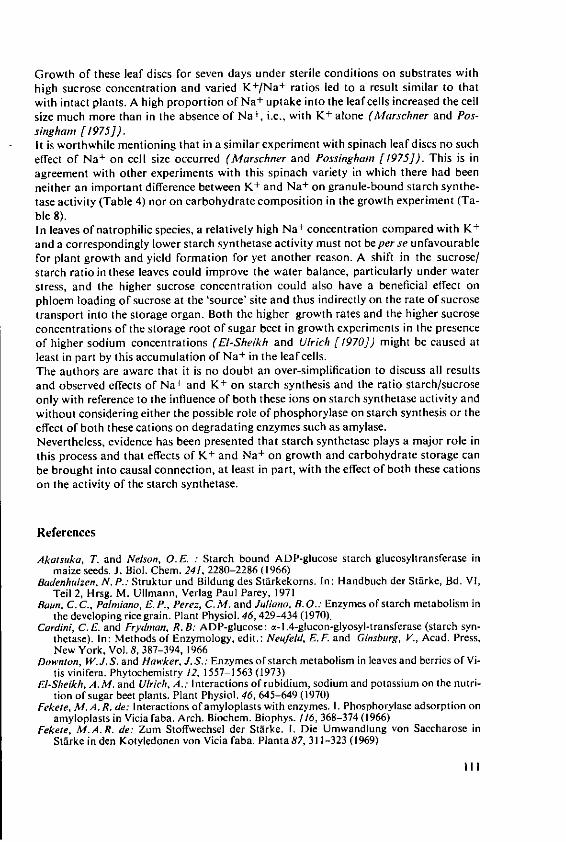
Growth of these leaf discs for seven days under sterile conditions on substrates withhigh sucrose concentration and varied K+/Na+ ratios led to a result similar to thatwith intact plants. A high proportion of Na+ uptake into the leaf cells increased the cellsize much more than in the absence of Na±, i.e., with K+ alone (A'Iarschner and Pos-singhan [1975]).It is worthwhile mentioning that in a similar experiment with spinach leaf discs no sucheffect of Na+ on cell size occurred (Marschner and Possingham [1975]). This is inagreement with other experiments with this spinach variety in which there had beenneither an important difference between K+ and Na+ on granule-bound starch synthe-tase activity (Table 4) nor on carbohydrate composition in the growth experiment (Ta-ble 8).In leaves of natrophilic species, a relatively high Na+ concentration compared with K+
and a correspondingly lower starch synthetase activity must not be per se unfavourablefor plant growth and yield formation for yet another reason. A shift in the sucrose/starch ratio in these leaves could improve the water balance, particularly under waterstress, and the higher sucrose concentration could also have a beneficial effect onphloem loading of sucrose at the 'source' site and thus indirectly on the rate of sucrosetransport into the storage organ. Both the higher growth rates and the higher sucroseconcentrations of the storage root of sugar beet in growth experiments in the presenceof higher sodium concentrations (El-Sheikh and Ulrich [1970]) might be caused atleast in part by this accumulation of Na + in the leaf cells.The authors are aware that it is no doubt an over-simplification to discuss all resultsand observed effects of Na+ and K+ on starch synthesis and the ratio starch/sucroseonly with reference to the influence of both these ions on starch synthetase activity andwithout considering either the possible role of phosphorylase on starch synthesis or theeffect of both these cations on degradating enzymes such as amylase.Nevertheless, evidence has been presented that starch synthetase plays a major role inthis process and that effects of K + and Na+ on growth and carbohydrate storage canbe brought into causal connection, at least in part, with the effect of both these cationson the activity of the starch synthetase.
References
Akatsuka, T. and Nelson, O.E. : Starch bound ADP-glucosc starch glucosyltransferase inmaize seeds. J. Biol. Chem. 241, 2280-2286 (1966)
Badenhuizen, N. P.: Struktur und Bildung des Stairkekorns. In: Handbuch der Stirke, Bd. VI,Teil 2, Hrsg. M. Ullmann, Verlag Paul Parey, 1971
Bonn, C. C., Palmiano, E. P., Perez, C. M. and Juliano, B. 0.: Enzymes of starch metabolism inthe developing rice grain. Plant Physiol. 46, 429-434 (1970).
Cardini, C.E. and Frydman, R. B: ADP-glucose: a-1.4-glucon-glyosyl-transfcrase (starch syn-thetase). In: Methods of Enzymology, edit.: Neufeld, E.F. and Ginsburg, V., Acad. Press,New York, Vol. 8, 387-394, 1966
Downton, W.J. S. and Hawker, J. S.: Enzymes of starch metabolism in leaves and berries of Vi-tis vinifera. Phytochemistry 12, 1557-1563 (1973)
El-Sheikh, A.M. and Ulrich, A.: Interactions of rubidium, sodium and potassium on the nutri-tion of sugar beet plants. Plant Physiol. 46, 645-649 (1970)
Fekete, M. A. R. de: Interactions of amyloplasts with enzymes. I. Phosphorylase adsorption onamyloplasts in Vicia faba. Arch. Biochem. Biophys. 116, 368-374 (1966)
Fekete, M.A. R. de: Zum Stoffwechsel der Starke. 1. Die Umwandlung von Saccharose inStarke in den Kotyledonen von Vicia faba. Planta 87, 311-323 (1969)
Ill
Fekete, M. A. R. de and Vieweg, G. H.: Biosynthese der St5rke in verschiedenen Geweben vonZea mays. Ber. Dtsch. Bot. Ges. 84, 475-478 (1971)
Fekete, M.A.R. de and Vieweg, G.H.: Ober die Aktivittt der Synthetase und Phosphorylaseim Maisblatt bei verschiedenem Starkegehalt. Planta 117, 83-91 (1974)
Filippis, L. F. de and Pallaghy, C.K.: Effect of light on the volume and ion relations of chloro-plasts in detached leaves of Elodea densa. Austr. J. Biol. Sci. 26, 1251-1265 (1973)
Forster, H. and Mengel, K.: Einflisse der Kaliumerniihrung auf die Ertragsbildung verscbiede-ner Sommerweizensorten (Triticum aestivum L.). Z. Acker- u. Pflanzenbau 139, 146-156(1974)
Frydmnan, R.B. and Cardini, C.E.: Studies on the biosynthesis of starch. 1. Isolation and prop-erties of soluble adenosine-diphosphate-glucose: starch glycosyltransferase from Solanumtuberosum. Arch. Biochem. Biophys. 116, 9-18 (1966)
Greenway, H.: Plant response to saline substrates. I. Growth and ion uptake of several varie-ties of Hordeum during and after sodium chloride treatment. Austr. J. Biol. Sci. 15, 16-38(1962)
laeder, H.-E., Mengel, K. and Forster, H.: The effect of potassium on translocation of photo-synthates and yield pattern of potato plants. J. Sci. Fd. Agric. 24, 1479-1487 (1973)
Iagemnann, 0.: Mineralstoffernahrung und Mineralstoffumsatz der Kartoffel. Kiihn-Archiv78, 225-258 (1964)
Hawker, J. S., Ozbun, J. L. and Preiss, J.: Unprimed starch synthesis by soluble ADP-glucosestarch glucosyltransferase from potato tubers. Phytochem. 11, 1287-1294 (1972)
lawker, J.S., Marschner, H. and Downton, W.J.S.: Effects of sodium and potassium onstarch synthesis in leaves. Austr. J. Plant Physiol. 1, 441-501 (1974)
1lecht-Buchholz, C., Mix, G. and Marsehner, H.: Effect of NaCI on mineral content and finestructure of cells in plant species with different salt tolerance. In: Proc. 7th Intern. Coll.Plant Analys. and Fertil. Problems, Vol. 1, 147-156 (1974)
Lavintnan, N. and Cardini, C.E.: Effect of cetyltrimethylammonium bromine on the activityof particulate starch synthetase from potato tuber. Plant Physiol. 50, 205-207 (1972)
Marschner, H. and Mix, G.: Einfluss von Natriumchlorid und Mycostatin auf den Mineralstoff-gehalt im Blattgewebe und die Feinstruktur der Chloroplasten. Z. Pflanzenern. Bodenk.136, 203-219 (1973)
Marschner, H. and Possinghain, J. V.: Effect of K+ and Na + on growth of leaf discs of sugarbeet and spinach. Z. Pflanzenphysiol. 75, 6-16 (1975)
Mengel, H. and Haeder, H.E.: Photosynthese und Assimilattransport bei Weizen wahrend derKornausbildung bei unterschiedlicher Kaliumernahrung. Z. Acker- u. Pflanzenbau 140,206-213(1974)
Mingo-Cos/el, A.Al., Young, R. E. and Smith, O.E.: Kinetin-induced tuberization of potato invitro: On the mode of action of kinetin. Plant and Cell Physiol. 17,557-570 (1976)
Mix, G. and Marschner, H.: Mineralstoffverteilung zwischen Chloroplasten und tibrigem Blatt-gewebe. Z. Pflanzenphysiol. 73, 307-312 (1974)
Murala, T. and Akazawa, T.: Enzymic mechanism of starch synthesis in sweet potato roots. I.Requirement of potassium ions for starch synthetase. Arch. Biochem. Biophys. 126,873-879 (1968)
Murata, T. and Akazawa, 7.: Stimulative effect of potassium ion on starch synthetase activityof different plant origins. Plant and Cell Physiol. 10, 457-460 (1969)
Murata, T., Sugiyamna, T. and Akazawa, T.: Enzymic mechanism of starch synthesis in ripen-ing rice grains. 11. Adenosine diphosphate glucose pathway. Arch. Biochem. Biophys. 107,92-101 (1964)
Nitsos, R.E. and Evans, H.J.: Effect of univalent cations on the activity of particulate starchsynthetase. Plant Physiol. 44, 1260-1266 (1969)
Ozbun, J.L., Hawker, J.S. and Preiss, J.: Multiple forms of a-1.4 g~ucan synthetase from spin-ach leaves. Biochem. Biophys. Res. Comm. 43, 631-636 (1971)
Ozbun, J. L., Hawker, J. S., Greenburg, E., Lanunel, C., Price, J. and Lee, E. Y. C.: Starch syn-thetase, phosphorylase, ADP-glucose pyrophosphorylase, and UDP-glucose pyrophos-phorylase in developing maize kernels. Plant Physiol. 51, 1-5 (1973)
Perez, C.M., Palniano, E.P., Baun, L.C. and Juliano, B.O.: Starch metabolism in the leafsheats and culm of rice. Plant Physiol. 47, 404-408 (1971)
Preiss, J., Ozbun, J. L., Hawker, J.S., Greenburg, E. and Lammel, C.: ADPG synthetase andADPG-a-glucan 4-glucosyl transferase: Enzymes involved in bacterial glycogen and plantstarch synthesis. Annals of New York Acad. of Sciences, Vol. 210, 265-278 (1973)
112
Recondo, E. and Leloir, L.F.: Adenosine diphosphate glucose and starch synthesis. Biochem.Biophys. Res. Comm. 6, 85-88 (1961)
Rees, W.R. and Duncan, H.J.: Nucleotides and related compounds in plants. I. Isolation andidentification of starch grain nucleotides. J. Sci. Fd. Agric. 23, 337-343 (1972)
Sanwal, G.G., Greenberg, E., Hardie, J., Cameron, E.C. and Preiss, J.: Regulation of starchbiosynthesis in plant leaves: Activation and inhibition of ADP-glucose pyrophosphorylase.Plant Physiol. 43, 417-427 (1968)
Sowokinos, J. R.: Pyrophosphorylase in Solamn tuberosum. 1. Changes in ADP-glucose andUDP-glucose pyrophosphorylase activities associated with starch biosynthesis during tub-erization, maturation and storage of potatoes. Plant Physiol. 57, 63-68 (1976)
Terry, N.: Development physiology of sugar beet. II. Effects of temperature and nitrogen sup-ply on the growth, soluble carbohydrate content and nitrogen content of leaves and roots.J. Exp. Bot. 21, 477-496 (1970)
Tsai, C. Y., Salamini, F. and Nelson, 0. E.: Enzymes of carbohydrate metabolism in the devel-oping endosperm of maize. Plant Physiol. 46, 299-306 (1970)
Vieweg, G.H. and Fekete, M.A.R. de: Die Bedeutung des Glucose-I-Phosphates far dieStfrkesynthese in der Biindelscheidenzelle von Zea mays. Planta 104, 257-266 (1972)
113

Effects of Potassium on Phloem Loadingand Transport
H. E. Haeder, Bflntehof Agricultural Research Station Hannover/Federal Republic of Germany-
Summary
On their way from source to sink the assimilates have to pass three systems: (1) diffusion in thesymplasma and in the free space, (2) active transport through the plasma membrane into thephloem and (3) passive flow in the sieve tubes. Potassium nutrition has a favourable effect, par-ticularly on the latter two transport systems.In assimilate transport, 'phloem loading' is of greatest importance. It builds up osmotic pres-sure in the sieve tubes of the source resulting in a hydrostatic pressure which induces the flowof assimilates. Phloem loading is favoured by potassium, because this nutrient promotes thesynthesis of ATP required for phloem loading.The sap flow in the phloem of castor oil plants was higher with adequate K nutrition than withpoor K supply. Since the sugar concentration in the phloem sap did not change with higherflow rates, more assimilates were transported to the sink. Potassium nutrition thus contributesto the translocation of greater amounts of assimilates for storage in grains and fruits.
Introduction
Photosynthesis and the storage of assimilates are most important physiological proc-esses in plant production. The sites where these processes take place are known assource and sink. The transport of assimilates from source to sink occurs in vascularbundles. This flow through plant vessels can be subdivided into short-distance trans-port, phloem loading and long-distance transport.
Short-distance transport
Short-distance transport is the diffusion from the mesophyll cells to the minor veins,threading the leaf tissue like a thin and dense cobweb. Diffusion takes place over a dis-tance of two to three cell diameters only and ends at the plasma membrane of thephloem. The diffusion rate is influenced by the water which is present in the free spacesof the pathway. Potassium may exert an influence on assimilate translocation even dur-ing short-distance transport due to its effect on moisture content in the leaf tissue. Theoften observed K effect on assimilate transport (Addiscolt [ 1974]; Harit [1970]; Men-
* Dr. H. E. Haeder, Landw. Forschungsanstalt Bintehof, Bfinteweg 8, D-3000 Hannover/Fed. Rep. of Germany
115
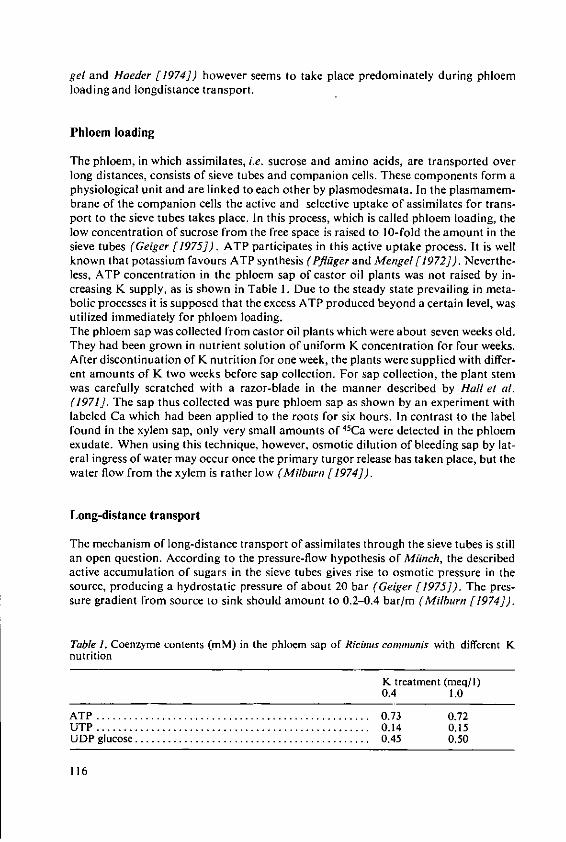
gel and Haeder [1974]) however seems to take place predominately during phloemloading and longdistance transport.
Phloem loading
The phloem, in which assimilates, i.e. sucrose and amino acids, are transported overlong distances, consists of sieve tubes and companion cells. These components form aphysiological unit and are linked to each other by plasmodesmata. In the plasmamem-brane of the companion cells the active and selective uptake of assimilates for trans-port to the sieve tubes takes place. In this process, which is called phloem loading, thelow concentration of sucrose from the free space is raised to 10-fold the amount in thesieve tubes (Geiger [1975]). ATP participates in this active uptake process. It is wellknown that potassium favours ATP synthesis (Pflilger and Mengel [1972]). Neverthe-less, ATP concentration in the phloem sap of castor oil plants was not raised by in-creasing K supply, as is shown in Table 1. Due to the steady state prevailing in meta-bolic processes it is supposed that the excess ATP produced beyond a certain level, wasutilized immediately for phloem loading.The phloem sap was collected from castor oil plants which were about seven weeks old.They had been grown in nutrient solution of uniform K concentration for four weeks.After discontinuation of K nutrition for one week, the plants were supplied with differ-ent amounts of K two weeks before sap collection. For sap collection, the plant stemwas carefully scratched with a razor-blade in the manner described by Hall et al.(1971]. The sap thus collected was pure phloem sap as shown by an experiment withlabeled Ca which had been applied to the roots for six hours. In contrast to the labelfound in the xylem sap, only very small amounts of 45Ca were detected in the phloemexudate. When using this technique, however, osmotic dilution of bleeding sap by lat-eral ingress of water may occur once the primary turgor release has taken place, but thewater flow from the xylem is rather low (Milburn [1974]).
Long-distance transport
The mechanism of long-distance transport of assimilates through the sieve tubes is stillan open question. According to the pressure-flow hypothesis of MUnch, the describedactive accumulation of sugars in the sieve tubes gives rise to osmotic pressure in thesource, producing a hydrostatic pressure of about 20 bar (Geiger [1975]). The pres-sure gradient from source to sink should amount to 0.2-0.4 bar/m (Milburn [1974]).
Table 1. Coenzyme contents (mM) in the phloen sap of Ricinus comnmunis with different Knutrition
K treatment (meq/i)0.4 1.0
A T P .................................................. 0.73 0.72U T P .................................................. 0.14 0.15U D P glucose ........................................... 0.45 0.50
116
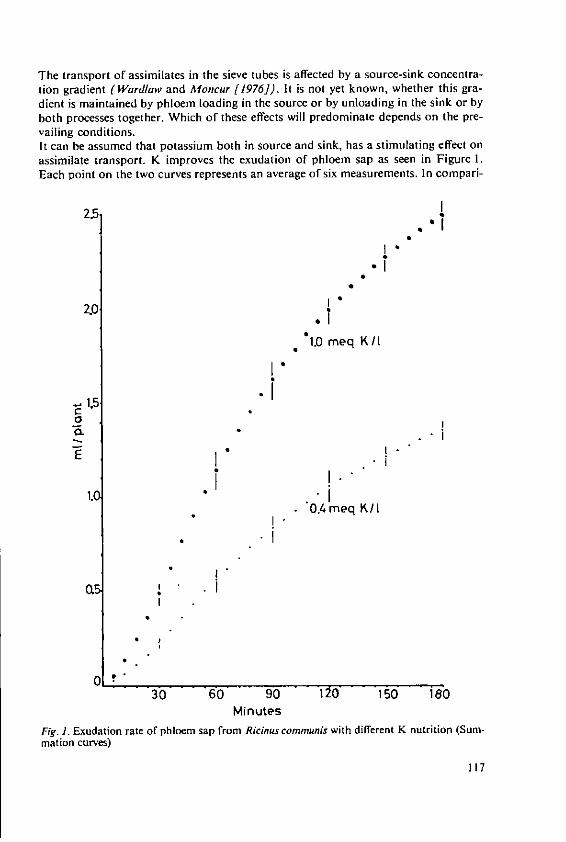
The transport of assimilates in the sieve tubes is affected by a source-sink concentra-tion gradient ( Ward/aw and Moncur [1976]). It is not yet known, whether this gra-dient is maintained by phloem loading in the source or by unloading in the sink or byboth processes together. Which of these effects will predominate depends on the pre-vailing conditions.It can be assumed that potassium both in source and sink, has a stimulating effect onassimilate transport. K improves the exudation of phloem sap as seen in Figure 1.Each point on the two curves represents an average of six measurements. In compari-
1.51
2$ I•
CC
2.0
lf .meq K/II"
SI
.5• I
"0., meq Il
a!
30 60 90 120 150 180Minutes
Fig. 1. Exudation rate of phloem sap from Ricinus communis with different K nutrition (Sum-mation curves)
117
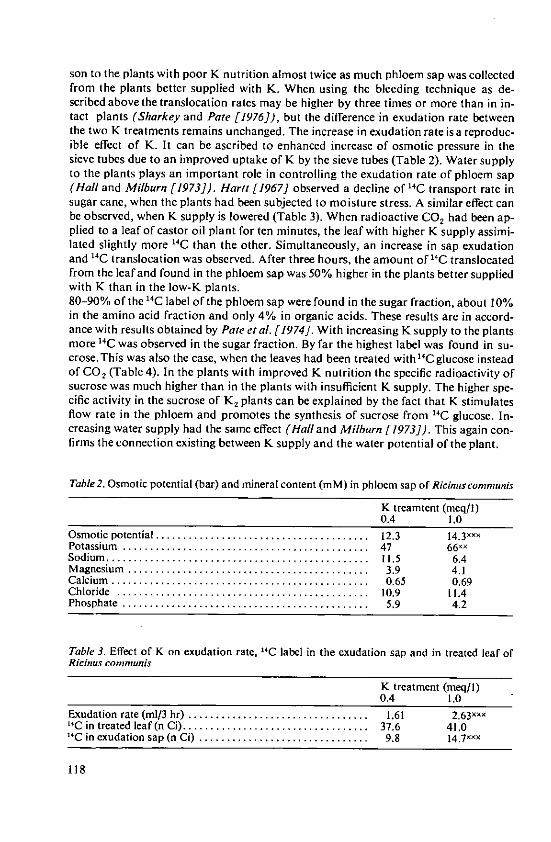
son to the plants with poor K nutrition almost twice as much phloem sap was collectedfrom the plants better supplied with K. When using the bleeding technique as de-scribed above the translocation rates may be higher by three times or more than in in-tact plants (Sharkey and Pate [1976]), but the difference in exudation rate betweenthe two K treatments remains unchanged. The increase in exudation rate is a reproduc-ible effect of K. It can be ascribed to enhanced increase of osmotic pressure in thesieve tubes due to an improved uptake of K by the sieve tubes (Table 2). Water supplyto the plants plays an important role in controlling the exudation rate of phloem sap(Hall and Milburn [1973]). Hart! [1967] observed a decline of 14C transport rate insugar cane, when the plants had been subjected to moisture stress. A similar effect canbe observed, when K supply is lowered (Table 3). When radioactive CO, had been ap-plied to a leaf of castor oil plant for ten minutes, the leaf with higher K supply assimi-lated slightly more "C than the other. Simultaneously, an increase in sap exudationand 14C translocation was observed. After three hours, the amount of 14 C translocatedfrom the leaf and found in the phloem sap was 50% higher in the plants better suppliedwith K than in the low-K plants.80-90% of the "C label of the phloem sap were found in the sugar fraction, about 10%in the amino acid fraction and only 4% in organic acids. These results are in accord-ance with results obtained by Pate etal. [1974]. With increasing K supply to the plantsmore 11C was observed in the sugar fraction. By far the highest label was found in su-crose. This was also the case, when the leaves had been treated with' 4C glucose insteadof CO, (Table 4). In the plants with improved K nutrition the specific radioactivity ofsucrose was much higher than in the plants with insufficient K supply. The higher spe-cific activity in the sucrose of K, plants can be explained by the fact that K stimulatesflow rate in the phloem and promotes the synthesis of sucrose from 14C glucose. In-creasing water supply had the same effect (Hall and Milburn [1973]). This again con-firms the connection existing between K supply and the water potential of the plant.
Table 2. Osmotic potential (bar) and mineral content (mM) in phloem sap of Ricinuscommunis
K treamlent (meq/l)0.4 1.0
Osm otic potential ....................................... 12.3 14.3xxxPotassium ............................................. 47 66x×
Sodium ................................................ 11.5 6.4M agnesium ............................................ 3.9 4.1C alcium ............................................... 0.65 0.69C hloride .............................................. 10.9 11.4Phosphate ............................................. 5.9 4.2
Table3. Effect of K on exudation rate, "C label in the exudation sap and in treated leaf ofRicinus comnmunis
K treatment (meq/l)0.4 1.0
Exudation rate (ml/3 hr) ................................. 1.61 2.63xxx14C in treated leaf (n Ci) .................................. 37.6 41.0"4C in exudation sap (n Ci) ............................... 9.8 14.7x×x
118
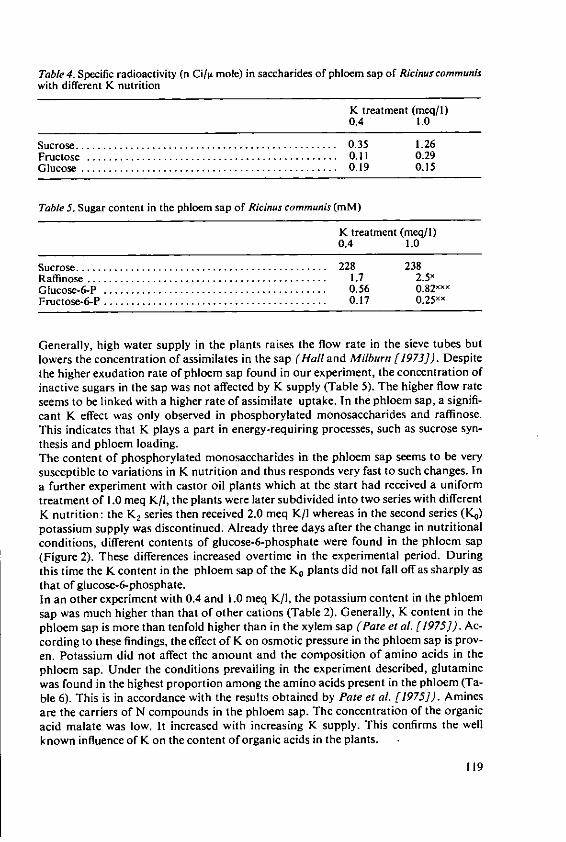
Table 4. Specific radioactivity (n Ci/ L mole) in saccharides of phloem sap of Ricinuscommuniswith different K nutrition
K treatment (meq/I)0.4 1.0
Sucrose ................................................ 0.35 1.26Fructose .............................................. 0.1 1 0.29G lucose ............................................... 0.19 0.15
Table 5. Sugar content in the phloem sap of Ricinus communis (mM)
K treatment (meq/I)0.4 1.0
Sucrose .............................................. 228 238R affinose ............................................ 1.7 2.5x
G lucose-6-P ......................................... 0.56 0.82 x×
Fructose-6-P ......................................... 0.17 0.25×'
Generally, high water supply in the plants raises the flow rate in the sieve tubes butlowers the concentration of assimilates in the sap (Hall and Milburn [1973]). Despitethe higher exudation rate of phloem sap found in our experiment, the concentration ofinactive sugars in the sap was not affected by K supply (Table 5). The higher flow rateseems to be linked with a higher rate of assimilate uptake. In the phloem sap, a signifi-cant K effect was only observed in phosphorylated monosaccharides and raffinose.This indicates that K plays a part in energy-requiring processes, such as sucrose syn-thesis and phloem loading.The content of phosphorylated monosaccharides in the phloem sap seems to be verysusceptible to variations in K nutrition and thus responds very fast to such changes. Ina further experiment with castor oil plants which at the start had received a uniformtreatment of 1.0 meq K/I, the plants were later subdivided into two series with differentK nutrition: the K, series then received 2.0 meq K/I whereas in the second series (K0)potassium supply was discontinued. Already three days after the change in nutritionalconditions, different contents of glucose-6-phosphate were found in the phloem sap(Figure 2). These differences increased overtime in the experimental period. Duringthis time the K content in the phloem sap of the K0 plants did not fall off as sharply asthat of glucose-6-phosphate.In an other experiment with 0.4 and 1.0 meq K/I, the potassium content in the phloemsap was much higher than that of other cations (Table 2). Generally, K content in thephloem sap is more than tenfold higher than in the xylem sap (Pate et al. [1975]). Ac-cording to these findings, the effect of K on osmotic pressure in the phloem sap is prov-en. Potassium did not affect the amount and the composition of amino acids in thephloem sap. Under the conditions prevailing in the experiment described, glutaminewas found in the highest proportion among the amino acids present in the phloem (Ta-ble 6). This is in accordance with the results obtained by Pate et al. [1975]). Aminesare the carriers of N compounds in the phloem sap. The concentration of the organicacid malate was low. It increased with increasing K supply. This confirms the wellknown influence of K on the content of organic acids in the plants.
119
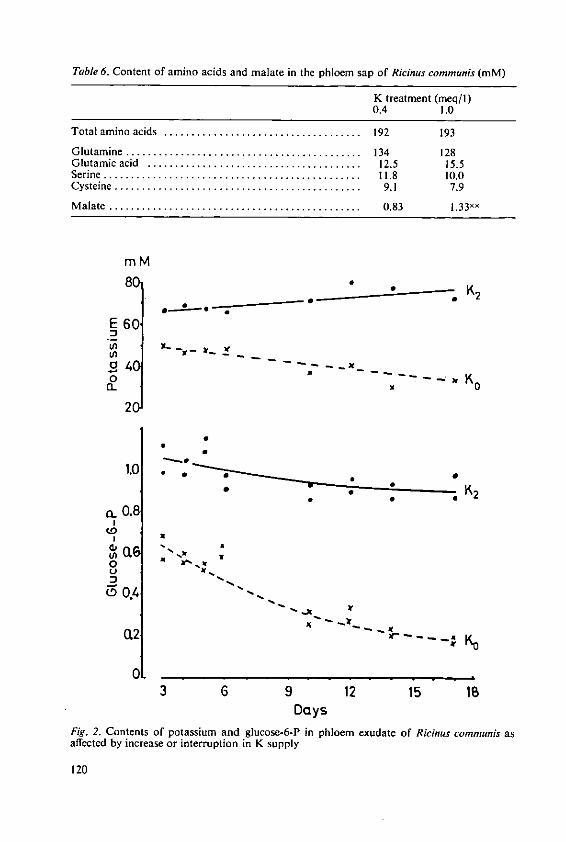
Table 6. Content of amino acids and malate in the phloem sap of Ricinus communis (mM)
K treatment (meq/1)0.4 1.0
Total am ino acids .................................... 192 193
G lutam ine ........................................... 134 128G lutam ic acid ....................................... 12.5 15.5Serine ............................................... 11.8 10.0C ysteine ............................................. 9.1 7.9
M alate .............................................. 0.83 1.33 ××
mM80 K2
E 60J
2 0 --N- K
2C
to .K2
a 0 .8
II
2K
o
3 6 9 12 15 " isIDays
Fig. 2. Contents of potassium and glucose-6-P in phloemn exudate of Ricinus communis asaffected by increase or interruption in K supply
120
References
Addiscott, T.M.: Potasssium in relation to transport of carbohydrate and ions in plants. Proc.10th Congress Int. Potash Inst., Budapest, pp. 175-190 (1974)
Geiger, D.R.: Phloem loading. In: Zimmermann, M.H, and Milburn, J.A.; Transport inplants !, pp. 395-43 1, Springer Verlag, Berlin 1975
Hall, S.M., Baker, D.A. and Milburn, J.A.: Phloem translocation of 14C-labelled assimilatesin Ricinus. Planta 100, 200-207 (1971)
Hall, S.M. and Milburn, J.A.: Phloem transport in Ricinus: Its dependence on the water bal-ance of the tissue. Planta 109, 1-10 (1973)
Harit, C.E.: Effect of moisture supply upon translocation and storage of 14C in sugar cane.Plant Physiol. 42, 338-346 (1967)
Hartt, C.E.: Effects of potassium deficiency upon translocation of 14C in detached blades ofsugarcane. Plant Physiol. 45, 183-187 (1970)
Mengel, K. and Haeder, H.E.: Photosynthese and Assimilattransport bei Weizen wAhrend derKornausbildung bei unterschiedlicher Kaliumerndhrung. Z. Acker- u. Pflanzenbau 140,206-213 (1974)
Milburn, J.A.: Phloem transport in Ricinus: concentration gradients between source and sink.Planta 117, 303-319 (1974)
Pflflger, R. and Mengel, K.: Die photochemische AktivitAt von Chloroplasten aus unterschied-lich mit Kalium ernahrten Pflanzen. Plant and Soil 36, 417-425 (1972)
Pate, J.S., Sharkey, P.J. and Lewis, O.A.M.: Phloem bleeding from legume fruits - A tech-nique for study of fruit nutrition. Planta 120, 229-243 (1974)
Pate, J.S., Sharkey, P.J. and Lewis, O.A.M.: Xylem to phloem transfer of solutes in fruitingshoots of legumes studied by a phloem bleeding technique. Planta 122, 11-26 (1975)
Sharkey, P.J. and Pate, J.S.: Translocation from leaves to fruits of a legume, studied by aphloem bleeding technique: Diurnal changes and effects of continuous darkness. Planta128, 63-72 (1976)
Wardlaw, I F. and Moncur, L.: Source, sink and hormonal control of translocation in wheat.Planta 128, 93-100 (1976)
121
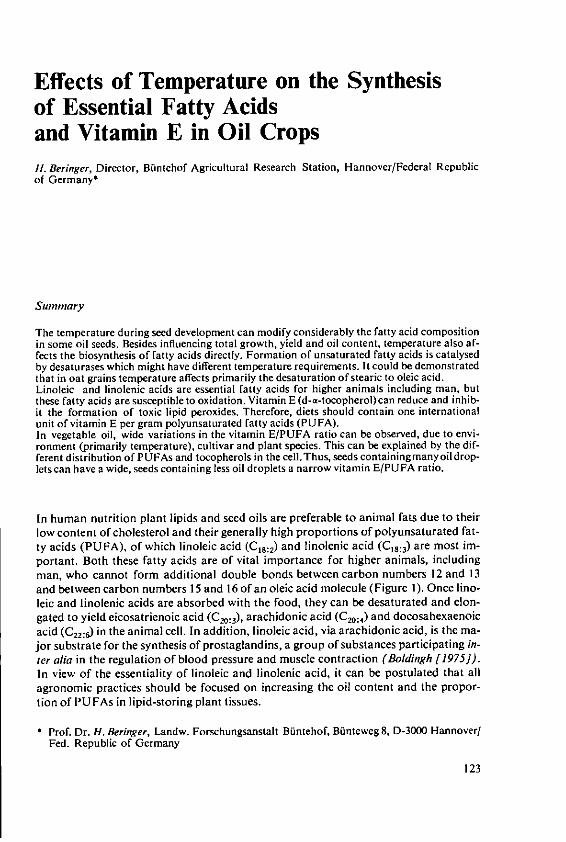
Effects of Temperature on the Synthesisof Essential Fatty Acidsand Vitamin E in Oil CropsH. Beringer, Director, Biintehof Agricultural Research Station, Hannover/Federal Republicof Germany*
Summary
The temperature during seed development can modify considerably the fatty acid compositionin some oil seeds. Besides influencing total growth, yield and oil content, temperature also af-fects the biosynthesis of fatty acids directly. Formation of unsaturated fatty acids is catalysedby desaturases which might have different temperature requirements. It could be demonstratedthat in oat grains temperature affects primarily the desaturation of stearic to oleic acid.Linoleic and linolenic acids are essential fatty acids for higher animals including man, hutthese fatty acids are susceptible to oxidation. Vitamin E (d-a-tocopherol)can reduce and inhib-it the formation of toxic lipid peroxides. Therefore, diets should contain one internationalunit of vitamin E per gram polyunsaturated fatty acids (PUFA).In vegetable oil, wide variations in the vitamin E/PUFA ratio can be observed, due to envi-ronment (primarily temperature), cultivar and plant species. This can be explained by the dif-ferent distribution of PUFAs and tocopherols in the cell.Thus, seeds containing many oildrop-lets can have a wide, seeds containing less oil droplets a narrow vitamin E/PUFA ratio.
In human nutrition plant lipids and seed oils are preferable to animal fats due to theirlow content of cholesterol and their generally high proportions of polyunsaturated fat-ty acids (PUFA), of which linoleic acid (Cl8 :2) and linolenic acid (C1 s:j) are most im-portant. Both these fatty acids are of vital importance for higher animals, includingman, who cannot form additional double bonds between carbon numbers 12 and 13and between carbon numbers 15 and 16 of an oleic acid molecule (Figure 1). Once lino-leic and linolenic acids are absorbed with the food, they can be desaturated and elon-gated to yield eicosatrienoic acid (C0:,), arachidonic acid (C, 0 :4) and docosahexaenoicacid (C2,: in the animal cell. In addition, linoleic acid, via arachidonic acid, is the ma-jor substrate for the synthesis of prostaglandins, a group of substances participating in-ier alia in the regulation of blood pressure and muscle contraction (Boldingh [1975]).In view of the essentiality of linoleic and linolenic acid, it can be postulated that allagronomic practices should be focused on increasing the oil content and the propor-tion of PUFAs in lipid-storing plant tissues.
* Prof. Dr. H. Beringer, Landw. Forschungsanstalt Bantehof, Bfinteweg 8, D-3000 Hannover/
Fed. Republic of Germany
123
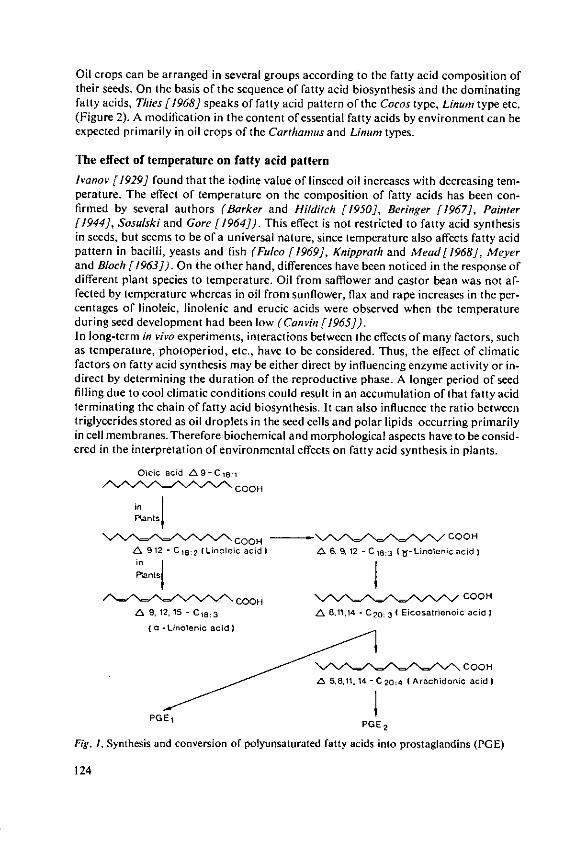
Oil crops can be arranged in several groups according to the fatty acid composition oftheir seeds. On the basis of the sequence of fatty acid biosynthesis and the dominatingfatty acids, Thies [1968] speaks of fatty acid pattern of the Cocos type, Linum type etc.(Figure 2). A modification in the content of essential fatty acids by environment can beexpected primarily in oil crops of the Carthamus and Linurn types.
The effect of temperature on fatty acid pattern
lvanov [1929] found that the iodine value of linseed oil increases with decreasing tem-perature. The effect of temperature on the composition of fatty acids has been con-firmed by several authors (Barker and Hilditch [1950], Beringer [1967], Painter[1944], Sosulski and Gore [1964]). This effect is not restricted to fatty acid synthesisin seeds, but seems to be of a universal nature, since temperature also affects fatty acidpattern in bacilli, yeasts and fish (Fulco [1969], Knipprath and Mead[1968], Meyerand Bloch [1963]). On the other hand, differences have been noticed in the response ofdifferent plant species to temperature. Oil from safflower and castor bean was not af-fected by temperature whereas in oil from sunflower, flax and rape increases in the per-centages of linoleic, linolenic and erucic acids were observed when the temperatureduring seed development had been low (Canvin [1965]).In long-term in vivo experiments, interactions between the effects of many factors, suchas temperature, photoperiod, etc., have to be considered. Thus, the effect of climaticfactors on fatty acid synthesis may be either direct by influencing enzyme activity or in-direct by determining the duration of the reproductive phase. A longer period of seedfilling due to cool climatic conditions could result in an accumulation of that fatty acidterminating the chain of fatty acid biosynthesis. It can also influence the ratio betweentriglycerides stored as oil droplets in the seed cells and polar lipids occurring primarilyin cell membranes. Therefore biochemical and morphological aspects have to be consid-ered in the interpretation of environmental effects on fatty acid synthesis in plants.
Oleic acid 4x9-C 18 1 COH
Plantsj
COH COOH
A! 9,12 - C18:2 (Linoleic acid) A 6, 9,12 - 018:3 (U-Linolenic acid)
Pants{
COOH COOH
An 9.12.15 - Ci8:3 A 8,11.14 - C 20 ,34 Eicosatrienoic acid)
(a -Linolenie acid)
,/x /\.',' COOH
An 5.8,11.14 - C 204 ( Arachidonic acid)
PGF, PGE 2
Fig. 1. Synthesis and conversion of polyunsaturated fatty acids into prostaglandins (PGE)
124
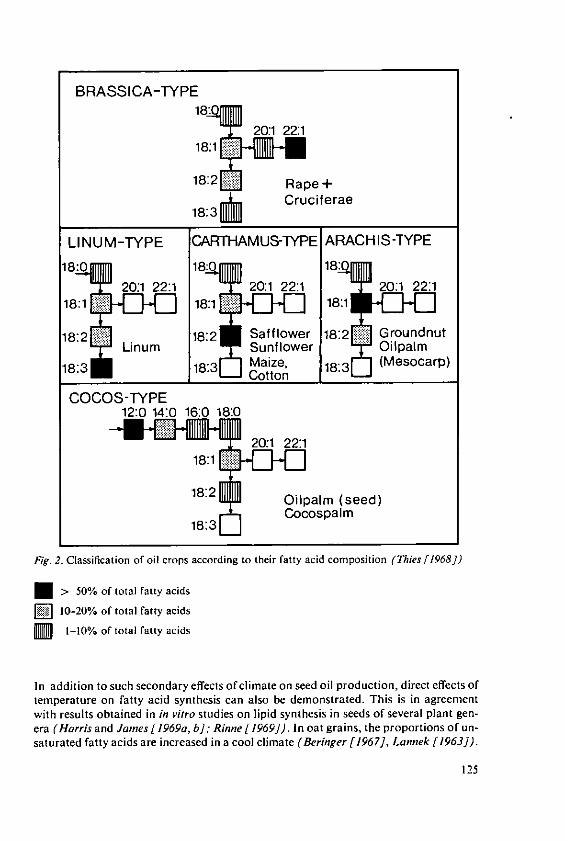
BRASSICA-TYPE18 W
201 22:118:1 L I -18 21 Rape+
18:3 gj Cruciferae
LINUM-TYPE CARTHAMUS-TYPE ARACHIS-TYPE
18:0 18: 18:
20:1 22:1 20:1 22:1 20:1 22:11818:11 18:1
18:2 18:2 Safflower 18:2 GroundnutS Linumn Sunflower Oipaim
18:3 18:3 Maize, 18:3 (Mesocarp)________________Cotton _ _______
COCOS-TYPE12:0 14:0 16:0 18:0
18:2 Oilpalm (seed)18:3 ECocospalm
Fig. 2. Classification of oil crops according to their fatty acid composition (Thies [1968])
> 50% of total fatty acids
E 10-20% of total fatty acids
E 1-10% of total fatty acids
In addition to such secondary effects of climate on seed oil production, direct effects of
temperature on fatty acid synthesis can also be demonstrated. This is in agreementwith results obtained in in vitro studies on lipid synthesis in seeds of several plant gen-era (Harris and James [1969a, b]; Rinne [1969]). In oat grains, the proportions of un-saturated fatty acids are increased in a cool climate (Beringer [1967], Lannek [1963]).
125
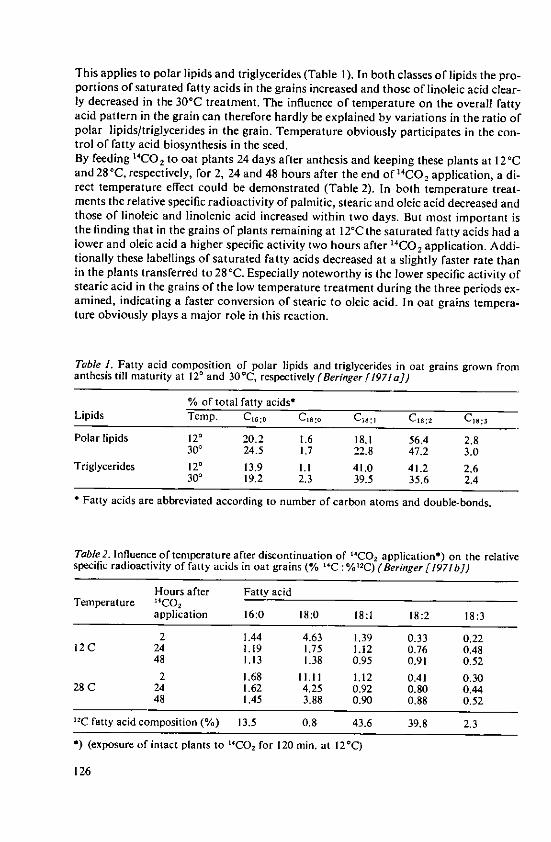
This applies to polar lipids and triglycerides (Table 1). In both classes of lipids the pro-portions of saturated fatty acids in the grains increased and those of linoleic acid clear-ly decreased in the 300C treatment. The influence of temperature on the overall fattyacid pattern in the grain can therefore hardly be explained by variations in the ratio ofpolar lipids/triglycerides in the grain. Temperature obviously participates in the con-trol of fatty acid biosynthesis in the seed.By feeding 14CO 2 to oat plants 24 days after anthesis and keeping these plants at 120Cand 280C, respectively, for 2, 24 and 48 hours after the end of 14CO 2 application, a di-rect temperature effect could be demonstrated (Table 2). In both temperature treat-ments the relative specific radioactivity of palmitic, stearic and oleic acid decreased andthose of linoleic and linolenic acid increased within two days. But most important isthe finding that in the grains of plants remaining at 12'C the saturated fatty acids had alower and oleic acid a higher specific activity two hours after 14CO 2 application. Addi-tionally these labellings of saturated fatty acids decreased at a slightly faster rate thanin the plants transferred to 28°C. Especially noteworthy is the lower specific activity ofstearic acid in the grains of the low temperature treatment during the three periods ex-amined, indicating a faster conversion of stearic to oleic acid. In oat grains tempera-ture obviously plays a major role in this reaction.
Table 1. Fatty acid composition of polar lipids and triglycerides in oat grains grown fromanthesis till maturity at 120 and 300C, respectively (Beringer[1971 a])
% of total fatty acids-Lipids Temp. C 6: 0 C,8 :o C18 :, C18 :2 CS:3
Polar lipids 120 20.2 1.6 18.1 56.4 2.8300 24.5 1.7 22.8 47.2 3.0
Triglycerides 120 13.9 1.1 41.0 41.2 2.6300 19.2 2.3 39.5 35.6 2.4
Fatty acids are abbreviated according to number of carbon atoms and double-bonds.
Table 2. Influence of temperature after discontinuation of "CO application*) on the relativespecific radioactivity of fatty acids in oat grains (% 14C: %1 2C) (Beringer [1971b])
Hours after Fatty acidTemperature 14CO 2
application 16:0 18:0 18:1 18:2 18:3
2 1.44 4.63 1.39 0.33 0.2212C 24 1.19 1.75 1.12 0.76 0.48
48 1.13 1.38 0.95 0.91 0.522 1.68 11.11 1.12 0.41 0.30
28 C 24 1.62 4.25 0.92 0.80 0.4448 1.45 3.88 0.90 0.88 0.52
'2C fatty acid composition (%) 13.5 0.8 43.6 39.8 2.3
*) (exposure of intact plants to "CO 2 for 120 min. at 12'C)
126
The enzymes catalyzing the synthesis of unsaturated fatty acids by desaturating satu-rated precursors need as cofactors 02 and NADPH + H+ . It is probably through thisrequirement of the desaturase reaction for 0, and its availability in the seed by whichtemperature can exert its regulating effect on the degree of saturation of seedoils. When increasing the 02 tension in in vitro experiments, Harris and James[1969 a, b] found stimulated desaturase activity with increasing temperatures. Thisindicates that under natural conditions at low temperatures both the solubilityof dissolved 02 in the seed tissue and its availability for the desaturase reactionmight be higher, because seed respiration will be reduced. These results have been con-firmed by experiments with intact sunflower seeds (Dompert and Beringer [1960]).The 02 content of seeds, however, is not the only aspect of temperature action. Sinceall desaturases require 02 it is to be expected that synthesis of all unsaturated fatty ac-ids will be reduced if 02 is present in limiting amounts only. In fact, decreases in poly-unsaturated C,8 acids in sunflower and flax seeds due to higher temperatures arecounterbalanced by higher proportions of oleic acid instead of saturated ones (Canvin[1965], Dybing and Zimmermann [1966]; see also Tables 3, 4). In addition, in photo-synthesizing seeds like rape, 02 can hardly be the rate-limiting factor in desaturation(Nitsch [1976]).There must exist additional mechanisms by which temperature affectsthe synthesis of unsaturated fatty acids. The remarkable reduction of C1 :2 in some saf-flower cultivars by breeding points to the existence of two different desaturases (Hilland Knowles [1968]). It could be that stearic acid and oleic acid desaturases responddifferently to ambient temperature or differ in their affinities to 02. Thus in some spec-ies, such as oat and soybeans, oleic acid synthesis and in others, e.g. sunflower, linoleicacid synthesis could be reduced by increasing temperature. To sum up, temperatureduring anthesis and seed ripening is an important, probably the most important, factorby which environment modifies the composition of seed oils. This leads to the questionas to whether oils produced in cooler climates have a higher nutritive value because oftheir higher content of essential fatty acids.
Essential fatty acids in the diet an their protection
The daily requirement of an adult person for linoleic acid is 10 g, but in industrialisedcountries the intake amounts to 20-28 g (Stssel [1976]). As PUFAs are rather unsta-ble against oxidative degradation (see below) and as the daily intake exceeds the actualrequirement, an important point should be discussed here. Obviously not only theamount of PUFAs in seed oils, but also their protection against peroxidation should begiven due attention.Many feeding trials have shown that increasing amounts of PUFAs in the daily rationshould be combined with higher amounts of antioxidants, of which the tocopherols(vit-amin E) are found in many seed oils. Harris and Embree [1963] recommend that foreach gram of linoleic acid 0.6 mg a-tocopherol is required, and according to Harifiel[1967], 1.5-2.5 mg a-tocopherol acetate per gram of linoleic acid should be aimed at.These recommendations are subject to slight modifications, because they depend onthe animal tested, the bioanalytical approach and the PUFA and selenium contents ofthe diet (Alfin-Slater et al [1972], Jager [1972], Staditman [1974] and review articlesby Molenaar et al [1972], Zinizen and Groebke [1974]). Apart from the complex andstill open role of vitamin E in metabolism of men and animals, plant producers can for
127
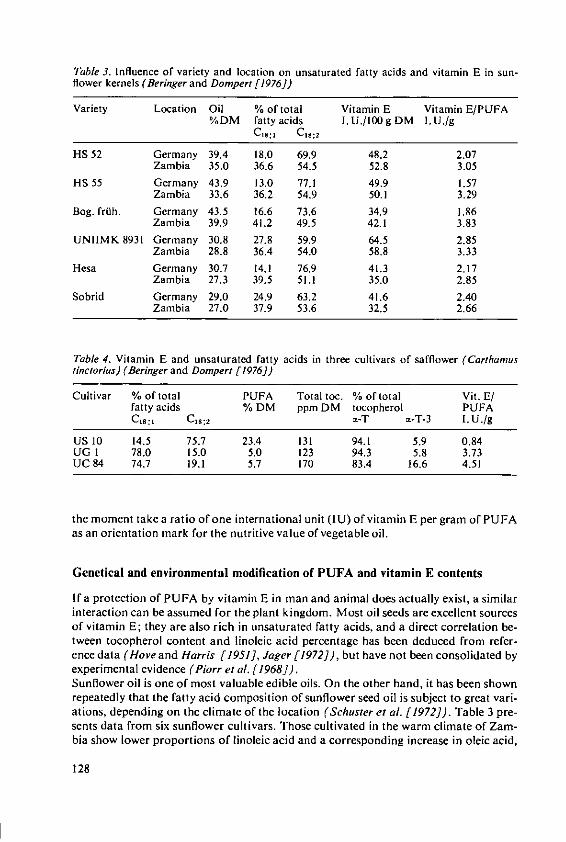
Table 3. Influence of variety and location on unsaturated fatty acids and vitamin E in sun-flower kernels (Beringer and Dompert [1976])
Variety Location Oil % of total Vitamin E Vitamin E/PUFA%DM fatty acids 1. UJ./00 g DM 1.U./g
C18:1 C18 :2
HS 52 Germany 39.4 18.0 69.9 48.2 2.07Zambia 35.0 36.6 54.5 52.8 3.05
HS 55 Germany 43.9 13.0 77.1 49.9 1.57Zambia 33.6 36.2 54.9 50.1 3.29
Bog. frfh. Germany 43.5 16.6 73.6 34.9 1.86Zambia 39.9 41.2 49.5 42.1 3.83
UNIIMK 8931 Germany 30.8 27.8 59.9 64.5 2.85Zambia 28.8 36.4 54.0 58.8 3.33
Hesa Germany 30.7 14.1 76.9 41.3 2.17Zambia 27.3 39.5 51.1 35.0 2.85
Sobrid Germany 29.0 24.9 63.2 41.6 2.40Zambia 27.0 37.9 53.6 32.5 2.66
Table 4. Vitamin E and unsaturated fatty acids in three cultivars of safflower (Carthamusinctorius) (Beringer and Dompert [1976J)
Cultivar % of total PUFA Total toe. % of total Vit. E/fatty acids % DM ppm DM tocopherol PUFAC 1 :1 C18:2 .- T a-T-3 [.U./g
US 10 14.5 75.7 23.4 131 94.1 5.9 0.84UG 1 78.0 15.0 5.0 123 94.3 5.8 3.73UC 84 74.7 19.1 5.7 170 83.4 16.6 4.51
the moment take a ratio of one international unit (IU) of vitamin E per gram of PU FAas an orientation mark for the nutritive value of vegetable oil.
Genetical and environmental modification of PUFA and vitamin E contents
If a protection of PUFA by vitamin E in man and animal does actually exist, a similarinteraction can be assumed for the plant kingdom. Most oil seeds are excellent sourcesof vitamin E; they are also rich in unsaturated fatty acids, and a direct correlation be-tween tocopherol content and linoleic acid percentage has been deduced from refer-ence data (Hove and Harris [1951], Jager [1972]), but have not been consolidated byexperimental evidence (Piorr et al. [1968]).Sunflower oil is one of most valuable edible oils. On the other hand, it has been shownrepeatedly that the fatty acid composition of sunflower seed oil is subject to great vari-ations, depending on the climate of the location (Schuster et al. [1972]). Table 3 pre-sents data from six sunflower cultivars. Those cultivated in the warm climate of Zam-bia show lower proportions of linoleic acid and a corresponding increase in oleic acid,
128
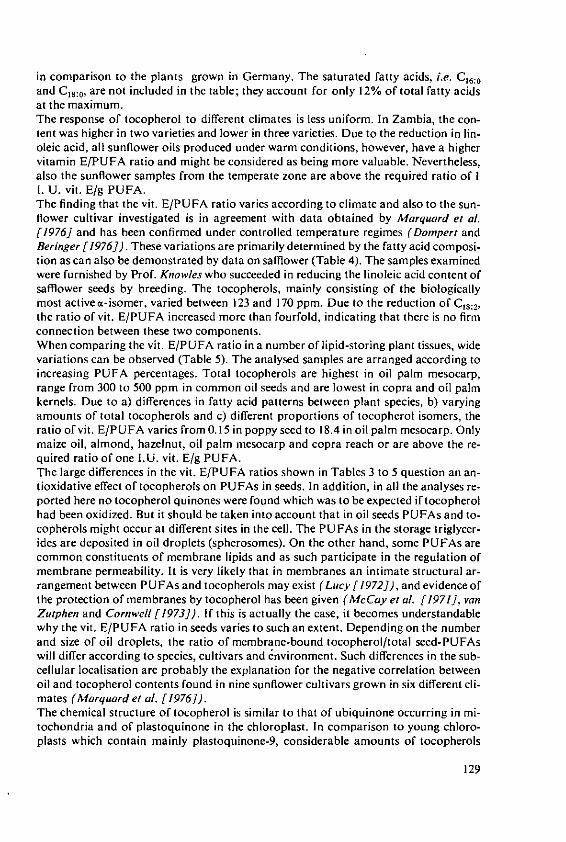
in comparison to the plants grown in Germany. The saturated fatty acids, i.e. C,6:0and C18: 0, are not included in the table; they account for only 12% of total fatty acidsat the maximum.The response of tocopherol to different climates is less uniform. In Zambia, the con-tent was higher in two varieties and lower in three varieties. Due to the reduction in fin-oleic acid, all sunflower oils produced under warm conditions, however, have a highervitamin E/PUFA ratio and might be considered as being more valuable. Nevertheless,also the sunflower samples from the temperate zone are above the required ratio of II. U. vit. E/g PUFA.The finding that the vit. E/PUFA ratio varies according to climate and also to the sun-flower cultivar investigated is in agreement with data obtained by Marquard et al.[1976] and has been confirmed under controlled temperature regimes (Dompert andBeringer [1976]). These variations are primarily determined by the fatty acid composi-tion as can also be demonstrated by data on safflower (Table 4). The samples examinedwere furnished by Prof. Knowles who succeeded in reducing the linoleic acid content ofsafflower seeds by breeding. The tocopherols, mainly consisting of the biologicallymost active a-isomer, varied between 123 and 170 ppm. Due to the reduction of C18:2,the ratio of vit. E/PUFA increased more than fourfold, indicating that there is no firmconnection between these two components.When comparing the vit. E/PUFA ratio in a number of lipid-storing plant tissues, widevariations can be observed (Table 5). The analysed samples are arranged according toincreasing PUFA percentages. Total tocopherols are highest in oil palm mesocarp,range from 300 to 500 ppm in common oil seeds and are lowest in copra and oil palmkernels. Due to a) differences in fatty acid patterns between plant species, b) varyingamounts of total tocopherols and c) different proportions of tocopherol isomers, theratio of vit. E/PUFA varies from 0.15 in poppy seed to 18.4 in oil palm mesocarp. Onlymaize oil, almond, hazelnut, oil palm mesocarp and copra reach or are above the re-quired ratio of one I.U. vit. E/g PUFA.The large differences in the vit. E/PUFA ratios shown in Tables 3 to 5 question an an-tioxidative effect of tocopherols on PUFAs in seeds. In addition, in all the analyses re-ported here no tocopherol quinones were found which was to be expected if tocopherolhad been oxidized. But it should be taken into account that in oil seeds PUFAs and to-copherols might occur at different sites in the cell. The PUFAs in the storage triglycer-ides are deposited in oil droplets (spherosomes). On the other hand, some PUFAs arecommon constituents of membrane lipids and as such participate in the regulation ofmembrane permeability. It is very likely that in membranes an intimate structural ar-rangement between PUFAs and tocopherols may exist (Lucy [1972]), and evidence ofthe protection of membranes by tocopherol has been given (McCay et al. [1971], vanZutphen and Cornwell [1973]). If this is actually the case, it becomes understandablewhy the vit. E/PUFA ratio in seeds varies to such an extent. Depending on the numberand size of oil droplets, the ratio of membrane-bound tocopherol/total seed-PUFAswill differ according to species, cultivars and environment. Such differences in the sub-cellular localisation are probably the explanation for the negative correlation betweenoil and tocopherol contents found in nine sunflower cultivars grown in six different cli-mates (Marquard et al. [1976]).The chemical structure of tocopherol is similar to that of ubiquinone occurring in mi-tochondria and of plastoquinone in the chloroplast. In comparison to young chloro-plasts which contain mainly plastoquinone-9, considerable amounts of tocopherols
129
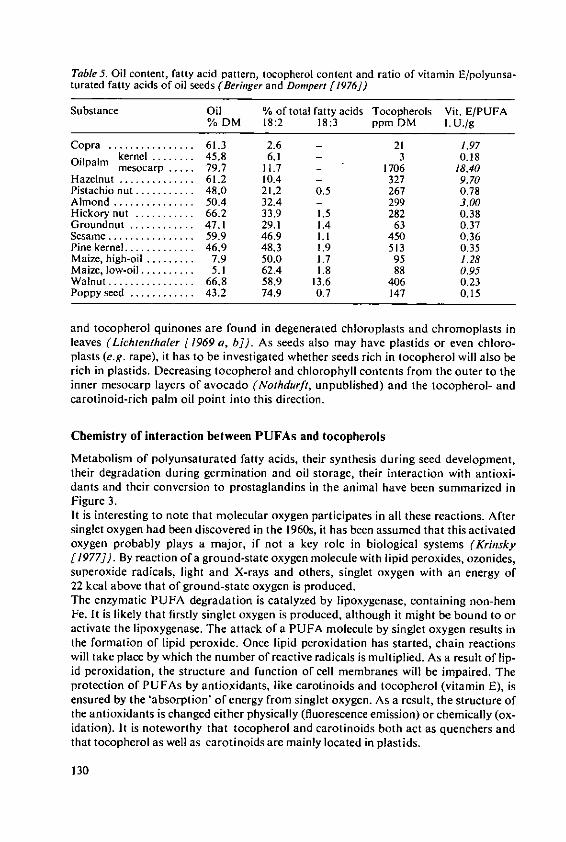
Table 5. Oil content, fatty acid pattern, tocopherol content and ratio of vitamin E/polyunsa-turated fatty acids of oil seeds (Beringer and Dompert [1976])
Substance Oil % of total fatty acids Tocopherols Vit. E/PUFA% DM 18:2 18:3 ppm DM l.U./g
Copra ................ 61.3 2.6 - 21 1.97Oilpalm kernel ........ 45.8 6.1 - 3 0.18mesocarp ..... 79.7 11.7 - 1706 18.40Hazelnut .............. 61.2 10.4 327 9.70Pistachio nut ........... 48.0 21.2 0.5 267 0.78Almond ............... 50.4 32.4 - 299 3.00Hickory nut ........... 66.2 33.9 1.5 282 0.38Groundnut ............ 47.1 29.1 1.4 63 0.37Sesame ............... 59.9 46.9 1.1 450 0.36Pine kernel ............ 46.9 48.3 1.9 513 0.35Maize, high-oil ......... 7.9 50.0 1.7 95 1.28Maize, low-oil ......... 5.1 62.4 1.8 88 0.95Walnut ............... 66.8 58.9 13.6 406 0.23Poppy seed ........... 43.2 74.9 0.7 147 0.15
and tocopherol quinones are found in degenerated chloroplasts and chromoplasts inleaves (Lichtenthaler [1969 a, b]). As seeds also may have plastids or even chloro-plasts (e.g. rape), it has to be investigated whether seeds rich in tocopherol will also berich in plastids. Decreasing tocopherol and chlorophyll contents from the outer to theinner mesocarp layers of avocado (Nothdurft, unpublished) and the tocopherol- andcarotinoid-rich palm oil point into this direction.
Chemistry of interaction between PUFAs and tocopherols
Metabolism of polyunsaturated fatty acids, their synthesis during seed development,their degradation during germination and oil storage, their interaction with antioxi-dants and their conversion to prostaglandins in the animal have been summarized inFigure 3.It is interesting to note that molecular oxygen participates in all these reactions. Aftersinglet oxygen had been discovered in the 1960s, it has been assumed that this activatedoxygen probably plays a major, if not a key role in biological systems (Krinsky[1977]). By reaction of a ground-state oxygen molecule with lipid peroxides, ozonides,superoxide radicals, light and X-rays and others, singlet oxygen with an energy of22 kcal above that of ground-state oxygen is produced.The enzymatic PUFA degradation is catalyzed by lipoxygenase, containing non-hemFe. It is likely that firstly singlet oxygen is produced, although it might be bound to oractivate the lipoxygenase. The attack of a PUFA molecule by singlet oxygen results inthe formation of lipid peroxide. Once lipid peroxidation has started, chain reactionswill take place by which the number of reactive radicals is multiplied. As a result of lip-id peroxidation, the structure and function of cell membranes will be impaired. Theprotection of PUFAs by antioxidants, like carotinoids and tocopherol (vitamin E), isensured by the 'absorption' of energy from singlet oxygen. As a result, the structure ofthe antioxidants is changed either physically (fluorescence emission) or chemically (ox-idation). It is noteworthy that tocopherol and carotinoids both act as quenchers andthat tocopherol as well as carotinoids are mainly located in plastids.
130
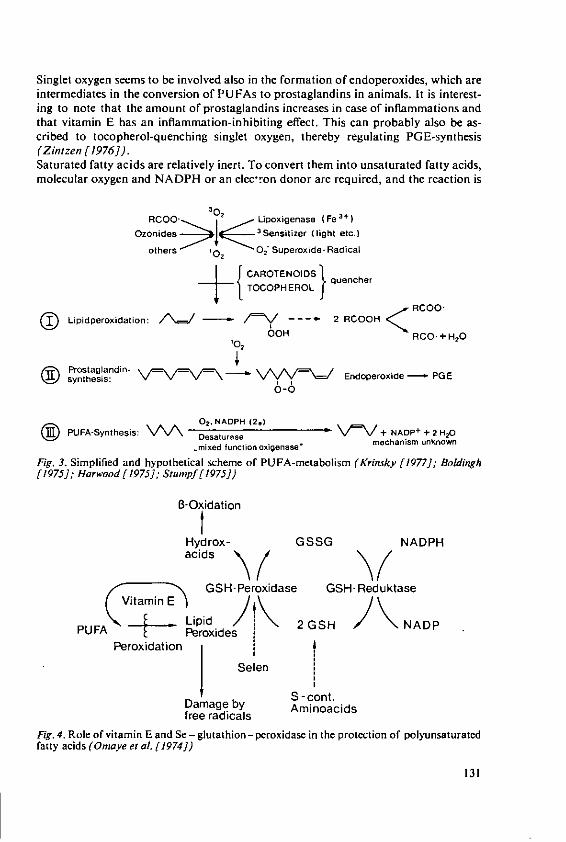
Singlet oxygen seems to be involved also in the formation of endoperoxides, which areintermediates in the conversion of PUFAs to prostaglandins in animals. It is interest-ing to note that the amount of prostaglandins increases in case of inflammations andthat vitamin E has an inflammation-inhibiting effect. This can probably also be as-cribed to tocopherol-quenching singlet oxygen, thereby regulating PGE-synthesis(Zintzen [1976]).Saturated fatty acids are relatively inert. To convert them into unsaturated fatty acids,molecular oxygen and NADPH or an elec-ron donor are required, and the reaction is
RCOO. '0 - Lipoxigenase (Fe 3+ )
Ozonides 3 Sensitizer (light etc.)
others *Oz 02 Superoxide- Radical
{ CAROTENOIDS } quencher
Lipidperoxidation: --- I/- --. 2 RCOOHO1 H RCO +H2 0
'02
Prostaglandin-synthesis: Endoperoxide- PGE
0-0
PUFA-Synthesis: \// 02. NADPH (2.) V + NAP++2H 20
, mixed function oxigenase mechanism unknown
Fig. 3. Simplified and hypothetical scheme of PUFA-metabolism (Krinsky [1977]; Boldingh[1975]; Harwood [1975]; Stumpf [1975])
B-OxidationIHydrox- GSSG NADPHacids
GSH-Peroxidase GSH-ReduktaseVitamin E ND
GLipid )'k 2 GS-1ADPUFA Peroxides 1
Peroxidlation
Selen
S -cont.Damage by Aminoacidsfree radicals
Fig. 4. Role of vitamin E and Se - glutathion - peroxidase in the protection of polyunsaturatedfatty acids (Omaye et al. [1974])
131
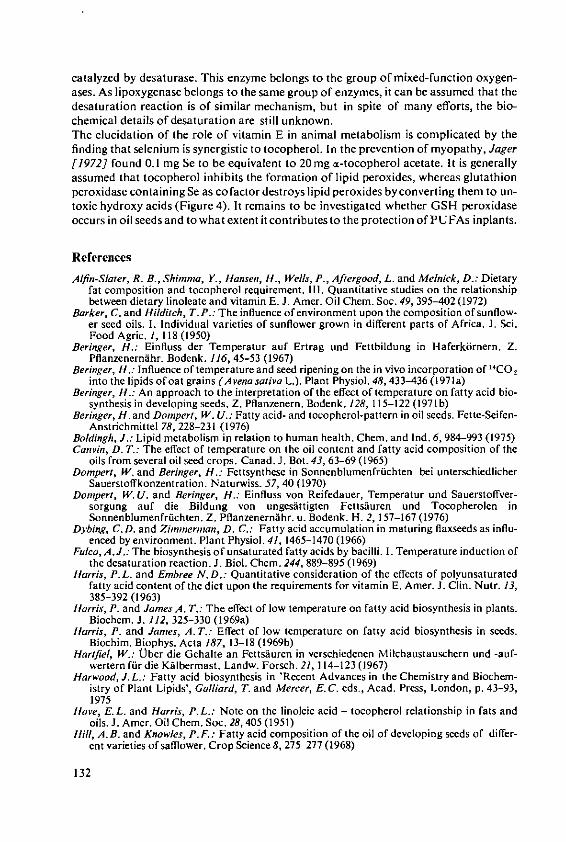
catalyzed by desaturase. This enzyme belongs to the group of mixed-function oxygen-ases. As lipoxygenase belongs to the same group of enzymes, it can be assumed that thedesaturation reaction is of similar mechanism, but in spite of many efforts, the bio-chemical details of desaturation are still unknown.The elucidation of the role of vitamin E in animal metabolism is complicated by thefinding that selenium is synergistic to tocopherol. In the prevention of myopathy, Jager[1972] found 0.1 mg Se to be equivalent to 20mg a-tocopherol acetate. It is generallyassumed that tocopherol inhibits the formation of lipid peroxides, whereas glutathionperoxidase containing Se as co factor destroys lipid peroxides by converting them to un-toxic hydroxy acids (Figure 4). It remains to be investigated whether GSH peroxidaseoccurs in oil seeds and to what extent it contributes to the protection of PU FAs inplants.
References
Afin-Slater, R. B., Shinna, Y., Hansen, H., Wells, P., Aftergood, L. and Melnick, D.: Dietaryfat composition and tocopherol requirement. Ill. Quantitative studies on the relationshipbetween dietary linoleate and vitamin E. J. Amer. Oil Chem. Soc. 49, 395-402 (1972)
Barker, C. and Hilditch, T. P.: The influence of environment upon the composition of sunflow-er seed oils. I. Individual varieties of sunflower grown in different parts of Africa. J. Sci.Food Agric. 1, 118 (1950)
Beringer, H.: Einfluss der Temperatur auf Ertrag und Fettbildung in Haferkbrnern. Z.Pflanzenernahr. Bodenk. 116, 45-53 (1967)
Beringer, H.: Influence of temperature and seed ripening on the in vivo incorporation of 14CO2into the lipids of oat grains (Avena sativa L.). Plant Physiol. 48, 433-436 (1971a)
Beringer, H.: An approach to the interpretation of the effect of temperature on fatty acid bio-synthesis in developing seeds. Z. Pflanzenern. Bodenk. 128, 115-122 (1971b)
Beringer, H. and Dompert, W. U.: Fatty acid- and tocopherol-pattern in oil seeds. Fette-Seifen-Anstrichmittel 78, 228-231 (1976)
Boldingh, J.: Lipid metabolism in relation to human health. Chem. and Ind. 6,984-993 (1975)Canvin, D. T.: The effect of temperature on the oil content and fatty acid composition of the
oils from several oil seed crops. Canad. J. Bot. 43, 63-69 (1965)Dompert, W. and Beringer, H.: Fettsynthese in Sonnenblumenfriichten bei unterschiedlicher
Sauerstoffkonzentration. Naturwiss. 57, 40 (1970)Dompert, W.U. and Beringer, H.: Einfluss von Reifedauer, Temperatur und Sauerstoffver-
sorgung auf die Bildung von ungesittigten Fetts~iuren und Tocopherolen inSonnenblumenfrichten. Z. Pflanzenern~hr. u. Bodenk. H. 2, 157-167 (1976)
Dybing, C.D. and Zimmerman, D. C.: Fatty acid accumulation in maturing flaxseeds as influ-enced by environment. Plant Physiol. 41, 1465-1470 (1966)
Fulco, A.J.: The biosynthesis of unsaturated fatty acids by bacilli. 1. Temperature induction ofthe desaturation reaction. J. Biol. Chem. 244, 889-895 (1969)
Harris, P.L. and Embree N.D.: Quantitative consideration of the effects of polyunsaturatedfatty acid content of the diet upon the requirements for vitamin E. Amer. J. Clin. Nutr. 13,385-392 (1963)
Harris, P. and James A. T.: The effect of low temperature on fatty acid biosynthesis in plants.Biochem. J. 112, 325-330 (1969a)
Harris, P. and James, A. T.: Effect of low temperature on fatty acid biosynthesis in seeds.Biochim. Biophys. Acta 187, 13-18 (1969b)
Harifiel, W.: Ober die Gehalte an Fettsiuren in verschiedenen Milchaustauschern und -auf-wertern f(ir die KMilbermast. Landw. Forsch. 21, 114-123 (1967)
Harwood, J.L.: Fatty acid biosynthesis in 'Recent Advances in the Chemistry and Biochem-istry of Plant Lipids', Galliard, T. and Mercer, E.C. eds., Acad. Press, London, p. 43-93,1975
Hove, E.L. and Harris, P.L.: Note on the linoleic acid - tocopherol relationship in fats andoils. J. Amer. Oil Chem. Soc. 28,405 (195 1)
Hill, A.B. and Knowles, P.F.: Fatty acid composition of the oil of developing seeds of differ-ent varieties of safflower. Crop Science 8, 275-277 (1968)
132
lvanov, S.: Die Klimaten des Erdballs und die chemische Tatigkeit der Pflanzen. In: Abderhal-den: Fortschr. d. naturwiss. Forsch. N. F. Heft 5, S. I, Berlin und Wien (1929)
Jager, F.C.: Effect of dietary linoleic acid and selenium on the requirement of vitamin E inducklings. Nutr. Metabol. 14, 210-227 (1972)
Knipprath, W.G. and Mead, J.F.: The effect of the environmental temperature on the fattyacid composition and on the in vivo incorporation of l-14C-acetate in goldfish (Carossiusauratus). Lipids 3, 121-128 (1968)
Krinsky, N.I.: Singlet oxygen in biological systems. Trends in Biochemical Sciences 2, 35-38(1977)
Lannek, N.: Muscular dystrophy in pigs; aetiological aspects. Proceed. XVII. World Veteri-nary Congr. Hannover 17, 2, 1263-1267 (1963)
Lichtenthaler, H.K.: Zur Synthese der lipophilen Plastidenchinone und Sekund.rcarotinoidewAhrend der Chromoplastenentwicklung. Ber. Dtsch. Bot. Ges. 82, 483-497 (1969a)
Lichtenthaler, H.K.: Die Bildung flberschflssiger Plastidenchinone in den Blittern von Ficuselastica (Roxb.). Z. Naturforsch. 24b, 1461-1466 (1969b)
Lucy, J.A.: Functional and structural aspects of biological membranes. A suggested structuralrole for vitamin E in the control of membrane permeability and stability. Ann. N. Y. Acad.Sci. 203, 4-11 (1972)
Marquard, R., Schuster, W. and Seibel, K. H.: Fettsfluremuster und Tocopherolgehalte im 01verschiedener Sonnenblumensorten aus weltweitem Anbau. Fette-Seifen-Anstrichmittel(1976; in press)
McCoy, P. B., Poyer, J. L., Pfeifer, P. M., May, H. E and Gillam, J. M.: A function for a-toco-pherol: stabilization of the microsomal membrane from radical attack during TPNH-de-pendent oxidations. Lipids 6, 297-306 (1971)
Meyer, F. and Bloch, K,: Effect of temperature on the enzymatic synthesis of unsaturated fattyacids in Torulopsis utilis. Biochim. Biophys. Acta 77, 671-673 (1963)
Molenaar, I., Vos J. and Hommes, F. A.: Effect of vitamin E deficiency on cellular membranes.Vitamins and Hormones 30, 45-82 (1972)
Nitsch, A.: Genetische und physiologische Untersuchungen an Polyenfettsiiure-Mutanten vonRaps. 11. Entwicklung und Polyenfettsauregehalt von reifenden Samen. Angew. Botanik50, 31-42 (1976)
Omaye, S. T. and Tappel, A. L.: Effect of dietary selenium on glutathioneperoxidase in thechick. J. Nutr. 104, 747-753 (1974)
Painter, E.P.: Fat acid formation during oil deposition in flax seed. Arch. Biochem. 5, 337-348(1944)
Piorr, W., T6th, L. and Novakovie, N.: Gaschromatographische und quantitativ-dinnschichtchromatographische Untersuchungen iber die Zusammensetzung derFettsiuren und Tocopherole authentischer Pflanzenble. Z. Lebensm. Unters. Forsch. 138,11-26(1968)
Rinne, R. W.: Biosynthesis of fatty acids by a soluble extract from developing soybean cotyle-dons. Plant Physiol. 44, 89-94 (1969)
Schuster, W., Marquard, R. and Boye, R.: Der Einfluss der Umwelt auf Fettgehalt undFetts~uremuster verschiedener Sonnenblumensorten. Fette-Seifen-Anstrichm. 74, 150-161(1972)
Sosulski, F. W. and Gore, R. R.: The effect of photoperiod and temperature on the characteris-tics of flax seed oils. Can. J. Plant Sci. 44, 381-382 (1964)
Stadtman, T.C.: Selenium biochemistry. Science 183, 915-921 (1974)Stissel, J. P.: Wir sollten endlich essen lernen. Bild der Wissenschaft 12/1976,13,72-86Stumpf, P.K.: Biosynthesis of Fatty Acids in Spinach Chloroplasts. In: Recent Advances in
the Chemistry and Biochemistry of Plant Lipids. Galliard, T. and Mercer, E. C. eds., Acad.Press, London, p. 95-113, 1975
Thies, W.: Die Biogenese von Linol- und Linolens~ure in den Samen h6herer Pflanzen, insbe-sondere Raps und RObsen, als Problem der Olpflanzenziichtung. Angew. Bot. 42, 140-154(1968)
Zinizen, H.: Vitamin E und Selen in der Tierernahrung. Hoffmann-La Roche AG, Grenzach,59 pp., 1976
Zintzen, H. und Grdbke, J.: Vitamine: das Problem der Bedarfsnormen. Kraftfutter 57, 1-24(1974)
Zutphen, H. van and Cornwell, D.G.: Some studies on lipid peroxidation in monomolecularand bimolecular lipid films. J. Membr. Biol. 13, 79-88 (1973)
133
Co-ordinator's Report on the Second Session
Prof. Dr. R. Bach, Swiss Federal Institute of Technology, Zurich/Switzerland; Member of theScientific Board of the International Potash Institute
The production of carbohydrates and lipids is based on photosynthesis which convertssolar energy to chemical energy. The overall chemical equation of the photosynthesisis known since a long time. The reports and communications presented in the secondworking session of this colloquium have shown that the research on the mechanismand morphology of photosynthesis, of the transport of assimilates and of the storageof reserve substances has also progressed very far. Only the main points may be repeatedhere.
Photosynthesis: The light absorption brings about the emission of electrons by specificpigment molecules. These electrons reduce ferredoxin which in turn transfers itselectrons to NADP+ thus forming NADPH. Moreover, the photosynthetic electronflow results in a separation of protons across the thylakoid membrane and in thesynthesis of ATP. By both ways the solar energy is converted to chemical energy whichis stored in the energy rich compounds NADPH and ATP. The synthesis of these ispromoted by potassium.The proton flow between the stroma and the intrathylakoid compartment is balancedby the transport of metallic cations, mainly by MgZ+. The preference for Mgz± over K+
can be explained by the theory of the double layer and ion exchange. The thylakoidmembrane acts as an exchanger of high exchange capacity and is therefore moreselective for ions of higher charge.Pigmentation of the plants seems to be very constant; it may be reduced by a deficiencyof nutrients, especially N. On the other hand the light absorption can be controlled toa certain extent by the choice of the plant type and the plant density resulting in anoptimum leaf area index for a given climate. For this purpose plant breeders havedeveloped cultivars of rice and wheat with short culms and small erect leaves. Leafarea is related to nutrient supply, especially to the supply of N. Beside the leaf areaindex the leaf area duration is important for the grain yield of wheat. The durationcan also be influenced by fertilization.NADP and ATP are required for the synthesis of sugar and amino acids. The CO2assimilation is often limited by the CO2 concentration in the air; the amino acidsynthesis depends much on the nitrogen supply.The photosynthetic efficiency of plants is low. The limiting step of energy conversion
135
is located in the redox carrier chain connecting the two photosystems. Experimentsare performed to mimic natural photosynthesis excluding the physiological barriers.One tries to produce H2 by splitting water into O0, electrons and H through artificialchlorophyll containing membranes. The electrons are used for the reduction of H+to H2, the process being catalyzed by a hydrogenase.
Transport ofassimilates: Sugars and amino acids are transported to seeds, fruits, tubersand roots. From source to sink the assimilates are transported by three systems:
1. diffusion in the symplasma and in the free space,2. active transport through the plasma membrane into the phloem sap,3. flow in the sieve tubes.Diffusion may be affected by potassium insofar as K+ affects the water content in theleaf tissue. The transport into the phloem - called phloem loading - requires ATP andis therefore enhanced by potassium. The phloem loading builds up an osmotic pressurein the sieve tubes which induces the flow of assimilates to the sink. The unloading inthe sink contributes to maintain a concentration gradient in the sieve tubes. In thisway the assimilation is coupled with the storage: high assimilation enhances storage,high storage favours assimilation.Another concentration gradient exists in the sieve tubes for K+, which in the phloemsap is ten times more concentrated than in the xylem sap.
Storage of reserve substances: The synthesis of starch in the leaves as well as in thestorage organs is brought about by starch synthetase and phosphorylase and requiresATP which may be provided by the phloem sap or by respiration in the storage organs.Starch synthetase is activated by K+; a decrease of the K+/Na+ ratio in the plant tissuedecreases starch content and increases sucrose content. The predominant transportof K+ in the phloem sap contributes to the synthesis of starch in the storage organ.To the reserve substances belong also oil and fat. Polyunsaturated fatty acids areessential for higher animals and man, but they are sensitive to oxidation. Vitamin E(tokopherol) inhibits the formation of toxic lipid peroxides and should therefore bepresent in the food in not too small proportions. It is very likely that an intimate struc-tural arrangement between vitamin E and polyunsaturated fatty acids (PUFA) existsin the membranes. Thus, the seeds containing many oil droplets have a wide vitaminE/PUFA ratio, seeds containing few oil droplets have a narrow ratio. The formation ofunsaturated fatty acids is catalyzed by desaturases which need as cofactors 02 andNADPH and H+. In some experiments the plants contained more polyunsaturatedfatty acids at low temperature. This was attributed to a higher O-content of the tissueresulting from a lower respiration. Though a positive effect of low temperature has notalways been found. The growth of the storage organs is related much to phyto-hormones. The turnover of these is affected e.g. by water, temperature and nitrogen.
Conclusion: Physiological processes are defined by reaction mechanisms and byarrangement in space and in time. The reaction mechanisms are genetically fixed andcannot be altered. This holds true also for the location on the molecular level. Yet therate and absolute magnitude of the different reactions depend not only on the geneticalcode but also on external conditions, e.g. on temperature, light intensity, supply ofCO2, water and mineral nutrients. This allows a certain controle over the wholeprocess and maximum profit from it.
136

The knowledge of reaction mechanisms and of morphological structures is thereforean important base for plant breeding as well as for plant production. It is the task ofthe agronomists, to make fruitful the scientific knowledge to agricultural practice. It isan aim of this colloquium and especially of the second session to bring together notonly scientists but also to bring together scientists and agronomists and to pushforward the transfer of science to practice.
137

3rd Session
The Needs of Humans andAnimals for Carbohydrates and Lipids
Co-ordinator: Dr. G. W. Cooke,C.B.E., Ph.D., F.R.I.C., F.R.S., Chief ScientificOfficer, Agricultural Research Council, London/United Kingdom; Member of the ScientificBoard of the International Potash Institute
Present Ideas and Evidence on the Amountsof Energy that are Regarded as Essential forPeople when Setting Nutritional StandardsJ. Klatzmann, Institut National Agronomique Paris-Grignon/France*
Summary
The whole conception of energy need is somewhat vague: there is a considerable differencebetween a ration which allows survival (taking account of the adaptability of the organism)and that which will support normal activity. Again there is a large difference between the needsof a young adult male and those of the 'average' inhabitant of a country, because the needs ofwomen, children and the elderly are not so great.A good deal is known about some factors causing variation in requirements but some aspectsare still open to discussion; for example, needs are less if body weight is lower but low bodyweight may itself be the result of malnutrition; the effects of intellectual activity and of the'stress' of daily life on energy needs are not known.In discussing energy values of diets, the distinction is not always clearly made between 'avail-able' calories (those which are quoted in food balances) and the calories which are effectivelyconsumed, allowing for losses incurred in distribution and preparation for the table. Thatthe various published nutritional standards show such wide differences should be no causefor surprise. It is the general opinion that the needs of a young adult male in an economi-cally developed country are of the order of 3000 calories per day (but does this refer to caloriesavailable or calories consumed?).This is an important field and much research remains to be done recognising that the energyvalue of a food is only one among a number of more complex factors. Further research isneeded in the laboratory but this alone will not suffice. Human energy needs can only be fullyunderstood when account is taken of individual behaviour and of the conditions of everydayexistence.
Ever since I have been concerned with the study of the world food problem I have been
in the habit of saying that, in evaluating the position in a particular country, we are
forced to equate eating habits of which we know very little with requirements whichare almost as ill defined. The present attempt to focus on the problem of energy re-quirements certainly reinforces this impression.
I. Problems of language
It is rare for those who pronounce on the energy needs of man to state clearly exactlywhat they are talking about.
* Prof. Dr. J. Klatzmann, Institut National Agronomique Paris-Grignon, 16 rue Claude-Bernard, F-75005 Paris/France
141
I.I. Contradictions in the idea of requirementsIf we define the energy need as the number of calories necessary to ensure equilibriumbetween intake and output, to maintain the body weight of the individual, there isgreat risk of our obtaining contradictory results. This is because equilibrium can beachieved at very different levels of consumption. If, as in many historical examples,men have been able to survive on famine rations, this is because a new equilibrium wasestablished at a very low level of consumption. But such an equilibrium would nothave sufficed for hard physical or intellectual effort. It is therefore necessary to defineneed - or the recommended level - more closely, as that level of consumption whichwill allow the individual to maintain himself in good health and to indulge in 'normal'physical and intellectual activity. Again, we do not eat simply to nourish ourselves. It iseasy to imagine food regimes which would cover 'needs' but which would not be ac-ceptable to the population.
1.2. Needs, norms and recommended levelsThe fact that different terms like 'needs', 'norms' and 'recommended levels' are usedcontributes little to clarification of the problem. We have just seen that the notion ofneed can, itself, be given various interpretations. When we speak of recommended lev-els, we are talking of food regimes which will maintain a man in good health and could,therefore, be well above 'needs', provided, of course, that a level of consumption is notreached which would compromise health through excessive consumption.The latter point throws up a new problem. Would it not be desirable to define bothlower and upper limits whenever we are concerned with determining food require-ments? The former corresponds to the minimum needed to maintain good health,while the latter is the upper limit which should not be exceeded on grounds of health.
1.3. Links between requirements for different kinds of foodsCan one really talk about energy needs without concerning oneself with the whole ra-tion? Does not the energy requirement depend, at least in part, on the protein contentof the food? This problem certainly exists but it is probably of no great practical im-portance, taking into account the uncertainties implicit in all the other aspects of thequestion.
1.4. Calories produced and calories consumedWithout doubt, one of the most serious confusions is in the definition of the sort of cal-ories one is speaking about. FAO, in their publications, speak of that part of produc-tion which is destined for human consumption. It is not certain that losses incurred instorage and distribution are properly accounted for. Calories actually bought by theconsumer are without doubt not strictly comparable with the quantity available and,above all, the number of calories effectively consumed is significantly below the num-ber bought in the wealthier countries. The consumer throws away some bread, somesalad oil and at least part of the fat on his meat - all products with a high energy value.If, for example, we talk of an energy need of 2500 calories do we mean'disposable' cal-ories as in the food balances of FAO or do we mean calories effectively eaten? Writersare often vague on this point and the reader has to try and divine the answer for him-self.
142
1.5. Requirements of the adult male and mean requirement per inhabitantDiscussion is often based on the needs of the adult male but in comparison of needsand consumption on a national basis we should not overlook the fact that the averageneed per inhabitant is much below the need of an active, adult male.
1.6. Theoretical and effective needs - taking into account income inequalitiesMean energy needs in a country are sometimes calculated taking account of the ageand sex distribution of the population and, if one is not on his guard, he can commitgross errors of interpretation. To compare effective consumption with needs it is neces-sary to take into account inevitable inequalities in consumption patterns, which reflectvarying wealth. For example, if it is found that the mean requirement per inhabitant is2300 calories, then effective mean consumption should be well above this figure in ord-er that the needs of the poorer sections of the community should be covered.
1.7. The sum of statistical inaccuracy, confusion of terms and errors of interpretationIn many countries, calculated food balances are far removed from reality. Taking intoaccount that the definition of need is inexact, that there may be confusion betweenavailable and consumed calories and that the influence of income inequalities on con-sumption may be ignored, it is quite possible to arrive at conclusions which are absurd.Thus, according to balance sheets published by FAO several years ago the averageconsumption of the Egyptians was of the order of 2800 calories per person per diem. Ifone assumed that the mean energy requirements per inhabitant were of the order of2000calories, he is forced to the conclusion that the great problem of present-day Egyptis that of protecting the fellahin against the dangers of over indulgence!
2. Factors influencing energy requirement - critical analysis
2.1. Enumeration of factorsHaving clarified some general points in the rather long introduction, we can now pro-ceed to a more scientific analysis of factors affecting the energy needs of man. It is gen-erally considered that the energy need is a function of sex, age, weight, activity and cli-mate. These factors are often inter-connected. Thus it is at least partly because thewoman is supposed to be lighter than the man that her energy needs are put lower.Again, there is no doubt that metabolism varies with age but because ageing also im-plies a reduction in physical activity and this reduces the need for energy.It should be emphasised that the following considerations are concerned with meansrelating to sizeable groups of individuals. In practice, differences between individualsof the same sex, the same weight and the same age can be very considerable. Effectiveconsumption can vary by a factor of two between individuals all in good health. Thecalculations of needs allow the drawing of conclusions on the consumption of groupsbut tell us nothing about individual behaviour within groups.
2.2. Energy requirement and body weightThere is no doubt that body weight affects energy requirement. But, surely, the bodyweight itself is a consequence of eating habit. Is it a consequence of their low weightthat the Japanese require less food or is it the other way round, that because they eat
143
little they are small? I speak purposely of the Japanese because, in this case, somecomparative data are available. Investigations have been made relating to Japanese liv-ing in the United States and these show that in the course of one or two generationsprofound changes take place with large increases in body weight and height. Even inJapan itself there has been a noticeable increase in the height of adolescents resultingfrom improvement of the diet.Certainly, in a country with an abundant supply of food one can say, in making com-parisons on an individual basis, that people of low body weight have a lesser energyneed than the heavier individuals. But, following the case of the Japanese, has one real-ly any right to say that because Indians are on the whole lighter than Europeans there-fore their need for food is less? Nevertheless, this is what FAO does.
2.3. Influence of climate on energy needAnother point for discussion is the variation in energy requirement according to cli-mate. It is generally admitted that less dietary energy is needed in warm climates thanin cool and calculations have been made of the norms which should apply at varyingtemperatures. However, in truth, this is not such a simple matter.It is certainly true to say that at a very low level of activity the expenditure of energy isless in a warm climate than in a cold climate, but is this also true when physical activi-ty is intense? Is not the expenditure of energy higher when the effort has to be made inthe heat?In warm countries, the proportion of the population who have access to air condition-ing is still infinitesimal, at least in the majority of cases. But the man who travels byairconditioned car from his air-conditioned flat to his airconditioned office scarcelyever has to suffer the rigours of the tropical climate.
2.4. Energy need and physical activityOne is tempted to think that things are much simpler when we consider the variationin energy need with varying physical activity. It is possible to evaluate the energy ex-penditure of a lumberjack or an athlete etc. and this allows us to draw conclusions onenergy needs in the economically advanced countries. There is no doubt that in suchcountries physical activity is being progressively reduced. The farmer spends much ofhis time sitting on a tractor. Most dockers no longer have to hump sacks, instead theyoperate machines which handle containers. This must be one of the main reasons forthe reduced consumption of bread - a high energy food. Certain people are of the opin-ion that energy consumption has been significantly reduced over the past fifteen yearsin the wealthier countries. This, at least, is the opinion of those who have studied theeating habits of the population by direct enquiry. On the other hand, FAO's global sta-tistics show that there has been an increase in the energy content of the average diet,the reduction in consumption of cereals being more than compensated by the increasein use of other products, notably animal fats. Which is the truth?Again, energy need does not depend solely upon physical activity. Has intellectual ef-fort no influence? Do occupations which demand much detailed attention to work,and all the stresses implicit in the modern daily round, increase the need for energy?No serious reply has yet been given to this question. Possibly we shall sometime dis-cover that stress causes cardiac attacks by indirect means, by increasing our energy re-quirement thus causing us to eat more of a diet rich in animal fats, itself a cause of ar-
144
terio-sclerosis. If this is indeed the case then the businessman has exactly the sameproblem as the Finnish lumberjack*.
2.5. Yet more uncertaintiesAll the above leads to the conclusion that there is still much to be done before actualfood requirement - specifically energy need - can be clearly and precisely stated with-out leaving room for errors of interpretation.
3. The results
In spite of all my reservations, it is only right that I should give you some figures. Indoing so, I shall confine myself to sources which will allow us to make some meaning-ful comparisons. The interpretation of published figures is often difficult for a reasonmentioned above - one does not always know whether one is dealing with caloriesavailable or calories consumed, so that it is hardly possible to equate needs with effec-tive consumption.
3.1. Optimistic opinionsCertain writers, like Colin Clark, have set out to show that all forecasts of world fam-ine and malnutrition are very exaggerated. In this they have assumed a low estimate ofenergy requirement. Colin Clark in his book 'Abundance or Famine' cites, at intervalsof several pages, a number of different figures, all of them low. He decides on thethreshold of malnutrition at 1800-2000 calories, which indicates that above this levelthere can be no 'malnutrition', that is to say that the diet is adequate. At another placein his book he states that the needs of a people of small stature living in a warm climatewhere the farmer's life follows the rhythm of the seasons amounts to 1625 calories perperson per day. Finally he says, without further definition, that a man consumes78cal-ories per hour in a sedentary occupation and 62.5 calories to maintain base metabo-lism during sleep. This corresponds, for 16 hours activity and 8 hours sleep, to a totalof 1750 calories per 24 hours. But we do not know to what kind of individual this ap-plies.
3.2. FAO dataThough they are open to some criticism, the evaluations made by FAO do represent aserious attempt to solve the problem of describing food requirements.A table published several years ago estimates average needs for energy and proteinover large areas of the world. The figures vary from 2700 calories per person per dayfor North America through 2400 calories for Japan to 2200 calories for Africa and theFar East. As these figures are compared with consumption calculated from food bal-ances it appears that they deal with disposable rather than effectively consumed calo-ries, but, unhappily, this is not certain.A detailed table (Table I) published in 1973 is much more interesting. This presents fig-ures by sex and by age and distinguishes between developed and under-developedcountries. In the developed countries the need of a man weighing 65 kg rises to 3000
-The highest levels of cardiac and circulatory disorders in Europa are found among the Finnsengaged in intense physical activity - probably because of a diet too rich in animal fats (nota-bly dairy products).
145
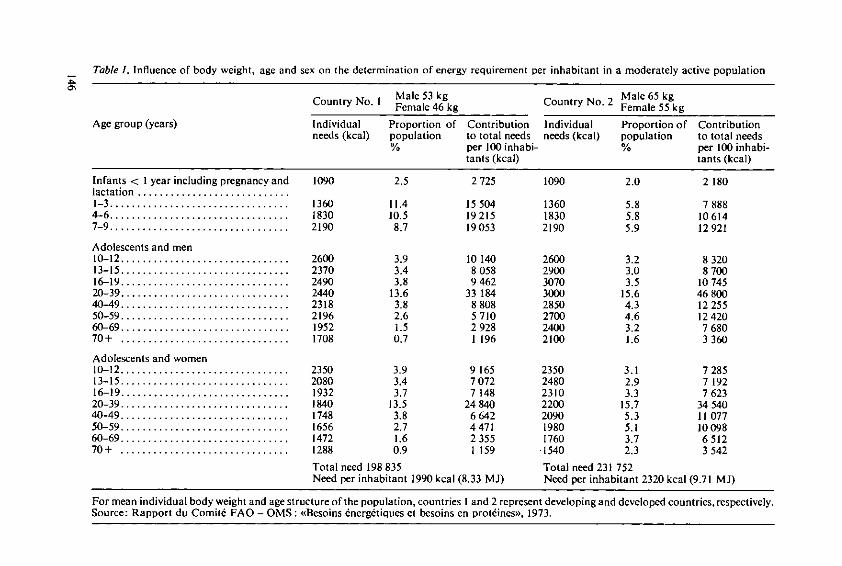
Table 1. Influence of body weight, age and sex on the determination of energy requirement per inhabitant in a moderately active population
Country No. I Male 53 kg Male 65 kgFemale 46 kg Country No. 2 Female 55 kg
Age group (years) Individual Proportion of Contribution Individual Proportion of Contributionneeds (kcal) population to total needs needs (kcal) population to total needs
% per 100 inhabi- % per 100 inhabi-tants (kcal) tants (kcal)
Infants < I year including pregnancy and 1090 2.5 2725 1090 2.0 2180lactation ............................1-3 ................................. 1360 11.4 15504 1360 5.8 78884-6 ................................. 1830 10.5 19215 1830 5.8 106147-9 ................................. 2190 8.7 19053 2190 5.9 12921
Adolescents and men10-12 ............................... 2600 3.9 10 140 2600 3.2 832013-15 ............................... 2370 3.4 8058 2900 3.0 870016-19 ............................... 2490 3.8 9462 3070 3.5 1074520-39 ............................... 2440 13.6 33 184 3000 15.6 4680040-49 ............................... 2318 3.8 8808 2850 4.3 1225550-59 ............................... 2196 2.6 5710 2700 4.6 1242060-69 ............................... 1952 1.5 2928 2400 3.2 768070+ . ............................... 1708 0.7 1 196 2100 1.6 3360
Adolescents and women10-12 ............................... 2350 3.9 9 165 2350 3.1 728513-15 ............................... 2080 3.4 7072 2480 2.9 7 19216-19 ............................... 1932 3.7 7 148 2310 3.3 762320-39 ............................... 1840 13.5 24840 2200 15.7 3454040-49 ............................... 1748 3.8 6642 2090 5.3 1107750-59 ............................... 1656 2.7 4471 1980 5.1 1009860-69 ............................... 1472 1.6 2355 1760 3.7 651270+ . ............................... 1288 0.9 1 159 .1540 2.3 3542
Total need 198 835 Total need 231 752Need per inhabitant 1990 kcal (8.33 MJ) Need per inhabitant 2320 kcal (9.71 MJ)
For mean individual body weight and age structure of the population, countries I and 2 represent developing and developed countries, respectively,Source: Rapport du Comit FAO - OMS: <,Besoins dnerg6tiques et besoins en protdines >, 1973.
calories per day between the ages of 20 and 39 years and falls to 2100 calories at overseventy. The woman weighing 55 kg aged 20 to 39 only needs.2200 calories, 800 lessthan the man while, at over 70, her energy needs do not exceed 1500 calories. It isworth noting that, taking account of the distribution of the population according tosex and age, the mean energy requirement per inhabitant does not exceed 2300 calories,that is 25% less than the corresponding figure for the adult male. The weights formen and women seem rather low so that, possibly, the diet levels should be raised alittle.In under-developed countries, the reference male weighs 53 kg and the woman 46 kg.Daily energy needs between the ages of 20 and 39 are estimated at 2450 calories for theman and 1850 for the woman, falling to 1700 and 1300 respectively at over seventy.Taking the population as a whole, the mean energy need is of the order of 2000 calo-ries, that is about 20% less than that for the adult male. I have given only rounded fig-ures but the table cited is much more precise and gives figures to the nearest calorie.Thus, the need of the woman aged 60-69 in under-developed countries is given as 1472calories per day!But, again, what calories are we talking about? If we adopt the hypothesis that theFAO figures are mutually consistent (and this is by no means certain for figures pub-lished at different dates) it appears that the figure of 2300calories, for the economicallyadvanced countries, means calories effectively consumed while the 2700 for NorthAmerica and 2650 for Europe are expressed in terms of available calories, in accord-ance with the hypothesis put forward above.Other FAO data allow us to differentiate energy needs as a function of the degree of ac-tivity. For the adult male in an economically advanced country at age 20-39, these varybetween 2700 and 4000 calories according to physical activity, which is not incompati-ble with a mean requirement of the order of 3000 calories.
3.3. Evaluations from other sourcesAccording to norms published twenty years ago in France by the National Institute ofHealth the energy need of the adult male was of the order of 3000 calories, varying be-tween the extremes of 2500 and 4000 calories, according to the degree of physical activ-ity. These figures agree well with those of the FAO cited above. True the French fig-ures refer to an adult male of no stated age, while the FAO refer to men aged 20-39.For all adults between the ages of 20 and 60, the FAO figures work out at an average of2900 calories, and the difference of about 100 calories can hardly be significant. On theother hand the norms recommended in the United States by the Food and NutritionBoard are somewhat different from those of FAO. They state that a man aged 23-50,weighing 70 kg, has an energy need of 2700 calories. For the same age group, the FAOnorm is about 2950 calories for a man of 65 kg. This divergence is appreciable and il-lustrates the kind of contradiction which can be found between evaluations preparedby two expert bodies.The comparison between the two tables can be taken further. According to the Ameri-cans, the group aged 15 to 18 years, with a need of 3000 calories, has a requirement tenper cent above that of the age group 23-50. At 3070 calories, the age group 16-19 isonly 100 calories above that of the group 20-50 according to FAO. Thus the contradic-tions are not only found between the needs of a particular category, but also in theway in which requirements vary according to age.
147
4. Conclusion
One can only conclude at the end of this analysis that there is still much to be done be-fore we really know the energy needs of man. Comparison between needs which are illknown and consumption levels which are even less well known can only be deceptive.However, there can be little doubt that consumptions of the order of 3200-3300 calo-ries per person per day estimated by the FAO for North America, Oceania, Europeand the USSR are excessive. Neither is there much doubt that hundreds of millions ofhuman beings have a food supply which does not exceed 1500 calories and survive inconditions of near starvation. Then, many more are suffering from various types ofmalnutrition even though their energy needs may be covered. But it is extremely diffi-cult to be any more precise so long as one is no better informed about actual foodneeds and real consumption patterns.Much then remains to be done in both spheres. There has been great progress in ani-mal nutrition. How is it that we are so ill informed about the needs of man?Laboratory research carried out under artificial conditions is not enough. It is the needof the ordinary man in his environment that we need to evaluate. The problem of nutri-tion is very complex interacting as it does with so many factors and there is little to begained by concentration on one or another separate aspect. This amounts to sayingthat a table of energy needs has no meaning unless it forms part of a table showing alldietary requirements.
Acknowledgment
Preparation of this paper on energetic requirement was efficiently supported by Dr.H. Dupin.
References
(Only main reference sources are cited.)
Dupin, H.: Les besoins nutritionnels et les apports recommand&s pour la satisfaction de ces be-soins. Bulletin de la Socit6 Scientifique d'Hygine Alimentaire 62, No. 2 (1974)
FAO: Besoins dnergtiques et besoins en proteines, 1973Food and Nutrition Board (USA): National Research Council. Recommanded Dietary Allow-
ances, 1973 (revised)
148
Are Certain Lipids and PhospholipidsEssential for Man and Animals?
M.A. Cranford, BSc, PhD, Nuffield Laboratory of Comparative Medicine,The Zoological Society of London, London/United Kingdom*
Surmary
Polyunsaturated fats are normally part of a balanced diet and are essential constituents ofthe diet in the same way as is protein. They are required for the growth, maintenance andrepair of all tissues of the body and are of special relevance to membrane-rich systems such asthe nervous, vascular, endocrine and reproductive systems. This paper is a brief review ofcurrent knowledge on essential fatty acids.
Definition of essential fats
Evidence on the essentiality of protein in the diet emerged a hundred years ago as itwas possible to use nitrogen as a marker. However, no such marker existed for the
fats. A hundred years ago early pathologists recognised that two different types of
fat existed in the body (I) visible and (2) invisible. The infiltration of the visible fats
into tissue was one of the first histological indicators of pathological change to be
used. The function of the two types of fat became recognised as distinctly different -
the visible fats for storage and the invisible for structural purposes.In 1929 it was established that the polyunsaturated fatty acids, linoleic and a-linolenic
acids were essential for growth and reproduction in laboratory animals (Burr and
Burr [2]); these acids were described as essential fatty acids (EFA). Deficiency of
the essential fatty acids resulted in failure of growth, failure in reproduction, atrophy
of the sex organs, together with severe exfoliative dermatitis and finally death of theanimal.Since then large-scale experiments proved that human infants had an essential require-
ment for EFA (Hansen et al. [10]) and more recently the use of intravenous feedingtechniques coincidentally established the essentiality in adults (Collins et al. [4]).
Because linoleic acid is more readily available commercially than a-linolenic acidmuch more is known about the physiology and biochemistry of linoleic acid than
o-linolenic acid. The detailed study of the biochemistry of the essential fatty acids
had to wait for radioisotope techniques and the development of gas liquid chromatog-raphy for analysis.
* M.A. Cranford, Nuffield Laboratory of Comparative Medicine, The Zoological Society ofLondon, Regent's Park, London NW 14 RY/United Kingdom
149
Function of essential fatty acids and their metabolism
The essential fatty acids are important for growth and development because they areused in the internal and exterior cell structures and membranes in combination withprotein in every tissue in the body. The EFA are the essential components of thestructural lipid which is the equivalent of the invisible fats described by the earlyhistologists. Structural -lipid is quantitatively the second most important structuralcomponent of all soft tissues after protein. It is built with phospholipid and cholesterol.The fatty acid composition in the phospholipid of the structural lipid is specific todifferent tissues and to their physical requirements. Whilst the fatty acid compositionof the storage fats (which are mainly triglycerides) change readily with diet, the com-position of the phospholipids is resistant to change. Given time, however, they willbe modified by dietary considerations.There are two positions for fatty acids in the phospholipid molecules; the first isoccupied by a saturated and the second by a polyunsaturated fatty acid (PUFA).If the diet is experimentally unbalanced by providing an excess of the saturated ornon-essential fats these can compete with the PUFA and force their way into thesecond position in place of the PUFA and so alter the physical properties of thephospholipid and ultimately that of the membrane itself (Hohnan [12J; Gurr andJames [9]).Cholesterol has only one position available for esterification and as much as 70% ofthe fatty acids used for making the cholesterol esters may be polyunsaturated; in manlinoleic acid is the major fatty acid found in the cholesterol esters. It is likely that thepresence of the polyunsaturated fatty acid in the cholesterol ester enhances its solu-bility and so enhances the secretion of cholesterol by the bile. Again, the high saturatedfatty acid content in the diet will compete for cholesterol esterification and reducethe solubility of the cholesterol esters by lowering their PUFA content.The triglycerides have three positions available for esterification. As with the phos-pholipids the middle position usually contains a PUFA whilst the others contain asaturated or non-essential fatty acid. The fatty acid composition of the triglyceridevaries with the diet but it will seldom have a ratio of more than one PUFA to two ofthe saturated or non-essential fatty acids. Triglycerides have a greater affinity for non-essential and phospholipids for essential fatty acids; the EFA are taken up preferen-tially by the structural lipids.
The metabolism of essential fatty acids
Just as certain essential amino acids give rise to substances of high physiologicalactivity like adrenalin and serotonin, the essential fatty acids give rise to the prosta-glandins, substances of high physiological activity (van Dorp [8]). That ist, theessential fatty acids, like the essential amino acids, have both a structural and aphysiological function.The structural function of the essential fatty acids is largely dependent on their chainlength and degree of unsaturation: The greater the degree of unsaturation, the greaterwill be the liquidity and the lower the melting point of the fat. By contrast, saturatedfatty acids give rise to hard or rigid fats with high melting points (Chapman [3]).Consequently, membrane or tissue fats can be built with specific properties of either
150
rigidity, as in the myelin sheath, or softness or elasticity, as in the arterial wall,depending on whether they have a high or low content of polyunsaturated fat.Two parent essential fatty acids occur in plant foods and these are linoleic anda-linolenic acids. These are metabolised by desaturation and chain elongation to theirlong-chain derivatives which include arachidonic and docosahexaenoic acids. Linoleicand a-linolenic acids have a chain length of eighteen carbons with two or threedouble bonds or degrees of polyunsaturation. Their long-chain derivatives havecarbon chain lengths of twenty to twenty-two carbons with four, five and sixdoublebonds. These long-chain derivatives are important because they are the principalfatty acid constituents of important membrane systems like those of the nervoussystem, the vascular endothelium and the platelet and because they are the directprecursors for the prostaglandins.
Summary of desaturation and chain elongation of EFA
A6 desat- elong- A5 desat- elong- A4 desat-urase ase urase ase urase
18:2w6 - 18:3w6 -, 20:3w6 , 20:4w6 -- 22:4w6 -, 22:5)6
linol- y-linol- dihomo-y- arachi- docosatetra-eate enate linolenate donate enoate
4,'I series II series
Prostaglandin andderivatives
I[I series
A6 desat- elong- A5 desat- elong- A4 desat-urase ase urase ase urase
18:3w3 -- 18:4w3 - 20:43 --- 20:5w3 ->- 22:5w3 -- 22:6w3
a-linol- eicosapenta- doco- doco-enate enoate sapenta- sahexa-
enoate enoate
Both in vivo and in vitro studies have shown that the desaturation reactions imposelimitations on the rate of conversion of the parent EFA to their higher homologues.
Essential fatty acids in fetal and neonate development
Brain growth and development mainly takes place during fetal and early postnatalgrowth. Quantitatively, lipid is the most important structural component of the brainand its essential fatty acid composition is similar, regardless of species differences orcontrasts in food selection patterns (Crawford et al. [6]).
151
The fetal brain specifically accumulates long-chain (C 20 and 22) polyunsaturatedfatty acids - arachidonic and docosahexaenoic - during cell division. De novo synthesisof these acids does not occur and they are thought to be either directly derived fromfood or by metabolism from linoleic and a-linolenic acids, respectively. The proportionof long-chain polyunsaturated fatty acids has been shown to be increased within thephospholipids (structural lipids) by what appears to be a multiple processing systemwhich increases chain length and degree of polyunsaturation of the essential fatty acidsfrom maternal liver to placenta, fetal liver, and fetal brain. Observations in mansuggest the same trend. The proportion of long-chain polyunsaturated acids increasesin the phospholipids from maternal blood, cord blood, fetal liver, and fetal brain.These data show that the placenta and fetus are radically modifying the maternalphospholipids so as to achieve the high proportions of the C 20 and C 22 polyun-saturated fatty acids in the structural lipids of the developing tissues.The postnatal nutrient requirements in the human are met by maternal milk and it isinteresting that milk from mothers from 5 different countries was found to be similarwith respect to its EFA content, providing about 6% of the energy as EFA (Crawfordet al. [7]).
The vascular system and platelet aggregation
Unlike the nervous system the fatty acid composition of the structural lipids of theplatelet and the vascular endothelium is not restricted to the C 20 and C 22 polyenoates.However, the long-chain derivatives total approximately 25-35% of the total polarphospholipid fatty acids. It is likely that a loss of EFA in these membranes wouldresult in increased permeability as occurs elsewhere; it has been known for some timethat the cholesterol esters in atheromatous material have lower levels of linoleate andhigher of oleate than normal healthy arteries.In addition, the essential fatty acids are involved in the maintenance of the vascularsystem and the mechanism of blood clotting via their prostaglandin derivatives. Thereare a number of physiologically active prostaglandin-type products derived from theEFA and their functions are directly relevant to thrombus formation and the integrityof the arterial wall (Moncada et al. [14]) in a way which is important in the contextof coronary heart disease.Normally the tendency of platelets to stick to each other is controlled by a balance ofone prostaglandin which suppresses and another which stimulates adhesiveness. Theproduction of the latter is crucial in haemorrhage. The PG which stimulates aggre-gation is also derived from linoleic acid, but the rate of conversion is very low, beinglimited by the A6 desaturation (Hassam et al. [11]); the amount produced is small.In addition, the vascular endothelium synthesises its own prostaglandin (prostacyclin,Moncada et al. [14]) which prevents platelets adhering to the wall and releases anywhich have become adherent. If the arterial endothelium is damaged, local synthesisof prostacyclin cannot occur and a mural thrombus is likely. The effectiveness of thesuppression of aggregation increases with the amount of linoleic acid in the diet up toabout 12-14% of the energy. This dose-related response could be important in personswith atherosclerosis which predisposes to thrombus formation.
152
Dietary factors which affect the utilisation of essential fatty acids
(I) Saturated fats
Diets high in saturated fats and low in essential fats lead to a change in the fatty acidcomposition of the membrane phospholipids and this alters the properties of themembrane, resulting in increased permeability. In these circumstances there is anincreased infiltration of the arterial endothelium by lipoproteins rich in cholesteroland this mechanism is thought to be one of the early lesions in atherosclerosis.Excess saturated fats compete with and obstruct the utilisation of essential fatty acidsin a similar way to that in which excess nonessential amino acids compete with andobstruct the utilisation of essential amino acids. Excess saturated fatty acids, inexperimental diets can induce a deficiency of essential fatty acids and it is known thatthe requirement for essential fatty acids increases if the saturated fat content of thediet is increased. Excess saturated fats or a deficiency of essential fats can also leadto increased risk to platelet aggregation or thrombus formation through the twoeffects of an alteration of the platelet membrane lipids and the reduction of the controlof aggregation by the prostaglandins.
(2) Cholesterol
An increase in the dietary polyunsaturated fatty acids will reduce the plasma cholester-ol. It is also true that an increase in the dietary cholesterol will impair the utilisationof the essential fatty acids because of the high content of linoleate in the cholesterolesters; high levels of cholesterol esters in the blood can result in less EFA beingavailable for other purposes.
(3) Carbohydrates
Carbohydrates can exacerbate the atherogenic effect of saturated fat in the diet(Vergroesen [17]). The likely explanation is that the carbohydrates are converteddirectly to fat and this conversion can only result in saturated and perhaps monoun-saturated fats. Different carbohydrates have different effects on the utilisation of fats.Sucrose or fructose is more lipogenic, for example, than glucose or starch. Additionof sucrose or fructose to a diet in which the fat is saturated increases the atherogenicityto a greater extent than does glucose, starch or fibre-rich carbohydrate sources(Kritchevsky [13]).
(4) Influence of hormones
The metabolism of EFA is interlocked with the metabolism of fatty acids, carbo-hydrates and proteins and as expected, the glucogenic and ketogenic hormones willimpinge on their metabolism; for example, there is a reduced conversion to the higherlong-chain derivatives in experimental diabetes. However, of special interest is theinfluence of the female sex hormones which results in an increased efficiency of EFAutilisation. The difference between the male and female response is so profound thatit results in a higher requirement for males (Hohnan [12]). Conversely, severeexternal deficiency symptoms are much more readily induced in male animals.It is therefore likely that the male is significantly more susceptible to the long-term
153
effects of adverse dietary conditions with respect to the EFA which is of direct rele-vance to the higher incidence of coronary heart disease in males and the tendency ofthis difference to disappear after the menopause.
(5) Protein
The balance of dietary protein to EFA is important because both protein and structuralfat are needed for building cells. In children whose growth was failing because ofundernutrition, feeding high protein diets resulted in EFA deficiency because theprotein stimulated cell division and growth without adequate amounts of EFA(Soderhjeln et al. [16]).As explained elsewhere, this separation of protein and EFA is unlikely to occur natu-rally but it is relevant to the bottle-fed infant and the zealous use of infant and othermanufactured foods prepared and marketed as especially high in protein.
(6) Lipoproteins
The lipoproteins have been used in an attempt to classify the risk of the individual tocoronary heart disease, Using this method, the Frederickson Type II B is associatedwith the highest risk. The plasma characteristics of Type II B are a raised VLDL,cholesterol and triglycerides together with a moderately raised LDL. The VLDL isthe lipoprotein fraction of plasma that has the least proportion of EFA. The converseis that a high HDL is associated with a low risk and the HDL is the fraction with thehighest proportion of EFA and especially the longer chain derivatives. The HDLfraction is the richest with respect to the phospholipids and their long-chain polyun-saturated fatty acids of the type that are used in the cell membranes and as precursorsfor prostaglandin synthesis. It is worth commenting that although the differentlipoprotein characteristics, cholesterol and triglycerides, have independently beenstudied in great detail with a view to establishing their independent qualities aspredictors of risk to CH D, as yet there have been no serious studies on the fatty acids,particularly those of the phospholipid type, including the long-chain derivatives usedin the arterial membranes and as prostaglandin precursors. Obviously this constitutesa major gap in our knowledge because these are the fundamental building bricks forthe vascular system and platelet.
Essential fatty acid deficiency and the requirement for EFA
Some confusion has been created by the fact that not all polyunsaturated fats areessential fatty acids. However, all essential fatty acids are PUFAs. The reason forthis paradox is that in extreme fatty acid deficiency the body can build a limited amountof its own polyunsaturated fats. However, the substitute fatty acids derived from oleicacid cannot replace the physiological functions of the essential fatty acids, althoughthey can act as a temporary buffer during a period of severe deficiency.Under normal dietary conditions this kind of essential fatty acid deficiency does notoccur because both protein and fats are needed for cell building hence any plant oranimal food which meets the protein requirements will also meet the requirements foressential fats (Crawford and Sinclair [5]). However, the real question which is being
154
asked is not what are the minimal requirements to prevent severe clinical deficiencywith external symptoms, but what is the correct balance of PUFA'to provide for theoptimum development. For example, in the context of early arterial development oneneeds to know the answer to the question on PUFA requirements for (I) the growth,maintenance and repair or integrity of the arterial wall and the endothelial barrier;(2) for safe control of platelet aggregation and thrombus formation; and (3) themaintenance of optimum plasma lipid levels.One should add, in attempting to discuss the nature of the requirements for PUFA inthe diet, that one is not only concerned with the amount of PUFA available per day,but also the other dietary constituents such as fats, carbohydrates and proteins andthe way in which their quantity and quality will affect the metabolism of the essentialfatty acid.There is a different but conceptually-related question on the EFA requirements forfetal and neonate development.In tackling the question of protein requirements the answers were relatively simplein the sense that the effect of deficiency or absence of an essential amino acid wastotal: protein synthesis could not take place in the absence of an essential aminoacid. Hence, one had to deal with fairly precise quantitative considerations. In thecase of the EFA structural lipid synthesis can still occur in the absence of EFA becausethere is a defence mechanism for synthesising substitutes: That there is room for varia-tion, immediately changes the discussion towards quality upon which it is very muchmore difficult to make decisions.
References
I. Brenner, R.R. and Peluffo, R. 0.: Effect of saturated and unsaturated fatty acids on thedesaturation in vitro of palmitic, stearic, oleic, linoleic and linolenic acids. J. Biol. Chem.241, 5213-5219 (1966)
2. Burr, G.L. and Burr, M.: A new deficiency disease produced by the rigid exclusion offat from the diet. J. Biol. Chem. 82, 345-367 (1929)
3. Chapman, D.: The role of fatty acids in myelin and other important brain structures.In: Lipids, Malnutrition and the Developing Brain. eds. K. Elliot and J. Knight. Asso-ciated Scientific Publishers, Amsterdam. 31-50, 1972
4. Collins, F. D., Sinclair, A. J., Royle, J. P., Coats, D.A., Maynard, A. T. and Leonard, A.F.:Plasma lipids in human linoleic acid deficiency. Nutr. Metabol. 13, 150-167 (1971)
5. Crawford, M.A. and Sinclair, AJ.: Nutritional influences in the mammalian brain.In: Lipids, Malnutrition and the Developing Brain. eds. K. Elliot and J. Knight. Asso-ciated Scientific Publishers, Amsterdam. 267-287, 1972
6. Crawford, M.A., Casperd, N.M. and Sinclair, A.J.: The long chain metabolites oflinoleic and linolenic acids in liver and brain n herbivores and carnivores. Comp. Biochem.Physiol. 54B, 395-401 (1976)
7. Crawford, M.A., Hall, B., Laurance, B.M. and Munhamo, A.: Milk lipids and theirvariability. Curr. Med. Res. Opinion 4, Suppl. 1, 33-43 (1976)
8. van Dorp, D.A., Beerthuis, R.K., Nugteren, D.H. and Vonkeman, H.: Enzymatic conver-sion of all-cis polyunsaturated fatty acids into prostaglandins. Nature 203, 839-841 (1964)
9. Garr, M. I. and James, A. 7.: Lipid Biochemistry. An Introduction. Chapman and HallLtd. (London) (publ.), 1971
10. Hansen, A.E., Wiese, H.F., Boelsche, A. N., Haggard, M. E., Adam, D. J. D. and Davis, H.:Role of linoleic acid in infant nutrition. Clinical and chemical study of 428 infants fedon milk mixtures varying in kind an amount of fat. Pediatrics 31, 171-192 (1963)
I. Hassam, A.G., Sinclair, A.J. and Crawford, M.A.: The incorporation of orally-fedradioactive y-linolenic acid and linoleic acid into the liver and brain lipids of sucklingrats. Lipids 10, 417-420 (1975).
155

12. Holman, R. T.: Biological activities of and requirements for polyunsaturated acids. Progr.Chem. Fats other Lipids 9, 607-682 (1970)
13. Kritchevsky, D.: Diet and cholesteremia. Lipids 12, 49-52 (1977)14. Moncada, S., Gryglewski, R., Binting, S., and Vane, J. R.: An enzyme isolated from artery
transforms prostaglandin endoperoxides to an unstable substance that inhibits plateletaggregation. Nature 263, 663-665 (1976)
15. Sinclair, A.J. and Crawford, M.A.: The incorporation of linolenic acid and docosahexae-noic acid into liver and brain lipids of developing rats. FEBS Letters 26, 127-129 (1972)
16. Soderhielhn, L., Wiese, H.F. and Holman, R.T.: In: Progress in the Chemistry of Fatsand Other Lipids. Vol. 9. Holman, R.T. (ed.) Pergamon Press, Oxford (pub].), 1970
17. Vergroesen, A.J. (Ed.): The role of Fats in human nutrition. Academic Press, 1975
156
Sensory Qualities ofCarbohydrates and Lipids
Prof. Dr. J. Solms, Department of Food Science, Swiss Federal Institute of Technology,Zurich/Switzerland*
Summary
Carbohydrates and lipids act with an astonishing variety of physical and chemical propertieson the sensory qualities of food systems. These factors comprise
- taste qualities,- indirect flavor effects,- chemical and physical interactions,- rheological characteristics,not to speak of their role as flavor precursors, which has not been treated in this paper. A trulymultidimensional approach is necessary for an understanding of the various interrelationships.
1. Introduction
The sensory quality of a compound describes the sensual response when taken intothe mouth; this comprises odor, taste, and other mouth sensations. In foods many com-pounds perform not only due to their sensory qualities per se, but also as flavor pre-cursors, and as flavor carriers; and they modify flavor perception, including thresholdconcentration and retention. This paper will be devoted to the over-all effects of fla-vor activity of carbohydrates and lipids.
2. Carbohydrates
Carbohydrates are polyhydroxy aldehydes or ketones or compounds derived fromthem and range in molecular weight from less than 100 to more than I million. Wethink of carbohydrates as the chemical class of sweet-tasting chemicals, because we are
so familiar with the sweetness of sucrose, glucose, and other sugars. However, of all themonosaccharides and polysaccharides known, only a few are sweet; most are tasteless.There are even bitter tasting carbohydrates.Most of us enjoy sweetness, it is the only sensory quality that is pleasant to man atmost concentrations. Sweetness intensity of a compound cannot be measured quantita-
* Prof. Dr. J. Sohns, Department of Food Science, Swiss Federal Institute of Technology,ETH-Zentrum LFO, CH-8092 Zurich
157
tively in absolute physical or chemical terms, but requires the use of subjective sensorymethods with trained taste panels [38, 47]. The sweetness of a variety of substances isshown in Table 1. Sucrose is the usual standard and the sweetening power of othersweeteners is then compared on a relative weight basis. These ratios are only approxi-mate at best and up to a certain concentration. It can be seen that most of the naturallyoccuring sugars are less sweet than sucrose [14].More recent work by Stevens [44] demonstrated that numerical estimates in propor-tion to subjective magnitude, called magnitude estimates, provide meaningful ratiomeasures of taste intensities. Moskowitz in his work [25] reported series of sweetnessscales for several dozen different sugars. A convenient term describing one sweeteneris:
S =k . C n
where S =sweetness judgment (magnitude estimation)C =physical concentration of solution e.g. molarityk and n =constants
whereby n governs as parameter the rate at which sweetness increases with concentra-tion. It appears to exceed 1.0 for sugars, but is less than 1.0 for several synthetic sweet-eners.Sweetness is best explained by multiple group stereogeometry, and the sugars vary intheir sweetness according to their molecular architecture. The common structural fea-ture has been recognised as being a trifunctional entity with an AH and B component asusually used to describe either an intra- or an intermolecular hydrogen bond, with in-teratomic distances between 2.5 and 4.0 A, a third site y is viewed as being hydropho-bic. The entity is grouped in an oblique planar stereogeometric arrangement. This unitthen interacts with a corresponding receptor site as presented for glucose and fructosein Figure 1 [5, 17, 41].It can easily be seen that only some of the hydroxyl groups of the sugar ring are respon-sible for eliciting the sweet effect, together with the hydrophobic region. Therefore it isan interesting task for researchers in this field to selectively eliminate hydroxyl groupsaround a sugar ring or to introduce stronger hydrophobic groups in correct stereo-chemical positions, and to examine the sensory properties of the resulting compounds.
Table 1. Relative sweetness of various sugars
Compounds Sweetness(sucrose= I)
Sucrose .................... ILactose ..................... 0.4M altose .................... 0.5Cellobiose .................. 0Galactose .................. 0.6D-G lucose ................. 0.7D-Fructose ................ 1.1Invert sugar ................ 0.7-0.9D-Xylose ................. 0.7Sorbitol .................... 0.5Mannitol .................. 0.7D ulcitol .................... 0.4
158
5.25 A
3.14
AH 3A B
H" /OH-H 0
H(AH ) OH OH
H (B)
(AH)CH
('Il, H (B c
OHHOH
OH
Fig. I. Lipophilic-hydrophobic attribute and component in the stereo-chemistry of sweetness
Examples of sweet tasting sugar-derived compounds are presented in Table 2 [13, 18].This type of approach indicates that one side of the sugar ring elicits specifically thesweet response while the other side may elicit a bitter response. Indeed several exam-ples are known with the combined bittersweet effect as can be seen from Table 3. Gen-tiobiose which is related to isomaltose is bitter. Mannose provides an interesting exam-ple; a-D-Mannose is sweet, and the stereoisomer, 3-0-Mannose is bitter.
159
Table 2. Sugar-derived compounds with sweet taste
Sweetness
Saccharose ..................... 1.0Sorbitol ........................ 0.5X ylitol ......................... 1.0M annitol ....................... 0.6M altitol ........................ 0.91',6,6'-Trichlorosucrose ......... 10I ',4,6,6'-Tetrachlorogalactosucrose -500
Table 3. Taste quality of selected sugars
alfa-D-M annose ................... sweetbeta-D-M annose .................. bitterIsomaltose ........................ sweetG entiobiose ....................... bitter
When mixtures of sugars are present together they often increase one another's sweet-ness due to synergistic effects. Synergism has been described in mixtures of sugars, ofsugars and sweeteners [9, 25, 26, 48] and of sugars with other compounds, like maltol[9, 48], mixtures of organic acids [1] etc.A'convenient term describing synergistic effects of two sugars in mixture and withmagnitude estimation is
Sa, b =k 3 (kl- Cm+k 2 . C)where S., b =mixture sweetness judgment (magnitude estimation)
Ca, Cb =concentrations of A and B in solutionk, n, m =constants
In this formula k3 is a constant accounting for synergistic effects. According to the lit-erature k3 amounts to 1.4 to 1.8 in many systems and describes satisfactorily synergisticeffects in several mixtures [27, 28].Glucose syrups, obtained by hydrolysis of starch are widely used in food products, andalthough they are individually less sweet than sucrose, no sweetness is lost when theyare mixed with sucrose in correct proportions due to synergistic effects [15].In recent years a good deal of research has been aimed at the preparation of newsweet-ening agents, many of them contain sugar moieties. However, these sweeteners willnot be discussed in this paper.In the past few years research has been concentrated on the interactions of sugars andpolysaccharides with non-volatile and volatile flavor compounds, which indirectlyhave an effect on flavor intensities of the mixtures.The binding of volatiles in systems rich in carbohydrates is complex. In model systemsof the composition flavor substance-sugar-water simple sugars produce an increase invapor pressure for a number of components, a marked decrease for others [8, 29, 30,49]. Polysaccharides are known to stabilize flavors. However, Maier [19] has shownthat cellulose has a relatively low adsorption and retention capacity. This can be ex-plained by the low mobility of the cellulose chain.
160
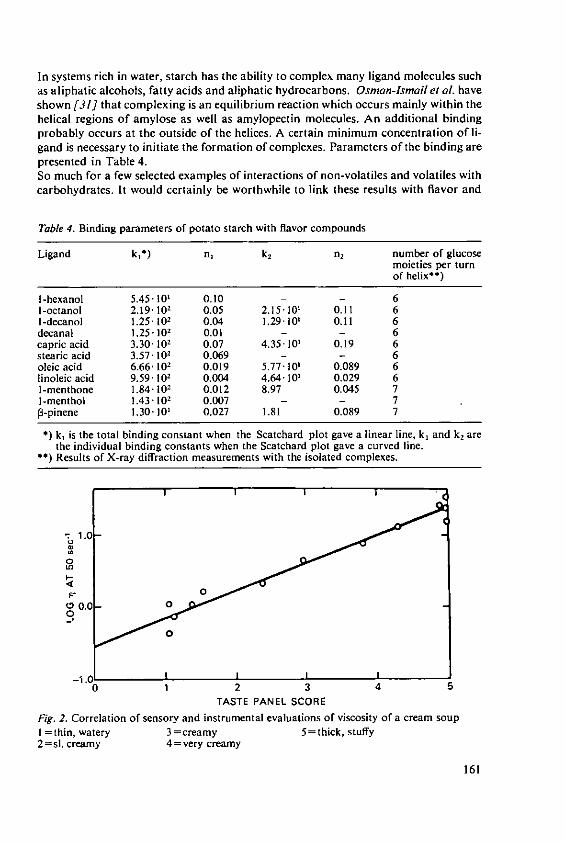
In systems rich in water, starch has the ability to complex many ligand molecules suchas aliphatic alcohols, fatty acids and aliphatic hydrocarbons. Osman-Ismailet a. haveshown [31] that complexing is an equilibrium reaction which occurs mainly within thehelical regions of amylose as well as amylopectin molecules. An additional bindingprobably occurs at the outside of the helices. A certain minimum concentration of li-gand is necessary to initiate the formation of complexes. Parameters of the binding arepresented in Table 4.So much for a few selected examples of interactions of non-volatiles and volatiles withcarbohydrates. It would certainly be worthwhile to link these results with flavor and
Table 4. Binding parameters of potato starch with flavor compounds
Ligand kl*) n, k, n2 number of glucosemoieties per turnof helix**)
l-hexanol 5.45-101 0.10 - 6I-octanol 2.19.102 0.05 2.15.10' 0.11 61-decanol 1.25.102 0.04 1.29.101 0.11 6decanal 1.25. 102 0.01 - - 6capric acid 3.30 102 0.07 4.35 l0' 0.19 6stearic acid 3.57 102 0.069 - - 6oleic acid 6.66.102 0.019 5.77-101 0.089 6linoleic acid 9.59"102 0.004 4.64.10' 0.029 61-menthone 1.84- 102 0.012 8.97 0.045 7]-menthol 1.43-102 0.007 - - 7P-pinene 1.30- 10 0.027 1.81 0.089 7
*) k, is the total binding constant when the Scatchard plot gave a linear line, k, and k2 arethe individual binding constants when the Scatchard plot gave a curved line.
*) Results of X-ray diffraction measurements with the isolated complexes.
1.00
020
00
-I.I I"0 1 2 3 4 5
TASTE PANEL SCORE
Fig. 2. Correlation of sensory and instrumental evaluations of viscosity of a cream soupI =thin, watery 3 =creamy 5 =thick, stuffy2 sl. creamy 4 =very creamy
161
odor intensity studies in hydrocolloid systems published recently by several authors[21, 32, 33, 46].Finally carbohydrates also have an influence on rheological properties of foods whichaffect mouthfeel and therefore the organoleptic properties of a whole food. Just as anexample the relationships between viscosity and sensory properties of a cream soup arepresented in Figure 2. In this example the concentration and state of dispersion ofstarch is the determining factor [50].
3. Lipids
Lipids consist of one or more of the following classes: free fatty acids, mono-, di-, andtriglycerides, phospholipids, sterols, plasmalogens and lipoproteins. Most lipids arehydrophobic, nonpolar materials, which exist naturally as liquids (oils) or solids (fats).Of the main classes of foodstuffs, it might be thought that lipids are the least importantfor their flavor effects. However, it will be shown that lipids perform as flavors per se,as flavor precursors, and as flavor carriers; moreover they modify flavor perception,including threshold concentration and retention [18].Glycerides and related compounds, which make up large parts of many fats and oilsare quite bland and do not contribute to organoleptic qualities.Free fatty acids which are generally formed by hydrolysis of glycerides are the most im-portant components contributing to flavors. Short chain fatty acids with less than10-12 carbon atoms are volatile and exert flavors. Generally, they have pK values be-tween pH 4 and 5 and are most potent at or below this range. Possible equilibria oflow-molecular weight fatty acids in emulsion as influenced by pH and the presence ofcations are presented in Table 5 [3].The nature of the medium in which compounds are dispersed affects the flavor percep-tion. Compounds of low polarity (long chain fatty acids) have low flavor thresholds inaqueous medium and high thresholds in oil, whereas more polar compounds (shortchain fatty acids) have lower flavor thresholds in oils and higher thresholds in water(Table 6) [35].Overall flavor impact is also influenced by the relative rates of partitioning of flavors.Many flavored foods are emulsions and the distribution and true flavor thresholds offlavors in such media are influenced by solubility and distribution of flavor consti-tuents.Extensive work has been done by Buttery et al. [7] on oil-water-mixtures, containingmodel flavor compounds. According to this work, the distribution of volatile flavorcompounds is governed solely by partition in a threephase system. A simple methodfor calculating the distribution between the different phases employs the following ex-pression:
Ka.FW/KW + F0 I/K 1
where Kam=air to vegetable oil-water mixture partition coefficientK, =air to water partition coefficientK., =air to oil partition coefficientF. =fraction of water in the mixtureF, =fraction of oil in the mixture
162
Table 5. Possible equilibria of low-molecular-weight fatty acids in a food emulsion as influ-enced by pH and the presence of cations
Equilib- Lipid Interface Aqueous pHrium phase phase
I. R-COOH -t R-COOH R-COOH <4
2. R-COOH = R-COO- - R-COO- >4-6
3. R-COOH = R-COONa 4- R-COONa >6
4. R-COOH R-COO- - (R-COO-)iCa >6
Table 6. Flavor threshold concentration of volatile fatty acids in water and oil
Threshold concentration (ppm)
Fatty acid Water Oil
Acetic C 2:0 ................................ 54 3aPropionic C 3:0 ................................ 22a -Butyric C 4:0 ............................... 7 0.6Hexanoic C 6:0 ................................ 5 3Octanoic C 8:0 ................................ 6 350Decanoic CI0:0 ................................ 4 200Dodecanoic C12:0 ................................ - 700
a Approximate
Table 7. Taste thresholds of free fatty acids in deodorized butter-oil-individual compoundsand mixtures
Fatty acid Individual Concentrations in ppmthreshold Fatty acid in mixture at the mixture threshold
1 II
C2 7.0 0.002 0.003C. 0.66 0.07 0.10C, 2.5 0.03 0.06C, 350 0.05 0.08C10 200 0.11 0.17C12 700 0.29 0.45
C-CI2 1,260 0.55 =mixture thresholdCI, 5,000 814C16 10,000 2,203Ct8 15,000 617C18:1 8,000 1,315Cr-CIa:, 39,260 5,000 =mixture threshold
Column I was a mixture through C, 2; column 11 contained all fatty acids listed.
163
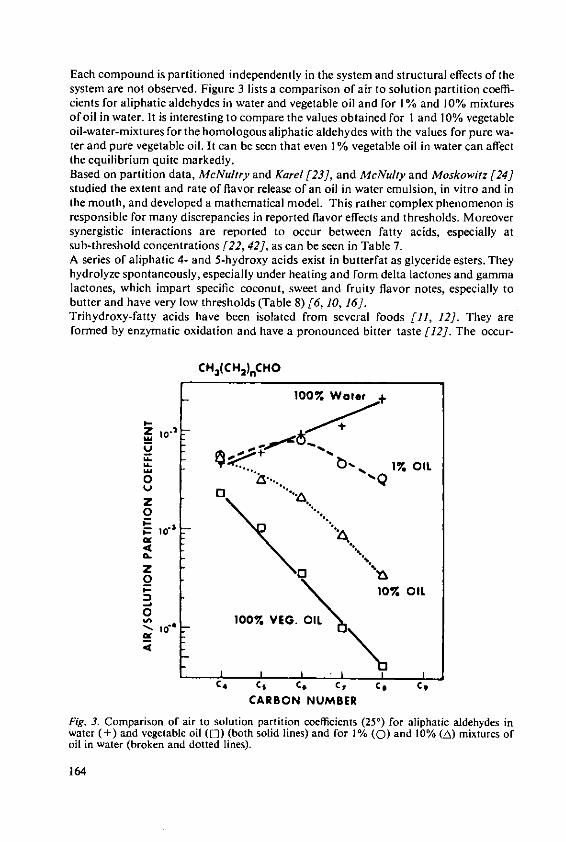
Each compound is partitioned independently in the system and structural effects of thesystem are not observed. Figure 3 lists a comparison of air to solution partition coeffi-cients for aliphatic aldehydes in water and vegetable oil and for 1% and 10% mixturesof oil in water. It is interesting to compare the values obtained for I and 10% vegetableoil-water-mixtures for the homologous aliphatic aldehydes with the values for pure wa-ter and pure vegetable oil. It can be seen that even 1% vegetable oil in water can affectthe equilibrium quite markedly.Based on partition data, McNultry and Karel [23], and McNulty and Moskowitz [24]studied the extent and rate of flavor release of an oil in water emulsion, in vitro and inthe mouth, and developed a mathematical model. This rather complex phenomenon isresponsible for many discrepancies in reported flavor effects and thresholds. Moreoversynergistic interactions are reported to occur between fatty acids, especially atsub-threshold concentrations [22, 42], as can be seen in Table 7.A series of aliphatic 4- and 5-hydroxy acids exist in butterfat as glyceride esters. Theyhydrolyze spontaneously, especially under heating and form delta lactones and gammalactones, which impart specific coconut, sweet and fruity flavor notes, especially tobutter and have very low thresholds (Table 8) [6, 10, 16].Trihydroxy-fatty acids have been isolated from several foods [11, 12]. They areformed by enzymatic oxidation and have a pronounced bitter taste [12]. The occur-
CH3 (CH2 ),CHO
100% Water +
Ztr2 +L.
1% OIL
0
- 10% OIL100% VEG. OIL
C. C, C' C, C' C9
CARBON NUMBER
Fig, 3. Comparison of air to solution partition coefficients (250) for aliphatic aldehydes inwater (+) and vegetable oil (La) (both solid lines) and for 1% (0) and 10% (_A) mixtures ofoil in water (broken and dotted lines).
164
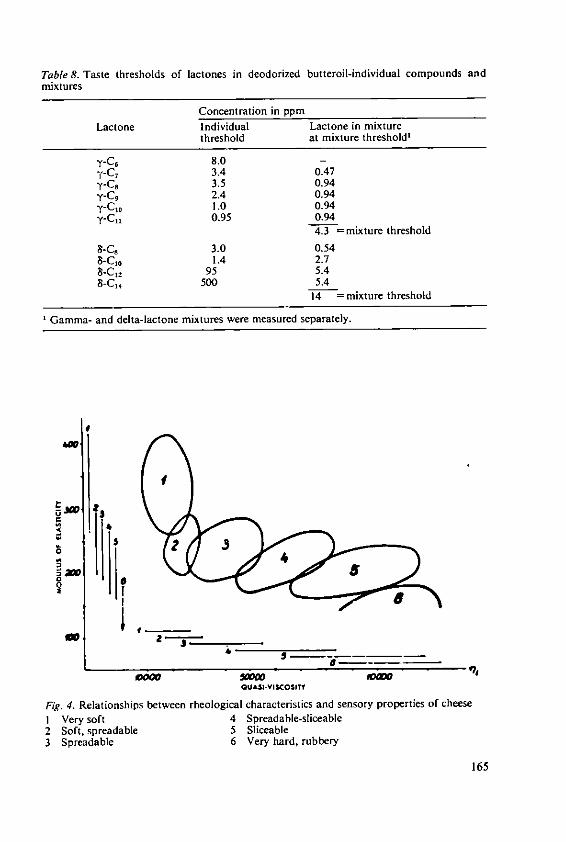
Table 8. Taste thresholds of lactones in deodorized butteroil-individual compounds andmixtures
Concentration in ppmLactone Individual Lactone in mixture
threshold at mixture threshold'
y-C 6 8.0 -y-C 7 3.4 0.47y-C, 3.5 0.94y-C, 2.4 0.94y-Clo 1.0 0.94y-CH 0.95 0.94
4.3 = mixture threshold
8-C, 3.0 0.54a-CO 1.4 2.78-C, 95 5.48-C'. 500 5.4
14 =mixture threshold
Gamma- and delta-lactone mixtures were measured separately.
0
of
QUASIVISCOSTY
Fig. 4. Relationships between rheological characteristics and sensory properties of cheeseI Very soft 4 Spreadable-sliceable2 Soft, spreadable 5 Sliceable3 Spreadable 6 Very hard, rubbery
165
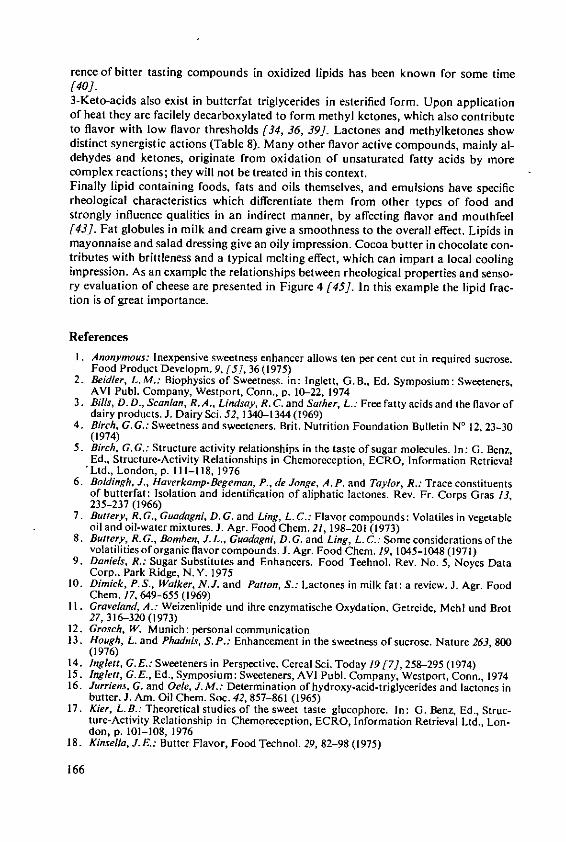
rence of bitter tasting compounds in oxidized lipids has been known for some time[40].3-Keto-acids also exist in butterfat triglycerides in esterifled form. Upon applicationof heat they are facilely decarboxylated to form methyl ketones, which also contributeto flavor with low flavor thresholds [34, 36, 39]. Lactones and methylketones showdistinct synergistic actions (Table 8). Many other flavor active compounds, mainly al-dehydes and ketones, originate from oxidation of unsaturated fatty acids by morecomplex reactions; they will not be treated in this context.Finally lipid containing foods, fats and oils themselves, and emulsions have specificrheological characteristics which differentiate them from other types of food andstrongly influence qualities in an indirect manner, by affecting flavor and mouthfeel[43]. Fat globules in milk and cream give a smoothness to the overall effect. Lipids inmayonnaise and salad dressing give an oily impression. Cocoa butter in chocolate con-tributes with brittleness and a typical melting effect, which can impart a local coolingimpression. As an example the relationships between rheological properties and senso-ry evaluation of cheese are presented in Figure 4 [45]. In this example the lipid frac-tion is of great importance.
References1. Anonymous: Inexpensive sweetness enhancer allows ten per cent cut in required sucrose.
Food Product Developm. 9, [5, 36 (1975)2. Beidler, L.M.: Biophysics of Sweetness. in: Inglett, G.B., Ed. Symposium: Sweeteners,
AVI Pub]. Company, Westport, Conn., p. 10-22, 19743. Bills, D. D., Scanlan, R.A., Lindsay, R. C. and Sather, L.: Free fatty acids and the flavor of
dairy products. J. Dairy Sci. 52, 1340-1344 (1969)4. Birch, G.G.: Sweetness and sweeteners. Brit. Nutrition Foundation Bulletin No 12, 23-30
(1974)5. Birch, G.G.: Structure activity relationships in the taste of sugar molecules. In: G. Benz,
Ed., Structure-Activity Relationships in Chemoreception, ECRO, Information Retrieval'Ltd., London, p. 111-118, 1976
6. Boldingh, J., Haverkamp-Begeman, P., de Jonge, A.P. and Taylor, R.: Trace constituentsof butterfat: Isolation and identification of aliphatic lactones. Rev. Fr. Corps Gras 13,235-237 (1966)
7. Buttery, R.G., Guadagni, D. G. and Ling, L.C.: Flavor compounds: Volatiles in vegetableoil and oil-water mixtures. J. Agr. Food Chem. 21, 198-201 (1973)
8. Buttery, R. G., Bomben, J.L., Guadagni, D.G. and Ling, L. C.: Some considerations of thevolatilities of organic flavor compounds. J. Agr. Food Chem. 19, 1045-1048 (1971)
9. Daniels, R.: Sugar Substitutes and Enhancers. Food Technol. Rev. No. 5, Noyes DataCorp., Park Ridge, N.Y. 1975
10. Dimick, P.S., Walker, N.J. and Patton, S.: Lactones in milk fat: a review. J. Agr. FoodChem. 17, 649-655 (1969)
I1. Graveland, A.: Weizenlipide und ihre enzymatische Oxydation. Getreide, Mehl und Brot27, 316-320 (1973)
12. Grosch, W. Munich: personal communication13. Hough, L. and Phadnis, S.P.: Enhancement in the sweetness of sucrose. Nature 263, 800
(1976)14. Inglett, G.E.: Sweeteners in Perspective. Cereal Sci. Today 19 [7, 258-295 (1974)15. Inglet, G.E., Ed., Symposium: Sweeteners, AVI Publ. Company, Westport, Conn., 197416. Jurriens, G. and Oele, J.M.: Determination of hydroxy-acid-triglycerides and lactones in
butter. J. Am. Oil Chem. Soc. 42, 857-861 (1965)17. Kier, L.B.: Theoretical studies of the sweet taste glucophore. In: G. Benz, Ed., Struc-
ture-Activity Relationship in Chemoreception, ECRO, Information Retrieval Ltd., Lon-don, p. 101-108, 1976
18. Kinsella, J.E.: Butter Flavor, Food Technol. 29, 82-98 (1975)
166
19. Maier, H.G.: Bindung flFichtiger Aromastoffe an Lebensmitteln. Lebensm. Wiss. Tech-nol. 5, 1-6 (1972)
20. Markwalder, H. U., Scheffeldt, P. and Neukom, H.: Oxidation of linoleic acid by lipoxy-genase in flour water systems. Lebensm. Wiss. Technol. 8, 234-235 (1975)
21. Marshall, S. G. and Vaisey, M.: Sweetness perception in relation to some textural charac-teristics of hydrocolloid gels. J. Texture Studies 3, 173-185 (1972)
22. McDaniel, M.R., Sather, L. and Lindsay, R.C.: Influence of free fatty acids on sweetcream butter flavor. J. Food Sci. 34, 251-254 (1969)
23. McNulty, P.B. and Karel, M.: Factors affecting flavor release and uptake in OW emul-sions. J. Food Technol. 8,309-318, 319-331,415-427 (1973)
24. McNulty, P.B. and Moskowitz, H. R.: Intensity-time curves for flavored oil-in-wateremulsions. J. Food Sci. 39,55-57 (1974)
25. Moskowitz, H.R.: Ratio scales of sugar sweetness. Percept. and Psychophys. 7, 315-320(1970)
26. Moskowitz, H.R.: Sweetness and intensity of artificial sweeteners. Percept. and Psycho-phys. 8, 40-42 (1970)
27. Moskowitz, H. R. and Wehrly, T.: Economic applications of sweetener scales. J. Food Sci.37,411-15 (1972)
28. Moskowitz, H.R.: Models of sweetness additivity. J. Exp. Psychol. 99, 88-98(1973)29. Nawar, W. W.: Some variables affecting composition of headspace aroma. J. Agr. Food
Chem. 19, 1057-1059 (1971)30. Nawar, W. W.: Considerations in interpretation of direct headspace GC analyses of food
volatiles. Food Technol. 20, 213-215 (1966)31. Osman-Ismail, F. and Saints, J.: Interaction of potatostarch with different ligands. Stdirke
24, 213-216 (1972)32. Pangborn, R.M. and Szczesniak, A.S.: Effect of hydrocolloids and viscosity on aromatic
flavor compounds. J. Texture Studies 4, 467-482 (1974)33. Pangborn, R.M., Trabue, 1M. and Szczesniak, A.S.: Effect of hydrocolloids on oral vis-
cosity and basic taste intensities. J. Texture Studies 4, 224-241 (1973)34. Parks, 0. W.: Milk flavor. In: H.W. Schultz, E.A. Day and L. M. Libby, Eds., Chemistry
and Physiology of Flavors, AVI Publ. Company, Westport, Conn., p. 296-314,196735. Patton, S.: Flavor thresholds of volatile fatty acids. J. Food Sci. 29,679-680(1964)36. Patton, S. and Tharp, B. W.: Formation of methyl ketones from milk fat during steam dis-
tillation or saponification. J. Dairy Sci. 42, 49-55 (1959)37. Pilnik, W.: Food Additives. Gordian 73, 208-214 (1973)38. Raunhardt, 0. and Escher, F.: Eds., Sensorische Erfassung und Beurteilung von Lebens-
mitteln. Forster Verlag, Zurich, 197739. Schwartz, D.P., Parks, 0. W. and Yoncoskie, W.: Quantitative studies on methyl ketone
formation in butteroil: Effect of temperature. J. Am. Oil Chem. Soc. 43, 128-132 (1966)40. Sessa, D.J., Warner, K. and Honig, D.H.: Soybean phosphatidylcholine develops bitter
taste on autoxidation. J. Food Sci. 39, 69-72 (1974)41. Shallenberger, R.S. and Lindley, M.G.: A lipophilic-hydrophobic attribute and compo-
nent in the stereochemistry of sweetness. Food Chem. 2, 145-153 (1977)42. Sick, T.J., Albin, I.A., Sather, L.A. and Lindsay, R.C.: Taste thresholds of butter vola-
tiles in deodorized butteroil medium. J. Food Sci. 34, 265-267 (1969)43. Sons, J., Ed., Fette als funktionelle Bestandteile von Lebensmitteln. Forster Verlag,
Zurich, 197344. Stevens, S.S.: Sensory scales of taste intensity. Percept. and Psychophys. 6, 302-308
(1969)45. Szabo, G., in Proceedings, Third Int. Congress Food Science and Technology, Washing-
ton, p. 434, 197046. Vaisey, M., Brunon, R. and Cooper, J.: Some sensory effects of hydrocolloid sols on sweet-
ness. J. Food Sci. 34, 397-400 (1969)47. Vaisey, M. and Moskowitz, H.: Sensory Response to Food. A Workshop, Zurich, in Press48. Van Eijk, A.: Organoleptische Probleme beim Austausch von Zuckern durch Zuckerer-
satzstoffe in Lebensmitteln. Gordian 73, 44-49 (1973)49. Wienijes, A. G.: Influence ofsugar concentrations on the vapor pressure of food odor vola-
tiles in aqueous solutions. J. Food Sci. 33, 1-2 (1968)50. Wood, F. W.: in: Society of Chemical Industry, Rheology and Texture of Foodstuffs.
S.C.I. Monograph No. 27, p. 40 (1968)
167
Co-ordinator's Report on the Third Session
Dr. G. W. Cooke, Agricultural Research Council, London; Chairman of the 13th IPI-Collo-quium; Member of the Scientific Board of the International Potash Institute
This session was unusual in the organisation of our Colloquia. We discussed threesubjects that are very relevant to the production and use of carbohydrates and lipidsbut which are nearer to food and nutrition science than to agriculture. These concernedfirstly the amounts of energy foods (calories) that are essential for people, secondly therole of essential fatty acids, and thirdly organoleptic qualities of carbohydrates andlipids.The first subject was discussed by Dr. Klatzmann in an interesting and lively fashion.He described the uncertainty attached to present estimates of dietary needs expressedin FAO data; these can vary, for no clear reasons, from over 3000 calories for men intemperate countries to only two-thirds as much for adults in developing countries.Need was defined as the level of consumption which allowed an individual to maintainhimself in good health and to indulge in normal physical and intellectual activity. Thisneed for food was considerably more than the smaller quantities needed to keep peoplealive on famine rations. Need in this sense varies with age, sex and occupation and,within any class, from individual to individual. Further uncertainty is introducedbecause there is always waste of food produced by farmers, and further waste by theconsumer. Therefore food produced, or food purchased, is not the same as food eaten.Dr. Klatzmann spoke of the factors affecting food need - sex, age, weight, activity andclimate and discussed the estimates made by individuals and expert bodies. No betterconclusion seemed possible than that for an adult average man 3200-3300 calorieswas too much and that 1500 calories were too little but that many millions in the worldhad no more than the lower figure.Clearly this is an unsatisfactory situation, particularly as we are so much better inform-ed on the nutritional needs of farm animals. Laboratory and calorimetry measurementsare very helpful for research on farm animals but to evaluate a man's needs he must bestudied in practical daily life in his own environment; a table of dietary requirementsmust take all individual and environmental factors into account if it is to be of any use.In the discussion attention was drawn to the changes that have taken place in proteinstandards; daily requirements used to be reckoned as more than 70 grammes of goodquality protein per person, now 40 grammes was said to be enough. We consideredthat further study of energy requirements, and of the balance between carbohydrates,lipids and proteins, was desirable. In particular studies were needed on the environ-
169
mental and individual factors which interact to cause large variations in the energyneeds of real people.Dr. Crawford discussed the essential role of certain lipids in nutrition. He first distin-guished between invisible structural fats in muscle and the visible storage fats. He thenwent on to show that the polyunsaturated fatty acids (PUFA) - linoleic and a-linolenicacids were essential for growth and reproduction in animals and man. These essentialfatty acids (EFA) are components of structural lipids which are built with phospho-lipids and cholesterol; they are specific to different purposes in the body and changelittle with diet. By contrast the storage fats are mainly triglycerides; they readilychange in composition with diet and are non-essential.The metabolism of the essential fatty acids was further discussed. They have structuralfunctions but also give rise to substances of high physiological activity. Desaturationand carbon-chain elongation leads to substances that are important in membranesystems, the nervous and vascular system, and in platelet formation; they include theprostaglandins.We cannot equate the growth of man and animals. In man, much time is taken todevelop the brain and elaborate nervous and vascular systems. The materials derivedfrom essential polyunsaturated fatty acids have an essential part in these developmentsduring growth. The possible role of unsaturated acid derivatives in arterial disease inadults was then discussed. Several prostaglandins appear to be involved; one controlsthe tendency of blood to clot, two others interact to control the tendency of plateletsto stick together; yet a fourth prostaglandin, recently discovered, is thought to preventplatelets adhering to the artery wall. The effectiveness of the amount of linolenic acidin the diet in suppressing aggregation increases up to about 12-14% of the totalenergy intake. This is some of the background of current interest in the role of PUFAin heart disease.The possible effects of excessive consumption of saturated fats were described - theycompete with and obstruct the functions of EFA. Carbohydrates, which are convertedto fat, may have the same effect. Dr. Crawford also mentioned the interactions ofPUFA nutrition with hormones and protein intake. Finally he discussed the correctbalance of PUFA for optimum development. In all dietary discussions we should beconcerned with optima, to provide the best conditions, norwith minima for survival;these optimum requirement (for PUFA) will vary through interactions with otherdietary constituents.Questions of needs are further complicated by the ability of animals to carry out acertain amount of synthesis of EFA; here the problem is different from protein defi-ciencies where one amino acid is deficient. While agronomists at the session weredisappointed that no standards could be given, they agreed that the questions discussedwere of great importance and that further information on the contribution of agricul-tural products to PUFA in diet should be accumulated.Professor Solms discussed the organoleptic qualities of carbohydrates and lipids. Theyare concerned with taste, flavour and physical (rheological) characteristics. Factorsaffecting the sweetness of sugars were discussed, particularly the synergistic effects oftheir mixtures. Professor Solms then went on to deal with the interactions on flavourof non-volatile and volatile materials with carbohydrates. Carbohydrates also affectthose rheological properties of food which influence the sensations of eating; type ofcarbohydrate, concentration and state of dispersion were all important factors.Lipids have flavours of their own, they also act as precursors of flavour and as carriers,
170
they modify other flavours. Much research has been done on systems involving lipid,aqueous and vapour phases; mathematical models for these complex phenomena havebeen developed and these were discussed by Professor So/ms. Lipids also have verypronounced effects on rheological properties of food, for example in cheese; theyinfluence both the flavour of foods and the sensations of eating in ways which othercomponents of food do not. Fat globules in foods such as milk, cream and saladdressing give the typical smooth feeling which makes these materials so acceptable andhelps to make other foods more palatable.The whole subject is extremely complicated, but fascinating and important. Palatability,meaning that foods both feel good, and taste good, is essential to the satisfactorymarketing of agricultural produce. It is even more important that foods offered toinfants and young children should be pleasant to eat so that they may consume enoughof the right kinds of food for optimum growth and development. The subjects ofindustrial preparation of packaged foods, the substitution of novel materials fortraditional foodstuffs (for example soya protein used as a substitute for meat), andthe production of foodstuffs which were satisfactory in transport and storage were alldiscussed. Modern processing and marketing practices affect quality of food offeredand there was some criticism that industrial and marketing needs sometimes lead toless satisfactory flavour in food.In accepting some of these criticisms Professor Sohns said that undoubtedly, in future,'technology would do better'. It was also agreed that the use of fertilizers need haveno deleterious effect on the flavour and texture of foodstuffs.
171
4th Session
Effects of Fertilizers on theProduction of CarbohydratesCo-ordinator: Dr. Th. Walsh,
Director, The Agricultural Institute of Ireland,Dublin/Ireland; Member of the Scientific Boardof the International Potash Institute
The Effects of Production Conditions andPost-Harvest Treatments of Plants on theComposition and Nutritive Value ofCarbohydrates in Animal FeedingChristiane Mercier*, A. Aumaitre** et P. Thivend***, Maitres de Recherches, Institut Natio-nal de ]a Recherche Agronomique (INRA)/France
Summary
The carbohydrate composition of various plants, cereals, tubers, legume seeds, oilseeds andforages used for animal feed has been classified into cytoplasmic (oligosaccharides, fructosansand starch) and cell-wall carbohydrates (cellulose, hemicelluloses and pentosans). Factorswhich modify the contents and the composition of the carbohydrates have been reviewed anddivided into:1) parameters related to the production of the plant, such as stage of growth, fertilizers, cli-matic conditions and variety;2) parameters related to different post-harvest treatments of the plant, such as ensiling, pre-storage, drying, pelleting, steam-flaking, and extrusion.The nutritive value of carbohydrates from cereals has been studied with monogastric animals(rat, piglet, chicken) and from cereals and forages with polygastric animals (cattle, sheep,goat). Results on Digestible Energy (D. E.) content, feed efficiency and Protein Efficiency Ra-tio (P.E. R.) are reported in relationship to biochemical modification of the carbohydratefraction. The variations in the carbohydrate composition (alcohol soluble sugars, starch con-tent) of grain or grasses after technological treatments were measured. The a-amylase contentand the behaviour of starch during in vitro hydrolysis was measured mainly in maize kernels.
1. Introduction
Carbohydrates constitute the main source of energy for animals. They are provided bygrains (cereals) and tubers (potatoes) for human and monogastric feeding and by for-ages for ruminant (Table 1).The cytoplasmic polysaccharides of grains (cereals and legumes) and tubers are mainlystarch. Glucose, fructose, sucrose and raffinose are the oligosaccharides present at alower level. In case of legumes and oilseeds, the oligosaccharide content is higher due
* Centre de Recherches de Nantes, Laboratoire de Biochimie des Aliments, chemin de ]aG(raudi6re, F44072 Nantes Cedex/FranceCentre National de Recherches Zootechniques, Station de Recherches sur I'Elevage desPorcs, Domaine de Vilvert, F 78350 Jouy-en-Josas/FranceCentre de Recherches Zootechniques et Vtrinaires, Station de Recherches sur 'Elevagedes Ruminants, Theix, F631 10 Beaumont/France
175
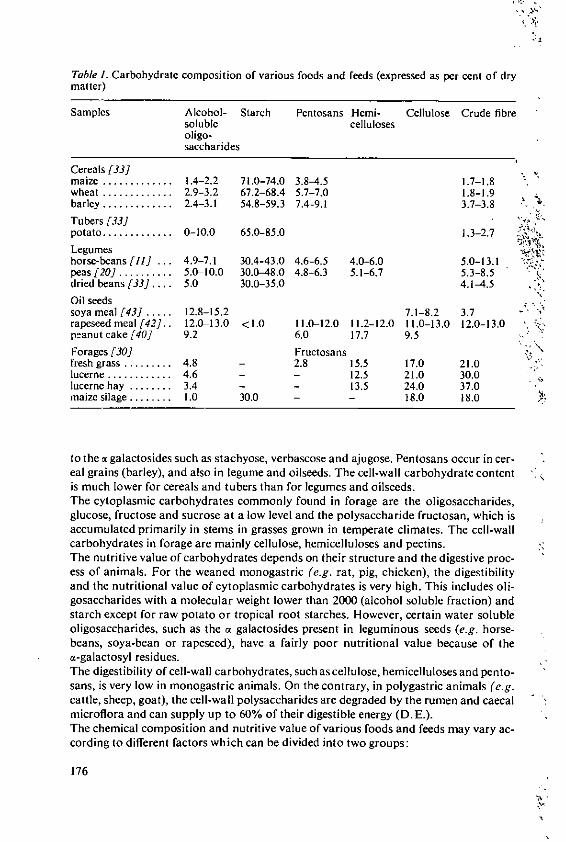
Table 1. Carbohydrate composition of various foods and feeds (expressed as per cent of drymatter)
Samples Alcohol- Starch Pentosans Hemi- Cellulose Crude fibresoluble cellulosesoligo-saccharides
Cereals [33]maize ............. 1.4-2.2 71.0-74.0 3.8-4.5 1.7-1.8wheat ............. 2.9-3.2 67.2-68.4 5.7-7.0 1.8-1.9barley ............. 2.4-3.1 54.8-59.3 7.4-9.1 3.7-3.8Tubers [33]potato ............ 0-10.0 65.0-85.0 1.3-2.7 •
Legumes -'-horse-beans [11] ... 4.9-7.1 30.4-43.0 4.6-6.5 4.0-6.0 5.0-13.1peas [20] .......... 5.0-10.0 30.0-48.0 4.8-6.3 5.1-6.7 5.3-8.5dried beans [33] .... 5.0 30.0-35.0 4.1-4.5Oil seedssoya meal [43] ..... 12.8-15.2 7.1-8.2 3.7rapeseed meal [42].. 12.0-13.0 <1.0 11.0-12.0 11.2-12.0 11.0-13.0 12.0-13.0peanut cake [40] 9.2 6.0 17.7 9.5
Forages [30] Fructosansfresh grass ......... 4.8 2.8 15.5 17.0 21.0lucerne ............ 4.6 - 12.5 21.0 30.0lucerne hay ........ 3.4 - 13.5 24.0 37.0maize silage ........ 1.0 30.0 - 18.0 18.0
to the a galactosides such as stachyose, verbascose and ajugose. Pentosans occur in cer-eal grains (barley), and also in legume and oilseeds. The cell-wall carbohydrate contentis much lower for cereals and tubers than for legumes and oilseeds.The cytoplasmic carbohydrates commonly found in forage are the oligosaccharides,glucose, fructose and sucrose at a low level and the polysaccharide fructosan, which isaccumulated primarily in stems in grasses grown in temperate climates. The cell-wallcarbohydrates in forage are mainly cellulose, hemicelluloses and pectins.The nutritive value of carbohydrates depends on their structure and the digestive proc-ess of animals. For the weaned monogastric (e.g. rat, pig, chicken), the digestibilityand the nutritional value of cytoplasmic carbohydrates is very high. This includes oli-gosaccharides with a molecular weight lower than 2000 (alcohol soluble fraction) andstarch except for raw potato or tropical root starches. However, certain water solubleoligosaccharides, such as the a galactosides present in leguminous seeds (e.g. horse-beans, soya-bean or rapeseed), have a fairly poor nutritional value because of thea-galactosyl residues.The digestibility of cell-wall carbohydrates, such as cellulose, hemicelluloses and pento-sans, is very low in monogastric animals. On the contrary, in polygastric animals (e.g.cattle, sheep, goat), the cell-wall polysaccharides are degraded by the rumen and caecalmicroflora and can supply up to 60% of their digestible energy (D. E.).The chemical composition and nutritive value of various foods and feeds may vary ac-cording to different factors which can be divided into two groups:
176
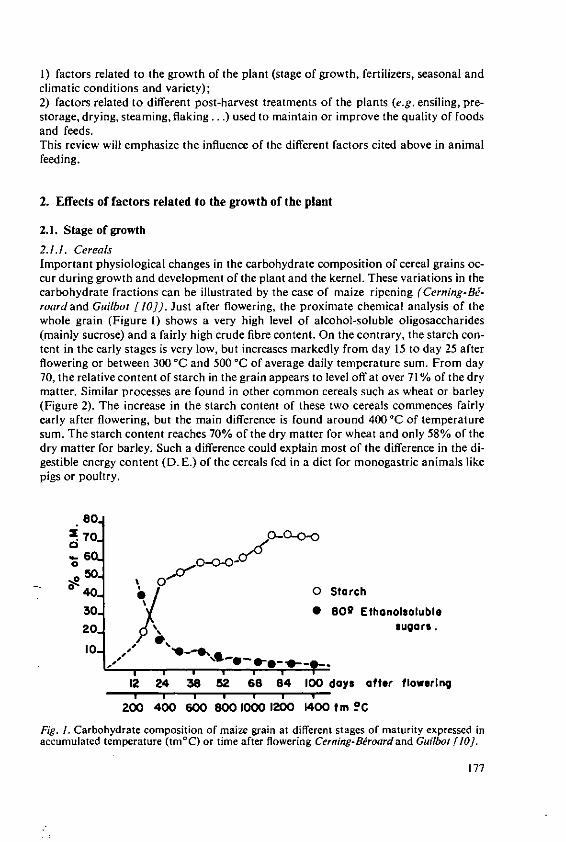
1) factors related to the growth of the plant (stage of growth, fertilizers, seasonal andclimatic conditions and variety);2) factors related to different post-harvest treatments of the plants (e.g. ensiling, pre-storage, drying, steaming, flaking.. .) used to maintain or improve the quality of foodsand feeds.This review will emphasize the influence of the different factors cited above in animalfeeding.
2. Effects of factors related to the growth of the plant
2.1. Stage of growth
2.1.1. CerealsImportant physiological changes in the carbohydrate composition of cereal grains oc-cur during growth and development of the plant and the kernel. These variations in thecarbohydrate fractions can be illustrated by the case of maize ripening (Cerning-Bi-roard and Guilbor [10]). Just after flowering, the proximate chemical analysis of thewhole grain (Figure 1) shows a very high level of alcohol-soluble oligosaccharides(mainly sucrose) and a fairly high crude fibre content. On the contrary, the starch con-tent in the early stages is very low, but increases markedly from day 15 to day 25 afterflowering or between 300 °C and 500 'C of average daily temperature sum. From day70, the relative content of starch in the grain appears to level off at over 71% of the drymatter. Similar processes are found in other common cereals such as wheat or barley(Figure 2). The increase in the starch content of these two cereals commences fairlyearly after flowering, but the main difference is found around 400 "C of temperaturesum. The starch content reaches 70% of the dry matter for wheat and only 58% of thedry matter for barley. Such a difference could explain most of the difference in the di-gestible energy content (D. E.) of the cereals fed in a diet for monogastric animals likepigs or poultry.
80.
c -6---
0-a 0 / O Starch
30 0 802 Ethanolsoluble
20 sugars.
12 24 38 52 68 84 100 days after flowering
200 400 600 8001000 12o 1400 tm ?
Fig. I. Carbohydrate composition of maize grain at different stages of maturity expressed inaccumulated temperature (tmC) or time after flowering Cerning-Broardand Guilbot [10].
177
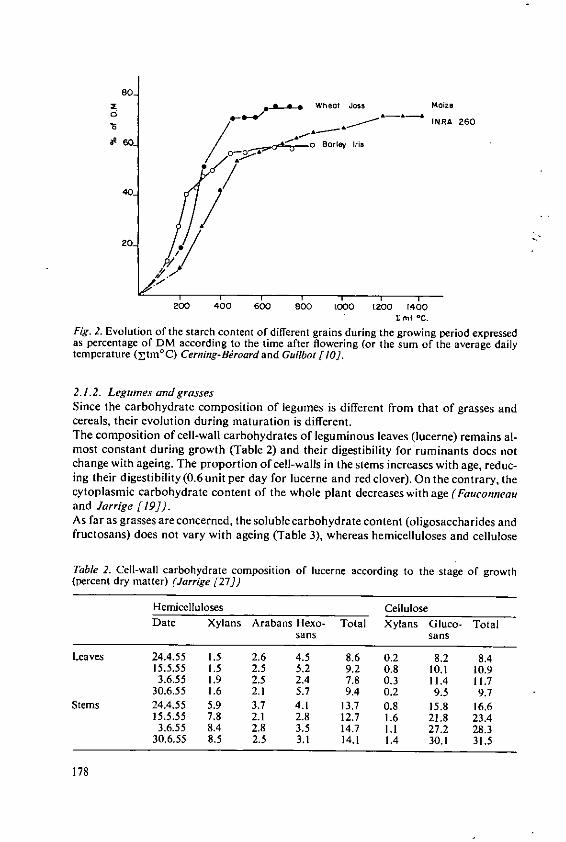
80_
o- 6 _ ft W h e 0 t J o s s M iz .
-.- INRA 260
..Rc 4 - --- o Baley Itis/40. ! //,
20 a
200 400 600 8t L00 10 00 120 400Int °C.
Fig. 2. Evolution of the starch content of different grains during the growing period expressedas percentage of DM according to the time after flowering (or the sum of the average dailytemperature (ztm0 C) Cerning-Broard and Guilbot [/1.
2.1.2. Legwnes andgrassesSince the carbohydrate composition of legumes is different from that of grasses andcereals, their evolution during maturation is different.The composition of cell-wall carbohydrates of leguminous leaves (lucerne) remains al-most constant during growth (Table 2) and their digestibility for ruminants does notchange with ageing. The proportion of cell-walls in the stems increases with age, reduc-ing their digestibility (0.6 unit per day for lucerne and red clover). On the contrary, thecytoplasmic carbohydrate content of the whole plant decreases with age (Fauconneauand Jarrige [19]).As far as grasses are concerned, the soluble carbohydrate content (oligosaccharides andfructosans) does not vary with ageing (Table 3), whereas hemicelluloses and cellulose
Table 2. Cell-wall carbohydrate composition of lucerne according to the stage of growth(percent dry matter) (Jarrige [27])
Hemicelluloses CelluloseDate Xylans Arabans Hexo- Total Xylans Gluco- Total
sans sans
Leaves 24.4.55 1.5 2.6 4.5 8.6 0.2 8.2 8.415.5.55 1.5 2.5 5.2 9.2 0.8 10.1 10.93.6.55 1.9 2.5 2.4 7.8 0.3 11.4 11.7
30.6.55 1.6 2.1 5.7 9.4 0.2 9.5 9.7Stems 24.4.55 5.9 3.7 4.1 13.7 0.8 15.8 16.6
15.5.55 7.8 2.1 2.8 12.7 1.6 21.8 23.43.6.55 8.4 2.8 3.5 14.7 1.1 27.2 28.3
30.6.55 8.5 2.5 3.1 14.1 1.4 30.1 31.5
178
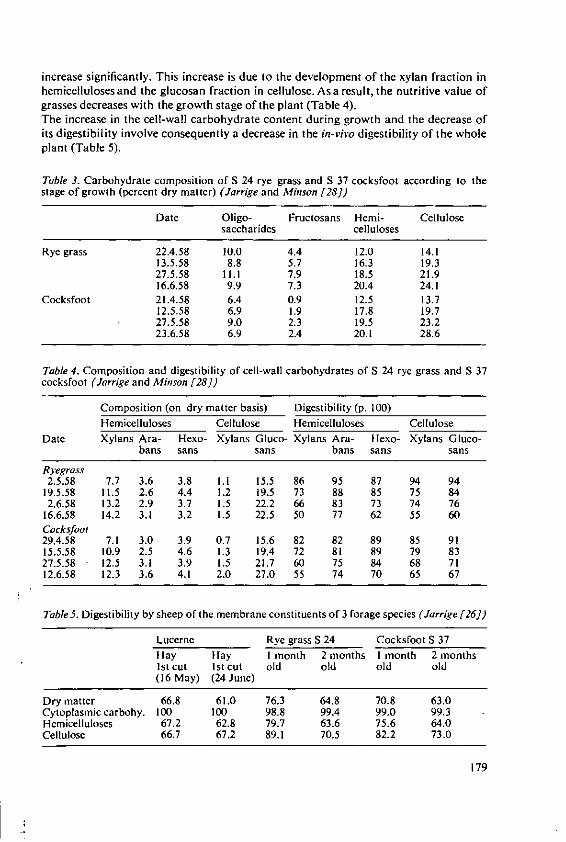
increase significantly. This increase is due to the development of the xylan fraction inhemicelluloses and the glucosan fraction in cellulose. Asa result, the nutritive value ofgrasses decreases with the growth stage of the plant (Table 4).The increase in the cell-wall carbohydrate content during growth and the decrease ofits digestibility involve consequently a decrease in the in-vivo digestibility of the wholeplant (Table 5).
Table 3. Carbohydrate composition of S 24 rye grass and S 37 cocksfoot according to thestage of growth (percent dry matter) (Jarrige and Minson [28])
Date Oligo- Fructosans Hemi- Cellulosesaccharides celluloses
Rye grass 22.4.58 10.0 4.4 12.0 14.113.5.58 8.8 5.7 16.3 19.327.5.58 11.1 7.9 18.5 21.916.6.58 9.9 7.3 20.4 24.1
Cocksfoot 21.4.58 6.4 0.9 12.5 13.712.5.58 6.9 1.9 17.8 19.727.5.58 9.0 2.3 19.5 23.223.6.58 6.9 2.4 20.1 28.6
Table 4. Composition and digestibility of cell-wall carbohydrates of S 24 rye grass and S 37cocksfoot (Jarrige and Minson [28])
Composition (on dry matter basis) Digestibility (p. 100)Hemicelluloses Cellulose Hemicelluloses Cellulose
Date Xylans Ara- Hexo- Xylans Gluco- Xylans Ara- Hexo- Xylans Gluco-bans sans sans bans sans sans
Ryegrass2.5.58 7.7 3.6 3.8 1.1 15.5 86 95 87 94 94
19.5.58 11.5 2.6 4.4 1.2 19.5 73 88 85 75 842.6.58 13.2 2.9 3.7 1.5 22.2 66 83 73 74 76
16.6.58 14.2 3.1 3.2 1.5 22.5 50 77 62 55 60Cocksfoot29.4.58 7.1 3.0 3.9 0.7 15.6 82 82 89 85 9115.5.58 10.9 2.5 4.6 1.3 19.4 72 81 89 79 8327.5.58 12.5 3.1 3.9 1.5 21.7 60 75 84 68 7112.6.58 12.3 3.6 4.1 2.0 27.0 55 74 70 65 67
Table 5. Digestibility by sheep of the membrane constituents of 3 forage species (Jarrige [26])
Lucerne Rye grass S 24 Cocksfoot S 37Hay Hay I month 2 months I month 2 months1st cut Ist cut old old old old(16 May) (24 June)
Dry matter 66.8 61.0 76.3 64.8 70.8 63.0Cytoplasmic carbohy. 100 100 98.8 99.4 99.0 99.3Hemicelluloses 67.2 62.8 79.7 63.6 75.6 64.0Cellulose 66.7 67.2 89.1 70.5 82.2 73.0
179
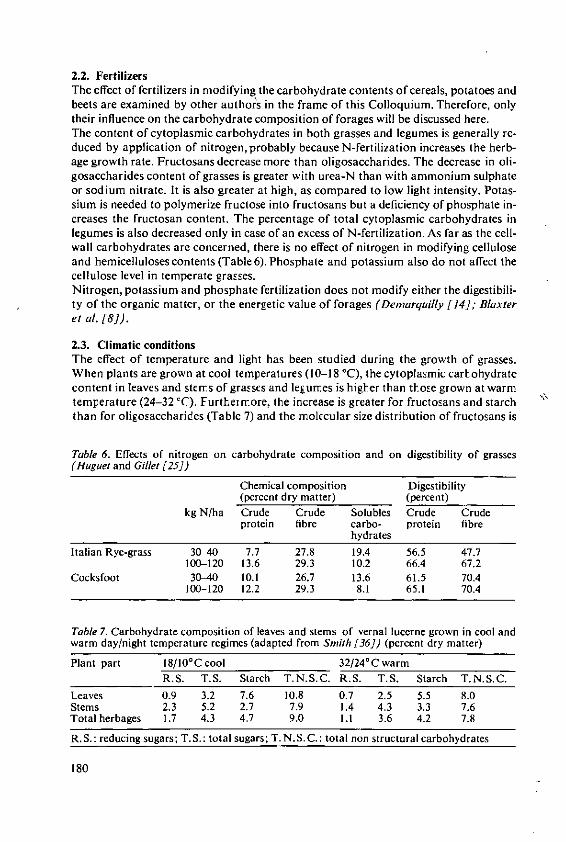
2.2. FertilizersThe effect of fertilizers in modifying the carbohydrate contents of cereals, potatoes andbeets are examined by other authors in the frame of this Colloquium. Therefore, onlytheir influence on the carbohydrate composition of forages will be discussed here.The content of cytoplasmic carbohydrates in both grasses and legumes is generally re-duced by application of nitrogen,probably because N-fertilization increases the herb-age growth rate. Fructosans decrease more than oligosaccharides. The decrease in oli-gosaccharides content of grasses is greater with urea-N than with ammonium sulphateor sodium nitrate. It is also greater at high, as compared to low light intensity. Potas-sium is needed to polymerize fructose into fructosans but a deficiency of phosphate in-creases the fructosan content. The percentage of total cytoplasmic carbohydrates inlegumes is also decreased only in case of an excess of N-fertilization. As far as the cell-wall carbohydrates are concerned, there is no effect of nitrogen in modifying celluloseand hemicelluloses contents (Table 6). Phosphate and potassium also do not affect thecellulose level in temperate grasses.Nitrogen, potassium and phosphate fertilization does not modify either the digestibili-ty of the organic matter, or the energetic value of forages (Demnarquilly [14]; Blaxteret al. [8]).
2.3. Climatic conditionsThe effect of temperature and light has been studied during the growth of grasses.When plants are grown at cool temperatures (10-18 'C), the cytoplasmic cartohydratecontent in leaves and sterns of grasses and legumes is high~er than those grown at warmtemperature (24-32 'C). Furtherr. ore, the increase is greater for fructosans and starchthan for oligosaccharides (Table 7) and the molecular size distribution of fructosans is
Table 6. Effects of nitrogen on carbohydrate composition and on digestibility of grasses(Huguet and Gillet [25])
Chemical composition Digestibility(percent dry matter) (percent)
kg N/ha Crude Crude Solubles Crude Crudeprotein fibre carbo- protein fibre
hydratesItalian Rye-grass 30-40 7.7 27.8 19.4 56.5 47.7
100-120 13.6 29.3 10.2 66.4 67.2Cocksfoot 30-40 10.1 26.7 13.6 61.5 70.4
100-120 12.2 29.3 8.1 65.1 70.4
Table 7. Carbohydrate composition of leaves and stems of vernal lucerne grown in cool andwarm day/night temperature regimes (adapted from Smith [36]) (percent dry matter)
Plant part 18/10°C cool 32/24°C warmR.S. T.S. Starch T.N.S.C. R.S. T.S. Starch T.N.S.C.
Leaves 0.9 3.2 7.6 10.8 0.7 2.5 5.5 8.0Stems 2.3 5.2 2.7 7.9 1.4 4.3 3.3 7.6Total herbages 1.7 4.3 4.7 9.0 1.1 3.6 4.2 7.8
R.S.: reducing sugars; T.S.: total sugars; T. N.S.C.: total non structural carbohydrates
180
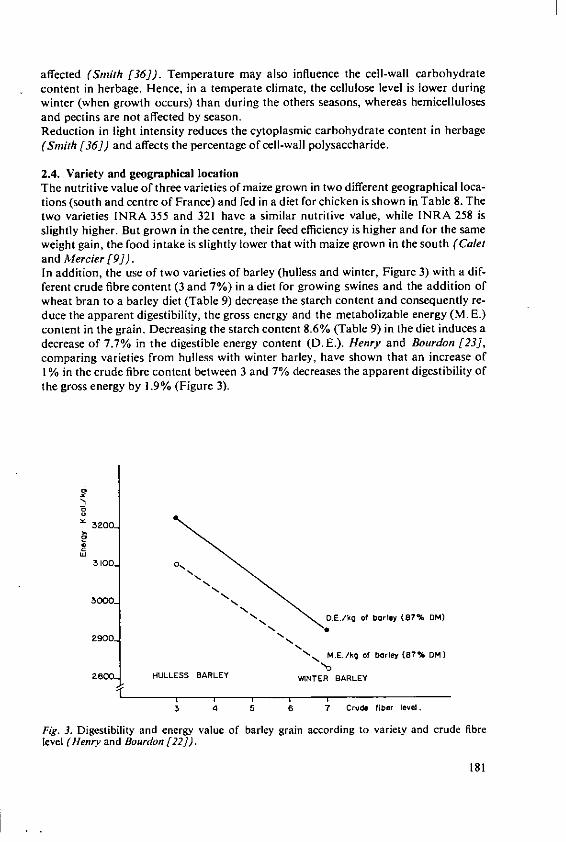
affected (Smnith [36]). Temperature may also influence the cell-wall carbohydratecontent in herbage. Hence, in a temperate climate, the cellulose level is lower duringwinter (when growth occurs) than during the others seasons, whereas hemicellulosesand pectins are not affected by season.Reduction in light intensity reduces the cytoplasmic carbohydrate content in herbage(Smith [36]) and affects the percentage of cell-wall polysaccharide.
2.4. Variety and geographical locationThe nutritive value of three varieties of maize grown in two different geographical loca-tions (south and centre of France) and fed in a diet for chicken is shown in Table 8. Thetwo varieties INRA 355 and 321 have a similar nutritive value, while INRA 258 isslightly higher. But grown in the centre, their feed efficiency is higher and for the sameweight gain, the food intake is slightly lower that with maize grown in the south (Caletand Mercier [9]).In addition, the use of two varieties of barley (hulless and winter, Figure 3) with a dif-ferent crude fibre content (3 and 7%) in a diet for growing swines and the addition ofwheat bran to a barley diet (Table 9) decrease the starch content and consequently re-duce the apparent digestibility, the gross energy and the metabolizable energy (M. E.)content in the grain. Decreasing the starch content 8.6% (Table 9) in the diet induces adecrease of 7.7% in the digestible energy content (D.E.). Henry and Bourdon [23],comparing varieties from hulless with winter barley, have shown that an increase of1% in the crude fibre content between 3 and 7% decreases the apparent digestibility ofthe gross energy by 1.9% (Figure 3).
3200
3100 0
3000N
N 0E./ g of borley (87% DM)
2900 N
SM.E./kg of borley (87% DM)
2600. HULLESS BARLEY WNTER BARLEY
3 4 5 6 7 Crud. fiber level.
Fig. 3. Digestibility and energy value of barley grain according to variety and crude fibrelevel (Henry and Bourdon [22]).
181
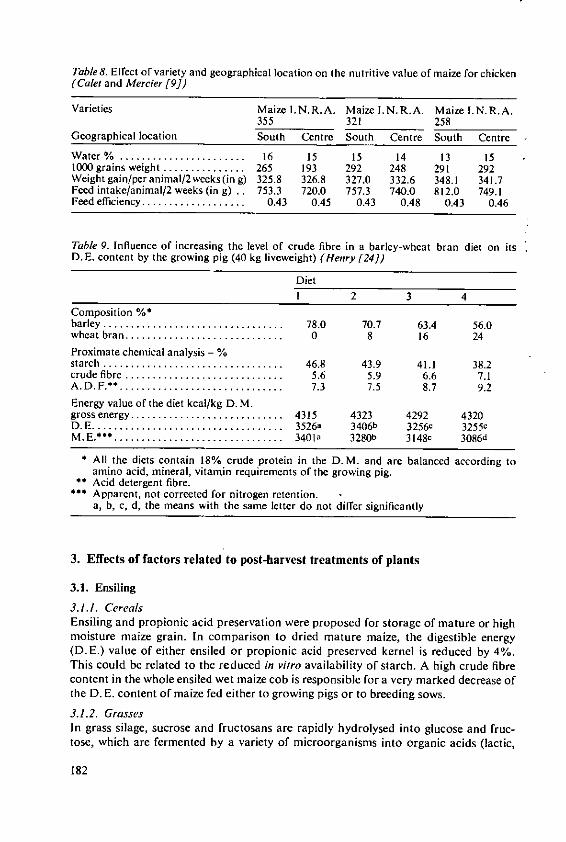
Table 8. Effect of variety and geographical location on the nutritive value of maize for chicken(Calet and Mercier [9])
Varieties Maize L.N.R.A. Maize I.N.R.A. Maize I.N.R.A.355 321 258
Geographical location South Centre South Centre South CentreW ater % ....................... 16 15 15 14 13 151000 grains weight ............... 265 193 292 248 291 292Weight gain/per animal/2weeks(in g) 325.8 326.8 327.0 332.6 348.1 341.7Feed intake/animal/2 weeks (in g) .. 753.3 720.0 757.3 740.0 812.0 749.1Feed efficiency ................... 0.43 0.45 0.43 0.48 0.43 0.46
Table 9. Influence of increasing the level of crude fibre in a barley-wheat bran diet on itsD.E. content by the growing pig (40 kg liveweight) (Henry [24])
DietI 2 3 4
Composition %barley ................................. 78.0 70.7 63.4 56.0wheat bran ............................. 0 8 16 24Proximate chemical analysis - %starch ................................. 46.8 43.9 41.1 38.2crude fibre ............................. 5.6 5.9 6.6 7.1A .D .F.** .............................. 7.3 7.5 8.7 9.2Energy value of the diet kcal/kg D. M.gross energy ............................ 4315 4323 4292 4320D.E ................................... 3526a 3406b 3256 3255cM .E.*** ............................... 3401a 3280b 3148' 3086d
All the diets contain 18% crude protein in the D.M. and are balanced according toamino acid, mineral, vitamin requirements of the growing pig.
* Acid detergent fibre.* Apparent, not corrected for nitrogen retention. -
a, b, c, d, the means with the same letter do not differ significantly
3. Effects of factors related to post-harvest treatments of plants
3.1. Ensiling
3.1.1. CerealsEnsiling and propionic acid preservation were proposed for storage of mature or highmoisture maize grain. In comparison to dried mature maize, the digestible energy(D.E.) value of either ensiled or propionic acid preserved kernel is reduced by 4%.This could be related to the reduced in vitro availability of starch. A high crude fibrecontent in the whole ensiled wet maize cob is responsible for a very marked decrease ofthe D. E. content of maize fed either to growing pigs or to breeding sows.
3.1.2. GrassesIn grass silage, sucrose and fructosans are rapidly hydrolysed into glucose and fruc-tose, which are fermented by a variety of microorganisms into organic acids (lactic,
182
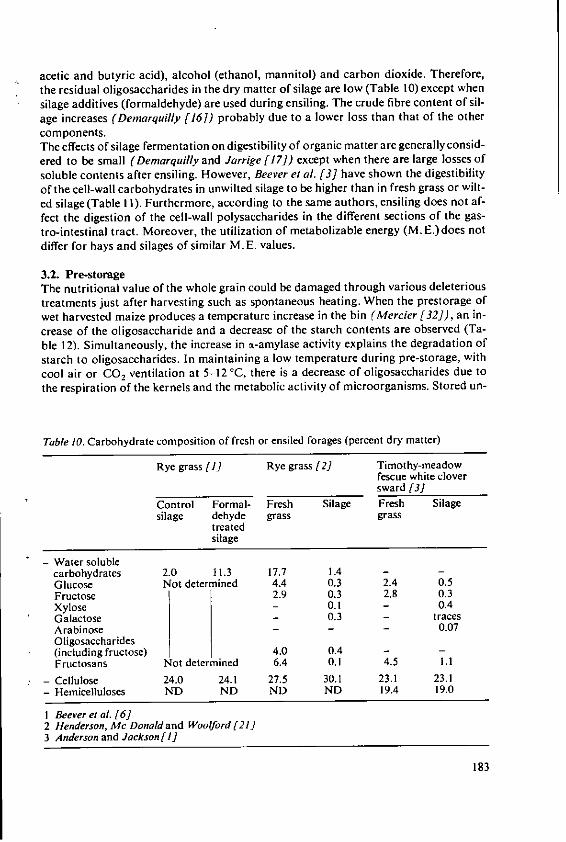
acetic and butyric acid), alcohol (ethanol, mannitol) and carbon dioxide. Therefore,the residual oligosaccharides in the dry matter of silage are low (Table 10) except whensilage additives (formaldehyde) are used during ensiling. The crude fibre content of sil-age increases (Detnarquilly [16]) probably due to a lower loss than that of the othercomponents.The effects of silage fermentation on digestibility of organic matter are generally consid-ered to be small (Demarquilly and Jarrige [17]) except when there are large losses of
soluble contents after ensiling. However, Beever et al. [3] have shown the digestibilityof the cell-wall carbohydrates in unwilted silage to be higher than in fresh grass or wilt-ed silage (Table II). Furthermore, according to the same authors, ensiling does not af-
fect the digestion of the cell-wall polysaccharides in the different sections of the gas-tro-intestinal tract. Moreover, the utilization of metabolizable energy (M. E.) does notdiffer for hays and silages of similar M.E. values.
3.2. Pre-storageThe nutritional value of the whole grain could be damaged through various deleterioustreatments just after harvesting such as spontaneous heating. When the prestorage ofwet harvested maize produces a temperature increase in the bin (Mercier [32]), an in-
crease of the oligosaccharide and a decrease of the starch contents are observed (Ta-ble 12). Simultaneously, the increase in m-amylase activity explains the degradation of
starch to oligosaccharides. In maintaining a low temperature during pre-storage, with
cool air or CO2 ventilation at 5-12 0C, there is a decrease of oligosaccharides due tothe respiration of the kernels and the metabolic activity of microorganisms. Stored un-
Table 10. Carbohydrate composition of fresh or ensiled forages (percent dry matter)
Rye grass [I] Rye grass [2] Timothy-meadowfescue white cloversward [3]
Control Formal- Fresh Silage Fresh Silagesilage dehyde grass grass
treatedsilage
- Water solublecarbohydrates 2.0 11.3 17.7 1.4 - -
Glucose Not determined 4.4 0.3 2.4 0.5Fructose 2.9 0.3 2.8 0.3Xylose - 0.1 - 0.4Galactose 0.3 - tracesArabinose - - - 0.07Oligosaccharides(including fructose) 4.0 0.4 - -
Fructosans Not determined 6.4 0.1 4.5 1.1
- Cellulose 24.0 24.1 27.5 30.1 23.1 23.1- Hemicelluloses ND ND ND ND 19.4 19.0
I Beever et al. [6]2 Henderson, Mc Donald and Woolford [21]3 Anderson and Jackson[I]
183
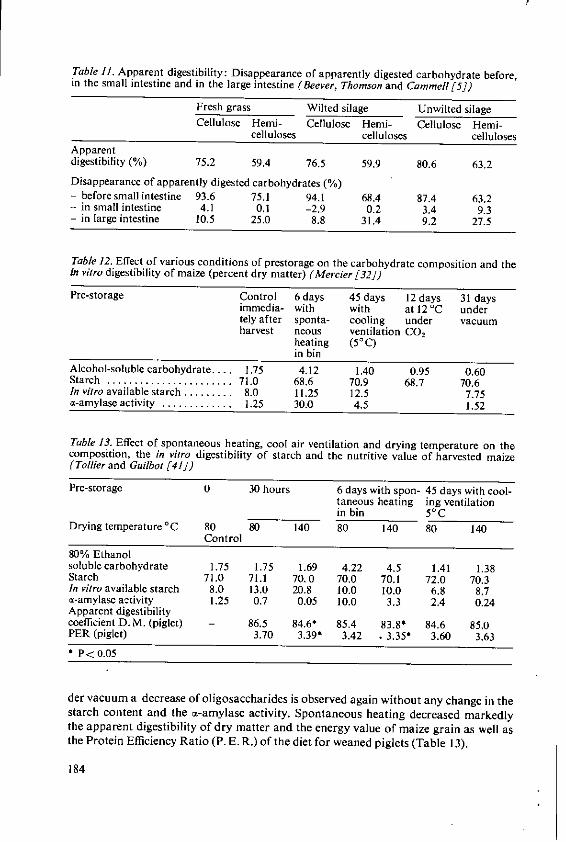
Table 11. Apparent digestibility: Disappearance of apparently digested carbohydrate before,in the small intestine and in the large intestine (Beever, Thomson and Cammell [5])
Fresh grass Wilted silage Unwilted silageCellulose Hemi- Cellulose Hemi- Cellulose Hemi-
celluloses celluloses cellulosesApparentdigestibility (%) 75.2 59.4 76.5 59.9 80.6 63.2Disappearance of apparently digested carbohydrates (%)- before small intestine 93.6 75.1 94.1 68.4 87.4 63.2- in small intestine 4.1 0.1 -2.9 0.2 3.4 9.3- in large intestine 10.5 25.0 8.8 31.4 9.2 27.5
Table 12. Effect of various conditions of prestorage on the carbohydrate composition and thein vitro digestibility of maize (percent dry matter) (Mercier [32])
Pre-storage Control 6 days 45 days 12 days 31 daysimmedia- with with at 12 'C undertely after sponta- cooling under vacuumharvest neous ventilation CO2
heating (50C)in bin
Alcohol-soluble carbohydrate .... 1.75 4.12 1.40 0.95 0.60Starch ....................... 71.0 68.6 70.9 68.7 70.6In vitro available starch ......... 8.0 11.25 12.5 7.75a-amylase activity ............. 1.25 30.0 4.5 1.52
Table 13. Effect of spontaneous heating, cool air ventilation and drying temperature on thecomposition, the in vitro digestibility of starch and the nutritive value of harvested maize(Tolher and Guilbot [41])
Pre-storage 0 30 hours 6 days with spon- 45 days with cool-taneous heating ing ventilationin bin 50 C
Drying temperature 'C 80 80 140 80 140 80 140Control
80% Ethanolsoluble carbohydrate 1.75 1.75 1.69 4.22 4.5 1.41 1.38Starch 71.0 71.1 70.0 70.0 70.1 72.0 70.3In vitro available starch 8.0 13.0 20.8 10.0 10.0 6.8 8.7a-amylase activity 1.25 0.7 0.05 10.0 3.3 2.4 0.24Apparent digestibilitycoefficient D. M. (piglet) - 86.5 84.6- 85.4 83.8* 84.6 85.0PER (piglet) 3.70 3.39* 3.42 . 3.35* 3.60 3,63* P< 0.05
der vacuum a decrease of oligosaccharides is observed again without any change in thestarch content and the a-amylase activity. Spontaneous heating decreased markedlythe apparent digestibility of dry matter and the energy value of maize grain as well asthe Protein Efficiency Ratio (P. E. R.) of the diet for weaned piglets (Table 13).
184
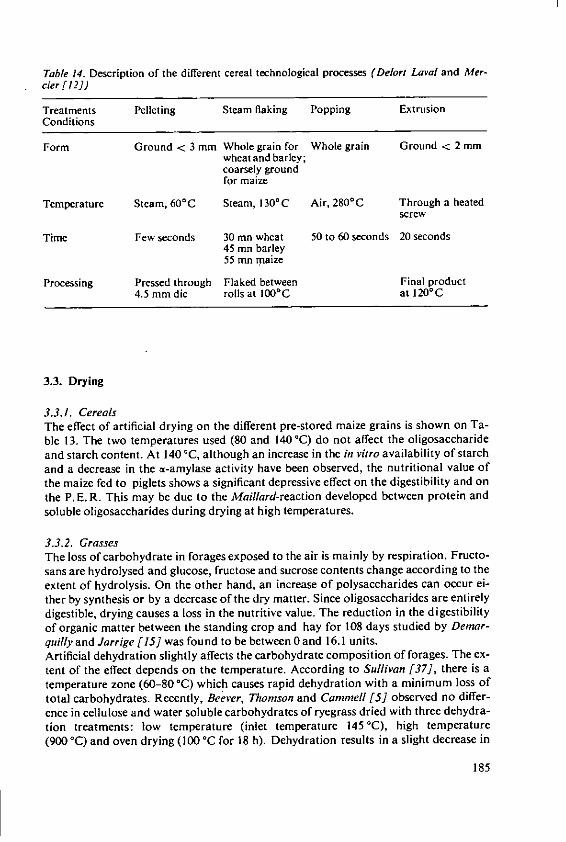
Table 14. Description of the different cereal technological processes (Delort Laval and Ater-cier [12])
Treatments Pelleting Steam flaking Popping ExtrusionConditions
Form Ground < 3 mm Whole grain for Whole grain Ground < 2 mmwheat and barley;coarsely groundfor maize
Temperature Steam, 60°C Steam, 130°C Air, 280 0C Through a heatedscrew
Time Few seconds 30 mn wheat 50 to 60 seconds 20 seconds45 onu barley55 mn maize
Processing Pressed through Flaked between Final product4.5 mm die rolls at 100°C at 120°C
3.3. Drying
3.3.1. CerealsThe effect of artificial drying on the different pre-stored maize grains is shown on Ta-ble 13. The two temperatures used (80 and 140'C) do not affect the oligosaccharideand starch content. At 140 'C, although an increase in the in vitro availability of starchand a decrease in the a-amylase activity have been observed, the nutritional value ofthe maize fed to piglets shows a significant depressive effect on the digestibility and onthe P. E. R. This may be due to the Maillard-reaction developed between protein andsoluble oligosaccharides during drying at high temperatures.
3.3.2. GrassesThe loss of carbohydrate in forages exposed to the air is mainly by respiration. Fructo-sans are hydrolysed and glucose, fructose and sucrose contents change according to theextent of hydrolysis. On the other hand, an increase of polysaccharides can occur ei-ther by synthesis or by a decrease of the dry matter. Since oligosaccharides are entirelydigestible, drying causes a loss in the nutritive value. The reduction in the digestibilityof organic matter between the standing crop and hay for 108 days studied by Demar-quilly and Jarrige [15] was found to be between 0 and 16.1 units.Artificial dehydration slightly affects the carbohydrate composition of forages. The ex-tent of the effect depends on the temperature. According to Sullivan [37], there is atemperature zone (60-80 'C) which causes rapid dehydration with a minimum loss oftotal carbohydrates. Recently, Beever, Thomson and Caninell [5] observed no differ-ence in cellulose and water soluble carbohydrates of ryegrass dried with three dehydra-tion treatments: low temperature (inlet temperature 145 'C), high temperature(900 'C) and oven drying (100 °C for 18 h). Dehydration results in a slight decrease in
185
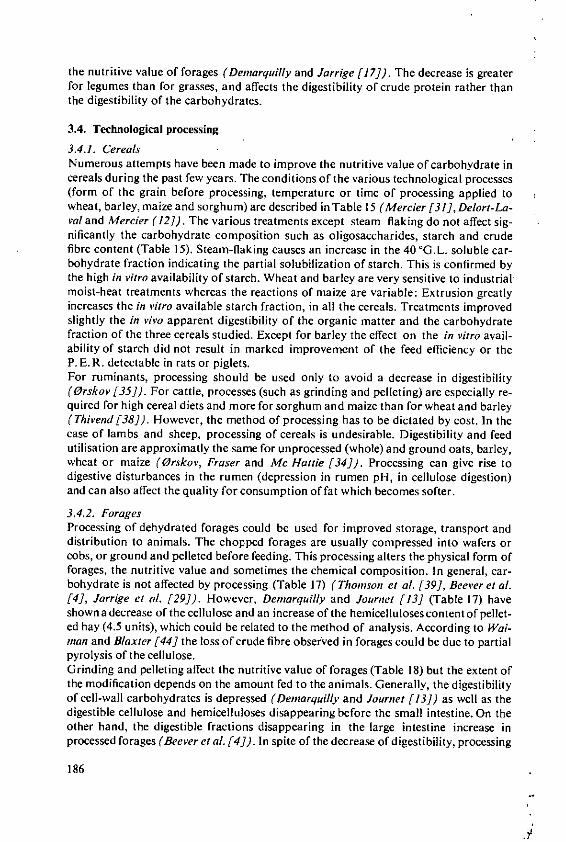
the nutritive value of forages (Demarquilly and Jarrige [17]). The decrease is greaterfor legumes than for grasses, and affects the digestibility of crude protein rather thanthe digestibility of the carbohydrates.
3.4. Technological processing
3.4.1. CerealsNumerous attempts have been made to improve the nutritive value of carbohydrate incereals during the past few years. The conditions of the various technological processes(form of the grain before processing, temperature or time of processing applied towheat, barley, maize and sorghum) are described inTable 15 (Mercier [31], Delort-La-val and Mercier (12]). The various treatments except steam flaking do not affect sig-nificantly the carbohydrate composition such as oligosaccharides, starch and crudefibre content (Table 15). Steam-flaking causes an increase in the 40 'G.L. soluble car-bohydrate fraction indicating the partial solubilization of starch. This is confirmed bythe high in vitro availability of starch. Wheat and barley are very sensitive to industrialmoist-heat treatments whereas the reactions of maize are variable: Extrusion greatlyincreases the in vitro available starch fraction, in all the cereals. Treatments improvedslightly the in vivo apparent digestibility of the organic matter and the carbohydratefraction of the three cereals studied. Except for barley the effect on the in vitro avail-ability of starch did not result in marked improvement of the feed efficiency or theP. E. R. detectable in rats or piglets.For ruminants, processing should be used only to avoid a decrease in digestibility(Orskov [35]). For cattle, processes (such as grinding and pelleting) are especially re-quired for high cereal diets and more for sorghum and maize than for wheat and barley(Thivend [38]). However, the method of processing has to be dictated by cost. In thecase of lambs and sheep, processing of cereals is undesirable. Digestibility and feedutilisation are approximatly the same for unprocessed (whole) and ground oats, barley,wheat or maize (Orskov, Fraser and Mc Hattie [34]). Processing can give rise todigestive disturbances in the rumen (depression in rumen pH, in cellulose digestion)and can also affect the quality for consumption of fat which becomes softer.
3.4.2. ForagesProcessing of dehydrated forages could be used for improved storage, transport anddistribution to animals. The chopped forages are usually compressed into wafers orcobs, or ground and pelleted before feeding. This processing alters the physical form offorages, the nutritive value and sometimes the chemical composition. In general, car-bohydrate is not affected by processing (Table 17) (Thomnson et al. [39], Beever et al.[4], Jarrige et al. [29]). However, Demarquilly and Journet [13] (Table 17) haveshown a decrease of the cellulose and an increase of the hemicelluloses content of pellet-ed hay (4.5 units), which could be related to the method of analysis. According to Wai-man and Blaxter [44] the loss of crude fibre observed in forages could be due to partialpyrolysis of the cellulose.Grinding and pelleting affect the nutritive value of forages (Table 18) but the extent ofthe modification depends on the amount fed to the animals. Generally, the digestibilityof cell-wall carbohydrates is depressed (Demarquilly and Journet [13]) as well as thedigestible cellulose and hemicelluloses disappearing before the small intestine. On theother hand, the digestible fractions disappearing in the large intestine increase inprocessed forages (Beever et al. [4]). In spite of the decrease of digestibility, processing
186
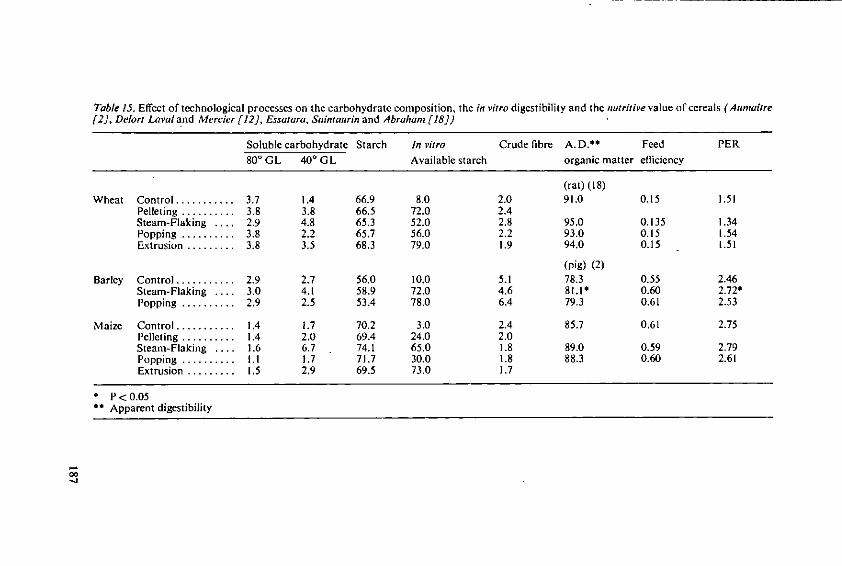
Table 15. Effect of technological processes on the carbohydrate composition, the in vitro digestibility and the nutritive value of cereals (Auniaitre[2], Delort Laval and Mercier [12], Essatara, Saintaurin and Abraham (18])
Soluble carbohydrate Starch In vitro Crude fibre A. D.** Feed PER
80' GL 400 GL Available starch organic matter efficiency
(rat) (18)
W heat Control ........... 3.7 1.4 66.9 8.0 2.0 91.0 0.15 1.51Pelleting .......... 3.8 3.8 66.5 72.0 2.4Steam-Flaking .... 2.9 4.8 65.3 52.0 2.8 95,0 0.135 1.34Popping .......... 3.8 2.2 65.7 56.0 2.2 93.0 0.15 1.54Extrusion ......... 3.8 3.5 68.3 79.0 1.9 94.0 0.15 1.51
(pig) (2)Barley Control ........... 2.9 2.7 56.0 10.0 5.1 78.3 0,55 2.46
Steam-Flaking .... 3.0 4.1 58.9 72.0 4.6 81.1" 0.60 2.72*Popping .......... 2.9 2.5 53.4 78.0 6.4 79.3 0.61 2.53
Maize Control ........... 1.4 1.7 70.2 3.0 2.4 85.7 0.61 2.75Pelleting .......... 1.4 2.0 69.4 24.0 2.0Steam-Flaking .... 1.6 6.7 74.1 65.0 1.8 89.0 0.59 2.79Popping .......... 1.1 1.7 71.7 30.0 1.8 88.3 0.60 2.61Extrusion ......... 1.5 2.9 69.5 73.0 1.7
* P<0.05** Apparent digestibility
-4
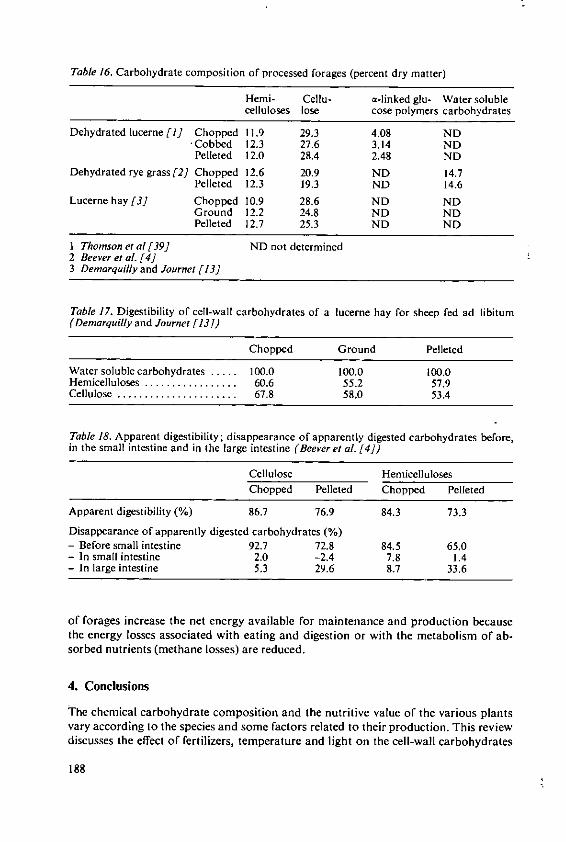
Table 16. Carbohydrate composition of processed forages (percent dry matter)
Hemi- Cellu- a-linked glu- Water solublecelluloses lose cose polymers carbohydrates
Dehydrated lucerne [1] Chopped 11.9 29.3 4.08 ND-Cobbed 12.3 27.6 3.14 NDPelleted 12.0 28.4 2.48 ND
Dehydrated rye grass[2] Chopped 12.6 20.9 ND 14.7Pelleted 12.3 19.3 ND 14.6
Lucerne hay [3] Chopped 10.9 28.6 ND NDGround 12.2 24.8 ND NDPelleted 12.7 25.3 ND ND
I Thomson et al [39] ND not determined2 Beever et al. [4]3 Demnarquilly and Journet [13]
Table 17. Digestibility of cell-wall carbohydrates of a lucerne hay for sheep fed ad libitum(Demarquilly and Journet [131)
Chopped Ground Pelleted
Water soluble carbohydrates ..... 100.0 100.0 100.0Hemicelluloses ................. 60.6 55.2 57.9Cellulose ...................... 67.8 58.0 53.4
Table 18. Apparent digestibility; disappearance of apparently digested carbohydrates before,in the small intestine and in the large intestine (Beever et al. [4])
Cellulose HemicellulosesChopped Pelleted Chopped Pelleted
Apparent digestibility (%) 86.7 76.9 84.3 73.3Disappearance of apparently digested carbohydrates (%)- Before small intestine 92.7 72.8 84.5 65.0- In small intestine 2.0 -2.4 7.8 1.4- In large intestine 5.3 29.6 8.7 33.6
of forages increase the net energy available for maintenance and production becausethe energy losses associated with eating and digestion or with the metabolism of ab-sorbed nutrients (methane losses) are reduced.
4. Conclusions
The chemical carbohydrate composition and the nutritive value of the various plantsvary according to the species and some factors related to their production. This reviewdiscusses the effect of fertilizers, temperature and light on the cell-wall carbohydrates
188
of forages, the effect of variety and geographical location on starch in cereals, the evo-lution of cytoplasmic (starch) and cell-wall carbohydrates during the maturation ofcereals and forages. All these parameters affecting the carbohydrate composition ofthe plants are extremely important to know since the cytoplasmic and cell-wall carbo-hydrates are differently digested by monogastric and polygastric animals.For grains produced for feeding monogastric animals, much attention will be paid inproducing mature cereals containing high proportions of starch or soluble oligosac-charides which provide the highest D. E. content, and low proportion of crude fibre. Itseems that the growing conditions of cereals play an important role in attaining suchgoals. In addition, pre-storage conditions just after harvest must be carefully selectedto prevent any loss or decrease in the chemical content and consequently the nutritivevalue of the grain. Finally, technological treatments proposed for improving the feedefficiency of cereals used in animal feeding through their effect on the carbohydratefraction should be discarded on account of their high cost.In forages, the most important factor affecting the carbohydrate composition and nu-tritive value is the stage of growth, i.e., the relative proportion between leaves andstems. The evolution of the carbohydrate composition leads to an increase of cell-wallcarbohydrates and lignification which will decrease the digestibility and the nutritivevalue. Generally, post-harvest treatments do not improve the nutritive value of foragesbecause they are not severe enough to modify greatly the structure of cell-wall carbo-hydrates. Additional studies are needed to propose new process which will permit de-struction of linkages between polysaccharides and lignin and to make easier the attackof cellulose and hemicelluloses by the digestive microflora of the ruminant. This couldbe very useful in improving the nutritive value of low quality forages which are high incell-wall carbohydrates.
5. References
1. Anderson, B.K. and Jackson, N.: Conservation of wilted and unwilted grass ensiled in air-tight metal containers with and without the addition of molasses. J. Sci. Fd. Agric. 21,p. 235-24 I(1970)
2. Aumaftre, A.: Influence du floconnage et de l'expansion de l'orge et du mals sur les per-formances du porcelet sevrd A 21 jours: effets sur Ia digestibilitd des 616ments de [a ration.Ann. Zootech. 25, No 1, p. 41-51 (1976)
3. Beever, D.E., Thomson, D.J., Pfeffer, E. and Armstrong, D.G.: The effect of drying andensiling grass on its digestion in sheep. Br. J. Nutr. 26, p. 123-134 (1971)
4. Beever, D.E., Coelho da Silva, J. F., Prescott, J. H. D. and Armstrong, D. G.: The effect insheep of physical form and stage of growth on the sites of digestion of a dried grass. I.Sites of digestion of organic matter, energy and carbohydrate. Br. J. Nutr. 28, p. 347-356(1972)
5. Beever, D.E., Thomson, D.J. and Cammel, S.B.: The digestion of frozen and dried grassby sheep. J. Agric. Sci. Camb. 86, p. 443-452 (1976)
6. Beever, D.E., Thomson, D.]., Cammel, S. B. and Harrison, D.G.: The digestion by sheepof silages made with and without the addition of formaldehyde. J. Agric. Sci. Camb. 88,p. 61-70 (1977)
7. Blaser, R. E.: Symposium on forage utilization: effects of fertility levels and stage of matu-rity on forage nutritive value. J. Animal. Sci. 23, p. 246-253 (1964)
8. Blaxter, K. L, Wainan, F. W., Dewey, P.J. S., Davidson, J., Denerley, H. and Gonn, I. B.:Effects of nitrogen fertilizer on the nutritive value of artificially dried grass. J. Agric. Sci.76, p. 307-319 (1971)
9. Calet, C. and Mercier, C.: Valeur nutritionnelle globale du mas. Ann. Nut. Alim. 20,No. 2, p. 241-256 (1966)
189
10. Cerning-Bdroard, J. and Guilbot, A.: Evolution de ha composition glucidique des grains dec6rales au cours de leur maturation: mais, bid orge. Ann. Technol. Agric. 24, No. 2.p. 143-170 (1975).
11. Cerning, J., Saposnik, A. and Guilbol, A.: Carbohydrate composition of horse beans (Vi-ciafaba) of different origins. Cereal Chem. 52, No. 2, p. 125-138 (1975)
12. Delort Laval, J. and Mercier, C.: Evaluation de divers traitements technologiques descdrdales. Part. 1: Choix des traitements et diude de leur influence sur ]a fraction glucidiquedu b1, de lorge et do matrs. Ann. Zootech. 25, No. I, p. 3-12 (1976)
13. Demarquilly, C. and Journet, M.: Valeur alimentaire des foins condensds. 1. Influence de!a nature du foin et de la finesse de broyage sur la digestibilit et ]a quantitd ing6re. Ann.Zootech. 16, p. 123-150 (1967)
14. Denarquilly, C.: Influence de la fertilisation azotde sur ]a valeur alimentaire des four-rages verts. Ann. Zootech. 19, p. 423-437 (1970)
15. Dernarquilly, C. and Jarrige, R.: The effect of forage conservation on digestibility andvoluntary intake. Proc. I Ith Intern. Grassi. Congr., p. 733-737 (1970)
16. Demarquilly, C.: Composition chimique, caractdristiques fermentaires, digestibilitd etquantit6 ing r&e des ensilages de fourrages. Modifications par rapport au fourrage vert in-itial. Ann. Zootech. 22, p. 1-35 (1973)
17. Denzarquilly, C. and Jarrige, R.: The comparative nutritive value of grasses and legumes.5th Gen. Meeting of European Grassl. Assoc. Uppsala, p. 33-41 (1973)
18. Essatara, M., Sainiaurin, M. A. de and Abraham, J.: Effet de l'expansion, de I'extrusion etdo floconnage sur Ia valeur alimentaire du bld et du mais pour le rat en croissance. Ann.Zootech. 25, No. 1, p. 3-12 (1976)
19. Fauconneau, G. and Jarrige, R.: Composition chimique et valeur nutritive de l'herbe. Bull.Tech. Inf. 118, p. 1-60 (1957)
20. Filiatre, A.: Caractdrisation et repartition histologique des glucides des graines de Igumi-neuses, fdverole, lupin, pois ridd et lisse. Th6se 3 me cycle, Universitd Paris-Sud, Centred'Orsay, No. 2153, Septembre, 1976
21. Henderson, A. R., Mc Donald, P. and Woolford, M.K.: Chemical changes and losses dur-ing the ensilage of wilted grass treated with formic acid. J. Sci. Fd. Agric. 23,p. 1079-1087 (1972)
22. Henry, Y. and Bourdon, D.: Valeur 6nerg6tique de deux types d'orge (vetue et nue) et uti-lisation par le porc en croissance. Jour. Rech. Pore 6, p. 71-80 (1975)
23. Henry, Y. and Bourdon, D.: Personal communication24. Henry, Y.: Prediction of energy values of feeds for swine from fibre content. 1st Inter.
Symp. on Feed Composition. Utah State University Logan, July 11-16 (1976)25. Huguet, L. and Gillet, M.: The influence of nitrogen fertilizer and autumn management on
the quality of green herbage. 5th Gen. Meeting of European Grassi. Fed., Uppsala,p. 100-110(1973)
26. Jarrige, R.: The membrane constituents of herbage. Proc. 8th Int. Grassl. Congr.,p. 629-634 (1960)
27. Jarrige, R.: Les constituants membranaires des plantes fourragdres. Ann. Biol. Anim.Bioch. Biophys. 3, p. 143-190 (1963)
28. Jarrige, R. and Minson, D.J.: Digestibilitd des constituants du ray grass anglais S 24 et dudactyle S 37, plus spdcialement des constituants glucidiques. Ann. Zootech. 13, p. 118-150(1964)
29. Jarrige, R., Denarquilly, C., Journet, M. and B&ranger, C.: The nutritive value of pro-cessed dehydrated forages with special reference to the influence of physical form and par-ticle size. Proc. Ist Intern. Green. Crop. Drying Congr. Oxford, p. 99-118 (1973)
30. Jarrige, R. and Denmarquilly, C.: Personal communication31. Mercier, C.: Effects of various U. S. Grain Processes on the alteration and the 'in vitro' di-
gestibility of starch granule. Feedstuffs 43, No. 49, p. 33-34 (1971)32. Mercier, C.: La conservation des c6rdales: aspects biochimiques. S.E. I., C.N.R.A., Ver-
sailles 53, p. 33-44 (1973)33. Mercier, C.: Composition glucidique des v~g6taux utilisds en alimentation humaine: as-
pects quantitatif et qualitatif. Revue Franqaise de Did6ttique 66, p. 27-40 (1973)34. Orksov, E.R., Fraser, C. and McHattie, I.: Cereal processing and food utilization by
sheep. 1. The effect of processing on utilization of barley by early-weaned lambs. Anim.Prod. 18, p. 85-88 (1974)
190
35. Orskov, E. R.: The effect of processing on digestion and utilization of cereals by ruminant.Proc. Nutr. Soc. 35, p. 245-252 (1976)
36. Smith, D.: The nonstructural carbohydrates in: Chemistry and Biochemistry of Herbage.1, p. 106-151. Ed. Butler, G. W. and Bailey, R. W. (1973)
37. Sullivan, J.T.: Drying and storing herbage as hay in: Chemistry and Biochemistry ofHerbage. 3, p. 1-28. Ed. Butler, G. W. and Bailey, R. IW. (1973)
38. Thivend, P.: Influence des traitements technologiques sur ]a valeur nutritive des cr(alespour le ruminant. Ind. Alim. 212, p. 37-45 (1970)
39. Thomson, D. J., Beever, D. E., Coelho do Silva, J. F. and Armstrong, D.G.: The effectin sheep of physical form on the sites of digestion of a dried lucerne diet. 1. Sites of organicmatter, energy and carbohydrate digestion. Br. J. Nutr. 28, p. 31-41 (1972)
40. Tollier, M. T.: Ddtoxification des tourteaux d'arachide par l'ammoniac: influence sur leurcomposition glucidique. Rapport D. G. R. S.T. - Paris, ddcembre (1974)
41. Toller, M. T. and Guilbot, A.: Caractdristiques de la fraction glucidique des dchantillonsde mals grain. Ann. Zootech. 20, p. 633-640 (1971)
42. Tollier, M. T. and Guilbot, A.: Ddtermination de ]a composition glucidique de ]a graine decolza (Brassica napus) et des produits d~riv~s. Proc. 4th Internat. Raps-Kongress, Gies-sen, June, p. 371-380 (1974)
43. Tollier, M. T. and Rinaudo, M.: Personal communication44. Wainian, F. W. and Blaxter, K. L.: Effect of grinding and pelleting on the nutritive value of
poor quality roughages for sheep. J. Agric. Sci. Camb. 79, p. 435-445 (1972)
191
The Effect of Fertilizers and Other Inputson Yield and Nutritive Valueof Cassava and Other Tropical Root CropsW. N.O.Ezeilo, B. Sc., International Institute of Tropical Agriculture, lbadan/Nigeria;Co-ordinator, National Cassava Center, National Root Crops Research Institute, Umudike,Umuahia/Nigeria*
Summary
Tropical root crops are important to the producing countries as a source of human and animalfood. They are also increasingly important in international trade. There is a need to increaseproduction of these crops to cover food deficits forecast for the 1980s. Discussion of the nu-trient requirements of cassava and other root crops and of the effect of fertilizer application isfollowed by discussion of the contribution to increased yield which can be made by genetic im-provement, consideration of the effect of climatic and soil conditions and the influence of thefarming system, notably of the effect of increasing population in shortening the fallow periodand thus causing soil deterioration. Factors which affect the efficacy of fertilizers in ameliorat-ing the adverse effects of shortening fallow periods are discussed. Consideration is also given tothe constraints imposed by farm management problems in the humid tropical areas of the de-veloping countries. Examples of the effectiveness of fertilizers applied in a 'package' of im-proved practices are drawn from results achieved in cassava cultivation under the Nigerian Na-tional Accelerated Food Production Project.
I. Introduction
The tropical root crops including yams (Dioscorea spp.), cassava (Manihot esculenta),sweet potato (Ipomnea batatas) and cocoyams - Tannia (Xanthosona spp.) and Taro(Colocasia esculenta) are among the world's most important staple food crops. Cassa-va contributes about two thirds of the global production of root crops estimated byCoursey [1975] at about 170 million tonnes equivalent to 250 teracalories (Table 1).Cassava production although widespread throughout all tropical regions of the worldis particularly important in the developing countries as illustrated in Figure 1 by Phil-lips [1974]. Cassava is an important food for man and animals in the producing areasand, in the past decade an increasing amount has been traded internationally as cassa-va chips or pellets for livestock feed (Table 2) and industrial starch. Phillips [1974]forecasts that the developing countries, particularly in Africa and the Far East, couldbe faced with carbohydrate shortage and that cassava products will be increasinglyused in industrial starch and animal feed industries in non-producing countries(Table 3).
* Dr. W. N. 0. Ezeilo, Co-ordinator, National Cassava Center. National Root Crops ResearchInstitute, P.M.B. 1006, Umudike, Umuahia/Nigeria
193
Table 1. Production of root crops in the developing world (million metric tons) after FAO 1973
Cassava Potato Yam Sweet Taro Miscella- TotalPotato neous
RootCrops
Africa ......... 42.384 1.838 17.864 5.719 3.276 0.611 71.692Tropical America 38.152 8.828 0.269 4.125 - 0.800 52.174Near East ....... 0.110 3.854 0.124 0.530 0.049 - 4.667Far East ........ 24.145 6.545 0.031 7.895 0.093 1.456 40.165Other .......... 0.538 0.005 0.068 0.178 0.105 0.077 0.971DevelopingWorld 105.328 21.071 18.357 18.447 3.522 2.944 169.669
Table 2. Imports of cassava products into the European Economic Community (1962-1970) -
1000 metric tons
1962 1963 1964 1965 1966 1967 1968 1969 1970
Fed. Rep. ofWest Germany ..... 366 387 462 520 702 533 481 548 591France ............ 23 20 18 17 16 na na na 35Italy .............. 0 0 0 I 0 na na na 14Netherlands ....... I 5 17 76 96 159 237 444 502Belgium ........... 23 72 105 100 70 113 127 212 268Total .............. 413 484 602 714 884 (805) (845) (1204) 1410
Source: 1962-66 The Markets for Manioc as a Raw material for Compound Feedingstuffs,International Trade Centre, UNCTAD/GATT, Geneva, 1968.
1967-70 The EEC Tapioca Market - Possibilities and Limits, FAO (unpublished),1972.
World production of cassava has increased by about 35% in the past decade mainlydue to increase in the planted area, higher yields per hectare accounting for less than10% of the increase in output (Flinn [1974]). However, since most of the cassava/yambelt is in areas of very high population and high pressure on land the cassava deficitsforecast for 1980 in some developing countries such as Nigeria can only be overcomeby increasing production per hectare and per man-day of labour. A number of factorscontribute to current low yields of root crops.This paper examines how fertilizers and other inputs can contribute to the achievementof higher economic yields and improved quality of cassava (and other tropical rootcrops) particularly by the integrated approach as exemplified in the cassava pro-gramme of the Nigerian National Accelerated Food Production Project (NA FPP).
2. Nutrient requirements and fertilization
Although cassava tolerates low soil fertility because its feeder roots can utilise the less-easily available plant nutrients (de Geus [1967]), and also because the roots can extractnutrients from depths of 40-80 cm its capacity for nutrient uptake as reported by Ni-joholt [1935], Potascheme [1958], Cours and Fritz [1967] is very high. It increases
194
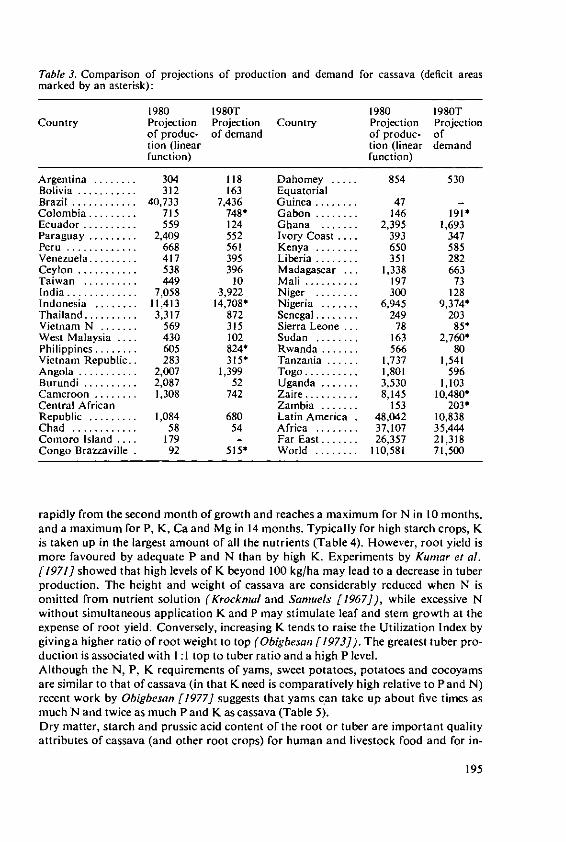
Table 3. Comparison of projections of production and demand for cassava (deficit areasmarked by an asterisk):
1980 1980T 1980 1980TCountry Projection Projection Country Projection Projection
of produc- of demand of produc- oftion (linear tion (linear demandfunction) function)
Argentina ........ 304 118 Dahomey ..... 854 530Bolivia ........... 312 163 EquatorialBrazil ............ 40,733 7,436 Guinea ........ 47 -Colombia ......... 715 748- Gabon ........ 146 191*Ecuador .......... 559 124 Ghana ....... 2,395 1,693Paraguay ......... 2,409 552 Ivory Coast .... 393 347Peru ............. 668 561 Kenya ........ 650 585Venezuela ......... 417 395 Liberia ........ 351 282Ceylon ........... 538 396 Madagascar ... 1,338 663Taiwan .......... 449 10 Mali .......... 197 73India ............. 7,058 3,922 Niger ........ 300 128Indonesia ........ 11,413 14,708" Nigeria ....... 6,945 9,374*Thailand .......... 3,317 872 Senegal ........ 249 203Vietnam N ....... 569 315 Sierra Leone ... 78 85*West Malaysia .... 430 102 Sudan ........ 163 2,760*Philippines ........ 605 824* Rwanda ....... 566 80Vietnam Republic.. 283 315" Tanzania ...... 1,737 1,541Angola ........... 2,007 1,399 Togo .......... 1,801 596Burundi .......... 2,087 52 Uganda ....... 3,530 1,103Cameroon ........ 1,308 742 Zaire .......... 8,145 10,480"Central African Zambia ....... 153 203*Republic ......... 1,084 680 Latin America . 48,042 10,838Chad ............ 58 54 Africa ........ 37,107 35,444Comoro Island .... 179 - Far East ....... 26,357 21,318Congo Brazzaville . 92 515- World ........ 110,581 71,500
rapidly from the second month of growth and reaches a maximum for N in 10 months,and a maximum for P, K, Ca and Mg in 14 months. Typically for high starch crops, Kis taken up in the largest amount of all the nutrients (Table 4). However, root yield ismore favoured by adequate P and N than by high K. Experiments by Kurnar et al.[1971] showed that high levels of K beyond 100 kg/ha may lead to a decrease in tuberproduction. The height and weight of cassava are considerably reduced when N isomitted from nutrient solution (Krockmal and Samuels [1967]), while excessive Nwithout simultaneous application K and P may stimulate leaf and stem growth at theexpense of root yield. Conversely, increasing K tends to raise the Utilization Index bygiving a higher ratio of root weight to top (Obigbesan [1973]). The greatest tuber pro-duction is associated with 1:1 top to tuber ratio and a high P level.Although the N, P, K requirements of yams, sweet potatoes, potatoes and cocoyamsare similar to that of cassava (in that K need is comparatively high relative to Pand N)recent work by Obigbesan [1977] suggests that yams can take up about five times asmuch N and twice as much P and K as cassava (Table 5).Dry matter, starch and prussic acid content of the root or tuber are important qualityattributes of cassava (and other root crops) for human and livestock food and for in-
195
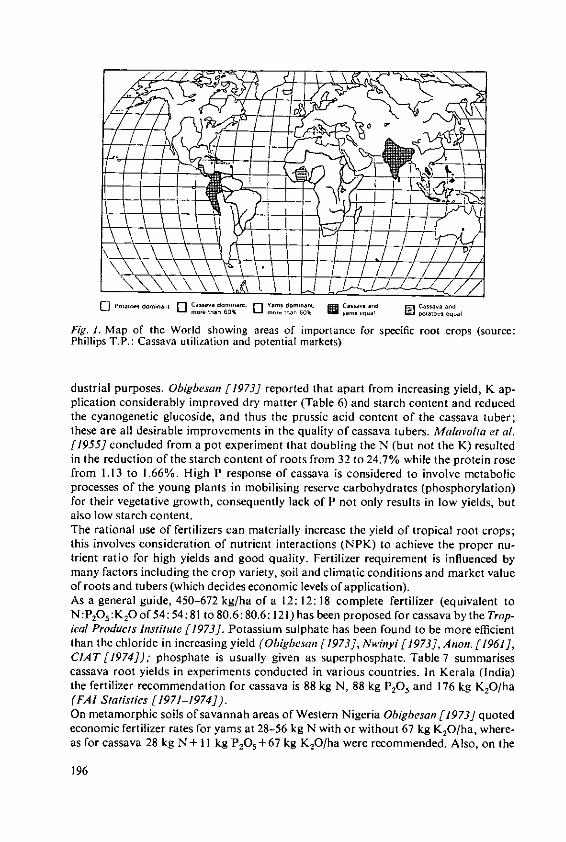
QP ntorndsamnan, Yam do ant Caswa ard Cassaa dl[] ......... . nn m ........ Ihn 60% [] ..... 6. -.. ..... I ...... . .....
Fig. 1. Map of the World showing areas of importance for specific root crops (source:Phillips T.P.: Cassava utilization and potential markets)
dustrial purposes. Obigbesan [1973] reported that apart from increasing yield, K ap-plication considerably improved dry matter (Table 6) and starch content and reducedthe cyanogenetic glucoside, and thus the prussic acid content of the cassava tuber;these are all desirable improvements in the quality of cassava tubers. Malavolta et al.[1955] concluded from a pot experiment that doubling the N (but not the K) resultedin the reduction of the starch content of roots from 32 to 24.7% while the protein rosefrom 1.13 to 1.66%. High P response of cassava is considered to involve metabolicprocesses of the young plants in mobilising reserve carbohydrates (phosphorylation)for their vegetative growth, consequently lack of P not only results in low yields, butalso low starch content.The rational use of fertilizers can materially increase the yield of tropical root crops;this involves consideration of nutrient interactions (NPK) to achieve the proper nu-trient ratio for high yields and good quality. Fertilizer requirement is influenced bymany factors including the crop variety, soil and climatic conditions and market valueof roots and tubers (which decides economic levels of application).As a general guide, 450-672 kg/ha of a 12: 12:18 complete fertilizer (equivalent toN:P2 0:KO of 54:54:81 to 80.6: 80.6:121) has been proposed for cassava by the Trop-ical Products Institute [1973]. Potassium sulphate has been found to be more efficientthan the chloride in increasing yield (Obigbesan [1973], Nwinyi [1973], Anon. [1961],CIA T[1974]); phosphate is usually given as superphosphate. Table 7 summarisescassava root yields in experiments conducted in various countries. In Kerala (India)the fertilizer recommendation for cassava is 88 kg N, 88 kg P20 5 and 176 kg K20/ha(FAI Statistics [1971-1974]).On metamorphic soils of savannah areas of Western Nigeria Obigbesan [1973] quotedeconomic fertilizer rates for yams at 28-56 kg N with or without 67 kg K2O/ha, where-as for cassava 28 kg N+ II kg P205+67 kg K20/ha were recommended. Also, on the
196
Table 4. Nutrient removal (kg/ha) from the soil by the cassava crop
Source- Nijholt Potascheme Cours and FritzNutrient 1936 1968 1961
60 t/ha tuber 30 t/ha tuber 40 t/ha tuber
N ................................. 124 60 85P105 .............................. 104 50 62K20 .............................. 584 258 280CaP .............................. 217 - 75M gO ............................. 71 -
Table 5. Equivalent amounts of fertilizers (kg/ha) removed by cassava cultivars and yamspecies through crop harvest:
Cassava Cultivars Yam Species53101 60506 D. alata D. rotundata
Tuber dry matter yield (kg/ha) ......... 7370 9350 9034 12133Ammonium sulphate (21%N) ......... 129 176 609 738Single super phosphate (18% P20,) .... 89 115 215 232Muriate of potash (60% KO) ......... 142 228 323 352
Table 6. Influence of K-nutrition on dry matter yield of cassava (M. palmata)*
Time of sampling 9 months February; dry 12 months May; wetIb K O/acre Dry matter Dry matter
in % Yield kg/plot in % kg/plot
0 ................................ 44.6 9.71 33.1 9.4340 ................................ 46.1 8.04 37.0 14.1060 ................................ 47.2 10.31 34.1 12.4180 ................................ 51.5 11.04 35.9 11.52
* Means of 4 values
Table 7. Root yields (metric tons/ha) of cassava in fertilizer experiments conducted invarious countries
Country (NPK kg/ha) 0 NK PK NP NPK
Brazil Slo Paulo (80-120-60) ........... 11.3 13.9 16.9 19.1 21.0Madagascar (33-96-90) ............... 32.5 38.7 39.9 40.0 40.5Vietnam (40-75-70) .................. 10.0 12.9 10.5 12.3 15.2Indonesia (45-40-100) ................. 10.7 20.8 - 9.0 33.6
Source: Cours [19531; Jacoby [19651 Normanha and Pereira [1950] and Van Dijk [1951]
197
sedimentary soil (forest area) the recommended fertilizer rates were 50 kg N + 67 kgK2O/ha for yams and 50 kg N, II kg P20, and 67 kg K20 for cassava. On the relativelyless-fertile sandy acid soils of South-Eastern Nigeria, the general recommendation(Anon. [1977]) for cassava, yams, potatoes and cocoyams is 400 kg/ha of N P K12: 12: 17:2 mg or 580 kg/ha of 10: 10: 20.
3. Varietal effects
Yield potential of root crops varies greatly with variety and there is thus great potentialfor improvement by the use of high yielding varieties. An efficient plant has a correctbalance between the leaves (which are the source of production) and the roots or tubers(which are the required products. A study group, Jennings et al. [1973], suggestedthat the ideal cassava plant should have the following characteristics:(a) Only one shoot arising from each cutting;(b) a high root to stem ratio;(c) a leaf area index of about 3.5;(d) about 8 tubers per plant;(e) large tubers;(f) early maturity and high bulking rate;(g) leaves placed at a narrow angle to the stem so that they are held vertically rather
than horizontally, and permit greater penetration of light to the lower leaves;(h) narrow leaf laminas also to permit light penetration, and(I) disease resistance. Hahn et al. [1972] reported a highly significant genetic correla-
tion between resistance to Cassava Mosaic Disease (CMD) and Cassava BacterialBlight (CBB); a high genetic gain in CMD resistance will therefore be expected as aresult of selection made for CBB and vice versa.
Many cassava clones from IITA screened in 1974/75 out-yielded the recommendedvarieties by 2 to 18. times IITA (1975) - due primarily to resistance to disease, espe-cially Cassava Bacterial Blight CBB (see Table 8).Yield of sweet potato was found to be significantly associated with average number oftuberous roots but not significantly associated with average tuberous root size; thusselection for large number of tuberous roots will result in smaller tuber size and viceversa (IITA [1972]).The objective of a cassava production project should be to select cultivars which per-form well not only under conditions of low fertility; but cultivars which are capable ofresponding to high fertility and improved agronomic practices, Figure 2 illustrates thedifferent yield response of three different cultivars to a similar treatment of 300 kg of a10- 10- 20 fertilizer in two locations in Nigeria (Jacoby [1965]).Ayenor (JITA [1977]) studied quality in different cassava varieties using physico-chemical and biochemical properties related to the traditional mode of food prepara-tion and utilisation. Quality attributes were based on texture characteristics (waxy tex-tured types being unsuitable for pounding); carbohydrate profile (starch contents ofvarieties studied ranged from 15% to 31 %, and the lower end of the range exhibitedpoor quality); functional properties (e.g. lower grades of cassava flour were thosewhich also contained higher levels of sugars, since starch hydrolysis and production ofsugars reduce the viscosity of the pasting system of starch); the swelling power of gari
198
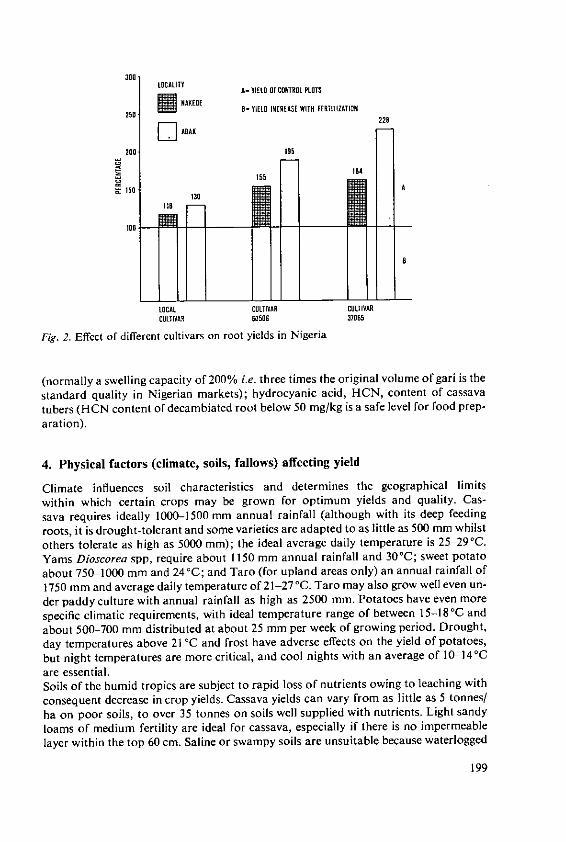
300 LOCALITY A- YIELD OF CONTROL PLOTS
m NAKEDE B-YIELD INCREASE WITH FERTILIZATION
250
F- ABAK
200 195
~~15514
150 A130
io
LOCAL CULTIVAR CULTIVAR
CULTIVA3 60506 37065
Fig. 2. Effect of different cultivars on root yields in Nigeria
(normally a swelling capacity of 200% i.e. three times the original volume of gari is the
standard quality in Nigerian markets); hydrocyanic acid, HCN, content of cassava
tubers (HCN content of decambiated root below 50 mg/kg is a safe level for food prep-
aration).
4. Physical factors (climate, soils, fallows) affecting yield
Climate influences soil characteristics and determines the geographical limits
within which certain crops may be grown for optimum yields and quality. Cas-
sava requires ideally 1000-1500 mm annual rainfall (although with its deep feeding
roots, it is drought-tolerant and some varieties are adapted to as little as 500 mm whilst
others tolerate as high as 5000 mm); the ideal average daily temperature is 25-290 C.
Yams Dioscorea spp, require about 1150 mm annual rainfall and 30'C; sweet potato
about 750-1000 mm and 24 0 C; and Taro (for upland areas only) an annual rainfall of
1750 mm and average daily temperature of 21-27C. Taro may also grow well even un-
der paddy culture with annual rainfall as high as 2500 m. Potatoes have even more
specific climatic requirements, with ideal temperature range of between 15-18 °C and
about 500-700 mm distributed at about 25 mm per week of growing period. Drought,
day temperatures above 21 'C and frost have adverse effects on the yield of potatoes,
but night temperatures are more critical, and cool nights with an average of 10-140C
are essential.Soils of the humid tropics are subject to rapid loss of nutrients owing to leaching with
consequent decrease in crop yields. Cassava yields can vary from as little as 5 tonnes/
ha on poor soils, to over 35 tonnes on soils well supplied with nutrients. Light sandy
loams of medium fertility are ideal for cassava, especially if there is no impermeable
layer within the top 60 cm. Saline or swampy soils are unsuitable because waterlogged
199
Table 8. High cassava yields due to resistance to disease: Yield (t/ha) of the best 10% and 5%selections and comparison with that of standard varieties. Figures in parenthesis refer tocomparison with standards
Location 10% 5% Standard Remarkslbadan IITA
52 clones ............... 51.1 (2.4) 53.3 (2.5) 21.4(1.0) 60444250 clones ............... 50.7 (1.9) 56.2 (2.1) 27.0 (1.0) 60444
Umudike FARTS300 clones ............... 23.0 (5.6) 25.9 (6.3) 4.0 (1.0) 60444
(1.7) (1.9) 13.3 (1.0) 60506Ward MWS/SheI-BP
300 clones ............... 15.5 (15.5) 17.5 (17.5) 1.0 (1.0) 60444(5.1) (5.8) 3.0 (1.0) 60447
100 clones ............... 14.5 (14.6) 17.6 (17.6) 1.0(1.0) 60444(4.8) (5.9) 3.0 (1.0) 60447
Mokwa ABU300 clones ............... 29.3 (1.8) 34.3 (2.2) 15.6 (1.0) 60444
conditions may result in rotting of tubers. Cassava yields poorly on clay soils becausestems and leaves grow at the expense of roots (Tropical Products Institute [1973]).Yams (Dioscorea spp.) also require good drainage and for optimum yields a deepwelldrained sandy loam is required. Tubers are liable to rot in heavy clays, whilst onpoor soils, tuber size is reduced because of inadequate supply of water or nutrients.The rapid loss of nutrients due to leaching in the cassava/yam belt of the world was his-torically overcome by 'shifting cultivation' - defined by Sanchez [1973] as a continu-ing agricultural system in which the cropping period is shorter than the fallow. In the'bush fallow' system of 'shifting cultivation' forest vegetation during the fallow repre-sents a nearly closed nutrient cycle and is thus a major buffer against nutrient loss (Nyeand Greenland [1960], Coulter [1972]). In thinly populated areas the bush fallow is asatisfactory system and the soil is fairly well protected against erosion. As populationdensity increases the fallow period becomes shorter and the original vegetation is re-placed by scrub and grass resulting in infertile soils and, possibly, erosion. Whether ornot fertilizers can be used as a practical and economically effective means of restoringsoil fertility (where population pressure is breaking down the practice of 'shifting culti-vation') may be dependent on some soil factors such as soil reaction, the nutrient level,and the soil's capacity to hold nutrients. For instance, K is best utilised around a pHrange of 5.00 to 7.00; N, pH 5.5 to 7.5; P, pH 6.5 to 8.00; and Ca, Mg utilization ishighest from pH of 6 and above. Leached soils in the high rainfall zones are usuallyacid (pH < 5). Therefore, until the problem of liming acid tropical soils is resolved,economic yield response to N, P, K fertilizer application is more feasible in soils enjoy-ing comparatively longer 'bush fallow', higher nutrient status, and pH above 5.00, thanin degraded acid soils with low capacity to hold nutrients as a result of low content oforganic matter, silt and clay particles. Table 9 shows the relationship between highpopulation density, decreasing length of fallows, increasing soil acidity, and decreasingorganic matter and base saturation in a recent study by Flinn and Lagemann [1976] ofareas in Eastern Nigeria with similar soil type and climate but with differing man: landratios.
200
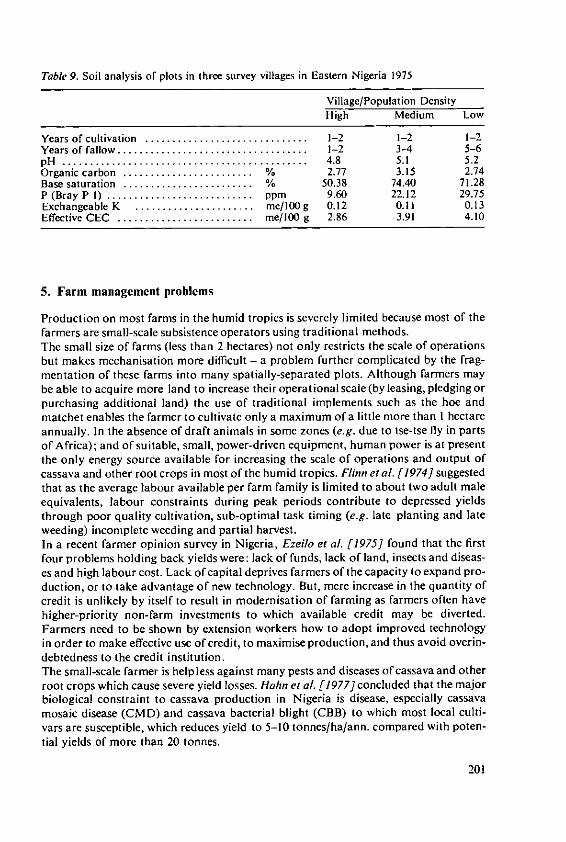
Table 9. Soil analysis of plots in three survey villages in Eastern Nigeria 1975
Village/Population DensityHigh Medium Low
Years of cultivation .............................. 1-2 1-2 1-2Years of fallow ................................... 1-2 3-4 5-6pH ............................................. 4.8 5.1 5.2Organic carbon ........................ % 2.77 3.15 2.74Base saturation ........................ % 50.38 74.40 71.28P (Bray P 1) ........................... ppm 9.60 22.12 29.75Exchangeable K ...................... me/100 g 0.12 0.11 0.13Effective CEC ......................... me/100 g 2.86 3.91 4.10
5. Farm management problems
Production on most farms in the humid tropics is severely limited because most of thefarmers are small-scale subsistence operators using traditional methods.The small size of farms (less than 2 hectares) not only restricts the scale of operationsbut makes mechanisation more difficult - a problem further complicated by the frag-mentation of these farms into many spatially-separated plots. Although farmers maybe able to acquire more land to increase their operational scale (by leasing, pledging orpurchasing additional land) the use of traditional implements such as the hoe andmatchet enables the farmer to cultivate only a maximum of a little more than I hectareannually. In the absence of draft animals in some zones (e.g. due to tse-tse fly in partsof Africa); and of suitable, small, power-driven equipment, human power is at presentthe only energy source available for increasing the scale of operations and output ofcassava and other root crops in most of the humid tropics. Flinn et al. [1974] suggestedthat as the average labour available per farm family is limited to about two adult maleequivalents, labour constraints during peak periods contribute to depressed yieldsthrough poor quality cultivation, sub-optimal task timing (e.g. late planting and lateweeding) incomplete weeding and partial harvest.In a recent farmer opinion survey in Nigeria, Ezeilo et al. [1975] found that the firstfour problems holding back yields were: lack of funds, lack of land, insects and diseas-es and high labour cost. Lack of capital deprives farmers of the capacity to expand pro-duction, or to take advantage of new technology. But, mere increase in the quantity ofcredit is unlikely by itself to result in modernisation of farming as farmers often havehigher-priority non-farm investments to which available credit may be diverted.Farmers need to be shown by extension workers how to adopt improved technologyin order to make effective use of credit, to maximise production, and thus avoid overin-debtedness to the credit institution.The small-scale farmer is help less against many pests and diseases of cassava and otherroot crops which cause severe yield losses. Hahn et al. [1977] concluded that the majorbiological constraint to cassava production in Nigeria is disease, especially cassavamosaic disease (CMD) and cassava bacterial blight (CBB) to which most local culti-vars are susceptible, which reduces yield to 5-10 tonnes/ha/ann. compared with poten-tial yields of more than 20 tonnes.
201
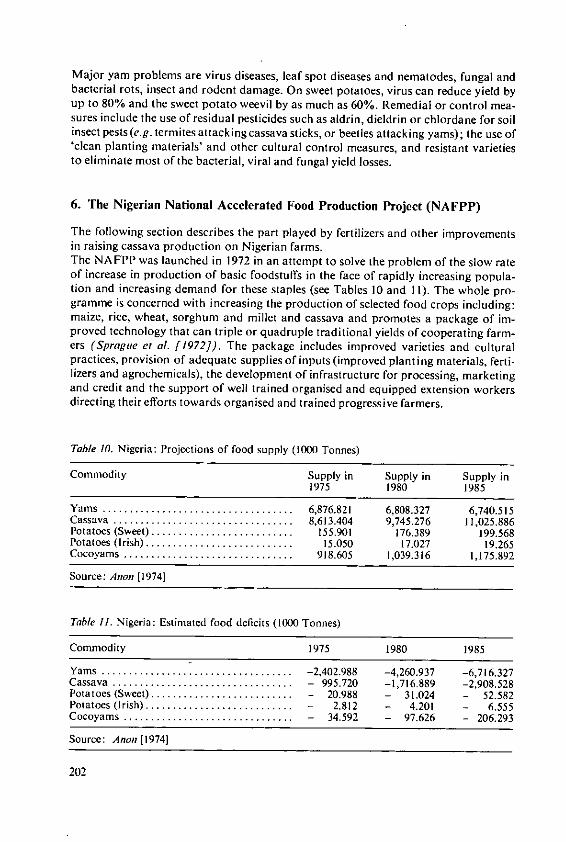
Major yam problems are virus diseases, leaf spot diseases and nematodes, fungal andbacterial rots, insect and rodent damage. On sweet potatoes, virus can reduce yield byup to 80% and the sweet potato weevil by as much as 60%. Remedial or control mea-sures include the use of residual pesticides such as aldrin, dieldrin or chlordane for soilinsect pests (e.g. termites attacking cassava sticks, or beetles attacking yams); the use of'clean planting materials' and other cultural control measures, and resistant varietiesto eliminate most of the bacterial, viral and fungal yield losses.
6. The Nigerian National Accelerated Food Production Project (NAFPP)
The following section describes the part played by fertilizers and other improvementsin raising cassava production on Nigerian farms.The NA FPP was launched in 1972 in an attempt to solve the problem of the slow rateof increase in production of basic foodstuffs in the face of rapidly increasing popula-tion and increasing demand for these staples (see Tables 10 and II). The whole pro-gramme is concerned with increasing the production of selected food crops including:maize, rice, wheat, sorghum and millet and cassava and promotes a package of im-proved technology that can triple or quadruple traditional yields of cooperating farm-ers (Sprague et al. [1972]). The package includes improved varieties and culturalpractices, provision of adequate supplies of inputs (improved planting materials, ferti-lizers and agrochemicals), the development of infrastructure for processing, marketingand credit and the support of well trained organised and equipped extension workersdirecting their efforts towards organised and trained progressive farmers.
Table 10. Nigeria: Projections of food supply (1000 Tonnes)
Commodity Supply in Supply in Supply in1975 1980 1985
Yams ................................... 6,876.821 6,808.327 6,740.515Cassava ................................. 8,613.404 9,745.276 11,025.886Potatoes (Sweet) .......................... 155.901 176.389 199.568Potatoes (Irish) ........................... 15.050 17.027 19.265Cocoyams ............................... 918.605 1,039.316 1,175.892
Source: Anon [1974]
Table II. Nigeria: Estimated food deficits (1000 Tonnes)
Commodity 1975 1980 1985
Yams .................................. -2,402.988 -4,260.937 -6,716.327Cassava ............... 995.720 -1,716.889 -2,908.528Potatoes (Sweet) .......................... 20.988 - 31.024 - 52.582Potatoes (Irish) ........................ . 2.812 - 4.201 - 6.555Cocoyams ............................... - 34.592 - 97.626 - 206.293
Source: Anon[1974]
202
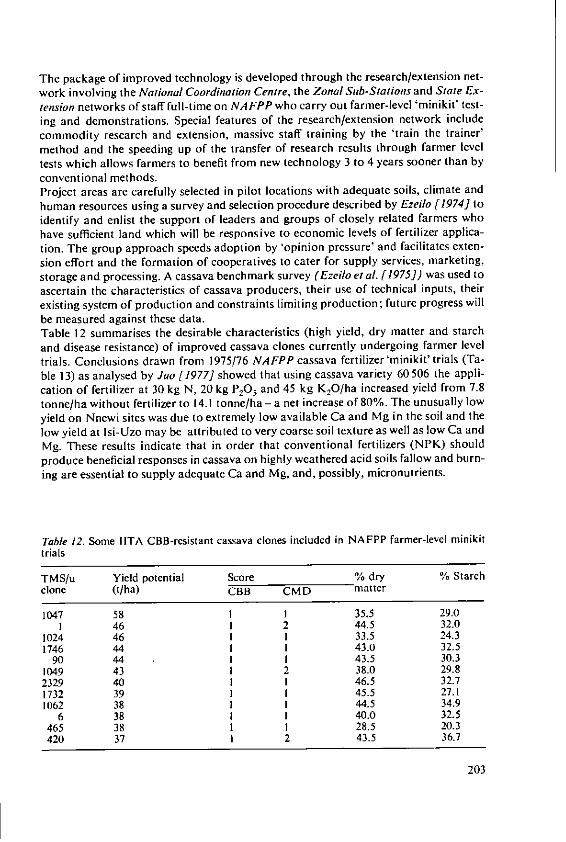
The package of improved technology is developed through the research/extension net-work involving the National Coordination Centre, the Zonal Sub-Stations and State Ex-tension networks of staff full-time on NAFPP who carry out farmer-level 'minikit' test-ing and demonstrations. Special features of the research/extension network includecommodity research and extension, massive staff training by the 'train the trainer'method and the speeding up of the transfer of research results through farmer level
tests which allows farmers to benefit from new technology 3 to 4 years sooner than byconventional methods.Project areas are carefully selected in pilot locations with adequate soils, climate and
human resources using a survey and selection procedure described by Ezeilo [1974] toidentify and enlist the support of leaders and groups of closely related farmers who
have sufficient land which will be responsive to economic levels of fertilizer applica-
tion. The group approach speeds adoption by 'opinion pressure' and facilitates exten-sion effort and the formation of cooperatives to cater for supply services, marketing,storage and processing. A cassava benchmark survey (Ezeilo et al. [1975]) was used toascertain the characteristics of cassava producers, their use of technical inputs, their
existing system of production and constraints limiting production; future progress will
be measured against these data.Table 12 summarises the desirable characteristics (high yield, dry matter and starch
and disease resistance) of improved cassava clones currently undergoing farmer level
trials. Conclusions drawn from 1975/76 NAFPP cassava fertilizer'minikit' trials (Ta-
ble 13) as analysed by Juo [1977] showed that using cassava variety 60506 the appli-cation of fertilizer at 30 kg N, 20 kg P205 and 45 kg K20/ha increased yield from 7.8
tonne/ha without fertilizer to 14.1 tonne/ha - a net increase of 80%. The unusually lowyield on Nnewi sites was due to extremely low available Ca and Mg in the soil and the
low yield at Isi-Uzo may be attributed to very coarse soil texture as well as low Ca andMg. These results indicate that in order that conventional fertilizers (NPK) should
produce beneficial responses in cassava on highly weathered acid soils fallow and burn-ing are essential to supply adequate Ca and Mg, and, possibly, micronutrients.
Table 12. Some IITA CBB-resistant cassava clones included in NAFPP farmer-level minikittrials
TMS/u Yield potential Score % dry % Starchclone (t/ha) CBB CMD matter
1047 58 1 I 35.5 29.01 46 1 2 44.5 32.0
1024 46 1 I 33.5 24.31746 44 1 I 43.0 32.5
90 44 1 I 43.5 30.31049 43 1 2 38.0 29.82329 40 1 I 46.5 32.71732 39 1 I 45.5 27.11062 38 1 I 44.5 34.9
6 38 1 1 40.0 32.5465 38 1 I 28.5 20.3420 37 1 2 43.5 36.7
203
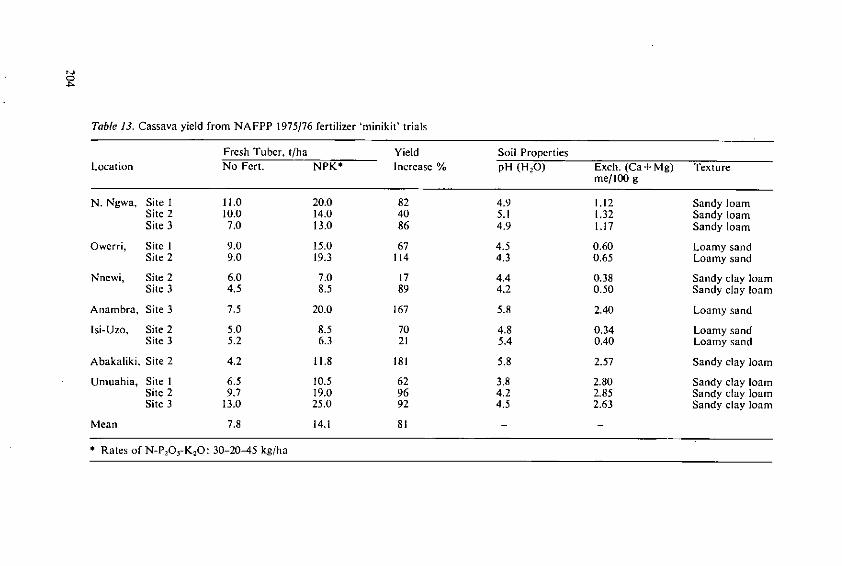
Table 13. Cassava yield from NAFPP 1975/76 fertilizer 'minikit' trials
Fresh Tuber, t/ha Yield Soil Properties
Location No Fert. NPK* Increase % pH (HO) Exch. (Ca+Mg) Textureme/100 g
N. Ngwa, Site 1 11.0 20.0 82 4.9 1.12 Sandy loamSite 2 10.0 14.0 40 5.1 1.32 Sandy loamSite 3 7.0 13.0 86 4.9 1.17 Sandy loam
Owerri, Site 1 9.0 15.0 67 4.5 0.60 Loamy sandSite 2 9.0 19.3 114 4.3 0.65 Loamy sand
Nnewi, Site 2 6.0 7.0 17 4.4 0.38 Sandy clay loamSite 3 4.5 8.5 89 4.2 0.50 Sandy clay loam
Anambra, Site 3 7.5 20.0 167 5.8 2.40 Loamy sand
Isi-Uzo, Site 2 5.0 8.5 70 4.8 0.34 Loamy sandSite 3 5.2 6.3 21 5.4 0.40 Loamy sand
Abakaliki, Site 2 4.2 11.8 181 5.8 2.57 Sandy clay loam
Unuahia, Site 1 6.5 10.5 62 3.8 2.80 Sandy clay loamSite 2 9.7 19.0 96 4.2 2.85 Sandy clay loamSite 3 13.0 25.0 92 4.5 2.63 Sandy clay loam
Mean 7.8 14.1 81 -
* Rates of N-PO,-K2O: 30-20-45 kg/ha
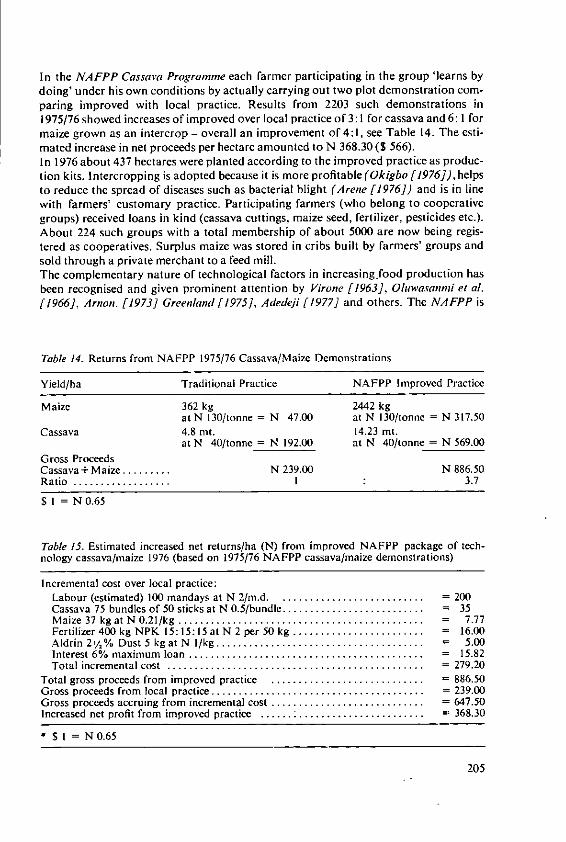
In the NAFPP Cassava Programme each farmer participating in the group 'learns bydoing' under his own conditions by actually carrying out two plot demonstration com-paring improved with local practice. Results from 2203 such demonstrations in1975/76 showed increases of improved over local practice of 3:1 for cassava and 6: 1 formaize grown as an intercrop - overall an improvement of 4:1, see Table 14. The esti-mated increase in net proceeds per hectare amounted to N 368.30 (S 566).I n 1976 about 437 hectares were planted according to the improved practice as produc-tion kits. lntercropping is adopted because it is more profitable (Okigbo [1976]), helpsto reduce the spread of diseases such as bacterial blight (Arene [1976]) and is in linewith farmers' customary practice. Participating farmers (who belong to cooperativegroups) received loans in kind (cassava cuttings, maize seed, fertilizer, pesticides etc.).About 224 such groups with a total membership of about 5000 are now being regis-tered as cooperatives. Surplus maize was stored in cribs built by farmers' groups andsold through a private merchant to a feed mill.The complementary nature of technological factors in increasing.food production hasbeen recognised and given prominent attention by Virone [1963], Oluwasanmi el al.[1966], Arnon. [1973] Greenland [1975], Adedeji [1977] and others. The NAFPP is
Table 14. Returns from NAFPP 1975/76 Cassava/Maize Demonstrations
Yield/ha Traditional Practice NAFPP Improved Practice
Maize 362 kg 2442 kgat N 130/tonne = N 47.00 at N 130/tonne = N 317.50
Cassava 4.8 mt. 14.23 mt.at N 40/tonne = N 192.00 at N 40/tonne = N 569.00
Gross ProceedsCassava +Maize ......... N 239.00 N 886.50R atio .................. 1 3.7
$ I = N 0.65
Table 15. Estimated increased net returns/ha (N) from improved NAFPP package of tech-nology cassava/maize 1976 (based on 1975/76 NAFPP cassava/maize demonstrations)
Incremental cost over local practice:Labour (estimated) 100 mandays at N 2/m.d . .......................... = 200Cassava 75 bundles of 50 sticks at N 0.5/bundle .......................... = 35M aize 37 kg at N 0.21/kg ............................................. = 7.77Fertilizer 400 kg NPK 15:15:15 at N 2 per 50 kg ........................ = 16.00Aldrin 2,/,% Dust 5 kg at N I/kg ...................................... = 5.00Interest 6% maximum loan ........................................... = 15.82Total incremental cost ............................................... = 279.20
Total gross proceeds from improved practice ............................ = 886.50Gross proceeds from local practice ....................................... = 239.00Gross proceeds accruing from incremental cost ............................ = 647.50Increased net profit from improved practice ............................. = 368.30
* $ I = N 0.65
205
an example of an on-going project which is beginning to achieve a rapid increase in theproduction of cassava (and intercrops) by the rational inter-related use of physical,technical, social and economic factors of production. The NAFPP has been described(Anon. [1976]) as the cornerstone of Nigeria's agricultural development.
Bibliography
1. Adedeji, A.: Africa's economic strategy. Magazine Africa No.71, pp.47-50 (1977)2. Anonymous: Annual Report 1959-1960, Agriculture Division, Ministry of Agriculture,
Eastern Nigeria (1961)3. Anonymous: Agricultural Development in Nigeria 1973-1985, Federal Ministry of Agri-
culture and Natural Resources Joint Planning Committee, Lagos (1974)4. Anonymous: NAFPP Newsletter, Federal Department of Agriculture, P.M.B. 12613, La-
gos (1976)5. Anonymous: Anambra State OFN/MANR Fertilizer Promotion Programme Labels, 19776. Arene, O.B.: Influence of shade and intercropping on the incidence of cassava bacterial
blight caused by Xanthomonas ,anihotis, 19767. Arnon, I.: Methods for introducing fertilizer use into farming practice. 10th Colloquium
Int. Potash Institute, pp. 569-582 (1973)8. Ayernor, G.S.: In-House report Root and Tuber Improvement Program. International
Institute of Tropical Agriculture, 19779. Bol/uis, G.G.: The toxicity of cassava roots. Netherlands J. Agric. Science, 2(3), 176-185
(1954)10. C.I.A.T.: Annual report of Centro Internac. Agric. Tropical Colombia, p. 93 (1974)I1. Coulter, J.K.: In: Soils of the Humid Tropics, pp. 189-197. Nat. Acad. Sci., Washington,
D.C., 197212. Cours, G.: Amdlioration des plantes: le manioc. Bull. Rech. Agron. Madagascar 2, 78-88
(1958)13. Cours, G. et al.: Fertilit6 12,3-20(1961)14. Coursey, D.G.: The Status of Root Crops: A culture-historical perspective. Indian Society
for Root Crops Vol. 2, No. 1, pp. 2-3 (1976)15. Dijk, J. W. van: Plant, bodem en bemesting 1I. Bemesting. J.B. Wolters, Groningen, Neth-
erlands, p. 200, 195116. Ezeilo, W. N. 0.: Cassava production training course. International Institute of Tropical
Agriculture, Ibadan, 197417. Ezeilo, W.N.O., Flinn, J.C. and Williams, L.B.: Cassava producers and cassava produc-
tion in the East Central State (ECS) of Nigeria. National Accelerated Food ProductionProject ECS Cassava Benchmark Survey, 1975
18. Flinn, J. C.: Cassava production and consumption - a global to Nigerian Overview, 197419. Flinn, J. C., Jellema, B. M., and Robinson, K. L.: Barriers to increasing food production in
the lowland humid tropics 1976. Seminar of OLAC/MEA Program Advisors in Agricul-ture, lbadan, Nigeria, I May, 1974
20. Flinn, J. C. and Lagemann, J.: Experiences in growing maize using 'improved technology'in South Eastern Nigeria, 1976
21. Foodand Agriculture Organization: 1973 Production Yearbook. Vol. 22, p. 36 (1974)22. Geus, J.G. de: Fertilizer guide for tropical and sub-tropical farming. Centre d'Etude de
l'Azote, Zurich, Switzerland, pp. 181-185, 196723. Greenland, D.J.: Bringing the Green Revolution to the Shifting Cultivator Science 190,
841-884 (1975); Copyright 1975 by the American Association for the Advancement ofScience
24. Hahn, S.K. and Howland, A. K.: Breeding for resistance to cassava mosaic. Proc. CassavaMosaic Workshop. pp. 37-39. IITA, lbadan, Nigeria. Dec. 1972
25. Hahn, S. K., Howland, A. K., and Wilson, J.E.: International Institute of Tropical Agricul-ture (IITA, Ibadan), 1977
26. International Institute of Tropical Agriculture (IITA): 1972 Annual Report of Root,Tuber and Vegetable Improvement Program, IITA, lbadan, Nigeria (1972)
206
27. International Institute of Tropical Agriculture (IITA): 1975 Annual Report of Root andTuber Improvement Program (1975)
28. International Institute of Tropical Agriculture (IITA): Root and Tuber Improvement Pro-gram, In-House Report 1976, 1977
29. Jacoby, T.: Nutrition and manuring of root crops. Verlagsgesellschaft fuir Ackerbau,Hannover; Green. Bull. No. 19, 9-16, 1965
30. Jennings, D. L. and Martin, F. W.: The utilization of cassava variability on an internation-al basis. Third International Symposium on Tropical Root Crops, IITA, lbadan (1973)
31. Juo, A.S.R.: International Institute of Tropical Agriculture, lbadan. Unpublished data,1977
32. Krockmal, A. and Samuels, G.: Deficiency symptoms in nutrient pot experiment with cas-sava. Ceiba 14 (1), 7-16 (1967)
33. Kumar, B.M., Mandal, R. C., and Magoon, M. L.: Influence of potash on cassava. IndianJ. Agron. 16, 82-84 (1971)
34. Malavolta, E., Graner, E. A., Coury, T., Sobr, M. O. C. B. and Pacheco, J. A. C.: Studies onthe mineral nutrition of cassava (Manihot utilissina, Pohl). Plant Phys. 30, 81-82 (1955)
35. Nijiholt, J.A.: Opname van voedingstoffen uit de bodem, 193636. Normanha, E.S. and Pereira, A.S.: Aspectos agron6micos da cultura de mandioca (Ma-
nihot utilissima, Pohl). (Agronomic aspects of the cultivation of cassava) Bragantia 10,179-202 (1950)
37. Nwinyi, S.C. 0.: Some factors affecting effective fertilizer use in the agriculture of Nigeria.Proceedings of the 10th Colloquium of the International Potash Institute p. 503 (1973)
38. Nye, P.H. and Greenland, D.J.: Commonw. Agr. Bur. Tech. Comm. (England) 51, 1-156(1960)
39. Obigbesan, G. 0.: The influence of potassium nutrition on the yield and chemical compo-sition of some tropical root and tuber crops. Proceedings of the 10th Colloquium of theInternational Potash Institute pp. 439-451 (1973)
40. Obigbesan, G.O.: Nutritional problems in root crop production. National seminar onroot and tuber crops at the National Root Crops Research Institute, Umudike 1977
41. Oktgbo, B.N.: International Institute of Tropical Agriculture, Ibadan, 1976 Annual Re-port (1977)
42. Oluwasanmi, H.A.el aL: Ubona, asocio-economic and nutritional survey of a rural com-munity in Eastern Nigeria. Shell Monograph published as Occasional Papers No. 6 of theWorld Land Use Survey, Geographical Publications Ltd., 1966
43. Phillips, T.P.: Cassava Utilization and Potential Markets IDRC Ottawa, Canada, 197444. Sanchez, P.A.: N.C. Agr. Exp. Sta. Tech. Bull. 219, 46-A7 (1973)45. Singh, B.R.: Delivery Systems National Accelerated Food Production Project, Review
and Recommendations, 197646. Tropical Products Institute: Crop and Product Digest 2. Tropical Products Institute, For-
eign and Commonwealth Office, London, 197347. Virone, L. E.: Borgo a Mozzano. Occasional papers No. 4 of the World Land Use Survey,
International Geographical Union, 196348. Witt, L. W.: Changes in the agriculture of South Central Brazil. J. Farm Economics 25,
622-643 (1953)
207
The Effects of Nitrogen and PotassiumNutrition on Yield and Quality of Sugar Beet
A. Kdchl, Federal Institute of Agricultural Chemistry, Vienna/Austria*
Summary
The influence of varying N-K nutrition on the yield and quality of sugar beet was studied inchanging solution culture. The two nutrients had contrasting effects on the yield of leaves, stor-age roots and roots, N being mainly effective by increasing leaf weight, while K, by favouringtransport of metabolites to the storage organs, had its main effect in increasing beet weight.There was a marked positive interaction between N and K in beet weight. The optimum N:Kratio was 1.0:0.7 on the basis of equivalents (N: K2O 1: 2.35 by weight).Both N and K affected quality by influencing beet sugar content and by influencing extract-ability. While sugar concentration in beet decreased linearly with increasing N, increasing Kin-creased sugar and its effect was greater the higher the N level.Alkalinity (Na and K) and a-amino nitrogen content of beet were determined. Increasing K re-duced the content of both groups of substances in relation to sugar, while increasing N in-creased them, particularly a-amino nitrogen content. K reduced the sugar retained in molasseswhile N increased it. The highest yield of refined sugar was obtained with moderate N and highK levels.
Introduction
The two elements nitrogen and potassium differ in many respects in their effects onplant growth. Nitrogen through its direct participation in protein synthesis has a directeffect on yield; potassium is an activator of many enzymes concerned in CO, and N as-similation, favouring the formation of N compounds of high molecular weight and,above all, the synthesis of carbohydrates for storage. The elements differ in their influ-ence on the growth of roots and shoots (Steineck [1962, 1964]) and this is of particu-lar significance in the case of sugar beet which is endowed with large storage organs. Itis thus not surprising that there have been many experiments concerned with the actionof nitrogen and potassium in determining yield and quality criteria of sugar beet, for ex-ample: Baldwin [1969], Bronner [1976], Forster [1970], Graf and Mueller [1971],Kiepe [1966], Koch and Mengel [1970], Luedecke and Nitzsche [1964], Mueller, Nie-mann and Werner [1962] and Wieninger and Kubadinow [1973]. In the majority of cas-
* A. Kdchl, Dipl. Ing., Landwirtschaftlich-chemische Bundesversuchsanstalt, Trunnerstrasse I,
A-1020 Vienna/Austria
209
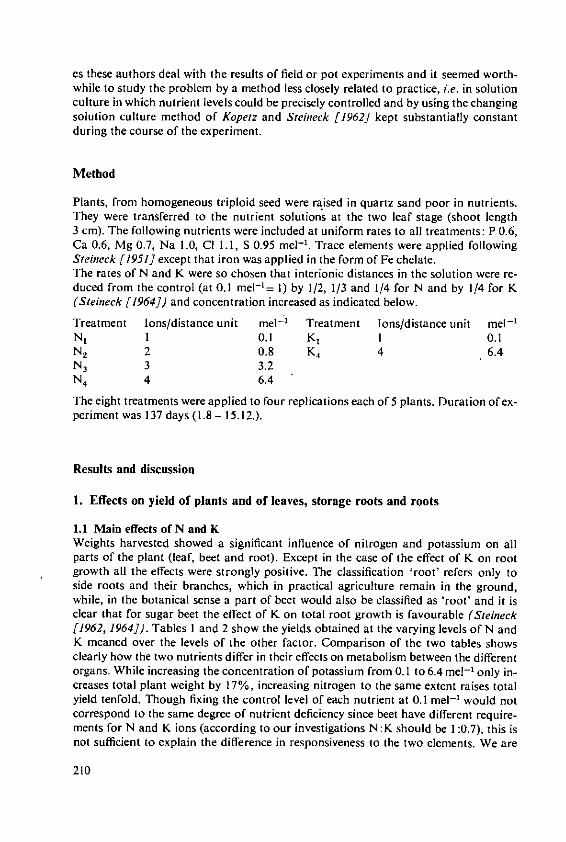
es these authors deal with the results of field or pot experiments and it seemed worth-while to study the problem by a method less closely related to practice, i.e. in solutionculture in which nutrient levels could be precisely controlled and by using the changingsolution culture method of Kopetz and Steineck [1962] kept substantially constantduring the course of the experiment.
Method
Plants, from homogeneous triploid seed were raised in quartz sand poor in nutrients.They were transferred to the nutrient solutions at the two leaf stage (shoot length3 cm). The following nutrients were included at uniform rates to all treatments: P 0.6,Ca 0.6, Mg 0.7, Na 1.0, Cl 1.1, S 0.95 mel-'. Trace elements were applied followingSteineck [1951] except that iron was applied in the form of Fe chelate.The rates of N and K were so chosen that interionic distances in the solution were re-duced from the control (at 0.1 me[t= I) by 1/2, 1/3 and 1/4 for N and by 1/4 for K(Steineck [1964]) and concentration increased as indicated below.
Treatment Ions/distance unit me1- Treatment Ions/distance unit mel -
N, 1 0.1 K, I 0.1N 2 2 0.8 K4 4 6.4N3 3 3.2N4 4 6.4
The eight treatments were applied to four replications each of 5 plants. Duration of ex-periment was 137 days (1.8 - 15.12.).
Results and discussion
1. Effects on yield of plants and of leaves, storage roots and roots
1.1 Main effects of N and KWeights harvested showed a significant influence of nitrogen and potassium on allparts of the plant (leaf, beet and root). Except in the case of the effect of K on rootgrowth all the effects were strongly positive. The classification 'root' refers only toside roots and their branches, which in practical agriculture remain in the ground,while, in the botanical sense a part of beet would also be classified as 'root' and it isclear that for sugar beet the effect of K on total root growth is favourable (Steineck[1962, 1964]). Tables I and 2 show the yields obtained at the varying levels of N andK meaned over the levels of the other factor. Comparison of the two tables showsclearly how the two nutrients differ in their effects on metabolism between the differentorgans. While increasing the concentration of potassium from 0.1 to 6.4 mel-' only in-creases total plant weight by 17%, increasing nitrogen to the same extent raises totalyield tenfold. Though fixing the control level of each nutrient at 0.1 mel-' would notcorrespond to the same degree of nutrient deficiency since beet have different require-ments for N and K ions (according to our investigations N:K should be 1:0.7), this isnot sufficient to explain the difference in responsiveness to the two elements. We are
210
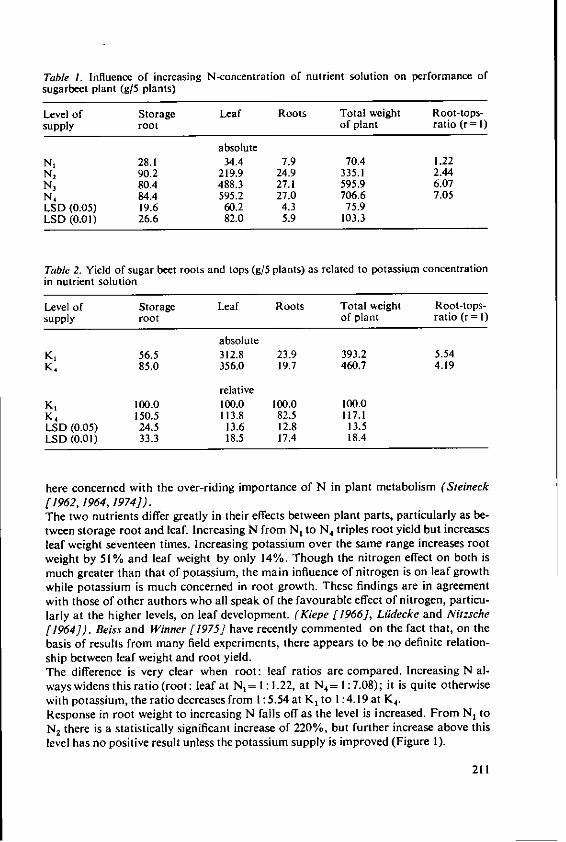
Table 1. Influence of increasing N-concentration of nutrient solution on performance ofsugarbeet plant (g/5 plants)
Level of Storage Leaf Roots Total weight Root-tops-supply root of plant ratio (r = 1)
absoluteN, 28.1 34.4 7.9 70.4 1.22N2 90.2 219.9 24.9 335.1 2.44N3 80.4 488.3 27.1 595.9 6.07N, 84.4 595.2 27.0 706.6 7.05LSD (0.05) 19.6 60.2 4.3 75.9LSD (0.01) 26.6 82.0 5.9 103.3
Table 2. Yield of sugar beet roots and tops (g/5 plants) as related to potassium concentrationin nutrient solution
Level of Storage Leaf Roots Total weight Root-tops-supply root of plant ratio (r = 1)
absoluteK, 56.5 312.8 23.9 393.2 5.54K, 85.0 356.0 19.7 460.7 4.19
relativeK, 100.0 100.0 100.0 100.0K4 150.5 113.8 82.5 117.1LSD (0.05) 24.5 13.6 12.8 13.5LSD (0.01) 33.3 18.5 17.4 18.4
here concerned with the over-riding importance of N in plant metabolism (Steineck
[1962, 1964, 1974]).The two nutrients differ greatly in their effects between plant parts, particularly as be-
tween storage root and leaf. Increasing N from N, to N 4 triples root yield but increases
leaf weight seventeen times. Increasing potassium over the same range increases root
weight by 51 % and leaf weight by only 14%. Though the nitrogen effect on both is
much greater than that of potassium, the main influence of nitrogen is on leaf growth
while potassium is much concerned in root growth. These findings are in agreementwith those of other authors who all speak of the favourable effect of nitrogen, particu-
larly at the higher levels, on leaf development. (Kiepe [1966], Lildecke and Nitzsche
[1964]). Beiss and Winner [1975] have recently commented on the fact that, on the
basis of results from many field experiments, there appears to be no definite relation-
ship between leaf weight and root yield.The difference is very clear when root: leaf ratios are compared. Increasing N al-
ways widens this ratio (root: leaf at N,= 1: 1.22, at N 4 = 1 : 7.08); it is quite otherwisewith potassium, the ratio decreases from 1: 5.54 at K 1 to 1: 4.19 at K 4.
Response in root weight to increasing N falls off as the level is increased. From N 1 to
N 2 there is a statistically significant increase of 220%, but further increase above this
level has no positive result unless the potassium supply is improved (Figure 1).
211
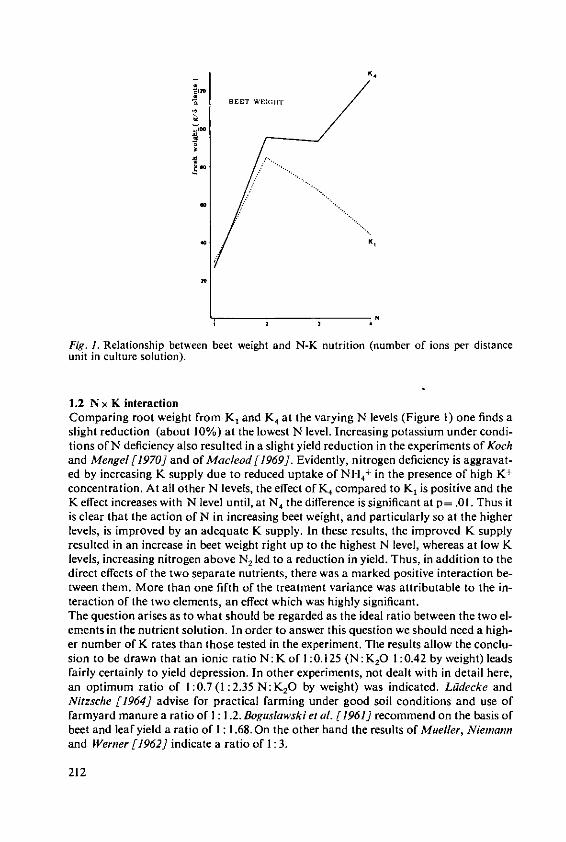
K4
" B3EET WEIGHFT
.'00
- K I
SN
Fig. 1. Relationship between beet weight and N-K nutrition (number of ions per distanceunit in culture solution).
1.2 N x K interactionComparing root weight from K, and K4 at the varying N levels (Figure t) one finds aslight reduction (about 10%) at the lowest N level. Increasing potassium under condi-tions of N deficiency also resulted in a slight yield reduction in the experiments of Kochand Mengel [1970] and of Macleod [19691. Evidently, nitrogen deficiency is aggravat-ed by increasing K supply due to reduced uptake of NH 4+ in the presence of high K +
concentration. At all other N levels, the effect of K4 compared to K, is positive and theK effect increases with N level until, at N4 the difference is significant at p= .01. Thus itis clear that the action of N in increasing beet weight, and particularly so at the higherlevels, is improved by an adequate K supply. In these results, the improved K supplyresulted in an increase in beet weight right up to the highest N level, whereas at low Klevels, increasing nitrogen above N, led to a reduction in yield. Thus, in addition to thedirect effects of the two separate nutrients, there was a marked positive interaction be-tween them. More than one fifth of the treatment variance was attributable to the in-teraction of the two elements, an effect which was highly significant.The question arises as to what should be regarded as the ideal ratio between the two el-ements in the nutrient solution. In order to answer this question we should need a high-er number of K rates than those tested in the experiment. The results allow the conclu-sion to be drawn that an ionic ratio N: K of I : 0.125 (N: K,0 1: 0.42 by weight) leadsfairly certainly to yield depression. In other experiments, not dealt with in detail here,an optimum ratio of 1:0.7 (1:2.35 N:KO by weight) was indicated. Ladecke andNitzsche [1964] advise for practical farming under good soil conditions and use offarmyard manure a ratio of I : 1.2. Boguslawski et at. [1961] recommend on the basis ofbeet and leaf yield a ratio of I : 1.68. On the other hand the results of Mueller, Nienannand Werner [1962] indicate a ratio of 1: 3.
212
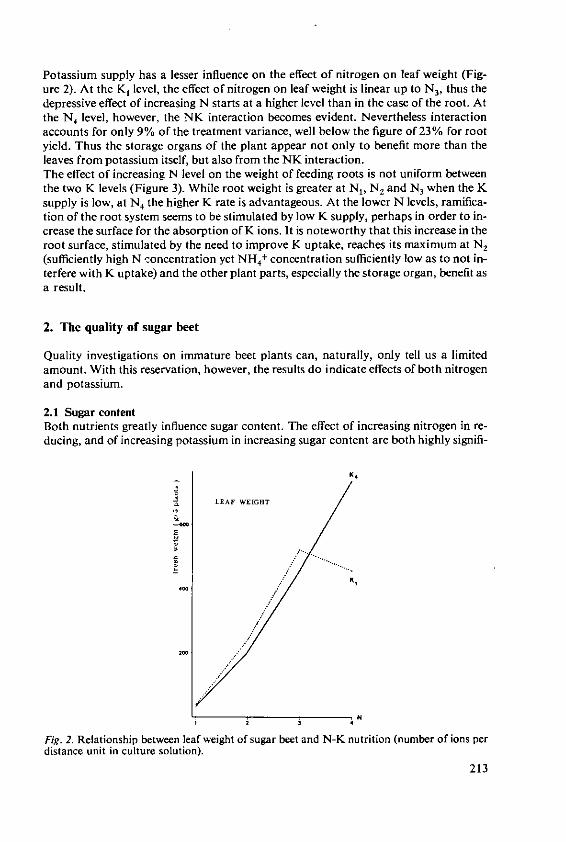
Potassium supply has a lesser influence on the effect of nitrogen on leaf weight (Fig-ure 2). At the K, level, the effect of nitrogen on leaf weight is linear up to N3, thus thedepressive effect of increasing N starts at a higher level than in the case of the root. Atthe N, level, however, the NK interaction becomes evident. Nevertheless interactionaccounts for only 9% of the treatment variance, well below the figure of 23% for rootyield. Thus the storage organs of the plant appear not only to benefit more than theleaves from potassium itself, but also from the NK interaction.The effect of increasing N level on the weight of feeding roots is not uniform betweenthe two K levels (Figure 3). While root weight is greater at N1, N2 and N3 when the Ksupply is low, at N4 the higher K rate is advantageous. At the lower N levels, ramifica-tion of the root system seems to be stimulated by low K supply, perhaps in order to in-crease the surface for the absorption of K ions. It is noteworthy that this increase in theroot surface, stimulated by the need to improve K uptake, reaches its maximum at N,(sufficiently high N concentration yet NH4 concentration sufficiently low as to not in-terfere with K uptake) and the other plant parts, especially the storage organ, benefit asa result.
2. The quality of sugar beet
Quality investigations on immature beet plants can, naturally, only tell us a limitedamount. With this reservation, however, the results do indicate effects of both nitrogenand potassium.
2.1 Sugar contentBoth nutrients greatly influence sugar content. The effect of increasing nitrogen in re-ducing, and of increasing potassium in increasing sugar content are both highly signifi-
K,
LEAF WEIGHT
K,
2 3 4
Fig. 2. Relationship between leaf weight of sugar beet and N-K nutrition (number of ions perdistance unit in culture solution).
213
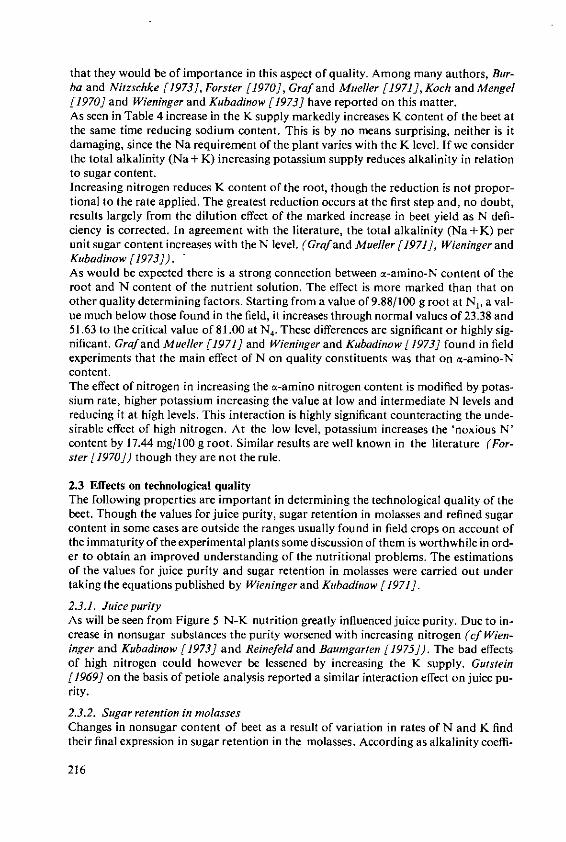
that they would be of importance in this aspect of quality. Among many authors, Bur-ba and Nitzschke [1973], Forster [1970], Graf and Mueller [1971], Koch and Mengel[1970] and Wieninger and Kubadinow [1973] have reported on this matter.As seen in Table 4 increase in the K supply markedly increases K content of the beet atthe same time reducing sodium content. This is by no means surprising, neither is itdamaging, since the Na requirement of the plant varies with the K level. If we considerthe total alkalinity (Na + K) increasing potassium supply reduces alkalinity in relationto sugar content.Increasing nitrogen reduces K content of the root, though the reduction is not propor-tional to the rate applied. The greatest reduction occurs at the first step and, no doubt,results largely from the dilution effect of the marked increase in beet yield as N defi-ciency is corrected. In agreement with the literature, the total alkalinity (Na + K) perunit sugar content increases with the N level. (Grafand Mueller [1971], Wieninger andKubadinow [1973]).As would be expected there is a strong connection between a-amino-N content of theroot and N content of the nutrient solution. The effect is more marked than that onother quality determining factors. Starting from a value of 9.88/100 g root at N1, a val-ue much below those found in the field, it increases through normal values of 23.38 and51.63 to the critical value of 81.00 at N4. These differences are significant or highly sig-nificant. Graf and Mueller [1971] and Wieninger and Kubadinow [1973] found in fieldexperiments that the main effect of N on quality constituents was that on m-amino-Ncontent.The effect of nitrogen in increasing the a-amino nitrogen content is modified by potas-sium rate, higher potassium increasing the value at low and intermediate N levels andreducing it at high levels. This interaction is highly significant counteracting the unde-sirable effect of high nitrogen. At the low level, potassium increases the 'noxious N'content by 17.44 mg/100 g root. Similar results are well known in the literature (For-ster [1970]) though they are not the rule.
2.3 Effects on technological qualityThe following properties are important in determining the technological quality of thebeet. Though the values for juice purity, sugar retention in molasses and refined sugarcontent in some cases are outside the ranges usually found in field crops on account ofthe immaturity of the experimental plants some discussion of them is worthwhile in ord-er to obtain an improved understanding of the nutritional problems. The estimationsof the values for juice purity and sugar retention in molasses were carried out undertaking the equations published by Wieninger and Kubadinow [1971].
2.3.1. JuicepurityAs will be seen from Figure5 N-K nutrition greatly influenced juice purity. Due to in-crease in nonsugar substances the purity worsened with increasing nitrogen (ef Wien-inger and Kubadinow [1973] and Reinefeld and Baumgarten [1975]). The bad effectsof high nitrogen could however be lessened by increasing the K supply. Gutstein[1969] on the basis of petiole analysis reported a similar interaction effect on juice pu-rity.
2.3.2. Sugar retention in molassesChanges in nonsugar content of beet as a result of variation in rates of N and K findtheir final expression in sugar retention in the molasses. According as alkalinity coeffi-
216
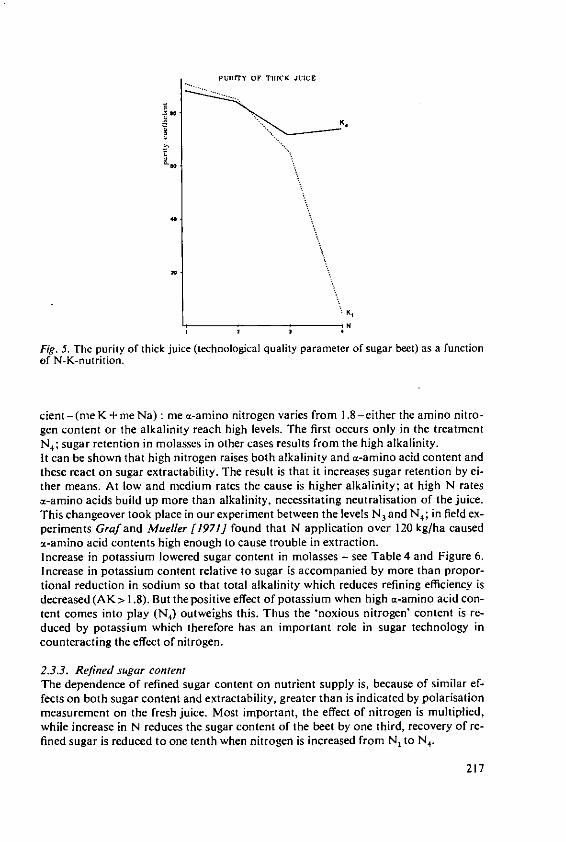
PURITy OF THICK JUICE
..
K,
N
Fig. 5. The purity of thick juice (technological quality parameter of sugar beet) as a functionof N-K-nutrition.
cient-(me K+me Nat) me a-amino nitrogen varies from 1.8-either the amino nitro-gen content or the alkalinity reach high levels. The first occurs only in the treatmentN,; sugar retention in molasses in other cases results from the high alkalinity.It can be shown that high nitrogen raises both alkalinity and a-amino acid content andthese react on sugar extractability. The result is that it increases sugar retention by ei-ther means. At low and medium rates the cause is higher alkalinity; at high N ratesa-amino acids build up more than alkalinity, necessitating neutralisation of the juice.This changeover took place in our experiment between the levels N, and N,; in field ex-periments Graf and Mueller [1971] found that N application over 120 kg/ha causeda-amino acid contents high enough to cause trouble in extraction.Increase in potassium lowered sugar content in molasses - see Table 4 and Figure 6.increase in potassium content relative to sugar is accompanied by more than propor-tional reduction in sodium so that total alkalinity which reduces refining efficiency isdecreased (AK> 1.8). But the positive effect of potassium when high a-amino acid con-tent comes into play (N,) outweighs this. Thus the 'noxious nitrogen' content is re-duced by potassium which therefore has an important role in sugar technology incounteracting the effect of nitrogen.
2.3.3. Refined sugar ContentThe dependence of refined sugar content on nutrient supply is, because of similar ef-fects on both sugar content and extractability, greater than is indicated by polarisationmeasurement on the fresh juice. Most important, the effect of nitrogen is multiplied,while increase in N reduces the sugar content of the beet by one third, recovery of re-fined sugar is reduced to one tenth when nitrogen is increased from N, to N,.
217
Potassium on the other hand has positive effects on both sugar content in the beet andupon its extractability. The overall increase in recoverable sugar is 98%, much greaterthan that on the content of unrefined sugar (47%). As can be seen in Figure 7 the mu-tual action of the two elements is thus further expressed in the final analysis.
SUAR [N MOLASSES K,
Fig. 6. Influence of N-K-nutrition on the quantity of molasses sugar (parts of sugar contentin %).
RECOVEILARLE SUCROSE (7)
K.
Fig. 7. Relationship between the percentage of recoverable sucrose and N-K nutrition.
218

SI4C
2.4 Yield of refined sugarUnder the conditions of this experiment 0.8 me N per litre of nutrient solution was suf-ficient for the realisation of maximum sugar yield and extractability. Higher rates gavepoorer results (as in the field experiments made by Grafand Mueller [1971] and Kiepe[1966] above 120 kg N/ha) but this was ameliorated by raising the potassium level sothat it exceeded that at N1 by 40 or 80%. One sided increase of nitrogen resulted in se-vere reduction of yield of refined sugar. Improved potassium supply doubled the yieldof refined sugar.
References
Baldwin, C.S. and Stevenson, C.K.: Der Einfluss der Stickstoffdfingung aufZuckerrfbenertrag, Zuckergehalt und Klarsaftreinheit. J. Amer. Sugar Bet Technol. 15,522-527 (1969)
Beiss, U. and Winner, C.: Ertragsbildung, Nahrstoffaufnahme und Nahrstoffentzug derZuckerrilbe. Zucker 28, 461-471 (1975)
Boguslawski, E. v., Atanasiu, N. and Zamani, R.: Ndhrstoffaufnahme und Nihrstoffverhaltnisim Laufe der Vegetation bei Zuckerribe. 2ucker 14, 398-404, 426-435 (1961)
Bronner, H.: Kenndaten des pflanzenverfigbaren Bodenstickstoffs in Beziehung zurn Wachs-turn der Zuckerriibe. Die Bodenkultur 27, 18-59, 120-161 (1976)
Burba, M. and Nitzschke, U.: Stoffwechselphysiologische Untersuchungen an Zuckerraibenwihrend der Vegetationszeit. Zucker 26, 356-366 (1973)
Forster, H.: Die Auswirkungen verschiedener variierter ErnAhrungsbedingungen auf den Er-trag und die Qualitit der Zuckerrfibe. Zucker 23, 343-346 (1970a.)
Graf, A. and Miller, H.J.: Die Rentabilitit von Stickstoff-Dfingergaben bei Zuckerraibe. DieBodenkultur 22, Sonderheft, 137-168 (1971)
Gutstein, Y.: Beziehungen zwischen Nitratstickstoff, Kalium und Natrium im Blatt der wach-senden Rijbe und deren spaiteren Ertrags- und Qualit~itsmerkmalen. Zucker 22, 505-511(1969)
Kiepe, H.: Die Rentabilitdtsgrenze der Stickstoffdungung zu Zuckerrtiben. Zucker 19, 631-634(1966)
Koch, K. and Mengel, K.: Der Einfluss einer variierten Stickstoff- und Kaliumernaihrung aufden Gehalt an 1slichen Aminosiluren und auf die Ertragsbildung bei Zuckerrfiben. Landw.Forschung 23, 353-362 (1970)
Kopetz, L.M. and Steineck, 0.: Zur Frage der Untersuchung von Ndihrstoffwirkungen. DieBodenkultur 13, 145-162(1962)
Ladecke, H., Nitzsche, M.: Ober das Stickstoff-Kalium-Verhiltnis bei Zuckerrbiben und des-sen Einfluss auf Ertrag, Qualit~it und Zuckerausbeute. Zucker 17, 173-178, 203-210 (1964)
Macleod, L. B.: Effects of N, P and K and their interactions on the yield and kernel weight ofbarley in hydroponic culture. Agron. Journal 61, 26-29 (1969)
Mfiller, K., Niemann, A. and Werner, W.: Der Einfluss des Stickstoff-Kali-Verhaltnisses aufErtrag und Qualitit der Zuckerribe. Zucker 15, 142-146 (1962)
Reinefeld, E. and Baumgarten, G.: Verarbeitungseigenschaften der Zuckerrflbe inAbhiingigkeit vom Stickstoffangebot. Zucker 28, 61-71 (1975)
Reuss, J.O.: Nitrogen regulation in sugar beets. Sugar Journal 33, 25-27 (1970)Steineck, 0.: Nahrldsungen der Pflanzenkultur. Die Bodenkultur 5, 313-324 (1951)Steineck, 0.: Untersuchungen mit der Wechselliisungskultur Oiber spezifische Wirkungen der
Nhhrstoffe Stickstoff und Kali auf das Pflanzenwachstum. Die Bodenkultur 13, 249-267(1962)
Steineck, 0.: Sprossbildung und Wurzelwachstum verschiedener Kulturpflanzen bei konstan-tern Angebot steigender Mengen der Nhhrstoffe N und K. Die Bodenkultur 15, 268-284(1964)
Steineck, 0.: Stickstoff als Ertragsfaktor, Osterreichische DfOngerberatungsstelle, Symposium1974
Wieninger, L. and Kubadinow, N.: Beziehungen zwischen Ruibenanalysen und technischerBewertung von Zuckerruben. Zucker 24, 599-604 (1971)
Wieninger, L. and Kubadinow, N.: Die Stickstoffdingung und ihre Auswirkungen auf tech-nologische Qualitatsmerkmale der Zuckerruibe. Zucker 26, 65-70 (1973)
219
The Effect of Potash Fertilizeron Sugar Beet Yield:Comparison of Solid and Fluid FertilizerA.Benvenuti and S.Miele, Institute for General Agronomy and Crop Science, University ofPisa, Pisa/ltaly*
Summary
The experiment tested the effects of nitrogen and phosphorus fertilisers applied at a constantrate of 200 kg N/ha and P20, respectively with varying rates of potassium (0-200 kg K20/ha)on root and sugar yield of beet grown on an alluvial clay-loam soil. The efficiency of applyingnutrients all in granular form, or as anhydrous ammonia plus granular P and K, or all inthe liquid form was also compared. The highest root and sugar yields were obtained at200 kg K20/ha-67 t/ha roots at 15,3% sugar. The different methods of application producedsubstantially similar yields.
Introduction
It is important that fertilizers for sugar beet should be correctly balanced. In mostparts of Europe where sugar beet is grown, nitrogen is generally considered to be thekey nutrient. This is due to the fact that usually this nutrient is present in the soil ininsufficient quantities, seldom higher than about 600 kg/ha, rather than to a particularneed of the plant for N.Research to determine the optimum nitrogen rate has been done in many countries.Time of application and type of fertilizer have also been studied, since these are bothimportant for root production and sugar yield. Various aspects of these problems havebeen dealt with by Baldwin et al. [1956], Tolman et al. [1958], Ulrich et al. [1959],Schmehl et al. [1963], Haddock et al. [1965], Campbell et al. [1967], Boyd et al.[1970]. The adverse effect of late applied nitrogen on sugar yield through increasein 'noxious nitrogen' is also mentioned.Davis et al. [1962] mention that phosphorus has only a limited effect on sugar pro-duction. This is true in most countries where sugar beet is grown since P reserveshave accumulated in the soil from normal applications, usually as manure, and theseare considered to be sufficient, at least within limits, to assure high yields withoutfurther applications. Crowther et al. [1941] summarizing the results of 200 experimentsin which phosphorus was applied at increasing rates obtained moderate yield increases,
* Prof. Dr. A. Benvenuti and Dr. S. Miele, Istituto di Agronomia generale e Coltivazionierbacee, Via S. Michele degli Scalzi 4, Pisa/Italy
221
not more than 0,75 t/ha sugar. Boyd et al. [1957] obtained yield increases of a similarorder. 0sen et al. [1950] noted that sugar beet only takes up 10-12% of the phosphateapplied in fertiliser and that P utilisation could be improved by placement near theseed. The main effects of P on deficient soils are more uniform emergence and higherinitial seedling vigour.Potassium is found in large quantity in the plant and has been shown to increasegreatly root yield and sugar content, without danger of excessive negative effects.Most of the Italian sugar beet soils are, from the point of view of physical properties,not exactly ideal for beet growing but, from the point of view of nutrient supply, theyare particularly favourable as they are high in available K20. If this element is defi-cient - and this is often the case in Europe - the effects on growth are as obvious asthose of N deficiency. Potassium improves the development of the aerial parts of theplant with a number of resulting advantages. It should be noted that the effect ofpotassium on juice purity has been differently interpreted by various authors. Tinker[1967] and Bolton et al. [1968] have come to contrasting conclusions.Fluid fertilisers have a number of attractive advantages over solids. The formulation,stability and distribution of fluids present some problems, particularly in the caseof the more complex types. For some time we have had an interest in these newtechniques and have worked with a range of crops including sugar beet which isresponsive to fertilizer and very demanding as to cultivation conditions. The mainobject of our study was to compare conventional solid fertiliser with fluid forms atvarious nutrient ratios.
Experimental
The experiment was on a large, completely uniform area of deep clay-loam soil ofalluvial origin, the previous crop being wheat. The physical and chemical propertiesof the soil are indicated in Table I.
Table 1. Soil physical and chemical properties
Stones ............................................................... % 0.00Soil ................................................................ % 100.00C lay ................................................................ % 2 1.6Silt ................................................................. % 35.8Sand ............................................................... % 40.3M oisture ............................................................ % 2.3p H ................................................................. 7 .1C aC O .............................................................. % 2.4N itrogen ............................................................ % 0.49O rganic m atter ....................................................... % 1.02Total P20 ......... .................................................. % 1.05Available P2O,, m g ................................................... % 0.12Available K20, m g ................................................... % 12.00
Treatments are described in Table 2. Nitrogen and phosphorus fertilizers were applieduniformly at optimal rates with varying rates of potash, all being put on as solid orfluid fertilizer. Treatments were randomised in four blocks. The plot size was large(20 mx 100 m) to allow the use of normal farm machinery for applying fertilizers.
222
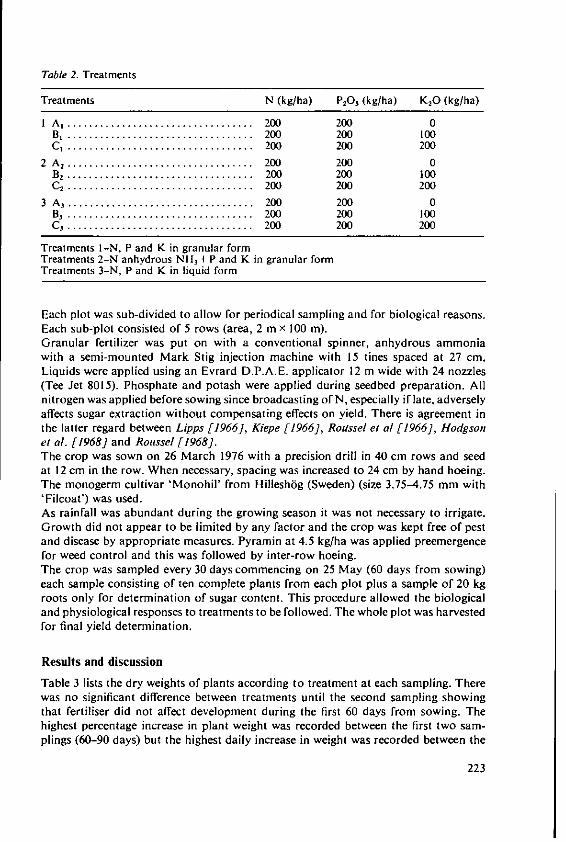
Table 2. Treatments
Treatments N (kg/ha) P20 (kg/ha) K20 (kg/ha)
I A .... .............................. 200 200 0B. .................................. 200 200 100C, .................................. 200 200 200
2 A .................................. 200 200 0B .................................. 200 200 100C2 .................................. 200 200 200
3 A .................................. 200 200 0B. .................................. 200 200 100C, .................................. 200 200 200
Treatments I-N, P and K in granular formTreatments 2-N anhydrous NH,+ P and K in granular formTreatments 3-N, P and K in liquid form
Each plot was sub-divided to allow for periodical sampling and for biological reasons.Each sub-plot consisted of 5 rows (area, 2 m x 100 m).Granular fertilizer was put on with a conventional spinner, anhydrous ammoniawith a semi-mounted Mark Stig injection machine with 15 tines spaced at 27 cm.Liquids were applied using an Evrard D.P.A.E. applicator 12 m wide with 24 nozzles(Tee Jet 8015). Phosphate and potash were applied during seedbed preparation. Allnitrogen was applied before sowing since broadcasting of N, especially if late, adverselyaffects sugar extraction without compensating effects on yield. There is agreement inthe latter regard between Lipps [1966], Kiepe [1966], Roussel et al [1966], Hodgsonet al. [1968] and Roussel [1968].The crop was sown on 26 March 1976 with a precision drill in 40 cm rows and seedat 12 cm in the row. When necessary, spacing was increased to 24 cm by hand hoeing.The monogerm cultivar 'Monohil' from Hilleshbg (Sweden) (size 3.75-4.75 mm with'Filcoat') was used.As rainfall was abundant during the growing season it was not necessary to irrigate.Growth did not appear to be limited by any factor and the crop was kept free of pestand disease by appropriate measures. Pyramin at 4.5 kg/ha was applied preemergencefor weed control and this was followed by inter-row hoeing.The crop was sampled every 30 days commencing on 25 May (60 days from sowing)each sample consisting of ten complete plants from each plot plus a sample of 20 kgroots only for determination of sugar content. This procedure allowed the biologicaland physiological responses to treatments to be followed. The whole plot was harvestedfor final yield determination.
Results and discussion
Table 3 lists the dry weights of plants according to treatment at each sampling. Therewas no significant difference between treatments until the second sampling showingthat fertiliser did not affect development during the first 60 days from sowing. Thehighest percentage increase in plant weight was recorded between the first two sam-plings (60-90 days) but the highest daily increase in weight was recorded between the
223
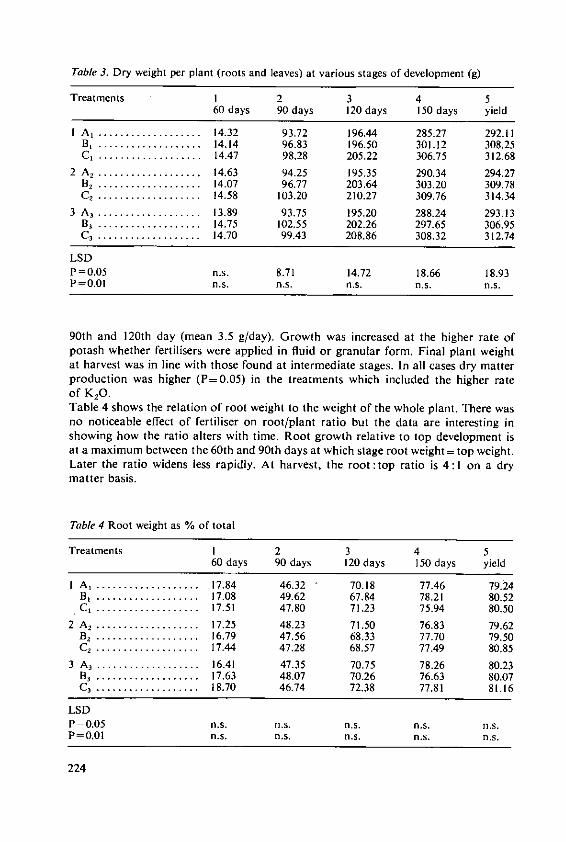
Table 3. Dry weight per plant (roots and leaves) at various stages of development (g)
Treatments 1 2 3 4 560 days 90 days 120 days 150 days yield
I A ................... 14.32 93.72 196.44 285.27 292.11B . .................. 14.14 96.83 196.50 301.12 308.25C, ................... 14.47 98.28 205.22 306.75 312.68
2 A ................... 14.63 94.25 195.35 290.34 294.27B ................... 14.07 96.77 203.64 303.20 309.78C, ................... 14.58 103.20 210.27 309.76 314.34
3 A ................... 13.89 93.75 195.20 288.24 293.13B ................... 14.75 102.55 202.26 297.65 306.95C3 ................... 14.70 99.43 208.86 308.32 312.74
LSDP=0.05 n.s. 8.71 14.72 18.66 18.93P=0.01 n.s. n.s. n.s. n.s. n.s.
90th and 120th day (mean 3.5 g/day). Growth was increased at the higher rate ofpotash whether fertilisers were applied in fluid or granular form. Final plant weightat harvest was in line with those found at intermediate stages. In all cases dry matterproduction was higher (P=0.05) in the treatments which included the higher rateof K 2 0.Table 4 shows the relation of root weight to the weight of the whole plant. There wasno noticeable effect of fertiliser on root/plant ratio but the data are interesting inshowing how the ratio alters with time. Root growth relative to top development isat a maximum between the 60th and 90th days at which stage root weight= top weight.Later the ratio widens less rapidly. At harvest, the root :top ratio is 4:1 on a drymatter basis.
Table 4 Root weight as % of total
Treatments I 2 3 4 560 days 90 days 120 days 150 days yield
I A, ................... 17.84 46.32 70.18 77.46 79.24B, ................... 17.08 49.62 67.84 78.21 80.52C, ................... 17.51 47.80 71.23 75.94 80.50
2 A ................... 17.25 48.23 71.50 76.83 79.62B . .................. 16.79 47.56 68.33 77.70 79.50C, ................... 17.44 47.28 68.57 77.49 80.85
3 A3 ................... 16.41 47.35 70.75 78.26 80.23B ................... 17.63 48.07 70.26 76.63 80.07C3 ................... 18.70 46.74 72.38 77.81 81.16
LSDP=0.05 n.s. n.s. n.s. n.s. n.s.P=0.01 n.s. n.s. n,s. n.s. n.s.
224
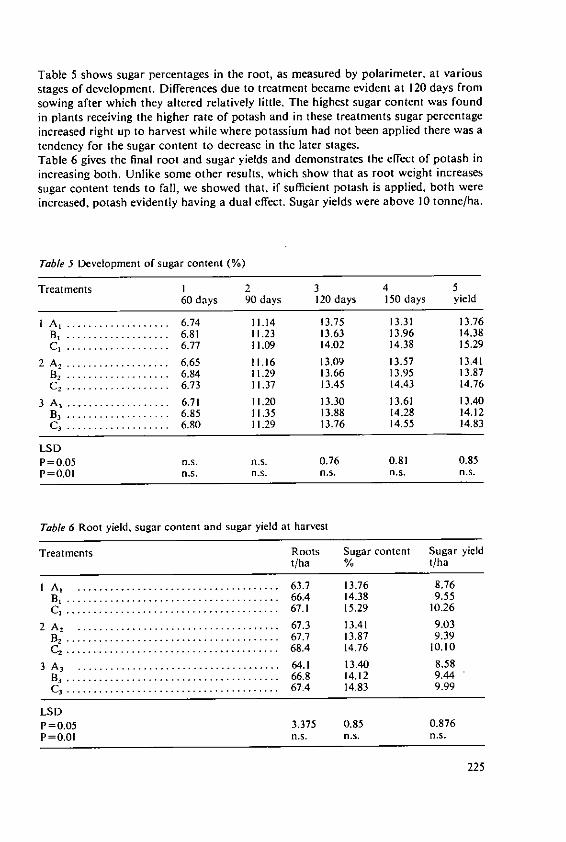
Table 5 shows sugar percentages in the root, as measured by polarimeter, at variousstages of development. Differences due to treatment became evident at 120 days fromsowing after which they altered relatively little. The highest sugar content was foundin plants receiving the higher rate of potash and in these treatments sugar percentageincreased right up to harvest while where potassium had not been applied there was atendency for the sugar content to decrease in the later stages.Table 6 gives the final root and sugar yields and demonstrates the effect of potash inincreasing both. Unlike some other results, which show that as root weight increasessugar content tends to fall, we showed that, if sufficient potash is applied, both wereincreased, potash evidently having a dual effect. Sugar yields were above 10 tonne/ha.
Table 5 Development of sugar content (%)
Treatments I 2 3 4 560 days 90 days 120 days 150 days yield
I A .. ................. 6.74 11.14 13.75 13.31 13.76B. ................... 6.81 11.23 13.63 13.96 14.38C, ................... 6.77 11.09 14.02 14.38 15.29
2 A. ................... 6.65 11.16 13.09 13.57 13.41B. ................... 6.84 11.29 13.66 13.95 13.87C2 . . . . . . . . . . . . . . . . . . . 6.73 11.37 13.45 14.43 14.76
3 A . ................... 6.71 11.20 13.30 13.61 13.40B3 ................... . 6.85 11.35 13.88 14.28 14.12C, ................... 6.80 11.29 13.76 14.55 14.83
LSD
P=0.05 n.s. n.s. 0.76 0.81 0.85P=0.01 n.s. n.s. n.s. n.s. n.s.
Table 6 Root yield, sugar content and sugar yield at harvest
Treatments Roots Sugar content Sugar yieldt/ha % t/ha
I A . ..................................... 63.7 13.76 8.76B , ....................................... 66.4 14.38 9.55C , ....................................... 67.1 15.29 10.26
2 A ..................................... . 67.3 13.41 9.03B2 ...................................... 67.7 13.87 9.39C2 . . . . . . . . . . . . . . . . . . . . . . . . . . . . . . . . . . . . . . . 68.4 14.76 10.10
3 A 3 ..................................... 64.1 13.40 8.58B I ............................ .......... 66.8 14.12 9.44C 3 ....................................... 67.4 14.83 9.99
LSDP=0.05 3.375 0.85 0.876P=0.01 n.s. n.s. n.s.
225
Conclusions
The results of this trial confirm:
- that fluid fertilisers are similar to solids in their agronomic effects. Fluid fertilisersoffer some advantages in ease of handling and application with some economy inhandling costs.
- that adequate amounts of N, P2 0 5 and K 20 are needed to obtain the highest yields.- that potassium is an essential nutrient for sugar beet both on its own account and
because it improves the returns obtained from the other major nutrients. Plantshave a large potassium requirement for vegetative growth and a lesser need in thelater reproductive phase. Sugar beet is a biennial plant and the commercial harvestis taken in the first year during the vegetative phase.
Bibliography
Baldwin C.S. and Davis J.F.: Effect of time and rate of application of nitrogen and date ofharvest on the yield and sucrose content of sugar-beets. Agron. J. 58, 373 (1956)
Tolman, B. and Johnson, R.C.: Effect of nitrogen on the yield and sucrose content of sugarbeets. J. Am. Soc. Sugar Beet Technol. 10, 254 (1958)
Ulrich, A., Minie, D., Hills, F.J., Alan, G.G. and Morton, D.M.: Plant analysis, a guide forsugar beet fertilization. California Agr. Exp. Sta. Bul. 766 (1959)
Schmehl, W.P., Finkner, R. and Swink, J.: Effect of nitrogen fertilization on yield and qualityof the sugar beets. J. Am. Soc. Sugar Beet Technol. 12, 538 (1963)
Haddock, J. L. and Stuart, D.M.: Nutrient balance and concentration in sugar beet production.J. Am. Soc. Sugar Beet Technol. 13, 613 (1965)
Campbell, R.E. and Viets, F.G., Jr.: Yield and sugar production by sugar beets as affectedby leaf area variations induced by stand density and nitrogen fertilization. Agron. J. 59,349 (1967)
Boyd, D.A., Tinker, P.B.H., Draycott, A.p. and Last, P.J.: Nitrogen requirement of sugarbeet grown on mineral soils. J. Agric. Sci., Camb. 74, 37 (1970)
Davis, J.F., Nichol, G. and Thurlow, D.: The interaction of rates of phosphate applicationwith fertiliser placement and fertiliser applied at planting time on the chemical compositionof sugar beet tissue, yield, percent sucrose and apparent purity of sugar beet roots. J.Am. Soc. Sug. Beet Technol. 12, 259 (1962)
Crowther, E.M. and Yates, F.: Fertiliser policy in war-time: the fertiliser requirements ofarable crops, Emp. J. exp. Agric. 9, 77 (1941)
Boyd, D.A., Garner, H. V. and Haines, W.B.: The fertiliser requirements of sugar beet. J.Agric. Sci., Camb. 48, 464 (1957)
Olsen, S.R., Gardner, R., Schtnehl, W.R., Watanabe, F.S. and Scott, C.O.: Utilisation ofphosphorus from various fertilizer materials by sugar beets in Colorado. Proc. Am. Soc.Sug. Beet Technol. 6, 317, (1950)
Tinker, P.B.H.: The effects of nitrogen, potassium and sodium fertilisers on sugar beet.. Agric. Sci., Camb. 65, 207 (1965)
Bolton, J. and Penny, A.: The effects of potassium and magnesium fertilisers on yield andcomposition of successive crops of ryegrass, clover, sugar beet, potatoes, kale and barleyon sandy soil at Woburn. J. Agric. Sci. Camb. 70, 303 (1968)
Lipps, R.C.: Anhydrous ammonia for sugar beets. Agron. Werks. Wichita, Kansas, 1966Kiepe, H.: Die Rentabilitatsgrenze der StickstoffdOngung zu ZuckerrOben. Zucker 19, 631
(1966)Roussel, N., Van Stollen, R. and Vlassak, K.: Rxsultats de deux annes d'exprimentation
avec l'ammoniac anhydre. J.I.I.R.B. 2, 19 (1966)Hodgson, D.R. and Draycoit, A.P.: Aqueous ammonia compared with other nitrogenous
fertilizers as solids and solutions on grass. J. Agr. Sci. Camb. 71, 195 (1968)Roussel, N.: Faut-il appliquer I'azote en couverture: oui, sous quelle forme? La Betterave 2,
6 (1968)
226
Effect of Potassium Fertilizer onYield and Quality of Sugar Beet
Milka Miltcheva, N. Poushkarov Institute of Soil Science, Sofia/Bulgaria*
Summary
Long term investigations on a range of soil types showed that potassium fertilizer in additionto a basal dressing of N, P and micronutrients positively affected sugar beet yield, sugar con-tent and other technological properties. The size of the effect depended on soil type, metereo-logical conditions, rate of potassium fertilizer applied and other fertilizers included in thedressing.
It is well known from references that potassium plays a significant role in increasingyield and improving quality of sugar beet. Long-term field experiments have been inprogress for 16 years under varying climatic conditions to study the effect of potas-sium fertilizer in crop rotations including sugar beet, as well as on the chemistry of po-tassium in the soil.The variety used is Marribo-PA, grown without irrigation. The following annual dress-ings are tested: 0, 66.4, 132.8, 265.6 kg K/ha in the presence of basal dressings of100 kg N and 44 kg P (annual average) and 150 kg N and 66 kg P/ha. The basal dress-ing also included a mixture of micronutrients in accordance with soil type. Acid soilswere limed to block toxic amounts of Al and Mn. On soils of low fertility the experi-ments were carried out only at high basal fertilizing. Yield was recorded regularly andanalyses were made of the chemical composition of sugar beet root and leaves and ofroots only, the dry matter contents, the sugar contents, the nonprotein N and in somecases of the purity of sap (Q) and soluble ash, i.e. indices determining output of sugarper unit of raw material.The values for yield, chemical composition and technological indices vary considerablyfor the different years with all the soil types. For the sake of brevity, we quote only theaverage data from experiments on soils that differ widely in genesis and fertility (Ta-bles I and 2). The conclusions have been drawn on the basis of much more detailed ex-perimental material.According to the results obtained from experiments on soils of low fertility and poor inavailable potassium (exchangeable potassium <t0 mg/100 g soil) such as the grey for-
* Mrs. Milka Miltcheva, N. Poushkarov Institute of Soil Science, 5 Shosse Bankya, Sofia 24/
Bulgaria
227
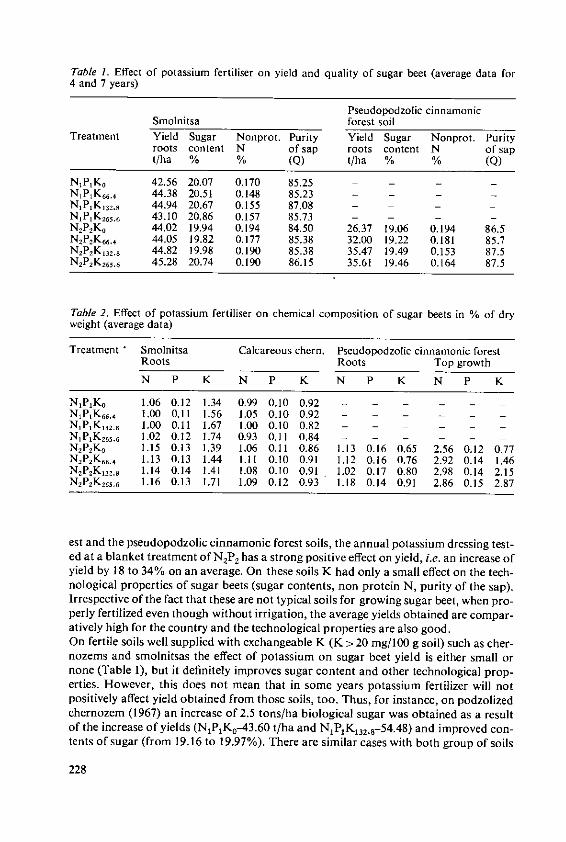
Table 1. Effect of potassium fertiliser on yield and quality of sugar beet (average data for4 and 7 years)
Pseudopodzolic cinnamonicSmolnitsa forest soil
Treatment Yield Sugar Nonprot. Purity Yield Sugar Nonprot. Purityroots content N of sap roots content N of sapt/ha % % (Q) t/ha % % (Q)
N,PK 0 42.56 20.07 0.170 85.25 - -NiPIK66.4 44.38 20.51 0.148 85.23 - - -NPK'3'.8 44.94 20.67 0.155 87.08 - - -NPK 656 43.10 20.86 0.157 85.73 - - - -NPK " 44.02 19.94 0.194 84.50 26.37 19.06 0.194 86.5N2P2K66.4 44.05 19.82 0.177 85.38 32.00 19.22 0.181 85.7N2P2 K1 3 .8 44.82 19.98 0.190 85.38 35.47 19.49 0.153 87.5N2P2K265.6 45.28 20.74 0.190 86.15 35.61 19.46 0.164 87.5
Table 2. Effect of potassium fertiliser on chemical composition of sugar beets in % of dryweight (average data)Treatment * Smolnitsa Calcareous chern. Pseudopodzolic cinnamonic forest
Roots Roots Top growth
N P K N P K N P K N P K
NPK 1.06 0.12 1.34 0.99 0.10 0.92 - - - - - -N1 PK 66. 1.00 0.11 1.56 1.05 0.10 0.92 - - -N PK 3 2.. 1.00 0.11 1.67 1.00 0.10 0.82 - -N, PK 2 65.6 1.02 0.12 1.74 0.93 0.11 0.84 - - - - -N2P2K0 1.15 0.13 1.39 1.06 0.11 0.86 1.13 0.16 0.65 2.56 0.12 0.77N 2P2K66.4 1.13 0.13 1.44 1.11 0.10 0.91 1.12 0.16 0.76 2.92 0.14 1.46N 2 P2K, 3 8 1.14 0.14 1.41 1.08 0.10 0.91 1.02 0.17 0.80 2.98 0.14 2.15N2 P2K 26 .6 1.16 0.13 1.71 1.09 0.12 0.93 1.18 0.14 0.91 2.86 0.15 2.87
est and the pseudopodzolic cinnamonic forest soils, the annual potassium dressing test-ed at a blanket treatment of NIP2 has a strong positive effect on yield, i.e. an increase ofyield by 18 to 34% on an average. On these soils K had only a small effect on the tech-nological properties of sugar beets (sugar contents, non protein N, purity of the sap).Irrespective of the fact that these are not typical soils for growing sugar beet, when pro-perly fertilized even though without irrigation, the average yields obtained are compar-atively high for the country and the technological properties are also good.On fertile soils well supplied with exchangeable K (K > 20 mg/100 g soil) such as cher-nozems and smolnitsas the effect of potassium on sugar beet yield is either small ornone (Table 1), but it definitely improves sugar content and other technological prop-erties. However, this does not mean that in some years potassium fertilizer will notpositively affect yield obtained from those soils, too. Thus, for instance, on podzolizedchernozem (1967) an increase of 2.5 tons/ha biological sugar was obtained as a resultof the increase of yields (N1P1K 0-43.60 t/ha and N1PK 13 2.8-54.48) and improved con-tents of sugar (from 19.16 to 19.97%). There are similar cases with both group of soils
228
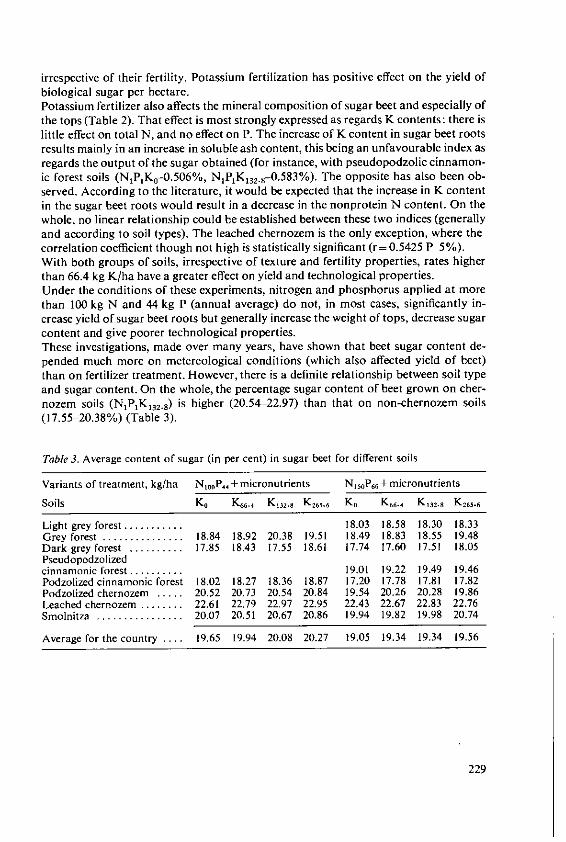
irrespective of their fertility. Potassium fertilization has positive effect on the yield ofbiological sugar per hectare.Potassium fertilizer also affects the mineral composition of sugar beet and especially ofthe tops (Table 2). That effect is most strongly expressed as regards K contents: there islittle effect on total N, and no effect on P. The increase of K content in sugar beet rootsresults mainly in an increase in soluble ash content, this being an unfavourable index asregards the output of the sugar obtained (for instance, with pseudopodzolic cinnamon-ic forest soils (N1PK 0-0.506%, N1P1K1 32.8-0.583%). The opposite has also been ob-served. According to the literature, it would be expected that the increase in K contentin the sugar beet roots would result in a decrease in the nonprotein N content. On thewhole, no linear relationship could be established between these two indices (generallyand according to soil types). The leached chernozem is the only exception, where thecorrelation coefficient though not high is statistically significant (r= 0.5425 P-5%).With both groups of soils, irrespective of texture and fertility properties, rates higherthan 66.4 kg K/ha have a greater effect on yield and technological properties.Under the conditions of these experiments, nitrogen and phosphorus applied at morethan 100 kg N and 44 kg P (annual average) do not, in most cases, significantly in-crease yield of sugar beet roots but generally increase the weight of tops, decrease sugarcontent and give poorer technological properties.These investigations, made over many years, have shown that beet sugar content de-pended much more on metereological conditions (which also affected yield of beet)than on fertilizer treatment. However, there is a definite relationship between soil typeand sugar content. On the whole, the percentage sugar content of beet grown on cher-nozem soils (NIPIK,32.8) is higher (20.54-22.97) than that on non-chernozem soils(17.55-20.38%) (Table 3).
Table 3. Average content of sugar (in per cent) in sugar beet for different soils
Variants of treatment, kg/ha NI0 0P44 + micronutrients N150P66 + micronutrients
Soils K K66.4 K 132.8 K 265.6 Ko K66.4 K 132.8 K265.6
Light grey forest ........... 18.03 18.58 18.30 18.33Grey forest ............... 18.84 18.92 20.38 19.51 18.49 18.83 18.55 19.48Dark grey forest .......... 17.85 18.43 17.55 18.61 17.74 17.60 17.51 18.05Pseudopodzolizedcinnamonic forest .......... 19.01 19.22 19.49 19.46Podzolized cinnarnonic forest 18.02 18.27 18.36 18.87 17.20 17.78 17.81 17.82Podzolized chernozem .... 20.52 20.73 20.54 20.84 19.54 20.26 20.28 19.86Leached chernozem ........ 22.61 22.79 22.97 22.95 22.43 22.67 22.83 22.76Smolnitza ................ 20.07 20.51 20.67 20.86 19.94 19.82 19.98 20.74
Average for the country .... 19.65 19.94 20.08 20.27 19.05 19.34 19.34 19.56
229
The Place of Fertilizers in 'Blueprints'for the Production of Potatoes and Cereals
S. A. Evans, B.Sc., Dip. Agric., M.I.Biol., Agricultural Development and Advisory Service,Lawnswood, Leeds/United Kingdom*
Summary
'Blueprints' are defined as systems of growing crops to produce what is predicted as their maxi-mum potential yield.Preparing the specifications of a blueprint may show the need for (a) information which re-search has so far not provided and (b) practices which are not currently economic or practicalon the farm.A blueprint which has produced consistently high yields of maincrop potatoes in the UK isdescribed and particular reference is made to fertilizer use. An equivalent successful blueprintfor cereals has not yet been devised.The value of this new approach to improving crop yields is discussed.
1. Introduction
1.1 Research and development on crop production is greatly concerned with increas-
ing yields. This interest seems likely to continue until the potentials of crops have been
fully exploited.
1.2 Calculations of the potentials of annual field crops in the UK have been made by
several crop physiologists (e.g. A/cock [1]). These calculations include a number of as-
sumptions and differ in complexity and the figures produced vary to some extent. They
do however clearly show that current production is well below potential and that aver-
age yields in the UK are only a half or even a third of that which is theoretically possi-ble.
1.3 Potential is proportional to the energy available (sunlight and carbon dioxide) and
the crops ability to use it. The calculations for potential indicate the magnitude of
yields it should be possible to reach when crops make full use of the available energy.
Potential maximum yields are of the following order:
potato (total tubers) 85-100 t/hasugar beet (roots) 75-85 t/hawheat and barley (grain) 12-15 t/ha
-S.A. Evans, Agricultural Development and Advisory Service, Government Buildings,
Lawnswood, Leeds/United Kingdom
231
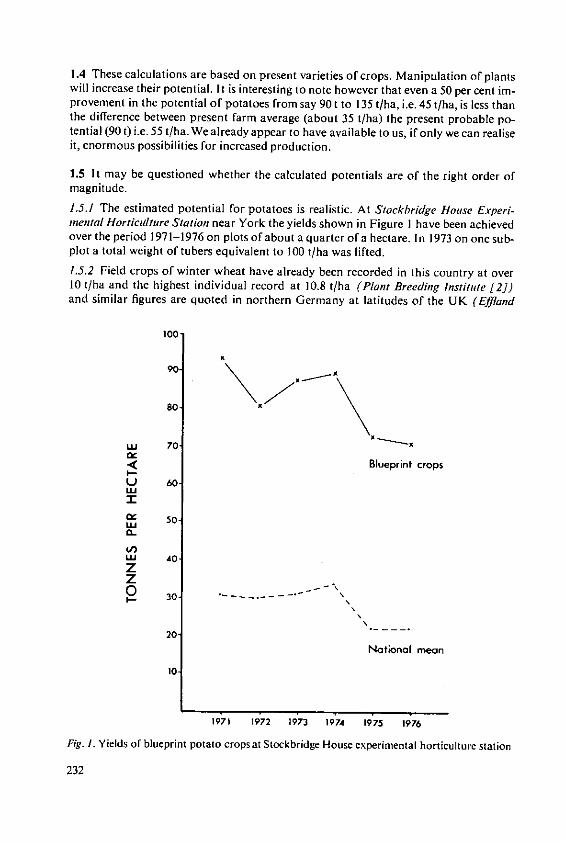
1.4 These calculations are based on present varieties of crops. Manipulation of plantswill increase their potential. It is interesting to note however that even a 50 per cent im-provement in the potential of potatoes from say 90 t to 135 t/ha, i.e. 45 t/ha, is less thanthe difference between present farm average (about 35 t/ha) the present probable po-tential (90 t) i.e. 55 t/ha. We already appear to have available to us, if only we can realiseit, enormous possibilities for increased production.
1.5 It may be questioned whether the calculated potentials are of the right order ofmagnitude.
1.5.1 The estimated potential for potatoes is realistic. At Stockbridge House Experi-mental Horticulture Station near York the yields shown in Figure I have been achievedover the period 1971-1976 on plots of about a quarter of a hectare. In 1973 on one sub-plot a total weight of tubers equivalent to 100 t/ha was lifted.1.5.2 Field crops of winter wheat have already been recorded in this country at over10 t/ha and the highest individual record at 10.8 t/ha (Plant Breeding Institute [2])and similar figures are quoted in northern Germany at latitudes of the UK (Effland
100
x90
80
in 70
<Blueprint crops
U 60UJ'
C 50-CL
Q.U,)LU 40z20 30
20-National mean
10
1971 1972 1973 1974 1975 1976
Fig. 1. Yields of blueprint potato crops at Stockbridge House experimental horticulture station
232
[3]). There is little doubt in my mind that a potential of 12 t/ha is realistic for cerealcrops.
2. The concept of growing crops at their potential maximum production
2.1 The potential yields quoted (1.3) are for outdoor annual crops utilising the fullgrowing season and are expressed as yields per unit area of land. The concept is not di-rectly appropriate for example to grazed grassland (a perennial crop with varied andpremature 'harvests') or to tiered crops in glasshouses. If the concept is acceptable forannual field crops then the question which follows is: can systems be devised which willallow crops to produce yields at or near the predicted potential?
2.2 The hypothetical basis of growing crops to their maximum potential is two-fold.
2.2.1 First there must be no constraint on the growth of the crop other than the limitsset by the available energy. (1.3) This means that moisture and nutrients should alwaysbe available as required by the crop and that the influence of pest diseases and weedsmust be totally absent.
2.2.2 The density of plants and the development of plants within the crop must be soordered that each plant produces its due contribution to the total yield. It may not benecessary for each individual within the community to achieve its maximum potential.In practice the parameters of the components of yield must be realistic and compo-nents are likely to be less than maximum (e.g. grain size and ear size in cereals do notneed to reach maximum in order to achieve maximum potential yield per unit area ofland).
3. The potato blueprint
3.1 The first attempt at specifying how to achieve the maximum potential yield of afield crop, as far as is known, was that for potatoes prepared by ADAS at Leeds in1969/70. Once on paper, the specifications became known colloquially as the 'blue-print' ('detailed plan of work to be done' - Concise Oxford Dictionary) and because ofthe high yields produced when tried in the field and the consequent publicity, the term'blueprint' became used in the farming world. The term however is now used in varioussenses (e.g. 'tomato blueprints' devised by ADAS horticulturalists several years agoand the so-called 'cereal blueprints', much talked about at present, do not have thesame objective as the potato blueprint). In this paper the word blueprint is taken onlyas an abbreviation for 'a specification for producing the yield of a crop at its maximumpotential'. On this definition blueprints do not accede to constraints on productionwhich may be present in current production methods.
3.2 Criticism of the blueprint approach to crop yield improvement may be made onthe grounds that uneconomic or impractical aspects will prevent the extension of thesystem into practice. However, it is a function of research and development to over-come restraints. In any case, I believe that this new approach can make a useful contri-bution to increased farm output in two ways (3.2.1 and 3.2.2).
233
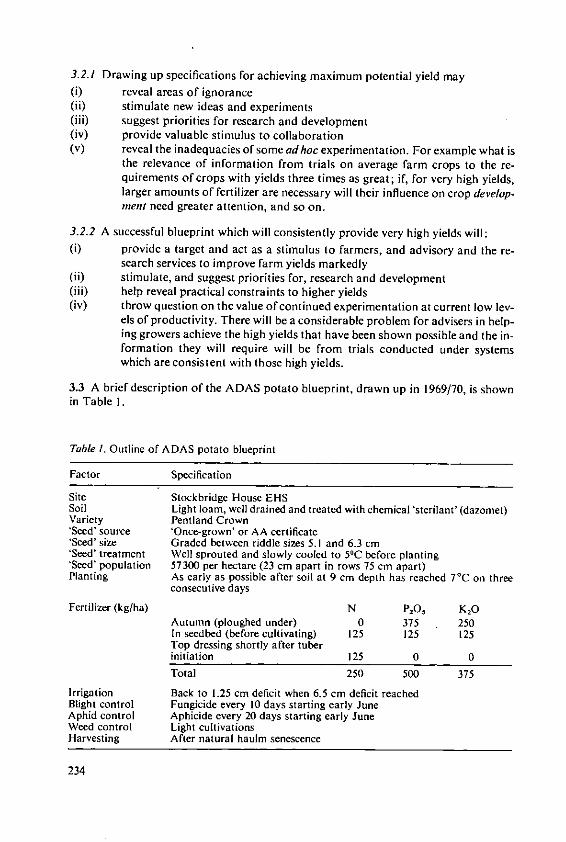
3.2.1 Drawing up specifications for achieving maximum potential yield may(i) reveal areas of ignorance(ii) stimulate new ideas and experiments(iii) suggest priorities for research and development(iv) provide valuable stimulus to collaboration(v) reveal the inadequacies of some ad hoc experimentation. For example what is
the relevance of information from trials on average farm crops to the re-quirements of crops with yields three times as great; if, for very high yields,larger amounts of fertilizer are necessary will their influence on crop develop-ment need greater attention, and so on.
3.2.2 A successful blueprint which will consistently provide very high yields will:(i) provide a target and act as a stimulus to farmers, and advisory and the re-
search services to improve farm yields markedly(ii) stimulate, and suggest priorities for, research and development(iii) help reveal practical constraints to higher yields(iv) throw question on the value of continued experimentation at current low lev-
els of productivity. There will be a considerable problem for advisers in help-ing growers achieve the high yields that have been shown possible and the in-formation they will require will be from trials conducted under systemswhich are consistent with those high yields.
3.3 A brief description of the ADAS potato blueprint, drawn up in 1969/70, is shownin Table I.
Table 1. Outline of ADAS potato blueprint
Factor Specification
Site Stockbridge House EHSSoil Light loam, well drained and treated with chemical 'sterilant' (dazomet)Variety Pentland Crown'Seed' source 'Once-grown' or AA certificate'Seed' size Graded between riddle sizes 5.1 and 6.3 cm'Seed' treatment Well sprouted and slowly cooled to 50C before planting'Seed' population 57300 per hectare (23 cm apart in rows 75 cm apart)Planting As early as possible after soil at 9 cm depth has reached 70C on three
consecutive days
Fertilizer (kg/ha) N P205 K20Autumn (ploughed under) 0 375 250In seedbed (before cultivating) 125 125 125Top dressing shortly after tuberinitiation 125 0 0Total 250 500 375
Irrigation Back to 1.25 cm deficit when 6.5 cm deficit reachedBlight control Fungicide every 10 days starting early JuneAphid control Aphicide every 20 days starting early JuneWeed control Light cultivationsHarvesting After natural haulm senescence
234
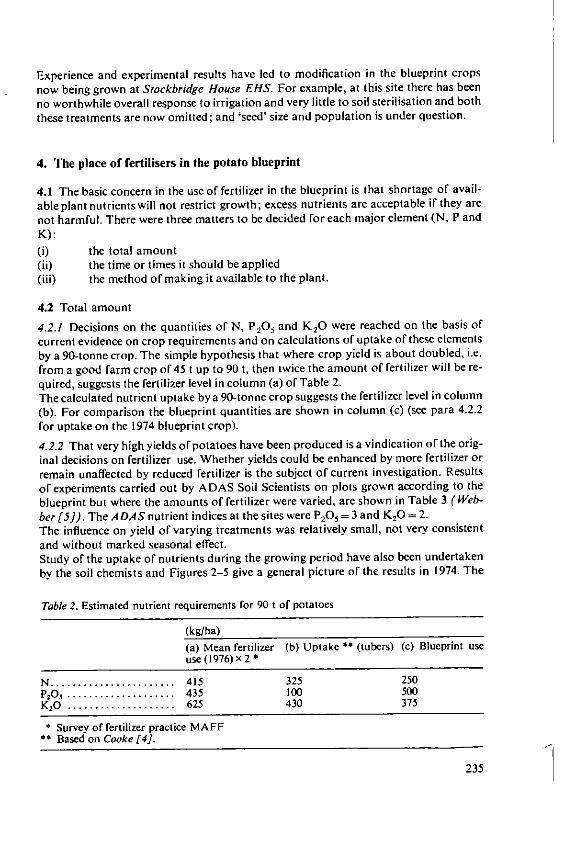
Experience and experimental results have led to modification in the blueprint crops
now being grown at Stockbridge House EHS. For example, at this site there has beenno worthwhile overall response to irrigation and very little to soil sterilisation and both
these treatments are now omitted; and 'seed' size and population is under question.
4. The place of fertilisers in the potato blueprint
4.1 The basic concern in the use of fertilizer in the blueprint is that shortage of avail-
able plant nutrients will not restrict growth; excess nutrients are acceptable if they are
not harmful. There were three matters to be decided for each major element (N, P andK):(i) the total amount(ii) the time or times it should be applied(iii) the method of making it available to the plant.
4.2 Total amount
4.2.1 Decisions on the quantities of N, P 2 0 5 and K 20 were reached on the basis of
current evidence on crop requirements and on calculations of uptake of these elements
by a 90-tonne crop. The simple hypothesis that where crop yield is about doubled, i.e.
from a good farm crop of 45 t up to 90 t, then twice the amount of fertilizer will be re-quired, suggests the fertilizer level in column (a) of Table 2.The calculated nutrient uptake by a 90-tonne crop suggests the fertilizer level in column
(b). For comparison the blueprint quantities are shown in column (c) (see para 4.2.2
for uptake on the 1974 blueprint crop).
4.2.2 That very high yields of potatoes have been produced is a vindication of the orig-inal decisions on fertilizer use. Whether yields could be enhanced by more fertilizer or
remain unaffected by reduced fertilizer is the subject of current investigation. Results
of experiments carried out by ADAS Soil Scientists on plots grown according to the
blueprint but where the amounts of fertilizer were varied, are shown in Table 3 (Web-ber [5]). The ADAS nutrient indices at the sites were P2O5 = 3 and K20 = 2.The influence on yield of varying treatments was relatively small, not very consistent
and without marked seasonal effect.Study of the uptake of nutrients during the growing period have also been undertaken
by the soil chemists and Figures 2-5 give a general picture of the results in 1974. The
Table 2. Estimated nutrient requirements for 90 t of potatoes
(kg/ha)
(a) Mean fertilizer (b) Uptake ** (tubers) (c) Blueprint useuse (1976) x2 *
N ....................... 415 325 250P201 .................... 435 100 500K20 .................... 625 430 375
* Survey of fertilizer practice MAFF• Based on Cooke [4].
235
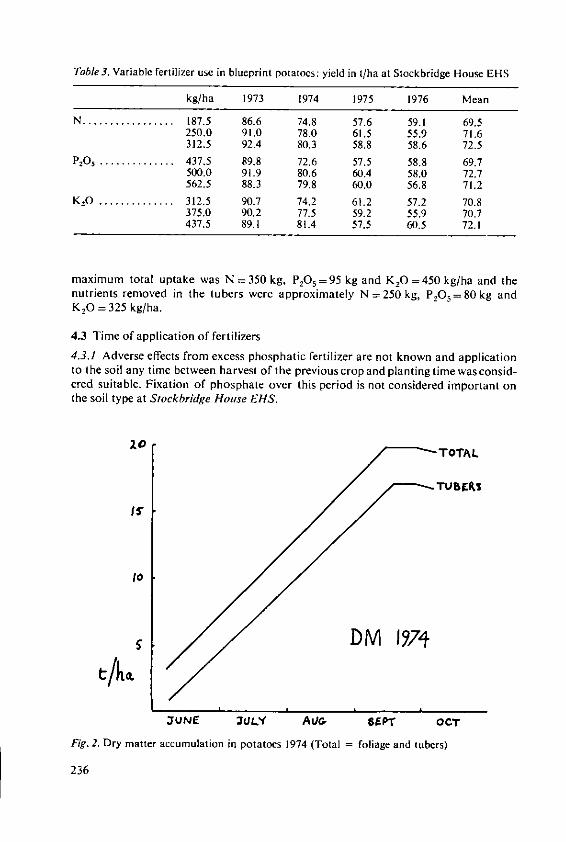
Table3. Variable fertilizer use in blueprint potatoes: yield in t/ha at Stockbridge House EHS
kg/ha 1973 1974 1975 1976 Mean
N ................. 187.5 86.6 74.8 57.6 59.1 69.5250.0 91.0 78.0 61.5 55.9 71.6312.5 92.4 80.3 58.8 58.6 72.5
P201 .............. 437.5 89.8 72.6 57.5 58.8 69.7500.0 91.9 80.6 60.4 58.0 72.7562.5 88.3 79.8 60.0 56.8 71.2
K[ O .............. 312.5 90.7 74.2 61.2 57.2 70.8375.0 90.2 77.5 59.2 55.9 70.7437.5 89.1 81.4 57.5 60.5 72.1
maximum total uptake was N = 350 kg, P205 = 95 kg and K20 = 450 kg/ha and thenutrients removed in the tubers were approximately N = 250 kg, P205 = 80 kg andK20 = 325 kg/ha.
4.3 Time of application of fertilizers
4.3.1 Adverse effects from excess phosphatic fertilizer are not known and applicationto the soil any time between harvest of the previous crop and planting time was consid-ered suitable. Fixation of phosphate over this period is not considered important onthe soil type at Stockbridge House EHS.
10TOA
If
/DM I/274
JUNE 3ULY AV&. $UPT OCT
Fig. 2. Dry matter accumulation in potatoes 1974 (Total = foliage and tubers)
236
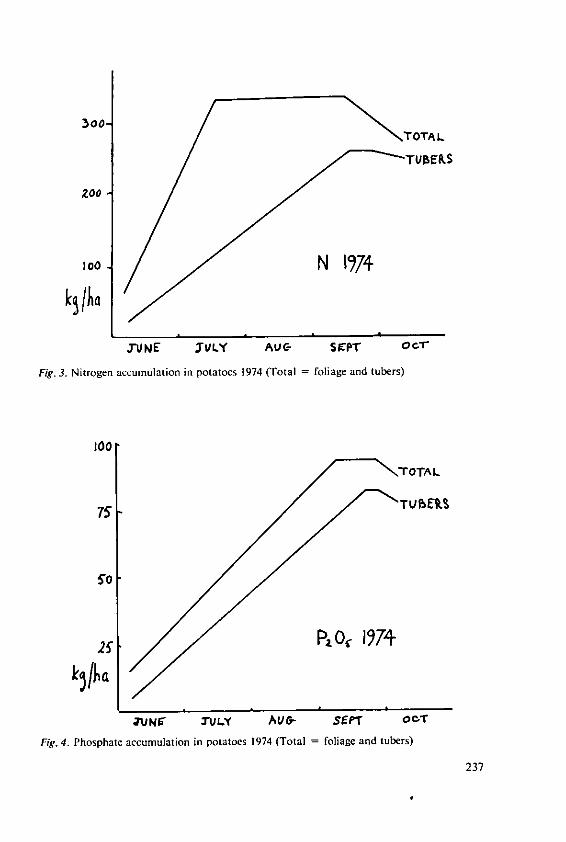
300O0- / TOTAL
zoo-
TUNE JULY AUC- $lZPT ocr"
Fig. 3. Nitrogen accumulation in potatoes 1974 (Total = foliage and tubers)
,TOTAL
s'o
25 POc 197+
IZI,
7.Nir TULY AVG- SEPT OcT
Fig. 4. Phosphate accumulation in potatoes 1974 (Total = foliage and tubers)
237
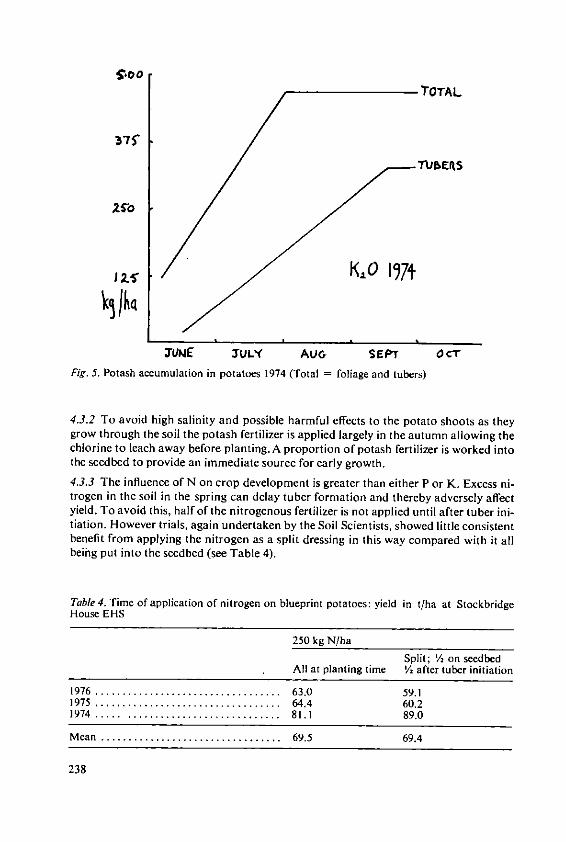
6.o0TOTAL
h7S'
/X IKO 197tr
TUNE JUL( AUG SEPT OCTFig. 5. Potash accumulation in potatoes 1974 (Total = foliage and tubers)
4.3.2 To avoid high salinity and possible harmful effects to the potato shoots as theygrow through the soil the potash fertilizer is applied largely in the autumn allowing thechlorine to leach away before planting. A proportion of potash fertilizer is worked intothe seedbed to provide an immediate source for early growth.4.3.3 The influence of N on crop development is greater than either P or K. Excess ni-trogen in the soil in the spring can delay tuber formation and thereby adversely affectyield. To avoid this, half of the nitrogenous fertilizer is not applied until after tuber ini-tiation. However trials, again undertaken by the Soil Scientists, showed little consistentbenefit from applying the nitrogen as a split dressing in this way compared with it allbeihg put into the seedbed (see Table 4).
Table 4. Time of application of nitrogen on blueprint potatoes: yield in t/ha at StockbridgeHouse EHS
250 kg N/ha
Split; ' , on seedbedAll at planting time -/ after tuber initiation
1976 .................................. 63.0 59.11975 .................................. 64.4 60.21974 ..... ............................ 81.1 89.0
M ean ................................. 69.5 69.4
238
4.4 Nutrient availabilityThe potato blueprint assumes that the roots are at all times able to provide the nutrientrequirement of the crop. No attempts are made to induce nutrient uptake through thefoliage. However the fertilizers applied in the autumn are mixed into the soil byploughing to provide a continuing source of nutrients for the roots as they explore thesoil. Economy of fertilizer use by more precise placement in the soil is being investi-gated.
5. Cereal blueprints
5.2 A proven blueprint for the maximum potential yield of wheat or barley does not,to my knowledge, exist. Systems, drawn up in a manner similar to the potato blueprint,have been produced for wheat and barley but they have failed when put to the test.
5.2 Fertilizer requirements for maximum potential yield of cerealsSome bases for the manurial requirement of the potato blueprint have been shown inTable 2 and a similar exercise for cereals is shown in Table 5.
Table 5. Estimated nutrient requirement for 12 t of grain: kg/ha
(a) Mean fertilizer (b) Uptake**use (1975)* x 2 (grain and straw)
N ..................................... 160 210P20 1 .................................. 75 80K 20 .................................. 75 110
Survey of Fertilizer Practice MAFFBased on Cooke [4].
It seems likely that maximum potential yields will require the support of higher fertiliz-er use than is currently standard in the UK. The use of P and K is likely to be governedby considerations similar to those discussed for potatoes. Again it is the nitrogen usewhich poses most problems. Nitrogenous fertilizers can have a profound influence onthe development of the crop, particularly in relation to the development of, competi-tion between, and survival of plant tillers.
6. Concepts of maximum potential yield and its achievement
6.1 Blueprints aim to put together a system of growing crops to achieve a yield levelnear the estimated maximum potential. This system will be based as knowledgablyand logically as possible but may have to extend beyond the limits of present informa-tion. It may be necessary to conduct more research before a blueprint can be producedwhich will succeed when put to the test.
6.2 A successful blueprint, too, may contain specifications which are unimportant orexceed the minimum requirements. Experimentation should be able to discover the op-
239
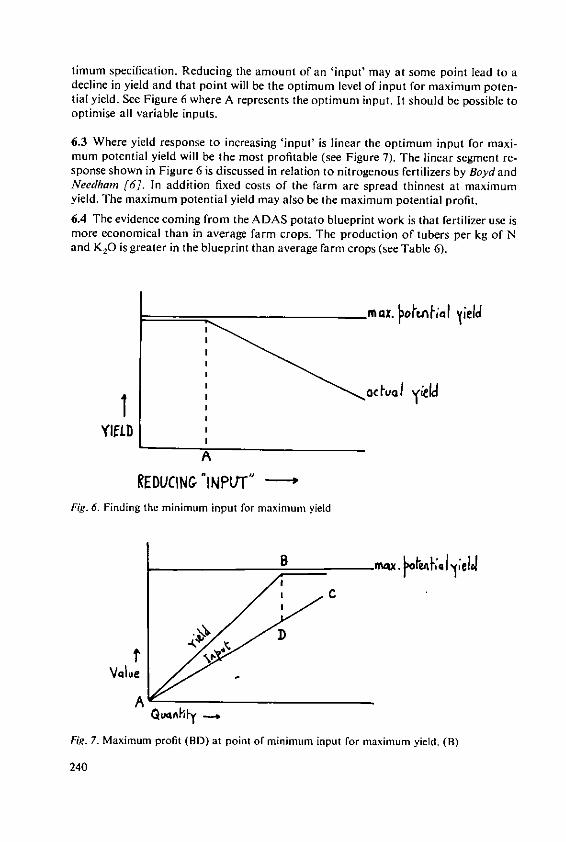
timum specification. Reducing the amount of an 'input' may at some point lead to adecline in yield and that point will be the optimum level of input for maximum poten-tial yield. See Figure 6 where A represents the optimum input. It should be possible tooptimise all variable inputs.
6.3 Where yield response to increasing 'input' is linear the optimum input for maxi-mum potential yield will be the most profitable (see Figure 7). The linear segment re-sponse shown in Figure 6 is discussed in relation to nitrogenous fertilizers by BoydandNeedham [6]. In addition fixed costs of the farm are spread thinnest at maximumyield. The maximum potential yield may also be the maximum potential profit.
6.4 The evidence coming from the ADAS potato blueprint work is that fertilizer use ismore economical than in average farm crops. The production of tubers per kg of Nand K20 is greater in the blueprint than average farm crops (see Table 6).
________________________max. oAnhoI yield
a~clua~l yOJc
YIELDA
REDUCING "INPUT"Fig. 6. Finding the minimum input for maximum yield
Value
A
Fig. 7. Maximum profit (BD) at point of minimum input for maximum yield. (B)
240
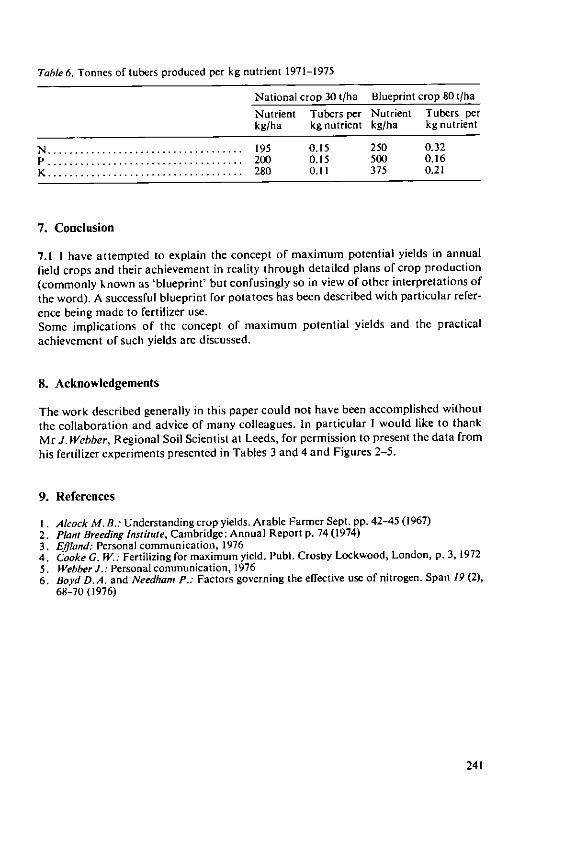
Table 6. Tonnes of tubers produced per kg nutrient 1971-1975
National crop 30 t/ha Blueprint crop 80 t/ha
Nutrient Tubers per Nutrient Tubers perkg/ha kg nutrient kg/ha kg nutrient
N .................................... 195 0.15 250 0.32p .................................... 200 0.15 500 0.16K .................................... 280 0.11 375 0.21
7. Conclusion
7.1 I have attempted to explain the concept of maximum potential yields in annualfield crops and their achievement in reality through detailed plans of crop production(commonly known as 'blueprint' but confusingly so in view of other interpretations of
the word). A successful blueprint for potatoes has been described with particular refer-ence being made to fertilizer use.Some implications of the concept of maximum potential yields and the practicalachievement of such yields are discussed.
8. Acknowledgements
The work described generally in this paper could not have been accomplished without
the collaboration and advice of many colleagues. In particular I would like to thank
Mr J. Webber, Regional Soil Scientist at Leeds, for permission to present the data from
his fertilizer experiments presented in Tables 3 and 4 and Figures 2-5.
9. References
I. Alcock M. B.: Understanding crop yields. Arable Farmer Sept. pp. 42-45 (1967)2. Plant Breeding Institute, Cambridge: Annual Report p. 74 (1974)3. Etland: Personal communication, 19764. Cooke G. W.: Fertilizing for maximum yield. PubI. Crosby Lockwood, London, p. 3,19 72
5. WebberJ.: Personal communication, 19766. Boyd D.A. and Needham P.: Factors governing the effective use of nitrogen. Span 19 (2),
68-70 (1976)
241
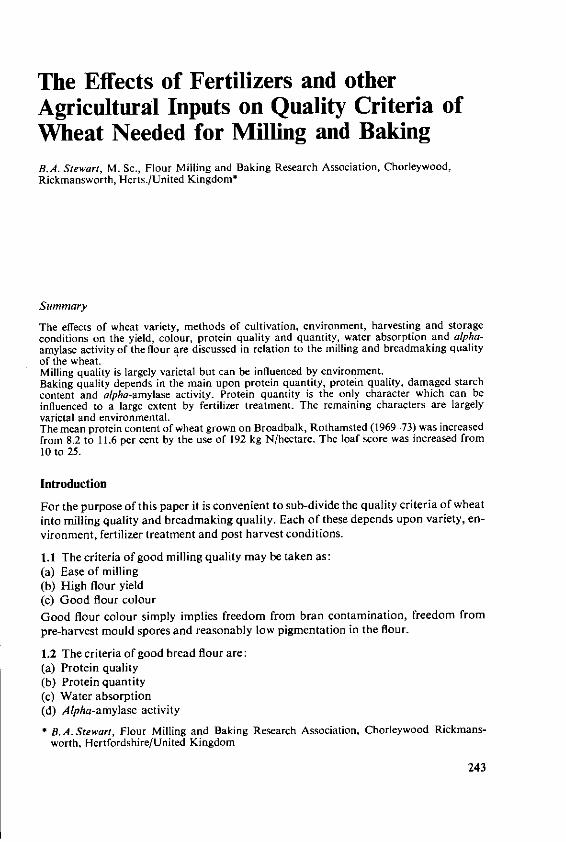
The Effects of Fertilizers and otherAgricultural Inputs on Quality Criteria ofWheat Needed for Milling and BakingB.A. Stewart, M. Sc., Flour Milling and Baking Research Association, Chorleywood,Rickmansworth, Herts./United Kingdom*
Summary
The effects of wheat variety, methods of cultivation, environment, harvesting and storageconditions on the yield, colour, protein quality and quantity, water absorption and alpha-amylase activity of the flour are discussed in relation to the milling and breadmaking qualityof the wheat.Milling quality is largely varietal but can be influenced by environment.Baking quality depends in the main upon protein quantity, protein quality, damaged starchcontent and alpha-amylase activity. Protein quantity is the only character which can beinfluenced to a large extent by fertilizer treatment. The remaining characters are largelyvarietal and environmental.The mean protein content of wheat grown on Broadbalk, Rothamsted (1969-73) was increasedfrom 8.2 to 11.6 per cent by the use of 192 kg N/hectare. The loaf score was increased from10 to 25.
Introduction
For the purpose of this paper it is convenient to sub-divide the quality criteria of wheat
into milling quality and breadmaking quality. Each of these depends upon variety, en-
vironment, fertilizer treatment and post harvest conditions.
1.1 The criteria of good milling quality may be taken as:
(a) Ease of milling(b) High flour yield
(c) Good flour colour
Good flour colour simply implies freedom from bran contamination, freedom from
pre-harvest mould spores and reasonably low pigmentation in the flour.
1.2 The criteria of good bread flour are:(a) Protein quality(b) Protein quantity(c) Water absorption(d) Alpha-amylase activity
* B.A. Stewart, Flour Milling and Baking Research Association, Chorleywood Rickmans-
worth, Hertfordshire/United Kingdom
243
2. Milling quality
2.1 Ease of milling
Wheat varieties differ in the way they break down during the milling process. Some vari-eties break down along the cell walls into particles which tend to be smooth-raced,sharp-cornered and fairly regular in shape and size. Since these particles tend to slideover one another reasonably easily the resulting flour flows freely and sieves easily.Wheats which behave in this manner are known as 'hard' milling wheats.Other wheat varieties break down across the individual cells to give smaller particles,irregular in shape and size which tend to bind to one another to give an amorphousmass. These flours sieve with difficulty and require the milling rate to be reduced.These wheats are known as 'soft' milling wheats.The difference appears to be of genetic origin. It can be controlled by the plant breeder.It can only be modified to a small extent by environment and fertilizer treatment.
2.2 Flour yield
Percentage flour yield may be defined as the yield of flour expressed as a percentage ofthe total mill products. The variation in flour yield due to variety is shown in Table 1.It will be noticed that varieties whose endosperm texture is described as 'hard' give ahigher flour yield than those varieties with an endosperm described as 'soft'. This is at-tributed to the manner in which the endosperm separates from the bran. In the case of'hard' milling wheats the bran is much freer from endosperm than in the case of 'soft'milling types, when both samples have been subjected to the same milling conditions.Flour yield may be modified by grain shrivelling which may simply involve lack of en-dosperm. The largest contributing factors to the production of shrivelled grain are un-doubtedly stress conditions while the grain is being laid down and the incidence of dis-ease, usually affecting the leaf or root system and consequently interfering with theproduction of carbohydrate and protein. Late applications of a nitrogenous fertilizer,aimed at increasing grain protein content may affect grain plumpness. Extra tillers,produced late in the growth cycle, which ultimately fail to produce well filled grain, arethe prime cause.Small well filled grains are not necessarily deleterious to flour yield.
2.3 Flour colourThe flour colour is measured with the Kent-Jones and Martin ,neter. A suspension offlour in water is compared photoelectrically with a cream coloured standard. The re-sult is given in arbitary units, the higher the value the poorer the colour.The flour colour depends upon variety, environment, and the condition of the grain.'Hard' milling wheats, despite giving a higher flour yield, usually produce of flourwhose colour is somewhat better than comparable 'soft' milling varieties where theyield of flour is lower. Thiis may be illustrated by the results in Table 1.The colour of flour can be seriously affected by imperfect development of the grain andby weathering. The first cause may simply involve lack of endosperm, but it is often as-sociated with the second in which the outer layers of the bran become partially separat-ed, lose their nature and exhibit brittleness during milling which will greatly impover-ish the colour of the flour.
244
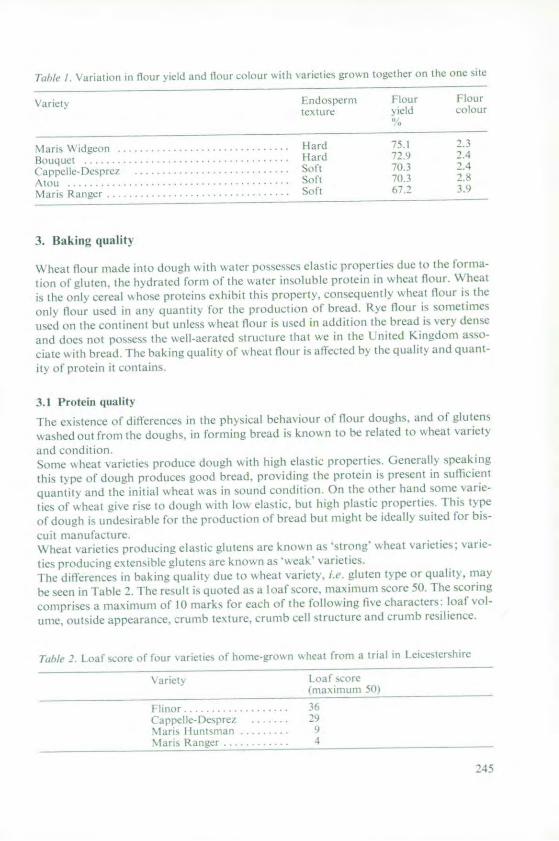
7o'w' I. ari ti ti i llour ield antI flour cokur ,ith irletes gro n toicther l the ole site
a 1iet, 1 ild o'pcrm ]o tout dt.'\ Lire. ldcolour
Mar -\\Iidgeou . lard 72.3
HOuI Luet ......... ..r .2 2.4Cappelle)-Dcpre .. So1 7i 2,4
%taii Rana. . S I tl67 2 1,Mat K [(aucr . . . . . .. . . . . .. . . o(Il ( 3
3. Baking qualit,
\' \heat flour made itLol dough ith ate[ poessesses casic pi Operl ICs due to the lorma-
tion ot gluten, the hydrated form ol the waler insoluble prte1Cim n l eat flour,. \Wheat
is the only cereal khose proteiniseshbi this prIoper to CmsequCntly w heat lour is the
onlh Ilour usCd in n) qlat111TN Ilo the prodlction ol) bread. lc Ilmr is soiPcimits
usCd (11 the ColtitCnt hllt unleSs wkheat flout is used in addition tile bread is ver dense-;
and does n)t p(osC the ell ted IILICtrC thIt we in the I nited Kingdom as)-
cie ih bread. The bakig qualtil of %heal lour is oectCd h the qtality and quant-
ilk of protein it containis.
3.1 Pritein quality
Ihe e isience of dillelences in Ihe physical behaiour of flour (du lghs. allndt Of gib lens1l
washcd oit from the doughs, in) forming bread is knorwn t) be related to whea)t vrietW
and coldilioll'Some l lcal varietiCs produce douUgh aith high elastic properties. General > speaking
this tkpe of dottgh ptoduces giood brcad, pro(iding the prt[cin is present in sufficient
quianllt and the initial kheal "as in sond conditi0on1
)ll O hte other hand so11C tot IC-
ties ol a heal gc rise to dough %kith l1o, eltiC. 1bu high pI'Lstic propeltics I his tN pC
of0dou'gh i unlesirable lot the production of bread but might he ideall suiled for his-atlil iia nufatl re
Wheai arettes prodncing elastic luten, are kior as "strot>g' kheat karietic': arie-
ties prodtltno esteosible glutetis are known as weak' varielies.
'lhe diflrelctes it baking quality due to Vlheat vaniCt%. ic l en ypC or qualit, tntav
be see t in t'ible 2. Ihe resut is quoted as a lioa f sore, mta/inutln score 50. [hie scorng
comprses a tmtsitlttityt A. 10 marks for each of the lfllowingke characters: loaf oI-
Litle, utside IppeCleellC. llb leItC, rttllb Cell struLL cture and)t] Crum1111b resilience
JahD/( 2 I of il 71 owol tour a iffe ofi Itore- groi nea fron a trial ii [ eii,,tershirc
F I Ic C lt ¢{51
ff1 0,0 "Ife} 5l
I i .r I
24i
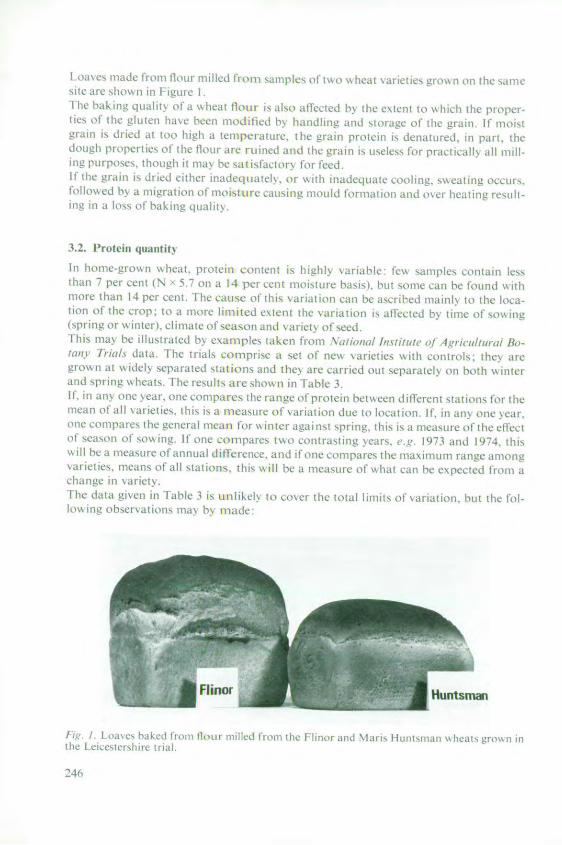
I oa mAade I nl oill flourA II miIled IImo 'tmp Les ll I s o s eat Na rA le CrsIo t on the atLIcsIe tile showIn i F irure II le bakitn quul Iit% of t s\ h eat 11kji i, also alliected [t lhe ex telnt Io which Ih propel-tie, of tile 'lulen haic heen modified lx hiancli antd stolagv of Ie griti. if mOist2gr11fn is d1 tcd at too high a tleixpe, atitic lic graili pIteil H, idealtuLed. In pil. thedotileh piopeities of the flour are anrt i d Ihle rain Is tsoecl for pr tcticall aI I ll II-
n"g pttrpoxes, though it ia, be Sat ikfaciot fll icdII he 'rain is dried cilhcl Inadeqtitfe. i1" lith tiadequate ooling. swealing ocecursii]lo\,,ed by a migrlatio oof t(IOtsIsIe eij tineala mould fIormainiO and O\Cr hcatiun .restil-
in"g An ilo" iof baking ctalir>.
3.2 Protein (JualilIn home-gr Oll iheat priteit Coltient is hifel %l lC% samples colllii les
hlan 7 pe t i N 7 o a 14 per cent illoiI..t bais) btll soile can lle found Iiithitore thln 14 per ceii ti1le cause o thli alltio 'i ll ca e acribed mionl in theo ioc-ion of the crop: to a mole limited ete~nI tile ailation is affeeted by limne of SO' ing
Ixpi I lr " inter), climte of s'asloni ad va riety of seed.I his nit'e IlhlslIitcd li 'iaii pfes tiaken from1 \Ytiina/ hwtiat A/ ff 4ri1n/wio/ Bio-
iltvi) It1l1/s data Fhe trials coiitp'i iset of iic", varicics witht conrols: te\ tiregc Ol ii ia i dclA sepal a ted s1ato i and t lie are caifedl Out pilaillely o hoth11 hi mitcraind spriti tnlicats .h icutist il' shoxi ih n Table 3If. 11 it A' oic c sear.i coti pIArs rte range oI prioei besteen different sa Itions ftr themian ol ill %at uelit. this is a iixcasttue of %alrtitio tile Io localion, If. in all ne Neat .Ole colpitle Ie gcencral ita tor\ inter agati tist spring. this is a meaC2isule of lie effCCtof1" season of so" ing If ont coilpires il\o cOaUt-slillg eai'Cs t' 1973 and 1974. hbis
i ill e ica i c- of" nllnult dilleficce, and if ote coilpares the iaiiutl range aiongvaritices. iecans of all statinli. this will be a lilasuic of A\hat Cal be expectld fomll ichtige in variety.
e lie dala giyen inI Fable 3 is tnlikel' to coxcr the total limit of vtr allon, ],ut the lot-lihtw Itig oAbsirv ations maI% b% made
Iv. I I .oa j baked trou I1oti iillcd fI In lie IlIlor and Na ix t"itsinatt ' [teats A ol'5 IIIhie i trialL .
24(,
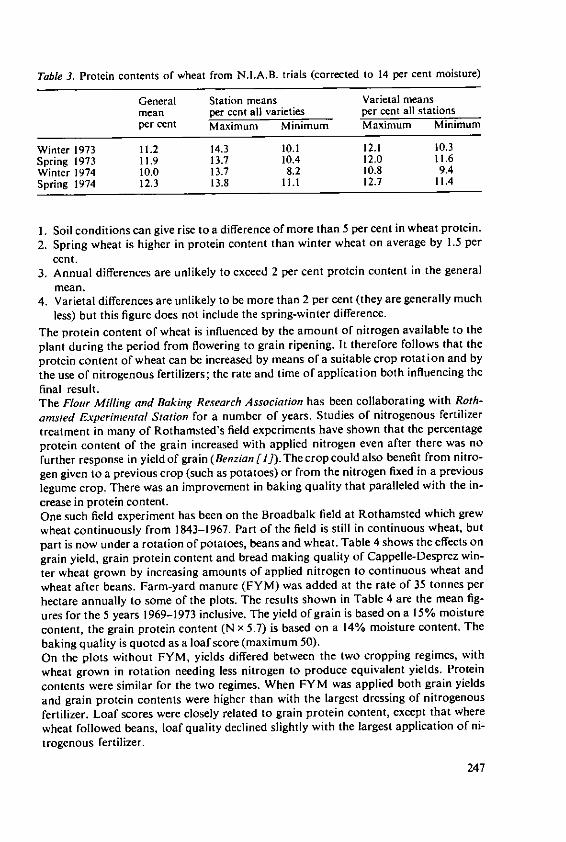
Table 3. Protein contents of wheat from N.I.A.B. trials (corrected to 14 per cent moisture)
General Station means Varietal meansmean per cent all varieties per cent all stationsper cent Maximum Minimum Maximum Minimum
Winter 1973 11.2 14.3 10.1 12.1 10.3Spring 1973 11.9 13.7 10.4 12.0 11.6Winter 1974 10.0 13.7 8.2 10.8 9.4Spring 1974 12.3 13.8 11.1 12.7 11.4
1. Soil conditions can give rise to a difference of more than 5 per cent in wheat protein.2. Spring wheat is higher in protein content than winter wheat on average by 1.5 per
cent.3. Annual differences are unlikely to exceed 2 per cent protein content in the general
mean.4. Varietal differences are unlikely to be more than 2 per cent (they are generally much
less) but this figure does not include the spring-winter difference.
The protein content of wheat is influenced by the amount of nitrogen available to the
plant during the period from flowering to grain ripening. It therefore follows that theprotein content of wheat can be increased by means of a suitable crop rotation and bythe use of nitrogenous fertilizers; the rate and time of application both influencing thefinal result.The Flour Milling and Baking Research Association has been collaborating with Roth-
ansted Experimental Station for a number of years. Studies of nitrogenous fertilizertreatment in many of Rothamsted's field experiments have shown that the percentageprotein content of the grain increased with applied nitrogen even after there was nofurther response in yield of grain (Benzian [1]).Thecrop could also benefit from nitro-
gen given to a previous crop (such as potatoes) or from the nitrogen fixed in a previouslegume crop. There was an improvement in baking quality that paralleled with the in-crease in protein content.One such field experiment has been on the Broadbalk field at Rothamsted which grew
wheat continuously from 1843-1967. Part of the field is still in continuous wheat, but
part is now under a rotation of potatoes, beans and wheat. Table 4 shows the effects on
grain yield, grain protein content and bread making quality of Cappelle-Desprez win-
ter wheat grown by increasing amounts of applied nitrogen to continuous wheat and
wheat after beans. Farm-yard manure (FYM) was added at the rate of 35 tonnes per
hectare annually to some of the plots. The results shown in Table 4 are the mean fig-
ures for the 5 years 1969-1973 inclusive. The yield of grain is based on a 15% moisturecontent, the grain protein content (N x 5.7) is based on a 14% moisture content. Thebaking quality is quoted as a loaf score (maximum 50).On the plots without FYM, yields differed between the two cropping regimes, withwheat grown in rotation needing less nitrogen to produce equivalent yields. Protein
contents were similar for the two regimes. When FYM was applied both grain yields
and grain protein contents were higher than with the largest dressing of nitrogenousfertilizer. Loaf scores were closely related to grain protein content, except that where
wheat followed beans, loaf quality declined slightly with the largest application of ni-trogenous fertilizer.
247
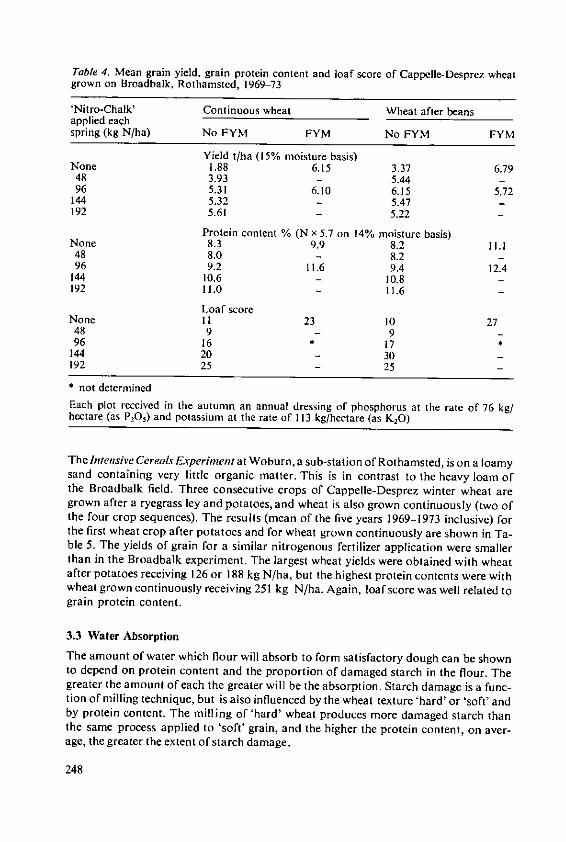
Table 4. Mean grain yield, grain protein content and loaf score of Cappelle-Desprez wheatgrown on Broadbalk, Rothamsted, 1969-73
'Nitro-Chalk' Continuous wheat Wheat after beansapplied eachspring (kg N/ha) No FYM FYM No FYM FYM
Yield t/ha (15% moisture basis)None 1.88 6.15 3.37 6.79
48 3.93 - 5.44 -96 5.31 6.10 6.15 5.72
144 5.32 - 5.47 -192 5.61 5.22
Protein content % (N x 5.7 on 14% moisture basis)None 8.3 9.9 8.2 1I.148 8.0 - 8.2 -96 9.2 11.6 9.4 12.4
144 10.6 - 10.8 -192 11.0 - 11.6 -
Loaf scoreNone 11 23 10 27
48 9 - 9 -96 16 17 *
144 20 - 30 -192 25 - 25 -
* not determinedEach plot received in the autumn an annual dressing of phosphorus at the rate of 76 kg/hectare (as P,O,) and potassium at the rate of 113 kg/hectare (as 1-20)
The Intensive Cereals Experiment at Woburn, a sub-station of Rothamsted, is on a loamysand containing very little organic matter. This is in contrast to the heavy loam ofthe Broadbalk field. Three consecutive crops of Cappelle-Desprez winter wheat aregrown after a ryegrass ley and potatoes, and wheat is also grown continuously (two ofthe four crop sequences). The results (mean of the five years 1969-1973 inclusive) forthe first wheat crop after potatoes and for wheat grown continuously are shown in Ta-ble 5. The yields of grain for a similar nitrogenous fertilizer application were smallerthan in the Broadbalk experiment. The largest wheat yields were obtained with wheatafter potatoes receiving 126 or 188 kg N/ha, but the highest protein contents were withwheat grown continuously receiving 251 kg N/ha. Again, loaf score was well related tograin protein content.
3.3 Water Absorption
The amount of water which flour will absorb to form satisfactory dough can be shownto depend on protein content and the proportion of damaged starch in the flour. Thegreater the amount of each the greater will be the absorption. Starch damage is a func-tion of milling technique, but is also influenced by the wheat texture 'hard' or 'soft' andby protein content. The milling of 'hard' wheat produces more damaged starch thanthe same process applied to 'soft' grain, and the higher the protein content, on aver-age, the greater the extent of starch damage.
248
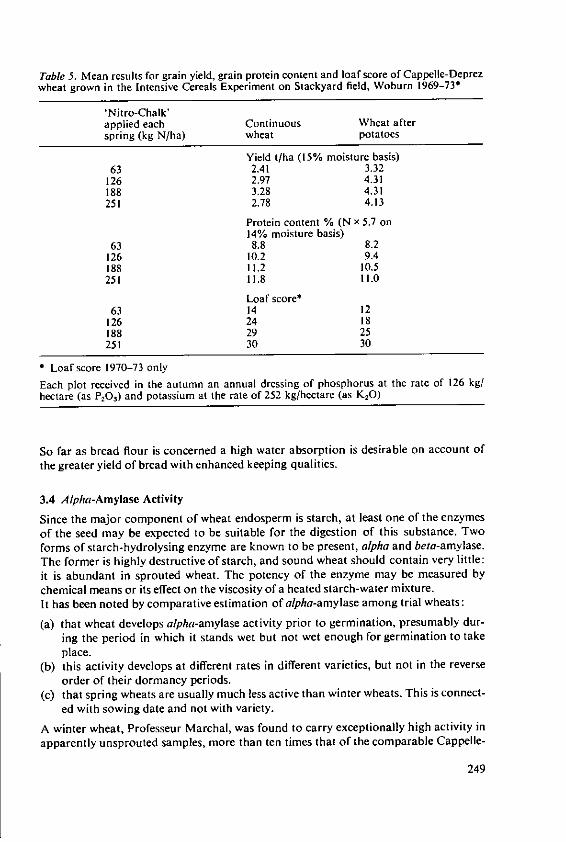
Table 5. Mean results for grain yield, grain protein content and loaf score of Cappelle-Deprezwheat grown in the Intensive Cereals Experiment on Stackyard field, Woburn 1969-73.
'Nitro-Chalk'applied each Continuous Wheat afterspring (kg N/ha) wheat potatoes
Yield t/ha (15% moisture basis)63 2.41 3.32
126 2.97 4.31188 3.28 4.31251 2.78 4.13
Protein content % (N x 5.7 on14% moisture basis)
63 8.8 8.2126 10.2 9.4188 11.2 10.5251 11.8 11.0
Loaf score*63 14 12
126 24 18188 29 25251 30 30
* Loaf score 1970-73 only
Each plot received in the autumn an annual dressing of phosphorus at the rate of 126 kg/hectare (as P20,) and potassium at the rate of 252 kg/hectare (as KO)
So far as bread flour is concerned a high water absorption is desirable on account of
the greater yield of bread with enhanced keeping qualities.
3.4 Alpha-Amylase Activity
Since the major component of wheat endosperm is starch, at least one of the enzymes
of the seed may be expected to be suitable for the digestion of this substance. Two
forms of starch-hydrolysing enzyme are known to be present, alpha and beta-amylase.
The former is highly destructive of starch, and sound wheat should contain very little:
it is abundant in sprouted wheat. The potency of the enzyme may be measured by
chemical means or its effect on the viscosity of a heated starch-water mixture.
It has been noted by comparative estimation of alpha-amylase among trial wheats:
(a) that wheat develops a/pha-amylase activity prior to germination, presumably dur-
ing the period in which it stands wet but not wet enough for germination to take
place.(b) this activity develops at different rates in different varieties, but not in the reverse
order of their dormancy periods.
(c) that spring wheats are usually much less active than winter wheats. This is connect-
ed with sowing date and not with variety.
A winter wheat, Professeur Marchal, was found to carry exceptionally high activity in
apparently unsprouted samples, more than ten times that of the comparable Cappelle-
249
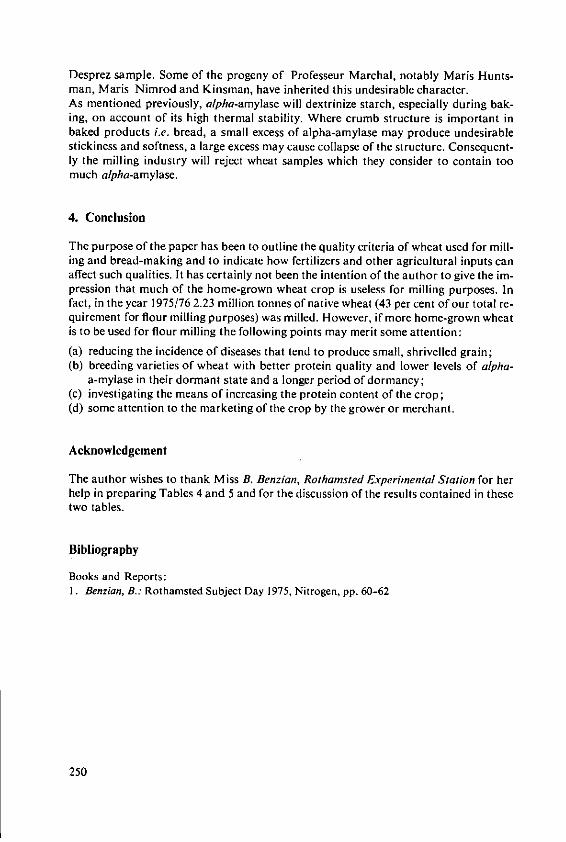
Desprez sample. Some of the progeny of Professeur Marchal, notably Mars Hunts-man, Maris Nimrod and Kinsman, have inherited this undesirable character.As mentioned previously, alpha-amylase will dextrinize starch, especially during bak-ing, on account of its high thermal stability. Where crumb structure is important inbaked products i.e. bread, a small excess of alpha-amylase may produce undesirablestickiness and softness, a large excess may cause collapse of the structure. Consequent-ly the milling industry will reject wheat samples which they consider to contain toomuch alpha-amylase.
4. Conclusion
The purpose of the paper has been to outline the quality criteria of wheat used for mill-ing and bread-making and to indicate how fertilizers and other agricultural inputs canaffect such qualities. It has certainly not been the intention of the author to give the im-pression that much of the home-grown wheat crop is useless for milling purposes. Infact, in the year 1975/76 2.23 million tonnes of native wheat (43 per cent of our total re-quirement for flour milling purposes) was milled. However, if more home-grown wheatis to be used for flour milling the following points may merit some attention:
(a) reducing the incidence of diseases that tend to produce small, shrivelled grain;(b) breeding varieties of wheat with better protein quality and lower levels of alpha-
a-mylase in their dormant state and a longer period of dormancy;(c) investigating the means of increasing the protein content of the crop;(d) some attention to the marketing of the crop by the grower or merchant.
Acknowledgement
The author wishes to thank Miss B. Benzian, Rothamsted Experimental Station for herhelp in preparing Tables 4 and 5 and for the discussion of the results contained in thesetwo tables.
Bibliography
Books and Reports:1. Benzian, B.: Rothamsted Subject Day 1975, Nitrogen, pp. 60-62
250
Co-ordinator's Report on theFourth Session
Dr. Th. Walsh, Director, The Agricultural Institute of Ireland, Dublin/Ireland; Member ofthe Scientific Board of the International Potash Institute
The subject matter of this session, i.e., the effects of fertilizers on production of carbo-hydrates, is a comprehensive one and in one way or another has been the subject ofmuch research over a long period. To facilitate analysing the work of this Session,I have divided it broadly into two parts, one dealing with what can generally bedescribed as component research work included in the paper by Drs. ChristianeMercier, Aunatire and Thrivend and the communications by Drs. K6chli, Miltchevaand Drs. Benvenuti and Miele (the latter not presented at the Session) and Stewart. Thesecond group of papers includes those of Messrs. Evans and Ezeilo which basicallydeal with the synthesising of research components into production systems or targetsetting blueprints, a subject currently attracting great interest.The subject discussed by Dr. Christiane Mercier et al. is an especially complex one.Here she was faced with dealing with many forms of carbohydrates and many differenttypes of uses. In effect it had to cover the chain from the soil to the animal. It has
suffered in some ways because of its essentially generalised nature and one would havewished for a deeper probe into some of the aspects. For instance, P and K are statedto have no effect on cellulose level or the digestibility of organic matter. The tworeferences cited deal only with the effects of nitrogen.However, Dr. Christiane Mercier has brought forward a number of very importantpoints. For instance, wheat and barley are shown as accumulating starch at differentrates and contain levels of 70% and 58% of dry matter, respectively, a fact whichprobably explains most of the difference in their digestible energy content. The grassesand legumes are shown to behave differently. In grass the cytoplasmic carbohydratecontent does not vary with age, whereas the composition of the cell wall carbohydratechanges. In legumes the cytoplasmic carbohydrate decreases but the composition ofthe cell wall carbohydrate remains almost constant during growth. Consequently, thedigestibility of legumes declines less rapidly with maturity than that of grasses, avariation which is of considerable importance in relation to grazing. The effects oflight and temperature on forage carbohydrates are discussed, with plants grown at
10 to 180C having higher levels than those at 24°-320 C. It is shown that variation inthe nutritive value of maize occurs with location.The section on post-harvest treatments deals with ensiling, drying and technologicalprocessing. This session suffers from being too generalised. There are already many
251
good reviews on this subject, especially in reference to cereals other than maize. Thestatement that the nutritive value of maize can be reduced by artificial drying at 1400Cis of considerable importance and one is left with the question as to why this obtainsand does not hold for other cereals. Processing of cereals does not apparently markedlyaffect nutritive value, while the differences between cattle and sheep in their need forprocessed cereals is noted but not explained. Sheep, for instance, are known to masti-cate more efficiently than cattle and hence do not require ground cereals.In essence, this paper has clearly demonstrated the complexity of this subject and thehighly interactive nature of the factors involved, such as stage of growth, species orvariety of plant, climatic conditions, geographic location and nutrients. Inevitably anumber of questions arise as to the future orientation of work in this field. There is aquestion-mark relating to the precision of the present methods of analysis and withregard to the more precise effects of different methods of processing and preparationon the different organic fractions. For instance, silage in one form or another, as it isproduced by various inputs, has become a highly important item of diet for ruminantanimals in many countries. Yet the information in this field, relating to pastures isimprecise especially as it relates to seasonality and acceptability to the animal. It isknown, for instance, that there is a substantial difference between the response ofanimals to silage and hay as reflected in the animal product, i.e., amount of lean andfat in meat. Here obviously the method of measurement comes into question and crudemethods of measurement such as total carcase response are no longer of any real value.Similar questions arise in relation to the measurement of the significance of bettervarieties of crop plants. Work on the effects of processing is especially necessaryand this is indicated by the authors when they propose that new processes should bedeveloped which will permit the destruction of linkages between polysaccharides andlignin to facilitate the action of the digestive microflora of the ruminant.The other three communications, i.e., by Drs. Kiehl, Milicheva, and Benvenuti andMiele (the latter not presented at the Session) which come into the component categoryall deal with one crop, i.e., sugar beet. In general much of the data on the straight-forward effect of fertilisers on the yield and quality of the crop is known. There are,however, a few questions which inevitably arise from these papers. The paper byDr.. KSch/ in which N/K interactions relating to crop yield are clearly demonstrateddoes not, however, penetrate into the reasons why these interactions occur or giveany insight into the physiological processes in the plant which are involved, and indeedas to how other nutrients, both organic and inorganic, are effected. Over the years,there has been much discussion on interactions which give rise to synergistic andantagonistic effects but far too little study into the reasons why. Perhaps now that Dr.Kdchl has this growth technique available relating to N/K interactions he mightproceed further into explaining why they occur. In relation to his paper, a majorquestion arose during the meeting as to the significance of the results obtained bythe cultural technique in relation to field conditions.In a rather similar fashion, Dr. Miltcheva, after demonstrating so clearly the effectbetween two different soils did not proceed to identify what factors were involved.One is tempted to ask if more potassium were applied down the profile to the loweryielding soil, would the yields have been equalised, or was it the level of soil organicmatter giving rise through biological activity to the release of carbon dioxide, into theatmosphere near the plants and so providing a different micro climate. In other words,what was the comparative balance between the different growth producing factors in
252
the particular soil environments under which the responses were obtained? Again, Ibelieve it is not sufficient for the soil scientists of to-day to point out that soils producedifferent yields. They should be concerned as to why this happens.The other paper dealing more or less with component type work was that of Dr. Stewartrelating to factors affecting the quality of wheat needed for milling and baking. Someof the information presented is known and documented. It is well known, for instance,that hard and soft wheats differ in milling and baking quality; that the strength ofgluten determines the type of loaf and that alfa amylase is highly important in deter-mining quality. However, this paper clearly demonstrated the relationship betweenfertilizer use and quality and that the latter could to a substantial degree be regulatedby controlling the nutritional environment. Accepting this position one inevitablymust ask the question as to how the baking characteristics of wheaten flour can beimproved and modified to meet the special needs of modern processing equipment.Is there a better way than merely blending a good wheat and a poor one in differentproportions? Technologically, the indications are that a managed flour, for instance,with a higher protein content can be produced by suitably processing rather conven-tional wheats. In the future development of cereals, it is obvious that it should bepossible to diversify use by producing new food products. One would like to haveheard something more on such an approach.The remaining two papers by Dr. Evans and Mr. Ezeilo deal largely with systemsdeveloped from research, designed to make the best possible use of component researchwork. This approach is highly important at a time when research workers everywhereare becoming more and more conscious of the fact that the results of their workshould be used to the greatest advantage and should be transferred into technologyof one type or another for use against the background of local needs and requirements.In essence, this refers to the process of technology transfer, a process so vital and asyet about which so very little is known.In regard to their approach, these two papers differ in certain respects. That of Evansbasically refers to blueprints based on the concept of potential maximum yields. Inother words, it is a matter of target setting and synthesising components into meaning-ful systems of production. So far, most success, as indicated in Dr. Evans paper hasbeen with the potato crop which in some respects is the simplest to use. Equally goodresults have been achieved with the tomato crop. However, with cereals and with somany variables, such as tillering affected by seeding rate and growth processes, successhas not been achieved so far. This is plainly acknowledged in the paper. This clearlyemphasises that the system developed to achieve certain targets depends on whatcomponents are in the package and how they fit together. The year to year variationshown in Dr. Evans results, i.e., a variation from 70 to 90 tons per hectare in differentyears again emphasises the balance which must be achieved between the differentproduction components.The importance of the 'package of practices' approach to fertiliser use is especiallyemphasised in the paper by Mr. Ezeilo who has given a very interesting account ofhow this approach is being used effectively in the Nigerian National Accelerated FoodProduction Project. Essentially Mr. Ezeilo set out to look at the different componentsin relation to some tropical root crops emphasising the contribution of a number offactors such as genetic improvement, climatic conditions, the influence of farmingsystems and the interaction of these factors with the social requirements of increasingpopulation and soil conservation. Of special interest is the approach to fertiliser use in
253
ameliorating what is in effect the impact of social structures on soil conservation. Itwould be difficult, in terms of food production in developing countries, to over-emphasise the important implications in Mr. Ezeilo's paper.Finally, in relation to this session as a whole and from our visit to Stockbridge Horti-cultural Experiment Station, it seems opportune that research workers primarilyinvolved with component type research work might, from the beginning, see theirwork in the perspective of target setting systems. They might attempt to begin withthe concept of a total system and see how the different components being researchedcan make a meaningful contribution to the system. In other words, how does any onecomponent affect the 'package of practices'. We have used this approach at some ofour research Centres with productive results.
254

5th Session
Effects of Fertilizers on the Productionof LipidsCo-ordinator: Prof. Dr. LArnon,
Director of Research, Settlement Study Center,Rehovot/Israel; Member of the Scientific Boardof the International Potash Institute
Relationship between the Use of Fertilizersand the Production of Lipids
L..A.Appelqvist, Department of Food Hygiene, The Swedish University of AgriculturalSciences, Uppsala/Sweden*
Summary
Recent literature on the effect of mineral nutrition of the seed on the oil content and oil com-position of harvested soybeans, groundnuts, sunflowers and rape seed/mustard seed is brieflyreviewed. Application of increasing levels of nitrogen fertilizer generally decreases the oilcontent and increases the protein content of such seeds. Application of phosphorous generallyincreases the oil content. The effect of potassium is highly variable, however in many casesan increase in oil content is observed.The effect of soil nutrition on the fatty acid composition of the seeds harvested is very smalland of no practical importance, although a statistically significant effect may sometimes benoted.These effects are discussed in relation to the biochemistry and physiology of oil seed cropsduring seed development.
Introduction
Human consumption of plant lipids is mainly from the vegetable oil. However, incountries with a low standard of living the relative supply from so called 'indirectsources' as such as cereals, tubers, pulses, fruits and vegetables is quite substantial.In the present review part of the discussion relating to indirect effects between the useof fertilizer and the production of lipids can apply to all kind of food plants containinglipids. However, information from fertilizer experiments will be confined to fourcrops or crop groups: soybeans, groundnuts, sunflower and rape seeds/mustard seed.Since the topic assigned to me for this conference is not at our laboratory beingcontinuously watched in current literature, a special search was made in Field CropsAbstracts for the years 1972-1976, yielding a total of 121 references. Together withliterature available to the author from previous research in this area (Appelqvist [3])as well as other literature searching, there were numerous references available. It isbeyond the capacity of this reviewer, who is a plant biochemist/food scientist with notraining in agronomy or plant physiology, to present a well digested over-all viewon the effect of mineral fertilizers applied to different soil types on the seed and oilyield of different oilseed crops. The paper however, contains a brief summary with
* Dr. L.A.Appelqvist, Assoc. Professor, Department of Food Hygiene, Roslagsvagen 101,S-10405 Stockholm/Sweden
257
references to papers published in the last ten years on the effect of mineral fertilizeron the oil content and quality of oil seed crops. As most of the participants of thecolloquium probably know, there are continously ongoing fertilizer field experimentsin many of the industrial countries where oil seeds are produced. Thus for instancethe Swedish Oil Plant Growers' Association has conducted such fertilizer trials withrape seed over the last 30 years, trying new varieties with new combinations of mineralfertilizers and other agronomic practises. It appears almost impossible to make ageneralized view of the outcome of such experiments as regards seed yield and seedcomposition.
What is meant by oil seed quality?
Any discussion on the quality characteristics of an oil seed crop must consider the endutilization of the oil contained in such seeds. For the present discussion, the only enduse is for food, since the general outline of the different colloquia organized by theInternational Potash Institute is to evaluate the use of mineral fertilizer for foodproduction. It must however, be remembered that some seed oils are used for non-food purposes. Further, the quality of seed oil for food depends on the populationwhich is going to consume the oil. This is very much apparent when the quality ofrape seed or mustard seed oil is considered, but is perhaps also apparent with othercrops. Since my own experience is with rapeseed mainly in industralized countries butto a small extent in developing countries the example will be taken from this groupof oil seeds.In the processing of rape seed or other cruciferous seeds for edible oil in industrializedcountries the end product is a colourless and odourless (bland) oil, which is eitherused as a salad oil or as an ingredient in margarine. Hence, the oil seed which has aminimum of other lipids than triglycerides, or triacylglycerols as they are nowadayspreferentially named, is the best raw material for the edible oil industry. The processingshould be conducted in such a way that the glucosinolates containing sulphur are notsplit to lipophilic breakdown products such as isothiocyanates (see Figure I in theaccompanying paper by Forster, page 310), which are dissolved in the oil and areruining the catalysts used in the hydrogenation of the oil.In the Indian subcontinent on the other hand, the rape and mustard oils are appre-ciated for their pungency, viz. their content of isothiocyanates. In India, Pakistan andBangladesh rape and mustard seed is often processed by small crushing units inwhich the glucosinolates present in the seeds are allowed to react with the glucosinolate-splitting enzymes (myrosinases). In the intact seeds these enzymes are located inspecial cells and therefore do not attack the glucosinolates. (The isothiocyanatesformed are also the flavouring substances of table mustard.) Thus the application ofsulphur fertilizers, which to some extent increases the content of glucosinolates in rapeand mustard seed, can be a slightly negative factor for rape seed in Europe and Canadabut can be a positive factor in India.In certain rape seed producing areas such as Western Europe and Canada where theultimate goal is a iefined oil, the content of such substances in the crude oil whichmust be removed in the refining is of course to be considered in discussing the quality.Since the major part of the phospholipids, the free fatty acids and all the pigments,mainly carotenoides and chlorophylls, are removed in the various steps of vegetable
258
oil refining, any agronomic practice which raises the level of those substances whichhave to be removed in the refining is of course a negative factor in seed oil quality.The fatty acid pattern of the triglycerides can also be an important quality factor. Sinceerucic acid, the major fatty acid of classical rapeseed oil, has been found responsiblefor the changes in the heart muscle which is observed after feeding of rape seed oil toexperimental animals, cultivars with very low levels of erucic acid have been developed.Since intake of linoleic acid is considered beneficial and since linolenic acid causes aquicker development of rancitity, conditions of cultivation which effect high linoleicacid and low linolenic acid contents are favourable. Further information on thesematters are found in Appelqvist and Ohison [4A].
Soybeans
Soybeans are the leading producer of vegetable oils in the world (Table I). Majorproduction areas are USA, China and Brazil. Since soybeans are richer in proteinthan in oil they can also be considered as a protein crop. Consequently, much dataon the effect of mineral fertilizer on the yield, oil content and protein content wasdiscussed already by scientists from Brazil, from Romania and from the US in thereport from the I Ith IP1 Colloquium 'Fertilizer Use and Protein Production'. Further,the effect of mineral nutrition on the oil content of soybeans is treated extensively inanother paper at this symposium (Davidescu et al., page 324).In most instances, application of nitrogen decreases the oil content whereas theapplication of phosphorus and potassium increases the oil content of soybeans. It hasbeen stated that added N in the US usually does not produce economic response.The effect of mineral nutrition of the oil quality of soybeans appears to be discussedby only a few reports in recent literature. The foliar application of manganese andboron in field experiments at different locations in the US did not affect the fattyacid composition of soybeans (Boswell and Worthington [9]). As seen from table 2no marked effect on the fatty acid composition of different lines of soybeans wasobserved in US field experiments with added N and added 'N+S' fertilizer (Hamet al. [18]).
Groundnuts
The cultivation of groundnuts, in the US called peanuts, is spread in all continentsbut Europe. World production of groundnut oil is shown in table I. It appears as themajor part of scientific papers on effect of fertilizer on yield and composition ofgroundnuts published during the last 5-6 years come from Indian research. Ground-nuts is the no. I oil crop in India. Data from tropical Africa are presented at thisColloquium by Ochs and Ollagnier. Basic information in this area for the US andthe 'French-speaking' part of Africa, where a very large proportion of the groundnutproduction occurs, has probably been published far earlier. However, a few papersfrom Africa and America also contribute to the following information.Results from field experiments at 3 US locations in 1968-1970 demonstrated nosignificant effect on seed yield and oil percentage from 4 different rates of Nitrogenfertilizer (0-134,4 kg/ha) but for two treatments; seed oil content was significantly
259
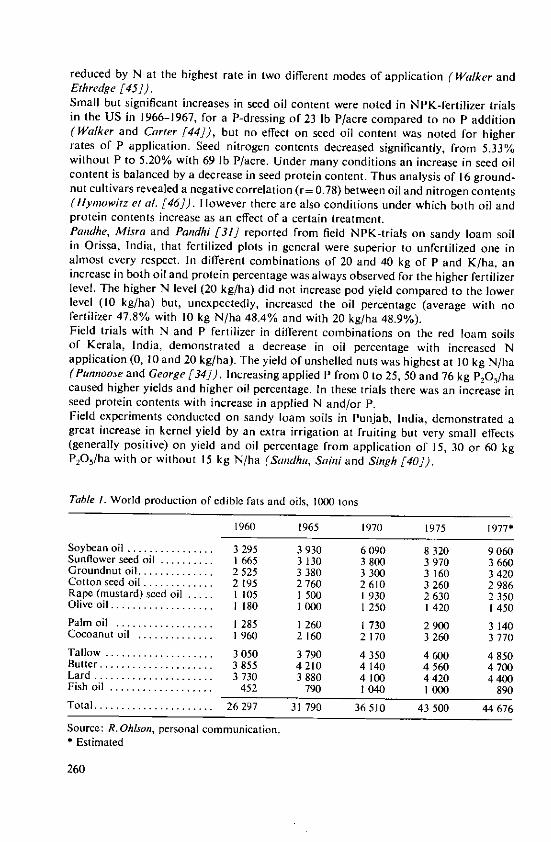
reduced by N at the highest rate in two different modes of application (Walker andEthredge [45]).Small but significant increases in seed oil content were noted in NPK-fertilizer trialsin the US in 1966-1967, for a P-dressing of 23 lb P/acre compared to no P addition(Walker and Carter [44]), but no effect on seed oil content was noted for higherrates of P application. Seed nitrogen contents decreased significantly, from 5.33%without P to 5.20% with 69 lb P/acre. Under many conditions an increase in seed oilcontent is balanced by a decrease in seed protein content. Thus analysis of 16 ground-nut cultivars revealed a negative correlation (r= 0.78) between oil and nitrogen contents(Hiymowitz el al. [46]). However there are also conditions under which both oil andprotein contents increase as an effect of a certain treatment.Pandhe, Misra and Pandhi [31] reported from field NPK-trials on sandy loam soilin Orissa, India, that fertilized plots in general were superior to unfertilized one inalmost every respect. In different combinations of 20 and 40 kg of P and K/ha, anincrease in both oil and protein percentage was always observed for the higher fertilizerlevel. The higher N level (20 kg/ha) did not increase pod yield compared to the lowerlevel (10 kg/ha) but, unexpectedly, increased the oil percentage (average with nofertilizer 47.8% with 10 kg N/ha 48.4% and with 20 kg/ha 48.9%).Field trials with N and P fertilizer in different combinations on the red loam soilsof Kerala, India, demonstrated a decrease in oil percentage with increased Napplication (0, 10 and 20 kg/ha). The yield of unshelled nuts was highest at 10 kg N/ha(Punnoose and George [34]). Increasing applied P from 0 to 25, 50 and 76 kg P205/hacaused higher yields and higher oil percentage. In these trials there was an increase inseed protein contents with increase in applied N and/or P.Field experiments conducted on sandy loam soils in Punjab, India, demonstrated agreat increase in kernel yield by an extra irrigation at fruiting but very small effects(generally positive) on yield and oil percentage from application of 15, 30 or 60 kgP2 0/ha with or without 15 kg N/ha (Sand/hu, Saint and Singh [40]).
Table I. World production of edible fats and oils, 1000 tons
1960 1965 1970 1975 1977*
Soybean oil ................. 3 295 3 930 6090 8 320 9 060Sunflower seed oil .......... I 665 3 130 3 800 3 970 3 660Groundnut oil .............. 2525 3 380 3 300 3 160 3 420Cotton seed oil ............. 2 195 2760 2610 3 260 2986Rape (mustard) seed oil ..... 1105 1 500 I 930 2 630 2 350Olive oil ................... 1 180 I 000 1 250 I 420 I 450Palm oil .................. 1 285 1 260 1 730 2900 3 140Cocoanut oil .............. 1960 2 160 2 170 3260 3770Tallow .................... 3 050 3 790 4 350 4 600 4 850Butter ..................... 3 855 4210 4140 4560 4700Lard ...................... 3 730 3 880 4 100 4420 4400Fish oil ................... 452 790 1 040 1 000 890
Total ...................... 26297 31 790 36510 43500 44 676
Source: R. OhIson, personal communication.* Estimated
260
Applying a uniform dose of 15 kg N/ha and 25 kg K 20/ha, Saini and Tripathi [39]found increasing pod yield with increasing doses of P fertilizer, 0, 20 and 40 kg P2O5/ha.No papers were found in our literature search on the effect of fertilizer on the oilquality of groundnuts. However, this does not mean that such data do not exist inthe literature.
Sunflower
World production of sunflower seed oil shares a second position with groundnutoil (Table 1). Major production areas are Soviet Union and Argentina.The effect of mineral fertilizer on the oil content and oil yield of sunflowers mainlyproduced in Eastern Europe is reviewed in another paper in this Colloquium (Davi-descu et al., page 314). Since recent literature on the effect of mineral fertilizer onsunflower seed oil content is extensive, the data from individual reports will be brieflysummarized. For data on seed yield, the paper by Davidescu has to be consulted.In some experiments nitrogen fertilizer alone reduced the oil content (Francesco [14],Pacucci and Searascia-Mugnozza [30], Petrova and Kolev [32], Singh et al. [42],Vicentini and Anelli [48], Zubriski and Zimmerman [49]), whereas in other experi-ment no effect was observed (Matvienko et al. [27], Po/uektov [33], Rakitina [35])and in still other experiments the oil percentage was increased by low doses of nitrogenbut decreased by high doses (Morris [29], Rainaswamy et al. [36]).Phosphorus alone, potassium alone or P+ K or N+P generally increased the oilpercentage (Agalarov [1], Aleksandrov and Rakitina [2], Balaganskaya et al. [6],Golsteva and Varvarina [16], Jocic [21], Karastan [23], Petrova and Kolev [32],Rakitina [35], Rollier et al. [38], Singh et al. [42], Varennikova [47], Vicentini andAnnelli [48]).The interested reader should also consult the Proceedings of the 5th InternationalConference on Sunflower, 25-29 July (1972), Clermont-Ferrand, Paris, France,CETIOM, INRA and ITERG [i/] which contains articles with much information inthis area.As regards mineral nutrition effects on seed oil quality, very little has been found inthe recent literature. It has been reported that N increased the relative proportions ofsaturated fatty acids ( Vicentine and Annelli [48]) whereas added P tended to increasethe content of unsaturated fatty acids (Rollier et al. [38], Varennikova [47]) as didadded K (Rollier el al. [38]).
Rape and mustard seed
World production of oil from rape and mustard is about 2 million tons. Majorproduction areas are Canada, India, China, Poland, France, Germany (FRG andGDR) and Sweden.The commodity traded under the name of rape seed can be the harvest from eitherBrassica napus (rape) or B. campestris (turnip rape) or a mixture of the two. WhereasCanadian rape seed is often a mixture of the two species, European rape seed is pre-dominantly but not entirely B. napus. Rape seed from the Indian subcontinent is oftenB. campestris and mustard seed from India is most probably B. juneea. This must be
261
born in mind when comparing literature data on these crops. See Appelqvist andOhlson [4A] for further information.In Europe rape seed can further be sown in the fall and harvested in the next summer orsown in the spring and harvested in the fall whereas rape seed in Canada is always ofthe spring-sown type.Fertilizer experiments in Europe have generally indicated a heavy requirement ofnitrogen and a substantial one of phosphorus whereas that for potassium is varying.For a yield of 4000 kg/ha, which can be obtained with winter rape seed in Europe,ca. 135 kg of N, 55 kg of P, and 70 kg of K is utilized. See also the paper by Gasserin this volume (page 341) and a paper by Johansson [22] at the 9th Congress of IPI.On many soils additional sulphur must also be applied; see reviews in Field CropsAbstract for details (Ldaf [26], Bunting [10]). It has been stated from Swedishexperience that often higher dressings of N are used than what is economically sound.From the farmer's point of view, this might vary from country to country, dependingon whether he is paid for seed or for seed oil. In Sweden, the oil content is determinedon all farmers harvest of rape seed traded.The oil content of rape is generally decreased by nitrogen fertilizers as is discussed byForster in this Colloquium (page 307), and earlier reported by many authors; see e.g.Hohnes and Ainsley [20] and Ioc.cit. Application of sulphur fertilizer gave increasedoil content in French experiments (Rollier and Ferrif [37], but decreased oil contentin Polish experiments Babuchowski [5]).Potassium applied alone has been reported to cause an increase in oil content (Garau-deaux and Chevalier [15]). Whereas the yield of fall sown rape seed in Europe istypically 2600-3600 kg/ha, that of spring sown rape and turnip rape in Canada is oftenca. 1000 kg/ha. The short-season crops (3-4 months) yield much less in India, Bangla-desh and Pakistan, ca. 500-600 kg/ha. The low yields are related to three factors atleast: planting on marginal lands, lack of fertilizer and lack of irrigation. It has beenestimated in Bangladesh that with proper mineral fertilizer, a doubling of yield caneasily be attained. Actually yields of 1500 kg of rape/mustard seed is obtained in Indiain farming with proper technique.Also in Brassicajuncea (Indian mustard or Rai), it appears as nitrogen decreases theoil content but phosphorus increases the oil content (Mehrotra et al. [28] and loc. cit.).Other Brassica crops in India of the B. camtpestris type (Toria, Brown Sarson andYellow Sarson) have been reported to respond to N by decreased oil content but noeffect was noted on oil content with added P or K (Gupta and Das [17]). Applicationof N+P decreased the oil content in B. campestris, var. Toria, (Dhindsa et al. [12]),and in B. campestris var. Brown Sarson (Singh et al. [41]).Only a few papers report studies on the rape seed oil quality in relation to mineralnutrition. Report on winter rape seed from New Zealand and GDR and winterrape seed and turnip rape seed from Czechoslovakia have verified earlier reports onsummer rape seed (Appelqvist [3]) demonstrating only very small effects on fatty acidpatterns from various levels of nitrogen fertilization (Lanmerink and Morice [25],Herrman [19], Fiby [13]). Although of a small magnitude, the nitrogen fertilizergenerally causes an increase in erucic acid content of 'classical' cultivars, see table 3.In Polish experiments with both winter and summer rape seed, application of N and Sis reported to decrease the erucic acid percentage and increase the oleic and linoleicacid percentages, whereas phosphorus and boron had effects opposite to those byNand S (Bobrzeka et al. [8]).
262
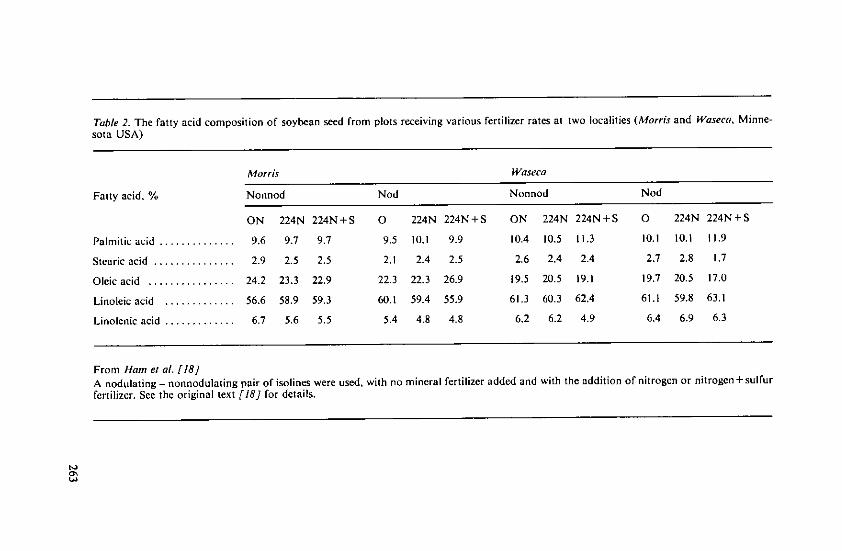
Table 2. The fatty acid composition of soybean seed from plots receiving various fertilizer rates at two localities (Morris and Waseca, Minne-sota USA)
Morris Waseca
Fatty acid, % Nonnod Nod Nonnod Nod
ON 224N 224N+S 0 224N 224N+S ON 224N 224N+S 0 224N 224N+S
Palmitic acid .............. 9.6 9.7 9.7 9.5 10.1 9.9 10.4 10.5 11.3 10.1 10.1 11.9
Stearic acid ............... 2.9 2.5 2.5 2.1 2.4 2.5 2.6 2.4 2.4 2.7 2.8 1.7
Oleic acid ................ 24.2 23.3 22.9 22.3 22.3 26.9 19.5 20.5 19.1 19.7 20.5 17.0
Linoleic acid ............. 56.6 58.9 59.3 60.1 59.4 55.9 61.3 60.3 62.4 61.1 59.8 63.1
Linolenic acid ............. 6.7 5.6 5.5 5.4 4.8 4.8 6.2 6.2 4.9 6.4 6.9 6.3
From Ham et al. [18]A nodulating - nonnodulating pair of isolines were used, with no mineral fertilizer added and with the addition of nitrogen or nitrogen + sulfurfertilizer. See the original text [18] for details.
to
Discussion
The data on oil content and (in some instances) oil composition of soybeans, ground-nuts, sunflower and rape/mustard as affected (or unaffected) by mineral nutritioncould have been extended to other oilseed crops such as cotton seed, safflower, sesameand to cereal crops, mainly oats and maize, but the aforementioned facts are sufficientas a background for our discussion on the following points:
1) Nitrogen fertilization generally increases the protein and decreases the oil content.2) Phosphorus often increases the oil content.3) Potassium sometimes increases the oil content.4) The fatty acid patterns are generally affected very little by the mineral nutrition.
Oil content
Efforts to explain these results from a physiological/biochemical point of view mustconsider both direct and indirect effects. The increased oil content upon P-additionmay be a direct effect on the fatty acid and triglyceride biosynthesis in the developingseed, since fatty acid biosynthesis requires ATP and NADPH as cofactors, see e.g.Stumpf [43]. Similarly the decrease in oil content by N-fertilizers might be explainedby increased amination of such metabolites which are precursors common to bothamino acids and acetyl CoA. Consequently there will be a decreased availability offatty acid precursors in the cell. The decrease in oil content from N-fertilizer applicationmay also be an indirect effect from a changed proportion of seed constituents (embryo,endosperm, hull) or a lengthening of the time from pollination to seed maturity as aresult of more vigorous growth. It is known that the oil accumulation and the proteinaccumulation do not run at proportional rates during the whole seed developmentperiod. In rapeseed, the oil accumulation peaks before the massive protein accumu-lation occurs. Nitrogen fertilization might also indirectly affect seed composition byincreasing the leaf area per plant and thus the amount of assimilates available to thedeveloping seed. It must be remarked that rapeseed and soybeans do contain chloro-plasts in their cotyledons during seed development and thus assimilate (Appelqvist [4].Therefore, if application of nitrogen fertilizer affects the photosynthetic apparatusin the cotyledons indirect effects on oil accumulation can be obtained thereby.A positive effect of added potassium of the oil content can be related indirectly to theincrease in sap flow in the phloem of the plant, but also to possible effects on thechloroplast.
Fatty acid patterns
Fatty acid biosynthesis is under strict genetic control and is generally only affected to asmall extent by mineral nutrition. The small effects found could be direct (changedproportions of enzymes and/or cofactors) or indirect. It is known that the differentmorphological parts.of rape seed vary in fatty acid patterns (Appelqvist and Oh/son[4A]) and that the rate of accumulation of different fatty acids is not constant fromflowering to maturity (see e.g. Appelqvist [4]). Some of the changes observed onfatty acid patterns can probably be explained from such indirect effects.It is of interest to note that the farmer thus can influence the 'quality' of the seed oilproduced to a small extent by practices of fertilizer addition, which is contrary to the
264
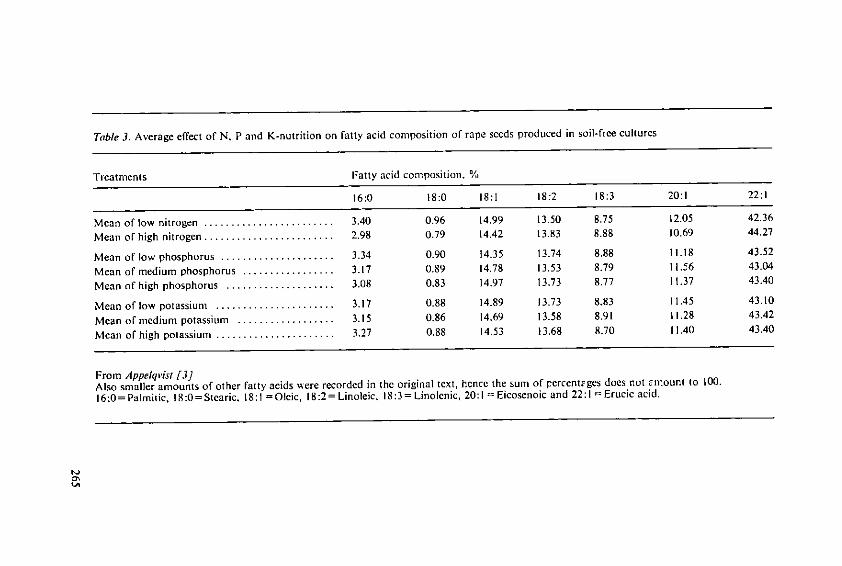
Table 3. Average effect of N, P and K-nutrition on fatty acid composition of rape sccds produced in soil-flee cultures
Treatments Fatty acid composition, %
16:0 18:0 18:1 18:2 18:3 20:1 22:1
Mean of low nitrogen ........................ 3.40 0.96 14.99 13.50 8.75 12.05 42.36
Mean of high nitrogen ........................ 2.98 0.79 14.42 13.83 8.88 10.69 44.27
Mean of low phosphorus ..................... 3.34 0.90 14.35 13.74 8.88 11.18 43.52
Mean of medium phosphorus ................. 3.17 0.89 14.78 13.53 8.79 11.56 43.04
Mean of high phosphorus .................... 3.08 0.83 14.97 13.73 8.77 11.37 43.40
Mean of low potassium ...................... 3.17 0.88 14.89 13.73 8.83 11.45 43.10
Mean of medium potassium .................. 3.15 0.86 14.69 13.58 8.91 11.28 43.42
Mean of high potassium ...................... 3.27 0.88 14.53 13.68 8.70 11.40 43.40
From Appelqvist [3]Also smaller amounts of other fatty acids were recorded in the original text, hence the sum of percentges does not on-ount to 100.
16:0= Palmitic, 18:0=Stearic. 18:1 Oleic, 18:2= Linoleic, 18:3 = Linolenic, 20:1 = Eicosenoic and 22:1 = Erucic acid.
t'Q
case with cereal proteins where heavy N-fertilization causes a 'dilution' of nutritionallyvaluable proteins with less valuable ones.It must, however, be born in mind that so far relatively few genotypes of each specieshave been tested for the effect of mineral fertilizer on fatty acid patterns of the matureseeds. In safflower it has been demonstrated that two of three genotypes tested foreffect of various temperatures during seed development on the fatty acid patternsresponded very little whereas one genotype demonstrated a large temperature sensi-tivity (Knowles [24]).To the best of the knowledge of this reviewer, no detailed studies on rates of enzymesof the developing oil seeds at different 'nutritional status' are published. Similarly,studies are generally lacking on the oil plant and seed developments in relation tomineral nutrition; only the final result, the seed yield and seed composition, is usuallyrecorded. An interesting exception is the paper by Barr et al. [7] who report reducedlevels of sulfolipids in S- and N-deficient maize leaves where an increased photosystem11 activity and occurrence of larger grana stacks are simultaneously recorded.In most instances one can only indicate alternative explanations to the changes ob-served in seed composition and perhaps stimulate to deeper studies in this area.
References
I. Agalarov, S.S.: Fertilization of irrigated sunflower on meadow-chernozem soils inKabardino-Balkar ASSR. Khimiya v Sel'skom Khozyaistve 12, 23-24 (1974)2. Aleksandrov, V.G. and Rakitina, T.N.: Effect of fertilizers applied to rows on yield of
sunflower. Khimiya v Sel'skom Khozyaistve 13, 15-17 (1975)3. Appe/qvist, L.A.: Lipids in Cruciferae. 11. Fatty Acid Composition of Brassica napus
seed as Affected by Nitrogen, Phophorous, Potassium and Sulphur Nutrition of thePlants. Physiol. Plant. 21, 455-465 (1968)
4. Appelqvist, L..4.: Biochemical and Structural Aspects of Storage and Membrane Lipidsin Developing Oil Seeds. In: Recent Advances in the Chemistry and Biochemistry ofPlant Lipids (T.Gaillard and E. 1. Mercer, Eds.) Academic Press, 247-286 (1975)
4a. Appe/qvist, L.-A. and Oh/son, R.: Rapeseed. 391 p. Elsevier Publ. Co. Amsterdam 19725. Babuchowski, K.: Processing value of rape seeds, cooking oil and oil meal as influenced
by sulphur nutrition. Zeszyty Naukowe Wyzszej Szkoly Roliczej w Olsztynie, A Suppl.No. 5, 51 pp. (1971)
6. Balaganskaya, V., Rakitina, T. and Razunova, S.: Sunflower responds to fertilizers.Zemledelie 47 (1974)
7. Barr, R., Hall, J. D., Baszynski. T., Brand, J., Crane, F. L. and Krogniann, D. .'.: TheEffect of Mineral Deficiency on the Photosynthetic Apparatus in Maize. I. The Role ofChloroplast Sulfolipid. Proc. Indiana Academy of Science 81, 114-120 (1970)
8. Bobrzecka, D., Krauze, A., Przezdzierki, Z. and Zorawski, A.: Effect of application ofmineral fertilizer on the fatty acid composition of winter and summer rape oil. RoczmoloNauk Rolniczych, A. 99, 71-84 (1973)
9. Boswell, F.C. and Worthington, R.E.: Boron and Manganese Effects on Protein, Oil,and Fatty Acid Composition of Oil in Soybeans. J. Agr. Food Chem. 19, 765-768 (1971)
10. Bunting, E.S.: Oil-seed crops in Britain. Field Crops Abstr 22, 215-223 (1969)It. CETIOM, INRA and ITERG: Proceedings of the 5th International Conference on
Sunflower, Clermont-Ferrand, Paris, France, 25-29 July, 197212. Dhindsa, K. S., Gupta, S. K., Chaudhry, M. S. and Singh, B. P.: Effect of date of sowing,
spacings and fertility levels on yield and chemical composition of toria (Brassica campestrisvar. toria Duthie and Full). Indian J. of Agricult. Research 7, 153-158 (1973)
13. Fiby, J.: Study of rapeseed oil quality. RostlinnA Vyroba 18, 579-591 (1972)14. Francesco, T.: Research on sunflower carried out at the Agronomy Institute of the
Faculty of Agriculture at Milan. Annali dell'Accad. di Agricolt. di Torino 114, 254-258(1971/1972)
266
15. Garaudeau, J. and Chevalier, H.: Studies of interactions between nitrogen and potassiumfertilizers. Overall results of long term trials at the Agronomy Station at Aspach-le-Bas.Comptes Rendus des Siances de I'Acad. d'Agricult. de France 61, 746-759 (1975)
16. Gol'steva, O.F. and Varvarina, Z. V.: Application of mineral fertilizers to sunflower.Khimiya v Sel'skom Khozyaistve 12, 10-11 (1974)
17. Gupta, S.K.D. and Das, K.: Effect of level and time of application of N, P and K on yieldand oil content of rape (Brassica campestris L. var. yellow sarson T42). Indian Agricult.17, 163-168 (1973)
18. Ham, G.E., Liener, I.E., Evans, S.D., Frazier, R. D. and Nelson, W. W.: Yield andcomposition of soybean seed as affected by N and S fertilization. Agron. J. 67, 293-297(1975)
19. Herrmann, B.: Fetts.urezusammensetzung der Rohfettfraktion des Winterrapskornes inAbhngigkeit von der Stickstoffdfngung. Arch. Acker- und Pflanzenbau und Bodenkd.,Berlin 21, 141-148 (1977)
20. Holmes, M.R.J. and Ainsley, A.M.: Fertiliser Requirements of Spring Oil-seed Rape.J. Sci. Fd Agric. 28, 301-311 (1977)
21. Jocic, B.: Relationships among leaf area, content of some elements in plant tissues, andyield of sunflower at various nutrient levels. Savremena Poljoprivreda 21, 57-68 (1973)
22. Johansson, O. H.H.: The intensification of oil crops (cruciferous) through fertilizer use.In: Proceedings of the 9th Congress of the International Potash Institute, Antibes,155-159 (1970).
23. Karastan, D.I.: Effect of mineral fertilizers on seed yield and quality of sunflower.Khimiya v Sel'skom Khozyaistve 12, 12-13 (1974)
24. Knowles, P. F.: The Plant Geneticist's Contribution Toward Changing Lipid and AminoAcid composition of Safflower. J. Am. Oil Chemists' Soc. 49, 27-29 (1972)
25. Lammerink, J. and Morice, I.M.: The effects of nitrogen and of a granulated systemicinsecticide on seed yield, 1000-seed weight, oil percentage, and fatty acid compositionof biennial rape seed (Brassica napus L.). New Zealand J. of Agricult. Research 13,921-929 (1970)
26. L66f, B.: The agronomy and present position of oil-seed crops in Scandinavia - a reviewof the literature. Field Crops Abst. 13, 1-7 (1960)
27. Matvienko, A.G. Poluektov, G.N., Tomakh, A.G. and Tkachev, N.A.: Effect and residualeffect of fertilizers on sunflower. Khimiya v Serskom Khozyaistve 13, 19-22 (1975)
28. Mehrotra, 0. N., Sinha, N. S.. Srivastava, R. D. I. and Rajendra Kumar: Effect of fertilizerson uptake of nutrients, yield and oil content of Indian mustard (Brassica juncea L.Czern Coss.). Indian Agriculturist 16, 49-55 (1972)
29. Morris, A.: Effects of nitrogen on sunflowers (Helianthus annaus). Rhodesia Agricult. J.72, 149 (1975)
30. Pacucci, G. and Scarascia-Mugnozza, G. T.: Aspects and problems of sunflower culturein Southern Italy. In: Proc. 5th Intern. Conference on Sunflower, 25-29 July 1972,Clermont-Ferrand, Paris. CETIOM, INRA and ITERG 490-496
31. Pandhe, D., Misra, S.N. and Padhi, S.C.: Response of groundnut varieties to varyinglevels of fertility. Indian J. Agron. 16, 249-250 (1971)
32. Pefrova, M. and Kolev, I.: Fertilization of sunflower on slightly leached chernozem soilsin Dobrudzha region. I. Effect of fertilizer rates on yields. Pochvoznanie i Agrokhimiya11, 50-60 (1976)
33. Poluektov, G.N.: Fertilization of sunflower. Khimiya v Sel'skom Khozyaistve 12, 12-14(1974)
34. Punnoose, K. 1. and George, C. M.: Studies on the effect of nitrogen and phosphorus onthe yield and quality of groundnut (Arachis hypogaea L.) in the red loam soils of Kerala.Agricult. Research J. of Kerala 12, 151-157 (1974)
35. Rakitina, T.N.: Effect of mineral fertilizers on seed yields and oil contents in sunflower.In: Puty povysheniya urozhainosti polevykh kul'tur na yuge Ukrainy, Odessa, Ukrainian,SSR, 139-145 (1975)
36. Ramaswamy, R., Sennaiyan, P. and Morachan, Y.B.: Effect of graded levels of nitrogenand spacing on the oil content of sunflower. Madras Agricult. J. 61, 823-825 (1974)
37. Rollier, M. and Ferrif, J.P.: Le colza et le soufre. Oldagineux 24, 491-496 (1969)38. Rollier, M., Trocmd, S. and Boniface, R.: Observations on the application of phosphorus-
potassium fertilizer to sunflower. Informations Techniques CETIOM, No. 47, 29-37(1975)
267
39. Saini, J.S. and Tripathi, H.P.: Effect of phosphorus on different varieties of groundnut(Arachis hypogaea L.). J. of Research, Punjab Agricult. Univ. 12, 355-358 (1975)
40. Sandhu, R.S., Saini, J.S. and Singh, T.: The effect of irrigation and fertilizer levels onthe yield and quality of groundnut C501. J. of Research, Punjab Agricult. Univ. 9,535-540 (1972)
41. Singh, B.P., Bhola, A. L. and Yadava:, T. P.: Studies on the growth, yield and oil contentof brown sarson (Brassica campestris var. brown sarson Duthie) with varying row spacingsand fertility levels. Haryana Agricult. Univ. J. of Research 1, 11-15 (1971)
42. Singh, P.P., Sharma, Y.K. and Kaushal, P.K.: Effect of varying levels of nitrogen andphosphorus on the yield and quality of sunflower. JNKVV Research Journal 7, 134-136(1973)
43. Stumpf, P.K.: Biosynthesis of Saturated and Unsaturated Fatty Acids by MaturingCarthamus tinctorius L. Seeds. J. Am. Oil. Chemists' Soc. 52, 484A-490A (1975)
44. Walker, M.E. and Carter, R.L.: The Effect of Fertilization and Storage Temperatureson Percent Nitrogen, Oils and Germination of Spanish and Runner Peanut Seed. Univer-sity of Georgia Research Bulletin No. 88, March 1971
45. Walker, M.E. and Ethredge, J.: Effect of N rate and application on Spanish peanut(Arachis hypogaea L.) yield and seed grade, N and oil. Peanut Sci. 1, 45-47 (1974)
46. Hymowitz, 7., Collins, F.I., Panezner, J., and Walker, W.M.: Relationship between thecontent of oil, protein and sugar in soybean seed. Agronomy J. 64, 613-616 (1972)
47. Varennikova, T. V.: Effect of phosphorus nutrition on contents and physical and chemicalindices of oil in seeds of sunflower. In: Fiziologiya obmena veshehestv i produktinost'rastenii. Kiskinev, Moldavian, SSR, 3-15 (1972)
48. Vicentini, G. and Annelli, G.: The effect of various rate of N and P20 on the productivityand oil composition of sunflower (Helianthus annuas L.). Agricoltura Italiana, Pisa 73,175-187 (1973)
49. Zubriski, J. C. and Zimmerman, D.C.: Effects of nitrogen, phosphorus and plant densityon sunflower. Agronomy J. 66, 789-801 (1974)
268
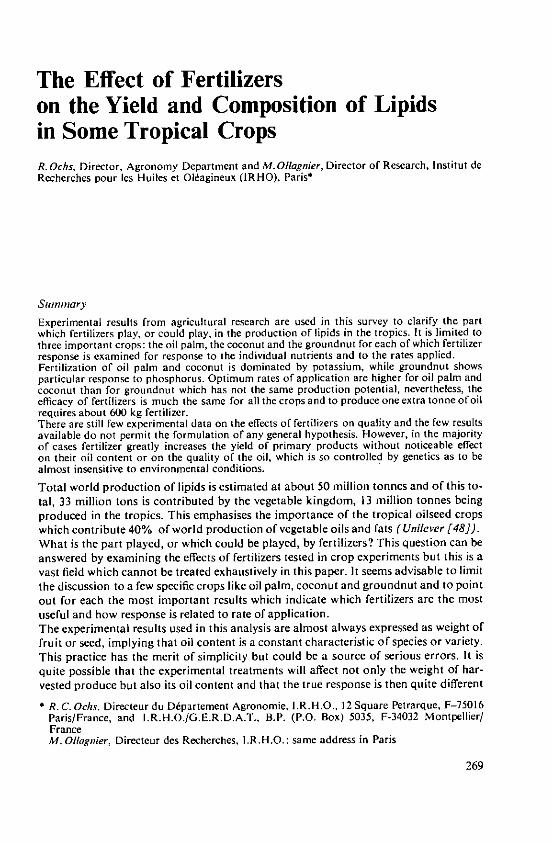
The Effect of Fertilizerson the Yield and Composition of Lipidsin Some Tropical CropsR. Ochs, Director, Agronomy Department and M.Ollagnier, Director of Research, [nstitut deRecherches pour les Huiles et Oldagineux (IRHO), Paris*
Summary
Experimental results from agricultural research are used in this survey to clarify the partwhich fertilizers play, or could play, in the production of lipids in the tropics. It is limited tothree important crops: the oil palm, the coconut and the groundnut for each of which fertilizerresponse is examined for response to the individual nutrients and to the rates applied.Fertilization of oil palm and coconut is dominated by potassium, while groundnut showsparticular response to phosphorus. Optimum rates of application are higher for oil palm andcoconut than for groundnut which has not the same production potential, nevertheless, theefficacy of fertilizers is much the same for all the crops and to produce one extra tonne of oilrequires about 600 kg fertilizer.There are still few experimental data on the effects of fertilizers on quality and the few resultsavailable do not permit the formulation of any general hypothesis. However, in the majorityof cases fertilizer greatly increases the yield of primary products without noticeable effecton their oil content or on the quality of the oil, which is so controlled by genetics as to bealmost insensitive to environmental conditions.
Total world production of lipids is estimated at about 50 million tonnes and of this to-tal, 33 million tons is contributed by the vegetable kingdom, 13 million tonnes beingproduced in the tropics. This emphasises the importance of the tropical oilseed cropswhich contribute 40% of world production of vegetable oils and fats (Unilever [48]).What is the part played, or which could be played, by fertilizers? This question can beanswered by examining the effects of fertilizers tested in crop experiments but this is avast field which cannot be treated exhaustively in this paper. It seems advisable to limitthe discussion to a few specific crops like oil palm, coconut and groundnut and to pointout for each the most important results which indicate which fertilizers are the mostuseful and how response is related to rate of application.The experimental results used in this analysis are almost always expressed as weight offruit or seed, implying that oil content is a constant characteristic of species or variety.This practice has the merit of simplicity but could be a source of serious errors. It isquite possible that the experimental treatments will affect not only the weight of har-vested produce but also its oil content and that the true response is then quite different
* R. C. Ochs, Directeur du Dpartement Agronomie, I.R.H.O., 12 Square Petrarque, F-75016Paris/France, and I.R.H.O./G.E.R.D.A.T., B.P. (P.O. Box) 5035, F-34032 Montpellier/FranceM. Ollagnier, Directeur des Recherches, IR.H.O.: same address in Paris
269
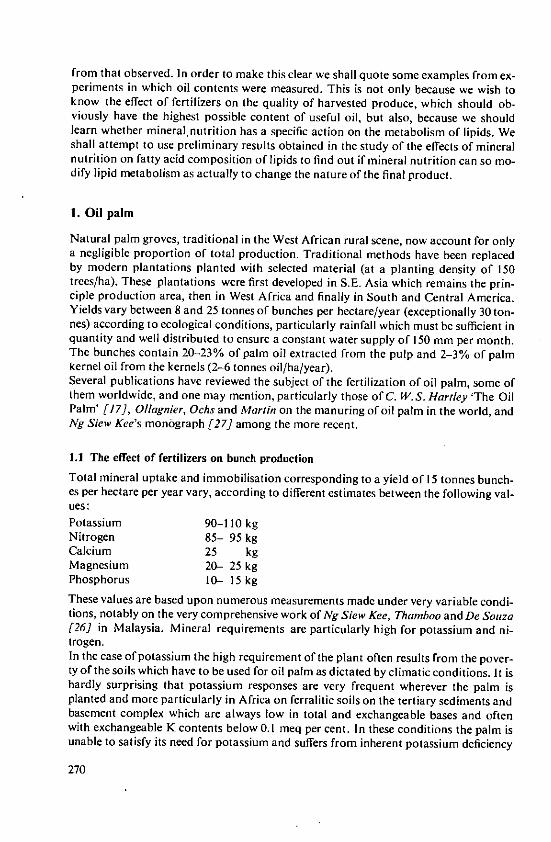
from that observed. In order to make this clear we shall quote some examples from ex-periments in which oil contents were measured. This is not only because we wish toknow the effect of fertilizers on the quality of harvested produce, which should ob-viously have the highest possible content of useful oil, but also, because we shouldlearn whether mineral nutrition has a specific action on the metabolism of lipids. Weshall attempt to use preliminary results obtained in the study of the effects of mineralnutrition on fatty acid composition of lipids to find out if mineral nutrition can so mo-dify lipid metabolism as actually to change the nature of the final product.
I. Oil palm
Natural palm groves, traditional in the West African rural scene, now account for onlya negligible proportion of total production. Traditional methods have been replacedby modern plantations planted with selected material (at a planting density of 150trees/ha). These plantations were first developed in S.E. Asia which remains the prin-ciple production area, then in West Africa and finally in South and Central America.Yields vary between 8 and 25 tonnesof bunches per hectare/year (exceptionally 30 ton-nes) according to ecological conditions, particularly rainfall which must be sufficient inquantity and well distributed to ensure a constant water supply of 150 mm per month.The bunches contain 20-23% of palm oil extracted from the pulp and 2-3% of palmkernel oil from the kernels (2-6 tonnes oil/ha/year).Several publications have reviewed the subject of the fertilization of oil palm, some ofthem worldwide, and one may mention, particularly those of C. W. S. Hartley 'The OilPalm' [17], Ollagnier, Ochs and Marin on the manuring of oil palm in the world, andNg Siew Kee's monograph [27] among the more recent.
1.1 The effect of fertilizers on bunch productionTotal mineral uptake and immobilisation corresponding to a yield of 15 tonnes bunch-es per hectare per year vary, according to different estimates between the following val-ues:Potassium 90-110 kgNitrogen 85- 95 kgCalcium 25 kgMagnesium 20- 25 kgPhosphorus 10- 15 kgThese values are based upon numerous measurements made under very variable condi-tions, notably on the very comprehensive work of Ng Siew Kee, Thamboo and De Sotiza[26] in Malaysia. Mineral requirements are particularly high for potassium and ni-trogen.In the case of potassium the high requirement of the plant often results from the pover-ty of the soils which have to be used for oil palm as dictated by climatic conditions. It ishardly surprising that potassium responses are very frequent wherever the palm isplanted and more particularly in Africa on ferralitic soils on the tertiary sediments andbasement complex which are always low in total and exchangeable bases and oftenwith exchangeable K contents below 0.1 meq per cent. In these conditions the palm isunable to satisfy its need for potassium and suffers from inherent potassium deficiency
270
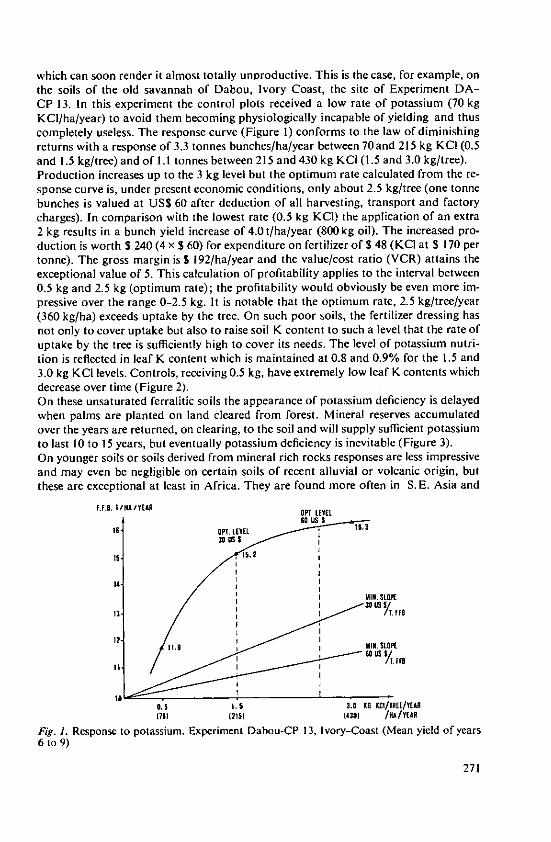
which can soon render it almost totally unoroductive. This is the case, for example, onthe soils of the old savannah of Dabou, Ivory Coast, the site of Experiment DA-CP 13. In this experiment the control plots received a low rate of potassium (70 kgKCI/ha/year) to avoid them becoming physiologically incapable of yielding and thuscompletely useless. The response curve (Figure 1) conforms to the law of diminishingreturns with a response of 3.3 tonnes bunches/ha/year between 70 and 215 kg KCI (0.5and 1.5 kg/tree) and of 1.1 tonnes between 215 and 430 kg KCI (1.5 and 3.0 kg/tree).Production increases up to the 3 kg level but the optimum rate calculated from the re-sponse curve is, under present economic conditions, only about 2.5 kg/tree (one tonnebunches is valued at USS 60 after deduction of all harvesting, transport and factorycharges). In comparison with the lowest rate (0.5 kg KCI) the application of an extra2 kg results in a bunch yield increase of 4.0 t/ha/year (800 kg oil). The increased pro-duction is worth S 240 (4 x S 60) for expenditure on fertilizer of S 48 (KCI at $ 170 pertonne). The gross margin is S 192/ha/year and the value/cost ratio (VCR) attains theexceptional value of 5. This calculation of profitability applies to the interval between0.5 kg and 2.5 kg (optimum rate); the profitability would obviously be even more im-pressive over the range 0-2.5 kg. It is notable that the optimum rate, 2.5 kg/tree/year(360 kg/ha) exceeds uptake by the tree. On such poor soils, the fertilizer dressing hasnot only to cover uptake but also to raise soil K content to such a level that the rate ofuptake by the tree is sufficiently high to cover its needs. The level of potassium nutri-tion is reflected in leaf K content which is maintained at 0.8 and 0.9% for the 1.5 and3.0 kg KCI levels. Controls, receiving 0.5 kg, have extremely low leaf K contents whichdecrease over time (Figure 2).On these unsaturated ferralitic soils the appearance of potassium deficiency is delayedwhen palms are planted on land cleared from forest. Mineral reserves accumulatedover the years are returned, on clearing, to the soil and will supply sufficient potassiumto last 10 to 15 years, but eventually potassium deficiency is inevitable (Figure 3).On younger soils or soils derived from mineral rich rocks responses are less impressiveand may even be negligible on certain soils of recent alluvial or volcanic origin, butthese are exceptional at least in Africa. They are found more often in S. E. Asia and
F.F.B. ItA /TEAU.N.I/HiYEAROPT ttWEt6so us $
Is OPT, LEVUL 16.3
30ous SI.I
I s
13-' .,9
12-
n. IiMIN. StOPE, 60us$
0.5 6,5 3.0 KG £tI/TI /YEAR(70) (215) (438) /KA/YAR
Fig. 1. Response to potassium. Experiment Dabou-CP 13, Ivory-Coast (Mean yield of years6 to 9)
271
K' I7 FROND
PLANTING YEAR: 1964G. KCI/TREE/YEAR
CRITICAL RANGE
09 3.0. - -- -..- ....----------
9 .1 .50
0.7
0.6
.. 500.5 .
'.5 0.1 0
0969 70 71 72 73 74 75 76 YEARS
Fig. 2. Evolution of K levels in leaf no 17. Experiment Dabou-CP 13/Ivory-Coast
K% I7 FRONDRIANTING YEAR: 1965
1.0. -I.I
CRITICAL RIGE
0.7
0.N
1969 70 71 72 73 74 75 76 YEARS
Fig. 3. Evolution of K levels in leaf n0 17 after jungle clearing. Experiment La Md-CP 19/Ivory-Coast (control without fertilizer).
S.America. In Malaysia, for example, Forster and Goh []/] have recently reviewed re-suits obtained in 20 factorial experiments (34 N P K Mg), sited on different soil typeson the West coast, deriving response surfaces (multiple regression). They concludedthat potassium would enter the composition of the most profitable fertilizer combina-tion in 13 cases out of 20. The score was 10 out of 10 on inland soils which, like mostAfrican soils, belong to the class of unsaturated ferralitic soils (exchangeable K below
272
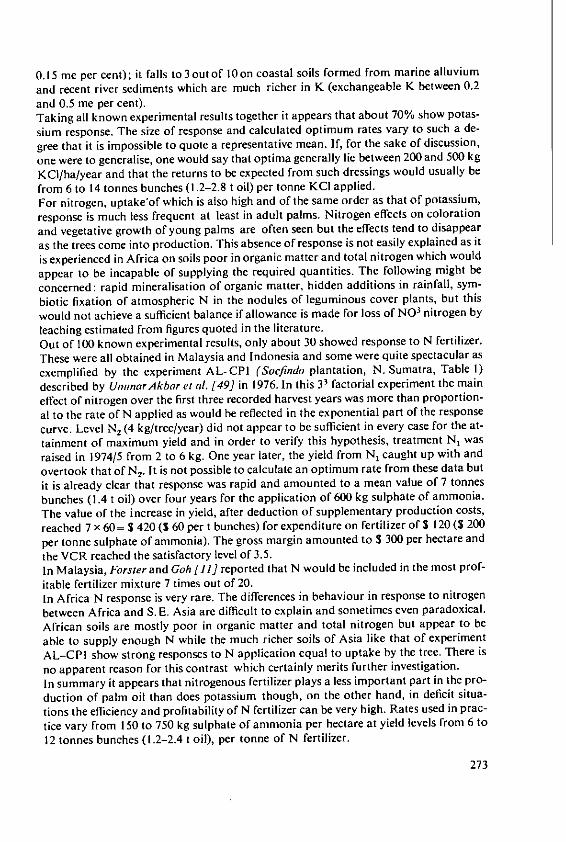
0.15 me per cent); it falls to 3 out of 10 on coastal soils formed from marine alluviumand recent river sediments which are much richer in K (exchangeable K between 0.2and 0.5 me per cent).Taking all known experimental results together it appears that about 70% show potas-
sium response. The size of response and calculated optimum rates vary to such a de-
gree that it is impossible to quote a representative mean. If, for the sake of discussion,
one were to generalise, one would say that optima generally lie between 200 and 500 kg
KCI/ha/year and that the returns to be expected from such dressings would usually be
from 6 to 14 tonnes bunches (1.2-2.8 t oil) per tonne KCI applied.For nitrogen, uptake'of which is also high and of the same order as that of potassium,
response is much less frequent at least in adult palms. Nitrogen effects on coloration
and vegetative growth of young palms are often seen but the effects tend to disappearas the trees come into production. This absence of response is not easily explained as it
is experienced in Africa on soils poor in organic matter and total nitrogen which would
appear to be incapable of supplying the required quantities. The following might be
concerned: rapid mineralisation of organic matter, hidden additions in rainfall, sym-
biotic fixation of atmospheric N in the nodules of leguminous cover plants, but this
would not achieve a sufficient balance if allowance is made for loss of NO3 nitrogen by
leaching estimated from figures quoted in the literature.Out of 100 known experimental results, only about 30 showed response to N fertilizer.
These were all obtained in Malaysia and Indonesia and some were quite spectacular as
exemplified by the experiment AL-CPI (Socfindo plantation, N. Sumatra, Table I)
described by UmnnarAkbar et at. [49] in 1976. In this 33 factorial experiment the main
effect of nitrogen over the first three recorded harvest years was more than proportion-
al to the rate of N applied as would be reflected in the exponential part of the response
curve. Level N, (4 kg/tree/year) did not appear to be sufficient in every case for the at-
tainment of maximum yield and in order to verify this hypothesis, treatment N1 was
raised in 1974/5 from 2 to 6 kg. One year later, the yield from N, caught up with and
overtook that of N2. It is not possible to calculate an optimum rate from these data but
it is already clear that response was rapid and amounted to a mean value of 7 tonnes
bunches (1.4 t oil) over four years for the application of 600 kg sulphate of ammonia.
The value of the increase in yield, after deduction of supplementary production costs,
reached 7 x 60= S 420 (3 60 per t bunches) for expenditure on fertilizer of S 120 ($ 200
per tonne sulphate of ammonia). The gross margin amounted to 3 300 per hectare and
the VCR reached the satisfactory level of 3.5.In Malaysia, Forster and Goh [1l] reported that N would be included in the most prof-
itable fertilizer mixture 7 times out of 20.In Africa N response is very rare. The differences in behaviour in response to nitrogen
between Africa and S. E. Asia are difficult to explain and sometimes even paradoxical.
African soils are mostly poor in organic matter and total nitrogen but appear to be
able to supply enough N while the much richer soils of Asia like that of experiment
AL-CPI show strong responses to N application equal to uptake by the tree. There is
no apparent reason for this contrast which certainly merits further investigation.
In summary it appears that nitrogenous fertilizer plays a less important part in the pro-
duction of palm oil than does potassium though, on the other hand, in deficit situa-
tions the efficiency and profitability of N fertilizer can be very high. Rates used in prac-
tice vary from 150 to 750 kg sulphate of ammonia per hectare at yield levels from 6 to
12 tonnes bunches (1.2-2.4 t oil), per tonne of N fertilizer.
273
Table 1. Experiment AL I (set up in 1971 on 1959 planting) Principal effects of ammonium sulphate on yield
Treatments Yields tonnes of bunches/ha/year FFB/ha1972/73 1973/74 1974/75 1975/76 Mean
N0 (control) 14,6 (100) 12,4 (100) 14,0 (100) 15,7 (100) 14,2(100)(1) N, (2 kg/tree/year) (300 kg/ha) 17,7 (121) 15,8- (127) 14,6 (104) (26,6)** (169)N, (4 kg/tree/year) (600 kg/ha) 19,6* (134) 20.4** (165) 18,9" (135) 25,7 ** (164) 21,2 (149)
(I) From the 1974-75 manuring campaign onward, this treatment was changed to 6 kg/tree/year.
Responses to phosphorus are also less frequent than those to potassium. About 30 percent of known experiments exhibited positive response to phosphorus but, in contrastto nitrogen, responses were clearly related to soil P status. Most of the positive results
again come from Malaysia and Indonesia. In experiment AL-CPI, already cited, the
main response to phosphorus was of the same order as that to nitrogen at 5.8 tonnes
bunches for application of 3 kg triple superphosphate (45% P20 5) per tree per year(450 kg/ha). In Malaysia, Forster and Goh would include P in their most profitable
fertilizer in 13 cases out of 20. On tertiary sands of the Belem region of Brazil, IRHO
obtained very strong responses to phosphorus (Martin and Prioux [20].Rates generally used to obtain optimum production vary from 150 to 450 kg triple
super-phosphate per hectare per year with yields varying widely between 6 and 18 t
bunches (1.2-1.9 t oil) per tonne of 45% P2O5 fertilizer.It will be noted that the rates used have a phosphorus equivalent (30-90 kg) wellabove the plant's needs, which are about 15 kg/ha/year.Response to magnesium is very rare and is found generally on very unsaturated ferrali-
tic soils developed on sandy sediments. It is often caused by the application of potas-
sium. Application rates used are low, 75 to 150 kg/ha/year of kieserite (27% MgO) inaccordance with the rather low uptake by the palm.To complete the story we should mention responses to sulphur which have been record-
ed in special circumstances and to chlorine as these influence the choice of form of po-
tash fertilizer - Ollagnier and Ochs [34, 35], Ollagnier [37]. In chlorine deficient situa-
tions as in the Magdalena valley in Colombia the response can reach 3.4 tonnes bunch-
es per hectare per year (700 kg oil) for an annual application of 75 kg chlorine per hec-tare.In conclusion it is clear that fertilizers play an important part in the production of palm
oil. Potash fertilizers are by far the most important (approx. 70% of cases) followed by
nitrogen and phosphate (30% of cases) and lastly magnesium, judging by the frequen-cy of response in experiments. One should not pay too much attention to these fre-
quencies which are not based on a rational survey.It may be noted that the rates of nutrient applied are very often higher than removalsin harvested produce. Many people see in this a simple consequence of poor utilisation
coefficients which it should be possible to improve. This may be true, but only in part.
Generally speaking soils used for oil palm are very low in assimilable minerals and fer-
tilizerisneeded to raise the concentration in the soil solution to a level sufficient for ab-
sorption by the plant and the rates which are needed to achieve this end are in certain
cases higher than would merely replace removals in crop. Residues which would accu-
mulate in temperate soils are partly lost in heavily leached ferralitic soils the exchange
complex of which tends to revert rapidly to its initial low equilibrium level. For phos-
phorus the scenario is a little different as, on the contrary, this element is more or lessirreversibly fixed in the form of insoluble compounds, but the end result is much the
same in the medium term. It appears that in the fertilization of oil palm one has to be
content with some inevitable mineral losses, but this is easy to accept because the effi-
ciency of fertilizers expressed as oil yield per unit fertilizer applied remains very high.
The excellent potential of the crop depends very much on this efficiency.
1.2 The effect of fertilizers on the oil content of bunches
Determination of the oil content of bunches originating from one experimental plot ofabout 20 trees which only provides a few bunches per harvesting round involves
275
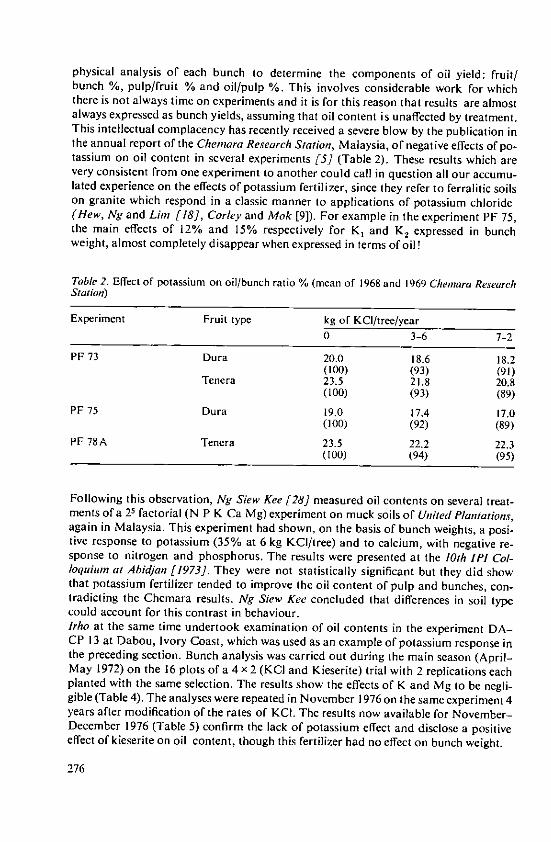
physical analysis of each bunch to determine the components of oil yield: fruit/bunch %, pulp/fruit % and oil/pulp %. This involves considerable work for whichthere is not always time on experiments and it is for this reason that results are almostalways expressed as bunch yields, assuming that oil content is unaffected by treatment.This intellectual complacency has recently received a severe blow by the publication inthe annual report of the Chemnara Research Station, Malaysia, of negative effects of po-tassium on oil content in several experiments [5] (Table 2). These results which arevery consistent from one experiment to another could call in question all our accumu-lated experience on the effects of potassium fertilizer, since they refer to ferralitic soilson granite which respond in a classic manner to applications of potassium chloride(Hew, Ng and Lin [18], Corley and Mok [9]). For example in the experiment PF 75,the main effects of 12% and 15% respectively for K1 and K, expressed in bunchweight, almost completely disappear when expressed in terms of oil!
Table 2. Effect of potassium on oil/bunch ratio % (mean of 1968 and 1969 Chemnara ResearchStation)
Experiment Fruit type kg of KCI/tree/year0 3-6 7-2
PF 73 Dura 20.0 18.6 18.2(100) (93) (91)
Tenera 23.5 21.8 20.8(100) (93) (89)
PF 75 Dura 19.0 17.4 17.0(100) (92) (89)
PF 78A Tenera 235 22.2 22.3(100) (94) (95)
Following this observation, Ng Slew Kee [28] measured oil contents on several treat-ments of a 25 factorial (N P K Ca Mg) experiment on muck soils of United Plantations,again in Malaysia. This experiment had shown, on the basis of bunch weights, a posi-tive response to potassium (35% at 6 kg KCI/tree) and to calcium, with negative re-sponse to nitrogen and phosphorus. The results were presented at the 10th IPI Col-loquium at Abidjan [1973]. They were not statistically significant but they did showthat potassium fertilizer tended to improve the oil content of pulp and bunches, con-tradicting the Chemara results. Ng Siew Kee concluded that differences in soil typecould account for this contrast in behaviour.lrho at the same time undertook examination of oil contents in the experiment DA-CP 13 at Dabou, Ivory Coast, which was used as an example of potassium response inthe preceding section. Bunch analysis was carried out during the main season (April-May 1972) on the 16 plots of a 4 x 2 (KCI and Kieserite) trial with 2 replications eachplanted with the same selection. The results show the effects of K and Mg to be negli-gible (Table 4). The analyses were repeated in November 1976 on the same experiment 4years after modification of the rates of KCI. The results now available for November-December 1976 (Table 5) confirm the lack of potassium effect and disclose a positiveeffect of kieserite on oil content, though this fertilizer had no effect on bunch weight.
276
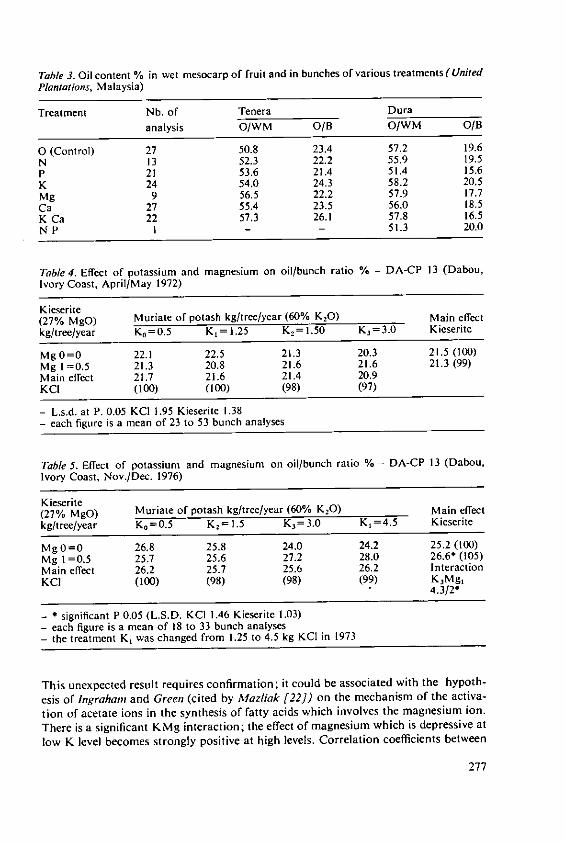
Table 3. Oil content % in wet mesocarp of fruit and in bunches of various treatments((UnitedPlantations, Malaysia)
Treatment Nb. of Tenera Dura
analysis O/WM O/B O/WM O/B
0 (Control) 27 50.8 23.4 57.2 19.6N 13 52.3 22.2 55.9 19.5P 21 53.6 21.4 51.4 15.6K 24 54.0 24.3 58.2 20.5Mg 9 56.5 22.2 57.9 17.7Ca 27 55.4 23.5 56.0 18.5K Ca 22 57.3 26.1 57.8 16.5N P I - - 51.3 20.0
Table 4. Effect of potassium and magnesium on oil/bunch ratio % - DA-CP 13 (Dabou,Ivory Coast, April/May 1972)
Kieserite(27% MgO) Muriate of potash kg/tree/year (60% KO) Main effectkg/tree/year K0 =0.5 K1 = 1.25 K, = 1.50 K3=3.0 Kieserite
Mg 0=0 22.1 22.5 21.3 20.3 21.5 (100)Mg 1 =0.5 21.3 20.8 21.6 21.6 21.3 (99)Main effect 21.7 21.6 21.4 20.9KCI (100) (100) (98) (97)
- L.s.d. at P. 0.05 KCI 1.95 Kieserite 1.38- each figure is a mean of 23 to 53 bunch analyses
Table 5. Effect of potassium and magnesium on oil/bunch ratio % - DA-CP 13 (Dabou,Ivory Coast, Nov./Dec. 1976)
Kieserite(27% MgO) Muriate of potash kg/tree/year (60% K 2O) Main effectkg/tree/year K 0 =0.5 K2 = 1.5 K, = 3.0 K, = 4.5 Kieserite
Mg 0=0 26.8 25.8 24.0 24.2 25.2(100)Mg 1 =0.5 25.7 25.6 27.2 28.0 26.6 (105)Main effect 26.2 25.7 25.6 26.2 InteractionKCI (100) (98) (98) (99) KMg,
4.3/2"
- significant P 0.05 (L.S.D. KCI 1.46 Kieserite 1.03)- each figure is a mean of 18 to 33 bunch analyses- the treatment K, was changed from 1.25 to 4.5 kg KCI in 1973
This unexpected result requires confirmation; it could be associated with the hypoth-
esis of Ingraham and Green (cited by Alazliak [22]) on the mechanism of the activa-
tion of acetate ions in the synthesis of fatty acids which involves the magnesium ion.There is a significant KMg interaction; the effect of magnesium which is depressive at
low K level becomes strongly positive at high levels. Correlation coefficients between
277
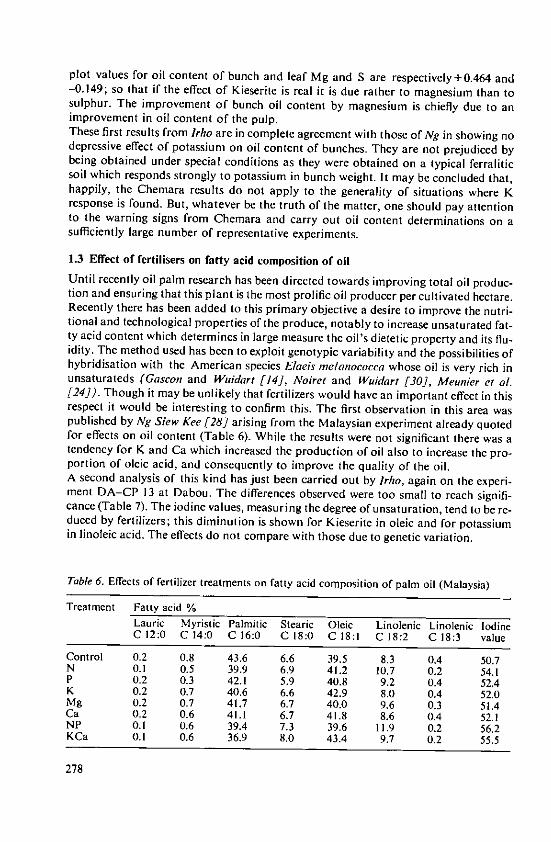
plot values for oil content of bunch and leaf Mg and S are respectively+0.464 and-0.149; so that if the effect of Kieserite is real it is due rather to magnesium than tosulphur. The improvement of bunch oil content by magnesium is chiefly due to animprovement in oil content of the pulp.These first results from Jrho are in complete agreement with those of Ng in showing nodepressive effect of potassium on oil content of bunches. They are not prejudiced bybeing obtained under special conditions as they were obtained on a typical ferraliticsoil which responds strongly to potassium in bunch weight. It may be concluded that,happily, the Chemara results do not apply to the generality of situations where Kresponse is found. But, whatever be the truth of the matter, one should pay attentionto the warning signs from Chemara and carry out oil content determinations on asufficiently large number of representative experiments.
1.3 Effect of fertilisers on fatty acid composition of oilUntil recently oil palm research has been directed towards improving total oil produc-tion and ensuring that this plant is the most prolific oil producer per cultivated hectare.Recently there has been added to this primary objective a desire to improve the nutri-tional and technological properties of the produce, notably to increase unsaturated fat-ty acid content which determines in large measure the oil's dietetic property and its flu-idity. The method used has been to exploit genotypic variability and the possibilities ofhybridisation with the American species Elaeis nelanococca whose oil is very rich inunsaturateds (Gascon and Wuidart [14], Noiret and Wuidart [30], Meunier el al.[24]). Though it may be unlikely that fertilizers would have an important effect in thisrespect it would be interesting to confirm this. The first observation in this area waspublished by Ng Siew Kee [28] arising from the Malaysian experiment already quotedfor effects on oil content (Table 6). While the results were not significant there was atendency for K and Ca which increased the production of oil also to increase the pro-portion of oleic acid, and consequently to improve the quality of the oil.A second analysis of this kind has just been carried out by Irho, again on the experi-ment DA-CP 13 at Dabou. The differences observed were too small to reach signifi-cance (Table 7). The iodine values, measuring the degree of unsaturation, tend to be re-duced by fertilizers; this diminution is shown for Kieserite in oleic and for potassiumin linoleic acid. The effects do not compare with those due to genetic variation.
Table 6. Effects of fertilizer treatments on fatty acid composition of palm oil (Malaysia)
Treatment Fatty acid %Laurie Myristic Palmitic Stearic Oleic Linolenic Linolenic IodineC 12:0 C 14:0 C 16:0 C 18:0 C 18:1 C 18:2 C 18:3 value
Control 0.2 0.8 43.6 6.6 39.5 8.3 0.4 50.7N 0.1 0.5 39.9 6.9 41.2 10.7 0.2 54.1P 0.2 0.3 42.1 5.9 40.8 9.2 0.4 52.4K 0.2 0.7 40.6 6.6 42.9 8.0 0.4 52.0Mg 0.2 0.7 41.7 6.7 40.0 9.6 0.3 51.4Ca 0.2 0.6 41.1 6.7 41.8 8.6 0.4 52.1NP 0.1 0.6 39.4 7.3 39.6 11.9 0.2 56.2KCa 0.1 0.6 36.9 8.0 43.4 9.7 0.2 55.5
278

Table 7. Effect of fertilizer treatments on fatty acid composition of palm oil - DA-CP 13(Dabou, Ivory Coast, Nov./Dec. 1976)
Kieserite(27 % MgO) KCI (60% K.0) kg/tree/year Main effectkg/tree/year 0.75 1.5 3.0 4.5 Kieserite
Iodine value0 57.6 57.3 56.8 56.3 57.0 (100)0.5 56.4 56.6 55.9 55.8 56.2 (99)KCI effect 57.0 56.9 56.3 56.0
(100) (100) (99) (98)
Pa/tufic0 37.4 38.1 38.6 38.6 38.1 (100)(C 16:0) 0.5 39.7 38.5 39.5 39.6 39.3 (103)KCI effect 38.6 38.3 39.0 39.1
(100) (99) (101) (101)Oleic0 42.5 41.7 41.9 41.7 41.9(100)(C 18:1) 0.5 40.2 41.3 41.1 41.6 41.0 (98)KCI effect 41.3 41.5 41.5 41.6
(100) (100) (100) (101)
Linoleic0 11.9 12.1 11.7 11.6 11.8(100)(C 18:2) 0.5 12.4 11.9 11.7 11.3 11.8(100)KCI effect 12.2 12.0 11.7 11.4
(100) (99) (96) (94)
2. Coconut
Forty years ago the coconut was still the most important source of plant lipids but its
relative importance has diminished for lack of improvement by breeding and because
cultural methods have with rare exceptions remained extensive. Traditionally coconutsare planted at densities between 100 and 250 trees/ha (average 150) and produce some
5000 nuts/ha giving 1000 kg copra (dry kernels) containing 700 kg oil. This tree should
not be condemned to a minor role as there has recently been spectacular progress in
selection. The hybrid of West African Tall and Malaysian yellow dwarf now released
by IRHO (Hybrid Port Bouet 121) yields more than 6 tonnes copra per hectare per
annum (4 tonnes oil) (de Nucd, de Lamothe and Rognon [31]).There are in the world more than three million hectares under coconut; the main pro-
ducers are the Philippines which dominate with 2 million hectares, India, Indonesia, Sri
Lanka, Malaysia, the S. Pacific Islands, the Caribbean, Africa (particularly Mozam-
bique and Tanzania) and S. America (essentially Mexico). The crop is thus found in
the whole area of the tropics, predominantly in S. E. Asia. Climatic requirements are
similar to those of the oil palm but because the plant is robust and easily cultivated ex-
tensively it has extended into zones which have marginal rainfall.
2.1 Effect of fertilizers on production of copra
Fewer fertilizer experiments have been done than is the case with oil palm. Summaries
can be found in various monographs like those of Child [6] and Frbmond etal. [12]
279
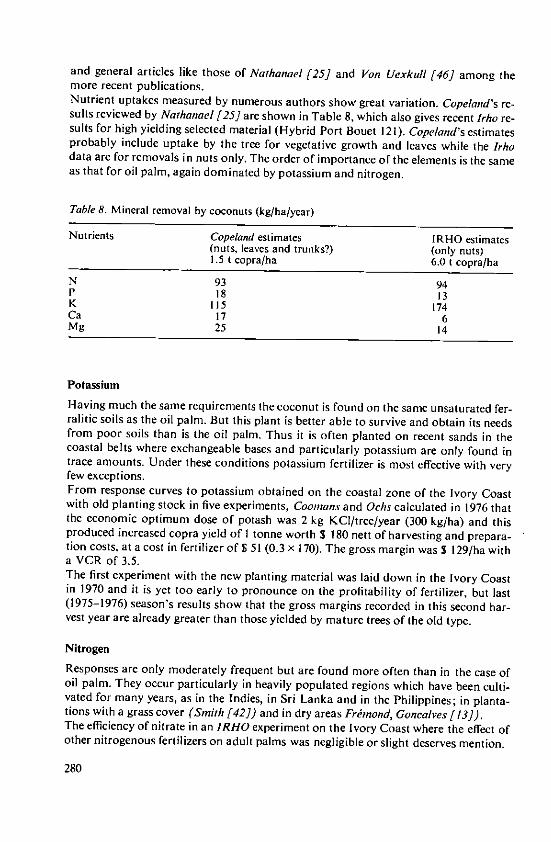
and general articles like those of Nathanael [25] and Von Uexkull [46] among themore recent publications.Nutrient uptakes measured by numerous authors show great variation. Copeland's re-sults reviewed by Nathanael [25] are shown in Table 8, which also gives recent lrho re-sults for high yielding selected material (Hybrid Port Bouet 121). Copeland's estimatesprobably include uptake by the tree for vegetative growth and leaves while the lrhodata are for removals in nuts only. The order of importance of the elements is the sameas that for oil palm, again dominated by potassium and nitrogen.
Table 8. Mineral removal by coconuts (kg/ha/year)
Nutrients Copeland estimates IRHO estimates(nuts, leaves and trunks?) (only nuts)1.5 t copra/ha 6.0 t copra/ha
N 93 94P 18 13K 115 174Ca 17 6Mg 25 14
Potassium
Having much the same requirements the coconut is found on the same unsaturated fer-ralitic soils as the oil palm. But this plant is better able to survive and obtain its needsfrom poor soils than is the oil palm. Thus it is often planted on recent sands in thecoastal belts where exchangeable bases and particularly potassium are only found intrace amounts. Under these conditions potassium fertilizer is most effective with veryfew exceptions.From response curves to potassium obtained on the coastal zone of the Ivory Coastwith old planting stock in five experiments, Coomans and Ochs calculated in 1976 thatthe economic optimum dose of potash was 2 kg KCI/tree/year (300 kg/ha) and thisproduced increased copra yield of I tonne worth S 180 nett of harvesting and prepara-tion costs, at a cost in fertilizer of S 51 (0.3 x 170). The gross margin was S 129/ha witha VCR of 3.5.The first experiment with the new planting material was laid down in the Ivory Coastin 1970 and it is yet too early to pronounce on the profitability of fertilizer, but last(1975-1976) season's results show that the gross margins recorded in this second har-vest year are already greater than those yielded by mature trees of the old type.
Nitrogen
Responses are only moderately frequent but are found more often than in the case ofoil palm. They occur particularly in heavily populated regions which have been culti-vated for many years, as in the Indies, in Sri Lanka and in the Philippines; in planta-tions with a grass cover (Smith [42]) and in dry areas Frnond, Goncalves [13]).The efficiency of nitrate in an IRHO experiment on the Ivory Coast where the effect ofother nitrogenous fertilizers on adult palms was negligible or slight deserves mention.
280
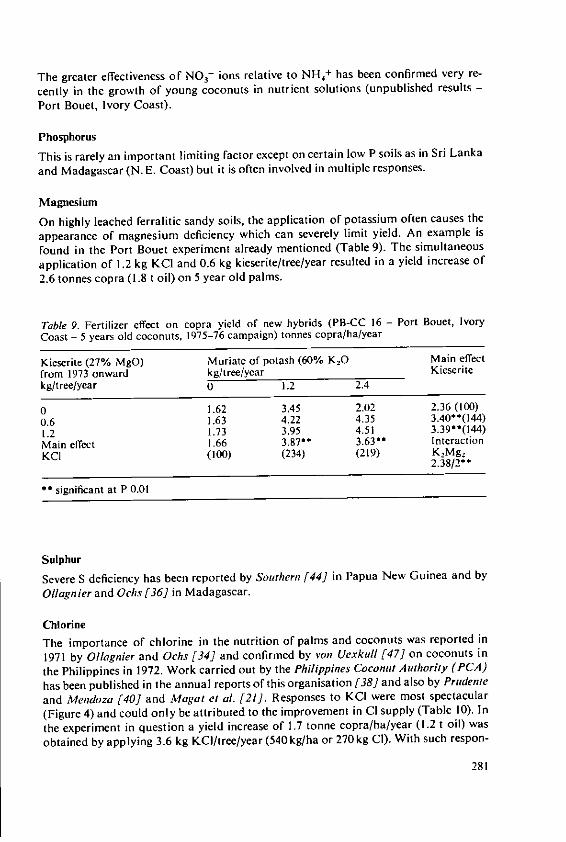
The greater effectiveness of NO, - ions relative to NH 4+ has been confirmed very re-
cently in the growth of young coconuts in nutrient solutions (unpublished results -
Port Bouct, Ivory Coast).
Phosphorus
This is rarely an important limiting factor except on certain low P soils as in Sri Lanka
and Madagascar (N. E. Coast) but it is often involved in multiple responses.
Magnesium
On highly leached ferralitic sandy soils, the application of potassium often causes the
appearance of magnesium deficiency which can severely limit yield. An example is
found in the Port Bouet experiment already mentioned (Table 9). The simultaneous
application of 1.2 kg KCI and 0.6 kg kieserite/tree/year resulted in a yield increase of
2.6 tonnes copra (1.8 t oil) on 5 year old palms.
Table 9. Fertilizer effect on copra yield of new hybrids (PB-CC 16 - Port Bouet, Ivory
Coast - 5 years old coconuts, 1975-76 campaign) tonnes copra/ha/year
Kieserite (27% MgO) Muriate of potash (60% K2 0 Main effect
from 1973 onward kg/tree/year Kieserite
kg/tree/year 0 1.2 2.4
0 1.62 3.45 2.02 2.36 (100)
0.6 1.63 4.22 4.35 3.40"(144)
1.2 1.73 3.95 4.51 3.39"*(144)Main effect 1.66 3.87** 3.63** Interaction
KCI (100) (234) (219) KMg,2.38/2"*
* significant at P 0.01
Sulphur
Severe S deficiency has been reported by Southern f44] in Papua New Guinea and by
OIlagnier and Ochs [36] in Madagascar.
Chlorine
The importance of chlorine in the nutrition of palms and coconuts was reported in
1971 by Ollagnier and Ochs [34] and confirmed by von Uexkull [47] on coconuts in
the Philippines in 1972. Work carried out by the Philippines Coconut Authority (PCA)
has been published in the annual reports of this organisation [38] and also by Prudente
and Mendoza [40] and Magat et al. [21]. Responses to KCI were most spectacular
(Figure 4) and could only be attributed to the improvement in Cl supply (Table 10). In
the experiment in question a yield increase of 1.7 tonne copra/ha/year (1.2 t oil) was
obtained by applying 3.6 kg KC!/tree/year (540 kg/ha or 270 kg CI). With such respon-
281
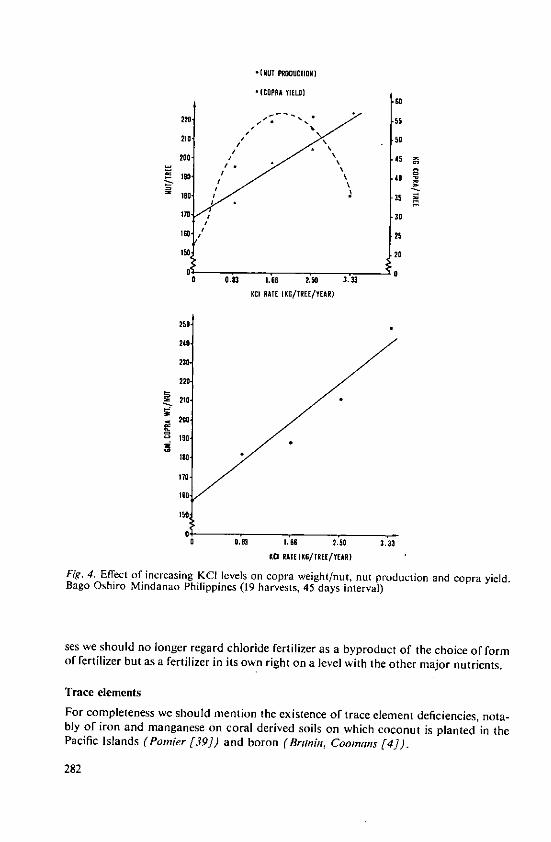
-(NUT PRODUCTION)
-(COPRA YIELD)
220 "55
200 20
0 An70 3
150 20
a 0.93 1.6$ 2.50 3.33
KC RATE [Ko/TREE/YEAR)
250
240
23
220
210
-200
ISO
370-
160;
20.
I0(
0 0.,3 1.66 2.50 3.33An1 RATE (KG/TREE/YEAR)
Fig. 4. Effect of increasing KCI levels on copra weight/nut, nut production and copra yield.Bago Oshiro Mindanao Philippines (19 harvests, 45 days interval)
ses we should no longer regard chloride fertilizer as a byproduct of the choice of formof fertilizer but as a fertilizer in its own right on a level with the other major nutrients.
Trace elementsFor completeness we should mention the existence of trace element deficiencies, nota-bly of iron and manganese on coral derived soils on which coconut is planted in thePacific Islands (Poiner [39]) and boron (Brnin, Coomans [4]).
282
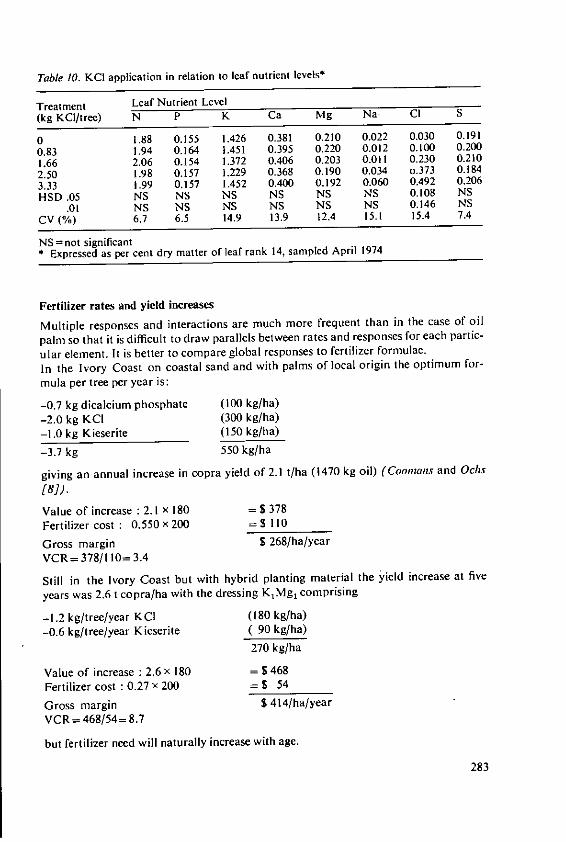
Table 10. KCI application in relation to leaf nutrient levels*
Treatment Leaf Nutrient Level(kg KCI/tree) N P K Ca Mg Na. CI S
0 1.88 0.155 1.426 0.381 0.210 0.022 0.030 0.1910.83 1.94 0.164 1.451 0.395 0.220 0.012 0.100 0.2001.66 2.06 0.154 1.372 0.406 0.203 0.011 0.230 0.2102.50 1.98 0.157 1.229 0.368 0.190 0.034 o.373 0.1843.33 1.99 0.157 1.452 0.400 0.192 0.060 0.492 0.206HSD .05 NS NS NS NS NS NS 0.108 NS
.01 NS NS NS NS NS NS 0.146 NSCV (%) 6.7 6.5 14.9 13.9 12.4 15.1 15.4 7.4
NS = not significant* Expressed as per cent dry matter of leaf rank 14, sampled April 1974
Fertilizer rates and yield increases
Multiple responses and interactions are much more frequent than in the case of oil
palm so that it is difficult to draw parallels between rates and responses for each partic-
ular element. It is better to compare global responses to fertilizer formulae.
In the Ivory Coast on coastal sand and with palms of local origin the optimum for-
mula per tree per year is:
-0.7 kg dicalcium phosphate (100 kg/ha)-2.0 kg KCI (300 kg/ha)-1.0 kg Kieserite (150 kg/ha)
-3.7 kg 550 kg/ha
giving an annual increase in copra yield of 2.1 t/ha (1470 kg oil) (Coomnans and Ochs
[8)).
Value of increase : 2.1 x 180 = 1378Fertilizer cost : 0.550 x 200 =S 110
Gross margin $ 268/ha/yearVCR= 378/1 10= 3.4
Still in the Ivory Coast but with hybrid planting material the yield increase at five
years was 2.6 t copra/ha with the dressing K1Mgl comprising
-1.2 kg/tree/year KCI (180 kg/ha)-0.6 kg/tree/year Kieserite ( 90 kg/ha)
270 kg/ha
Value of increase : 2.6 x 180 = $ 468Fertilizer cost : 0.27 x 200 = S 54
Gross margin $ 414/ha/yearVCR= 468/54= 8.7
but fertilizer need will naturally increase with age.
283
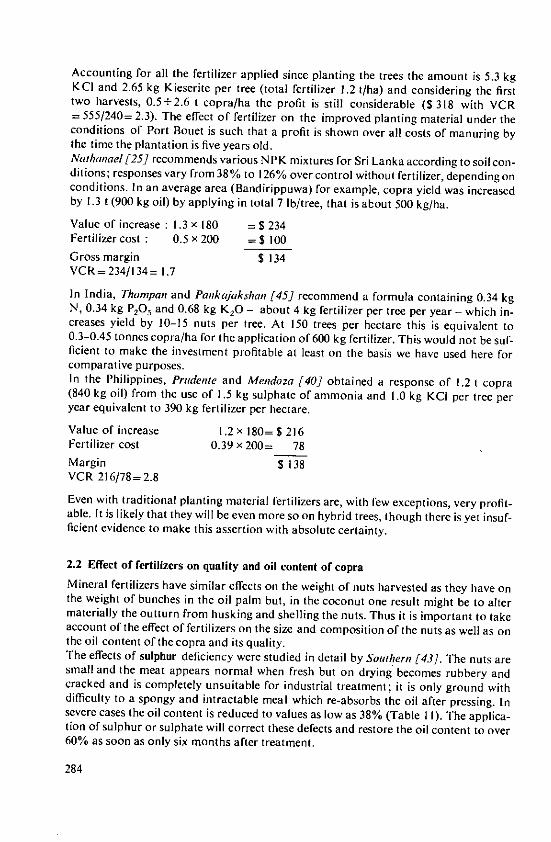
Accounting for all the fertilizer applied since planting the trees the amount is 5.3 kgKCI and 2.65 kg Kieserite per tree (total fertilizer 1.2 t/ha) and considering the firsttwo harvests, 0.5 +2.6 t copra/ha the profit is still considerable (S 318 with VCR= 555/240= 2.3). The effect of fertilizer on the improved planting material under theconditions of Port Bouet is such that a profit is shown over all costs of manuring bythe time the plantation is five years old.Nathanael [25] recommends various NPK mixtures for Sri Lanka according to soil con-ditions; responses vary from38% to 126% over control without fertilizer, depending onconditions. In an average area (Bandirippuwa) for example, copra yield was increasedby 1.3 t (900 kg oil) by applying in total 7 lb/tree, that is about 500 kg/ha.
Value of increase : 1.3 x 180 = S 234Fertilizer cost : 0.5 x 200 = $ 100
Gross margin S 134VCR= 234/134= 1.7
In India, Thampan and Pankajakshan [45] recommend a formula containing 0.34 kgN, 0.34 kg P20 5 and 0.68 kg K20 - about 4 kg fertilizer per tree per year - which in-creases yield by 10-15 nuts per tree. At 150 trees per hectare this is equivalent to0.3-0.45 tonnes copra/ha for the application of 600 kg fertilizer. This would not be suf-ficient to make the investment profitable at least on the basis we have used here forcomparative purposes.In the Philippines, Prudente and Mendoza [40] obtained a response of 1.2 t copra(840 kg oil) from the use of 1.5 kg sulphate of ammonia and 1.0 kg KCI per tree peryear equivalent to 390 kg fertilizer per hectare.
Value of increase 1.2 x 180= S 216Fertilizer cost 0.39 x 200= 78Margin S 138VCR 216/78= 2.8
Even with traditional planting material fertilizers are, with few exceptions, very profit-able. It is likely that they will be even more so on hybrid trees, though there is yet insuf-ficient evidence to make this assertion with absolute certainty.
2.2 Effect of fertilizers on quality and oil content of copraMineral fertilizers have similar effects on the weight of nuts harvested as they have onthe weight of bunches in the oil palm but, in the coconut one result might be to altermaterially the outturn from husking and shelling the nuts. Thus it is important to takeaccount of the effect of fertilizers on the size and composition of the nuts as well as onthe oil content of the copra and its quality.The effects of sulphur deficiency were studied in detail by Southern /43]. The nuts aresmall and the meat appears normal when fresh but on drying becomes rubbery andcracked and is completely unsuitable for industrial treatment; it is only ground withdifficulty to a spongy and intractable meal which re-absorbs the oil after pressing. Insevere cases the oil content is reduced to values as low as 38% (Table 11). The applica-tion of sulphur or sulphate will correct these defects and restore the oil content to over60% as soon as only six months after treatment.
284
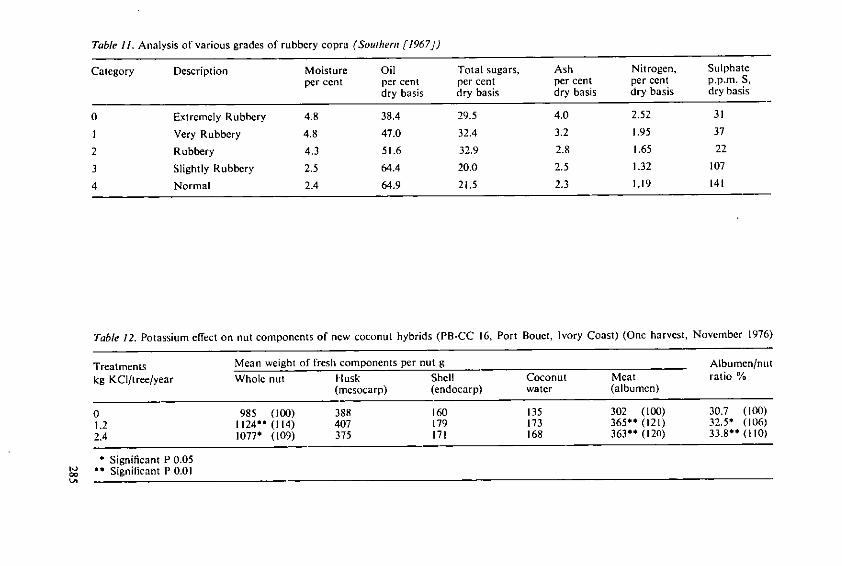
Table II. Analysis of various grades of rubbery copra (Southern [1967])
Category Description Moisture Oil Total sugars, Ash Nitrogen, Sulphateper cent per cent per cent per cent per cent p.p.m. S,
dry basis dry basis dry basis dry basis dry basis
0 Extremely Rubbery 4.8 38.4 29.5 4.0 2.52 31
1 Very Rubbery 4.8 47.0 32.4 3.2 1.95 37
2 Rubbery 4.3 51.6 32.9 2.8 1.65 22
3 Slightly Rubbery 2.5 64.4 20.0 2.5 1.32 107
4 Normal 2.4 64.9 21.5 2.3 1.19 141
Table 12. Potassium effect on nut components of new coconut hybrids (PB-CC 16, Port Bouct, Ivory Coast) (One harvest, November 1976)
Treatments Mean weight of fresh components per nut g Albumen/nutkg KCI/tree/year Whole nut Husk Shell Coconut Meat ratio %
(mesocarp) (endocarp) water (albumen)
0 985 (100) 388 160 135 302 (100) 30.7 (100)1.2 1124* (114) 407 179 173 365** (121) 32.5* (106)2.4 1077* (109) 375 171 168 363** (120) 33.8** (110)
Significant P 0.05** Significant P 0.01
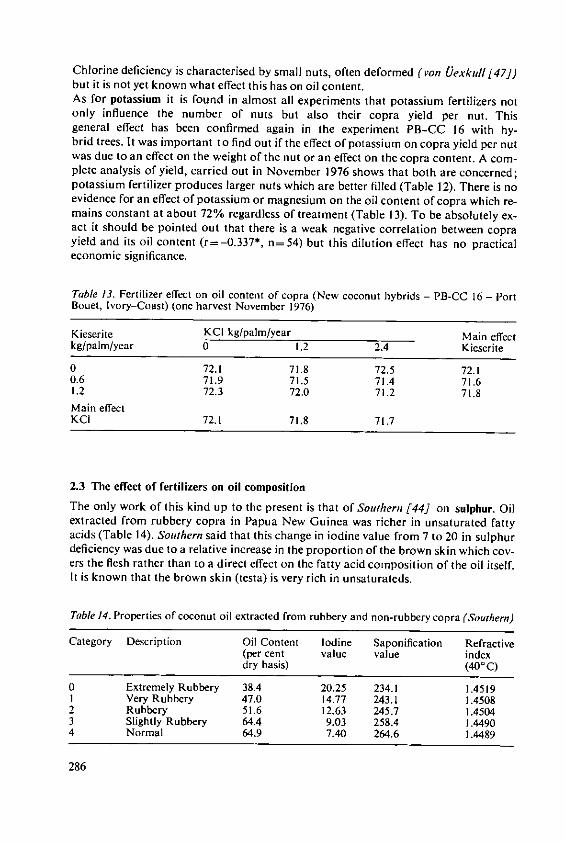
Chlorine deficiency is characterised by small nuts, often deformed (von UexkuI [47])but it is not yet known what effect this has on oil content.As for potassium it is found in almost all experiments that potassium fertilizers notonly influence the number of nuts but also their copra yield per nut. Thisgeneral effect has been confirmed again in the experiment PB-CC 16 with hy-brid trees. It was important to find out if the effect of potassium on copra yield per nutwas due to an effect on the weight of the nut or an effect on the copra content. A com-plete analysis of yield, carried out in November 1976 shows that both are concerned;potassium fertilizer produces larger nuts which are better filled (Table 12). There is noevidence for an effect of potassium or magnesium on the oil content of copra which re-mains constant at about 72% regardless of treatment (Table 13). To be absolutely ex-act it should be pointed out that there is a weak negative correlation between coprayield and its oil content (r=-0.337", n=54) but this dilution effect has no practicaleconomic significance.
Table 13. Fertilizer effect on oil content of copra (New coconut hybrids - PB-CC 16 - PortBouct, Ivory-Coast) (one harvest November 1976)
Kieserite KCI kg/palm/year Main effectkg/palm/year 0 1.2 2.4 Kieserite
0 72.1 71.8 72.5 72.10.6 71.9 71.5 71.4 71.61.2 72.3 72.0 71.2 71.8Main effectKCI 72.1 71.8 71.7
2.3 The effect of fertilizers on oil composition
The only work of this kind up to the present is that of Sothern [44] on sulphur. Oilextracted from rubbery copra in Papua New Guinea was richer in unsaturated fattyacids (Table 14). Southern said that this change in iodine value from 7 to 20 in sulphurdeficiency was due to a relative increase in the proportion of the brown skin which cov-ers the flesh rather than to a direct effect on the fatty acid composition of the oil itself.It is known that the brown skin (testa) is very rich in unsaturateds.
Table 14. Properties of coconut oil extracted from rubbery and non-rubbery copra (Southern)
Category Description Oil Content Iodine Saponification Refractive(per cent value value indexdry basis) (40'C)
0 Extremely Rubbery 38.4 20.25 234.1 1.45191 Very Rubbery 47.0 14.77 243.1 1.45082 Rubbery 51.6 12.63 245.7 1.45043 Slightly Rubbery 64.4 9.03 258.4 1.44904 Normal 64.9 7.40 264.6 1.4489
286
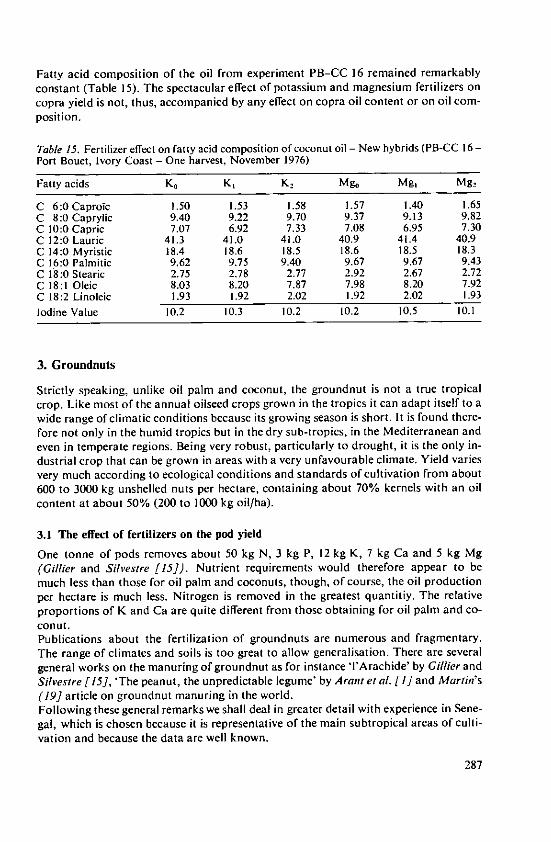
Fatty acid composition of the oil from experiment PB-CC 16 remained remarkablyconstant (Table 15). The spectacular effect of potassium and magnesium fertilizers oncopra yield is not, thus, accompanied by any effect on copra oil content or on oil com-position.
Table 15. Fertilizer effect on fatty acid composition of coconut oil - New hybrids (PB-CC 16 -
Port Bouet, Ivory Coast - One harvest, November 1976)
Fatty acids K0 K, K, Mg, Mg, Mg2
C 6:0 Caproic 1.50 1.53 1.58 1.57 1.40 1.65C 8:0 Caprylic 9.40 9.22 9.70 9.37 9.13 9.82C 10:0 Capric 7.07 6.92 7.33 7.08 6.95 7.30C 12:0 Lauric 41.3 41.0 41.0 40.9 41.4 40.9C 14:0 Myristic 18.4 18.6 18.5 18.6 18.5 18.3C 16:0 Palmitic 9.62 9.75 9.40 9.67 9.67 9.43C 18:0 Stearic 2.75 2.78 2.77 2.92 2.67 2.72C 18:1 Oleic 8.03 8.20 7.87 7.98 8.20 7.92C 18:2 Linoleic 1.93 1.92 2.02 1.92 2.02 1.93Iodine Value 10.2 10.3 10.2 10.2 10.5 10.1
3. Groundnuts
Strictly speaking, unlike oil palm and coconut, the groundnut is not a true tropicalcrop. Like most of the annual oilseed crops grown in the tropics it can adapt itself to awide range of climatic conditions because its growing season is short. It is found there-fore not only in the humid tropics but in the dry sub-tropics, in the Mediterranean andeven in temperate regions. Being very robust, particularly to drought, it is the only in-dustrial crop that can be grown in areas with a very unfavourable climate. Yield variesvery much according to ecological conditions and standards of cultivation from about600 to 3000 kg unshelled nuts per hectare, containing about 70% kernels with an oilcontent at about 50% (200 to 1000 kg oil/ha).
3.1 The effect of fertilizers on the pod yield
One tonne of pods removes about 50 kg N, 3 kg P, 12 kg K, 7 kg Ca and 5 kg Mg(Gillier and Silvestre [15]). Nutrient requirements would therefore appear to bemuch less than those for oil palm and coconuts, though, of course, the oil productionper hectare is much less. Nitrogen is removed in the greatest quantitiy. The relativeproportions of K and Ca are quite different from those obtaining for oil palm and co-conut.Publications about the fertilization of groundnuts are numerous and fragmentary.The range of climates and soils is too great to allow generalisation. There are severalgeneral works on the manuring of groundnut as for instance 'l'Arachide' by Gillier andSilvestre [15], 'The peanut, the unpredictable legume' by Arant et al. [I] and Martin's(19] article on groundnut manuring in the world.Following these general remarks we shall deal in greater detail with experience in Sene-gal, which is chosen because it is representative of the main subtropical areas of culti-vation and because the data are well known.
287
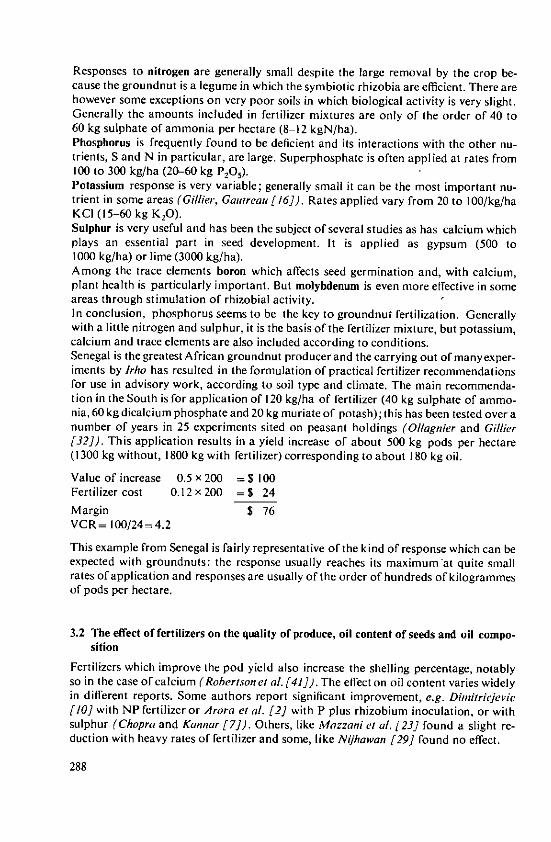
Responses to nitrogen are generally small despite the large removal by the crop be-cause the groundnut is a legume in which the symbiotic rhizobia are efficient. There arehowever some exceptions on very poor soils in which biological activity is very slight.Generally the amounts included in fertilizer mixtures are only of the order of 40 to60 kg sulphate of ammonia per hectare (8-12 kgN/ha).Phosphorus is frequently found to be deficient and its interactions with the other nu-trients, S and N in particular, are large. Superphosphate is often applied at rates from100 to 300 kg/ha (20-60 kg P20 5).Potassium response is very variable; generally small it can be the most important nu-trient in some areas (Gil/ier, Gautreau [16]). Rates applied vary from 20 to 100/kg/haKCI (15-60 kg K20).Sulphur is very useful and has been the subject of several studies as has calcium whichplays an essential part in seed development. It is applied as gypsum (500 to1000 kg/ha) or lime (3000 kg/ha).Among the trace elements boron which affects seed germination and, with calcium,plant health is particularly important. But molybdenum is even more effective in someareas through stimulation of rhizobial activity.In conclusion, phosphorus seems to he the key to groundnut fertilization. Generallywith a little nitrogen and sulphur, it is the basis of the fertilizer mixture, but potassium,calcium and trace elements are also included according to conditions.Senegal is the greatest African groundnut producer and the carrying out of manyexper-iments by lrho has resulted in the formulation of practical fertilizer recommendationsfor use in advisory work, according to soil type and climate. The main recommenda-tion in the South is for application of 120 kg/ha of fertilizer (40 kg sulphate of ammo-nia, 60 kg dicalcium phosphate and 20 kg muriate of potash); this has been tested over anumber of years in 25 experiments sited on peasant holdings (Ollagnier and Gillier[32]). This application results in a yield increase of about 500 kg pods per hectare(1300 kg without, 1800 kg with fertilizer) corresponding to about 180 kg oil.
Value of increase 0.5 x 200 = S 100Fertilizer cost 0.12 x200 =S 24Margin $ 76VCR= 100/24 = 4.2
This example from Senegal is fairly representative of the kind of response which can beexpected with groundnuts: the response usually reaches its maximumat quite smallrates of application and responses are usually of the order of hundreds of kilogrammesof pods per hectare.
3.2 The effect of fertilizers on the quality of produce, oil content of seeds and oil compo-sition
Fertilizers which improve the pod yield also increase the shelling percentage, notablyso in the case of calcium (Robertson et al. [41]). The effect on oil content varies widelyin different reports. Some authors report significant improvement, e.g. Dimitricjevic[/0] with NP fertilizer or Arora et al. [2] with P plus rhizobium inoculation, or withsulphur (Chopra and Kannar [7]). Others, like Mazzani et al. [23] found a slight re-duction with heavy rates of fertilizer and some, like Nijawan [29] found no effect.
288
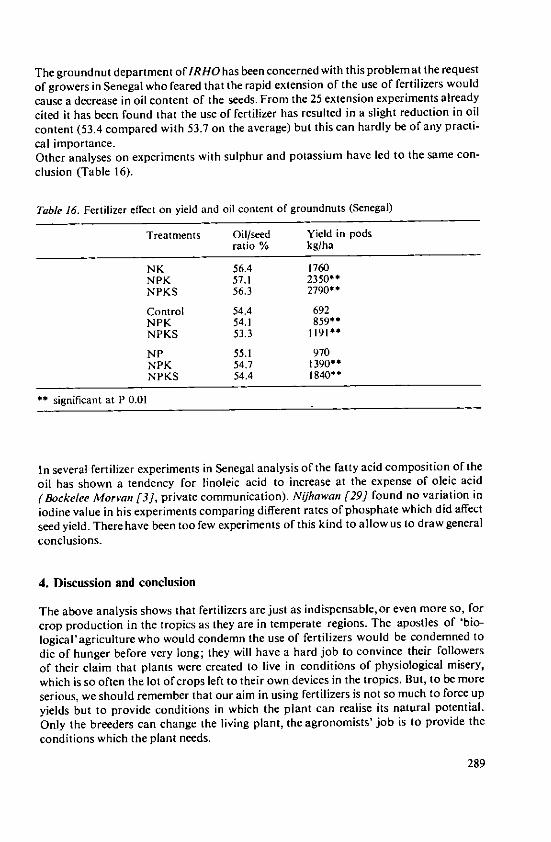
The groundnut department of IRHO has been concerned with this problem at the requestof growers in Senegal who feared that the rapid extension of the use of fertilizers would
cause a decrease in oil content of the seeds. From the 25 extension experiments already
cited it has been found that the use of fertilizer has resulted in a slight reduction in oil
content (53.4 compared with 53.7 on the average) but this can hardly be of any practi-
cal importance.Other analyses on experiments with sulphur and potassium have led to the same con-clusion (Table 16).
Table 16. Fertilizer effect on yield and oil content of groundnuts (Senegal)
Treatments Oil/seed Yield in podsratio % kg/ha
NK 56.4 1760NPK 57.1 2350**NPKS 56.3 2790**
Control 54.4 692NPK 54.1 859**NPKS 53.3 1191*
NP 55.1 970NPK 54.7 1390**NPKS 54.4 1840**
significant at P 0.01
In several fertilizer experiments in Senegal analysis of the fatty acid composition of the
oil has shown a tendency for linoleic acid to increase at the expense of oleic acid
(Bockelee Morvan [3], private communication). Ni.1hawan [29] found no variation in
iodine value in his experiments comparing different rates of phosphate which did affect
seed yield. Therehave been too few experiments of this kind to allowus to draw generalconclusions.
4. Discussion and conclusion
The above analysis shows that fertilizers are just as indispensable, or even more so, for
crop production in the tropics as they are in temperate regions. The apostles of 'bio-
logical'agriculture who would condemn the use of fertilizers would be condemned to
die of hunger before very long; they will have a hard job to convince their followersof their claim that plants were created to live in conditions of physiological misery,which is so often the lot of crops left to their own devices in the tropics. But, to be more
serious, we should remember that our aim in using fertilizers is not so much to force up
yields but to provide conditions in which the plant can realise its natural potential.
Only the breeders can change the living plant, the agronomists' job is to provide the
conditions which the plant needs.
289
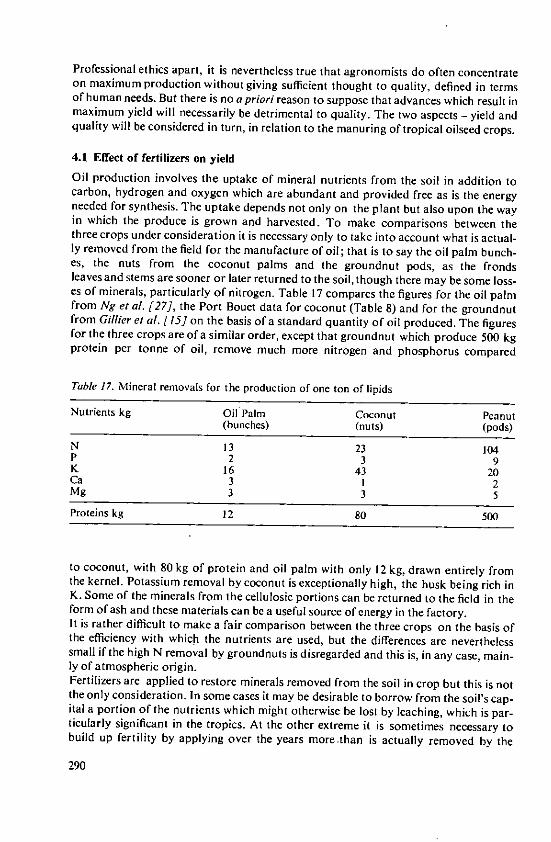
Professional ethics apart, it is nevertheless true that agronomists do often concentrateon maximum production without giving sufficient thought to quality, defined in termsof human needs. But there is no a priori reason to suppose that advances which result inmaximum yield will necessarily be detrimental to quality. The two aspects - yield andquality will be considered in turn, in relation to the manuring of tropical oilseed crops.
4.1 Effect of fertilizers on yield
Oil production involves the uptake of mineral nutrients from the soil in addition tocarbon, hydrogen and oxygen which are abundant and provided free as is the energyneeded for synthesis. The uptake depends not only on the plant but also upon the wayin which the produce is grown and harvested. To make comparisons between thethree crops under consideration it is necessary only to take into account what is actual-ly removed from the field for the manufacture of oil; that is to say the oil palm bunch-es, the nuts from the coconut palms and the groundnut pods, as the frondsleaves and stems are sooner or later returned to the soil, though there may be some loss-es of minerals, particularly of nitrogen. Table 17 compares the figures for the oil palmfrom Ng et al. [27], the Port Bouet data for coconut (Table 8) and for the groundnutfrom Gillier et al. [15] on the basis of a standard quantity of oil produced. The figuresfor the three crops are of a similar order, except that groundnut which produce 500 kgprotein per tonne of oil, remove much more nitrogen and phosphorus compared
Table 17. Mineral removals for the production of one ton of lipids
Nutrients kg Oil Palm Coconut Peanut(bunches) (nuts) (pods)
N 13 23 104P 2 3 9K 16 43 20Ca 3 1 2Mg 3 3 5
Proteins kg 12 80 500
to coconut, with 80 kg of protein and oil palm with only 12 kg, drawn entirely fromthe kernel. Potassium removal by coconut is exceptionally high, the husk being rich inK. Some of the minerals from the cellulosic portions can be returned to the field in theform of ash and these materials can be a useful source of energy in the factory.It is rather difficult to make a fair comparison between the three crops on the basis ofthe efficiency with which the nutrients are used, but the differences are neverthelesssmall if the high N removal by groundnuts is disregarded and this is, in any case, main-ly of atmospheric origin.Fertilizers are applied to restore minerals removed from the soil in crop but this is notthe only consideration. In some cases it may be desirable to borrow from the soil's cap-ital a portion of the nutrients which might otherwise be lost by leaching, which is par-ticularly significant in the tropics. At the other extreme it is sometimes necessary tobuild up fertility by applying over the years more .than is actually removed by the
290
crop. Long term trials are needed to elucidate these points and these allow us to define
fertilizer needs for optimum production in practical economic terms. We shall try to
characterise the three crops studied as to which are the most useful fertilizers and as to
how effective fertilizers are.Without a doubt, potash plays the main role in the cultivation of oil palm and coconut,
while with groundnuts phosphatic fertilizers, particularly those containing sulphur, are
of overriding importance. Nitrogen is second in importance in every case. The particu-
lar need of groundnuts for sulphur and calcium should be stressed. We see then that
there is no such thing as a general fertilizer recipe for all oilseedcrops; their needs differ.
If we take as a basis of comparison the efficiency of fertilizers in oil production we
might expect a five fold difference between the legume and the two palms, on account
of their very different potential productivity. But this is not the case; all three crops
need about 600 kg fertilizer per extra tonne of oil produced.
We have put the groundnut at a disadvantage by imposing on it the marginal condi-
tions to which it is so frequently subjected; in spite of this, it achieves the same level
of fertilizer profitability as the tree crops, which have a longer production period and
are grown under more favourable climatic conditions.
4.2 The effect of fertilizers on oil content and oil quality
Unhappily there have been too few investigations to allow general conclusions to be
drawn. So far as concerns oil content of harvested products there are some cases where
fertilizer response is accompanied by a dilution effect as if the plant puts less energy
into reserve when growth approaches the optimum, but this has only a negligible effect
on the return from using fertilizers. The strong depressive effect found in the Chemara
work on oil palm appears to be an exception, but it would, nevertheless, be a good
thing to find an explanation for this behaviour. The positive effects like those of Jrho
with magnesium on palms or those of Ng Siew Kee should be confirmed before the dis-
cussion is taken further. Those of Southern on the other hand leave no room for doubt:
applying sulphur caused a spectacular increase in the oil content of copra but only in
comparison with severe deficiency which seriously disturbed the whole growth of the
tree. This is a particular case which adds nothing to Venemta's [50] hypothesis on the
specific effect of the sulphate ion in the metabolism of oil seed crops.
As concerns oil composition, any variations found have been very minor. It is possible
that when more, and more precise, results are available they will be found to be of
some physiological significance but they are unlikely to be of practical importance. Ge-
netics control metabolism to such a degree that quality is practically insensitive to envi-
ronmental conditions.
This cursory review of the effects of fertilizers on some tropical oil crops shows:
- that mineral fertilizers are indispensable- that they are very efficient and, in economic terms, give a return worth three times
their cost- that their beneficial effect on yield is not accompanied by any adverse effect on quali-
ty.
The use of fertilizers is already well established in oil palm plantations and even in
small village plots which have been developed around the large centres. Such concen-
291
tration provides a framework for advisory effort. However this does not apply with co-conuts and groundnuts usually grown in traditional agricultural systems, upon whichit is more difficult to make an impact with a view to improvement. Nevertheless, the fu-ture has much to offer.
References
I. Arant F.S. et al.: The peanut, the unpredictable legume. The National Fertilizer Associa-tion, Washington, p. 333, 1951
2. Arora S. K., Soini, J. S., Gandhi, R. C. and Sandhu, R. S.: Study of chemical compositionand yield of groundnut as affected by Rhizobium inoculation. Oldagineux 25, No 5,p. 279-280 (1970)
3. Bockelee-Morvan: D~partement Ol6agineux Annuels. frho Paris4. Brunin, C. and Coomans, P.: La carence en bore sur jeunes cocotiers en C6te d'lvoire.
Olagineux 28, N' 6, p. 220-234 (1973)5. Chentara Research Station: Annual Report 1968-1969, Seremban, 19706. Child, R.: Coconuts (2nd edition). Ed. Longman, London, 19747. Chopra, S.L. and Kanwar, J.S.: Effect of sulphur fertilization on the chemical composi-
tion an nutrient uptake by legumes. J. Indian Soc. Soil Sci. 14, p. 69-76 Soils and Fertiliz-ers 30, No 1, Abstract N0 707 (1967)
8. Coomans, P. and Ochs, R.: Rentabilitd des fumures mindrales sur cocotier dans les condi-tions du Sud-Est ivoirien. Ol1agineux 31, N0 8-9, p. 375-382 (1976)
9. Corley, R.H. V. and Mok, C.K.: Effects of nitrogen, phosphorus, potassium and magne-sium on growth of the oil palm. Exp. Agric. 8, p. 347-353 (1972)
10. Dinitricjevic, R.: The effect of manure and mineral fertilizers on the yield of groundnuts;Soils and Fertilizers 26, N' 6, p. 459, Abstract N0 3367 (1963)
11. Forster, H. L. and Goh, H. S.: Fertilizer requirements of oil palm in West Malaysia. Pre-print from Malaysian Agric. Oil Palm Conf. Kuala Lumpur, 1976
12. Fr~Mond, Y., Ziller, R. and de Nuc de Lanothe, M.: Lecocotier. Ed. G. P. Maisonneuveet Larose, Paris, 1966
13. Fr~mond, Y. and Goncalvts, A.J.L.: Nutrition min6raleet carence azot6e dans les cocoter.ales du Mozambique-OI6agineux 22, N' 10, p. 601-606 (1967)
14. Gascon, J.P. and Wuidart, W.: Amelioration de ja production et de la qualit6 de I'huiled'Elacis guineensis. Oldagineux 30, N' 1, p. 1-4 (1975)
15. Gillier, P. and Silvestre, P.: L'Arachide. Ed. Maisonneuve et Larose, Paris, 196916. Gillier, P. and Gautreau, J.: Dix ans d'expdrimentation dans Ia zone h carence potassique
de Patar au Sdndgal. Olagineux 26, N' I, p. 33 (1971)17. Hartley, C. W.S.: The oil palm. Ed. Longmans, London, 196718. He",, C. K., Ng Slew Kee and Lint, K. P.: The rationalisation of manuring oil palms and its
economics in Malaysia. Advances in oil palm cultivation, p. 306-323. The Incorp. Soc. ofPlanters, Kuala Lumpur, 1973
19. Martin, G.: La fumure de 'arachide dans le monde. Olagineux 19, N' 3, p. 161-167(1964)
20. Martin, G. and Prioux, G.: Les effets de la fumure phosphat~e sur le palmier A huile auBrdsil. Ol1agineux 27, N' 7, p. 351-354 (1972)
21. Magat, S.S., Cadigal, V.L. and Habana, J.A.: Yield improvement of coconut in elevatedin land area of Davao (Philippines) by KCI fertilization. Oldagineux 30, No 10, p. 412-418(1975)
22. Mazliak, P.: Le mdtabolisme des lipides dans les plantes supdrieures. Ed. Masson, Paris,p. 112-113, 1968
23. Mazzani, C., Allievi, J., Hinojosa, S. and Boscan, D.: Quelques aspects de la fertilizationmindrale de l'arachide au Vdndzuela. Oldagineux 23, N' 6, p. 383-385 (1968)
24. Meunier, J., Vallejo, G. and Boutin, D.: Elaeis nielanococca x Elaeis guineensis hybrid andits improvement. Oldagineux 31, No 12, p. 519-528 (1976)
25. Nathanael, W. R. N.: Thdorie de ]a fumure et application d'engrais sur cocotiers adultes.Fertilitd N' 35 (1970)
26. Ng Siew Kee and Thanbo, S. (De Souza): Nutrient contents of oil palms in Malaya. Ma-laysian Agric. J. 46, p. 3-45 (1967), p. 332-391 (1968)
292
27. Ng Slew Kee: The oil palm, its culture, manuring and utilisation. Ed. International Po-tash Institute, Berne, 1972
28. Ng Slew Kee: The influence of nutrition on the chemical properties of some tropical plan-
tation crop product. Potassium in tropical crops and soils. loe Colloquium IPI. Abidjan,1973
29. Nijhawan, H.L.: Effect of application of manures on the composition of groundnut crop.I. Change in the important constituents of groundnut seed affecting its quality in trade.Indian Oilseeds J. 6, No 2 (1962)
30. Noiret, J.M. and Wuidart, W.: Possibilities of improving the fatty acid composition of
palm oil, Results and Prospects. Olagineux 31, N' 11, p. 465-474 (1976)31. de Nuc6 de Lamothe, M. and Rognon, F.: L'hybride Port-Bouet 121. Nouveaux resultats.
Ol6agineux 30, N' 11 (1975)32. Ollagnier, M. and Gillier, P.: Contraintes techniques et socio-6conomiques dans l'utilisa-
tion des engrais minraux au Sngal. Ol6agineux 25, N0 12, p. 661-668 (1970)
33. Ollagnier, M., Ochs, R. and Martin, G.: La fumure du palmier i huile dans le monde. Fer-tilit& No 36 (1970)
34. Ollagnier, M. and Ochs, R.: La nutrition en chlore du palmier a huile et du cocotier. C. R.Academic Agric. de France 17/2, p. 203-312 (1971)
35. Ollagnier, M. and Ochs, R.: Chlorine, a new essential element in oil palm nutrition. Olda-
gineux 26, N' I, p. 1-15 (1971)36. Ollagnier, M. and Ochs, R.: Les ddficiences en soufre du palmier A huile et du cocotier.
Oldagineux 27, p. 193-198 (1972)37. Ollagnier, M.: Anionic nutrition of the oil palm. Application to fertilizer policy in
North-Sumatra. Oldagineux 28, N' 1, p. 1-9 (1973)38. Philippines Coconut Authority - Agricultural Research Branch (PCA-ARD)-Davao Min-
danao Philippines: Annual Reports 1974-1975 and 1975-197639. Pomier, M.: Nutrition mindrale des jeunes cocotiers sur sols coralliens. Oldagineux 24,
N' I, p. 13-19 (1969)40. Pradenie, R. L. and Mendoza, A. M. R.: Response of inland coconuts to inorganic fertili-
zation from field planting. The Philippine Journal of Coconut Studies No I, p. 27- 36
(1976)41. Robertson, W. K., Lundy, H. W. and Thompson, L.G.: Peanut response to calcium sources
and micronutrients; after: Soils and Fertilizers 30, N0 3, Abstract No 2314 (1967)42. Smith, R. W.: Fertilizer responses by coconuts on two contrasting Jamaican soils. Expl.
Agric. 1969, N0 5, p. 133-145 (1969)43. Southern, P.J.: Sulphur deficiency in coconuts, a widespread field condition in Papua and
New-Guinea; Part 2: The effect of sulphur deficiency on copra quality. Papua andNew-Guinea Agric. Journal 19, N' 1, p. 38-44 (1967)
44. Southern, P.J.: Sulphur deficiency in Coconut. Oldagineux 24, No 4, p. 211-220 (1969)
45. Thampan, P.K. and Pankajakshan, A.S.: The economics of recommanded management
practices for coconut. Coconut Bull. India 3, N' 8, p. 2-11 (1972)46. von Uexkull, H. R.: Manuring of coconuts. Cocoa and Coconuts in Malaysia. Ed. Yau
Seng Press, Kuala Lumpur, p. 386-399, 197247. von Uexkull, H. R.: Response of coconuts to (potassium) chloride in the Philippines.
Oldagineux 27, N' 2, p. 13-19 (1972)48. Unilever: Statistiques mondiales des Corps Gras 1972-1975. Oldagineux 31, N' 7,
p. 339-349 (1976)49. Ununar Akbar, Tampubolon, F.H., Amiruddin, D. and Ollagnier, M.: Expdriences de fu-
mure sur palmier 6 huile au Nord-Sumatra. Oldagineux 31, No 7, p. 305-316 (1976)
50. Venema, K. C. W.: Some notes regarding the fmnction of the sulphate anion in the metabo-
lism of oil producing plants, especially oil palms. Potash and Tropical Agriculture 5, No 3,4; 6, N' 1, 2 (1962-1963)
293
The Effect of Nitrogen and PotassiumFertilizers on Olive Production
1. Klein, Ph.D. and S. Lavee, Ph.D., Division of Oleiculture and Viticulture, AgriculturalResearch Organization, The Volcani Center, Bet Dagan/lsrael*
Sunnary
Nitrogen and potassium fertilization of Nabali olives was investigated during 6 years infive experimental plots at different sites in the Judea and Samaria mountains. Fertilizertreatments included 0, 0.4 or 0.8 kg/tree of nitrogen with a combination of either 0 or 4.2 kg/tree of potassium.Application of nitrogen alone increased yield and leaf nitrogen content of the olive trees. Anadditional increase in leaf nitrogen content and yield was obtained when potassium wasapplied in combination with nitrogen.Yield was positively correlated with leaf nitrogen in four out of the five locations. The fifthlocation was found to be deficient in boron, and hence did not respond to nitrogen or potassiumfertilization. The correlation of yield and potassium content of leaves was negative in twolocations, positive in one, and absent in two.
Introduction
The olive tree can exist under extreme and adverse conditions. However, to obtain
reasonable yields, certain cultural practices - such as pruning, insect and pest control,
and fertilizer application - have to be observed. It is widely accepted that lack of
fertilization can be one of the limiting factors in agricultural production, and particu-
larly so when crops are irrigated. The merits of fertilizer use in dry farming are often
questioned, on the assumption that the rate-limiting factor is water rather than fertilizer
availability.Fertilization of olives has been investigated in the USA (Hartmann [13, 14]), and
in the Mediterranean basin (Bouai [1, 2], Bouat, Renaud and Dulac [3], Buchmnann,Brsand Prevot [4], Garcia et al. [9, 10, 1/], Louvrier [16], Prevot and Buchmann [17]).
Some of these studies were carried out in irrigated groves and others under non-
irrigated conditions. The olive was found to respond to nitrogen application when
growing in shallow and non-fertile soils. Increased yield following nitrogen application
was due to higher fruit set rather than to an increase in the number of flowers or to
changes in the number of perfect flowers (Hartmann [14]). The nitrogen level in
deficient trees is usually below 1.3%, and in high-yielding trees above 1.5%.
Dr. 1. Klein, Agric. Research Organization, The Volcani Center, P.O.B. 6, Rehovot/IsraelDr. S. Lavee, Agric. Research Organization, The Volcani Center, P.O.B. 6, Rehovot/Israel
295
Alternate bearing is one of the major problems in olive production. Several studieswere carried out in an attempt to evaluate the role of nutrition in the alternate pro-duction of the olive tree (Fahamy [6], Fahany and Nasrallah [7], Gonzales et al.[12], Prevot and Buchrnann [17]). The N level in leaves and vegetative buds wasreported to be higher in the 'off' year than in the 'on' year. Based on this observation,it was speculated that in the heavy-crop year the tree is being depleted of its nutrientreserves and therefore does not initiate reproductive structures (Hartmann, Uritt andLilleland [15]).Several cases of potassium deficiency were observed in olive trees. Hartman reported[13] that a massive dose of potassium application in the USA increased shoot growth,fruit size, yield and leaf K content. Potassium deficiency was diagnosed also in France(Prevot and Buchinann [17]) and Greece (Demnetriades and Gavalas [5]).A close relationship between productivity and K content of leaves was found insurveys of olive groves in Turkey (Fox, Aydeniz and Kacar [8]) and Tunisia (Buch-mann, Br& et Prevot [4]).A leaf analysis survey of the two major olive cultivars (Suri and Manzanillo) grownin Israel was carried out in the past by Samnish et al. [18]. This survey did not includethe Judea and Samaria regions, located west of the Jordan River, where the Nabalicultivar is grown. Leaf analyses that were carried out in 1970 indicated several casesof low levels of N in the Nabali olives. Consequently, an experiment was set up tostudy the effect of fertilizer application on yield. Application of both N and K wasinvestigated in view of the fact that the Nabali olives in the Judea and Samaria regionhave always been grown without any fertilizer application.
Materials and methodsFive orchards in Judea and Samaria, 35-40 years of age, of the local variety Nabali,were selected for the experiment. The orchards are located 250-700 m above sea level,in an area with an average annual rainfall of 600-850 mm (limited to the winter months).The prevailing temperatures are 0-12°C during the winter and 18-30'C during the(dry) summer.Combinations of 0, 0.4 or 0.8 kg N (as calcium amonium nitrate or amonium sulfate)and 0 or 4.2 kg K (as potassium chloride) were broadcast around the trees duringthe second half of the winter. Treatments were replicated twice at each location exceptin Bedia, each replicate consisting of 15-40 trees. The olive trees are planted irregularly,in a density of 100-150 trees/hectare.The yield of each tree and leaf samples from pre-selected trees were collected annually.A composite leaf sample (the middle one-third of current growth) was collected fromthree trees in the center of each replicate. Three additional trees were sampled individ-ually; thus four leaf samples were analyzed in each replicate. Leaf samples werecollected during October, washed, and dried at 70'C. Samples were then ground anddigested on a hot plate with 2 ml of concentrated sulfuric acid and I ml of H202 addedat the final stage of digestion. Nitrogen and phosphorus were analyzed colorimetricallywith an autoanalyser, and potassium, calcium and magnesium with atomic absorption.Correlations of yield with nitrogen and potassium content of leaves were calculatedfrom those trees that were sampled individually for leaf analysis. The correlationswere therefore calculated from data obtained on the same trees for the duration of theexperiment, excluding years when no yield was recorded.
296
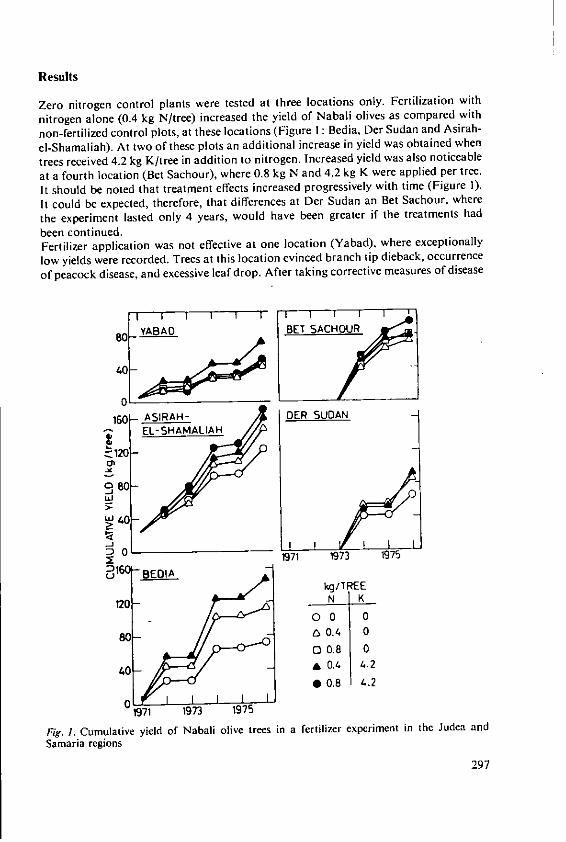
Results
Zero nitrogen control plants were tested at three locations only. Fertilization with
nitrogen alone (0.4 kg N/tree) increased the yield of Nabali olives as compared with
non-fertilized control plots, at these locations (Figure I : Bedia, Der Sudan and Asirah-
el-Shamaliah). At two of these plots an additional increase in yield was obtained when
trees received 4.2 kg K/tree in addition to nitrogen. Increased yield was also noticeable
at a fourth location (Bet Sachour), where 0.8 kg N and 4.2 kg K were applied per tree.
It should be noted that treatment effects increased progressively with time (Figure 1).
It could be expected, therefore, that differences at Der Sudan an Bet Sachour, where
the experiment lasted only 4 years, would have been greater if the treatments had
been continued.Fertilizer application was not effective at one location (Yabad), where exceptionally
low yields were recorded. Trees at this location evinced branch tip dieback, occurrence
of peacock disease, and excessive leaf drop. After taking corrective measures of disease
go YABAD BET SAC __
40
0
160 ASIRAH- DER SUDANEL- SHA MAt IAH
120
Lij
40
01971 1973 1975
1 - BEDIA
kg/TREE
120 N K0 0 0
80 AO0.4 0
0 0.8 0
40 A 0.4 4.2
* 0.8 4.2
01971 1973 1975
Fig. I. Cumulative yield of Nabali olive trees in a fertilizer experiment in the Judea andSamaria regions
297
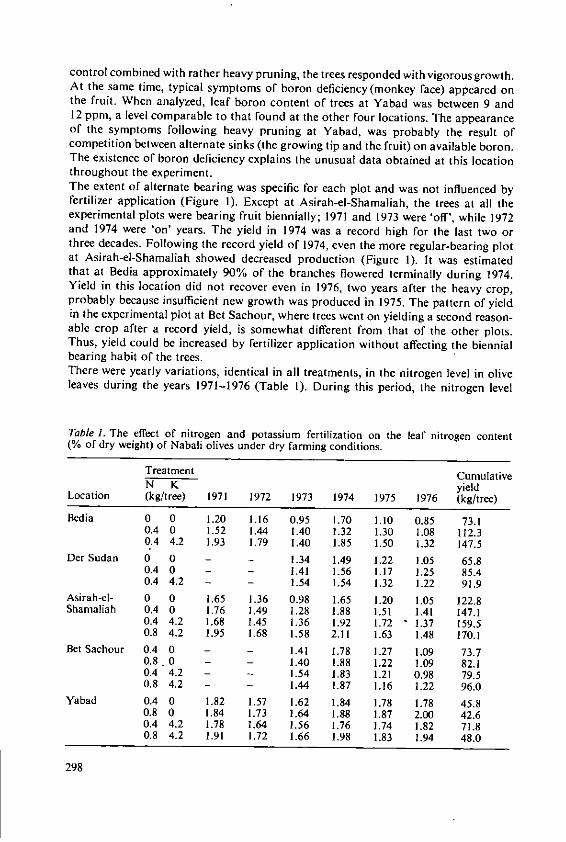
control combined with rather heavy pruning, the trees responded with vigorous growth.At the same time, typical symptoms of boron deficiency (monkey face) appeared onthe fruit. When analyzed, leaf boron content of trees at Yabad was between 9 and12 ppm, a level comparable to that found at the other four locations. The appearanceof the symptoms following heavy pruning at Yabad, was probably the result ofcompetition between alternate sinks (the growing tip and the fruit) on available boron.The existence of boron deficiency explains the unusual data obtained at this locationthroughout the experiment.The extent of alternate bearing was specific for each plot and was not influenced byfertilizer application (Figure 1). Except at Asirah-eI-Shamaliah, the trees at all theexperimental plots were bearing fruit biennially; 1971 and 1973 were 'off', while 1972and 1974 were 'on' years. The yield in 1974 was a record high for the last two orthree decades. Following the record yield of 1974, even the more regular-bearing plotat Asirah-el-Shamaliah showed decreased production (Figure 1). It was estimatedthat at Bedia approximately 90% of the branches flowered terminally during 1974.Yield in this location did not recover even in 1976, two years after the heavy crop,probably because insufficient new growth was produced in 1975. The pattern of yieldin the experimental plot at Bet Sachour, where trees went on yielding a second reason-able crop after a record yield, is somewhat different from that of the other plots.Thus, yield could be increased by fertilizer application without affecting the biennialbearing habit of the trees.There were yearly variations, identical in all treatments, in the nitrogen level in oliveleaves during the years 1971-1976 (Table I). During this period, the nitrogen level
Table 1. The effect of nitrogen and potassium fertilization on the leaf nitrogen content(% of dry weight) of Nabali olives under dry farming conditions.
Treatment CumulativeN K yieldLocation (kg/tree) 1971 1972 1973 1974 1975 1976 (kg/tree)
Bedia 0 0 1.20 1.16 0.95 1.70 1.10 0.85 73.10.4 0 1.52 1.44 1.40 1.32 1.30 1.08 112.30.4 4.2 1.93 1.79 1.40 1.85 1.50 1.32 147.5
Der Sudan 0 0 - - 1.34 1.49 1.22 1.05 65.80.4 0 - - 1.41 1.56 1.17 1.25 85.40.4 4.2 - - 1.54 1.54 1.32 1.22 91.9
Asirah-el- 0 0 1.65 1.36 0.98 1.65 1.20 1.05 122.8Shamaliah 0.4 0 1.76 1.49 1.28 1.88 1.51 1.41 147.1
0.4 4.2 1.68 1.45 1.36 1.92 1.72 1.37 159.50.8 4.2 1.95 1.68 1.58 2.11 1.63 1.48 170.1
Bet Sachour 0.4 0 - - 1.41 1.78 1.27 1.09 73.70.8. 0 - - 1.40 1.88 1.22 1.09 82.10.4 4.2 - - 1.54 1.83 1.21 0.98 79.50.8 4.2 - - 1.44 1.87 1.16 1.22 96.0
Yabad 0.4 0 1.82 1.57 1.62 1.84 1.78 1.78 45.80.8 0 1.84 1.73 1.64 1.88 1.87 2.00 42.60.4 4.2 1.78 1.64 1.56 1.76 1.74 1.82 71.80.8 4.2 1.91 1.72 1.66 1.98 1.83 1.94 48.0
298

cycled twice, regardless of treatment, from a high to a low value (1971 to 1973 and
1974 to 1976). The effect of nitrogen and potassium fertilization on leaf nitrogen level
could be seen in all years, but it was more pronounced in years when leaf N was low.
Application of nitrogen alone increased leaf nitrogen, and an additional increase was
evident when potassium was combined with nitrogen (Table 1). A close relationship
between nitrogen level and yield was observed at all experimental locations except
Yabad.The level of potassium in the leaves was approximately 0.60-0.85% during 1971-1973,
and was not affected by potassium fertilization (Table 2). The high yield of 1974
caused a remarkable drop in K content of leaves except at Bet Sachour. Potassium
level was slow to recover in the following years. A slight effect of potassium application
on leaf K content was evident at Bedia, Der Sudan and Yabad under these conditions
(Table 2).Phosphorus levels were found to be adequate, with the probable exception of Bedia,
where levels were frequently below 0.10% (Table 3).Correlation of leaf nitrogen with yield of individual trees was highly significant
(Figure 2). Correlation coefficients for nitrogen were r=0.310-0. 66 7 .Correlation coefficients of yield and potassium were absent (at Asirah-el-Shamaliah
and Yabad), negative (at Der Sudan and Bedia), or significantly positive (at Bet
Sachour) (Figure 3). The negative correlation of yield with potassium is obviously not
a case of potassium 'toxicity.' It must indicate depletion at a time when supply is
insufficient.
Table 2. The effect of nitrogen and potassium fertilization on the leaf potassium content(% of dry weight) of Nabali olives under dry farming conditions.
Treatment CumulativeN K yield
Location (kg/tree) 1971 1972 1973 1974 1975 1976 (kg/tree)
Bedia 0 0 0.62 0.84 0.82 0.26 0.26 0.52 73.10.4 0 0.72 0.75 0.80 0.47 0.40 0.51 112.30.4 4.2 0.77 0.87 0.82 0.28 0.48 0.65 147.5
Der Sudan 0 0 - - 0.64 0.37 0.44 0.46 65.80.4 0 - - 0.60 0.41 0.47 0.50 85.40.4 4.2 - - 0.62 0.42 0.57 0.53 91.9
Asirah-el- 0 0 0.76 0.95 0.78 0.74 0.63 0.68 122.8Shamalia 0.4 0 0.67 0.83 0.66 0.63 0.41 0.62 147.1
0.4 4.2 0.82 0.88 0.80 0.70 0.61 0.67 159.50.8 4.2 0.74 0.86 0.83 0.68 0.65 0.71 170.1
Bet Sachour 0.4 0 - - 0.60 0.68 0.59 0.53 73.70.4 0 - - 0.60 0.78 0.59 0.50 82.10.4 4.2 - - 0.59 0.78 0.58 0.52 79.50.8 4.2 - - 0.54 0.68 0.61 0.50 96.0
Yabad 0.4 0 0.78 0.88 0.74 0.62 0.50 0.56 45.80.8 0 0.71 0.80 0.63 0.54 0.48 0.61 42.60.4 4.2 0.74 0.85 0.77 0.69 0.57 0.76 71.80.8 4.2 0.76 0.95 0.77 0.70 0.65 0.72 48.0
299
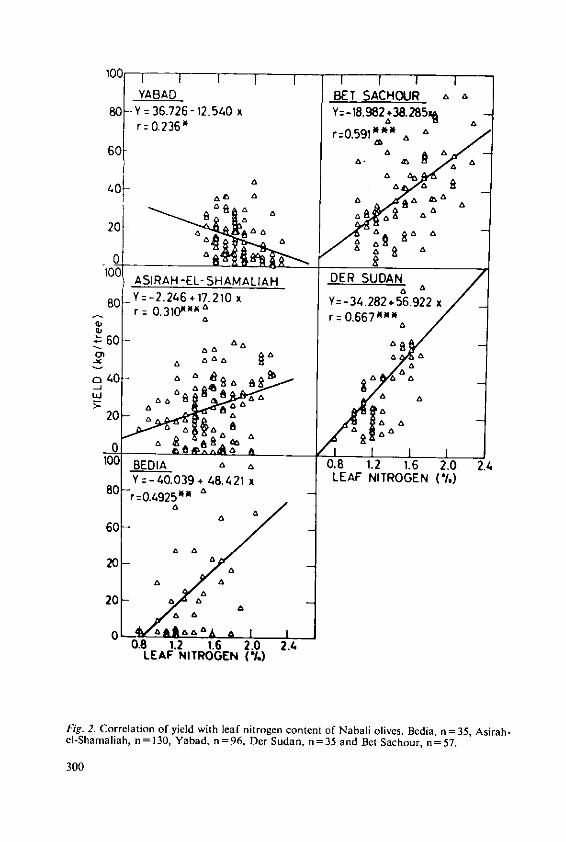
100 I F I F I I I I I
YABAD BET SACHOUR a a80 --Y=36.726-12.540 x Y=-18.982438.285x a-
rr0.236* rr0.591** t a a
60 - a
40 aa 4
a a fi - th40
8 Y=-2246 17.210 x a a
rr 0.3107**
40 a a 4
20- A K A
a J4 a aA__________________ a ca af
100 BEDIA H - A 0.8 1.6 2.0 2.4
Y =- 40.039 + 48.421 x LEAF NITROGEN xr r0.4925rr 6
60-w-4 a a I
0,8 1.2 1.6 2.0 2.4LEAF NITROGEN (%)
Fig. 2. Correlation of yield with leaf nitrogen content of Nabaii olives. Bedia, n =35, Asirah-el-Shamaliah, n= 130, Yabad, n=96, Der Sudan, n =35 and Bet Sachour, n=57.
300
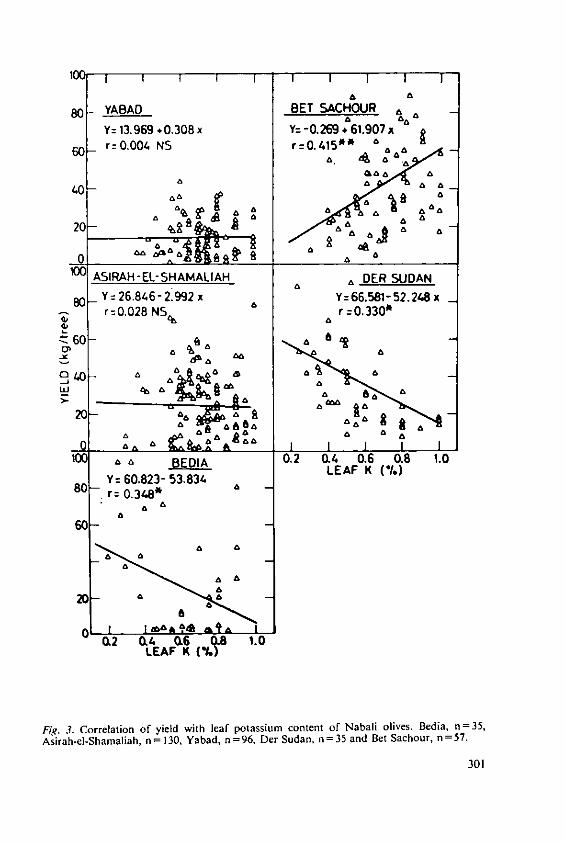
10(] I I I I I I I
80- YABAD BET SACHOUR
Y= 13.969 .0.308 x Y= -0.269 * 61.907 x60- r:0.004 NS r=0.415**
40 a
20- ait a a a
ASIRAH-EL-SHAMALIAH a DER SUDANa
80- Y =26.846- 2.992 x Y= 66.581- 52.248 xr=0.028 NS r 0.330*
60
40 aw! t' a
S a a EDIA 0.2 0.4 0.6 0.8 1.0LEAF K (*I)
YV 60.823- 53.834 L
80 . r= 0.38 *"
60
0.2 o.4 0.6 ,.o
LEAF K M?.
Fig. 3. Correlation of yield with leaf potassium content of Nabali olives. Bedia, n=35,Asirah-el-Shamaliah, n =130, Yabad, n=96, Der Sudan, n=35 and Bet Sachour, n=57.
301
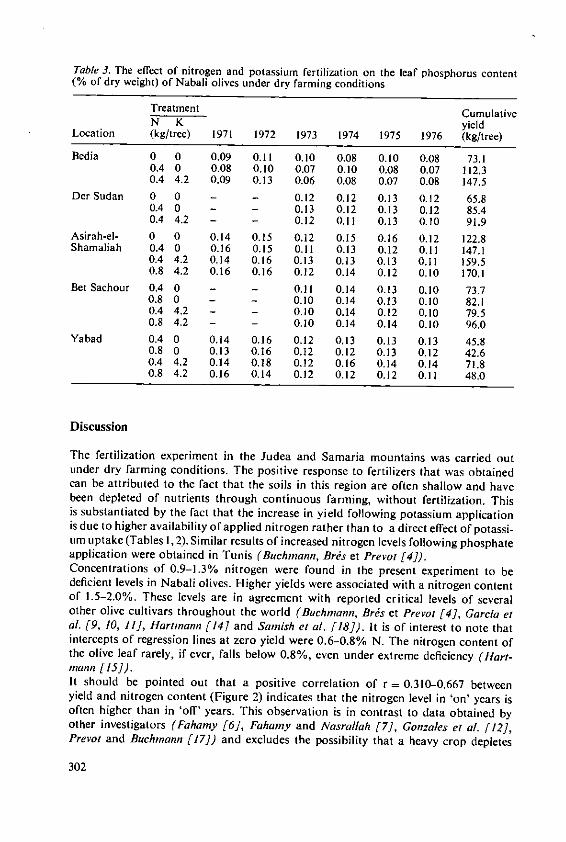
Table 3. The effect of nitrogen and potassium fertilization on the leaf phosphorus content(% of dry weight) of Nabali olives under dry farming conditions
Treatment CumulativeN K yield
Location (kg/tree) 1971 1972 1973 1974 1975 1976 (kg/tree)
Bedia 0 0 0.09 0.11 0.10 0.08 0.10 0.08 73.10.4 0 0.08 0.10 0.07 0.10 0.08 0.07 112.30.4 4.2 0.09 0.13 0.06 0.08 0.07 0.08 147.5
Der Sudan 0 0 - - 0.12 0.12 0.13 0.12 65.80.4 0 - - 0.13 0.12 0.13 0.12 85.40.4 4.2 - - 0.12 0.11 0.13 0.10 91.9
Asirah-el- 0 0 0.14 0.15 0.12 0.15 0.16 0.12 122.8Shamaliah 0.4 0 0.16 0.15 0.11 0.13 0.12 0.11 147.1
0.4 4.2 0.14 0.16 0.13 0.13 0.13 0.11 159.50.8 4.2 0.16 0.16 0.12 0.14 0.12 0.10 170.1
Bet Sachour 0.4 0 - - 0.11 0.14 0.13 0.10 73.70.8 0 - - 0.10 0.14 0.13 0.10 82.10.4 4.2 - - 0.10 0.14 0.12 0.10 79.50.8 4.2 - - 0.10 0.14 0.14 0.10 96.0
Yabad 0.4 0 0.14 0.16 0.12 0.13 0.13 0.13 45.80.8 0 0.13 0.16 0.12 0.12 0.13 0.12 42.60.4 4.2 0.14 0.18 0.12 0.16 0.14 0.14 71.80.8 4.2 0.16 0.14 0.12 0.12 0.12 0.11 48.0
Discussion
The fertilization experiment in the Judea and Samaria mountains was carried outunder dry farming conditions. The positive response to fertilizers that was obtainedcan be attributed to the fact that the soils in this region are often shallow and havebeen depleted of nutrients through continuous farming, without fertilization. Thisis substantiated by the fact that the increase in yield following potassium applicationis due to higher availability of applied nitrogen rather than to a direct effect of potassi-um uptake (Tables 1,2). Similar results of increased nitrogen levels following phosphateapplication were obtained in Tunis (Buchmann, Brs et Prevot [4]).Concentrations of 0.9-1.3% nitrogen were found in the present experiment to bedeficient levels in Nabali olives. Higher yields were associated with a nitrogen contentof 1.5-2.0%. These levels are in agreement with reported critical levels of severalother olive cultivars throughout the world (Buchmann, Brs et Prevo [4], Garcia elal. [9, 10, 11], Hartmann [14] and Sanish et al. [18]). It is of interest to note thatintercepts of regression lines at zero yield were 0.6-0.8% N. The nitrogen content ofthe olive leaf rarely, if ever, falls below 0.8%, even under extreme deficiency (Hart-mann [15]).It should be pointed out that a positive correlation of r = 0.310-0.667 betweenyield and nitrogen content (Figure 2) indicates that the nitrogen level in 'on' years isoften higher than in 'off' years. This observation is in contrast to data obtained byother investigators (Fahamy [61, Fahamy and Nasrallah [7], Gonzales el al. [12],Prevot and Buchmann [17]) and excludes the possibility that a heavy crop depletes
302
the tree of its nutrient reserves, thus preventing initiation of reproductive structures(Hartnamn, Uriu and LilIeland [15]).Critical levels of leaf potassium during the winter months have been reported to bein the range of 0.7-0.85% [Bouat [2], Garcia et al. [9, 10, 11], Sainish et al. [18]).
Such values were found in Nabali during 1971-1973 (Table 2); considerably lower
values were found in 1974 (except at Bet Sachour). The decrease was definitely asso-
ciated with heavy yield. Consequently, the potassium level recovered slowly without
reaching the original level even after two years (Table 2). The depletion of potassium
by a heavy yield is probably the reason for the abscence or the negative correlations,
that were found between yield and potassium level at several locations (Figure 3). If
we accept a critical potassium level of 0.7%, this will emphasize the importance of
regular potassium fertilization of olives to obtain heavy yields.
Acknowledgment
We greatefully acknowledge the assistance of the extension service officers of theMinistry of Agriculture of the Judea and Samaria regions.
Bibliography
1. Bouat, A.: Le diagnostic foliaire et son utilisation dans les probl6mes de conduite, detaille, de rdg6neration et fumure de l'olivier. Informations Olicoles Internationales.No. 8, Oct.-Dec., pp. 3-19 (1959)
2. Banat, A.: Fertilization of the Olive Tree. Fertilitd 10, pp. 13-25 (1960).3. Booam, A., Renaud, P. and Dulac, J.: Etude sur ]a physiologic de la nutrition de l'olivier
(cinqui me mSmoire). Ann. Agron., Srie A9, pp. 193-215 (1958)4. Buchmann, E., Brds, C. and Prevot, P.: Diagnostic foliaire de Iolivier irrigu6 en Tunisie.
Oleagineux 14, pp. 163-173 (1959)5. Demetriades, S.D. and Gavalas, N.A.: La carence potassique de l'olivier en Grece.
Proc. 7th Congress Int. Potash Institute, Berne, pp. 395-400 (1962)6. Fahamy, L: Changes in Carbohydrate and Nitrogen Content of Souri Olive Leaves in
Relation to Alternate Bearing. Proc. Am. Soc. Hort. Sci. 72, pp. 252-256 (1958)7. Fahamy, 1. and Nasrallah, S.: Changes in Macronutrient Elements of Souri Olive Leaves
in Alternate Bearing Years. Proc. Am. Soc. Hort. Sci. 74, pp. 372-377 (1959)8. Fox, R.L., Aydeniz, A. and Kacar, B.: Soil and Tissue Tests for Predicting Olive Yields
in Turkey. Emp. J. expt. Hort. 32, pp. 84-91 (1964)9. Garcia, F.G., Gomez, A.M.G., Sanchez, M.C. and Vein, C.M.: Estado de Nutrici6n,
Equilibrio Nutritivo y Rendimiento en el Olivar de la Provincia de Sevilla. I. Estudiosobre variedades de aceite. An. Edaf. Agrob. XXVI, Nos. 1-4, pp. 733-762 (1967)
10. Garcia, F.G., Gomez, A.M.G., Sanchez, M.C. and Mazuelos, C.: Estado de Nutrici6n,Equilibrio Nutritivo y Rendimiento en el Olivar de ]a Provincia de Sevilla. II. EstudioSobre ]a Variedad <(Gordal de Mesa. An. Edaf. Agrob. XXIX, Nos. 5-6, pp. 318-341(1970)
11. Garcia, F.G., Gomez, A.M.G., Sanchez, M.C. and Vela C.M.: Estado de Nutrici6n,Equilibrio Nutritivo y Rendimientos en el Olivar de ]a Provincia de Sevilla. Ill. EstudiosSobre la Variedad < Manzanillo>> de Mesa. An. Edaf. Agrob. XXIX, Nos. 9-10, pp. 683-697 (1970)
12. Gonzales, F., Chaves, M., Mazuelos, C. and Troncoso, A.: Aspectos Fisiol6gicos en ]aNutrici6n del Olivar, Variedad «Manzanillo>> de Mesa. Ciclo de Nutrientes en Hojas,Organos de Crecimiento y de Producci6n. An. Edaf. Agrob. XXXII, Nos. 7-8, pp. 615-634 (1973)
303

13. Hartmann, H.T.: Olive Production in California. Manual Calif. agric. Exp. Stn. 7(1953)
14. Hartmann, H. T.: Some Responses of the Olive to Nitrogen Fertilizers. Proc. Am. Soc.Hort. Sci. 72, pp. 257-266 (1958)
15. Hartmann, H. T., Uriu, K. and Lilleland, 0.: Olive Nutrition. In: Temperature to TropicalFruit Nutrition. Childer N.F. (Ed.) Horticultural Publications, Rutgers - The StateUniversity, N.J., pp. 252-261, 1966
16. Louvrier, J.: L'olivier sfaxien; pluies, sols, fumures. Information Olicoles InternationalesNo. 7, pp. 25-34 (1959)
17. Prevot, P. and Buchnann, B.: Foliar Diagnosis of Irrigated Olive Trees. Evolution ofConcentrations in the Course of the Year. Fertilite 10, pp. 3-11 (1960)
18. Samish, R.M., Moscicki, W.Z., Kessler, B. and Hoffnann, M.: A Nutritional Survey ofIsrael Vineyards and Olive Groves by Foliar Analysis. The National and UniversityInstitute of Agriculture, Div. of Publications, Bet Dagan. Spec. Bull. No. 39 (1961)
304
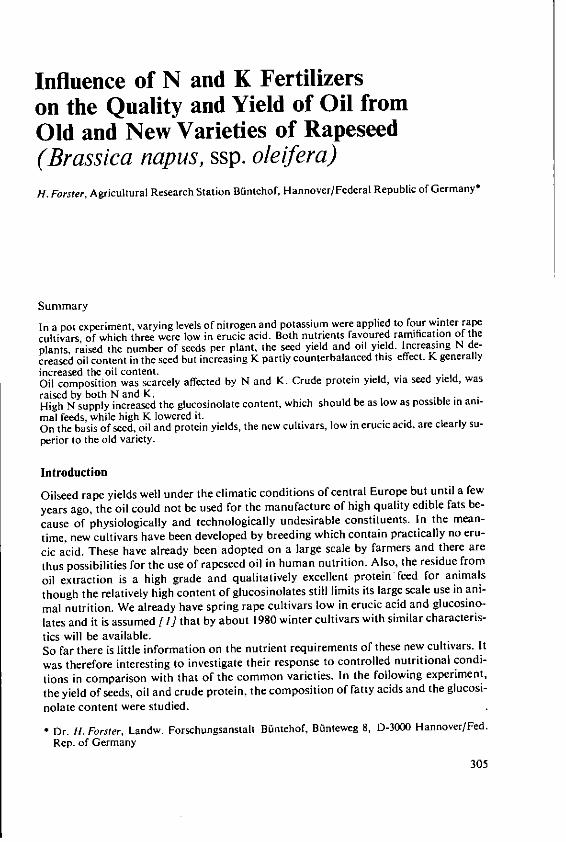
Influence of N and K Fertilizerson the Quality and Yield of Oil fromOld and New Varieties of Rapeseed(Brassica napus, ssp. oleifera)
H. Forster, Agricultural Research Station Bintehof, Hannover/Federal Republic of Germany-
Summary
In a pot experiment, varying levels of nitrogen and potassium were applied to four winter rapecultivars, of which three were low in erucic acid. Both nutrients favoured ramification of theplants, raised the number of seeds per plant, the seed yield and oil yield. Increasing N de-creased oil content in the seed but increasing K partly counterbalanced this effect. K generallyincreased the oil content.Oil composition was scarcely affected by N and K. Crude protein yield, via seed yield, wasraised by both N and K.High N supply increased the glucosinolate content, which should be as low as possible in ani-mal feeds, while high K lowered it.On the basis of seed, oil and protein yields, the new cultivars, low in erucic acid, are clearly su-perior to the old variety.
Introduction
Oilseed rape yields well under the climatic conditions of central Europe but until a few
years ago, the oil could not be used for the manufacture of high quality edible fats be-
cause of physiologically and technologically undesirable constituents. In the mean-
time, new cultivars have been developed by breeding which contain practically no eru-
cic acid. These have already been adopted on a large scale by farmers and there are
thus possibilities for the use of rapeseed oil in human nutrition. Also, the residue from
oil extraction is a high grade and qualitatively excellent protein feed for animals
though the relatively high content of glucosinolates still limits its large scale use in ani-
mal nutrition. We already have spring rape cultivars low in erucic acid and glucosino-
lates and it is assumed [l] that by about 1980 winter cultivars with similar characteris-
tics will be available.So far there is little information on the nutrient requirements of these new cultivars. It
was therefore interesting to investigate their response to controlled nutritional condi-
tions in comparison with that of the common varieties. In the following experiment,
the yield of seeds, oil and crude protein, the composition of fatty acids and the glucosi-
nolate content were studied.
* Dr. 1f. Forster, Landw. Forschungsanstalt B~intehof, Bflnteweg 8, D-3000 Hannover/Fed.Rep. of Germany
305
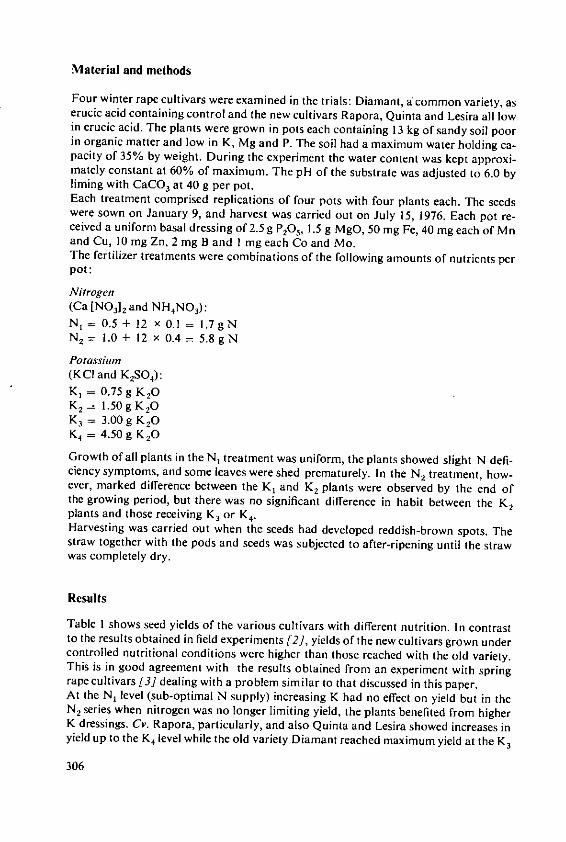
Material and methods
Four winter rape cultivars were examined in the trials: Diamant, acommon variety, aserucic acid containing control and the new cultivars Rapora, Quinta and Lesira all lowin erucic acid. The plants were grown in pots each containing 13 kg of sandy soil poorin organic matter and low in K, Mg and P. The soil had a maximum water holding ca-pacity of 35% by weight. During the experiment the water content was kept approxi-mately constant at 60% of maximum. The pH of the substrate was adjusted to 6.0 byliming with CaCO3 at 40 g per pot.Each treatment comprised replications of four pots with four plants each. The seedswere sown on January 9, and harvest was carried out on July 15, 1976. Each pot re-ceived a uniform basal dressing of 2.5 g P2O 5 , 1.5 g MgO, 50 mg Fe, 40 mg each of Mnand Cu, 10 mg Zn, 2 mg B and I mg each Co and Mo.The fertilizer treatments were combinations of the following amounts of nutrients perpot:
Nitrogen(Ca [NO3]2 and NH 4NO3):N, = 0.5 + 12 x 0.1 = 1.7gNN2 = 1.0 + 12 x 0.4 = 5.8 g N
Potassium(KCI and K 2SO):
K, = 0.75 g KOK 2 = 1.50 g K2OK3 = 3.00g K 20K4 = 4.50 g K20
Growth of all plants in the N, treatment was uniform, the plants showed slight N defi-ciency symptoms, and some leaves were shed prematurely, In the N2 treatment, how-ever, marked difference between the K, and K, plants were observed by the end ofthe growing period, but there was no significant difference in habit between the K,plants and those receiving K3 or K4.Harvesting was carried out when the seeds had developed reddish-brown spots. Thestraw together with the pods and seeds was subjected to after-ripening until the strawwas completely dry.
Results
Table I shows seed yields of the various cultivars with different nutrition. In contrastto the results obtained in field experiments [2], yields of the new cultivars grown undercontrolled nutritional conditions were higher than those reached with the old variety.This is in good agreement with the results obtained from an experiment with springrape cultivars [3] dealing with a problem similar to that discussed in this paper.At the N, level (sub-optimal N supply) increasing K had no effect on yield but in theN2 series when nitrogen was no longer limiting yield, the plants benefited from higherK dressings. Cv. Rapora, particularly, and also Quinta and Lesira showed increases inyield up to the K4 level while the old variety Diamant reached maximum yield at the K3
306
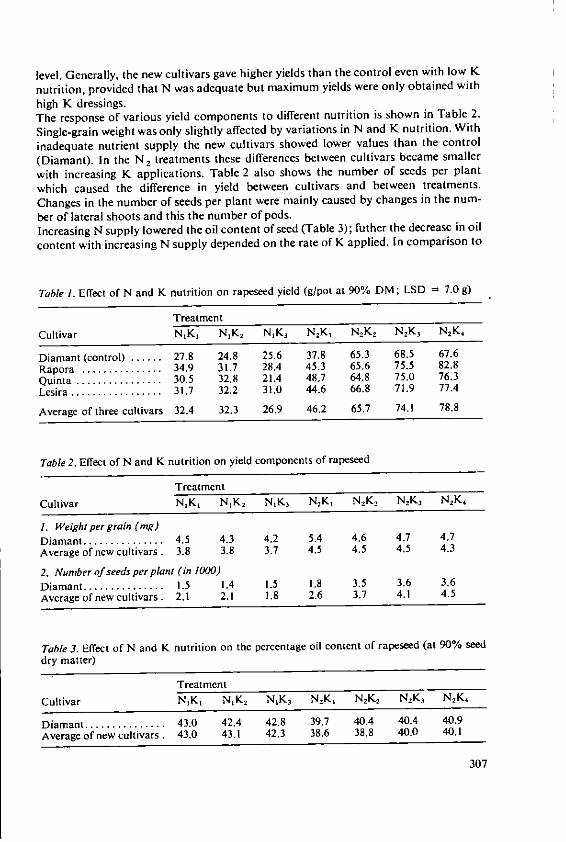
level. Generally, the new cultivars gave higher yields than the control even with low K
nutrition, provided that N was adequate but maximum yields were only obtained with
high K dressings.The response of various yield components to different nutrition is shown in Table 2.
Single-grain weight was only slightly affected by variations in N and K nutrition. With
inadequate nutrient supply the new cultivars showed lower values than the control
(Diamant). In the N2 treatments these differences between cultivars became smaller
with increasing K applications. Table 2 also shows the number of seeds per plant
which caused the difference in yield between cultivars and between treatments.
Changes in the number of seeds per plant were mainly caused by changes in the num-
ber of lateral shoots and this the number of pods.Increasing N supply lowered the oil content of seed (Table 3); futher the decrease in oil
content with increasing N supply depended on the rate of K applied. In comparison to
Table I. Effect of N and K nutrition on rapeseed yield (g/pot at 90% DM; LSD = 7.0 g)
Treatment
Cultivar N1 K1 NK 2 N1K3 N2K, N2 K2 N2K, N2K4
Diamant (control) ...... 27.8 24.8 25.6 37.8 65.3 68.5 67.6
Rapora ............... 34.9 31.7 28.4 45.3 65.6 75.5 82.8
Quinta ................ 30.5 32.8 21.4 48.7 64.8 75.0 76.3
Lesira ................. 31.7 32.2 31.0 44.6 66.8 71.9 77.4
Average of three cultivars 32.4 32.3 26.9 46.2 65.7 74.1 78.8
Table 2. Effect of N and K nutrition on yield components of rapeseed
Treatment
Cultivar N1 K1 NK 2 NK 3 N2K, N2 K2 N2K, N2 K4
1. Weight per grain (ag)
Diamant ............... 4.5 4.3 4.2 5.4 4.6 4.7 4.7
Average of new cultivars. 3.8 3.8 3.7 4.5 4.5 4.5 4.3
2. Number of seeds per plant (in 1000)
Diamant ............... 1.5 1.4 1.5 1.8 3.5 3.6 3.6Average of new cultivars. 2.1 2.1 1.8 2.6 3.7 4.1 4.5
Table 3. Effect of N and K nutrition on the percentage oil content of rapeseed (at 90% seed
dry matter)
Treatment
Cultivar N1K N1K2 N1K, N2K N2K2 N2K3 NK 4
Diamant ............... 43.0 42.4 42.8 39.7 40.4 40.4 40.9
Average of new cultivars . 43.0 43.1 42.3 38.6 38.8 40.0 40.1
307
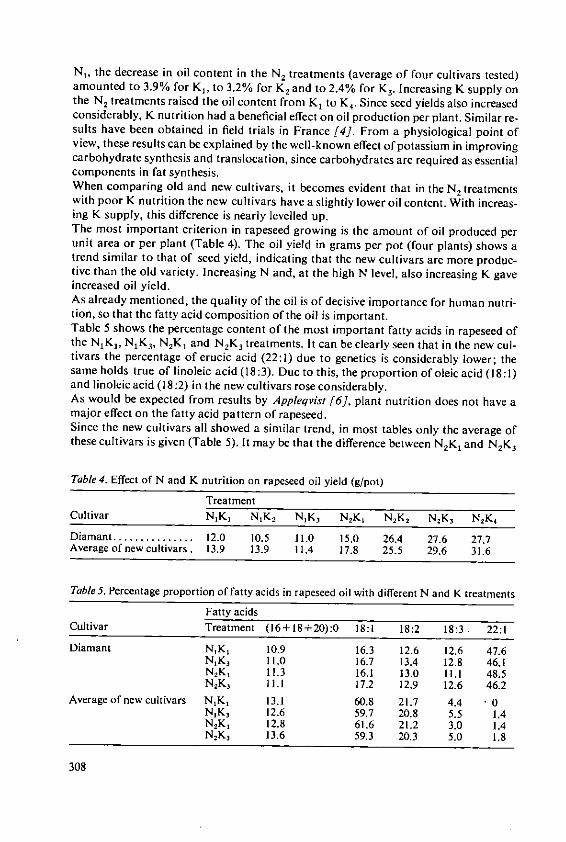
N1, the decrease in oil content in the N2 treatments (average of four cultivars tested)amounted to 3.9% for K,, to 3.2% for K, and to 2.4% for K3. Increasing K supply onthe N, treatments raised the oil content from K1 to K4. Since seed yields also increasedconsiderably, K nutrition had a beneficial effect on oil production per plant. Similar re-sults have been obtained in field trials in France [4]. From a physiological point ofview, these results can be explained by the well-known effect of potassium in improvingcarbohydrate synthesis and translocation, since carbohydrates are required as essentialcomponents in fat synthesis.When comparing old and new cultivars, it becomes evident that in the N2 treatmentswith poor K nutrition the new cultivars have a slightly lower oil content. With increas-ing K supply, this difference is nearly levelled up.The most important criterion in rapeseed growing is the amount of oil produced perunit area or per plant (Table 4). The oil yield in grams per pot (four plants) shows atrend similar to that of seed yield, indicating that the new cultivars are more produc-tive than the old variety. Increasing N and, at the high N level, also increasing K gaveincreased oil yield.As already mentioned, the quality of the oil is of decisive importance for human nutri-tion, so that the fatty acid composition of the oil is important.Table 5 shows the percentage content of the most important fatty acids in rapeseed ofthe N 1K,, N1K3, N2K, and N2K3 treatments. It can be clearly seen that in the new cul-tivars the percentage of erucic acid (22:1) due to genetics is considerably lower; thesame holds true of linoleic acid (18:3). Due to this, the proportion of oleic acid (18:1)and linoleic acid (18:2) in the new cultivars rose considerably.As would be expected from results by Appleqvist [6], plant nutrition does not have amajor effect on the fatty acid pattern of rapeseed.Since the new cultivars all showed a similar trend, in most tables only the average ofthese cultivars is given (Table 5). It may be that the difference between N2 K1 and NK 3
Table 4. Effect of N and K nutrition on rapeseed oil yield (g/pot)
TreatmentCultivar NK, N1K2 N1K3 N2K N2K2 N2K3 NK
Diamant ............... 12.0 10.5 11.0 15.0 26.4 27.6 27.7Average of new cultivars . 13.9 13.9 11.4 17.8 25.5 29.6 31.6
Table 5. Percentage proportion of fatty acids in rapeseed oil with different N and K treatments
Fatty acidsCultivar Treatment (16+18+20):0 18:1 18:2 18:3. 22:1
Diamant NK 1 10.9 16.3 12.6 12.6 47.6NK, 11.0 16.7 13.4 12.8 46.1N2 K, 11.3 16.1 13.0 11.1 48.5N2K3 11.1 17.2 12.9 12.6 46.2
Average of new cultivars N1K1 13.1 60.8 21.7 4.4 0NK, 12.6 59.7 20.8 5.5 1.4N2 K, 12.8 61.6 21.2 3.0 1.4N2K, 13.6 59.3 20.3 5.0 1.8
308
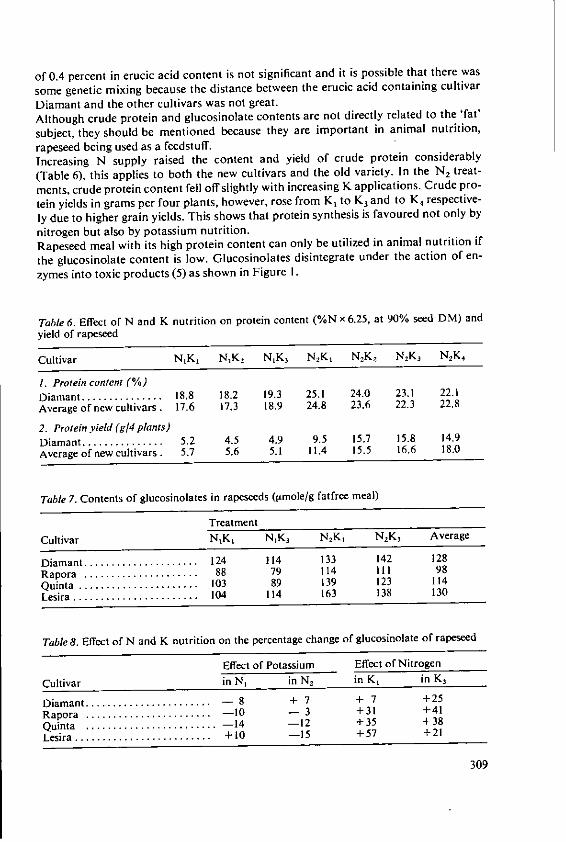
of 0.4 percent in erucic acid content is not significant and it is possible that there was
some genetic mixing because the distance between the erucic acid containing cultivar
Diamant and the other cultivars was not great.Although crude protein and glucosinolate contents are not directly related to the 'fat'
subject, they should be mentioned because they are important in animal nutrition,
rapeseed being used as a feedstuff.Increasing N supply raised the content and yield of crude protein considerably
(Table 6), this applies to both the new cultivars and the old variety. In the N 2 treat-
ments, crude protein content fell off slightly with increasing K applications. Crude pro-
tein yields in grams per four plants, however, rose from K, to K3 and to K4 respective-
ly due to higher grain yields. This shows that protein synthesis is favoured not only by
nitrogen but also by potassium nutrition.Rapeseed meal with its high protein content can only be utilized in animal nutrition if
the glucosinolate content is low. Glucosinolates disintegrate under the action of en-
zymes into toxic products (5) as shown in Figure I.
Table 6. Effect of N and K nutrition on protein content (%N x 6.25, at 90% seed DM) and
yield of rapeseed
Cultivar N,K, NK 2 NK, NK, NK, NK, NK 4
I. Protein content (%)
Diamant ............... 18.8 18.2 19.3 25.1 24.0 23.1 22.1Average of new cultivars. 17.6 17.3 18.9 24.8 23.6 22.3 22.8
2. Protein yield (g/4 plants)
Diamant ............... 5.2 4.5 4.9 9.5 15.7 15.8 14.9
Average of new cultivars. 5.7 5.6 5.1 11.4 15.5 16.6 18.0
Table 7. Contents of glucosinolates in rapeseeds (limole/g fatfree meal)
Treatment
Cultivar N1K, NK, NK, NK, Average
Diamant ..................... 124 114 133 142 128
Rapora ..................... 88 79 114 IH ] 98
Quinta ...................... 103 89 139 123 114
Lesira ....................... 104 114 163 138 130
Table 8. Effect of N and K nutrition on the percentage change of glucosinolate of rapeseed
Effect of Potassium Effect of Nitrogen
Cultivar in N, in N2 in K, in K3
Diamant ....................... - 8 + 7 + 7 +25
Rapora ....................... - 10 - 3 +31 +41
Quinta ........................ - 14 - 12 +35 +38
Lesira ......................... +10 - 15 +57 +21
309
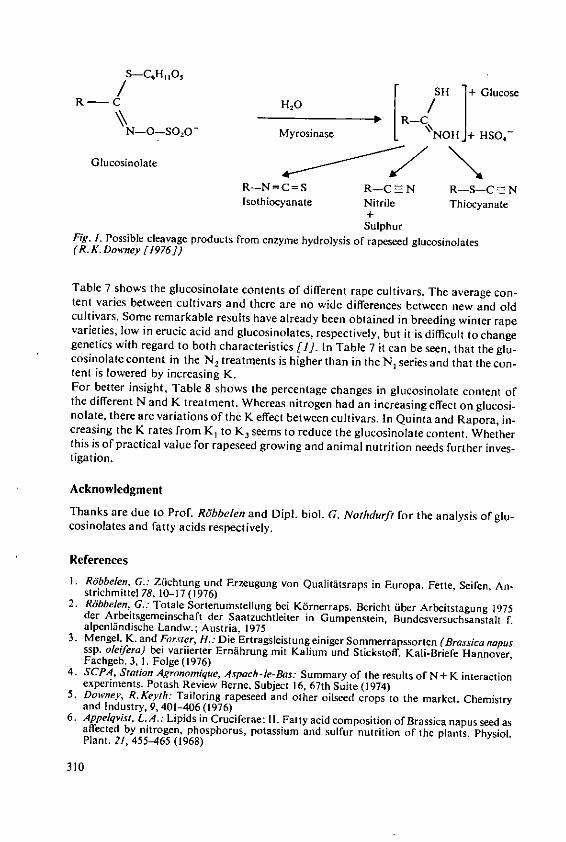
S-C 6 HO 5
RH
+GlucoseN-O-SO,0- Myrosinase -CNoHJ+ HSO,-
Glucosinolate
R-N=C=S R-C=N R-S-CE NIsothiocyanate Nitrile Thiocyanate
+Sulphur
Fig. 1. Possible cleavage products from enzyme hydrolysis of rapeseed glucosinolates(R. K. Downey [1976])
Table 7 shows the glucosinolate contents of different rape cultivars. The average con-tent varies between cultivars and there are no wide differences between new and oldcultivars. Some remarkable results have already been obtained in breeding winter rapevarieties, low in erucic acid and glucosinolates, respectively, but it is difficult to changegenetics with regard to both characteristics [1]. In Table 7 it can be seen, that the glu-cosinolate content in the N2 treatments is higher than in the N, series and that the con-tent is lowered by increasing K.For better insight, Table 8 shows the percentage changes in glucosinolate content ofthe different N and K treatment. Whereas nitrogen had an increasing effect on glucosi-nolate, there are variations of the K effect between cultivars. In Quinta and Rapora, in-creasing the K rates from K1 to K3 seems to reduce the glucosinolate content. Whetherthis is of practical value for rapeseed growing and animal nutrition needs further inves-tigation.
Acknowledgment
Thanks are due to Prof. Rdbbelen and Dipl. biol. G. Nothdurft for the analysis of glu-cosinolates and fatty acids respectively.
References
I. Rdbbelen, G.: Zrichtung und Erzeugung von Qualititsraps in Europa. Fette, Seifen, An-strichmittel 78, 10-17 (1976)
2. Rdbbelen, G.: Totale Sortenumstellung bei K6rnerraps. Bcricht iber Arbeitstagung 1975der Arbeitsgemeinschaft der Saatzuchtleiter in Gumpenstein, Bundesversuchsanstalt f.alpenlndische Landw.; Austria, 1975
3. Mengel, K. and Forster, H.: Die Ertragsleistungeiniger Sommerrapssorten (Brassica napusssp. oleifera) bei variierter Ernfhrung mit Kalium and Stickstoff. Kali-Briefe Hannover,Fachgeb. 3, 1. Folge (1976)
4. SCPA, Station Agronornique, Aspach-le-Bas: Summary of the results of N+ K interactionexperiments. Potash Review Berne, Subject 16, 67th Suite (1974)
5. Downey, R.Keyth: Tailoring rapeseed and other oilseed crops to the market. Chemistryand Industry, 9, 401-406 (1976)
6. Appelqvist, L.A.: Lipids in Cruciferae: II. Fatty acid composition of Brassica napus seed asaffected by nitrogen, phosphorus, potassium and sulfur nutrition of the plants. Physiol.Plant. 21, 455-465 (1968)
310
Relationship between EnvironmentalConditions and Oil Contentin Sunflower and SoyabeanD. Davidescu, I. Criyan, Veliica Davidescu, J. Borza,Agricultural University, Bucharest/Romania*
Summary
Factors, including genetics, climate, soil, cultural conditions and fertilizer treatment, which af-fect yield and oil content of soya and sunflower are discussed. The effects for sunflower areshown in Table I and Figures 1-3. International literature on the effect of fertilizers on thesecrops is briefly reviewed and results from Romanian experiments, which show how yield andfertilizer response varies with soil conditions and weather, are discussed in greater detail (Fig-ures 4-8 for sunflower and Figures 9-14 for soya). Attention is drawn to the inverse correlationbetween oil and protein content of soya (Figure 14).
Annual oil crops occupy about 120 million hectares in the world (7% of the cultivated
area). These include groundnuts, rape, sesame, sunflower, castor oil, cotton, mustard
and soyabean. In Romania, oil crops (sunflower, flax, castor, poppy, mustard and soy-
bean) are grown on 798 700 ha (8.2% of the cultivated area) with 511 100 ha under
sunflower (1976). Yield of these crops is much affected by ecological conditions, varie-
ty, soil conditions and fertilization.
1. Sunflower
Sunflower originates from America (Mexico, Nebraska, Kansas) and is a thermophilic
plant requiring 1800-2500'C days during the growing season. It thrives on soils rich in
organic matter at a pH from 6.0 to 7.5. It is sensitive to acid soils. Although it is
drought resistant, sunflower is susceptible to atmospheric drought during the flowering
and fruiting periods. Excessive moisture favours infection by Peronospora helianthi and
Sclerotinia sclerotioruin. Having a high oil content (39-53%) sunflower cultivation has
been much extended during the past decade and it now covers almost 7% of the world
area under annual oil crops. It is important in the USSR, Romania, France, Bulgaria,
Jugoslavia, USA and Mexico and has recently been adopted in Iran and Morocco. Av-
erage yields recorded range from 610-1540 kg/ha (FAO Yearbook (29) [1976]) which
are low in relation to its biological potential. The yield in Romania averaged
* Prof. Dr. Dc. D. Davidescu, Faculty of Agronomy, 14 Av. N. Drossu, 71336 Bucharest/RomaniaDr. 1. Critan, Conf. Dr. Velicica Davidescu and Dr. J. Borza: same address
311
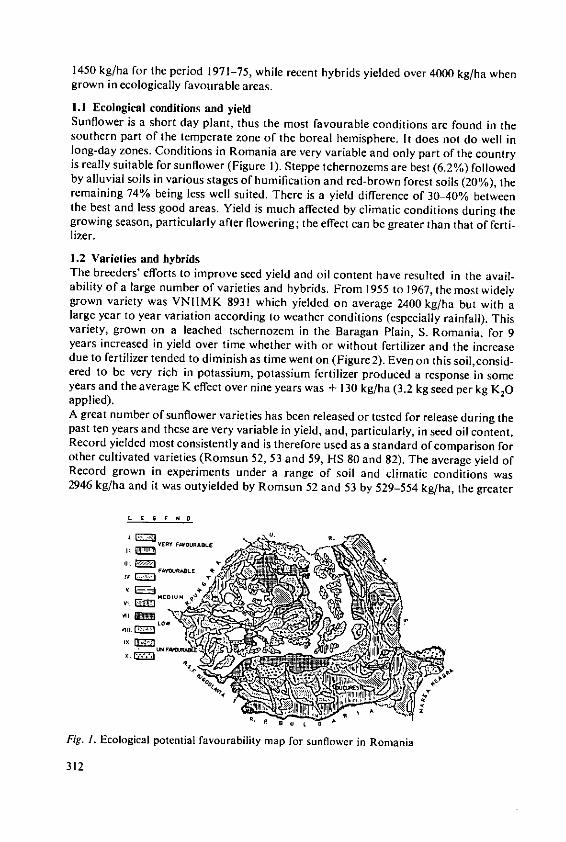
1450 kg/ha for the period 1971-75, while recent hybrids yielded over 4000 kg/ha whengrown in ecologically favourable areas.
1.1 Ecological conditions and yieldSunflower is a short day plant, thus the most favourable conditions are found in thesouthern part of the temperate zone of the boreal hemisphere. It does not do well inlong-day zones. Conditions in Romania are very variable and only part of the countryis really suitable for sunflower (Figure I). Steppe tchernozems are best (6.2%) followedby alluvial soils in various stages of humification and red-brown forest soils (20%), theremaining 74% being less well suited. There is a yield difference of 30-40% betweenthe best and less good areas. Yield is much affected by climatic conditions during thegrowing season, particularly after flowering; the effect can be greater than that of ferti-lizer.
1.2 Varieties and hybridsThe breeders' efforts to improve seed yield and oil content have resulted in the avail-ability of a large number of varieties and hybrids. From 1955 to 1967, the most widelygrown variety was VNIIMK 8931 which yielded on average 2400 kg/ha but with alarge year to year variation according to weather conditions (especially rainfall). Thisvariety, grown on a leached tschernozem in the Baragan Plain, S. Romania, for 9years increased in yield over time whether with or without fertilizer and the increasedue to fertilizer tended to diminish as time went on (Figure 2). Even on this soil,consid-ered to be very rich in potassium, potassium fertilizer produced a response in someyears and the average K effect over nine years was + 130 kg/ha (3.2 kg seed per kg K20applied).A great number of sunflower varieties has been released or tested for release during thepast ten years and these are very variable in yield, and, particularly, in seed oil content.Record yielded most consistently and is therefore used as a standard of comparison forother cultivated varieties (Romsun 52, 53 and 59, HS 80 and 82). The average yield ofRecord grown in experiments under a range of soil and climatic conditions was2946 kg/ha and it was outyielded by Romsun 52 and 53 by 529-554 kg/ha, the greater
L. E $ E N D
VERY FrOURABLE
__ FA OR '
Fig. I. Ecological potential favourability map for sunflower in Romania
312
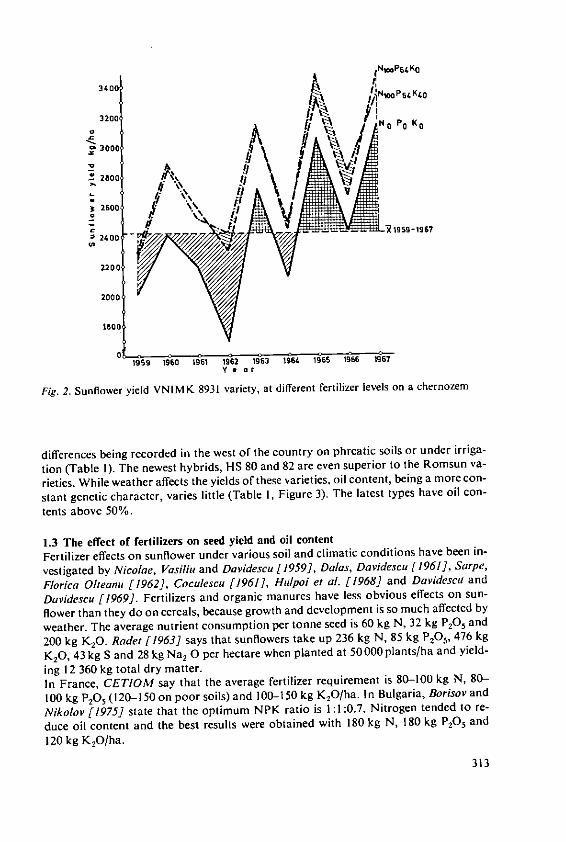
3400 ,NwoP5 4 KOJ,1NOO P 6tK40
3200 No PO K O
S3000
.2800 Ie2600
A/ RiS569-1967
2200
2000
1800
01959 1960 1961 1962 1963 1964 1965 1956 67
N'e or
Fig. 2. Sunflower yield VNIMK 8931 variety, at different fertilizer levels on a chernozem
differences being recorded in the west of the country on phreatic soils or under irriga-
tion (Table I). The newest hybrids, HS 80 and 82 are even superior to the Romsun va-
rieties. While weather affects the yields of these varieties, oil content, being a more con-
stant genetic character, varies little (Table I, Figure 3). The latest types have oil con-
tents above 50%.
1.3 The effect of fertilizers on seed yield and oil contentFertilizer effects on sunflower under various soil and climatic conditions have been in-
vestigated by Nicolae, Vasiliu and Davidesca [1959], Dalas, Davidescu [1961], Sarpe,
Florica Olteanu [1962], Coculescu [1961], Hulpoi et al. [1968] and Davidesca and
Davidescu [1969]. Fertilizers and organic manures have less obvious effects on sun-
flower than they do on cereals, because growth and development is so much affected by
weather. The average nutrient consumption per tonne seed is 60 kg N, 32 kg P2O5 and
200 kg K2O. Radet [1963] says that sunflowers take up 236 kg N, 85 kg P,0 5 , 476 kg
K20, 43 kg S and 28 kg Na2 0 per hectare when planted at 50000 plants/ha and yield-
ing 12 360 kg total dry matter.In France, CETIOM say that the average fertilizer requirement is 80-100 kg N, 80-
100 kg P2O (120-150 on poor soils) and 100-150 kg K 20/ha. In Bulgaria, Borisov and
Nikolor [1975] state that the optimum NPK ratio is 1:1:0.7. Nitrogen tended to re-
duce oil content and the best results were obtained with 180 kg N, 180 kg P2O and
120 kg KO/ha.
313
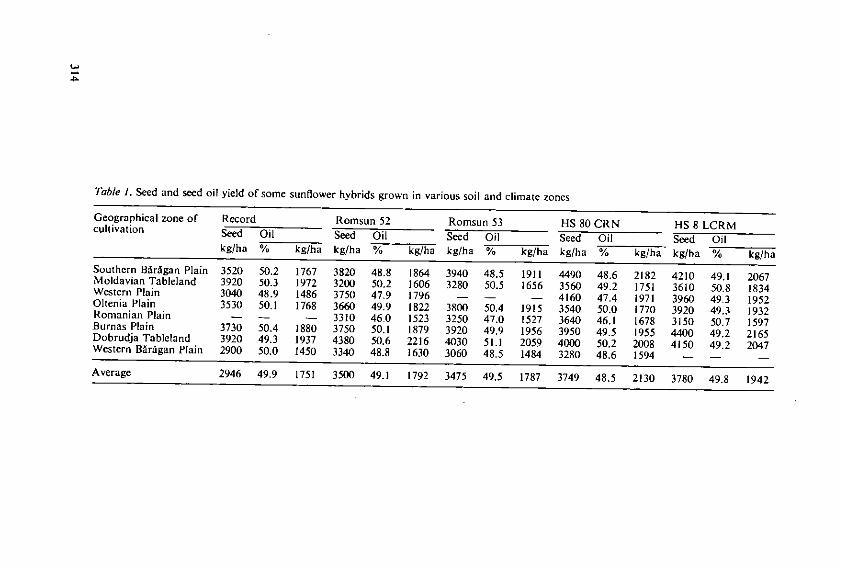
Table 1. Seed and seed oil yield of some sunflower hybrids grown in various soil and climate zones
Geographical zone of Record Romsun 52 Romsun 53 HS 80 CRN HS 8 LCRMcultivation Seed Oil Seed Oil Seed Oil Seed Oil Seed Oilkg/ha % kg/ha kg/ha % kg/ha kg/ha % kg/ha kg/ha % kg/ha kg/ha % kg/ha
Southern Birigan Plain 3520 50.2 1767 3820 48.8 1864 3940 48.5 1911 4490 48.6 2182 4210 49.1 2067Moldavian Tableland 3920 50.3 1972 3200 50.2 1606 3280 50.5 1656 3560 49.2 1751 3610 50.8 1834Western Plain 3040 48.9 1486 3750 47.9 1796 - - - 4160 47.4 1971 3960 49.3 1952Oltenia Plain 3530 50.1 1768 3660 49.9 1822 3800 50.4 1915 3540 50.0 1770 3920 49.3 1932Romanian Plain - - 3310 46.0 1523 3250 47.0 1527 3640 46.1 1678 3150 50.7 1597Burnas Plain 3730 50.4 1880 3750 50.1 1879 3920 49.9 1956 3950 49.5 1955 4400 49.2 2165Dobrudja Tableland 3920 49.3 1937 4380 50.6 2216 4030 51.1 2059 4000 50.2 2008 4150 49.2 2047Western Brdgan Plain 2900 50.0 1450 3340 48.8 1630 3060 48.5 1484 3280 48.6 1594 - - -
Average 2946 49.9 1751 3500 49.1 1792 3475 49.5 1787 3749 48.5 2130 3780 49.8 1942
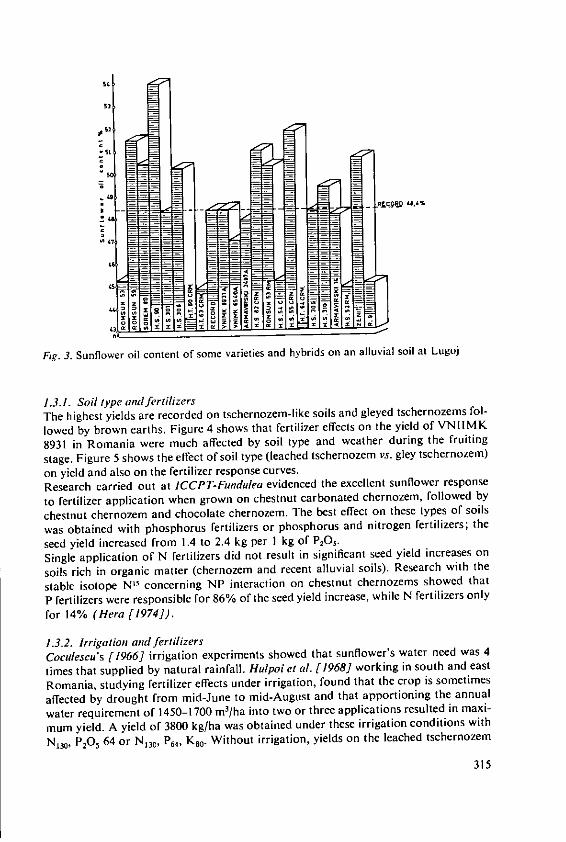
_at
Fig. 3. Sunflower oil content of some varieties and hybrids on an alluvial soil at Lugoj
1.3.1. Soil type and fertilizersThe highest yields are recorded on tschernozem-like soils and gleyed tschernozems fol-
lowed by brown earths. Figure 4 shows that fertilizer effects on the yield of VNIIMK
8931 in Romania were much affected by soil type and weather during the fruiting
stage. Figure 5 shows the effect of soil type (leached tschernozem vs. gley tschernozem)
on yield and also on the fertilizer response curves.Research carried out at ICCPT-Fundulea evidenced the excellent sunflower response
to fertilizer application when grown on chestnut carbonated chernozem, followed by
chestnut chernozem and chocolate chernozem. The best effect on these types of soils
was obtained with phosphorus fertilizers or phosphorus and nitrogen fertilizers; the
seed yield increased from 1.4 to 2.4 kg per I kg of PO,.
Single application of N fertilizers did not result in significant seed yield increases on
soils rich in organic matter (chernozem and recent alluvial soils). Research with the
stable isotope N" concerning NP interaction on chestnut chernozems showed that
P fertilizers were responsible for 86% of the seed yield increase, while N fertilizers only
for 14% (Hera [1974]).
1.3.2. Irrigation and fertilizersCocilescu's [1966] irrigation experiments showed that sunflower's water need was 4
times that supplied by natural rainfall. Hulpoi et af. [1968] working in south and east
Romania, studying fertilizer effects under irrigation, found that the crop is sometimes
affected by drought from mid-June to mid-August and that apportioning the annual
water requirement of 1450-1700 m'/ha into two or three applications resulted in maxi-
mum yield. A yield of 3800 kg/ha was obtained under these irrigation conditions with
Ni,, P205 64 or N130 , P64, K,,. Without irrigation, yields on the leached tschernozem
315
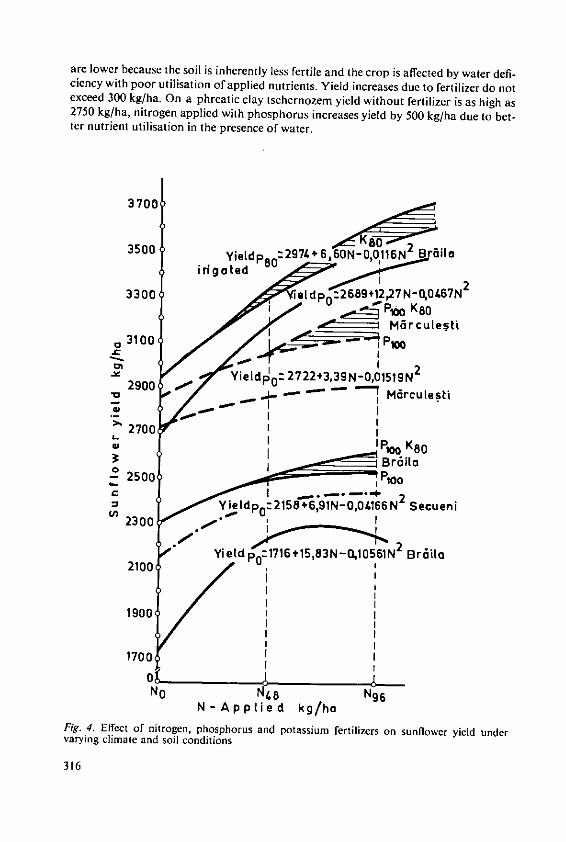
are lower because the soil is inherently less fertile and the crop is affected by water defi-ciency with poor utilisation of applied nutrients. Yield increases due to fertilizer do notexceed 300 kg/ha. On a phreatic clay tschernozem yield without fertilizer is as high as2750 kg/ha, nitrogen applied with phosphorus increases yield by 500 kg/ha due to bet-ter nutrient utilisation in the presence of water.
3700
290035 200 V ied 8
9 7 B I
3300 .Ieldp0 :2689+12,27N-0,047N2
0
I Pl K 80
~3100OO ' - I
6; 250 -. ;m2700.
S Yieldp 0 - 2- 2 ,9BN-O1 SIc
2300 10
N-Apdplied. ".g/ha
2100in 0-at 17 6 15 8 N- ,0 soi 61Nditions
31
0I
1900
No N48 N96N- Applie d kg/ha
Fig. 4. Effect of nitrogen, phosphorus and potassium fertilizers on sunflower yield undervarying climate and soil conditions
316
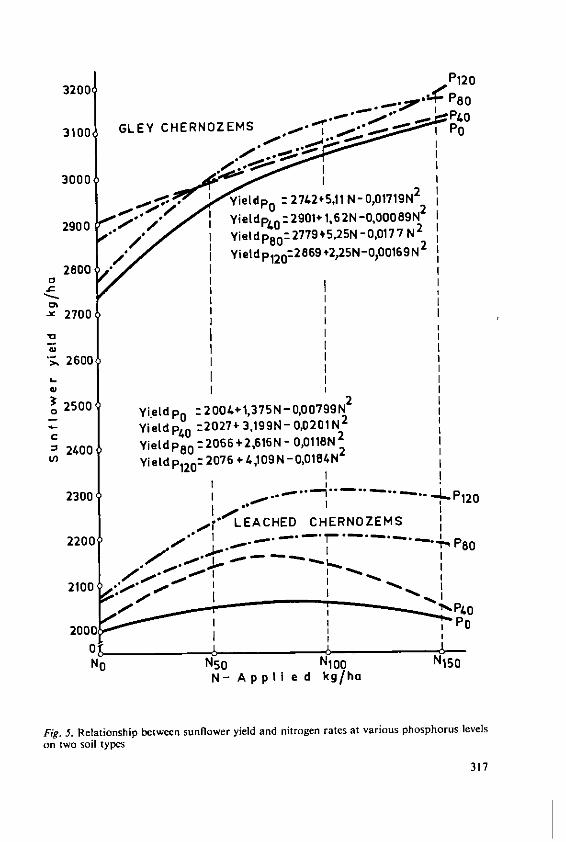
3200
3100 GLEY CHERNOZEMS .,PO
300013000 a' 2742+5,11 N - 0,01719N
2900 Yieodp4 0:2901*1,62N-000089N2
g0 "I YiIdp8 0=2779+5, 25N-0,0 7 7 N2
1 YietdP120;28692,25N -000169N2
2700 1 1
,2600
32500 2 1o Yi.eidpO : 20041,375N-0,00799N
2400 Yietd p4 0 :202743,199N-0,0201N 2
2400 Yieidp 8 0- 2066+2. 6 16N - 00118N 2 I
U, Yietd P12 0 2076- 4,109N -0,0184N 2
2300 I P120
LEACHED CHERNOZEMS
22 0 No0 N/ __,,,.....- .... -' ...... " P80
2100 $ .0. I
2000 PO]
No N50 N100o N150
N- Appli e d kg/ha
Fig. 5. Relationship between sunflower yield and nitrogen rates at various phosphorus levelson two soil types
317
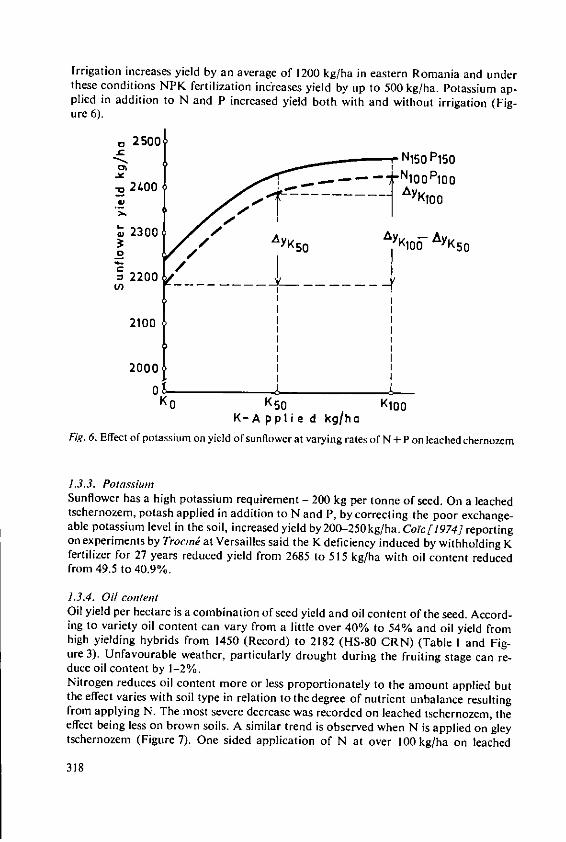
Irrigation increases yield by an average of 1200 kg/ha in eastern Romania and underthese conditions NPK fertilization increases yield by up to 500 kg/ha. Potassium ap-plied in addition to N and P increased yield both with and without irrigation (Fig-ure 6).
o 2500N15 0 P15 0
. 2400 AYK00
30 AYK0 AYK10&_ AYK 5 0
= 2200
2100
2000
Ko K5 0 K10 0K-Applie d kg/ha
Fig. 6. Effect of potassium on yield of sunflower at varying rates of N + P on leached chernozem
1.3.3. PotassiumSunflower has a high potassium requirement - 200 kg per tonne of seed. On a leachedtschernozem, potash applied in addition to N and P, by correcting the poor exchange-able potassium level in the soil, increased yield by 200-250 kg/ha. Corc [1974] reportingon experiments by Troctn at Versailles said the K deficiency induced by withholding Kfertilizer for 27 years reduced yield from 2685 to 515 kg/ha with oil content reducedfrom 49.5 to 40.9%.
1.3.4. Oil contentOil yield per hectare is a combination of seed yield and oil content of the seed. Accord-ing to variety oil content can vary from a little over 40% to 54% and oil yield fromhigh yielding hybrids from 1450 (Record) to 2182 (HS-80 CRN) (Table I and Fig-ure 3). Unfavourable weather, particularly drought during the fruiting stage can re-duce oil content by 1-2%.Nitrogen reduces oil content more or less proportionately to the amount applied butthe effect varies with soil type in relation to the degree of nutrient unbalance resultingfrom applying N. The most severe decrease was recorded on leached tschernozem, theeffect being less on brown soils. A similar trend is observed when N is applied on gleytschernozem (Figure 7). One sided application of N at over 100 kg/ha on leached
318
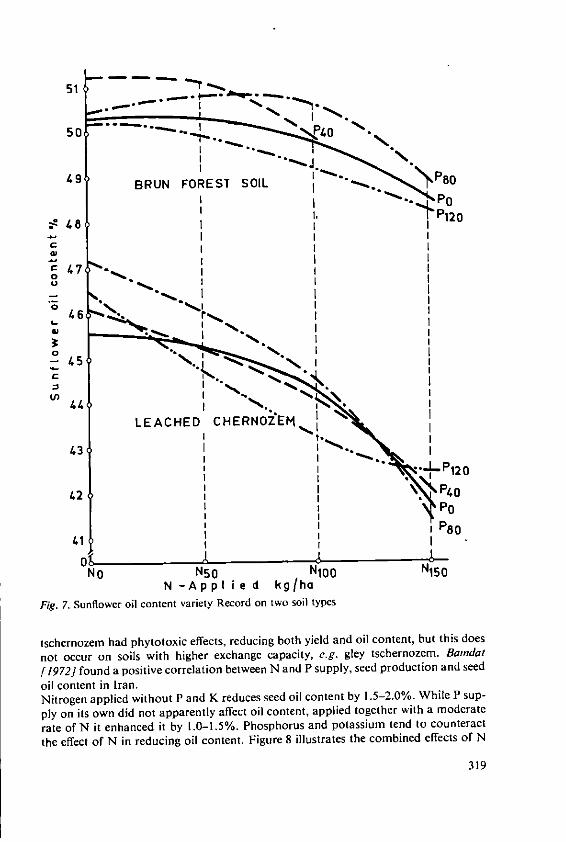
51
49BRUN FOREST SOILP0
I-P120e~ 48
0
30
44
LEACHED CHERNOZ EM 1
43
42 ,P4 PoP80
41 I
01 1ISNo N50 N100 N15 0
N -Applied kg/ha
Fig. 7. Sunflower oil content variety Record on two soil types
tschernozem had phytotoxic effects, reducing both yield and oil content, but this does
not occur on soils with higher exchange capacity, e.g. gley tschernozem. Bamdat
[1972] found a positive correlation between N and P supply, seed production and seed
oil content in Iran.Nitrogen applied without P and K reduces seed oil content by 1.5-2.0%. While P sup-
ply on its own did not apparently affect oil content, applied together with a moderate
rate of N it enhanced it by 1.0-1.5%. Phosphorus and potassium tend to counteract
the effect of N in reducing oil content. Figure 8 illustrates the combined effects of N
319
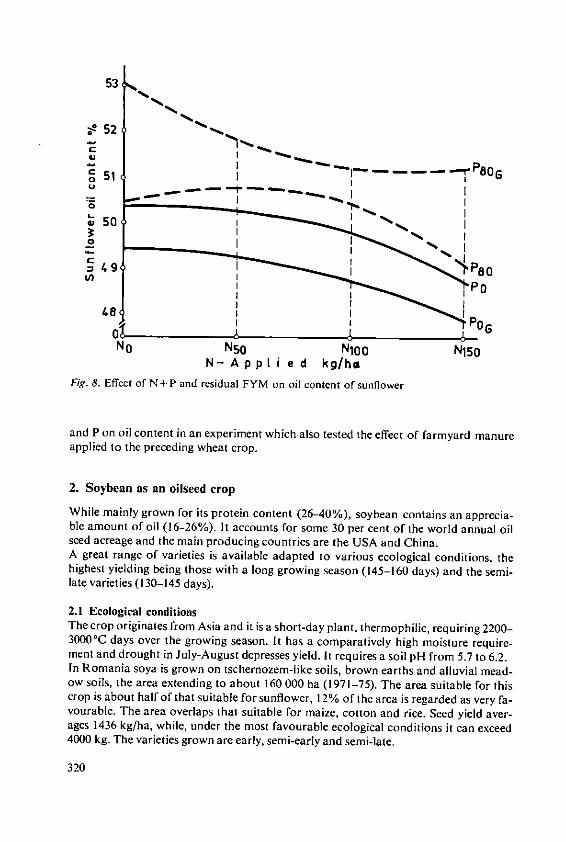
53
~52C 51 IP8o
49 'P80
7Po)
48
0 6
No N50 N100 N150N- AppIi e d kg/hs
Fig. 8. Effect of N + P and residual FYM on oil content of sunflower
and P on oil content in an experiment which also tested the effect of farmyard manureapplied to the preceding wheat crop.
2. Soybean as an oilseed crop
While mainly grown for its protein content (26-40%), soybean contains an apprecia-ble amount of oil (16-26%). It accounts for some 30 per cent of the world annual oilseed acreage and the main producing countries are the USA and China.A great range of varieties is available adapted to various ecological conditions, thehighest yielding being those with a long growing season (145-160 days) and the semi-late varieties (130-145 days).
2.1 Ecological conditionsThe crop originates from Asia and it is a short-day plant, thermophilic, requiring 2200-30000C days over the growing season. It has a comparatively high moisture require-ment and drought in July-August depresses yield. It requires a soil pH from 5.7 to 6.2.In Romania soya is grown on tschernozem-iike soils, brown earths and alluvial mead-ow soils, the area extending to about 160 000 ha (1971-75). The area suitable for thiscrop is about half of that suitable for sunflower, 12% of the area is regarded as very fa-vourable. The area overlaps that suitable for maize, cotton and rice. Seed yield aver-ages 1436 kg/ha, while, under the most favourable ecological conditions it can exceed4000 kg. The varieties grown are early, semi-early and semi-late.
320
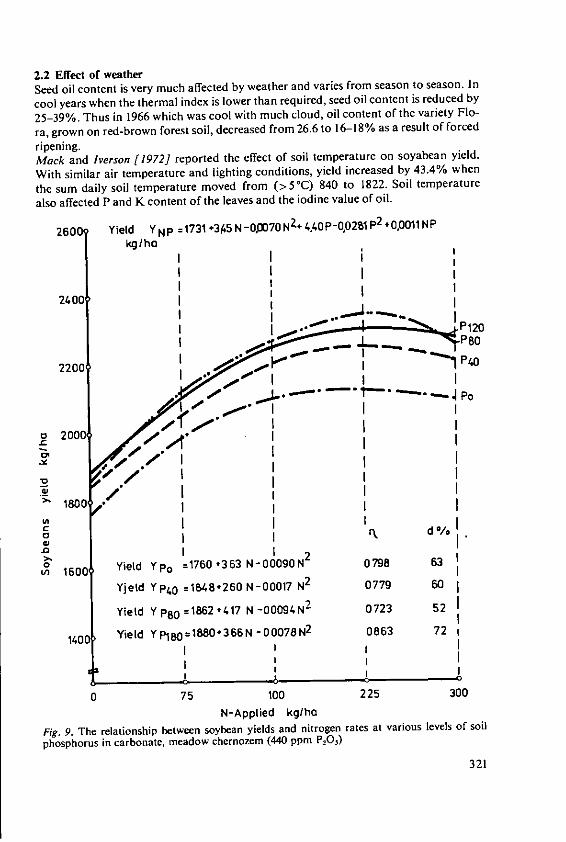
2.2 Effect of weatherSeed oil content is very much affected by weather and varies from season to season. In
cool years when the thermal index is lower than required, seed oil content is reduced by
25-39%. Thus in 1966 which was cool with much cloud, oil content of the variety Flo-
ra, grown on red-brown forest soil, decreased from 26.6 to 16-18% as a result of forced
ripening.Mack and Iverson [1972] reported the effect of soil temperature on soyabean yield.
With similar air temperature and lighting conditions, yield increased by 43.4% when
the sum daily soil temperature moved from (>50 C) 840 to 1822. Soil temperature
also affected P and K content of the leaves and the iodine value of oil.
26009 Yield YNP =1731+345N-O"70 NZ+440P-0,028lP 2 00011NP
kglho
I I
2400 I~P120
2200 P40
'.000 -. . . " " -4 P o
o 2000
2 I I2
.0
160
oYield YPo =1760 +363078 6
ul1600 N000 78 6
Yield YP4 0 =1B48-260 N-00017 N2 0779 60
Yield Y P80 =1862+417 N -00094N 2 0723 52
1400 Yield YP1 r0=1880+366N-00078N2 0863 72
JI I
0 75 100 225 300
N-Applied kglho
Fig. 9. The relationship between soybean yields and nitrogen rates at various levels of soil
phosphorus in carbonate, meadow chernozem (440 ppm PO,)
321
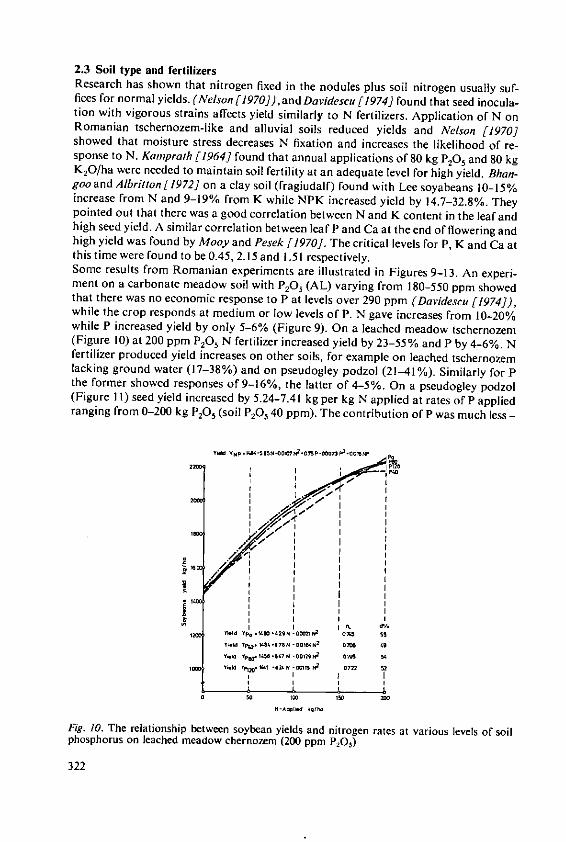
2.3 Soil type and fertilizersResearch has shown that nitrogen fixed in the nodules plus soil nitrogen usually suf-fices for normal yields. (Nelson [1970]), and Davidescu [1974] found that seed inocula-tion with vigorous strains affects yield similarly to N fertilizers. Application of N onRomanian tschernozem-like and alluvial soils reduced yields and Nelson [1970]showed that moisture stress decreases N fixation and increases the likelihood of re-sponse to N. Kamprath [1964] found that annual applications of 80 kg P2O5 and 80 kgK 20/ha were needed to maintain soil fertility at an adequate level for high yield. Bhan-goo and Albritton [1972] on a clay soil (fragiudalf) found with Lee soyabeans 10-15%increase from N and 9-19% from K while NPK increased yield by 14.7-32.8%. Theypointed out that there was a good correlation between N and K content in the leaf andhigh seed yield. A similar correlation between leaf P and Ca at the end of flowering andhigh yield was found by Mooy and Pesek [1970]. The critical levels for P, K and Ca atthis time were found to be 0.45, 2.15 and 1.51 respectively.Some results from Romanian experiments are illustrated in Figures 9-13. An experi-ment on a carbonate meadow soil with P205 (AL) varying from 180-550 ppm showedthat there was no economic response to P at levels over 290 ppm (Davidescu [1974]),while the crop responds at medium or low levels of P. N gave increases from 10-20%while P increased yield by only 5-6% (Figure 9). On a leached meadow tschernozem(Figure 10) at 200 ppm P2O5 N fertilizer increased yield by 23-55% and P by 4-6%. Nfertilizer produced yield increases on other soils, for example on leached tschernozemlacking ground water (17-38%) and on pseudogley podzol (21-41%). Similarly for Pthe former showed responses of 9-16%, the latter of 4-5%. On a pseudogley podzol(Figure 11) seed yield increased by 5.24-7.41 kg per kg N applied at rates of P appliedranging from 0-200 kg P20 (soil P20 5 40 ppm). The contribution of P was much less -
.hdY, . ... . .2g *45.. 2 45M 55
51.0 Y~.'$4G28 0 1N 054$ 4922
I I
Fig. 10. The relationship between soybean yields and nitrogen rates at various levels of soilphosphorus on leached meadow chernozem (200 ppm PO,)
322
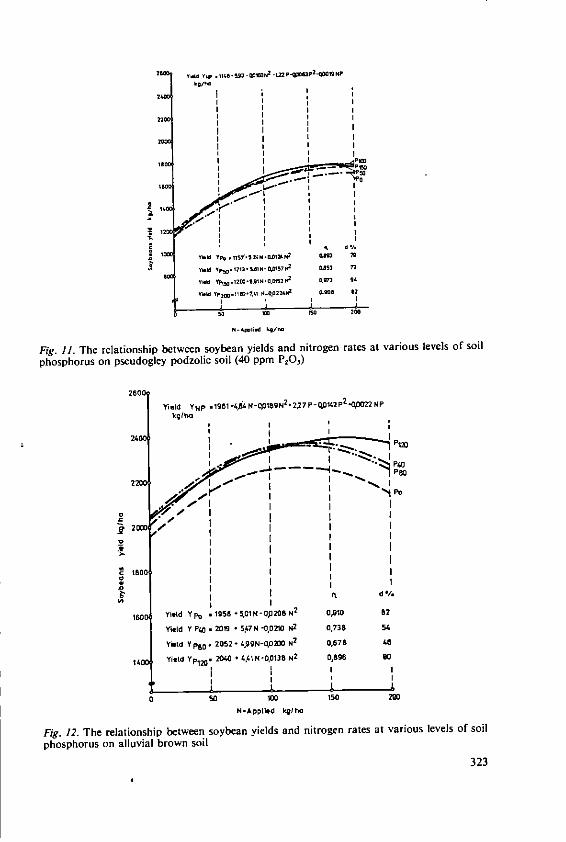
,2 II I I
III
Fig.r5.1 . ps0 . I lds aN ni0ne57N C vro3 72
I P,
Fig. 11. The relationship between soybean yields and nitrogen rates at various levels of' soil
phosphorus on pseudogley podzolic soil (40 ppm P 2 0)
2600
Yield YNP *19 1 4 AN' 0 P1 N 2 27P00% 2p2
.4'0 22N P
kglho
I
1800
10 YIeld Y po 1958 *5,01 N' 0P206 N2
0,910 82
Yield Y P40 , 2019 * 5F7N 0,020 N2
0,738 54
YOd Y pSO , 2052 4,99N-'L020 N2
0,678 45
14M ietd Yp 1M0, 2040 44 41 N-0,0138 N
2 0,896 GO
I II
00 SOOM 150 m1
N-Applied Ikql ha
Fig. 12. The relationship between soybean yields and nitrogen rates at various levels of soilphosphorus on alluvial brown soil
323
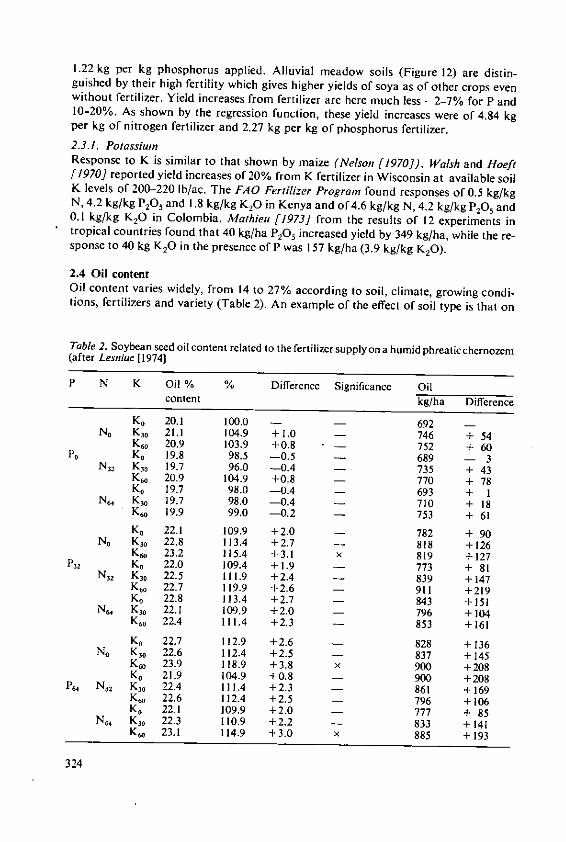
1.22 kg per kg phosphorus applied. Alluvial meadow soils (Figure 12) are distin-guished by their high fertility which gives higher yields of soya as of other crops evenwithout fertilizer. Yield increases from fertilizer are here much less - 2-7% for P and10-20%. As shown by the regression function, these yield increases were of 4.84 kgper kg of nitrogen fertilizer and 2.27 kg per kg of phosphorus fertilizer.
2.3.1. PotassiumnResponse to K is similar to that shown by maize (Nelson [1970]). Walsh and Hoeft[1970] reported yield increases of 20% from K fertilizer in Wisconsin at available soilK levels of 200-220 lb/ac. The FAO Fertilizer Program found responses of 0.5 kg/kgN, 4.2 kg/kg P205 and 1.8 kg/kg K20 in Kenya and of 4.6 kg/kg N, 4.2 kg/kg P20, and0.1 kg/kg KO in Colombia. Mathieu [1973] from the results of 12 experiments intropical countries found that 40 kg/ha P205 increased yield by 349 kg/ha, while the re-sponse to 40 kg KO in the presence of P was 157 kg/ha (3.9 kg/kg K20).
2.4 Oil contentOil content varies widely, from 14 to 27% according to soil, climate, growing condi-tions, fertilizers and variety (Table 2). An example of the effect of soil type is that on
Table 2. Soybean seed oil content related to the fertilizer supply on a humid phreaticchernozem(after Lesniuc [1974)
P N K Oil % % Difference Significance Oilcontent kg/ha Difference
K, 20.1 100.0 - - 692 -No K,, 21.1 104.9 +1.0 - 746 + 54
K6, 20.9 103.9 +0.8 - 752 + 60P, K, 19.8 98.5 -0.5 - 689 - 3N,, K, 19.7 96.0 -0.4 - 735 + 43
K, 20.9 104.9 +0.8 - 770 + 78K, 19.7 98.0 -0.4 - 693 + I
N 64 K,, 19.7 98.0 -0.4 - 710 + 18K6,, 19.9 99.0 -0.2 - 753 + 61K, 22.1 109.9 +2.0 - 782 + 90
N, K, 22.8 113.4 +2.7 - 818 +126K, 23.2 115.4 +3.1 X 819 +127P31 Ko 22.0 109.4 +1.9 - 773 + 81
N, K, 22.5 111.9 +2.4 - 839 + 147K,, 22.7 119.9 +2.6 - 911 +219K, 22.8 113.4 +2.7 - 843 +151N, K, 22.1 109.9 +2.0 - 796 +104K, 22.4 111.4 +2.3 - 853 + 161
K, 22.7 112.9 +2.6 - 828 +136N, K3, 22.6 112.4 +2.5 - 837 +145K6, 23.9 118.9 +3.8 × 900 +208K, 21.9 104.9 +0.8 - 900 +208P" N 2 K o 22.4 111.4 +2.3 - 861 +169K, 22.6 112.4 +2.5 - 796 +106K, 22.1 109.9 +2.0 - 777 + 85
N,4 K3, 22.3 110.9 +2.2 - 833 +141Kwo 23.1 114.9 +3.0 × 885 +193
324
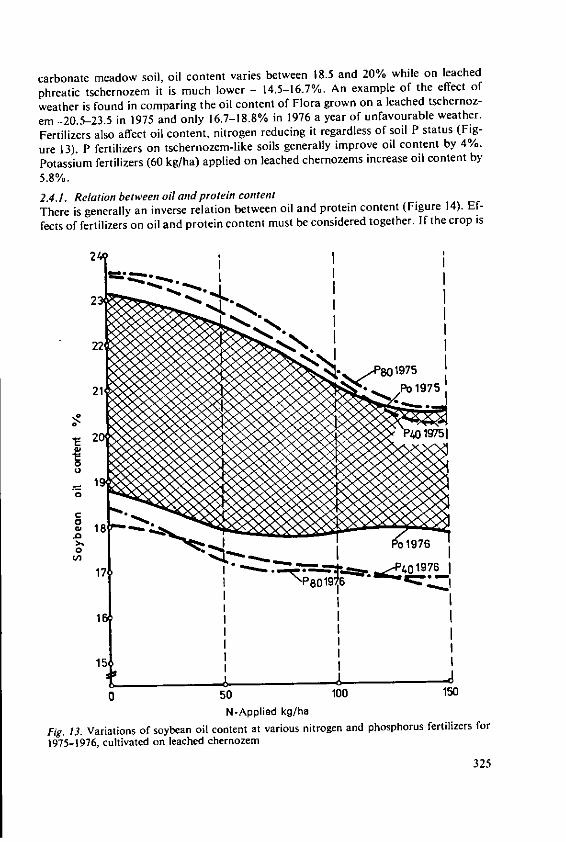
carbonate meadow soil, oil content varies between 18.5 and 20% while on leached
phreatic tschernozem it is much lower - 14.5-16.7%. An example of the effect of
weather is found in comparing the oil content of Flora grown on a leached tschernoz-
em -20.5-23.5 in 1975 and only 16.7-18.8% in 1976 a year of unfavourable weather.
Fertilizers also affect oil content, nitrogen reducing it regardless of soil P status (Fig-
ure 13). P fertilizers on tschernozem-like soils generally improve oil content by 4%.
Potassium fertilizers (60 kg/ha) applied on leached chernozems increase oil content by
5.8%.
2.4.1. Relation between oil and protein contentThere is generally an inverse relation between oil and protein content (Figure 14). Ef-
fects of fertilizers on oil and protein content must be considered together. If the crop is
2
2
22
21 1975
2D] P40 19751
C
0 5101
17 lvtonecdhno7e
325
050 100 150
N-Applied kg/ha
Fig. 13. Variations of soybean oil content at various nitrogen and phosphorus fertilizers for
1975-1976, cultivated on leached ehernozem
325
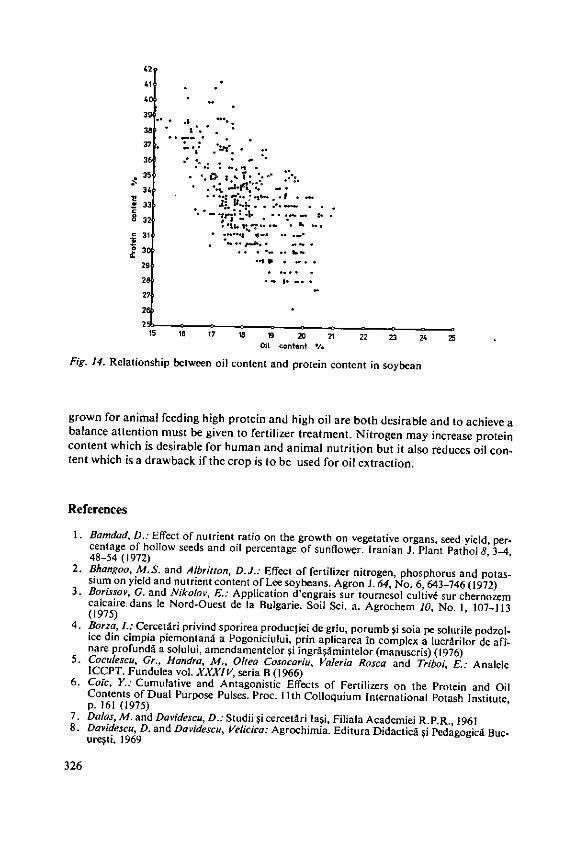
42
41
4C
39
3537.
32
31.
3 *.: -.-.
±30
33:-..5-
# 5 1 * *
29 -.
26
OR .,., o
IS 1 '7 IC 1 20 21 22 23 24OIL content V.
Fig. 14. Relationship between oil content and protein content in soybean
grown for animal feeding high protein and high oil are both desirable and to achieve abalance attention must be given to fertilizer treatment. Nitrogen may increase proteincontent which is desirable for human and animal nutrition but it also reduces oil con-tent which is a drawback if the crop is to be used for oil extraction.
References
I. Bamdad, D.: Effect of nutrient ratio on the growth on vegetative organs, seed yield, per-centage of hollow seeds and oil percentage of sunflower. Iranian J. Plant Pathol 8, 3-4,48-54 (1972)
2. Bhangoo, M.S. and A/britton, D.J.: Effect of fertilizer nitrogen, phosphorus and potas-sium on yield and nutrient content of Lee soybeans. Agron J. 64, No. 6, 643-746 (1972)3. Borissov, G. and Nikolov, E.: Application d'engrais sur tournesol cultivd sur chernozemcalcaire dans le Nord-Ouest de Ia Bulgarie. Soil Sci. a. Agrochem 10, No. 1, 107-113(1975)
4. Borza, I.: Cercetdri privind sporirea producliei de griu, porumb $i soia pe solurile podzol-ice din cimpia piemontanA a Pogoniciului, prin aplicarea in complex a lucrArilor de afi-nare profundA a solului, amendamentelor i ingrAilmintelor (manuscris) (1976)5. Coculescu, Gr., Handra, M., Otea Cosocariu, Valeria Rosca and Triboi, E.: Analele
ICCPT. Fundulca vol. XXXIV, scria B (1966)6. Coic, Y.: Cumulative and Antagonistic Effects of Fertilizers on the Protein and OilContents of Dual Purpose Pulses. Proc. I I th Colloquium International Potash Institute,p. 161 (1975)
7. Dalas, M. and Davidescu, D.: Studii i cercetAri la i, Filiala Academiei R.P.R., 19618. Davidescu, D. and Davidescu, Velicica: Agrochimia. Editura Didactic. $i Pedagogica Buc-ure~ti, 1969
326
9. Davidescu, D., Davidescu, Velicica and Crifan, I.: The role of fertilizers in Soybean culti-
vation. Fertilizer use and protein production. Proc. 1 th Colloquium International Po-tash Institute p.20 3 (1975)
10. Dimancea, St.: Lucrari §tiinlifice IANB seria A vol. XIII (1974)1I. Hanway, J.J. and Weber, C. R.: N, P, and K percentages in soybean (Glycine max (L)
Merrill) plant parts. Agron. J. 63, No. 2, 286-290 (1971)12. Hera, Cr. et al.: Effects of cultivation and fertilizers application on the growth of soybeans
in Romania. International biological program Edinburgh, 197313. Hera, Cr. et al.: Analele ICCPT. Fundulea seria B, p. 309-314 (1972)14. Hera, Cr.: Experimental results concerning the fertilizer application on sunflower in
Romania. Proceedings of the Sixth International Sunflower Conference, Bucharest (1974)15. Hulpoi, N., Negoomireanu, V., Vasiliu, M., Stefan, Gh., Patarscoiu, C., Stratula, V., Coifan,
M. and Cimponeru, N.: Analele ICCPT Fundulea vol. XXXIVseria B (1968)
16. Lesniuc, O.:Cercet~ri privind influenla erbicidelor i a ingrA Amintelor [a soia pe cernozio-mul freatic umed din Cimpia RomAnA. Ph. D. thesis IANB, 1974
17. Kamprath, E.J.: Optimum soil fertility levels for soybeans and corn. Plant Food Rev. 10,No. 3, 4-6 (N.C. St.Coll.Raleigh) (1964)
18. Mooy de, C.J. and Pesek, J.: Differential effects of P, K, and Ca salts on leaf composition,yield and seed size of soybean lines. Crop Sci. 10, No. 1, 72 (1970)
19. Mack, A. R. and Jvarson, K. C.: Yield of soybeans and oil quality in relation to soil tem-perature and moisture in a field environment. Can. J. Soil Sci. 52, No. 2, 225-235 (1972)
20. Marinov, M.: Action des engrais sur les rendements et la qualit6 du soja sur sols alluviauxde prairies dans la region du Danube. Soil Sci. a Agrochem. 7, No. 5, 53-60 (1972)
21. Mathieu, M.: La r~ponse A ]a fumure potassique dans le Programme Engrais de la FAOen Afrique 1961-1972. Potassium in Tropical Crops and Soils. Proc. 10th ColloquiumInternational Potash Institute, Abidjan, p. 399 (1973)
22. Nelson, W. L.: Fertilization of soybeans, Potash Institute of North America, West Lafay-ette, Indiana (USA). Proc. 9th Congress of the International Potash Institute, Antibes,p. 161-171 (1970)
23. Nicolae, V.: Eficienta ingrtiA5mintelor chimice la soia cu privire ]a produclia de boabe,proteind, ulei Ph. D. thesis, 1975
24. Nicolae, V., Vasiliu, A. and Davidesct, D.: Analele [CAR vol. XXVI, Bucureti, Editura
Academiei RPR (1975)25. Pirjol, Liana, Milica, C. and Vrinceanu, V.: Analele ICCPT Fundulea vol. XXXVII, Seria
C (1969)26. Sarpe, N. and Florica Olteanu: Analele ICCPT Fundulea vol. XXX, Seria B (1962)27. Teaci, D.: Bonitarea terenuriloragricole. Editura Ceres, Buc., 197028. Vrinceanu, V., Voinea, S. and Stoenescu, F.: Analele ICCPT Fundulea vol. 1 XXXIV,
Seria C (1967)29. Vrinceanu, V., Voinea, S., Vulpe and Roske, C.: Analele ICCPT Fundulea 1967. XXXIII,
Seria C (1965)30. Vrinceanu, V., Stoenescu, F., Rusanovschi, V., llicevici, S., Negut, L and Siclovan, V.: An-
alele ICCPT Fundulea vol. XXXIX, Seria C (1973)31. Vrinceanu, V. and Stoenescu, F..: Analele ICCPT Fundulea vol. XXXIX, Seria C ( 973)
32. Vrinceanu, V. and Stoenescu, Ff.: Analele ICCPT Fundulea vol. XXXVI1, Seria C (1969)
33. Walsh, L.M. and Hoeft, R. G.: Will fertilizer boost soybean yields. Better crops with plantfood, No. 3 (1970)
34. Anonymous: FAO fertilizer programme 1962-1979, the first decade, November 197435. Anonymous: Documentation technique des Potasses d'Alsace, Mulhouse/France
327
The Responseof Soyabean to Potassium Fertilizer
H. Chevalier, Agricultural Experiment Station, Aspach-le-Bas/France*
The effects of increasing rates of potassium on growth, yield and nutrient absorption
by the early maturing soyabean cultivar 'Altona' was studied in an experiment in 1975.
The production of dry matter was studied in successional harvests.
Design
The three potash levels - 0, 100 and 200 kg K 20/ha were applied to main plots
replicated four tims in a randomised block design. Main plots were divided into
8 sub-plots for successive harvests to determine dry matter yield of the above ground
portions of the plants.A basal dressing of 100 kg P2 0/ha as triple superphosphate plus 30 kg N/ha as
nitrochalk was applied with the potash in the final stages of seedbed preparation.
Inoculated seed was sown at 35 plants per m2.
Soil analysis before treatment is detailed in Table 1. Soil K content was low.
Table I Physico-cheinical analysis of soils
Physical analysis, 0/. Chemical analysis, 0/o
Coarse sand .................. 11.25 P20, citric acid ................ 0.19Fine sand .................... 120.00 PO Joret method ............. 0.10Very fine sand ................ 303.30 CaO exchangeable ............. 2.31Loam ........................ 335.25 K 20 exchangeable ............. 0.07
Clay ........................ 212.00 M gO exchangeable ............ 0.21Organic matter ............... 20.50 Na20 exchangeable ............ 0.03pH water .................... 5.4pH K CI ...................... 4.4
Growth pattern and production of dry matter
Plant height and dry matter production at various stages (Tables 2 and 3; Figure 1)
indicate rapid growth in the first 90 days ending with grain formation. In this growth
* H. Chevalier, Agricultural Experiment Station, F-68000 Aspach-le-Bas/France
329
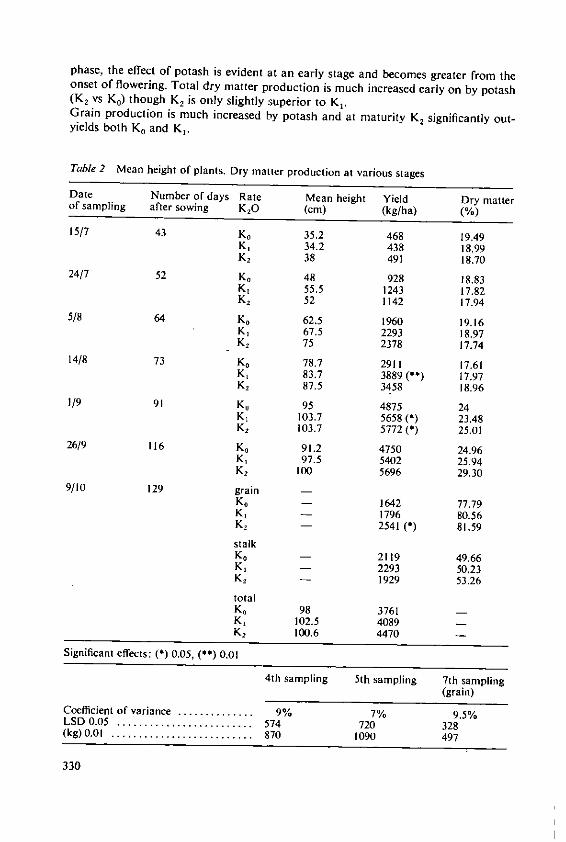
phase, the effect of potash is evident at an early stage and becomes greater from theonset of flowering. Total dry matter production is much increased early on by potash(K, vs K,) though K, is only slightly superior to K,.Grain production is much increased by potash and at maturity K, significantly out-yields both K0 and K,
Table 2 Mean height of plants. Dry matter production at various stages
Date Number of days Rate Mean height Yield Dry matterof sampling after sowing KO (cm) (kg/ha) (%)
15/7 43 Ko 35.2 468 19.49K. 34.2 438 18,99K2 38 491 18.70
24/7 52 Ko 48 928 18.83K, 55.5 1243 17.82K, 52 1142 17.94
5/8 64 K, 62.5 1960 19.16K, 67.5 2293 18.97K, 75 2378 17.74
14/8 73 K, 78.7 2911 17.61KL 83.7 3889 (**) 17.97K, 87.5 3458 18.96
1/9 91 K, 95 4875 24K, 103.7 5658 (*) 23.48K, 103.7 5772 () 25.01
26/9 116 K, 91.2 4750 24.96K, 97.5 5402 25.94K2 100 5696 29.30
9/10 129 grain -K, - 1642 77.79K, - 1796 80.56K, - 2541 () 81.59
stalkK0 - 2119 49.66K, - 2293 50.23K2 - 1929 53.26
totalK, 98 3761 -K, 102.5 4089 -Kz 100.6 4470 -
Significant effects: () 0.05, (*) 0.01
4th sampling 5th sampling 7th sampling(grain)
Coefficient of variance .............. 9% 7% 9.5%LSD 0.05 ......................... 574 720 328(kg) 0.01 .......................... 870 1090 497
330
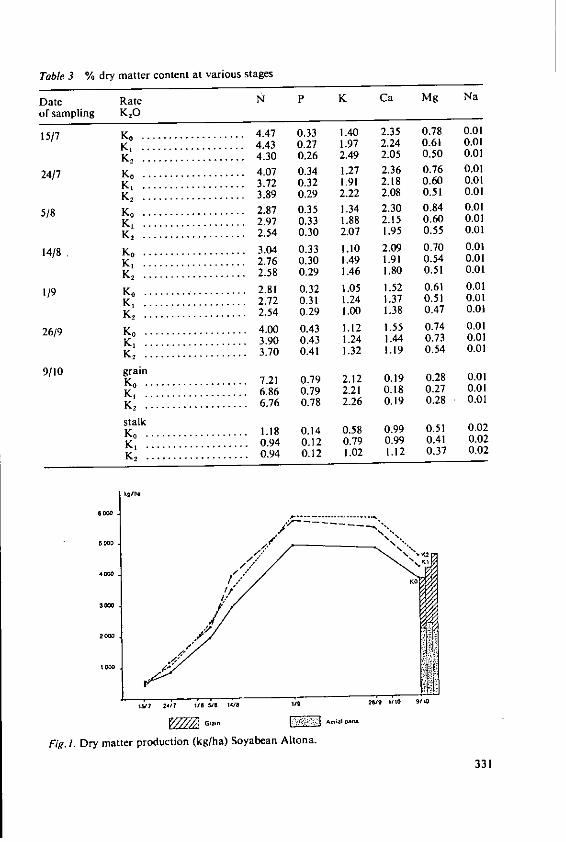
Table 3 % dry matter content at various stages
Date Rate N P K Ca Mg Naof sampling K20
15/7 Ko . ................. 4.47 0.33 1.40 2.35 0.78 0.01K . .................. 4.43 0.21 1.97 2.24 0.61 0.01K 2 ................... 4.30 0.26 2.49 2.05 0.50 0.01
24/7 Ko ................... 4.07 0.34 1.27 2.36 0.76 0.01K . .................. 3.72 0.32 1.91 2.18 0.60 0.01K 2 ................... 3.89 0.29 2.22 2.08 0.51 0.01
5/8 Ko ................... 2.87 0.35 1.34 2.30 0.84 0.01K . .................. 2.97 0.33 1.88 2.15 0.60 0.01K2 ................... 2.54 0.30 2.07 1.95 0.55 0.01
14/8 Ko ................... 3.04 0.33 1.10 2.09 0.70 0.01K, .................. 2.76 0.30 1.49 1.91 0.54 0.01K..................2.58 0.29 1.46 1.80 0.51 0.01
1/9 Ko ................... 2.81 0.32 1.05 1.52 0.61 0.01K . .................. 2.72 0.31 1.24 1.37 0.51 0.01K...................2.54 0.29 1.00 1.38 0.47 0.01
26/9 Ko ................... 4.00 0.43 1.12 1.55 0.74 0.01K . ................. 3.90 0.43 1.24 1.44 0.73 0.01Kz ................... 3.70 0.41 1.32 1.19 0.54 0.01
9/10 grainK. ................... 7.21 0.79 2.12 0.19 0.28 0.01K.....................6.86 0.79 2.21 0.18 0.27 0.01K. ................... 6.76 0.78 2.26 0.19 0.28 0.01
stalkKo ................... 1.18 0.14 0.58 0.99 0.51 0.02K, .................. 0.94 0.12 0.79 0.99 0.41 0.02
K2 ................... 0.94 0.12 1.02 1.12 0.37 0.02
6000. Ow .... .- ...........
4M4
2000
Fig.). Dry matter production (kg/ha) Soyabean Altona.
331
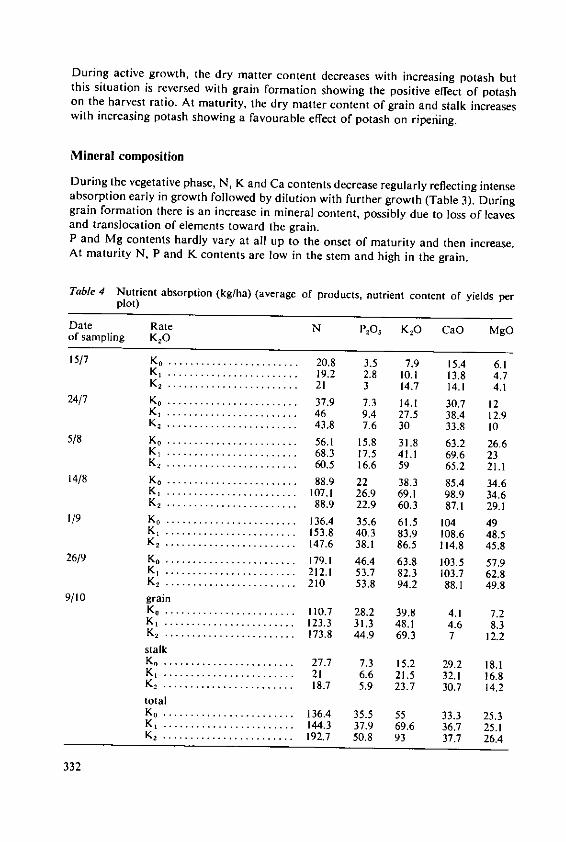
During active growth, the dry matter content decreases with increasing potash butthis situation is reversed with grain formation showing the positive effect of potashon the harvest ratio. At maturity, the dry matter content of grain and stalk increaseswith increasing potash showing a favourable effect of potash on ripening.
Mineral composition
During the vegetative phase, N, K and Ca contents decrease regularly reflecting intenseabsorption early in growth followed by dilution with further growth (Table 3). Duringgrain formation there is an increase in mineral content, possibly due to loss of leavesand translocation of elements toward the grain.P and Mg contents hardly vary at all up to the onset of maturity and then increase.At maturity N, P and K contents are low in the stem and high in the grain.
Table 4 Nutrient absorption (kg/ha) (average of products, nutrient content of yields perplot)
Date Rate N PO 5 K2O CaO MgOof sampling KO
15/7 K. ........................ 20.8 3.5 7.9 15.4 6.1K ........................ 19.2 2.8 10.1 13.8 4.7K ........................ 21 3 14.7 14.1 4.1
24/7 K0 ........................ 37.9 7.3 14.1 30.7 12K ........................ 46 9.4 27.5 38.4 12.9K ........................ 43.8 7.6 30 33.8 10
5/8 Ko ........................ 56.1 15.8 31.8 63.2 26.6K ........................ 68.3 17.5 41.1 69.6 23K . .................... ... 60.5 16.6 59 65.2 21.1
14/8 K. ........................ 88.9 22 38.3 85.4 34.6K ........................ 107.1 26.9 69.1 98.9 34.6K 2 ........................ 88.9 22.9 60.3 87.1 29.1
1/9 Ko ........................ 136.4 35.6 61.5 104 49K* . ........................ 153.8 40.3 83.9 108.6 48.5K . ........................ 147.6 38.1 86.5 114.8 45.8
26/9 K. ........................ 179.1 46.4 63.8 103.5 57.9K . ........................ 212.1 53.7 82.3 103.7 62.8K . ........................ 210 53.8 94.2 88.1 49.8
9/10 grainK . ........................ 110.7 28.2 39.8 4.1 7.2K* . ........................ 123.3 31.3 48.1 4.6 8.3K2 ........................ 173.8 44.9 69.3 7 12.2stalkK ........................ 27.7 7.3 15.2 29.2 18.1K . ....................... 21 6.6 21.5 32.1 16.8K . ....................... 18.7 5.9 23.7 30.7 14.2totalKo ........................ 136.4 35.5 55 33.3 25.3K, ........................ 144.3 37.9 69.6 36.7 25.1K. ........................ 192.7 50.8 93 37.7 26.4
332
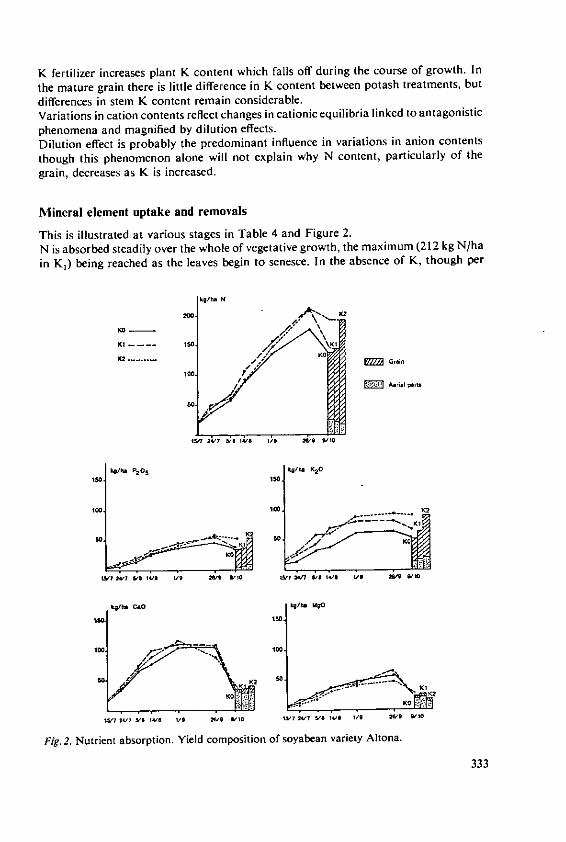
K fertilizer increases plant K content which falls off during the course of growth. In
the mature grain there is little difference in K content between potash treatments, but
differences in stem K content remain considerable.Variations in cation contents reflect changes in cationic equilibria linked to antagonisticphenomena and magnified by dilution effects.Dilution effect is probably the predominant influence in variations in anion contents
though this phenomenon alone will not explain why N content, particularly of the
grain, decreases as K is increased.
Mineral element uptake and removals
This is illustrated at various stages in Table 4 and Figure 2.N is absorbed steadily over the whole of vegetative growth, the maximum (212 kg N/ha
in K,) being reached as the leaves begin to senesce. In the absence of K, though per
kg/Sn N
100
1(0- 4'.
1 .2v &llIn . \0 1
KI-- S0.
K.
INI
100 2.
150 "0 M'O
1W 1W 7
Fig.2. Nutrient absorption. Yield composition of soyabean variety Altona.
333
cent N content is higher, total absorption is much less than when K is applied. Thisdifference is particularly marked in the grain: 110.7 kg/ha N in K. and 173.8 kg in K 2.P20 5 absorption closely follows that of N, the maximum being reached at the samestage (53.8 kg/ha P20, in K,). On the average, 83% of the plant's P content is foundin the grain. Maximum removal by grain is 44.9 kg/ha P205 .Most of the K is taken up in the early stages of development. In K, and K, maximumabsorption is reached at 50% grain formation (83.9 kg/ha K2O in K1). At the higherrate (K2) absorption continued during the growth of grain and reached 94.2 kg/haK2O at the onset of ripening.Mean daily uptakes at the peak of absorption are of the order of 1.5 kg/ha K2O. Thusa high level of K availability is essential to provide adequate nutrition of the soyabean.The grain is much higher in K (2.2% in dry matter) than in cereals. On the average,72% of plant K content is found in the grain and removals in grain are considerable,reaching some 70 kg/ha K2O in K 2.Mg is taken up steadily right up to maturity. The maximum uptake, obtained in K1 is62.8 kg/ha MgO, but content at maturity is much lower and removal in grain is12.2 kg/ha MgO in treatment K2.C. Courpron and J. Tauzin in 1973-1974 studied mineral uptake by soyabean (cv.Amsoy) on irrigated soil in the Landes/France. Though the ecological conditions werevery different and though the Amsoy strain is much higher yielding, the patterns ofabsorption in our experiment were very similar. Total uptakes by Amsoy are muchhigher but removals per 100 kg grain were closely similar.
Grain quality
As N content decreases with increasing K, protein content is correspondingly reduced(K1 and K2 <K0) but the total protein yield is considerably increased by the highpotash dressing.K has a significant favourable effect on oil content, oil yield increasing from 294 kg/haat K, to 482 kg/ha at K.
Conclusion
Soyabean is a quick growing plant with a large nutrient requirement. In order fullyto realise its potential for quantity and quality of harvest it is essential that nutrientavailability should be high, particularly in the case of potash which has a greatinfluence on grain and oil yield. As the grain has a high K content, K removals ingrain can be appreciable.
334
Co-ordinator's Reporton the 5th Working Session
Prof. Dr. 1. Arnon, Director of Research, Settlement Study Centre, Rehovot/Israel; Memberof the Scientific Board of the International Potash Institute
While considerable attention has been paid by research workers to the effect of
fertilizer on the yields of oil crops, information regarding their effects on oil content
and its quality is still fragmentary and inadequate.As Ochs and Ollagnier point out, the general practice is to express experimental results
in weight of fruit or seed, even when oil is the main commercial product 'implyingthat oil content is a constant characteristic of species or variety'. Whilst such a practice
has the merit of simplicity, it is not only sometimes a source of serious errors, it also
perpetuates the ignorance on the effect of mineral nutrition on the metabolism and
production of lipids.The various papers presented at the Colloquium have shown experimental results on
the effect of fertilizersa) on the fatty acid composition of the lipids;b) on oil content;c) on overall yield of lipids/ha.
Effects on fatty acids composition of oils
Whilst the primary role of lipids in nutrition is quantitative, namely to supply energy
in a concentrated form, a few unsaturated fatty acids- linoleic, linolenic and arachidic-
are essential for vital processes and growth. Therefore, when studying the effect of
fertilizers on the oil content of crops, there would appear to be justification to consider
also qualitative make-up of these oils, similarly to the practice of judging the biological
value of proteins in addition to actual quantity.In contrast to the efforts devoted to increasing total oil production, much less work
has been done on improving the nutritional and technological properties of oils.
However, in certain crops, genetic variability has been used in breeding programmes
for this purpose. Examples mentioned in the 5th Session are increases in unsaturated
fats in palm oil, achieved by hybridization with an American species, and the develop-
ment of new cultivars of oilseed rape which contain practically no erucic acid.However, a general review of literature as well as the results presented at this Collo-
quium, indicate that whatever variations due to fertilizer treatments may have beenfound to date, they have been very minor.
335
Crawford has expressed the opinion that these effects are completely overshaded bythe changes in oil composition that occur during processing.
Effects of fertilizers on oil content
As lipids are derived from carbohydrates, maximum oil production by the plant willbe dependent on conditions that are favourable to the production of carbohydrates.Protein synthesis and oil formation may occur simultaneously but almost every paperhas stressed that oil content is usually in inverse proportion to protein content. Severalreasons for this inverse relationship have been presented and these are not mutuallyexclusive. The most simple is probably that the formation of carbohydrates can followtwo alternative pathways, one leading to the production of protein, the other to thesynthesis of fats. If for example, ample reduced N is available, the production ofproteins will be favoured and less carbohydrates will be available for fat synthesis. If,on the contrary, there is deficiency of reduced N, fat synthesis will be favoured.Another possible explanation for the inverse relationship between lipids and proteinsis that an increased nitrogen supply causes an increase in respiration, therefore fewercarbohydrates remain available for fat-synthesis under conditions promoting vegeta-tive growth. The beneficial effect of K nutrition on carbohydrate synthesis and trans-location is well-known. The main effect of K appears to lie in its interactions with N,and potassium fertilizers can help to control the carbohydrate-nitrogen relationshipsin plants. This is of particular importance when excess nitrogen causes excessivevegetative growth. This may provide the explanation of the generally beneficial effectof K-fertilizers on oil production by the plant. Examples of such effects have beenpresented during the session:Forster reports that in a trial in Hannover on oilseed rape, increasing N supply loweredthe oil content of the seed but the decrease in oil content with increasing N supplydepended on the rate of K applied. Since seed yields were also increased considerably,K nutrition had a beneficial effect on overall oil production.Davidescu et al. report that in sunflowers, nitrogen applied without P and K reducesseed oil content. The reduction was more or less proportionate to the amount of Napplied and to the degree of nutrient imbalance created. P and K were found to coun-teract the negative effect of N on oil content. Similar results were obtained withsoybeans.A different kind of interaction between N and K has been noted by Klein and Lavee,who found that the increase in yields of olives following K application is apparentlydue to the higher availability of the N applied rather than to the direct effects of Kuptake.
From all data presented, the direct effects of fertilizers on oil content and quality,appear to be very minor. Appelqvist has pointed out that indirect effects may be moreimportant, such as changes in the proportions of the different seed constituents whichhave different levels of oil content or a lengthening of the time that elapses betweenpollination and seed formation.However, the overall conclusion that imposes itself when analysing the informationpresented is that:
336
a) there is little point in endeavouring to influence oil quality by breeding or by
fertilization;b) breeding is, and remains, the main tool for improving oil content;
c) fertilizer use should aim at increasing overall yield of the plant constituents that
serve as a sink for the lipids - namely fruits and seeds.
In this respect, fertilizers have been shown to play a major role in all crops and under
most circumstances, with K very often as the key element.
Oil production
A few words on effective rates of applicationOchs and Ollagnier point out that the rates of nutrients that need to be applied on
tropical soils, which are notoriously poor in assimilable minerals, are very often
markedly higher than removals in the harvested products. Fertilizers under these
conditions are needed to raise the concentration in the soil solution to a level sufficient
for absorption by the plant, and 'the rates needed to achieve this end are in certain
cases higher than would merely replace removal in the crops'.
There are also inevitable losses of potassium in the heavily leached typical tropical
soils.The authors have, however, shown that these disadvantages are more than balanced
by the high oil yield per unit fertilizer applied.
A particularly interesting observation in the paper by Klein and Lavee, on the effect
of fertilizers on olive production, on soils which have previously never been treated
by fertilizers, is that treatment effects of K increased progressively with time, another
example of the need to continue fertilizer trials for long periods before drawing
conclusions - in particular true for K.
Summing up:
One of the basic objectives of this symposium was to review the state of our knowledge
on the effect of fertilizers on carbohydrate and lipid production in crops and in partic-
ular to highlight the gaps and deficiencies in our knowledge on this subject. The aim
was, of course, to encourage research in these dark areas.
It appears to me to be somewhat of an anticlimax - as far as lipids are concerned - if
we find
a) that we know every little on the effect of fertilizers on the lipid content and quality -
andb) that it really doesn't matter very much, as long as we are diligent in increasing
lipid yield.
May I suggest that this would be an appropriate subject for discussion, so as to be in a
position to draw conclusions of great practical importance to our research workers -
even if the conclusions are uncomfortable to contemplate.
337

6th Session
General DiscussionCo-ordinator: Dr. G. W. Cooke,
C.B.E., Ph.D., F.R.I.C., F.R.S., Chief ScientificOfficer, Agricultural Research Council, London/United Kingdom
The Efficiency of Energy Used in theProduction of Carbohydrates and Lipids
J. K. R. Gasser, M. Sc., Ph.D., Agricultural Research Council, London/United Kingdom*
Summary
In the intensive agricultural system of the U.K., about one-quarter of the energy is used forfertilizers and about half for mechanisation. For arable cropping much energy is needed for thebasic operations such as cultivation, weed control and harvesting. The amounts and types offertilizer used can be varied and with other inputs such as crop varieties should be chosen toprovide the best return from all energy inputs. Most energy per unit of nutrient is required toprovide fixed N and least for K. Therefore, the use of N is most critical and the results of in-vestigations on crop increases to be achieved by the use of N are examined and shown to be de-sirable because usually more energy is recovered in the product than is needed to produce thefertilizer.The energy balances for carbohydrates and lipids for a number of crops are considered. Theidea is developed that in considering energy balances the total output of a crop should be con-sidered and support energy particularly for fertilisers should not be assessed only by yield ofthe desired product.
1. Energy used in United Kingdom agriculture, food processing, distribution and
preparation
In recent years much attention has been focused on the amount of energy derived from
fossil fuels required in modern intensive agricultural systems. This energy is often
termed 'support energy', and the efficiency of farming practice can be expressed as the
energy contained within the desired product divided by the energy used to produce and
if necessary dry and store it (Leach [9], White [10]). For the U. K., Table I gives val-
ues from White [10] of the support energy needed both for farm crops and for animal
products and the ratio of usable or metabolisable energy is expressed as a fraction of
the energy input or support energy. This includes energy used for fertilizers applied for
crops which are either used directly for human consumption or are fed to animals. For
U.K. agriculture as a whole, the usable output was less than half the energy input to
produce it. The direct production of plants apparently gives a much better ratio than
animal products, even when only the protein part is considered. Much emphasis has
been placed on the protein provided by various crops even when they are grown primar-
* Dr. J.K.R. Gasser, Agricultural Research Council, 160 Great Portland Street, LondonWIN 6 DT/United Kingdom
341
Table 1. Estimates of agricultural use of support energy
Crop or product Energy input Energy E = Protein out- Energy in-or support output or Column 3 put put to pro-energy metabolis- Column 2 kg ha-' duceGJ ha-' able year-' proteinyear- 1 energy MJ kg-'
GJ ha-2 3 4 5 6
CropsWheat 19.6 61.0 3.11 435 45*Wheat 17.8 56.2 3.35 400 42Barley 18.1 60.6 3.36 310 58Oats 18.8 66.4 3.52 480 39Potatoes 52.0 69.3 1.33 460 113*Potatoes 36.2 56.9 1.57 376 96Sugar beet (at farm gate) 25.2 82.5 3.28 Not applicableCarrots 25.1 32.5 1.30 234 107*Carrots 27.6 30.0 1.10 219 126Brussels sprouts 32.4 10.9 0.34 296 109*Brussels sprouts 47.9 9.1 0.19 244 196Onions, dry bulb 93.4 27.7 0.30 276 338Tomatoes (glasshouse) 1300 62.0 0.05 945 1360
Aninal productsMilk 17.0 12.0 0.70 145 118*Milk 26.9 10.0 0.37 129 208Pigs (pork and bacon) 18.0 11.4 0.63 76 238Poultry (eggs) 22.5 6.0 0.26 113 200*Poultry (eggs) 48.5 7.0 0.14 137 353Poultry (broilers) 29.4 4.3 0.15 145 203*Poultry (broilers) 58.9 5.9 0.10 203 290Poultry (turkeys) 23.6 7.1 0.30 129 184Beef (from dairy herd) 10.4 3.2 0.31 40 257Beef (from beef herd) 10.6 2.4 0.23 31 348Sheep (lamb and mutton) 10.1 2.5 0.25 22 465
* Results of Leach [9]; all other values of White [10]
ily for their energy value, and this paper considers the use of the energy used particu-larly for fertilizers to produce energy as carbohydrates or lipids.In 1973 the support energy used by agriculture was 361 TkJ, representing about 4 percent of the total energy used in the U. K. (White [10]). The primary energy consumedby agriculture was divided as shown in Table 2 and was largely used for mechanisation(the provision and use of machines) and for fertilizers. The use of power machineryand fertilizers with other inputs such as improved varieties of crops, pest and weedcontrol enable increasing production to be achieved from a limited land area and witha decreasing labour force.Before food is eaten it is processed, distributed and cooked. Food processing takes 5.2per cent of the national energy consumption and food distribution a further 1.5 percent of total energy (White [10]). The use of fossil fuel for cooking requires anamount of energy about equal to that used for agriculture, but in primitive societieswith less sophisticated equipment for cooking more energy is needed (Leach [9]).
342
Table 2. Primary energy consumed in U.K. agriculture, 1973 (White [10])
Item TkJ per cent
Solid fuel .................................................. 4.1 1.1Petroleum ................................................. 85.0 23.6Electricity ................................................. 33.1 9.2Fertilizer .................................................. 83.5 23.1M achinery ................................................. 52.0 14.4Feedstuff processing (off farm) ................................ 51.3 14.2C hem icals ................................................. 8.5 2.4Buildings .................................................. 22.8 6.3Transport, services .......................................... 16.3 4.5Miscellaneous ......................................... 4.3 1.2
Total ...................................................... 360.0 100.0
Table 3. Trends in primary energy usage in the form of petroleum fuels, solid fuels and 61ectric-ity, number of workers employed on agricultural holdings (full-time, part-time and tempo-rary) and number of tractors (White [10)
Year 1950 1960 1970
Primary energy used TkJ ...................... 67 80 104Numbers of workers, thousands ............... 918 693 430Numbers of tractors, thousands .............. 240 360 350
Therefore production to the farm gate accounts for only slightly more than one quarter
of the total energy required to place food on the table.
1.1. Energy used by tractorsTable 3 shows that between 1950 and 1970 power used increased one and a half times,
the labour force decreased to less than half, but the number of tractors only increased
between 1950 and 1960. Between 1960 and 1970 numbers fell very slightly and the aver-
age power of tractors increased.
1.2. Energy used for fertilizer manufacture in the U.K.Figures given in Table 4 show that in 1972/73 nearly 88 per cent of the energy con-
sumed for fertilizers was used for the manufacture of N fertilizers. Between 1972/73
and 1974/75 consumption of N increased by 3.5 per cent whereas P declined by 18.8
per cent and K by 4.8 per cent (Fertilizer Manufacturers Association [6]). The propor-
tion of energy used for the manufacture of N fertilizer increased to nearly 90 per cent
of a slightly larger total. These figures illustrate the dominant position of nitrogen as
the fertilizer element requiring the most support energy, and therefore the need to
make the most effective use of this for increasing energy yields.
1.3. Energy used for transporting fertilizerIn calculating the energy required to provide fertilizers on the farm in the U.K., Leach
[9] has included transport of raw materials and movement of the product from facto-
ry to farm. The latter required about I per cent of the total energy needed. However,
transport by ship over long distances and by road from the port of landing to the farm
343
Table 4. Energy required for fertilizer consumed in the U.K.
1972/3 1974/5consumption energy required consumption energy required'000 t TkJ '000 t TkJ
Nitrogen (N) ...... 947 75.7 984 78.7Phosphorus (P.O.).. 482 6.7 395 5.5Potassium (K 20) .... 435 3.9 397 3.6Totals ............. 86.3 87.8
Note: Energy required for fertilizer delivered to farm from values given by Leach [9]. N, 80MJ kg-1; P205, 14 MJ kg-i; KO, 9 MJ kg- 1.
requires appreciable amounts of energy. A sea journey of 5000 km requires 635 MJ t-and a following road journey of 500 km requires at least 370 MJ t-', giving a total needfor 1.0 GJ t- ' (calculated from values given by Leach [9]). The average energy re-quired to make the four formulations given by Leach [9] is 14.8 GJ t-1 of product.Transport in this example therefore increases energy demand by nearly 7 per cent.
2. Requirements and benefits of intensification of agriculture
2.1 In a highly mechanised farming system much of the support energy used in arablefarming is for cultivation, harvesting, drying and storing crops. For forage crops muchenergy is required for drying green crops or barn-drying hay, varying amounts areneeded for fertilizing crops, depending on the intensity of the system and on the cropsgrown, for example no nitrogen is needed for leguminous crops. Least energy is re-quired for forage crops grazed by animals, particularly legumes or grass-legumes mix-tures receiving little nitrogen (Leach [9]).
2.2 In subsistence agriculture, the effort comes from man and his domestic animalsand the apparent efficiency of the system appears to be great, but the questions ofproductivity, of standards of living, health and other social factors are ignored in thissimplistic view. Two of the first requirements for increased productivity are commonlyimproved varieties giving larger potential yields, and fertilizers to help achieve theseyields. Improved farming systems frequently involve better cultivation, harvesting andstorage, weed, disease and pest control and in some areas, irrigation. All these inputsrequire larger inputs of energy and begin to alter the system towards more intensive ag-riculture. The inputs also have to be purchased demanding a change from subsistence tocash cropping because the farmer must sell part of his produce to purchase the neces-sary aids to production and has therefore to increase his productivity to achieve thissurplus for sale. One of the major benefits from mechanisation is improved timelinessby enabling work to be done at the best time.
2.3 These points are illustrated in Table 5 by the energy budgets for rice production(Leach [9]) which show that with increasingly efficient agriculture including mechani-sation and fertilizers, yield increased more than the energy used, and man hours re-quired to produce the crop decreased, thus improving productivity. These factors were
344
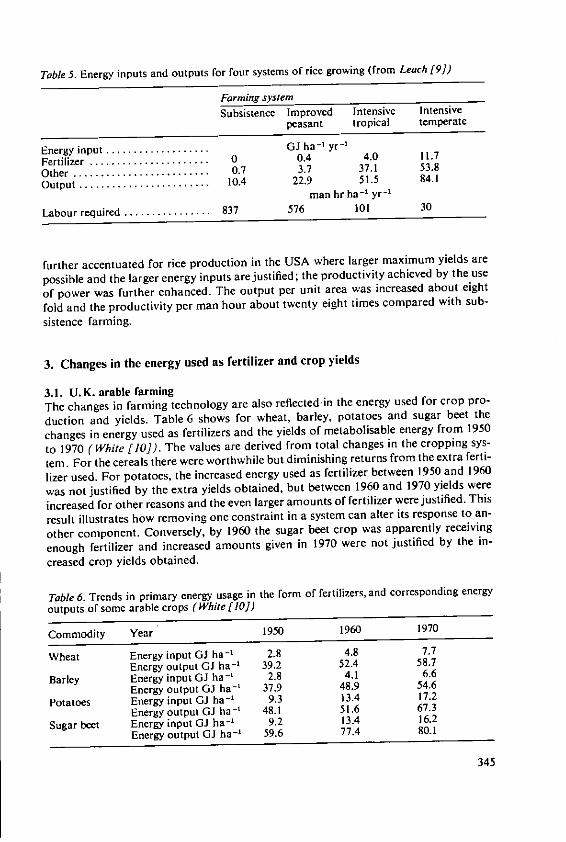
Table 5. Energy inputs and outputs for four systems of rice growing (from Leach [9])
Farming system
Subsistence Improved Intensive Intensivepeasant tropical temperate
Energy input ................... GJ ha - yr -IFertilizer ...................... 0 0.4 4.0 11.7
Other ......................... 0.7 3.7 37.1 53.8Output ........................ 10.4 22.9 51.5 84.1
man hr ha-1 yr-
Labour required ................ 837 576 101 30
further accentuated for rice production in the USA where larger maximum yields are
possible and the larger energy inputs are justified; the productivity achieved by the use
of power was further enhanced. The output per unit area was increased about eight
fold and the productivity per man hour about twenty eight times compared with sub-
sistence farming.
3. Changes in the energy used as fertilizer and crop yields
3.1. U.K. arable farmingThe changes in farming technology are also reflected-in the energy used for crop pro-
duction and yields. Table 6 shows for wheat, barley, potatoes and sugar beet the
changes in energy used as fertilizers and the yields of metabolisable energy from 1950
to 1970 ( White [10]). The values are derived from total changes in the cropping sys-
tem. For the cereals there were worthwhile but diminishing returns from the extra ferti-
lizer used. For potatoes, the increased energy used as fertilizer between 1950 and 1960
was not justified by the extra yields obtained, but between 1960 and 1970 yields were
increased for other reasons and the even larger amounts of fertilizer werejustified. This
result illustrates how removing one constraint in a system can alter its response to an-
other component. Conversely, by 1960 the sugar beet crop was apparently receiving
enough fertilizer and increased amounts given in 1970 were not justified by the in-
creased crop yields obtained.
Table 6. Trends in primary energy usage in the form of fertilizers, and corresponding energy
outputs of some arable crops (White [10])
Commodity Year 1950 1960 1970
Wheat Energy input GJ ha - 2.8 4.8 7.7Energy output GJ ha-' 39.2 52.4 58.7
Barley Energy input GJ ha - ' 2.8 4.1 6.6Energy output GJ ha-' 37.9 48.9 54.6
Potatoes Energy input GJ ha-' 9.3 13.4 17.2Energy output GJ ha-' 48.1 51.6 67.3
Sugar beet Energy input GJ ha-' 9.2 13.4 16.2Energy output GJ ha-' 59.6 77.4 80.1
345
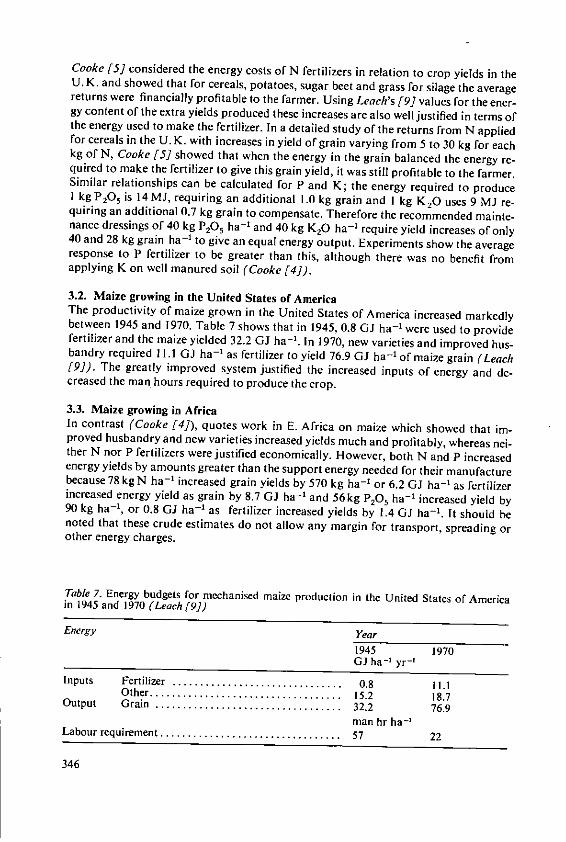
Cooke [5 considered the energy costs of N fertilizers in relation to crop yields in theU. K. and showed that for cereals, potatoes, sugar beet and grass for silage the averagereturns were financially profitable to the farmer. Using Leach's [9J values for the ener-gy content of the extra yields produced these increases are also well justified in terms ofthe energy used to make the fertilizer. In a detailed study of the returns from N appliedfor cereals in the U. K. with increases in yield of grain varying from 5 to 30 kg for eachkg of N, Cooke [5 showed that when the energy in the grain balanced the energy re-quired to make the fertilizer to give this grain yield, it was still profitable to the farmer.Similar relationships can be calculated for P and K; the energy required to produceI kgP 2O5 is 14MJ, requiring an additional 1.0 kg grain and I kg K2O uses 9 MJ re-quiring an additional 0.7 kg grain to compensate. Therefore the recommended mainte-nance dressings of 40 kg P2O5 ha- ' and 40 kg K20 ha- 1 require yield increases of only40 and 28 kg grain ha- 1 to give an equal energy output. Experiments show the averageresponse to P fertilizer to be greater than this, although there was no benefit fromapplying K on well manured soil (Cooke [4]).
3.2. Maize growing in the United States of AmericaThe productivity of maize grown in the United States of America increased markedlybetween 1945 and 1970. Table 7 shows that in 1945, 0.8 GJ ha- 1 were used to providefertilizer and the maize yielded 32.2 GJ ha- 1. In 1970, new varieties and improved hus-bandry required 11.1 GJ ha- 1 as fertilizer to yield 76.9 GJ ha- 1 of maize grain (Leach[9]). The greatly improved system justified the increased inputs of energy and de-creased the man hours required to produce the crop.
3.3. Maize growing in AfricaIn contrast (Cooke [4]), quotes work in E. Africa on maize which showed that im-proved husbandry and new varieties increased yields much and profitably, whereas nei-ther N nor P fertilizers were justified economically. However, both N and P increasedenergy yields by amounts greater than the support energy needed for their manufacturebecause 78 kg N ha-' increased grain yields by 570 kg ha-' or 6.2 GJ ha-' as fertilizerincreased energy yield as grain by 8.7 GJ ha-' and 56 kg P20 5 ha- 1 increased yield by90 kg ha-', or 0.8 GJ ha-' as fertilizer increased yields by 1.4 GJ ha- 1. It should benoted that these crude estimates do not allow any margin for transport, spreading orother energy charges.
Table 7. Energy budgets for mechanised maize production in the United States of Americain 1945 and 1970 (Leach [9])
Energy Year
1945 1970GJ ha-1 yr-
Inputs Fertilizer ............................... 0.8 11.1O ther ................................... 15.2 18.7Output G rain .................................. 32.2 76.9man hr ha-'
Labour requirement ................................. 57 22
346
3.4. Dwarf wheatsThe new dwarf wheats have increased the maximum potential yields in many areas and
have required changes in farming practice including the use of more fertilizer-N. 20 to
40 kg grain are commonly produced for each kg N applied or in energy terms, 80 MJ
as fertilizer-N gives 288 to 576 MJ as wheat grain. In both Turkey and Pakistan (Cento
[3]), more fertilizer-N is recommended for dwarf wheats than for local varieties al-
though P and K are not often increased. Recommendations for wheat grown without
irrigation suggest from 50-120kg N ha- 1, 60-80 kg P2O5 ha - , and 0-60 kg K2O ha,
compared with about half the amount of N for local varieties, with much the same P
and K. 100 kg N together with median amounts of P and K require 9.2 GJ ha - t requir-
ing 640 kg to contain an equal amount of energy. These conditions can be easily
achieved. Cooke [4] quotes results of a trial on dwarf wheat in which the increment of
fertilizer-N from 80 to 120 kg N ha- 1 increased yields of grain from 4800 to 5300
kg ha-'. The extra fertilizer-N requires an input of 3.2 GJ ha-', the extra grain yields
7.2 GJ ha-'. Increasing fertilizer-N to 160 kg N ha- 1, did not further increase grain;
earlier increments increased yield more. Therefore the application of sufficient fertil-
izer-N to give maximum yields is well justified in energy terms.
4. Carbohydrates and lipids
4.1 Most plants contain both carbohydrates and lipids and the partition between these
two forms of energy in comparison with energy needed for the fertilizer used for in-
creasing crop yields cannot sensibly be done. However, crops are usually grown for
one predominant component and it is convenient to consider them under these head-
ings when discussing energy balances. The importance of secondary products is dis-
cussed where appropriate.
4.2. CarbohydratesThe common forms of carbohydrate in increasing order of polymerisation are sugars,
starches, hemi-celluloses and celluloses. Only the first two of these are digestible by
mono-gastric animals, and their various forms are the desired products for human con-
sumption. The last two can be utilised by ruminants and form an important part of
their diet. Lignin also occurs in plants but is not digestible and is not considered as an
energy source. However, most crop plants give both types of carbohydrate. For exam-
ple sugar cane yields sugar, a cellulose residue (bagasse) and other products. The be-
gasse is usually squeezed sufficiently dry to be able to be burnt in a furnace and can
provide heat energy for the mill or be used as a source of cellulose for industrial pur-
poses. Sugar beet gives sugar, pulp and tops. Both sugar beet pulp and tops are valu-
able cattle foods and therefore in any overall energy balance their production from fert-
ilizers should be considered an asset. Similarly, cereal straw contains much energy and
although current farming systems may discourage utilisation for economic reasons, its
production should not be ignored when considering the energy balance.
4.3. LipidsLipids include fats and oils, waxes, phospholipids, glycolipids and sterols. The oils are
largely produced as a major product and occur extensively for example in the seeds of
rape, sunflower, groundnut, coconut and oil palm. However, the various residues from
347
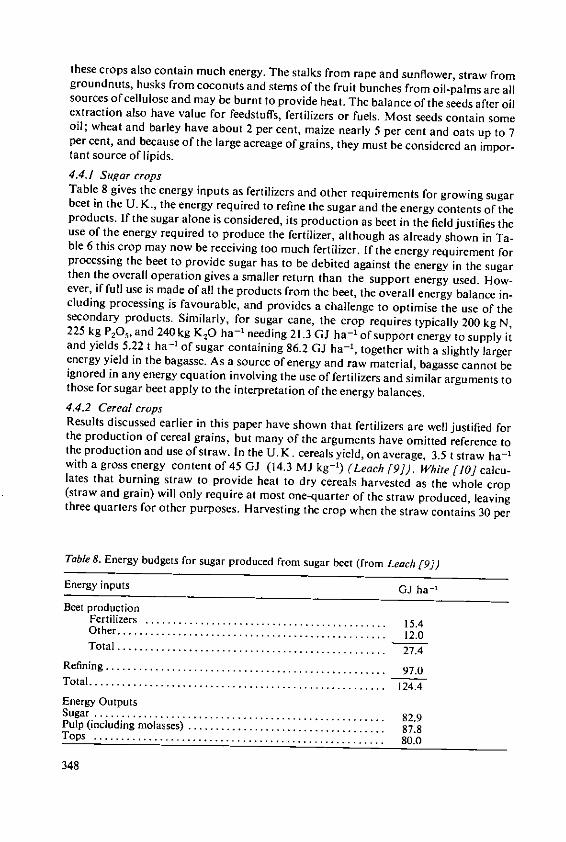
these crops also contain much energy. The stalks from rape and sunflower, straw fromgroundnuts, husks from coconuts and stems of the fruit bunches from oil-palms are allsources of cellulose and may be burnt to provide heat. The balance of the seeds after oilextraction also have value for feedstuffs, fertilizers or fuels. Most seeds contain someoil; wheat and barley have about 2 per cent, maize nearly 5 per cent and oats up to 7per cent, and because of the large acreage of grains, they must be considered an impor-tant source of lipids.
4.4.1 Sugar cropsTable 8 gives the energy inputs as fertilizers and other requirements for growing sugarbeet in the U. K., the energy required to refine the sugar and the energy contents of theproducts. If the sugar alone is considered, its production as beet in the field justifies theuse of the energy required to produce the fertilizer, although as already shown in Ta-ble 6 this crop may now be receiving too much fertilizer. If the energy requirement forprocessing the beet to provide sugar has to be debited against the energy in the sugarthen the overall operation gives a smaller return than the support energy used. How-ever, if full use is made of all the products from the beet, the overall energy balance in-cluding processing is favourable, and provides a challenge to optimise the use of thesecondary products. Similarly, for sugar cane, the crop requires typically 200 kg N,225 kg P,05 , and 240 kg K2O ha-' needing 21.3 GJ ha- 1 of support energy to supply itand yields 5.22 t ha- 1 of sugar containing 86.2 GJ ha-', together with a slightly largerenergy yield in the bagasse. As a source of energy and raw material, bagasse cannot beignored in any energy equation involving the use of fertilizers and similar arguments tothose for sugar beet apply to the interpretation of the energy balances.
4.4.2 Cereal cropsResults discussed earlier in this paper have shown that fertilizers are well justified forthe production of cereal grains, but many of the arguments have omitted reference tothe production and use of straw. In the U.K. cereals yield, on average, 3.5 t straw ha- 1with a gross energy content of 45 GJ (14.3 MJ kg- 1) (Leach [9]). White [1O] calcu-lates that burning straw to provide heat to dry cereals harvested as the whole crop(straw and grain) will only require at most one-quarter of the straw produced, leavingthree quarters for other purposes. Harvesting the crop when the straw contains 30 per
Table 8. Energy budgets for sugar produced from sugar beet (from Leach [9])
Energy inputs GJ ha-'
Beet productionFertilizers ............................................ 15.4O ther ................................................. 12.0T otal ................................................. 27.4
R efining ................................................... 97.0T otal ...................................................... 124.4
Energy OutputsSugar .................. ............................ 82.9Pulp (including molasses) ................................ 87.8T ops ..................................................... 80.0
348
cent moisture will require 10 GJ ha- 1 of the 45 GJ ha-' in the straw to dry the whole
crop. Straw yield is increased by the use of fertilizers, particularly by N, and as a first
approximation increases in straw yield may be equated with increases in grain yield al-
though the gross energy content of straw per unit weight is slightly greater than that of
grain. Therefore using an increase of 20 kg straw for each kg of fertilizer-N, represents
an energy return of 286 MJ for an input of 80 MJ already discounted against grain
production.
4.5. Energy budgets for lipidsPlants grown for oil production include annual crops such as sunflower and rape (also
grown as a biennial) and legumes, such as ground nuts and soya beans; perennial crops
such as olives, trees and coconut and oil palms. These plants have differing fertilizer re-
quirements.
4.5.1 Rape andsunflowerThese crops need much nitrogen together with P and K. For example, in Turkey, sun-
flower requires 70-90 kg N, 70-90 kg PO0, and 40-60 kg KO ha- 1 (Cento [3]). In
temperate N. Europe, oilseed rape receives 120-180 kg N, 55 kg PO0 and 70 kg K20
ha - 1. Using average values for the amounts of fertilizer applied, sunflower requires
8.0 GJ ha- 1 and rape 13.4 GJ ha- 1. Assuming vegetable oil has an average energy con-
tent of 36 MJ kg- 1 (the exact value will depend on the fatty acids present) 222 kg ha -
of sunflower oil is required to equal the energy input required for making the fertilizer
and similarly 372 kg ha- 1 of rape seed oil. These amounts represent 20-25 per cent of
the average yield of oil from sunflower and rape and although the energy balance will
be positive it is less beneficial than for some other crops. However, in this case agricul-
ture may be considered a process for converting inedible mineral oil into an edible veg-
etable oil and no energy benefit would necessarily have to be achieved. Most of the en-
ergy input is from N and in energy terms 2.2 kg oil is required to balance the energy
used to supply I kg N; this is smaller than for cereals. Also this does not allow for the
energy value of the rape-seed cake or sunflower seed residues after the oil has been ex-
tracted, and in any overall energy balance these parts of the crops must also be consid-
ered.
4.5.2 GroundnutsIn contrast, groundnuts (Arachis hypogea) are a leguminous crop, receive little N but
need much P and K, and, in some areas such as West Africa, S also. In the U.S.A. they
may receive 20 kg N, 30-50 kg P2Oand 35-75 kg K,0 ha- 1.The maximum rate of ferti-
lizing requires an input of 3.0 GJ ha-', requiring much smaller crop increases to justify
the fertilizer use than are required for nonlegumes (oil-seed rape and sunflower).
4.5.3 0ilpalmOne of the most productive oil crops is the oil palm, yielding up to 2.5 t ha- 1 of oil.
The oil palm grows vigorously and requires much K although P is not required on all
soils. On typical sandy soils in West Malaysia, the equivalent quantities of fertilizers
applied per hectare would be 60 kgN, 100 kg P9O,, 300 kg K2O. Fertilizers are normal-
ly applied round each palm and not broadcast over the whole surface area. Magnesium
may also be applied. The N, P and K have an energy requirement of about 9 GJ ha-<.
2.5 t of oil contain 90 GJ energy, so that a 10 per cent increase in yield is needed to
equal the energy used to produce the fertilizers. Such yield increases, although justified
in energy terms, may not be economic, and therefore the economics of fertilizing oil-
349
palm are likely to outweigh the energy considerations. Cooke [4] comments 'Adequatefertilizing in the first years is particularly important so that the young palms grow asquickly as possible and give their maximum yields early, so minimising the effects onprofits of overhead costs of establishment'.
4.6. Waxes on the leaves of plantsPlant waxes occur only in small quantities on the surface of leaves and some fruits(Batt and Pickard [2], Holloway and Baker [7]). They act as a barrier to attack andare involved in resistance to insect and fungal attack. They also affect the entry ofchemicals into the plant such as foliar applied fertilizers, insecticides, fungicides andherbicides (Baker [1]). The role of waxes is not clearly understood and the effects offertilizer on their production, composition and their effects on plant health have beenlittle investigated. The limited results suggest that fertilizers do not affect the amountor composition of leaf waxes (Batt and Pickard [2]), whereas environmental factorsparticularly temperature affect both the amount and form of the surface waxes ofleaves (Hunt et al. [8]). Because they affect the entry of chemicals into plants, theirhealth and possible response to fertilizers, these waxes are important although their di-rect relationship to energy use in fertilizers cannot at present be quantified.
5. Grassland and forage crops
Grass and other forage crops contain sugars, cellulose, and some lipids. Grasses re-spond to nitrogen and in discussing the role of fertilizer energy in the production ofcarbohydrates and lipids it is necessary to realise that they are fed to animals to pro-duce animal products. A very small proportion of green crops is grown for directconsumption by humans. The total carbohydrate energy of forage crops may be consid-ered but the metabolisable energy is a better measure of the useful output.
5.1. Leguminous cropsAll leguminous crops i-equire adequate supplies of P and K. Lucerne and clover are themost frequently grown forage legumes in U. K.agriculture. Lucerne is usually grown asa pure stand and gives a good return on the input of energy as fertilizer because of thesymbiotic N fixation. Cooke [4] suggests a total of 125 kg P205 and 250 kg K20 ha-'should be applied during seed-bed preparation and a further 50 kg P20 5 ha-' placed di-rectly beneath the lucerne seed and 2.5-5 cm deeper. Further K will be needed duringthe life of the crop. Assuming replacement of P and K removed by the crop during thesubsequent two years a further 120 kg P2O 5 and 300 kg K2O will be required (allowingfor some accession from the soil). For a three year period the total energy required is8.9 GJ ha-' and the harvested yield of metabolisable energy is 318.0 GJ ha - '. Thiscontains 840 kg N ha-', all of which may be considered to have been fixed biologicallyby symbiosis and in terms of N fixed industrially represents an input of 67.2 GJ ha- '.Similar considerations will apply to other forage legumes.
5.2 GrassGrass needs much fertilizer N for maximum yield and although clover in grass/clovermixtures provides some nitrogen, the most intensive management of both legume-grassmixtures and pure grass swards requires fertilizer-N together with appropriate
350
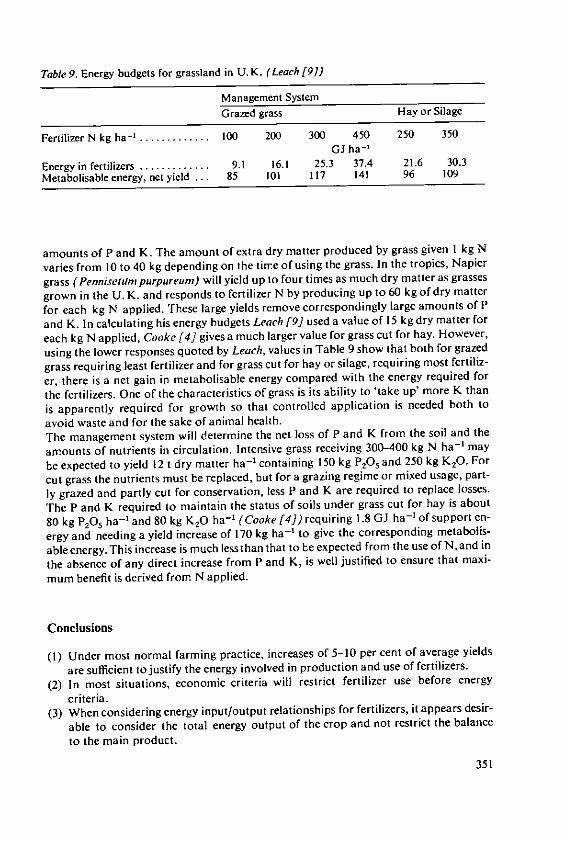
Table 9. Energy budgets for grassland in U.K. (Leach [9])
Management SystemGrazed grass Hay or Silage
Fertilizer N kg ha- 1 . . . . . . . . . . . . . 100 200 300 450 250 350GJ ha-'
Energy in fertilizers ............. 9.1 16.1 25.3 37.4 21.6 30.3Metabolisable energy, net yield ... 85 101 117 141 96 109
amounts of P and K. The amount of extra dry matter produced by grass given I kg N
varies from 10 to 40 kg depending on the time of using the grass. In the tropics, Napier
grass (Pennisettm purpureum) will yield up to four times as much dry matter as grasses
grown in the U. K. and responds to fertilizer N by producing up to 60 kg of dry matter
for each kg N applied. These large yields remove correspondingly large amounts of P
and K. In calculating his energy budgets Leach [9] used a value of 15 kg dry matter for
each kg N applied, Cooke [4] gives a much larger value for grass cut for hay. However,
using the lower responses quoted by Leach, values in Table 9 show that both for grazed
grass requiring least fertilizer and for grass cut for hay or silage, requiring most fertiliz-
er, there is a net gain in metabolisable energy compared with the energy required for
the fertilizers. One of the characteristics of grass is its ability to 'take up' more K than
is apparently required for growth so that controlled application is needed both to
avoid waste and for the sake of animal health.The management system will determine the net loss of P and K from the soil and the
amounts of nutrients in circulation. Intensive grass receiving 300-400 kg N ha-' may
be expected to yield 12 t dry matter ha - containing 150 kg P2O5 and 250 kg K20. For
cut grass the nutrients must be replaced, but for a grazing regime or mixed usage, part-
ly grazed and partly cut for conservation, less P and K are required to replace losses.
The P and K required to maintain the status of soils under grass cut for hay is about
80 kg P2 O5 ha- 'and 80 kg K2O ha - 1 (Cooke [4]) requiring 1.8 GJ ha- 1 of support en-
ergy and needing a yield increase of 170 kg ha-' to give the corresponding metabolis-
ableenergy. This increase is much lessthan that to be expected from the use of N,and in
the absence of any direct increase from P and K, is well justified to ensure that maxi-
mum benefit is derived from N applied.
Conclusions
(I) Under most normal farming practice, increases of 5-10 per cent of average yields
are sufficient tojustify the energy involved in production and use of fertilizers.
(2) In most situations, economic criteria will restrict fertilizer use before energy
criteria.(3) When considering energy input/output relationships for fertilizers, it appears desir-
able to consider the total energy output of the crop and not restrict the balance
to the main product.
351
Symbols of units usedk =kilo= 103 TTera= I012 J -Joule =0.24 calorieM = Mega = 106 Tk = Terakilo= 10 kg-kilogrammeG=Giga-- 109 ha=hectare t=tonne= 103 kg
References
I. Baker, E.A.: Cuticular, environmental and developmental factors in relation to penetra-tion of foliar applied chemicals. Rep. Long Ashton Res. Sin. for 1975, p. 84 (1976)2. Batt, R. F. and Pickard, J.A.: The cuticles of plants. Rep. Long Ashton Res. Sin. for1965, p. 45 (1966)
3. Cento Handbook on the use of fertilizers in the Cento region. Ankara, Turkey 19754. Cooke, G. W.: Fertilizing for maximum yield, Crosby Lockwood, London 19725. Cooke, G. W.: The energy costs of the nitrogen fertilizers used in Britain, the returns re-ceived and some savings that are possible. . Sci. Fd. Agric. 26,1065-1069 (1975)6. Fertilizer Manufacturers Association: Fertilizer Statistics, London 19757. Holloway P. J. and Baker, E. A.: Epicuticular waxes of normal and mutant forms of Bras-
sicanagus. Rep. Long Ashton Res. Stn. for 1975, p. 80(1976)8. Hunt, G.M., Baker, E.A. and Holloway, P.J.: The influence of environmental conditions
on the development of plant cuticles. Rep. Long Ashton Res. Stn. for 1975, p. 84 (1976)9. Leach, G.: Energy and food production, IPC Science and Technology Press, Guildford,
197610. White, D.J.: Energy use in agriculture pp. 141-176. In: Aspects of energy conversion. Ed-
ited by Blair, Jones and van Horn. Pergamon Press, Oxford and New York, 1976
352
Closing Address
Conclusions from the Colloquium
Dr. G.W. Cooke, C.B.E., Ph.D., F.R.I.C., F.R.S., Chief Scientific Officer, AgriculturalResearch Council, London; Chairman of the 13th IPI-Colloquium; Member of the ScientificBoard of the International Potash Institute
We came to York to discuss the role of fertilizers in the production of carbohydrates
and lipids. In planning the proceedings we realised that we could not have simple
papers which dealt with the effects of N, P and K on yields of crops supplying these
foods. We had to take account of the many complexities involved in the modern
production and use of foods. High yields from modern farming depend on interactions
of many inputs. The rise of the food manufacturing industry leads to demands for
agricultural produce with special qualities. Food scientists have added the results of
their research on the evaluation of flavour and texture which concern both manu-
facturer and consumer. All of this has led to a wide range of papers, perhaps as wide
as ever we had in an IPI Colloquium. Nevertheless I must say that the papers are
excellent: most of them will be used for reference in years to come.
The objectives of most of our papers have been to assess the effects of fertilizers,
genetic material, farming conditions, environment and post-harvest treatment of the
produce on 1) total yield, 2) composition of the yield, 3) its digestibility when used
for animal feeding, and 4) the much more complex factors which make food suitable
for humans. One idea that I think we rejected was that of minimum requirements -
with the implication of minimum for survival. Professor Klatzinann exposed this as a
false aim for agricultural scientists concerned with human food. It is much more
important to define quantity and composition needed for optimum growth and per-
formance. We should not try to measure how little food can be eaten to assure the
survival of people in developing countries; we should aim to discover how much of
what sort of food they should have for optimum growth, development and performance.
We should try to help the poor people of the world to grow and perform as well as we
do, while avoiding our form of malnutrition - eating too riuch, perhaps of the wrong
kinds of foods. I believe that the papers we have received make a valuable contribution
to these objectives.In all this work we have to take account of the vast technology that has been built up
in this century to process and market food. While the housewife may still buy some
foods, potatoes for example, direct from the farmer and cook them herself, much else
that we eat is handled by many people between farmer and consumer. The housewife
buys prepared 'convenience' foods - dried potatoes, frozen peas, pre-packed meat,
icecream and tinned fruit are typical of menus in countries like England. These trends
353
will continue, the agricultural scientist must meet their implications and heed the wordsof nutritionists and medical people working on food in relation to health.Now what place do fertilizers have in these needs of the people from agriculture?Yield: We agree that fertilizers are essential to secure the yields of carbohydrates,lipids (and protein) we need to make survival possible for the World's increasingpopulation. They are essential in raising soil fertility to obtain higher production andin replacing the nutrients removed when one community feeds another. N, P and Kare lost from soil when a village supplies food to a neighbouring town or when carbo-hydrates, lipids and protein are sold from tropical regions to feed people or animals indeveloped regions. We are agreed on this. While alternative biological sources of Nmay help to raise productivity without requiring fossil fuel to make fertilisers the lessephemeral components of soil fertility - P, K (and Mg, Ca and S) will continue to beneeded from industry in increasing quantities.Quality: i) Nitrogen fertilizers raise percentage of protein, but often depress percentof oil in lipid-producing crops; ii) Potassium fertilizers, and phosphates too, oftenincrease the percent of oil in crops; iii) All fertilizers affect the composition of foragecrops grown for animal feeding; iv) We have heard no word in this Colloquium tosuggest that fertilizers damage the quality of any foodstuff- that is they do not makeit less suitable for its purpose in human and animal feeding.Fertilizers have no effects on some qualities of crops. They cannot make a soft wheatinto a hard wheat more suitable for breadmaking. They cannot alter the fatty acidcomposition of lipids and provide more polyunsaturated fats and less saturated fat.To achieve changes of this kind we have to look to other branches of agriculturalscience. Some of our papers illustrated the great contributions made by genetics andplant (and animal) breeding. Obtaining good milling wheat depends on growing agood variety; fertilizers can, however, raise protein percentage and make the grainplump so they help to make good wheat even better. Fertilizers cannot alter glutenquality, or o-amylase activity. Plant breeders have also contributed to the developmentof more suitable lipid-producing crops. Breeding to produce varieties of rapeseed lowin erucic acid is perhaps the best example we have heard about. Fertilizers cannot alterthe effects of climate and environment though they may alleviate local conditions.Certain crops are suitable for certain climates - for example we were told that sun-flowers are a short day plant needing 2500 day degrees - fertilizers alone cannot makethe crop successful in Britain - though we hope plant breeders may do so.This brings me to the last important subject which affects the use of fertilizers toproduce lipids and carbohydrates; this is management and farming system. We havehad several papers which made it clear that agricultural development to achieve theknown potential of crops depends on interactions between inputs. This was wellemphasised by Dr. Walsh's report on the Fourth Session. Although we may work asindividuals on a specialised subject, the day for specialists to apply their results indi-vidually is over. New techniques and materials must be fitted into the farming systemin which the crops will be produced. Two papers stand out in this context - those byDr. Ezeilo and by Mr. Stanley Evans. Each was concerned with achieving yields nearerto the known crop potentials that were stated - 60 tons/ha of cassava and 90 t/ha ofpotatoes. It is interesting how similar these yield targets are: by my calculations 15 t/haof starch from cassava, 13 V t/ha from potatoes! Both papers show that the averagepractices of good farmers supply too little nutrients to replace the amounts the cropsremove.
354
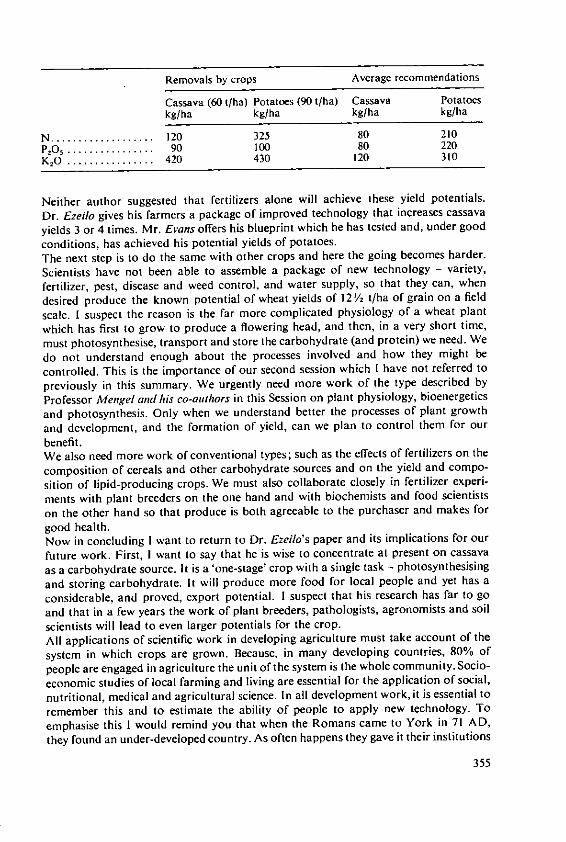
Removals by crops Average recommendations
Cassava (60 t/ha) Potatoes (90 t/ha) Cassava Potatoeskg/ha kg/ha kg/ha kg/ha
N ................... 120 325 80 210P1o1 ................ 90 100 80 220K2O ................ 420 430 120 310
Neither author suggested that fertilizers alone will achieve these yield potentials.
Dr. Ezeilo gives his farmers a package of improved technology that increases cassava
yields 3 or 4 times. Mr. Evans offers his blueprint which he has tested and, under good
conditions, has achieved his potential yields of potatoes.The next step is to do the same with other crops and here the going becomes harder.
Scientists have not been able to assemble a package of new technology - variety,
fertilizer, pest, disease and weed control, and water supply, so that they can, when
desired produce the known potential of wheat yields of 12/ t/ha of grain on a field
scale. I suspect the reason is the far more complicated physiology of a wheat plant
which has first to grow to produce a flowering head, and then, in a very short time,
must photosynthesise, transport and store the carbohydrate (and protein) we need. We
do not understand enough about the processes involved and how they might be
controlled. This is the importance of our second session which I have not referred to
previously in this summary. We urgently need more work of the type described by
Professor Mengel and his co-authors in this Session on plant physiology, bioenergetics
and photosynthesis. Only when we understand better the processes of plant growth
and development, and the formation of yield, can we plan to control them for our
benefit.We also need more work of conventional types; such as the effects of fertilizers on the
composition of cereals and other carbohydrate sources and on the yield and compo-
sition of lipid-producing crops. We must also collaborate closely in fertilizer experi-
ments with plant breeders on the one hand and with biochemists and food scientists
on the other hand so that produce is both agreeable to the purchaser and makes for
good health.Now in concluding I want to return to Dr. Ezeilo's paper and its implications for our
future work. First, I want to say that he is wise to concentrate at present on cassava
as a carbohydrate source. It is a 'one-stage' crop with a single task - photosynthesising
and storing carbohydrate. It will produce more food for local people and yet has a
considerable, and proved, export potential. I suspect that his research has far to go
and that in a few years the work of plant breeders, pathologists, agronomists and soil
scientists will lead to even larger potentials for the crop.All applications of scientific work in developing agriculture must take account of the
system in which crops are grown. Because, in many developing countries, 80% of
people are engaged in agriculture the unit of the system is the whole community. Socio-
economic studies of local farming and living are essential for the application of social,nutritional, medical and agricultural science. In all development work, it is essential to
remember this and to estimate the ability of people to apply new technology. To
emphasise this I would remind you that when the Romans came to York in 71 AD,
they found an under-developed country. As often happens they gave it their institutions
355

and technology. They built here fortresses and villas which had under-floor heating,piped water supplies, and systems of sanitation and sewage disposal that could not bemaintained by the local people after the Romans left in 411 AD. Consequently at least1500 years were to elapse before the level of comfort and convenience that the Romanshad for everyday use began to be available to the ordinary people of Britain! Do notlet gaps appear in the application of our technology in other countries. Agriculturaland social systems must be studied to make sure that scientific work and technologicalinnovation is the kind which fits local needs and which can be applied successfully bythe farmer whether he lives in Yorkshire, or in Nigeria.
356
Copyright © 2022 FDOKUMEN