PITAI AlAI - International Potash Institute
607
IT I TI I IN PITAI AlAI *aln el Fr iiz~ti'to ncre~ an~ utTm AgricuturVI, lti
-
Upload
khangminh22 -
Category
Documents
-
view
0 -
download
0
Transcript of PITAI AlAI - International Potash Institute
IT I TI
I IN
PITAIAlAI
*aln el Fr iiz~ti'toncre~ an~ utTm
AgricuturVI, lti

Potassium in AsiaBalanced Fertilization to Increase and Sustain AgriculturalProduction
24th Colloquium of the International Potash Institute
Chiang Mai, ThailandFebruary 21-24, 1995
Potassium in Asia
Balanced Fertilization to Increaseand Sustain Agricultural Production
International Potash Institute, CH-4001 Basel / SwitzerlandP.O. Box 1609Phone: (41)61 261 29 22/24 Telefax: (41)61 261 29 25

C All rights held by: International Potash InstituteSchneidergasse 27P.O. Box 1609CH-4001 Basel/SwitzerlandPhone: (41) 61 261 29 22/24Telefax: (41) 61 261 29 25
Printing: Imprimerie Brinkmann, Mulhouse/France

Proceedings of the 24th Colloquium of the International Potash Institute
CONTENTS
Inaugural Session page
Reports to Her Royal Highness Princess Maha Chakri Sirindhorn
Chooti Theetranont President of the Chiang Mai University ..................... 11
PongsakAngkasith Dean of the Faculty of Agriculture .......................... 13
Wyss, E. President of the International Potash Institute .......... 15
Welcome address and official opening by HRH PrincessM aha C hakri Sirindhom ................................................................................. 19
Keynote adress
von Uexkiill, H.R. Population growth and food security in Asia .......... 21
Session I Soil fertility and soil K-status for the main agro-clim atic regions of Asia ........................................ 41
Tandon, H.L.S. Major nutritional constraints to crop productionand the soil fertility management strategies indifferent agroclimatic regions of Asia ..................... 43
Suwanarit, A. Potassium dynamics and availability in stronglyweathered and highly leached soils in the humidtropics ................................................................... ..73
Cao, Z and Hu, G. Potassium dynamics and availability in soilsof subtropical (humid) regions of China .................. 95
Sekhon, G.S. Characterization of K availability in paddy soils -present status and future requirements ....................... 115
Cassmon, K.G,, The influence of moisture regime, organic matter,0/k, D.C., and root eco-physiology on the availability andBrouder, S.M. and acquisition of potassium: implications for tropicalRoberts, B.A. low land rice ................................................................ 135
Wivutvongvana, P., Soil K-status and fertility constraints for soybeanJiraporncharoen, S. production in the Chiang Mai Valley ......................... 157and Korsamphan, C.
5
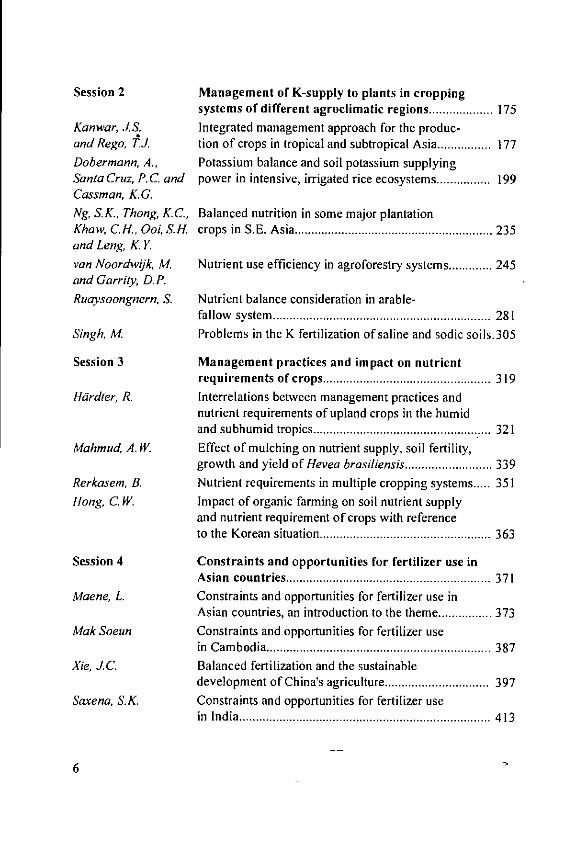
Session 2 Management of K-supply to plants in croppingsystems of different agroclimatic regions ................... 175
Kanwar, JS. Integrated management approach for the produc-and Rego, TJ. tion of crops in tropical and subtropical Asia ................ 177Dobermann, A., Potassium balance and soil potassium supplyingSanta Cruz, P.C. and power in intensive, irrigated rice ecosystems ................ 199Cassman, K.G.Ng, S.K., Thong, K.C., Balanced nutrition in some major plantationKhaw, C H., Ooi, .H. crops in S.E. Asia ........................................................... 235and Leng, K. Yvan Noordwik, M. Nutrient use efficiency in agroforestry systems ............. 245and Garrity, D.P.Ruaysoongnern, S. Nutrient balance consideration in arable-
fallow system ................................................................. 28 1Singh, M. Problems in the K fertilization of saline and sodic soils.305
Session 3 Management practices and impact on nutrient
requirem ents of crops .................................................. 319
Hardier, R. Interrelations between management practices andnutrient requirements of upland crops in the humidand subhum id tropics ................................................... 321
Mahmud, A. W. Effect of mulching on nutrient supply, soil fertility,growth and yield of Hevea brasiliensis .......................... 339
Rerkasem, B. Nutrient requirements in multiple cropping systems..... 351Hong, C. W. Impact of organic farming on soil nutrient supply
and nutrient requirement of crops with referenceto the K orean situation ................................................... 363
Session 4 Constraints and opportunities for fertilizer use inA sian countries ............................................................. 37 1
Maene, L. Constraints and opportunities for fertilizer use inAsian countries, an introduction to the theme ................ 373
Mak Soeun Constraints and opportunities for fertilizer usein C am bodia ................................................................... 387
Xie, .C Balanced fertilization and the sustainabledevelopment of China's agriculture ............................... 397
Saxena, S.K. Constraints and opportunities for fertilizer usein In d ia ........................................................................... 4 13
6

Sri Adiningsih, J., Integrated fertilizer management to sustainDiah Setyorini and self-sufficiency in food in Indonesia ........................... 437Kasno, A.Cholitkul, W. and Constraints and opportunities for fertilizer useChanyanuwat, P. in Thailand ................................................................... 453Nguyen Vy. Dinh, B.D., Constraints and opportunities for fertilizer useand Nguyen Van Bo in V ietnam ................................................................... 463
Prokoshev, V. Constraints and opportunities for fertilizer usein Central Asia and Kazakhstan ................................... 483
Session 5 Approaches for the implementation ofsustainable soil management practices ..................... 493
Johnston, A.E. The sustainability and increase of agriculturalproductivity, the current dilemma ................................ 495
Syers, J.K. and International networks to improve the acquisitionMyers, R.JK. and dissemination of results on soil fertility ................ 519
Thornton, P.K. Improving management and impact of fertilizersw ith m odelling ............................................................. 533
Kimmo, Ui Scientific and practical approaches in soil testingand fertilizer recommendations ................................... 547
Bonfl, D.J. and Plant genotype effects on efficient use ofKajkafi, U. plant nutrients .............................................................. 557
Sum m ary of the Sessions .................................................................................. 575
Introduction to the field visits .......................................................................... 581
Phrek Yipmantasiri Sustainable land use systems in Northern Thailand..... 583
Sajjapongse, A., Management of sloping lands for sustainableZainolE. and agriculture in Asia: A network approach ..................... 587Boonchee, S.
P o ste rs ................................................................................................................ 59 5
I. N utrient status and diagnosis ....................................................................... 597
Myers, R.J.K. and Nutritional problems of upland acid soils in Asia ....... 597Sumalee, .Oberthuir, T2, Detailed mapping of the K status - A case studyDobermann, A., in Central Luzon, Philippines ...................................... 599Pampolino, M.F.,Adviento, M.A. andNeue, H.A.
7
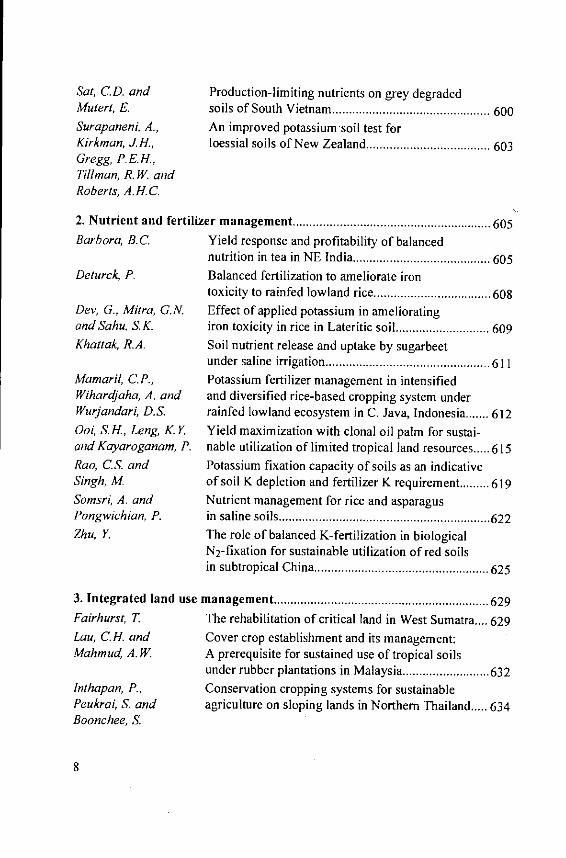
Sat, C.D. and Production-limiting nutrients on grey degradedM utert, E. soils of South Vietnam ............................................... 600Surapaneni, A., An improved potassiumsoil test forKirkman, i., loessial soils of New Zealand ..................................... 603Gregg, P.E.H.,Tillman, R. W. andRoberts, A.H.C
2. N utrient and fertilizer m anagem ent .......................................................... 605Barbora, B.C. Yield response and profitability of balanced
nutrition in tea in N E India ......................................... 605Deturck, P. Balanced fertilization to ameliorate iron
toxicity to rainfed lowland rice ................................... 608Dev, G., Mitra, G.N. Effect of applied potassium in amelioratingand Sahn, S.K. iron toxicity in rice in Lateritic soil ............................ 609Khattak, R.A. Soil nutrient release and uptake by sugarbeet
under saline irrigation ................................................. 611Mamaril, C.P., Potassium fertilizer management in intensifiedWihardjaha, A. and and diversified rice-based cropping system underWurjandari, D.S. rainfed lowland ecosystem in C. Java, Indonesia ....... 612Ooi, S.1-., Leng, K. Y Yield maximization with clonal oil palm for sustai-and Kayaroganam, P. nable utilization of limited tropical land resources..... 615Rao, C.S. and Potassium fixation capacity of soils as an indicativeSingh, M of soil K depletion and fertilizer K requirement ......... 619Somsri, A. and Nutrient management for rice and asparagusPongwichian, P. in saline soils ............................................................... 622Zhu, Y. The role of balanced K-fertilization in biological
N2-fixation for sustainable utilization of red soilsin subtropical C hina .................................................... 625
3. Integrated land use m anagem ent ................................................................ 629Fairhurst, T The rehabilitation of critical land in West Sumatra.... 629Lau, C.H. and Cover crop establishment and its management:Mahmud, A. I. A prerequisite for sustained use of tropical soils
under rubber plantations in Malaysia .......................... 632Inthapan, P., Conservation cropping systems for sustainablePeukrai, S. and agriculture on sloping lands in Northern Thailand..... 634Boonchee, S.
8

Inaugural Session
Report to Her Royal Highness Princess MahaChakri Sirindhorn
Choti TheetranontPresident of the Chiang Mai University, Chiang Mai, Thailand
Your Royal Highness,
I, Mr. Choti Theetranont, the President of the Chiang Mai University, onbehalf of the university community, feel most privileged that Your RoyalHighness has consented to come to open the 24th International Colloquium on"Potassium in Asia" organized by the Faculty of Agriculture, Chiang MaiUniversity and the International Potash Institute, today.
Chiang Mai University has been established for 30 years and has graduallydeveloped its capacity, especially in the educational programs. The universityhas also the policy to develop itself to become a "research university" to pursuenew body of knowledge and experiences as basis for continuing refinement andimprovement of educational programs which would be eventually translated fornational development.
Research and development in agricultural sciences and related disciplinesare crucial for the development of Thai economy and society as agriculture isthe basis for livelihood of majority Thais. These important tasks have beenentrusted in the hand of the Faculty of Agriculture.
This International Colloquium is another step to share the progress inagricultural technology, especially in the field of soil management with expertsand researchers from other countries. This meeting will be a floor forexchanging ideas, knowledge and experiences that can benefit not onlyagriculture in the wider context, but also the research and education communityin the Faculty of Agriculture, as well as Chiang Mai University.
Now, it is an auspicious moment that I wish to be granted the permissionfrom Your Royal Highness to present Mr. Pongsak Angkasith, Dean of Facultyof Agriculture, and Mr. E. Wyss, President of IPI, to give their reports,respectively, concerning the 24th International Colloquium. And after that, Iwish to request Your Royal Highness to give an inaugural address to thisColloquium as a blessing for all of us, participants and guests.
May it please Your Royal Highness.
II
Report to Her Royal Highness Princess MahaChakri Sirindhorn
Pongsak AngkasithDean of the Faculty of Agriculture, Chiang Mai University, Chiang Mai, Thailand
Your Royal Highness,
I, Mr. Pongsak Angkasith, the Dean of the Faculty of Agriculture, Chiang
Mai University, as the Chairman of the organizing committee for the 24thInternational Colloquium on "Potassium in Asia" wish to express on behalf of
the committee and the participants our utmost gratitude and appreciation for thegracious presence of Your Royal Highness to open our colloquium today.
The Faculty of Agriculture, Chiang Mai University, not only has fulfilled its
commitment to produce graduates in various disciplines of agricultural sciencesand related fields in Bachelor, Master and Doctoral degree levels, but it has alsoencouraged and supported its academic and technical staff to undertake a diver-
sity of researches to enhance the quality of education as well to contribute to thedevelopment of agriculture which is the principal occupation and fundamental
to livelihood of the majority Thai population. Among various areas of agricultu-ral research, soil science and conservation is one of the important componentsfor the knowledge and understanding about soils, appropriate fertilization and
land management for different types of cultivation. At the more specific level,major soil nutrients like nitrogen, phosphorus, and potassium are essentialelements for plant growth and productivity which needs to be better understood.
This International Colloquium on "Potassium in Asia" focusing on
fertilization for effective increase in agricultural productivity and enrichment in
soil conditions is, therefore, highly relevant to our particular concern in thedevelopment of body of knowledge in these fields.
The International Colloquium on Potassium has been held for 24 times,
including the present one, and this is the second time taking place in Thailand.The objective of the present colloquium is to provide a floor for discussion andpresentation about research works concerning fertilization to increase and
sustain agricultural productivity. At this meeting, research works will be
presented in panel sessions covering 29 topics and in poster session covering 18subjects. In addition to presentation and group discussion, field excursion willalso be organized for interest individuals to study land management practices
and projects for irrigated and highland agriculture in Chiang Mai areas.
13

At this International Colloquium, there are about 200 participants fromvarious countries including USA, England, Germany, Australia, Switzerlandand others, as well as Thailand, spending four days together for the presentendeavour. The International Potash Institute in Switzerland is the main sourceof financial support and has coordinated with scientists and researchers from allover the world to make the present convention materialized. The wholeparticipation and supports are indeed a good sign of cooperation to work foragricultural advancement. We also look forward to future collaboration inresearches on soil and fertilizer management for sustainable development.
Now, it is the auspicious moment that I wish to request Your RoyalHighness to give an inaugural address to open the 24th InternationalColloquium on "Potassium in Asia".
May it please Your Royal Highness.
14

Report to Her Royal Highness Princess MahaChakri Sirindhorn
E. WyssPresident, International Potash Institute, P.O. Box 1609, CH-4001 Basel, Switzerland
Royal Highness,Honourable Governor,President of Chiang Mai University,Distinguished Guests,Ladies and Gentlemen,
It is a great honour and privilege to report to her Royal Highness and towelcome the esteemed guests and delegates on behalf of the InternationalPotash Institute to the 24th Colloquium on "Balanced fertilization to increaseand sustain agricultural production".
It gives me a great pleasure and satisfaction to report that more than 200registered participants have responded to the announcement of the InternationalPotash Institute to gather at the Chiang Mai University to discuss and exchangefindings and views on how best to increase and sustain agricultural production.
We are indeed very grateful to the Government of Thailand and theUniversity of Chiang Mai to host the 24th IPI Colloquium. But you may ask:
- who is IPI, and,- why are we coming to Thailand.
The IPI, founded in 1952 and located in Basel/Switzerland, is a non-governmental scientific organization with the aim to promote worldwide the useof balanced fertilization.
The importance of balanced fertilization cannot repeatedly be proclaimedenough, its impact on soil fertility, crop production, farmers income, is ofutmost significance to the social prosperity as well as to the health of theenvironment.
Producers in Europe, FSU included, and the Near East are Members of theInstitute and united by a common aim: to encourage agricultural research withregard to potassium.
15
The main purposes of IPI are therefore:- to stimulate on-farm research on the use of balanced fertilization with
potash in order to address and to educate the farmer,- to compile - transform - and disseminate knowledge on the effect of
balanced fertilization,- and thus, to bridge the gap in knowledge between research and the
farmer.
On-farm research is done in cooperation with national and internationalresearch and advisory institutes all over the world. This is coordinated byagronomists appointed to the IPI within different regions, namely South EastAsia, China, India, West Asia, North Africa, Southern Africa, Central Europeand the FSU.
Publications of international as well as national findings in form of leaflets,booklets and periodicals are the messenger to transmit the information.
A selection of IPI publications is available in front of the conference halland reflects the large variety. Increasingly, IPI publishes in cooperation withscientists from the regions in the local languages in order to address a wideraudience.
Workshops and seminars focus on nationally or even internationally relevantaspects. They are frequently held. The audience addressed by these events aremainly advisors from the advisory departments, advanced farmers and membersfrom the agricultural administration.
And, finally, colloquia like today are thought to cover relevant subjects onplant nutrition for a whole region. So far, 23 colloquia were held till now, 3 ofthem in Asia. The audience which we would like to address is the InternationalCommunity of agricultural researchers, advisors and decision makers. Theinformation gathered during these events is made available to everybodyinvolved in these disciplines in an appropriate way.
And now, why have we intended to be today in Chiang Mai in Thailand ?There are 3 very clear answers:
First, the last IPI Colloquium in Asia was held 10 years ago, incidently inBangkok/Thailand. So, it appeared to be high time to come to Asia again.
Second, the question of balanced fertilization has become the most vitalissue, especially in the South Asian Region.
- agriculture is a major cornerstone in the economy of most countries of theregion (in Thailand, 63% of the economically active population isemployed in agriculture),
16

- exports of agricultural products contribute considerably to the foreignexchange earnings of those countries,
- countries in this region are also confronted with a substantially increasingpopulation pressure,
- but, land reserves for crop production are more or less exhausted unlessone accepts further clearing of the rainforest or cultivation of marginalland, both of which are not acceptable from the ecological point of view.
And last but not least, Thailand is placed in the heart of South East Asia.Thailand's ecology, including climate and soils, is representative for numerouscountries in this region. The problems and constraints to sustained agriculturaldevelopment is similar to many countries from where we can welcome thenumerous participants today.
Being aware that this event here is just one step of the many required for thesuccess, I would like to finish with the words of a banker and leave the floor forthe agricultural experts with the story about the butcher and the banker:
A very good client was entering the butcher's shop and asked the butcher tolend him 1000 Bahts. The butcher did not know how to evade this issue but,after some time, he answered: "1 would love to oblige, but I have an agreementwith the banker. He does not sell meat and I do not lend money!"
I guess you may understand that I have a similar agreement with our highlyrespected scientists: they do not give advice about finance and I do not giveadvice about agriculture.
Therefore, I am sure you do not expect me to give you anymore technicalinformation. I would like to leave this to the scientists.
So let me now come to an end:
I wish on behalf of IPI:* to thank Her Royal Highness for her presence,* to thank the Chiang Mai University again for being the host,* to thank the organizing committee for arranging the Colloquium.
We all hope you have an enjoyable time and that the meeting provesrewarding not only in scientific matters, but also through enhancing personalrelationships which will lead to a better understanding to the benefit of all.
Thank you very much.
17
Welcome Address and Official Opening
HRH Princess Maha Chakri SirindhornChiang Mai, Thailand
It is my pleasure to be here to open the 24th International Colloquium on"Potassium in Asia" held by the Faculty of Agriculture, Chiang Mai Universityand the International Potash Institute.
As I have learned from the earlier reports, this International Colloquium hasbeen organized with a major objective to facilitate the exchange of ideas amongscientists of various backgrounds in the areas of soil management andappropriate fertilization to enhance agricultural productivity and to maintain the
ecological stability in natural resources and environmental systems. Thisconvention indeed addresses a subject which is very critical for agriculturaldevelopment in Thailand as well as in other countries. Meanwhile, the presenceof scientists and scholars from all over the world at this gathering is alsosignificant in the premise that collaborative efforts can be initiated andstrenghened to undertake researches and studies to deal with problems inagriculture and the environment.
Agriculture is most fundamental for human survival and livelihood. Allnations on this one earth do cultivate to produce food as a principal occupation,and so does Thailand where predominant portion of its population still practiceagriculture as main source of economic well-being. Nevertheless, if concernover agriculture were placed solely on the production aspect without giving a
heed to the stability of the natural resource base, then, many damages to menand nature can occur as consequence. Only scientific research and technologicaldevelopment attempting to increase agricultural productivity and also sustainenvironmental and natural resource quality can contribute to development in thedesirable nature. This International Colloquium, particularly, will represent andprovide an excellent opportunity for all distinguished participants to spend timediscussing, analyzing, and exchanging knowledge and opinions from the perspec-tives of different countries and experiences to generate the most fruitful results.
I wish the 24th International Colloquium on "Potassium in Asia" here a great
success, achieving all goals and objectives as intended. I hope all participantscan bring additional knowledge and useful ideas gained from the present forumfor further application to foster agricultural development in your own countryand elsewhere in the world. And finally, I wish all of you hapiness and anenjoyable stay in Chiang Mai.
19

Population Growth and Food Security in Asia
H.R. von Uexkfll
Former Director International Potash Institute and Potash and PhosphateInstitute, East and Southeast Asia Program, Singapore.
Summary
The first part of the paper discusses general trends in world population and
compares it with population growth in the various sub-regions of Asia. Data on
changes in population and cropped area are provided to illustrate the very
special case of Asia where there is very little room left for a further expansion
of agricultural land.The second part of the paper analyses the combined impact of population
growth and rapid economic development on food demand. Changes in eating
habits, resulting from rising incomes, will require considerable changes in the
structure of agriculture in many Asian countries where agriculture at present is
centered around irrigated rice. This chapter concludes that in the years to come,
rising per capita incomes will have a stronger influence on food demand in gene-
ral, and the composition of the diet in particular than population growth per se.
Past and potential future sources of food supply in Asia are the topic of the
third part of the paper. Incremental gains in food supply in Asia over the past
thirty years have largely come as a result of the successful introduction of
science-based agriculture, with emphasis on two crops: rice and wheat. This
development has been termed the "Green Revolution". Virtually all gains came
from increases in yield per hectare. The potential yield in the traditional farming
systems is now largely exploited and to secure the future, Asia will have to look
increasingly for other and additional sources of food supply.Future food supply can come from three different sources: expansion of
arable land, intensification and imports.The paper concludes that the possibilities for the expansion of arable land
following traditional patterns are very limited. There is, however, still a large
potential in the acid upland soils of the tropics that have resisted sustainable use
for agriculture under conventional management systems with minimal inputs
but that can be made highly productive by using proper, modem technologies.
There will be increasing needs for more imports, but the paper cautions that
the availability of reasonably priced food will be increasingly limited. As many
countries with huge populations will be competing for limited food stocks, the
need for imports should be minimized as far as possible by increasing domestic
efforts to produce more food.
21

The paper ends with a plea to focus future efforts on the neglected rainfeduplands. It is in the acid soils of the uplands where there are still some landreserves and where current yields are still low and unstable. Furthermore, it is inthese areas where there is the biggest potential to increase food output and toproduce the kind of food a more affluent population will demand in the future.
1. Introduction
Food security is the very basis for economic, social and culturaldevelopment and for political stability. In this regard, over the past threedecades, Asia has performed in every respect better than the other continents, inspite of having to feed about 60% of the world's population on less than 25% ofthe land area available for food production. But can this momentum bemaintained? During the last decade of this century, Asia will have to providefood for an additional 600 million people. This corresponds to about 75% of thepresent combined population of Africa and South America. Moreover, rapidlyincreasing incomes in many Asian countries are expected to contribute more tothe increasing future food demand than population growth alone.
In the past, the productivity of Asian agriculture has more than kept pacewith the combined effects on food demand of population growth and increasingper capita income. Between 1965 and 1994, per capita supply of food calories inAsia increased by more than 30% for a population that increased by more thanone billion. However, most of the rapid increase in food output over the past 30years has been obtained from a rather narrow base. Nearly all the gains inagricultural productivity came from either the irrigated lowlands or from highbase saturation upland soils. Comer stones which underpinned the past successof Asia's agriculture were:- the rapid expansion of irrigated land,- the successful breeding and introduction of high yielding, photo-period
insensitive, fertilizer responsive varieties of rice and wheat, and lately also theintroduction of high-yielding, disease resistant hybrid maize,
- the very fast increase in the supply and use of cheap (nitrogen) fertilizer.In the future, it will not be possible to rely on these options alone for increasesin food output because:- the scope for a further expansion of land under (controlled) irrigation is very
limited,- virtually all high base saturation soils with good topography and a suitable
climate are already under cultivation,- the possibilities for another quantum jump in the yield potential of new rice
and wheat (and maize) varieties are very limited, except perhaps for hybrid rice,
22

- in most areas with good water control, fertilizer (nitrogen) usage levels areapproaching, and in many cases even exceeding the optimum,
- more good arable land is lost every year to housing, industry andinfrastructure development than is being added through land reclamation orland development.
Since most of the easy and inexpensive opportunities for increasing foodproduction on existing land have already been exploited, farmers, researchers,national planners and policy-makers will have to find new approaches to foodproduction or food supply to meet not only the growing basic food needs, butalso a more diversified demand of a growing and more affluent population.
2. Trends in world population
Currently the world population stands at about 5.3 billion. During the 1990s,world population is estimated to grow by nearly one billion with another billionpeople being added during the first decade of the 21st century.
A "medium" projection assumes a world population of 6.2 billion by theyear 2000 and about 8.3 billion by 2025, before perhaps stabilising at about 10billion at the end of the 21 st century (Table 1).
Table I. Trends in world population (Table 26 in World Development Report1993).
Region Population in millions % increase1990 2000 2025 1990-2025
Low & middle income economies:- Sub-Saharan Africa 495 668 1229 153- Middle East & N. Africa 256 341 515 101- Latin America & Caribbean 433 515 699 61- Europe 200 217 252 26- South Asia 1148 1377 1896 65- East Asia & Pacific 1677 1818 2276 36Sub-total 4199 4934 6867 63
Other economies 321 345 355 11
High income economies I 816 858 915 12
World 5336 6139 8137 53
This classification includes the former Soviet Union, Cuba and the People's
Republic of Korea for which unreliable or inadequate data is available.
23
Population growth rates in most of developing Asia are smaller than in otherregions or in continents comprising low and middle income economies.However, total population growth is still by far largest in the Asia and Pacificregion, due to Asia's very large population base.
Most frightening is the projected population growth for Sub-Saharan Africa,since this region is not even able to provide adequate food for its presentpopulation.
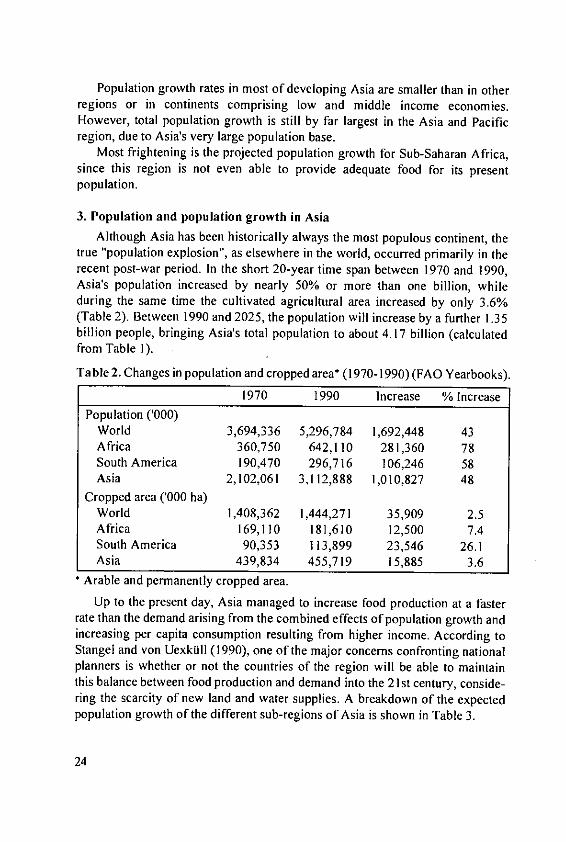
3. Population and population growth in AsiaAlthough Asia has been historically always the most populous continent, the
true "population explosion", as elsewhere in the world, occurred primarily in therecent post-war period. In the short 20-year time span between 1970 and 1990,Asia's population increased by nearly 50% or more than one billion, whileduring the same time the cultivated agricultural area increased by only 3.6%(Table 2). Between 1990 and 2025, the population will increase by a further 1.35billion people, bringing Asia's total population to about 4.17 billion (calculatedfrom Table I).
Table 2. Changes in population and cropped area* (1970-1990) (FAO Yearbooks).
1970 1990 Increase % Increase
Population ('000)World 3,694,336 5,296,784 1,692,448 43Africa 360,750 642,110 281,360 78South America 190,470 296,716 106,246 58Asia 2,102,061 3,112,888 1,010,827 48
Cropped area ('000 ha)World 1,408,362 1,444,271 35,909 2.5Africa 169,110 181,610 12,500 7.4South America 90,353 113,899 23,546 26.1Asia 439,834 455,719 15,885 3.6
Arable and permanently cropped area.
Up to the present day, Asia managed to increase food production at a fasterrate than the demand arising from the combined effects of population growth andincreasing per capita consumption resulting from higher income. According toStangel and von Uexktill (1990), one of the major concerns confronting nationalplanners is whether or not the countries of the region will be able to maintainthis balance between food production and demand into the 21 st century, conside-ring the scarcity of new land and water supplies. A breakdown of the expectedpopulation growth of the different sub-regions of Asia is shown in Table 3.
24
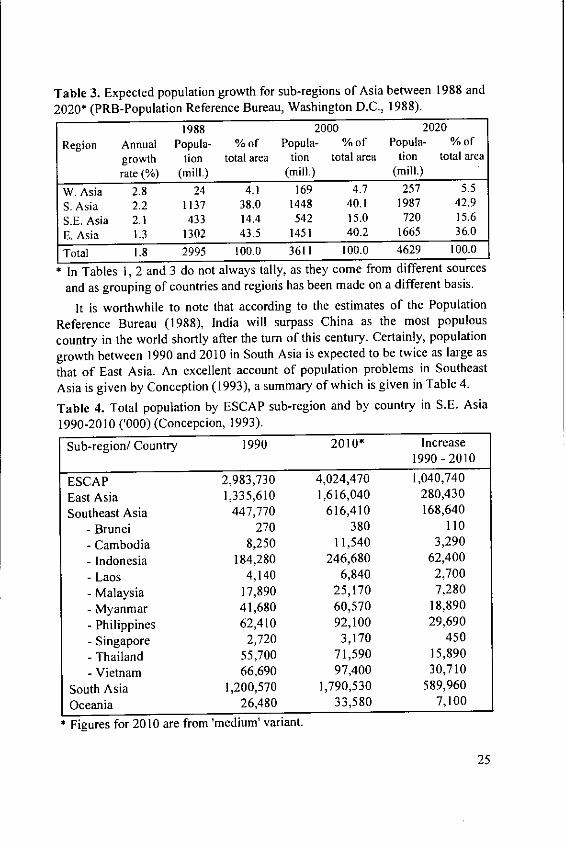
Table 3. Expected population growth for sub-regions of Asia between 1988 and2020* (PRB-Population Reference Bureau, Washington D.C., 1988).
1988 2000 2020Region Annual Popula- % of Popula- % of Popula- % of
growth tion total area tion total area tion total area
rate (%/) (mill.) (mill.) (mill.)
W. Asia 2.8 24 4.1 169 4.7 257 5.5
S. Asia 2.2 1137 38.0 1448 40.1 1987 42.9
S.E. Asia 2.1 433 14.4 542 15.0 720 15.6E. Asia 1.3 1302 43.5 1451 40.2 1665 36.0
Total 1.8 2995 100.0 3611 100.0 4629 100.0
In Tables 1, 2 and 3 do not always tally, as they come from different sources
and as grouping of countries and regions has been made on a different basis.
It is worthwhile to note that according to the estimates of the Population
Reference Bureau (1988), India will surpass China as the most populous
country in the world shortly after the turn of this century. Certainly, population
growth between 1990 and 2010 in South Asia is expected to be twice as large as
that of East Asia. An excellent account of population problems in Southeast
Asia is given by Conception (1993), a summary of which is given in Table 4.
Table 4. Total population by ESCAP sub-region and by country in S.E. Asia
1990-2010 ('000) (Concepcion, 1993).
Sub-region/ Country 1990 2010* Increase1990-2010
ESCAP 2,983,730 4,024,470 1,040,740East Asia 1,335,610 1,616,040 280,430
Southeast Asia 447,770 616,410 168,640-Brunei 270 380 110
- Cambodia 8,250 11,540 3,290
- Indonesia 184,280 246,680 62,400
- Laos 4,140 6,840 2,700
- Malaysia 17,890 25,170 7,280
- Myanmar 41,680 60,570 18,890- Philippines 62,410 92,100 29,690- Singapore 2,720 3,170 450
- Thailand 55,700 71,590 15,890- Vietnam 66,690 97,400 30,710
South Asia 1,200,570 1,790,530 589,960Oceania 26,480 33,580 7,100
Figures for 20 10 are from 'medium' variant.
25
South and Southeast Asia are the most densely populated regions in thetropics, but there is great demographic diversity. Disregarding Singapore as acity state, the most densely populated countries are the Philippines and Vietnam,with population densities of 208 persons km-2 in 1990 increasing to 307 personskm- 2 by the year 2010. At the other end of the scale is Papua New Guinea witha population density of 8 persons km-2 in 1990 projected to reach only 13persons km-2 in 2010.
4. Effect of population growth and economic development on food demand
Food demand in Asia will grow at a much faster rate than in the rest of theworld. This is due to two factors: rapid population growth and rapid increase inper capita income.
Eating habits change in many ways with increasing income. Starting from astarvation base, the following sequence in eating habits can be observed withincreasing incomes:0 Increase in the consumption of cheapest starchy food (root crops)
% Substitution of root crops by grains (in Asia mainly from sweet potatoand cassava to rice)% Rice is partially and increasingly substituted by wheat products
% Eventually the contribution of carbohydrates to the total calorieintake decreases and their place is taken by animal products(meat, eggs, milk and milk products), vegetables and fruits.
In Japan, over the last thirty years, rice consumption decreased from 115 kgto 70 kg per capita year-1 while at the same time the consumption of wheat pro-ducts increased from 25 kg to 32 kg, meat from 5 kg to 28 kg and milk and milkproducts from 22 kg to 63 kg per capita year- 1. Past and future changes in theper capita consumption of major food items in Indonesia are given in Table 5.
Such dietary changes resulting from increased income have severalimportant consequences, especially for Asia:I. With more meat in the diet, total grain requirements increase steeply (9 kg of
grain are needed to produce 1 kg of meat).2. Efficient production of animals and fruit is rarely possible on rice land
which is currently the backbone of agriculture in most of Asia.3. The future the demand for coarse grains is expected to grow at a much faster
rate than that for rice.
According to data from IRRI (1993) in 1991 rice provided 58% of the totalcalorific supply in Indonesia. By the year 2025, this is expected to drop to 46%while at the same time the contribution from non-rice sources will grow from
26

42% to 54%. Translated into metric tons of food, this means that in Indonesiathe demand for non-rice food sources will grow from 27.9 M tons in 1991 to75.4 M tons in the year 2025.
Table 5. Trends in the per capita consumption of major food items in Indonesia,1970 - 2010 (kg/year) (IRRI, 1993; Pasandaran, 1994; own estimates for years2010 and 2020).
Year Rice Maize Wheat Cassava Soybean
1970 109 20 4 63 4
1980 122 24 8 67 5
1990 148 37 10 52 10
2000 152 49 12 48 14
2010 146 60 15 42 17
Year Sugar Fruits Vegetables Fish Meat
1970 7 27 19 10 3
1980 12 26 16 12 3
1990 13 32 21 14 7
2000 15 35 23 15 9
2010 17 40 26 18 1I
2020 20 43 29 19 14
Affluent countries in Asia, such as Japan, South Korea and China (Taiwan)now face the problem that their agriculture is producing a surplus of rice, but atthe same time, there are increasing deficits of wheat and feed grains, which haveto be largely imported. With further economic development and a slow-down inpopulation growth, other rapidly developing Asian countries, such as China,Malaysia, Indonesia and Thailand will face similar problems in the future.
The world famous Nobel laureate, Norman Borlaug, pointed out that ifmankind was satisfied with a diet that consisted of 92% plant products (mainlycereals), the world's food output in 1990 would have provided an adequate diet(2,350 calories per capita, principally from grain) for 6.2 billion people - nearlyone billion more than the actual population (Borlaug and Dowswell, 1994).However, had the people in Third World countries attempted to obtain 30% oftheir calories from animal products - as in W. Europe or in North America - aworld population of only 2.5 billion people could have been sustained - lessthan half of the present world population.
Borlaug's argument suggests that in the years to come, rising per capitaincomes in Asia will have a stronger influence on food demand than populationgrowth per se.
27

In absolute numbers, Asia has still the largest number of poor people, butwhile both the percentage of the population and the absolute number of poorpeople in Asia is decreasing, the opposite is true for the other continents as canbe seen in Table 6.
Table 6. Poverty* in the Developing World, 1985 - 2000 (World DevelopmentReport, 1992, adapted from Borlaug and Dowswell, 1994).
Region % population below the Number of poor (millions)poverty line
1985 1990 2000 1985 1990 2000South Asia 52 49 37 532 562 511East Asia 13 I1 4 182 169 73Sub-Saharan Africa 48 48 50 184 216 304Mideast & N. Africa 31 33 31 60 73 89Eastern Europe** 7 7 6 5 5 4Latin America & Carib. 22 25 25 87 108 126Total (all developing) 31 30 24 1051 1113 1107
US$ 370 annual per capita income in 1985 purchasing power parity is used as thepoverty line. In 1990, the poverty line would be approximately US$ 420 annualincome per capita.
** Does not include the former USSR.
5. Past and future sources of food supply
5.1. The pastIncremental gains in food supply in Asia over the past thirty years have
largely come as a result bf the successful introduction of science-basedagriculture, with the emphasis on two crops: rice and wheat. This developmenthas been termed "the Green Revolution". Before the onset of the GreenRevolution in the late 1960's, the most famine-plagued regions of the worldwere in South and East Asia. In the meantime, per capita supplies of food haveincreased from 1,725 to more than 2,400 calories per capita day-] in East Asiaand from 1,725 to 2,200 calories per capita day-1 in South Asia. It has to beremembered that this increase in per capita food supply occurred in spite ofrapid population growth.
Virtually all production gains came from increases in yield per hectare. Forrice, it was mainly the area under controlled irrigation in the tropics thatbenefited from Green Revolution technology, whilst for wheat it was limited tosome areas with high base saturation soils in sub-tropical regions (e.g. thePunjab in India, parts of Pakistan, the Middle East and China).
28
In these areas, farmers could use large amounts of (nitrogen) fertilizer on the
new responsive varieties at very low risk and obtain large yield increases. Thepotential yield in these farming systems is now nearly fully exploited. For future
gains, Asia will have to look for other and additional avenues to increase food
production, all of which will be more complex. Yields of wheat and rice nearly
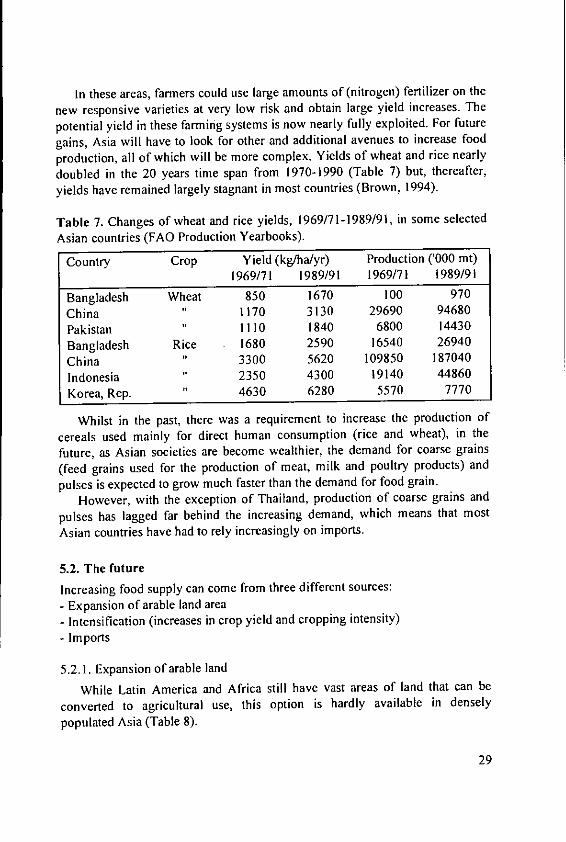
doubled in the 20 years time span from 1970-1990 (Table 7) but, thereafter,yields have remained largely stagnant in most countries (Brown, 1994).
Table 7. Changes of wheat and rice yields, 1969/71-1989/91, in some selected
Asian countries (FAO Production Yearbooks).
Country Crop Yield (kg/ha/yr) Production ('000 mt)1969/71 1989/91 1969/71 1989/91
Bangladesh Wheat 850 1670 100 970
China 1170 3130 29690 94680
Pakistan 1110 1840 6800 14430
Bangladesh Rice 1680 2590 16540 26940
China 3300 5620 109850 187040
Indonesia 2350 4300 19140 44860
Korea, Rep. 4630 6280 5570 7770
Whilst in the past, there was a requirement to increase the production of
cereals used mainly for direct human consumption (rice and wheat), in the
future, as Asian societies are become wealthier, the demand for coarse grains
(feed grains used for the production of meat, milk and poultry products) and
pulses is expected to grow much faster than the demand for food grain.
However, with the exception of Thailand, production of coarse grains and
pulses has lagged far behind the increasing demand, which means that most
Asian countries have had to rely increasingly on imports.
5.2. The future
Increasing food supply can come from three different sources:- Expansion of arable land area- Intensification (increases in crop yield and cropping intensity)- Imports
5.2.1. Expansion of arable land
While Latin America and Africa still have vast areas of land that can be
converted to agricultural use, this option is hardly available in densely
populated Asia (Table 8).
29

Table 8. Potential cropland in Asia, Africa and Latin America (M ha).
Southwest Southeast Central Africa South CentralAsia Asia Asia America America
Potentially 48 297 127 789 819 75cultivablePresently 59 274 113 168 124 38cultivatedUncultivated 0 23 14 621 695 37% of the region 0 8 I1 79 85 52
Source: adapted from Borlaug and Dowswell, 1994 (after Buringh and Dudal,1987).
Data provided by Greenland et al (1994) show that land for furtherdevelopment will have almost disappeared by 2025 (Fig. 1).
25
~,20 0202599
0 150o
A 10E
0 F-Ff1 f-f- H 7 - r-1
0.1 0.2 0.3 0.4 0.5 0.6 0.7
Per caput cropland (ha)
Fig. 1. Per caput cropland in 1990 and 2025 in Asia (Greenland et al., 1994).
On the contrary, currently in many Asian countries more good land is beinglost due to housing, industry and infrastructure development than can be gainedthrough land reclamation or land clearing. China alone is currently loosing300,000 ha of prime agricultural land per year. Losses of good agricultural landare also serious in Indonesia, the Philippines, Thailand and Vietnam.
30

According to the data in Table 8, only 37 million ha of potentially cultivableland are left in Asia, and in S.W. Asia the limit of cultivable land has even beenexceeded by 11 M ha presumably as agriculture has expanded into areas riot
suited to crop production.However, the author does not fully agree with this assessment. There are still
large areas in Asia and especially in S.E. Asia under soils that were not
considered suitable for agricultural development under traditional management
systems with zero external inputs. These areas can be made highly productive
after the main constraints, such as toxicity's, nutrient deficiencies and poordrainage have been removed.
A potential land reserve for food production in tropical Asia therefore exists
in peat soil areas and in the acid soils, which have been termed as "ProblemSoils" in the past (von Uexkflll, 1982).
Currently much attention is being paid to the possibility to develop some of
the 39 million ha of swamp lands that exist in Indonesia alone (Pasandaran,1994), but the development of peat soils for agricultural use in the tropics
requires very considerable initial investments in drainage and infrastructure.Also their permanent use for annual crop production may not be sustainable due
to the oxidation of organic matter and the resulting shrinkage once the soil is
drained. Moreover, peat soils in the tropics should not be overexploited as they
may be more important for reasons of hydrology and bio-diversity than as a
fragile basis for food production.But, there are good prospects for some of the acid soils in Asia that are
currently idling. According to Sanchez and Smyth (1987) acid tropical soils,classified mainly as Oxisols and Ultisols represent the largest block of the
world's potentially arable land. In tropical Asia alone there are 264 million ha of
such lands (Table 9).
Table 9. Extent of acid soils in tropical Asia (Sanchez and Smyth, 1987).
Country Million ha % of total land area
China (tropical) 16 48
India 43 13Indonesia 82 43
Malaysia 24 72
Papua New Guinea 8 17
Philippines 17 58Thailand 51 82
Vietnam 23 70
Total (8 countries) 264 79
31
A detailed account of the global extent, development and economic impactof acid soils is given by von Uexkall and Mutert (1993).
Until recently, most of the acid soils in the tropics were covered by tropicalrain forest. Destructive exploitation of timber and abusive "modern" shiftingcultivation, as practised by inexperienced in-migrants has caused worldwidelosses of at least 250 million ha of tropical rain forests during the second half ofthis century, and left behind vast areas of unproductive anthropic savannahs(dominated by the grass Imperata Cylindrica) on heavily eroded and degradedacid soils.
Large scale trials and demonstrations, initiated by the Potash & PhosphateInstitute in Singapore (von Uexk[Ill and Mutert, 1993) have convincingly shownthat such soils can not only be rehabilitated, but that they can be made highlyproductive on a sustainable basis, provided that sufficient initial inputs are usedto eliminate basic constraints caused by low soil pH (and associated aluminiumtoxicity) and small amounts of nutrients (particularly phosphorus).
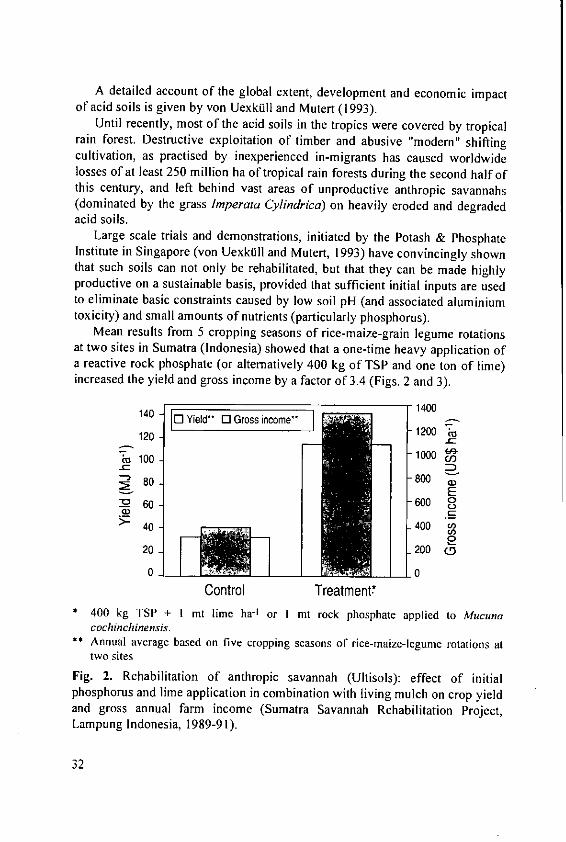
Mean results from 5 cropping seasons of rice-maize-grain legume rotationsat two sites in Sumatra (Indonesia) showed that a one-time heavy application ofa reactive rock phosphate (or alternatively 400 kg of TSP and one ton of lime)increased the yield and gross income by a factor of 3.4 (Figs. 2 and 3).
140- 1 Yield- 0 Gross income" 1400
120 -1200
CO 100 "1000
80 - 80080. E60 -600 o
>- 40 .400
20 200 D
0 0
Control Treatment!* 400 kg TSP + I mt lime ha- or I mt rock phosphate applied to Mucuna
cochinchinensis.** Annual average based on five cropping seasons of rice-maize-legume rotations at
two sitesFig. 2. Rehabilitation of anthropic savannah (Ultisols): effect of initialphosphorus and lime application in combination with living mulch on crop yieldand gross annual farm income (Sumatra Savannah Rehabilitation Project,Lampung Indonesia, 1989-91).
32
Us$1.600 US$2,6.
US$1.400 US$1,400 US$ 271
US$1.200 us$1200C Cteks
US$ 1.00 Seeds US$10 US$559 rECkensUS$ 800 Rock phosphate US$800 I Ma
US$600 * N & K fertiers US$ 600 --US$480 C0 A rochernicais US40US$ 400 US$ 400
Us$ 200 US$200
US$0 US$ 0Inputs Outputs
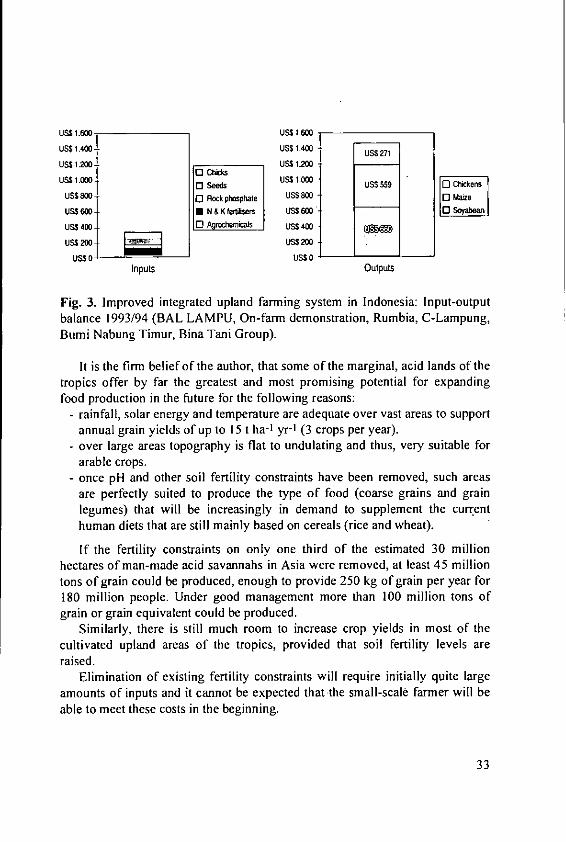
Fig. 3. Improved integrated upland farming system in Indonesia: Input-outputbalance 1993/94 (BAL LAMPU, On-farm demonstration, Rumbia, C-Lampung,Bumi Nabung Timur, Bina Tani Group).
It is the firm belief of the author, that some of the marginal, acid lands of thetropics offer by far the greatest and most promising potential for expandingfood production in the future for the following reasons:
- rainfall, solar energy and temperature are adequate over vast areas to supportannual grain yields of up to 15 t ha-1 yr-I (3 crops per year).
- over large areas topography is flat to undulating and thus, very suitable forarable crops.
- once pH and other soil fertility constraints have been removed, such areasare perfectly suited to produce the type of food (coarse grains and grainlegumes) that will be increasingly in demand to supplement the currenthuman diets that are still mainly based on cereals (rice and wheat).
If the fertility constraints on only one third of the estimated 30 millionhectares of man-made acid savannahs in Asia were removed, at least 45 milliontons of grain could be produced, enough to provide 250 kg of grain per year for180 million people. Under good management more than 100 million tons ofgrain or grain equivalent could be produced.
Similarly, there is still much room to increase crop yields in most of thecultivated upland areas of the tropics, provided that soil fertility levels areraised.
Elimination of existing fertility constraints will require initially quite largeamounts of inputs and it cannot be expected that the small-scale farmer will beable to meet these costs in the beginning.
33

To activate the huge potential that rests in the unproductive man-madesavannahs of the tropics in Asia a comprehensive, well coordinated programwould be required that would provide:
- initial financing (about US$ 750 ha-1 for inputs and infrastructure),- research, training and extension,- initial assistance in markets (inputs and outputs).
Only when adequate funds and technical assistance are provided at theoutset can wealth be generated in areas where the potentially productive landlies. The population in these areas contribute a large proportion of the remainingrural poor who also function as unpaid custodians of the upland ecosystem.Successful transformation of unproductive, acid soils can also be the mosteffective way to slow down the destruction of the tropical rain forest.
The agroclimatic potential of the acid soils in the tropics is best illustrated bythe performance of the oil palm, which as a forest plant, is well adapted to soilacidity related problems. Most of the world's oil palms are grown on acid soils.Under good management and with adequate fertilizer inputs, oil palms haveproduced more than 9,200 kg of oil ha-I yr 1 (von Uexkall and Fairhurst, 1991).In terms of energy equivalents, this corresponds to about 26 tons of grain perhectare. At present oil palms produce about 22% of vegetable oils producedworldwide, but on a mere 2% of the total acreage planted to oil crops (Fig. 4).
Area planted to oil crops Vegetable oil production
Oil palmCoconut 2% Sunflower Coeot Oil palm
13% 24% 6% 22%
Soyabean Groundnut 29%Sunler
36% 6% 4%Coron Rapeseed Coron Groundnut8% 11 % Rapeseed
7% 15% 5%
Fig. 4. Area planted to selected oil crops and their contribution to totalvegetable oil production (Mutert, private communication).
This means that the oil palm, grown on naturally low fertility status acidsoils is producing about eleven times as more oil per unit area than the averageof all main oil crops, nearly all of which are grown on high base saturation soils.
34

5.2.2. Intensification
Most of the gains in Asia's food production over the past 25 years havecome as a result of intensification or increases in production on existing land.Major components of intensification are:
- increases and/or improvements in irrigation (permitting multiple croppingand/or reducing risk and increasing fertilizer use efficiency),
- use of modem, fertilizer responsive varieties,- increased use of fertilizer (both in total quantity as well as improved nutrient
balance),- improved disease and pest control,- increased cropping intensity (made possible through the use of e.g. varieties
with shorter growth period, faster tillage techniques),- increase in farmers' management skills.
As there is very little chance to increase the area under arable land (otherthan on the acid soils), intensification will have to remain one of the mainvehicles for future increases in food output. But, future gains will not come aseasy as they have come during the past 30 years for the following reasons:
- there is not much room left to expand the area under irrigation,- modem, high yielding varieties are already planted on most of the suitable
land,- nitrogen fertilizer rates applied by farmers already often exceed the agronomic
and economic optimum,- even to maintain high yields at the present level, on many soils more fertilizer
(other than nitrogen) will have to be used to compensate the heavy nutrientremoval.
All this means that future yield increases on existing land will be moredifficult and also more expensive because heavier outside inputs will berequired. Fortunately, poverty in Asia is on the decline and there is thus anincreasing segment of the population that can afford to pay realistic prices forfood that not only cover cost of production, but that leave farmers withsufficient incentives to produce more food.
Recently, largely as a combined result of environmental concerns,agricultural surpluses in the affluent countries and inadequate research into thehistory of agriculture organic farming has been re-invented. Can organicfarming solve Asia's food problems and/or replace a mineral fertilizer basedmodem agriculture? This is what some people suggest (Blake, 1994). In hiskeynote speech on the occasion of the 12th Meeting of the Technical AdvisoryCommittee of the Food and Fertilizer Technology Centre in Taipei, China,
35
Blobaum (1994) cites a United Nations report that states:"... If conventionalagriculture (meaning modern agriculture) had been made to pay for thedegradation and environmental damage it is causing, the move toward organicagriculture would have been made long ago."
By comparing "conventional" agriculture with "organic" agriculture, thisstatement suggests that organic agriculture is a new development. The fact isthat until very recently mankind and agriculture survived on the basis of organicagriculture, as there was no other alternative. Until 1955, Chinese agriculturerelied entirely on farmers practising organic farming. Organic farming shouldbe the basis of sound crop husbandry, but organic farming alone could not evenfeed half of the present, not to speak of the future world population.
With increasing yields, increasing amounts of nutrients are being removedwith the exported crops and such nutrients have to be replenished, largelythrough the discriminate and balanced use of commercial fertilizers. Organicfarming without the supplement of commercial fertilizer is only an option for alimited number of farmers in the industrialised countries, where total fooddemand is either not growing any more or is shrinking and where soil fertilityhas been built up in the recent past through heavy use of mineral (commercial)fertilizers and by-products of industry (e.g. basic slag).
5.2.3. Imports
No matter how great the future efforts to increase food production, there willbe a rapidly growing need in many countries for more food imports, inparticular wheat and maize. But, as many countries with huge populations willbe competing for food stocks, such imports should be minimised as far aspossible by increasing domestic efforts to produce more of crops such as maize,and pulses such as soybean and mungbean.
dne has to be aware of the fact that the availability of reasonably pricedfood for exports will be increasingly limited. China's GDP has been growing atstaggering rates of 10 to 14% per annum and this over a population base ofmore than 1.2 billion. According to Brown (1994), China's grain import needsalone could exceed the world's current total exported grain supplies by the year2025.
No doubt, prices for imported food will increase steeply in the future.Money used to import food deprives the country of funds that could otherwisebe used for economic development, so reliance on food imports shouldtherefore by kept at a minimum.
36
6. Summary and conclusions
Throughout history, Asia has been the most populous continent. Today, Asiais not only home for about 60% of the total world population but is currentlyalso the continent with the fastest economic growth. The combined effect of thefast growth of a huge population and rapidly increasing incomes will result inincreases in food demand of such dimensions that in the near future foodsupplies, not only in Asia, but also worldwide, will be stretched to the verylimits.
Over the past thirty years, agriculture in Asia has done exceptionally well,increasing the per capita supply of food by a margin of about 30% for apopulation that grew by nearly two billion during the last two and a halfdecades. This phenomenal success in agriculture development was largely dueto the very successful "Seed and Fertilizer" based "Green Revolution". But,what was easily possible during the past 25-30 years will be much more difficultduring the next thirty years. All the easy steps have already been taken, andunless decision and policy-makers wake up and conceive and finance newprograms and drastic reforms, large segments of Asian agriculture will run outof steam:
- by the year 2025 at the latest Asia will have run out of land available forfurther agricultural development,
- long before that more land will have been lost to housing, industry andinfrastructure than can be reclaimed for agriculture,
- most of the easy steps offered by the Green Revolution have already beentaken,
- opportunities for further yield increases become less and less and furtheryield increments will require more complex and more costly technologies,
- eating habits change with increasing income. The biggest growth in futurefood demand will come for items other than rice. While rice agriculture hasbeen perfected, upland agriculture has been neglected.
To avoid future food shortages and the resulting economic and politicalimplications, Asia will need a program that focuses on the neglected rainfeduplands. It is in the uplands where there are still some unused land reservesand where current yields are still very low and unstable and where there isthe biggest potential to increase food output and to produce the kind offood a more affluent population will demand.
A "Seed and Fertilizer" based "Green Revolution" on the uplands ispossible, but to make it a reality different seed and different fertilizers anda lot of research, institution building and extension will be required. It isnot too late yet, but time can run out quickly.
37

Acknowledgment
The author wishes to express his gratitude to Thomas Fairhurst ofIndonesian - German Government Cooperation; Regional Planning Board ofWest Sumatra; Deutsche Geselischaft fitr Technische Zusammenarbeit (GTZ)GmbH - Area Development for the Rehabilitation of Critical Land and theProtection of Natural Resources and Environment (ProRLK) for many usefulsuggestions and for his editorial help.
References
Blake, F. (1994): Organic food production. The Planter (Kuala Lumpur), 70,No. 819: 267-271.
Blobaum, R. (1994): Two years after Rio: Progress in making a global transitionto sustainable agriculture. Keynote speech. 12th Technical AdvisoryCommittee Meeting, Food & Fertilizer Technology Centre, Taipei, Taiwan,China (in print).
Borlaug, N.E. and Dowswell, C.R. (1994): Feeding a human population thatincreasingly crowds a fragile planet. Keynote lecture, 15th World Congressof Soil Sci., Acapulco, Mexico. International Soc. Soil Sci.
Buringh and Dudal (1987): cited by Borlaug and Dowswell, 1994.Brown, L.R. (1994): Facing food insecurity. In: State of the World, 1994. A
Worldwatch Institute Report on Progress Toward a Sustainable Society.W.W. Norton & Co., N.Y.
Conception, M.B. (1993): Population growth in Southeast Asia: pushing thelimits. p. 33-38. In: H. Brookfield and Y. Byron (eds) Southeast Asia'sEnvironmental Future. UN Univ. Press, Toronto, N.Y., Paris.
FAO Yearbooks (1990-1993): Food & Agric. Organisation of the UN. Rome.IRRI (1993): International Rice Res. Inst. Rice Facts. Los Bafios, Philippines.Greenland, D.J., Bowen, G., Eswaran, H., Rhodes, R. and Valentin, C. (1994):
Soil, water and nutrient management research - a new agenda. IBSRAMposition paper, Bangkok, Thailand.
Pasandaran, E. (1994): Food situation and prospects for Indonesia. Countrypaper presented at the 12th Technical Advisory Committee Meeting of theFood & Fertilizer Technical Centre (FFTC) Taipei, Taiwan, April 10-15 (inpress).
PRB (1988): Population Reference Bureau, Washington, D.C. World populationsheet.
Sanchez, P.A. and Smyth, T.J. (1987): The IBSRAM tropical soils network: aprogress report. International Board for Soil Res. and Management Inc.(IBSRAM). Land development and management of acid soils in Africa.
38

Proc. 2nd Reg. Workshop on Land Development and Management of AcidSoils in Africa, Lusaka, Zambia.
Stangel, P.J. and von Uexkill, H.R. (1990): Regional food security:demographic and geographic implications. In: Phosphorus requirements forsustainable agriculture in Asia and Oceania. Int'l Rice Res. Inst. Los Bafios,Philippines.
von Uexkoll, H.R. (1982): Suggestions for the management of problem soils forfood crops in the tropics. Trop. Agric. Res. Ser. No. 15 Trop. Agric Res.Centre, MAF, Tskuba, Japan.
von Uexktill, H.R. and Fairhurst, T.H. (1991): The oil palm: Fertilizing for high
yield and quality. IPI Bull. No. 15. Int'l Potash Inst., Bern, Switzerland.von Uexkfll, H.R. and Mutert, E. (1993): Global extent, development and
economic impact of acid soils. Brisbane, Australia.von Uexkiill, H.R. and Mutert, E. (1993): Fertilizer use and sustainable
agriculture in Asia. Proc. No. 34. The Fertilizer Society. Int'l Conf.Robinson College, Cambridge, U.K.
World Development Report, 1992. Washington, D.C., U.S.A.World Development Report, 1993. Washington, D.C., U.S.A.
39

Chairman of the Session I
Dr. A.E. Johnston, Rothamsted ExperimentalStation, Harpenden, UK; member of theScientific Board of the International PotashInstitute
Session 1
Soil Fertility and Soil K-Status forthe Main Agroclimatic Regions ofAsia
41
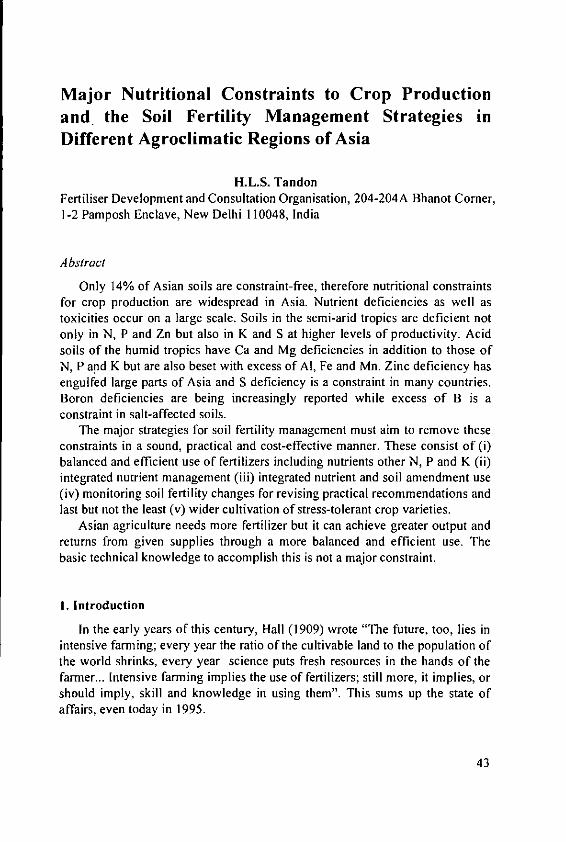
Major Nutritional Constraints to Crop Productionand, the Soil Fertility Management Strategies inDifferent Agroclimatic Regions of Asia
H.L.S. TandonFertiliser Development and Consultation Organisation, 204-204A Bhanot Comer,1-2 Pamposh Enclave, New Delhi 110048, India
Abstract
Only 14% of Asian soils are constraint-free, therefore nutritional constraintsfor crop production are widespread in Asia. Nutrient deficiencies as well astoxicities occur on a large scale. Soils in the semi-arid tropics are deficient notonly in N, P and Zn but also in K and S at higher levels of productivity. Acidsoils of the humid tropics have Ca and Mg deficiencies in addition to those ofN, P and K but are also beset with excess of A[, Fe and Mn. Zinc deficiency hasengulfed large parts of Asia and S deficiency is a constraint in many countries.Boron deficiencies are being increasingly reported while excess of B is aconstraint in salt-affected soils.
The major strategies for soil fertility management must aim to remove theseconstraints in a sound, practical and cost-effective manner. These consist of (i)balanced and efficient use of fertilizers including nutrients other N, P and K (ii)integrated nutrient management (iii) integrated nutrient and soil amendment use(iv) monitoring soil fertility changes for revising practical recommendations andlast but not the least (v) wider cultivation of stress-tolerant crop varieties.
Asian agriculture needs more fertilizer but it can achieve greater output andreturns from given supplies through a more balanced and efficient use. Thebasic technical knowledge to accomplish this is not a major constraint.
I. Introduction
In the early years of this century, Hall (1909) wrote "The future, too, lies inintensive farming; every year the ratio of the cultivable land to the population ofthe world shrinks, every year science puts fresh resources in the hands of thefarmer... Intensive farming implies the use of fertilizers; still more, it implies, orshould imply, skill and knowledge in using them". This sums up the state ofaffairs, even today in 1995.
43
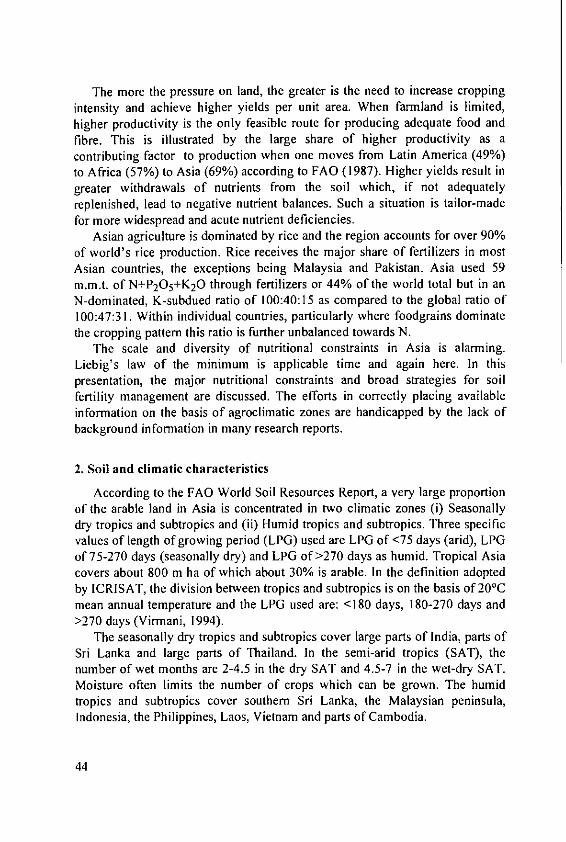
The more the pressure on land, the greater is the need to increase croppingintensity and achieve higher yields per unit area. When farmland is limited,higher productivity is the only feasible route for producing adequate food andfibre. This is illustrated by the large share of higher productivity as acontributing factor to production when one moves from Latin America (49%)to Africa (57%) to Asia (69%) according to FAO (1987). Higher yields result ingreater withdrawals of nutrients from the soil which, if not adequatelyreplenished, lead to negative nutrient balances. Such a situation is tailor-madefor more widespread and acute nutrient deficiencies.
Asian agriculture is dominated by rice and the region accounts for over 90%of world's rice production. Rice receives the major share of fertilizers in mostAsian countries, the exceptions being Malaysia and Pakistan. Asia used 59m.m.t. of N+P205+K20 through fertilizers or 44% of the world total but in anN-dominated, K-subdued ratio of 100:40:15 as compared to the global ratio of100:47:31. Within individual countries, particularly where foodgrains dominatethe cropping pattern this ratio is further unbalanced towards N.
The scale and diversity of nutritional constraints in Asia is alarming.Liebig's law of the minimum is applicable time and again here. In thispresentation, the major nutritional constraints and broad strategies for soilfertility management are discussed. The efforts in correctly placing availableinformation on the basis of agroclimatic zones are handicapped by the lack ofbackground information in many research reports.
2. Soil and climatic characteristics
According to the FAO World Soil Resources Report, a very large proportionof the arable land in Asia is concentrated in two climatic zones (i) Seasonallydry tropics and subtropics and (ii) Humid tropics and subtropics. Three specificvalues of length of growing period (LPG) used are LPG of<75 days (arid), LPGof 75-270 days (seasonally dry) and LPG of >270 days as humid. Tropical Asiacovers about 800 m ha of which about 30% is arable. In the definition adoptedby ICRISAT, the division between tropics and subtropics is on the basis of 200Cmean annual temperature and the LPG used are: <180 days, 180-270 days and>270 days (Virmani, 1994).
The seasonally dry tropics and subtropics cover large parts of India, parts ofSri Lanka and large parts of Thailand. In the semi-arid tropics (SAT), thenumber of wet months are 2-4.5 in the dry SAT and 4.5-7 in the wet-dry SAT.Moisture often limits the number of crops which can be grown. The humidtropics and subtropics cover southern Sri Lanka, the Malaysian peninsula,Indonesia, the Philippines, Laos, Vietnam and parts of Cambodia.
44
It is generally hot and humid throughout the year. The temperate regionincludes the upper Himalayas, northern China, Japan and Korea. Typical sub-humid tropics (2.5-5 dry months a year) include the western Philippines,extending through southern China, Vietnam, Cambodia, Laos and parts of India.The rainy season starts in early summer in Sri Lanka and in southern India(Katyal and Vlek, 1985).
The majority of soils available for agriculture in the humid tropics are theso-called acid infertile soils (Oxisols and Ultisols). These soils represent thelargest single remaining block (333 m. ha) of untapped, potentially arable soilsin Asia (von UexktIll and Mutert, 1993a). In the semi-arid tropics which coverfor example two-thirds of the 143 m. ha in India, Vertisols, Alfisols, Inceptisolsand Entisols are the major soils (Tandon and Rego, 1989). The tropical and sub-tropical China covers 2.18x 10⁶ sq. km. covering 14 provinces and regions southof the river Yangtse. The major soils there are red, lateritic, latosols, and thepaddy soils (Xie Jian-Chang et al., 1982).
Climatic descriptions of an agricultural area are vastly modified by theavailability of irrigation. This is one input which can transform single-crop, highrisk farming in the SAT to multiple-cropped, low risk farming. Irrigated landsare also the sites of multiple nutrient deficiencies, largely due to the high levelof nutrient removal as a result of higher yields, more leaching, and losses due toerosion.
3. Major nutritional constraints for crop production
3.1. Overall scenario
The nutritional constraints in Asian soils are so many and so diversely distri-buted that even a balanced account may seem to present an alarming picture. Itappears that soils with a capacity to sustain high yields from their own reservesand natural recycling are a part of history. Among mineral nutrients, the currentscenario of nutritional constraints covers virtually all of them, includingchlorine (Kanwar and Mudahar, 1986; Katyal and Vlek, 1985; Ponnamperumaand Deturk, 1993; Tandon and Kimmo, 1993; von Uexkflll and Bosshart, 1988).
The issues in soil, water and nutrient management at the macro level havebeen analysed recently wherein nutrient depletion/deficiency/timing was rankedas the most important problem, followed by soil erosion and degradation(Greenland et al., 1994). Nutrient stresses are a major constraint on about 60%of soils of S.E. Asia (Dent, 1990). In an assessment of the most commonenvironmental issues in land and water development for 13 Asian countries, lowsoil fertility and imbalanced (crop) nutrition was found to be a universalproblem (FAO, 1992).
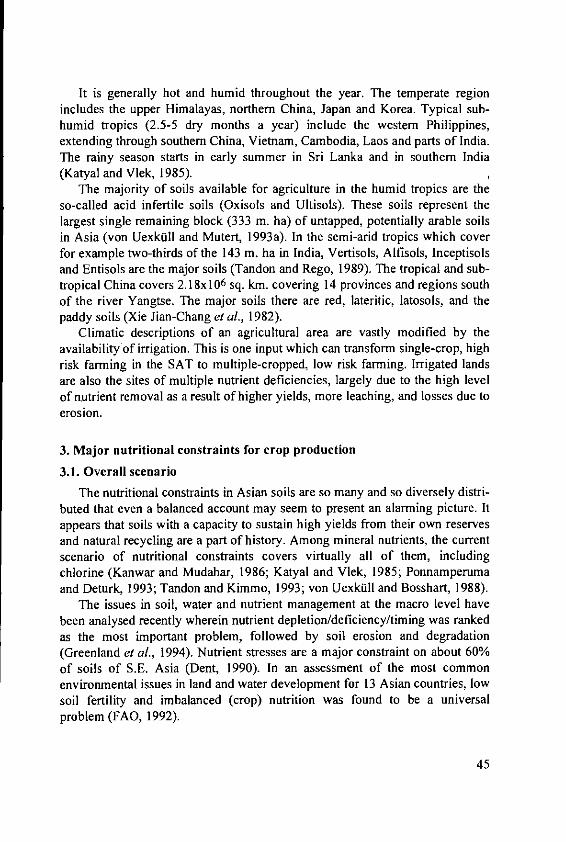
45
An overview of the extent of major soil-related constraints reveals a varietyof physical and chemical constraints (Table 1). Coarseness and low moistureretention are inter-related as also are acidity, high P-fixation and Al/Fe toxicity.
Table 1. Distribution of area under different soil constraints in South East Asia.
Region No Physical Low Aluminium Strong P- Low K-Climate inherent limitations nutrient toxicity fixation reserves(share in constraint retentionarea)
SE Asia (33 m. ha) (537 m. ha) (30 m. ha) (241 m. ha) (191 m. ha) (257 m. ha)(898 m. ha)
Arid 2.9 0.8 48.5 0 0 0.4(12.0%)
Semi-arid 30.7 18.9 1.2 3.7 3.5 44.0(21.0%)
Humid 60.0 64.1 49.0 95.2 95.5 94.8(61.8%)
Cold 6.5 9.0 1.2 1.2 1.0 0.8(5.3%)
Based on data in World Resources 1990-92, the World Resources Institute, Hanson(1994). Countries included: Bangladesh, Bhutan, India, Indonesia, Cambodia, LaosPDR, Malaysia, Myanmar, Nepal, Pakistan, Philippines, Singapore, Thailand andVietnam.
The most extensive nutrient deficiencies are those of nitrogen, phosphorusand potassium. These are also the nutrients which crops absorb in the largestamount (Table 2) and which dominate the fertilizer-use pattern. A recent surveyon the state of nutrients other than N, P, K and Ca showed that severaldeficiencies are already important (Table 3). Calcium and magnesiumdeficiency can be expected in the humid tropics and to a lesser extent in sub-humid areas (Kemmler, 1992). Generally, Ca deficiency is suspected if Ca++
occupies <25% of the soil's CEC or is <1.5 me/100g. For Mg, the correspondingguidelines are 4-15% of the CEC or <1.0 me exchangeable Mg/lOOg (Biswas etal., 1985). Sulphur deficiencies have been reported from several Asian countries(Kanwar and Mudahar, 1986; Portch, 1993). These are emerging as animportant constraint in lowland rice production and could be contributing to thedeclining yield trend observed in some rice growing countries (Mamaril, 1993).Results of field trials under the FAO sulphur network revealed widespread Sdeficiency in Asia. Significant yield responses to S application were recorded in80% of the 25 trials in China and in 56% of the 120 trials in India (Roy, 1993).
46

Table 2. Nitrogen, phosphorus and potassium taken up by tropical crops.
Crop Yield N P Kt/ha kg/ha
CerealsRice: Grain 9.8 143 26 26
Straw 8.2 75 5 232Total 218 31 258
Maize: Grain 9.5 150 27 37Straw 11.0 110 19 135Total 260 46 172
Wheat: Grain 6.2 87 17 25Straw 6.5 31 4 80Total 118 21 105
Root crops, contents of tubers onlyCassava 30.0 120 40 187Yams 11.0 38 3 39Potatoes 35.6 115 18 161
Forage crops, in yields of dry cropLucerne (alfalfa) 10.0 200 20 170Coastal Bermuda grass 20.0 340 35 250Napier grass (elephant grass) 24.0 360 64 298
Fruit cropsBananas (in fruit) 45.0 78 22 224Coconuts (dry copra) 1.4 62 17 56Pineapple, in fruit 55.0 43 7 109
total in crop 205 25 326
Plantation crops, contents in harvested fractionOil palm (yield of oil) 2.5 162 30 217Sugarcane (cane yield) 88.0 45 25 121Rubber (yield of dry rubber) 1.1 7 I 4Coffee (made coffee) 1.0 38 8 50Tea (dried leaves) 1.3 60 5 30Tobacco (cured leaves) 1.0 116 14 202
Cotton seed and lint 1.7 45 11 14stalks, leaves and bums 2.2 39 5 33
Grain legumesBeans 1.0 31 3.5 6.6Soybeans 1.0 49 7.2 21Groundnuts (unhulled) 1.0 49 5.2 27
Source: Cooke (1985).
47

Table 3. An assessment of the deficiencies of nutrients other than N, P, K andCa in the soils of some Asian countries.
Country Scale of deficiency'
S Mg Fe Mn Zn Cu Mo B Cl
Bangladesh 5 5
India 4 3 3 2 5 2 2 3
Indonesia 3 5 2 2 5 2 2 4" *
Malaysia I 4 2 2 2 2 2 4" ..
Pakistan 3 nr 2 5 2 3
Philippines 2 3 nr 4 2 2 2 ...
Thailand 3 2 2 2 4 2 2 2
Scale of occurrence of the deficiency is very qualitative: 5 = common, extensive; 4 =common enough to be of concern; 3 - localised, sometimes; 2 = rare; I = nonereported.Very common in oil palm.Chlorine deficiency important for oil palm in Indonesia, Malaysia and for coconut inthe Philippines.Data source: Isherwood (1992); Others.
The deficiencies of micronutrients, particularly those of Zn and B are verycommon (Zn more so than B) in Asian soils. Their incidence variesconsiderably between countries and agro-climatic regions but the extremes areset by the deficiencies of Zn and Fe in alkaline, calcareous soils of the semi-aridtropics to the toxicities of Al and Fe in acid tropical soils. Micronutrientproblems of Asia have been reviewed by Katyal and Vlek (1985), von UexkIlland Bosshart (1988) and in the volume edited by Ponch (1993). Work on thedistribution of micronutrients in Asia is very sketchy and attempts to associatemicronutrient problems with soil parent materials, climate or other factors arerare (Katyal and Vlek, 1985).
In acid tropical soils the major nutritional constraints are low base saturationaccompanied by high Al saturation, low available P and high P fixation, andhigh concentrations of exchangeable Al and Mn. Related constraints areexcessive acidity, low organic matter and low water holding capacity(Pushparajah, 1991). In the acid upland rice soils, the major constraints are thedeficiencies of N, P, K, Ca, Mg and Al toxicity (Makarim et al., 1991; De Dattaand Kundu, 1991). Manganese toxicity/calcium deficiency can be a constraint atpH <5 and Al toxicity if pH is <4. Flooding may correct Al and Mn toxicitiesbut induce Zn deficiency and toxicities of Fe and sulphide.
48

In the semi-arid tropics, the deficiencies of N, P, and Zn are widespread andFe deficiency is being increasingly noticed (Tandon and Rego, 1989). When
productivity levels are raised, as for example through irrigation or moisture
conservation, deficiencies of K and S also become important in many areas.
Soils of the arid and semi-arid regions of India were more frequently deficient
in Zn than those in humid or sub-humid zones (Katyal and Vlek, 1985). While
in many parts of eastern India (Bihar, West Bengal, Assam), boron deficiency is
being increasingly reported, its excess is expected to be a constraint in sodic
soils of the Indo-Gangetic plains.Rice in India is grown on 42 m. ha in environments ranging from temperate
in the Himalayas to acid, tropical soils in the southern tip of the country. The
nutritional constraints across such a wide range of soils, climates and cropping
systems cover most of the situations which occur in Asia (Table 4). On one
extreme are the constraints associated with acid sulphate soils and on the other
are those in highly sodic soils.
Table 4. Relationship between soil analysis and probable occurrence of
nutritional disorders in rice.
Soil Soil condition Disorder
Extremely low pH (<4.5) Acid sulphate soil Iron and Al toxicity
Low in organic matter Phosphorus deficiency(<0.5% C) combined with iron
toxicity
High in active High in organic matter Phosphorus deficiencyiron (>0.75% C) combined with iron
toxicity
l.ow pIl IHigh in manganese Manganese toxicity(4.5-5.5) (probably rare)
Low in active FLow in potassium Iron toxicity interact with
iron and exchan- (<118 kg K/ha) potassium deficiencygeable cations
Low in bases and silica Imbalance of nutrients[with sulphate application associated with hydrogen
sulphide toxicity
[High in calcium and low Potassium deficiency asso-High pH I in potassium ciated with high calcium
(>7.5) I igh in sodium (ECe>4 Sodicity problem, Zinc anddS/m, and exchangeable Iron deficiency, Boron
L sodium %>15) toxicity
Source: Patnaik et al. (1991).
49

Nutritional constraints at the practical level are directly influenced byproductivity levels. At 14 research stations in Japan, an average paddy yield of4.3t/ha was produced by applying NPK. A farmer who harvested 10.2 t/ha grainhad to apply Ca, Mg, Mn and as much as 1.5 t SiO2/ha in addition to N, P and K(Yamazaki, 1967). Experience with tea in south India shows that while noexternal nutrients are needed to obtain yields below 0.8 t/ha, a number ofconstraints must be overcome to harvest over 4.5 made tea/ha (Table 5).
Table 5. Emergence of soil limiting factors in relation to crop productivity (anexample of tea in south India).
Productivity, Limiting factorkg/ha (made tea)
Below 800 Nil800-1000 N and K1000-2000 N, P, K, Zn + liming2000-3000 N, P, K, Zn + liming with material containing MgCO 33000-4000 N, P, K, Zn, Mg, Si, B +liming; transport process within
the soilAbove 4500 N, P, K, Zn, Mg, Si, Mo, B +liming; transport process
within the soil
Soil mining or depletion of soil nutrients can be held responsible for theaggravation of nutrient deficiencies in several cases. Negative nutrient balanceshave been reported in many Asian countries for most of the plant nutrientswhich are required in large amounts (Dent, 1992). Unbalanced, or ratherlopsided use of fertilizer N is currently the biggest factor causing soil nutrientdepletion. Work done at IRRI shows that while application of adequate Nincreased paddy yield 2.9 times (from 3.4 t/ha to 9.8 t/ha), it also resulted in theremoval of 2.6 times more P, 3.7 times more K and 4.6 times more S from thesoil as compared to the unfertilized plot (Fig. 1). In India, soil nutrient depletionis widespread and unabated (Tandon 1993a). The annual gap between nutrientremoval by crops and the fertilizer input is 9-10 m.m.t. Negative balances havebeen reported for the country as a whole (Tandon and Pratap Narayan, 1990),for each of the 15 agro-climatic regions (Biswas and Tewatia, 1991), inintensive cropping systems at research stations (Sekhon and Pur, 1986) and inthe farmer's fields (Tandon and Sekhon, 1988). In China, depletion of P and K,particularly of K is a major problem (Lu, 1991). A gross negative balance of 4.9m.m.t. K20 was reported for Chinese agriculture in 1990 (von Uexktlll andMutert, 1993b). This is twice the deficit computed for 1965.
50

Percent increase due to N application
0 100 150 200 250 300 350
Grain yield + 188%
Straw yield +193%
N uptake +31
P uptake +158%
K uptake +274 T1
S uptake +K356 %:
Fig. 1. Impact of the application of 174 kg N/ha on rice yield and nutrientuptake by the crop in a farmer's field in Calaun, Laguna, Philippines (De Datta,1985).
Numerous data show that crop removal of soil P (depletion) was 33-129%more in plots which were regularly fertilized with N as compared to theunfertilized control plots. In long-term experiments (Nambiar and Ghosh,1984), the ability to mine P on N-only plots varied with the type of soils. Thesame set of experiments provided data on the mining of soil K underfertilization systems which excluded K. Optimum application of N increased Kuptake by 57% over control plots and N + P application increased it by 145%.Highest rates of potash depletion were observed in alluvial soils, black clay soilsand mollisols, lowest in the acid red loams (Tandon and Sekhon, 1988).
3.2. Country-level constraints
Bangladesh
The deficiencies of N, P, S, Zn and K are common. Sulphur deficiency has
become acute and affects 45-80% soils. Out of a cultivated area of 9.4 m ha,about 1.8 m ha are estimated to be deficient in Zn and B deficiency is likely onone m ha (Islam, 1994; Bhuiyan, 1993).
51
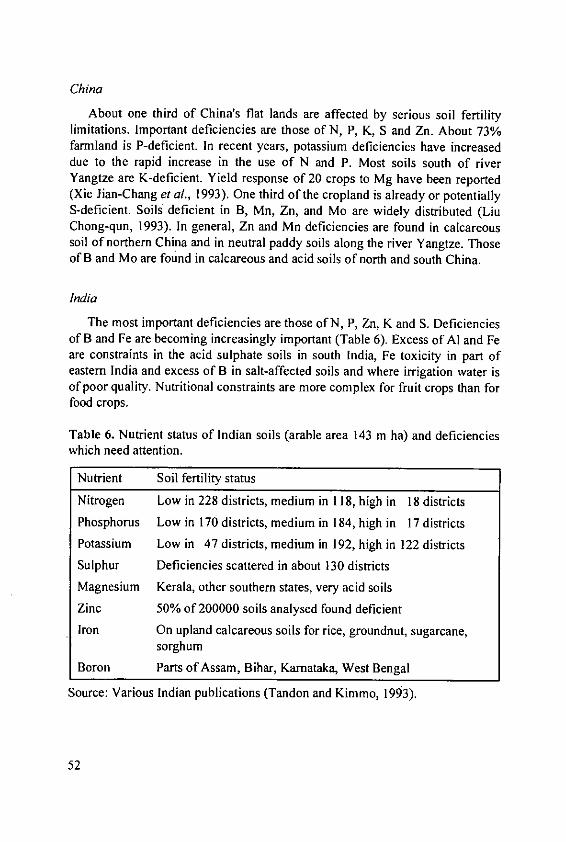
China
About one third of China's flat lands are affected by serious soil fertilitylimitations. Important deficiencies are those of N, P, K, S and Zn. About 73%farmland is P-deficient. In recent years, potassium deficiencies have increaseddue to the rapid increase in the use of N and P. Most soils south of riverYangtze are K-deficient. Yield response of 20 crops to Mg have been reported(Xie Jian-Chang et al., 1993). One third of the cropland is already or potentiallyS-deficient. Soils deficient in B, Mn, Zn, and Mo are widely distributed (LiuChong-qun, 1993). In general, Zn and Mn deficiencies are found in calcareoussoil of northern China and in neutral paddy soils along the river Yangtze. Thoseof B and Mo are found in calcareous and acid soils of north and south China.
India
The most important deficiencies are those of N, P, Zn, K and S. Deficienciesof B and Fe are becoming increasingly important (Table 6). Excess of Al and Feare constraints in the acid sulphate soils in south India, Fe toxicity in part ofeastern India and excess of B in salt-affected soils and where irrigation water isof poor quality. Nutritional constraints are more complex for fruit crops than forfood crops.
Table 6. Nutrient status of Indian soils (arable area 143 m ha) and deficiencieswhich need attention.
Nutrient Soil fertility status
Nitrogen Low in 228 districts, medium in 118, high in 18 districts
Phosphorus Low in 170 districts, medium in 184, high in 17 districts
Potassium Low in 47 districts, medium in 192, high in 122 districts
Sulphur Deficiencies scattered in about 130 districts
Magnesium Kerala, other southern states, very acid soils
Zinc 50% of 200000 soils analysed found deficient
Iron On upland calcareous soils for rice, groundnut, sugarcane,sorghum
Boron Parts of Assam, Bihar, Karnataka, West Bengal
Source: Various Indian publications (Tandon and Kimmo, 1993).
52
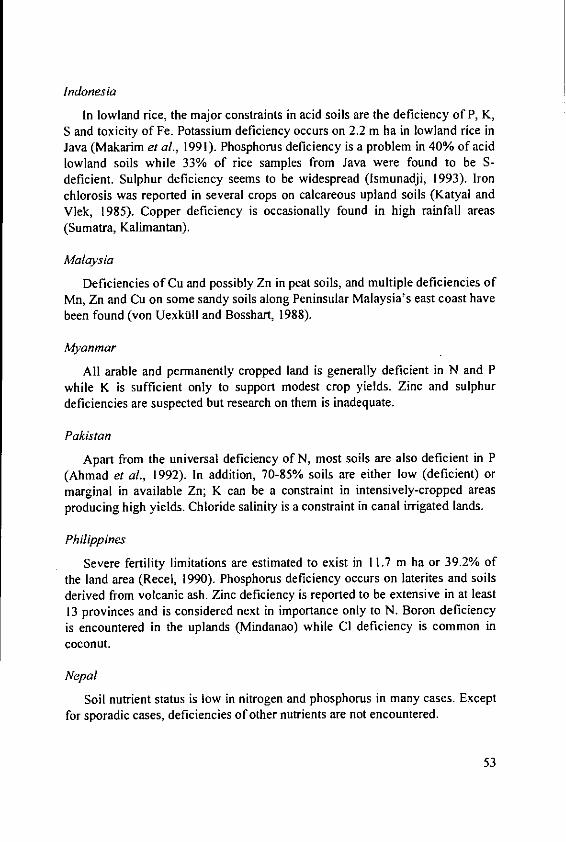
Indonesia
In lowland rice, the major constraints in acid soils are the deficiency of P, K,S and toxicity of Fe. Potassium deficiency occurs on 2.2 m ha in lowland rice inJava (Makarim et al., 1991). Phosphorus deficiency is a problem in 40% of acidlowland soils while 33% of rice samples from Java were found to be S-deficient. Sulphur deficiency seems to be widespread (Ismunadji, 1993). Ironchlorosis was reported in several crops on calcareous upland soils (Katyal andVlek, 1985). Copper deficiency is occasionally found in high rainfall areas(Sumatra, Kalimantan).
Malaysia
Deficiencies of Cu and possibly Zn in peat soils, and multiple deficiencies ofMn, Zn and Cu on some sandy soils along Peninsular Malaysia's east coast havebeen found (von Uexktlll and Bosshart, 1988).
Myanmar
All arable and permanently cropped land is generally deficient in N and Pwhile K is sufficient only to support modest crop yields. Zinc and sulphurdeficiencies are suspected but research on them is inadequate.
Pakistan
Apart from the universal deficiency of N, most soils are also deficient in P(Ahmad et al., 1992). In addition, 70-85% soils are either low (deficient) ormarginal in available Zn; K can be a constraint in intensively-cropped areasproducing high yields. Chloride salinity is a constraint in canal irrigated lands.
Philippines
Severe fertility limitations are estimated to exist in 11.7 m ha or 39.2% ofthe land area (Recel, 1990). Phosphorus deficiency occurs on laterites and soilsderived from volcanic ash. Zinc deficiency is reported to be extensive in at least13 provinces and is considered next in importance only to N. Boron deficiencyis encountered in the uplands (Mindanao) while Cl deficiency is common incoconut.
Nepal
Soil nutrient status is low in nitrogen and phosphorus in many cases. Exceptfor sporadic cases, deficiencies of other nutrients are not encountered.
53
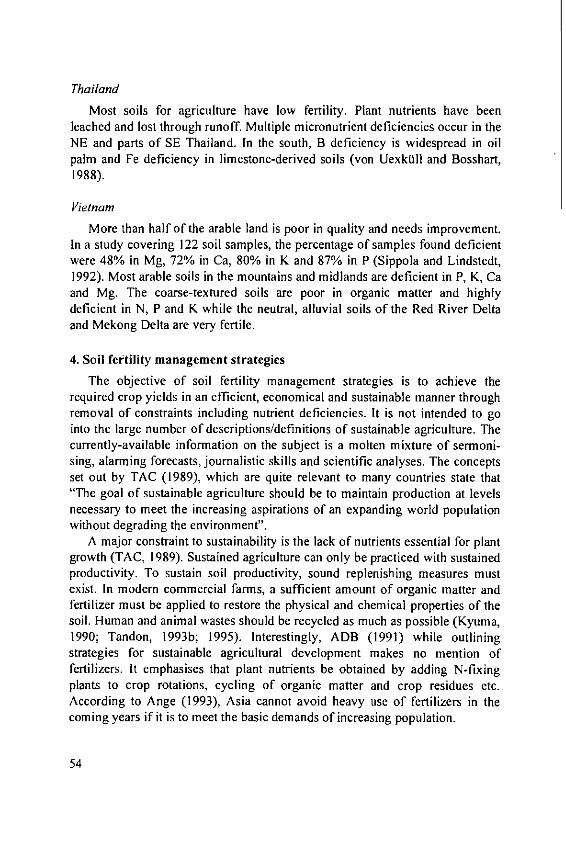
Thailand
Most soils for agriculture have low fertility. Plant nutrients have beenleached and lost through runoff. Multiple micronutrient deficiencies occur in theNE and parts of SE Thailand. In the south, B deficiency is widespread in oilpalm and Fe deficiency in limestone-derived soils (von Uexkli and Bosshart,1988).
Vietnam
More than half of the arabic land is poor in quality and needs improvement.In a study covering 122 soil samples, the percentage of samples found deficientwere 48% in Mg, 72% in Ca, 80% in K and 87% in P (Sippola and Lindstedt,1992). Most arable soils in the mountains and midlands are deficient in P, K, Caand Mg. The coarse-textured soils are poor in organic matter and highlydeficient in N, P and K while the neutral, alluvial soils of the Red River Deltaand Mekong Delta are very fertile.
4. Soil fettility management strategies
The objective of soil fertility management strategies is to achieve therequired crop yields in an efficient, economical and sustainable manner throughremoval of constraints including nutrient deficiencies. It is not intended to gointo the large number of descriptions/definitions of sustainable agriculture. Thecurrently-available information on the subject is a molten mixture of sermoni-sing, alarming forecasts, journalistic skills and scientific analyses. The conceptsset out by TAC (1989), which are quite relevant to many countries state that"The goal of sustainable agriculture should be to maintain production at levelsnecessary to meet the increasing aspirations of an expanding world populationwithout degrading the environment".
A major constraint to sustainability is the lack of nutrients essential for plantgrowth (TAC, 1989). Sustained agriculture can only be practiced with sustainedproductivity. To sustain soil productivity, sound replenishing measures mustexist. In modern commercial farms, a sufficient amount of organic matter andfertilizer must be applied to restore the physical and chemical properties of thesoil. Human and animal wastes should be recycled as much as possible (Kyuma,1990; Tandon, 1993b; 1995). Interestingly, ADB (1991) while outliningstrategies for sustainable agricultural development makes no mention offertilizers. It emphasises that plant nutrients be obtained by adding N-fixingplants to crop rotations, cycling of organic matter and crop residues etc.According to Ange (1993), Asia cannot avoid heavy use of fertilizers in thecoming years if it is to meet the basic demands of increasing population.
54

The strategies outlined here are widely applicable across different
agroclimatic regions. Correction of nutrient deficiencies and toxicities is a basic
requirement but in order to be effective, these need the support of
complimentary inputs. For example soil amendments (gypsum in sodic soils,lime in acid upland soils), moisture conservation in the semi-arid and arid
regions, efficient application of water in irrigated areas, use of organic manures
in coarse-textured soils pave the way for higher nutrient use efficiency. Putting
fertilizer without lime in an acid soil or without gypsum in a sodic soil is not a
sound decision. It is unfortunate that the marketing and distribuition of soil
amendments has received far less attention than that of fertilizers in many Asian
countries. If constraints are to be removed, then the inputs and resources needed
to do so should be easily available to the cultivators.
4.1. Balanced fertilizer application
Balanced fertilizer use will remain an ever-green strategy. Its scope and
content will however extend well beyond NPK dressings in over-simplified
ratios (4:2:1) and should include "The deliberate application of all those
nutrients in optimum amounts and ratios which the soil cannot provide to
sustain profit-maximising yield levels." The contents of balanced fertilization
can vary from N+Zn application to rice in newly-reclaimed sodic soils in semi
arid climates to the application of 7-8 nutrients for sustaining a productivity
level of 4.5 t/ha tea. The issues in balanced fertilization in the Asian context and
practical recommendations have been recently reviewed (Tandon and Kimmo,1993; von UexktlII and Mutert, 1993b).
At present, in many wheat-growing soils of India, the major components of
balanced nutrient application are: NP/NPK/NPZn/NPKZn/NPZnS or NPKZnS.
For arable crops, the order of importance is generally N>P>K but for tree crops,
it is often K>N>P. Some results on the impact of N, P, K and Zn on the
productivity of wheat and rice will underscore the contribution of each nutrient
in raising crop yields (Table 7). Results from Bangladesh show that if
fertilization is restricted to NPK alone, sizable yield loss can occur due to the
widespread deficiency of sulphur in the soils. The yield difference between the
application of NPKS and NPK was 19-40% depending upon the season in
which rice was grown and the yield potential in that season (Fig. 2). Results
with sugarcane in China demonstrate the effect of progressively moving from
unbalanced to balanced nutrient application on productivity (Fig. 3). Here the
inclusion of Mg in the fertilization schedule added more than I 0 t/ha cane yield.
55
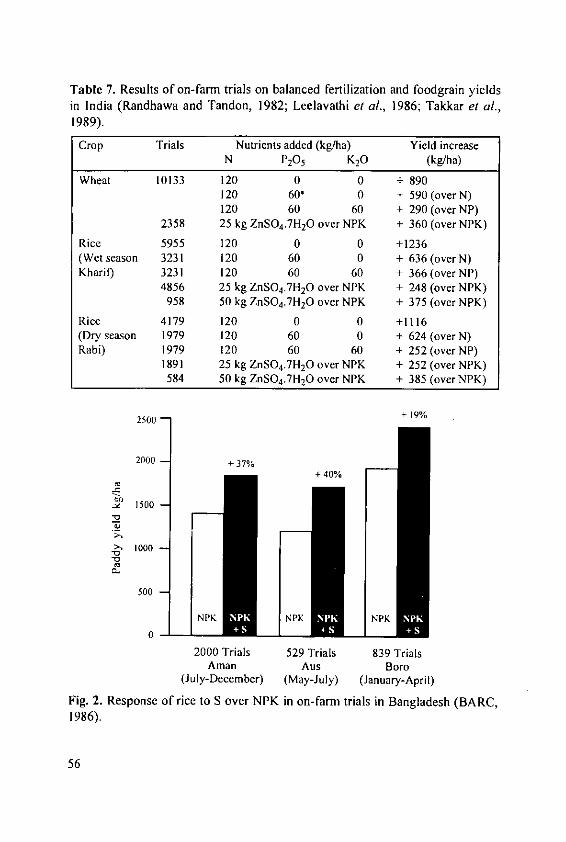
Table 7. Results of on-farm trials on balanced fertilization and foodgrain yieldsin India (Randhawa and Tandon, 1982; Leelavathi et al., 1986; Takkar et al.,1989).
Crop Trials Nutrients added (kg/ha) Yield increaseN P205 K20 (kg/ha)
Wheat 10133 120 0 0 + 890120 60* 0 + 590 (over N)120 60 60 + 290 (over NP)
2358 25 kg ZnSO 4.7H 20 over NPK + 360 (over NPK)
Rice 5955 120 0 0 +1236(Wet season 3231 120 60 0 + 636 (over N)Kharif) 3231 120 60 60 + 366 (over NP)
4856 25 kg ZnSO 4.7H20 over NPK + 248 (over NPK)958 50 kg ZnSO 4.7H 20 over NPK + 375 (over NPK)
Rice 4179 120 0 0 +1116(Dry season 1979 120 60 0 + 624 (over N)Rabi) 1979 120 60 60 + 252 (over NP)
1891 25 kg ZnSO 4.7H20 over NPK + 252 (over NPK)584 50 kg ZnSO4.7H20 over NPK + 385 (over NPK)
2500 - + 19%
2000 - + 37%
+ 40%
1 500C.)
> 100O
500 -
50-]P NPK JNPKI
2000 Trials 529 Trials 839 TrialsAman Aus Boro
(July-December) (May-July) (January-April)
Fig. 2. Response of rice to S over NPK in on-farm trials in Bangladesh (BARC,1986).
56
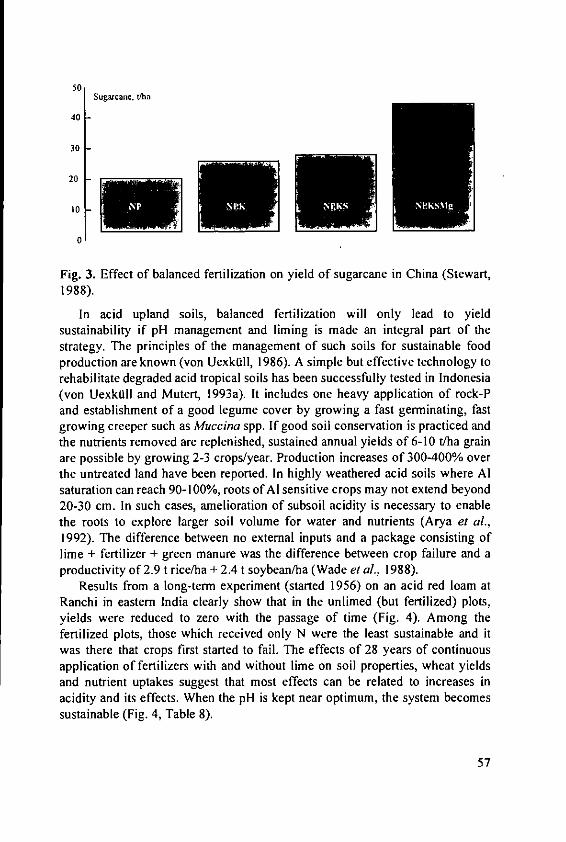
50Sugarcane, tha
40
30 -
20
Fig. 3. Effect of balanced fertilization on yield of sugarcane in China (Stewart,1988).
In acid upland soils, balanced fertilization will only lead to yieldsustainability if pH management and liming is made an integral part of thestrategy. The principles of the management of such soils for sustainable foodproduction are known (von Uexkoll, 1986). A simple but effective technology torehabilitate degraded acid tropical soils has been successfully tested in Indonesia(von UexkUll and Mutert, 1993a). It includes one heavy application of rock-Pand establishment of a good legume cover by growing a fast germinating, fastgrowing creeper such as Muccina spp. If good soil conservation is practiced andthe nutrients removed are replenished, sustained annual yields of 6-10 t/ha grainare possible by growing 2-3 crops/year. Production increases of 300-400% overthe untreated land have been reported. In highly weathered acid soils where Alsaturation can reach 90-100%, roots of Al sensitive crops may not extend beyond20-30 cm. In such cases, amelioration of subsoil acidity is necessary to enablethe roots to explore larger soil volume for water and nutrients (Arya et al.,1992). The difference between no external inputs and a package consisting oflime + fertilizer + green manure was the difference between crop failure and aproductivity of 2.9 t rice/ha + 2.4 t soybean/ha (Wade et al., 1988).
Results from a long-term experiment (started 1956) on an acid red loam atRanchi in eastern India clearly show that in the unlimed (but fertilized) plots,yields were reduced to zero with the passage of time (Fig. 4). Among thefertilized plots, those which received only N were the least sustainable and itwas there that crops first started to fail. The effects of 28 years of continuousapplication of fertilizers with and without lime on soil properties, wheat yieldsand nutrient uptakes suggest that most effects can be related to increases inacidity and its effects. When the pH is kept near optimum, the system becomessustainable (Fig. 4, Table 8).
57

-Grain yicld. ha NPK IME
4
3\ FERTILISER (NPK)
2,.
01960 1970 1980 1990
YEAR
Fig. 4. Trends in maize yield under different treatments on an acidic red loam atRanchi in eastern India. Experiment started in 1956 (Mathur et al., 1989).
Table 8. Effect of 28 years of continuous application of fertilizers with andwithout lime on wheat yield and soil properties in an acid red loam soil ofeastern India (Mathur et al., 1989).
Effect Initial Control NPK NPK + lime
Soil pH 5.5 5.8 4.0 6.3Wheat yield, kg/ha 1090 480 4070Exchangeable Ca+Mg, me 8.5 6.7 1.9 10.8
N uptake, kg/ha 24.2 26.2 118.6P uptake, kg/ha 4.5 5.8 24.8K uptake, kg/ha 28.4 56.9 225.3Ca uptake, kg/ha 3.5 6.0 27.5
It is expected of any balanced fertilization strategy that it will maximise thegains from synergistic effects and minimise the occurrence of antagonisticeffects. The most frequently observed positive interactions are those between Nand P, N and K, and S and B while the commonly encountered antagonisticeffects are being between K and Mg, P and Zn and S and Mo. Again, mostnegative interactions are perhaps indicators of a departure from the optimum/balanced condition (Tandon, 1992a). Some examples with the N-K interactionfrom Indian research bring out the practical value of nutrient interactions. Thesubject has been recently reviewed (Singh, 1992).
58

A typical NxK interaction in rice grown on the alluvial soils of West Bengal(available K20 = 175 kg/ha) during the wet and dry seasons is illustrated in Fig.5. In the wet season, the best paddy yield was 4.3 t/ha regardless of the level ofN-used but 5.0 t/ha (+16%) could be harvested with an application of 120 kgN+80 kg K20/ha. In the dry season, highest paddy yield with 40 kg K20/ha was6 t/ha but by matching high levels of K with a high level of N, 7.4 t/ha of paddy(+23%) could be harvested (Mondal, 1982).
8
+ 120 kg KO0ha.. .,..
DRY SEASON 4 gK0h
. ET SEASON 0
4 - -- )- + 40 kg KO/haC---
3I I40 80 120 160
N APPLIED. KG / HA
Fig. 5. The NxK interaction in rice in the two major rice-growing seasons inWest Bengal, India (Mondal, 1982).
The NxK interaction in tea is of a different kind. For example, the optimumN:K ratios for tea in south India are as follows: (Ranganathan and Natesan,1985).N:K of 1.00:0.83 for tea nurseries.N:K of 1.00:0.83-1.25 for young tea depending upon soil pH and potassium
availability in soil.N:K of 1.00:1.25-1.66 for mature tea in the prune-year depending upon the type
of pruning.N:K of 1.00:0.42-0.83 for mature tea in years other than the prune year
depending upon the source of N used and the yield level.
59

An interesting NxK interaction in pineapples has been reported by Roy(1986). Above an application of 200 kg N + 400 kg P20 5 + 200 kg K20, furthernutrient applications resulted in the following yield increases:
Increasing N application to 600 kg N/ha = + 8.8 t/ha extra yieldIncreasing K application to 600 kg/ha = + 1.2 t/ha extra yieldIncreasing both N and K to 600 kg/ha = +18.4 tlha extra yieldInteraction benefit = 8.4 t/ha or 46%
Yield gains from positive interactions, even where large, may not fully showup in grain yields. Work with S and B in groundnut has shown that thesynergistic effect between the two was more pronounced in the oil yield than inthe seed yield. With the intensification of agriculture and the need to managemultiple nutrient deficiencies, nutrient interactions will become increasinglyimportant in Asia.
4.2. Increasing fertilizer efficiency
Efficient fertilizer use is the offspring of balanced nutrient supplies and bestmanagement practices. A high level of fertilizer use efficiency (FUE) isimpossible to achieve under any imbalance. Though FUE needs to be improvedin most situations, the sector deserving priority attention is fertilizer N in riceculture. The strategy here is to develop products and practices which willminimise N losses. Although Asia will have to use increasing rates of fertilizerto meet population demand, the required amount of food can be obtained withlower inputs through more efficient use of fertilizers. To meet the food needs,grain yields in Asia should reach 3.5 t/ha by 2010 and 5.5 t/ha by 2030. Thesecan be achieved as follows according to Ange (1993):
Year Productivity needed Fertilizer nutrients needed, kg/hagrain t/ha Low efficiency High efficiency Saving
2010 3.5 230 160 702030 5.5 380 300 80
Towards improving N-use efficiency in rice and other crops, a considerableamount of field data have been generated on the deep placement of large ureagranules and the pre-treatment of urea with locally-available nitrificationinhibitors such as neem (Azadirachta sp.). At a given level of N application,these techniques are often associated with yield gains of 400-600 kg paddy/ha(Kumar et al., 1989).
60
For high agro-economic efficiency of P in most acid soils, use of rockphosphate is suggested where transport costs are low. Experiments with uplandrice and maize show that the residual effect of a 140 kg P/ha application asrock-P was maintained upto the 4th crop. Partial acidulation of rock P isconsidered effective and 50% acidulation with H2SO 4 or 20% with H 3 PO 4
approaches the effectiveness of water soluble P in several tropical soils andcrops (De Datta and Kundu, 1991). When phosphate rocks are finally ground,the degree of acidulation can be lowered to 20% and still 40% water solubilitycan be achieved (Rajan, 1994).
4.3. Integrated Plant Nutrient Supply (IPNS)
The objective of IPNS is to meet the total nutrient needs of a croppingsystem through the combined use of mineral, organic and microbiologicalagents and minimising soil depletion. Current information on IPNS is reviewedin a number of publications (Ange, 1993; FAO, 1993; Tandon 1992b; 1995).
In a recent survey of specialists on research priorities in soil, water andnutrient management, the two top priorities listed were adaptive on-farmresearch and integrated organic-inorganic plant nutrition (Greenland et al.,1994). Although several diverse nutrient sources are integratable in principle,the actual ingredients of an IPNS package will depend upon the localavailability of resources. In a survey of several countries, the main resourcesidentified were animal wastes, crop residues, green manures and BNF (Roy,1992). Animal wastes and crop residues in many cases have competing uses andthe entire quantities produced are not available for recycling. There is a verylarge potential for the recycling of a wide variety of wastes and by products intoagriculture (Tandon, 1995).
Natural nutrient cycling, with all its merits can only take productivity to acertain level. In China, all external nutrient inputs in 1949 came from organicrecycling and rice yields were around 2.2 t/ha. In 1990, organic sourcescontributed 24% N, 32% P and 79% of the total K used, the rest coming fromchemical fertilizers and the average rice yield was 5.8 t/ha (von Uexkilll andMutert, 1993b).
An overall assessment of green manures concluded that these can meet a
part of the nutrient needs, particularly N (40-80 kg N/ha) needs of crops foroptimum production and to that extent can save on fertilizer costs. These cannotcompletely replace fertilizer N if the goal is to harvest moderate-high yields ona sustained basis (Palaniappan, 1992). For lowland rice, the greatest challenge isto increase soil organic matter content. This can be achieved by sustained incor-poration of green manure crops fertilized with P (De Datta and Kundu, 1991).
61
High labour cost and high opportunity costs of land use are two of the majorconstraints to the economic feasibility of green manuring. Under Indianconditions, the overall cost to grow a green manure is estimated to be Rs.500/ha (US$ 16). At currently subsidised prices of urea, this amount can buy 65kg of urea-N. The farmer has, therefore, to evaluate whether he should raise ashort duration grain legume with Rs. 500/ha, sell it and purchase fertilizer Ninstead. Subsidies on fertilizer N, whatever their merits, are a disincentive to theadoption of green manuring and to IPNS.
Apart from capturing BNF through green manures, the other major sourcesare Rhizobia/Azotobacter/Azospirillum for upland crops and cyanobacteria(BGA)/azolla for flooded rice. Considerable information on these inputs, theirpotentials and problems has been reviewed (FAO, 1993; Tandon, 1992b).Among the N-fixing bacteria, Rhizobium has attracted the greatest attention.There is often a need for inoculation with improved strain of Rhizobiumbecause native strains are often inefficient or ineffective. These soils are thusnot only poor in chemical fertility but also in biological fertility.
In flooded rice systems, N-fixation through cyanobacteria BGA and azolla isof potential interest. The sensitivity of these organisms to P deficiency isknown. Surveys in the Philippines show that 53% azolla samples were Pdeficient (Watanabe and Cholitkul, 1990), the implication being suboptimal N-fixation under farmer conditions. In Thailand, 67% azolla samples were P-deficient. Similarly, a field survey of cyanobacteria BGA revealed an average Pcontent of 0.45% as compared to the optimum level of 1% P on an ash freebasis. An adequate supply of phosphate is thus as necessary to sustain BNFsystems as it is for crop production in general.
In acid tropical soils, the merit of including legumes in the managementstrategy has been already mentioned (von UexkOll and Mutert, 1993a).Experience in Malaysia shows that the application of P, K, or Mg to the legumecover in rubber plantations not only recycled these nutrients for use of rubbertrees but also provided more N through higher BNF. As compared to no P plots,application of 45 kg P/ha through rock-P increased BNF by 120 kg N/ha and225 kg P/ha increased it by 370 kg N/ha (Pushparajah and Chew, 1994).
In the semi-arid tropics, integrated use of fertilizers and organics producedthe highest crop yields and also provided greater yield stability (Table 9) whichis so desperately needed in the unirrigated lands. Multi-location, long-termexperiments have shown that high levels of crop productivity can be sustainedby integrating optimum fertilizer application rates with 10-15 t FYM/ha/year(Nambiar and Abrol, 1989; Nambiar and Ghosh, 1984).
62

Table 9. Effect of fertilizers and FYM on the productivity and stability of
dryland finger millet over a period of nine years in an Alfisol under semi-arid
tropical conditions at Bangalore, India (Hedge et al., 1988).
Treatment Mean grain yield Number of years in which
(annual) kg/ha grain yield (t/ha) was
<2 2-3 3-4 4-5
Control 1510 9 0 0 0
Farmyard manure, 10 t/ha 2550 1 6 2 0
Fertilizer 50-50-25 (kg/ha N-P20 5 -K20) 2940 0 5 4 0
FYM, 10 t/ha + 25-25-12.5 2900 0 6 3 0
FYM, 10 t/ha + 50-50-25 3570 0 1 5 3
Both organic and mineral inputs contribute to increase in crop productivity
though the contribution of each varies from one system and condition to
another. Based on the Indian experience, some fertilizer equivalents of diverse
plant nutrient sources are presented in Table 10. These are intended at best to
serve as an illustration for assembling integrated nutrient application rates
employing mined, manufactured as well as locally available resources.
Table 10. Some fertilizer equivalents of organic manures and biofertilizers
(based on several Indian data summarized in Tandon, 1992b).
Component Input level Fertilizer equivalent of inputin terms of crop yield
Organic manure (FYM) per ton 3.6 kg N+P205+K20(2:I: 1)
Green manure (Sesbania) per ton 4.4 kg N*
Green manure (Sesbania) 45 days crop 50-60 kg N for HYV rice
Cowpea intercropped with Legume buried after 30 kg fertilizer N on castor
castor 6 weeksLeucaenia loppings 88 kg N in Leucaenia 25 kg fertilizer N on sorghum
Rhizobium Inoculant 19-22 kg N
Azotobacter and Azospirillum Inoculant 20 kg N
Blue Green Algae 10 kg/ha 20-30 kg N
Azolla 6-12 t/ha 3-4 kg N/t
Sugarcane trash 5 t1/ha 12 kg Nit
Rice straw + water hyacinth 5 t/ha 20 kg N/t
* for tall varieties. Effect expected to be higher on HYV's.
It is foreseen that IPNS will be increasingly mentioned as the strategy for
soil fertility management in which fertilizer will be a key component. It is the
author's assessment that in most high productivity, intensive cropping systems,
IPNS packages in Asia will be fertilizer driven in most cases, by necessity.
63
4.4. Monitoring soil fertility dynamics as a decision making tool
Strategies for fertilizer use need to recognise the dynamic nature of soilfertility. Soils which are well supplied with a particular nutrient can becomedeficient in it when the nutrient balance becomes negative. After a period ofnutrient mining, crops begin to respond to inputs of that nutrient. This calls for aperiodic review of the rates and ratios of nutrients to be applied to sustain highyields. Thus balanced nutrient application rates are subject to change with time.
In the early years of the Green Revolution, it soon became evident that soilswell-supplied in P became deficient in it within a short period when croppedwith N alone and N+P application became the minimum input package. In the1950's, field trials in China showed that crop response to K was limited to a fewplaces. In the 1970's, remarkable responses to K were obtained in many tropicaland subtropical regions. These were partly triggered by negative potashbalances due to increasing application of only N and P (Xie Jian-Chang et al.,1982). When response trends of cereals to K were examined over a decade indifferent agroclimatic zones of India, in almost all cases, the response ratesincreased with time. Results from long-term experiments initiated at IIlocations in the early 1970's also show that while the response to N was positiveat all sites and to P at 6 locations from the beginning, responses to K wereinitially observed at only two locations. At 6-8 locations, responses to fertilizerK started to appear for one or more crops after 5-13 years (Nambiar and Ghosh,1984; Tandon and Sekhon, 1988).
Results from long-term experiments bring out the dynamics of soil fertilityas shown for two separate environments (Table I1). In the rice-wheat rotation atPantnagar, the contribution of nutrients other than N increased with time. AtPalampur, while the application of N alone contributed 51% to the totalproductivity increase in 1973-75, this contribution came to zero a decade later.Continuous use of N alone had apparently resulted in the depletion of soil P andK with the result that high yields were no longer sustainable with N alone.Within a given agroclimatic region, site characteristics also modify the soilnutrient dynamics. On Alfisols at two locations in the Indian SAT, on a fertile,deep Alfisol at the ICRISAT center, initial exchangeable K (59 ppm) changedlittle after 8 years of continuous cropping. On a shallower Alfisol at Bangalore,the exchangeable K dropped from 66 ppm to 27 ppm over a 10-year period andthe application of 75 kg K20/ha increased grain yield of finger millet by 994kg/ha without irrigation (Tandon and Rego, 1989).
64
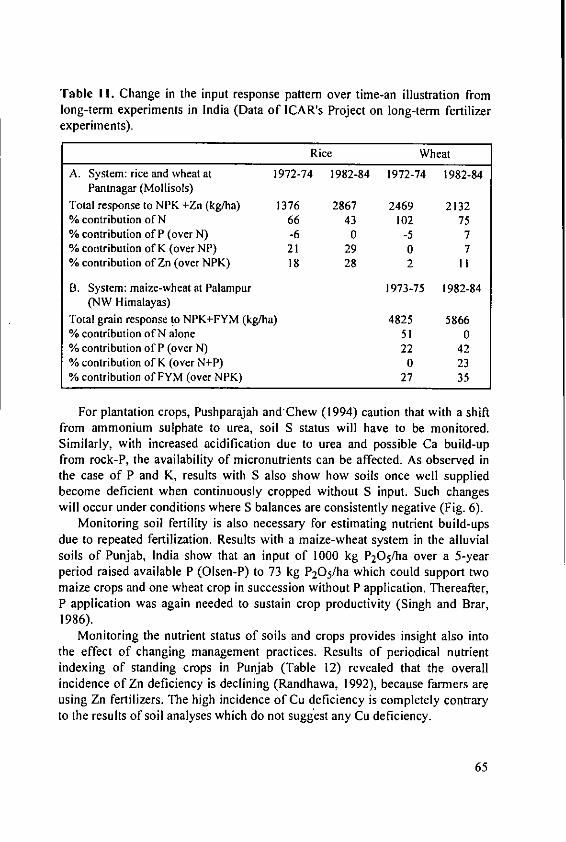
Table I1. Change in the input response pattern over time-an illustration fromlong-term experiments in India (Data of ICAR's Project on long-term fertilizerexperiments).
Rice Wheat
A. System: rice and wheat at 1972-74 1982-84 1972-74 1982-84Pantnagar (Mollisols)
Total response to NPK +Zn (kg/ha) 1376 2867 2469 2132% contribution of N 66 43 102 75% contribution of P (over N) -6 0 -5 7% contribution of K (over NP) 21 29 0 7% contribution of Zn (over NPK) 18 28 2 1I
B. System: maize-wheat at Palampur 1973-75 1982-84(NW Himalayas)
Total grain response to NPK+FYM (kg/ha) 4825 5866% contribution of N alone 51 0% contribution of P (over N) 22 42% contribution of K (over N+P) 0 23% contribution of FYM (over NPK) 27 35
For plantation crops, Pushparajah andChew (1994) caution that with a shiftfrom ammonium sulphate to urea, soil S status will have to be monitored.Similarly, with increased acidification due to urea and possible Ca build-upfrom rock-P, the availability of micronutrients can be affected. As observed inthe case of P and K, results with S also show how soils once well suppliedbecome deficient when continuously cropped without S input. Such changeswill occur under conditions where S balances are consistently negative (Fig. 6).
Monitoring soil fertility is also necessary for estimating nutrient build-upsdue to repeated fertilization. Results with a maize-wheat system in the alluvialsoils of Punjab, India show that an input of 1000 kg P205/ha over a 5-yearperiod raised available P (Olsen-P) to 73 kg P205/ha which could support twomaize crops and one wheat crop in succession without P application. Thereafter,P application was again needed to sustain crop productivity (Singh and Brar,1986).
Monitoring the nutrient status of soils and crops provides insight also intothe effect of changing management practices. Results of periodical nutrientindexing of standing crops in Punjab (Table 12) revealed that the overallincidence of Zn deficiency is declining (Randhawa, 1992), because farmers areusing Zn fertilizers. The high incidence of Cu deficiency is completely contraryto the results of soil analyses which do not suggest any Cu deficiency.
65

Response to Sulphur, kg/ha
0 200 400 600 800 1000I I I I I I I I I
--- 1 972-831983-84
Soyabea 1984-85
1985-86
7 1972-83
1983-84Wheat 1984-85 I
1985-86
11972Maize 1973-79fodder
1980-85
Fig. 6. Trends in crop response to sulphur a long-term experiment in a blackclay soil at Jabalpur, India (Nambiar and Abrol, 1989).
Table 12. Results of periodical nutrient indexing in wheat (results from Punjab).
Year Samples Percent wheat samples deficient inP K Ca Mg Zn Cu
1973-74 445 3 12 4 16 90 311978-79 337 7 12 9 26 46 481985-86 344 4 12 0 6 30 41
It is suggested that an elaborate programme of monitoring changes in soilfertility should be established in Asia which can serve to periodically revisenutrient application rates in such a way that any recently-developed contraintsare taken care of and fertilizer efficiency, profitability and yield sustainabilityare safeguarded.
4.5. Cultivation of stress-tolerant crop varieties
An aspect which has been neglected is the potential of stress-tolerant cropvarieties in overcoming soil related constraints. Varieties which are tolerant tostresses can bring about a grain yield advantage of 2 t/ha over comparablevarieties without such tolerance (Table 13). A yield advantage of 2 t paddy/haequates to Rs. 7000 or US$ 220/ha at current paddy support prices in India forexample.
66

Table 13. Yield advantage conferred by soil stress tolerance in modem ricevarieties (Ponnamperuma and Deturk, 1993).
Stress Total number Mean yield t/haTests Sites Rices Min. Max. Advantage
Salinity 25 15 64 1.5 3.6 2.1Alkalinity 6 2 50 0.8 3.7 2.9Fe toxicity 14 4 58 2.1 4.7 2.6Al/Mn toxicity 4 4 36 1.8 3.6 1.8P deficiency 14 2 118 1.9 4.3 2.4Zn deficiency 31 10 107 0.8 2.9 2.1Fe deficiency 9 3 69 0.8 2.7 1.9
In Indonesia, where Fe-toxicity is a problem in lowland rice, the constraintcan be managed by drainage, planting tolerant varieties and proper fertilizerapplication (Ismunadji el al., 1991). Potassium is reported to play a dominantrole in alleviating iron toxicity but even under "optimum" NPK application,yield differences among rice varieties were as much as 2 t/ha. The practicalutility of such research bears fruit only when the seed industry multiplies theseeds of such varieties and these are vigorously marketed in the target areas.
5. References
ADB (1991): Sustainable agricultural development-concepts, issues and strate-gies. Agric. Dept. Staff Paper No. 1. Asian Development Bank, Manila,Philippines. pp. 22.
Arya, L.M., Dierolf, T.S., Rusman, B., Sofyan, A. and Widjaja-Adhi, I.P.G.(1992): Soil structure effects on hydrologic process and crop wateravailability in Ultisols and Oxisols of Sitiung, Indonesia. Soil ManagementCRSP Bulletin 92-03. NCSU, Raleigh, N.C. pp. 51.
Ahmad, N., Tahir Saleem, M. and Twyford, I.T. (1992): Phosphorus research inPakistan-a review. Proc. Symp. Role of Phosphorus in Crop Production.NFDC, Islamabad, Pakistan. pp. 59-92.
Ange, A.L. (1993): Environmental risks of fertilizer use, overuse or misuse.Proc. Reg. FADINAP Seminar on Fertilization and the Environment.Bangkok, Thailand. pp. 49-102.
BARC (1986): Proc. Int. Symp. Sulphur in Agricultural Soils. Dhaka,Bangladesh. pp. 519.
Bhuiyan, N.I. (1993): Sulphur fertilization for rice and non-rice crops ofBangladesh agriculture. Proc. Int. Symp. Role of Sulphur, Magnesium andMicronutrients in Balanced Plant Nutrition. PPIC, Hongkong. pp. 81-93.
67
Biswas, B.C. and Tewatia, R.K. (1991): Nutrient balance in agroclimaticregions of India-an overview. Fert. News 36(6): 13-18.
Biswas, B.C., Yadav, D.S. and Maheshwari, S. (1985): Role of calcium and
magnesium in Indian agriculture. Fert. News 30(7): 15-35.Cooke G.W. (1985): The role and importance of potassium in the agricultural
systems of the humid tropics. Proc. 19th Colloquium Potassium in theAgricultural Systems of the Humid Tropics. IPI, Berne. pp. 369-405.
De Dana, S.K. (1985): Nutrient requirement for sustaining high yields of rice
and other cereals. Proc. 19th Colloquium Potassium in the AgriculturalSystems of the Humid Tropics. IPI, Berne. pp. 93-120.
De Datta, S.K. and Kundu, D.K. (1991): Fertility management of acid ricegrowing soils in tropical Asia-a review. Proc. Int. Symp. Rice Production onAcid Soils of the Tropics. IFS, Kandy, Sri Lanka. pp. 147-160.
Dent, F.J. (1990): Land resources of Asia and the Pacific. In: Problem Soils ofAsia and the Pacific. RAPA Report No. 1990/6. FAO, Bangkok, Thailand.pp. 44-67.
Dent, F.J. (1992): Environmental issues in land and water development - aregional perspective. In: Environmental Issues in Land and WaterDevelopment. RAPA Publ. No. 1992/8. FAO, Bangkok, Thailand. pp. 52-75.
FAO (1987): Agriculture towards 2000. Revised ed. Rome, Italy. pp. 263.FAO (1992): Environmental Issues in Land and Water Development. RAPA
Publ. No. 1992/8. FAO, Bangkok, Thailand. pp. 488.FAO (1993): The role of IPNS in Sustainable and Environmentally Sound Agri-
cultural Development. RAPA Pub]. No. 1993/13. FAO, Bangkok, Thailand.pp. 230.
FAO-FIAC (1992): The Importance of Sulphur in Crop Production. Rome,Italy. pp. 62.
Greenland, D.J., Bowen, G., Easwaran, H., Rhoades, R. and Valantin, C.(1994): Soil, Water and Nutrient Management Research-a new agenda.IBSRAM, Bangkok, Thailand. pp. 72.
Hall, A.D. (1909): Fertilisers and Manures. John Murrary, London. pp. 384.Hanson, R.G. (1994): Personal communication. N.C. State University, Raleigh,
N.C., U.S.A.Hegde, B.R. el al. (1988): In: National Symp. Recent Advances in Dryland
Agriculture. CRIDA, Hyderabad.Isherwood, K.F. (1991): The consumption of nutrients other than N, P, K, and
Ca. IFA, Paris, France. pp. 46.Islam, M.S. (1994): Soil fertility and fertiliser use in Bangladesh (manuscript).
68

Ismunadji, M., Ardjasa, W.S. and von Uexktill, H.R. (1991): Increasing produc-tivity of iron toxic soils of Indonesia. Proc. Int. Symp. Rice Production onAcid Soils of the Tropics. IFS, Kandy, Sri Lanka. pp. 213-217.
Ismunadji, M. (1993): Sulphur nutrition of food crop farming systems inIndonesia. Proc. Int. Symp. Role of Sulphur, Magnesium and Micronutrientsin Balanced Plant Nutrition. PPIC, Hongkong. pp. 70-77.
Kanwar, J.S. and Mudahar, M.S. (1986): Fertiliser sulphur and food production.Martinus Nijhoff. pp. 247.
Kanwar, J.S. and Youngdahl, L.J. (1985): Micronutrient needs of tropical foodcrops. Fert. Res. 7: 43-67.
Katyal, J.C. and Vlek, P.L.G. (1985): Micronutrient problems in tropical Asia.Fert. Res. 7: 69-94.
Kemmler, G. (1992): Secondary Nutrients. Publication AGL/MISC/20/92.FAO, Rome, Italy. pp. 73.
Kumar, V, Shrotriya, G.C. and Kaore, S.V. (Eds.) (1989): Soil Fertility andFertiliser Use, Vol. III on Urea Super Granules for Increasing Nitrogen UseEfficiency. IFFCO, New Delhi. pp. 143.
Kyuma, K. (1990): Protection of the environment. Sustained agriculture,sustained ecosystems. Proc. Symp. Phosphorus Requirements forSustainable Agriculture in Asia and Oceania. IRRI, Los BaftIos. pp. 57-71.
Leelavathi, C.R., Bapat, S.R. and Narain, P. (1986): Revised yardsticks ofadditional production of rice due to improved measures. I.A.S.R.I., NewDelhi. pp. 108.
Liu Chong-qun (1993): Characterisation of content and distribution of microelements in soils of China. Proc. Int. Symp. Role of Sulphur, Magnesiumand Micronutrients in Balanced Plant Nutrition. PPIC, Hong Kong. pp. 54-61.
Lu, R.K. (1991): Human activity and soil fertility-nutrient depletion of arablesoils of China. Biosphere 1(4): 371-376.
Makarim, A.K., Ismunadji, M. and von Uexkoll, H.R. (1991): An overview ofmajor nutritional constraints to rice production on acid soils of Indonesia.Proc. Int. Symp. Rice Production on Acid Soils of the Tropics. IFS, Kandy,Sri Lanka. pp. 199-203.
Mamaril, C.P., Gonzales, P.B. and Cacnio, V.N. (1993). Sulphur managementin lowland rice. Proc. Int. Symp. Role of Sulphur, Magnesium and Micro-nutrients in Balanced Plant Nutrition. PPIC, Hong Kong. pp. 11-18.
Mathur, B.S., Sarkar, A.K., Singh, K.P. and Lal, S. (1989): Long-term effects ofmanure and fertiliser on crop production and fertility of acid soils. ResearchBull. 2/89, Birsa Agric. University, Ranchi, India. pp. 54.
Mondal, S.S. (1982): Potassium nutrition at high levels of N fertilisation on rice.Potash Review, Subject 9, Suite 52. IPI, Berne.
69

Nambiar, K.K.M. and Abrol, I.P. (1989): Long-term fertiliser experiments inIndia. Fert. News 34 (4): 11-20, 26.
Nambiar, K.K.M. and Ghosh, A.B. (1984): Highlights of research on long-termfertiliser experiments in India (1971-82). Tech. Bull. Long-term Fertiliser
Project. IARI, New Delhi. pp. 100.Palaniappan, S.P. (1992): Green manures and their management. In: Fertilisers,
Organic Manures, Recyclable Wastes and Biofertilisers (Ed. H.L.S.Tandon). FDCO, New Delhi. pp. 52-71.
Patnaik, S., Mandal, L.N., Ramanathan, K.M. and Panda, D. (1991): Soil-
related constraints limiting rice production in traditional rice growing areasof peninsular, eastern and north eastern regions. In: Bulletin No. 15. IndianSoc. Soil Sci., New Delhi. pp. 107-118.
Ponnamperuma, F.N. and Deturk, P. (1993): A review of fertilisation in riceproduction. Int. Rice Commn. Newsl. 42: 1-12.
Portch, S. (Ed.) (1993): Proc. Int. Symp. Role of Sulphur, Magnesium andMicronutrients in Balanced Plant Nutrition. PPIC, Hong Kong. pp. 418.
Pushparajah, E. (1991): Acid soils: a need to evaluate appropriate managementsystems for sustained production under rainfed conditions. Proc. Int. Symp.Rice Production on Acid Soils of the Tropics. IFS, Kandy, Sri Lanka. pp.97-105.
Pushparajah, E. and Chew, P.S. (1994): Integrated nutrient management for
sustaining high yields of plantation tree crops in tropical Asia (manuscript).Rajan, S.S.S, 0' Connor, M.B. and Sinclair, A.G. (1994): Partially acidulated
phosphate rocks: controlled release phosphorus for more sustainableagriculture. Fert. Res. 37: 69-78.
Ranganathan, V. and Natesan, S. (1985): Potassium nutrition of tea. In:
Potassium in Agriculture. Amer. Soc. Agron., Madison, WI, USA. 981-1022.
Randhawa, N.S. (1992): Balanced fertiliser use and food production in the
northern states. Proc. PPIC-lndia Symp., Hisar. pp. 14-30.Randhawa, N.S. and Tandon, H.L.S. (1982): Advances in soil fertility and
fertiliser use reseach in India. Fert. News 26(2): 11-26.Recel, M.R. (1990): Problem soils in the Philippines. RAPA Report No. 1990/6,
FAO, Bangkok. pp. 239-246.Roy, R. (1986): Field response of Kew pineapple to N, K and plant density.
Maharashtra J. Hort. 3 (2): 38-43.Roy, R.N. (1992): Integrated plant nutrition systems-an overview. In:
Fertilisers, Organic Manures, Recyclable Wastes and Biofertilisers (Ed.H.L.S. Tandon). FDCO, New Delhi. pp. 1-11.
70

Roy, R.N. (1993): Review of results of the FAO interregional sulphur network.Proc. Int. Symp. Role of Sulphur, Magnesium and Micronutrients inBalanced Plant Nutrition. PPIC, Hong Kong. pp. 135-140.
Sekhon, G.S. and Puri, D.N. (1986): The input-output balance of plant nutrientsin some intensive multiple cropping systmes in India. Potash Review,Subject 6, Suite 52. IPI, Berne.
Singh, Bhajan and Brar, S.P.S. (1986): Long-term effects of NPK and Znfertilisation in maize-wheat rotation on crop yields and soil characteristics(1970-1984). Research Bulletin No. 12, Department of Soils, Punjab Agric.University, Ludhiana, India. pp. 54.
Singh, M. (1992): The nitrogen-potassium interaction and its management. In:Management of Nutrient Interactions in Agriculture (Ed. H.L.S. Tandon).FDCO, New Delhi, India. pp. 21-37.
Sippola, J. and Lindstedt, L. (1992): Report on the soil test results for samplesfrom Vietnam. Agric. Res. Center of Finland, Joikioinen, Finland.
Stewart, JA. (1988): Balanced fertilisation. Proc. Int. Symp. BalancedFertilisation. Beijing. China. pp. 161-178.
TAC (1989): Sustainable agricultural production. Implications for agriculturalresearch. FAO, Rome. pp.
Takkar, P.N., Chibba, I.M. and Mehta, S.K. (1989): Twenty years of coordinatedresearch on micronutrients in soils and plants. I.I.S.S., Bhopal, India. pp. 314.
Tandon, H.L.S. (Ed.) (1992a): Management of Nutrient Interactions in Agricul-ture. FDCO, New Delhi. pp. 142.
Tandon, H.L.S. (Ed.) (1992b): Fertilisers, Organic Manures, Recyclable Wastesand Biofertilisers. FDCO, New Delhi, India. pp. 143.
Tandon, H.L.S. (1993a): Assessment of soil nutrient depletion. Proc. Reg.FADINAP Seminar on Fertilisation and the Environment. Bangkok,Thailand. pp. 203-220.
Tandon, H.L.S. (1993b): Soil fertility and fertiliser use-an overview of researchfor increasing and sustaining crop productivity. In: CASAFA-ISSS-TWASWorkshop on Integration of Natural and Manmade Chemicals in SustainableAgriculture in Asia. New Delhi. pp. 32.
Tandon, H.L.S. (1995): Recycling of Crop, Animal, Human and IndustrialWastes in Agriculture. FDCO, New Delhi, India. pp. 150.
Tandon, H.L.S. and Kimmo, I.J. (1993): Balanced fertiliser use: Its practicalimportance and guidelines for agriculture in the Asia Pacific Region.FADINAP, Bangkok, Thailand. pp. 49.
Tandon, H.L.S. and Pratap Narayan (1990): Fertilisers in Indian Agriculture-past, present and future (1950-2000). FDCO, New Delhi, India. pp.160+viii.
71

Tandon, H.L.S. and Ranganathan, V. (1989): Fertilisers and their managementin plantation crops. In: Fertiliser Management in Plantation Crops. FDCO,New Delhi, India. pp. 26-60.
Tandon, H.L.S. and Rego, T.J. (1989): Management of fertiliser nutrients otherthan nitrogen in the semi-arid tropics of India. Proc. Colloquium SoilFertility and Fertiliser Management in Semiarid Tropical India. Patancheru,India. Int. Fertilizer Development Centre, Muscle Shoals, Al. USA. 71-88.
Tandon, H.L.S. and Sekhon, G.S. (1988): Potassium Research and AgriculturalProduction in India. FDCO, New Delhi, India. pp. 144.
Virmani, S.M. (1994): Personal communication. ICRISAT, Patancheru, India.von Uexktlll, H.R. (1986): Efficient fertiliser use in acid upland soils of humid
tropics. FAO Fertilizer and Plant Nutrition Bulletin No. 10. FAO, Rome,Italy. pp. 59.
von Uexktll, H.R. and Bosshart, R.P. (1988): Micronutrient needs and fertilisa-tion in southeast Asia. Proc. IFA-FADINAP Reg. Conf. IFA, Paris, France.
von Uexkoll, H.R. and Mutert, E.W. (1993a): Principles of balanced fertilisa-tion. Proc. Reg FADINAP. Seminar on Fertilisation and the Environment.Bangkok, Thailand. pp. 17-36.
von Uexkilll, H.R. and Mutert, E.W. (1993b): Fertiliser use and sustainableagriculture in Asia. The Fertiliser Society, London. pp. 20-36.
Wade, M.K., Gill, D.W., Subagjo, Hardjosubroto, Sudjadi, M. and Sanchez,P.A. (1988): Overcoming soil fertility constraints in a transmigration area ofIndonesia. Trop. Soils Bull. 88-01. NC State University, Raleigh, N.C. pp.60.
Watanabe, 1. and Cholitkul, W. (1990): Phosphorus as a factor limiting nitrogenfixation in flooded rice soils. Proc. Symp. Phosphorus Requirements forSustainable Agriculture in Asia and Oceania. IRRI, Los Baflos. pp. 281-293.
Xie Jian-Chang, Du Cheng-Lin and Li Fu-Sheng (1993): Soil magnesium statusand prospects for magnesium requirements in south China. Proc. Int. Symp.Role of Sulphur, Magnesium and Micronutrients in Balanced PlantNutrition. PPIC, Hongkong. pp. 262-272.
Xie Jian-Chang, Ma Mao-Tong, Du Cheng-Lin and Chen Ji-Xing (1982):Potassium status and potassium fertiliser requirement of soils in tropical andsub-tropical regions of China. Proc. Int. Conf. Phosphorus and Potassium inthe Tropics. Malaysian Soc. Soil Sci., Kuala Lumpur, Malaysia. pp. 113-126.
Yamazaki, T. (1967): Possibilities of obtaining high rice yield through increasedfertiliser application. Tottori University, Japan.
72

Potassium Dynamics and Availability in StronglyWeathered and Highly Leached Soils in the HumidTropics
A. SuwanaritDepartment of Soil Science, Faculty of Agriculture, Kasetsart University,Bangkok 10900,Thailand.
Abstract
Highly leached and strongly weathered soils in the humid tropics may befound on a wide range of parent materials. Clay minerals in the clay fraction aredominated by kaolinite. Most of the soils are acidic. The majority of the soilshave low to moderate organic matter contents, very low to low cation exchangecapacities (CEC), very low to low total-K contents and widely varying contentsof exchangeable K.
In the old, highly weathered soils of the tropics, feldspars have already beenbroken down and the residual feldspars, which may exist in small amounts, havebeen made inactive in K liberation. Most of micas in the highly leached andstrongly weathered soil have also been transformed to minerals which are low inK and CEC.
The soils have a small proportion of exchange sites high in affinity for K' inthe exchange complex and therefore, exhibit low capacity to fix K and to releaseK from non-exchangeable form. Highly leached and strongly weathered soils inthe humid tropics therefore, suffer from leaching of K and can easily becomeexhausted in K on cropping. Some of the soils are already exhausted withrespect to K supply. The measurement of K status of the soils with extractantsslightly stronger than those used to determine the exchangeable form or thatprovide information involving exchangeable K have proved satisfactory.Liming, placement method, application time, balance of nutrients and cropcultivar are important matters to be considered in the efficient utilization of Kfertilizer.
1. Introduction
Highly leached and strongly weathered soils can be classified in the GreatGroups of Reddish Brown Lateritic soils, Red Yellow Podzolic soils, GrayPodzolic soils, and Latosols according to Dudual and Moormann (1964) or in theorders of Oxisols and Ultisols according to the soil taxonomy. Data adapted byMalavolta(1985) for soils in the tropics and subtropics shows that Oxisols cover17% of the total area and are the second most abundant after Aridisols (33 %).
73

Ultisols, covering 9% of the total area, are the fourth after Alfisols (13%). In35 provinces of Thailand, soils which are classified in the Great Groups ofReddish Brown Lateritic soils, Red Yellow Podzolic soils, Red Brown Latosolsand Red Yellow Latosols cover 18.7% of the total area of 140.7 m ha (adaptedfrom Anon., 1971-1977).
Highly leached and strongly weathered soils can be found on a wide rangeof parent materials because leaching and degree of weathering are among manyfactors affecting soil formation. For example, from studying soils in Thailand,Ogawa et al. (1975) reported that Reddish Brown Lateritic soils were formed onresiduum from old alluvium, acid rocks and intermediate rocks, Red YellowPodzolic soils from residuum from soil alluvium, acid rocks, and intermediaterocks, Gray Podzolics soils from old alluvium, Reddish Brown Latosols soilsfrom residuum from basalt and Red Yellow Latosols from old alluvium.Acquaye (1973) and Malavolta (1985) presented summaries of parent materialsfor soils of Ghana and Brazil which showed a wide range of parent materials ofhighly leached and strongly weathered soils. The parent materials includedbiotite, granite, schist, gneiss, basalt and basic rocks.
2. Chemical soil properties
Organic matter content, pH and cation exchange capacity (CEC) of differenthighly leached and strongly weathered soils found in 35 provinces of Thailandare shown in Tables I and 2. Wide variation can be observed in all theseproperties. This is presumably due to wide variation in soil forming factors.
2.1. pH
The means for pH's of the soils are in the range of 4.9-5.9 though those of afew soils can be either as low as 3.8 or as high as 7.8. The data from each soilseries at different sites presented by Anon. (1971-1977) show that most of thesoils are acidic, with very few being either neutral or alkaline. Soils with lowerpH's in the subsurface soils are found more often than those with higher pH's inthe subsurface soils than in surface soils.
2.2. Organic matter content
Organic matter contents of the surface layer of the soils are in the range of2.4-37.8 g kg-I as reported by Ogawa et al. (1975) whereas those reported byAnon. (1971-1977) are in a range of 0.2-58.0 g kg-1. The lowest figure reportedby Ogawa et al. (1975) was from Gray Podzolic soils while that reported byAnon. (1971-1977) was from Red Yellow Podzolic soils. The highest figurewere from a Red Yellow Podzolic soil reported by Ogawa et al. (1975) andfrom a Gray Podzolic soil reported by Anon. (1971-1977).
74

Table I. pH, organic matter content, CEC and available K in some highlyleached and strongly weathered soils in Thailand.
Great soil Layer No. of pEI OM CEC Exch. Kgroup (cm) soil series (in H20) (g kg-1) (cmol kg-') (mg kg-1)
Reddish Brown 0-30 25 4.4-8.0 5.0-45.0 2.1 -30.0 0.1 -207Lateritic 30-60 25 4.0-7.5 1.3-32.0 0.14-30.0 0.1 -130
Red Yellow 0-30 36 4.0-7.3 2.0-58.0 0.55-30.0 0.02-187Podzolic 30-60 36 3.8-8.0 2.0-32.0 1.4 -30.0 0.03-155
Gray Podzolic 0-30 7 4.0-7.0 4.0-54.0 1.1 -33.5 0.05-15130-60 7 4.0-6.5 4.0-11.0 1.8 -30.0 0.03-120
Source: Adapted from Anon. (1971-1977).
The data showed that highly leached and strongly weathered soils maycontain from a trace to very high levels of organic matter. The mean figures arehowever in the range of 9.6-21.1 g kg- I for the surface soils and 4.2-6.2 g kg-Ifor the subsurface soils.
2.3. Cation exchange capacity
Cation exchange capacity (CEC) of the surface and subsurface layers ofhighly leached and strongly weathered soils in Thailand reported by Anon.(1971-1977) are summarized in Table I and those reported by Ogawa et al.(1975) are shown in Table 2. For the surface soils, the figures reported by Anon.(1971-1977) are in the range of 0.14-33.5 cmol kg-I whereas those reported byOgawa et al. (1975) are in the range of 0.64 -23.9 cmol kg-'. The formerauthors reported the lowest from a Red Yellow Podzolic soils and the highestfrom three groups of soils including Reddish Brown Lateritic soils, Red YellowPodzolic soils, and Gray Podzolic soils. The latter reported the lowest figurefrom Gray Podzolic soils and the highest from Red Yellow Podzolic soils. Thelowest CEC's were found mostly from the soils containing the lowest organicmatter whereas the highest CEC's were found mostly from the soils containingthe highest organic matter. This suggest that organic matter is the main sourceof the CEC. The mean values obtained by Ogawa et al. (1975) suggest that mostof the soils have CEC's of 10 cmol kg-I or less which are low to very lowaccording to standard of rating.
75
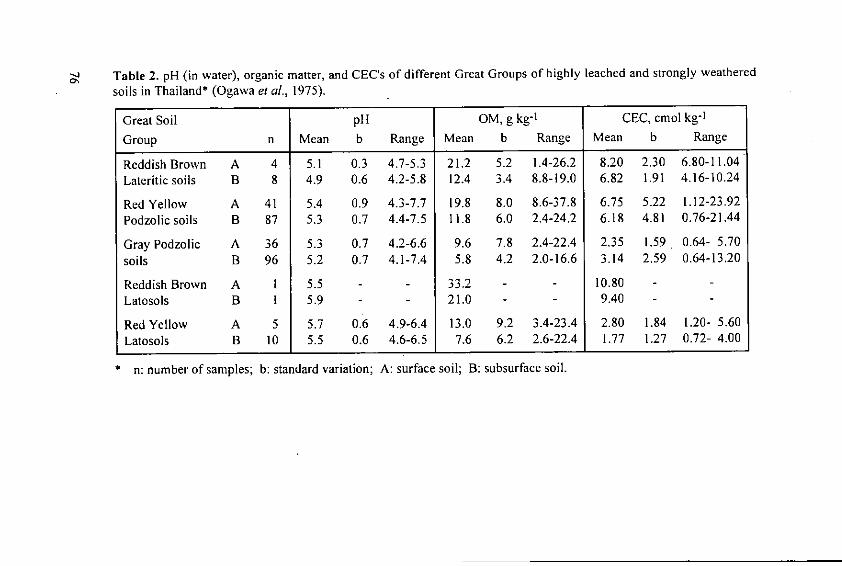
Table 2. pH (in water), organic matter, and CEC's of different Great Groups of highly leached and strongly weatheredsoils in Thailand* (Ogawa et al., 1975).
Great Soil pH OM, g kg-' CEC, cmol kg-1
Group n Mean b Range Mean b Range Mean b Range
Reddish Brown A 4 5.1 0.3 4.7-5.3 21.2 5.2 1.4-26.2 8.20 2.30 6.80-11.04
Lateritic soils B 8 4.9 0.6 4.2-5.8 12.4 3.4 8.8-19.0 6.82 1.91 4.16-10.24
Red Yellow A 41 5.4 0.9 4.3-7.7 19.8 8.0 8.6-37.8 6.75 5.22 1.12-23.92Podzolic soils B 87 5.3 0.7 4.4-7.5 11.8 6.0 2.4-24.2 6.18 4.81 0.76-21.44
Gray Podzolic A 36 5.3 0.7 4.2-6.6 9.6 7.8 2.4-22.4 2.35 1.59 0.64- 5.70
soils B 96 5.2 0.7 4.1-7.4 5.8 4.2 2.0-16.6 3.14 2.59 0.64-13.20
Reddish Brown A 1 5.5 - 33.2 - 10.80 -
Latosols B 1 5.9 - 21.0 - 9.40 -
Red Yellow A 5 5.7 0.6 4.9-6.4 13.0 9.2 3.4-23.4 2.80 1.84 1.20- 5.60
Latosols B 10 5.5 0.6 4.6-6.5 7.6 6.2 2.6-22.4 1.77 1.27 0.72- 4.00
* n: number of samples; b: standard variation; A: surface soil; B: subsurface soil.
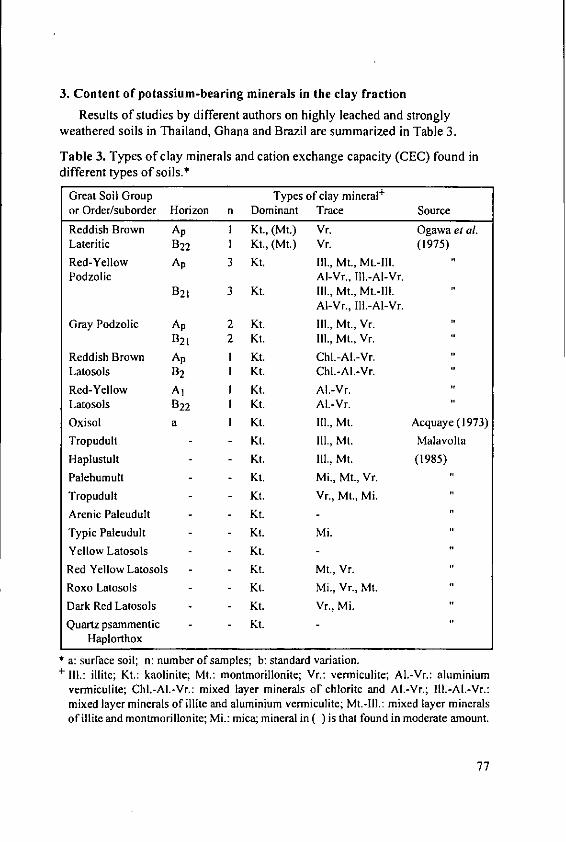
3. Content of potassium-bearing minerals in the clay fraction
Results of studies by different authors on highly leached and stronglyweathered soils in Thailand, Ghana and Brazil are summarized in Table 3.
Table 3. Types of clay minerals and cation exchange capacity (CEC) found indifferent types of soils.*
Great Soil Group Types of clay mineral'or Order/suborder Horizon n Dominant Trace Source
Reddish Brown Ap I Kt., (Mt.) Vr. Ogawa et al.Lateritic B22 I Kt., (Mt.) Vr. (1975)Red-Yellow Ap 3 Kt. Ill., Mt., Mt.-Ill.Podzolic AI-Vr., III.-AI-Vr.
B2 1 3 Kt. Ill., Mt., Mt.-Ill.Al-Vr., Ill.-AI-Vr.
Gray Podzolic Ap 2 Kt. Ill., Mt., Vr.B2 1 2 Kt. Ill, Mt., Vr.
Reddish Brown Ap I Kt. Chl.-AI.-Vr.Latosols B2 I Kt. Chl.-AI.-Vr.Red-Yellow Al I Kt. AI.-Vr.Latosols B22 I Kt. AI.-Vr.
Oxisol a I Kt. Ill., Mt. Acquaye (1973)
Tropudult - - Kt. Ill., Mt. Malavolta
Haplustult - - Kt. 1Il., Mt. (1985)
Palehumult - - Kt. Mi., Mt., Vr.
Tropudult - - Kt. Vr., Mt., Mi.
Arenic Paleudult - - Kt.
Typic Paleudult - - Kt. Mi.
Yellow Latosols - - Kt.
Red Yellow Latosols - - Kt. Mt., Vr.
Roxo Latosols - - Kt. Mi., Vr., Mt.
Dark Red Latosols - Kt. Vr., Mi.
Quartz psammentic - Kt.Haplorthox
* a: surface soil; n: number of samples; b: standard variation.+ Ill.: illite; Kt.: kaolinite; Mt.: montmorillonite; Vr.: vermiculite; Al.-Vr.: aluminium
vermiculite; Chl.-AI.-Vr.: mixed layer minerals of chlorite and AI.-Vr.; Ill.-Al.-Vr.:mixed layer minerals of illite and aluminium vermiculite; Mt.-Ill.: mixed layer mineralsof illite and montmorillonite; Mi.: mica; mineral in ( ) is that found in moderate amount.
77

It is evident that kaolinite predominates in the clay fraction. The minor clayminerals are illite, vermiculite, montmorillonite, aluminum vermiculite, mica,mixed layer minerals of montmorillonite and illite, mixed layer minerals of illiteand aluminum vermiculite and mixed layer minerals of chlorite and aluminumvermiculite. The contents of clay minerals suggest low potassium-supplyingpower and explain the low cation exchange capacity of highly leached andstrongly weathered soils, since kaolinite has very low CEC and K content.
4. Soil K status
4.1. Total K
The total-K contents of the surface and subsurface layers of soils in differentGreat Groups of highly leached and strongly weathered soils in Thailand areshown in Table 4.
Table 4. Amounts of total K and exchangeable K of different Great Groups ofhighly leached and strongly weathered soils in Thailand* (Ogawa et al., 1975).
Great Soil Group Total K, g kg-' Exch. KO, mg kg-'n Mean b Range Mean h Range
Reddish Brown A 4 0.99 0.48 0.52- 1.68 255 127 100-370Lateritic B 8 1.50 6.48 0.45- 2.03 119 83 50-288
Red-Yellow A 41 0.41 3.81 0.32-12.63 108 77 30-220Podzolic B 93 4.75 4.34 0.12-15.01 62 45 7-170
Gray Podzolie A 37 0.94 0.47 0.05- 3.83 64 57 20-267B 93 1.34 1.40 0.10- 4.92 45 43 4-199
Reddish Brown A I 1.56 - 513 - -
Latosols B I 1.24 - 396 - -
Red-Yellow A 5 0.46 0.42 0.25- 1.20 75 73 14-185Latosols B 10 0.44 0.34 1.00- 1.20 44 41 5-144
NIH4OAc-exchangeable K* n: number of samples; b: standard variation;
A: surface soil; 13: subsurface soil.
Most, if not all, of the Reddish Brown Lateritic soils, Red Yellow Podzolicsoils and Gray Podzolic soils have a higher K content in the subsurface soilsthan in the surface soils while most of Reddish Brown Latosols and Red YellowLatosols have a K content in the surface soil either similar to or higher than thatof the subsurface soil. For the surface soils, the figures are in the range of 0.05-12.7 g kg-'. The lowest figure was found from Gray Podzolic soils whereas thehighest from Red Yellow Podzolic soils.
78

Excluding the Reddish Brown Latosol of which only one sample wasstudied, the means for the surface soils from the different Great Soil Groups arein the range of 0.41-0.99 g kg-1. This shows that most of the soils are very lowin total K content. For the subsurface soils, the figures are in the range of 0.10-15.0 g kg-'. The lowest figure was from Red Yellow Latosols whereas thehighest from Red Yellow Podzolic soils. The means for different Great SoilGroups are in the range of 0.44-4.75 g kg-1.
4.2. Exchangeable K
Amounts of exchangeable K in the soils reported by Anon. (1971-1977) aresummarized in Table I and those reported by Ogawa et al. (1975) in Table 4.The amounts of exchangeable K reported by Ogawa et al. (1975) are in theranges of 0.02-207 mg kg-I K for surface soils and 0.03-155 mg kg-I K forsubsurface soils. The amounts reported by the latter authors are in the ranges of14-370 mg kg- I K for surface soils and 5-288 mg kg- I K for subsurface soils.The mean figures for the surface soils are in the order of Gray Podzolic soils <Red Yellow Latosols < Red Yellow Podzolic soils < Reddish Brown Lateriticsoils. A very similar order is observed for the subsurface soils.
5. K transformation
A general picture of the dynamics of K in the soil-plant-water system, whichis sometimes referred to as the cycle of potassium, has been adapted byMalavolta (1985) as shown in Fig. 1. The most relevant processes in the schemeare discussed in the following sections.
Primary Organic Fertilizersminerals matter
Soil 4
Solution 4 Exchangeable K+ Nonexchangeable K
6 7
Plants Percolation water
Fig. I. Schematic presentation of biochemical K transformation.
79
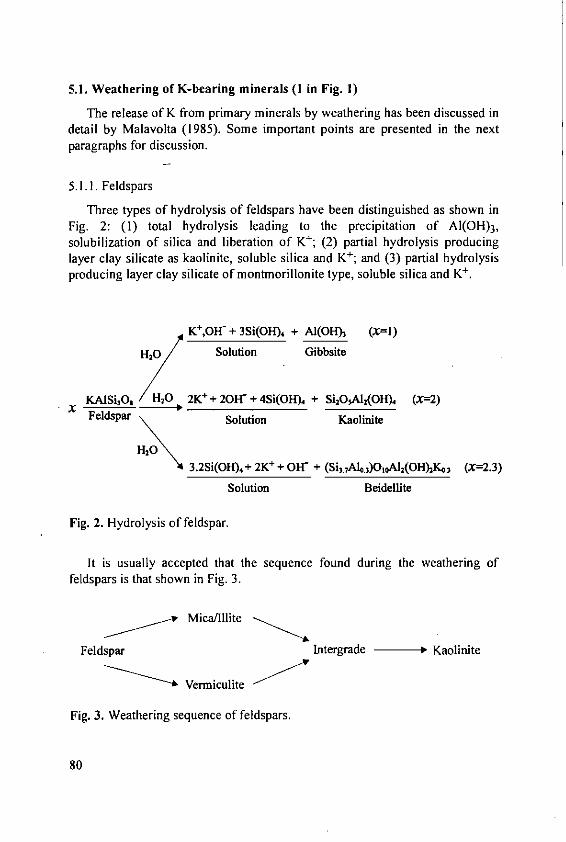
5.1. Weathering of K-bearing minerals (1 in Fig. 1)
The release of K from primary minerals by weathering has been discussed indetail by Malavolta (1985). Some important points are presented in the nextparagraphs for discussion.
5.1.1. Feldspars
Three types of hydrolysis of feldspars have been distinguished as shown inFig. 2: (1) total hydrolysis leading to the precipitation of AI(OH) 3,solubilization of silica and liberation of K+; (2) partial hydrolysis producinglayer clay silicate as kaolinite, soluble silica and K+; and (3) partial hydrolysisproducing layer clay silicate of montmorillonite type, soluble silica and K+.
K+,O - + 3Si(OH) 4 + AI(OH)3 (X=l)
H20 Solution Gibbsite
X KAISiO, H 0f, 2K+ + 20H- + 4Si(OH)4 + Si20A,(OH, (X--2)Feldspar H\ Solution Kaolinite
HO3.2Si(OH)4+ 2K+ + OW + (Si3.Al4.)O 0 oA2(OH) 2Ko3 (X--2.3)
Solution Beidellite
Fig. 2. Hydrolysis of feldspar.
It is usually accepted that the sequence found during the weathering offeldspars is that shown in Fig. 3.
, Mica/Illite
Feldspar Intergrade -- Kaolinite
Vermiculite
Fig. 3. Weathering sequence of feldspars.
80

In the regions of high rainfall and high temperature and good drainage, the
sequence can be short-circuited so that feldspars yield kaolinite directly,
accompanied by dissolved silica and K+. Data on dominant clay minerals in the
clay fraction of highly leached and strongly weathered soils presented in the
preceding section which show that kaolinite predominates in all of the soils
suggest that the short-circuited sequence prevails in the weathering of the
feldspars. Malavolta (1985) pointed out that in the old, highly weathered soils of
the tropics and subtropics, feldspars have already been broken down. In
addition, it is likely that the residual feldspars, which may exist in small
amounts are covered by Fe and Al oxides that would render them inactive for K
liberation. This evidence suggests that release of K from feldspars in highly
leached and strongly weathered soils would not be a significant source of K to
plants growing on such soils.
5.1.2. Micas
The transformation of micas into clay minerals, with a consequent gradual
decrease in K content due to its liberation from the lattice is presented in Fig. 4.
Within the environment that exists in soil formation in the tropical regions, two
different sequences have been postulated: (1) mica -- vermiculite -> kaolinite
- gibbsite; and (2) mica -+ chloritizated vermiculite -* gibbsite -, kaolinite.
The sequence and its results depend on the nature of the K-bearing mineral as
well as the duration and the conditions of the weathering process. Data on
dominant clay minerals presented in the preceding section and the evidence
deduced in the preceding section which show that organic matter is the main
source of the CEC suggested that most of the micas in the highly leached and
strongly weathered soils have been transformed into minerals which are low in
K and permanent CEC. This evidence suggests that mica is not an importantsource of K-supply for plant in these soils.
Vermiculite
Mica Hydrous lllite Transitionalmica minerals M
K conent~gkg-'MontmorilloniteK content,g kg-,
-100 60-80 40-60 -30 <10
Fig. 4. Transformation of mica into clay and changes in K content.
81
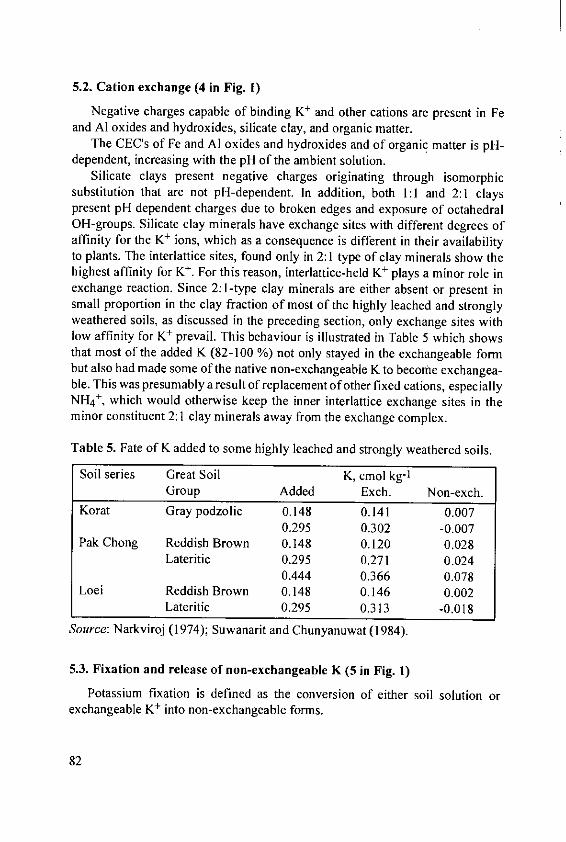
5.2. Cation exchange (4 in Fig. 1)
Negative charges capable of binding K+ and other cations are present in Feand Al oxides and hydroxides, silicate clay, and organic matter.
The CEC's of Fe and A! oxides and hydroxides and of organic matter is pH-dependent, increasing with the pH of the ambient solution.
Silicate clays present negative charges originating through isomorphicsubstitution that are not pH-dependent. In addition, both 1:1 and 2:1 clayspresent pH dependent charges due to broken edges and exposure of octahedralOH-groups. Silicate clay minerals have exchange sites with different degrees ofaffinity for the K' ions, which as a consequence is different in their availabilityto plants. The interlattice sites, found only in 2:1 type of clay minerals show thehighest affinity for K+. For this reason, interlattice-held K' plays a minor role inexchange reaction. Since 2:1-type clay minerals are either absent or present insmall proportion in the clay fraction of most of the highly leached and stronglyweathered soils, as discussed in the preceding section, only exchange sites withlow affinity for K' prevail. This behaviour is illustrated in Table 5 which showsthat most of the added K (82-100 %) not only stayed in the exchangeable formbut also had made some of the native non-exchangeable K to become exchangea-ble. This was presumably a result of replacement of other fixed cations, especiallyNH 4
+, which would otherwise keep the inner interlattice exchange sites in theminor constituent 2:1 clay minerals away from the exchange complex.
Table 5. Fate of K added to some highly leached and strongly weathered soils.
Soil series Great Soil K, cmol kg-'Group Added Exch. Non-exch.
Korat Gray podzolic 0.148 0.141 0.0070.295 0.302 -0.007
Pak Chong Reddish Brown 0.148 0.120 0.028Lateritic 0.295 0.271 0.024
0.444 0.366 0.078Loei Reddish Brown 0.148 0.146 0.002
Lateritic 0.295 0.313 -0.018
Source: Narkviroj (1974); Suwanarit and Chunyanuwat (1984).
5.3. Fixation and release of non-exchangeable K (5 in Fig. 1)
Potassium fixation is defined as the conversion of either soil solution orexchangeable K+ into non-exchangeable forms.
82
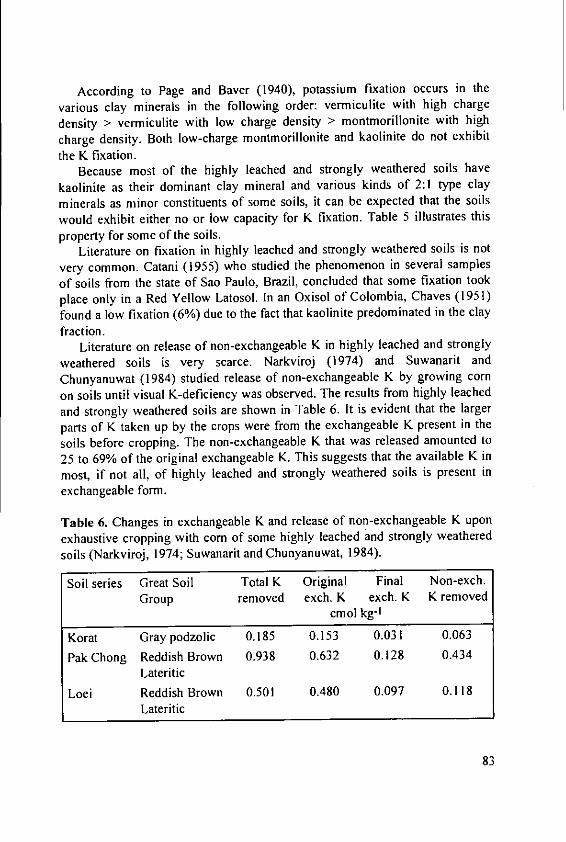
According to Page and Baver (1940), potassium fixation occurs in the
various clay minerals in the following order: vermiculite with high charge
density > vermiculite with low charge density > montmorillonite with high
charge density. Both low-charge montmorillonite and kaolinite do not exhibit
the K fixation.Because most of the highly leached and strongly weathered soils have
kaolinite as their dominant clay mineral and various kinds of 2:1 type clay
minerals as minor constituents of some soils, it can be expected that the soils
would exhibit either no or low capacity for K fixation. Table 5 illustrates this
property for some of the soils.Literature on fixation in highly leached and strongly weathered soils is not
very common. Catani (1955) who studied the phenomenon in several samplesof soils from the state of Sao Paulo, Brazil, concluded that some fixation tookplace only in a Red Yellow Latosol. In an Oxisol of Colombia, Chaves (1951)found a low fixation (6%) due to the fact that kaolinite predominated in the clayfraction.
Literature on release of non-exchangeable K in highly leached and strongly
weathered soils is very scarce. Narkviroj (1974) and Suwanarit and
Chunyanuwat (1984) studied release of non-exchangeable K by growing cornon soils until visual K-deficiency was observed. The results from highly leachedand strongly weathered soils are shown in Table 6. It is evident that the largerparts of K taken up by the crops were from the exchangeable K present in thesoils before cropping. The non-exchangeable K that was released amounted to25 to 69% of the original exchangeable K. This suggests that the available K inmost, if not all, of highly leached and strongly weathered soils is present inexchangeable form.
Table 6. Changes in exchangeable K and release of non-exchangeable K uponexhaustive cropping with corn of some highly leached and strongly weatheredsoils (Narkviroj, 1974; Suwanarit and Chunyanuwat, 1984).
Soil series Great Soil Total K Original Final Non-exch.Group removed exch. K exch. K K removed
cmol kg- I
Korat Gray podzolic 0.185 0.153 0.031 0.063
Pak Chong Reddish Brown 0.938 0.632 0.128 0.434Lateritic
Loei Reddish Brown 0.501 0.480 0.097 0.118Lateritic
83

5.4. Crop removal (6 in Fig. 1)The total quantities of K found within the plants vary with the species,
within species, and with the amounts of dry matter or the yields produced. Theyields and dry matter of different parts of crops, K contents of different parts,and quantities of K in I ton of the yields of several crops are given in Table 7.Corn, cassava, and peanut took up very similar amounts of K (72-82 kg ha-').Sugarcane took up the largest amount of K and kenaf took up the secondlargest. Mungbean took up the smallest amount.
Table 7. The yields, K contents, and quantities of K in I ton of the yields ofseveral crops (adapted from Phetchawee et al., 1985).
Crop Yield, kg ha- I K content, kg ha- I kg K(t of yield)-I
dry weight basisCorn
Grain 3669 18 4.90Stover -* 59
CassavaRoots 31750 47 1.49Stems * 21Leaves 18125 4
SoybeanGrain 1231 16 13.00Stems & leaves -* 30
PeanutKernels 1963 19 6.67Shells 725 4Stems, leaves & roots 2750 56
MungbeanGrains 1025 14 13.65Stems 538 7Leaves 869 5Roots 188 0.56
SugarcaneFresh canes 103356 121 1.17
KenafStems & leaves (dry) 11812 82 6.94Fibers 2738
Yield data not given by the authors.
84

Assuming that only the plant part that is usually removed from the field, i.e.corn grains, cassava roots, soybean grains, peanut kernels, mungbean grains,
sugarcanes, and kenaf stems are taken away from the fields, the total amounts of
K lost from the fields are in the order: sugarcane > kenaf > cassava > peanut
and corn > soybean > mungbean. In term of loss of K through I ton of the
produces the order is: soybean and mungbean > peanut and kenaf > corn >
cassava and sugarcane.
5.5. Leaching (7 in Fig. I)
The main factors responsible for leaching losses are the low ability of soils
to hold K in exchangeable or non-exchangeable forms and the high rainfall in
terms of quantity and intensity. The result of a study by Pushparajah (1979)
showed the influence of intensity of rainfall on leaching losses whereas the
results of a study by Pushparajah and Ismail (1982) shows that leaching losseswere less severe in soil with high-activity clays.
It has been deduced in the previous sections that most of the highly leached
and strongly weathered soils have low CEC's and capacities to fix K, suggesting
low ability of the soils to hold K in exchangeable or non-exchangeable forms.This property of the soils in conjunction with the characteristically-high rainfall,both in terms of intensity and quantity, of the humid tropics will increase the
risk of leaching of K and the other basic cations from these soils more than in
those of other regions.
6. Management of soil and fertilizer potassium
6.1. Assessment of soil K-status
Although soil solution K and exchangeable K are considered the two
available forms, both non-exchangeable and structural K can be made available.The measurement of the K status with the aid of extractants much stronger than
those used to determine the exchangeable form, e.g. NH4OAc, thus often give
reliable information about the soil K-supplying power. For example, Pushparajah
and Ismail (1982) used soil K extracted with 6M HCI as diagnostic criteria for
rubber fertilization in Malaysia. Xie el al. (1982) used boiling HNO 3 to evaluatethe K supplying power of rice soils in the People's Republic of China.
Because a larger proportion of the available K in highly leached and
strongly weathered soils is in the exchangeable form, it might be expected that
using extractants milder than 6M HCI and boiling HNO 3 but which take into
account some of the non-exchangeable K would give more reliable informationabout the K-supplying power than those used to determine exchangeable K or to
provide information involving exchangeable K only.
85

Suwanarit and Narkviroj (1976) compared the critical levels and thethreshold levels of K deficiency symptoms obtained with different chemicalindices, using exhaustive cropping in pots with corn on five different soils from5 soil series. Two of the soils used were highly leached and strongly weathered.The chemical indices studied were K extracted with H-saturated resin,NH 4OAc-exchangeable K, the equilibrium (K+) : (Ca2 + Mg2') activity ratio,and K concentration in the plant. They concluded that K extracted with H-saturated resin was most reliable in reflecting K-status of soils, since this indexgave the narrowest ranges of K for the critical levels and for the threshold levelsof K deficiency symptoms obtained from different soils. Wiwutwongwana andSuwanarit (1979) and Suwanarit and Chunyanuwat (1983) supported thisfinding. They reported that the range of the K extracted with H-saturated resincovering the critical levels and that covering the threshold levels for Kdeficiency symptoms were narrower than those of the NH 4 OAc-exchangeable Kand of K in the plant.
The amounts of K fertilizer required for different crops grown on soils withdifferent levels of K in soils as obtained from experiments in Thailand aresummarized in Table 8. The data show that cotton needs the highest K status ofabout 120 mg kg-' of exchangeable K to produce 90% the maximum yield; riceand corn need 74 mg K kg-'; soybean, cassava, and kenaf need similar levels of45-55 mg K kg-'; and peanut needs 35 mg kg- I of the exchangeable K. Data onexchangeable K of highly leached and strongly weathered soils in Thailanddiscussed in the preceding sections (see also Tables I and 4) suggest that thesoils are so variable in their K-status that some are so poor that they aredeficient in K even when used to grow peanut whereas some are quite high andhave enough K for growing cotton.
6.2. Efficient use of potassium fertilizer
The efficiency of utilization of fertilizer K by crops varies not only with Kstatus of the soils but also with many factors. Some measures which take intoaccount the more important factors are discussed in the following sections.
6.2. I. Liming
Liming can be expected to be beneficial for most highly leached and stronglyweathered soils, since most of them are acidic with many being strongly acidic,as discussed in the preceding section. Results of studies have also shown effectsof liming on the efficiency of K fertilizer. Muzilli (1982), for example, studiedthe response of soybean to levels of KCI in the absence and presence of lime.
86

Table 8. Critical levels of K in soils for different crops from experiments donewith Thai soils.
Crops Critical levels* Soil types+ References/mg K kg-' Sources
Rice 80" ns Suwanwong et al. (1985)74 ns Calculated basing on data of
Suwanwong el al. (1984)and Cholitkul (1967)
Corn 51- 74 Six widely different Suwanarit and207-21 1 types of soils Narkviroj (1975)
121-207 Seven different Wivutvongvana and184-195' + types of soils Suwanarit (1979)
58- 94 Six widely different Suwanarit and117-137' + types of soils Chunyanuwat (1973)
50- 80 Reddish Brown Suwanarit (1985)Lateritic
Soybean 55 Low Humic Gley Ho and Sittibusaya (1984)and Non CalcicBrown Soils
Peanut 35 ns Ho and Sittibusaya (1984)
Cassava 50 ns Ho and Sittibusaya (1984)
Cotton 120 ns Ho and Sittibusaya (1984)
Kenaf 45 ns Ho and Sittibusaya (1984)
NH 4OAc-exchangeable K or otherwise specified, at which 90% of themaximum yield could be obtained; + ns: not specified; ** 0.05 N HCIextractable K; ++ H-saturated resin extractable K.
The soil was of highly leached and strongly weathered type (DystrophicRoux Latosol) and low in K and with 59% Al saturation. The effect of thefertilizer increased with application of limestone. In the absence of liming, thecrop response to K decreased. Leaf analyses showed that the K level in thetissue was increased by liming. Ritchey (1979) dismisses the possibility of lime-induced K fixation in Oxisols and Ultisols of the humid tropics, since the claysresponsible are either absent or present in small proportion.
In soils with low K, liming might however reduce the concentration of theelement in the soil solution to deficient levels (Goedert et al., 1975).
87
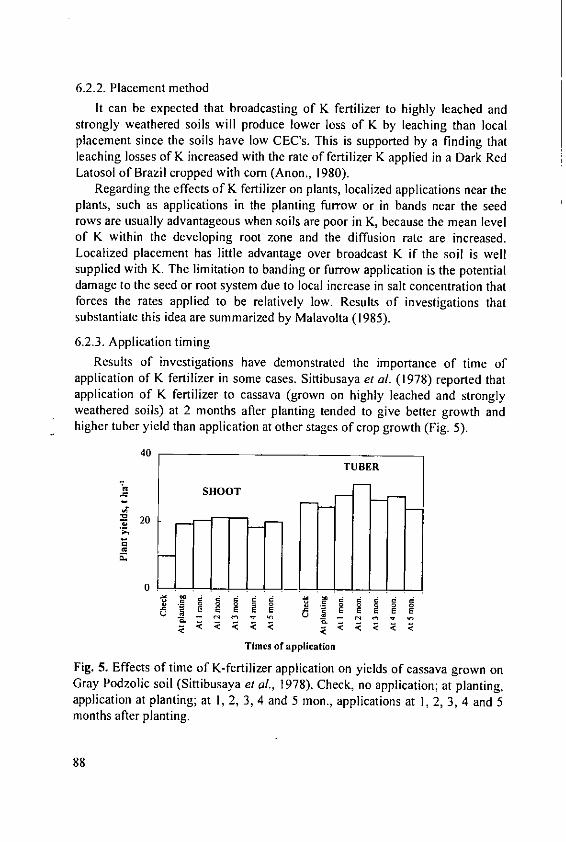
6.2.2. Placement methodIt can be expected that broadcasting of K fertilizer to highly leached and
strongly weathered soils will produce lower loss of K by leaching than localplacement since the soils have low CEC's. This is supported by a finding thatleaching losses of K increased with the rate of fertilizer K applied in a Dark RedLatosol of Brazil cropped with corn (Anon., 1980).
Regarding the effects of K fertilizer on plants, localized applications near theplants, such as applications in the planting furrow or in bands near the seedrows are usually advantageous when soils are poor in K, because the mean levelof K within the developing root zone and the diffusion rate are increased.Localized placement has little advantage over broadcast K if the soil is wellsupplied with K. The limitation to banding or furrow application is the potentialdamage to the seed or root system due to local increase in salt concentration thatforces the rates applied to be relatively low. Results of investigations thatsubstantiate this idea are summarized by Malavolta (1985).
6.2.3. Application timing
Results of investigations have demonstrated the importance of time ofapplication of K fertilizer in some cases. Sittibusaya et al. (1978) reported thatapplication of K fertilizer to cassava (grown on highly leached and stronglyweathered soils) at 2 months after planting tended to give better growth andhigher tuber yield than application at other stages of crop growth (Fig. 5).
40TUBER
SHOOT
M 20
6 aE E a 5 E a E
Times of application
Fig. 5. Effects of time of K-fertilizer application on yields of cassava grown onGray Podzolic soil (Sittibusaya et al., 1978). Check, no application; at planting,application at planting; at 1, 2, 3, 4 and 5 mon., applications at 1, 2, 3, 4 and 5months after planting.
88
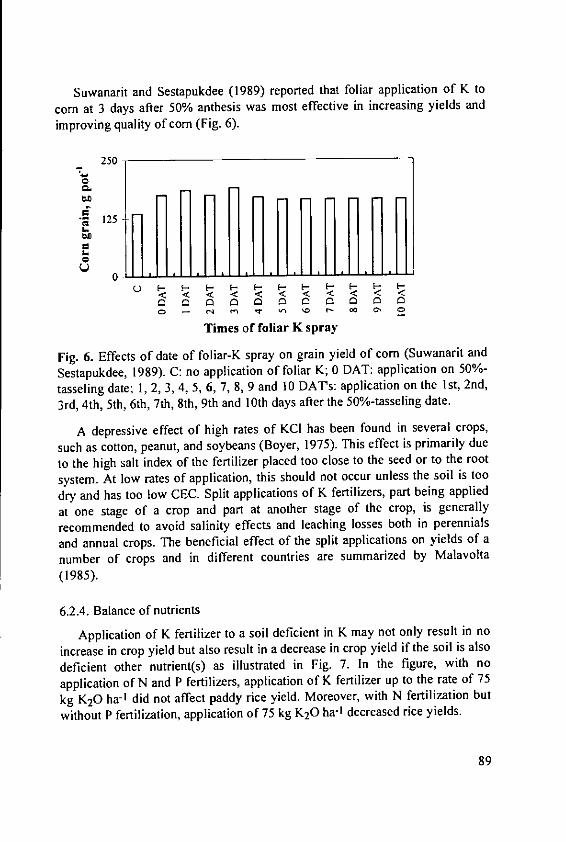
Suwanarit and Sestapukdee (1989) reported that foliar application of K to
corn at 3 days after 50% anthesis was most effective in increasing yields and
improving quality of corn (Fig. 6).
250
125
0Ii
Times of foliar K spray
Fig. 6. Effects of date of foliar-K spray on grain yield of corn (Suwanarit and
Sestapukdee, 1989). C: no application of foliar K; 0 DAT: application on 50%-
tasseling date; 1, 2, 3, 4, 5, 6, 7, 8, 9 and 10 DAT's: application on the I1st, 2nd,
3rd, 4th, 5th, 6th, 7th, 8th, 9th and I10th days after the 50%-tasseling date.
A depressive effect of high rates of KCI has been found in several crops,
such as cotton, peanut, and soybeans (Boyer, 1975). This effect is primarily due
to the high salt index of the fertilizer placed too close to the seed or to the root
system. At low rates of application, this should not occur unless the soil is too
dry and has too low CEC. Split applications of K fertilizers, part being applied
at one stage of a crop and part at another stage of the crop, is generally
recommended to avoid salinity effects and leaching losses both in perennials
and annual crops. The beneficial effect of the split applications on yields of a
number of crops and in different countries are summarized by Malavolta
(1985).
6.2.4. Balance of nutrients
Application of K fertilizer to a soil deficient in K may not only result in no
increase in crop yield but also result in a decrease in crop yield if the soil is also
deficient other nutrient(s) as illustrated in Fig. 7. In the figure, with no
application of N and P fertilizers, application of K fertilizer up to the rate of 75
kg K20 ha -1 did not affect paddy rice yield. Moreover, with N fertilization but
without P fertilization, application of 75 kg K20 ha- l decreased rice yields.
89
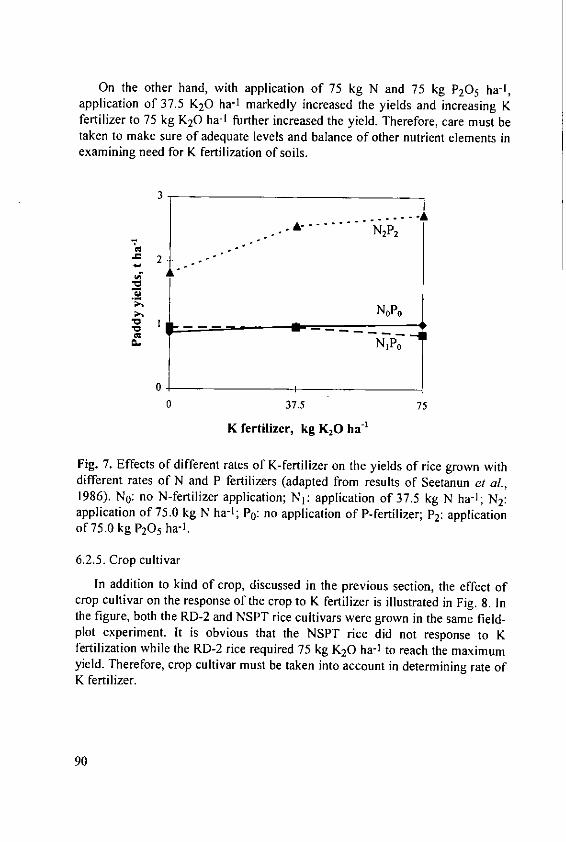
On the other hand, with application of 75 kg N and 75 kg P20 5 ha-1,application of 37.5 K20 ha-1 markedly increased the yields and increasing Kfertilizer to 75 kg K20 ha-1 further increased the yield. Therefore, care must betaken to make sure of adequate levels and balance of other nutrient elements inexamining need for K fertilization of soils.
3
A N2P2
2
N0P0
NIPO1
PC --"
- - -
0 37.5 75
K fertilizer, kg K20 ha'1
Fig. 7. Effects of different rates of K-fertilizer on the yields of rice grown withdifferent rates of N and P fertilizers (adapted from results of Seetanun et al.,1986). N0: no N-fertilizer application; NI: application of 37.5 kg N ha- 1; N2:application of 75.0 kg N ha-1; PO: no application of P-fertilizer; P2: applicationof 75.0 kg P205 ha-1.
6.2.5. Crop cultivar
In addition to kind of crop, discussed in the previous section, the effect ofcrop cultivar on the response of the crop to K fertilizer is illustrated in Fig. 8. Inthe figure, both the RD-2 and NSPT rice cultivars were grown in the same field-plot experiment. it is obvious that the NSPT rice did not response to Kfertilization while the RD-2 rice required 75 kg K20 ha- 1 to reach the maximumyield. Therefore, crop cultivar must be taken into account in determining rate ofK fertilizer.
90
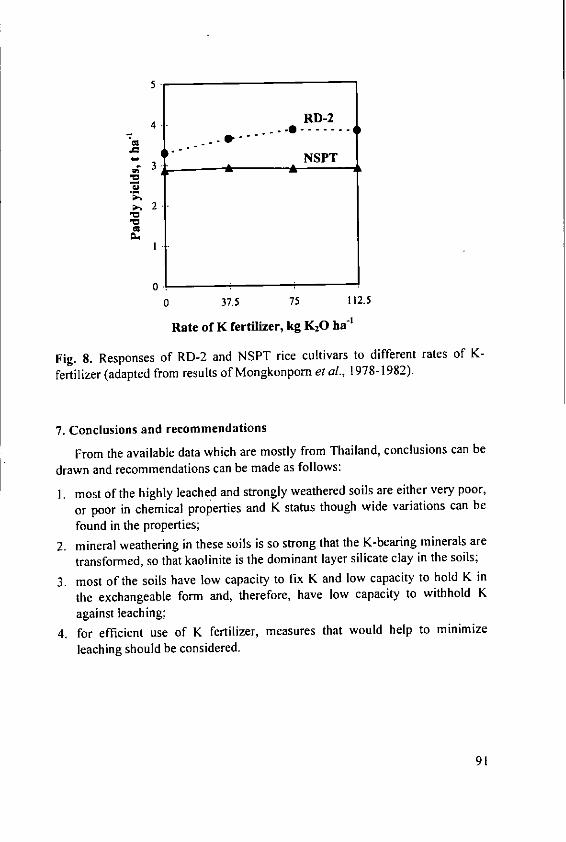
5
RD-2'7~- .-
- 3NSPT
.
0
S2-
0.
0 37.5 75 112.5
Rate of K fertilizer, kg K20 ha 1
Fig. 8. Responses of RD-2 and NSPT rice cultivars to different rates of K-
fertilizer (adapted from results of Mongkonporn et al., 1978-1982).
7. Conclusions and recommendations
From the available data which are mostly from Thailand, conclusions can be
drawn and recommendations can be made as follows:
I. most of the highly leached and strongly weathered soils are either very poor,
or poor in chemical properties and K status though wide variations can be
found in the properties;
2. mineral weathering in these soils is so strong that the K-bearing minerals are
transformed, so that kaolinite is the dominant layer silicate clay in the soils;
3. most of the soils have low capacity to fix K and low capacity to hold K in
the exchangeable form and, therefore, have low capacity to withhold K
against leaching;
4. for efficient use of K fertilizer, measures that would help to minimize
leaching should be considered.
91

References
Anonymous (1971-1977): Detailed Reconnaissance Soil Map of Provinces.Province series no.'s 4-27 and Land Use Maps of Provinces. Department ofLand Development, Ministry of Agriculture and Cooperatives, Kingdom ofThailand.
Anonymous (1980): Agronomic-Economic Research on Soils of the Tropics,1978-1979. Rep. North Carolina State University, Raleigh.
Acquaye, D.K. (1973): Factors determining the potassium supplying power ofsoils in Ghana. In: Potassium in Tropical Crops and Soils. Int. Potash Inst.,Bern, pp. 51-69.
Boyer, J. (1975): El Potasio del suelo. pp. 133-169. In: Suelos de las RegionesTropicales Humedes. Ediciones Marymar, Buenos Aires. Cited by Malavolta(1985).
Catani, R.A. (1955): Estudos do Potassio nos Solos do Estado de Sao Paulo.Piracicaba, Brasil. Cited by Malvolta (1985).
Chaves, R. (1951): Estudio preliminar sobre ]a fijacion de potasio en suelos dela serie 10 (Caldas, Colombia). Bol. Inf. Cent. Nac. Invest. Cafe. 2(22):28-33. Cited by Malvolta (1985).
Cholitkul, W. (1967): Unpublished data cited by Petchawee et al. (1985).Dudual, R. and Moormann, F.R. (1964): Major soils of Southeast Asia. Jour.
Tropical Geography 18: 4-80.Geodert, W.J., Corey, R.B. and Syers, J.K. (1975): The effect of potassium
equilibrium in soils of Rio Grande do Sul, Brazil. Soil Sci. 120:107-111.Ho, C.T. and Sittbusaya, C. (1984): Fertilizer requirements of field crops in
Thailand. Proc. 5th Asian Soil Conf., Bangkok, Thailand, pp. H 1.1-H 1.19.Malavolta, E. (1985): Potassium status of tropical and subtropical region soils.
In: Potassium in Agriculture. Proc. Int. Symp., Amer. Soc. Agron., CropScience Soc. Amer., Soil Sci. Soc. Amer., pp. 163-200.
Mongkonporn, P., Rojanakusone, S., Nammuang, C., Kan-oran, K., lngkapradit,K., Hatrongjit, K., Jinda, M., Paowsong, C. and Na-glang, K. (1978-1982):Determination of suitable rates of phosphorus and potassium for rice. In:Ann. Res. Rep., Rice Div., Dept. Agri., Ministry of Agriculture andCooperatives, Thailand (in Thai).
Muzilli, 0. (1982): Nutricao e adubacao potassica da soja no Brasil. pp. 373-392. In: Yamada et al. (ed.) Potassio na Agricutura Brasileira. Instituto daPotassio e Fosfato (EUA) and Instituto Internacional da ]a Potassa (Suica).Piracicaba, Brasil. Cited by Malavolta (1985).
Narkviroj, P. (1974): Studies on Potassium in Some Soils of Corn and SorghumAreas. M.S. Thesis, Kasetsart University, Bangkok, Thailand. 71p. (in Thai).
92
Ogawa, K, Phetchawee, S. and Suriyapan, 0. (1975): The Study on Fertility of
Upland Soils in Thailand. The report of the joint research work under the
cooperation research work program between Thailand and Japan, Tropical
Agriculture Research Center, Ministry of Agriculture and Forestry, Japan
and Department of Agriculture, Ministry of Agriculture and Cooperatives,Thailand.
Page, J.B. and Baver, L.D. (1940): Ionic size in relation to fixation of cations by
colloidal clay. Soil Sci. Soc. Am. Proc. 4:140-155.
Phetchawee, S., Kanareugsa, C., Sittibusaya, C. and Khunathai, H. (1985):
Potassium availability in soils of Thailand. Preprints of the papers presented
at 9th Colloquium of the International Potash Institute, Bangkok, Thailand,Nov. 25-29, pp. 135-155.
Pushparajah, E. (1979): Leaching losses of potassium in Malaysian soils. Potash
Rev. Subject 4, 66th Suite: 1-4.Pushparajah, E. and Ismail, T. (1982): Potassium in rubber cultivation. pp. 293-
313. In: Pushparajah, E. and Hamid, S.H.A. (ed.) Phosphorus and potassium
in the tropics. Proc. Int. Conf. on Phosphorus and Potassium in the Tropics,
Kuala Lumpur, Malaysia. August, 1981. Malaysian Society of Soil Science,Kuala Lumpur.
Ritchey, K.D. (1979): Potassium fertility in Oxisols and Ultisols of the humid
tropics. Cornell Int. Agric. Bull. 37. Cornell University, Ithaca, NY.
Seetanun, W., Songmuang, P., Hemtanon, B., Tojantuk, S. and Srisaichewa, S.
(1986): Long-term effects of NPK fertilizers on rice yields and soil
properties at Ubon Ratchathani Rice Research Center. In: Ann. Res. Rep. on
Soil and Fertilizer Research Group, Soil Sci. Div., Dept. Agri., Thailand. pp.
181-192 (in Thai).Sittibusaya, C., Nop-amombodee, W.,.Narkviroj, C., Donse, M., Torpone, C.
and Manmoh, M. (1978): Responses to potassium fertilizer of cassava grown
on Yasothon and Korat soils. pp. 374-383. In: 1978 Res. Rep. (no. 1), Soils
and Fertilizers Branch, Field Crop Division, Dept. Agri., Thailand (in Thai).
Suwanarit, A. and Chumyanuwat, P. (1983): Critical and threshold of deficiency
levels of potassium for corn in Chun Tuk, Hin Kong, Manorom, Pak Chong,Tha Muang, and Tha Tako soils as indicated by soil tests and % K in plant.
Thai J. Soils Fertilizers 5:197-205.Suwanarit, A. and Churnyanuwat, P. (1984): Potassium supplying power and
fate of added K in Chum Tuk, Hin Kong,, Manorom, Pak Chong, Tha
Muang and Tha Tako soils for corn. Thai J. Soils Fertilizers 6: 39-57.
Suwanarit, A. and Narkviroj, P. (1976): Potassium supplying power of some
soils of Thailand. 1. Loei, Kamphaeng Saen, Korat, Thap Kwang, and Takhli
soils. Thai J. Agr. Sci. 9: 89-104.
93

Suwanarit, A. and Sestapukdee, M. (1989): Stimulating effects of foliar K-fertilizer applied at the appropriate stage of development of maize: A newway to increase yield and improve quality. Plant and Soil 120:111-124.
Suwanwong, S., Cholitkul, W. and Chantanaparb, N. (1985): Fertility status ofThai paddy soils. Report on Soil Chemistry and Fertility, no. 2. Soil Sci.Division, Dept. of Agriculture, Bangkok, Thailand.
Wivutwongwana, P. and Suwanarit, A. (1979): Critical levels and threshold ofdeficiency symptom levels of K for corn grown on Muak Lek, PhattanaNikom, Chai Badan, Lam Narai, Kamphaeng Saen, Takhli and Lop Burisoils. Thai J. Soils Fertilizers 1:257-267 (in Thai).
Xie, J., Ma, M., Du, C. and Chen, J. (1982): K supplying power and K fertilizerrequirements of the main rice soils of China. Potash Rev., Subject 4, 76thSuite, 1-5.
94

Potassium Dynamics and Availability in Soils ofSubtropical (Humid) Regions of China
Zhihong Cao and Guosong Hu
Institute of Soil Science, Academia Sinica, Nanjing, China 210008
Abstract
The high rainfall and temperature in tropical and subtropical China have
resulted in the strong weathering of soils and leaching of potassium and other
nutrients. So the contents of total K, available K and slowly-available K are
generally very low; in latosols, red soils and lateritic red earths the slowly-
available K is even lower than the available K because the clay minerals are
mainly kaolinite, gibbsite and goethite with less negative charge and low ability
to fix K. Potassium deficiency symptoms can be seen in most crops grown on
these soils with no K application. The high moisture and temperature contribute
to the loss of potassium from soil much more than it does in iemperate zone
soils. The great loss from leaching, removal by harvested crops and limited
return by chemical fertilizer and crop residue cause a very big imbalance in the
potassium status of tropical and subtropical soils. The imbalance becomes more
severe year by year, even though chemical K fertilizer use in China has
increased greatly. More attention should be paid to the recycling of organic
potassium in soil-plant-animal-human system in such a country like China with
very limited K sources.
I. Introduction
The tropical and subtropical wet region in China, including all of Guandong,
Guangxi, Fujian, Taiwan, Hainan, Hunan, Jiangxi, Zhejiang, Hubei, Yunnan,
Guizhou, and the part of Jiangsu, Anhui, Sichuang provinces is about 148
square kilometer, approximately 15.4% of the total area of China. This region is
rich in water with an average rainfall of 1200-1500 mm and the accumulated
temperature greater than 10' C is about 4500-9000' C annually. The main soils
of this region are red soils, latosols, yellow soils, lateritic red earths, paddy soils,
and torrid red earths. This area is now the production base of grain and cash
crops as well as tropical and subtropical fruits. For example, in 1986 the regions
produced grain crops 58.7%, oil rape seed 85.4%, sugarcrops 85.5%, tobacco
58.5% and fruits 36% of the total yield of the country, respectively. So the
tropical and subtropical region plays an absolutely important role in the
agriculture of China (Xiong and Li, 1990).
95
Because of the high temperature and wet conditions during soil-formingprocesses, most K-bearing minerals have been weathered and soil potassium hasbeen leached out from soil profile. Therefore, average total potassium content inthe soils of these regions is only about 1%, half of the average value of earth'scrust which is about 2% (Xiong and Li, 1990). So the potassium supplyingcapacity of the soils is generally poor and potassium deficiency symptoms couldbe seen in many crops in China if no potassium fertilizer is used. Thus most ofchemical potassium fertilizer used in China, both domestic and imported, isapplied in this area.
But it is well known that China is poor in potassium resources and almost90% of potassium fertilizer is imported. In such conditions the efficient use ofpotassium fertilizer as well as K cycling through crop residues is one of the keyfactors for sustainable production. To do this at first we must know thedynamics and equilibrium of potassium in these soils, which is discussed in thispaper.
2. Characterization of potassium fertility in tropical and subtropical soils
Potassium of natural soils originates mainly from the weathering of K-bearing minerals during soil-forming processes. But most potassium in tropicaland subtropical regions has been leached out from the soil profile, becausepotassium is one of the elements leached out first when the strong weatheringprocess occurs. For example, the granite rock of Hainan Island, red sandstone ofGuixi and Jiangxi provinces contain 3.37% and 2.00% potassium, respectively,but soils developed from these two parent materials contain .only 0.79% and0.45% of potassium. The weathering intensity of tropical and subtropical zonesoils in China decreased in the order as follows: latosol > lateritic red earth >red soil > yellow soil > yellow brown earth > yellow cinnamon soil; and so, thepotassium content of these soils increased in the same order. Table I shows thepotassium status of tropical and subtropical regions of China, and contrasts thevalues with those of three soils from north China.
Table I suggests that latosols (except for those developed from granite andmetamorphic rock) and lateritic red earths are soils most short of potassium. It isa matter of fact, that potassium use in China on a large scale was started onthese latosols and the potassium application increased the yield of rice and allkinds of cash crops significantly (SFRICAAS, 1974; Zhu, 1980; Lu, 1980; Tanand Dong, 1981). The potassium supplying capacity of red soil and yellow soilare also within the low to very low category, expecially soils derived from redsandstone. Soils derived from phyllite contain the highest potassium, lakedeposit materials the second, and alluvial sediment the third.
96
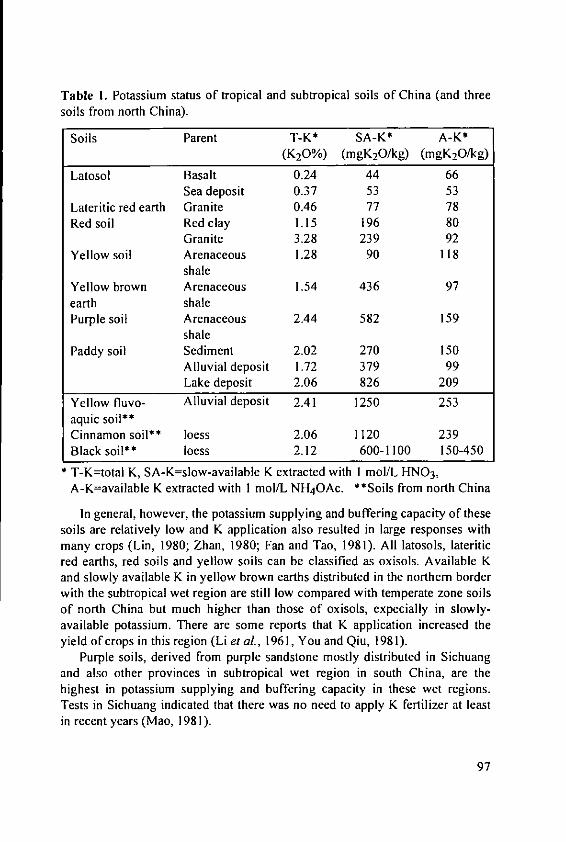
Table 1. Potassium status of tropical and subtropical soils of China (and threesoils from north China).
Soils Parent T-K* SA-K* A-K*(K20%) (mgK20/kg) (mgK 20/kg)
Latosol Basalt 0.24 44 66Sea deposit 0.37 53 53
Lateritic red earth Granite 0.46 77 78Red soil Red clay 1.15 196 80
Granite 3.28 239 92Yellow soil Arenaceous 1.28 90 118
shaleYellow brown Arenaceous 1.54 436 97earth shalePurple soil Arenaceous 2.44 582 159
shalePaddy soil Sediment 2.02 270 150
Alluvial deposit 1.72 379 99Lake deposit 2.06 826 209
Yellow fluvo- Alluvial deposit 2.41 1250 253aquic soil**Cinnamon soil** loess 2.06 1120 239Black soil** loess 2.12 600-1100 150-450
* T-K=total K, SA-K=slow-available K extracted with I mol/L HNO 3,
A-K=available K extracted with I mol/L NH 4OAc. **Soils from north China
In general, however, the potassium supplying and buffering capacity of thesesoils are relatively low and K application also resulted in large responses withmany crops (Lin, 1980; Zhan, 1980; Fan and Tao, 1981). All latosols, lateriticred earths, red soils and yellow soils can be classified as oxisols. Available Kand slowly available K in yellow brown earths distributed in the northern borderwith the subtropical wet region are still low compared with temperate zone soilsof north China but much higher than those of oxisols, expecially in slowly-available potassium. There are some reports that K application increased theyield of crops in this region (Li et aL, 1961, You and Qiu, 1981).
Purple soils, derived from purple sandstone mostly distributed in Sichuangand also other provinces in subtropical wet region in south China, are thehighest in potassium supplying and buffering capacity in these wet regions.Tests in Sichuang indicated that there was no need to apply K fertilizer at leastin recent years (Mao, 1981).
97
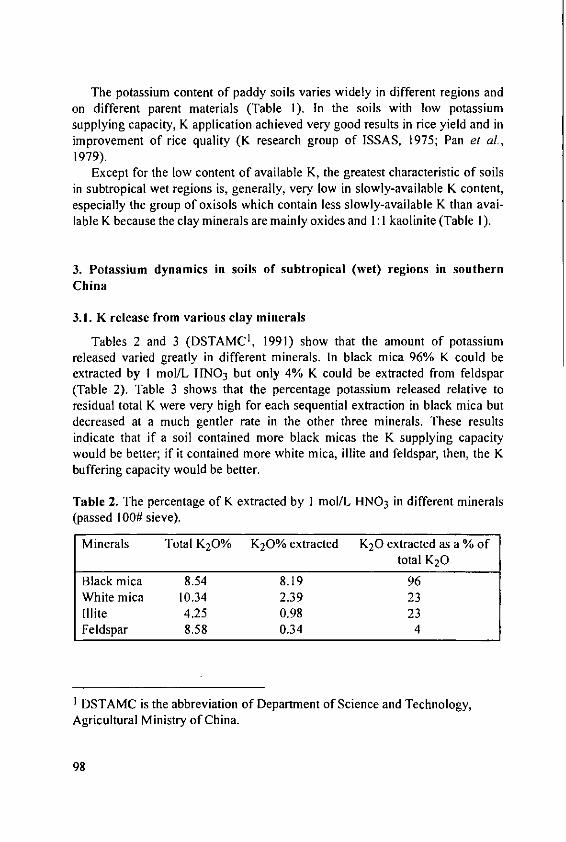
The potassium content of paddy soils varies widely in different regions andon different parent materials (Table 1). In the soils with low potassiumsupplying capacity, K application achieved very good results in rice yield and inimprovement of rice quality (K research group of ISSAS, 1975; Pan et al,1979).
Except for the low content of available K, the greatest characteristic of soilsin subtropical wet regions is, generally, very low in slowly-available K content,especially the group of oxisols which contain less slowly-available K than avai-lable K because the clay minerals are mainly oxides and 1: 1 kaolinite (Table 1).
3. Potassium dynamics in soils of subtropical (wet) regions in southernChina
3.1. K release from various clay minerals
Tables 2 and 3 (DSTAMC 1, 1991) show that the amount of potassiumreleased varied greatly in different minerals. In black mica 96% K could beextracted by I mol/L HNO 3 but only 4% K could be extracted from feldspar(Table 2). Table 3 shows that the percentage potassium released relative toresidual total K were very high for each sequential extraction in black mica butdecreased at a much gentler rate in the other three minerals. These resultsindicate that if a soil contained more black micas the K supplying capacitywould be better; if it contained more white mica, illite and feldspar, then, the Kbuffering capacity would be better.
Table 2. The percentage of K extracted by I mol/L HNO 3 in different minerals(passed 100# sieve).
Minerals Total K20% K20% extracted K20 extracted as a % oftotal K20
Black mica 8.54 8.19 96White mica 10.34 2.39 23HIlite 4.25 0.98 23Feldspar 8.58 0.34 4
DSTAMC is the abbreviation of Department of Science and Technology,
Agricultural Ministry of China.
98

Table 3. K extracted as a % of the residual K in each sequential extraction byI mol/L HNO 3 in different minerals.
I 2 3 4 5 6 7 8 9 10
Black mica 20.5 18.4 17.2 16.5 15.6 15.0 14.5 7.2 4.1 2.3White mica 3.6 2.4 2.0 1.8 1.6 1.6 1.5 1.4 1.3 1.1Illite 1.9 1.8 1.8 1.6 1.6 1.6 1.5 1.4 1.4 1.1Feldspar 1.0 0.7 0.6 0.5 0.4 0.4 0.4 0.4 0.3 0.3
Other studies revealed that if a soil had kaolinite as main clay mineral, thenK release was very slow and only in limited amount. Soils with illite as mainclay mineral released potassium slowly but could go on doing so much longerand the total amount of potassium supplied was greater than that of former soiltype. In soils with high percentage of illite and vermiculite as main clayminerals then potassium was released both rapidly and in greater quantity(Huang et al., 1989). However, the soils in subtropical wet regions mainlycontain 1:1 kaolinite, thus they have a lower K supplying and bufferingcapacity.
3.2. Adsorption and fixation
Potassium in soils is mainly bound by negative charges the main sources ofwhich in subtropical soils are Fe and Al oxides, kaolinite and organic matter. Sothe CEC of these soils are mainly pH dependent and much lower than those ofsoils in north China. The selective adsorption of K by soil results mainly fromthe existing of 2:1 layer silicates such as montmorillonite and illite. Becauseboth the CEC and the content of 2:1 type silicates in these soils are very low, theamount of K adsorbed on soil surfaces is very limited.
Fixation is usually defined as the conversion of K+ in soil solution or
exchangeable sites into non-exchangeable forms, which occurred as free K+enters into the interlayer of 2:1 silicates as reviewed in the paper of Agarwal(1960). Data from Table 4 (Luo and Bao, 1988) indicate that soils in theseregions did fix K but the amount was much less than that of temperate soils, andit was in agreement with other studies (Moss and Coulter, 1984; Acquaye et al,1967; Peng and Fan, 1984). The K fixing capacity of minerals and soilsdecreased in the order as follow: kaolinite < mica < illite < vermiculite andlatosol = lateritic red earth < red soil < loess < yellow brown earth. The amountof K fixed by soils was well correlated with clay content (Luo and Bao, 1988).
99

Table 4. K % fixed in various soils under different K addition l).
K concentration added 40 mg/kg 120 mg/kg 240 mg/kg
Soils Locations Slowly More slowly Slowly More Slowly Moreavailable K available K available K slowly available K slowly
available K available K
Latosol Xuwen, GD 0.5 0.4 0.5 0.5 2.5 2.4Lateritic Huazhou, GD 2.0 0.5 2.5 2.3 2.5 2.3red earth
Red soil Guangzhou 1.0 0.5 0.3 0.5 2.5 2.4Red soil Laibin, GX 2.0 1.5 2.5 1.5 2.5 2.2
Red soil Guangzhe, 1.5 1.0 2.2 1.5 4.1 2.5FJ
Red soil Jinxian, JX 5.5 1.5 2.2 2.5 4.8 4.0Yellow Nanjing 70.5 2.4 72.0 4.4 66.8 6.7brown earth
GD, GX, FJ, JX, and SX represent Guangdong, Guangxi, Fujian, Jiangxi and Shanxi Provinces, respectively.

Due to both the very low K adsorption and fixation capacity of the soils insubtropical wet regions, only small amounts of K should be applied each timeso as to avoid the possibility of leaching losses.
3.3. Leaching
As mentioned above, the tropical and subtropical regions have muchrainfall, and the ability of soils to adsorb or fix K is very limited, so thatleaching of soil K or fertilizer K is a big problem and much research has beenpublished on the leaching of K in both undisturbed ecosystems and croppedland (Mccoll, 1970; Ritchey, 1979; Pushparajah and Ismail, 1982).
Gong el al (1985) studied the leaching of all kinds of elements from alatosol covered by forest with a yearly rainfall of 1250 mm. The results indicatedthat most of K, Ca, Mg and Na have been leached out from the parent materials.Table 5 shows the amounts of K and other elements leached from red soilsderived from different parent materials in various treatments in a field lysimeterduring Sept. I, 1991 to Aug. 31, 1992. The amount leached was the highest inred soil derived from granite on the treatment without cropping. The amountleached dropped in the order of red soil from granite > red soil from Quaternaryred earth > red soil from basalt > red soil from red sandstone. On the whole, theamount of potassium leached declined with cropping, but cropping increasedthe leaching in red soil from Quaternary red earth (Shen, 1993).
Table 5. Leaching of some nutrient from red soils developed from differentparent materials with or without planting.
Parent materials Treatments K Ca Mg NO3
Red sandstone No crop 546 1534 270 2224With crop 454 1030 147 1101
Quaternary red earth No crop 966 1217 245 2142With crop 1358 4921 506 1981
Basalt No crop 878 1646 355 518With crop 310 938 199 340
Granite No crop 1083 3033 558 2134With crop 807 2391 400 295
Figures I and 2 are the accumulated amount of K leached from two red soilswith various parent materials, red sandstone and Quaternary red earth, underdifferent treatments in a column test. The multiple treatment was the mixture ofCaCO 3+Urea+KCI.
101
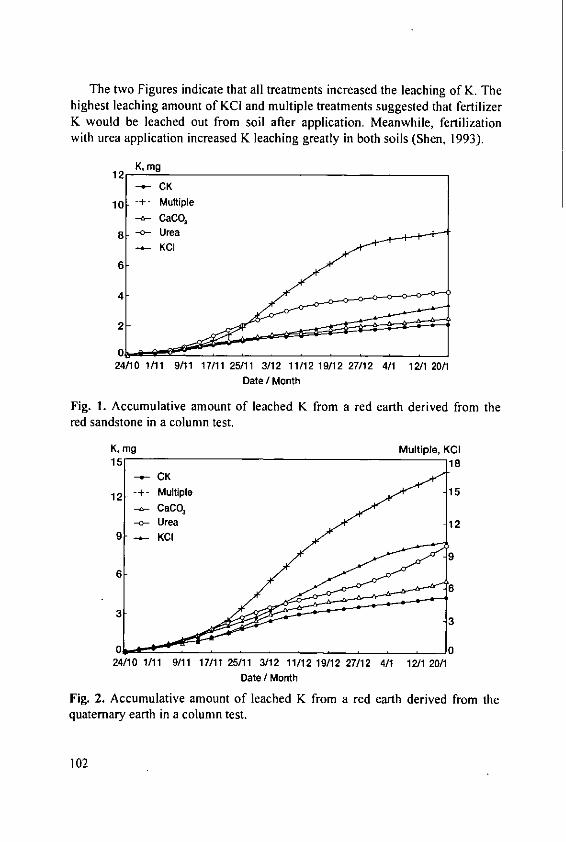
The two Figures indicate that all treatments increased the leaching of K. Thehighest leaching amount of KCI and multiple treatments suggested that fertilizerK would be leached out from soil after application. Meanwhile, fertilizationwith urea application increased K leaching greatly in both soils (Shen, 1993).
K, mg12CK
10 - Multiple-- CaCO
8 o Ureau.-KCI
6
2-
24/10 1/11 9/11 17/11 25/11 3/12 11112 19/12 27/12 4/1 1211 20/1Date / Month
Fig. 1. Accumulative amount of leached K from a red earth derived from thered sandstone in a column test.
K, mg Multiple, KCI15 18
CK
12- - Multiple 15
CaCO,--- Urea 12
9 -- KCI
6.6
3 .
0 024/10 1/11 9/11 17/11 25/11 3/12 11/12 19/12 27/12 4/1 12/1 20/1
Date / Month
Fig. 2. Accumulative amount of leached K from a red earth derived from thequaternary earth in a column test.
102
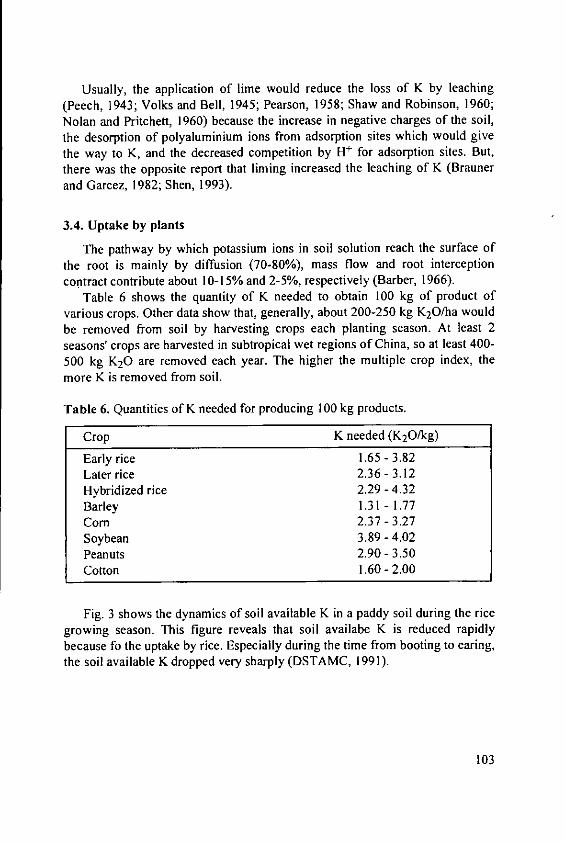
Usually, the application of lime would reduce the loss of K by leaching(Peech, 1943; Volks and Bell, 1945; Pearson, 1958; Shaw and Robinson, 1960;Nolan and Pritchett, 1960) because the increase in negative charges of the soil,the desorption of polyaluminium ions from adsorption sites which would givethe way to K, and the decreased competition by H+ for adsorption sites. But,there was the opposite report that liming increased the leaching of K (Braunerand Garcez, 1982; Shen, 1993).
3.4. Uptake by plants
The pathway by which potassium ions in soil solution reach the surface of
the root is mainly by diffusion (70-80%), mass flow and root interceptioncontract contribute about 10-15% and 2-5%, respectively (Barber, 1966).
Table 6 shows the quantity of K needed to obtain 100 kg of product ofvarious crops. Other data show that, generally, about 200-250 kg K20/ha wouldbe removed from soil by harvesting crops each planting season. At least 2seasons' crops are harvested in subtropical wet regions of China, so at least 400-500 kg K20 are removed each year. The higher the multiple crop index, themore K is removed from soil.
Table 6. Quantities of K needed for producing 100 kg products.
Crop K needed (K20/kg)
Early rice 1.65-3.82Later rice 2.36-3.12Hybridized rice 2.29-4.32Barley 1.31 - 1.77
Corn 2.37-3.27Soybean 3.89-4.02Peanuts 2.90- 3.50Cotton 1.60-2.00
Fig. 3 shows the dynamics of soil available K in a paddy soil during the ricegrowing season. This figure reveals that soil availabe K is reduced rapidlybecause fo the uptake by rice. Especially during the time from booting to earing,the soil available K dropped very sharply (DSTAMC, 1991).
103

2 0 0 -A N K y :A: NPK, 3yea,
B: NP. 3 yearsC: NPK, 10 years
E 15(0 D: NP, 10 years
oo
40
140
2015 rate 30/6 2W 1W / 2M 2W8/10
Gate/Month
Fig. 3. The dynamics of soil available K in one rice-planting season (Paddy soilderived from reddish soil, 1984).
4. K cycling and balance in soil-crop systems
Potassium nutrition of plants is controlled by the equilibrium among manysoil components, fertilization and plant absorption, as shown in Fig. 4 (Cao etal, 1993).
Grass und ScSpray
Solution K t Exchanigeable K0ILeaching Structural K FixedJ K
Weatherig
Fig. 4. Interrelationships of potassium in soil-rice system.
104
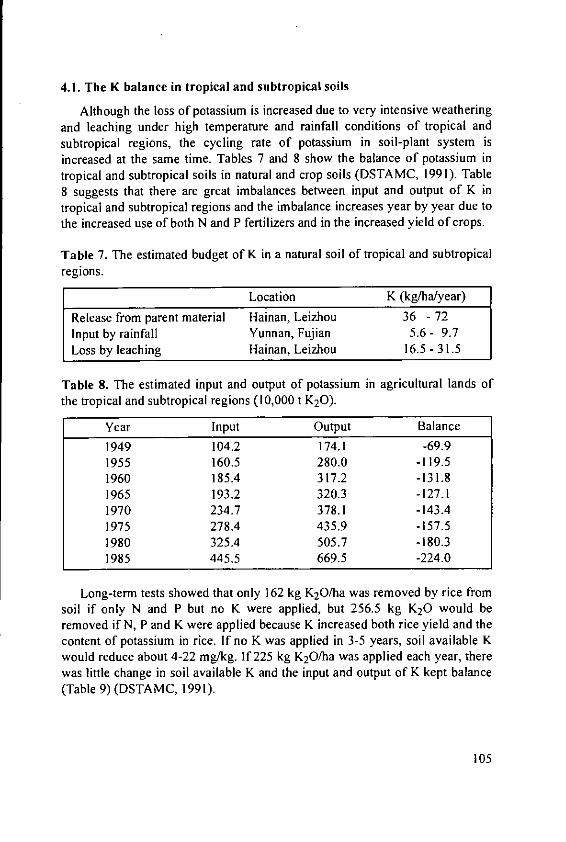
4.!. The K balance in tropical and subtropical soils
Although the loss of potassium is increased due to very intensive weatheringand leaching under high temperature and rainfall conditions of tropical andsubtropical regions, the cycling rate of potassium in soil-plant system isincreased at the same time. Tables 7 and 8 show the balance of potassium intropical and subtropical soils in natural and crop soils (DSTAMC, 1991). Table8 suggests that there are great imbalances between input and output of K intropical and subtropical regions and the imbalance increases year by year due tothe increased use of both N and P fertilizers and in the increased yield of crops.
Table 7. The estimated budget of K in a natural soil of tropical and subtropicalregions.
Location K (kg/ha/year)
Release from parent material Hainan, Leizhou 36 - 72Input by rainfall Yunnan, Fujian 5.6- 9.7Loss by leaching Hainan, Leizhou 16.5- 31.5
Table 8. The estimated input and output of potassium in agricultural lands ofthe tropical and subtropical regions (10,000 t K20).
Year Input Output Balance
1949 104.2 174. 1 -69.91955 160.5 280.0 -119.51960 185.4 317.2 -131.81965 193.2 320.3 -127.11970 234.7 378.1 -143.41975 278.4 435.9 -157.51980 325.4 505.7 -180.31985 445.5 669.5 -224.0
Long-term tests showed that only 162 kg K20/ha was removed by rice fromsoil if only N and P but no K were applied, but 256.5 kg K20 would beremoved if N, P and K were applied because K increased both rice yield and thecontent of potassium in rice. If no K was applied in 3-5 years, soil available Kwould reduce about 4-22 mg/kg. If 225 kg K2 0/ha was applied each year, therewas little change in soil available K and the input and output of K kept balance(Table 9) (DSTAMC, 199 1).
l05

Table 9. The total K balance and changes of soil available K in 5 years in an experiment with rice.0\
Location Years K applied Removed by Balance A-K (mg/kg)crop
(K20 kg/ha) (K20 kg/ha) (K20 kg/ha) BT* AT*
Xinnin, GD 5 0 1216.5 -1216.5 74 52 -211500 1482 18 74 ±0
Zhongshan, GD 5 0 1033.5 -1033.5 65 59 -61500 1120.5 529.5 77 +12
Huilai, GD 5 0 697.5 -697.5 48 28 -201500 1234.5 265.5 49 +1
Huiyang, GD 5 0 531 -531 31 21 -101500 1173 177 45 +14
Liangtang, JX 5 0 576 -576 35 25 -101500 1260 -540 40 +5
Dongxiang, JX 5 0 684 -534 45 33 -121500 207 -120 65 +20
Wangcheng, JS 5 0 369 -360 74 70 -41500 820.5 -79.5 113 +39
BT: Before treatment; AT: After treatment.
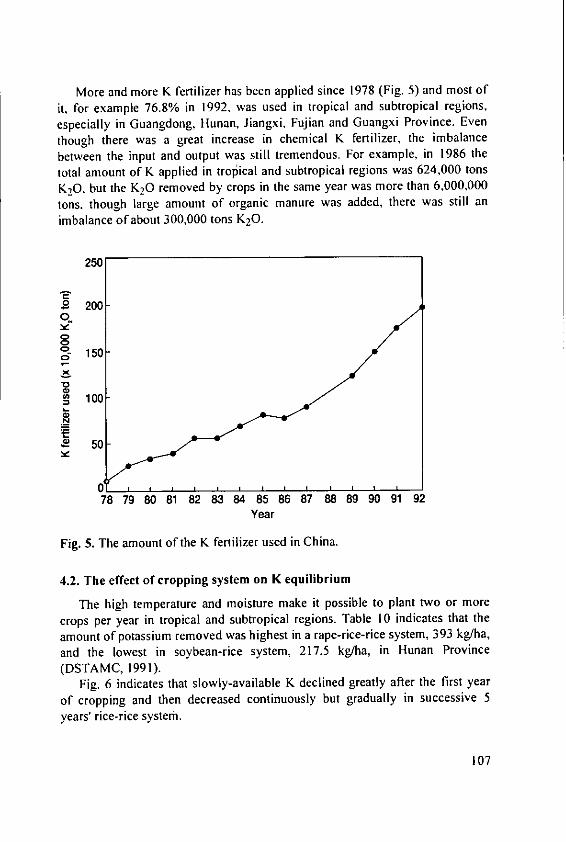
More and more K fertilizer has been applied since 1978 (Fig. 5) and most ofit, for example 76.8% in 1992, was used in tropical and subtropical regions,especially in Guangdong, Hunan, Jiangxi, Fujian and Guangxi Province. Eventhough there was a great increase in chemical K fertilizer, the imbalancebetween the input and output was still tremendous. For example, in 1986 the
total amount of K applied in tropical and subtropical regions was 624,000 tons
K2 0. but the K20 removed by crops in the same year was more than 6,000,000tons, though large amount of organic manure was added, there was still animbalance of about 300,000 tons K 20.
250
S 200
0
- 150
"0S100
50
78 79 80 81 82 83 84 85 86 87 88 89 90 91 92Year
Fig. 5. The amount of the K fertilizer used in China.
4.2. The effect of cropping system on K equilibrium
The high temperature and moisture make it possible to plant two or morecrops per year in tropical and subtropical regions. Table 10 indicates that theamount of potassium removed was highest in a rape-rice-rice system, 393 kg/ha,and the lowest in soybean-rice system, 217.5 kg/ha, in Hunan Province(DSTAMC, 1991).
Fig. 6 indicates that slowly-available K declined greatly after the first year
of cropping and then decreased continuously but gradually in successive 5years' rice-rice systerm.
107

Table 10. The amount of K removed in different cropping systems.
Cropping system Nutrients removed (kg/ha/year)N P205 K20
Soybean-rice 288 97.5 217.5Soybean + corn-rice 325.5 97.5 256.5Green manure-rice-rice 324 96 292.5Rape-rice-rice 343.5 108 393
11
0
09
8-
7- NPK
NPBE L E L E L EL E L
1982 1983 1984 1985 1986
Fig. 6. The dynamics of soil slowly-available K in a five years rice-rice plantingsystem (B, E and L represent background soil, early rice and late rice,respectively).
5. Management of potassium in subtropical regions
To reduce the imbalance of K in tropical and subtropical (wet) regions, it isnecessary to improve management of soil K cycling processes. There are mainlytwo ways to do so, the maximum use of crop residues and increase input ofchemical K. The first way includes the return of crop residues, the use of dung,the planting of high K efficient green manure, and the use of gentic engineeringtechniques to create new high K efficient plant etc.
5.2. Return of crop residues
The straw and stalk of all kinds of crops contain much potassium and somuch potassium will be removed by them from soil if they are not returned.Table I I lists the amount of potassium removed by different crop residues.
108
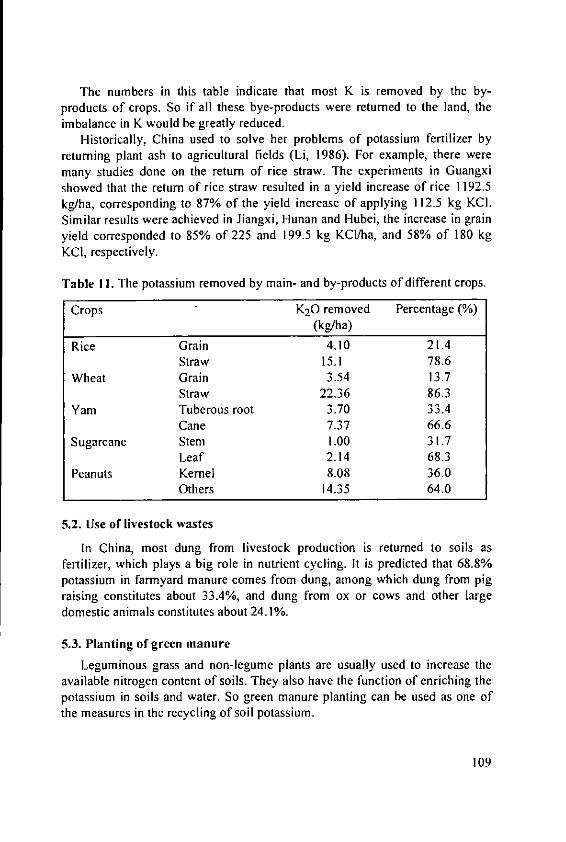
The numbers in this table indicate that most K is removed by the by-products of crops. So if all these bye-products were returned to the land, theimbalance in K would be greatly reduced.
Historically, China used to solve her problems of potassium fertilizer byreturning plant ash to agricultural fields (Li, 1986). For example, there weremany studies done on the return of rice straw. The experiments in Guangxishowed that the return of rice straw resulted in a yield increase of rice 1192.5kg/ha, corresponding to 87% of the yield increase of applying 112.5 kg KCI.Similar results were achieved in Jiangxi, Hunan and Hubei, the increase in grainyield corresponded to 85% of 225 and 199.5 kg KCI/ha, and 58% of 180 kgKCI, respectively.
Table II. The potassium removed by main- and by-products of different crops.
Crops K20 removed Percentage (%)(kg/ha)
Rice Grain 4.10 21.4Straw 15.1 78.6
Wheat Grain 3.54 13.7Straw 22.36 86.3
Yam Tuberous root 3.70 33.4Cane 7.37 66.6
Sugarcane Stem 1.00 31.7Leaf 2.14 68.3
Peanuts Kernel 8.08 36.0Others 14.35 64.0
5.2. Use of livestock wastes
In China, most dung from livestock production is returned to soils asfertilizer, which plays a big role in nutrient cycling. It is predicted that 68.8%potassium in farmyard manure comes from dung, among which dung from pigraising constitutes about 33.4%, and dung from ox or cows and other largedomestic animals constitutes about 24.1%.
5.3. Planting of green manure
Leguminous grass and non-legume plants are usually used to increase theavailable nitrogen content of soils. They also have the function of enriching thepotassium in soils and water. So green manure planting can be used as one ofthe measures in the recycling of soil potassium.
109
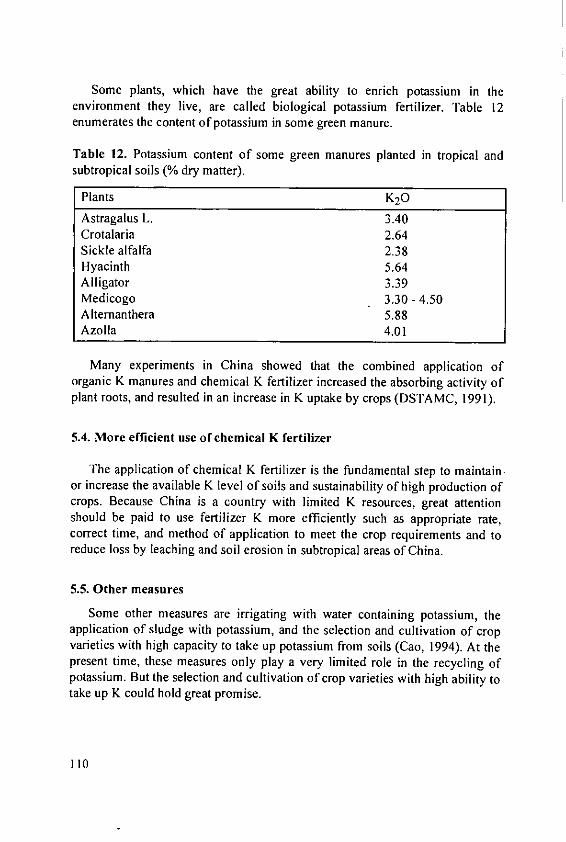
Some plants, which have the great ability to enrich potassium in theenvironment they live, are called biological potassium fertilizer. Table 12enumerates the content of potassium in some green manure.
Table 12. Potassium content of some green manures planted in tropical andsubtropical soils (% dry matter).
Plants K20
Astragalus L. 3.40Crotalaria 2.64Sickle alfalfa 2.38Hyacinth 5.64Alligator 3.39Medicogo 3.30- 4.50Alternanthera 5.88Azolla 4.01
Many experiments in China showed that the combined application oforganic K manures and chemical K fertilizer increased the absorbing activity ofplant roots, and resulted in an increase in K uptake by crops (DSTAMC, 1991).
5.4. More efficient use of chemical K fertilizer
The application of chemical K fertilizer is the fundamental step to maintainor increase the available K level of soils and sustainability of high production ofcrops. Because China is a country with limited K resources, great attentionshould be paid to use fertilizer K more efficiently such as appropriate rate,correct time, and method of application to meet the crop requirements and toreduce loss by leaching and soil erosion in subtropical areas of China.
5.5. Other measures
Some other measures are irrigating with water containing potassium, theapplication of sludge with potassium, and the selection and cultivation of cropvarieties with high capacity to take up potassium from soils (Cao, 1994). At thepresent time, these measures only play a very limited role in the recycling ofpotassium. But the selection and cultivation of crop varieties with high ability totake up K could hold great promise.
110

References
Acquaye, D.K., Mclean, A.J. and Ricem H.M. (1967): Potential and capacity of
potassium in some representative soils of Ghana. Soil Sci. 103: 79-89.
Agarwal, R.R. (1960): Potassium fixation in soils. Soils Fert. 23: 375-378.
Barber, S.A. (1966): The role of root interception, mass flow and diffusion in
regulating the uptake of ions by plants from soil. Tech. Rep. Ser. l.A.E.A.
65: 30-45.Brauner, J.L. and Garcez, J.R.B. (1982): Lixiviacao de potassio, calcio e
magnesio em solos do Rio Grande do sul submetidos a calagem, analisada
em condicoes de laboratorio. Rev. Bras. Ci. Solo 6:89-93.
Cao, Z.H., Hu, G.S. et al. (1993): Regulation and control of potassium and
microelements behaviour in soil and their relations to the quality of tobacco.
Soils. 25: 119-122.DSTAMC (1991): Potassium in the Agriculture of South China. Agriculture
Press, Beijing, pp 328.Fan, Y.C. and Tao, Q.X (1981): The efficiency of potassium in increasing rice
yield. Science and Technology of Jiangxi Agriculture. No. 4, 6-9.
Feigenbaum, S. and Shainberg, 1. (1975): Dissolution of illite possible. A
mechanism of potassium release. Soil Sci. Soc. Am. Proc. 39: 985-990.
Gong, Z.T. el al. (1985): The forestry soil and its biological geochemical
characteristics nearby Nannin. in: Z.T. Gong (ed.) The Advance and
Application of Soil Geochemistry. Science Press, Beijing.
Huang, C.Y. et al. (1989): Study on the potassium supplying power of the hilly
upland soils in Zhejiang Province. Acta Pedologica Sinica 26: 57-63.
Li, Q.K. et al. (1961): The potassium content, status and transforming of K-
minerals in the soils of red soil region. Acta Pedologica Sinica 9 (1-2).
Li, Q.K. (1986): Fertilizer Application, Food Production and Changes in Soil
Fertility through 30 Year's Land Utilization in South China - Proceedings of
the International Symposium on Red Soils. Science Press, Beijing, China. pp
560-569.Lin, H. (1980): The function of potassium in increasing yield of crops. Science
and Technology of Fujian Agriculture No. 5, 14-17.
Lu, S.N. (1980): The potassium supplying ability of soils in Guangxi province
and the application of potassium fertilizer. Soils No. 2, 50-52.
Luo, JX. and Bao, M.F. (1988): Potassium fixation by several minerals and
soils. Acta Pedologica Sinica 25: 378-385.
Mao, Z.Y. (1981): The preliminary discussion about the development of
fertilizer in Sichuang Provinces. Science and Technology of Southwest
Agricultural University No. 1, 36-41.
III

Mccoll, J.G. (1970): Properties of some natural waters in tropical wet forest ofCosta Rica. BioScience 20: 1096-1100.
Moss, P. and Coulter, K.J. (1984): The potassium status of West India volcanicsoil. J. Soil Sci. 15: 284-298.
Nolan, C.W. and Pritchett, W.C. (1960): Certain factors affecting the leachingof potassium from dandy soil. Proc. Soil Crop Fla. 20: 139-145.
Pan, Z.P. et aL (1979): The summary of efficiency tests of P and K fertilizers.Soils No. 2, 65-71.
Pedro, G. (1973): La Pddogdnese sous les tropiques humides et ]a dynamique dupotassium. In: Potassium in tropical crops and soil. Proc. Colloq. Int. PotashInst. 10: 23-49.
Peech, M. (1943): Availability of ions in light sandy soils as affected by soilreaction. Soil Sci. 55: 37-48.
Peng, Q.T. and Fan, Q.Z. (1984): Preliminary study on influence of moistureand temperature on release of potassium and fixation of potassium in soils.Acta Pedologica Sinica 21: 394-399.
Pearson, R.W. (1958): Liming and fertilizer efficiency. Agron. J. 50: 356-362.Potassium Research Group of ISSAS (1975): Study on the efficiency of
potassium fertilizer in different soils of Jiangsu province. Soils No. 3.Pushparajah, E. and Ismail, T. (1982): Potassium in rubber cultivation. pp. 293-
313. In: E. Pushparajah and S.H.A. Hamid (ed.) Phosphorus and Potassiumin the Tropics. Proc. Int. Conf. on Phosphorus and Potassium in the Tropics,Kuala Lumpur, Malaysia. August 1981. Malaysian Society of Soil Science,Kuala Lumpur.
Ritchey, K.D. (1979): Potassium fertility in oxisols and ultisols of the humidtropics. Corell Int. Agri. Bull. 37. Cornell University, Ithaca, N.Y.
Shen, R.F. (1993): Leaching of fertilizer ions in red soils - Laboratory soilcolumn and field lysimeter studies. Ph. D. Thesis, Institute of Soil Science,Academia Sinica.
SFRICAAS (1974): The efficiency of potassium fertilizer. Soil and FertilizerNo. I.
Shaw, W.M. and Robinson, B. (1960): Reaction efficiency of liming materialsas indicated by lysimeter leachate composition. Soil Sci. 89: 209-218.
Sparks, D.L. and Leibhardt, L.C. (1982): Temperature effect on potassiumexchange and selectivity in Delaware soils. Soil Sci. 133: 10-17.
Tan, H.Z. and Dong, Q.H. (1981): The efficiency of K fertilizer and its efficientapplication. The Science of Guangxi Agriculture No. 4, 29-34.
Volk, G.M. and Bell, D.E. (1945): Some major factors in leaching of calcium,potassium, sulfur and nitrogen from sandy soils. A. Lysimeter study. FloridaAgric. Exp. Stn. Bull. 416.
112

Ziong, Y. and Li, Q.K. (1990): The Soils of China (2nd Edition). Science Press.Beijing.
You, D.M. and Qiu, J.Z. (1981): The dynamics of P and K fertilizer efficiencyin long-term tests of three main nutrients. The Science of Jiangsu
Agriculture No. 6, 39-45.Zhan, C.G- (1980): The relationship between K efficiency and application
conditions. The Sience of Zhejiang Agriculture No. 4, 155-160.
Zhu, W.H. (1980): The study on the potassium statue and efficiency of
potassium fertilizer in the main soils of Guangdong Province. The Science
of Guangdong Agriculture No. 4, 27-34.
113
Characterization of K Availability in Paddy Soils -Present Status and Future Requirements
G.S. Sekhon
Department of Soils, Punjab Agricultural University, Ludhiana, Punjab, India
Abstract
Soil potassium exists in solution, exchangeable and non-exchangeable forms.Equilibrium reactions between these phases of K influence the chemistry of soilK. In paddy soils, submergence increases its conductance and ionic strength andsuch soils are characterized by high percentage of so-called available Kcompared with upland soils, especially in the cultivated layer. However, thesignificance of the availability of K to paddy has not been adequately examined.
Exchangeable + water soluble K, usually extracted with IN NH 4OAc, ismost widely used to estimate plant available K. It appears preferable to includea measure of non-exchangeable K in an estimate of available K. Alternatively,taxonomic units may be examined for non-exchangeable K and estimates ofexchangeable + water soluble K in individual samples can be interpretedaccordingly. The electro-ultrafiltration technique is able to obtain an estimate ofboth the exchangeable and non-exchangeable K.
In parts of developing world where satisfactory soil testing is unlikely to bewidely available, use of fertility evaluation on the basis of taxonomic unitswould be most advantageous. More background information for interpretingsoil tests appears necessary.
i. Potassium in soils
Soil potassium often is considered to exist in solution, exchangeable, and
non-exchangeable (fixed and structural K) forms. The amount of solution andexchangeable K is usually a small proportion of total K; the bulk of soil K existsin K-bearing micas and feldspars.
A major proportion of soil K moves to the roots from the soil solutionthrough diffusion and mass flow. However, the crop requirement for K is oftenmuch larger than the soil solution K at any point of time. Thus, continuousrenewal of K in the soil solution for adequate nourishment of plants during cropgrowth is obvious.
115

Similarly, the exchangeable K component has to be continuouslyreplenished through the release of fixed K and the weathering of K reservessuch as micas and feldspars. Hence, K availability to crops is a function of theamounts of different forms of K in soil, their rates of replenishment and thedegree of leaching.
Equilibrium reactions occurring between solution, exchangeable, non-exchangeable, and mineral phases of K have a profound influence on thechemistry of soil K. The direction and rate of these reactions determines the fateof applied K and release of non-exchangeable K. A schematic diagram relatingthe four forms of soil K is depicted as under:
.K in plantsMineral K . Non-exchangeable _ Exchangeable - Solution K
K K K -\ K down the profile
Considering the ease or difficulty with which plants can use different formsof soil K, the distinctions tend to fade and the adjacent forms tend to overlap.Thus, Wicklander (1954) considers K in the soil solution as a form which is inequilibrium with but difficult to distinguish from exchangeable K, defined asthe fraction that occupies sites in the soil colloidal complex.
Similarly, fixed K is K which occupies internal positions within clay sheetsas well as hexagonal cavities in minerals, such as illites. Black (1968) states thatin most experimental work, soil solution K is not measured independently but isincluded with exchangeable K. The two fractions are extracted simultaneouslyby the salt solutions used to remove exchangeable K for analysis and this is onereason for the common practice. Also, soil solution and exchangeable K areconsidered directly available to plants. Non-exchangeable K which, accordingto Boyer (1982), is partially available to plants, can be split into two fractions:(i) difficultly exchangeable, extracted by cold dilute mineral acids (H2SO4, HCI,HNO 3) and (ii) fixed, extracted by cold concentrated strong mineral acids (6Ml-2 SO4 or HCI). Malavolta (1985) also has classified non-exchangeable K into 2categories, (i) available and (ii) unavailable. The K content of mineral soilsranges from 0.4 to 29 g kg-1 (Jackson, 1969). Potassium minerals vary inparticle size, in individual properties and in degree of weathering. The availabilityof K to plants is related in many ways to their structure and morphology. Inmicas, differences in K-O bond lengths, caused by variable tetrahedral rotationand in the degree of tilting of tetrahedra along rows producing corrugationswould influence orientation of the OH- groups, leading to divergencies in K-stability in the structure. The particles of smaller diameter generally release K ata slower rate than coarser particles.
116
Crystal imperfections such as openings in the basal structures cause themicaceous layers to form scrolls. Properties of K-feldspar crystals whichinfluence the rate of their weathering are: composition such as the inclusion ofNa in the structure, crystal and particle size and the nature of twining andcrystallization of several minerals within a particle (Rich, 1972). Micas appearmore important than K-feldspars in crop nutrition, owing to more rapidweathering. However, due to much larger amount of K-feldspars, and thevariations in the weathering rate of feldspars and micas, feldspars can be ofsignificance in the K nutrition of plants.
Bertsch and Thomas (1985) and Malavolta (1985) have discussed the Kstatus of temperate region and tropical and subtropical region soils respectively.Suwanarit (1995) and Zhihong (1995) have described K dynamics andavailability in soils of humid tropics and subtropics respectively. Yu Tian-ren(1985) states that in comparison with other soils, the proportions of K+ andNH4 + in the total ions are larger in paddy soils.
The bulk of rice production is centred in wet tropical climates. However, thecrop flourishes in the humid regions of the subtropics and in temperate climates.The paddy soils of east Asia (China, Taiwan, Korea and Japan), South Asia(India, Pakistan, Nepal, Bangladesh and Sri Lanka), and South East Asia(Indonesia, Thailand, Vietnam, Burma, Philippines, Malaysia, Kampuchea andLaos) account for approximately 80% of world's annual rice production. Thepaddy soils of Brazil and other countries of Latin America contribute approx.3.7%. The paddy soils of USA, USSR and Europe account for approx. 2.5% ofthe world production; nearly the same amount is contributed by paddy soils ofNorth Africa and West Asia, and of Sub-Saharan Africa (DeDatta, 1981).
Moormann (1978) has discussed the morphology and classification of soilson which rice is grown. Although rice is grown on all soil orders, the moreimportant are Inceptisols, Alfisols and Ultisols. The suborders of majorimportance among Inceptisols are Aquepts (Sulfaquepts, Tropaquepts,Haplaquepts), Ochrepts (Ustochrepts, Eutrochrepts, Dystrochrepts) andTropepts (Ustropepts, Dystropepts). The suborders of greater importance amongAlfisols are Aqualfs (Ochraqualfs, Tropaqualfs) and Ustalfs (Paleaustalfs,Haplustalfs, Rhodustalfs, Natrustalfs). The more important suborders amongUltisols are Aquults (Ochraquults, Tropaquults) and Udults (Paleudults,Rhoduldults, Tropudults, Hapludults). The Inceptisols, Alfisols and Ultisolsdiffer from each other, in the intensity of leaching besides other attributes.While Inceptisols are weakly leached, Alfisols are moderately depleted of bases,and Ultisols are intensively leached. Accordingly, in the Inceptisols, theelectrical conductivity in the cultivated layer is rather high, while in the Ultisols,the conductivity is low.
117
Zhang Xiao-Nian (1985) described differences in the composition ofexchangeable bases in different paddy soils. Thus, in soils derived from granitematerials, exchangeable potassium was 10-20% of the exchangeable bases whilein soils derived from quaternary red clay and laterite, this figure was 3-8% and4-5% respectively. At the Potash Research Institute of India, one hundredcomposite surface (0-15 cm) soil samples were collected from each of the 29soil series known to occur widely in intensively cultivated areas in differentstates of India. Amounts of different forms of K in soils were estimated fromanalyses of these samples. An extract of this information, provided by Sekhon etal. (1992), pertaining to rice-growing soils is given in Table I.
2. Chemistry of paddy soils
Paddy soils differ from other soils in their management. Ponnamperuma(1972) has described paddy soils as those that are managed in a special way forthe wet cultivation of rice. The management practices include: (a) levelling ofthe land and construction of levees to impound water; (b) puddling (plowingand harrowing the water-saturated soils); (c) maintenance of 5-10 cm ofstanding water during the 4-5 months the crop is on the land; (d) draining anddrying the field at harvest; and (e) reflooding after an interval which varies froma few weeks to as long as eight months. These operations and oxygen secretionby rice roots lead to the development of certain features peculiar to paddy soils.
During the period of submergence, reducing conditions prevail and the soilturns dark gray. Iron, manganese, silica and phosphate become more soluble anddiffuse to the surface and move by diffusion and mass flow to the roots and tothe subsoil. When reduced iron and manganese reach the oxygenated surface, thesurface of rice roots, or the aerobic zone below the plow layer, they are oxidizedand precipitated alongwith silica and phosphate. Sandwiched between theaerobic surface layer and the zone of iron and manganese illuviation is therootzone of rice with reddish-brown streaks along root channels. When the landis drained at harvest, almost the entire profile above the water table is reoxidizedgiving it a highly mottled appearance. The downward movement of iron andmanganese ensures their permanent loss from the top soil. The eluviated ironand manganese, along with some phosphate, are deposited below the plowedsoil to produce an iron-rich Bir horizon overlying a plowed manganese rich Bmnhorizon. During submergence, the cations displaced from exchange sites byFe2+ migrate out of the reduced zone and are lost. When the soil is drained anddried, the reduced iron is reoxidized and precipitated, Bit leaving H+ as the onlymajor cation. The soil is acidified and the clay disintegrates.
118
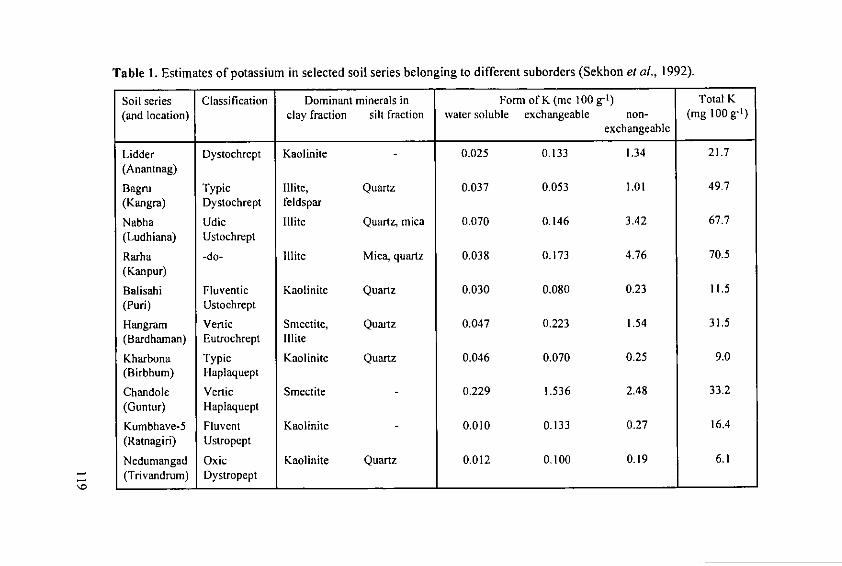
Table 1. Estimates of potassium in selected soil series belonging to different suborders (Sekhon et al., 1992).
Soil series Classification Dominant minerals in Form of K (me 100 g-1) Total K(and location) clay fraction silt fraction water soluble exchangeable non- (mg 100 g-l)
exchangeable
Lidder Dystochrept Kaolinite 0.025 0.133 1.34 21.7(Anantnag)
Bagru Typic lilite, Quartz 0.037 0.053 1.01 49.7(Kangra) Dystochrept feldspar
Nabha Udic Illite Quartz, mica 0.070 0.146 3.42 67.7(Ludhiana) Ustochrept
Rarha -do- Illite Mica, quartz 0.038 0.173 4.76 70.5(Kanpur)
Balisahi Fluventic Kaolinite Quartz 0.030 0.080 0.23 11.5
(Puri) Ustochrept
Hangram Vertic Smectite, Quartz 0.047 0.223 1.54 31.5(Bardhaman) Eutrochrept Illite
Kharbona Typic Kaolinite Quartz 0.046 0.070 0.25 9.0(Birbhum) Ilaplaquept
Chandole Vertic Smectite 0.229 1.536 2.48 33.2(Guntur) Haplaquept
Kumbhave-5 Fluvent Kaolinite 0.010 0.133 0.27 16.4(Ratnagiri) Ustropept
Nedumangad Oxic Kaolinite Quartz 0.012 0.100 0.19 6.1(Trivandrum) Dystropept
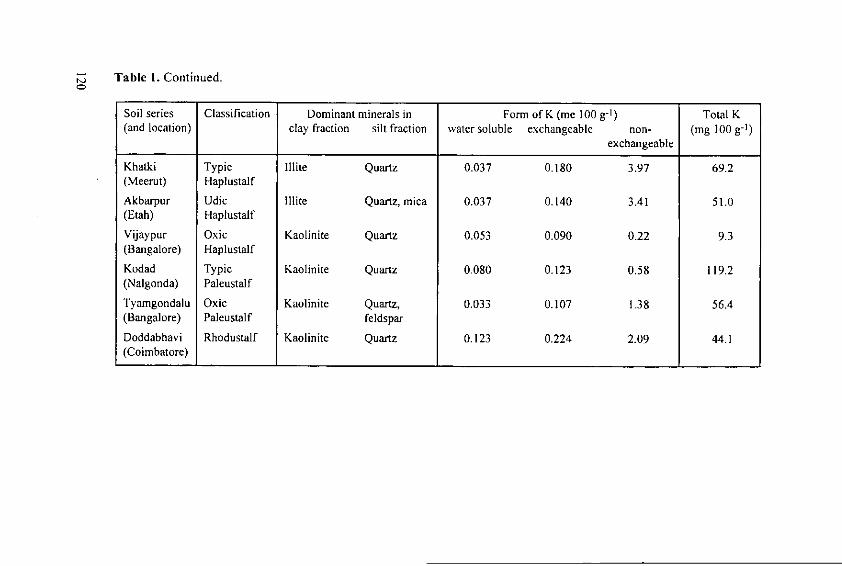
Z Table 1. Continued.
Soil series Classification Dominant minerals in Form of K (me 100 g-l) Total K(and location) clay fraction silt fraction water soluble exchangeable non- (mg 100 g-l)
exchangeable
Khatki Typic Illite Quartz 0.037 0.180 3.97 69.2(Meerut) Haplustalf
Akbarpur Udic Illite Quartz, mica 0.037 0.140 3.41 51.0(Etah) Haplustalf
Vijaypur Oxic Kaolinite Quartz 0.053 0.090 0.22 9.3(Bangalore) Haplustalf
Kodad Typic Kaolinite Quartz 0.080 0.123 0.58 119.2(Nalgonda) Paleustalf
Tyamgondalu Oxic Kaolinite Quartz, 0.033 0.107 1.38 56.4(Bangalore) Paleustalf feldspar
Doddabhavi Rhodustalf Kaolinite Quartz 0.123 0.224 2.09 44.1(Coimbatore)

The increase in conductance during the first few weeks of flooding is due torelease of Fe2+ and Mn2+ from the insoluble Fe (111) and Mn (IV) oxide hydra-tes, the accumulation of NH4±, HCo3"and RCoo-, and (in calcareous soils thedissolution of CaCO 3 by CO2 and organic acids. An additional factor is thedisplacement of ions, especially cations, from soil colloids by reactions of thefollowing type:
Ca2+- Colloid + Fe2+ Fe2+- Colloid + Ca2+11L
Fe304.nH20
This is evident from the similarity of the curves for the kinetics of (Fe 2 + +
Mn 2+), other cations, and specific conductance. The decline after the peak is
due mainly to the precipitation of Fe 2+ and Fe 30 4 .nH20 and Mn 2+ as MnCO3.The decrease in conductance of calcareous soils is caused by the fall in partial
pressure of CO 2 and the decomposition of organic acids.The specific conductance of an aqueous solution, at a fixed temperature,
depends on the kind and concentration of ions present. Since the kind and
concentration of ions determine to a large extent the ionic strength (I = 1/2 _CIZ 1
2 where I is the ionic strength, c1 the concentration in moles per litre and zl
is the valence), there should be a quantitative relationship between specificconductance and ionic strength. Experimental verification showed that the ionicstrength in moles per litre was numerically equal to 16 times the specificconductance (k) in mhos/cm at 25°C, upto an ionic strength of 0.05. Use of I =16k eliminates the need for chemical analysis and enormously simplifies thecalculation of the ionic strength.
Yu Tian-ren (1985) has edited a comprehensive treatise on physicalchemistry of paddy soils. Discussing ion adsorption, Zhang Xiao-Nian (1985)states that paddy soils are characterized by a low iron oxide content due to
reductive eluviation caused by long term submergence and a high content oforganic matter as compared with their corresponding upland soils. These proper-ties together with a periodical change in pH during alternate wetting and dryinghave some influence on the electrical charge of the soil. The ionic compositionof soil solutions during submergence also differs from that under upland soils.Work with acidic paddy soils shows that the amount of K' ions adsorbed bysoils and their bonding energy increases with rise in pH but decreases withelectrolyte concentration. The paddy soil is characterized by larger amount of
exchangeable potassium and sodium compared with the upland soil, especiallyin the cultivated layer. Wu Jun et al. (1985) state that except for the paddy soilsderived from weakly leached soils, the conductivity of the paddy soil isgenerally higher than that of its parent soil or the corresponding upland soil.
121
The electrical conductivity increases upon submergence owing to thechemical changes occurring in the soil. The electrical conductivity increasessharply at first but the rate of increase tends to decline gradually, attaining asteady state. There appears to be a close relationship between electricalconductivity and the fertility level of non-saline paddy soils in China because infarm manure, which is the chief fertilizer for rice, the range of variation inrelative proportions of various ions is not large.
3. Nutrient availability
Availability of nutrients in soils has received much attention from variousscientists. However, its precise meaning and measurement continue to defyagreement. Black (1993) suggests that availability can be understood in terms ofthe effective quantity susceptible to absorption by plants. Hence, it is notpossible to evaluate absolute availabilities because of the great diversity betweencrops, the representative character of the soil samples and the standard of farming.However, one can hope to obtain a fair measure of the proportional availabilityof a nutrient which may be designated to an index of nutrient availability.
Since plants are an essential component of the system, the primarymeasurements to obtain estimates of availability indexes must be made withtheir use. These biological measurements should serve as standards for thechemical methods which alone, for reasons of economy and speed, can be usedin soil testing practice.
Three aspects of nutrient availability are now generally recognized:intensity, quantity and the buffer capacity. The intensity aspect of nutrientavailability relates to the nutrients in the soil solution in contact with rootsurfaces. Although the composition of the soil solution varies with distancefrom soil particles, the activity of the nutrient is assumed to be identicalthroughout the solution at equilibrium with the soil solids. The solution used foranalysis in nonsaline soils is often obtained by equilibrating a sample of soilwith a relatively large volume of a dilute (usually 0.01 molar) calcium chloridesolution. The quantities of nutrient present in soil solutions are so small inrelation to the quantities absorbed by plants that soil solids are expected to holdthe bulk of the nutrients that become available to plants during the crop growth.The methods usually used to estimate nutrient availability extract largeramounts of nutrients than are present in the soil solution. The buffer capacity ofa soil for a nutrient is the rate of change of quantity with respect to intensity.The decrease in intensity depends upon the amount of nutrient absorbed by theplant and the amount released from the soil solids.
122
An increase in intensity and quantity follows the addition of a solublenutrient to a soil. The increase in quantity of solid-phase nutrient in equilibriumwith the solution per unit increase in intensity of the nutrient is called the buffercapacity at that particular intensity. When some of the nutrient is removed from
the solution, a change in the opposite direction follows. The nutrient intensitydecreases, with a concomitant release of some of the nutrient from the solids toestablish a new equilibrium.
4. Soil Test Methods for estimation of plant available potassium
4.1. Chemical
Use of IN NH 4OAc at pH 7 to extract the exchangeable + water soluble K isthe most widespread of all methods used to estimate the so-called plant available
K. Soil:solution ratios tend to differ between laboratories but in all cases anexcess ofNH4
+ is used. Laboratories in various countries use similar proceduresbut with variation in the nature of extractant viz. neutral salts, weak or strongacids, the ratio of soil:extractant and time of extraction, etc. (Novozamsky andHouba, 1987). The usual procedure for ranking different methods of soil testingis to note the degree of correlation with biological indexes of nutrientavailability experimentally ascertained from the same group of soils.
Use of boiling I M HNO3 to also extract non-exchangeable K has beensuggested (Wood and DeTurk, 1940). The method consists of boiling 2.5 gsample with IN HNO 3 for 10 min. making up to a volume and determining K inthe extract and computing non-exchangeable K from the difference between theK extracted by IM HNO3 and IN NH4 OAc-K. The NaBPh4 treatment extractssimilar amounts of K from the soil, although it is a less drastic treatment of themineral structures. However, the period of extraction is longer (72 hrs) and theextractant is costly. The cation exchange resin extraction requires longer periodfor equilibration. Hence, on account of cost and time factors, use of boiling I MHNO 3 has better chances of adoption as a routine laboratory method.
4.2. Electrochemical
The electro-ultrafiltration (EUF) extraction method is a combination ofelectrodialysis and ultrafiltration. The technique (Nemeth, 1979) is widely usedin Germany, Austria and several other countries of Europe. The three-cellapparatus has a middle cell containing the soil suspension (soil:water is 1:10)and a stirrer and a water-inflow.
The two accompanying cells are connected to the central cell with microporefilters attached to Pt electrodes. The two end cells are provided with vacuumconnections to move the solution through the filters. The K collects at the
123

cathode alongwith other cations and anions collect at the anode. Most of theexchangeable K' is removed from soils in 10 minutes with the voltage at 200Vand the temperature 213 k. However, K release from the non-exchangeableform in micaceous soils markedly increases with the rise in voltage to 400V andtemperature to 353k.
A general disadvantage that has been noted for the electro-ultrafiltrationmethod is the high cost of the ultrafiltration units and the limited number ofsamples that can be processed per unit per day (Black, 1993).
5. Evaluation of soil test results
Having performed the analysis one would like to examine the soil test resultsto find out whether a soil is deficient or sufficient in the supply of K.
The critical soil test value concept seeks to divide the soils into 2 categories:responsive and non-responsive or soils which produce a statistically significant,economically profitable yield response and those which give a less significant,economically unattractive yield response. All methods to determine criticalvalues for a soil test seek to arrange in an ascending order, the soil test valuesfor the observed group of soils along the X-axis and depict the correspondingresponse (the yield of the control pots or field plots or the control yieldsexpressed as percentage of the maximum yields known as relative yield), on theY-axis. Where plants are grown in pots, nutrient uptake provides an estimate ofthe dependent variable along the Y-axis. A best fit (usually curvilinear) isattempted. Visual inspection suggests a reasonable point in the curvature whichdistinguishes the two soil populations; the corresponding point on the X-axis isdesignated as the critical soil test value.
The accuracy of the critical soil test value depends upon the representativecharacter of the soils used for collecting background information, number ofsoils included in the study, precision of the laboratory results and the nature ofthe crop response date. The yield of dry matter (and grain in particular) is linearover a smaller range of nutrient supply in the growth medium than the yield ofthe nutrient. Hence, the critical soil test values estimated from crop responsedata or yield of nutrients would tend to be higher than those established fromthe data on the yield of the economic component of the crop.
124
Visual inspection of soil test crop response correlation curves may indicatemore than one break, such that it is possible to divide the soils into 3 categories:Highly responsive, moderately responsive, and having small, uneconomic ornegligible response. It is thus that a large number of soil testing laboratoriesdistinguish the soils as low, medium or high in respect of a nutrient supply.
Some laboratories classify the fertility of soils as very low, low, medium, highor very high. While others merely indicate the soil test values. Crops differ in
their K requirement. What is low for potatoes, may be high for small grains.Similarly, what is low for a clay loam, may be high for a sandy loam. Thus,Rouse (1968) showed that the K requirement for cotton was much greater than
that for corn and soybean and similar relative yields of cotton could be obtainedwith different amounts of soil K, in various groups of soils, having differentcation exchange capacities.
Cate and Nelson's procedure (1965, 1971) to locate the critical soil testvalue has become popular in recent years. In the graphic version, the crop
response data are plotted on the Y-axis against the soil test values on the X-axis.A transparent overlay with a vertical line and an intersecting horizontal line isso placed that the number of points in the first and the third quadrants are themaximum. The soil test value corresponding to the vertical line is the criticalvalue. In a statistical technique, the least sum of squares obtained from two
groups, typifying the two soil populations, through an iterative process, definesthe postulated critical value.
While most laboratories use a measure of exchangeable + water-soluble K asan index of K availability in the soil, some laboratories use an estimate of non-exchangeable K for the same purpose. There appears a merit in combining thetwo estimates and examine a measure of exchangeable + water soluble K in thelight of information on non-exchangeable K. Potassium desorption usingelectro-ultrafiltration has shown (Brar and Sekhon, 1986; Brar et al., 1986) thatsoils having similar amounts of NH 4 OAc-K could release different amounts ofK depending upon their contents of non-exchangeable K. Fig.I illustrates therelationship between HNO3-K and NH 4OAc-K for various groups of soils andshows that the regression slopes decreases in the sequence smectitic > kaolinitic> illitic. Accordingly, at a given HNO 3-K content, the associated amount ofNH 4OAc-K increased from illitic to kaolinitic to smectitic soils. Table 2 groupsthe soils according to their HNO 3-K: < 600, 600-1200 and > 1200 mg kg-1.Looking at the modal value of NH 4 OAc-estimates of various soil groups in thelight of HNO 3-K one finds that most of the kaolinitic soils were low in bothHNO 3-K and NH 4 OAc-K and had low K-release rates. More than two thirds ofthe illitic soils were high in HNO3-K, had a moderate amount of NH 4OAc-Kbut were characterized by rapid K-release rates.
125
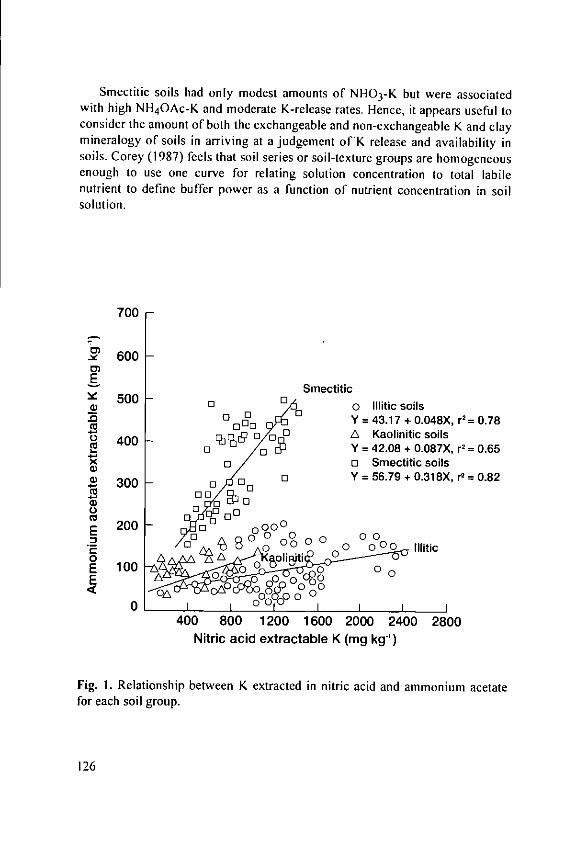
Smectitic soils had only modest amounts of NHO 3-K but were associatedwith high NH 4 OAc-K and moderate K-release rates. Hence, it appears useful toconsider the amount of both the exchangeable and non-exchangeable K and claymineralogy of soils in arriving at a judgement of K release and availability insoils. Corey (1987) feels that soil series or soil-texture groups are homogeneousenough to use one curve for relating solution concentration to total labilenutrient to define buffer power as a function of nutrient concentration in soilsolution.
700
C)
- 600
I-E Smectitic500 - D1 0 Illitic soils
"0 0 0 Y = 43.17 + 0.048X, r'= 0.78moo
L) 400 0 I1 1 0C A Kaolinitjc soils4 0 Y = 42.08 + 0.087X, r2
= 0.65D 0 o Smectitic soils
S 300 - 0 0 Y = 56.79 + 0.318X, r2 = 0.82
C52300 0 0
0 000E_ 200 n 0 ooooO
E 0 0 0 00
O 100 Az_ , o-i~t o ,
E 0 00
I A1 000 0o0cg1o0 I I o Io' I I I I400 800 1200 1600 2000 2400 2800
Nitric acid extractable K (mg kg-')
Fig. i. Relationship between K extracted in nitric acid and ammonium acetatefor each soil group.
126

Table 2. Distribution of soils in different categories of HNO 3-K and modalvalues of NH 4 OAc-K (Bhonsle et al., 1992).
Soil series Boiling nitric acid NH 4OAc-Ksoluble-K (mg kg-1) (mg kg-')
% soils Modal value<600 600-1200 > 1200
Kaolinitic soilsBalisahi 100 - - 21- 30Kharbona 100 - 31- 40Vijaypura 100 - - 31- 40Tyamagondalu 95 5 - 41- 50Lidder 96 4 - 41- 50Kodad 100 - - 51- 60Nedumangad 99 1 - 51- 60
Smectitic soilsPemberty 22 78 - 181-200Kalathur 1 99 - 181-200Kamlia Kheri 45 55 - 261-300Sarol 15 74 II 301-340Pithvajal 20 80 - 401-440Shendvada - 66 34 401-440
Ill itic soilsAkbarpur - 32 68 81- 90Rarha - 29 71 81- 90Nabha I 85 14 81- 90
Khatki - 7 93 91-100
6. Interpretation of soil test results
Soil testing is done to decide whether to treat soils with fertilizers (or amend-ments) to optimize yields and profits from farming. Hence, a good interpretationof soil K test data requires sufficient information on the relationship betweenlaboratory soil test values and yield response from the incremental amounts of Kapplied in the field.
Many soil testing laboratories merely distinguish the soils into two or morecategories on the basis of the likelihood of the yield response and its magnitudefrom the application of K fertilizers. Supplementary information on the responseof various crops to dressings of K fertilizers in soils differing in K fertility isprovided to furnish guidance to the growers, whose soils are tested.
127
Often enough, the available background information for the purpose ofadvisory work is far from adequate. Attention has been drawn in the precedingsection as to how a good classification of soil test results for K can be ensured.A reasonable number of field experiments on all crops of economic importancein a homogeneous soil group co-terminus with dominant soil series or the soil-texture group should be conducted to obtain a fair estimate of the optimumamount of K fertilizer necessary to ensure good yields.
Some soil testing laboratories use regression equations to suggest theappropriate amounts of K fertilizer to apply, keeping in view the soil testestimates of nutrients other than K, in the presence of recommended amounts ofN, P and other secondary or micronutrients. As Welch and Wiese (1973) pointout, correlation (and regression) coefficients are often poor for field data, due toan insufficient number of observations or a few high or low values, caused byfactors unrelated to the supply of available nutrients in the soil. Soil chemicalproperties account for a high proportion of the yield response variation fromapplications of plant nutrients and lime.
Two concepts of soil test interpretation have excited considerable interest;the basic cation saturation ratio (BCSR) and the sufficiency level of availablenutrients (SLAN). According to the BCSR concept, there is an ideal ratio forsaturation of the cation exchange complex i.e. 65% Ca, 10% Mg, 5% K and 20%N. These saturations were derived from several years of work with alfalfa on soilsin New Jersey. Some others who followed this approach, did not necessarilysubscribe to the existence of one 'ideal ratio' per se. Emphasis on ideal ratios hascontributed to the formulation of some unrealistic, cost-prohibitive fertilizerrecommendations. The sufficiency level concept assumes the existence of ameasurable soil test K level below which there is a reasonable likelihood of cropresponse to fertilizer K and above which there is not. Arising from' theMitscherlich-Bray equation, the SLAN concept generates information on suffi-ciency levels, using the procedures suggested by Cate and Nelson (1965, 1971).
It is possible to apply different amounts of fertilizers to field plots differingin the supply of various plant nutrients, N, P and K and then fit a regressionequation to obtain estimates of the regression coefficients which may be used topredict the crop responses to applied nutrients, such as K, to obtain the targetyield. Ramamoorthy and Velayutham (1971) have described the procedure,which has been used in the Indian programme on soil test crop responsecorrelation, to develop yield equations. It has been noticed in the follow uptrials that there is a tendency for the observed yields to drop, relative to targetyields, as the target yields are increased (Black, 1992).
Because of the wide range in soil characteristics, it would be ideal to developcalibration curves or yield equations for all important soil types and phases.
128
The fertility capability soil classification system, proposed by Buol (1972)and reviewed by Sanchez et al. (1982) includes three category levels: texture ofthe surface soil, texture of the subsoils and 15 modifiers, among the criteria thathave a direct influence on soil fertility management practices. The system isrecommended for use in connection with the soil testing for nutrient supplywhich may vary within each classification unit. The higher classification units ofSoil Taxonomy have been found useful in formulating broad fertilizer policiesfor large areas of humid tropics (LeMare, 1981; Cottenie et at., 1981). It is thoughtthat where very small farms are the norm, and satisfactory soil testing is unlikelyto be widely available, use of fertilizers on the basis of broad groups would beextremely desirable. The Potash Research Institute of India conducted a study on29 benchmark soils which typify the diversity that occurs in the soils. Most ofthe red and lateritic soils and 3 alluvial soils were uniformly low or marginallymedium in estimates of NH4 OAc-K, although there was a wide variation inabsolute amounts ofNH 4OAc-K in the adjacent soils in these soil series (Sekhonet al., 1992). Frequency distribution diagrams of NH 4OAc-K illustrate it (Fig. 2).
Field experiments can be single-season or long-term. Single season experi-ments are useful in developing information for establishing critical values. Thesetests do not require many treatments nor many replications on a site, but shouldbe replicated by location. Large number of two-plot tests, one plot receiving noK and another receiving adequate K (both receiving sufficient amounts of allother nutrients) are needed only. The soils on which these experiments are con-ducted, should represent the range in fertility levels for which the critical levelinformation is sought. Additionally, single season experiments also providerecommendations for fertilizer use in terms of application to the first crop follo-wing the soil test. Long-term experiments are useful to secure information onthe build-up or depletion of nutrients such as K, in the soil with time. Potassiumdeficiencies often appear only after a few years cropping without fertilizer K.Such information can be suitably communicated to the growers, indicating howa reduction in soil K and profitability of fertilizer K increase with time.
7. A look at the future
One can look at the future only in the light of past achievements and theperceptions of the future requirements. A lot of good'information is now availa-ble on basic and practical aspects of mineralogy and chemistry of potassium insoils, release of soil potassium by weathering, chemical equilibria of soil potas-sium, thermodynamics of K-exchange in soils, chemistry of paddy soils,nutrient availability , soil test methods for estimating plant available K and theevaluation and interpretation of soil test results.
129

(a) Red and Latertic
35 S Doddabhavi30 Vijayapura
C TyamagondaluA Nedumangad
a 20 * Kumbhave - 5aX Kodad
o,~-10
0
NH 4OAC - K (mg kg 'I)
40 0Udder A Lukhi A Nabha * Rarha * Khatki XAkbarpur35 oBalisahi aKarbono oHanrgrarn DJagdishpurBagha
30 RaghopuroBagni *Chandole A Masitawali
(b ) Alluvial25
S20
15
10
5
NH4OAC - K (mg kg -1)
O Pernberty35 * Noyyal (c ) Vertisols and Vertic
o Pithvajal30 * Shendvada
X Kamliakheri2,25 A Sarohu--~ ~ Z aathur
E 20
100
ID C ' O ~
NH40AC - K (ng kg- 1)
Fig. 2. Frequency distribution of available potassium in some benchmark soilsof India.
130

Most soil testing laboratories use a measure of exchangeable + water solubleK as an estimate of plant available K, although it is common knowledge thatcrops usually absorb, during their active growth, a part of the K which wasinitially in the non-exchangeable form. Hence, it appears desirable to include ameasure of non-exchangeable K in our estimate of plant available K.Alternatively, classification units of Soil Taxonomy may be examined for non-exchangeable K and estimates of exchangeable + water soluble K can beinterpreted against that background. Although paddy soils have a higherconductance, its significance for the availability of potassium to crops over aperiod of time has not been adequately investigated. The concepts andprocedures for determination of critical soil test values are widely understoodbut the background information for the purpose is often lacking. Consequently,the critical soil test values are borrowed and applied on soils having a ratherwide range in characteristics. Disproportionately more effort has been spent onthe choice of appropriate indexes of K availability than on collecting thebackground information for sounder advisory work. Accordingly, it may beworthwhile to adopt a fertility capability soil classification system, collect afairly large number of representative soil samples from each unit and examinethem for nutrient deficiency or sufficiency, including K. In much of thedeveloping world, crop yields are low and small applications of criticallydeficient nutrients are essential for sustainable farming but satisfactory soiltesting is unlikely to be widely available, the use of fertilizers on the basis oftaxonomic units would be most productive. An adequate number of fieldfertilizer experiments on representative sites, some of which are long-term,should be conducted which, over a period of a few years, can yield requisiteinformation for advisory purposes.
8. References
Bertsch, P.M. and Thomas, G.W. (1985): Potassium status of temperate regionsoils. In: Potassium in Agriculture. pp. 131-162. Munson, R.D. (Ed.) Amer.Soc. Agron. Madison, Wisconsin.
Bhonsle, N.S., Pal, S.K. and Sekhon, G.S. (1992): Relationship of K forms andrelease characteristics with clay mineralogy. Geoderma, 54: 285-293.
Black, C.A. (1968): Soil-Plant Relations Second Edition. John Wiley & Sons,Inc. New York.
Black, C.A. (1993): Soil fertility evaluation and control. Lewis Publishers. AnnArbor. Michigan, USA.
Boyer, J. (1982): Les soils Ferralitiques, Vol. X. Office de ]a Recherche Scienti-fique et Technique Outre Mer. Paris.
131
Brar, M.S. and Sekhon, G.S. (1986): Desorption of potassium from five soils ofNorth India using electro-ultrafiltration. J. Soil Sci. 37, 405-411.
Brar, M.S., Subba Rao, A. and Sekhon, G.S. (1986): Solution, exchangeableand non-exchangeable potassium in five soil series from the alluvial soilregion of Northern India. Soil Sci. 142(4): 229-234.
Buol, S.W. (1972): Fertility capability classification. In: Agronomic-EconomicResearch on Tropical Soils. Annual Report for 1971. pp. 4 4-50 . Soil ScienceDepartment, North Carolina State University, Raleigh, USA.
Cate, R.B. Jr. and Nelson, L.A. (1965): A rapid method for correlation of soiltest analysis with plant response data. North Carolina Agricultural Experi-ment Station. International Soil Testing Series, Technical Bulletin No.1.Raleigh.
Cate, R.B. Jr. and Nelson, L.A. (1971): A simple statistical procedure forpartitioning soil test correlation data into two classes. Soil Science Societyof America Proceedings. 35: 658-660.
Corey, R.B. (1987): Soil test procedures: correlation. In: Soil testing; sampling,correlation, calibration and interpretation. SSSA Sp. Public. 21 Soil Sci. Soc.Amer. Inc. Madison, Wi. USA.
Cottenie, A., Kang, B.T., Kiekens, L. and Sajjapongse, A. (1981): Micronutrientstatus. In: Characterization of soils. pp. 149-163. D.S. Greenland (Ed.)Clarendon Press, Oxford, U.K.
DeDatta, S.K. (1981): Principles and Practices of Rice Production. John Wiley& Sons, New York.
Jackson, M.L. (1964): Chemical Composition of Soils. In: F.E. Bear (Ed.)Chemistry of the Soil. pp. 71-141. Van Nostrand Reinhold Co. New York.
LeMare, P.H. (1981): Phosphorus sorption and release. In: Characterization ofsoils. pp. 97-134. D.J. Greenland (Ed.) Clarendon Press, Oxford, U.K..
Malavolta, E. (1985): Potassium status of tropical and subtropic region soils. In:Potassium in Agriculture. pp. 163-200. Munson, R.D. (Ed.) Amer. Soc.Agron. Madison, Wisconsin.
Moorman, F.R. (1978): Morphology and classification of soils in which rice isgrown. In: Soils and Rice. pp. 255-272. International Rice Res. Inst. LosBaflos, Philippines.
Nemeth, K. (1979): The availability of nutrients in soils as determined byelectro-ultrafiltratin (EUF). Adv. Agron. 31: 155-188.
Novozamsky, 1. and Houba, V.J.G. (1987): Critical evaluation of soil testingmethods for K. 20th Colloq. International Potash Institute, Baden bei Wein.Austria: 177-197.
Ponnamperuma, F.N. (1972): The chemistry of submerged soils. Adv. Agron.24: 29-96.
132

Ramamoorthy, B. and Velayutham, M. (1971): Soil test crop responsecorrelation work in India. Food and Agriculture Organization of the UnitedNations, World Soil Resource Report No. 41: 96-102.
Rioh, C.I. (1972): Potassium in soil minerals. In: Potassium in Soil. pp. 15-32.9th Colloq. Int. Potash Inst. Landshut, Germany.
Rouse, R.D. (1968): Soil test theory and calibration for cotton, corn, soybeanand coastal bermuda grass. Auburn Univ. Ala. Agri. Expt. sta. Bull. 375 pp.
Sanchez, P.A., Couto, W. and Buol, S.W. (1982): The fertility capability soilclassification system: interpretation, applicability and modification.Geoderma 27: 282-309.
Sekhon, G.S., Brar, M.S. and Subba Rao, A. (1992): Potassium in some bench-mark soils of India. PRII Sp. Publ. 3. Potash Research Inst. India, Gurgaon-122 001.
Suwanarit, Amnat (1995): Potassium dynamics and availability in stronglyweathered and highly leached soils in the humid tropics. In: Potassium inAsia. 24th Colloq. Intern. Potash Inst., Chiang Mai, Thailand.
Welch, C.D. and Wiese, R.A. (1973): Opportunities to improve soil testingprograms. Soil testing and Plant analysis. Revised Edition. L.M. Walsh andJ.D. Beaton (Ed.). pp. 1-11. Soil Sci. Soc. Amer. Inc. Madison (Wi) USA.
Wicklander, L. (1954): Forms of ptoassium in the soil. Potassium Symposium 1:109-112.
Wood, L.K. and DeTurk, E.E. (1940): The absorption of potassium in soils innon-replaceable forms. Soil Sci. Soc. Am. Proc. 5: 152-161.
Wu Jun, Sun Hui-Zhen and Zhang Dao Ming (1985): Electrical conductivity.In: Physical Chemistry of Paddy Soils. pp. 157-177. Yu Tian-ren (Ed.)Science Press, Beijing, Springer Verlag Berlin.
Yu Tian-ren (1985): Physical chemistry of paddy soils. Science Press, Beijing,Springer-Verlag Berlin.
Zhang Xiao-nian (1985): Ion adosrption. In: Physical chemistry of paddy soils.Yu Tian-ren (Ed.) Science Press, Beijing, Springer-Verlag Berlin.
Zhihong Cao and Yongguan Zhu. (1995): Potassium dynamics and availabilityin soils of subtropical (humid) region. In: Potassium in Asia. 24th Colloq.Intern. Potash Inst.: Chiang Mai, Thailand.
133
The Influence of Moisture Regime, Organic Matter,and Root Eco-physiology on the Availability andAcquisition of Potassium: Implications for TropicalLowland Rice
K.G. Cassman t , D.C. 01k, S.M. Brouder 2 and B.A. Roberts3
1 International Rice Research Institute, P.O. Box 933, Manila 1099, Philippines;2 Dept. Agronomy and Range Sci., University of California, Davis, California-
95616, USA.; and 3 University of California Agric. Extension, Kings CountyGov't Center, Hanford, California-93230, USA.
Abstract
Although there is a large body of research on soil-plant K relations, use ofthis knowledge to improve K management by farmers on low-K soils with Kfixation character has been minimal. While lack of impact can be attributed, inpart, to the complexity of soil moisture regime, mineralogy, organic matter, androot traits that govern K availability and K uptake, there is a need for a morerobust approach that links fundamental and applied research on nutrientmanagement. The quantitative foundation of this framework is the monitoringof nutrient input/ouput balance and crop response in farmers' fields, both ofwhich are used to direct and validate research on processes and mechanisms. Inthis paper we describe how this approach was used to guide research on cottonK deficiency problems, and discuss its relevance for intensive rice systems.
Introduction
The purpose of this paper is to summarize recent advances in ourunderstanding of K dynamics in agricultural soils with strong K fixationcharacter, and to consider the agronomic relevance of these findings to lowlandrice (Oryza sativa L.) systems of Asia. Much of the subject matter we cover isrelated to the paper by Dobermann et at. (1995), which is also included in theseproceedings.
Asia is the most densely populated continent with more than 3 billion peoplein 1990 and predictions for about 5 billion by 2025 (Bus et al., 1992). Arableland per capita is expected to decrease from 0.15 ha in 1990 to 0.10 ha by 2025.
135
Based on these estimates and expected changes in food consumptionpatterns, rice demand must increase by 60-70% in the next 30 years (IRRI,1993). Assuming no decrease in arable land devoted to rice, average rice yieldson 74 million harvested ha of irrigated rice land must increase from 4.9 t ha-1 in1990 to at least 8 t ha-1 in 2025 to meet the expected increase in demand. Thisestimate assumes a similar relative yield increase will also occur on the 38 millionha of rainfed lowland rice although yield targets are much lower.
Yield increases of this magnitude will require significant increases innutrient inputs to sustain productivity. A need for greater nutrient use efficiency(i.e. rice output per unit input) arises from growing concerns about theprofitability of rice-based cropping systems and the preservation of naturalresources. To be honest, our track record in the applied sciences of soil fertilityand plant nutrition is not good. For example, from 1976-1986 N fertilizer usedon rice in Indonesia increased by 400% while total rice production increased byonly 70% (Cassman and Pingali, 1995).
Success in achieving both increased production and a significant increase innutrient use efficiency necessitates a critical evaluation of our research targetsand the framework used to validate hypotheses. Moreover, higher yields andmore efficient plant uptake and recycling of available nutrients within ricecropping systems will depend on more precise, information-intensivemanagement--which in turn requires greater understanding of complexinteractions among soil biotic and abiotic processes, and the effects of cropmanagement on them. As stated by the late C.T. de Witt (1992), "Strategicresearch that is to serve both agriculture and the environment should not somuch be directed towards the search for marginal returns of variableproduction resources, but towards the search for the minimum of eachproduction resource that is needed to allow maximum utilization of all otherresources of the farming system".
The need for broader research targets
The standard approach to soil fertility management emphasizes the identifi-cation of K-deficient soils or plant K deficiency using rapid chemical tests withdefined critical thresholds or threshold ranges (Peck and Soltanpour, 1990;Dahnke and Olson, 1990). This approach relies on a large number of fieldexperiments to establish calibrations between a given soil K test value or indextissue K concentration and the probability of a response to applied K (MacLeanand Watson, 1985; Bennett, 1993).
136

The outputs from this approach are K management guidelines for cerealcrops that are mostly based on empirical field calibrations of "static" soil K testsutilizing a soil extraction method of some kind. On soils with relatively highnative fertility and little K fixation character, this approach may be adequate toprovide reasonable recommendations for K input requirements. Such anapproach is sorely inadequate, however, for intensive irrigated rice systems inthe tropics and subtropics. This is because these systems are extremely K-demanding with two and sometimes three rice crops each year grown insubmerged soil with soil drying in fallow periods, and therefore extractable soilK levels can fluctuate enormously. Also, many lowland rice soils have strong Kfixation properties, or poor nutrient retention and low K buffering power.
It is our belief that development of improved K management strategies forintensive cereal cropping systems in Asia will require a more thoroughunderstanding of processes governing K fluxes in soil and root eco-physiology,and the packaging of this knowledge in user-friendly simulation models anddynamic soil tests that predict optimal K input rates and the residual benefit ofadded K to subsequent crops. Such research must focus on the ability to predictthe amount of K the crop obtains from indigenous soil resources as well as theamount of K acquired from applied inputs. The foundation of this approach isthe measurement of K balance in the cropping system of interest, and the use ofthis information to identify those components of soil K supply that cannot beexplained. This approach will be illustrated by examples from research on the Krequirements of irrigated cotton (Gossypium hirsutum L.) grown on vermiculiticsoils in Central California. In a subsequent section, the relevance of this approachwill be considered with regard to intensive lowland rice systems in Asia.
Potassium input/output balance and cotton response to applied K
A key issue at the beginning of this work was whether cotton yields werelimited by deficient soil K supply or by a disease that reduced plant growth and Kacquisition from soil (Hafez et al., 1975; Weir el al., 1986). The diseasehypothesis was proposed because: (1) foliar symptoms were atypical of Kdeficiency in that symptoms first appeared on younger leaves when cottonreached full bloom, (2) there was little relationship between soil-test K levels andcotton response to applied K, (3) foliar symptoms were not eliminated with highrates of K input up to 500 kg K ha-1, (4) no other crops had K deficiencysymptoms or responded to added K on these vermiculitic soils, and (5) there werelarge yield differences among cotton varieties when grown without K additionwhich were associated with varietal differences in tolerance of verticillium wilt(Verticillium dalhiae Kleb.). The K deficiency hypothesis was supported by tissue
137

tests that indicated petiole K levels that were well below the critical threshold rangeand a consistent yield response to applied K that was associated with increasedpetiole K concentration.
Foliar symptoms on younger leaves were the result of stronger K sink strengthin developing bolls than in young, expanding leaves. The dominance of cottonfruit as a sink for K was verified by boll pruning which immediately alleviatedfoliar symptoms on younger leaves (Padilla, 1986), and by the K harvest index (i.e.the proportion of aboveground plant K in fruiting structures) which increasedfrom 65% in plants well-supplied with K to 90% in plants that were severely Kdeficient (Cassman et al., 1989a). Likewise, standard soil tests using neutral IMammonium acetate or acid extractions with boiling IN HNO3 or ION H2SO4 usedin previous studies to estimate plant-available K were not sensitive indicators ofcrop yields in soil without applied K (Cassman et al., 1990). Instead, the Kconcentration in the soil solution estimated by either a water or 0.01 M CaCI 2extracts (1:10 w:v) was the most sensitive index of cotton response to soil K statusin these vermiculitic soils with massive K fixation capacity.
In fact, rough estimates of the K input/output balance indicated highly K-extractive systems with net removal up to 5000 kg K ha-1 over 30 years for typicalrotations of 3-yr cotton and 3-yr alfalfa (Medicago sativa L.) or rotations withmaize (Zea mays L.) for silage because farmers applied only small amounts of K asinorganic fertilizer or manure (Cassman et al., 1986). This magnitude of K depletionwas reflected in the cumulative response to repeated applications of 480 kg K/hato three consecutive cotton crops (total of 1440 kg K ha-1) in one field experiment(Cassman et al., 1992). Accounting for K removal with harvested seed cotton andchanges in soil K status, 86% of the added K was fixed beyond extraction by IMNH 4CI. In the first year, the yield response to input of 480 kg K ha-1 was I kgseed cotton per kg applied K versus 2.6 kg seed cotton per kg applied K in thethird year. This cumulative response reflected decreasing yield in treatments with-out K that was associated with a significant decrease in extractable and solution-phase K levels, and higher yields in each successive year with repeated applicationof 480 kg K ha-4 . However, changes in extractable and solution-phase K thatoccurred in treatments with or without K addition could not be reconciled with theinput/output balance and K fixation predicted by standard laboratory isotherms.
Given the massive rates of K addition required to alleviate K deficiency on thesesoils, the ability to predict the residual effects of added K on solution-phase K andK buffering capacity was crucial to the development of optimal K managementstrategies. It was clear, however, that cotton yields were limited by a deficient soil Ksupply in these vermiculitic soils although alleviating plant K deficiency resulted insignificantly less foliar necrosis from verticillium wilt despite a similar level ofstem infection in K-deficient and K-sufficient plants (Cassman etal., 1992).
138
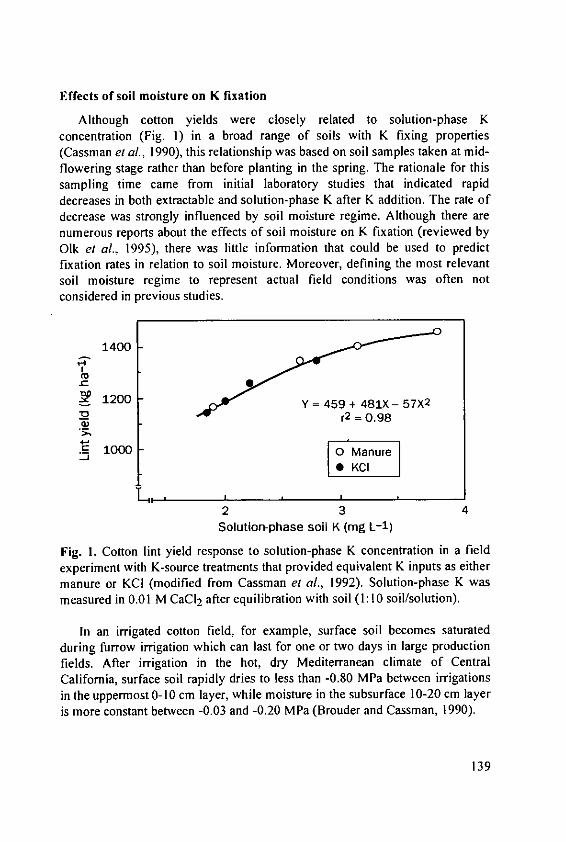
Effects of soil moisture on K fixation
Although cotton yields were closely related to solution-phase Kconcentration (Fig. 1) in a broad range of soils with K fixing properties(Cassman et al., 1990), this relationship was based on soil samples taken at mid-flowering stage rather than before planting in the spring. The rationale for thissampling time came from initial laboratory studies that indicated rapiddecreases in both extractable and solution-phase K after K addition. The rate ofdecrease was strongly influenced by soil moisture regime. Although there arenumerous reports about the effects of soil moisture on K fixation (reviewed byOk el al., 1995), there was little information that could be used to predictfixation rates in relation to soil moisture. Moreover, defining the most relevantsoil moisture regime to represent actual field conditions was often notconsidered in previous studies.
1400
- 1200 Y 459+481X-57X2" r2 = 0.98
'1)
1000 0 Manure0 KCl
2 3 4
Solution-phase soil K (mg L-1)
Fig. I. Cotton lint yield response to solution-phase K concentration in a fieldexperiment with K-source treatments that provided equivalent K inputs as eithermanure or KCI (modified from Cassman et al., 1992). Solution-phase K wasmeasured in 0.01 M CaC12 after equilibration with soil (1:10 soil/solution).
In an irrigated cotton field, for example, surface soil becomes saturatedduring furrow irrigation which can last for one or two days in large productionfields. After irrigation in the hot, dry Mediterranean climate of CentralCalifornia, surface soil rapidly dries to less than -0.80 MPa between irrigationsin the uppermost 0-10 cm layer, while moisture in the subsurface 10-20 cm layeris more constant between -0.03 and -0.20 MPa (Brouder and Cassman, 1990).
139

Recent studies on the effects of moisture regime found the rate of K fixationfollowing K addition to vermiculitic soils were adequately described by first orderkinetics with two distinct phases--a rapid phase in the first 2-5 d after K additionand a slow phase that continued up to 100 d, the duration of the incubationperiod (Olk el al., 1995). The length of the rapid phase depended on moistureregime, lasting 2 d when soils were allowed to air dry (Fig. 2a), and 5 d whensoil remained saturated (Fig. 2b). A relatively large amount of K fixationoccurred in the last stages of drying as soil reached complete air-dryness, but air-dry soil conditions may only occur in the top few cm under field conditions.
5.8 5.8
(a) wet/dry cycles (b) saturated soil
k = -0.058 d1 5.4 _026& &
Z 5.4
"5.2 ', / R O06& 5.2
-k -O.005 &1,5.0 cclle A 5.0
0 4 8 12 16 20 0 20 40 60 80 100lime (days) Time (days)
Fig. 2. Decrease in extractable K from K fixation in a vermiculitic soilfollowing addition of 12 mmol K kg-I soil in (a) two subsequent wetting anddrying cycles A and B or (b) in saturated soil. Rate constants (k) are indicatedfor the rapid and the slow phases in the wet/dry cycles, and for the slow phasein saturated soil (modified from 0lk et al., 1995). Extractable K was measuredby extraction with I M NH 4CI (1:10 soil/solution).
More relevant to actual field conditions are the long-term fixation rates atmoisture contents between -0.03 and -0.50 MPa in soil that does not reach air-dryness. Based on incubations with soil equilibrated at a defined matricpotential, the rate of slow-phase K fixation increased at lower soil moisturecontents (Fig 3a), and solution-phase K decreased in a similar fashion but morerapidly than for the extractable K pool (Fig. 3b). The estimated rates of Kfixation in these laboratory incubations (0lk ei al., 1995) were sufficient toaccount for the K fixation measured in subsurface soil over a 3-yr period in afield experiment (Cassman e al., 1992).
140

These results are consistent with the description of K fixation as a continuousprocess of inward K+ movement through a spectrum of sorption sites from thoseof lowest affinity on organic matter and mineral surfaces to peripheral interlayersites, and finally to deep interlayer sites between the clay sheets (Reitemeier,1951). It also appears feasible to estimate K fixation rates and the residualbenefit from K addition in the field based on measured long-term fixation ratesin laboratory incubations under relevant moisture regimes. However, K fixationmeasured in the field was also found to be sensitive to soil organic matter content,which in turn was influenced by the use of manure and crop rotation.
5.00 (a) 0.82 -i)
; 4.98 -. 0.78
to 6 ""-07 -E *E-
4.96S0.74
,0 ...- *4 ~ In-.01 -
.. -. 4 ~ 0()5 -
o AC * 0.6
00.70
8 4.92
Tim (days) "ime (days)
Fig. 3. Decrease in (a) extractable K and (b) solution-phase K from K fixationin a vermiculitic soil incubated at constant moisture equivalent to a matricpotential of -0.12 or -0.48 MPa. First order rate constants (k) are indicated
(modified from Olk el al., 1995).
Effects of soil organic matter on K fixationSoil organic carbon content (SOC) decreased by 11% after three consecutive
cotton crop cycles from 1985-1987, and we speculated that the decrease in SOCcontributed to the decrease in extractable K that could not be explained by the Kinput/output balance and K fixation estimated from fixation isotherms (Cassmanet al., 1989b). To test this hypothesis at the field level, equivalent K inputs wereapplied as either manure or KCo at uniform rates in 1989-1990 over the previousK-rate treatments that received total net K inputs ranging from 290-1354 kg K
ha-1 from 1985-1987. All other limiting nutrients were applied at non-limiting
141
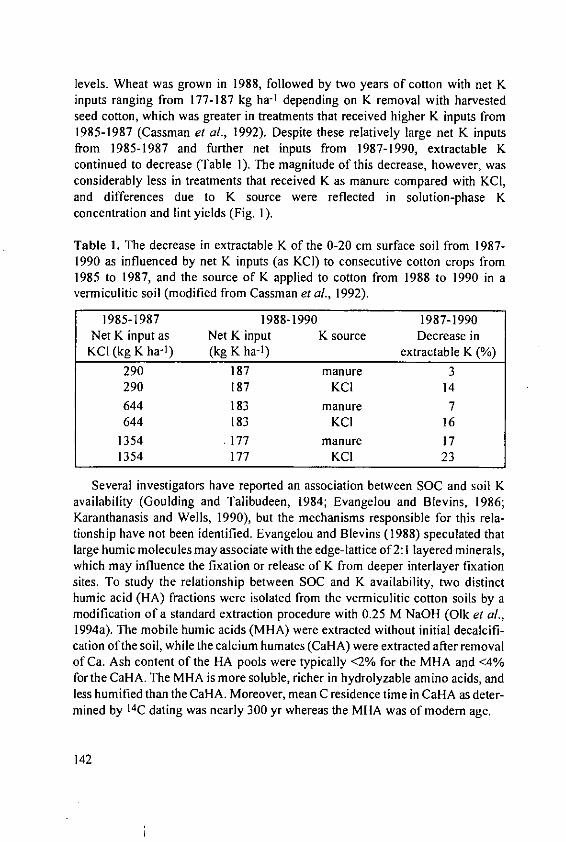
levels. Wheat was grown in 1988, followed by two years of cotton with net Kinputs ranging from 177-187 kg ha-I depending on K removal with harvestedseed cotton, which was greater in treatments that received higher K inputs from1985-1987 (Cassman et al., 1992). Despite these relatively large net K inputsfrom 1985-1987 and further net inputs from 1987-1990, extractable Kcontinued to decrease (Table 1). The magnitude of this decrease, however, wasconsiderably less in treatments that received K as manure compared with KCI,and differences due to K source were reflected in solution-phase Kconcentration and lint yields (Fig. 1).
Table 1. The decrease in extractable K of the 0-20 cm surface soil from 1987-1990 as influenced by net K inputs (as KCI) to consecutive cotton crops from1985 to 1987, and the source of K applied to cotton from 1988 to 1990 in avermiculitic soil (modified from Cassman et al., 1992).
1985-1987 1988-1990 1987-1990Net K input as Net K input K source Decrease in
KCI (kg K ha-1) (kg K ha-1) extractable K (%)
290 187 manure 3290 187 KCI 14644 183 manure 7644 183 KCI 16
1354 177 manure 171354 177 KCI 23
Several investigators have reported an association between SOC and soil Kavailability (Goulding and Talibudeen, 1984; Evangelou and Blevins, 1986;Karanthanasis and Wells, 1990), but the mechanisms responsible for this rela-tionship have not been identified. Evangelou and Blevins (1988) speculated thatlarge humic molecules may associate with the edge-lattice of 2:1 layered minerals,which may influence the fixation or release of K from deeper interlayer fixationsites. To study the relationship between SOC and K availability, two distincthumic acid (HA) fractions were isolated from the vermiculitic cotton soils by amodification of a standard extraction procedure with 0.25 M NaOH (Ok et al.,1994a). The mobile humic acids (MHA) were extracted without initial decalcifi-cation ofthe soil, while the calcium humates (CaHA) were extracted after removalof Ca. Ash content of the HA pools were typically <2% for the MHA and <4%for the CaHA. The MHA is more soluble, richer in hydrolyzable amino acids, andless humified than the CalA. Moreover, mean C residence time in CaHA as deter-mined by 14C dating was nearly 300 yr whereas the MHA was of modem age.
142

Addition of MHA to a vermiculitic soil in a first wetting and drying cyclefollowed by K addition in a second wet/dry cycle caused a large reduction in Kfixation whereas addition of CalA had little effect (Table 2).
Table 2. Effects of mobile humic acid (MHA) or calcium humate (CaHA)addition to a vermiculitic soil in a first wetting and drying cycle on the fixationof K added at the initiation of a second wetting and drying cycle. Fixed K wasestimated by the proportion of added K not recovered by extraction with IMNH 4CI after the second wet/dry cycle (modified from Olk and Cassman, 1993).
Humid acid fractionHumid acid addition K addition MHA CaHA
(g kg-I) (mg kg- 1) (% of added K fixed)
0 117 84 843.7 117 80 837.4 117 74 83
14.8 117 62 81
0 234 83 843.7 234 81 83
7.4 234 77 8214.8 234 68 81
In a pot experiment, plant K uptake from soil that received both MHA and Kadditions was 42% greater than in soil with only K addition, while extractablesoil K was 30% greater after 3-weeks growth (Fig. 4).
Addition of MHA also decreased K fixation in a long-term incubation withsoil maintained at constant moisture or during consecutive wetting and dryingcycles (data not shown). Subsequent studies revealed that the decrease in Kfixation due to MHA addition (1) could not be attributed to mineral dissolution,(2) occurred even when the MHA was separated from soil by a dialysismembrane with molecular weight cut-off of 6,000-8,000 (Olk and Cassman,1993), and (3) could be reproduced by dodecylammonium chloride (analiphatic, 9-carbon amine) but not by aromatic compounds such as thymolwhich do not have an amine moiety (Ok, 1993).
These results suggest that two mechanisms contribute to the increase in Kavailability and the decrease in fixation of added K from MHA addition. First,the peripheral amino acids attached to the MHA core may participate in Kexchange of interlayer K at the expanding edges of clay sheets where interlayersare exposed to the external soil solution. Second, the increased CEC provided bythe MHA shifts the equilibrium away from K fixation at interlayer sites, and theMHA itself may also contain specific adsorption sites for K. The role of amino
143

acid moieties in reducing K fixation is consistent with two-fold greaterhydrolyzable amino acid content in MHA compared with CaHA which had littleinfluence on K fixation.
8 g0.3
mno K addition
0.2E b1) 4 b
aa a a
0.1 -
0 - 0
Soil Alone Soil + MHA Soil Alone Soil + MHA
Fig. 4. Effect of mobile humic acids (MHA) and K addition on K uptake bysudangrass after 3 weeks growth in a vermiculitic soil. MHA was added at 6 mgkg-1 soil. Treatments with the different letters indicate a significant meanseparation by Duncan's Multiple Range Test (modified from Ok, 1993).
Likewise, the CalA is less soluble and is perhaps "inactivated" byintramolecular divalent bridges between Ca+2 and carboxyl moieties in theCaHA. Analysis by 13C NMR also indicates greater prevalence of carboxylgroups in the more humified CaHA than in MHA (Olk et al., 1994a). Thephysical blockage hypothesis of Evangelou and Blevins (1988) was notsupported by the experimental results because MHA increased extractable Klevels significantly and decreased K fixation when added in a wetting anddrying cycle that followed K addition to a previous wet/dry cycle, or whenMHA was physically separated from soil by a dialysis membrane.
Cotton root traits and K uptake
The cotton root system has unique characteristics that influence Kacquisition in vermiculitic soils. First, unlike other crops, cotton rootdistribution is typically incongruent with available K in soil profiles (Grimes etal., 1975; Brouder and Cassman, 1990). Lack of congruence reflects stratifiedsoil K availability and poor cotton root development in the uppermost topsoillayers (Gulick et al, 1989) caused by cessation of root growth at a soil moisturethreshold of about -0.1 MPa, a threshold much higher than for other crops(Taylor and Klepper, 1974). Available K is concentrated in the surface soil
144
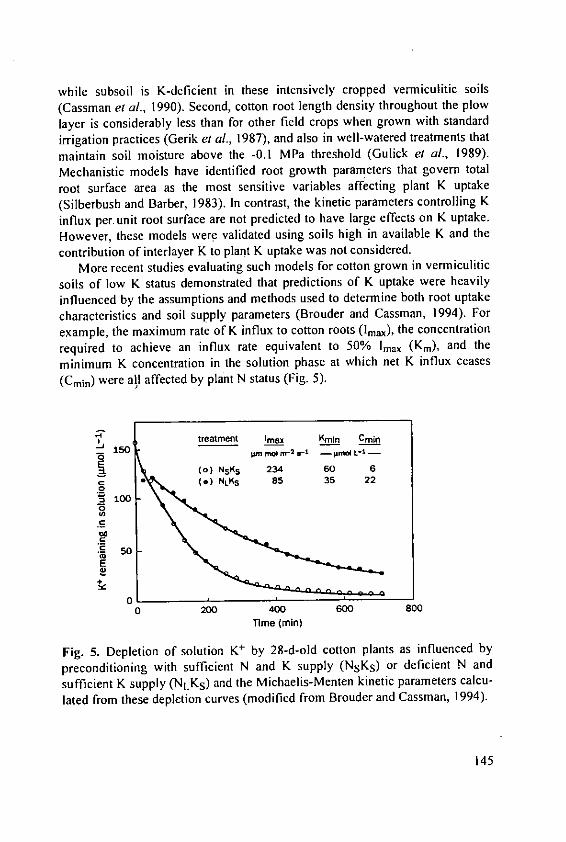
while subsoil is K-deficient in these intensively cropped vermiculitic soils(Cassman et al., 1990). Second, cotton root length density throughout the plowlayer is considerably less than for other field crops when grown with standard
irrigation practices (Gerik et al., 1987), and also in well-watered treatments thatmaintain soil moisture above the -0.1 MPa threshold (Gulick et al., 1989).
Mechanistic models have identified root growth parameters that govern total
root surface area as the most sensitive variables affecting plant K uptake
(Silberbush and Barber, 1983). In contrast, the kinetic parameters controlling K
influx per unit root surface are not predicted to have large effects on K uptake.
However, these models were validated using soils high in available K and the
contribution of interlayer K to plant K uptake was not considered.More recent studies evaluating such models for cotton grown in vermiculitic
soils of low K status demonstrated that predictions of K uptake were heavily
influenced by the assumptions and methods used to determine both root uptake
characteristics and soil supply parameters (Brouder and Cassman, 1994). For
example, the maximum rate of K influx to cotton roots (Im.), the concentration
required to achieve an influx rate equivalent to 50% lmax (Km), and the
minimum K concentration in the solution phase at which net K influx ceases
(Cmin) were all affected by plant N status (Fig. 5).
-z treatment Imax Kmin Cmin
-f 150lflnm nr 1 -- l -
(o) NSKS 234 60 6
(.) NLKs 85 35 22
._5.a 50-0
0 200 400 600 800
Time (mnin)
Fig. 5. Depletion of solution K' by 28-d-old cotton plants as influenced bypreconditioning with sufficient N and K supply (NsKs) or deficient N and
sufficient K supply (N,,Ks) and the Michaelis-Menten kinetic parameters calcu-
lated from these depletion curves (modified from Brooder and Cassman, 1994).
W5
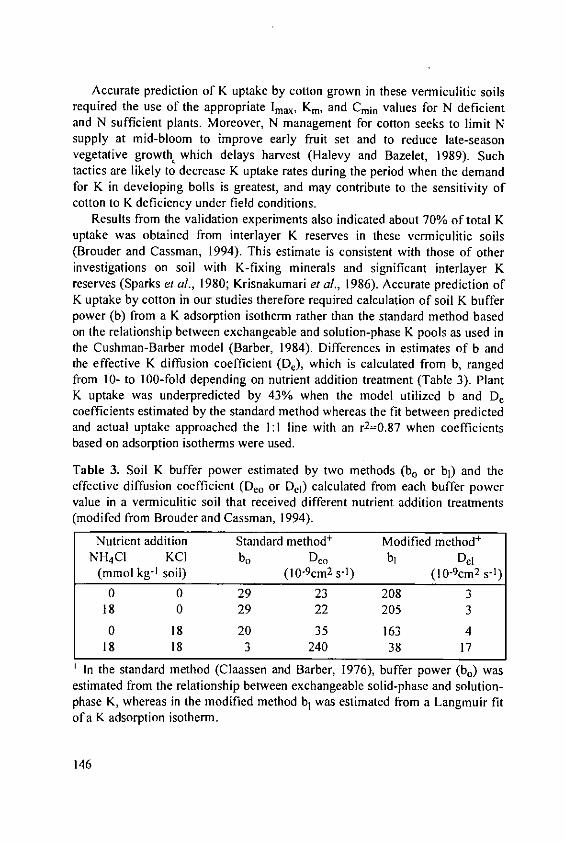
Accurate prediction of K uptake by cotton grown in these vermiculitic soilsrequired the use of the appropriate I.., Kin, and Cmin values for N deficientand N sufficient plants. Moreover, N management for cotton seeks to limit Nsupply at mid-bloom to improve early fruit set and to reduce late-seasonvegetative growth which delays harvest (Halevy and Bazelet, 1989). Suchtactics are likely to decrease K uptake rates during the period when the demandfor K in developing bolls is greatest, and may contribute to the sensitivity ofcotton to K deficiency under field conditions.
Results from the validation experiments also indicated about 70% of total Kuptake was obtained from interlayer K reserves in these vermiculitic soils(Brouder and Cassman, 1994). This estimate is consistent with those of otherinvestigations on soil with K-fixing minerals and significant interlayer Kreserves (Sparks el al., 1980; Krisnakumari et al., 1986). Accurate prediction ofK uptake by cotton in our studies therefore required calculation of soil K bufferpower (b) from a K adsorption isotherm rather than the standard method basedon the relationship between exchangeable and solution-phase K pools as used inthe Cushman-Barber model (Barber, 1984). Differences in estimates of b andthe effective K diffusion coefficient (D,), which is calculated from b, rangedfrom 10- to 100-fold depending on nutrient addition treatment (Table 3). PlantK uptake was underpredicted by 43% when the model utilized b and D,coefficients estimated by the standard method whereas the fit between predictedand actual uptake approached the 1:1 line with an r2=0.87 when coefficientsbased on adsorption isotherms were used.
Table 3. Soil K buffer power estimated by two methods (b. or bl) and theeffective diffusion coefficient (Deo or Del) calculated from each buffer powervalue in a vermiculitic soil that received different nutrient addition treatments(modifed from Brouder and Cassman, 1994).
Nutrient addition Standard method' Modified method'NH 4CI KCI b, Deo b Del
(mmol kg-1 soil) (10- 9cm 2 s- 1) (I 0-9cm 2 s- 1)
0 0 29 23 208 318 0 29 22 205 3
0 18 20 35 163 418 18 3 240 38 17
+ In the standard method (Claassen and Barber, 1976), buffer power (b0 ) was
estimated from the relationship between exchangeable solid-phase and solution-phase K, whereas in the modified method bi was estimated from a Langmuir fitof a K adsorption isotherm.
146

Relevance to intensive lowland rice systems
Water regime and soil K supply
Soils with vermiculite, illite, and other K-fixing minerals are found in thedeltas, flood plains, and inland valleys of Asia where lowland rice is the
dominant food crop. Such soils are common in major rice-growing areas of
Central Luzon in the Philippines, the Mekong Delta of Vietnam, the Gangeticplain of India and Nepal, and the inland valleys of Southern and Central China.
Although it is often stated that K availability increases in flooded soil from
reduction of Fe±3 to Fe+2 , and exchange of the more soluble Fe+2 for K+
(Ponnamperuma, 1972), results from our studies with vermiculitic soils suggestthat plant-available K would decrease after flooding of dry soil. This decreasewould be most pronounced with greater soil drying in the fallow period and
after incorporation of fertilizer K--which raises the issue of when to take soilsamples for testing in lowland rice systems.
In fact, the soil moisture regime of lowland rice paddies is characterized bytremendous variation, from submergence during rice cropping to drying in the
fallow periods between crop cycles. Although the effects of such largefluctuations in soil moisture on P availability have received attention (Sah andMikkelsen, 1986), the influence on K availability in lowland rice soils has not.It is clear, however, that soil moisture status has a large influence on K fixation
based on the results from an initial study of several paddy soils from CentralLuzon in the Philippines. For example, in the G-4 soil collected from a farmer'sfield, 45% of added K was fixed when soil was equilibrated under saturated
conditions versus 70% after one wetting and drying cycle (Fig. 6). In the PRRIsoil with moderate K fixation, the proportion of added K that was fixed
increased from 15 to 45% in saturated versus wet/dry equilibrations.Water regime is even more dynamic in rice-wheat systems practiced on
more than 10 million ha in the Gangetic Plain of the Indian sub-continent. Rice
is transplanted after puddling in flooded soil and soil is kept flooded byirrigation during the summer season. Soil dries after rice harvest, fields are
plowed, and wheat (Triticum aestivum L.) is grown in the winter season onrainfall and supplemental irrigation. In soil from a long-term experiment with a
rice-wheat rotation in the Tarai Plain of Southern Nepal, the proportion ofadded K that was fixed ranged from 46 to 56% in a wet/dry equilibration, andfixation was linear with addition rates up to 25 mmol K kg- 1 soil (Regmi, 1994).The greatest fixation (56%) and lowest extractable K occurred in soil from
treatments that received the highest rates of fertilizer-K input (75 kg K ha-1-yrsince 1978). In contrast, fixation was lowest (46%) and extractable K highest is
the control treatment without nutrient inputs. Because all straw is removed in
147
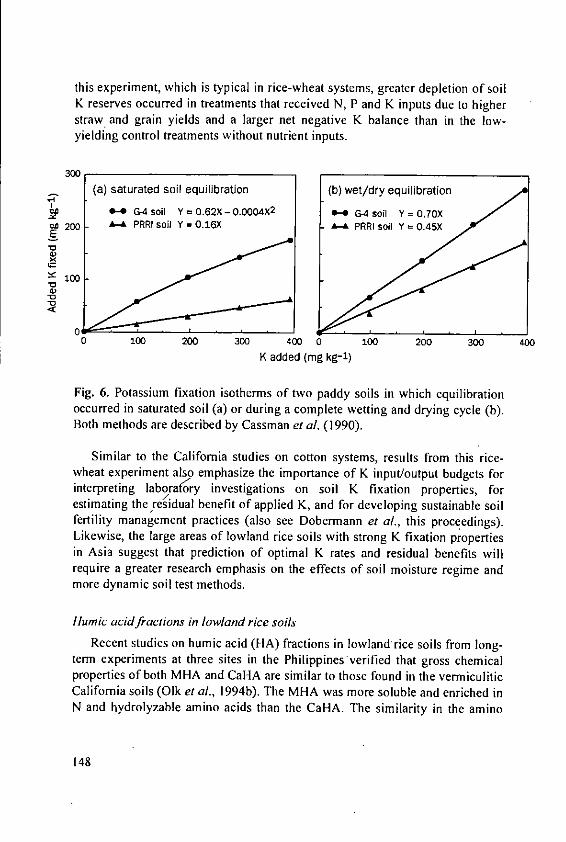
this experiment, which is typical in rice-wheat systems, greater depletion of soilK reserves occurred in treatments that received N, P and K inputs due to higherstraw and grain yields and a larger net negative K balance than in the low-yielding control treatments without nutrient inputs.
300(a) saturated soil equilibration (b) wet/dry equilibration
e- G-4 soil Y = 0.62X - 0.0004X2 GA4 G-4 soil Y = O.OXE 200 A PRRI soil Y = 0.16X A-& PRn soil Y=.45X
E
*0
0 100 200 300 400 0 100 200 300 400
K added (mg kg-1)
Fig. 6. Potassium fixation isotherms of two paddy soils in which equilibrationoccurred in saturated soil (a) or during a complete wetting and drying cycle (b).Both methods are described by Cassman et al. (1990).
Similar to the California studies on cotton systems, results from this rice-wheat experiment also emphasize the importance of K input/output budgets forinterpreting laboratory investigations on soil K fixation properties, forestimating the residual benefit of applied K, and for developing sustainable soilfertility management practices (also see Dobermann et al., this proceedings).Likewise, the large areas of lowland rice soils with strong K fixation propertiesin Asia suggest that prediction of optimal K rates and residual benefits willrequire a greater research emphasis on the effects of soil moisture regime andmore dynamic soil test methods.
Humic acid fractions in lowland rice soils
Recent studies on humic acid (HA) fractions in lowland rice soils from long-term experiments at three sites in the Philippinesverified that gross chemicalproperties of both MHA and CaHA are similar to those found in the vermiculiticCalifornia soils (Ok et al., 1994b). The MHA was more soluble and enriched inN and hydrolyzable amino acids than the CalA. The similarity in the amino
148

acid composition between comparable HA fractions in the lowland rice soilsand the California soils was remarkable with a tight correlation between themolar percentage of each amino acid in the MHA and CaHA from these verydifferent soils (r=0.94-0.96). In the lowland rice soils, the MHA was alsoyounger than CaHA although mean C residence time in both HA fractions wasless than 50 years. These ages indicate the MHA fractions in both the rice andCalifornia soils are of similar age while the CaHA fraction in the California soilis much older than in lowland rice soils-perhaps due to higher temperatures andfaster turnover rates in the tropics than in the temperate Mediterranean climateof California.
Although effects of MHA and CaHA on soil K availability in paddy soilshave not been examined, the similarity in gross chemical properties of each HAfraction in both the lowland rice and California cotton soils suggests similareffects on K fixation. In paddy soils, the MHA fraction represents a relativelylarge pool of soil organic matter (SOM). In soils from the three different long-term experiments on intensive rice systems, the MHA represented 5-14% oftotal soil C and was sensitive to recent crop management practices (unpublisheddata). At two of the three sites, for example, soil organic C and total N contentwere about 10% higher in fertilizer treatments with balanced inputs of N, P, andK compared with soil from the unfertilized control treatments. In contrast, theincrease in MHA with balanced NPK inputs was 30% at one site and 60% at theother indicating that small changes in SOM content due to recent cropmanagement can result in relatively large changes in the size of the MHA pool.The actual increase in MHA content ranged from 0.6 to 1.2 g MHA kg-' soil.While the size of this increase is less than the MHA addition rates in the Kfixation studies with vermiculitic California soils (Table 2), they are of sufficientmagnitude to cause a measurable decrease in fixation of added K and increasein extractable K in a soil with strong K fixation character--assuming the activityof MHA in the rice soils is comparable to MHA in the California soils.
Root traits and soil K supply parameters
Like most cereals, the rice plant has a fibrous root system with profuse deve-lopment in the topsoil layer where nutrient availability is greatest. We measuredroot length density (RLD) of two rice cultivars at heading in the long-termexperiments at the IRRI Research Farm and the Philippine Rice Research Institutein Central Luzon in the 1992 dry season. Mean RLD was 6.7, 2.8, and 0.9 cm cm-3
at 0-10, 10-20, and 20-30 cm depth, respectively (unpublished data). There waslittle difference in RLD between treatments without nutrient inputs and those withbalanced N, P, and K inputs, although aboveground biomass and grain yield were
149
two- to three-fold greater with balanced fertilization. The root/shoot biomass ratioincreased with decreasing nutrient supply, particularly for N. In all treatments,the measured RLD was greater than reported values for other cereal crops (Gerikel al., 1987), and much greater than for cotton (Brouder and Cassman, 1990).
Root development and exploitation of K in subsoil, however, may be limitedby 02 diffusion to lateral rice roots growing in submerged soil. Armstrong andBeckett (1987) estimated that apical root tissue in rice would become anoxicwhen root length exceeds 22-30 cm in an anoxic media. This restriction onaerated root length suggests that the rice plant is more dependent on nutrientuptake from the topsoil layer than other cereal crops grown in aerated, upland soilconditions and this may explain the relatively high RLD of rice in the puddledsoil layer.
Root traits controlling K uptake and soil supply parameters may also beimportant for rice. Rhizosphere acidification due to cation-anion uptake imbalanceand oxidation of iron by 02 leakage from rice roots may reduce cation diffusionrates to the root surface by reducing bicarbonate concentration which is thedominant counter anion in flooded rice soils (Begg et al., 1994). Iron-oxidecoatings that form on older rice roots in submerged soil might also influenceMichaelis-Menten uptake parameters although these coatings are not visible onmost of the fine, young roots that are active in nutrient acquisition. Teo et al.(1992) measured Michaelis-Mentin parameters for K uptake by rice and reportedlmax, Km, and Cmin values similar to those of maize (Barber, 1984). Also similarto maize, sensitivity analyses by Teo et al. (1992) found root uptake parameters tobe insensitive for predicting K uptake by rice in soils well supplied with K. Intheir analyses, however, the K buffer power was calculated by the standardmethod and was less than 1% of the b values of the vermiculitic California soilwithout K addition (Table 2).
The potential effects of suboptimal N supply on Michaelis-Menten kineticshave not been studied in rice but it is noteworthy that the rice crop is oftenpurposely kept N deficient to avoid lodging and disease problems, particularly inthe wet season. Because initial conditions have a large influence on such sensitivityanalyses (Brouder and Cassman, 1994), both Michaelis-Menten and soil supplyparameters may have greater influence on uptake from low K soils with strong Kfixation character than found by Teo et al. (1992) in soils with high K availability.Moreover, high root density, relatively high I.., and low Cmin of rice suggestthat rice would depend on non-exchangeable K reserves for much of its Ksupply in low-K soils with strong K fixation character.
150

Interactions between plant K status and disease
Many crops with deficient K supply become more susceptible to or lesstolerant of diseases of various kinds (Huber and Amy, 1986). For cotton, thiswas true for expression of foliar necrosis from verticillium wilt in California(Cassman et al., 1992), and for Alternaria leaf spot in Africa (Hillocks andChinodya, 1989). For rice, there are reports of decreased infection of by anumber of pathogens due to the addition of K. These diseases include brown
leaf spot caused by Cercospora oryzae and Helminthosporium spp., and blastcaused by Pyricualria oryzae as reviewed by Huber and Amy (1986). In mostcases, however, the mechanisms responsible for associations between diseaseand plant K status are poorly understood.
With intensified rice cropping and net negative K balance in many ricesystems, the occurrence of potassium-disease interactions, and nutrient balance-disease interactions in general, are likely to increase. For example, sheath blight
(Rhizoctonia solani) infection levels are typically greater in rice crops withdense canopies that receive high N rates (Mew, 1991). Recent on-farm studies
in the Red River Delta of northern Vietnam indicate, however, that severesheath blight infection can cause 25-50% yield loss in rice crops with poorcanopy development and deficient foliar N concentration. In these fields, the Kconcentration in flag leaves sampled at flowering was less than 1% at most ofthe farm sites, with values as low as 0.7%--indicating severe deficiency (Trung
et al., 1995). Whether the unusual severity of sheath blight in N deficientcanopies is related to plant K deficiency remains to be determined.
Summary and conclusions
A research approach that seeks to understand the short- and longer-term crop
response to applied K was illustrated by recent studies of cotton-based cropping
systems on vermiculitic soils in California. This approach begins with careful
monitoring of K input/output balance, changes in soil properties that govern K
supply, crop eco-physiological responses above and belowground, and
interactions with disease to identify gaps in our understanding of processes
governing crop performance.Moisture regime, specific organic matter fractions, rooting pattern in the soil
profile, and K uptake kinetics as influenced by N supply were identified as keyfactors. It is now possible to begin development of user-friendly decision-
support models, and dynamic soil tests for improved K managementrecommendations.
151

We believe that a similar approach will be needed for improving Kmanagement of intensive rice systems given the need to increase average grainyields from 4.9 to 8.0 t ha- 1 within 30 years, and the prevalence of rice soilswith strong K fixation character in Asia. For rice, as with other crops, there hasbeen a large body of work on K equilibria and soil test methods to identify K-deficient soils. It can be argued that this approach has failed to achieve the goalof improved K management in farmers' fields because it does not attempt toexplain K uptake by the crop and the dynamic nature of soil K availabilityunder actual field conditions. We would argue that future research must have atighter focus on developing the capability to predict actual K uptake fromindigenous soil resources and applied K inputs, and the residual benefit and fateof added K that is not acquired by the crop in the season of application. There issome urgency in achieving these goals because present K management practicesindicate significant net negative K balances and exhaustion of soil K reserves in
* many of the most productive rice-growing domains of Asia, and we estimatethat rice K uptake requirements must increase from about 100 kg K ha- 1 foraverage yields of 4.9 t ha-1 today, to more 200 kg K ha-1 to achieve yields of 8.0t ha- 1 by 2020 (Dobermann et al., this proceedings).
Acknowledgements
The authors thank Ms. Evelyn Belleza for her excellent technical assistancein the humic acid extractions on rice soils, Ms. Marianne Samson for the dataanalysis of rice root distribution, and Mr. Nguyen Bao Ve for performing the Kfixation isotherms on the rice soils. We also thank Dr. Guy J.D. Kirk for histhorough review and comments on an earlier draft of this manuscript.
References
Armstrong, W. and Beckett, P.M. (1987): Internal aeration and the developmentof stelar anoxia in submerged roots. New Phytol. 105:221-245.
Barber, S.A. (1984): Soil nutrient bioavailability: a mechanistic approach. JohnWiley & Sons, New York.
Begg, C.B.M., Kirk, G.J.D., MacKenzie, A.F. and Neue, H.U. (1994): Root-induced iron oxidation and pH changes in the lowland rice rhizosphere. NewPhytol. 128 (in press).
Bennett, W.F. (1993): Nutrient deficiencies and toxicities in crop plants.American Phytopathological Society Press, St. Paul, Minnesota.
152

Bos, E., Vu, M.T., Levin, A. and Bulatao, R.A. (1992): World populationprojections, 1992-2993 Edition. John Hopkins University Press, Baltimore,Maryland.
Brouder, S.M. and Cassman, K.G. (1990): Root development of two cottoncultivars in relation to potassium uptake and plant growth in a vermiculiticsoil. Field Crops Res. 23: 187-203.
Brouder, S.M. and Cassman, K.G. (1994): Evaluation of a mechanistic model ofpotassium uptake by cotton in a vermiculitic soil. Soil Sci. Soc. Amer. J. 58:1174-1183.
Cassman, K.G. (1986): Soil, crop management, and plant factors whichinfluence cotton potassium nutrition on vermiculitic soils of the San JoaquinValley. J. Fert. Issues 3:38-45.
Cassman, K.G., Bryant, D.C. and Roberts, B.A. (1990): Comparison of soil testmethods for predicting cotton response to soil and fertilizer potassium onpotassium fixing soils. Commun. Soil Sci. Plant Anal. 21:1727-1743.
Cassman, K.G., Kerby, T.A. Roberts, B.A., Bryant, D.C. and Brouder, S.M.(1989a): Differential response of two cotton cultivars to fertilizer and soilpotassium. Agron. J. 81:870-876.
Cassman, K.G. and Pingali, P.L. (1995): Extrapolating trends from long-termexperiments to farmers fields: the case of irrigated rice systems in Asia. pp.63-84. In: V. Barnett, R. Payne, and R. Steiner (eds.), AgriculturalSustainability in Economic, Environmental, and Statistical Terms. JohnWiley & Sons, Ltd., London, U.K.
Cassman, K.G., Roberts, B.A. and Bryant, D.C. (1992): Cotton response toresidual fertilizer potassium as influenced by organic matter and sodium in avermiculitic soil. Soil Sci. Soc. Am. J. 56:823-830.
Cassman, K.G., Roberts, D.A., Kerby, T.A., Bryant, D.C. and Higashi, S.L.(1989b): Soil potassium balance and cumulative cotton response to annualpotassium additions on a vermiculitic soil. Soil Sci. Soc. Am. J. 53:805-812.
Claassen, N. and Barber, S.A. (1976): Simulation model for nutrient uptakefrom soil by a growing plant root system. Agron. J. 68:961-964.
Dahnke, W.C. and Olson, R.A. (1990): Soil test correlation, calibration, andrecommendation. pp. 45-71. In: R.L. Westerman (ed.), Soil Testing andPlant Analysis, Third Edition. Soil Science Society of America, Madison,Wisconsin.
Dobermann, A., Santa Cruz, P. and Cassman, K.G. (1995): Potassium balanceand soil potassium supplying power in intensive, irrigated rice ecosystems.In: Proceedings of the 24th International Colloquium of the InternationalPotash Institute, 21-24 February 1994, Chiang Mai University, Thailand.
153

Evangelou, V.P. and Blevins, R.L. (1985): Soil-solution phase interactions ofbasic cations in long-term tillage systems. Soil Sci. Soc. Am. J. 49:357-362.
Evangelou, V.P. and Blevins, R.L. (1988): Effect of long-term tillage systemsand nitrogen addition on potassium quantity intensity relationships. Soil Sci.Soc. Am. J. 52:1047-1054.
Gerik, T.J., Morrison, J.E. and Chichester, F.W. (1987): Effects of controlled-traffic on soil physical properties and crop rooting. Agron. J. 79:434-438.
Goulding, K.W.T. and Talibudeen, 0. (1984): Thermodynamics of K-Caexchange in soils. 1. Effects of potassium and organic matter residues in soilsfrom the Broadbalk and Saxmundham Rotation experiments. J. Soil Sci. 35:397-408.
Grimes, D.W., Miller, R.J. and Wiley, P.L. (1975): Cotton and corn rootdevelopment in two field soils of different strength characteristics. Agron. J.67: 519-523.
Gulick, S.H., Cassman, K.G. and Grattan, S.R. (1989) Exploitation of soilpotassium in layered profiles by root systems of cotton and barley. Soil Sci.Soc. Am. J. 53:146-153.
Hafez, A.A.R., Stout, P.R. and De Vay, J.E. (1975): Potassium uptake by cottonin relation to verticillium wilt. Agron. J. 67:359-361.
Halevy, J. and Bazelet, M. (1989): Cotton: Fertilizing for high yield and quality.IPI Bull. No. 2. 2nd ed. International Potash Inst., Bern, Switzerland.
Hillocks, R.J. and Chinodya, R. (199.): The relationship between Altemaria leafspot and potassium deficiency causing premature defoliation of cotton. PlantPathol. 38:502-508.
Huber, D.M. and Amy, D.C. (1985): Interactions of potassium with plantdisease. pp. 467-488. In: R.D. Munson (ed.), Potassium in Agriculture.American Society of Agronomy, Madison, Wisconsin.
IRRI (1993): Rice Research in a time of change: IRRI's Medium-Term Plan for1994-1998. International Rice Research Institute, Los Bafios, Philippines.
Karathanasis, A.D. and Wells, K.L. (1990): Conservation tillage effects on thepotassium status of some Kentucky soils. Soil Sci. Soc. Am. J. 54:800-806.
Krishnakumari, M., Khera, M.S. and Ghosh, A.B. (1984): Studies on potassiumrelease in an Inceptisol soil (Holambi series) at the minimum level ofexchangeable potassium. Plant Soil 79: 3-10.
McLean, E.O. and Watson, M.E. (1985): Soil measurements of plant-availablepotassium. pp. 277-308. In: R.D. Munson (ed.), Potassium in Agriculture.American Society of Agronomy, Madison, Wisconsin.
Mew, T. (1991): Disease management in rice. pp. 279-299. In: D. Pimentel (ed)CRC Handbook of Pest Management in Agriculture, Second Edition, Vol.111. CR Press Inc., Boston.
154

Olk, D.C. (1993): Effects of soil moisture and organic matter on potassiumavailability in a calcareous vermiculitic soil. Ph.D. Thesis in Soil Science.Dept. of Agronomy and Range Science, University of California, Davis,California.
Olk, D.C. and Cassman, K.G. (1993): Reduction of potassium fixation byorganic matter in vermiculitic soils. pp. 307-315. In: K. Mulongoy and R.Merckx (eds.) The dynamics of soil organic matter in relation to thesustainability of tropical agriculture. J.W. Wiley & Sons, London.
Olk, D.C., Cassman, K.G. and Fan, T.W.M. (1994a): Characterization of twohumic acid fractions from a calcareous vermiculitic soil: Implications for thehumification process. Geoderma 65: 195-208.
Ok, D.C. and Cassman, K.G. (1995): Characteristics of two chemicallyextracted humic acid fractions in relation to nutrient availability. In: E.T.Craswell, G.J. Blair, and R.D.B. Lefroy (eds). Soil Organic Matter forSustainable Agriculture in Asia. Proceedings of a workshop, UbonRatchathani, Thailand, 24-26 August 1994. Australian Center forInternational Agricultural Research Proceedings 56, Canberra, Australia.
Olk, D.C., Cassman, K.G. and Carlson, R.M. (1995): Kinetics of potassiumfixation in vermiculitic soil under different moisture regimes. Soil Sci. Soc.Amer. J. 59: 423-429.
Olk, D.C., Cassman, K.G., Randall, E.W. and Kinchesh, P. (1994b): Chemicalproperties of two humic acid fractions in tropical lowland rice soils.Proceedings of the Third Symposium on Biogeochemistry of Wetlands, 26-29 June 1994, Orlando, Florida (Abstract).
Padilla, F.G. (1986): Patterns of potassium acquisition and distribution in field-grown cotton on potassium deficient soils. M.Sc. thesis. Dept. Agronomyand Range Sci., Univ. California, Davis.
Peck, T.R. and Soltanpour, P.N. (1990): The principles of soil testing. pp. 1-9.In: R.L. Westerman (ed.), Soil Testing and Plant Analysis, Third Edition.Soil Science Society of America, Madison, Wisconsin.
Ponnamperuma, F.N. (1972): The chemistry of submerged soils. Adv. Agron.24: 29-96.
Regmi, A.P. (1994): Long-term effects of organic amendment and mineralfertilizers on soil fertility in a rice-wheat cropping system in Nepal. M.Sc.Thesis in Soil Science. Department of Soil Science, University of thePhilippines, Los Bafilos, Philippines.
Reitemier, R.F. (1951): Soil potassium. Adv. Agron. 3:113-164.Sah, R.N. and Mikkelsen, D.S. (1986): Sorption and bioavailability of
phosphorus during the drainage period of flooded-drained soils. Plant Soil92: 265-278.
155

Sparks, D.L., Martens, D.C. and Zehizny, L.W. (1980): Plant uptake andleaching of applied and indigenous potassium in Dotham soils. Agron. J.72:551-555.
Silberbush, M. and Barber, S.A. (1983): Sensitivity analysis of parameters usedin simulating K uptake with a mechanistic mathematical model. Agron J.75:851-854.
Taylor, H.M. and Klepper, B. (1974): Water relations of cotton. 1. Root growthand water use as related to top growth and soil water content. Agron. J.66:584-588.
Teo, Y.H., Beyrouty, C.A. and Gbur, E.E. (1992): Evaluating a model forpredicting nutrient uptake by rice during vegetative growth. Agron. J. 84:1064-1070.
Trung, H.A., Vien, N.V., Thanh, D.T., Thuy, N.T., Thanh, H.M., Cassman,K.G., Mew, T.W., Teng, P.S. and Cu, R.M. (1995): Relationships betweenrice intensification, plant nutrition, and diseases in the Red River Delta. pp.201-210. In: Proceedings of the IRRI-Vietnam Rice Research Conference,4-7 May 1994, Hanoi. International Rice Research Institute, Los Bafilos,Philippines.
Weir, B.L., Kerby, T.A., Roberts, B.A., Mikkelsen, D.S. and Garber, R.H.(1986): Potassium deficiency syndrome of cotton. Calif. Agric. 40(5-6): 13-14.
Witt, C.T. de (1992): Resource use efficiency in agriculture. AgriculturalSystems 40: 125-151.
156
Soil-K Status and Fertility Constraints for SoybeanProduction in the Chiang Mai Valley
P. Wivutvongvana, S. Jiraporneharoen and C. KorsamphanFaculty of Agriculture, Chiang Mai University, Thailand
Abstract
A systematic investigation involving several steps was carried out on LowHumic Gley soils to evaluate soil-K status and fertility constraints for soybeanproduction in the Chiang Mai Valley since late 1993. The preliminary survey ofthe major soybean growing area in the valley using 100 sampling sites,indicated a relatively high soil-K status both in terms of exchangeable K and K-supplying potential. A series of pot experiments using soil from 20 selected sitesvarying in soil-K status consistently showed non-significant responses ofsoybean to applied potash fertilizer. Most of the soils had an initial concentrationof exchangeable K higher than 50 ppm whereas the average level of slowlyavailable K was greater than 400 ppm. Changes in soil-K status after croppingwith and without added-K treatments are also discussed.
During the course of these investigations, soybean plants in all the potexperiments consistently showed a typical deficiency symptom of Mg. Thepercent soil-Mg saturation in the 20 soils was relatively low with an average of4.21%. Each increment of Mg application (0, 0.5, 1.0, and 2.0 me Mg/100 g)consistently increased leaf-Mg concentrations and grain yields. Except for Mg,other nutrient contents, including N, P, K, Ca, Fe, Mn, Zn, Cu, and B appearedto be in a normal range for leaves.
Results from the experiments also showed a striking antagonistic effect of Kon Mg uptake by soybean plants. The applied-K fertilizer tended to decreasegrain yield, but not significantly whilst leaf-Mg concentrations weresignificantly decreased. The present research evidence reflects an importantaspect of the balanced fertilization for soybean in the Chiang Mai Valley.
I. Introduction
Soybean is one of the most common crops grown after lowland paddy ricein the Chiang Mai Valley, Upper Northern Thailand, especially on Low HumicGley soils in which Typic Tropaqualfs and Typic Paleaquults are dominated(Chiang Mai University, 1980). Surface soils vary from sandy loam to silt loam,and silty clay loam to clay and are generally low to moderately low in CEC, pH,organic matter, available P and base saturation, the K status is moderately lowto high.
157
In practice, Thai farmers have been using the most commonly available andtherefore, familiar fertilizer, 16-20-0, for most crops particularly for rice andfield crops including soybean (Jirapomcharoen, 1993). This fertilizer isrelatively cheap and usually allocated by the Ministry of Agriculture andCooperatives. Due to the uncertainty in crop response and fertilizer price, theuse of potash is less extensive with a low rate of application. Other macro-micronutrient soil amendments are used in very limited amounts because mostfarmers are unacquainted with them and cannot afford them.
Yields of soybean grown in the Chiang Mai Valley are very low, averagingfrom 1.1-1.3 t/ha (Rerkasem and Rerkasem, 1988) which is much lower than theworld average (Cooke, 1985). Among the macronutrients, much evidence hasindicated that nitrogen and phosphorus are not sufficient for soybean productionon these soils. There is still doubt about the response of soybean to potashwhich is not consistent and depends upon soil-K status and managementpractices. Working in the Chiang Mai Valley, Rerkasem and Rerkasem (1988)pointed out that some other macro-micronutrients might be important limitingfactors for soybean production.
To increase and sustain soybean production through balanced fertilization, itis important that soil fertility constraints be first identified. This is crucial forlocal farmers with limited cash for inputs and investment. Since late 1993, theInternational Potash Institute jointly with Chiang Mai University have beencarrying out a systematic study to investigate soil-K status and fertilityconstraints for soybean production in the Chiang Mai Valley. This paperpresents the work to date.
2. General methodology
The evaluation of soil-K status and fertility constraints for soybeanproduction in the present study was based on analytical data for soils and plantsas well as plant growth performance and grain yield responses. Availability ofsoil-K was determined by both 1.0 N NH 4OAc, pH 7.0 and boiling 1.0 N HN0 3extractions (Knudsen el al., 1982). The former fraction was designated as"exchangeable K" whereas the latter, minus the former fraction, will bearbitrarily denoted as "slowly available K" throughout this paper. The criticalconcentration range for each nutrient in soybean plants was taken from the datareported by Small and Ohlrogge (1973).
Due to the large number of locations, careful soil sampling, accompanied bypot experiments were carried out for the study. With a limited budget and timeavailable, this method has proved to be effective and useful (Dowdle andPortch, 1990).
158

The present study involved several steps, so for simplicity in the discussionand presentation, a brief description of materials and methods together withresults will be presented for each step.
3. Survey of soil-K status in Chiang Mai Valley
3.1. Materials and methods
The major soybean growing areas in the Chiang Mai Valley are on LowHumic Gleys including two major soil groups, Tropaqualfs and Paleaquults, anda preliminary survey of their soil-K status was carried out. With the aid of adetailed reconnaisance soil map (Ministry of Agriculture and Cooperatives,1976) one hundred sites were located and field surveys made. Representativesurface soil samples (0-15 cm depth) from an area of 20m x 20m were taken ateach site during November-December 1993 before soybean planting. The 100village sites were distributed evenly in the four districts (Mae Taeng, San Sai,Hang Dong and San Pa Tong), 25 villages per district in the survey (Fig. 1).Information regarding soybean cultural practices and production inputs wererecorded periodically at each site.
3.2. Results and discussion
The range in soil-K status as extracted by 1.0 N NH 4OAc, pH 7.0(exchangeable K) and 1.0 N HNO3 minus 1.0 N NH 4OAc (slowly available K)for the 100 sampling sites is presented in Table 1. The results showed that 82%of the sites had exchangeable K higher than 60 ppm and the remaining 18% wasin the range of 30-60 ppm. For slowly available K, 88% of the sites hadconcentrations higher than 400 ppm of which 50% had more than 600 ppmslowly available K (Table 1).
Table I. Soil-K status of 100 sampling sites distributed in the Chiang MaiValley.
Exchangeable K (ppm)1 Slowly available K (ppm) 2
Range No. of sites Range No. of sites
30- 60 18 200-400 1261- 90 49 401-600 3891-120 22 601-800 45
>120 11 >800 5
1.0 N NH 4 OAc, pH 7.0 extraction.2 1.0 N HNO 3 minus 1.0 N NH 4OAc, pH 7.0 extraction.
159
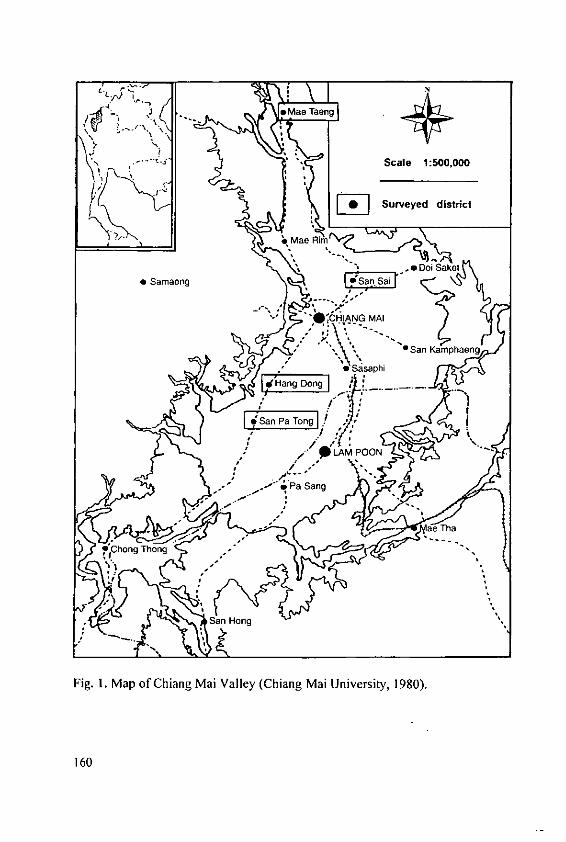
9*Mae Taee
7 ,'
...... -S- Scale 1:500,000
Surveyed district
, Mae' i m
e. Doi Sakete Samaeng
I -
CHIANG MAI
*San Kamphaeng
* Sasaphi
ofHaDong ,
; San Pa Tong
•" . • a Sang
*Chong Thong
Fig. I. Map of Chiang Mai Valley (Chiang Mai University, 1980).
160

For soybean grown on Low Humic Gleys in Thailand, the critical level ofexchangeable K is reported to be 55 ppm (Phetchawee et at., 1985), whilstGreenland (1985) set a general limit at 78 ppm K (0.2 me/100 g) for many soilsand crops. Thus, it appears that soils in the Chiang Mai Valley in the presentinvestigation were relatively high in soil-K availability in that 82% had morethan 60 ppm exchangeable K. In addition, 50% of the sites had slowly availableK higher than 600 ppm which is a relatively high K-supplying potential (Xieand Du, 1988). When an attempt was made to correlate soil-K status withsoybean grain yields under farmer practices, no significant relationship wasobtained. The yields recorded varied widely ranging from less than 0.5 t/ha tomore than 2.5 t/ha. Such differences in grain yield were mainly due to a widevariability in growing conditions and cultural practices, particularly, waterstress, plant spacing/population, diseases, insect pest and weed infestation.Nevertheless, it is worthwhile to investigate whether these soils are sufficient insoil-K or whether they have any other fertility constraint for soybeanproduction.
4. Potash fertilizer response and fertility constraint
4.1. Materials and methods
Based on chemical soil tests of the 100 sampling sites in the precedingsection, 20 of them (five per each of the four districts) covering a considerablerange of soil-K status were selected for a soil-pot experiment conducted in anopen field at Chiang Mai University. The aim of the study was to examinesoybean response to soil-K status and potash fertilizer application. Otherpossible soil nutrients that might limit yield were also tested.
Surface soil (0-15 cm depth) was collected in December 1993-January 1994from each of the 20m x 20m areas of the 20 locations sampled in thepreliminary survey. After thorough mixing, 12 kg of each soil was potted into aclay pot; there were 12 pots per each location. Half of them (6 pots) werefertilized with KCI at a rate of 2.0 g/pot, while the other half were not treated.The pots were arranged in a randomized complete block design for each soil.Before soybean planting, an application of 16-20-0 fertilizer, 2.0 g/pot wasapplied to all pots. Soybeans (var. CM 60) were planted and harvested duringFebruary-June 1994. Some characteristics of each soil sample are given in Table2.
161

Table 2. Characteristics of the 20 selected soils used for the soil-pot experiment.
Soil pH' CEC 2 % O.M. 3 p4 Extractable (ppm) 5 SoilNo. (me/100 g) (ppm) K Ca Mg texture6
t 5.7 5.6 1.3 14.5 67 500 35 Sandy loam2 5.8 5.5 1.3 19.0 47 500 38 Sandy loam3 5.5 12.5 1.4 9.0 51 875 38 Sandy loam4 5.7 12.4 2.0 3.5 61 1000 75 Loam5 5.7 11.3 1.0 10.0 56 750 44 Sandy loam6 5.4 13.8 2.5 8.0 87 1125 54 Loam7 6.3 10.2 2.1 14.0 72 750 76 Sandy clay loam8 5.7 8.6 1.8 19.0 56 750 73 Loam9 6.3 13.5 2.1 15.0 51 1125 84 Loam
10 5.7 26.9 3.2 5.5 67 1500 131 Silt loamIt 5.0 24.4 3.7 9.5 102 625 78 Clay loam12 5.4 25.8 3.8 5.5 143 1125 188 Clay loam13 6.0 28.8 2.8 2.5 61 1500 150 Clay loam14 5.0 30.2 2.8 6.0 92 1000 97 Silt loam15 7.2 18.0 1.9 14.5 72 750 100 Sandy loam16 5.6 30.2 3.4 3.5 92 1375 125 Clay loam17 5.2 16.3 2.1 9.5 72 625 50 LoamIS 5.0 31.8 3.2 5.0 97 1500 138 Clay19 5.5 34.7 2.8 9.5 128 1625 150 Clay20 5.7 36.8 4.0 5.5 143 2375 138 Clay
I Soil: H20 - 1:1 4 Bray I1 method2 Ammonium acetate method 5 1.0 N NH 4OAc, pH 7.0 extraction3 Walkley & Black method 6 Hydrometer method
4.2. Results and discussion
4.2. I. Soil-K and fertilizer response
Soybean grain yields with (KI) and without (K0) potash fertilizerapplication are presented in Table 3. The Table also shows nutrient compositionin the third trifoliate leaves taken during the flowering stage prior to pod set.Grain yields with and without K fertilizer were not much different. The effect ofadded K was inconsistent and in many soils, the yields tended to be lower withadded-K. Average grain yields for KO and KI treatments were 14.9 and 15.1g/pot, respectively. No significant relationships were observed between grainyields and nutrient contents in the leaves. However, a slight increase in leafpotassium was noted with KI treatment for all soils. On average, potassiumconcentrations in soybean leaves for KO and KI treated pots were 1.97 and2.13%, respectively (Table 3).
162
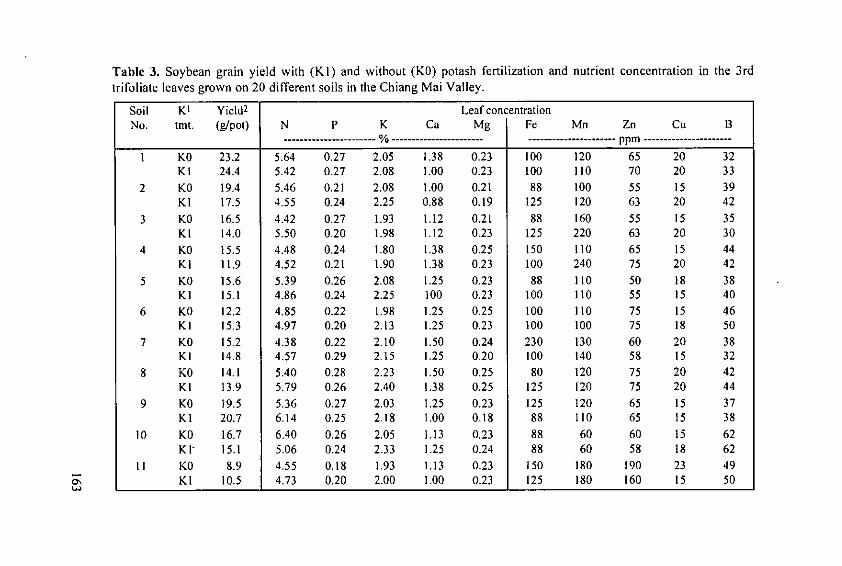
Table 3. Soybean grain yield with (KI) and without (KO) potash fertilization and nutrient concentration in the 3rdtrifoliate leaves grown on 20 different soils in the Chiang Mai Valley.
Soil K1 Yield2 Leaf concentrationNo. tnt. (g/pot) N P K Ca Mg Fe Mn Zn Cu B
----------------------- % ...................... ppm ........-------------
I KO 23.2 5.64 0.27 2.05 1.38 0.23 100 120 65 20 32KI 24.4 5.42 0.27 2.08 1.00 0.23 100 110 70 20 33
2 KO 19.4 5.46 0.21 2.08 1.00 0.21 88 100 55 15 39KI 17.5 4.55 0.24 2.25 0.88 0.19 125 120 63 20 42
3 K0 16.5 4.42 0.27 1.93 1.12 0.21 88 160 55 15 35KI 14.0 5.50 0.20 1.98 1.12 0.23 125 220 63 20 30
4 K0 15.5 4.48 0.24 1.80 1.38 0.25 150 110 65 15 44KI 11.9 4.52 0.21 1.90 1.38 0.23 100 240 75 20 42
5 KO 15.6 5.39 0.26 2.08 1.25 0.23 88 110 50 18 38KI 15.1 4.86 0.24 2.25 100 0.23 100 110 55 15 40
6 KO 12.2 4.85 0.22 1.98 1.25 0.25 100 110 75 15 46KI 15.3 4.97 0.20 2.13 1.25 0.23 100 100 75 18 50
7 KO 15.2 4.38 0.22 2.10 1.50 0.24 230 130 60 20 38KI 14.8 4.57 0.29 2.15 1.25 0.20 100 140 58 15 32
8 KO 14.1 5.40 0.28 2.23 1.50 0.25 80 120 75 20 42KI 13.9 5.79 0.26 2.40 1.38 0.25 125 120 75 20 44
9 K0 19.5 5.36 0.27 2.03 1.25 0.23 125 120 65 15 37KI 20.7 6.14 0.25 2.18 1.00 0.18 88 110 65 15 38
10 KO 16.7 6.40 0.26 2.05 1.13 0.23 88 60 60 15 62KP 15.1 5.06 0.24 2.33 1.25 0.24 88 60 58 18 62
II K0 8.9 4.55 0.18 1.93 1.13 0.23 150 180 190 23 49KI 10.5 4.73 0.20 2.00 1.00 0.23 125 180 160 15 50

Table 3. Continued.
Soil K1 Yield2 Leaf concentrationNo. tit. (g/pot) N P K Ca Mg Fe Mn Zn Cu B
% ----------------------- --------------- ppm -------------
II KO 8.9 4.55 0.18 1.93 1.13 0.23 150 180 190 23 49KI 10.5 4.73 0.20 2.00 1.00 0.23 125 180 160 15 50
12 KO 15.2 5.62 0.27 1.93 1.00 0.18 125 120 65 20 59KI 15.1 5.16 0.28 2.13 1.25 0.23 100 110 65 20 58
13 KO 17.4 5.51 0.27 1.50 1.25 0.23 63 60 55 15 60KI 19.2 4.46 0.25 1.80 1.13 0.23 88 60 55 20 57
14 KO 10.1 4.46 0.24 1.88 1.13 0.21 125 130 90 23 42KI 11.1 4.16 0.22 1.98 1.00 0.18 250 120 83 15 44
15 KO 14.5 5.00 0.37 1.83 1.25 0.25 100 80 50 20 54KI 15.5 4.94 0.28 2.45 1.00 0.23 100 70 50 18 54
16 KO 11.1 4.73 0.17 1.88 0.88 0.16 120 80 50 13 42KI 10.1 5.82 0.25 2.10 1.50 0.23 125 120 70 20 42
17 KO 13.3 4.65 0.22 1.95 1.00 0.20 100 130 80 20 41KI 13.3 4.38 0.22 2.18 1.00 0.18 100 140 70 20 42
18 KO 15.5 4.67 0.29 2.05 1.00 0.23 100 110 60 20 52K! 16.9 4.90 0.27 2.18 1.13 0.21 190 110 60 20 52
19 K0 13.4 4.85 0.26 1.98 1.00 0.19 125 80 60 20 50KI 10.1 4.60 0.27 2.00 1.13 0.20 230 100 70 18 51
20 KO 13.5 4.29 0.21 2.05 1.25 0.20 100 120 60 15 38K1 14.8 4.60 0.21 2.18 1.13 0.19 125 130 60 15 38
Average KO 14.9 5.01 0.25 1.97 1.18 0.22 112 112 69 18 45KI 15.1 4.96 0.24 2.13 1.14 0.22 124 124 70 18 45
KO : No K added; KI : 2.0 g/pot of KCI was added; tint: treatment2 Average of 6 pots, 2 plants/pot.

The results show that all the soils were relatively high in available K andthere were no positive responses from the potash fertilization. Except soil No. 2,which had 47 ppm K, the initial levels of exchangeable K for all soils werehigher than 50 ppm which appeared to be adequate for soybean production.This finding is similar to that reported by Phetchawee et al. (1985). They set acritical level of 55 ppm exchangeable K for soybean grown on Low HumicGleys in Thailand. Soil-K status before and after soybean cropping in eachtreated soil is presented in Table 4.
Table 4. Soil-K status of the 20 selected soils before and after soybean croppingwith (KI) and without (KO) potash fertilization.
Soil No. Exchangeable K (ppm)' Slowly available K (ppm) 2
Before After Before AfterKO KO K 1 KO KO KI
1 67 40 88 305 208 2082 47 45 83 375 295 2853 51 40 98 721 496 5224 61 38 63 459 426 4375 56 43 80 644 489 5446 87 60 85 349 264 3757 72 53 78 296 247 2748 56 43 63 464 437 4739 51 43 95 609 525 53310 67 63 100 733 693 68011 102 90 140 246 230 220
12 143 103 145 729 553 79113 81 68 105 699 664 64714 92 75 103 896 809 85915 72 48 60 432 436 48816 92 68 95 588 248 29717 72 65 113 558 275 23918 97 95 128 551 221 38419 128 98 155 656 498 49320 143 88 143 709 288 293
Average 82 63 101 551 415 452
1.0 N NH 4 OAc, pH 7.0 extraction2 1.0 N HNO 3 minus 1.0 N NH 4OAc, pH 7.0 extraction
165
Without potash application (KO), exchangeable K in each soil tended todecrease depending upon soil-K status (Table 4). However, with K-fertilizeradded (KI) the level of exchangeable K after harvest increased appreciably. Theaverage concentration was 101 ppm compared to initial value of 82 ppm.
For slowly available K in the KO treatment, K levels in all soils decreasednoticeably; average decline from 551 to 415 ppm K after cropping (Table 4).This showed that some fractions of the non-exchangeable K had been releasedto replenish the decrease in exchangeable K by crop removal. It is interesting tonote that when K was added (K I), slowly available K still tended to decrease inmost soils but still to a smaller extent compared with the KO treatment. This wasopposite to the result obtained with exchangeable K for which the concentrationwas increased appreciably upon fertilization. Thus it appears that most of theadded-K should be readily available to soybean plants and was mainly in theexchangeable form during the cropping period. Fixation of the applied-K bythese soils was unlikely upon cropping, however if it occurred, the rate offixation should be very slow.
4.2.2. Soil fertility constraint
It appears that K availability in all the soils investigated was sufficient forsoybean production. To determine whether any other plant nutrients werelimiting, all the nutrient contents in the leaves as presented in Table 3 werecarefully examined. Using the widely accepted critical values reported by Smalland Ohlrogge (1973), leaf concentrations for N, P, K, Ca, Fe, Mn, Zn, Cu and Bappeared to be in a normal range. For Mg, however, the concentrations insoybean leaves grown on the 20 selected soils ranged from 0.16 to 0.25% withan average of 0.22% Mg (Table 3) which was considerably below its criticallevel. A typical Mg deficiency symptom on plant leaves was also noted.Interveinal chlorosis first developed on the older trifoliates (lower leaves)approximately four weeks before flowering for most plants grown on thesesoils. The symptoms were more pronounced as the plants reached maturity. Theupper leaves, however, were much less affected.
The availability of soil Mg was evaluated in terms of its concentration inrelation to exchangeable K and Ca as well as cation exchange capacity (CEC)on an equivalent basis. Except soils No. 1-5, most of the soils had exchangeableMg higher than 0.42 me/100g with an averge of 0.78 me/100g before planting(Table 5). For many crops, the critical concentration was reported around 50ppm Mg (0.42 me/100g) (Doll and Lucas, 1973; Ling and Lu, 1990).
166
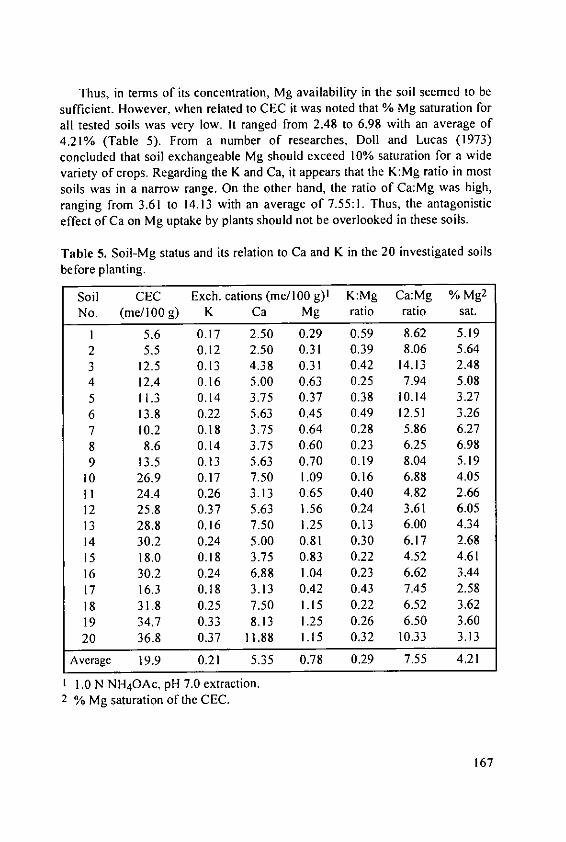
Thus, in terms of its concentration, Mg availability in the soil seemed to besufficient. However, when related to CEC it was noted that % Mg saturation forall tested soils was very low. It ranged from 2.48 to 6.98 with an average of4.21% (Table 5). From a number of researches, Doll and Lucas (1973)concluded that soil exchangeable Mg should exceed 10% saturation for a widevariety of crops. Regarding the K and Ca, it appears that the K:Mg ratio in mostsoils was in a narrow range. On the other hand, the ratio of Ca:Mg was high,ranging from 3.61 to 14.13 with an average of 7.55:1. Thus, the antagonisticeffect of Ca on Mg uptake by plants should not be overlooked in these soils.
Table 5. Soil-Mg status and its relation to Ca and K in the 20 investigated soilsbefore planting.
Soil CEC Exch. cations (me/100 g)] K:Mg Ca:Mg % Mg2
No. (me/100 g) K Ca Mg ratio ratio sat.
1 5.6 0.17 2.50 0.29 0.59 8.62 5.192 5.5 0.12 2.50 0.31 0.39 8.06 5.643 12.5 0.13 4.38 0.31 0.42 14.13 2.484 12.4 0.16 5.00 0.63 0.25 7.94 5.085 11.3 0.14 3.75 0.37 0.38 10.14 3.276 13.8 0.22 5.63 0.45 0.49 12.51 3.267 10.2 0.18 3.75 0.64 0.28 5.86 6.278 8.6 0.14 3.75 0.60 0.23 6.25 6.989 13.5 0.13 5.63 0.70 0.19 8.04 5.19
10 26.9 0.17 7.50 1.09 0.16 6.88 4.0511 24.4 0.26 3.13 0.65 0.40 4.82 2.6612 25.8 0.37 5.63 1.56 0.24 3.61 6.0513 28.8 0.16 7.50 1.25 0.13 6.00 4.3414 30.2 0.24 5.00 0.81 0.30 6.17 2.6815 18.0 0.18 3.75 0.83 0.22 4.52 4.6116 30.2 0.24 6.88 1.04 0.23 6.62 3.4417 16.3 0.18 3.13 0.42 0.43 7.45 2.5818 31.8 0.25 7.50 1.I5 0.22 6.52 3.6219 34.7 0.33 8.13 1.25 0.26 6.50 3.60
20 36.8 0.37 11.88 1.15 0.32 10.33 3.13
Average 19.9 0.21 5.35 0.78 0.29 7.55 4.21
1.0 N NH4 OAc, pH 7.0 extraction.2 % Mg saturation of the CEC.
167

Thus, it appears that besides N and P, which had been applied beforeplanting, Mg availability was another important limiting factor for soybeanproduction in most soils in the present investigation. To test this, further soilexperiments including Mg-fertilizer treatments were carried out subsequently.
5. Potassium-magnesium fertilizer experiments
5.1. Materials and methods
Two pot experiments were conducted concurrently to investigate soybeanresponses to soil-Mg status and fertilizer application. The first experimentinvolved the 20 soils used for K-fertilizer trials described in Section 4.1. Afterharvesting the soybeans in the K-fertilizer experiment, the six-pots for each KOand KI treatment were divided into two groups of three pots for Mg-fertilizerapplication (Mgl) and without Mg added (MgO). Magnesium was applied asMgCI 2 at 1.0 me per 100 g air-dried soil for each pot. In addition, the K I treatedpots had 2.0 g/pot of KCI while the KO pots were left untreated for the presentK-Mg fertilizer study.
To test more levels of Mg, one soil (Soil No. 1) was selected and enoughsurface soil sampled for the study in this second experiment. A factorialarrangement of treatments consisting of KO and K I as used previously and fourlevels of MgCI 2 (0, 0.05, 1.0, and 2.0 me Mg/100g) were tested in a randomizedcomplete block design with four replicates. An individual experimental unitconsisted of three pots for each treatment. Planting and potting procedures weresimilar to those described in the previous section (Section 4.1). Before planting,all pots in both experiments were fertilized with 2.0 g/pot of 16-20-0 fertilizer.The same variety of soybeans (var. CM 60) were planted and harvested duringJuly-October 1994.
5.2. Results and discussion
5.2.1. The first K-Mg experiment
The effect of K and Mg on average grain yields and leaf nutrient contents ofsoybeans grown on the 20 soils are summarized in Table 6. The results weresimilar to those in the previous K-fertilizer experiment (Section 4.2. 1).
Grain yields without (KO) and with (KI) added K were not significantlydifferent with an average of 34.0 and 33.0 g/pot, respectively. On the otherhand, the application of Mg increased soybean yield significantly, average 30.1g for MgO to 36.8 g/pot for Mgl.
168
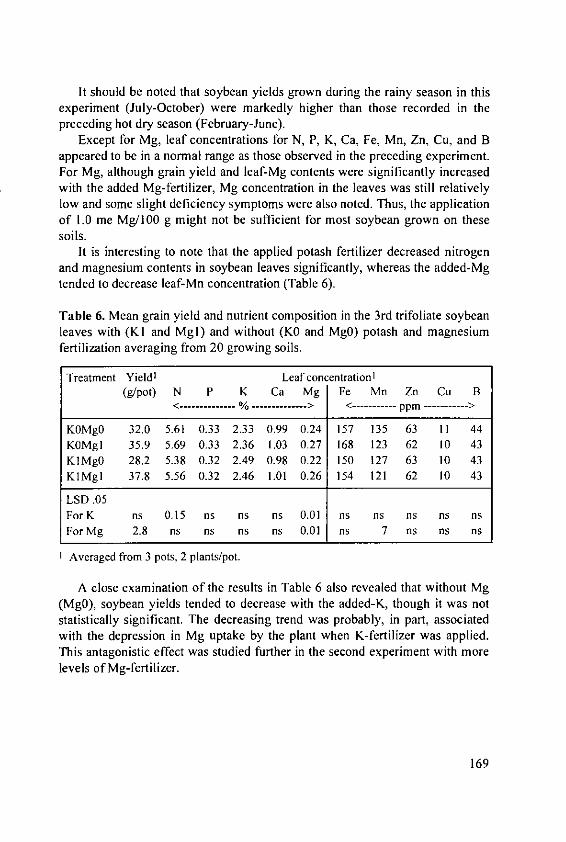
It should be noted that soybean yields grown during the rainy season in thisexperiment (July-October) were markedly higher than those recorded in thepreceding hot dry season (February-June).
Except for Mg, leaf concentrations for N, P, K, Ca, Fe, Mn, Zn, Cu, and Bappeared to be in a normal range as those observed in the preceding experiment.For Mg, although grain yield and leaf-Mg contents were significantly increasedwith the added Mg-fertilizer, Mg concentration in the leaves was still relativelylow and some slight deficiency symptoms were also noted. Thus, the applicationof 1.0 me Mg/100 g might not be sufficient for most soybean grown on thesesoils.
It is interesting to note that the applied potash fertilizer decreased nitrogenand magnesium contents in soybean leaves significantly, whereas the added-Mgtended to decrease leaf-Mn concentration (Table 6).
Table 6. Mean grain yield and nutrient composition in the 3rd trifoliate soybeanleaves with (KI and Mgl) and without (KO and MgO) potash and magnesiumfertilization averaging from 20 growing soils.
Treatment Yield' Leaf concentration1
(g/pot) N P K Ca Mg Fe Mn Zn Cu B< %---------- --------- > < ---------- ppm --------- >
KOMg0 32.0 5.61 0.33 2.33 0.99 0.24 157 135 63 I1 44KOMg1 35.9 5.69 0.33 2.36 1.03 0.27 168 123 62 10 43KIMg0 28.2 5.38 0.32 2.49 0.98 0.22 150 127 63 10 43KIMgI 37.8 5.56 0.32 2.46 1.01 0.26 154 121 62 10 43
LSD .05For K ns 0.15 ns ns ns 0.01 ns ns ns ns nsFor Mg 2.8 ns ns ns ns 0.01 ns 7 ns ns as
Averaged from 3 pots, 2 plants/pot.
A close examination of the results in Table 6 also revealed that without Mg(MgQ), soybean yields tended to decrease with the added-K, though it was notstatistically significant. The decreasing trend was probably, in part, associatedwith the depression in Mg uptake by the plant when K-fertilizer was applied.This antagonistic effect was studied further in the second experiment with morelevels of Mg-fertilizer.
169
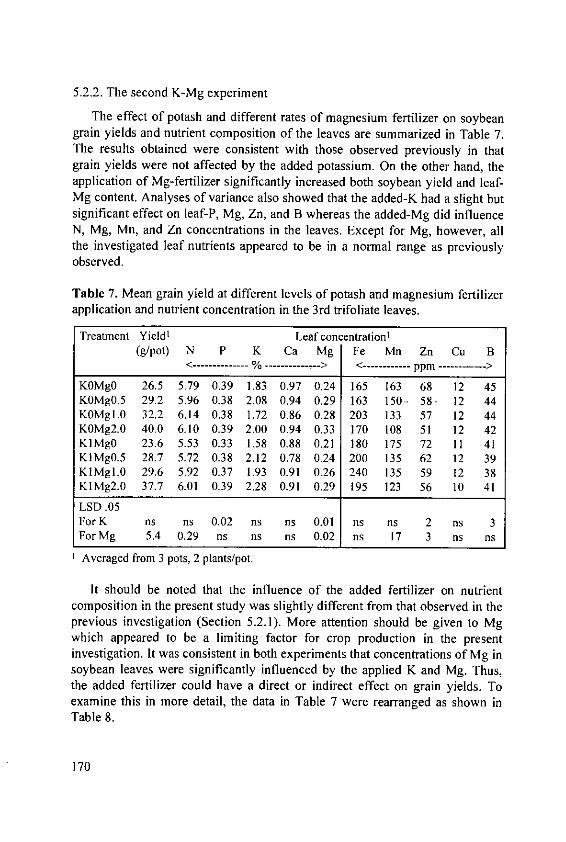
5.2.2. The second K-Mg experiment
The effect of potash and different rates of magnesium fertilizer on soybeangrain yields and nutrient composition of the leaves are summarized in Table 7.The results obtained were consistent with those observed previously in thatgrain yields were not affected by the added potassium. On the other hand, theapplication of Mg-fertilizer significantly increased both soybean yield and leaf-Mg content. Analyses of variance also showed that the added-K had a slight butsignificant effect on leaf-P, Mg, Zn, and B whereas the added-Mg did influenceN, Mg, Mn, and Zn concentrations in the leaves. Except for Mg, however, allthe investigated leaf nutrients appeared to be in a normal range as previouslyobserved.
Table 7. Mean grain yield at different levels of potash and magnesium fertilizerapplication and nutrient concentration in the 3rd trifoliate leaves.
Treatment Yield' Leaf concentration i
(g/pot) N P K Ca Mg Fe Mn Zn Cu B<- % ---- > <----------- ppm ---------- >
KOMgO 26.5 5.79 0.39 1.83 0.97 0.24 165 163 68 12 45KOMg0.5 29.2 5.96 0.38 2.08 0.94 0.29 163 150- 58- 12 44KOMgI.0 32.2 6.14 0.38 1.72 0.86 0.28 203 133 57 12 44KOMg2.0 40.0 6.10 0.39 2.00 0.94 0.33 170 108 51 12 42K1Mg0 23.6 5.53 0.33 1.58 0.88 0.21 180 175 72 11 41KIMg0.5 28.7 5.72 0.38 2.12 0.78 0.24 200 135 62 12 39KIMgI.0 29.6 5.92 0.37 1.93 0.91 0.26 240 135 59 12 38KIMg2.0 37.7 6.01 0.39 2.28 0.91 0.29 195 123 56 10 41
LSD .05For K ns ns 0.02 ns ns 0.01 ns ns 2 ns 3For Mg 5.4 0.29 ns ns ns 0.02 ns 17 3 ns ns
Averaged from 3 pots, 2 plants/pot.
It should be noted that the influence of the added fertilizer on nutrientcomposition in the present study was slightly different from that observed in theprevious investigation (Section 5.2.1). More attention should be given to Mgwhich appeared to be a limiting factor for crop production in the presentinvestigation. It was consistent in both experiments that concentrations of Mg insoybean leaves were significantly influenced by the applied K and Mg. Thus,the added fertilizer could have a direct or indirect effect on grain yields. Toexamine this in more detail, the data in Table 7 were rearranged as shown inTable 8.
170

The results indicate that soybean grain yields and leaf-Mg contents wereprogressively increased with each increment of the added-Mg. The averageyields obtained with 0, 0.5, 1.0, and 2.0 me Mg/100g were 25.1, 29.0, 30.9, and38.9 g/pot, respectively. Though the yield increase from 0 to 0.5 and 0.5 to 1.0me Mg was not statistically significant, the increase with each increment ofadded-Mg amounted to 15.5, 23.1, and 55% of the yield without Mg. Similar toprevious observations, the application rate of 1.0 me Mg/100g gave only about0.27% leaf-Mg and seemed to be inadequate and slight deficiency symptoms ofMg were noted. The highest dose of 2.0 me Mg appeared to ameliorate theproblem.
Table 8. Mean grain yield and % Mg in the leaves with (KI) and without (KO)potash and different rates of magnesium fertilizer application.
Mg-fertilizer Grain yield (g/pot) % leaf Mg(me Mg/100g) KO KI Average KO KI Average
0 26.5 23.6 25.1 0.24 0.21 0.230.5 29.2 28.7 29.0 0.28 0.24 0.261.0. 32.2 29.6 30.9 0.28 0.26 0.272.0 - 40.0 37.7 38.9 0.33 0.29 0.31
Mean comparisons For grain yield For % leaf-MaBetween K level M2 level K level MP level
LSD.05 ns 5.4 0.01 0.02
The effect of K on grain yields was not statistically significant but theapplied-K tended to reduce soybean yield and leaf-Mg contents were decreasedsignificantly at each level of Mg fertilization. This evidence suggested that theadded-K fertilizer suppressed Mg uptake by plants. The results obtained in thisexperiment were consistent with those observed in the previous investigation(Section 5.2.1). These findings are also in agreement with those reported byWalworth and Sumner (1990); they found that the addition of K depressed Mguptake by alfalfa plants markedly.
6. Conclusions
Results so far obtained in a series of investigations have demonstrated clearlythat the present soil-K status in the major soybean growing areas in the ChiangMai Valley are relatively high both in terms of exchangeable K and K-supplyingpotential. On the other hand, Mg availability appears to be an important limitingfactor for soybean production on these soils. The application of Mg-fertilizermarkedly increased grain yield and Mg concentration in the leaves.
171

One of the most interesting results obtained from the study was the observedantagonistic effect of K on Mg uptake by soybean plants. Though grain yieldswere not much affected, the added-K decreased leaf-Mg contents significantly.Thus for Mg-deficient soils, the application of K-fertilizer could aggravate theproblems unless adequate Mg was applied. These research findings emphasizethe importance of balanced fertilization for agricultural production. In order toimprove fertilizer recommendations, further investigations, including carefulfield experiments are needed to increase and sustain soybean production in theChiang Mai Valley.
References
Chiang Mai University (1980): An interdisciplinary perspective of croppingsystems in the Chiang Mai Valley: Key questions for research. MultipleCropping Project, Faculty of Agriculture, Chiang Mai University, pp. 238.
Cooke, G.W. (1985): The role and importance of potassium in the agriculturalsystems of the humid tropics: the way forward. Proceedings of the 19thColloquium of the International Potash Institute held in Bangkok/Thailand,369-405.
Doll, E. and Lucas, R. (1973): Testing soils for potassium, calcium, andmagnesium. In: Walsh, L. and Beaton, J. (ed.), Soil testing and plantanalysis. Soil Sci. Soc. Amer. Inc., USA. 133-151.
Dowdle, S. and Portch, S. (1990): A systematic approach for determining soilnutrient constraints and establishing balanced fertilizer recommendations forsustained high yields. Proceedings of the International Symposium onBalanced Fertilization. The Soil and Fertilizer Institute of the ChineseAcademy of Agricultural Sciences, 243-251.
Greenland, D. (1985): Experimental approaches in defining the needs forpotassium. Proceedings of the 19th Colloquium of the International PotashInstitute held in Bangkok/Thailand, 293-306.
Jirapomcharoen, S. (1993): The use of chemical and organic fertilizers in cropproduction in Thailand. Food and Fertilizer Technology Center, ExtensionBull. No. 370, pp. 10.
Knudsen, D., Peterson, G. and Pratt, P. (1982): Lithium, sodium, and potassium.In: Page et al. (ed.), Methods of soil analysis, Part 2. Agronomy No. 9, 225-246.
Ling, C. and Lu, B. (1990): Studies on effect of magnesium fertilizer and itsreasonable application to reddish soils in Fujian, China. Proceedings of theInternational Symposium on Balanced Fertilization. The Soil and FertilizerInstitute of the Chinese Academy of Agricultural Sciences, 342-347.
172
Ministry of Agriculture and Cooperatives (1976): Detailed reconnaissance soilmap of Chiang Mai Province. Department of Land Development, SoilSurvey Division, Province Series No. 27, pp. 26.
Phetchawee, S., Kanareugsa, C., Sittibusaya, C. and Khunathai, H. (1985):Potassium availability in the soils of Thailand. Proceedings of the 19thColloquium of the International Potash Institute held in Bangkok/Thailand,167-181.
Rerkasem, B. and Rerkasem, K. (1988): A decline of soil fertility underintensive cropping in northern Thailand. First International Symposium onPaddy Soil Fertility, Chiang Mai, Thailand, 671-682.
Small, H. and Ohlrogge, A. (1973): Plant analysis as an aid in fertilizingsoybeans and peanuts. In: Walsh, L. and Beaton, J. (ed.), Soil testing andplant analysis. Soil Sci.Soc. Amer. Inc., USA, 315-327.
Walworth, J. and Sumner, M. (1990): Alfalfa response to lime, phosphorus,potassium, magnesium, and molybdenum on acid ultisols. Fertilizer Res. 24:167-172.
Xie, J. and Du, C. (1988): Characteristics of potassium supply in paddy soilsand effective applications of potassium fertilizer in China. First InternationalSymposium on Paddy Soil Fertility, Chiang Mai, Thailand, 625-641.
173

Chairman of the Session 2
Prof. Dr. U. Kalkafi, Center for AgriculturalResearch in Desert and Semi Arid Lands, Facultyof Agriculture, The Hebrew University ofJerusalem, Rehovot, Israel
Session 2
Management of K-Supply to Plantsin Cropping Systems of DifferentAgroclimatic Regions
175
Integrated Management Approach for the Productionof Crops in Tropical and Subtropical Asia 1
J.S. Kanwar and T.J. RegoDeputy Director General (Emeritus), and Senior Scientist (Soil Science),ICRISAT Asia Center, Patancheru 502 324, Andhra Pradesh, India.
Abstract
In the Tropical and Subtropical Asia, the soil related constraints, particularlynutrient and moisture stress in the semi-arid and nutritional stress in the humidand sub-humid ecoregions, are the major factors limiting crop yields. Anintegrated technology management, especially integrated nutrient management,is the key to meeting the challenges of food in this ecosystem. The increase infertilizer consumption and food grain productivity in the most populouscountries of this region is an evidence of the key role of fertilizers in increasingthe productivity. However, the disproportionate use of N to K and imbalancedand inadequate use of fertilizers and organics are causes of concern for thefuture. To correctly appraise the K deficiency problem, long-term instead ofshort-term studies are needed. Research has shown that even with currentlyavailable technologies, the productivity potential of the prime lands degraded,and degradation in both these ecoregions has not been fully exploited. The gapbetween the plant nutrient requirements and nutrient input from inorganic aswell as organic sources and imbalanced use of nutrients is limiting production.Evidence has been presented of the synergistic effect of integration of variouscomponents of technology including fertilizer as a key factor on yield withoutdetrimental effects on environment.
Introduction
The tropical and subtropical Asia supports more than half of the world'spopulation from less than one third of the world's cultivated land and with littlescope for bringing more areas under cultivation without increasing the risk ofsoil degradation, environmental deterioration, and unsustainable agriculture.Even in 2025 AD, the region will not only be more densely populated, but stillfarming more than 50% of the world's population to be supported by it (WorldDevelopment Report, 1992).
Submitted as Conference Paper No. 921 by the International Crops ResearchInstitute for the Semi-Arid Tropics (ICRISAT).
177

Though the use of improved technology based on high-yielding seed,chemical fertilizers, pesticides, and irrigation enabled the region generally toattain self-sufficiency in food, it will be very short lived as the gap betweenfood demand and supply is increasing. The specter of food shortages in thisregion is even greater than elsewhere and still 731 million people, i.e. 27%, arebelow the poverty line in this region (Borlaugh and Dowswell, 1994).Agriculture is the predominant enterprise and will continue to be the same forlong time to come. Majority of farmers are small marginal and predominantlyresource poor. In this situation, the only hope for ensuring food security,nutritional security, and environmental safety, lies in increasing agriculturalproductivity from the land already under cultivation with a technology thatleads to remunerative, sustainable and ecoffiendly agricultural system. Thestrategy should aim at enhancing the productivity and realizing the potential ofthe favorable environments or the so-called green revolution areas, restoring theproductivity of the degraded lands, conserving and maintaining the productivityin the degrading areas by using appropriate soil and water conservationmeasures. The technologies which are land saving, labor intensive, moreproductive, ecofriendly and integrated-resource utilizing, are the need of theregion. The purpose of this paper is to review the past work and to demonstratethe usefulness of integrated management approach for the production of cropsin tropical subtropical Asia.
Agroecological environments
There are two distinct agroecological regions in this part of the world: (i)humid and sub-humid, and (ii) semi-arid. The humid and sub-humid regionreceives abundant solar radiation and has high temperature and high rainfall,which are conductive to year-round cropping with or without irrigation,depending on the climatic pattern, nature of soils, crops, cropping system andmanagement. Most serious constraints to productivity in this ecoregion are soil-related constraints. Alfisols, Oxisols, Ultisols, Inceptisols, Entisols, andVertisols are some of the important soil groups of this region. The nature ofsoil-related constraints and their intensity differs with the nature of the soil. Thecommon constraints of these soils are inadequate nutrient supply, P fixation,acidity, aluminum toxicity, crusting, low infiltration, drainage, erosion, andseasonal moisture stress (Eswaran, 1992). The main approach for increasingproductivity of these soils has been to overcome these constraints through theapplication of fertilizers and amendments, appropriate tillage and drainage tomake the environment most favourable to crop production.
178
In the semi-arid ecoregion, the predominant soils are Alfisol, Vertisol,Inceptisol, Entisol, and Aridisol (Kampen and Burford, 1980). The first threegroups are of more common occurrence. The productivity of this region is low,more because of abiotic stresses such as moisture stress and nutrient stress. Thedensity of population in this region though less than in the former, but thecombined pressure of human and animal population is land degrading and soilproductivity reducing hence affecting the present and future of agriculture. Thescope for bringing more area under cropping is rather too limited. Many ofthese soils are of shallow depth and of low fertility and considered marginal orfragile environment for agriculture. The soils like Vertisol though of heavytexture and of greater depth have some physical constraints and remain under-utilised because of this problem. The major possibility to increase production inthis region lies in increasing productivity from good or resilient soils withproper management of natural resources namely soil and water and withintegrated nutrient management system. The management of climatic and soilconstraints is the main plank of a strategy to realize the potential of theseenvironments.
Technological advances and concerns
In the last three decades, the development of integrated technology based onuse of high-yielding genotypes, application of fertilizer, and soil and cropmanagement practices has produced spectacular results in many countries ofboth these ecoregions under favorable moisture situations with or withoutirrigation. Use of improved technology ushered in green revolution in rice(Oryza saliva), wheat (Triticum spp), maize (Zea mays), sorghum (sorghumhicolor), cotton (Gossypium spp), sugarcane (Saccharum officinarum), potato(Solanum tuberosum) and root and tuber crops, but the gains have beenconfined to more favorable situations and restricted to farmers who had moreaccess to credit capital and purchased inputs. Borlaugh and Dowswell (1994)believe that, but for this technology, many developing countries such as Chinaand India would have been required to put more than 2 to 3 times more landunder cereals in 1992 if they had continued using the technology of years before1961 (Fig.I). Thus the technology has not only produced more food but alsosaved more land.
179

China-All Cereals
300
Production250 196 1-147 Million tonnos
2W0
Area Used
161 1965 1970 1975 190 1WO5 1990 19 2
India-All Cereals225
2OO Production15 S 19961200 Million tonnes
1 1962-87 Million tonns
125
00
75
Area Used50
25
1961 1965 1970 1Q75 1980 lOs 1990 102
Fig. 1. The land that Chinese and Indian farmers spared through raising cerealyields (Borlaugh and Dowswell, 1994).
Increasing productivity in subsistence farm lands of humid and sub-humidregions
The important crops of this ecoregion are predominantly cereals such asrice, wheat, maize, which cover 70% area, pulses and other legumes 8%, oilcrops 7%, roots and tubers 4%, horticultural, plantation, and fibre crops about10% (adapted from RAPA, 1988). Many of these crops have high fertilizerrequirements. Kanwar (1974) stressed that any strategy for increasingproductivity of these crops has to take care of their high K needs. This assumeseven greater significance in the coming years, as many of them are exportoriented and foreign exchange earning crops and all the developing countriesare anxious to increase their production and export.
180

Amon (1985) divided the agricultural production systems of humid and sub-humid ecoregions into two groups: one consisting of commercial plantationfarms and large farmers and the other of resource-poor small and marginalfarmers. The latter consists of a large group of subsistence farmers who producefood crops, cereals, oilseeds, pulses etc., using mostly traditional technology. Inrecent years, they have also started using components of improved technologysuch as high yielding varieties (HYV), small to medium doses of fertilizers,irrigation, and some pesticides and have achieved impressive results.
There is considerable scope to increase productivity of subsistence farmlands in the humid and sub-humid regions by removing the soil-relatedconstraints through application of fertilizers and amendments and using HYV asmost of the time in a year, moisture availability is adequate. The integratednutrient management system based on use of FYM, green manuring, bio-fertilizers supplemented with chemical fertilizers to meet the requirements of agood crop yield, is an ideal system for a resource-poor farmer, but the optimummix for best results will depend on the availability of the components and theeconomies of their use.
In recent years, great interest in low-input sustainable agriculture (LISA) hasbecome the focus of many environmentalists, but the innovation and the manage-ment techniques suitable for one set of soil, climate, cropping conditions may beentirely unsatisfactory to another situation and LISA is not the solution ofmeeting the increasing food demand of the population. But no system isconsidered sound and acceptable, unless it includes improvement of productivity,sustainability and environmental safety. Even under the system of shifting culti-vation after a few years of cultivation, nutrient deficiency becomes so seriousthat it is uneconomical to grow crops. Addition of organic manures, and cropresidues, though provide sustainability, their availability, alternative uses andlow-nutrient availability prohibit their large-scale use. Use of legumes for greenmanure and N fixation is another time honored soil fertility building practicewith the farmers of both the ecoregions, but the constraint of land, irrigationwater, and other practical difficulties are restricting its use in intensive croppingsystem. The other alternative is growing of legumes in intercropping, sequentialcropping and in alley cropping system as hedgerows or agro-forestry system.These systems are being used with varying degrees of success in the region.
A long-term experiment on alley cropping at the International Institute forTropical Agriculture (IITA) clearly shows the improvement in productivity on asustainable basis (Fig. 2). The gains from this system also depend on the applica-tion of lime and NPK in these acid and low fertility soils. IITA in Africa and theInternational Board for Soil Research and Management (IBSRAM) in Asia areengaged in on-farm researches in a net working arrangement in the humid tropics.
181
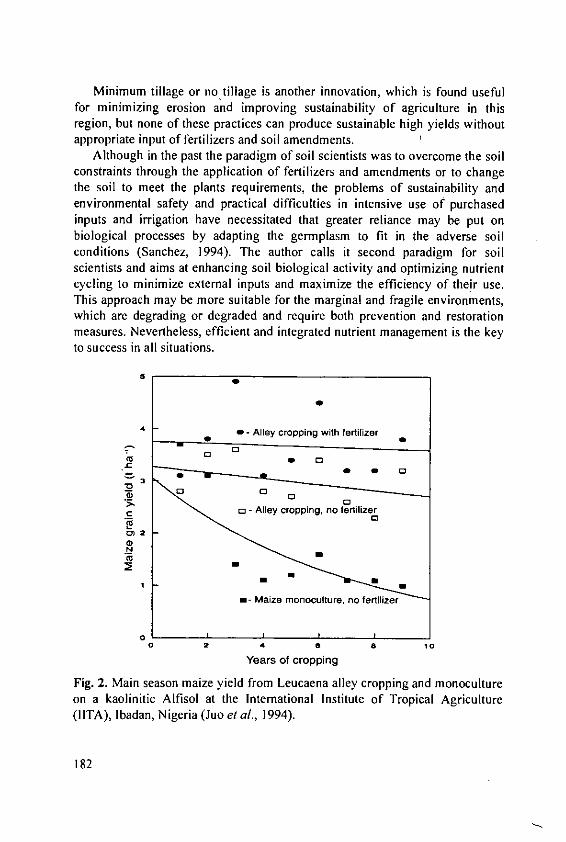
Minimum tillage or notillage is another innovation, which is found usefulfor minimizing erosion and improving sustainability of agriculture in thisregion, but none of these practices can produce sustainable high yields withoutappropriate input of fertilizers and soil amendments.
Although in the past the paradigm of soil scientists was to overcome the soilconstraints through the application of fertilizers and amendments or to changethe soil to meet the plants requirements, the problems of sustainability andenvironmental safety and practical difficulties in intensive use of purchasedinputs and irrigation have necessitated that greater reliance may be put onbiological processes by adapting the germplasm to fit in the adverse soilconditions (Sanchez, 1994). The author calls it second paradigm for soilscientists and aims at enhancing soil biological activity and optimizing nutrientcycling to minimize external inputs and maximize the efficiency of their use.This approach may be more suitable for the marginal and fragile environments,which are degrading or degraded and require both prevention and restorationmeasures. Nevertheless, efficient and integrated nutrient management is the keyto success in all situations.
SQ
4- Alley cropping with fertilizer
0
~0*mio - mcropping, no fertilizer
0) 2
.N
*=- Maize monocunture, no fertilizer
0 I0 a 4 a 8 10
Years of cropping
Fig. 2. Main season maize yield from Leucaena alley cropping and monocultureon a kaolinitic Alfisol at the International Institute of Tropical Agriculture(IITA), lbadan, Nigeria (Juo et al., 1994).
182
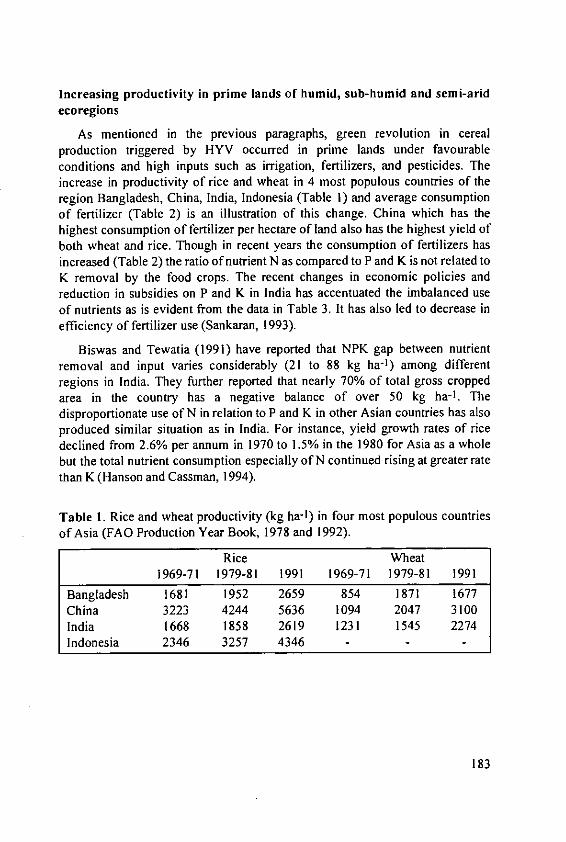
Increasing productivity in prime lands of humid, sub-humid and semi-aridecoregions
As mentioned in the previous paragraphs, green revolution in cerealproduction triggered by HYV occurred in prime lands under favourableconditions and high inputs such as irrigation, fertilizers, and pesticides. Theincrease in productivity of rice and wheat in 4 most populous countries of theregion Bangladesh, China, India, Indonesia (Table I) and average consumptionof fertilizer (Table 2) is an illustration of this change. China which has thehighest consumption of fertilizer per hectare of land also has the highest yield ofboth wheat and rice. Though in recent years the consumption of fertilizers hasincreased (Table 2) the ratio of nutrient N as compared to P and K is not related toK removal by the food crops. The recent changes in economic policies andreduction in subsidies on P and K in India has accentuated the imbalanced useof nutrients as is evident from the data in Table 3. It has also led to decrease inefficiency of fertilizer use (Sankaran, 1993).
Biswas and Tewatia (1991) have reported that NPK gap between nutrientremoval and input varies considerably (21 to 88 kg ha - 1) among differentregions in India. They further reported that nearly 70% of total gross croppedarea in the country has a negative balance of over 50 kg ha- 1. Thedisproportionate use of N in relation to P and K in other Asian countries has alsoproduced similar situation as in India. For instance, yield growth rates of ricedeclined from 2.6% per annum in 1970 to 1.5% in the 1980 for Asia as a wholebut the total nutrient consumption especially of N continued rising at greater ratethan K (Hanson and Cassman, 1994).
Table 1. Rice and wheat productivity (kg ha-1 ) in four most populous countriesof Asia (FAO Production Year Book, 1978 and 1992).
Rice Wheat1969-71 1979-81 1991 1969-71 1979-81 1991
Bangladesh 1681 1952 2659 854 1871 1677China 3223 4244 5636 1094 2047 3100India 1668 1858 2619 1231 1545 2274Indonesia 2346 3257 4346 - - -
183

Table 2. Fertilizer consumption (kg ha-I) in four most populous countries ofAsia (FAO Fertilizer Year Book, 1972 and 1991).
1972 1980-81 1991N P20 5 K20 N P20 5 K20 N P20 5 K20
Bangladesh 13.3 4.3 1.2 29.2 13.1 3.1 66.6 25.9 9.6China 10.9 3.3 1.2 120.0 27.2 4.7 201.4 60.9 18.1India 10.3 3.3 1.9 21.8 43.3 3.7 47.3 18.9 7.8Indonesia 12.4 2.6 1.1 43.3 11.8 4.6 72.5 25.4 14.2
Table 3. Changes in N, P, K ratios in fertilizer consumption in India (1971-94)(Gohil and Majumdar, 1994).
Year N P20 5 K20
1971-72 6.0 1.9 1.01981-82 6.0 1.9 1.01991-92 5.9 2.4 1.01992-93 9.5 3.2 1.01993-94 10.5 3.2 1.0
Rice - Rice based system
Rice is the predominant crop of prime lands of both these ecoregions. Theirrigated low lands of Asia produce 75% of the world's rice (De Datta, 1985).Under favorable situations continuous rice, i.e. 2 to 3 crops of rice or rice-ricebased cropping system of intensive agriculture are being commonly practicedby farmers. Such intensive cropping systems no doubt produce high yields but itis a very exhaustive system. It require high amounts and ready availability ofnutrients and depends on adequate and ready supply from the soil and fertilizersources. Problems of declining or stagnation of yields despite higher inputs arebeing experienced in all rice-growing areas. The increasing deficiency of K, S,Zn, Fe, and Mn are other ill effects of this imbalanced fertilization.
Rice-wheat system
Rice-wheat system is a dominant intensive agricultural production system infive Asian countries, i.e. China, India, Pakistan, Bangladesh, and Nepal (Kinje,1994). It covers more area in semi-arid ecoregion than in humid or sub-humidregion and is practiced essentially under irrigated conditions.
This system has shown great potentiality for maximizing production as isevident from the impressive yield gain in the whole region. It is highlighted bythe maximum yield research (MYR) and maximum economic yield (MEY)
184

research in many countries of the region. Palaniappan et al. (1990) reported thatcontinuous experiments on the same site at the Punjab Agricultural University,Ludhiana and C.S. Azad University, Kanpur for over 3 years produced averageyields of 9 t ha-I of paddy and 5.3 t ha- I of wheat grain at Ludhiana, 8.4 t ha- 1
paddy and 5.85 t ha- 1 wheat grain at Kanpur. At both those places, a saving of60 kg N ha-1 was obtained by introducing green manuring with legumes thusreducing the fertilizer -N dose for wheat which succeeded the rice crop. Rice-wheat drains the soil nutrients heavily removing annually a total of about 700kg N, P, K besides large amounts of micronutrients, and sulphur thus indicatingthe necessity of high and balanced fertilization for sustained yield. The annualnutrient removal by a few important intensive cropping systems in India (Table4) indicate the need for heavy fertilization for integrated nutrient managementfor maintaining a sustained high yield (Tandon and Sekhon, 1988).
Table 4. Nutrient uptake by some high-intensity sequence cropping systems inIndia (Tandon and Sekhon, 1988).
Cropping Yield* Nutrient uptake kg ha- I year-1
system (t ha-1) N P20 5 K20 Total
Rice-Rice 6.3 139 88 211 438
Rice-wheat-jute 6.9+2.3(fi) 170 76 254 500
Soybean-wheat- 5.8+5.1(fo) 334 99 499 932maize (fo)
Rice-wheat- 9.6+3.9(fo) 272 153 389 814cowpea (fo)
Soybean-wheat- 3.2+6.8(t) 284 41 202 527potato
Rice-Wheat- 9.3+29(fo) 305 123 306 734Maize+Cowpea
Under yield data: fo is fodder; fi is fibre; t is tuber; and all others are grain.
Long-term experiments and latent nutrient deficiencies
The long-term fertility experiments which have been carried out in Indiafrom 1970 at a number of sites representative of different agroecologicalconditions on intensive cropping system have indicated (Nambiar and Ghosh,1987) that after 5-13 years, in 6-8 locations, most of the crops started showingresponses to K whereas in the beginning only at one site cereals and 2 sitespotato showed such responses.
185

Moreover, the deficiency of Zinc and Sulphur also became more severe withtime. The treatments containing FYM along with the same dose of N, P, K asthe other treatments, did not manifest deficiency of K and other nutrients nor adecline in yield. This clearly demonstrates that the sustainability of the intensivecropping system cannot be measured in a short period of experimentation. Theaddition of FYM or other organics provide an effective measure againstexpected deficiencies. Continuous monitoring of soil health and changes inbalance sheet of nutrient removal and inputs becomes unavoidable necessity towardoff the likely nutrient deficiencies and deteriora-tion of physical conditionsof the soil to seriously affect the realization of the potential of the system. Thecontinuous wheat-rice system is considered to be an exhaustive system andconcerns about its sustainability for a long time in both the ecoregions of Asiahave been expressed.
Improved technology and sustainability of agriculture
The technology based on HYV, and greater use of fertilizer, pesticide,irrigation water and management is sometimes blamed for producing in the longrun the environmental deterioration and decline in yield. If the technology is ill-matched with the environments it can sometimes produce ill-effects. But mostoften poor results are due to lack of consideration of balanced use of inputs andmanagement. The use of disease resistant HYV compatible with the environ-ment, integrated pest management instead of unwise, indiscriminate use ofpesticides, balanced nutrient input based on inorganic and organic sources, cropresidue management and soil water and crop management system, can producesustainable high yields without detriment to environment. In fact, anharmonious combination and integration of various inputs and scientificmanagement of soil water and crop can lead to sustainable agricultural systemand it is an ecological and economic imperative for this region.
Integrated management to bridge gap between potential and farmers' yield
There is no doubt that even with the present day's available technology,these favorable environments are capable of producing many times more foodthan they are doing today, but there is a big gap between the potential yields andthe farmers' yields as is illustrated by the gap between the nationaldemonstration yields and the farmers' yields in India (Fig. 3).
186
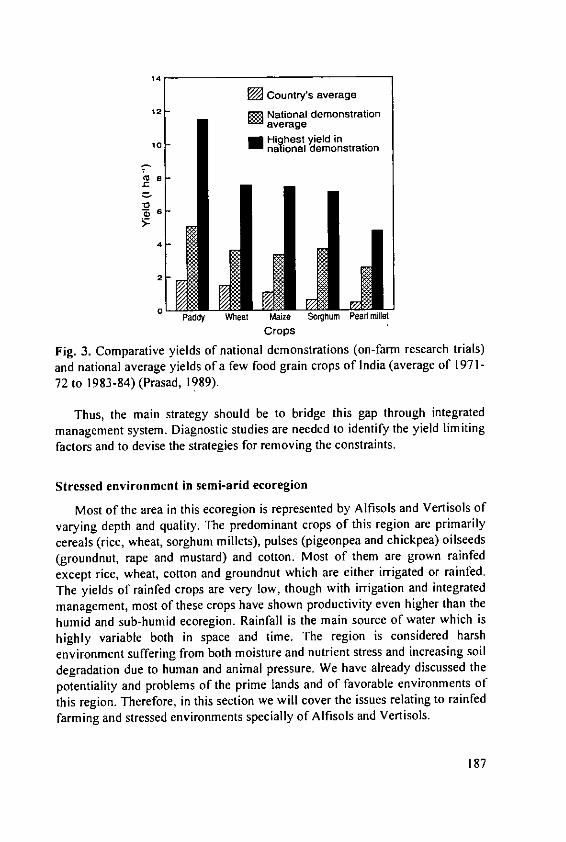
14
Country's average12 -National demonstration
average10 - Highest yield in
1 nional demonstration
-
4
2
Paddy Wheat Maize Sorghum Pead milletCrops
Fig. 3. Comparative yields of national demonstrations (on-farm research trials)
and national average yields of a few food grain crops of India (average of 1971-
72 to 1983-84) (Prasad, 1989).
Thus, the main strategy should be to bridge this gap through integrated
management system. Diagnostic studies are needed to identify the yield limiting
factors and to devise the strategies for removing the constraints.
Stressed environment in semi-arid ecoregion
Most of the area in this ecoregion is represented by Alfisols and Vertisols of
varying depth and quality. The predominant crops of this region are primarily
cereals (rice, wheat, sorghum millets), pulses (pigeonpea and chickpea) oilseeds
(groundnut, rape and mustard) and cotton. Most of them are grown rainfed
except rice, wheat, cotton and groundnut which are either irrigated or rainfed.
The yields of rainfed crops are very low, though with irrigation and integrated
management, most of these crops have shown productivity even higher than the
humid and sub-humid ecoregion. Rainfall is the main source of water which is
highly variable both in space and time. The region is considered harsh
environment suffering from both moisture and nutrient stress and increasing soil
degradation due to human and animal pressure. We have already discussed the
potentiality and problems of the prime lands and of favorable environments of
this region. Therefore, in this section we will cover the issues relating to rainfed
farming and stressed environments specially of Alfisols and Vertisols.
187
Over the last 20 years, technologies for increasing productivity of rainfedfarming areas of Alfisol and Vertisol have been developed by the joint efforts ofinternational and national programs such as International Crops ResearchInstitute for the Semi-Arid Tropics (ICRISAT), and its collaborative andcooperative programs with the national agricultural research systems (NARS).The improved technology uses watershed concept for efficient rain-watermanagement and integrated crop management technology based on synergisticeffect of genotype, fertilizer, and crop management matched with the availablemoisture.
Vertisol technology
Most of the vertisols in India and elsewhere in Asia are kept fallow duringrainy season due to difficulties of preparing the land and waterlogging. They aregenerally cropped only in the post-rainy season on conserved moisture thoughthey are capable of producing two crops, one in the rainy season, and the otherin post-rainy season. However, it needs improved technology for soil, rain-water and crop management. With the integrated technology either twosequential crops or one cereal crop intercropped with a legume, which willcome to maturity in post-rainy season have been successfully grown onexperimental plots as well as on farmers' fields.The important components of technology which uses watershed concept are asfollows:I. Preparing the land immediately after harvest of the postrainy-season crops.2. Preparing the land to broadbed and furrows 1.5 m apart to facilitate removal
of excess water to drain through grassed waterways into collection tanks.3. Dry seeding of rainy-season crops like sorghum, pigeonpea, maize etc., a
week or 10 days before the onset of monsoon.4. Application of a small quantity of basal fertilizer, e.g. 20 kg N and 20 kg P
ha-1 for non-legumes followed by top dressing when the crop is fullyestablished.
5. Relay sowing or sequential sowing of the postrainy-season crops aftermaturity of the rainy-season crops.
6. Providing minimum measures of plant protection against pests and diseases.
The results from large size plot trials at ICRISAT Asia Center for 13 yearsare presented in Table 5. These data clearly indicate not only increased but alsostable productivity and reduced soil loss. Fig. 4 shows the effect of integration ofvarious components of technology in increasing productivity of maize/pigeonpeaintercrop system.
188

Table 5. Grain yields under improved and traditional technologies on deep Vertisols at ICRISAT Center' in 13
successive years along with changes in soil losses (Virmani and Eswaran, 1989).
Grain yield (t ha-') Soil loss@ (t ha- ')
Improved system: Traditional Improved Traditional
double cropping system technology technology
Year Cropping Sorghum/ Sequential Total Sorghum Chickpeaperiod rain- maize or inter-fall (mm) cropped
1976/77 708 3.20 0.72 3.92 0.44 0.54 0.80 9.201977/78 616 3.08 1.22 4.30 0.38 0.87 0.04 1.681978/79 1089 2.15 1.26 3.41 0.56 0.53 3.40 9.701979/80 715 2.30 1.20 3.50 0.50 0.45 0.70 9.471980/81 751 3.59 0.92 4.51 0.60 0.56 0.90 4.581981/82 1073 3.19 1.05 4.24 0.64 1.05 5.00 11.011982/83 667 3.27 1.10 4.37 0.63 1.24 0.20 0.701983/84 1045 3.05 1.77 4.82 0.84 0.48 0.80 4.701984/85 546 3.36 1.01 4.37 0.69 1.231985/86 477 2.70 0.73 3.43 0.84 -
1986/87 585 4.45 0-38 4.83 0.37 1.27 -
1987/88 841 4.26 1.35 5.61 0.80 0.92 - -
1988/89 907 4.64 1.23 5.87 0.61 1.18 - -
Mean 771 3.33 1.07 4.40 0.59 0.86 - -
SD 205 0.76 0.34 0.76. 0.15 0.32 - -
CV (%) 27 23 32 17 25 37 - -
Average rainfall for Hyderabad (29 km away from ICRISAT Asia Center) based on 1901-84 data is 784 mm with a
CV of 27%.** No crop sown.
,.o @ Adapted from Srivastava and Jangwad (1987).
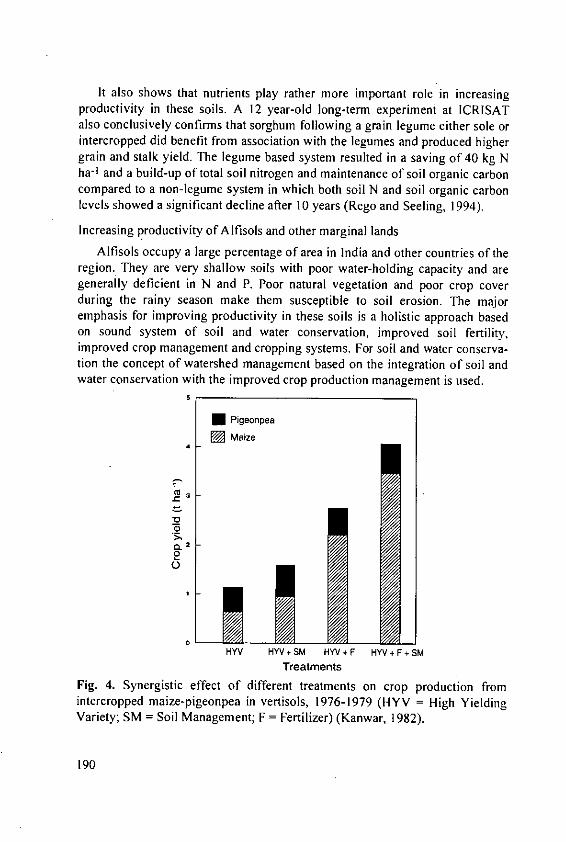
It also shows that nutrients play rather more important role in increasingproductivity in these soils. A 12 year-old long-term experiment at ICRISATalso conclusively confirms that sorghum following a grain legume either sole orintercropped did benefit from association with the legumes and produced highergrain and stalk yield. The legume based system resulted in a saving of 40 kg Nha- 1 and a build-up of total soil nitrogen and maintenance of soil organic carboncompared to a non-legume system in which both soil N and soil organic carbonlevels showed a significant decline after 10 years (Rego and Seeling, 1994).
Increasing productivity of Alfisols and other marginal lands
Alfisols occupy a large percentage of area in India and other countries of theregion. They are very shallow soils with poor water-holding capacity and aregenerally deficient in N and P. Poor natural vegetation and poor crop coverduring the rainy season make them susceptible to soil erosion. The majoremphasis for improving productivity in these soils is a holistic approach basedon sound system of soil and water conservation, improved soil fertility,improved crop management and cropping systems. For soil and water conserva-tion the concept of watershed management based on the integration of soil andwater conservation with the improved crop production management is used.
•Pigeonpea[ Maize
A
a20
0 -
HYV HYV SM HYV+F HYV+ F+SM
TreatmentsFig. 4. Synergistic effect of different treatments on crop production fromintercropped maize-pigeonpea in vertisols, 1976-1979 (HYV = High YieldingVariety; SM = Soil Management; F = Fertilizer) (Kanwar, 1982).
190
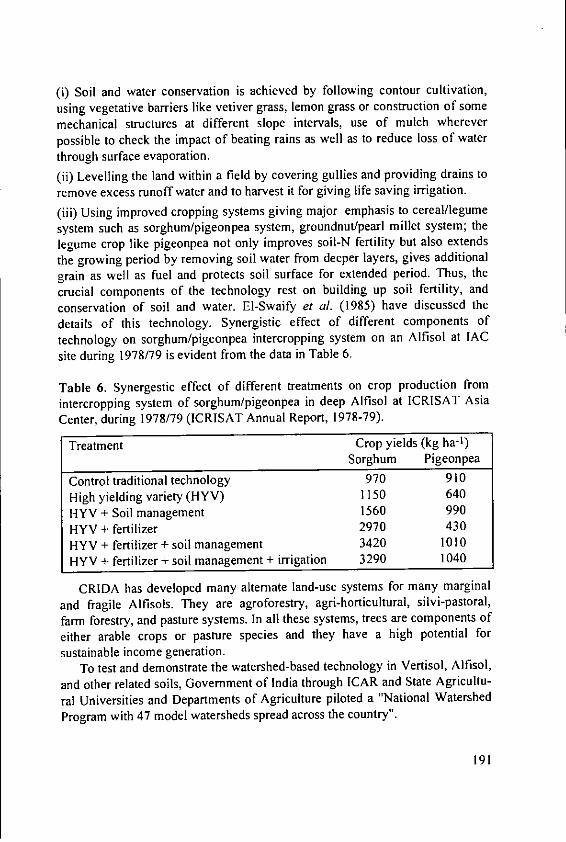
(i) Soil and water conservation is achieved by following contour cultivation,using vegetative barriers like vetiver grass, lemon grass or construction of somemechanical structures at different slope intervals, use of mulch whereverpossible to check the impact of beating rains as well as to reduce loss of waterthrough surface evaporation.
(ii) Levelling the land within a field by covering gullies and providing drains toremove excess runoff water and to harvest it for giving life saving irrigation.
(iii) Using improved cropping systems giving major emphasis to cereal/legumesystem such as sorghum/pigeonpea system, groundnut/pearl millet system; thelegume crop like pigeonpea not only improves soil-N fertility but also extendsthe growing period by removing soil water from deeper layers, gives additionalgrain as well as fuel and protects soil surface for extended period. Thus, thecrucial components of the technology rest on building up soil fertility, and
conservation of soil and water. EI-Swaify et al. (1985) have discussed the
details of this technology. Synergistic effect of different components of
technology on sorghum/pigeonpea intercropping system on an Alfisol at IACsite during 1978/79 is evident from the data in Table 6.
Table 6. Synergestic effect of different treatments on crop production from
intercropping system of sorghum/pigeonpea in deep Alfisol at ICRISAT AsiaCenter, during 1978/79 (ICRISAT Annual Report, 1978-79).
Treatment Crop yields (kg ha-')Sorghum Pigeonpea
Control traditional technology 970 910High yielding variety (HYV) 1150 640HYV + Soil management 1560 990HYV + fertilizer 2970 430
HYV + fertilizer + soil management 3420 1010HYV + fertilizer + soil management + irrigation 3290 1040
CRIDA has developed many alternate land-use systems for many marginal
and fragile Alfisols. They are agroforestry, agri-horticultural, silvi-pastoral,farm forestry, and pasture systems. In all these systems, trees are components of
either arable crops or pasture species and they have a high potential for
sustainable income generation.To test and demonstrate the watershed-based technology in Vertisol, Alfisol,
and other related soils, Government of India through ICAR and State Agricultu-
ral Universities and Departments of Agriculture piloted a "National WatershedProgram with 47 model watersheds spread across the country".
191

Singh and Sharma (1989) reported that yields of sorghum, mung bean(vigna radiata) and groundnut in these watersheds were 663, 580 and 414 kgha- 1 in 1983-84 and increased to 1708, 517, and 1194 kg ha-1 respectively, in1987-88. Encouraged by the gains obtained in model watershed program,Government of India has launched a massive national Watershed DevelopmentProgram for improving productivity and sustainability of agriculture in rainfedfarming areas. The emphasis in this project is on farmers' participation while theGovernment agencies act only as catalysts.
Some aspects of potassium management in cropping systems
In the previous section we have discussed some aspects of integratedtechnologies for increasing productivity and sustainability of agriculture in bothhumid, sub-humid and semi-arid ecoregions. Soil fertility management is acritical factor for crop production in these ecoregions and out of three majornutrients, K is the most often neglected nutrient, therefore, in this section, wewill discuss some aspects relating to K in integrated management system in theregions. We will restrict our observation to some general issues about fertiliza-tion with K as the other speakers of this symposium will discuss specific detailsin rice-based system, plantation crops system, and agroforestry system.
(i) The changing pattern of N, P, and K fertilizer consumption in tropical andsubtropical Asia is indicative of growing imbalance of nutrients in cropproduction and becoming a potential factor for declining responses to fertilizersand stagnation of yield. The long-term experiments confirm that increased yieldcombined with inadequate and imbalanced application of N,P,K and non returnof crop residue to soil has enhanced K deficiency besides that of micronutrientsand sulphur.
(ii) From the nitrogen, phosphorous, and potassium uptake data in tropical crops(Table 7), it is evident that in cereals the annual removal of K equals or exceedsN whereas the replacement of K by fertilizer represents only a fraction of N asis evident from wide N/K ratios. This is not a healthy sign. Secondly, most ofthe K uptake in cereals is stored in straw or stover which is mostly removedfrom the field as animal feed and not directly returned to the soil as regularfertility management practice as is the case in developed countries. Thirdly,crops like roots and tubers, banana, pineapple, sugarcane, coffee, tobacco,coconut and oil palm are more heavy feeders of K and large quantities of theirharvestable produce is exported from the region. Thus, unless a deliberate effortis made to return to the soil what is removed, it will have serious deleteriouseffect on yields.
192
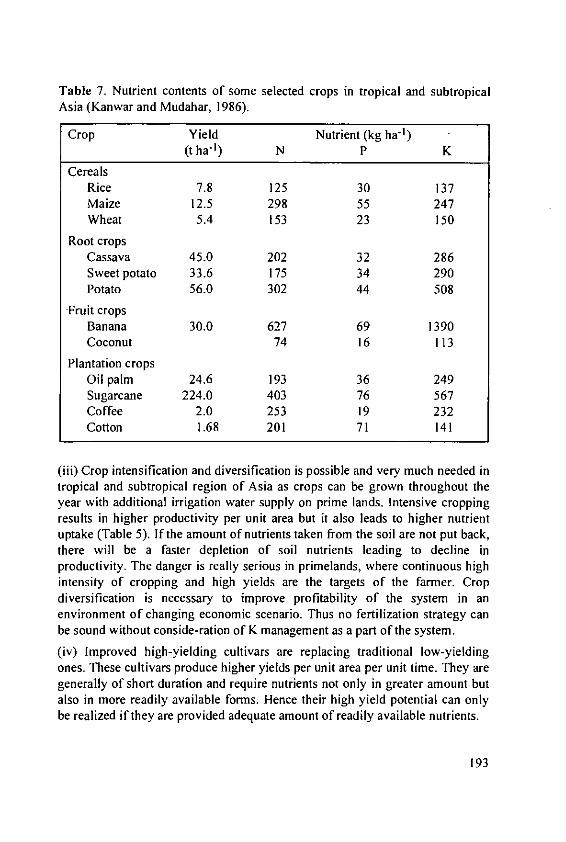
Table 7. Nutrient contents of some selected crops in tropical and subtropicalAsia (Kanwar and Mudahar, 1986).
Crop Yield Nutrient (kg hat1)(t ha-') N P K
CerealsRice 7.8 125 30 137Maize 12.5 298 55 247Wheat 5.4 153 23 150
Root cropsCassava 45.0 202 32 286Sweet potato 33.6 175 34 290Potato 56.0 302 44 508
Fruit cropsBanana 30.0 627 69 1390Coconut 74 16 113
Plantation cropsOil palm 24.6 193 36 249Sugarcane 224.0 403 76 567Coffee 2.0 253 19 232Cotton 1.68 201 71 141
(iii) Crop intensification and diversification is possible and very much needed intropical and subtropical region of Asia as crops can be grown throughout theyear with additional irrigation water supply on prime lands. Intensive croppingresults in higher productivity per unit area but it also leads to higher nutrientuptake (Table 5). If the amount of nutrients taken from the soil are not put back,there will be a faster depletion of soil nutrients leading to decline inproductivity. The danger is really serious in primelands, where continuous highintensity of cropping and high yields are the targets of the farmer. Cropdiversification is necessary to improve profitability of the system in anenvironment of changing economic scenario. Thus no fertilization strategy canbe sound without conside-ration of K management as a part of the system.
(iv) Improved high-yielding cultivars are replacing traditional low-yieldingones. These cultivars produce higher yields per unit area per unit time. They aregenerally of short duration and require nutrients not only in greater amount butalso in more readily available forms. Hence their high yield potential can onlybe realized if they are provided adequate amount of readily available nutrients.
193

(v) Better weed control and pest management is essential to ensure greaterefficiency of nutrient input as all the yield reducers, adversely affect thenutrient-use efficiency and profitability of the system. Potassium is consideredan effective nutrient to enhance the ability of the plant to withstand diseaseshence it becomes an additional benefit to crops besides the nutritional effect.(vi) The long-term experiments on intensive cropping show that the sites whichdid not show K deficiency on short-term experiments began to manifest its defi-ciency on cropping in the long run. The observation of Nambiar and Ghosh (1987)discussed in previous pages, clearly demonstrates that on continuous croppingdespite the same high input of NPK year after year, the crop had to draw upon Kreserves of the soil, as the annual K input was not adequate to meet the demand(Table 8).
Table 8. Potassium balances in experimental plots under intensive croppingover the 1971/83 period (Nambiar and Ghosh, 1987).
kg ha.' K20
Soil type No. of crops Mean annual K balance
location harvested Added Removed Balance NPK plots NP plots
AlluvialLudhiana 35 1490 3346 -1856 -66 -229BlackJabalpur 23 654 3722 -3068 -434 -481RedHyderabad 19 565 2002 -1437 -151 -215LateriteBhubaneswar 23 1369 2434 -1065 -92 -133
Sub-montanePalampur 21 1384 1468 -84 -37 -109TaraiPannagar 24 760 3284 -2524 -308 -386
Similar was the experience of Lin Bao (1985) from China - that responses toK in wetlands increased gradually in areas where cultivation has been continuousand HYV and multiple cropping was introduced. The results from an 8-year-oldexperiment on an Alfisol at ICRISAT Asia Center under rainfed conditions indica-te that responses to K in the second 4-year cycle of cropping were more frequentthan in the first 4-year cycle. The changes in soil K status also show (Table 9)that N application enhanced K uptake and caused its depletion. The exchangeableK content of the soil decreased from about 60 mg kg-' to about 40 mg kg- I after8 years cropping in the absence of K application. Those experiments also confirmthat any conclusion based on short-term observations are misleading.
194
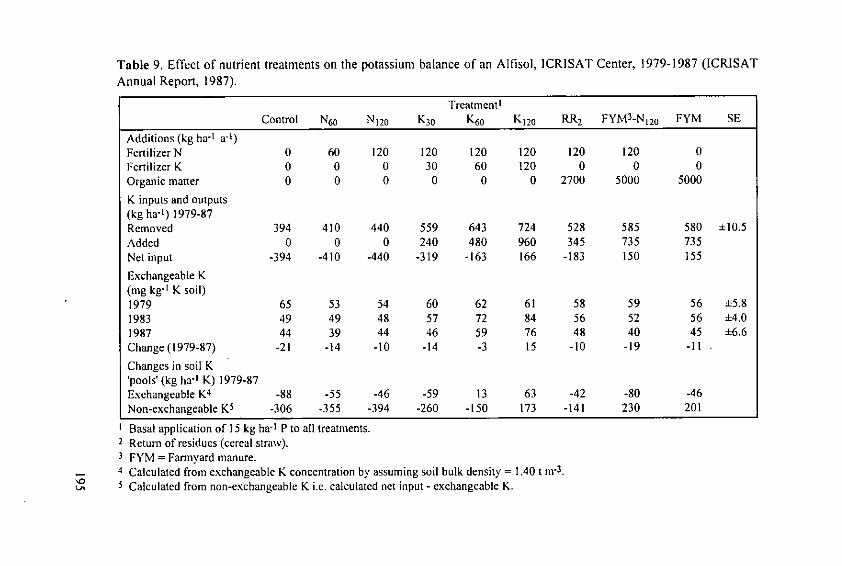
Table 9. Effect of nutrient treatments on the potassium balance of an Alfisol, ICRISAT Center, 1979-1987 (ICRISAT
Annual Report, 1987).
Treatment]Control N60 N120 K30 K60 K120 RR2 FYM3-N2o FYM SE
Additions (kg ha-1 a-')Fertilizer N 0 60 120 120 120 120 120 120 0Fertilizer K 0 0 0 30 60 120 0 0 0Organic matter 0 0 0 0 0 0 2700 5000 5000
K inputs and outputs(kg ha- 1) 1979-87Removed 394 410 440 559 643 724 528 585 580 ±10.5Added 0 0 0 240 480 960 345 735 735Net input -394 -410 -440 -319 -163 166 -183 150 155
Exchangeable K(mg kg -' K soil)1979 65 53 54 60 62 61 58 59 56 ±5.81983 49 49 48 57 72 84 56 52 56 ±4.01987 44 39 44 46 59 76 48 40 45 ±6.6Change (1979-87) -21 -14 -10 -14 -3 15 -10 -19 -11
Changes in soil K'pools' (kg ha- K) 1979-87Exchangeable K4 -88 -55 -46 -59 13 63 -42 -80 -46Non-exchangeable K5 -306 -355 -394 -260 -150 173 -141 230 201Basal application of 15 kg ha-4 P to all treatments.
2 Return of residues (cereal straw).3 FYM = Farmyard manure.4 Calculated from exchangeable K concentration by assuming soil bulk density = 1.40 t M-3.5 Calculated from non-exchangeable K i.e. calculated net input - exchangeable K.
(vii) Many crops do take more K from soil than the external input and the crophas to draw upon even fixed resources of the soil as the exchangeable pool maynot be able to meet this demand. Split application and integrated nutrient (NPK)management is the best approach to get the best results from the application ofK. Where use of FYM, crop residues and green manuring is feasible, the Kneeds, can be suitably met provided the K status is continually monitored andsteps taken to correct the imbalances.
Supplying the K need of crops through fertilizers should be strategic, i.e.,other sources of K, available at the farm should be used first and the balanceshould be made up by fertilizer. Cereal stalk/stover contain nearly 2/3 of total Kuptake and wherever possible stalk/stover should be put back to soil. If straw isfed to animals then FYM should be added to the soil. Among the Asiancountries, China gives much importance to this aspect of nutrient recyclingwhen compared to other countries in the region. Other crop managementcomponents like weed control, pest and disease control, appropriate watermanagement will lead to a better crop growth and development by use ofadequate nutrient supply and finally improved and sustained crop productivity.Therefore, a balance integrated nutrient management strategy should becombined with other good crop management practices for the maximumbenefits to farmers on a sustainable basis.
References
Amon, 1. (1985): Coordinator's report on session No. I - Yield potentials andnutrient requirement of crops. pp. 121-124. In: Proceedings of the 19thColloquium of the International Potash Institute, held in Bangkok, Thailand.
Biswas, B.C. and Tewatia, R.K. (1991): Nutrient balance in agroclimaticregions of India, an overview. Fertilizer News 36(6): 13-17.
Borlaugh, N.E. and Dowswell, C.R. (1994): Feeding a human population thatincreasingly crowds a fragile planet. Keynote lecture. In: Supplement toTransactions of the 15th World Congress of Soil Science, Acapulco,Mexico. p. 15.
De Datta, S.K. (1985): Nutrient requirement for sustained high yield of rice andother cereals. pp. 97-120. In: Proceedings of the 19th Colloquium of theInternational Potash Institute held in Bangkok, Thailand.
EI-Swaify, S.A., Pathak, P., Rego, T.J. and Singh, S. (1985): Soil managementfor optimized productivity under rainfed conditions in the semi-arid tropics.Advances in Soil Science 1: 1-64.
Eswaran, Fl. (1992): Role of soil information in meeting the challenges ofsustainable land management. J. Indian Society of Soil Science 40(1): 6-24.
196
FAO (Food and Agriculture Organization of the United Nations) (1978):Fertilizer year book 1978, FAO Statistics series No. 23, p. 115.
FAO (Food and Agriculture Organization of the United Nations) (1991):Fertilizer year book 1991, FAO Statistics series No. 106, p. 147.
FAO (Food and Agriculture Organization of the United Nations) (1978):Production year book 1978, FAO Statistics series No. 22, p. 287.
FAO (Food and Agriculture Organization of the United Nations) (1992):Production year book 1992, FAO Statistics series No. 112, p. 281.
Gohil, H.P. and Majumdar, M.H. (1994): Pricing and promoting strategies inemerging fertilizer scenario: role and responsibilities. Fertilizer News 39(8):35-40.
Hanson, R.G. and Cassman, K.G. (1994): Soil management and sustainableagriculture in the developing world. In: Transactions of the 15th WorldCongress of Soil Science, Acapulco, Mexico: Volume 7(a): 17-33.
ICRISAT (International Crops Research Institute for the Semi-Arid Tropics)(1980): pp. 213-215. In: Annual Report 1978-79. Patancheru, A.P. 502 324,India: ICRISAT.
ICRISAT (International Crops Research Institute for the Semi-Arid Tropics)(1988): pp. 315-318. In: Annual Report 1987. Patancheru, A.P. 502 324,India: ICRISAT.
Juo, A.S.R., Caldwell, J.O. and King, B.T. (1994): Place for alley cropping insustainable agriculture in the humid tropics. In: Transactions of the 15thWorld Congress of Soil Science, Acapulco, Mexico: Vol.7(a): 98-109.
Kampen, J. and Burford, JR. (1980): Production systems of soil relatedconstraints in the semi-arid tropics: special reference to India. pp. 141-165.In: Proceedings for alleviating soil related constraints to food production inthe tropics. Los Bafios, Philippines: International Rice Research Institute.
Kanwar, J.S. (1974): Assessment of potassium fertilizer in the tropics and sub-tropics of Asia. pp. 201-227. In: Proceedings of the 10th Congress ofInternational Potash Institute, Budapest, Hungary.
Kanwar, J.S. (1982): Problems and potentialities of Vertisols and Alfisols - Thetwo important soils of SAT - ICRISAT experience. pp. 119-138. TropicalAgriculture Research Series No. 15. Tropical Agriculture Research Center,Ministry of Agriculture, Forestry and Fisheries. Yatabe, Tsukuba, lbaraki,305, Japan.
Kanwar, J.S. and Mudahar, M.S. (1986): Fertilizer sulphur and food production.Martinus Nijhoff/Dr. W. Junk Publishers, Dordrecht. The Netherlands. 247PP.
197

Kinje, J.W. (1994): Role of irrigation management in sustainable farmingsystems. In: Transactions of the 15th World Congress of Soil Science,Acapulco, Mexico: Vol. 7(a): 72-86.
Lin Bao (1985): Effect and management of potassium fertilizer on wetland ricein China. pp. 285-292. In: Wetland soils: Characterization, classification andutilization. Los Baflos, Philippines: International Rice Research Institute.
Nambiar, K.K.M. and Ghosh, A.B. (1987): Crop response to K and soil Kbalance in long-term fertilizer experiments. PRII Research Review SeriesNo.4: 125-134.
Palaniappan, S.P., Narang, R.S., Radha, K.S. and Dev, G. (1990): Some resultsfrom maximum yield research in India. pp. 65-77. In: Proceedings ofSymposium on Maximum Yield Results. A satellite Symposium of the 14thInternational Congress of Soil Science, Aug. 1990. Kyoto, Japan.
Prasad, C. (1989): Agricultural extension service. pp. 234-267. In: 40 years ofagricultural research and education in India. Indian Council for AgriculturalResearch, Krishi Bhavan, New Delhi, India.
RAPA (Regional Office for Asia and the Pacific) (1988): Selected indicators offood and agriculture development in Asia and the Pacific regions. RAPA ofFAO 1987-88, Bangkok, Thailand.
Rego, T.J. and Seeling, B. (1994): Long-term effects of legume based croppingsystems on soil N status and mineralization in Vertisols (in Print).
Sanchez, P.A. (1994): Tropical soil fertility research towards the secondparadigm. In: Transactions of the 15th World Congress of Soil Science,Acapulco, Mexico: Vol. 7(a): 65-88.
Sankaran, A. (1993): Global agricultural perceptions and prerequisites. M.S.Swaminathan Foundation Monograph 6.
Singh, R.P. and Sharma, Shrinivas (1989): Managing rain water to betterfarmers' lot. Indian Farming 39(9): 61-63.
Srivastava, K.L. and Jangawad, L.S. (1988): Water balance and erosion rates ofVertisol watershed under different managements. Indian Journal of DryLand Agricultural Research and Development 3(2): 137-144.
Tandon, H.L.S. and Sekhon, G.S. (1988): Potassium research and agriculturalproduction in India. Fertilizer Development and Consultation Organization,New Delhi, India. pp. 144+vii.
Virmani, S.M. and Eswaran, H. (1989): Concepts for sustenance of improvedfarming systems in the semi-arid regions of developing countries. pp. 89-108 In: Proceedings of an International Conference on Soil Quality in Semi-Arid Agriculture, June I 1-16, 1989, Saskatchewan, Canada.
World Development Report (1992): Development and the environment.Published by the World Bank and the Oxford University Press. 25-43 pp.
198

Potassium Balance and Soil Potassium SupplyingPower in Intensive, Irrigated Rice Ecosystems
A. Dobermann, P.C. Sta. Cruz, and K.G. CassmanInternational Rice Research Institute, P.O. Box 933, Manila 1099, Philippines*
Abstract
Potassium is taken up by a healthy rice crop in large quantities and it plays amajor role in many physiological processes. Research in many countries hasindicated a negative K balance in intensive, irrigated rice ecosystems. In thispaper, we analyze K uptake, K use efficiency, K balance, and soil K-supplyingpower in long-term fertility trials at 11 sites in 5 countries of Asia. Results ofthis study show that depending on the absolute yield level, the K requirementsof rice vary from 17 to 30 kg K per ton of grain. For yields above 8 t ha-1 , the
total K uptake exceeds 200 kg ha -1. In irrigated rice systems of Asia, the amountof K annually cycling from the soil into rice plants is in the range of 7-10million tons, and about I million t of this is removed with harvested grain alone.The K balance at most experimental sites was highly negative and response to Kcan only be expected if the K rate is high enough and N and P are in amplesupply. We describe two new approaches for assessing the K-supplying powerof rice soils. The first method combines several static measures of readilyavailable K and potential slow K release, but it requires determination of awhole set of standard soil properties. The second approach uses ion exchangeresin capsules to derive kinetic parameters of rapid and slow K release duringanaerobic incubation. Results obtained with this method were closely correlatedto K uptake under field conditions and the method seems to have great potentialas a multi-element, dynamic soil test for rice. There is evidence that high(Ca+Mg)/K ratios may signal K deficiency in rice soils. Possible reasons for thisare discussed, but more research is needed to verify whether long-term irrigatedrice production may result in significant changes in the cation chemistry of rice
soils. Efficient K management for rice has to be based on the K input/outputbalance, taking into account the yield target and the effective K-supplyingpower of the soil.
* e-mail address: [email protected]
199
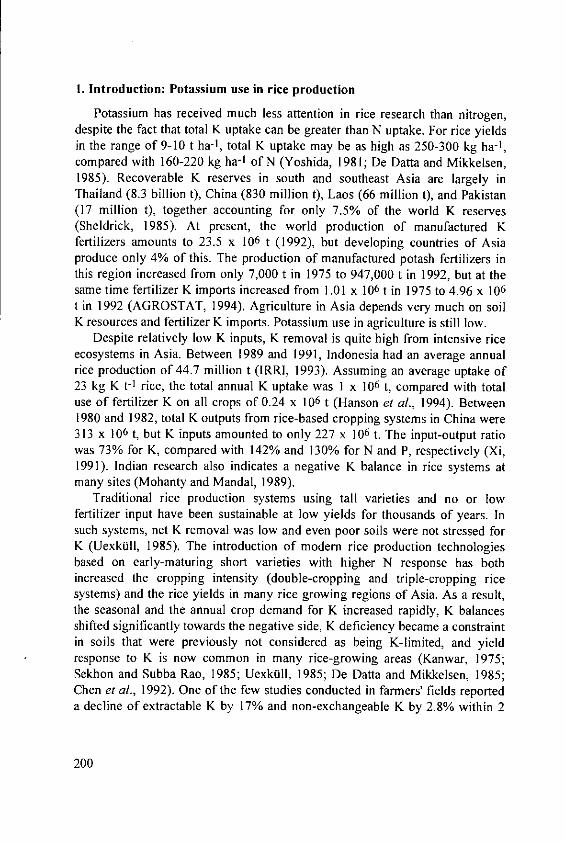
I. Introduction: Potassium use in rice production
Potassium has received much less attention in rice research than nitrogen,despite the fact that total K uptake can be greater than N uptake. For rice yieldsin the range of 9-10 t ha-1 , total K uptake may be as high as 250-300 kg ha-1,compared with 160-220 kg ha- 1 of N (Yoshida, 1981; De Datta and Mikkelsen,1985). Recoverable K reserves in south and southeast Asia are largely inThailand (8.3 billion t), China (830 million t), Laos (66 million t), and Pakistan(17 million t), together accounting for only 7.5% of the world K reserves(Sheldrick, 1985). At present, the world production of manufactured Kfertilizers amounts to 23.5 x 10⁶ t (1992), but developing countries of Asiaproduce only 4% of this. The production of manufactured potash fertilizers inthis region increased from only 7,000 t in 1975 to 947,000 t in 1992, but at thesame time fertilizer K imports increased from 1.01 x 10⁶ t in 1975 to 4.96 x 10⁶t in 1992 (AGROSTAT, 1994). Agriculture in Asia depends very much on soilK resources and fertilizer K imports. Potassium use in agriculture is still low.
Despite relatively low K inputs, K removal is quite high from intensive riceecosystems in Asia. Between 1989 and 1991, Indonesia had an average annualrice production of 44.7 million t (IRRI, 1993). Assuming an average uptake of23 kg K t- 1 rice, the total annual K uptake was 1 x 10⁶ t, compared with totaluse of fertilizer K on all crops of 0.24 x 10⁶ t (Hanson et al., 1994). Between1980 and 1982, total K outputs from rice-based cropping systems in China were313 x 106 t, but K inputs amounted to only 227 x 106 t. The input-output ratiowas 73% for K, compared with 142% and 130% for N and P, respectively (Xi,1991). Indian research also indicates a negative K balance in rice systems atmany sites (Mohanty and Mandal, 1989).
Traditional rice production systems using tall varieties and no or lowfertilizer input have been sustainable at low yields for thousands of years. Insuch systems, net K removal was low and even poor soils were not stressed forK (Uexktlll, 1985). The introduction of modem rice production technologiesbased on early-maturing short varieties with higher N response has bothincreased the cropping intensity (double-cropping and triple-cropping ricesystems) and the rice yields in many rice growing regions of Asia. As a result,the seasonal and the annual crop demand for K increased rapidly, K balancesshifted significantly towards the negative side, K deficiency became a constraintin soils that were previously not considered as being K-limited, and yieldresponse to K is now common in many rice-growing areas (Kanwar, 1975;Sekhon and Subba Rao, 1985; Uexkcll, 1985; De Datta and Mikkelsen, 1985;Chen et al., 1992). One of the few studies conducted in farmers' fields reporteda decline of extractable K by 17% and non-exchangeable K by 2.8% within 2
200

cropping cycles measured in 14 paddy fields of Kanpur, India, where illite is thedominant clay mineral and farmers did not apply fertilizer K (Tiwari, 1985).
Except in some countries (e.g. India), routine soil testing for specifyingfertilizer K recommendations is still not widely used in Asia. Thus, decisions byfarmers about K application heavily depend on personal preferences, fertilizermarket conditions, or government regulations, rather than on knowledge of thesoil K status and K demand by the crop (yield target). In the 1994 dry season,for example, we have conducted a survey of 60 farms in Central Luzon,Philippines. Rice yields ranged from 2.9 to 8.0 t ha-1 and fertilizer K wasapplied at an average level of 26 kg ha-1 . Even though almost all farmers in thisregion recycled most of the K contained in straw, the K balance was negativefor 30% of the fields. Moreover, there was no correlation between soil K statusmeasured by NH 4-acetate extraction and fertilizer K application, or between theamount of K applied and rice yield.
In contrast to this, highly subsidized fertilizer prices and blanket recommen-dations for fertilizer use may even lead to misuse and buildup of soil P and K inirrigated rice systems as reported in several parts of Java, Indonesia (Adiningsihet al., 1991; Hanson et al., 1994). Recently, fertilizer subsidies were reduced orcompletely removed in several Asian countries (e.g. India and Indonesia) andfarmers will be increasingly compelled to optimize use of indigenous andexternal nutrient reserves. Quantitative understanding of the nutrient balanceand soil nutrient-supplying power will provide the information needed todevelop such improved nutrient management strategies targeting high yields,high net returns, and maintenance of the soil resource base over the long run.
In this paper, we present some recent research on K requirements ofirrigated rice systems, aiming at a better understanding of the major factorsaffecting crop K demand and soil K supply (Fig. I). We will first examine therelationship between total K uptake and grain yield as the central yardstick forassessing the K requirements of a rice crop. Then we will examine the Kbalance in long-term fertility experiments (LTFE) with rice in five countries andits implications for soil and crop management. Based on the K balance and cropK requirements, we will assess static soil testing approaches for characterizingthe K-supplying capacity of rice soils and general factors affecting K release.Finally, we will evaluate a new dynamic soil test for rice, which integratesmeasures of different soil K fractions and K mobility in submerged soil into akinetic index of the K-supplying capacity.
201
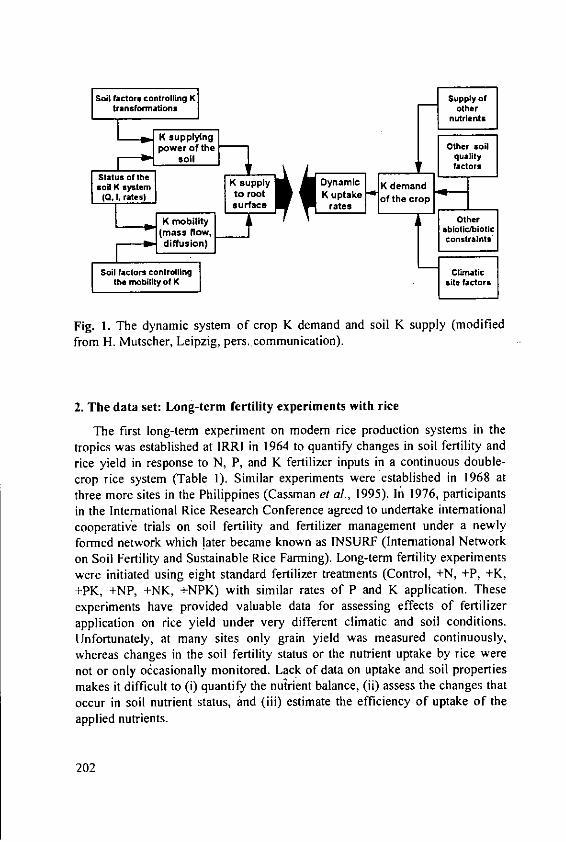
Soil factors controlling K Supply oftransformations other
nutrients
Soil quality
SStatus of the K sppltoramisoil K system K demand
(0,1. rates) to root K uptake of the crop
2. Thedat
:o ility
eaopers
SSoil factors controlling Climatic
the mbility of K st atr
Fig. 1. The dynamic system of crop K demand and soil K supply (modifiedfrom H. Mutscher, Leipzig, pers. communication).
2. The data set: Long-term fertility experiments with rice
The first long-term experiment on modem rice production systems in thetropics was established at IRRI in 1964 to quantify changes in soil fertility andrice yield in response to N, P, and K fertilizer inputs in a continuous double-crop rice system (Table 1). Similar experiments were established in 1968 atthree more sites in the Philippines (Cassman et al., 1995). In 1976, participantsin the International Rice Research Conference agreed to undertake internationalcooperative trials on soil fertility and fertilizer management under a newlyformed network which later became known as INSURF (International Networkon Soil Fertility and Sustainable Rice Farming). Long-term fertility experimentswere initiated using eight standard fertilizer treatments (Control, +N, +P, +K,+PK, +NP, +NK, +NPK) with similar rates of P and K application. Theseexperiments have provided valuable data for assessing effects of fertilizer
application on rice yield under very different climatic and soil conditions.Unfortunately, at many sites only grain yield was measured continuously,whereas changes in the soil fertility status or the nutrient uptake by rice were
not or only ocasionally monitored. Lack of data on uptake and soil propertiesmakes it difficult to (i) quantify the nutrient balance, (ii) assess the changes that
occur in soil nutrient status, and (iii) estimate the efficiency of uptake of theapplied nutrients.
202
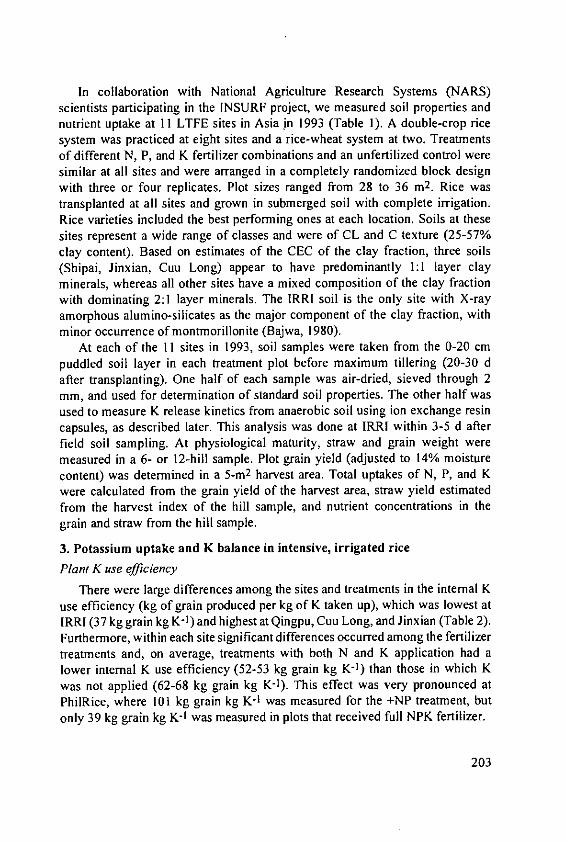
In collaboration with National Agriculture Research Systems (NARS)scientists participating in the INSURF project, we measured soil properties andnutrient uptake at II LTFE sites in Asia jn 1993 (Table 1). A double-crop ricesystem was practiced at eight sites and a rice-wheat system at two. Treatmentsof different N, P, and K fertilizer combinations and an unfertilized control weresimilar at all sites and were arranged in a completely randomized block designwith three or four replicates. Plot sizes ranged from 28 to 36 M2. Rice wastransplanted at all sites and grown in submerged soil with complete irrigation.Rice varieties included the best performing ones at each location. Soils at thesesites represent a wide range of classes and were of CL and C texture (25-57%clay content). Based on estimates of the CEC of the clay fraction, three soils(Shipai, Jinxian, Cuu Long) appear to have predominantly 1:1 layer clayminerals, whereas all other sites have a mixed composition of the clay fractionwith dominating 2:1 layer minerals. The IRRI soil is the only site with X-rayamorphous alumino-silicates as the major component of the clay fraction, withminor occurrence of montmorillonite (Bajwa, 1980).
At each of the 11 sites in 1993, soil samples were taken from the 0-20 cmpuddled soil layer in each treatment plot before maximum tillering (20-30 dafter transplanting). One half of each sample was air-dried, sieved through 2mm, and used for determination of standard soil properties. The other half wasused to measure K release kinetics from anaerobic soil using ion exchange resincapsules, as described later. This analysis was done at IRRI within 3-5 d afterfield soil sampling. At physiological maturity, straw and grain weight weremeasured in a 6- or 12-hill sample. Plot grain yield (adjusted to 14% moisturecontent) was determined in a 5-m2 harvest area. Total uptakes of N, P, and Kwere calculated from the grain yield of the harvest area, straw yield estimatedfrom the harvest index of the hill sample, and nutrient concentrations in thegrain and straw from the hill sample.
3. Potassium uptake and K balance in intensive, irrigated rice
Plant K use efficiency
There were large differences among the sites and treatments in the internal Kuse efficiency (kg of grain produced per kg of K taken up), which was lowest atIRRI (37 kg grain kg K-') and highest at Qingpu, Cuu Long, and Jinxian (Table 2).Furthermore, within each site significant differences occurred among the fertilizertreatments and, on average, treatments with both N and K application had alower internal K use efficiency (52-53 kg grain kg K-') than those in which Kwas not applied (62-68 kg grain kg K-1). This effect was very pronounced atPhilRice, where 101 kg grain kg K- 1 was measured for the +NP treatment, butonly 39 kg grain kg K-1 was measured in plots that received full NPK fertilizer.
203
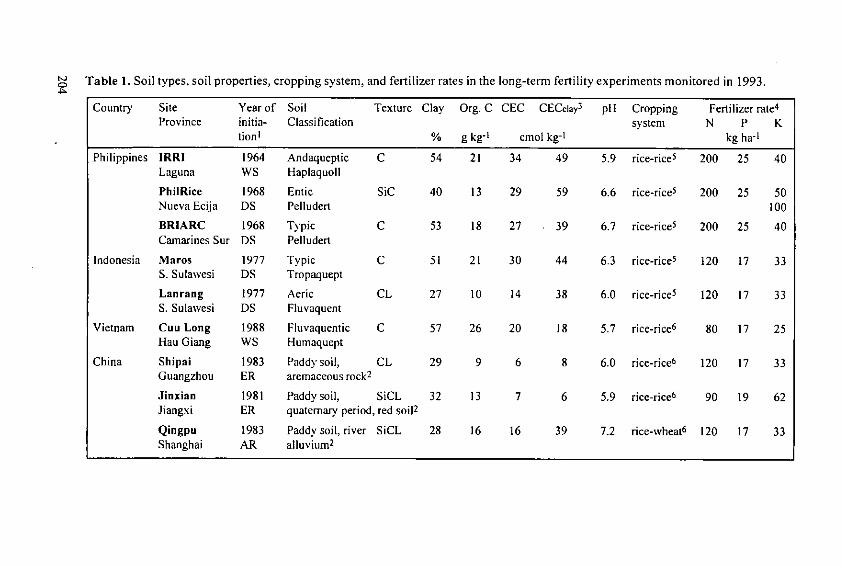
Table 1. Soil types, soil properties, cropping system, and fertilizer rates in the long-term fertility experiments monitored in 1993.
Country Site Year of Soil Texture Clay Org. C CEC CECclay 3 pH Cropping Fertilizer rate4
Province initia- Classification system N P Ktion i % g kg-' cmol kg-1 kg ha-1
Philippines IRRI 1964 Andaqueptic C 54 21 34 49 5.9 rice-rice5 200 25 40Laguna WS Haplaquoll
PhilRice 1968 Entic SiC 40 13 29 59 6.6 rice-rice5 200 25 50Nueva Ecija DS Pelludert 100
BRIARC 1968 Typic C 53 18 27 39 6.7 rice-rice5 200 25 40Camarines Sur DS Pelludert
Indonesia Maros 1977 Typic C 51 21 30 44 6.3 rice-rice5 120 17 33S. Sulawesi DS Tropaquept
Lanrang 1977 Aeric CL 27 10 14 38 6.0 rice-rice5 120 17 33S. Sulawesi DS Fluvaquent
Vietnam Cuu Long 1988 Fluvaquentic C 57 26 20 18 5.7 rice-rice6 80 17 25Hau Giang WS Humaquept
China Shipai 1983 Paddy soil, CL 29 9 6 8 6.0 rice-rice6 120 17 33Guangzhou ER aremaceous rock 2
Jinxian 1981 Paddy soil, SiCL 32 13 7 6 5.9 rice-rice6 90 19 62Jiangxi ER quaternary period, red soil2
Qingpu 1983 Paddy soil, river SiCL 28 16 16 39 7.2 rice-wheat6 120 17 33Shanghai AR alluvium2

Table 1. Continued.
Country Site Year of Soil Texture Clay Org. C CEC CECclay 3 pH Cropping Fertilizer rate4
Province initia- Classification system N P Ktion1 % g kg-' cmol kg-1 kg ha-1
India Pantnagar 1984 Fluventic SiL 25 9 12 35 8.5 rice-wheat6 120 17 33Uttar Pradesh WS Ilaplaquoll
Coimbatore 1988 Vertic C 43 7 27 59 8.2 rice-mung- 100 21 41Tamil Nadu DS Ustropept bean-sesame 6
WS wet season, DS dry season, ER early rice, AR autumn rice.2 Based on Chinese soil classification.3 CECcIay = (CEC-0.35org.C)* 100/Clay. This equation assumes an average CEC of soil organic matter of 350 cmol kg C-1 (Van
Reeuwijk, 1992).4 P and K are incorporated into the soil basally, N is applied in three equal splits: basal, mid-tillering, and first-flowering; the basal
application is incorporated into the soil. At PhilRiceNK receives 50 kg K ha-1, NPK receives 100 kg K ha- 1.5 Remaining stubble incorporated into soil.6 All straw removed (Cutting at ground level).

Table 2. Potassium response and K use efficiency in long-term fertility experiments with rice (1993 DS).oN
Site Variety Grain yield (GY) I Internal K Yield Agronomic A Extract.
+NPK +NP efficiency 2 response to K K efficiency3 K4
(kg ha-') (kg ha-l) kg grain (%) A kg grain cmol kg-1
kg K uptake kg K applied
BRIARC IR 72 7009a 7403a 59 ± 5 0 0.0 0.110*Coimbatore CR 1009 5587a 4840b 56+ 7 15 18.2 0.026
Cuu Long IR 64 5167a 5280a 68 ± 10 0 0.0 -0.035
IRRI IR 72 7825a 7385a 37 ± 7 5 9.9 -0.088Jinxian ER 2106 3830a 3633a 76 ± 18 5 3.2 0.048*
Lanrang 5 IR42 5385a 5219a 3 5.1 -0.037
Maros IR 74 5572a 5422a 42 ± 5 3 4.5 -0.011
Pantnagar Pant Dhan-4 5685a 5083b 61 ± 5 12 18.3 0.066*
PhilRice IR 72 8052a 5464b 61 ± 27 47 26.0 0.077*
Qingpu Hanfeng 7792a 7804a 89 ± 9 0 0.0 0.012
Shipai Guichaoxuan 4001a 3904a 57+ 8 3 2.9 0.000
I Grain yields adjusted to 14% moisture content. Means with common letters are not significantly different within sites by LSD
(5%).2 Internal K use efficiency = GY/total K uptake (all measured as kg ha-'). Average ± standard deviation of all treatments.3 Agronomic K efficiency = (GYNPK-GYNp)/fertilizer K applied (all measured as kg ha-1).4 Extractable K in +NPK treatment minus extractable K in -NPK treatment, both measured in 1993 DS.5 Long-term average yields. Yields in 1993 DS were affected by rat damage.* Significant difference by LSD (5%).

With a limited K supply, the crop will use the amount taken up as economi-cally as possible - i.e., there is maximum dilution of K in the plant and K uptakeis not influenced by growth but only by the supply (source limitation). Whenthe supply of K is high and growth is not limited by K uptake, the internal K levelwill be high, i.e., there is maximum accumulation (sink limitation). In this situa-tion, growth is only limited by factors other than K, such as other nutrients, solarradiation, or pests (Janssen et al., 1990). The internal K use efficiency may there-fore serve as an indicator of the K status of the rice plant. This was very high forIRRI and the +NPK treatment at PhilRice, but low for Jinxian and Cuu Long.
Potassium uptake and future K requirements
Total K uptake ranged from 23 to 255 kg ha-1 with a mean of 95 kg ha-1 for
4.89 t ha- 1 rice across treatments and sites (Table 3). This compares to uptake of
20-200 kg N ha-! and 4-34 kg P ha-1 (data not shown), demonstrating the
importance of K in rice nutrition. The interactions with other nutrients and
growth factors explain the wide range of K removal by modem rice varietiesgiven in the literature. Estimates range from 16-50 kg K tH of rough rice
(Goswami and Banerjee, 1978; Yoshida, 1981; De Datta, 1981; De Datta and
Mikkelsen, 1985; Mohanty and Mandal, 1989), which makes it difficult to
estimate the K requirements for a given yield target.The relationship between grain yield and K uptake is scattered and nonlinear
(Fig. 2). The scatter of data however forms the envelope of maximum dilution
and maximum accumulation of K in the rice plant. The model for the response
curve is an additive model with an exponential component describing thenonlinear decrease in the internal K use efficiency between 2 and 5 t ha-t grain
yield and a linear response component with an average slope of 22.5 kg K ha-1 t
grain-] for yields above 5 t ha- 1. Although the data are somewhat scattered, this
model suggests that at yields from 5 to 8 t ha-1 , the internal response to K is
more or less constant and driven by sink size, whereas at low yield levels source
limitation occurs and internal K use efficiency is very high. More research is
needed to verify this hypothesis.The K requirement of rice in the yield range of 4-8 t ha-1 varied from 17 to
30 kg K t grain- 1. Because K is absorbed at a rate that parallels dry matter
production and N uptake, 75-90% of the total K requirement is taken up
between tillering and early grain filling, a period as short as 60 d (De Datta and
Mikkelsen, 1985; Shi et al, 1990). Using the equation given in Figure 2, yieldsof 5 and 8 t ha-t would require total K uptake of 105 and 237 kg ha- l ,
respectively. Daily K uptake rates between tillering and flowering of rice must
therefore average 1.4-1.6, and 3.0-3.6 kg K ha-1 d- 1, respectively.
207
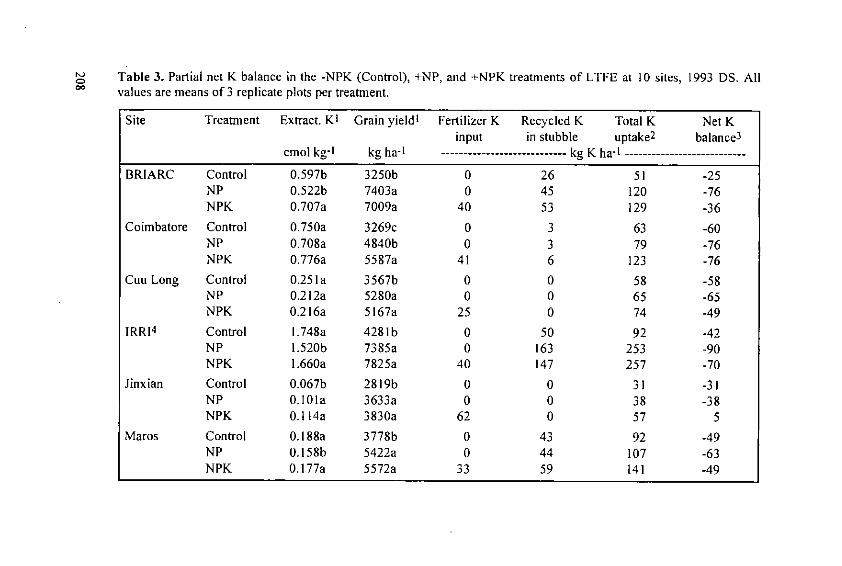
Table 3. Partial net K balance in the -NPK (Control), +NP, and +NPK treatments of LTFE at 10 sites, 1993 DS. Allvalues are means of 3 replicate plots per treatment.
Site Treatment Extract. K I Grain yield[ Fertilizer K Recycled K Total K Net Kinput in stubble uptake2 balance3
cmol kg-' kg ha-I ------- - - - - - - - - - - - - - - - - - - - - - kg K ha- 1 ----------- - - - - - - - - - - - - - - -
BRIARC Control 0.597b 3250b 0 26 51 -25NP 0.522b 7403a 0 45 120 -76NPK 0.707a 7009a 40 53 129 -36
Coimbatore Control 0.750a 3269c 0 3 63 -60NP 0.708a 4840b 0 3 79 -76NPK 0.776a 5587a 41 6 123 -76
Cuu Long Control 0.25 la 3567b 0 0 58 -58NP 0.212a 5280a 0 0 65 -65NPK 0.216a 5167a 25 0 74 -49
IRRI 4 Control 1.748a 4281b 0 50 92 -42NP 1.520b 7385a 0 163 253 -90NPK 1.660a 7825a 40 147 257 -70
Jinxian Control 0.067b 2819b 0 0 31 -31NP 0.101a 3633a 0 0 38 -38NPK 0. 114a 3830a 62 0 57 5
Maros Control 0.188a 3778b 0 43 92 -49NP 0.158b 5422a 0 44 107 -63NPK 0.177a 5572a 33 59 141 -49

Table 3. Continued.
Site Treatment Extract. K! Grain yield' Fertilizer K Recycled K Total K Net Kinput in stubble uptake2 balance 3
cmol kg-1 kg ha-I ------- - - - - - - - - - - - - - - - - - - - - - kg K ha- I ----------- - - - - - - - - - - - - - - -
Pantnagar Control 0.126b 2125c 0 0 36 -36NP 0.118b 5083b 0 0 74 -74
NPK 0.192a 5685a 33 0 91 -58
PhilRice Control 0.207b 2594c 0 32 54 -22NP 0.137c 5464b 0 22 54 -32
NPK 0.283a 8052a 100 114 209 5
Quingpu Control 0.206a 4377b 0 0 48 -48NP 0.196a 7804a 0 0 76 -76NPK 0.217a 7792a 33 0 102 -69
Shipai Control 0.124a 3713a 0 0 59 -59NP 0.116a 3904a 0 0 60 -60
NPK 0.124a 4001a 33 0 72 -39
All sites Control 0.426 3371 0 15 58 -43N 0.378 4834 0 23 82 -59
NP 0.379 5630 0 27 93 -65
NK 0.472 5052 38 28 101 -36
NPK 0.447 6055 43 37 125 -44
Means with common letters are not significantly different within sites by LSD (5%).2 Total K uptake = K grain + K straw3 Partial net K balance = fertilizer K input - (K uptake-K recycled)4 Very high K input from irrigation (120-200 kg ha-1). Actual net K balance is highly positive.

8000-*
7000 • BRIARCCoimbatore
6000. TV Cuu LongiSOOO u IRRI
5000 'Jixian1 O 0: t - Lanrang? 4000 0 Maros
PantnagarA_-300 -* PhilRice
~D 2000 "y =2756(1 -expoO3) 26 5 )+22.5x o Oingpua Shipai
1000 r2 = 0.67*
00 50 100 150 200 250
Total K uptake (kg ha")
Fig. 2. Relationship between total K uptake and grain yield in long-term fertilityexperiments with rice at II sites. Values shown are replicates of six fertilizertreatments at each site, sampled inthe 1993 dry season,
In 1990, the total annual rice production in Asia was 480 million t. Thepresent harvest area of irrigated rice in Asia is 74 million ha, with an averageyield level of 4.9 t ha- l . Irrigated rice alone accounts for 75% (363 million t) ofthe overall rice production in Asia (IRRI, 1993). Yields of irrigated rice in Asiamust rise to 8.0 t ha-1 by the year 2025 with no change in the harvested area tomeet a projected demand on rice from irrigated systems of 592 million t(Cassman and Pingali, 1995). The K content in the grain of modem ricevarieties (MV) is fairly constant between 0.25 and 0.33%. Thus, current annualK removal from irrigated rice paddies with harvested grain is as large as 0.9-1.2x 10⁶ t. By 2025, this would increase to 1.5-2.0 x 10⁶ t. The actual net Kremoval from rice-based cropping systems is probably much greater due toincreasing use of straw as forage, fuel, or for industrial purposes (Uexkoll,1985). About 80-85% of the K absorbed by rice remains in the i'egetative partsat maturity and thus straw management has a large impact on the overall Kbalance. Using the model shown in Figure 2, the total amount of K cyclingannually from the soil into rice plants in irrigated rice systems of Asia is in therange of 7-10 million t (assuming 20-27 kg K t grain-I). Clearly, this exceedsthe present level of fertilizer K use on rice by a large margin and indigenous soilK reserves are the major source of K supply.
210
At present, we still do not have enough data for rice yields beyond 8 t ha- t
and it is possible that the curve shown in Figure 2 flattens off, but it seems that
the K requirements for very high yields are also very high. This has implicationsfor ongoing research at IRRI aiming at raising the yield plateau up to 15 t ha-1
(Cassman, 1994). The exact amounts of K required for such yields must still bedetermined and the rice root system must be capable of taking up 300-400 kg Kha-1 in a period as short as 50-60 d.
Yield response to applied K
The average yield increase from K application in 1993 when N and P werealso applied was 8.5%, but the K response differed significantly among sites(Table 2). At PhilRice, there was a 47% yield increase, and significant yieldincreases were also obtained at Coimbatore and Pantnagar (12-15%). All othersites showed only a slight K response of 3-5%. The wide range in response to Kwas reflected in the agronomic K use efficiency, which ranged from 0 to 26 kg
grain per kg fertilizer K applied. In general, these results agreed with the long-term K response. Sites such as IRRI, Lanrang, Maros or Qingpu never showed aclear K response, whereas the average long-term response at BRIARC, Jinxian,Shipai, and Pantnagar was somewhat larger than in 1993. Only PhilRice showeda trend of increasing K response with time, which was also caused by theincrease of the fertilizer K rate from 50 kg ha-1 (1968-75) to 75 kg ha-1 (1976-91) and 100 kg ha-1 (since the 1992 wet season).
What are the reasons for the small K response at most sites in this study?
One hypothesis is that high amounts of K are added from sources other thanfertilizer. At IRRI, for example, K concentration in soil solution (10-20 mg L-')
and extractable K reserves (1.5-1.8 cmol kg-1) are very high, and high K inputfrom irrigation water (120-200 kg ha-1 season- l ) prevented any significantfertilizer K effects throughout the 29-yr period. In fact, there has been a buildupin the extractable K content i in this experiment, even in -K treatments (De Dattaet al., 1988). However, none of the other sites has such large K inputs fromsources other than fertilizer. A second hypothesis is that slowly available,nonexchangeable K contributes more to K nutrition than K provided byfertilizer. We will examine this aspect in more detail later, but high release ofslowly available K may have caused little or no K response at sites such as
BRIARC, Lanrang, Maros, and Qingpu (Tables I and 2).
Throughout this paper, we use the term extractable K, which includes solution
and readily exchangeable K as commonly extracted by IN NH 4 acetate.
211

Finally, a third hypothesis raises the question of whether the NPK rates usedat some of the sites provided sufficient nutrient supply to maximize crop growthand K demand, and whether other nutritional constraints may have limited Kuptake and/or K response. On average, only 40 kg K ha-1 was applied in the +Ktreatments and the amounts of fertilizer K applied in these experiments wouldonly provide enough K for 2.5-3.5 t grain, if all fertilizer K was acquired by thecrop. A very small and even nonsignificant K response was observed at threesites which also had the lowest yields (Cuu Long, Shipai, Jinxian). Apparently,low N and P uptake has reduced K effects at those sites, and, at least at Shipaiand Jinxian, the expected K response (very low extractable K content, Table 3)was not achieved. At Jinxian, a very low N/K ratio in the straw (0.7) indicatedsevere N deficiency.
Many fertilizer experiments with rice in the tropics did not show response toK and most soils were capable of sustaining rice yields at a level of 2 t ha-1
without the need for applied K (Kemmler, 1980; De Datta and Mikkelsen,1985). Yield gains due to K application may appear small for many sites, butthey are closely related to N-K interactions (De Datta and Mikkelsen, 1985; DeDatta et al., 1988). In many of those trials, N rates and rice yields were low anda significant response to K is only likely at higher yield levels due to proper Nand P management, as clearly shown at PhilRice.
Partial net K balance
Published data suggest negative K balances in rice-based cropping systemsof southern China (Huang et al., 1990), India (Mohanty and Mandal, 1989;Mongia el al., 1991; Prasad, 1993), and Bangladesh (Abedin Mian el al., 1991),but comparative, quantitative studies across different soils and agroecologicalzones are few. Calculating the whole K balance in an irrigated ricefield wouldrequire measurements of plant K uptake; K losses due to leaching, runoff andseepage; and K gains from fertilizer, recycled rice straw, irrigation water,capillary rise, and rainfall. Quantitative data about these different inputs andoutputs are still scarce and many of the balance components are site-specific.River or well water used for irrigation differs considerably, but 1-4 mg K L-1
(Kawaguchi and Kyuma, 1977; De Datta el al., 1988; Abedin Mian et al., 1991)seems to be a reasonable estimate for many sites in Asia. Given this range andan estimated net irrigation water supply of 750-1250 mm H2 0 per rice crop, theK input due to irrigation would be in the range of 7-50 kg ha-1. Potassium inputfrom rainfall was estimated in a study in Bangladesh and amounted to 12 kgha-1 yr - , with the K concentration in rainwater ranging from 0.25 to 1.8 mg L- 1
(Abedin Mianetal., 1991).
212

In contrast, substantial amounts of K may be lost from irrigated rice paddiesdue to leaching, seepage, and runoff. On a lateritic red soil in southern China,44% of the applied fertilizer K was lost due to leaching (Huang et al., 1990).Potassium leaching losses at a continuous irrigated rice site in Brazil were aslarge as 0.56 kg ha- I d- 1 (Beltrame et al., 1992) and 39 kg K ha-1 yr-1 were lostdue to percolation from an Aeric Haplaquept in Bangladesh (Abedin Mian etal., 1991). Heavy clay soils with low percolation rates (1-5 mm d-l) would havemuch lower K leaching losses. Other factors of the water balance such as bypassflow during land soaking and seepage (lateral flow through the bunds of anirrigated paddy) have not been considered in these nutrient balance studies.Under most circumstances, inputs and outputs of K from rainfall, irrigation, andleaching seem to sum up to zero or leaching losses may even surpass the Kgains. To our knowledge, only one complete balance study (Abedin Mian et al.,1991) has been published, and K percolation losses exceeded the K input fromirrigation, rainfall, and capillary rise by 6 kg ha - 1 yr-.
Without detailed data sets, we will use a simplified approach for calculatingthe partial net K balance based on fertilizer K input, the aboveground K uptake,and the K recycled with the straw, as shown in Table 3. The partial net Kbalance was highly negative at all sites and in all NPK combinations tested. Onaverage, control plots with a mean yield of 3.4 t ha-1 had a net deficit of 43 kgK ha-I season -1 , whereas for different NPK combinations the net balance was -36 to -65 kg ha- I season-] (Table 3).
Potassium deficits were largest in the +NP treatments (-59 to -65 kg K ha -
season-1), reflecting again the strong interactions between crop K demand and Nsupply. Only at two sites, PhilRice and Jinxian, was the K balance in the +NPKplots slightly positive, which may result from the higher K rates, the large propor-tion of K recycled with the straw at PhilRice, and the low yield at Jinxian in 1993.Clearly, fertilizer K application in the +NK and +NPK treatments was not largeenough to match the K outputs at most sites. Levels of extractable K in +NPKtreatments were not significantly different from those in the control plots at sevensites, indicating no accumulation of soil K due to fertilizer application (Table 2).
At Jinxian, during a period of 13 yr there was an estimated net negative partialK balance of 730 kg K ha-1 in the +NK and +NPK treatments, although thefertilizer rate was 62 kg ha-1 per rice crop (Table 4). In the minus K plots, the Kremoval exceeded I t ha-1 for 25 rice crops. The annual net K balance at Shipaiwas indeed more negative and losses of 400-550 kg K ha-1 were estimated for a
period of only 9 rice crops. At both sites, this was accompanied by a significantdepletion of extractable soil K, which was most severe in the +NP and +Ntreatments but also occurred in the +NPK treatment because of insufficient Kinputs.
213

_2 Table 4. Long-term K balance and change in extractable K in different fertilizer treatments at Jinxian and Shipai," China. The cropping system at both sites is rice (DS) - rice (WS) and all straw is removed at harvest.
Jinxian Treatment
1981-1993, 25 rice crops -NPK +N +NP +NK +PK +NPK
Average K balance per rice crop, kg/haFertilizer K 0 0 0 62 62 62DS yield 2837 3571 3765 3976 3201 4331WS yield 2956 3758 4163 4213 3386 4616
K uptake DS 43 43 52 80 63 89K uptake WS 48 43 42 103 67 93
K balance DS -43 -43 -52 -18 -I -27K balance WS -48 -43 -42 -41 -5 -31
Total K balance (1981-1993), kg/haFertilizer K 0 0 0 1550 1550 1550K uptake 1135 1072 1177 2277 1631 2280K balance -1135 -1072 -1177 -727 -81 -730
Extractable K (cmol/kg)1981 (Initial) 0.251 0.251 0.251 0.251 0.251 0.2511993 DS 0.067 0.080 0.101 0.148 0.149 0.114A Extractable K -0.184 -0.171 -0.150 -0.103 -0.102 -0.137
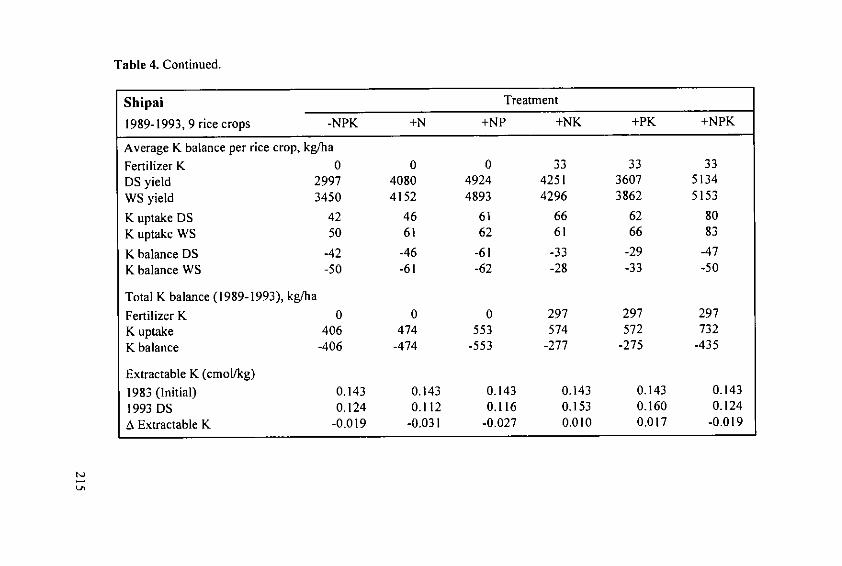
Table 4. Continued.
Shipai Treatment
1989-1993, 9 rice crops -NPK +N +NP +NK +PK +NPK
Average K balance per rice crop, kg/haFertilizer K 0 0 0 33 33 33DS yield 2997 4080 4924 4251 3607 5134
WS yield 3450 4152 4893 4296 3862 5153
K uptake DS 42 46 61 66 62 80K uptake WS 50 61 62 61 66 83
K balance DS -42 -46 -61 -33 -29 -47K balance WS -50 -61 -62 -28 -33 -50
Total K balance (1989-1993), kg/ha
Fertilizer K 0 0 0 297 297 297K uptake 406 474 553 574 572 732K balance -406 -474 -553 -277 -275 -435
Extractable K (cmollkg)1983 (Initial) 0.143 0.143 0.143 0.143 0.143 0.1431993 DS 0.124 0.112 0.116 0.153 0.160 0.124A Extractable K -0.019 -0.031 -0.027 0.010 0.017 -0.019
hi
It is interesting to note that the K response measured in 1993 was small atboth sites (3-5%, Table 2), but long-term average yield increases due to Kapplication are in the order of 17 and 5% for Jinxian and Shipai, respectively.
These figures do not provide a complete picture of the K balance and theactual balance sheet may differ markedly due to other sources of inputs or lossnot measured in the partial budgets. For example, the amount of K contained inunfilled spikelets at five sites (IRRI, PhilRice, BRIARC, Pantnagar, Qingpu)ranged from I to 12 kg K ha- 1 or, on average, 4.6% additional K uptake, whichis not considered in our partial K balances. However, we can conclude that inmost rice-growing regions, K inputs do not match net K removal from thesystem and that, over the long run, there is an alarming situation of continued Kmining from intensively used riceland. At many sites in Asia, the K ratesapplied by the farmers are even far below the rates used in the long-termexperiments and, particularly on soils where straw is completely removed, Kexhaustion may be even more rapid and significant. Occurrence of response toK application is then a question of time, the overall yield level (actual sink size),the amount of NPK fertilizer applied, the K buffering capacity of the soil, andstraw management. Therefore, after having quantified the crop demand for acertain yield goal, we need to quantify the potential soil K supply as the basisfor predicting the optimum fertilizer recommendations. Most soil tests, however,do not provide accurate information about the actual soil K-supplying capacity.
4. Assessing the soil K-supplying power: static soil tests
Soil K tests for rice
Soil testing has been widely used to estimate the amount of K that becomesplant available during a rice cropping season. The standard approach involvesrapid chemical analyses treating the soil with chemical extractants, correlationand calibration to yield response, and definition of critical thresholds or thresholdranges at which a yield response to applied K can be expected. Suitable soiltests should quantify intensity and quantity factors as well as the rates of Krelease and transport to the root surface, as illustrated in Figure I. It is clear thatmost of the presently used methods only describe one or two components of theK-supplying power of rice soils and are, in their inherent nature, static.
Extractable soil K (solution + exchangeable K) is still the most widespreadmeasure of available K in rice soils, but its suitability as a measure of plantavailable K remains controversial. The literature gives numerous examples ofhigh correlation to plant K uptake (Adiningsih and Sudjadi, 1983; Gill and Dev,1985; Nath and Purkaystha, 1988; Sutar et al., 1992; Panda and Panda, 1993),but its reliability is unsatisfactory, especially when soils with different texturesand clay mineralogy are considered together (Kemmler, 1980; Wanasuria et al.,
216

1981). Although 0.18-0.21 cmol Kkg-I seems to be a fairly well accepted criticallevel for IN NH 4 acetate-extractable K in rice soils (Mahapatra and Prasad,1970; Su, 1976; IRRI, 1985; Sutar et al., 1992; Prasad and Prasad, 1992; Joneset al., 1982; Chen et al., 1987), the overall range of published data is as wide as0.10-0.41 cmol K kg-1 (Xie et al., 1989; Adiningsih and Sudjadi, 1983; Bansalet al., 1985). Given a bulk density of 1.2 g cm-3, this translates into 94-385 kg Kha-1 for the upper 20-cm layer.
Only about 1-2% of the total soil K exists as K' in the soil solution or asexchangeable K adsorbed on soil colloids (De Datta and Mikkelsen, 1985; Basilioand San Valentin, 1990) and many rice soils possess significant K-fixing proper-ties. The contribution of exchangeable and solution K to the total K uptake maythen be rather small. Attempts have been made to develop soil tests that providea measure of fixed K. The methods primarily use boiling I N HNO 3 soilextraction or extraction with NaTPB (Mc Lean and Watson, 1985). The I NHN0 3 method is widely used by Indian and Chinese researchers, but it also wasnot always correlated to grain yield and total K uptake (Nath and Purkaystha,1988; Panda and Panda, 1993). Furthermore, when the actual K supply to an
actively absorbing root surface is considered, other soil factors controlling the Kexchange equilibrium and the K activity in soil solution are important (Fig. 1).
Another problem is that much of the actual correlation research is done inpot experiments at research stations (Adiningsih and Sudjadi, 1983; Gill andDev, 1985; Panda and Panda, 1993), under conditions that are quite differentfrom those in farmers' fields. Therefore, most of these published calibrations donot provide reliable measures of soil K-supplying power unless calibrated for aspecific soil type.
A new index of soil K-supplying power
We describe a new approach that combines different static soil tests into onemeasure of overall K availability. The factors that we consider in estimatingpotential K supply as measured by plant K uptake include
(i) K saturation of the CEC (or extractable K)(ii) potential release of fixed K+, which is determined by the clay mineral
composition and quantitatively described by the CEC of the clay fraction(CECciay), and
(iii) the effect of cation interactions on K adsorption and K activity in the soilsolution, described by the ratio of extractable Ca+Mg to extractable K.
We will derive a new K availability index using data from the +NP and+NPK treatments at all sites because we want to get a measure for situations inwhich K uptake is not limited by N or P -- i.e., where high yields are targeted.Furthermore, fertilizer K in the +NPK plots was applied 30-40 d before the soil
217

samples were taken so that applied K would have time to equilibrate betweenexchangeable and fixed pools (Olk et al., 1995). The +NP and +NPK treatmentsrepresent different soil K supply with varying contributions of readily availableand fixed K to total plant K uptake.
Potassium uptake was positively correlated with extractable K or Ksaturation (KS) and CECclay at many sites, but K uptake was suppressed at high(Ca+Mg)/K ratios (Fig. 3). However, any one of these static measures by itselfdid not explain the variation in K uptake very well. The effect of extractable Kor KS on K uptake was very clear for soils having a low CECclay, i.e.,predominantly 1:1 layer clay minerals in their clay fraction (Fig. 4a), as in thecase of Jinxian and Shipai. In contrast, in soils with K-fixing clay minerals, KSor extractable K were not suitable as single indicators of K status (Fig. 4b). TheCECciay seemed to have a significant influence on K uptake only at valuesabove 35 cmol kg- 1. At PhilRice, the high CECjay corresponded to high Kuptake only in the +NPK treatment, whereas yields and K uptake in the +NPplots remained low. Obviously, on those plots the reserves of nonexchangeableK depleted during 25 years of double-rice cropping and the CECclay alone doesnot provide enough information about potential release of fixed K+. The soil atCoimbatore had both a high K saturation (2.5-3%) and a very high CECiay (60cmol kg-'), but some other factor prevented high K uptake at this site.Apparently, the (Ca+Mg)/K ratio (all measured by I N NH 4-acetate extraction)provides this additional information on the K status. Where this ratio exceeds80-100, it becomes more likely that K supply to roots is limited, as shown forCoimbatore, Pantnagar, and the +NP treatment at PhilRice (Fig. 3c). Possiblereasons for this negative effect are discussed below. The combination of thesethree factors yields a new K supply index (PSI), which we define as
CECclay [P]PSI1= KS (C-M)
KP
where CECclay is the CEC of the clay fraction (cmol kg-1), KS is the Ksaturation of the total CEC (%), and K, Ca, Mg are the exchangeable + solutionforms of those elements (cmol kg-1). Assuming an average CEC of soil organicmatter of 350 cmol kg C-', (Van Reeuwijk, 1992) we estimate CECcIay as
CEC (CEC - 0.350C) 100 [2]Cay - Clay
where CEC is the total CEC (cmol kg-1 ), OC is the organic carbon content(g kg-1 ), and clay is the clay content (%). This equation does not consider pH-dependent charge of soil organic matter, but, in a flooded soil at steady statereduction, the pH range is rather narrow (6.5-7) in most soils and does not much
218
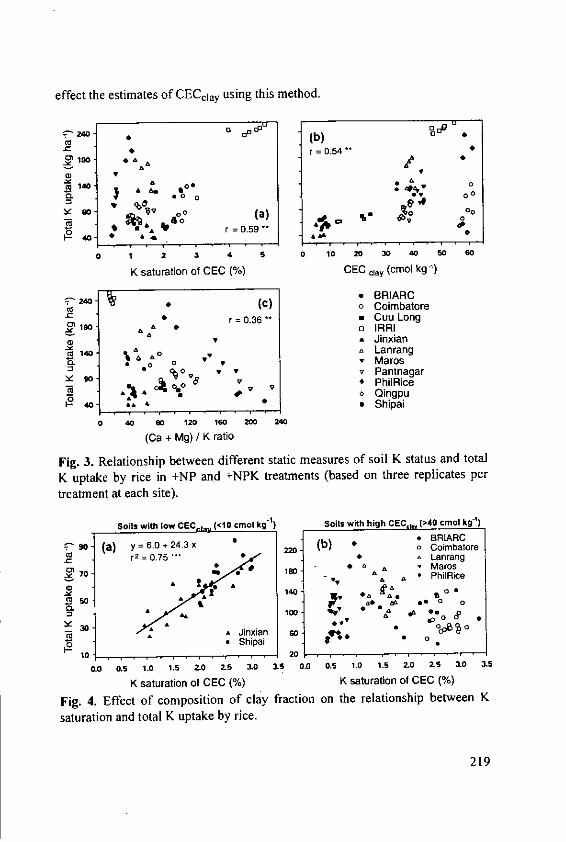
effect the estimates of CECciay using this method.
(b) LJ*
r = 0.54
"~130 - *• /A
0 0
a 1 2 4 5 010 W W 40 W W
K saturation of CEC ()CEC clay (cmoI kg"
- BRIARC00 (C) o Coimbatore
* r =0.36 Cuu Long1Wo A o IRRI
- Jinxian.Lanrang0 0 Maros
= • o V , Pantnagar8 4 PhilRice
•4 * ingpu0 a Shipai
0 40 W 120 GO 5 0
(Ca + Mg) / K ratio
Fig. 3. Relationship between different static measures of soil K status and total
K uptake by rice in +NP and +NPK treatments (based on three replicates per
treatment at each site).
KSoil with low CECO,,, (%10 mol k Sas with high CECly (40 cmol kg)
so (a) yR 6.0 + 24A3 x R BRIARC(b) o C oimbato re
A
r0 A .1 Ji2iao
r014 r2
07 * * Lanrang anan
* Maros aro
Y 30 0 * h co
o9 I QingpunGOcA
S Shipa* ia
00 0 . . . . . . 5 0 0 2.0 . 5 . .
K saturation of CEC (%) K saturation of CEC (%)
Fig. 4. Effect of composition of clay fraction on the relationship between K
saturation and total K uptake by rice.
219

This new index, PSI, is a measure of the potential supply of K to the riceplant, taking into consideration (i) K release from non-exchangeable fractions(CECciay), which contributes most to K uptake at very low K saturation and (ii)K exchange equilibrium and K activity which may be negatively affected byhigh (Ca+Mg)/K ratios. Thus, PSI combines the interactions of severalprocesses and it was positively correlated to K uptake (r=0.76*'*). To fullyaccount for differences in the K status across a wide range of soils, we have toadd a measure of the labile K such as extractable K or KS as a single factorcontrolling K supply in soils without substantial release of fixed K' and withoutserious limitations due to Ca:Mg:K imbalances. Regression analysis resulted inthe following model for the combined +NP and +NPK treatments
UK = 34 + 61 K + 162 PSI r2 = 0.72*** or [3]UK = 2.5 + 22 KS + 208 PSI r2 = 0.75.**
with UK= total K uptake (kg ha-1), K=extractable K (cmol kg-'), and KS=Ksaturation (%). In this model, the partial correlation coefficients for KS and PSIare 0.64 and 0.80, respectively. When analyzing both treatments separately, wefound differences in the effects of KS and PSI on the K uptake. In the +NPtreatments, partial correlations of 0.81 for KS and 0.75 for PSI revealed similarcontribution of both K indices to variation in plant K uptake. The model for the+NPK plots explained 90.2% of total variation in K uptake and the partialcorrelations were 0.55 for KS and 0.94 for PSI:
UK=35+24K +245PSI r2 = 0.88 ** or [4]UK= 19+ 11 KS+263 PSI r2 = 0.90'**
It is interesting to note here that we could not find any significant effect ofclay content on total K uptake, even when its interactions with CECclay wereanalyzed. This is probably due to the relatively high clay content at most sites inour data set (25-57% clay, Table I) and may be different when coarser texturedsoils are considered. Further improvement of the prediction can be expected byusing a modified K activity ratio which also includes Fe2+ and Mn 2+ (Pasricha,1983). Equations [I] and [3] account for the complexity of the processesgoverning K supply to the root surface (Fig. I), but their drawback is theirinherent empirical and static character. One would have to measure CEC, soilorganic matter content, clay content, and extractable K, Ca, and Mg to predict Kuptake. The approach proposed here may have its merits for land evaluationstudies and detailed mapping projects, where many of these parameters aredetermined anyway. For routine soil testing purposes, this is not feasible and adirect, dynamic, and practical measure of K supply is needed.
220

Effects of Ca and Mg on K availability to the rice plant
Pasricha (1983) obtained a very high positive correlation between K activityratio (K/[Ca+Mg]) and K uptake, and it has been proposed that excessive(Ca+Mg)/K ratios are somehow related to K deficiency of rice (IRRI, 1985).Actual mechanisms responsible for this association, however, are not fullyunderstood. Our data confirm these findings, and we speculate about possibleexplanations for this phenomenon. One hypothesis is an antagonism between Kand Mg or K and Ca+Mg in plant uptake. Antagonistic effects, particularly atlow K levels, were reported for rye (Soares et al., 1983), cowpea (Narwal et al.,1985), and rice (Fageria, 1983). However, the strong inhibitiory effect of high(Ca+Mg)/K ratios on resin K accumulation (Fig. 6b) indicates that the phenome-non seems to be more related to cation equilibria and diffusivity in flooded soil.
Therefore, a second hypothesis is that high (Ca+Mg)/K ratios result instronger K adsorption to cation exchange sites, which reduces K bufferingpower and K diffusion rates in the soil. Studies on nonrice soils havedemonstrated that many soils have a preferential adsorption of K+ over Ca2± orMg 2' and that this preference is relatively greater at low K levels and withvermiculitic or micaceous components of the clay fraction (Rhue and Mansell,1988; Neog et al., 1991; Feigenbaum et al., 1991; Parfitt, 1992; Tang andSparks, 1993). A side effect of increased preferential K adsorption would be asignificant decrease in solution phase K and an increasing (Ca+Mg)/K ratio.Under most situations for a particular cation, the ratio of concentration insolution to the exchangeable form will change during the course of ion uptake(Bouldin, 1989). If there is a high preferential K adsorption on the exchangesites of clay minerals, the amount of K desorbing may then decline, resulting ina reduced K uptake at high (Ca+Mg)/K ratios in their exchangeable forms.Bouldin (1989) has also demonstrated that variation in the ratio of exchangeableions changes the ratio of ions in solution but has little impact on the K uptake aslong as the anion concentration is high enough to keep the cation concentrationof all cations high as well. Bicarbonate is the dominant anion in flooded soils atpH >5.5. However, in an acidified environment, such as the rhizosphere of rice,HCO 3 concentrations will be low (Kirk, 1993), which may reduce K diffusionrates to the root at high (Ca+Mg)/K ratios. The results obtained with the resinmethod (see Section 5), which is a measure of ion activities in soil solution overa certain time period, clearly confirmed that high (Ca+Mg)/K ratios, either intheir extractable forms (Fig. 6b) or measured as ion movement to a H+ releasingresin sink (data not shown), significantly reduced cumulative K adsorption bythe resin. The influence of high (Ca+Mg)/K ratios on resin K adsorptionincreased with increasing incubation time (1-14 d).
221

These mechanisms seem to have relevance for sustaining soil quality inintensively used irrigated riceland. Irrigation water inputs of cations such asCa 2+or Mg 2± may be large, particularly where ground water is the source forirrigation. In contrast, the rice crop does not take them up in large quantities.Ranges of 3-7 kg Ca and 2-5 kg Mg t- grain yield have been reported for rice(Goswami and Banerjee, 1978; De Datta, 1981; De Datta and Mikkelsen, 1985).Over time, therefore, high net additions of Ca and Mg to the system and a wide(Ca+Mg)/K ratio in the irrigation water may change the Ca:Mg:K equilibrium ina paddy soil. If the (Ca+Mg)/K ratio increases, this could reduce K availability.In a long-term experiment with a pearl millet - wheat rotation in India,application of farmyard manure for 20 years resulted in a consistent increase inthe preference of K' over Ca2+ adsorption (Mehta et al., 1988), but it stillremains a challenge to verify similar long-term effects for soils planted to rice.
5. Assessing the soil K-supplying power: dynamic soil tests
Besides simple and quick chemical extractions, other methods have beendeveloped to characterize quantity and intensity factors (Q/1) of soil K supply(Mc Lean and Watson, 1985; Haby et al., 1990). Among them, Beckett's Q/Irelationships of exchangeable/solution K' (Pasricha, 1983; Basilio and SanValentin, 1990) and electro-ultrafiltration (EUF) have been successfully appliedas indicators of K supply from rice soils (Wanasuria et al., 1981; Ramanathanand Nemeth, 1982). With regard to rice, the EUF method does not account forchanges in K availability in a flooded soil undergoing reduction, and diffusion insoil is not measured. Most of these methods are fairly expensive and laborious.
Ion exchange resins have received considerable attention as an alternativemethod for estimating bioavailable nutrients in a more dynamic sense. Resinsmaintain low ion concentrations in solution, thereby stimulating further releasefrom soil solids (Sparks, 1987). They were successfully used to study K releasekinetics from soils and minerals (Pratt, 1951; Arnold, 1958; Feigenbaum et al.,1981; Martin and Sparks, 1983; Havlin and Westfall, 1985; Wimaladasa andSinclair, 1988) and even a few applications to rice soils are known (Xie and Du,1988; Yang et al., 1992; Boruah et al., 1993; Dobermann et al., 1994a;Dobermann et al., 1994b). There is basically a distinction between batch techni-ques - methods in which a soil suspension is shaken with the resin - and in situor in vitro incubation techniques. Advantages and disadvantages of both techni-ques were discussed elsewhere (Dobermann et al., 1994b). Compared with staticextraction soil tests, resin incubation techniques assess the nutrient supply to astrong resin sink over a longer time period and, in most cases, they can accountfor diffusion as one process controlling the amount of K+ adsorbed on the resin.
222

Given this, they are a prototype of a new generation of soil tests, which we maycall "dynamic soil tests", and they integrate parameters of soil K status (Q, I,
rates), K mobility, and other soil factors that influence Q/1 and mobility (Fig. 1).
The phytoavailability soil test for rice: theory and method
In our studies, we adopted a multi-ion resin capsule method -- thephytoavailability soil test, PST (Skogley et al., 1990; Yang et al., 1991). ThePST method is based on the hypothesis that a uniformly shaped and sizedcapsule of mixed-bed cation/anion exchange resin placed in direct contact withsoil solution will accumulate ions from the soil by exchange processes similar tothose of living roots. Resin capsules have a uniform, spherical shape with a totalsurface area of 11.4 cm 2. They contain a 1:1 equivalent mixture of strongly
acidic cation (H+) and strongly basic anion (OH-) exchange resin. A capsule is
placed into a fresh, water-saturated soil sample, usually taken 20-40 d after
transplanting of rice. Because of its high affinity for anions and cations, the
capsule immediately starts to adsorb ions from the surrounding film layer of soil
solution and, in exchange, releases counter ions (H', OH-). Greater cation
uptake results in net acidification of the interfacial solution, simulating
acidification processes occurring in the rhizosphere of rice (Dobermann et al.,1994a). Compared with the relatively small soil volume affected, the exchange
capacity of the capsule is very high (2.2 meq of cation + anion exchange
capacity) and it acts as an infinite, strong sink. Our standard procedure is a 14-d
incubation at 30 °C with removal of capsules from the soil at 1, 2, 4, 7, and 14
d. Capsules are then carefully washed and extracted with 2 N HCI and the
concentrations of eight ions (NH 4-N, P, K, Ca, Mg, Na, Fe, Mn) are determined
in the HCI extract. A nonlinear function is then fitted to the resin adsorptionquantity (RAQ), given in ptmol cm-2 capsule surface:
RAQ(i,t) = a tb a>0 0 < b < 1 [5]
where RAQ(i,t) is the quantity (pmol cm-2) of nutrient i absorbed by the resin at
time t (d) and a and b are positive-valued adjustable parameters, with b
constrained to lie between 0 and 1.
The phytoavailability soil test for rice: interpretation
To assess the K status of a rice soil, we use (i) the aK coefficient and (ii) the
bK coefficient, both estimated by curvilinear regression analysis of RAQ versus
time. It is also possible to estimate the kinetic constants aK and bK by using
only two time steps of I and 7 d or I and 14 d (Dobermann et al., 1994b), with
aK being equal to RAQK at I d.
223

The multiplicative coefficient aK expresses the amount of K adsorbed withinthe first 24 h of incubation. In this phase, the adsorption rate is primarily limitedby film diffusion and ion exchange at the capsule and from soil solids.Therefore, nutrients adsorbed within 24 h should mainly represent fractions thatare either in solution or in dynamic equilibrium with the soil solution. Processesdominating the rate coefficient bK for K are (i) ion diffusion, (ii) cationexchange, (iii) release of specifically bound K from interlayers or wedgepositions of clay minerals (Martin and Sparks, 1983; Havlin and Westfall,1985), and (iv) release of structural K from soil minerals due to acidification(Feigenbaum el at., 1981; Sadusky and Sparks, 1985). Thus, bK characterizesthe capability of a soil to maintain a nutrient flux to a strong sink like a resin ora plant root. It summarizes the potential delivery rate from different pools aswell as the physicochemical characteristics of a soil controlling diffusive solutetransport. Both aK and bK determine the K-supplying power of a soil and thecumulative resin K adsorption within two wk of incubation is a linear functionof both parameters.
Figure 5 shows the mean K kinetics for each treatment of the LTFE at I Isites. They clearly reflect the expected long-term trends in changes of the Kstatus.
1.4 +NK~-NPK1.2 .. .... + NPK
E 1 .0 . . .
+NPa a.80
Kinetic parametersTRTM a b r2
0.4 -NPK 0.363 0.475 0.98C +N 0.359 0.353 0.92
+NP 0.310 0.396 0.980,2 +NK 0.468 0.405 0.95
+NPK 0.408 0.429 0.9800
O.O1
0 2 4 6 8 10 12 14
Time (d)
Fig. 5. Resin K adsorption kinetics in long-term fertility experiments (LTFE)with rice. Curves and kinetic parameters are means of each treatment for the I Isites sampled in 1993.
224
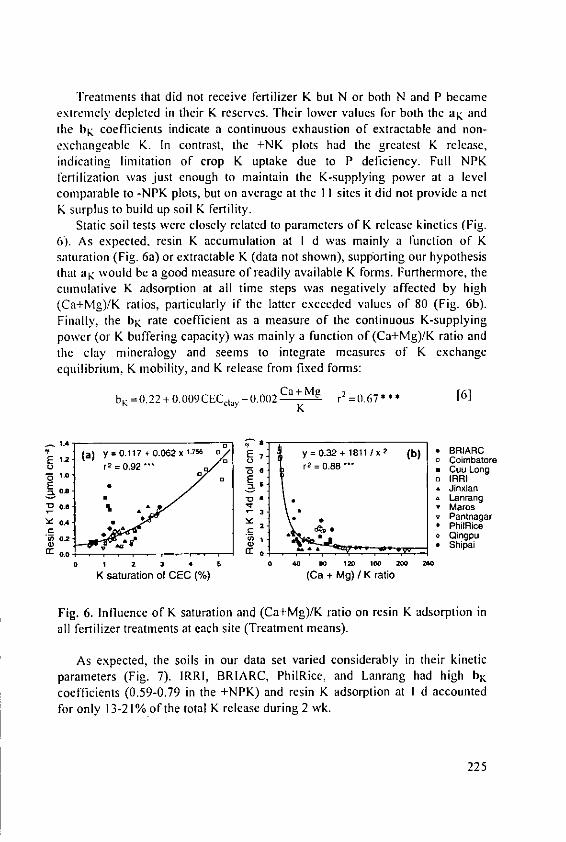
Treatments that did not receive fertilizer K but N or both N and P becameextremely depleted iii their K reserves. Their lower values for both the aK and(ie bK coefficients indicate a continuous exhaustion of extractable and non-exchangeable K. In contrast, the +NK plots had the greatest K release,indicating limitation of crop K uptake due to P deficiency. Full NPKfertilization was just enough to maintain the K-supplying power at a levelcomparable to -NPK plots, but on average at the I I sites it did not provide a netK surplus to build up soil K fertility.
Static soil tests were closely related to parameters of K release kinetics (Fig.6). As expected. resin K accumulation at I d was mainly a function of Ksaturation (Fig. 6a) or extractable K (data not shown), supporting our hypothesisthat aK would be a good measure of readily available K forms. Furthermore, thecumulative K adsorption at all time steps was negatively affected by high(Ca+Mg)/K ratios, particularly if the latter exceeded values of 80 (Fig. 6b).Finally, the bK rate coefficient as a measure of the continuous K-supplyingpower (or K buffering capacity) was mainly a function of (Ca+Mg)/K ratio andthe clay mineralogy and seems to integrate measures of K exchangeequilibrium, K mobility, and K release from fixed forms:
b K =0.22 + 0.009CECctay_ 0.002 Ca+Mg r2 =0.67.** [6]K
1.4 BRIAROE L2 (a) y= 0 .1 17 +O.062x 1.7
E y=O.32 + 18111 x
2 (b) Coimbatore
1 r 0.92 a r n Cuu Long
r= 0.8 Jinxian4 Lanrang
.8 , ,MarosS0.4 Pantnagar
2 2 .2* PhilRice02 t. .o Oingpu
0) -'- Shipai
0 1 2 3 4 5 0 40 W0 1 10 200 40
K saturation of CEC (%) (Ca + Mg) / K ratio
Fig. 6. Influence of K saturation and (Ca+Mg)/K ratio on resin K adsorption inall fertilizer treatments at each site (Treatment means).
As expected, the soils in our data set varied considerably in their kineticparameters (Fig. 7). IRRI, BRIARC, PhilRice, and Lanrang had high bKcoefficients (0.59-0.79 in the +NPK) and resin K adsorption at I d accountedfor only 13-21% of the total K release during 2 wk.
225
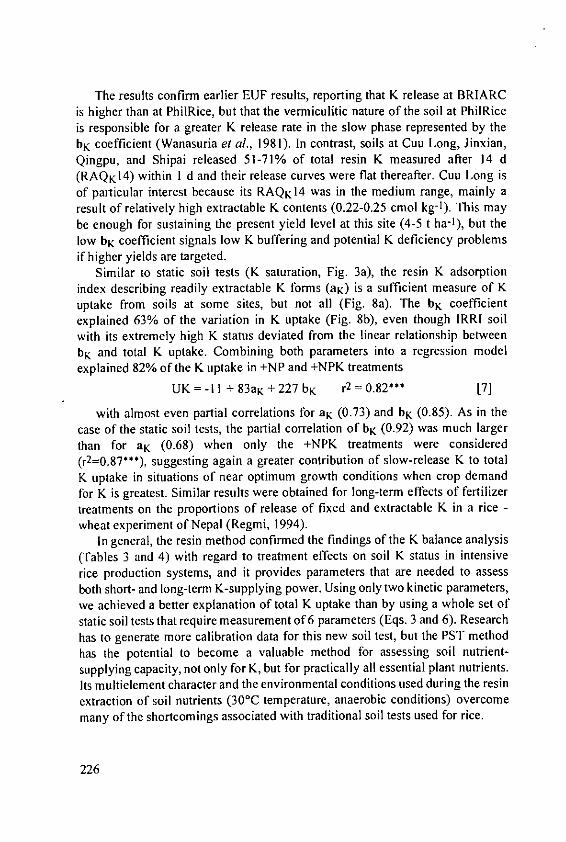
The results confirm earlier EUF results, reporting that K release at BRIARCis higher than at PhilRice, but that the vermiculitic nature of the soil at PhilRiceis responsible for a greater K release rate in the slow phase represented by thebK coefficient (Wanasuria et al., 1981). In contrast, soils at Cuu Long, Jinxian,Qingpu, and Shipai released 51-71% of total resin K measured after 14 d(RAQK14) within I d and their release curves were flat thereafter. Cuu Long isof particular interest because its RAQKI4 was in the medium range, mainly aresult of relatively high extractable K contents (0.22-0.25 cmol kg-1). This maybe enough for sustaining the present yield level at this site (4-5 t ha-1), but thelow bK coefficient signals low K buffering and potential K deficiency problemsif higher yields are targeted.
Similar to static soil tests (K saturation, Fig. 3a), the resin K adsorptionindex describing readily extractable K forms (aK) is a sufficient measure of Kuptake from soils at some sites, but not all (Fig. 8a). The bK coefficientexplained 63% of the variation in K uptake (Fig. 8b), even though IRRI soilwith its extremely high K status deviated from the linear relationship betweenbK and total K uptake. Combining both parameters into a regression modelexplained 82% of the K uptake in +NP and +NPK treatments
UK = -1 I+ 83aK + 227 bK r2 = 0.82*** [7]
with almost even partial correlations for aK (0.73) and bK (0.85). As in thecase of the static soil tests, the partial correlation of bK (0.92) was much largerthan for aK (0.68) when only the +NPK treatments were considered(r2=0.87'**), suggesting again a greater contribution of slow-release K to totalK uptake in situations of near optimum growth conditions when crop demandfor K is greatest. Similar results were obtained for long-term effects of fertilizertreatments on the proportions of release of fixed and extractable K in a rice -wheat experiment of Nepal (Regmi, 1994).
In general, the resin method confirmed the findings of the K balance analysis(Tables 3 and 4) with regard to treatment effects on soil K status in intensiverice production systems, and it provides parameters that are needed to assessboth short- and long-term K-supplying power. Using only two kinetic parameters,we achieved a better explanation of total K uptake than by using a whole set ofstatic soil tests that require measurement of 6 parameters (Eqs. 3 and 6). Researchhas to generate more calibration data for this new soil test, but the PST methodhas the potential to become a valuable method for assessing soil nutrient-supplying capacity, not only for K, but for practically all essential plant nutrients.Its multielement character and the environmental conditions used during the resinextraction of soil nutrients (30'C temperature, anaerobic conditions) overcomemany of the shortcomings associated with traditional soil tests used for rice.
226
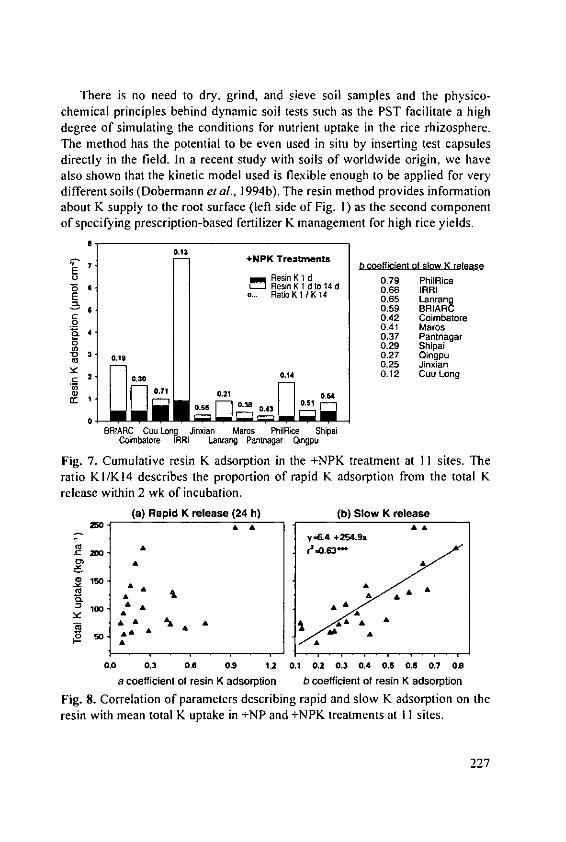
There is no need to dry, grind, and sieve soil samples and the physico-chemical principles behind dynamic soil tests such as the PST facilitate a highdegree of simulating the conditions for nutrient uptake in the rice rhizosphere.The method has the potential to be even used in situ by inserting test capsulesdirectly in the field. In a recent study with soils of worldwide origin, we havealso shown that the kinetic model used is flexible enough to be applied for verydifferent soils (Dobermann etal., 1994b). The resin method provides informationabout K supply to the root surface (left side of Fig. I) as the second componentof specifying prescription-based fertilizer K management for high rice yields.
0.13*NPK TreatmentsE7 b coefficient of slow K release
U n Resin K 1 d 0.79 PhilRice-3 6 Resin K I d to 14 d 0.66 IRRISo... Ratio K 1 /K 14 0.65 Lanran
0.59 BRIARCC 0.42 Coimbatore.0 0.41 Maros
4 0.37 Pantnagaro 0.29 Shipai
0.19 0.27 Oingpu0.25 Jinxian
2 an0.14 0.12 Cuu Long
o 0.I71~ 0.21 0640.56 03 051
0 1 ;2 61BRARC Cuu Long Jinxian Mares PhilRice Shipai
Coinbatore IRRI Lanrang pantnagar Oingpu
Fig. 7. Cumulative resin K adsorption in the +NPK treatment at I I sites. Theratio KI/K!4 describes the proportion of rapid K adsorption from the total Krelease within 2 wk of incubation.
(a) Rapid K release (24 I) (b) Slow K releaseA0 A A
V(&4 +254.
n
1W AAA
A
0.0 0.3 0.6 0.9 12 0.1 0.2 0.3 0+4 0.5 0+6 0.1 0.
a coefficient of resin K adsorption b coefficient of resin K adsorptionFig. 8. Correlation of parameters describing rapid and slow K adsorption on theresin with mean total K uptake in +NP and +NPK treatments at I I sites.
227

6. Summary and conclusions
The K requirements for obtaining high rice yields are large and there is aneed to reconsider the important role of K as a macronutrient in rice nutrition.While N is almost always a major limitation in irrigated rice ecosystems acrossall agroecological zones and soil types, depletion of soil K reserves is ongoingand net negative K balances suggest that a significant response to K is just amatter of time and overall yield level.
The present level of K management is unsatisfactory. Potassium inputs arecommonly low and the K balance in many rice-growing regions is negative.Rice production systems practiced by many farmers and even by researchers atexperimental stations do not maintain soil quality in terms of K status.
As researchers, we have the responsibility to develop modem and resourcebase-sustaining technologies for high-yielding rice production. With regard to Kand other plant nutrients, such a framework has to be based on crop demand,effective soil-supplying power (Fig. 1), and K balance, instead of blanketrecommendations for fertilizer application. Measures of the soil K-supplyingpower should be derived from or related to K uptake under field conditions. Useof minus K plots with full supply of other nutrients would allow farmers to dotheir own calibrations. On the other side, new, dynamic soil tests such as ionexchange resin methods provide reliable measures of potential K supply fromindigenous soil reserves.
We need more on-farm research to quantify complete K balances at differentgeographical scales. Research is also necessary to study varietal differences ininternal K use efficiency, to increase the data base for calibration of dynamicsoil tests, and to study mechanisms behind possible long-term effects of ricecultivation on K chemistry in flooded soils.
Acknowledgments
We like to acknowledge the valuable contributions made by our collaborators,including Mr. Josue P. Descalsota (IRRI), Ms. Elisa M. Imperial (BRIARC),Mr. Wilfredo B. Collado (PhilRice), Dr. S.P. Palaniappan (Coimbatore, TNAU),Dr. Pyare Lal (Pantnagar, G. B. Pant University), Dr. R. Djafar Baco, Ir.Reginald Le Cerff, and Ir. Rauf Mufran (Maros and Lanrang, MORIF), Dr.Pham Sy Tan (Cuu Long, CLRRI), Prof. Li Jiakang (Jinxian, Qingpu, Shipai),Dr. Lai Qingwang (Jinxian, Red Soil Institute - Jiangxi), Mr. Wang Yinhu(Qingpu, Soil & Fert. Inst. - SAAS), and Dr. Zhou Xiuchong (Soil & Fert. Inst.- GAAS). Furthermore, we are grateful to Ms. Mirasol Pampolino and Ms.Arlene Adviento for their excellent technical assistance in conducting the PST
228
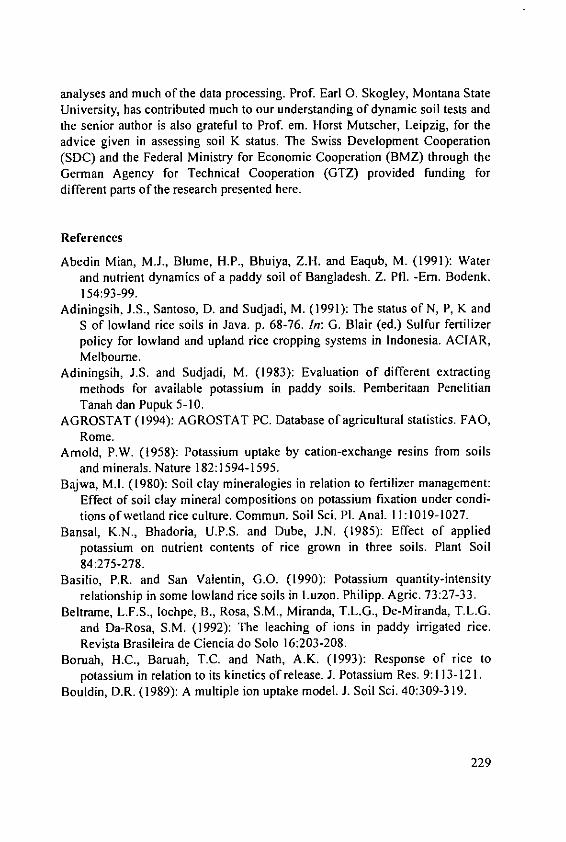
analyses and much of the data processing. Prof. Earl 0. Skogley, Montana StateUniversity, has contributed much to our understanding of dynamic soil tests andthe senior author is also grateful to Prof. em. Horst Mutscher, Leipzig, for theadvice given in assessing soil K status. The Swiss Development Cooperation(SDC) and the Federal Ministry for Economic Cooperation (BMZ) through theGerman Agency for Technical Cooperation (GTZ) provided funding fordifferent parts of the research presented here.
References
Abedin Mian, M.J., Blume, H.P., Bhuiya, Z.H. and Eaqub, M. (1991): Waterand nutrient dynamics of a paddy soil of Bangladesh. Z. Pfl. -Em. Bodenk.154:93-99.
Adiningsih, J.S., Santoso, D. and Sudjadi, M. (1991): The status of N, P, K andS of lowland rice soils in Java. p. 68-76. In: G. Blair (ed.) Sulfur fertilizerpolicy for lowland and upland rice cropping systems in Indonesia. ACIAR,Melbourne.
Adiningsih, J.S. and Sudjadi, M. (1983): Evaluation of different extractingmethods for available potassium in paddy soils. Pemberitaan PenelitianTanah dan Pupuk 5-10.
AGROSTAT (1994): AGROSTAT PC. Database of agricultural statistics. FAO,Rome.
Arnold, P.W. (1958): Potassium uptake by cation-exchange resins from soilsand minerals. Nature 182:1594-1595.
Bajwa, M.I. (1980): Soil clay mineralogies in relation to fertilizer management:Effect of soil clay mineral compositions on potassium fixation under condi-tions of wetland rice culture. Commun. Soil Sci. Pl. Anal. 11:1019-1027.
Bansal, K.N., Bhadoria, U.P.S. and Dube, J.N. (1985): Effect of appliedpotassium on nutrient contents of rice grown in three soils. Plant Soil84:275-278.
Basilio, P.R. and San Valentin, G.O. (1990): Potassium quantity-intensityrelationship in some lowland rice soils in Luzon. Philipp. Agric. 73:27-33.
Beltrame, L.F.S., lochpe, B., Rosa, SM., Miranda, T.L.G., De-Miranda, T.L.G.and Da-Rosa, S.M. (1992): The leaching of ions in paddy irrigated rice.Revista Brasileira de Ciencia do Solo 16:203-208.
Boruah, H.C., Baruah, T.C. and Nath, A.K. (1993): Response of rice topotassium in relation to its kinetics of release. J. Potassium Res. 9:113-121.
Bouldin, D.R. (1989): A multiple ion uptake model. J. Soil Sci. 40:309-319.
229

Cassman, K.G. (ed.) (1994): Breaking the yield barrier: Proceedings of aWorkshop on Rice Yield Potential in Favorable Environments. 29 Nov - 4Dec 1994. International Rice Research Institute, P.O. Box 933, 1099 Manila,Philippines.
Cassman, K.G., De Datta, S.K., Olk, D.C., Alcantara, J., Samson, M.,Descalsota, J.P. and Dizon, M. (1995): Yield decline and the nitrogeneconomy of long-term experiments on continuous, irrigated rice systems inthe tropics. In: R. Lal and B.A. Stewart (ed.) Sustainable management ofsoils. Lewiston Publishers, CRC Press Inc. Michigan (in press).
Cassman, K.G. and Pingali, P.L. (1995): Intensification of irrigated ricesystems: Learning from the past to meet future challenges. Geoderma 35:299-305.
Chen, C.L., Wang, X., Wang, W.M., He, X.T. and Ye, W.J. (1987): A study onindexes of sufficiency-deficiency of nutrients and recommended fertilizerapplication. Fujian Agric. Sci. Technol. 2-4.
Chen, FX., Chen, Y.A. and Zou, C.M. (1992): Potassium balance in red earthpaddy soil of Southern Hunan and its application. p. 193-194. In: Proc. ofthe International Symposium on Paddy Soils. Chinese Academy of Sciences,Nanjing.
De Datta, S.K. (1981): Principles and practices of rice production. J. Wiley,New York.
De Datta, S.K., Gomez, K.A. and Descalsota, J.P. (1988): Changes in yieldresponse to major nutrients and in soil fertility under intensive rice cropping.Soil Sci. 146:350-358.
De Datta, S.K. and Mikkelsen, D.S. (1985): Potassium nutrition of rice. p. 665-699. In: R.D. Munson et al (ed.) Potassium in agriculture. ASA, CSSA,SSSA, Madison, Wi.
Dobermann, A., Adviento, M.A. and Pampolino, M.F. (1994a): The phyto-availability soil test for rice. p. 138-139. In: Trans. 15th World Congr. SoilSci., Vol. 5b. ISSS, Acapulco.
Dobermann, A., Langner, H., Mutscher, H., Skogley, E.O., Neue, H.U., Yang,J.E., Adviento, M.A. and Pampolino, M.F. (1994b): Nutrient adsorptionkinetics of ion exchange resin capsules: A study with soils of internationalorigin. Commun. Soil Sci. PI. Anal. 25:1329-1353.
Fageria, N.K. (1983): Ionic interactions in rice plants from dilute solutions.Plant Soil 70:309-316.
Feigenbaum, S., Edelstein, R. and Shainberg, 1. (1981): Release rate ofpotassium and structural cations from micas to ion exchangers in dilutesolutions. Soil Sci. Soc. Am. J. 43:501-506.
230

Feigenbaum, S., Bar-Tal, A., Portnoy, R. and Sparks, D.L. (1991): Binary andternary exchange of potassium on calcareous montmorillonite soils. Soil Sci.Soc. Am. J. 55:49-56.
Gill, M.P.S. and Dev, G. (1985): Comparison of chemical indices for availableK for rice in alluvial soils of Punjab. Int. Rice Res. Newsl. 10:27-28.
Goswami, N.N. and Banerjee, N.K. (1978): Phosphorus, potassium and othermacroelements. p. 561-580. In: Soils and rice. International Rice ResearchInstitute, P.O. Box 933, 1099 Manila, Philippines.
Haby, V.A., Russelle, M.P. and Skogley, E.O. (1990): Testing soils forpotassium, calcium and magnesium. p. 181-227. In: R.L. Westerman (ed.)Soil testing and plant analysis. Third ed., ASA,SSSA, Madison,Wl.
Hanson, R.G., Sudjadi, M., Hardjono, A., Sudaryanto, T. and Dahnke, W.(1994): Soil fertility and fertilizer use study in Indonesia. Draft of report andproposal. Agency for Agric. Res. and Development and The World Bank,Washington.
Havlin, J.L. and Westfall, D.G. (1985): Potassium release kinetics and plantresponse in calcareous soils. Soil Sci. Soc. Am. J. 49:366-370.
Huang, J.N., Li, J.P. and Xie, S. (1990): A study of nutrient balance in differentcropping systems on a lateritic red soil. J. South China Agric. Univ. 13:7-14.
IRRI (1985): Wetland soils: characterization, classification, and utilization.International Rice Research Institute, P.O. Box 933, 1099 Manila,Philippines.
IRRI (1993): 1993-1995 IRRI Rice almanac. International Rice ResearchInstitute, P.O. Box 933, 1099 Manila, Philippines.
Janssen, B.H., Guiking, F.C.T., Van der Eijk, D., Smaling, E.M.A., Wolf, J. andVan Reuler, H. (1990): A system for Quantitative Evaluation of the Fertilityof Tropical Soils (QUEFTS). Geoderma 46:299-318.
Jones, U.S., Katyal, J.C., Mamaril, C.P. and Park, C.S. (1982): Wetland rice-nutrient deficiencies other than nitrogen. p. 327-378. In: Rice researchstrategies for the future. International Rice Research Institute, P.O. Box 933,1099 Manila, Philippines.
Kanwar, J.S. (1975): Assessment of potassium in the tropics and sub-tropics ofAsia. p. 261-282. In: Potassium research and agricultural production.International Potash Institute, Bern, Switzerland.
Kawaguchi, K. and Kyuma, K. (1977): Paddy soils in tropical Asia. Theirmaterial nature and fertility. The University Press of Hawaii, Honolulu.
Kemmler, G. (1980): Potassium deficiency in soils of the tropics as a constraintto food production. p. 253-275. In: Priorities for alleviating soil-relatedconstraints to food production in the tropics. International Rice ResearchInstitute, P.O. Box 933, 1099 Manila, Philippines.
231
Kirk, G.J.D. (1993): Root ventilation, rhizosphere modification, and nutrientuptake by rice. p. 221-232. In: F. Penning de Vries et al. (ed.) Systemsapproaches for agricultural development. Kluwer, Dordrecht.
Mahapatra, I.C. and Prasad, R. (1970): Response of rice to potassium in relationto its transformation and availability under waterlogged condition. Fert.News 15:34-41.
Martin, H.W. and Sparks, D.L. (1983): Kinetics of non-exchangeable potassiumrelease from two coastal plain soils. Soil Sci. Soc. Am. J. 47:883-887.
Mc Lean, E.O. and Watson, M.E. (1985): Soil measurements of plant-availablepotassium. p. 277-308. In: R.D. Munson (ed.) Potassium in agriculture.ASA, CSSA, SSSA, Madison, WI.
Mehta, S.C., Sharma, D.R. and Mittal, S.B. (1988): Influence of long-termapplication of farmyard manure on K-Ca and K-Na exchange equilibria in atropical soil. J. Potassium Res. 4:168-173.
Mohanty, S.K. and Mandal, L.N. (1989): Transformation and budgeting of N, Pand K in soils for rice cultivation. Oryza 26:213-231.
Mongia, A.G., Ganeshamurthy, A.N. and Bandyopadhyay, A.K. (1991): Effectof flooding, phosphorus application and liming of Sulphaquepts of Andamanon exchangeable Al 3' and rice yield. J. Indian Soc. Soil Sci. 39:792-794.
Narwal, R.P., Kumar, V. and Singh, J.P. (1985): Potassium and magnesium rela-tionship in cowpea (Vigna unguiculata (L.) Walp.). Plant Soil 86:129-134.
Nath, A.K. and Purkaystha, S. (1988): A study on soil test and crop response inrespect of potassium in acid alluvial soils of Assam. J. Indian Soc. Soil Sci.36:120-124.
Neog, T., Das, M. and Talukdar, M.C. (1991): Thermodynamics of K-Caexchange in acid soils of Assam. J. Potassium Res. 7:260-265.
Ok, D.C., Cassman, K.G. and Carlson, R.M. (1995): Kinetics of potassiumfixation in vermiculitic soil under different moisture regimes. Soil Sci. Soc.Am. J. 59:0000-0000.
Panda, M. and Panda, S.K. (1993): Evaluation of some potassium tests for ricein a Fluventic Ustochrept. J. Indian Soc. Soil Sci. 41:188-189.
Parfitt, R.L. (1992): Potassium-calcium exchange in some New Zealand soils.Aust. J. Soil Res. 30:145-158.
Pasricha, N.S. (1983): Cation activity ratios in the soil solution and availabilityof potassium to rice in a submerged soil. J. Agric. Sci. 100:1-6.
Prasad, B.L. (1993): Effect of continuous application of potassium on cropyields and potassium availability under different cropping sequences incalcareous soil. J. Potassium Res. 9:48-54.
Prasad, B.L. and Prasad, J. (1992): Availability and critical limits of potassiumin rice and calcareous soils (Calciorthents). Oryza 29:310-316.
232

Pratt, P.F. (1951): Potassium removal from Iowa soils by greenhouse andlaboratory procedures. Soil Sci. 72:107-118.
Ramanathan, K.M. and Nemeth, K. (1982): EUF-K as measure of K availabilityindex for Tamil Nadu soils. Plant Soil 64:95-104.
Regmi, A.P. (1994): Long-term effects of organic amendment and mineralfertilizers on soil fertility in a rice-wheat cropping system in Nepal. MSthesis. University of the Philippines Los Bafios, Laguna, Philippines.
Rhue, R.D. and Mansell, R.S. (1988): The effect of pH on sodium-calcium andpotassium-calcium exchange selectivity for Cecil soil. Soil Sci. Soc. Am. J.52:641-647.
Sadusky, M.C. and Sparks, D.L. (1985): Dynamics of potassium release fromsand fractions of Coastal Plain soils. Agron. Abstr.: 151.
Sekhon, G.S. and Subba Rao, A. (1985): Potassium availability in soils ofSouthern India. p. 207-225. In: Potassium in the agricultural systems of thehumid tropics. International Potash Institute, Bern.
Sheldrick, W.F. (1985): World potassium reserves. p. 3-28. In: R.D. Munson etal. (ed.) Potassium in agriculture. ASA, CSSA, SSSA, Madison, WI.
Shi, Q.H., Zhong, X.H., Pan, X.H., Guo, J.Y. and Zhang, P.L. (1990): Studieson the characteristics of potassium absorption and yield formation in earlyhybrid rice. Acta Agric. Univ. Jiangxiensis 12:54-59.
Skogley, E.O., Georgitis, S.J., Yang, J.E. and Schaff, B.E. (1990): The phyto-availability soil test - PST. Commun. Soil Sci. Pl. Anal. 21:1229-1243.
Soares, E., Lima, L.A., Mischan, M.M., Mello, F.A.F. and Boaretto, A.E.(1983): Relationship between exchangeable Ca and Mg content of the soiland uptake of K by rye. Rev. Agric. (Piracicaba, Brazil) 58:315-330.
Sparks, D.L. (1987): Potassium dynamics in soils. Advances Soil Sci. 6:1-63.Su, N.R. (1976): Potassium fertilization of rice. p. 117-148. In: The fertility of
paddy soils and fertilizer applications for rice. Food and FertilizerTechnology Center for the Asian and Pacific Region, Taipei, Taiwan.
Sutar, V.S., Dongale, J.H. and Chavan, A.S. (1992): Forms of potassium andevaluation of soil K test methods along with critical limits of K in lateriticsoils. J. Potassium Res. 8:187-199.
Tang, L. and Sparks, D.L. (1993): Cation-exchange kinetics on montmorilloniteusing pressure-jump relaxation. Soil Sci. Soc. Am. J. 57:42-46.
Tiwari, K.N. (1985): Changes in potassium status of alluvial soils underintensive cropping. Fert. News 30:17-24.
Uexktill, H.R. von (1985): Availability and management of potassium inwetland rice soils. p. 293-305. In: Wetland soils: characterization, classifica-tion and utilization. International Rice Research Institute, P.O. Box 933,1099 Manila, Philippines.
233

Van Reeuwijk, L.P. (1992): Procedures for soil analysis. 3rd ed. ISRIC,Wageningen.
Wanasuria, S., Mengel, K. and De Datta, S.K. (1981): Use of the electro-ultrafiltration (EUF) technique to study the potassium dynamics of wetlandsoils and potassium uptake by rice. Soil Sci. Plant Nutr. 27:137-149.
Wimaladasa, G.D. and Sinclair, A.H. (1988): Ion exchange resin and soilsolution measurements of soil potassium and its uptake by ryegrass andclover. Anal. Proc. 25:65-67.
Xi, Z.B. (1991): Prospects for rice fertilization research in China for the Year2000. In: Prospects of rice farming for 2000. Proceedings of the CNRRIInauguration Ceremony and Rice Research Conference, 9-11 October 1989,Hangzhou, China. CNRRI, Hangzhou.
Xie, J.C. and Du, C.L. (1988): Studies on availability of potassium in soils andmethods of evaluation. Acta Pedol. Sin. 25:269-280.
Xie, L.C., Zheng, S.L. and Xie, X.W. (1989): A study on soil testing andfertilisation recommendations for rice crop. p. 233-248. In: E. Maltby and T.Wollersen (ed.) Soils and their management: a Sino - European perspective.London.
Yang, J.E., Skogley, E.O., Georgitis, S.J., Schaff, B.E. and Ferguson, A.H.(1991): Phytoavailability soil test: development and verification of theory.Soil Sci. Soc. Am. J. 55:1358-1365.
Yang, J.E., Skogley, E.O., Kim, J.J. and Cho, B.O. (1992): Resin adsorptionquantity comparison with nutrient uptake by rice. Agron. Abstr.:296.
Yoshida, S. (1981): Fundamentals of rice crop science. International RiceResearch Institute, P.O. Box 933, 1099 Manila, Philippines.
234

Balanced Nutrition in Some Major Plantation Cropsin S.E. Asia
S.K. Ng, K.C. Thong, C.H. Khaw, S.H. Ooi and K.Y. LengAgromac Sdn Bhd, 493A Bangunan Camay, Jalan Pasir Puteh
31650 lpoh, Malaysia
1. Introduction
The ASEAN nations of Indonesia, Malaysia and Thailand are majorproducers and exporters of primary commodities and the growth in productionover the past decade has been spectacular, especially in palm oil, palm kernel,rubber and cocoa beans (Table 1).
Table 1. Growth in production of major commodities in Malaysia/Indonesia/Thailand (Million MT).
1983 1993 2003
Palm Oil 3.82 11.40 19.60Rubber 2.40 3.40 4.20Cocoa 0.05 0.50 0.60Palm Kernel 0.46 2.50 4.20
While these production advances have been achieved mainly on the back ofincreased plantings, there is acute awareness that in future, more can beaccomplished by increasing yields through improved nutrition and fertilizerpractices (Ng, 1977) and greater exploitation of genetic yield potentials as underthe MEGYP system of agro-management (Ng and Thong, 1985; Ng et al,1990). There is considerable scope for enhancing productivity in plantationcrops as average yields are well below maximum field yields attained inplantations following the MEGYP strategy or in agronomic trials (Table 2).
Table 2. Current average, highest plantation field and experimental yields(t/hayr).
Crop Average Highest field yields Experimental plot
Oil Palm 3.80 9.20 9.80Rubber 1.10 2.80 3.50Sugar 5.20 9.20 10.00Cocoa 0.50 2.20 3.00
235

While several factors including environment and management areresponsible for the appreciable yield gap between average and highest levels,one of the main avenues for advancing yields is through better balanced nutrientmanagement for optimal plant metabolism involving both macro- andmicronutrients (Beaton, 1990). The critical role of nutrient balance in yieldimprovement of selected tropical plantation crops is the main topic of this paper.
2. Balanced nutrition
2.1. Sugarcane
Our first example is on sugarcane cultivated on light textured Ultisols in thesouthermost province of Lampung in Sumatra, Indonesia. Initially, fertilizerpolicy emphasized high inputs of nitrogen and phosphate which were heavilysubsidized but a policy change to improve K balance was taken from 1985 andthis has resulted in significantly higher average yields achieved over 16000 haof cane. In essence, N and P inputs were pared back while potassium wasincreased by 33% to 240 kg /ha/yr (Table 3).
Table 3. Change in nutrient inputs for sugarcane on Ultisols, Indonesia(kg/ha/yr).
Nutrient 1981-84 1985-87 1988-92
N 160 138 138P20 5 270 230 92K20 180 240 240N/K 20 ratio 0.89 0.58 0.58P2 0 5/K20 ratio 1.50 0.96 0.38
Significant improvements in cane and sugar yields were achieved post 1984and importantly, the gains were accompanied by better quality of cane asmanifested by the rendement values (Table 4).
Table 4. Yield and quality improvements of sugarcane by better NPK balance.
Crop season TCH TSH Rendement %79/81 60.9 3.61 6.7282/84 67.7 4.27 6.2485/87 77.1 5.89 6.7988/90 90.3 6.30 7.2791/93 78.8 6.69 7.97
TCH = tonnes of cane/ha, TSH = tonnes of sugar/ha, Rendement = % sugar incane extracted at the mill.
236

While these results are salutary, the possible limitations of secondary andmicronutrients cannot be overlooked as revealed by annual leaf nutrientmonitoring of plant cane (Table 5).
Table 5. Nutrient contents of 1993 plant cane (Leaf 4).
Nutrient % D.M. ppm
Mg 0.15-0.19S 0.16-0.23B 3-12Zn 16- 17
Therefore, requirements for sulphur and micronutrients are kept constantlyin view as high productivity continues to be pursued by management.
2.2. Oil palm
2.2. 1. Macronutrient requirements
Oil palm has been and continues to be the fastest growing plantation crop inS.E. Asia, and its nutrient requirements vary from moderate to high, depending onsoil fertility (Hew and Ng, 1968) but are generally lower than those of temperateoil crops. On soils of poor buffering capacity, such as tertiary sands in Ivory Coast,Ollagnier and Ochs (1973) showed that nitrogen alone depressed yield of fruit bun-ches, but the combination of potassium and nitrogen raised yields strongly by 37%.
Cheong and Ng (1980) also showed that on tropical acid peat of very lowpotassium status, nitrogen and phosphate suppressed yields while potassium incombination with limestone gave the highest response (Fig. 1). Interestingly,magnesium gave a slight positive effect.
An interesting aspect of this trial on peat is that potassium alone and incombination with limestone increased oil content in fruit bunches via improvedoil in pericarp (Ng, 1973) as presented in Table 6.
Table 6. Effect of nutrients on bunch traits (%).
Treatment O/B O/WP
Control 23.4 50.8N 22.2 52.3P 21.4 53.6K 24.3 54.0Mg 22.2 56.5Ca 23.5 55.4KCa 26.1 57.3
O/B = oil to bunch (%), O/WP = oil in wet pericarp (%)
237
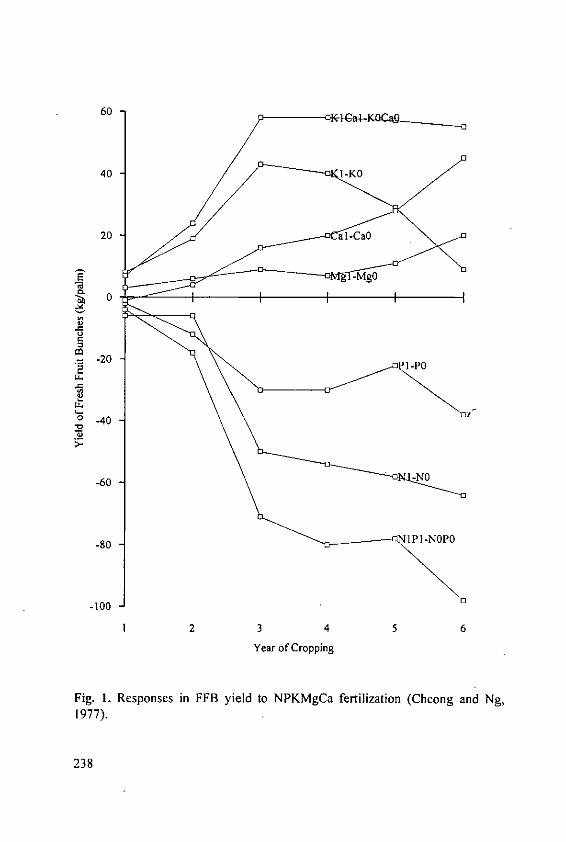
60 -K IcaIKOC 4a_ _ ,
40 I-K0
20
0
-20
:2o-40 "
-60 -NO
-80 - IPI-NOPO
-100
1 2 3 4 5 6
Year of Cropping
Fig. 1. Responses in FFB yield to NPKMgCa fertilization (Cheong and Ng,1977).
238

Although magnesium gave a lower O/B value, it increased oil content in wetpericarp (O/WP), which suggests an important role of magnesium in oilformation.
More recent findings on the importance of optimal K balance on earlyproduction in South Thailand were reported by Ng et al (1993). Potassium inputsthat were in balance with other major nutrients enhanced fruit bunch yields by38% and 57% during the first 4 and 3 years of harvesting respectively (Table 7).
Table 7. Cumulative yields of FFB under 2 potassium regimes.
Planting K20 (kg/ha) 4 years cropping 3 years cropping
1 969 49.0 (100)1912 67.7 (138) -
2 762 31.6 (100)1550 49.7 (157)
2.2.2. Magnesium balance
In oil palm nutrition, K, Mg and Ca are the major cations that are present inleaf tissues and published leaf analysis data show that their sum totals around2.0-2.2% of dry matter on average. However, as antagonisms between K/Mgand Ca/Mg are known, their relationships would vary according to the quantitiesand ratios of the three cations concerned.
Potassium followed by magnesium are given priority in palm nutrition, butover the past decade, for economic reasons, ground magnesium limestone hasreplaced magnesium sulphate in many plantations. On Ultisols with lowmagnesium status, GML coupled with a moderately high rate of potash applica-tion could result in Mg imbalance over time. Such in fact has occurred as shownby data from monitoring blocks over the past 12 years in Malaysia (Table 8).
Table 8. Evolution of K, Mg, Ca- concentrations in mature oil palms (leaf 17)before and after the use of ground magnesium limestone.
Palm age K Mg Ca FFB (t/ha)
6- 8 1.02- 1.31 0.252 - 0.379 0.425 - 0.683 24.99- 11 * 1.12- 1.26 0.206 - 0.271 0.421 - 0.676 20.2
12- 14 1.11-1.27 0.161 -0.220 0.642-0.831 20.215- 17 0.89- 1.33 0.152 -0.184 0.772 -0.917 17.8
Inception of GML use.
239

The declining trend in leaf Mg status was accompanied by an upward trendin Ca levels. Although yields also followed a declining trend with age, it cannotbe attributed categorily to magnesium deficiency. Nevertheless, the probabilityof a negative yield effect caused by suboptimal magnesium nutrition should notbe ruled out.
Positive evidence of the debilitating effect of continuous application ofground magnesium limestone as a source of magnesium has been provided bythe Tun Razak Agricultural Research Centre of FELDA (PPPTR) in Malaysia(Syed Sofi, pers. comm., 1994) as clearly shown in Table 9.
Table 9. Comparative yield effects of kieserite and ground magnesiumlimestone on 8 year old palms in PPPTR.
MgO Source Frequency Mean FFB (kg/palm)
(kg/palm/application) over 4 years
0 179.90.36 GML Yearly 168.80.36 Ks 200.00.48 GML Once in 3 years 158.70.48 Ks 192.2
The results amply demonstrate the importance of cationic relationships in oilpalm nutrition.
2.2.3. Micronutrients
Not unlike other fruit bearing crops such as citrus, the oil palm also needscertain micronutrients to be in balance with the macronutrients. The micro-nutrients that have been shown to be critical to the oil palm are boron(Rajaratnam, 1973) and copper (Ng et aL, 1974).
Copper is particularly crucial for young palms on peat soil, but Cheong andNg (1976) showed that if the syndrome is corrected at the right early stage thenaffected palms can recover and yield nearly as well as unaffected normal palms(Table 10).
Table 10. 1st year yield of young palms treated with copper sulphate sprays for2 years.
Copper deficiency status FFB (t/ha)Normal 7.6Moderately affected 6.3Severely affected 6.5
240
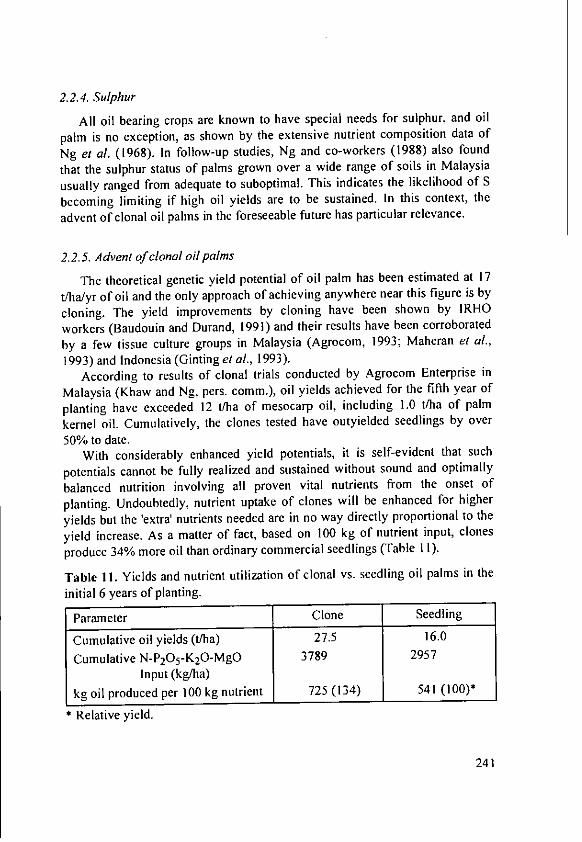
2.2.4. Sulphur
All oil bearing crops are known to have special needs for sulphur, and oil
palm is no exception, as shown by the extensive nutrient composition data of
Ng et al. (1968). In follow-up studies, Ng and co-workers (1988) also found
that the sulphur status of palms grown over a wide range of soils in Malaysia
usually ranged from adequate to suboptimal. This indicates the likelihood of S
becoming limiting if high oil yields are to be sustained. In this context, the
advent of clonal oil palms in the foreseeable future has particular relevance.
2.2.5. Advent of clonal oil palms
The theoretical genetic yield potential of oil palm has been estimated at 17
t/ha/yr of oil and the only approach of achieving anywhere near this figure is by
cloning. The yield improvements by cloning have been shown by IRHO
workers (Baudouin and Durand, 1991) and their results have been corroborated
by a few tissue culture groups in Malaysia (Agrocom, 1993; Maheran et al.,
1993) and Indonesia (Ginting et al., 1993).According to results of clonal trials conducted by Agrocom Enterprise in
Malaysia (Khaw and Ng, pers. comm.), oil yields achieved for the fifth year of
planting have exceeded 12 t/ha of mesocarp oil, including 1.0 t/ha of palm
kernel oil. Cumulatively, the clones tested have outyielded seedlings by over
50% to date.With considerably enhanced yield potentials, it is self-evident that such
potentials cannot be fully realized and sustained without sound and optimally
balanced nutrition involving all proven vital nutrients from the onset of
planting. Undoubtedly, nutrient uptake of clones will be enhanced for higher
yields but the 'extra' nutrients needed are in no way directly proportional to the
yield increase. As a matter of fact, based on 100 kg of nutrient input, clones
produce 34% more oil than ordinary commercial seedlings (Table II).
Table 11. Yields and nutrient utilization of clonal vs. seedling oil palms in the
initial 6 years of planting.
Parameter Clone Seedling
Cumulative oil yields (t/ha) 27.5 16.0
Cumulative N-P20 5-K20-MgO 3789 2957Input (kg/ha)
kg oil produced per 100 kg nutrient 725 (134) 541 (100)*
Relative yield.
241

Thus, by using clones generated by tissue culture instead of conventionalseedlings, fertilizer use efficiency will be enhanced appreciably and for a givenvolume of production, less land resources will be required. These advantageswill contribute positively towards the improvement of the environment.
3. Tropical fruits
The truly exotic fruit of the tropics is the durian (Durio zibethinus), regardedby connoisseurs as the 'King of Fruits'. However, to many Occidentals thedurian is the fruit of the sewers.
Durian orchards are springing up in S.E. Asia, especially in Thailand andMalaysia. The value of domestic consumption of durian could exceed US$ 400million annually while fruit exports are expanding and are dominated byThailand.
Very little research has been done on the nutrition and nutrient requirementsof durians. Ng and Thamboo (1968) were the first to publish nutrientcomposition data on durians and rambutans (Nephelium lappaceum L.), andshowed that potassium was richest in the thorny husks and therefore potassiumremoval in fruits harvested was very high as compared with other majornutrients (Table 12).
Table 12. Nutrients removed by 12.7 t/ha durian crop (in kg ha-').
Nutrient I N ! P20 5 K20 MgO CaO
Quantity 32 12 67 11 6
However, for optimal fruit quality, overall nutrient balance has to besustained as shown by recent leaf analysis data of the premier 'Monthong' cloneof Thailand. The results (Table 13) indicate that due attention has to be paid toK/Ca and K/Mg balance, as well as sound complement of micronutrients,particularly, boron, zinc, copper and manganese. Unfortunately, the relationshipbetween fruit palatability and palpability, and nutrient status has not beenstudied so far.
242
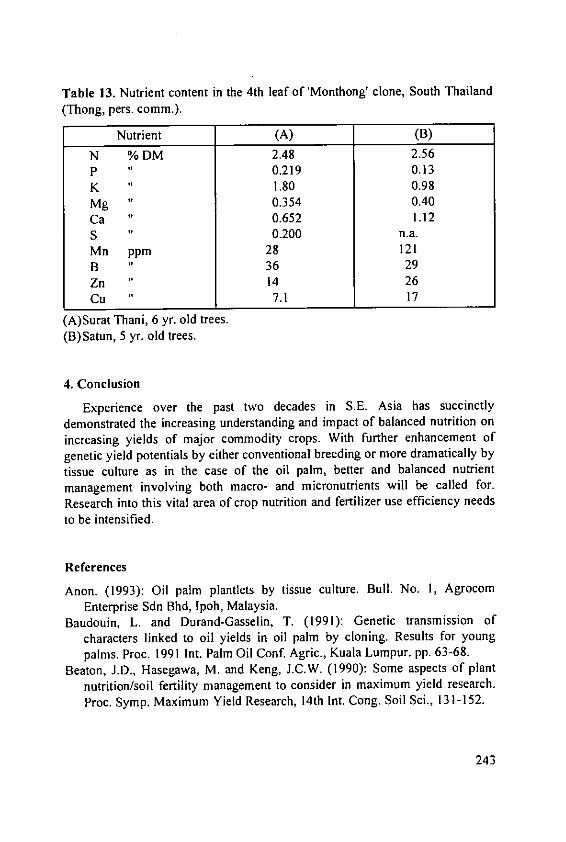
Table 13. Nutrient content in the 4th leaf of 'Monthong' clone, South Thailand(Thong, pers. comm.).
Nutrient (A) (B)
N % DM 2.48 2.56P 0.219 0.13K 1.80 0.98Mg 0.354 0.40Ca 0.652 1.12S 0.200 n.a.Mn ppm 28 121B 36 29Zn 14 26Cu 7.1 17
(A)Surat Thani, 6 yr. old trees.(B)Satun, 5 yr. old trees.
4. Conclusion
Experience over the past two decades in S.E. Asia has succinctlydemonstrated the increasing understanding and impact of balanced nutrition on
increasing yields of major commodity crops. With further enhancement ofgenetic yield potentials by either conventional breeding or more dramatically by
tissue culture as in the case of the oil palm, better and balanced nutrient
management involving both macro- and micronutrients will be called for.
Research into this vital area of crop nutrition and fertilizer use efficiency needs
to be intensified.
References
Anon. (1993): Oil palm plantlets by tissue culture. Bull. No. 1, AgrocomEnterprise Sdn Bhd, lpoh, Malaysia.
Baudouin, L. and Durand-Gasselin, T. (1991): Genetic transmission of
characters linked to oil yields in oil palm by cloning. Results for young
palms. Proc. 1991 Int. Palm Oil Conf. Agric., Kuala Lumpur. pp. 63-68.Beaton, J.D., Hasegawa, M. and Keng, J.C.W. (1990): Some aspects of plant
nutrition/soil fertility management to consider in maximum yield research.Proc. Symp. Maximum Yield Research, 14th Int. Cong. Soil Sci., 131-152.
243
Cheong, S.P. and Ng, S.K. (1976): Copper deficiency of oil palms on peat. In:Int. Dev. in Oil Palm, Edt. Earp & Newall. pp. 362-370.
Cheong, S.P. and Ng, S.K. (1980): Major nutrient requirements of oil palms ondeep acid peat in Malaysia. Proc. Clamatrops 1977, pp. 525-535.
Ginting, G., Lubis, A.U. and Fatmawati (1993): Yield and vegetative characte-ristics of oil palm clonal planting materials. Proc. Int. Oil Palm Conf.,PORIM, Kuala Lumpur.
Maheran, A.B., Abu Zarin, 0., Aw, K.T. and Chin, C.W. (1993): FELDA'searly experiences with vegetative propagation of the oil palm (Elaeisguineensis Jacq.). Proc. Int. Oil Palm Conf, PORIM, Kuala Lumpur.
Ng, S.K. and Thamboo, S. (1967): Nutrient removal studies on Malayan fruits:Durian and Rambutan. Mal. Agric. J. 46: 164-182.
Ng, S.K., Thamboo, S. and de Souza, P. (1968): Nutrient contents of oil palm inMalaya 11: Nutrients in vegetative tissues. Mal. Agric. J. 46, 164-182.
Ng, S.K. (1973): The influence of nutrition on the chemical properties of sometropical plantation crop products. Proc. 10th Coll. Int. Potash Inst. pp. 249-264
Ng, S.K,, Tan, Y.P., Chan, E. and Cheong, S.P. (1974): Nutritional complexesof oil palms planted on peat soil in Malaysia. I1. Preliminary results ofcopper sulphate treatment. Oleagineux 29: 445-456.
Ng, S.K. (1977): Review of oil palm nutrition and manuring - scope for greatereconomy. Oleagineux 32, No. 5, pp. 197-206.
Ng, S.K. and Thong, K.C. (1985): Nutrient requirements for exploiting yieldpotentials of major plantation tree crops in the tropics. Proc. 19th Coll. Int.Potash Inst. pp. 81-95.
Ng, S.K., Thong, K.C., Woo, Y.C. and Ooi, S.H. (1988): A preliminary surveyof leaf sulphur status of oil palms in Malaysia. Sulphur in Agriculture Vol.12, pp. 19-21.
Ng, S.K., Uexk ll, H.R. von, Thong, K.C. and Ooi, S.H. (1990): Maximumexploitation of genetic yield potentials of some major tropical tree crops inMalaysia. Proc. Symp. Maximum Yield Research, 14th Int. Cong. Soil Sci.,pp. 120-130.
Ng, S.K., Uexkoll, H.R. von, Thong, K.C. and Prasert, A. (1993): Optimalbalance of potassium important for young oil palm nutrition and yield. In:Better Crops [t. PPI, Dec. 1993, pp. 18-21.
Ollagnier, M. and Ochs, R. (1973): Interaction between nitrogen and potassiumin the nutrition of tropical oil plants. Oleagineux 28, pp. 493-508.
Rajaratnam, J.A. (1973): The effect of boron deficiency on the yield of oilpalms in Malaysia. In: Advances in Oil Palm Cultivation. Ed. Wastie &Earp, pp. 280-288.
244

Nutrient Use Efficiency in Agroforestry Systems
M. Van Noordwijk and D.P. GarrityInternational Centre for Research on Agroforestry (ICRAF), S.E. Asian regional
research program, P.O. Box 161, Bogor 16001, Indonesia
Abstract
Agroforestry can contribute to the solution of a number of problems in thenutrient balance of agro-ecosystems. Tree products with a high economic valueper unit nutrient content can reduce the risk of mining the soil without financialpossibilities for obtaining external inputs. Trees may also reduce nutrient lossesfrom agro-ecosystems and thus contribute to long term productivity and inputuse efficiency.
A general approach is given to optimizing agroforestry systems on the basisof tree-soil-crop interactions. Nutrient sources for tree growth can becomplementary to those of crops (nutrient puni'ps and safety nets) or be thesame, leading to competition. Soil fertility improvement through tree litter andprunings depends on the quantity, quality, timing and placement. Soil fertilityimprovement can be most clearly studied in sequential agro-forestry systems.On sloping lands trees can contribute to erosion control, but especially to localdeposition of sediment.
1. Different types of agroforestry
Agroforestry is a collective name for land use systems and technologies inwhich woody perennials (trees, shrubs, palms, bamboos, etc.) are deliberatelycombined on the same land management unit with herbaceous crops and/oranimals, either in some form of spatial arrangement or temporal sequence. Inagroforestry systems there are both ecological and economic interactions amongthe different components (Nair, 1993). Trade-offs between productivity of thevarious components are normally unavoidable, but the combined productivity of
a mixed agroforestry system can under certain conditions be higher than that ofthe best single-component systems.
Figure I gives a tentative classification of agroforestry systems, based on the
degree of spatial and temporal overlap of the tree and crop components.Systems in the lower left comer do not fall under the definition of agroforestry,as here trees and crops do not interact.
245

fully (improved) agroforests nmixed fellow
improved homegardens.. viableuo fallow -taungya
relayrotational alley
- oalley cropping croppingzoned
> parkland0l boundary trees
plantings
NON-AF mulch transferwoodlots, fodder banks,
separate crop fields manure transfersequential relay simultaneous
overlap in time
Fig. 1. Classification of agricultural systems based on both trees and crops, withregards to the degree of overlap in time (X-axis) and space (Y-axis).
Systems in the upper right corner are generally not viable as competitionbetween the tree and crop component will be too severe. In the upper left cornerwe find (improved) fallow systems, where a crop and a tree phase alternate onthe same land. From a biophysical point of view, such systems are fairly simpleand can be successful, but farmers will hesitate to put efforts into improving thefallow phase; it is thus understandable that developments in the direction ofrelay-establishment of the fallow vegetation are sought (ICRAF, 1994), whichmove the system towards the centre of the graph. Alley cropping was firstdeveloped as a fully simultaneous spatially zoned system, but recently interestin 'rotational alley cropping' also moves the system towards the centre of thegraph. Agroforestry systems with full-grown trees are either based on low treedensities (parklands, boundary plantings) or on relay systems, with a short cropand long tree phase (taungya, homegarden, agroforests).
Part of the enthusiasm generated by 'alley cropping' as sustainablealternative to shifting cultivation systems in the past decade, has been temperedby disappointing results in 'implementation' programs with the specific formchosen. There is some danger that this disappointment leads to a swing of thetree-crop balance to the other extreme of completely separated crop fields andwoodlots, but there are many agroforestry systems developed and used byfarmers which apparently do meet their criteria.
246

As many of them are far more complex and less tidy than the neat sequence
of hedgerows and crops of alleycropping, researchers face a much more
challenging task in quantifying such systems and exploring the range of options
to improve the systems, in support of what farmers do. Nutrient cycling and
nutrient efficiency of many of the real-world agroforestry systems is poorly
quantified at the systems level, as yet.
2. Trees and agro-ecosystem nutrient use efficiency
The term efficiency generally indicates an output/input ratio and thus
efficiency depends on the boundaries where inputs and outputs are measured.The term 'nutrient use efficiency' is often used without specifying the boundaries
of the system in space and time, and this supposes that efficiency attributes are
conserved across system scales - this is not true, however. Farm level nutrient
use efficiency can be understood from the nutrient use efficiency of the various
components of the farm, but taking due account of which inputs of farm
components are based on outputs of other components. Similarly, nutrient use
efficiency at the society level depends on the farm level efficiency, but should
take transfers among sectors into account. Even if the direct efficiency of using
recycled wastes is lower than that of using 'new' external inputs, the overall
efficiency can be greatly enhanced by recycling. Agricultural development as
exemplified by W. Europe is often based on farm specialization, increased
distance between production sites and markets and a reduction of recycling.
Even if crop level nutrient use efficiency may have been maintained, the overall
efficiency decreased and environmental concerns increased.For an annual crop the agronomic efficiency (products per unit input) can be
separated into three components: application efficiency (available/input), uptake
efficiency (uptake/available), utilization efficiency (products/uptake), all on an
annual basis. The relevant root and shoot parameters for predicting uptake
efficiency on the single plant level (crop or tree) depend not only on the nutrient
resource studied, but also on the complexity of the agricultural system (Van
Noordwijk, 1987; Van Noordwijk et al, 1993). In intensive horticulture with
nearly complete technical control over nutrient and water supply, fairly small
root systems may allow very high crop productions in a situation where resource
use efficiency ranges from very low to very high, depending on the technical
perfection of the (often soil-less) production system (Van Noordwijk, 1990). In
field crops grown as a monoculture, the technical possibilities for ensuring a
supply of water and nutrients where and when needed by the crop are far less;
the soil has to act as a buffer, temporarily storing these resources, and root systems
are important in obtaining these resources where present and when needed.
247
Adjustment of supply and demand in both time and space (synchrony andsynlocation) become critical factors. In mixed cropping systems (includinggrasslands), the belowground interactions between the various plant species adda level of complexity to the system; on one hand it opens possibilities ofcomplementarity in using the space and thus of the stored resources, henceimproving overall resource use efficiency, on the other hand, it means that rootlength densities which would be sufficient for efficient resource use in amonoculture, may not be sufficient in a competitive situation. Agroforestrysystems are yet another step more complex, as the perennial and annualcomponents have separate time frames on which to evaluate the interactions.
Economic efficiency does not necessarily coincide with biophysicalefficiency. Van Noordwijk and Scholten (1994) explored how the price ratio offertilizer inputs and yield products may influence farmer's decisions whether ornot to utilize existing efficiency improving technologies; if fertilizer inputs arecheap, no incentive is given to their efficient use, if they are expensive, theymay not be used at all; in an intermediate range biophysical efficiencyimprovement may pay off to the farmer.
Agronomic research has for a long time made the implicit assumption thatresults of relatively small plots, selected on the basis of their homogeneity for'proper' experiments, were directly relevant for the field scale. Van Noordwijkand Wadman (1992) showed that the agronomic efficiency of a crop productionsystem, defined as crop output per unit input, decreased with increasing internalvariability, all other parameters being equal. Independently, Cassman and Plant(1992) developed a similar model and applied it to field results. Fieldheterogeneity does not affect nutrient use efficiency in the linear responserange, where it may be most visible in the crop. Heterogeneity affects efficiencyespecially when the nutrient supply to part of the plants exceeds therequirements for maximum yield. Field heterogeneity has a direct effect on theproduction-environment conflict, as the amounts of inputs needed for,economically optimum' yield increase, while the amounts of inputs which canbe tolerated from an environmental point of view decreases. In heterogeneousfields, nutrient use efficiency can be improved by site specific input decisions.Technical options for such decisions are being developed for large scalemechanized farming. The small scale farmer with intimate knowledge of herland may be directly inclined to apply nutrients where needed most. This is onlypossible, however, if the rich and poor strata of the field can be recognized fromeasily observable patterns.
The time dimension also causes concern in the definition of nutrient useefficiency of agroforestry systems.
248

For perennial crops, such as trees, one has to consider efficiency on thewhole life span, rather than on an annual basis, as uptake and harvest will be
separated in time. For the nutrient use efficiency of agroforestry systems, the
typical lifespan of the trees should be used and this explains why little empirical
data exist. We thus have to rely on a discussion of the component processes and
on nutrient balance sheets, including losses to the environment, rather than on
direct efficiency measures. The changes in the nutrient content of a system, ANs,can be written as the sum of inputs and Astorage, minus (desirable +undesirable) outputs, where storage occurs in the soil as well as the plantcomponent. Any reduction in 'undesirable outputs' is likely to improve the long-
term efficiency, even if it is based on increased internal storage, rather than
direct 'desirable output'.Figure 2 gives a schematic view of the key processes in nutrient cycling in
agricultural systems, and focusses on three aspects:I.Plant nutrient uptake from stored as well as recently added organic and/or
inorganic resources; the complement of uptake is formed by losses of
available nutrients to other environmental compartments.2. Internal redistribution in the plant and yield formation,3.Removal of harvest products, their exchange for external inputs and the
recycling of harvest residues in the system.Aspects I and 2 are traditionally studied in soil fertility and plant physiological
research, respectively, while aspect 3 is the focus for farming systems and agro-
economic studies. Without recycling and external inputs, the scheme quickly
degenerates into a uni-directional nutrient flow, representing agriculture as
mining operation.
c,1aiion ays
0 r0
rV
stored soi tsol. mineralization
losses to other compartments of the environment
Fig. 2. Schematic nutrient flow and/or cycle in agro-ecosystems.
249
Figure 3 shows that different categories of problems may reduce the nutrientuse efficiency of agro-ecosystems. These problems occur at different spatialscales:
1. Chemical occlusion (and similar soil biological and soil physicalphenomena) limits uptake of stored soil resources and/or the utilization offresh inputs in the root zone at large, or more specifically in the rhizosphere.
2. A number of processes leads to spatial heterogeneity of nutrient supply atthe field scale, and thus reduces the overall efficiency (Cassman and Plant,1992; Van Noordwijk and Wadman, 1992):
a. horizontal nutrient transfer by trees, crops or farmer's practices, creatingdepletion and enrichment zones,
b. soil loss and displacement by erosion/ deposition cycles, esp. on slopinglands,
3. Leaching leading to vertical nutrient transfer to deeper layers, often beyondthe reach of shallow rooted crops,
4. Losses to the atmosphere in gas form (esp N and S), dust (wind erosion) oras particulate ash during fire; the latter leads to deposition elsewhere in thelandscape,
5. Export of harvest products beyond the realm where recycling is possible:increasing economic integration of farms and/or hygienically motivatedreductions in waste recycling cause reduction of re-cycling as part of'development',
6. Economic conditions which prevent the use of external inputs to replace theexported nutrients.
Potentially, agroforestry can contribute to problems 1, 2, 3, 4 and 6, butprobably not to all problems at the same time, so choices have to be made.
Trees can increase nutrient concentrations on small areas of land, at theexpense of nutrients elsewhere. If their source of nutrients is deep soil layers(3), chemically occluded soil nutrient sources (1), air-borne dust (4) or soilmaterial moving downslope with surface run-off (2b) one may expect that theyincrease the nutrient stocks available for other components of the system, suchas crops. As long as deep and chemically occluded sources last and as long aswind erosion up-wind and water erosion up-slope continue, these nutrientsources can be sustainable from the agroforest farmers point of view. None ofthese processes is easy to prove and quantify, however. If most of the nutrientswhich the trees absorb come from top soil layers (2a), and this may even extendto 50 m from the tree in some cases, the role of trees is only positive in as far astopsoil nutrients would not be utilized by other components and get lost fromthe system.
250

harvest exceeds external inputs .
export beyond recycling realm
loss to atmosphere landscape
leaching farm
soil loss/ displacementfield
horizontal nutrient transfer "P
chemical occlusion rhizosphere
Fig. 3. Categories of problems for efficient nutrient use in agro-ecosystems.
The large horizontal spread appears to have been neglected in the design ofmany agroforestry experiments, and positive conclusions about increased nutrientstorage and/or crop yields for agroforestry treatments, as compared to neighbou-ring 'control' plots, may in fact be partly due to tree roots mining the soil underthe neighbouring plots as well as in their own (Coe, 1994). The direct evidencewhich is available in the literature may be rather suspect for this reason.
The general wisdom is that trees help to improve nutrient cycling andnutrient retention in agro-ecosystems, but the question whether or not and bywhich pathways this will lead to more money in farmer's pockets is lessobvious. Trees in agroforestry systems are supposed to perform multiplefunctions, being directly productive as well as helping to conserve the soil andother resources. The 'harvest index', i.e. the harvested part of total biomassproduction, can serve as indicator for the tradeoff between the two functions(Cannell, 1985). If nearly all biomass of trees is removed, as happens in'fodderbanks' (harvest index >75%), little protective effects can be expected. Iftrees produce harvestable products rich in nutrients, such as fruits or seeds, theywill cause a considerable export of nutrients from the farm; yet, their sale maygenerate the cash and the incentive to buy external inputs. If trees are managedcompletely for their 'protection' role (harvest index 0), and all organic matter isrecycled, soil fertility will be enhanced, but this will only be seen as sufficientreason for the time (and other resources) invested in them if a very valuable cropdirectly benefits from this soil fertility. It is clear that the question 'what is agood tree for agroforestry' will get very different answers in different conditions.
251

When we compare a number of tree and crop products as regards theireconomic value per unit nutrient export, it is clear that especially latex-basedtree products have a low nutrient content compared to their economic value, andthus may help to solve problem 6, as formulated above. Rubber and Shoreatrees from which the damar mata kucing is collected are good choices from thispoint of view. Cassava is probably one of the most efficient nutrient scavengersamong the crops, yet cassava based systems are not efficient in generating cash(e.g. for obtaining inputs) per unit nutrient export.
Two contrasting views exist on trees: in agroforestry trees are generally seenas 'soil improvers', especially where fast growing N2 fixing trees are used, whilein plantation forestry there is serious concern about soil depletion due to shortrotation forestry, especially where fast growing trees are used (Bruijnzeel, 1992;Sanchez et al., 1985). The different perceptions are partly due to different condi-tions (poor soils used for plantation forestry) and management practices (moredamage may be done to the soil while harvesting the timber than by the nutrientexport as such).
In choosing trees to optimize the nutrient use efficiency of the croppingsystem, a distinction should be made between agroforestry systems where treesand crops use the same land simultaneously, and sequential systems such as'improved fallows'. Trees with abundant superficial roots and rapid growth andbiomass production may not be suitable for the first, but may be desirable forthe second type of system. In sequential systems soil conditions at the time oftransition of tree to crop phase are the most important criterion. The tree mayhave left a considerable litter layer on the soil surface and a network ofdecaying tree roots in the soil. Effects on the subsequent crop may be based onthe total soil organic matter and nutrient mineralization potential of the soil, butalso on more specific facilitation of crop root development by using the old treeroot channels. The latter is especially relevant on soils where soil compaction orA13+ toxicity restrict crop root development. Old tree root channels provide easypathways into a compact soil and a coating of organic matter which may help todetoxify A13+ (Van Noordwijk et aL, 1991). In simultaneous agroforestrysystems, belowground interaction are probably dominated by competition forwater and nutrients. Complementarity in resource use is possible, however,especially under conditions of high leaching rates.
In this review we will focus on the nutrient aspects of the interactions oftrees, crops and soils to specify environmental conditions and tree cropcombinations for which positive interactions, such as conservation of nutrientsand soil in the system, can exceed the negative effects of competition. We willaddress the following issues:
252
I. What is the role of interaction terms in optimizing agroforestry systems,2. What are the nutrient sources for tree growth: scavengers, safety nets and/or
nutrient pumps,3. How to quantify fertility improvement through tree litter and prunings (F),4. How to quantify soil fertility improvement in sequential agro-forestry
systems (AL),5. How to predict and reduce competition for nutrients between trees and crops
in simultaneous systems (C),6. The role of agroforestry in erosion control on sloping lands.
3. Optimizing agroforestry systems: the role of interaction terms
Agroforestry (AF) systems as defined here are not simply farming systemswhere both trees and crops or animals give useful products to the farmer, butsystems where tree and crop (and/or animal) production interact (Nair, 1993).Understanding and predicting such interactions should thus be at the heart of anagroforestry research program. Interactions can be ecological or economic innature, or both, as will most often be the case because ecological interactionsaffecting the biological productivity will have economic consequences as well.Biological tree - crop interactions in agroforestry systems may be indirect, viachanges in soil conditions during a tree phase affecting subsequent possibilitiesfor crop growth in 'sequential' agroforestry systems, such as 'improved fallows',or direct as in 'simultaneous' systems. Direct interactions include negative ones,such as competition for light, water and nutrients, allelopathic interactions(specific inhibiting effects of chemicals released by living or dead parts of acomponent species) and stimulation of pests and diseases. Positive interactionscan be based on soil fertility improvement (similar to the indirect effects insequential systems), microclimate improvement (especially in harsh conditions,e.g. with strong winds) and reduction of the impact of pests and diseases(Gajaseni and Jordan, 1992; Nair et aL, 1994; Watanabe, 1992). Based on therelative importance of the positive and negative interactions between trees andcrops, one may decide that it is worthwhile to combine them into anagroforestry system, or to keep them separate as 'woodlots' and 'cropped fields'.We will explore in general terms under which conditions agroforestry systemsshould be preferred over single-component systems.
In simultaneous agro-forestry systems, trees and food crops are interactingin various ways. As both positive and negative interactions occur, site specificoptimization of the system may be required. The most important interactionsprobably are:
253
a. Mulch production from the trees, increasing the supply of N and othernutrients to the food crops,
b. Shading by the trees, reducing light intensity at the crop level,c. Competition between tree and crop roots for water and/or nutrients in the
topsoil,d. Nitrogen supply by tree roots to crop roots, either due to root death
following hedgerow pruning or by direct transfer if nodulated roots are inclose contact with crop roots,
e. Effects on weeds, pests and diseases,f. Long-term effects on erosion, soil organic matter content and soil compaction.
Interactions a and d are positive, b and c are normally negative. Effects eand f are difficult to quantify in general terms, but can have a dramatic effect onthe acceptability of tree-crop combinations.
Considerable efforts have been made in the past decade to quantify the tree-soil-crop interactions in one of the most simple agroforestry systems: hedgerowintercropping or alleycropping. As the initial high expectations of crop yieldbenefits were tuned down by often negative or neutral results, we learned moreabout the nature of the interactions. This knowledge can now be used to selecttree - crop combinations on a priori knowledge and to optimize hedgerow inter-cropping systems. In hedgerow intercropping the following choices can be made:1. Tree species,2. Distance between hedgerows,3. Pruning regime (height and frequency),4. Crop, cultivar, crop population density and plant spacing,5. Additional fertilizer input level.
As it is at least impractical to explore all possible combinations of suchfactors in simple 'trial and error' experiments, we will have to resort to'diagnosis and design' procedures: build a coherent model of the systems, basedon the major interactions and use that to define 'design' criteria for the realworld, which can then be tested in limited number of experiments.
The total yield of an agroforestry system in a given year can be described asthe sum of the crop yield, the yield of tree products (or increase in net presentvalue), the yield of animal products and the change in land quality, whichreflects the concerns over the long term sustainability of the system. The treeproducts obtained at the end of the cycle will have to be discounted for thelength of the harvest cycle. If we restrict ourselves to agroforestry systemswithout an animal production component, we obtain:
Ytot=EeY +EtYt+ELAL (1)
254
where:Ytot = total yield, [S/ha]E = price per unit crop yield, [S/kg]Yc = crop yield, [kg/ha]Et = price per unit yield of tree products, [$/kg],Yt = yield of tree products (or 'net present value' of future productivity),
[kg/ha]EL = price per unit change in land quality, [I/X],AL = change in land quality for future production in units X to be further
specified, [X/ha].
On the basis of this equation we can explore under which conditions a
maximization of total yield will lead to a choice for an agroforestry system, with
both a tree and a crop component, and under which conditions pure tree or crop
production will be preferred.In the most simple case we may describe all tree-crop interactions as linear
functions of the relative tree area at. For crop yield Yc we may formulate:
Yc=(l -at)(Yo+atF-tCt) (2)
where:at = relative tree area (for an agroforestry system: 0 < at < 1)
Yoc = crop yield in the absence of trees, [kg/ha],
F = positive effect of trees on crop yield, e.g. due to soil fertility improve-
ment, per unit relative tree density, [kg/ha],Ct= = crop yield decrease due to competition by the tree, per unit relative tree
density [kg/ha],
When we see the system purely from the crop's point of view, agroforestry
or at least some inclusion of trees can be beneficial (i.e. lead to a higher yield
than the crop monoculture), if the yield curve has a positive slope close to a
pure crop system (at = 0); this means that the partial derivative of crop yield per
at at at = 0 is positive:
5c _.0 =-Y 0,+F-Ct>0 (3)Ctt t.
or, F - Ctc > Yoe. The positive effect of including trees on soil fertility F must
not only exceed the competition caused by the trees (F > Ct,), but per unit area
the positive effect (F - Ct,) must outweigh the crop yield per ha obtainable in a
pure-crop situation. From a crop production point of view, we may conclude
that combination with trees is only useful under poor soil fertility conditions
(low crop production YOc, potentially large F) and comparatively non-
competitive trees.
255
For the yield of tree products we may consider a negative interaction bycrops through competition and a positive interaction via better weed control:
Yt = at (Yot + (I - ct) (W - Cct)) (4)
where:Yot = yield of tree products in the absence of crops (kg/ha),Cct = decrease in yield of tree products due to competition by the crop, per unit
relative crop density (kg/ha),W = reduction in competition by weeds, due to crop cultivation, expressed as
increased production of tree products (kg/ha).The change in land quality for future production, AL, may be negative for a
pure crop system and may become more positive with increasing relative treedensity:
AL = (I - ot) ALc + aQ ALt = ALc + a t (ALc) (5)where:ALe = (normally negative) change in land quality for future production while
under monoculture crop (X/ha),ALt (possibly positive) change in land quality for future production while
under tree cover (X/ha).If land qualities are not supposed to degrade (AL > 0), then:
at -> (6)
ALt -ALc
Alternatively, the costs of land degradation may be considered to beoutweighed by direct benefits and be restored later, as happens in shiftingcultivation or fallow rotation systems.
If we substitute equations (2), (4) and (5) in (1), we obtain a quadraticequation in at for the total yield, Ytot. An agroforestry system (0< at <1) as awhole is more productive then either a pure tree (at = 1) or a pure crop (at = 0)system, if Ytot(at) has a local maximum in the range (0< a t <1). An optimumtree density at,,pt may be found for dYt/dat= 0, provided that d2Yt/(da) 2
<0. Only if this optimum tree density is between 0 and 1, agroforestry systemsare the best choice.
dY,=- E¢ (F -Ctc-Yo)+E,(Y 0, +W-CCt)+EL(AL, -AL)-2a,(E(F-Ct)+ E,(W- Ct) (7)
The requirement d2Ytot / (da1 )2 < 0 leads to:
E, F + E, W > Ec Ctc + Et Cct (8)
256
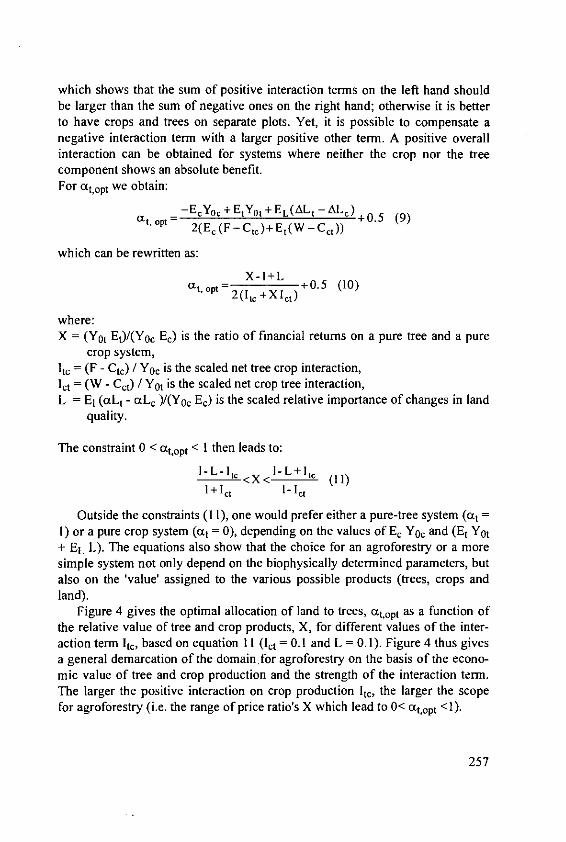
which shows that the sum of positive interaction terms on the left hand shouldbe larger than the sum of negative ones on the right hand; otherwise it is betterto have crops and trees on separate plots. Yet, it is possible to compensate anegative interaction term with a larger positive other term. A positive overallinteraction can be obtained for systems where neither the crop nor the treecomponent shows an absolute benefit.For at,0pt we obtain:
-E.Yoc + EtYot + EL(ALt - AL,) + 0. 5 (9)tt. pt = 2(E (F_ Ct)+ Et(W_ CCt)
which can be rewritten as:
X-I+Lt, opt = 2(t + Xlt) +0.5 (10)
where:X - (Yot Et/(Yoc Ec) is the ratio of financial returns on a pure tree and a pure
crop system,ltc = (F - Ctc) / Yoc is the scaled net tree crop interaction,lct = (W - Ct) / Yot is the scaled net crop tree interaction,L = El (aLt - aLc )/(Yo, E) is the scaled relative importance of changes in land
quality.
The constraint 0 < at,0pt < I then leads to:
I+lc't I -let
Outside the constraints (11), one would prefer either a pure-tree system (at =1) or a pure crop system (at = 0), depending on the values of Ec Yo, and (Et Yot+ EL L). The equations also show that the choice for an agroforestry or a moresimple system not only depend on the biophysically determined parameters, butalso on the 'value' assigned to the various possible products (trees, crops andland).
Figure 4 gives the optimal allocation of land to trees, tt,opt as a function ofthe relative value of tree and crop products, X, for different values of the inter-action term tc, based on equation IH (lct = 0.1 and L = 0.1). Figure 4 thus givesa general demarcation of the domain for agroforestry on the basis of the econo-mic value of tree and crop production and the strength of the interaction term.The larger the positive interaction on crop production It,, the larger the scopefor agroforestry (i.e. the range of price ratio's X which lead to 0< at,opt <1).
257

For realistic estimates of the interaction term, the tree products need to havesome direct value to the farmer to justify agroforestry. If trees have no directvalue, the term (F-Ctc)/Yoc has to be 1.0 or more, i.e. the net positive effect oftrees on crop yield per unit tree area has to exceed the monocultural crop yieldper unit area.
Optimum proportion of space for trees1~
(FCI)/Yoc
0.8- -0.1
20 0.2
0.6 -- 0.3
- 0.4
0.4- -0.7 :
-1.0.
0.2-
0 ~ ~ .¢ . .
0 0.1 0.2 0.3 0.4 0.5 0.6 0.7 0.8 0.9 1 1.1 1.2
Tree/crop economic yield ratio
Fig. 4. Optimum allocation of land to trees, ot,opt, as a function of the economicyield ratio of tree and crop products X.
If no nutrient shortages exist, as may be expected where fertilizer is cheap,the term F will probably be small and the term Yoc large. Thus, the interactionterm is small and the scope for agroforestry will be restricted to tree-cropcombinations with approximately equal value of the tree and crop component.
With these equations one can directly describe approximately stationarysystems, as approximated in alley cropping, where the normal growth of the treecomponent is checked by regular pruning. For most other AF systems, however,the tree-crop interactions change from year to year. The equations can still beapplied, however when annual yields are averaged over the typical lifespan of asingle production cycle. If two years of food crops can be obtained afterplanting a slow growing tree, with a sixty year cutting cycle, or one year with afast growing tree, with a 15 year cutting cycle, the average crop yield in thelatter system is twice that in the first, when averaged over the cycle length.
The simple model approach as above appears to be restricted to modifyingtree - crop land allocation ratio's, at constant plant density in the area's allocated.The production possibility frontier approach of Ranganathan (1993) overcomesthis limitation and can optimize plant densities for each component.
258
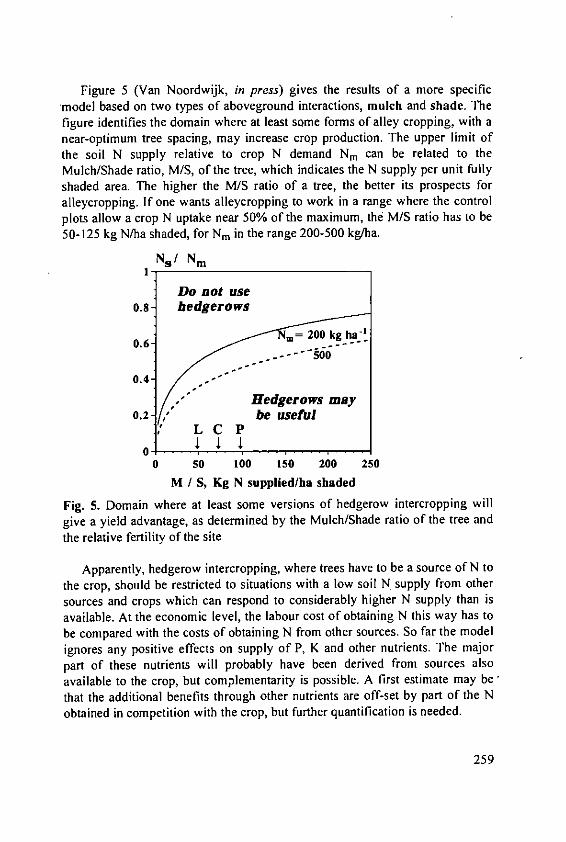
Figure 5 (Van Noordwijk, in press) gives the results of a more specificmodel based on two types of aboveground interactions, mulch and shade. Thefigure identifies the domain where at least some forms of alley cropping, with anear-optimum tree spacing, may increase crop production. The upper limit ofthe soil N supply relative to crop N demand Nm can be related to theMulch/Shade ratio, M/S, of the tree, which indicates the N supply per unit fullyshaded area. The higher the M/S ratio of a tree, the better its prospects foralleycropping. If one wants alleycropping to work in a range where the controlplots allow a crop N uptake near 50% of the maximum, the M/S ratio has to be50-125 kg N/ha shaded, for Nm in the range 200-500 kg/ha.
NS/ NmI-
Do not use0.8- hedgerows
0.6-
Hedgerows may0.2- be useful
, L C P
0 ... .I . 1 . I I
0 50 100 150 200 250
M / S, Kg N supplied/ha shaded
Fig. 5. Domain where at least some versions of hedgerow intercropping willgive a yield advantage, as determined by the Mulch/Shade ratio of the tree andthe relative fertility of the site
Apparently, hedgerow intercropping, where trees have to be a source of N tothe crop, should be restricted to situations with a low soil N supply from othersources and crops which can respond to considerably higher N supply than isavailable. At the economic level, the labour cost of obtaining N this way has tobe compared with the costs of obtaining N from other sources. So far the modelignores any positive effects on supply of P, K and other nutrients. The majorpart of these nutrients will probably have been derived from sources alsoavailable to the crop, but complementarity is possible. A first estimate may bethat the additional benefits through other nutrients are off-set by part of the Nobtained in competition with the crop, but further quantification is needed.
259
Although the model suggests a rather limited 'niche' for hedgerow inter-cropping, considerable scope remains for selecting hedgerow trees which aremost suitable. For the situation described the best hedgerow tree is one with ahigh M/S ratio, which can be based on a combination of a narrow but dense andcompact hedgerow canopy, thick leaves, the major part of the tree canopy notexceeding that of the crop, a high N content and a suitable N-release patternfrom the prunings, coinciding with crop demand. The need for fine tuning of theN release pattern increases with decreasing residence time for mineral N in thecrop root zone, due to shallow rooting and/or high rainfall infiltration surplusover evapotranspiration (Van Noordwijk et al., 1991).
The evaluation given may be too pessimistic on the scope for alleycropping:spontaneous litterfall from the trees (turnover of leaf biomass) will add to themulch supply, without causing further shade. With the intensive pruning regimesrequired to check the tree growth during the cropping period, however, litterfallwill be low for most trees. If part of the growing season can be reserved for treegrowth, litterfall as well as an increased pruned biomass can be important. Theprospects for alleycropping greatly improve if the crop is light saturated underfull sunlight. This opens the option of 'free light interception' by an upper treecanopy, resulting in mulch supply to the crop without shade costs. In that casesparse open canopies are better than dense hedgerows. This situation is morelikely to exist under the clear skies of the semi-arid tropics than under the usuallyovercast skies of the humid tropics, and more so for C3 than for C4 crops.
Essentially, the approach can also be used for evaluating the optimum treedensity for sparse upper story trees with little or no pruning. The example of thetea gardens in Java shows, however, that shade costs of in situ N production, areconsiderable. Tea gardens used to have a complete tree cover of trees such asParaserianthes as a source of N and organic matter, before inorganic fertilizerbecame abundantly available, but now nearly all trees are removed. This changefrom an agroforestry to a pure crop system was also stimulated by theavailability of new higher yielding, but less shade tolerant tea varieties. It wouldbe interesting to see at what timber prices it becomes worthwhile to reintroducethe trees, based on equation (10).
Only in specific situations are widely spaced upper canopy trees compatiblewith light demanding annual food crops. Peden et al (1993) reported crop yieldincreases of about 20% in maize and beans over a monocrop control whereAlnus acuminata was used as an upperstorey tree in Uganda, while all other treespecies tested (including Casuarina, Melia, Maesopsis, Markhamia andCupressus had negative effects. In Southern China Paulownia is widely grownin wheat fields, apparently with little harmful effect on the crop (Zhu Zhaohua,1991).
260

In North India Populus is similarly grown for timber in crop fields (Van denBeldt, pers. comm.). The specific tree characteristics which make these treesacceptable are not yet known: a relatively deep root system (Paulownia) and N2
fixation (AInus) probably contribute to the success.Otherwise, upper canopy trees are usually grown on field contours. Trees
such as Paraserianthes are widespread in Java around crop fields, Tectona ispopular among Javanese migrants in Lampung ('North Java'); Grevillea iscommonly found around maize fields on the lower slopes of Mount Kenya,Gmelina is increasingly popular in strip planting (following contour lines) onsloping land in the Philippines. In all these cases the value of the tree productsto the farmer apparently compensates for the losses of crop yields. Treemanagement by pruning and pollarding can be used to check tree growth.
The scope for systems with simultaneous trees and crops has clearlimitations. A partial temporal separation may be needed. If we uncouple themulch production from the amount of shade cast, e.g. by having a period of the
year devoted to tree growth and thus mulch production and a period in whichthe trees are set back severely and the crops are growing, the potential for in situmulch production will increase.
4. Nutrient sources for tree growth: scavengers, nutrient pumps and safetynets
A letter to the 'Tropical Agriculturalist' (Colombo, Ceylon) in 1887 statedthat: "Grevillea is valuable in the field, as its light shade, if planted at say 30 to36 feet apart, is rather beneficial to tea. But the great good it does is the bringingup of plant food from the subsoil, and distributing the same in the form of fallenleaves, ... which, too, are useful in preventing surface wash while decomposingon the ground" (Agroforestry Today, 1990). The idea that trees act as a nutrientpump has thus been around for at least a century. Little hard data haveaccumulated, however, as it is no easy task to identify which part of the netnutrient uptake of a tree comes from deep or superficial soil layers. A largeamount of 'circumstantial evidence' is available, however. A number of
conditions should be met for trees to act as nutrient pumps:
- the tree should have a considerable amount of fine roots and/or mycorrhiza indeep soil layers,
- deep soil layers should contain considerable nutrient stocks in directlyavailable form or as weatherable minerals in the soil or in a saprolite layer,
- soil water content at depth should be sufficient to allow diffusive transport tothe roots.
261
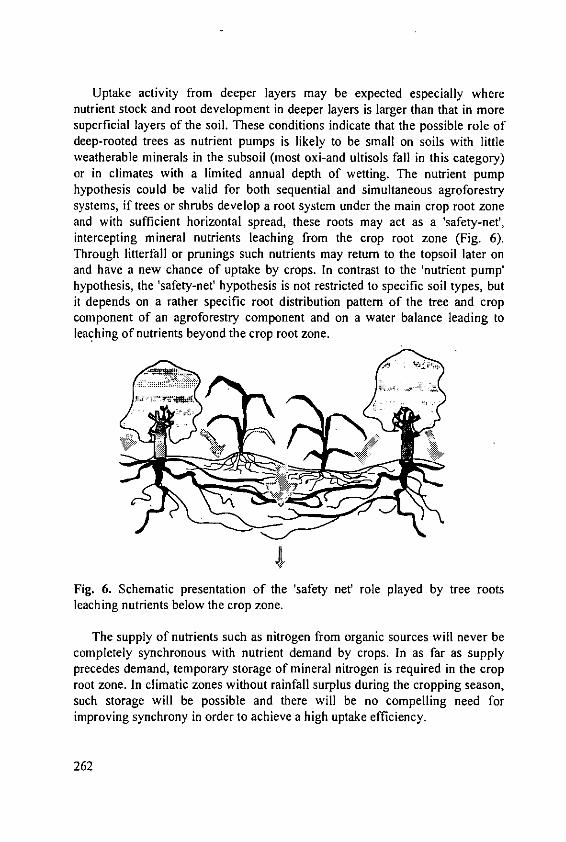
Uptake activity from deeper layers may be expected especially wherenutrient stock and root development in deeper layers is larger than that in moresuperficial layers of the soil. These conditions indicate that the possible role ofdeep-rooted trees as nutrient pumps is likely to be small on soils with littleweatherable minerals in the subsoil (most oxi-and ultisols fall in this category)or in climates with a limited annual depth of wetting. The nutrient pumphypothesis could be valid for both sequential and simultaneous agroforestrysystems, if trees or shrubs develop a root system under the main crop root zoneand with sufficient horizontal spread, these roots may act as a 'safety-net',intercepting mineral nutrients leaching from the crop root zone (Fig. 6).Through litterfall or prunings such nutrients may return to the topsoil later onand have a new chance of uptake by crops. In contrast to the 'nutrient pump'hypothesis, the 'safety-net' hypothesis is not restricted to specific soil types, butit depends on a rather specific root distribution pattern of the tree and cropcomponent of an agroforestry component and on a water balance leading toleaching of nutrients beyond the crop root zone.
Fig. 6. Schematic presentation of the 'safety net' role played by tree rootsleaching nutrients below the crop zone.
The supply of nutrients such as nitrogen from organic sources will never becompletely synchronous with nutrient demand by crops. In as far as supplyprecedes demand, temporary storage of mineral nitrogen is required in the croproot zone. In climatic zones without rainfall surplus during the cropping season,such storage will be possible and there will be no compelling need forimproving synchrony in order to achieve a high uptake efficiency.
262

In climates, such as the (per)humid tropics, however, where rainfall exceedsevapotranspiration during the growing season, products of early mineralizationwill be washed into deeper layers of the soil. If crop rooting is shallow, ascommon on the acid soils typical of this climatic zone, nutrients will be leachedbeyond the crop root zone. Deep rooted (tree) components of mixed cropping
- systems can then act as 'safety-net', intercepting N on its way to deeper layers(Van Noordwijk and De Willigen, 1991).
The safetynet role seems particularly valid for simultaneous agroforestrysystems, but under certain conditions may apply to sequential systems as well.Van Noordwijk (1989) used a simple leaching model (related to time-depthcurves) to analyze under what leaching rates (and consequently for whichcombinations of net precipitation surplus and apparent nutrient adsorptionconstants) a deep rooted component can intercept nutrients leached beyond thereach of a previous, shallow rooted component (Fig. 7). A limited window ofopportunities exists for such interception, but only when the rooting depth of thefallow vegetation substantially exceeds that of the crop. The chances forrecovery of leached nutrients increase when K. increases with depth, as mayoccur in soils with substantial nitrate adsorption capacity in deeper layers.
Z0.75
05-
.0.5
1,0.25-0
4 . 1.
S 3
KO 0-
.M
1 0 0.1 0.2 0.3 0.4 0.5 0.6 0.7 0.8 0.9 1Annual leaching depth, rn'
Fig. 7. Relationship between annual rainfall surplus (lower Y axis), annualleaching depth of nutrients (X axis, as determined by the apparent adsorptionconctant K) and chances of interception (upper Y-axis) by a deep-rooted fallowfollowing a shallow rooted crop (Van Noordwijk, 1989).
263
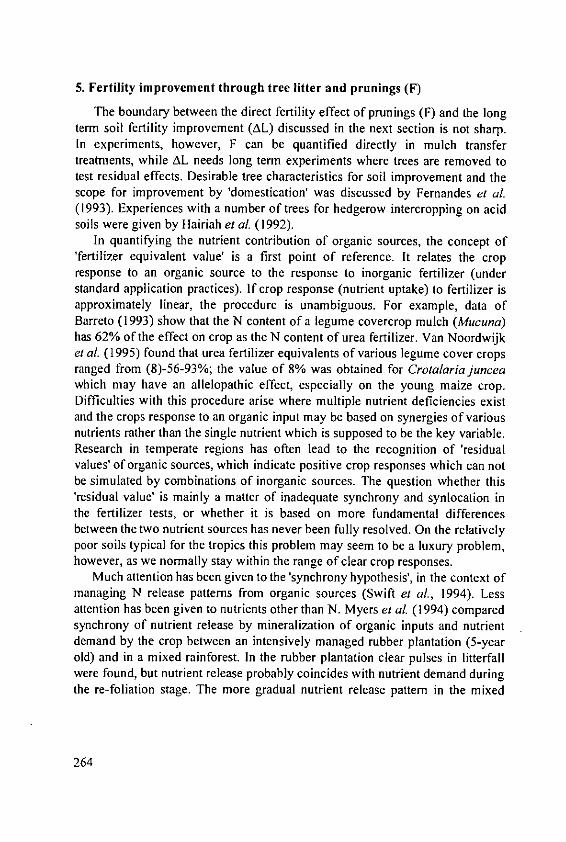
5. Fertility improvement through tree litter and prunings (F)
The boundary between the direct fertility effect of prunings (F) and the longterm soil fertility improvement (AL) discussed in the next section is not sharp.In experiments, however, F can be quantified directly in mulch transfertreatments, while AL needs long term experiments where trees are removed totest residual effects. Desirable tree characteristics for soil improvement and thescope for improvement by 'domestication' was discussed by Fernandes et aL(1993). Experiences with a number of trees for hedgerow intercropping on acidsoils were given by Hairiah et a! (1992).
In quantifying the nutrient contribution of organic sources, the concept of'fertilizer equivalent value' is a first point of reference. It relates the cropresponse to an organic source to the response to inorganic fertilizer (understandard application practices). If crop response (nutrient uptake) to fertilizer isapproximately linear, the procedure is unambiguous. For example, data ofBarreto (1993) show that the N content of a legume covercrop mulch (Mucuna)has 62% of the effect on crop as the N content of urea fertilizer. Van Noordwijket a! (1995) found that urea fertilizer equivalents of various legume cover cropsranged from (8)-56-93%; the value of 8% was obtained for Crotalariajunceawhich may have an allelopathic effect, especially on the young maize crop.Difficulties with this procedure arise where multiple nutrient deficiencies existand the crops response to an organic input may be based on synergies of variousnutrients rather than the single nutrient which is supposed to be the key variable.Research in temperate regions has often lead to the recognition of 'residualvalues' of organic sources, which indicate positive crop responses which can notbe simulated by combinations of inorganic sources. The question whether this'residual value' is mainly a matter of inadequate synchrony and synlocation inthe fertilizer tests, or whether it is based on more fundamental differencesbetween the two nutrient sources has never been fully resolved. On the relativelypoor soils typical for the tropics this problem may seem to be a luxury problem,however, as we normally stay within the range of clear crop responses.
Much attention has been given to the 'synchrony hypothesis', in the context ofmanaging N release patterns from organic sources (Swift et al, 1994). Lessattention has been given to nutrients other than N. Myers et a! (1994) comparedsynchrony of nutrient release by mineralization of organic inputs and nutrientdemand by the crop between an intensively managed rubber plantation (5-yearold) and in a mixed rainforest. In the rubber plantation clear pulses in litterfallwere found, but nutrient release probably coincides with nutrient demand duringthe re-foliation stage. The more gradual nutrient release pattern in the mixed
264

forest, due to more diverse litterfall patterns and litter compositions is inaccordance with the more continuous nutrient demand.
The lignin/N ratio is used in models such as Century (Parton et al., 1994) topredict N release patterns, with considerable success in a broad range of tropicalsituations. For a more detailed prediction, however, other litter quality parametersmay have to be included. The content of polyphenolics can explain part of thevariation in N mineralization from tree litter sources, in addition to C/N ratioand lignin content, but its importance decreases with higher leaching rates(Handayanto et al., 1994).
Most attention has been given to N release patterns, partly because N is animportant plant nutrient, but also because it is the most mobile and least buffered(compare figure 7). P release patterns can differ substantially from N releasepatterns, as P is stored in different cell components and may depend on phospha-tase activity. For the cations, which are mostly in ionic form in the vacuoles,nutrient release patterns will simply depend on physical damage to the membra-nes and the cation exchange properties of the degrading cell wall complex.
We have to consider the spatial pattern of soil enrichment by litterfall. Litter-fall data and nutrient contents of original forest trees maintained on bunds in ricefields in Northeast Thailand (Sae-Lee et al, 1992; Vityakon, 1993) show thatzones of enrichment and zones of depletion can be distinguished. In croppingpatterns with fixed management regimes, such as in intensively managed oil palmplantations, specific areas are designated for organic inputs. Fairhurst (1994) gavedata for a 10-year old oilpalm field in Sumatera and showed that significant diffe-rences in soil organic matter and most nutrients arise in that system, where fertili-zer is added to clean-weeded circles around each tree and organic residues areaccumulated in the frond stack. Figure 8 summarizes his results. Inputs are expres-sed per unit area, i.e. fertilizer inputs per unit area in the clean-weeded circleand organic inputs per unit area in the frond stack. The path area is taken as apoint of reference, as no inputs occur here and probably little uptake by the tree.
Figure 9 shows similar patterns in cassava-based intercropping systems inLampung, Sumatera. Cassava was planted in the same row position for 6consecutive years. The cassava row had a lower Corg and available P contentthan the soil in between the rows, which had been intercropped with rice, maizeor soybean. The Mg content of the cassava row had increased remarkably. Suchpatterns can be expected for any intercropping system and make sampling andnutrient balance calculations complex. They reflect on one hand un-evennutrient extraction patterns, even if the whole topsoil appears to be exploited byroots, and uneven litter deposition patterns. In the cassava based systems boththe residue of the intercrop and the major part of the leaf litter fall of the cassava(Van Noordwijk and Purnomosidhi, 1992) occurred in the middle of the plot.
265
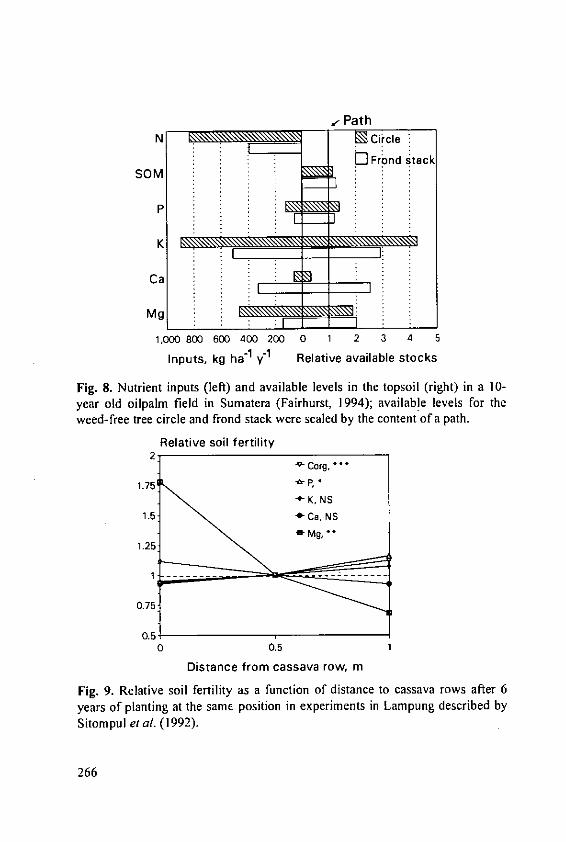
- Path
SOM
P
K
Ca __
Mg
1,000 800 600 400 200 0 1 2 3 4 5
Inputs, kg ha 1 y1 Relative available stocks
Fig. 8. Nutrient inputs (left) and available levels in the topsoil (right) in a 10-year old oilpalrn field in Sumatera (Fairhurst, 1994); available levels for theweed-free tree circle and frond stack were scaled by the content of a path.
Relative soil fertility2
-Ccrg,
1.75 I, .
K, N S1.5 - ]a, NS
Mg : :: " \'%"" M::j
1.25
1 --------- --------
0 0.51
Distance from cassava row, m
Fig. 9. Relative soil fertility as a function of distance to cassava rows after 6years of planting at the same position in experiments in Lampung described bySitompul etal. (1992).
266
6. Soil fertility improvement in sequential agro-forestry systems (AL)
Fallow systems
If we try to avoid any interpretation, we can define a fallow as: land whichhas been cropped before, which is not currently cropped, but will be in future.One expects the crop yield in the first year of cropping after a fallow to behigher than in the last year before the fallow started. Normally, this is expressedas 'declining soil fertility' during cropping and 'restoration of soil fertility'during the fallow, but 'soil fertility' is an umbrella for a wide range of soilchemical, physical and biological aspects. If we want to extrapolate betweensoils and climatic zones, we should be sure of a site-specific diagnosis beforewe can hope to design relevant solutions.
Agroforestry research on fallows may have two objectives:- to improve the fallow in its role towards the subsequent crop ("improved
fallow"),- to enrich the fallow and increase its direct use to the farmer, by yielding
valuable products (firewood, grazing, opportunities for bee-keeping)("enriched fallow"). Somewhere along the line, improved fallows candevelop into full agroforestry systems and the perspective of subsequentcropping can become of secondary importance, as happens in the 'complexagroforests'.Improvement and enrichment of fallows are not mutually exclusive and
farmers may go for a combination. Yet, for purposes of analysis, we concentrateon the "improved fallow" here.
How can afallow be improved?
The effect of improving soil fertility is normally associated with the durationof the fallow period. An 'improved fallow' is supposed to speed up therestoration process and have the same effect in a shorter period of time.Experiments usually compare the effect after an equal number of years, as thisis easier to derive from existing designs, but a comparison of the time requiredto achieve a state where cropping becomes worthwhile may be more relevant topractical situations, where reduced length of fallows due to increased localpopulation density is the cause of a breakdown of the system (not enough landfor long fallows -+ cropping before soil fertility fully restored - lower yields-+ earlier switch to a new plot - even shorter fallows etc.). Normally theclearing of a natural fallow vegetation is followed by burning the slashedbiomass. Burning slashed forest vegetation still appears to be the cheapest andmost effective way to ensure crop nutrition. Not burning is not a productivealternative for slash-and-bur farmers (Van Reuler and Janssen, 1993).
267

Table 1. Reasons for having a fallow and opportunities for improving it.00
Constraint to Major restoration process Yard stick of success Scope for improved fallowcontinuous cropping during fallow
A. N supply Build up of (top) soil N mine- I. Pool size of 1. Producing more biomassralization potential, based on: 'intermediate' fraction which contributes to SOM (low- N2 fixation, SOM, to intermediate quality litter ?)- atmospheric inputs 2. N mineralization 2. Increased mineralization rate- deep soil N sources rate of the soil- absence of losses/ exports
B. P supply 1. Transforming poorly availa- Pool size of organic P More effective P mining (orble P forms into organic P in the top soil better use of strategic P2. Uptake from deep layers ?? inputs...) and transfer to readily
available/organic P pool
C. Cation (K, Ca, Mg) Relocation of cations in the Concentration of Increased cation uptake fromsupply profile cations in the top zones where they are available
layer but not accessable to crops
D. Soil acidification 1. Accumulating other cations 1. Relative Al 1. see C(Al toxicity), obstruc- in top soil (- C) saturation of top soil 2. Increased production of theting root development 2. Producing organic acids 2. Concentration of right type of organic acidsand hence resource which can (temporarily) monomeric (toxic) Al 3. Increased production ofcapture by crops reduce Al toxicity in soil solution 'dead tree root channels'
3. Localized Al detoxification 3. Tree root distribu-around 'dead tree root tion and root turnoverchannels'

Table 1. Continued.
Constraint to Major restoration process Yard stick of success Scope for improved fallowcontinuous cropping during fallow
E. Soil physical degra- 1. Increased water infiltration Biological activity 1. Feeding the worms in adation, obstructing root 2. Reduced bulk density (earthworms etc.), better waydevelopment and hence 3. Improved soil aeration presence of 2. Increased production ofresource capture by macropores 'dead tree root channels'crops
F. Presence of 1. Decreased viability of 1. Viability of weed 1. Earlier formation of a(parasitic) weeds rhizomes of perennial weeds rhizomes closed shrub/tree canopy,
2. Decay of seed bank of 2. Size of seed bank shading out perennialsannual weeds 3. Re-infestation in 2. 'Fooling' of parasitic weed
cropping period seeds ?
G. Presence of soil Reducing population of Population size of More effective 'fooling' of theborne diseases disease organisms and/or disease organisms and disease organisms, or
increase population of antagonists stimulation of the antagonistsantagonists
H. Decreased presence Build up of VAM population Soil VAM infection Increased VAM sporeof'symbionts' such as potential or spore production of the right typeVAM fungi density
NJ

Technical developments to deal with thick mulch layers and avoid fire risksare needed if atmospheric pollution by burning is considered unacceptable.
The burning process leads to the loss of large amounts of N (and possibly P,S and ash as well), and may induce transformations in the top layers of the soil,depending on the temperature of the burn (amount and moisture content of theslashed biomass). A major distinction should thus be made between those typesof "improved fallow" which do and those which do not depend on burning uponreclamation. We can only avoid burning if we have techniques for planting cropsin (thick) layers of mulch, if decomposition rates of the mulch are sufficientlyfast (and immobilization effects are small) and if pest and disease problems aremanageable without a burn.
Research on 'improved fallows' would be much easier if we know what themain function of the fallow is in each location, and if we can find yard sticks formeasuring the effect of fallows, without a direct test of growing a crop.
A number of the effects of fallows, especially F, G and H can also be obtainedby proper crop rotation systems, and research methods can be derived from/shared with this field. Fallow based systems are normally 'sequential' agroforestrysystems, where trees and crops are present at different times on the same soil.Tree - crop interactions are mediated through soil conditions in this case. In somespatially zoned (simultaneous) systems such as 'hedgerow inter-cropping' anattempt is made to integrate the fallow function into a permanent system; thismay be successful where litter production is the main criterion (part of A, D &E). In its current form hedgerow intercropping systems suffer from too intensetree-crop competition or from a decline of the tree component due to too intensivepruning. Currently, interest is increasing in 'rotational alleycropping' systems,where a number of years of pruning the trees and growing food crops is alternatedwith a rest period in which the trees can grow. Such systems are similar to 'impro-ved fallows' in that they are based on a more rapid establishment of a tree phasethan would occur by natural succession. In fact, they draw on the best traditionalknowledge of shifting cultivators who abandon their plots while the tree stumpsare still alive.
New prospects for fractionating soil organic matter by a combination of sizeand physical density (degree of association with mineral particles) hold apromise that a sensitive 'yardstick' for the various functions of soil organicmatter can be found (Meijboom et al., 1995; Barrios et al, 1994).
7. Competition for nutrients between trees and crops in simultaneoussystems (C)
Direct evidence for belowground competition between trees and crops canbe obtained by separating the roots, by trenching or other means. Coster (1933)
270
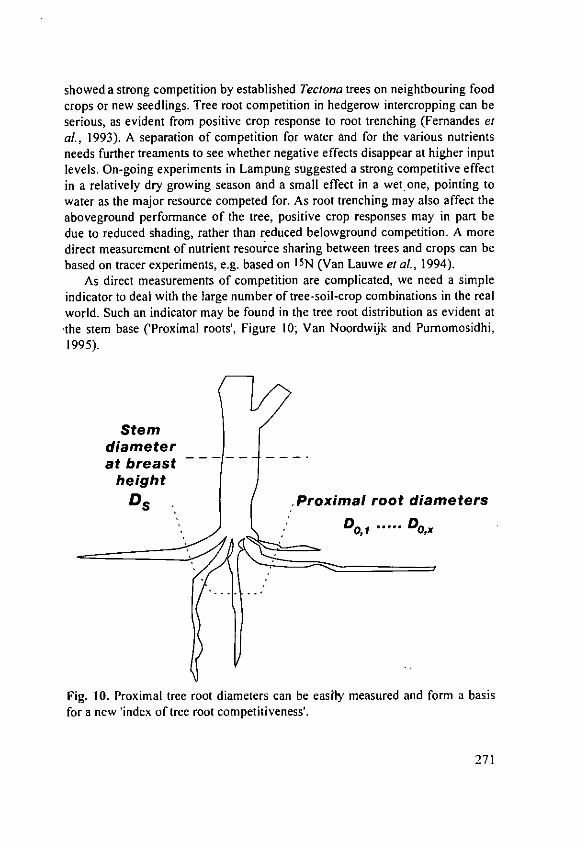
showed a strong competition by established Tectona trees on neightbouring foodcrops or new seedlings. Tree root competition in hedgerow intercropping can beserious, as evident from positive crop response to root trenching (Fernandes etal., 1993). A separation of competition for water and for the various nutrientsneeds further treaments to see whether negative effects disappear at higher inputlevels. On-going experiments in Lampung suggested a strong competitive effectin a relatively dry growing season and a small effect in a wet.one, pointing towater as the major resource competed for. As root trenching may also affect theaboveground performance of the tree, positive crop responses may in part bedue to reduced shading, rather than reduced belowground competition. A moredirect measurement of nutrient resource sharing between trees and crops can bebased on tracer experiments, e.g. based on 15N (Van Lauwe et al., 1994).
As direct measurements of competition are complicated, we need a simpleindicator to deal with the large number of tree-soil-crop combinations in the realworld. Such an indicator may be found in the tree root distribution as evident atthe stem base ('Proximal roots', Figure 10; Van Noordwijk and Purnomosidhi,1995).
Stemdiameterat breast ---------
heightDs .Proximal root diameters
S0,. ..... Do,x
Fig. 10. Proximal tree root diameters can be easily measured and form a basisfor a new 'index of tree root competitiveness'.
271
Measurements of root parameters can be based either on measuring all rootsbelonging to a single plant, or on sampling a known volume of soil andextrapolation to the soil volume per plant. For annual crops, growing in aregular planting pattern, both procedures are possible. For forest trees in aregular spacing the second approach is normally used. For isolated trees bothapproaches are virtually impossible and an alternative estimation procedure isrequired. An analogy may be found in forest mensuration procedures, whereaboveground tree biomass can be estimated with reasonable accuracy frommeasurements of stem diameter at a standardized height.
In a 'fractal' branching pattern, the same rules govern branching at eachsubsequent level. The initial size (diameter) and the essential branching rulesthus contain the information required to construct the whole pattern. If rootbranching patterns have fractal characteristics, measurement of the proximalroot diameter at the stem base and the branching rules as observed anywhere inthe root system, would be enough to predict total root length, root diameterdistribution and root length per unit dry weight (specific root length).
Table 2. Protocol for measuring proximal tree roots and index of rootcompetitiveness.
1. Carefully excavate the first apart of the proximal roots at the stem base. Forsmall tree a 0.3 m half sphere may be sufficient, for larger trees a 0.5-1 mhalf sphere will be needed. While excavating, all major roots should be leftintact; destruction of most of the fine roots can not be avoided. Check for'sinker' roots (vertically oriented roots starting from horizontal roots, oftenclose to the tree stem).
2. Measure the root diameter of all proximal roots (i.e. roots originating fromthe stem base or as laterals from the top part of the tap root) and classifythem by orientation (angle with a horizontal plane). Root diametermeasurements should be made outside the range of obvious thickening closeto the branching point or buttress roots (they normally taper off rapidly).
3. Measure stem diameter Ds (either as 'root collar' diameter or as stemdiameter at breast height, depending on the size of the tree).
4. Calculate the sum of root diameter squares for roots with a horizontal (anglewith horizontal plane less than 450), EDhor2 and vertical orientation EDvert2.
5. A tentative index of root competitiveness is then calculated as EDhor2/Ds 2 .
The average value of the proportionality factor (measured on branchingpoints throughout the diameter range) and link length can be used in theequations for total length, surface area and volume given by Van Noordwijk et
272
al. (1994a); if either of the regressions is has a significant slope, modifiedequations will have to be developed (e.g. on the basis of the numeric model
given by Spek and Van Noordwijk, 1994). Further checks of the 'index of rootcompetitiveness' are needed.
8. Sloping lands and erosion control
Erosion and sedimentation occur across a wide range of scales, but
extrapolations from one scale to another are not as easy as is normallyconsidered. 'Erosion control' can be based on two principles: a) prevent any soilmovement, b) increase local deposition of soil material on the move. Hedgerows
of trees planted along contour lines have been promoted for erosion control, withconsiderable success. Generally, the amount of sediment leaving the field is
greatly reduced by such hedgerows, similar to effects of grass strips or natural
vegetation. As a major source of nutrient export from the field is thus controlled,one may expect the overall 'nutrient use efficiency' to increase. Whether or not
such improvement also leads to improved nutrient availability to the crops is
questionable, however. Contour vegetation leads to terrace formation by soilredistribution and to considerable soil fertility gradients (Turkelboom et aL,
1993; ICRAF, 1994). The upper part of the terrace is depleted ('scoured'), while
the terrace is build up from organic matter and nutrient rich topsoil. Soil fertility
management can be based on a number of approaches:- exploit the gradients by putting nutrient demanding (tree) crops in the terrace
and good scavengers on scoured upper terrace,- try to reduce the fertility gradients by corrective fertilizer application (organic
an/or inorganic) on the upper terrace,- try to reduce the terrace formation effect by controlling soil movement rather
than increasing soil deposition; a nearly permanent soil cover by mulch may
be needed to reduce the splash impact leading to soil movement. Trees with a
slow litter decomposition rate will be superior in this respect. Grass strips can
probably not fulfill this requirement.As a first approach to modelling the crop effects, assume a parabolic
distribution of relative crop yields, due to 'shade and mulch' type interactionsbetween tree and crop, leading to increased yield in the middle of the alleys,compared to the no-tree control, and reduced yields close to the hedgerow. Soil
fertility is assumed to be proportional to topsoil depth. If the distance X is
scaled from 0 to I and the average yield is I (no net benefit or loss due to the
hedgerows, this means that the yield Y can be described by:
Y=pX(!-X)+l-Z (12)6
where the parameter p determines the shape of the curve.
273
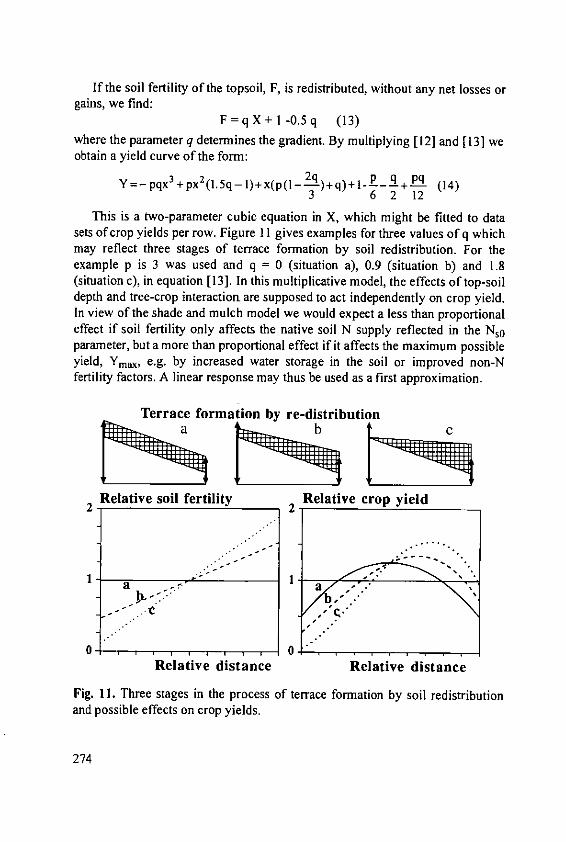
If the soil fertility of the topsoil, F, is redistributed, without any net losses orgains, we find:
F=qX+ 1-0.5q (13)where the parameter q determines the gradient. By multiplying [12] and [13] weobtain a yield curve of the form:
Y=- pqx 3 +px 2 (1.5q-l)+x(p(1- q )+q)+ ! -- q + q (14)3 6 2 12
This is a two-parameter cubic equation in X, which might be fitted to datasets of crop yields per row. Figure I I gives examples for three values of q whichmay reflect three stages of terrace formation by soil redistribution. For theexample p is 3 was used and q = 0 (situation a), 0.9 (situation b) and 1.8(situation c), in equation [13]. In this multiplicative model, the effects of top-soildepth and tree-crop interaction. are supposed to act independently on crop yield.In view of the shade and mulch model we would expect a less than proportionaleffect if soil fertility only affects the native soil N supply reflected in the Ns0parameter, but a more than proportional effect if it affects the maximum possibleyield, Ymax, e.g. by increased water storage in the soil or improved non-Nfertility factors. A linear response may thus be used as a first approximation.
Terrace formation by re-distribution
2 Relative soil fertility 2 Relative crop yield
a
01 0 1" ,Relative distance Relative distance
Fig. 11. Three stages in the process of terrace formation by soil redistributionand possible effects on crop yields.
274
A consequence of the linear soil fertility gradient and the symmetric shadeand mulch interaction curve is that the effect on average yield is neutral (as can
be checked by integrating [14] over the interval [0-1]).
9. Concluding remarks
Research on nutrient use efficiency of agroforestry systems as presentedhere has to bridge a number of levels of complexity. Equal attention is neededfor resource capture by the trees and processes which (finally) make it available
to other (marketable) components of the system. Nutrient management is an
integral part of the overall optimization of the agroforestry system. With
increased availability of fertilizers and increased market integration, the 'service'
roles of trees will probably decrease, while the direct market value becomes
more prominent.
We believe that progress in agroforestry research can come from a
combination of the following steps:
I. Inventory and classify the existing agroforestry systems and their raison
d'6tre (farmer knowledge and values, soils, climate, market conditions and
policy environment); diagnose the major constraints, management optionsand trade-offs, including risk management (Van Noordwijk et aL, 1994b).
2. Develop process-based models for the various types of interactions under a
wide range of environmental conditions and estimate the relevant parameters
in well controlled experiments.3. Develop and test simple criteria! indicators for judging interaction terms for
any tree on any site, such as the index of tree root competitiveness; these
criteria can be based on a combination of existing farmer knowledge, new
observation skills and key parameters for the process-based models.
4. Use the model as well as the local indicators for optimizing management
choices, including germplasm selection, for all relevant biophysical,socioeconomic and policy environments.
Agroforestry research in this sense has only just started and forms an
exciting challenge.
References
Barreto, H.J. (1993): Evaluation and utilization of different mulches and cover
crops for maize production in Central America): In: H.D. Thurston, M.
Smith, G. Abawi and S. Kearl (eds.) Tapado, Slash/Mulch: How Farmers
Use It And What Researchers Know About It. p. 157-165.
275
Barrios, E., Buresh, R.J. and Sprent, J.l. (1994): Soil organic matter size anddensity fraction in contrasting annual and perennial legume systems. Proc.ISSS 1994 Mexico, Vol. 3b, p.60.
Bruijnzeel, L.A. (1992): Sustainability of fast-growing plantation forests in thehumid tropics with particular reference to nutrients. In: C.F. Jordan, J.Gajaseni and H. Watanabe (eds.) Taungya: Forest Plantations withAgriculture in Southeast Asia. CAB International, Wallingford. pp 51-67.
Cannell, M.G.R. (1985): Dry matter partitioning in trees. In: M.G.R. Cannelland J.E. Jackson (eds.) Attributes of Trees as Crops. Institute of TerrestrialEcology, Huntingdon. p. 160-193.
Cassman, K.G. and Plant, R.E. (1992): A model to predict crop response toapplied fertilizer nutrients in heterogeneous fields. Fertilizer Research 31:151-163.
Coe, R. (1994): Through the looking glass: ten common problems in alley-cropping research. Agroforestry Today 6(1): 9-I1.
Coster, Ch. (1933): Wortelstudien in de tropen [Root studies in the tropics]. IV.Wortelconcurrentie [Root competition]. Tectona 26: 450-497.
Fairhurst, Th. (1994): The development of soil fertility gradients under oil palmand their effect on plant growth. Preliminary report for Kali und Salz AG,60 pp.
Fernandes, E.C.M., Garrity, D.P., Szott, L.T. and Palm, C.A. (1993): Use andpotential of domesticated trees for soil improvement. In: R.R.B. Leakey andA.C. Newton (eds.) Tropical trees: the Potential for Domestication and theRebuilding of Forest Resources. p. 137-147. London, HMSO.
Gajaseni, J. and Jordan, C.F. (1992): Theoretical basis for taungya and itsimprovement. In: C.F. Jordan, J. Gajaseni and H. Watanabe (eds.) Taungya:Forest Plantations with Agriculture in Southeast Asia. CAB International,Wallingford. pp. 68-8.
Hairiah, K., Van Noordwijk, M., Santoso, B. and Syekhfani, MS. (1992):Biomass production and root distribution of eight trees and their potentialfor hedgerow intercropping on an ultisol in Lampung. AGRIVITA 15: 54.
Handayanto, E., Cadisch, G. and Giller, K.E. (1994): Nitrogen release fromprunings of legume hedgerow trees in relation to quality of the prunings andincubation period. Plant and Soil 160: 237-248.
ICRAF (1994): Annual report 1993. ICRAF, Nairobi.Meijboom, F.W., Hassink, J. and Van Noordwijk, M. (1995): Density fractiona-
tion of soil macroorganic matter using silica suspensions. Soil Biol.Biochem. 27: 1109-1111.
276

Myers, R.J.K., Palm, C.A., Cuevas, E., Gutatilleke, UN. and Brossard, M.(1994): The synchronisation of nutrient mineralisation and plant nutrientdemand. In: Woomer, P.L. and Swift, M.J. (eds.) The Biological Manage-ment of Tropical Soil Fertility. Wiley, New York. p. 81-116.
Nair, P.K. (1993): An introduction to agroforestry. Kluwer Academic Publ.,Dordrecht. 499 pp.
Nair, P.K.R., Rao M.R. and Fernandez, E.C.M. (1994): Tree-crop interactions insustainable agroforestry systems. Proceedings 15th World Congress of SoilScience, Acapulco, Mexico. Vol. 7a, pp. 110-137.
Parton, W.J., Woomer, P.L. and Martin, A. (1994): Modelling soil organicmatter dynamics and plant productivity in tropical ecosystems. In: Woomer,P.L. and Swift, M.J. (eds.) The Biological Management of Tropical SoilFertility. Wiley, New York. p. 171-188.
Peden, D., Byenka, S., Wajja-Musukwe, N. and Okorio, J. (1993): Increased cropproduction with Alnus acuminata in Uganda. Agroforestry Today 5(4): 5-8.
Ranganathan, R. (1993): Analysis of yield advantage in mixed cropping. PhDthesis, Wageningen Agricultural University, Wageningen, 93 pp.
Sae-Lee, S., Vityakon, P. and Prachaiyo, B. (1992): Effects of trees on paddybund on soil fertility and rice growth in Northeast Thailand. AgroforestrySystems 18: 213-223.
Sitompul, S.M., Setijono, S., Van der Heide, J. and Van Noordwijk, M. (1992):Crop yields and sustainability of cassava-based cropping systems on anultisol in Lampung. AGRIVITA 15: 19-28.
Spek, L.Y., and Van Noordwijk, M. (1994): Proximal root diameters aspredictors of total root system size for fractal branching models. II.Numerical model. Plant and Soil 164:119-127.
Vanlauwe, B., Mulongoy, K. and Merckx, R. (1994): The Fate of AddedLeucaena-N in an Alley Cropping System in Southern Nigeria. Proc. ISSS1994 Mexico, Vol. 7b. p. 319.
Van Noordwijk, M. (1987): Methods for quantification of root distributionpattern and root dynamics in the field. 20th Colloq. Intern. Potash Inst.,Bern, p. 263-281.
Van Noordwijk, M. (1989): Rooting depth in cropping systems in the humidtropics in relation to nutrient use efficiency. In: J. van der Heide (ed.)Nutrient Management for Food Crop Production in Tropical FarmingSystems. Institute for Soil Fertility, Haren. p. 129-144.
Van Noordwijk, M. (1990): Synchronization of supply and demand is necessaryto increase efficiency of nutrient use in soilless horticulture. In: M.L. vanBeusichem (ed.) Plant Nutrition - Physiology and Applications. KluwerAcademic Publ., p. 525-531.
277
Van Noordwijk, M., and De Willigen, P. (1991): Root functions in agriculturalsystems. In: H. Persson and B.L. McMichael (eds.) Plant Roots and theirEnvironment. Elsevier, Amsterdam. pp. 381-395.
Van Noordwijk, M., Widianto, Heinen, M. and Hairiah, K. (1991): Old tree rootchannels in acid soils in the humid tropics: important for crop root pene-tration, water infiltration and nitrogen management. Plant Soil 134: 37-44.
Van Noordwijk, M. and Purnomisidi, P. (1992): Litter fall in cassava-basedcropping systems in Lampung. AGRIVITA 15: 29-33.
Van Noordwijk, M. and Wadman, W. (1992): Effects of spatial variability ofnitrogen supply on environmentally acceptable nitrogen fertilizerapplication rates to arable crops. Neth. J. Agric. Sci. 40: 51-72.
Van Noordwijk, M., G. Brouwer & K. Harmanny (1993): Concepts and methodsfor studying interactions of roots and soil structure. Geoderma 56: 351-375.
Van Noordwijk, M. and Scholten, J.H.M. (1994): Effects of fertilizer price onfeasibility of efficiency improvement: case study for an urea injector forlowland rice. Fert. Res. 39: 1-9.
Van Noordwijk, M., Spek, L.Y. and De Willigen, P. (1994a): Proximal rootdiameters as predictors of total root system size for fractal branchingmodels. I. Theory. Plant and Soil 164: 107-117.
Van Noordwijk, M., Dijksterhuis, G. and Keulen, H. van (1994b): Riskmanagement in crop production and fertilizer use with uncertain rainfall:how many eggs in which baskets. Neth. J. Agric. Sci. 42: 249-2.
Van Noordwijk, M. (in press): Mulch and shade model for optimum hedgerowspacing in alley cropping systems. C. Ong and P. Huxley (Eds.) Tree - CropInteractions, a Physiological Approach. CABI-ICRAF (in press).
Van Noordwijk, M., Sitompul, S.M., Hairaih, K., Listyarini, E. and Syekhfani,M.S. (1995): Nitrogen supply from rotational or spatially zoned inclusion ofleguminosae for sustainable maize production on an acid soil in Indonesia.In: R.A. Date, N.J. Grundon, G.E. Rayment and M.E. Probert (eds.) Plant-Soil Interactions at Low pH: Principles and Management. Kluwer,Dordrecht. pp. 779-784.
Van Noordwijk, M. and Purnomosidhi, P. (1995): Root architecture in relationto tree-soil-crop interactions and shoot pruning in agroforestry. AgroforestrySystems 30: 161-173.
Van Reuler, H. and Janssen, B.H. (1993): Nutrient fluxes in the shiftingcultivation system of south-west C6te d' Ivoire. Plant and Soil 154: 169-188.
Vityakon, P. (1993): The traditional trees-in-paddy fields agroecosystem ofNortheast Thailand: its potential for agroforestry development. East-WestCenter working paper no. 34, University of Hawaii.
278

Sanchez, P.A., Palm, C.A., Davey, C.B., Szott, L.T., and Russell, C.E. (1985):Tree crops as soil improvers in the humid tropics? In: M.G.R. Cannell and
J.E. Jackson (eds.) Attributes of Trees as Crops. Institute of Terrestrial
Ecology, Huntingdon. p. 327-358.Swift, M.J., Bohren, L., Carter, S.E., Izac, A.M. and Woomer, P.L. (1994):
Biological management of tropical soils: integrating process research andfarm practice. In: Woomer, P.L. and Swift, M.J. (eds.) The Biological
Management of Tropical Soil Fertility. Wiley, New York. p. 209-227.Turkelboom, F., Ongprasert, S. and Taejajai, U. (1993): Alley cropping on steep
slopes: soil fertility gradients in a contour hedgerow intercropping system.
Int. Workshop on Sustainable Agricultural Development, AIT, Bangkok, 16
p.Watanabe, H. (1992): Tree - crop interactions in taungya plantations. In: C.F.
Jordan, J. Gajaseni and H. Watanabe (eds.) Taungya: Forest Plantations with
Agriculture in Southeast Asia. CAB International, Wallingford. pp 32-43.
Zhu Zhaohua, Chao Ching-Ju, Lu Xin-Yu and Xiong Yao Gao (1986):
Paulownia in China: cultivation and utilization. Asian Network for
Biological Sciences and IDRC, Singapore and Ottawa, 65 pp.
Zhu Zhaohua (1991): Evaluation and model optimisation of Paulownia
intercropping system - a project summary report. In: Zhu Zhaohua, Cai
Mantang, Wang Shiji and Jiang Youxu (Eds.) Agroforestry Systems in
China, Chinese Academy of Forestry and IDRC, 30-43.
279
Nutrient Balance Consideration in Arable - FallowSystem
S. Ruaysoongnern
Department of Soil Science, Faculty of Agriculture, Khon Kaen University,Khon Kaen 40002, Thailand
Summary
Agricultural resource degradation is much discussed because of urban-biased approaches to development programs of various developing countries ofsoutheast Asia. The main cause derives from the intention to increaseagricultural production for exports. Thus farmer practices by expanding cropcultivations on marginal uplands have increased gaps of nutrient imbalance andreduce potential replenishment in low lands. The adoption by resource-poorfarmers of opening new lands in tropical forests on slope lands has furtherdegraded the resource base of agricultural systems in both uplands and lowlands. Erosion losses, though easily noticed, might not be very great, as theycould become gains in lower ecosystems. Management to reduce their unwantedside effects of erosion should be practiced rather than attempts on completeprevention. Readily mobile nutrients, such as N, K, S, Ca, and Mg aresignificantly lost through both crop removal and erosion. However, they couldalso be partially returned through application of crop residues and organicamendments. Losses of P through crop removals and erosion are significant in
low P agroecosystems on poor sandy soil. P gains were recorded in lowlandsthrough runoff and sedimentation from associated uplands. Amounts ofnutrients returned to soils as chemical fertilizers (mainly N, P and K) are mostlyfar lower than losses through crop removal and erosion. However,supplementary inputs of manures and recycling may produce a balance in somespecific localities, with some areas of potential gains. Under low external inputsystems, farmers tend to pay more attention to N, and, sometimes to P, but littleto K, with even less to Ca, S and Mg. The latter nutrients could becomelimiting. Current practices on fallow systems or ley farming probably improveshort-term soil productivity, but may be limited in long term, due to continuousmining of nutrients. Integrated farming systems, agroforestry, may have a
potential future because of recycling. Therefore, immediate attention must be
paid to develop longer term alternatives to sustain agriculture in resource-pooragroecosystem of developing countries in Southeast Asia.
281
1. Introduction
Recently, agricultural development in Southeast Asian countries has beenpromoted according to the different economic constraints and developmentplans in each country. Many such developments have induced resource-poorfarmers to exploit marginal lands using very low inputs. The low input systemshave been practiced continuously because of the generally low returns fromworld market prices. At the same time, rapid increase population have alsocreated problems in urban-biased development plans. Hence, there has been aconsiderable degradation of agricultural resource bases (Tongpan, 1988). Onemajor problem was expansion of agricultural lands rather than improvement ofexisting arable lands. Therefore, it is not uncommon to find exploitatively lowinput systems in most of the agricultural production in developing countries.
Frequently policy makers are not fully aware of the interactive situationsleading to degradation of the agricultural resource base. Such deficiencies havecaused, and could do a lot more damage to agricultural production in both theshort- and long-term. Therefore, serious consideration must be given toplanning processes for real development of agricultural systems.
In order to improve agricultural systems, nutrient balances are important andcould lead to better sustainable development through more appropriate plansand practical guidelines. Nutrient balance data have been compiled from varioussources, including on-going studies in research institutes. However, direct expe-riences in the Northeast of Thailand are mainly applied as base line to comparewith other systems in both country and regional findings. Since Kyuma (1983)showed that there are wide ranges of soil fertility in southeast Asia, even in onecountry. Any analysis and comparison should be done on a regional, or local level.
As a framework, arable lands have been categorized into various systems:sloping land, upland and lowland; and subsystems, according to the level ofindigenous resource and prevailing agricultural activities. Such activitiesinclude lowland rice, upland crops, and dry season cropping. Under these crops,various practices have been recognized depending on different resource bases,production purposes, market environments and input availability. So far,attention has been directed to estimating net losses, or net gains under individualsystems, rather than trying to describe details of the internal processes.
2. Nutrient balances
The data, mainly from direct experience in Thailand, have been categorizedand analyzed for problem systems or subsystems, according to the intensity ofactivity. However, some systems with high potential impacts have also beenincluded for future development planning.
282

2.1. Nutrient losses
Table 1. Amounts of soil loss (m3/ha) measured at Nam Phrom, Chaiyapum(Takahashi et al., 1983).
Period Rainfall Shifting Upland Bare Forest(mm) cultivation cultivation plot plot
1980Feb. 1-May 14 350 71.4 84.6 67.0 2.2May 15-May 29 209 4.8 5.4 8.3 1.8May 30-June 13 158 8.3 5.4 17.3 0.0June 14-July 26 166 1.1 9.8 10.1 0.0July 27-Aug. 25 162 1.0 0.5 9.1 0.0Aug. 26-Sept. 9 163 0.0 1.0 21.1 0.0Sept. 10-Oct. 17 285 1.0 0.3 12.9 0.7Oct. 18-Nov. 6 49 0.0 0.0 8.5 0.0
Total 1542 87.6 107.0 154.3 4.7
1981Feb. 25-May 27 409 2.3 2.0 6.0 1.0May 28-June 28 64 0.9 0.6 0.9 0.1June 29-July 15 73 2.3 0.9 1.1 0.9July 16-Aug. 20 93 1.1 2.0 3.1 0.9Aug. 21-Sept. 19 100 0.3 0.6 0.6 0.0Sept. 20-Oct. 10 138 0.0 0.3 11.1 0.0Oct. I I-Nov. 2 132 0.0 0.0 3.1 0.0
Total 1009 6.9 6.4 25.9 2.9
2.1.1. Erosion, runoff and leaching
From studies on shifting cultivation ecology (Kyuma and Pairintra, 1983;Takahashi et al., 1983; Pairintra, 1985), a main primary loss of soil andnutrients (around 80-90 m3/ha) from sloping arable lands occurred only duringthe land clearing and burning to land preparation stages (February to May) asshown in Table 1. During that stage, soil surface of newly opened lands wasextremely loose with high organic matter content (6 - 9% OM) and low bulkdensity (1.0-1.1 g/cm 3) and was transported easily by early storms even prior tosoil preparation. The losses could be attributed to the relatively large portion offorest floor materials rich in nutrients. Subsequently, losses of soil (-3% OM)and nutrients was relatively small (-6-7 m3/ha/year), but it occurred all yearround (Kyuma and Pairintra, 1983).
283
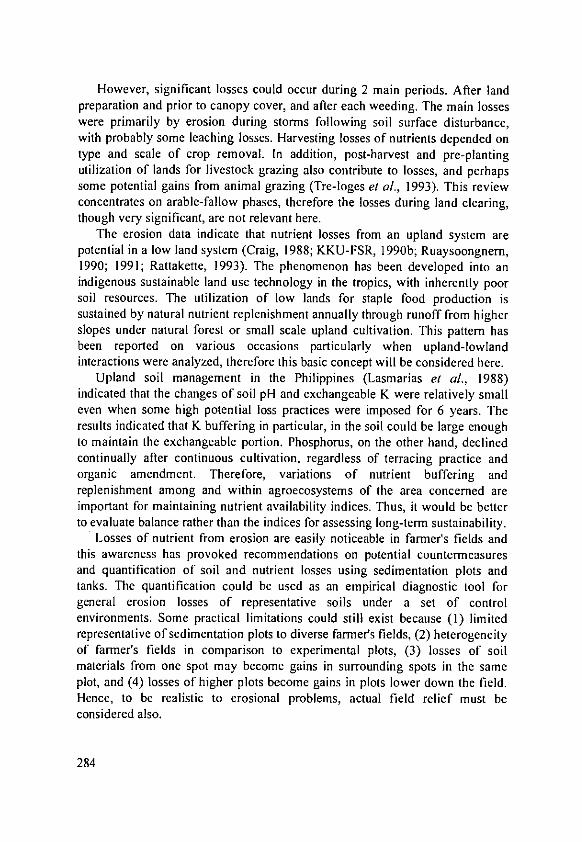
However, significant losses could occur during 2 main periods. After landpreparation and prior to canopy cover, and after each weeding. The main losseswere primarily by erosion during storms following soil surface disturbance,with probably some leaching losses. Harvesting losses of nutrients depended ontype and scale of crop removal. In addition, post-harvest and pre-plantingutilization of lands for livestock grazing also contribute to losses, and perhapssome potential gains from animal grazing (Tre-loges et al., 1993). This reviewconcentrates on arable-fallow phases, therefore the losses during land clearing,though very significant, are not relevant here.
The erosion data indicate that nutrient losses from an upland system arepotential in a low land system (Craig, 1988; KKU-FSR, 1990b; Ruaysoongnem,1990; 1991; Rattakette, 1993). The phenomenon has been developed into anindigenous sustainable land use technology in the tropics, with inherently poorsoil resources. The utilization of low lands for staple food production issustained by natural nutrient replenishment annually through runoff from higherslopes under natural forest or small scale upland cultivation. This pattern hasbeen reported on various occasions particularly when upland-lowlandinteractions were analyzed, therefore this basic concept will be considered here.
Upland soil management in the Philippines (Lasmarias el al., 1988)indicated that the changes of soil pH and exchangeable K were relatively smalleven when some high potential loss practices were imposed for 6 years. Theresults indicated that K buffering in particular, in the soil could be large enoughto maintain the exchangeable portion. Phosphorus, on the other hand, declinedcontinually after continuous cultivation, regardless of terracing practice andorganic amendment. Therefore, variations of nutrient buffering andreplenishment among and within agroecosystems of the area concerned areimportant for maintaining nutrient availability indices. Thus, it would be betterto evaluate balance rather than the indices for assessing long-term sustainability.
Losses of nutrient from erosion are easily noticeable in farmer's fields andthis awareness has provoked recommendations on potential countermeasuresand quantification of soil and nutrient losses using sedimentation plots andtanks. The quantification could be used as an empirical diagnostic tool forgeneral erosion losses of representative soils under a set of controlenvironments. Some practical limitations could still exist because (1) limitedrepresentative of sedimentation plots to diverse farmer's fields, (2) heterogeneityof farmer's fields in comparison to experimental plots, (3) losses of soilmaterials from one spot may become gains in surrounding spots in the sameplot, and (4) losses of higher plots become gains in plots lower down the field.Hence, to be realistic to erosional problems, actual field relief must beconsidered also.
284

Table 2. Average soil loss and runoff on experimental plots with different landuse at the Phu Wiang watershed Khon Kaen, in 1988-1990 (Vannaprasert andThongmee, 1993).
Treatment 1988 1989 1990soil loss runoff soil loss runoff soil loss runoff
(t/ha) (mm) (t/ha) (mm) (t/ha) (mm)
Bare soil 74.2 337.7 29.6 294.5 0.4 55.1Cassava 13.4 364.8 14.9 204.4 7.3 316.3Peanut 23.9 362.9 27.4 259.6 11.9 341.6Cas/Euc-4×4 7.7 357.4 16.1 234.1 2.4 282.3Pea/Euc-4x4 13.7 373.4 14.4 213.2 5.1 322.3Cas/Euc-2x8 14.1 377.6 13.9 251.3 3.4 312.4Pea/Euc-2x8 23.5 432.6 15.4 266.5 11.5 378.0Cas/Leu-4x4 18.3 309.4 10.1 200.4 3.9 188.1Pea/Leu-4x4 24.8 425.4 17.1 275.8 6.8 325.8Cas/Leu-2x4 16.9 425.4 14.7 216.4 4.7 240.6Pea/Leu-2x8 29.4 463.8 18.8 260.0 9.8 295.6Euc-4x4 1.3 136.9 1.4 51.1 0.4 59.8Leu-4x4 2.0 78.9 0.6 36.0 0.1 16.7Euc-2×8 0.4 78.9 0.8 61.4 0.4 60.0Leu-2x8 2.6 168.0 3.1 80.4 0.1 21.5
Cas. = cassava, Euc = Eucalyptus, Leu. = Leucaena, Pea. = peanut
Long-term sedimentation plots at Phu Wiang watershed (Vannaprasert andThongmee, 1993) were designed to simulate various agricultural options,including agroforestry systems. The data (Table 2) indicated severe soil lossesunder artificial bare soil up to 74 t/ha in the first year, even though the amountof runoff was only moderate. The result also indicate that soil losses were notdirectly related to runoff but probably related to soil covering and itserodability. The data demonstrate comparable effects of different vegetationcovers, without extrapolation for actual results in farmer's fields. Empiricalinformation on soil and nutrient losses suggest that normal cropping practicescould reduce erosion losses, in comparison to the bare plot. Also, for example,losses under cassava planting were only half those under peanut for all of 3
years with similar amounts of runoff. Effective reduction of erosion losses couldbe achieved through some agroforestry system, such as cassava interplantedwith tree species.
285
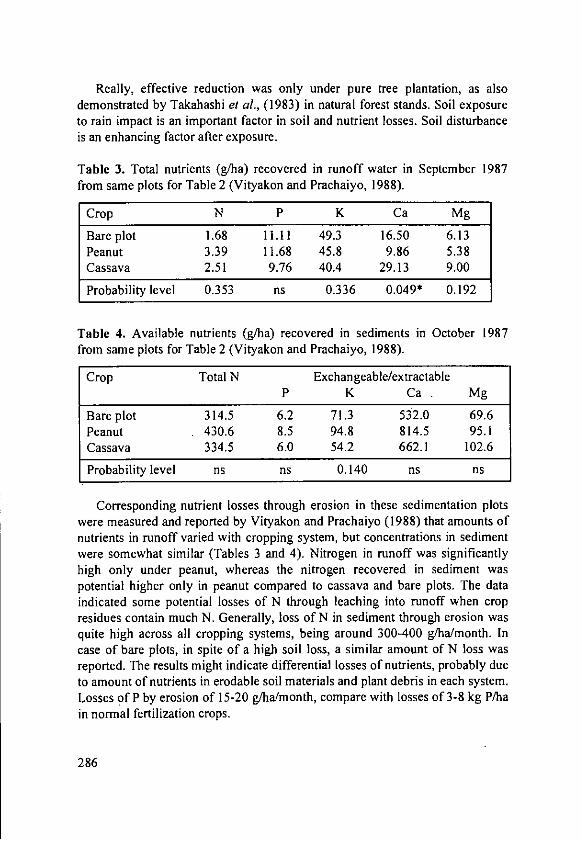
Really, effective reduction was only under pure tree plantation, as alsodemonstrated by Takahashi et al., (1983) in natural forest stands. Soil exposureto rain impact is an important factor in soil and nutrient losses. Soil disturbanceis an enhancing factor after exposure.
Table 3. Total nutrients (g/ha) recovered in runoff water in September 1987from same plots for Table 2 (Vityakon and Prachaiyo, 1988).
Crop N P K Ca Mg
Bare plot 1.68 11.11 49.3 16.50 6.13Peanut 3.39 11.68 45.8 9.86 5.38Cassava 2.51 9.76 40.4 29.13 9.00
Probability level 0.353 ns 0.336 0.049* 0.192
Table 4. Available nutrients (g/ha) recovered in sediments in October 1987from same plots for Table 2 (Vityakon and Prachaiyo, 1988).
Crop Total N Exchangeable/extractableP K Ca. Mg
Bare plot 314.5 6.2 71.3 532.0 69.6Peanut . 430.6 8.5 94.8 814.5 95.1Cassava 334.5 6.0 54.2 662.1 102.6
Probability level ns ns 0.140 ns ns
Corresponding nutrient losses through erosion in these sedimentation plotswere measured and reported by Vityakon and Prachaiyo (1988) that amounts ofnutrients in runoff varied with cropping system, but concentrations in sedimentwere somewhat similar (Tables 3 and 4). Nitrogen in runoff was significantlyhigh only under peanut, whereas the nitrogen recovered in sediment waspotential higher only in peanut compared to cassava and bare plots. The dataindicated some potential losses of N through leaching into runoff when cropresidues contain much N. Generally, loss of N in sediment through erosion wasquite high across all cropping systems, being around 300-400 g/halmonth. Incase of bare plots, in spite of a high soil loss, a similar amount of N loss wasreported. The results might indicate differential losses of nutrients, probably dueto amount of nutrients in erodable soil materials and plant debris in each system.Losses of P by erosion of 15-20 glha/month, compare with losses of 3-8 kg P/hain normal fertilization crops.
286
Under poor soil environments without external inputs, the erosion loss maybe sufficiently high to affect long term soil productivity. Losses of K, Ca, and
Mg, were quite high despite little or no fertilizer inputs. Combined runoff and
sediment losses were 100-140, 500-800, and 70-110 g/ha/month, for K, Ca, and
Mg, respectively. These amounts are large for poor soils with low inputs.
Hence, reduction of sediment losses would be significant to maintain the
balance of these three major elements on upland plots.Leaching losses of nutrients are predominantly in sandy soils and depend on
amount and intensity of rainfall, and density of active plant roots. From a studyby Vibulsuk et al. (1987) using an upland soil in the Northeast of Thailand, it
was concluded that ammonium-N up to 120 kg N/ha was readily transformed
into nitrate-N and leached to lower soil horizons. Losses were high at the
beginning of the growing season when maize plants were still small. S and Clwere leached even faster than N. Sulphate applied at the rate of 30 kg S/ha in
form of gypsum powder disappeared completely from sandy soil profile down
to 2 m depth after only 600 mm of accumulated rainfall. Some K was also
leached down to the profile or lower slope through under ground flows (KKU-
FSR, 1990b). P was leached from soil surface down into the soil profile, but it
was still in root zone of maize plants. From the data, it may be concluded that
leaching losses are significant for N and S, with minimum potential losses up to
120 and 60 kg (of N or S)/ha/yr, respectively. Therefore, fertilizer management
is a critical factor for fertilizer use efficiency. Moreover, losses of N through
denitrification after leached into anaerobic zones in lower horizons. The loss in
this case could be all of the transformed N (Satrusajang et al., 1988).
2.1.2. Crop removal
Crop removal is an important source of nutrient loss from all agricultural
lands together with leaching and volatilized losses.Tanaka (1988) compiled total nutrient uptakes of some commonly grown
crops at relatively high productivity as in Table 5. Nutrients absorbed by crops
are somewhat similar with the exception for Si and amount removed by crops
were quite high for N and K at around 100-200 kg/ha/crop, while other major
elements, including P, Ca and Mg were around 13-40 kg/ha/crop. Leguminous
crops tended to absorb less K and Mg, but more Ca than cereal crops. However,the uptakes could only be considered as potential losses of nutrients, if all plant
parts were removed from the field.
287

Table 5. Yield, amounts of nutrients absorbed by some commonly grown crops(Tanaka, 1988).
Yield Rice Wheat Maize Soybean Field beant/ha
Biol. yield 13.9 14.8 16.4 5.8 5.5Econ. yield 6.3 4.8 6.4 2.9 2.6
Nutrient absorbed in biological yield (kg/ha)
N 187 207 210 226 149P 38 29 30 -20 17K 186 192 209 109 106Ca 21 29 37 36 34Mg 20 19 23 18 13Na 18 3 5 1 1Si 733 510 284 36 72
Balogan et al. (1988) described nutrient uptake of cereal crops in Nepal(Table 6) and compared uptake and distribution under maize, wheat, and rice.At equivalent yields, losses of nutrients with maize and wheat crops (grain only)were nearly double those of rice for N, P, and K. Total plant uptake of K by ricewas large but it was accumulated in straw rather than in grain. Similar nutrientaccumulation in straw of rice was also found for N. This amount of N, and Kmay be returned directly or indirectly to soil, depending on farmer practices.Hence, straw incorporation, or even burning on site would be a good practice tomaintain K in wheat and rice production as suggested by KKU-FSR (1990b),but may not be significant in the case of maize production systems.Incorporation of rice and maize straw could reduce N losses significantly inrice and maize production, but may be less efficient for wheat. So, evaluation ofnutrient distribution in plant parts would be necessary to justify appropriatedpractices for reduction of nutrient losses due to crop removal. From the existingdata, the losses of N, P, and K would be 20 - 30, 12 - 16, and 6 - 9 kg/ha/cropfor the cereal crops, which seemed to relate to both biological yield and economicyield ranges. For example, every ton of rice yield would remove about 30 kg Nand so forth, regardless of yield ranges. As such, normal recommendations offertilizer applications for lowland rice at 300 kg/ha of 16-20-0 or 16-16-8, couldapproximately compensate for the crop removal losses. Since, farmers wouldapply only 30-150 kg/ha of these fertilizers (KKU-FSR, 1990b), there could bea deficit of at least half of the crop removal. However, as some losses could bereturned as recycling or waste products the actual losses may be somewhat less,depending on farming practices.
288

Table 6. Quantity of nutrients removed by maize, wheat and rice (Balogan etal., 1988).
Crops / yield Yield Quantity removed by cropskg/ha N P K
kg/ha kg/ha kg/ha
Maizegrain 1,560 27.8 14.8 8.6stalk 2,340 25.5 7.7 3.8Total 53.3 22.5 12.4
Wheatgrain 1,323 20.8 11.5 6.6straw 1,985 9.1 2.8 25.0Total 29.9 14.3 31.6
Ricegrain 2,310 30.0 16.2 9.2straw 3,465 24.3 6.9 65.1Total 54.3 23.1 74.3
Cassava grown in the uplands in the tropics has long been considered to be a'soil mining' crop. Regardless of its bad name, resource-poor farmers still preferto grow cassava as a main cash crop in poor soils of semi-arid to arid regionsbecause of its high adaptability to the constraints of those environments. Thatreasonable root yields of cassava can be produced in extremely poor soils atvery low or completely no fertilizer inputs indicates a high efficiency of nutrientuptake. This, together with the low price of cassava roots and their productsfurther reduces the capacity and willingness of farmers to increase fertilizerinputs. Howeler and Reinhardt (1985) described amounts of macro-nutrientsabsorbed by cassava crops under both fertilized and non-fertilized conditions(Table 7). The data indicated that nutrient removal through uptake in rootsalmost doubled when fertilizer was applied, but root yield increase was onlyaround a quarter of the yield on unfertilized control plots. More of the nutrientuptake accumulated in tops than in roots. Therefore, if tops were not removed orremoved at minimum, nutrient losses would be 30 and 55 kg/ha of N and K,respectively, at a yield of 10 t/ha. For P, Ca, Mg, and S, the losses were onlyaround 3-8 kg/ha. Thus no fertilizer application would cause depletion of soil Nand K but when fertilizer is applied losses were at least doubled for all nutrients.
* Management to reduce losses would be rather difficult due to large proportionof those nutrients presented in marketable parts.
289
Table 7. Nutrient losses by crop removal under cassava (Howeler andReinhardt, 1985).
t/ha kg/haDM N P K Ca Mg S
ControlTops 4.29 58.0 6.2 28.2 31.5 13.6 6.9Roots 10.75 30.3 7.5 54.9 5.4 6.5 3.3Total 15.04 88.3 13.7 83.1 36.9 20.1 10.2
FertilizedTops 5.80 83.9 9.8 62.4 46.2 12.8 8.1Roots 13.97 67.3 16.8 102.1 15.5 8.4 7.0Total 19.77 151.2 26.6 164.5 61.7 21.1 15.1
Nutrient removals for a number of crops were calculated by Cock (1985) ona dry matter harvested basis. The data indicated high N removal for sorghumand some temperate food crops in the range 18-21 kg N/ton of dry matterharvest. For other tropical crops, such as cassava, rice and maize, N removalswere smaller, around 6-15 kg N/ton. Removals of P were different from N,although the pattern of removals was similar, the range of values was very smallaround 1-5 kg P/ton for all of the crops compared. For K, only tropical andtemperate root crops removed large amounts of K in their roots. Cereal cropsshowed no any significant difference for kg K /ton removal.
2. 1.3. Other removals and losses
Losses of nutrients can occur by other means than erosion and crop removal.Such processes include off-season animal grazing on agricultural plots, animalfeed collection both during and off- cropping season, and accidental orcontrolled burning. Significant amount of some readily mobile nutrients such asnitrate-N and sulphate-S may be lost through leaching under wet environmentson highly permeable soils. Volatilization losses of mineral N may alsosignificant in low land rice production. Soils conditions conducive todenitrification can result in much loss of nitrate.
Animal grazing after crop harvest is a common practice in subsistencefarming systems, utilizing crop residues and agricultural wastes but nutrientlosses depend on the material grazed. For example, comparison of post-harvestgrazing of leguminous and cereal crops showed that where fresh leguminouscrop residues were left after harvest most were repeatedly grazed, until onlysome tough and unpalatable material was left (KKU-FSR, 1990a).
290
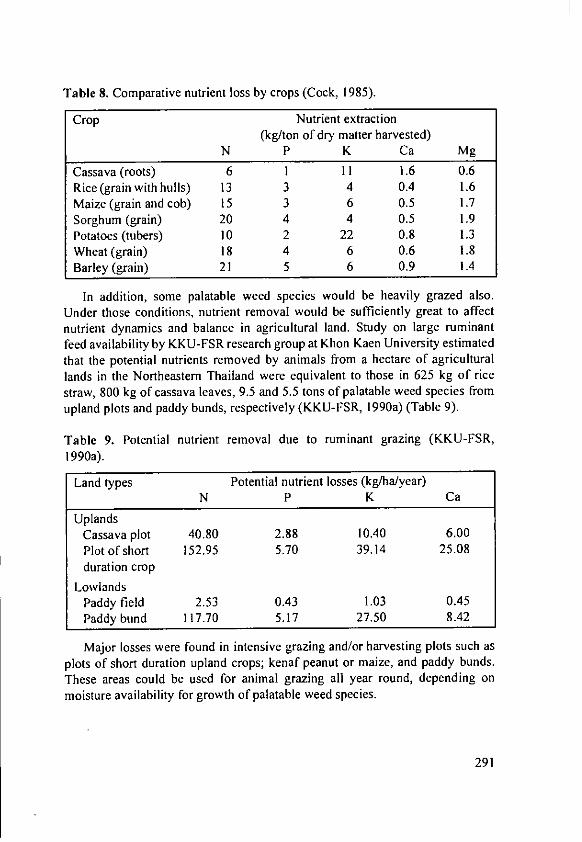
Table 8. Comparative nutrient loss by crops (Cock, 1985).
Crop Nutrient extraction(kg/ton of dry matter harvested)
N P K Ca Mg
Cassava (roots) 6 1 11 .6 0.6Rice (grain with hulls) 13 3 4 0.4 1.6Maize (grain and cob) 15 3 6 0.5 1.7Sorghum (grain) 20 4 4 0.5 1.9Potatoes (tubers) 10 2 22 0.8 1.3Wheat (grain) 18 4 6 0.6 1.8Barley (grain) 21 5 6 0.9 1.4
In addition, some palatable weed species would be heavily grazed also.Under those conditions, nutrient removal would be sufficiently great to affectnutrient dynamics and balance in agricultural land. Study on large ruminantfeed availability by KKU-FSR research group at Khon Kaen University estimatedthat the potential nutrients removed by animals from a hectare of agriculturallands in the Northeastern Thailand were equivalent to those in 625 kg of ricestraw, 800 kg of cassava leaves, 9.5 and 5.5 tons of palatable weed species fromupland plots and paddy bunds, respectively (KKU-FSR, 1990a) (Table 9).
Table 9. Potential nutrient removal due to ruminant grazing (KKU-FSR,1990a).
Land types Potential nutrient losses (kg/ha/year)N P K Ca
UplandsCassava plot 40.80 2.88 10.40 6.00Plot of short 152.95 5.70 39.14 25.08duration crop
LowlandsPaddy field 2.53 0.43 1.03 0.45Paddy bund 117.70 5.17 27.50 8.42
Major losses were found in intensive grazing and/or harvesting plots such asplots of short duration upland crops; kenaf peanut or maize, and paddy bunds.These areas could be used for animal grazing all year round, depending onmoisture availability for growth of palatable weed species.
291

The main nutrients lost were N, K and Ca. Potential nutrient removal couldreach 150, 40, and 25 kg/ha/year, for N, K, and Ca, respectively. Losses of Pwere relatively small from around 1-5 kg/ha/year. However, losses in this casecould be recovered in forms of manures and nutrient redistribution from animaldropping during grazing.
Major losses of nutrient can occur during burning especially in land clearingby 'slash and burn' agriculture, where excessive weed growth prevents landpreparation by available tools. For example, on sloping land in Koa Ko district,Petchabun province, Central Highland of Thailand. Land preparation by largetractors would be nearly impossible without prior burning of the dense 3-4 mtall canegrass swards. Another case of controlled burning of crop residues bysmall farmers was found under sugarcane production. Without burning,sugarcane trash will prevent plowing, both for planting and ratooning crops.Losses are mainly of N and S, and varied according to the content of thesenutrients in trashes and straws. The losses could be 20 -25 kg N/ha (as drawnfrom Table 6) or around 2.5 kg/ha/yr for paddy fields (as drawn from Table 9).
2.2. Nutrient gains (input)
Gains of nutrients in low input systems primarily consist of deposition fromhigher slope runoff, materials and nutrients carried by flood water, recyclingfrom depth by trees, animal manures, crop residues, organic and some inorganicfertilizer, N 2 fixation processes natural and by managed green manure crops,and incorporation of waste products. Both inputs vary in nutritional quality.
As stated previously erosion losses can become deposition gains lower downslopes. Improvement of soil fertility under trees could be achieved only inlowland environments (Rathakette, 1993). The increases included organicmatter, CEC and available nutrients as shown in Table 10. Vityakon et al.(1988) compared soil ecology under three native densities of diptherocarp treespecies and analyzed soil samples for nutrient contents. Only P availabilityindices were related to tree density in the study site. Other nutrients all hadsimilar values under different tree densities. In a later study (Ruaysoongnem etal., 1993), the contribution of P through trees from litter fall significantlyimproved not only total P in paddy soil but also soluble P in runoff water and insoil solution. However, another related study also showed that amount of Kleached out from leaf litter was quite high during early rains. Hence, under lowinput systems, trees can contribute significantly to nutrient replenishment ofpoor soils (Vityakon et al., 1988).
292
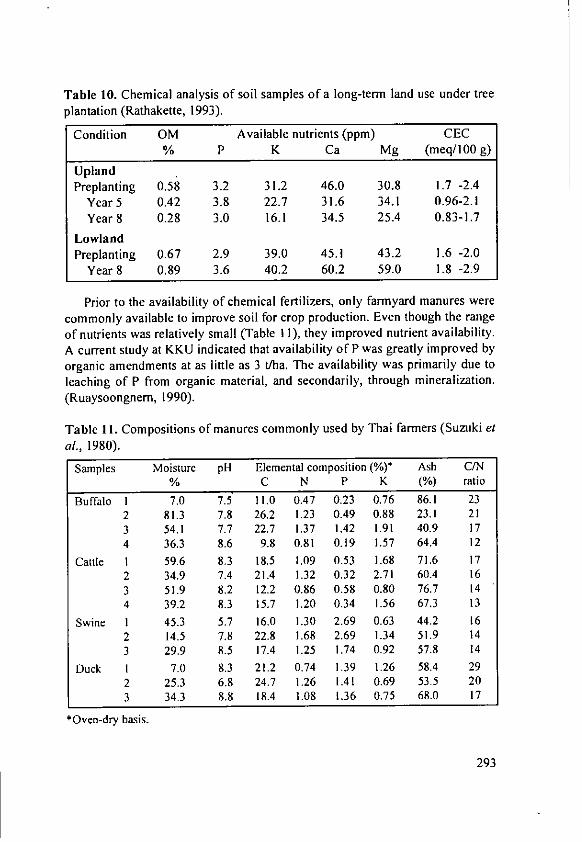
Table 10. Chemical analysis of soil samples of a long-term land use under treeplantation (Rathakette, 1993).
Condition OM Available nutrients (ppm) CEC% P K Ca Mg (meq/100 g)
UplandPreplanting 0.58 3.2 31.2 46.0 30.8 1.7 -2.4
Year 5 0.42 3.8 22.7 31.6 34.1 0.96-2.1Year8 0.28 3.0 16.1 34.5 25.4 0.83-1.7
LowlandPreplanting 0.67 2.9 39.0 45.1 43.2 1.6 -2.0
Year 8 0.89 3.6 40.2 60.2 59.0 1.8 -2.9
Prior to the availability of chemical fertilizers, only farmyard manures werecommonly available to improve soil for crop production. Even though the rangeof nutrients was relatively small (Table 11), they improved nutrient availability.A current study at KKU indicated that availability of P was greatly improved byorganic amendments at as little as 3 t/ha. The availability was primarily due toleaching of P from organic material, and secondarily, through mineralization.(Ruaysoongnem, 1990).
Table 1I. Compositions of manures commonly used by Thai farmers (Suzuki etal., 1980).
Samples Moisture pHi Elemental composition (%)* Ash C/N% C N P K (%) ratio
Buffalo I 7.0 7.5 11.0 0.47 0.23 0.76 86.1 232 81.3 7.8 26.2 1.23 0.49 0.88 23.1 213 54.1 7.7 22.7 1.37 1.42 1.91 40.9 174 36.3 8.6 9.8 0.81 0.19 1.57 64.4 12
Cattle 1 59.6 8.3 18.5 1.09 0.53 1.68 71.6 172 34.9 7.4 21.4 1.32 0.32 2.71 60.4 163 51.9 8.2 12.2 0.86 0.58 0.80 76.7 144 39.2 8.3 15.7 1.20 0.34 1.56 67.3 13
Swine 1 45.3 5.7 16.0 1.30 2.69 0.63 44.2 162 14.5 7.8 22.8 1.68 2.69 1.34 51.9 143 29.9 8.5 17.4 1.25 1.74 0.92 57.8 14
Duck I 7.0 8.3 21.2 0.74 1.39 1.26 58.4 292 25.3 6.8 24.7 1.26 1.41 0.69 53.5 203 34.3 8.8 18.4 1.08 1.36 0.75 68.0 17
*Oven-dry basis.
293

The range of nutrients in manures also varies from place to place and withseason (Rerkasem and Rerkasem, 1988). Wider ranges could also be found inTable 12 by Suzuki et al. (1980) for various sources of organic wastes. Theyreported that sawdust contained very small amount of nutrients with high C/Nratio, whereas rice mill dust varied widely in its nutritional quality.Fermentation residues contain high N and K, but are rather low in P. Activatedsludge and rice straw compost could contain relatively high N and P, but K islow in activated sludge. From field experience with farmer's application rates, ifthe amount of amendment was low, 3-6 t/ha, most farmers would apply in crophills. For application rates exceeding 6 t/ha, broadcasting of organic materialsmight be done, either prior to or after planting. Such different practices couldcreated a range of nutrient uptakes and balances due to different rootingenvironments. Similarly, nutrient contents of crop residues returned to soil afterharvest or intentional application to other fields could also vary with theirsources. Ongprasert (1988) reported that variation of nutrients in tobaccoresidues from Chiang Mai were, sometimes, related to their economic yieldlevels. However, most residues contained 3% K, 0.9% N, 0.2% P and 0.7% Ca.Residues from high yielding crops tended to have high nutrients.
Table 12. Compositions of organic wastes commonly used by Thai farmers(Suzuki et al., 1980).
Materials Moisture pit Elemental composition (%)* Ash C/N% C N P K (%) ratio
Sawdust 7.9 4.7 34.1 0.11 0.02 0.03 1.8 310Rice mill dust-I 6.5 7.0 14.6 0.96 0.33 0.51 69.9 15.2Rice mill dust-2 73.8 5.2 31.7 2.71 3.24 0.82 46.6 11.7Sugarcane press cake 70.1 8.5 37.5 1.93 2.36 0.28 32.4 18.9Fermentation 8.0 4.0 41.1 2.10 0.11 2.12 12.0 19.6
residues from brewing industryActivated sludge 8.3 6.8 31.7 3.71 1.52 0.21 23.1 8.5
from soft drink industryRice straw compost 75.9 6.2 36.0 2.14 1.80 2.28 30.6 16.8
from mushroom cultivation*Oven-dry basis.
Leguminous crops tend to have more nutrients in residues as shown in Table13. Myers and Wood (1986) reported that under normal cropping procedureswith grain harvested, soybean may provide nearly 80 kg N/ha in residues. Theamount could be increased to nearly 300 kg N/ha if it was used as a greenmanure crop.
294
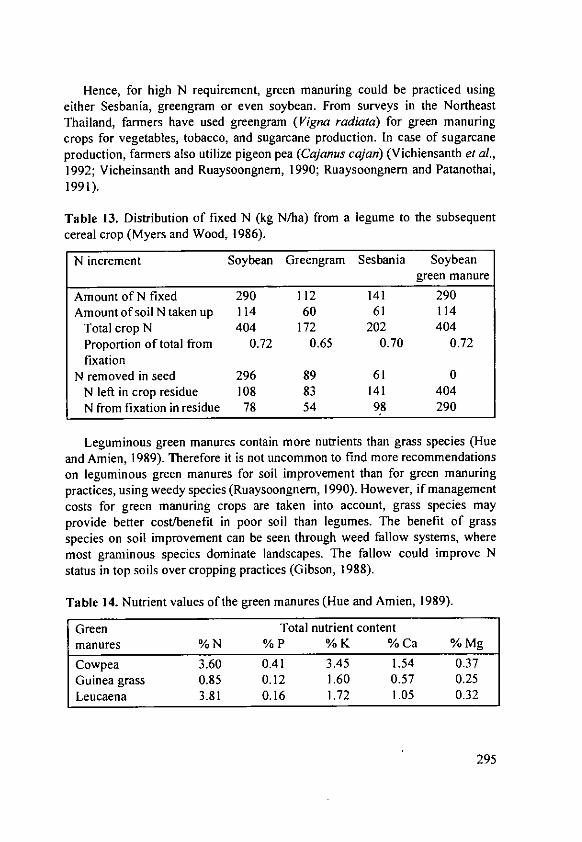
Hence, for high N requirement, green manuring could be practiced usingeither Sesbania, greengram or even soybean. From surveys in the NortheastThailand, farmers have used greengram (Vigna radiata) for green manuringcrops for vegetables, tobacco, and sugarcane production. In case of sugarcaneproduction, farmers also utilize pigeon pea (Cajanus cajan) (Vichiensanth et al.,1992; Vicheinsanth and Ruaysoongnem, 1990; Ruaysoongnern and Patanothai,1991).
Table 13. Distribution of fixed N (kg N/ha) from a legume to the subsequentcereal crop (Myers and Wood, 1986).
N increment Soybean Greengram Sesbania Soybeangreen manure
Amount of N fixed 290 112 141 290Amount ofsoilN taken up 114 60 61 114
Total crop N 404 172 202 404Proportion of total from 0.72 0.65 0.70 0.72fixation
N removed in seed 296 89 61 0N left in crop residue 108 83 141 404N from fixation in residue 78 54 98 290
Leguminous green manures contain more nutrients than grass species (Hueand Amien, 1989). Therefore it is not uncommon to find more recommendationson leguminous green manures for soil improvement than for green manuringpractices, using weedy species (Ruaysoongnern, 1990). However, if managementcosts for green manuring crops are taken into account, grass species mayprovide better cost/benefit in poor soil than legumes. The benefit of grassspecies on soil improvement can be seen through weed fallow systems, wheremost graminous species dominate landscapes. The fallow could improve Nstatus in top soils over cropping practices (Gibson, 1988).
Table 14. Nutrient values of the green manures (Hue and Amien, 1989).
Green Total nutrient contentmanures % N % P % K %Ca %Mg
Cowpea 3.60 0.41 3.45 1.54 0.37Guinea grass 0.85 0.12 1.60 0.57 0.25Leucaena 3.81 0.16 1.72 1.05 0.32
295

3. Discussion
Variation of input distribution in arable lands is a criterion in nutrientbalance considerations and are related to land use and resource availability ofeach farm, crop type, land type, soil types, purposes of the production andinfrastructure (Limpinuntana, 1985; Ruaysoongnern and Patanothai, 1991).Such variation has produced gradients of nutrient input-output and balance inindividual systems.
3.1. Systems with potential gains
Under normal circumstances, a positive nutrient balance in an agriculturalsystem is not very common in developing countries, due to less bargainingpower of farmers for expanding profit margin. As a result, most farmers aretrying to reduce every cost of production, especially fertilizer inputs byincreasing extraction efficiency of crops in less suitable soils (Vichiensanth etal., 1992). Therefore, it is quite common to find replacement of low profitablecrops with more aggressive crops, such as introduction of cassava andEucalyptus into extremely degraded soils in Thailand. These are examples ofcontinuous and excessive mining of nutrients from soils with normallynegligible inputs, which will be discussed later in the next section.
Agricultural systems where farmers have applied surplus fertilizer are usualonly where the farming system is profitable (Limpinuntana, 1985;Ruaysoongnem, 1990). Also, some effective natural replenishment systems maystill exist. Therefore, net gains could be divided into at least two maincategories: (I) when it is necessary to apply the fertilizers for cash crop, and thecost of fertilizer inputs will be paid off by value of the products, and (2) whereeffective indigenous replenishment systems still exist. Those areas includelowland rice, vegetables, seed crops, subsidized crops, and other high valuecrops. Inputs applied for soil and nutrient improvements included intentionaland unintentional organic amendments, soil replacement, and chemical fertilizerapplication (Ruaysoongnem and Patanothai, 1991). Hence under intensivemanagement, fertility and productivity status should be continually assessed.With such practices, any non-distinctive causes of poor growth and productionwould normally corrected by organic and inorganic fertilizer application.Hence, potential nutrient gains would exist in such limited circumstances. Otherlocalized net gains are possible in integrated farming systems, or intensiverecycling systems, where nutrient outputs are smaller than inputs (Hutanuwatr,1988). Such systems are practiced where an awareness of soil degradation hasbeen provoked.
296
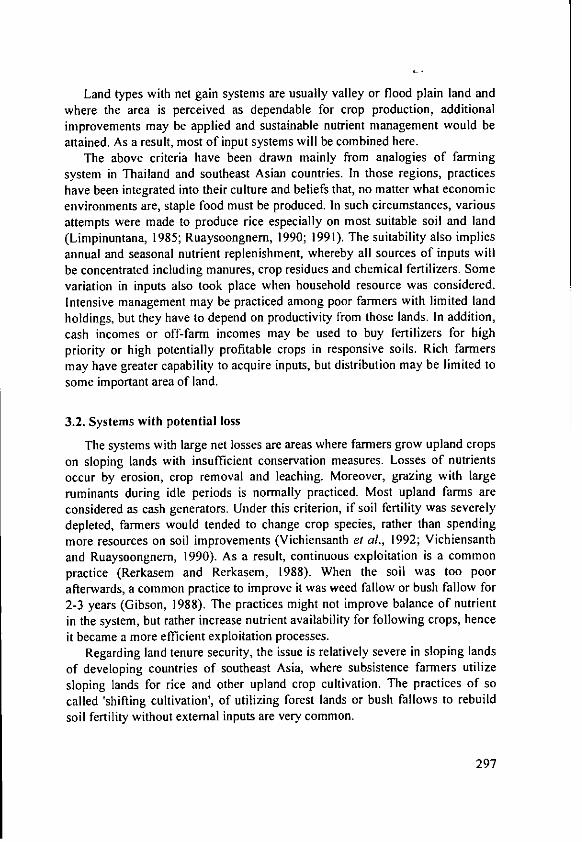
Land types with net gain systems are usually valley or flood plain land andwhere the area is perceived as dependable for crop production, additionalimprovements may be applied and sustainable nutrient management would beattained. As a result, most of input systems will be combined here.
The above criteria have been drawn mainly from analogies of farmingsystem in Thailand and southeast Asian countries. In those regions, practiceshave been integrated into their culture and beliefs that, no matter what economicenvironments are, staple food must be produced. In such circumstances, variousattempts were made to produce rice especially on most suitable soil and land(Limpinuntana, 1985; Ruaysoongnem, 1990; 1991). The suitability also impliesannual and seasonal nutrient replenishment, whereby all sources of inputs willbe concentrated including manures, crop residues and chemical fertilizers. Somevariation in inputs also took place when household resource was considered.Intensive management may be practiced among poor farmers with limited landholdings, but they have to depend on productivity from those lands. In addition,cash incomes or off-farm incomes may be used to buy fertilizers for highpriority or high potentially profitable crops in responsive soils. Rich farmersmay have greater capability to acquire inputs, but distribution may be limited tosome important area of land.
3.2. Systems with potential loss
The systems with large net losses are areas where farmers grow upland cropson sloping lands with insufficient conservation measures. Losses of nutrientsoccur by erosion, crop removal and leaching. Moreover, grazing with largeruminants during idle periods is normally practiced. Most upland farms areconsidered as cash generators. Under this criterion, if soil fertility was severelydepleted, farmers would tended to change crop species, rather than spendingmore resources on soil improvements (Vichiensanth et al., 1992; Vichiensanthand Ruaysoongnern, 1990). As a result, continuous exploitation is a commonpractice (Rerkasem and Rerkasem, 1988). When the soil was too poorafterwards, a common practice to improve it was weed fallow or bush fallow for2-3 years (Gibson, 1988). The practices might not improve balance of nutrientin the system, but rather increase nutrient availability for following crops, henceit became a more efficient exploitation processes.
Regarding land tenure security, the issue is relatively severe in sloping landsof developing countries of southeast Asia, where subsistence farmers utilizesloping lands for rice and other upland crop cultivation. The practices of socalled 'shifting cultivation', of utilizing forest lands or bush fallows to rebuildsoil fertility without external inputs are very common.
297
Other soil conservation measures are virtually absent. One of the mostcommon reasons was lack of appropriated conservation technologies.
On undulating lands where low price crops are grown, inputs for those cropsare also minimal, and those crops are stress tolerant or hardy crops which can beproduced profitably in nutrient-poor soils. Therefore, these areas are undercontinuous nutrient losses (Tre-loges et al., 1993). Recently, high populationpressure, requiring more land resource has become an important push-factor forthis type of practice. Furthermore, as the practice is now common on plateau orslope lands where, previously , it has been used as a resource base for lowlands,a practices attached to the attitudes and beliefs of farmers. The interaction ofphysical with social factors is a difficult process to modify, unless very clearbenefits have been demonstrated.
3.3. Systems probably in balance
Near balance systems are possible on land for continuous utilization, mainlyfor subsistence (Tre-loges et al., 1993). Under such management, yields wouldbe monitored continually with prompt response to any decline. In cases ofnutrient insufficiency, amendments might be done as soon as the problem wasobserved (Ragland and Boonpuckdee, 1987). Besides, under subsistence farming,excessive amendments were usually discouraged for 'healthy' food products.
Others similar systems, probably, include some pasture fallows, upper paddyareas, ley farming practices, green manuring, bush fallows, and agroforestry.Under these systems, flows of inputs and outputs are, sometimes, in balance dueto adoption of some natural processes for soil fertility replenishment with someexternal inputs. Pasture fallows and ley farming could improve nutrient availabi-lity through plant root activities and animal droppings. The actual amount ofnutrient losses from grazing would not be too excessive, in comparison to cutand carry systems. For example, by the end of a ley period on sandy soil of theNortheast of Thailand, N status in the soil has been clearly improved (Gibson,1988). The agroforestry and bush fallows, nutrient recycling would be from depthwith some potential contribution from N2 fixation and soil fertility could bereplenished in 5-10 years depending on native soil fertility. For upper paddyareas, flows of nutrients were normally both in and out due to their toposequenceon the landscape (Tre-loges et al., 1993). However, normal practice of infrequentcultivation, 3 out of 10 years, could be considered as a type of fallow, and leyfarming if ruminant grazing were also practiced (Ruaysoongnern, 1990).Therefore, balance might be maintained even for long-term use. Moreover,intention of farmers to keep trees in upper paddy fields in the Northeast couldbe considered as an agroforestry system. As such, nutrient recycling by treesmay be applied in these particular areas as well (Vityakon et al., 1988).
298

The practice of these systems is common in undulating areas aroundfloodplain terraces or midlanem. Incorporation of rice and maize straw could beof high value to reduce N losses at the same time. Hence management is animportant determining factor towards final results of gains or loss.
4. Recommendations
Potential solutions should seek the development of appropriate technologiesto reduce nutrient losses from the system and at the same time encouraged inputapplications and recycling through system analysis. Reducing losses couldinvolve contour farming adapted to local farming systems. Crop residueutilization, directly or indirectly should be promoted together with moreefficient recycling through agroforestry for resource-base improvement. Underagricultural systems, integrated farming could be developed for efficiencynutrient cycling and resource uses. Facilitation must be realistic for applicationin normal agroecosystem of each region. Recommendations, however, must besufficiently flexible for farmers to practice. Holistic planning for technologydevelopment and transfer should be applied throughout processes ofdevelopment. To develop long-term sustainability, serious attempts must beplaced on resource development, agricultural environment improvement, wasterecycling, and soil and water conservation. Finally, higher bargaining power offarmers must also be developed to allow autonomy adjustment for self-relianceand controllable development using system approaches.
5. Conclusions
Most of arable lands have negative nutrient balance. Only a few areas havepositive balance from intensive fertilizer inputs. Losses of N occur in both byerosion and crop removals, but returns were also practiced in most of soilamendment systems, from chemical fertilizers, crop residues, green manures andmanures. P losses seem to be smaller than N, but the losses are highly significantfor upland soils in long-term because soils contain little P. On the contrary, gainsof P in lowlands may be an important factor for sustainability of their producti-vity. Organic amendments could also contribute to P balance where intensiveorganic waste recycling is practiced. Losses of K, Ca, and Mg were high in erosionand crop removal. Losses could be returned for K, but less so for Ca and Mg.Losses of K could be even higher under root crop production. Generally, lossesof nutrient in a field could contribute to gains in other fields, with exception ofproducts exported to outside systems. Therefore, it is necessary to concentrate onimportant absolute losses rather than general losses. Hence, appropriatetechnologies to control nutrient flow for higher efficiency of recycling should bedeveloped.
299

In order to develop the system for long-term agricultural sustainability,indigenous technologies could be used as basic guidelines for furthermodification and development. In order to utilize the technologies effectively,strength and weakness should be primarily identify for appropriaterecommendations. The above criteria should also be considered for suitabilitythrough land types, toposequences, cropping systems, farmer type, subsistenceor cash economy. Moreover, emphasis should also be put towards economicbargaining power. On environmental issues, integrated farming system andagroforestry could be promoted for better input-output system in arable lands.
6. References
Balogan, P., Gurung, G. and Sthapit, B. (1988): An approach to sustainableagricultural research in the hills of Nepal: The experience of LumleAgricultural Center. "Sustainable rural development in Asia", edited by TerdCharoenwatana and A. Terry Rambo, the 4th SUAN Regional Symposiumon Agroecosystem Research held at Khon Kaen University, Khon Kaen,Thailand. July 4-7, 1988. p. 207-2 19.
Cock, H.J. (1985): Cassava; New potential for a neglected crop. InternationalAgricultural Development Service and CIAT. p. 64-92.
Craig, I.A. (1988): Current farmer strategies for soil-fertility management innortheast Thailand: Implications for research and development. NeradicsProblem Definition Series P6. 28p.
Gibson, T.A. (1988): The agronomic and soil fertility effects and leguminousley pastures in sandy, upland soils of Northeast Thailand. A thesis submittedfor the degree of Doctor of Philosophy in Department of Agriculture, theUniversity of Queensland. 266p.
Howeler, R.H. and Reinhardt, H. (1985): Mineral nutrition and fertilization ofcassava. Production and utilization, Cassava program. CIAT, Cali,Colombia: 249-319.
Hue, N.V. and Amien, 1. (1989): Aluminum detoxification with green manures.Commun. in Soil Sci. Plant Anal. 20: 15-16.
Hutanuwatr, N. (1988): Integrated farming. Farming Systems Research Project& Department of Animal Science, Faculty of Agriculture, Khon KaenUniversity, Thailand. June, 1988.
Khon Kaen University-Farming System Research Project (1990a): Largeruminant feed availability. Final research report. 61 p.
Khon Kaen University-Farming System Research Project (1990b): Sources ofPotassium in rice paddy agroecosystem of the Northeast. Final researchreport. 39 p.
300
Kyuma, K. (1983): Productivity of lowland soils chapter in Potentialproductivity of field crops under different environments. IRRI. p. 427.
Kyuma, K. and Pairintra C. (1983): "Shifting Cultivation". An experiment atNam Phrom, Northeast Thailand, and its implications for upland farming inthe monsoon tropics. JSPS-NRCT joint research. 219 p.
Lasmarias, N.C., Sajise, P.E., Alcantara, A.J., and Cruz, W.D. (1988): Analysisof the on-site cost of soil erosion. In: "Sustainable Rural Development inAsia". Edited by Terd Charoenwatana and A. Terry Rambo; the 4th SUANRegional Symposium on Agroecosystem Research held at Khon KaenUniversity, Khon Kaen, Thailand. July 4-7, 1988. p. 87-102.
Limpinuntana, V. (1985): Soil, water and crop management practices forrainfed agricultural systems in Northeast Thailand. In: "Soil, water and cropmanagement systems for rainfed agriculture in Northeast Thailand".Proceedings of the Workshop at Khon Kaen University, Khon Kaen,Thailand, February 25-March 1, 1985. p 85-100.
Myers, R.J.K. and Wood, I.M. (1986): Food legumes in the nitrogen cycle offarming systems. In: "Food Legume Improvement for Asian FarmingSystems". Proceeding of an international workshop held in Khon Kaen,Thailand, 1-5 September 1986. p. 46-52.
Ongprasert, S. (1988): Utilization of organic waste materials in Alfisols ofNorthern Thailand. "Sustained soil fertility in a tropical region as affected byorganic waste materials", Kasetsart University, February 1988. p. 173-180.
Pairintra, C. (1985): Soil and water management problems associated withdeforestation in Northeast Thailand. Proceedings of the workshop "Soil,Water and Crop Management System Rainfed Agriculture in NortheastThailand" at Khon Kaen University Khon Kaen, Thailand, February 25-March 1, 1985. p. 327, 329.
Ragland, J. and Boonpuckdee, L. (1987): Fertilizer responses in NortheastThailand: 1. Literature Review and Rationale. Thai J. Soils and Fert. 9: 63-79.
Rathakette, P. (1993): Small farmers and a agroforestry system model: Casestudies. Thai J. For. 12: p. 13 8 -14 3 .
Rerkasem, B. and Rerkasem, K. (1988): Soil fertility decline under intensivecropping in Northern Thailand. In: "Sustainable Rural Development inAsia", edited by Terd Charoenwatana and A. Terry Rambo. The 4th SUANRegional Symposium on Agroecosystem Research held at Khon KaenUniversity, Khon Kaen, Thailand. July 4-7, 1988. p. 144-152.
Ruaysoongnem, S. (1990): Indigenous soil management technologies of theNortheast rice farming system: A conceptual analysis. Proceedings ofinternational seminar on Agricultural change and development in SoutheastAsia (ISACDESA-II) Phuket, Thailand, 21-23 November, 1990. p. 171-200.
301

Ruaysoongnem, S. (1991): Sustainability of paddy soil fertility in the Northeastof Thailand. Proceedings of the 8th National Fanning Systems Seminar,"Towards Sustainable Agriculture", 20-22 March 1991, Chiang MaiUniversity. p. 90-111.
Ruaysoongnem, S. and Patanothai, A. (1991): Farmers' perceptions and theadoption of sustainable land management technologies-Thailand's experience.Proceedings of the international Workshop on Evaluation for SustainableLand Management in the Developing World, Chiang Rai, Thailand, 15-21September 1991. IBSRAM. p. 491-508.
Ruaysoongnem, S., Vichiensanth, P. and Chooprasert, T. (1993): Effects of treeleaf litters on soil solution phosphorus, nutrient uptake, and yield of rice onRoi-et soil. Thai J. For. 12:34-44.
Satrusajang, A., Snitwongse, P. and Bruesh, R.J. (1988): Loss of nitrogenfertilizer applied to lowland rice on an acid sulfate soil. Proceedings of FirstInternational Symposium on Paddy Soil Fertility. Chiangmai, Thailand, 6-13December 1988. p. 571-586.
Suzuki, M., Thepoolpon, M., Morakul, P., Phetchawee, S. and Cholitkul, W.(1980): Soil chemical studies on rotting process of plant remains in relationto fertility of upland soils in Thailand. Joint research project between Trop.Agric. Res. Center, Japan and Dept. of Agric., Thailand. p. 327-329.
Tongpan, S. (1988): Principle and practices of Thailand agricultural policies.Applied Economics Research Center, Kasetsart University, Bangkok. 25! p.
Takahashi, T., Nagahori, K., Mongkolsawat, C. and Losirikul, M. (1980): Run-off and soil loss. An experiment at Nam Phrom, Northeast Thailand, and itsimplications for upland farming in the monsoon tropics. JSPS-NRCT jointresearch project. p. 84-109.
Tanaka, A. (1988): Potential yield of upland cropping systems and approachesto its expression. Proceedings of the International Conference on themanagement and fertilization of upland soils in the Tropics and Subtropics.September 7-11, 1986. Nanjing, People's Republic of China. p. 11-21.
Tre-loges, V., Polthanee, A., Ruaysoongnern, S. and Patanothai, A. (1993):Nutrient budget in an agricultural area: Case study in two representativeagroecosystems of the Northeast. Paper presented at the 10th NationalFarming Systems Seminar. Kasetsart University, Kampaengsaen campus.22-25 March 1993. 13 p.
Vichiensanth, P. and Ruaysoongnern, S. (1990): Potential and limitations ofbiotechnology for improving soil productivity in the Northeast. Proceedingsof ADRC workshop on Soil improvement for agricultural development ofthe Northeast. 14-16 November 1990, Khon Kaen. pp. 240 - 256.
302
Vichiensanth, P., Polthanee, A. and Supanchaimart, N. (1992): Farmers'constraints in the application of modem technologies for improving soilfertility in the Northeast. KKU-RDI-CIDA research report. 157 p.
Vannaprasert, M. and Thongmee, U. (1993): Soil and water losses on plots withdifferent land use in Phu Wiang watershed. Thai J. For. 12: 107-117.
Vibulsuk, N., Morakul, P, Cholitkul, W. and Sommanus, P. (1987): Nutrientmovement in sandy soils. Research report of Agricultural Development andResearch Center for 1985-86. Ministry of Agriculture and Cooperative. p.328-335.
Vityakon, P., Smutkupt, S. and Prachaiyo, B. (1988): Trees in paddy fields:Their contributions to soil fertility, and sustainability of the paddy ricesystem. "Sustainable Rural development in Asia" edited by TerdCharoenwatana and A. Terry Rambo, the 4th SUAN Regional Symposiumon Agroecosystem Research held at Khon Kaen University, Khon Kaen,Thailand. July 4-7, 1988. p. 65-86 .
Vityakon, P. and Prachaiyo, B. (1988): Nutrient loss through runoff andsediments and the roles of trees and agroforestry in reducing the loss inupland agroecosystem of Phu Wiang watershed, Northeast Thailand. NamPong Watershed management Project report. Royal Department of Forestry.Ministry of Agriculture and Cooperatives. p. 15-19.
303

Problems in the K Fertilization of Saline and SodicSoils
M. SinghPotash Research Institute of India, Gurgaon 122001, Haryana, India
Summary
A review of past work outlines the properties of saline and sodic soils andtheir suitability for agriculture. Effects of salinity on plant growth and thephysiological processes concerned are described and the part which can beplayed by potassium in improving crop performance discussed. Results fromseries of experiments on salt-affected soils in India show that application of Kfertilizer greatly improves yield and enables satisfactory crops to be grown.
I. Suitability of saline/sodic soils for agriculture
The measurement of electrical conductivity (ECe) in the soil solution(saturation extract) can be used to give a rapid and simple assessment of saltcontent and of the suitability of soils for crop production. The osmotic potential
of the saturation extract can be calculated from ECe. The salt concentration inthe soil solution at field capacity will be about twice that indicated by measuringEC, in the saturation extract and higher still at lower soil moisture contents.
EC, alone does not fully indicate the suitability of a soil for plant growthsince:a) salt concentration at the root surface can be much higher than that in the
bulk soil;b) being only a measure of salt concentration, EC, gives no indication of its
composition.
NaCI is usually the dominant salt but others, depending on the origin of thesaline water and the solubilities of individual salts, may also be present. Inaddition, boron concentration in soil and irrigation water can well be morecritical for plant growth than salt concentration; more than 0.5 mg 1-1 in
irrigation water may injure sensitive species and a B content >2.0 mg 1-1 isharmful to most plants.
305

2. Effects of salinity/sodicity on plant physiology and growth
Nutrient and ion uptake
Excess of salts under saline and sodic conditions adversely affects growthand yield of crops. The predominant cation under both these conditions isinvariably sodium, either in soil solution (saline soil) or on the exchangecomplex (sodic soil). Various factors which adversely affect plant growth insaline/sodic soils have been identified:
1. water or osmotic stress,2. specific ion excess or toxicity,3. ionic imbalance stress or induced nutrient deficiency.
Plants subjected to salt stress seek osmotic adjustment to avoid loss ofcellular water and maintain favourable water balance. This chemi-osmoticbalance is achieved by accumulating osmotically active solutes like Na± and Cl-(most readily available under salt stress) and organic compounds. Plants whichthrive under these conditions must have fairly stable and well regulatedintracellular ionic environment. Among glycophytes, this capability iscommonly correlated with restricted uptake of those ions which are nor requiredin such high concentration.
Uptake of Na+ and Cl- not only creates danger of ion excess (toxicity) butalso interferes with uptake of other nutrients like K+. This interference causesmarket nutrient imbalance and shoot K content falls as Na content rises. This isclearly demonstrated by the K and Na concentrations measured in rice shoots at30 days after transplanting on soils with increasing salinity and sodicity (Table I).
Table 1. Effect of salinity and sodicity on Na and K contents and Na/K ratio inrice shoots at 30 days after transplanting (% dry wt.).
Variety EC, (dS/m) Exchangeable sodium (%)2.8 7.0 11.2 15.9 7 52 69 80
K 3.53 2.79 2.46 1.83 3.53 2.46 1.79 1.43CSRI Na 0.12 0.36 0.52 0.68 0.12 0.81 1.04 1.16
Na/K 0.03 0.13 0.21 0.37 0.03 0.33 0.59 0.80K 2.97 2,42 2.02 1.45 2.97 1.78 1.41 1.11
Jaya Na 0.23 0.46 0.85 1.06 0.23 1.21 1.40 1.54Na/K 0.08 0.19 0.42 0.73 0.08 0.68 0.99 1.40
Symptoms of K deficiency may be evident even though soil availablecontent is high by normal standards.
306
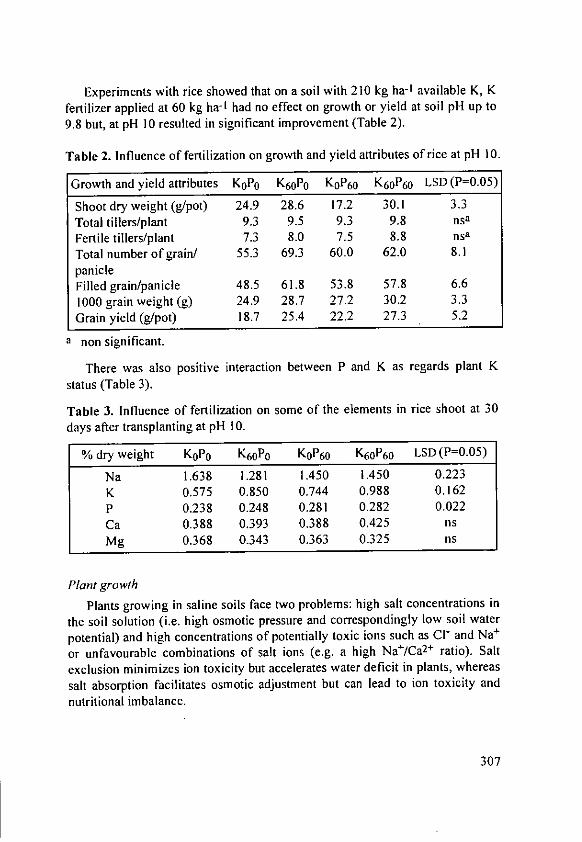
Experiments with rice showed that on a soil with 210 kg ha- I available K, Kfertilizer applied at 60 kg ha-4 had no effect on growth or yield at soil pH up to9.8 but, at pH 10 resulted in significant improvement (Table 2).
Table 2. Influence of fertilization on growth and yield attributes of rice at pH 10.
Growth and yield attributes K0P0 K60P0 KoP 60 K60P60 LSD (P=0.05)
Shoot dry weight (g/pot) 24.9 28.6 17.2 30.1 3.3Total tillers/plant 9.3 9.5 9.3 9.8 nsaFertile tillers/plant 7.3 8.0 7.5 8.8 nsaTotal number of grain/ 55.3 69.3 60.0 62.0 8.1panicleFilled grain/panicle 48.5 61.8 53.8 57.8 6.61000 grain weight (g) 24.9 28.7 27.2 30.2 3.3Grain yield (g/pot) 18.7 25.4 22.2 27.3 5.2
a non significant.
There was also positive interaction between P and K as regards plant Kstatus (Table 3).
Table 3. Influence of fertilization on some of the elements in rice shoot at 30days after transplanting at pH 10.
% dry weight K0P0 K60P0 KoP 60 K60P60 LSD (P=0.05)
Na 1.638 1.281 1.450 1.450 0.223K 0.575 0.850 0.744 0.988 0.162P 0.238 0.248 0.281 0.282 0.022Ca 0.388 0.393 0.388 0.425 nsMg 0.368 0.343 0.363 0.325 ns
Plant growth
Plants growing in saline soils face two problems: high salt concentrations inthe soil solution (i.e. high osmotic pressure and correspondingly low soil waterpotential) and high concentrations of potentially toxic ions such as C- and Na+
or unfavourable combinations of salt ions (e.g. a high Na+/Ca 2+ ratio). Saltexclusion minimizes ion toxicity but accelerates water deficit in plants, whereassalt absorption facilitates osmotic adjustment but can lead to ion toxicity andnutritional imbalance.
307
It is often impossible to assess the relative contribution of ion excess andwater deficit to growth inhibition at high soil salinity levels. In most instances,however, growth inhibition in salt-sensitive species even at low salinity levels iscaused primarily by ion toxicity.
Frequently, at low or moderate salinity levels, growth reduction ofglycophytes is not correlated with specific symptoms such as leaf scorch orchlorosis. Plants are stunted and may have darker green leaves than normalcontrol plants. Very often, dicotyledons leaves become succulent, that is, thewater content per unit leaf area increases. Generally, there is a greater reductionin shoot growth than in root growth. Without chemical analysis, no conclusioncan be drawn as to whether water deficit or ion toxicity/imbalance, or both, isthe predominant constraint on shoot growth. The effects of salinity on thegrowth of plant species restricts salt uptake, growth with relatively high rates ofuptake and translocation of salt ions (mainly C[" and/or Na±) to the shoots(includers). Classifying species as excluders or includers is helpful indemonstrating the principles of adverse effects of (or adaption to) salinity but,in reality, very few glycophytes can be either strict excluders or includers; mostare intermediate types. In various herbaceous and most woody species, marginalchlorosis and necrosis of leaves are widespread under conditions of NaCIsalinity; the leaf contents indicate that Cl- toxicity is the major constraint.Whether water deficit or ion toxicity is the main constraint on plant growth alsodepends on the type of salinity (e.g. whether the predominant anion is C[" orS042-, and the ratio Ca2+/Na+), the duration of exposure, and the salinity level.In plants exposed to high salinity levels for short periods, water deficit is theprincipal constraint. In plants exposed for long periods, which is more typical offield-grown plants, in addition to water deficit, especially in expanding leaves,ion toxicity and imbalance are increasingly important.
Photosynthesis and respiration
Salinity level and leaf area are usually inversely related. This could beexplained by a water deficit in expanding tissues. However, not only total leafarea but also net CO 2 fixation per unit leaf may decline, whereas respirationincreases, leading to a drastic reduction in net CO2 assimilation per unit leafarea per day. Lower rates of net CO2 fixation during the light period are notnecessarily caused by water deficit and partial stomatal closure, but can also bethe result of direct adverse effects of C-. Rates of CO 2 fixation are inverselyrelated to the Cl- levels in the leaves and to an increase in mesophyll resistanceand not to stomatal resistance, as would be expected from water deficit.
308

After long-term exposure to high salinity levels, lower rates of netphotosynthesis may also be caused by a drop in chlorophyll content per unit leafarea, but not per unit weight of chlorophyll, indicating that the remainingchlorophyll is fully active. Salinity may also increase the respiration rate of theroots, which have a higher carbohydrate requirement for maintenancerespiration in saline substrates. This higher requirement presumably results from
the compartmentation of ions, ion secretion (e.g. Na -efflux pump), or therepair of cellular damage. In certain salt-tolerant species of the naturalvegetation, root respiration even declines in saline substrates, and carbohydratesformerly used for "alternative respiration" are then preferentially utilized for thesynthesis of sorbitol, a compatible organic solute for osmotic adaptation in thecytoplasm.
Protein synthesis
Protein synthesis in the leaves of plants growing in saline substrates may
decline in response either to a water deficit or to a specific ion excess. Where
there is a low substrate water potential imposed by'Carbowax or NaC1, protein
synthesis in the leaves is inhibited by both substrates, but inhibition is more
severe with salt stress than with water stress only. The effects of NaCI salinity
on protein synthesis might be due to Cl- toxicity in sensitive species, whereas in
the more salt tolerant species, Na+/K+ imbalance in the leaves is probably the
responsible factor. The adverse effect of high NaCI concentrations on bothpotassium content and protein synthesis can be counterbalanced by KCI, despitethe further decrease in the osmotic potential and increase in the CI"
concentration of the substrate. In barley, replacement of K' by Na + may bring
about some osmotic adjustment in expanded leaves but does not permit the
maintenance of protein synthesis. Except in a few halophytes, K' concentrationin the cytoplasm of between 100 and 150 mM is required for protein synthesis.
As has been shown in wheat, sodium cannot replace K+ in this function,irrespective of the salt tolerance of cultivars within a given species.
Ion toxicity and ion imbalance
In many herbaceous crop species, growth inhibition occurs even at very low
levels of CI- salinization, where water deficit is not a constraint. In these
species, CI" toxicity is responsible for growth inhibition. Many leguminousspecies belong to this group. Isoosmotic concentrations of NaCI are therefore
much more inhibitory than Na2SO4 on the growth of peanut and bean.
309

Outstanding examples in this respect are certain soybean cultivars; in poorlydrained coastal soils, the application of potash fertilizer as KCI can raise theCl-I levels of some cultivars to 1% of the leaf dry weight, causing leaf scorchand a severe reduction in grain yield. Sodium toxicity seems not to be aswidespread as Cl[ toxicity and is mainly related to low absolute Ca 2+ levels insaline substrates or high Ca2+/Na+ ratios in combination with poor soil aeration.
Many crop species with relatively low salt tolerance are typical Na+
excluders. They are capable at low and moderate salinity levels of restricting thetransport of Na + to the leaves, where it is highly toxic. This exclusionmechanism relies on relatively high external Ca2+ concentrations and Ca 2+/Na+ratios, respectively. Soil salinity increases the incidence of calcium-relatedphysiological disorders such as tipburn in lettuce and blossom end rot in tomatoeither by competition between Na+ and Ca 2+ during uptake, or by decreasingthe soil water potential and thus, root pressure. Although high levels of Cl" mayinhibit NO3 uptake induced nitrogen deficiency is not likely to be an importantfactor in the growth depression caused by soil salinity. In contrast, under fieldconditions, salt tolerance is apparently reduced in various crop species when alarge amount of nitrogen fertilizer is applied. This decrease is probably relatedmainly to a change in water balance imposed by nitrogen, namely, a change inrooting pattern and in phytohormone level. In legumes relying on N2 fixation,the situation might be different because salinity impairs nodulation eitherdirectly by interfering with Rhizobium colonization or indirectly by inhibitingroot hair development. In substrates with high phosphorus availability, salinityimposed by C1- salts stimulates phosphorus uptake. The excess P level in theleaves is not a result of a concentration effect due to growth depression, but ofenhanced rates of phosphorus uptake by the roots and of translocation to theshoots. Thus, salt-stimulated phosphorus uptake may improve phosphorusnutrition of plants growing in saline soils.
3. Problem of K nutrition in salt affected soils
Excess salinity affects crop growth in two ways. Firstly, as the amount ofsalt increases, the water in the soil becomes less available to the plants eventhough the soil may appear quite moist. The osmotic pressure of the soilsolution increases and plants are unable to extract water as readily as they canfrom relatively non-saline soils. Apart from the osmotic effect of salts in the soilsolution, high concentration and absorption of individual ions may prove toxicto the plants or may retard the absorption of plant nutrients essential for thenormal growth of plants.
310

Soils of Punjab, Haryana, Rajasthan and Uttar Pradesh, where illite is the
dominant clay mineral, release substantial amounts of non-exchangeable K to
become available to crops. Continuous use of nitrogen and phosphate fertilizersonly without potassium leads to depletion of non-exchangeable K reserves in
such soils. The assessment of the available potassium status of soils of Uttar
Pradesh has revealed widespread deficiencies of potassium (Ghosh and Hasan,1976). According to Bhangu and Sidhu (1990), about 26, 24 and 16% soil
samples of Samana, Fatehpur and Tulewal series of Central Punjab respectivelywere low in available potassium.
In addition to reducing water availability to plants and the possible toxic
effect of some constituents, excess neutral soluble salts in soils may also interfere
with the normal nutrition of crops. Thus, although the available nutrient status
of a soil might not be deficient, inter-ion competition can decrease plant uptake
of certain ions. Several studies have shown that deficiencies of K and Ca may
be responsible for depressed growth and yield on saline soils (Finck et al.,
1976). Proper fertilization of low to medium salinity soils should serve to:
(i) maintain the levels of nutrients that are present in sufficient amounts, and,
(iii) supplement nutrients that, although present at adequate levels, are not taken
up in amounts sufficient to counteract in antagonisms and so decrease the
uptake of harmful ions, e.g. K vs. Na or phosphate vs. chloride (Chabbra et
al., 1976).
Marked increase in the yield of various crops due to potassium application
has been recorded in field experiments (Tiwari et al., 1973; Tiwari and Nigam,
1985). On moderately saline soils, the application of potassic fertilizers may
increase crop yields (Oregne and Mojallali, 1969) either by directly supplying K
or by improving the K-Na-Ca-Mg balance. However, when salinity is high, it is
difficult to overcome the effect of high sodium concentration by use of K
fertilizers. Swamp (1993) reported that the application of K enhanced
significantly the yield, N and K concentration and uptake of N use efficiency by
wheat on saline soils.Plant growth is adversely affected in sodic soils due to one or more of the
following factors:I. Accumulation of certain elements in plant parts at toxic levels may result in
plant injury and even death in the extreme cases.2. Effect of excess exchangeable Na on plant growth through its effect on soil
pH.
Elements commonly toxic in sodic soils include sodium, molybdenum, boron,etc. In some cases, selenium has also been reported to occur in toxic concentra-
tions. Similarly, toxicity of bicarbonate ions has been reported for some crops.
311
The second effect of excess exchangeable sodium on plant growth is throughits effect of soil pH. High pH results in reduced availability of some essentialplant nutrients. At ESp over 12-15%, soil physical conditions deteriorate; soilaggregates disperse and the soil pores through which water and air must movebecome clogged. Cultivation of sodic soil leaves the surface cloddy whichresults in poor germination and spotty crop stands ultimately resulting inreduced yield.
High levels of exchangeable sodium and the accompanying high pH of sodicsoils affect the transformation and availability of several essential plantnutrients. For this reason, optimum crop production in sodic soils calls forspecial fertilization management practices. Several studies have shown thatincreasing soil sodicity results in reduced uptake of potassium by most crops(Singh et al., 1979, 1980, 1981), although the opposite was true for some othercrops (Chabbra et al., 1979; Martin and Bingham, 1954).
Illite, the dominant clay mineral of sodic soils, provides a good K reserve. Ina laboratory study, Pal and Mandal (1980) observed large scale release of Kfrom the sodic soils, both by water and ammonium acetate. Because more Kwas released to water than to NH 4 acetate, they concluded the greater part of theK released originated from the dissolution of K bearing minerals (feldspars andbiotite) and from illite in the clay fraction. More K was released in the presenceof NaCI than CaCI 2 or NH 4Ac and that it increased with increase intemperature. Because so much K was released, there was no response to Kfertilizer applied to wheat, rice or berseem either in field or pot experiments.There was a similar lack of response in field experiments over 4 years reportedby Dargan and Chillar (1978) and Srivastava and Srivastava (1973).
There is experimental evidence to show that crop varieties which can absorbpotassium in preference over sodium are relatively more tolerant to salinity andalkalinity (Singh and Rana, 1985). Groundnut plants exposed to increasinglevels of salinity recovered better from salt stress if they received foliarapplication of potassium after the onset of the salt stress (Rama Rao andRajeshwar Rao, 1984). Singh et al. (1987) reported that the application ofpotassium increased the yield of wheat grain and straw. Tiwari el al. (1993)reported that the application of potassium to partially reclaimed sodic soil ishighly economical for both rice and wheat crops. The residual effect of added Kwas not very pronounced. Added potassium significantly increased K content ofleaves at heading and of grain and straw at maturity.
Saline-sodic soils have generally been neglected and are usually poor innutrients. In any attempt to utilize these soils, therefore, care must be taken toprovide adequate nutrients to crops. In a laboratory experiment (Abrol, 1968), itwas found that exchangeable sodium percentage (ESP), apart from its influence
312
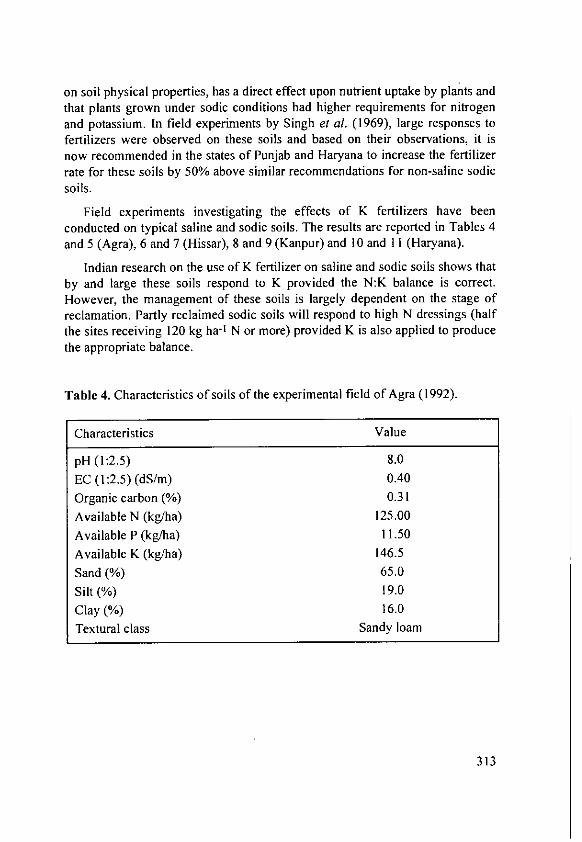
on soil physical properties, has a direct effect upon nutrient uptake by plants andthat plants grown under sodic conditions had higher requirements for nitrogenand potassium. In field experiments by Singh el al. (1969), large responses tofertilizers were observed on these soils and based on their observations, it isnow recommended in the states of Punjab and Haryana to increase the fertilizerrate for these soils by 50% above similar recommendations for non-saline sodicsoils.
Field experiments investigating the effects of K fertilizers have beenconducted on typical saline and sodic soils. The results are reported in Tables 4and 5 (Agra), 6 and 7 (Hissar), 8 and 9 (Kanpur) and 10 and II (Haryana).
Indian research on the use of K fertilizer on saline and sodic soils shows thatby and large these soils respond to K provided the N:K balance is correct.However, the management of these soils is largely dependent on the stage ofreclamation. Partly reclaimed sodic soils will respond to high N dressings (halfthe sites receiving 120 kg ha-1 N or more) provided K is also applied to producethe appropriate balance.
Table 4. Characteristics of soils of the experimental field of Agra (1992).
Characteristics Value
pH (1:2.5) 8.0
EC (1:2.5) (dS/m) 0.40
Organic carbon (%) 0.31
Available N (kg/ha) 125.00
Available P (kg/ha) 11.50
Available K (kg/ha) 146.5
Sand (%) 65.0
Silt (%) 19.0
Clay (%) 16.0
Textural class Sandy loam
313

Table 5. Effective use of nitrogen fertilizer with potassium in Bajra-wheatsequence under Agra conditions (1992-94).
Treatment Bajra WheatGrain yield Stover yield Grain yield Stover yield
(t ha- 1) (t ha- 1) (t ha- 1) (t ha-1)
NoPoK0 1.18 2.92 1.18 1.54N80 P60 Ko 1.41 3.91 3.56 4.07N8oP6oK60* 1.84 4.21 3.81 4.65NsoP 6oK3o+3o** 2.02 4.75 3.99 4.76N8oP6oK2o+2o+2o** 1.92 4.65 4.06 5.02N120 P60Ko 1.58 4.24 4.38 5.37NI 2oP6oK6o* 2.22 5.34 4.59 5.66N12oP6oK3o+30 ** 2.42 5.38 4.72 5.78N120P6oK2o+2o+20 ** 2.25 5.39 4.76 5.79N120P60K120 * 2.31 5.43 4.69 5.67N 120P60K6 0+FYM 2.62 5.78 4.83 6.52@10 t ha- I
* K as basal** 'A K as basal + / K at maximum tillering
• 1/3 K as basal + 1/3 K at maximum tillering+ 1/3 K at panicle initiation.
Table 6. Physical and chemical characteristics of a typical sodic (Zarifa Viran)soil series (Typic Natrustalfs) from Hisar District.
Horizon Depth pH EC CaCO 3 Organic Avail, Silt Clay Exch.(cm) (1:2) (dSm-1) (%) carbon K20 (%) (%) sodium
(%) (kg/ha) (%)
AP 0- 19 9.3 0.31 0.26 416 25.6 14.4 28.0A2131 19- 35 9.4 0.39 0.5 0.14 285 24.2 17.2 46.0B21t 35- 57 9.2 0.47 1.0 0.11 202 19.4 27.2 52.0B22t 57- 88 9.1 0.63 1.5 0.11 236 39.8 32.6 62.9B23t 88-117 9.1 0.57 3.0 0.10 282 38.6 31.6 51.2
B3C1 117-160 8.4 0.86 5.5 0.08 449 36.8 33.8 54.3
314

Table 7. Effect of potassium application of nitrogen use efficiency on Pearlmillet at Hissar (1992 and 1994).
Treatments Grain yield (t/ha)
N120 PoKo (N) 0.81
N120P60Ko (NP) 1.34
Nl 20 P60K6 0 (NPK) 1.80
N1 20 PoK 60 (NK) 1.23
N1 20P 60 K30+3 0 (basal + top) 1.70
N1 20P60 -K 30 +15+15 (basal + top + foliar) 1.39
CD at 5% level 0.26
Table 8. Physical and chemical characteristics of a sodic soil from Pura farm
(Kanpur) - a Typic Natrustalfs soil. '
Horizon Depth pH EC Free Organic Silt Clay Exch.(cm) (1:2.5) (dSm- 1) CaCO 3 carbon (%) (%) sodium
(O/o) (%) (%)
A21 0- 14 10.1 12.4 6.72 0.26 45.6 9.6 81.6
A22 14- 37 10.3 9.5 4.28 0.09 37.2 21.4 78.3
B2t 37- 78 10.2 6.2 6.21 0.07 46.4 30.8 52.8
B3 78-121 10.0 6.2 6.84 0.07 31.9 24.3 34.9
CICa 121-150 9.6 2.2 20.73 0.04 26.8 11.2 19.8
CICa 150-180 9.6 2.0 19.87 0.08 48.0 11.2 15.5
Table 9. Effect of potassium on grain yield of three oilseed crops at Kanpur
(1989-90).
Treatment Mustard Linseed Safflower
(kg K20/ha) Grain yield Response Grain yield Response Grain yield Response(kg/ha) (kg grain/ (kg/ha) (kg grain/ (kg/ha) (kg grain/
kg K20) kg K20) kg K20)
0 1332 - 1280 - 1047 -
15 1417 5.7 1408 8.5 1220 10.9
30 1533 6.7 1496 7.2 1492 14.8
45 1496 3.6 1432 3.4 1378 7.3
60 1445 1.9 1413 2.2 1377 5.5
315
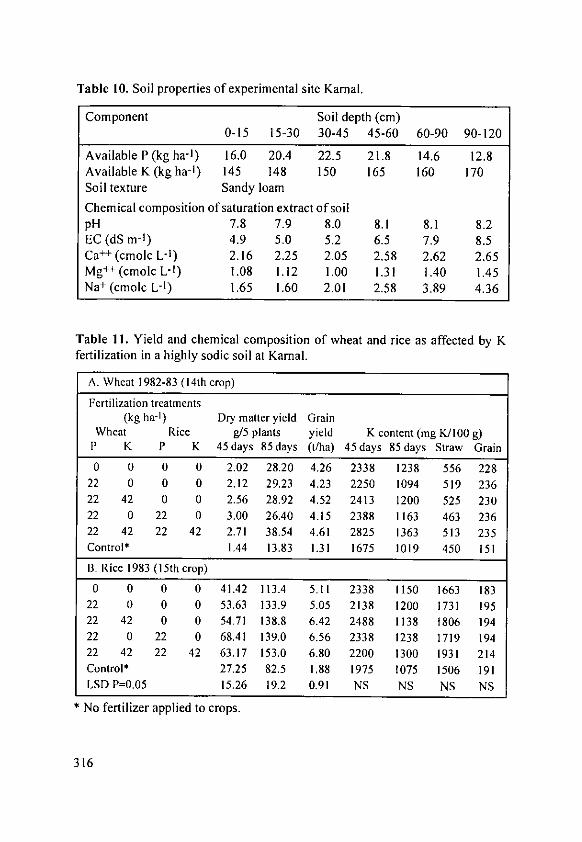
Table 10. Soil properties of experimental site Karnal.
Component Soil depth (cm)0-15 15-30 30-45 45-60 60-90 90-120
Available P (kg ha-') 16.0 20.4 22.5 21.8 14.6 12.8Available K (kg ha-I) 145 148 150 165 160 170Soil texture Sandy loam
Chemical composition of saturation extract of soilpH 7.8 7.9 8.0 8.1 8.1 8.2EC (dS m-I) 4.9 5.0 5.2 6.5 7.9 8.5Ca+ (cmolc L-') 2.16 2.25 2.05 2.58 2.62 2.65Mg++ (cmolc L- 1) 1.08 1.12 1.00 1.31 1.40 1.45Na+ (cmolc L-1) 1.65 1.60 2.01 2.58 3.89 4.36
Table 11. Yield and chemical composition of wheat and rice as affected by Kfertilization in a highly sodic soil at Kamal.
A. Wheat 1982-83 (14th crop)
Fertilization treatments(kg ha-I) Dry matter yield Grain
Wheat Rice g/5 plants yield K content (mg K/100 g)P K P K 45 days 85 days (t/ha) 45 days 85 days Straw Grain
0 0 0 0 2.02 28.20 4.26 2338 1238 556 22822 0 0 0 2.12 29.23 4.23 2250 1094 519 23622 42 0 0 2.56 28.92 4.52 2413 1200 525 23022 0 22 0 3.00 26.40 4.15 2388 1163 463 23622 42 22 42 2.71 38.54 4.61 2825 1363 513 235Control* 1.44 13.83 1.31 1675 1019 450 151
13. Rice 1983 (15th crop)0 0 0 0 41.42 113.4 5.11 2338 1150 1663 183
22 0 0 0 53.63 133.9 5.05 2138 1200 1731 19522 42 0 0 54.71 138.8 6.42 2488 1138 1806 19422 0 22 0 68.41 139.0 6.56 2338 1238 1719 19422 42 22 42 63.17 153.0 6.80 2200 1300 1931 214Control* 27.25 82.5 1.88 1975 1075 1506 191LSD P=0.05 15.26 19.2 0.91 NS NS NS NS
* No fertilizer applied to crops.
316
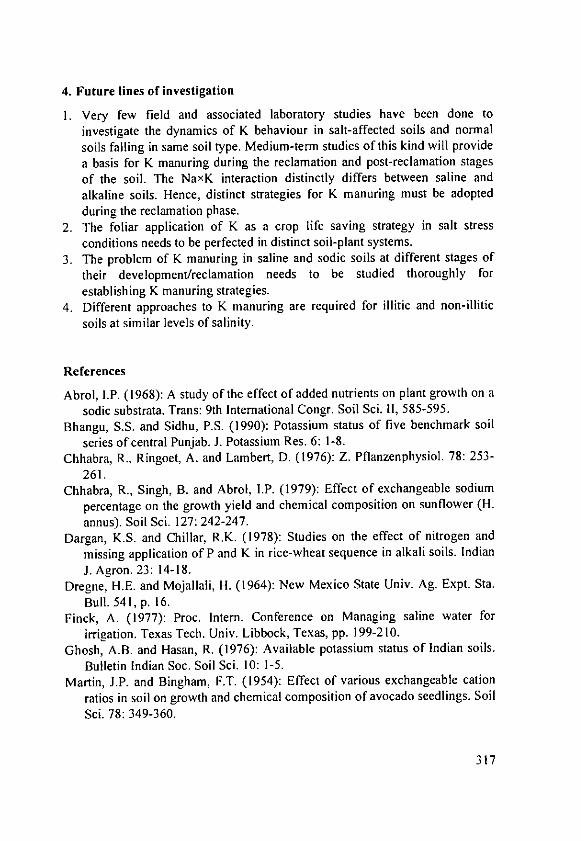
4. Future lines of investigation
I. Very few field and associated laboratory studies have been done toinvestigate the dynamics of K behaviour in salt-affected soils and normalsoils falling in same soil type. Medium-term studies of this kind will providea basis for K manuring during the reclamation and post-reclamation stagesof the soil. The NaxK interaction distinctly differs between saline andalkaline soils. Hence, distinct strategies for K manuring must be adoptedduring the reclamation phase.
2. The foliar application of K as a crop life saving strategy in salt stressconditions needs to be perfected in distinct soil-plant systems.
3. The problem of K manuring in saline and sodic soils at different stages of
their development/reclamation needs to be studied thoroughly forestablishing K manuring strategies.
4. Different approaches to K manuring are required for illitic and non-illiticsoils at similar levels of salinity.
References
Abrol, I.P. (1968): A study of the effect of added nutrients on plant growth on asodic substrata. Trans: 9th International Congr. Soil Sci. I1, 585-595.
Bhangu, S.S. and Sidhu, P.S. (1990): Potassium status of five benchmark soilseries of central Punjab. J. Potassium Res. 6: 1-8.
Chhabra, R., Ringoet, A. and Lambert, D. (1976): Z. Pflanzenphysiol. 78: 253-261.
Chhabra, R., Singh, B. and Abrol, I.P. (1979): Effect of exchangeable sodiumpercentage on the growth yield and chemical composition on sunflower (H.
annus). Soil Sci. 127: 242-247.Dargan, K.S. and Chillar, R.K. (1978): Studies on the effect of nitrogen and
missing application of P and K in rice-wheat sequence in alkali soils. IndianJ. Agron. 23: 14-18.
Dregne, H.E. and Mojallali, H. (1964): New Mexico State Univ. Ag. Expt. Sta.Bull. 541, p. 16.
Finck, A. (1977): Proc. Intern. Conference on Managing saline water forirrigation. Texas Tech. Univ. Libbock, Texas, pp. 199-210.
Ghosh, A.B. and Hasan, R. (1976): Available potassium status of Indian soils.Bulletin Indian Soc. Soil Sci. 10: 1-5.
Martin, J.P. and Bingham, F.T. (1954): Effect of various exchangeable cationratios in soil on growth and chemical composition of avocado seedlings. SoilSci. 78: 349-360.
317

Pal, D.K. and Mondal, R.C. (1980): Crop response to potassium in sodic soils inrelation to potassium release behaviour in salt solutions. J. Indian Soc. SoilSci. 28: 347-354.
Rama Rao, K.V. and Rajeshwar Rao, G. (1984): Effect of foliar application ofK on uptake and distribution of some essential elements in groundnut undersalt stress. Indian J. Plant Nutrition 3:173-182.
Singh, K.N. and Rana, R.S. (1985): Genetic variability and character associationin wheat varieties grown on sodic soil. Indian J. Agric. Sci. 55(12): 723-726.
Singh, N.T., Bhumbla, DR. and Kanwar, J.S. (1969): Effect of gypsum aloneand in combination with plant nutrients on crop yields and amelioration of asaline sodic soil. Indian J. Agric. Sci. 39: 1-9.
Singh, S.B., Chhabra, R. and Abrol, I.P. (1979): Effect of exchangeable sodiumon the yield and chemical composition of Royal Brassicajuncea L. Agron. J.71: 767-770.
Singh, S.B., Chhabra, R. and Abrol, I.P. (1980): Effect of soil sodicity on theyield and chemical composition of cowpea for fodder. Indian J. Agric. Sci.50: 852-856.
Singh, S.B., Chhabra, R. and Abrol, I.P. (1981): Effect of exchangeable sodiumon the yield, chemical composition and oil content of safflower and linseed.Indian J. Agric. Sci. 51: 885-891.
Singh, Vinay, Bhardwaj, P.K. and Mehta, V.S. (1987): Effect of Na, K and Znon the yield and uptake by wheat. J. Indian Soc. Soil Sci. 35: 537-538.
Srivastava, A.K. and Srivastava, O.P. (1993): Potassium availability andresponse of its application in Typic Natraqualf. B.H.U., Varanasi, U.P. Int.Symp. on a decade of potassium research, held at New Delhi, Nov. 18-20.
Swarup, A. (1993): Interaction of K with N on wheat crop in a saline soil. Int.Symp. on a decade of potassium research, held at New Delhi, Nov. 18-20.
Tiwari, K.N., Nigam, V. (1985): Crop responses to potassium fertilization ofUttar Pradesh. J. Potassium Research I: 62-71.
Tiwari, K.N., Pathak, A.N. and Singh, M.P. (1973): Fertilizer requirements formaize and wheat in farmers' fields. Fertil. News 18(4): 37-40.
Tiwari, V.S., Singh, R., Singh, N.R., Sharma, D.N. and Tiwari, K.N. (1993):Potassium requirement of wheat and rice in sodic soil at different stages ofreclamation. Int. Symp. on a decade of potassium research, held at NewDelhi, Nov. 18-20.
318

Chairman of the Session 3
Prof. Dr. P. Sequi, Istituto Sperimentale per [aNutrizione delle Piante, Roma, Italy
Session 3
Management Practices and Impacton Nutrient Requirements of Crops
319

Interrelations between Management Practices andNutrient Requirements of Upland Crops in theHumid and Subhumid Tropics
R. HilrdterCoordinator Asia, International Potash Institute, c/o Kali & Salz GmbH,
P.O. Box 10 20 29, D-34111 Kassel, Germany
Abstract
Upland cropping is increasingly important in tropical Asia. The replacementof shifting cultivation with semi-permanent or permanent cropping demands theintroduction of integrated management practices including crop sequence,choice of crop variety, tillage and soil conservation, and irrigation.
The selection of appropriate cropping systems has the most pronouncedimpact on utilization and requirement of plant nutrients. Improved techniqueslike alley cropping and mixed cropping (so-called low external input systems)do not outyield traditional systems unless fertilizers are used. Concerningnutrient use efficiency, rotation of cereals with legumes has given promisingresults. Preliminary long-term studies indicate that sustained production onupland soils is possible provided soils are stabilized by applying organicmanures and residues and adequate levels of fertilizer.
Nutrient use efficiency in plantation crops is improved when high yieldingclonal planting material is used.
1. Introduction
For economic and ecological reasons, the assessment of the nutrient needs ofcrops and cropping systems must be site-specific. Attention must be paid tofactors which modify nutrient requirements, especially those within the controlof the farmer. Important among these are:
- Selection of cropping system and variety,- Soil tillage and conservation,- Crop residue management,- Water management (irrigation).
321

The influence of single management factors has been much studied,especially the effect of nutrient supply in relation to crop variety (e.g. Asher andOzanne, 1967, 1977) or the effect of residue management on crop nutrient requi-rement (e.g. Bachthaler and Wagner, 1973; Graff and Kthn, 1977) but little hasbeen done on the relation between cropping system and nutrient efficiency.
Only four of the seven tropical cropping systems as defined by Ruthenberg(1980) occur to a significant extent in the humid and subhumid tropics of S.E.Asia. The most important of these in relation to food production is irrigatedarable with rice as the principal crop and this has been well covered in thisColloquium. We concentrate here on upland, principally rainfed, croppingsystems which, with increasing population pressure are increasingly importantin Asia. Management of upland rainfed systems to achieve sustainable yieldspresents certain difficulties. The systems with which we are concerned fall intothree main categories:
1. Annual cropping: • mono cropping• multiple cropping: - intercropping
- crop rotation
2. Annual/perennial mixtures:Agroforestry (alley cropping)
3. Perennial crops: Oilpalm, rubber, tea, etc.
2. Influence of cropping system on nutrient requirements
2.1. Intercropping
lntercropping of cereals with other crop species, especially legumes, iswidely practised in the subsistence agriculture of the tropics (Steiner, 1982).The principle of these systems is the simultaneous growing of various cropspecies on the same field. This has certain advantages regarding food diversityand risk avoidance for the farmers.
The productivity of traditional intercropping systems in the tropics isgenerally low because inputs are minimal (Steiner, 1982); means must be foundto increase their output. The intensification of intercropping systems calls for abetter understanding of the basic interaction between component crops in theutilization of growth factors, especially nutrient supply.
In comparison with sole cropping, intercropping may result in improvednutrient utilization (Elmore and Jackobs, 1986, Horst and Waschkies, 1987),especially where the component crops differ in their temporal and spatialnutrient requirements. Thus, cereals grown in rotation with legumes profit fromN2 fixation by the latter.
322
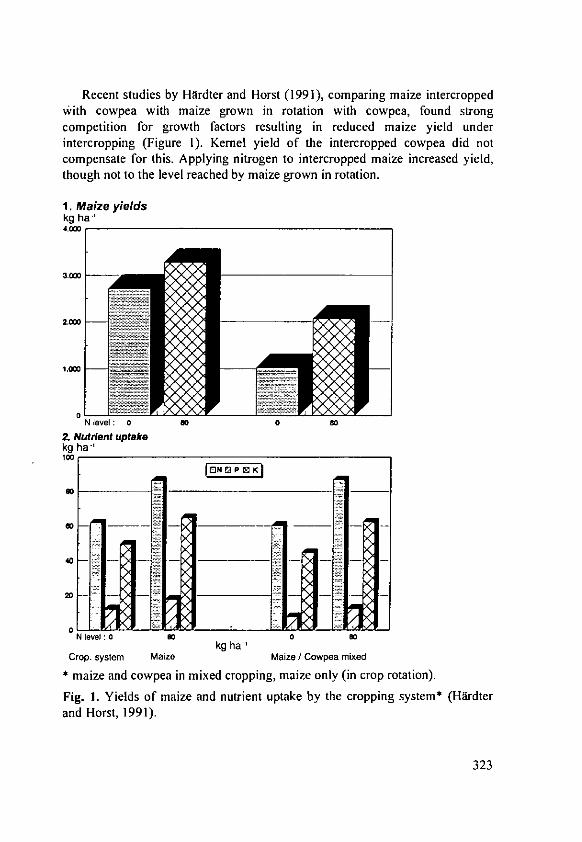
Recent studies by HArdter and Horst (1991), comparing maize intercroppedwith cowpea with maize grown in rotation with cowpea, found strongcompetition for growth factors resulting in reduced maize yield underintercropping (Figure I). Kernel yield of the intercropped cowpea did notcompensate for this. Applying nitrogen to intercropped maize increased yield,though not to the level reached by maize grown in rotation.
1. Maize yieldskg ha4.0=
.. ... .....
Nlevel: o DO 0 W0
2 Nutrient uptakekg ha-'
1031
80
N Jevel : O 0 Wkg ha
Crop. system Maize Maize/ Cowpea mixed
* maize and cowpea in mixed cropping, maize only (in crop rotation).
Fig. 1. Yields of maize and nutrient uptake by the cropping system* (Hardterand Horst, 1991).
323

Total nutrient uptake was similar under both systems indicating that, evenwhen N was applied, nutrient supply was insufficient and there was noimprovement in nutrient efficiency especially as regards P by intercropping; itwas better on the maize cowpea rotation. Soil moisture content was lower undermixed cropping and this affected P availability.
In addition, the cowpea fixed less nitrogen when intercropped due toincreased competition for light and water and the reduced P availability whilethere may also have been competition for other nutrients.
In this connection, Senaratne et al. (1993) found in a pot experiment thatgroundnut grown in a red yellow podzolic soil did not respond to K applicationwhen sole cropped. In association with the intercrop maize, K application,however, increased dry matter production, pod yield and the N2 fixed from theatmosphere (Table 1).
Table 1. Effect of K on yield and N2 fixation of groundnut grown as sole andintercrop with maize (Senaratne et al., 1993; modified).
Crop K level Dry matter yield (g plant-') N fixation(kg ha-1) Pods Stover Total (mg plant-')
Sole crop 0 10.97 7.72 18.69 526.4040 11.31 8.32 19.70 541.32
Groundnut 80 11.22 8.25 19.47 516.92
Intercrop 0 8.28 6.25 14.54 413.1040 8.97 7.35 16.32 438.10
Groundnut 80 11.39 8.46 19.85 542.33
At low K-levels (K0 and K40), intercropping resulted in a significant
depression in N2-fixation. With the increase of the K application to 80 kg ha-Isimilar yields as under sole crop conditions were achieved in the intercroppedgroundnut. This clearly shows that the optimum level of K for the intercroppedgroundnut is greater than for sole cropped.
Intercropping/variety interaction
CIAT (1992) found that when maize was intercropped with cassava, netnutrient (NPK) removal from the soil was higher with an improved maizevariety than with a conventional type, resulting in reduced nutrient recycling(Table 2). Allowance must be made for such effects in deciding rates offertilizer to be used.
324
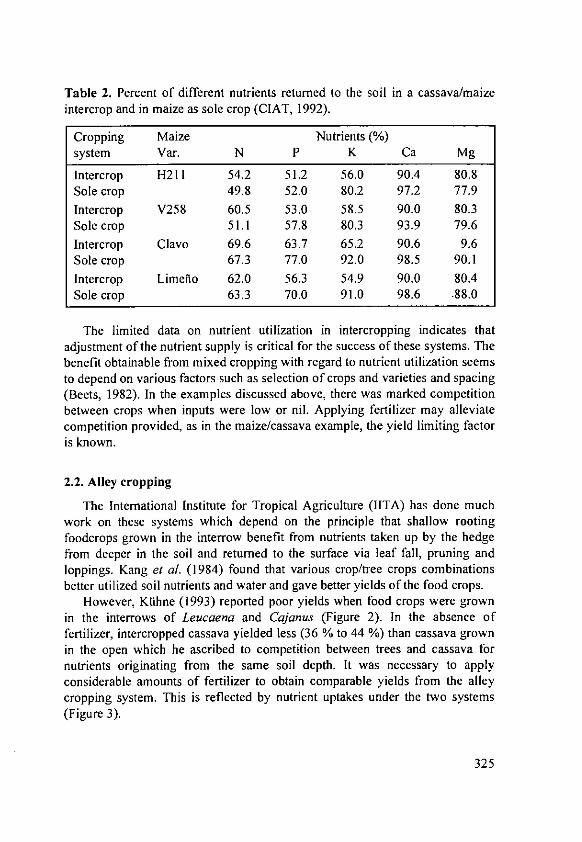
Table 2. Percent of different nutrients returned to the soil in a cassava/maizeintercrop and in maize as sole crop (CIAT, 1992).
Cropping Maize Nutrients (%)
system Var. N P K Ca Mg
Intercrop H211 54.2 51.2 56.0 90.4 80.8Sole crop 49.8 52.0 80.2 97.2 77.9
Intercrop V258 60.5 53.0 58.5 90.0 80.3Sole crop 51.1 57.8 80.3 93.9 79.6
Intercrop Clavo 69.6 63.7 65.2 90.6 9.6Sole crop 67.3 77.0 92.0 98.5 90.1
Intercrop Limefio 62.0 56.3 54.9 90.0 80.4Sole crop 63.3 70.0 91.0 98.6 .88.0
The limited data on nutrient utilization in intercropping indicates thatadjustment of the nutrient supply is critical for the success of these systems. Thebenefit obtainable from mixed cropping with regard to nutrient utilization seemsto depend on various factors such as selection of crops and varieties and spacing(Beets, 1982). In the examples discussed above, there was marked competitionbetween crops when inputs were low or nil. Applying fertilizer may alleviatecompetition provided, as in the maize/cassava example, the yield limiting factoris known.
2.2. Alley cropping
The International Institute for Tropical Agriculture (IITA) has done muchwork on these systems which depend on the principle that shallow rootingfoodcrops grown in the interrow benefit from nutrients taken up by the hedgefrom deeper in the soil and returned to the surface via leaf fall, pruning andloppings. Kang et al. (1984) found that various crop/tree crops combinationsbetter utilized soil nutrients and water and gave better yields of the food crops.
However, Ktihne (1993) reported poor yields when food crops were grownin the interrows of Leucaena and Cajanus (Figure 2). In the absence offertilizer, intercropped cassava yielded less (36 % to 44 %) than cassava grownin the open which he ascribed to competition between trees and cassava fornutrients originating from the same soil depth. It was necessary to applyconsiderable amounts of fertilizer to obtain comparable yields from the alleycropping system. This is reflected by nutrient uptakes under the two systems(Figure 3).
325

Dry matter (t ha- 1)
25
20
15,4,
IS
10
+ NPK
E control vMthout hedge [ leucmena hedge [ cajanus hedge
Fig. 2. Dry matter production of cassava as influenced by cropping system andmineral fertilizer application (based on Ktihne, 1993).
Nuptake kg (ha a)250
200 ___________
10
100 -- - -
503
-NPK +NPK
[i control without hedge [ leumena hedge cajanus hedge
Fig. 3. Nitrogen uptake of a cassava/maize rotation (average of 4 years) asinfluenced by cropping system and mineral fertilizer application (based onKuhne, 1993).
326

Average N uptake by the cassava maize rotation over 4 years was clearlydepressed by alley cropping but the situation was improved when NPK wasapplied. Management practices which may improve the performance of alleycropping will include:
- Adjustment of spatial arrangement of tree and food crop,- Selection of tree species,- Pruning of trees,- Shallow tillage,- Applying fertilizer only to the food crop,- Mulching the food crop.
The main contribution of alley cropping to the soil fertility through pruningof trees and spreading of the branches in the interrows may come from thestabilization of the organic matter content and the CEC and thus the capacity ofthe soil to store and transform plant nutrients. In addition, alley cropping mayreduce wind and water erosion.
However, as shown by above results, alley cropping can do nothing toreplace nutrients lost from the soils through removal at harvest or throughleaching, while under zero external input, trees and food crops tend to competewith each other for nutrients which results in drastic yield depressions of thefood crops.
Since the adoption of new technologies by farmers depends on the degree towhich the latter improves the yield of the food crops, an intensification of thesystem appears to be crucial. This could be achieved by the combination oforganic manuring via pruning and mineral fertilization to the intercropped foodcrops.
2.3. Crop rotations
As indicated above, with the change from traditional bush fallow systems tosemi-permanent and permanent cropping the choice of the adequate croppingsystems and the respective management to increase production and to restorefertility becomes increasingly important. Schmidt and Frey (1988) and Htrdter(1989) showed in experiments in the West African Guinea Savanna that underthe same fertilizer input, crop rotation of maize with legumes generally led tolarger maize yields in comparison to intercropping.
Furthermore, crop rotations of cereals with legumes showed advantages withregard to utilization of soil and fertilizer nutrients (Horst and Hflrdter, 1994).Therefore, intensive crop rotation systems seem to be the most appropriatealternative to extensive bush fallow systems, in particular where high populationdensity and thus land scarcity restrict the expansion in area.
327

Prasad (1993) investigated the nutrient requirements of intensive croprotations. The combination of high yielding varieties in intensive multiplecropping systems and imbalanced fertilization led to a significant depletion ofthe soil K. The potassium uptake of two typical crop rotations on calcareoussoils showed that K uptake from soils depended on crops and cropping systems(Table 3).
Table 3. Potassium uptake of two typical crop rotations on a calcareous soil ofBihar (Prasad, 1993).
K application N uptake (kg K-y ha-')Rotation Rotation
(kg K20-y ha- 1) Rice Wheat Total Groundnut Oat Total
0 95.4 77.3 172.7 49.1 97.7 146.840 126.6 89.3 215.9 69.4 143.3 212.780 167.1 107.2 274.3 94.0 150.5 244.5
K uptake was generally larger in the cereal based rice-wheat rotation than inthe groundnut-oat rotation. K uptake of both cropping systems increased withK-application. The marked difference in K uptake, in particular in theunfertilized plots between the two cropping systems may be explained by thedifferences in K uptake efficiency between the crops. According to theseresults, rice and oats were the most efficient crops with regard to K utilizationfrom the soil whereas groundnut was the least. This may be explained by thedifferences in the rooting system. The fertility management therefore has toconsider both the total demand of the cropping system and also the efficiency inuptake of its component crops, with respect to when and how much to apply.This also depends on the soil's retention capacity for nutrients.
If the soil's sorption capacity is sufficiently high, its K status can bemaintained by so-called "rotational fertilization", applying sufficient K for theneeds of the whole rotation only to the more K responsive crops, allowing theirsuccessors to benefit from residual K. However, if K retention is poor, thispractice is not advisable; leaching losses are to be expected and it is preferableto apply some K to all crops. Split application of potash is advocated for lighttextured soils under high rainfall.
2.4. Plantation cropping
Plantation crops are important sources of foreign exchange for a largenumber of tropical countries, in particular in SE Asia. At the same time, itseems that under the climatic conditions of the humid tropics plantation crops,
328
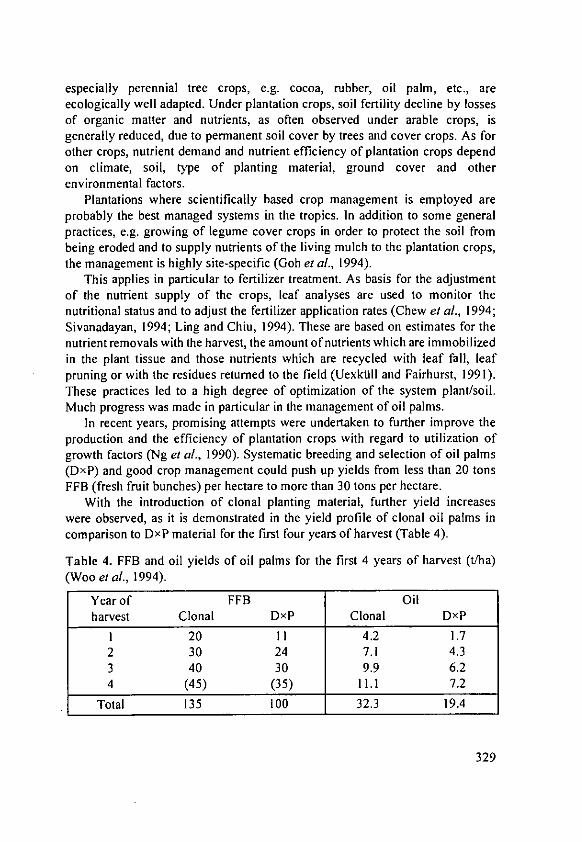
especially perennial tree crops, e.g. cocoa, rubber, oil palm, etc., areecologically well adapted. Under plantation crops, soil fertility decline by lossesof organic matter and nutrients, as often observed under arable crops, isgenerally reduced, due to permanent soil cover by trees and cover crops. As forother crops, nutrient demand and nutrient efficiency of plantation crops dependon climate, soil, type of planting material, ground cover and otherenvironmental factors.
Plantations where scientifically based crop management is employed areprobably the best managed systems in the tropics. In addition to some generalpractices, e.g. growing of legume cover crops in order to protect the soil frombeing eroded and to supply nutrients of the living mulch to the plantation crops,the management is highly site-specific (Gob et al., 1994).
This applies in particular to fertilizer treatment. As basis for the adjustmentof the nutrient supply of the crops, leaf analyses are used to monitor thenutritional status and to adjust the fertilizer application rates (Chew et al., 1994;Sivanadayan, 1994; Ling and Chiu, 1994). These are based on estimates for thenutrient removals with the harvest, the amount of nutrients which are immobilizedin the plant tissue and those nutrients which are recycled with leaf fall, leafpruning or with the residues returned to the field (Uexktill and Fairhurst, 1991).These practices led to a high degree of optimization of the system plant/soil.Much progress was made in particular in the management of oil palms.
In recent years, promising attempts were undertaken to further improve theproduction and the efficiency of plantation crops with regard to utilization ofgrowth factors (Ng et al., 1990). Systematic breeding and selection of oil palms(DxP) and good crop management could push up yields from less than 20 tonsFFB (fresh fruit bunches) per hectare to more than 30 tons per hectare.
With the introduction of clonal planting material, further yield increaseswere observed, as it is demonstrated in the yield profile of clonal oil palms incomparison to DxP material for the first four years of harvest (Table 4).
Table 4. FFB and oil yields of oil palms for the first 4 years of harvest (t/ha)(Woo et al., 1994).
Year of FFB Oilharvest Clonal DxP Clonal DxP
1 20 11 4.2 1.72 30 24 7.1 4.33 40 30 9.9 6.24 (45) (35) 11.1 7.2
Total 135 100 32.3 19.4
329

In view of the substantial yield advantage obtained by the clonal palms overconventional DxP seedlings the nutrient requirements have to be reassessed. Ina first approximation based on observation plots, there is a clear indication thatthe new planting material has a larger nutrient requirement. However, asindicated in Table 5, the nutrient use efficiency of clonal palms is superior tothe DxP material. This means that although the nutrient demand per tree or perunit area increased, per unit of produce (kg oil), it declined. Whether thistranslates into higher nutrient uptake efficiency and thus to reduced nutrientlosses from the soil needs further investigations.
Table 5. Superior yields and efficiency of nutrient utilization of clonal oil palmin the first 6 years after planting (Woo et al., 1994).
Parameter Clone DxP(Cumulative) Seedling
Oil yield (t/ha) 32.3 19.4
kg K20/ha 1,865 1,6872.1 kg K20/yr palm/yr 1.9 kg K20/yr palm/yr
kg oil/100 kg K2 0 1,732 1,150
Efficiency 151% 100%
3. Tillage and soil conservation methods
There are numerous publications about soil tillage methods and their impacton the physico-chemical properties of tropical soils, e.g. Krause et al. (1978),Lal (1981), Lal (1984). Most of them indicate the problems caused bymechanisation and intensive tillage practices used on tropical soils. In order tominimize the deteriorating effect of soil tillage on maintenance of soil fertilityeither low or no-tillage and a combination with mulching is recommended. Todiscuss all of them here would be beyond the scope of this paper. However,measures taken regarding soil tillage have to be highly site-specific.
The physical status of soils, in particular bulk density, is an important factorfor the access of plants to soil nutrients. This because in a compacted soil, rootgrowth is restricted and mobility of nutrients is inhibited. Farmers can influenceadverse physical soil conditions by management practices which include tillageand soil amendments such as incorporation of organic residues and liming. Afew examples on how these measures can improve the nutrient supply to cropswill be given below.
330
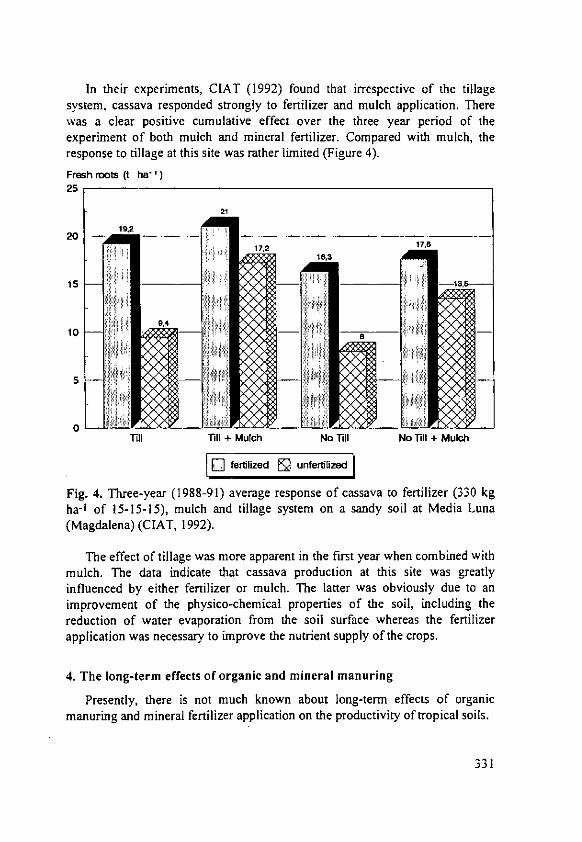
In their experiments, CIAT (1992) found that irrespective of the tillagesystem, cassava responded strongly to fertilizer and mulch application. Therewas a clear positive cumulative effect over the three year period of theexperiment of both mulch and mineral fertilizer. Compared with mulch, theresponse to tillage at this site was rather limited (Figure 4).
Fresh roots (t ha-')25
21
20 19,2
20 17,2 17's
15,15 -- i __
10 __
5
it'II
Till ill ± Mulch No ll No ll + Mulch
UI] fertilized [ unfertilized
Fig. 4. Three-year (1988-91) average response of cassava to fertilizer (330 kgha-1 of 15-15-15), mulch and tillage system on a sandy soil at Media Luna(Magdalena) (CIAT, 1992).
The effect of tillage was more apparent in the first year when combined withmulch. The data indicate that cassava production at this site was greatlyinfluenced by either fertilizer or mulch. The latter was obviously due to animprovement of the physico-chemical properties of the soil, including thereduction of water evaporation from the soil surface whereas the fertilizerapplication was necessary to improve the nutrient supply of the crops.
4. The long-term effects of organic and mineral manuring
Presently, there is not much known about long-term effects of organicmanuring and mineral fertilizer application on the productivity of tropical soils.
331

From a long-term experiment on a chernozem soil from loss under temperateconditions, clear differentiation in the soil fertility parameters depending on thetreatments occurred within the period of 85 years of experimentation (Kbppenand Eich, 1991).
The results show that the organic content in the topsoil was larger by 0.5 %after organic and mineral fertilization. Fertilization (NPK) alone increased the Ccontents in the soil by 0.2 %. Farmyard manure considerably reduced nutrientdeficiency. However, only combined organic manuring and fertilizer couldmaintain adequate soil fertility levels as is shown for potassium in Figure 5.
Kcontent (mg (100g)-')35
30 __ _ _
25 ..
20 - -_---
15 _ _ ___--
101
0Organic manure 0 20 30(t ha- I) ( ] 0 aj NPK [ NP M NK ff N PK Mineralfertilizer
Fig. 5. Soil potassium contents (mg,,,h' K (100 g)-1 ) of topsoil samples after 85years of different application of organic manure and mineral fertilizers (Ksppenand Eich, 1991).
Continuous arable cropping in the tropics is more critical, and changes insoil properties tend to occur more rapidly than in temperate climates. Therefore,management of soil fertility by incorporation of both organic and mineralfertilization is crucial for high and sustained production.
This is confirmed by results obtained from an experiment with upland riceon a sandy soil in North Eastern Thailand (Figure 6).
332

Willett (1994) attributed the positive effect of the combined compost andfertilizer application to stabilization of the CEC. Both compost and fertilizeradded considerable amounts of nutrients to the system which in turn increasedbiomass production (above and below ground) and thus produced larger
residues of organic matter in the soil. In particular, cations may haveaccumulated under these conditions owing also to reduced leaching.
Rice yield (t ha")3.000
* 156kg ha- ' i6-16- 2.519
18.8t ha- ' compost2.500
1.888
2.000 l.775
1.500
1.000
50
control mineral fertilizer compost** mineral fertilizer+ compost
Fig. 6. The interaction of organic manuring and mineral fertilizer application onupland rice yield, Northeast Thailand (Willett, 1994).
An experiment from India showed that productivity under tropicalconditions can be maintained over a longer period of time provided adequatemeasures including organic manuring and fertilizer application are undertaken(Figure 7).
The results, however, indicate that long-term response to manuring is rathercrop-specific. Complete manuring to maize and wheat resulted in a constantincrease of production with the duration of the experiment. In contrast, yields ofcowpea after a steep increase during the first 8 years declined thereafter.
333

MAIZE CROP
3000
2600 -S% P
2200
1800 100% NP
1400 - 00 N
1000
58oo - WHEAT CROP
id 5300 -1
4800
5. 4300
3800
O 33000,
2800 7
2300 I''''
COWPEA FODDER3400
3000 -OO%NPft,
2600 -
2200
1800 100% N
1400 1 I 1 1 1 .
1972 '74 '76 '78 '60 '82 P84 '86
Fig. 7. Yields of maize, wheat and cowpea in the long-term trials with NPK andcattle manure at Ludhiana, India, 1972-86 (Nambiar and Ghosh, 1984).
5. Water management
Water is the medium in which nutrients are transported to the roots and fromwhich they are taken up by the plants. Availability of water is therefore crucialfor the protection of plants from water shortage and also from nutrientdeficiency. Water management which includes the drainage of excessive waterunder wet and irrigation under dry conditions is an important measure by whichnutrient availability can be influenced.
334

Nutrients are distinctly different regarding their mobility in the soil, and thedegree of mobility is important for availability. In this regard, the mode oftransport, whether by massflow or diffusion, is of great importance. Thequantity of nutrients transported by diffusion from the soil to the plant roots issupported by large nutrient concentrations and a high soil water content.
For potassium, diffusion is the major mode of transport in the soil whichexplains that K availability is closely related to the soil water content. This isdemonstrated in Figure 8 where the K uptake of maize is plotted against the soilwater content. Potassium uptake by maize was significantly raised withincreasing water saturation of the soil.
Exch. K K-conc.(mg/100 g) (mre/ll
500- 46 1.07
0
A 31 0.47Ew300
.. , 17 0.177 .... ...... 1
100 .. . . . 11 0.08
20 30 40
Soil water content (Vol %$
Fig. 8. The effect of soil water content on K uptake of young maize plants atfour soil K levels (Chemozem) (Grimme, 1979).
The reduction of K availability caused by low water content, however, couldbe compensated by raising the potassium concentration in the soil solution.Although, according to Grimme (1979), soil water contents in the range of 20%to 40% were within the limits of good water supply; significant yield reductionsoccurred long before plants suffered from water shortage.
These findings show that under dry conditions, the critical K level in the soilis higher. The close interaction between soil water content and potassiumavailability implies that the problem of potassium deficiency can be overcomeeither by increasing the water content of the soil, thus the mobility of K, e.g.through irrigation, or by increasing the K concentration in the soil solution.
335
Irrigation favours yield formation and thus the nutrient uptake and to acertain extent, nutrient transport out of the rooting zone, unless properlymanaged. Therefore, nutrient resources of irrigated soils become exhaustedmuch faster and have to be replenished by organic manuring and fertilizer.
Similar to lack of soil moisture, excessive water negatively affects thenutrient uptake by plants. This is mainly caused by oxygen deficiency and thusreduced activity of the roots. A compensation by mineral and organic manuringis more difficult; unless large amounts of organic manures are incorporated intothe soil improving the drainage of excessive water is essential.
6. Conclusion
Increasing population and shrinking reserves of potential agricultural landdictate that attention must be paid to devising permanent systems of fanningwhich will sustain crop yields for the uplands. Whether this can be achievedsimply by improvement of traditional systems (e.g. intercropping) or by thesubstitution of "modern" systems (crop rotation/alley cropping) depends on thenutrient efficiency of the systems and on our ability to ensure adequate suppliesof plant nutrients.
A major constraint on traditional intercropping and alley cropping is inter-plant competition for nutrients and this can be ameliorated by carefulmanagement including selection of suitable crops and varieties, maximum useof organic residues and rational fertilizer usage. More long-term investigation inthe field is required if sustainable systems are to become a reality.
Even in plantation systems which are well suited to the tropical andsubtropical uplands, there is scope for improvement in nutrient use efficiencyand, here, the availability of high performance clonal planting material offersgreat possibilities.
References
Asher, C.J. and Ozanne, P.G. (1967): Growth and potassium content of plants insolution culture maintained at constant potassium concentrations. Soil Sci.103, 155-161.
Asher, C.J. and Ozanne, P.G. (1977): Individual plant variability insusceptibility to potassium deficiencies: Some observations on capeweed.Austr. J. Plant Physiol. 4, 499-503.
Bachthaler, G. and Wagner, A. (1973): Long-term field trial comparing strawincorporation and straw burning on different sites. Bayer. Landw. Jahrb. 50,436-461.
336
Beets, W.C. (1982): Multiple cropping and tropical farming systems. Gower,Great Britain; Westview Press, USA; pp. 156.
Chew, P.S., Kee, K.K., Goh, K.J., Quah, Y.T. and Tey, S.H. (1994): Anintegrated fertilizer management system for oil palms. Proc. IFA-FADINAPReg. Conf. for Asia and the Pacific, Kuala Lumpur, Malaysia, Dec. 12-15,1994.
CIAT (1992): Cassava programme 1987 - 1991, Working Document No. 116.Elmore, R.W. and Jackobs, J.A. (1986): Yield and N yield of sorghum
intercropped with nodulating and non-nodulating soybeans. Agron. J. 78:780-782.
Goh, K.J., Chew, P.S. and Kee, K.K. (1994): The K nutrition for mature oil
palm in Malaysia. IPI-Res. Topics No. 17, Intern. Potash Institute Basel/Switzerland.
Graff, 0. and Kuhn, H. (1977): Influence of the earthworm Lumbricus terrestris
L. on the yield and nutrient effect of straw application. Landw. Forsch. 30,86-93 (1977).
Grimme, H. (1990): Soil Moisture and K Mobility. Proc. 22nd Colloq.International Potash Institute, Bern, 117-131.
Hardter, R. (1989): Utilization of nitrogen and phosphorus by intercropping and
sole cropping systems of maize (Zea mays L.) and cowpea (vignaunguiculata L.) on an alfisol in Northern Ghana. Nyankpala Agric. Res.Report 5. J. Margraf D-6992 Weikersheim.
Hardter, R. and Horst W.J. (1991): Nitrogen and phosphorus use in maize solecropping and maize-cowpea mixed cropping systems on an alfisol in theNorthern Guinea Savanna of Ghana. Biol. Fertil. Soils 10: 267-275.
Horst, J.W. and Waschkies, C. (1987): Phosphorus nutrition of spring wheat in
mixed culture with white lupin. Pflanzenernhrung Bodenkunde 150: 1-8.Horst, J.W. and Hirdter, R. (1994): Rotation of maize with cowpea improves
yield and nutrient use of maize compared to maize monocropping in an
alfisol in the Northern Guinea Savanna of Ghana. Plant and Soil 160, 171-183.
Kang, B.T., Wilson, G.F. and Lawson, T.L. (1984): Alley Cropping. A stablealternative to shifting cultivation. lbadan, Nigeria: IITA.
Krause, R., Lorenz, F. and Wieneke, F. (1978): Tillage in tropical andsubtropical climates. Berichte fiber Landwirtschaft 59: 308-828.
Kuihne, R.F. (1993): Wasser und Nahrstoffhaushalt in Mais-Maniok-Anbausystemen mit und ohne Integration von Alleekulturen ("Alleycropping") in Stid-Benin. Hohenheimer Bodenkundliche Hefte. Univ.Hohenheim, D-70393 Stuttgart.
337
Lal, R. (1981): Land clearing and hydrological problems. In: R. Lal and E.W.Russell (eds.): Tropical Agricultural Hydrology, J. Wiley & Sons,Chichester, UK, 131-140.
Lal, R. (1984): Mechanised tillage systems. Effects on soil erosion from alfisolsin watersheds cropped to maize. Soil Tillage Res. 4, 349-360.
Ling, A.H. and Chiu, S.B. (1994): Cocoa nutrition in Malaysia: An update.Proc. IFA-FADINAP Reg. Conf. for Asia and the Pacific, Kuala Lumpur,Malaysia, Dec. 12-15, 1994.
Nambiar, K.K.M. and Gosh, A.B. (1984): Highlights of research of a long-termfertilizer experiment in India (1971-1982). LIFE Research Bulletin No. 1,Indian Agricultural Res. Institute, New Delhi, pp. 100.
Ng., S.K., v. Uexkoll, H.R., Thong, K.C. and Ooi, S.H. (1990): Maximumexploitation of genetic yield potentials of some major tropical tree crops inMalaysia. Proc. Symp. on Maximum Yield Res., 14th Int. Cong. Soil Sci.,Kyoto, Japan.
Prasad, B. (1993): Effect of continuous application of potassium on crop yieldsand potassium availability under different cropping sequences in calcareoussoils. J. Potassium Res. 9 : 48-54.
Ruthenberg, H. (1980): Farming systems in the tropics. Oxford Univ. PressLondon, 3rd edition.
Senaratne, R., Liyanage, N.D.L. and Ratnasinghe, D.S. (1993): Effect of K onnitrogen fixation of intercrop groundnut and the competition betweengroundnut and maize. Fertilizer Res. 34 : 9-14.
Sivanadyan, K. (1994): Manuring in hevea cultivation: A mainstay for ensuringenhanced productivity. Proc. IFA-FADINAP Reg. Conf. for Asia and thePacific, Kuala Lumpur, Malaysia, Dec. 12-15, 1994.
Steiner, K.G. (1982): Intercropping in tropical smallholder agriculture withspecial reference to West Africa. German Agency for technical Cooperation(GT2) Eschborn, FRG.
Willett, J.R. (1994): Constraints to sustainable soil use in South East Asia. In:Syers and Rimmer (eds.): Soil science and sustainable land management inthe tropics. CAB International, 235-247.
Woo, Y.C., Ooi, S.H. and Hardter, R. (1994): Potassium for clonal oil palms inthe 21st century. Proceedings IFA-FADINAP Regional Conference for Asiaand the Pacific, Kuala Lumpur, Malaysia, 12-15.12.1994.
338

Effect of Mulching on Nutrient Supply, Soil Fertility,Growth and Yield of Hevea brasiliensis
A.W. MahmudCrop Management Division, Rubber Research Institute of Malaysia,
260 Jalan Ampang, 50908 Kuala Lumpur, Malaysia
Abstract
Various types and forms of mulching materials are used in Heveacultivation. The mulching materials, introduced or produced in situ, conservesoil moisture, improve soil physical and chemical properties, promote feederroot development, ensure transplanting success and enhance growth during theimmature phase of Hevea. The long-term residual effects of mulching alsoresult in better yields in the early production stage. The practice of mulching isvery much influenced by the availability and cost of the materials, labourrequirements and ground conditions. This paper reviews various aspects ofmulching practices and the effects on soil fertility, growth and yield of Heveabrasiliensis.
1. Introduction
Important environmental factors that influence growth and yield of Hevea
brasiliensis are climate, topography and soils. The adverse effects of theseconditions have been shown to hamper plant growth and productivity. With theintroduction of appropriate soil technologies, problems associated with theseunfavourable conditions can be fully or partially overcome.
Mulching, a form of low input technology, is a recommended practice inHevea cultivation. Mulching not only protects the soil surface from erosion byrain, but also provides a cool and moist environment for root growth. Anadditional advantage is the suppression of weeds in the immediate vicinity ofthe planting points. However, this practice is normally carried out only underspecific circumstances as it is costly and laborious. In areas that eitherexperience prolonged drought, marginal and unpredictable rainfall or planted onsteeply sloping terrain, mulching during the field planting of young rubber isfound to be beneficial (Rubber Research Institute of Malaysia, 1956).
339
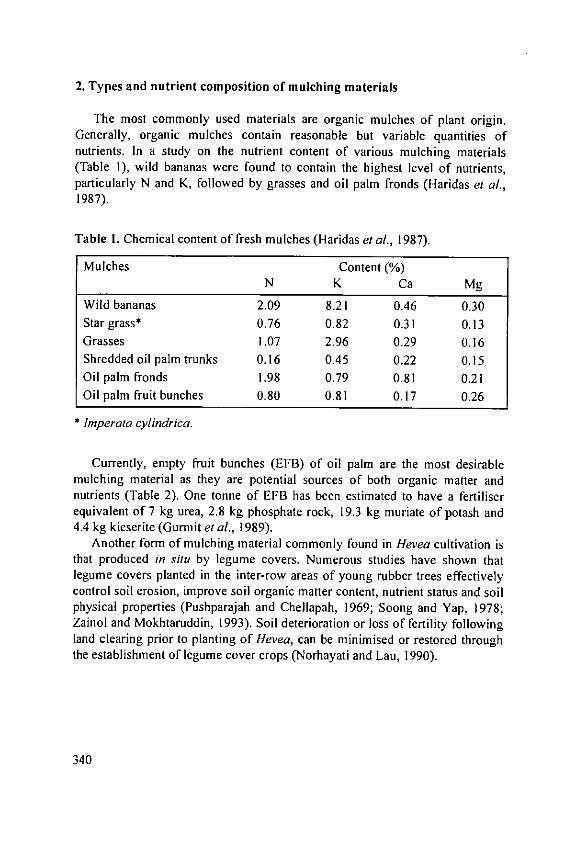
2. Types and nutrient composition of mulching materials
The most commonly used materials are organic mulches of plant origin.Generally, organic mulches contain reasonable but variable quantities ofnutrients. In a study on the nutrient content of various mulching materials(Table I), wild bananas were found to contain the highest level of nutrients,particularly N and K, followed by grasses and oil palm fronds (Haridas et al.,1987).
Table 1. Chemical content of fresh mulches (Haridas et al., 1987).Mulches Content (%)
N K Ca Mg
Wild bananas 2.09 8.21 0.46 0.30Star grass* 0.76 0.82 0.31 0.13Grasses 1.07 2.96 0.29 0.16Shredded oil palm trunks 0.16 0.45 0.22 0.15Oil palm fronds 1.98 0.79 0.81 0.21Oil palm fruit bunches 0.80 0.81 0.17 0.26
* Imperata cylindrica.
Currently, empty fruit bunches (EFB) of oil palm are the most desirablemulching material as they are potential sources of both organic matter andnutrients (Table 2). One tonne of EFB has been estimated to have a fertiliserequivalent of 7 kg urea, 2.8 kg phosphate rock, 19.3 kg muriate of potash and4.4 kg kieserite (Gurmit et al., 1989).
Another form of mulching material commonly found in Hevea cultivation isthat produced in situ by legume covers. Numerous studies have shown thatlegume covers planted in the inter-row areas of young rubber trees effectivelycontrol soil erosion, improve soil organic matter content, nutrient status and soilphysical properties (Pushparajah and Chellapah, 1969; Soong and Yap, 1978;Zainol and Mokhtaruddin, 1993). Soil deterioration or loss of fertility followingland clearing prior to planting of tlevea, can be minimised or restored throughthe establishment of legume cover crops (Norhayati and Lau, 1990).
340
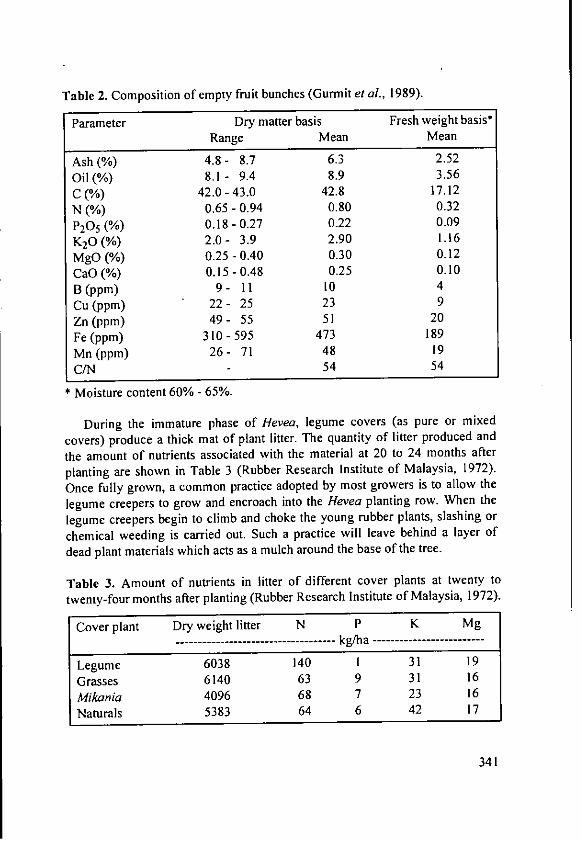
Table 2. Composition of empty fruit bunches (Gurmit et al., 1989).
Parameter Dry matter basis Fresh weight basis'Range Mean Mean
Ash (%) 4.8- 8.7 6.3 2.52
Oil (%) 8.1- 9.4 8.9 3.56
C (%) 42.0-43.0 42.8 17.12
N (%) 0.65 -0.94 0.80 0.32
P205 (%) 0.18-0.27 0.22 0.09
K20(%) 2.0- 3.9 2.90 1.16
MgO (%) 0.25-0.40 0.30 0.12
CaO (%) 0.15-0.48 0.25 0.10
B (ppm) 9- 11 10 4
Cu (ppm) 22- 25 23 9
Zn (ppm) 49- 55 51 20
Fe (ppm) 310-595 473 189
Mn (ppm) 26- 71 48 19
C/N 54 54
* Moisture content 60% - 65%.
During the immature phase of Hevea, legume covers (as pure or mixed
covers) produce a thick mat of plant litter. The quantity of litter produced and
the amount of nutrients associated with the material at 20 to 24 months after
planting are shown in Table 3 (Rubber Research Institute of Malaysia, 1972).
Once fully grown, a common practice adopted by most growers is to allow the
legume creepers to grow and encroach into the Hevea planting row. When the
legume creepers begin to climb and choke the young rubber plants, slashing or
chemical weeding is carried out. Such a practice will leave behind a layer of
dead plant materials which acts as a mulch around the base of the tree.
Table 3. Amount of nutrients in litter of different cover plants at twenty to
twenty-four months after planting (Rubber Research Institute of Malaysia, 1972).
Cover plant Dry weight litter N P K Mg------------------------------------ kg/ha ------------------------
Legume 6038 140 I 31 19
Grasses 6140 63 9 31 16
Mikania 4096 68 7 23 16
Naturals 5383 64 6 42 17
341

In a humid tropical environment, mulching materials generally tend todecompose rather rapidly, so that it is difficult to maintain a constant protectivelayer of mulch. In this situation, the large quantities of organic materialproduced by the creeping legumes will therefore serve as a constant supplier ofin situ mulch.
During the mature phase of Hevea growth, trees not only play the major roleof mobilising and utilising the available soil nutrients but also serve as the chiefsource of nutrient return. Hevea trees normally undergo annual leaf fall(wintering) resulting in the return of large amount of leaf litter and other deadplant materials to the soil. Leaf litter generated from this process besides actingas a mulch is also a significant source of nutrients (Table 4).
Table 4. Total amount of nutrients in main annual fall of leaf and fruits ofHevea (Rubber Research Institute of Malaysia, 1972).
Plant parts Dry weight N P K Mg------------------------------------ kg/ha ------------------------
Leaf 3700-7700 45-90 3-7 10-20 9-18(lamina/petiole)Fruit 160 2 0.2 2 0.2(seed/capsule)
3. Effect of mulching on soil fertility
In view of their importance, the influence of legume creepers on soil fertilityhad been extensively studied.
3.1. Soil physical characteristics
In a long-term experiment, Soong and Yap (1976) found that ground coverregimes established during the immature phase of Hevea had significantresidual effect on the soil. The effect was still noticeable after 16 years fromplanting. There were improvements on percentage soil aggregation, porosityand permeability followed by a decrease in the bulk density of the soil (Table5). Of the various ground covers, legumes generally left the soil in much bettercondition than did grasses or Mikania. The improvement of soil physicalconditions is attributed to the large amount of organic matter generated by the insitu covers.
342
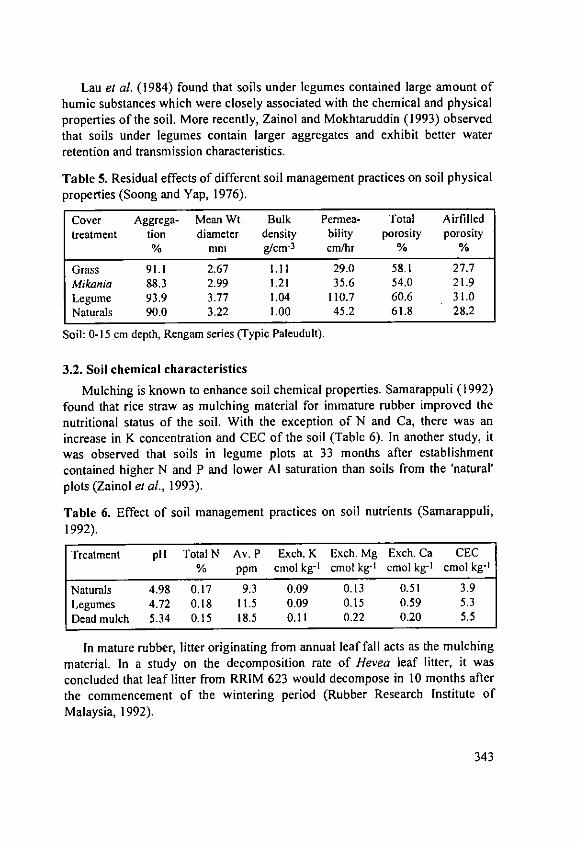
Lau et al. (1984) found that soils under legumes contained large amount ofhumic substances which were closely associated with the chemical and physicalproperties of the soil. More recently, Zainol and Mokhtaruddin (1993) observedthat soils under legumes contain larger aggregates and exhibit better waterretention and transmission characteristics.
Table 5. Residual effects of different soil management practices on soil physicalproperties (Soong and Yap, 1976).
Cover Aggrega- Mean Wt Bulk Permea- Total Airfilledtreatment tion diameter density bility porosity porosity
% mm g/cm- 3 cm/hr % %
Grass 91.1 2.67 1.11 29.0 58.1 27.7Mikania 88.3 2.99 1.21 35.6 54.0 21.9Legume 93.9 3.77 1.04 110.7 60.6 31.0Naturals 90.0 3.22 1.00 45.2 61.8 28.2
Soil: 0-15 cm depth, Rengam series (Typic Paleudult).
3.2. Soil chemical characteristics
Mulching is known to enhance soil chemical properties. Samarappuli (1992)found that rice straw as mulching material for immature rubber improved thenutritional status of the soil. With the exception of N and Ca, there was an
increase in K concentration and CEC of the soil (Table 6). In another study, itwas observed that soils in legume plots at 33 months after establishmentcontained higher N and P and lower Al saturation than soils from the 'natural'plots (Zainol et al., 1993).
Table 6. Effect of soil management practices on soil nutrients (Samarappuli,1992).
Treatment pH Total N Av. P Exch. K Exch. Mg Exch. Ca CEC% ppm cmolkg -' cmolkg-' cmol kg- 1 cmol kg-'
Naturals 4.98 0.17 9.3 0.09 0.13 0.51 3.9Legumes 4.72 0.18 11.5 0.09 0.15 0.59 5.3Dead mulch 5.34 0.15 18.5 0.11 0.22 0.20 5.5
In mature rubber, litter originating from annual leaf fall acts as the mulchingmaterial. In a study on the decomposition rate of Hevea leaf litter, it wasconcluded that leaf litter from RRIM 623 would decompose in 10 months afterthe commencement of the wintering period (Rubber Research Institute ofMalaysia, 1992).
343

As the leaf litter decomposed with time, the nutrient composition in thedecomposed litter also changed (Table 7). Except for N, all nutrient levels(particularly K and Mg) in the litter decreased with time suggesting thatnutrients were released when the litter underwent decomposition. Consideringthe large quantity of leaf litter generated annually, the amount of nutrientsreturned to the soil via the litter would be very significant.
Table 7. Decomposition of Hevea (RRIM 623) leaf litter (Rubber ResearchInstitute of Malaysia, 1992).
Time %Decom- C/N N P K Mg Ca Mn Cu Zn(days) posed ----------------- % ----------------- ------- ppm -------
0 - 38.8 1.66 0.06 0.53 0.11 0.31 423 9 4467 40.27 26.9 2.19 0.06 0.11 0.06 0.83 195 15 1231
139 63.15 23.7 2.20 0.07 0.11 0.05 0.92 222 15 181201 76.23 20.9 2.61 0.08 0.09 0.06 0.41 124 37 98276 86.75 - 2.41 0.07 0.02 0.03 0.27 249 24 56400 91.57 18.3 - - - - - - -
4. Effect of mulching on growth
In early growth, the young Hevea plant depends greatly on the condition ofthe surface soil as its root system is confined mainly to that layer. With propermulching which keeps the soil moist and cool under adverse weather conditions,root development is enhanced. The superior effect of mulching on the tree'srooting habit was studied by Sivanadyan et al. (1973). In the presence of mulch,the concentration of feeder root was found to be 10.24 g I-1 soil as comparedwith 2.25 g 1-1 soil with no mulching. Beyond this point, it is expected that therubber roots should be exploiting a large area of soil and therefore should bebetter able to withstand drought conditions.
In a trial with stumped budding, an advanced planting material with limitedroot system at planting, responses to mulching were evident as early as 3months after its application (Sivanadyan et al., 1973). Within 3 months, girthmeasurements of 0.7 and 1.0 cm of the stumped buddings were obtained fromthe unmulched and mulched plots, respectively (Table 8). In addition, underirrigation, the combined effect of mulch plus irrigation was even greater.
344
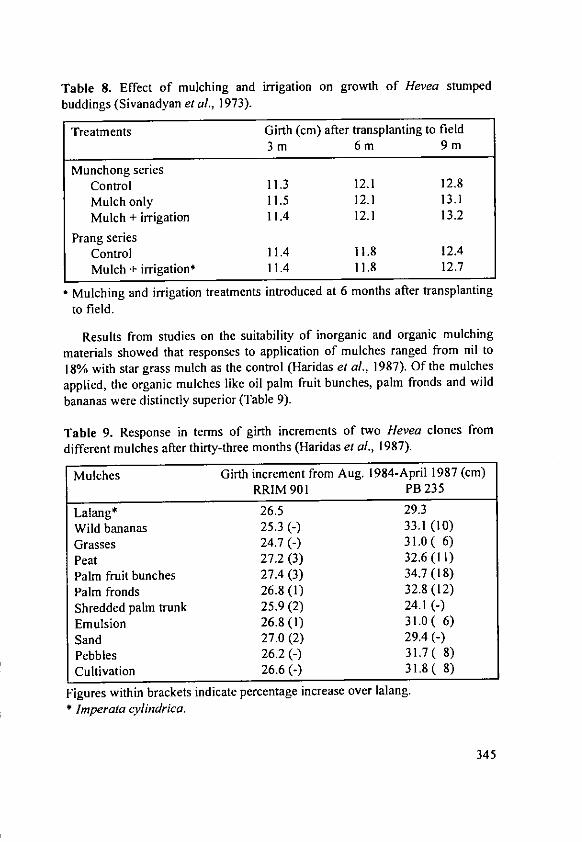
Table 8. Effect of mulching and irrigation on growth of Hevea stumped
buddings (Sivanadyan et al., 1973).
Treatments Girth (cm) after transplanting to field3m 6m 9m
Munchong seriesControl 11.3 12.1 12.8Mulch only 11.5 12.1 13.1Mulch + irrigation 11.4 12.1 13.2
Prang seriesControl 11.4 11.8 12.4Mulch + irrigation* 11.4 11.8 12.7
* Mulching and irrigation treatments introduced at 6 months after transplanting
to field.
Results from studies on the suitability of inorganic and organic mulching
materials showed that responses to application of mulches ranged from nil to
18% with star grass mulch as the control (Haridas et al., 1987). Of the mulches
applied, the organic mulches like oil palm fruit bunches, palm fronds and wild
bananas were distinctly superior (Table 9).
Table 9. Response in terms of girth increments of two Hevea clones from
different mulches after thirty-three months (Haridas et al., 1987).
Mulches Girth increment from Aug. 1984-April 1987 (cm)RRIM 901 PB 235
Lalang* 26.5 29.3
Wild bananas 25.3 (-) 33.1 (10)
Grasses 24.7 (-) 31.0 ( 6)
Peat 27.2(3) 32.6(11)
Palm fruit bunches 27.4 (3) 34.7(18)
Palm fronds 26.8 (l) 32.8 (12)
Shredded palm trunk 25.9 (2) 24.1 (-)Emulsion 26.8 (1) 31.0 ( 6)
Sand 27.0 (2) 29.4 (-)Pebbles 26.2 (-) 31.7 (8)
Cultivation 26.6 (-) 31.8 ( 8)
Figures within brackets indicate percentage increase over lalang.
* Imperata cylindrica.
345

Samarappuli et al. (1992) applied rice straw around the base of the Heveatree at 5 kg per plant per application once in 6 months and found that tree girthin mulched plots was generally superior to that of trees in legumes and 'natural'plots (Figure I).
70, 0 Dead Mulch0 Legumes
60 -0 Naturals
:5o 30
20
10
1982 1983 1984 1985 198 1987 1988 1989 1990 1991
Year
Fig. 1. Effect of different soil management practices on girth of rubber plants.
More importantly, the better girthing with mulching resulted in the reductionof the immature unproductive period by approximately 18 and 12 months, asexhibited by the tappability census (Table 10) in comparison with 'naturals' andlegumes, respectively.
Table 10. Effect of soil management practices on tappability of Hevea(Samarappuli, 1992).
Treatment Tappability (%)
Naturals 13.17Legumes 25.58Dead mulch 66.82
The better growth in the mulched plots was also reflected in the Hevea leafnutrient levels where levels of N, P, K and Mg were higher in mulched than in'naturals' and legume plots (Table 11).
346
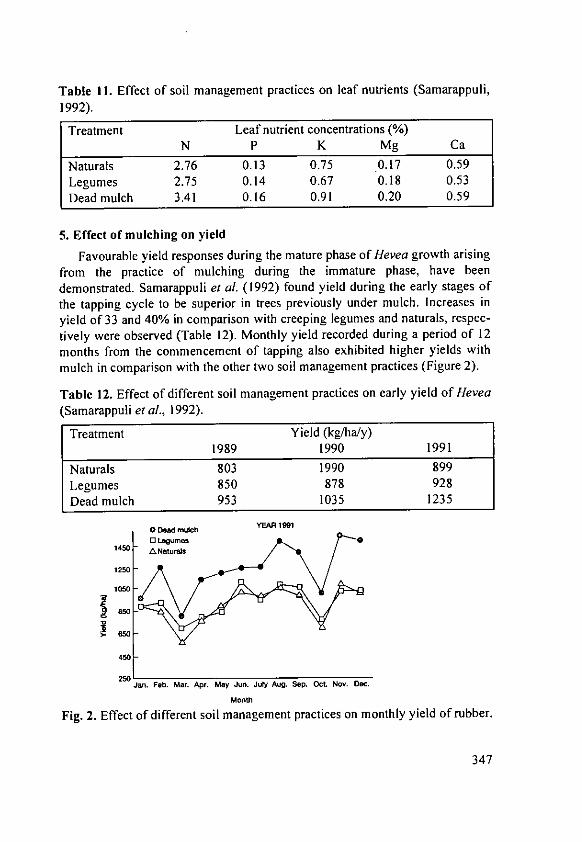
Table 1I. Effect of soil management practices on leaf nutrients (Samarappuli,1992).
Treatment Leaf nutrient concentrations (%)
N P K Mg Ca
Naturals 2.76 0.13 0.75 0.17 0.59Legumes 2.75 0.14 0.67 0.18 0.53Dead mulch 3.41 0.16 0.91 0.20 0.59
5. Effect of mulching on yield
Favourable yield responses during the mature phase of Hevea growth arisingfrom the practice of mulching during the immature phase, have beendemonstrated. Samarappuli et al. (1992) found yield during the early stages of
the tapping cycle to be superior in trees previously under mulch. Increases inyield of 33 and 40% in comparison with creeping legumes and naturals, respec-
tively were observed (Table 12). Monthly yield recorded during a period of 12
months from the commencement of tapping also exhibited higher yields with
mulch in comparison with the other two soil management practices (Figure 2).
Table 12. Effect of different soil management practices on early yield of Hevea(Samarappuli et al., 1992).
Treatment Yield (kg/ha/y)1989 1990 1991
Naturals 803 1990 899Legumes 850 878 928Dead mulch 953 1035 1235
YEAR 1991
14O ANaturals
4050
25OJan. Feb. Mar. Apr. May Jun. July Aug. Sep. Oct. NOV. Dec.
Mont
Fig. 2. Effect of different soil management practices on monthly yield of rubber.
347
In situ mulch provided by planted legume creepers during the immaturephase of Hevea growth, has also proven to have residual effects leading tohigher early yields of Hevea. Over a period of 14.5 years of tapping, Heveagrown together with legume creepers during the immature phase, yielded a totalof 19,668 kg/ha dry rubber which was 2895, 1471 and 2088 kg/ha more thanthe cumulative yields produced under grass, Mikania and natural covers,respectively (Pushparajah and Mahmud, 1978).
6. Conclusion
The beneficial effects of both introduced and in situ mulch in enhancing theestablishment, growth and early yield of Hevea are largely due to improvementsin soil physical and chemical properties, soil 'moisture regime, root growth,reduction in surface wash, leaching and soil surface temperature which created aconducive environment for proper tree establishment. In addition, on steepterrains, the mulch can also be used to control soil erosion and surface runoff offertilisers.
References
Gurmit, S., Manoharan, S. and Toh Tai San (1989): United Plantations'approach to palm oil mill by-product management and utilisation. Proc. Int.Palm Oil Dev. Conf, Kuala Lumpur, 225-234.
Haridas, G., Zainol, E., Sudin, M.N. and Bachik, A.T. (1987): Soil moistureconservation in rubber. Proc. Rubb. Res. Inst. Malaysia. Rubb. Grow. Conf.,Desaru, Johore, 1987, 154-166.
Lau, C.H., Soong, N.K. and Tan, K.S. (1984): Seasonal changes in humicsubstances in soil under different vegetative covers. Proc. Int. Conf. on Soilsand Nutrition of Perennial Crops (Eds. Bachik, A.T. and Pushparajah, E.),Kuala Lumpur. Malaysian Soc. Soil Sci. 1984, 199-207.
Norhayati, M. and Lau, C.H. (1990): Soil fertility changes following landclearing and rubber cultivation. Trans. 14th Int. Cong. Soil Sci. VI: 22-27.
Pushparajah, E. and Chellapah, K. (1969): Manuring of rubber in relation tocovers. J. Rubb. Res. Inst. Malaysia 21: 126-139.
Pushparajah, E. and Mahmud, A.W. (1978): Manuring in relation to covers.Proc. Rubb. Res. Inst. Plrs' Conf, Kuala Lumpur, 1977: 150-165.
Rubber Research Institute of Malaysia (1956): Mulching. PIr's Bull. Rubb. Res.Inst. Malaysia, 26: 90-92.
348
Rubber Research Institute of Malaysia (1972): Cycle of nutrients in rubberplantation. PIr's Bull. Rubb. Res. Inst. Malaysia, 120: 73-81.
Rubber Research Institute of Malaysia (1992): Ann. Rep. Rubb. Res. Inst.Malaysia.
Samarappuli, L. (1992): Some agronomic practices to overcome moisture stressin Hevea brasiliensis. Ind. J. Nat. Rubb. Res. 5: 127-132.
Samarappuli, L., Yogaratnam, N., Samarappuli, I.N., Karunadasa, P. andMitrasena, U. (1992): Towards shorter immaturity and improved yields bymulching with rice straw. J. Rubb. Res. Inst. Sri Lanka, 72: 27-38.
Sivanadyan, K., Mussa bin Mohd Said, Woo, Y.K., Soong, N.K. andPushparajah, E. (1973): Agronomic practices towards reducing period of
immaturity. Proc. Rubb. Res. Inst. Malaysia Plrs' Conf, Kuala Lumpur1973, 1-17.
Soong, N.K. and Yap, W.C. (1973): Effect of cover management on physicalproperties of rubber-growing soils. J. Rubb. Res. Inst. Malaysia, 24: 145-159.
Zainol, E. and Mokhtaruddin, A.M. (1993): Effects of intercropping systems onsurface processes in an acid Ultisol 1. Short-term changes in soil physicalproperties. J. Nat. Rubb. Res., 8: 57-67.
Zainol, E., Mahmud, A.W. and Sudin, M.N. (1993): Effects of intercroppingsystems on surface processes in an acid Ultisol 2. Changes in soil chemicalproperties and their influence on crop performance. J. Nat. Rubb. Res., 8:124-136.
349
Nutrient Requirements in Multiple Cropping Systems
B. RerkasemChiang Mai University, Faculty of Agriculture, Chiang Mai 50200, Thailand
Abstract
Multiple cropping systems generally refer to the practice of cropping
intensification in time, space or both. This paper reviews aspects of plant
nutrient requirements specific to multiple cropping systems. These include
differences in uptake and requirements among plant genotypes and species
which are components of the cropping systems, role of biological nitrogen
fixation by leguminous components, and interactions in intercropping systems.
Implications of these on fertilizer management and soil fertility maintenance of
multiple cropping systems are also discussed.
1. Introduction
Multiple Cropping Systems generally refer to the practice of growing more
than one crop per year in one space (Andrew and Kassam, 1976). This cropping
intensification takes one of the two basic forms with two or more crops grown
(i) in sequence on the same land, one succeeding another over time, and (ii) in
mixture in the same place and time. Numerous variations from these basic
forms, including their combinations (e.g. relay cropping) are practiced by
farmers throughout the world (see for example Andrew and Kassam, 1976). The
intensification of land use in time and space has given rise to many
characteristics unique to multiple cropping systems.
First of all, the requirement of nutrients to maintain soil fertility increases
with the number of crops grown in a field in one year. The problem is
complicated by differences among crop species and genotypes in the amount of
each mineral nutrient element required for a given unit of growth and yield and
in their ability to absorb and take up the nutrient from soil.
Secondly, biological nitrogen fixation can play a significant role in nutrient
requirement of cropping systems when a component crop is a legume.
Thirdly, in mixed or intercropping systems, nutrient requirement may be
influenced by interactions, competition or complementarity, between the
component crops.Finally, all of these lead to questions on the maintenance of soil fertility that
are specific to multiple cropping systems.
351
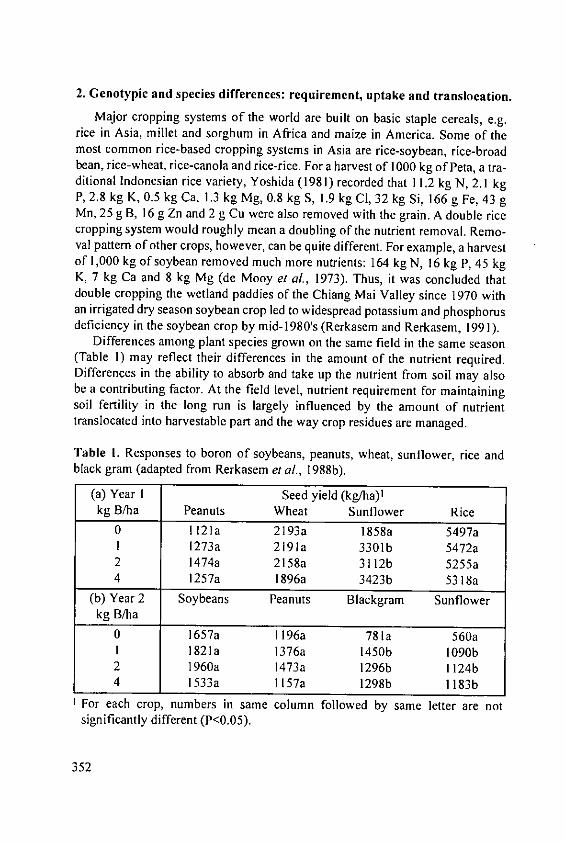
2. Genotypic and species differences: requirement, uptake and translocation.
Major cropping systems of the world are built on basic staple cereals, e.g.rice in Asia, millet and sorghum in Africa and maize in America. Some of themost common rice-based cropping systems in Asia are rice-soybean, rice-broadbean, rice-wheat, rice-canola and rice-rice. For a harvest of 1000 kg of Peta, a tra-ditional Indonesian rice variety, Yoshida (1981) recorded that 11.2 kg N, 2.1 kgP, 2.8 kg K, 0.5 kg Ca, 1.3 kg Mg, 0.8 kg S, 1.9 kg Cl, 32 kg Si, 166 g Fe, 43 gMn, 25 g B, 16 g Zn and 2 g Cu were also removed with the grain. A double ricecropping system would roughly mean a doubling of the nutrient removal. Remo-val pattern of other crops, however, can be quite different. For example, a harvestof 1,000 kg of soybean removed much more nutrients: 164 kg N, 16 kg P, 45 kgK, 7 kg Ca and 8 kg Mg (de Mooy et al., 1973). Thus, it was concluded thatdouble cropping the wetland paddies of the Chiang Mai Valley since 1970 withan irrigated dry season soybean crop led to widespread potassium and phosphorusdeficiency in the soybean crop by mid-1980's (Rerkasem and Rerkasem, 1991).
Differences among plant species grown on the same field in the same season(Table 1) may reflect their differences in the amount of the nutrient required.Differences in the ability to absorb and take up the nutrient from soil may alsobe a contributing factor. At the field level, nutrient requirement for maintainingsoil fertility in the long run is largely influenced by the amount of nutrienttranslocated into harvestable part and the way crop residues are managed.
Table I. Responses to boron of soybeans, peanuts, wheat, sunflower, rice andblack gram (adapted from Rerkasem et al., 1988b).
(a) Year I Seed yield (kg/ha)Ikg B/ha Peanuts Wheat Sunflower Rice
0 1121a 2193a 1858a 5497aI 1273a 2191a 3301b 5472a2 1474a 2158a 3112b 5255a4 12 57a 1896a 3423b 5318a
(b) Year 2 Soybeans Peanuts Blackgram Sunflowerkg B/ha
0 1657a 1196a 781a 560aI 1821a 1376a 1450b 1090b2 1960a 1473a 1296b 1124b4 1533a 1157a 1298b 1183b
For each crop, numbers in same column followed by same letter are notsignificantly different (P<0.05).
352
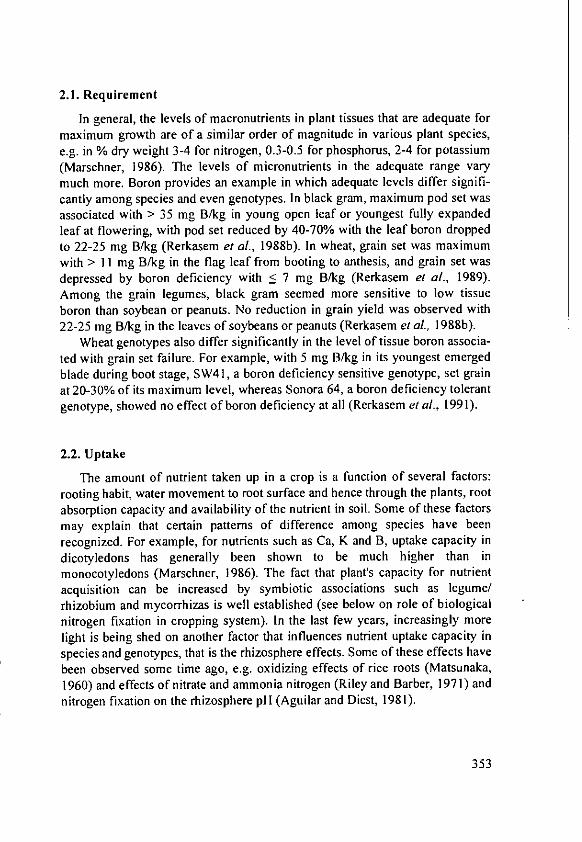
2.1. Requirement
In general, the levels of macronutrients in plant tissues that are adequate formaximum growth are of a similar order of magnitude in various plant species,e.g. in % dry weight 3-4 for nitrogen, 0.3-0.5 for phosphorus, 2-4 for potassium(Marschner, 1986). The levels of micronutrients in the adequate range varymuch more. Boron provides an example in which adequate levels differ signifi-cantly among species and even genotypes. In black gram, maximum pod set wasassociated with > 35 mg B/kg in young open leaf or youngest fully expandedleaf at flowering, with pod set reduced by 40-70% with the leaf boron droppedto 22-25 mg B/kg (Rerkasem et al., 1988b). In wheat, grain set was maximumwith > 11 mg B/kg in the flag leaf from booting to anthesis, and grain set wasdepressed by boron deficiency with < 7 mg B/kg (Rerkasem et al., 1989).Among the grain legumes, black gram seemed more sensitive to low tissueboron than soybean or peanuts. No reduction in grain yield was observed with22-25 mg B/kg in the leaves of soybeans or peanuts (Rerkasem et al., 1988b).
Wheat genotypes also differ significantly in the level of tissue boron associa-ted with grain set failure. For example, with 5 mg B/kg in its youngest emergedblade during boot stage, SW4 1, a boron deficiency sensitive genotype, set grainat 20-30% of its maximum level, whereas Sonora 64, a boron deficiency tolerantgenotype, showed no effect of boron deficiency at all (Rerkasem el al., 1991).
2.2. Uptake
The amount of nutrient taken up in a crop is a function of several factors:rooting habit, water movement to root surface and hence through the plants, rootabsorption capacity and availability of the nutrient in soil. Some of these factorsmay explain that certain patterns of difference among species have beenrecognized. For example, for nutrients such as Ca, K and B, uptake capacity indicotyledons has generally been shown to be much higher than inmonocotyledons (Marschner, 1986). The fact that plant's capacity for nutrientacquisition can be increased by symbiotic associations such as legume/rhizobium and mycorrhizas is well established (see below on role of biologicalnitrogen fixation in cropping system). In the last few years, increasingly morelight is being shed on another factor that influences nutrient uptake capacity inspecies and genotypes, that is the rhizosphere effects. Some of these effects havebeen observed some time ago, e.g. oxidizing effects of rice roots (Matsunaka,1960) and effects of nitrate and ammonia nitrogen (Riley and Barber, 1971) andnitrogen fixation on the rhizosphere pH (Aguilar and Diest, 1981).
353
More recently, observations have been made on effects of root exudates onavailability of nutrients such as Fe, P, Mn, Zn and Cu (Barrow, 1993). Observa-tion is still yet to be made on how this capacity for nutrient uptake of individualcrop species and genotypes affects nutrient requirement in cropping systems.
2.3. Nutrient removal and crop residue management
For grain crops, the nutrient translocated into the grain is removed from thefield with the harvest. Species differ a great deal in the amount of each nutrientpartitioned into the grain (Table 2). Most grain legumes tend to put the majorpart of total plant nitrogen and phosphorus in the grain, 80% for N and P insoybean as shown in Table 2.
Table 2 also shows that the amount of nutrients removed in the grain canalso be influenced by crop cultivars. The change of traditional rice (representedby Peta) to a new high yielding cultivar (IR8) resulted in a yield increase of 2.61tlha, but also removal of an additional 45.5 kg N, 25.2 kg P and 44.7 kg K perha. In moderately intensive multiple cropped areas with rice-soybean (e.g. in theChiang Mai Valley) the burning of rice straw before the soybean crop meansthat virtually all of the potassium, calcium and also magnesium in the rice straware returned to the soil. In other areas where straws are removed, e.g. rice andwheat straw to be used as fuel, broad bean straw as feed, the removal of thesebasic cations each year, and hence the amount needed to maintain soil fertilitylevel, can be substantial.
Table 2. Comparing some the amount of some macroelements removed in thegrain and straw in two rice cultivars (Peta and IR8) and soybeans.
Rice1 Ricel Soybeans 2
Peta IR8Panicle Straw Panicle Straw Grain Straw
N 68.5 74.5 116 48 164 42P 12.8 21.6 38 8 16 3K 17.3 290.7 62 247 45 18Ca 2.8 26.9 3.7 23.6 8 66
Grain yield(t/ha) 6.09 8.70 2.60
I Yoshida, 1981.2 deMooy et al., 1973.
354
3. The role of legumes
Combinations of cereals and legumes are probably the most common ofmultiple cropping systems. The ability of legumes, with their symbioticallyassociated bacteria, to "fix" nitrogen 'from the air influences nutritionrequirement in cropping systems in two major ways.
3.1. Nitrogen economy of cropping systems
A legume crop associated with effective nodule bacteria can fix largeamounts of nitrogen. How much this "free" nitrogen contributes to nitrogeneconomy of the cropping system depends on the input of nitrogen throughfixation and output via the harvestable product.
3.1.1. Grain legumes
The amount of nitrogen fixed by grain legumes recorded ranged from lessthan 10 kg N/ha to 450 kg N/ha (Peoples and Herridge, 1990). However,whether a crop of grain legume also enriches the soil with nitrogen after thegrain is harvested, thus benefiting the associated cereal crop, depends on thebalance of a simple equation:
nitrogen balance = nitrogen fixed - nitrogen removed.
Several measurements were made on soybean in Chiang Mai to determinepotential nitrogen balance. Effective symbiosis always develop with soybeaneven without rhizobium inoculation, fixing 55 kg N/ha (Wang et al., 1993) to225 kg N/ha (Tongrod, 1991). Nitrogen removed with harvested seed rangedfrom 60 kg N/ha to 194 kg N/ha, from seed yields of 889 to 2778 kg/ha(Tongrod, 1991). After each individual crop, when only the harvested seed isremoved from the field, nitrogen balances ranged from -42 to +48 kg N/ha.
Soybean is grown in three major cropping systems: (i) as the first crop of thewet season to be followed by another crop of soybean or black gram; (ii) as theend of wet season crop, following maize; and (iii) as dry season crop, followingwetland rice in wet season. The early wet season crop generally fixed slightlymore nitrogen (averages 20-50 kg N/ha) than that in the harvested seed. The endof wet season crop fixed almost the same as that harvested. The dry season cropactually removed some 40 kg N/ha in the harvested seed more than it gainedfrom fixation.
Throughout Asia, after the grain legume is harvested, remaining residues areeither taken home to be used as fuel or feed (China, Nepal, Bangladesh, Vietnam)or piled up near the threshing floor (Thailand). Measurements in the abovestudies indicated that a soybean harvest that removes everything above theground could deplete soil nitrogen to the order of 20 to 180 kg N/ha.
355
Field grown legumes almost always derive some of their nitrogen from thesoil. The effect of a legume crop on nitrogen economy of the cropping system canbe considered by relating the proportion (NHI% = N harvest index) of the legumeN that was derived from symbiotic fixation and the total N content of the crop.
Soybean represents the modem grain legumes with high harvest index, some75-85% of the plant nitrogen is generally removed in the grain (NHI = 75-85%).Such legumes, including modern varieties of other legumes such as cowpea,mungbean, pigeonpeas selected for increasing HI, will have to obtain at least75-85% of their nitrogen by fixation if soil nitrogen is not to be depleted.Although values between 80-90% are sometimes found, recorded estimates ofthe percentage of plant nitrogen derived from fixation at <50% are common formajor grain legumes (Peoples and Herridge, 1990).. Apart from the modem grain legumes with high NHI, several grain legumes
commonly grown in association with cereals can have positive effects onnitrogen economy of the cropping systems. These are the more traditional typeof legumes, with low harvest index and low NHI: climbing type cowpeas andbeans, rice bean, lablab, tall type pigeon peas. For example, rice bean (Vignaumbellata) was found to have an NHI of 28% and lablab (Lablab purpureus)10% (Rerkasem and Rerkasem, 1993). The rice bean was getting 97 kg N/ha(72% of its total nitrogen) from fixation. With a seed yield of 1300 kg/ha(containing 45 kg N) the crop left the soil with a positive balance of 52 kg N/ha.With a much longer period for vegetative growth, flowering in December,lablab was estimated to have fixed 296 kg N/ha in six months. With its seedyield of 1125 kg/ha, only 38 kg of nitrogen was removed with the harvest,leaving a positive nitrogen balance of 258 kg N/ha.
3.1.2. Green manure and cover legumes
Green manure and cover legumes vary widely in nitrogen concentration andnitrogen yields which have led to increased yields in succeeding cereal cropsthat were equivalent to responses to 50-120 kg fertilizer N/ha (Peoples andHerridge 1990). Most green manure and cover legumes are selected for their abi-lity to fix large amounts of nitrogen. However, it cannot be assumed that all of thenitrogen taken up in the green manure or cover legume has come from fixation.Few estimates of nitrogen fixed by green manure and cover legumes are available.
Contribution of nitrogen may also come from leguminous weeds. Mimosainvisa, for example, is considered by most people a noxious weed, largelybecause of its numerous spines combined with a copious seeding habit. Farmersin many mountain villages in Northern Thailand, however, consider Mimosainvisa important to the soil fertility maintenance of their upland fields.
356
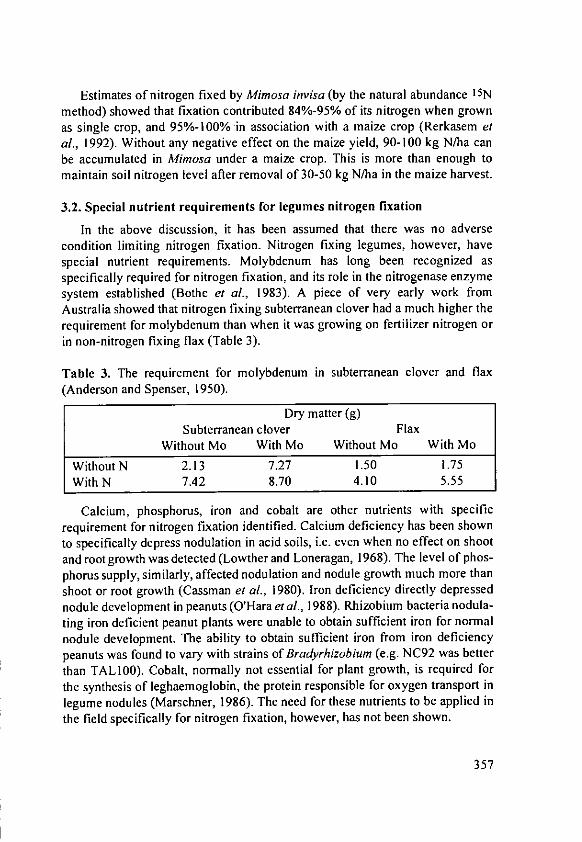
Estimates of nitrogen fixed by Mimosa invisa (by the natural abundance 15Nmethod) showed that fixation contributed 84%-95% of its nitrogen when grownas single crop, and 95%-100% in association with a maize crop (Rerkasem etal., 1992). Without any negative effect on the maize yield, 90-100 kg N/ha canbe accumulated in Mimosa under a maize crop. This is more than enough tomaintain soil nitrogen level after removal of 30-50 kg N/ha in the maize harvest.
3.2. Special nutrient requirements for legumes nitrogen fixation
In the above discussion, it has been assumed that there was no adversecondition limiting nitrogen fixation. Nitrogen fixing legumes, however, havespecial nutrient requirements. Molybdenum has long been recognized asspecifically required for nitrogen fixation, and its role in the nitrogenase enzymesystem established (Bothe et al., 1983). A piece of very early work fromAustralia showed that nitrogen fixing subterranean clover had a much higher therequirement for molybdenum than when it was growing on fertilizer nitrogen orin non-nitrogen fixing flax (Table 3).
Table 3. The requirement for molybdenum in subterranean clover and flax(Anderson and Spenser, 1950).
Dry matter (g)Subterranean clover Flax
Without Mo With Mo Without Mo With Mo
Without N 2.13 7.27 1.50 1.75With N 7.42 8.70 4.10 5.55
Calcium, phosphorus, iron and cobalt are other nutrients with specificrequirement for nitrogen fixation identified. Calcium deficiency has been shownto specifically depress nodulation in acid soils, i.e. even when no effect on shootand root growth was detected (Lowther and Loneragan, 1968). The level of phos-phorus supply, similarly, affected nodulation and nodule growth much more thanshoot or root growth (Cassman et al., 1980). Iron deficiency directly depressednodule development in peanuts (O'Hara et al., 1988). Rhizobium bacteria nodula-ting iron deficient peanut plants were unable to obtain sufficient iron for normalnodule development. The ability to obtain sufficient iron from iron deficiencypeanuts was found to vary with strains of Bradyrhizobium (e.g. NC92 was betterthan TALl00). Cobalt, normally not essential for plant growth, is required forthe synthesis of leghaemoglobin, the protein responsible for oxygen transport inlegume nodules (Marschner, 1986). The need for these nutrients to be applied inthe field specifically for nitrogen fixation, however, has not been shown.
357
4. Competition and complementarity in intercropping systems
"Nutritional efficiency" is one of the advantages attributed to intercropping(e.g. Willey, 1979). Concrete evidence of intercrops' greater nutritional efficiencyis however rare. Two aspects of nutrient requirements specific to intercroppingsystems will be discussed in the following section: (i) effects of intercropping onnitrogen fixation by the legume component, and (ii) effects of root competition.
4.1. Nitrogen fixation by intercropped legumes
Throughout the tropics and subtropics, legumes such as cowpeas, beans, ricebean, chickpea, pigeon pea, peanut and soybean are intercropped with staplecrops such as maize, millet, sorghum, rice and cassava (Ofori and Stem, 1987).As stated above, intercropping can either increase or decrease the amount ofnitrogen fixed by the legume, and increase or decrease the degree of symbioticdependence of the legume - measured as proportion of legume nitrogen derivedfrom fixation (Peoples and Herridge, 1990). Normally, short stature legumessuch as soybean and peanut can be shaded by tall cereal crops such as maize andsorghum to such an extent that their yields and nitrogen fixation are decreasedsignificantly (Wahua and Miller, 1978; Nambiar et al., 1983). Cassava, its largehorizontal leaves blocking out most of the light, may depress the accompanyinglegumes even more (K. Rerkasem and B. Rerkasem, unpublished).
Legumes with indeterminate growth and climbing habit are generally moresuccessful in intercrops. It may not be just an accident that these are thetraditional intercrop species, e.g. ricebean and cowpea with maize in Thailand,cowpea with sorghum and millet in Africa, and common beans with maize inAmerica. With the right combination of intercrops, nitrogen fixation by thelegume tended to be enhanced in intercropping systems with higher proportionof the cereal. For example, rice bean monoculture was getting 32% to 72% of itsnitrogen from fixation, depending on mineral nitrogen status of the soil(Rerkasem et al., 1988a; Rerkasem and Rerkasem, 1988). lntercroppingincreased contribution from fixed nitrogen in rice bean to 51% to 90%. Asexpected, the ability of the rice bean to take up mineral nitrogen from the soilwas depressed by intercropping, i.e. as it had to compete against the morecompetitive maize.
It is often assumed that a portion of the nitrogen fixed by an intercropped orpasture legume is made available to the associated nonlegume during thegrowing season. However, after reviewing many papers Peoples and Herridge(1990) concluded that evidence of direct transfer of nitrogen is limited.
358

4.2. Other nutrients
As intercropped species can compete for soil nitrogen, they may also becompeting for other nutrients. A classical example came from a study on alegume/grass mixture of Setaria anceps and Desmodium intorlum (Hall, 1974).The pasture mixture was exhibiting significant "intercrop advantage" withrespect to dry matter and uptake of nitrogen, potassium and phosphorus, whenthere was sufficient potassium in the soil. This intercrop advantage largelydisappeared under potassium deficiency. With potassium deficiency,Desmodium only poorly competed for it against Setaria. Thus, limited bypotassium deficiency, Desmodium in intercrop fixed relatively less nitrogen andtook up less phosphorus and accumulated less dry matter than when it wasgrowing by itself in monoculture.
Unfortunately, knowledge about "real" intercrops of, e.g. cereal andlegumes, is rather scanty.
5. Effects of seed nutrient level
There are many reports in the literature on the effects of seed nutrient levelon seed viability and subsequent plant growth. That response to molybdenum insoybean is strongly dependent of the nutrient level in the seed was establishedmany years ago (Harris et al., 1965). More recently there are reports on theeffect of seed phosphorus and manganese on establishment and growth(Thompson and Bolger, 1993). Seed boron level has been shown to affect seedviability, seedling growth and subsequent yield in black and green gram (Bell etal., 1989; Rerkasem et al., 1990) and soybean (Rerkasem et al., 1989). In areaswith intensive cropping systems, where farmers often keep their own seed fromseason to season, this effect of seed nutrient level could receive more attention.Furthermore, the concentration of certain nutrients in the seed could markedlyalter plant responses in fertilizer trials.
6. Conclusions: implications for soil fertility and fertilizer management
This paper has shown that nutrient requirements in multiple croppingsystems are significantly different from those in monoculture in many respects.The management of fertilizers and the maintenance of soil fertility in multiplecropping systems are also complicated by differences among crop species andgenotypes in their uptake and requirement and management of crop residues.
359

Specific issues in nutrient requirements that are related to the management
of multiple cropping systems are summarized as follows:
(i) Intensification by multiple cropping systems inevitably leads to depletionof all the nutrients.
(ii) Species and genotypic differences in uptake ability and requirement arewell known. Utilization of these in improving nutrient management incropping system is still limited.
(iii) In intercropping systems competition for nutrients other than nitrogencan lead to the loss of intercrop advantages.
(iv) Quantification of nitrogen input (nitrogen fixation) and output(harvested) is essential for the understanding of the role of nitrogenfixation by legumes in cropping systems.
(v) Requirements for other nutrients in multiple cropping systems may beinfluenced by the input of nitrogen from the legume component.
(vi) Concentration of certain nutrients in the seed may influence subsequentplant responses, with implications for both experimentation and fertilizermanagement.
References
Aguilar, S.A. and van Diest, A. (1981): Rock-phosphate mobilization inducedby the alkaline uptake pattem of legumes utilizing symbiotically fixednitrogen. Plant Soil 61: 27-42.
Anderson, A.J. and Spencer, D. (1950): Molybdenum in nitrogen metabolism oflegumes and non-legumes. Aust. J. Sci. Res. B. 3: 414-430.
Andrews, D.J. and Kassam, A.H. (1976): The importance of multiple croppingin increasing world food supplies. In: "Multiple Cropping" (R.I. Papendick,P.A. Sanchez and G.B. Triplett, eds.), pp. 1-10. Spec. Pub. No 27, AmericanSociety of Agronomy, Madison, Wisc.
Barrow, N.J. ed. (1993): Plant Nutrition: from genetic engineering to fieldpractice. Developments in Plant and Soil Sciences Vol. 54. KluwerAcademic Publishers. 803 p.
Bell, W.R., McLay, L., Plaskett, D. and Loneragan, J.F. (1989): Germinationand vigour of black gram (Vigna mungo (L.) Hepper) seed from plantsgrown with and without boron. Aust. J. Agric. Res. 40: 273-279.
Bothe, H., Yates, M.G. and Cannon, F.C. (1983): Physiology, biochemistry andgenetic of dinitrogen fixation. In: "Encyclopedia of Plant Physiology, NewSeries" (A. Liuchli and R.L. Bieleski, eds.), Vol. 15A, pp. 241-285.Springer-Verlag, Berlin and New York.
360

Cassman, K.G., Whitney, A.S. and Stockinger, K.R. (1980): Root growth anddry matter distribution of soybean as affected by phosphorus stress,nodulation, and nitrogen source. Crop Sci. 20: 239-244.
deMooy, C.J., Pesek, J. and Spaldon, E. (1973): Mineral nutrition. In:"Soybeans: Improvement, Production and Uses" (B.E. Caldwell ed.), pp.267-352. Monograph 16, American Society of Agronomy, Madison, Wisc.
Hall, R.L. (1974): Analysis of the nature of interference between plants ofdifferent species. II. Nutrient relations in a Nandi Setaria and GreenleafDesmodium association with particular reference to potassium. Aust. J.Agric. Res. 25: 749-756.
Lowther, W.L. and Loneragan, J.F. (1968): Calcium and nodulation in subter-ranean clover (Trifolium subterraneum L.). Plant Physiol. 1362-1366.
Marschner, H. (1986): Mineral nutrition of higher plants. Academic Press. 674p.
Matsunaka, S. (1960): Studies on the respiratory enzyme systems of plants. I.Enzymatic oxidation of ca-naphthylamine in rice plant root. J. Biochem. 47:820-829.
Nambiar, P.C.T., Rao, M.R., Reddy, M.S., Floyd, C., Dart, P.J. and Willey,R.W. (1983): Effect of intercropping on nodulation and N2 fixation bygroundnut. Exp. Agric. 64:411-416.
O'Hara, G.W., Hartzook, A., Bell, R.W. and Loneragan, J.F. (1988): Responsesto Bradyrhizobium strain of peanut cultivars grown under iron stress. J. PlantNut. 11: 6-10.
Ofori, F. and Stem, W.R. (1987): Cereal-legume intercropping systems. Adv.Agron. 41: 41-90.
Peoples, M.B. and Herridge, D.F. (1990): Nitrogen fixation by legumes in- tropical and subtropical agriculture. Adv. Agron. 44: 155-233.
Rerkasem, B., Rerkasem, K., People, M.B., Herridge, D.F. and Bergersen, F.J.(1988a): Measurement of N2 fixation in maize (Zea mays L.), ricebean(Vigna umbellata [Thunb.] Ohwi and Ohashi) intercrops. Plant and Soil 108:125-135.
Rerkasem, B., Netsangtip, R., Bell, R.W., Loneragan J.F. and Hiranburana, N.(1988b): Comparative species responses to boron on a Typic Tropaqualf inNorthern Thailand. Plant Soil 106: 15-21.
Rerkasem, K., and Rerkasem, B. (1988): Yields and nitrogen nutrition ofintercropped maize and ricebean (Vigna umbellata [Thunb.] Ohwi andOhashi). Plant and Soil 108: 151-162.
Rerkasem, B., Bell, R.W. and Loneragan J.F. (1989): Low boron in seeddepresses soybean yield. In: Proceedings of the 5th Australian AgronomyConference. Australian Society of Agronomy, Parkvill, Vic. Australia.
361
Rerkasem, B., Bell R.W. and Loneragan, J.F. (1990): Effects of seed and soilboron on early seedling growth of black and green gram (Vigna mungo andVigna radiata). In: "Plant nutrition - physiology and applications" (M.L. vanBeusichem, ed), pp. 281-285. Kluwer Academic Publishers.
Rerkasem, B., Lodkaew, S. and Jamjod, S. (1991): Assessment of grainsetfailure and diagnosis for boron deficiency in wheat. In: Saunders D.A., ed.(1991). Wheat for the nontraditional Warm Areas. Mexico DF: CIMMYT.pp. 500-504.
Rerkasem, B. and Rerkasem K. (1991): A decline of soil fertility underintensive cropping in northern Thailand. In: "Soil Management forSustainable Rice Production in the Tropics", pp. 315-328. InternationalBoard for Soil Research and Management (1991). IBSRAM Monograph no.2.
Rerkasem, B. and Rerkasem, K. (1993): Legumes for the highlands. In:"Proceedings of Completion Seminar", pp. 32-40. Thai-Australia HighlandAgricultural and Social Development Project.
Rerkasem, B., Yoneyama, T. and Rerkasem, K. (1992): Spineless mimosa(Mimosa invisa) a potential live-mulch for corn. Working Paper 1, Agricul-tural Systems Programme, Chiang Mai University.
Riley, D. and Barber, S.A. (1971): Effect of ammonium and nitrate fertilizationon phosphorus uptake as related to root-induced pH changes at the root-soilinterface. Soil Sci. Soc. Am. Proc. 35: 301-306.
Tongrod, P. (1991): Nitrogen fixation in soybeans (Glycine max L.) underdifferent growing seasons. MS Thesis, Department of Agronomy, ChiangMai University.
Wahua, T.A.T. and Miller, D.A. (1978): Effects of intercropping on soybean N 2
fixation and plant composition on associated sorghum and soybeans. Agron.J. 70: 292-295.
Wang, G., Peoples, M.B., Herridge, D.F. and Rerkasem, B. (1993): Nitrogenfixation, growth and yield of soybean grown under saturated soil culture andconventional irrigation. Field Crop Res. 32: 257-268.
Willey, R.W. (1979): lntercropping - its importance and research needs. Part I.Competition and yield advantages. Field Crops Abstract 32: 1-10.
Yoshida, S. (1981): Fundamentals of rice crop science. IRRI, Los Baflos. 269 p.
362

Impact of Organic Farming on Soil Nutrient Supplyand Nutrient Requirement of Crops with Referenceto the Korean Situation
C.W. HongNational Agricultural Science and Technology Institute, Suweon 441707, Korea
Summary
Korean farmers, accustomed to high crop yields, are generous fertilizerusers. Large amounts of animal-based manures are available but where farmersare practising organic farming, replacing all or the greater part of fertilizer withorganic manure, the rates applied to achieve the customary high yield are suchas to cause build up of soil P and K to very high levels which can threaten theenvironment. It is essential that maximum use be made of farm manures forreasons of economy and environmental protection but there are problems to besolved in making their use more efficient. In the short to medium term, apossible solution is to combine their application with some fertilizer, especiallyN, so as to adjust the nutrient balance while, in the longer term, a betterknowledge of the turnover of nitrogen in the soil could improve the return fromthe manure itself.
I. Introduction
"Organic farming" (OF) is defined as "Farming that avoids the use ofchemically synthesized agricultural inputs by using alternative means such ascrop rotation, agricultural by-products, organic by-products of non-agriculturalorigin, natural minerals and biological means to conserve the soil physically, tobuild up soil fertility and to control weeds, diseases and pests" (USDA, 1980).In Korea, this is taken to mean the replacement of chemical fertilizers byorganic manure and the avoidance of agricultural chemicals (MAFF, 1993). Inpractice, however, there are problems in following this policy and there hasbeen little investigation of technological problems involved on the practising of
OF or of its effects on soil nutrients and their availability to crops.
363
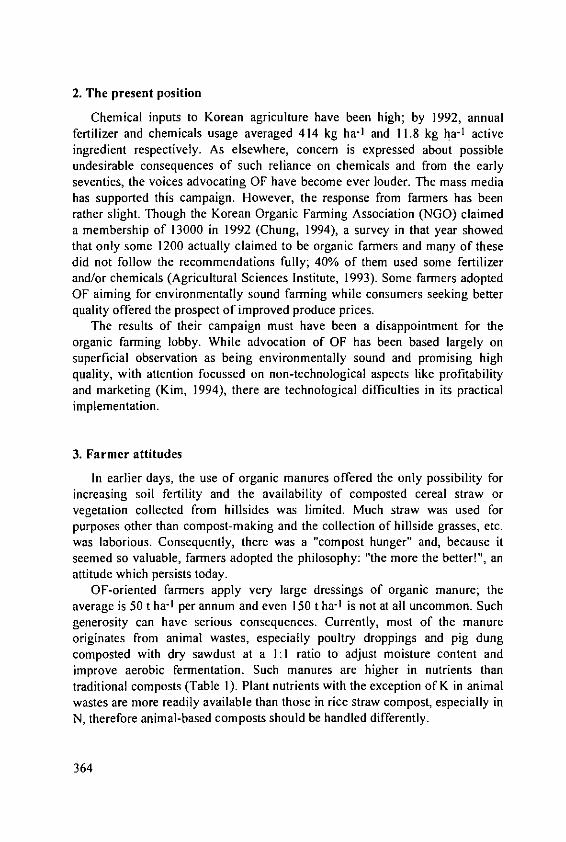
2. The present position
Chemical inputs to Korean agriculture have been high; by 1992, annualfertilizer and chemicals usage averaged 414 kg ha-1 and 11.8 kg ha-t activeingredient respectively. As elsewhere, concern is expressed about possibleundesirable consequences of such reliance on chemicals and from the earlyseventies, the voices advocating OF have become ever louder. The mass mediahas supported this campaign. However, the response from farmers has beenrather slight. Though the Korean Organic Farming Association (NGO) claimeda membership of 13000 in 1992 (Chung, 1994), a survey in that year showedthat only some 1200 actually claimed to be organic farmers and many of thesedid not follow the recommendations fully; 40% of them used some fertilizerand/or chemicals (Agricultural Sciences Institute, 1993). Some farmers adoptedOF aiming for environmentally sound farming while consumers seeking betterquality offered the prospect of improved produce prices.
The results of their campaign must have been a disappointment for theorganic farming lobby. While advocation of OF has been based largely onsuperficial observation as being environmentally sound and promising highquality, with attention focussed on non-technological aspects like profitabilityand marketing (Kim, 1994), there are technological difficulties in its practicalimplementation.
3. Farmer attitudes
In earlier days, the use of organic manures offered the only possibility forincreasing soil fertility and the availability of composted cereal straw orvegetation collected from hillsides was limited. Much straw was used forpurposes other than compost-making and the collection of hillside grasses, etc.was laborious. Consequently, there was a "compost hunger" and, because itseemed so valuable, farmers adopted the philosophy: "the more the better!", anattitude which persists today.
OF-oriented farmers apply very large dressings of organic manure; theaverage is 50 t ha-1 per annum and even 150 t ha-1 is not at all uncommon. Suchgenerosity can have serious consequences. Currently, most of the manureoriginates from animal wastes, especially poultry droppings and pig dungcomposted with dry sawdust at a 1:1 ratio to adjust moisture content andimprove aerobic fermentation. Such manures are higher in nutrients thantraditional composts (Table 1). Plant nutrients with the exception of K in animalwastes are more readily available than those in rice straw compost, especially inN, therefore animal-based composts should be handled differently.
364
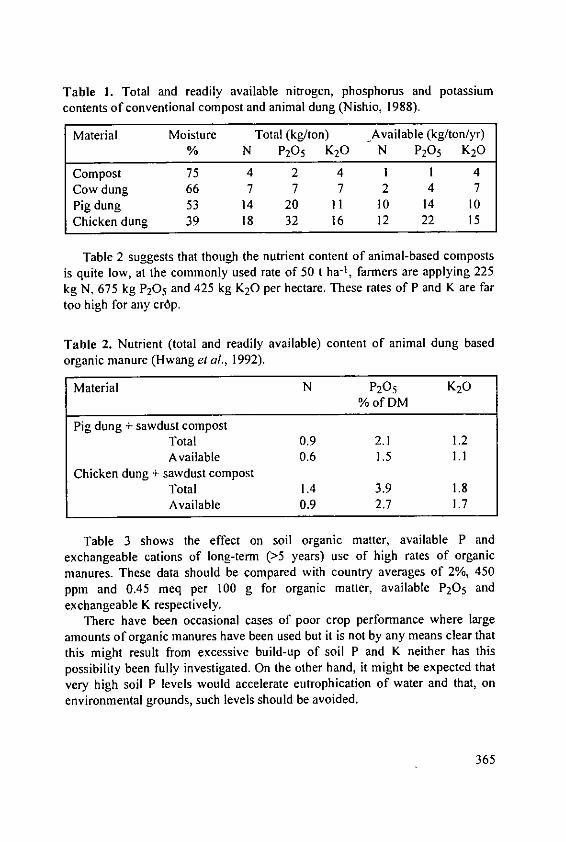
Table I. Total and readily available nitrogen, phosphorus and potassiumcontents of conventional compost and animal dung (Nishio, 1988).
Material Moisture Total (kg/ton) Available (kg/ton/yr)% N P20 5 K20 N P20 5 K20
Compost 75 4 2 4 I I 4Cow dung 66 7 7 7 2 4 7Pig dung 53 14 20 11 10 14 10Chicken dung 39 18 32 16 12 22 15
Table 2 suggests that though the nutrient content of animal-based compostsis quite low, at the commonly used rate of 50 t ha-l, farmers are applying 225kg N, 675 kg P20 5 and 425 kg K20 per hectare. These rates of P and K are fartoo high for any cr6p.
Table 2. Nutrient (total and readily available) content of animal dung basedorganic manure (Hwang et al., 1992).
Material N P20 5 K20%ofDM
Pig dung + sawdust compostTotal 0.9 2.1 1.2Available 0.6 1.5 1.1
Chicken dung + sawdust compostTotal 1.4 3.9 1.8Available 0.9 2.7 1.7
Table 3 shows the effect on soil organic matter, available P andexchangeable cations of long-term (>5 years) use of high rates of organicmanures. These data should be compared with country averages of 2%, 450ppm and 0.45 meq per 100 g for organic matter, available P20 5 andexchangeable K respectively.
There have been occasional cases of poor crop performance where largeamounts of organic manures have been used but it is not by any means clear thatthis might result from excessive build-up of soil P and K neither has thispossibility been fully investigated. On the other hand, it might be expected thatvery high soil P levels would accelerate eutrophication of water and that, onenvironmental grounds, such levels should be avoided.
365

Table 3. Chemical properties of soils in farmers' field where organic farminghas been practiced more than 5 years (Agricultural Sciences Institute, 1992).
Place pH O.M. Available P Exch. cations (me/100 g)(1:5 H20) (%) (ppm) Ca Mg K
Guri 6.8 5.8 1483 11.0 5.5 2.4Yangju 5.6 3.6 1392 6.9 3.3 2.5Chungyang 6.1 2.8 1301 6.4 2.3 1.8Chonweon 6.3 7.8 2400 9.0 4.8 1.9Boryeong 6.9 3.2 1992 7.4 3.9 0.8Boseong 6.8 8.8 979 9.9 4.0 2.4Bongwha 6.2 3.0 1155 7.4 1.3 0.9
Even though organic manuring is laborious and costly, farmers, on the basisof their experience, persist in the practice and must feel that this is worthwhile.They are accustomed to high yields whatever their methods; even though anobjective of OF is improved crop quality, high yield is still their main target.They commonly apply N at 300 kg ha-1 to Chinese cabbage; 50 t ha-1 manureonly supplies 225 kg ha- 1 so they may try to make up the N deficit simply byapplying more than 50 t, being unaware of the risk of excessive P and Kaccumulation. Table 4 compares the effects of fertilizer and organic manuretreatment on soil characteristics.
Table 4. Influence of long-term (4 years) application of organic manure on thechemical properties of soil under the cultivation of vegetable crops (Shin et al.,1993).
Treatment(I:20) pH O.M. Available P Exch. cations (me/100 g)
Mineral fertilizers' 5.8 1.0 391 3.2 0.6 0.4Organic manure" 7.1 3.1 1230 8.0 3.7 2.8
* At the rate of 240-200-220 kg ha-1 of N, P20 5 and K20.** At the rate of 50 t ha- 1 of organic manure containing 1.3% N, 2.8% P20 5
and 1.9% K20.
366

4. Effect of accumulated soil nutrients on plants
Whether the building up of soil organic matter above a satisfactory level isbeneficial is problematic. Shortage of P was formerly a problem. Accumulationof P and K in intensive vegetable growing in poly-tunnels was first thought tobe a problem in the early eighties (Rural Development Administration, 1989),but due to its low mobility, it might be permissible. High K levels resultingfrom heavy application of fertilizer and manure would be expected to affectcrop nutrition due to antagonistic effects among the cations leading to reducedCa or Mg uptake (Bear and Toth, 1948). Interest in this topic persists (Smithand Demchak, 1987) and it has been investigated in Korea (Yoon and Riu,1976; Chung et al., 1987) who found that high soil K especially depresseduptake of Mg possibly resulting in Mg deficiency. This is illustrated in Table 5which shows the effects of the alternative treatments fertilizer supplying 240 kgN, 200 kg P20 5 and 220 kg K20 per ha per annum and 50 t ha- 1 per yearchicken dung-sawdust manure supplying 340 kg N, 750 kg P20 5 and 500 kgK20 for a period of 4 years. The resulting high level of soil K from organicmanure reduced especially plant uptake of Mg and its activity in the plant.There is also evidence (Hong, 1994, unpublished) that heavy K applicationfollowed by irrigation displaces Ca and Mg. Clearly, the continued applicationof organic manure high in K would, in the long run, carry a risk of inducing Caand/or Mg deficiency.
Table 5. Influence of the application of organic manure on the exchangeablecations in the soil and Ca, Mg, and K content in the plant (Chinese cabbage)(Shin, personal communication).
Treatment In soil In plantExch. cation Ca, Mg and K(me/100g) Mg content (me/100g) Mg
Ca Mg K act. Ca Mg K act.
Mineral fertilizer 2.8 0.5 0.4 0.33 113.3 30.4 78.0 0.062Organic manure 7.5 3.1 2.2 0.36 90.3 29.6 121.0 0.042
5. Conclusion
Our discussion has shown that organic farming as currently practiced bysome Korean farmers carries with it some more or less serious drawbacks.However, this is not to say that organic manuring should be discouragedbecause circumstances in Korea dictate that maximum use should be made of
367
organic wastes which, it is estimated (Chung, pers. comm.), contain sufficientnutrients to replace 40% of the N and virtually all of the P and K now applied asfertilizer. Not to make full use of this bounty would be madness and anextravagance which we can ill afford. On top of this economic aspect, we haveto take into account the potential adverse environmental effects of accumulatingexcessively high soil nutrient contents.
It rather appears that the rates of application of organic manures currentlyused on some crops are excessive and that it would be advantageous to reducethese rates so as to apply only the normally recommended rates of P and K andto make good any shortage of N which would result therefrom by applyingsome N fertilizer in order to improve the nutrient balance. As things are, while itis as yet impossible to utilize all the animal wastes, the amount of whichincreases steadily, the consumption of fertilizers continues to grow. One resulthas been the loading of the environment with animal wastes.
It may well be possible to improve the utilization of nitrogen in organicmanures. At the present, our knowledge of the long-term mobilization andimmobilization of nitrogen in the soil is incomplete and an effort to improvethis is called for. In the meantime, the answer to the problem appears to be theuse of organic manures and to correct their defects by combining them withsome fertilizer in order to adjust the nutrient balance.
References
Agricultural Sciences Institute (1992): Studies on organic farming in Korea(The First Year Report on a Special Research on Organic Farming,sponsored by Rural Development Administration). p. 51.
Bear, F.B. and Toth, S.J. (1948): Influence of calcium on availability of othercations. Soil Sci. 65: 69-75.
Chung, J.Y. (1994): Retrospect of organic farming in Korea. Proceedings of"Symposium on the strategy for the development of organic farming inKorea", Agricultural Sciences Institute, 12-13 October 1994, Suweon,Korea. p. 45-55.
Hong, C.W. (1993): Current status and prospect for the agricultural use oforganic resources-with special reference to organic farming. In: Proceedingsof the symposium on "Soil management for the environment conservingagriculture", organized by Korean Society of Soil Science and Fertilizer, 15October 1993, Taejeon, Korea. p. 31-67.
368
Hong, Y.P. and Hong, C.W. (1994): Diagnosis of nutritional disorder of fruit
trees observed in farmers' fields. Rural Development Administration, Journalof Agricultural Science 36, No. I (S&F), p. 265-270.
Hwang, K.N., Lee, K.S., Shin, Y.K. and Lee, Y.H. (1992): Study on the effect
of the degree of composting on the nutrient release of organic matter.
Agricultural Sciences Institute 1992 Research Report. p. 244-249.
Jeong, Y.G., Hong, C.W. and Ha, H.S. (1987): Study on the influence of Ca and
Mg saturation ratios of soils on the uptake of Ca, Mg, and K by rice plant.
Journal of Korea Society of Soil Science and Fertilizer 20, No. 2, p. 115-121.
Kim, J.S. (1994): Current management status of organic farmers. Proceedings of
"Symposium on the strategy for the development of organic farming in
Korea", Agricultural Sciences Institute, 12-13 October 1994, Suweon,
Korea. p. 95-110.Ministry of Agriculture, Forestry and Fisheries (1993): Discussion paper for the
development of sustainable agriculture (unpublished).Ministry of Agriculture, Forestry and Fisheries (1994): Key Statistics of
Agriculture, Forestry and Fisheries for 1994.Nishio, M., Fujiwara, J. and Sugawara, B. (1988): How to use organic materials
in agriculture. Nosangosonbunkakyokai. Tokyo. p. 106.
Shin, Y.K., Lee, Y.H., Hwang, K.N. and Choi, D.N. (1993): Experiment on the
effect of continued application of organic manure on vegetable crops.
Agricultural Sciences Institute Research Report for 1994. p. 2 64 -2 6 8 .
Rural Development Administration (1989): Final Report on "10 Year Arable
Land Soil Improvement Project". p. 188.Smith, C.B. and Demchak, K.T. (1987): Nutrient element interaction in
vegetable crops. Journal of plant nutrition 10: 9/16, 1501-1507.
Yoon, J.H. and Ryu, I.S. (1976): Study on influence of base ratio in plant and
soil on soybean yield and growth. The Research Reports of Office of Rural
Development 18: 35-40.
369

Chairmen of the Session 4
Sorasith Vacharotayan, Dept. of Soil Science,Faculty of Agriculture, Kasetsart University,Bangkok, Thailand, and M. Singh, Potash
Research Institute of India, Gurgaon, India
Session 4
Constraints and Opportunities forFertilizer Use in Asian Countries
371

Constraints and opportunities for fertilizer use inAsian countries, an introduction to the theme
L.M. MaeneThe International Fertilizer Industry Association (IFA), 28, rue Marbeuf, 75008Paris, Tel: (33) (1) 42 25 27 07, Fax: (33) (1) 42 25 24 08
The region covered by this paper comprises South Asia, East Asia
(excluding Japan) and Socialist Asia. The main fertilizer-consuming countriesof South Asia are India, Pakistan and Bangladesh; those of East Asia are
Indonesia, Republic of Korea, Malaysia, Myanmar, the Philippines and
Thailand; those of Socialist Asia are China, Korea DPR and Vietnam. Some of
the smaller consuming countries are Nepal, included in South Asia, and
Cambodia and Laos included in Socialist Asia.
Note: M = million.
I. The issues
The following statistics almost speak for themselves.
1.1. Population
In 1990, the region had a total population of 2729 M people, 52% of the
world total. It is estimated that the number will grow to 4233 M by the year
2030, i.e. an increase of 1504 M (Table I).
1.2. Land
The area of arable and permanent crop land amounted to 375.5 M ha in
1992, or 26% of the world total. In 1982 the area was 374.3 M ha (Table 2).
1.3. Cereal production
In 1993 total cereal production was 811 Mt, or 43% of the world total. Rice
production, at 460 Mt accounted for 88% of the world total. At present the
region accounts for about 20% of world cereal imports (Table 3).
373

Table 1. Population (in '000).
1990 2030South Asia 1088678 1906810Bangladesh 109820 191 097India 849514 1 432 181Pakistan 112 351 259039Sri Lanka 16993 24493East Asia 418 714 667697Indonesia 178232 274712Korea Republic 42 869 53 679Malaysia 17 763 31 955Myanmar 41 825 76729Philippines 61 480 121 448Taiwan, China 20242 25 860Thailand 56303 83 314Socialist Asia 1 221 687 1 658 563China 1 133 683 1 500611Korea DPR 21 771 34742Vietnam 66233 123 210Total listed 2 729 079 4 233 070World 5266007 8474017
Source: World Bank.
Table 2. Land area: arable and permanent crops (in '000 ha).
1992 1982South Asia 201 709 200 092Bangladesh 9044 9 130India 169650 168675Pakistan 21 110 20430Sri Lanka I 905 t 857East Asia 68809 64 779Indonesia 22500 19730Korea Republic 2070 2 180Malaysia 4 880 4 860Myanmar 10039 10080Philippines 9 190 8830Thailand 20 130 19099Socialist Asia 105 019 109 396China (1) 96302 100891Korea DPR 2 020 I 925Vietnam 6 697 6 580Total listed 375537 374 267World I 443 999 I 421 106
(I) Including Taiwan.Source: FAO.
374
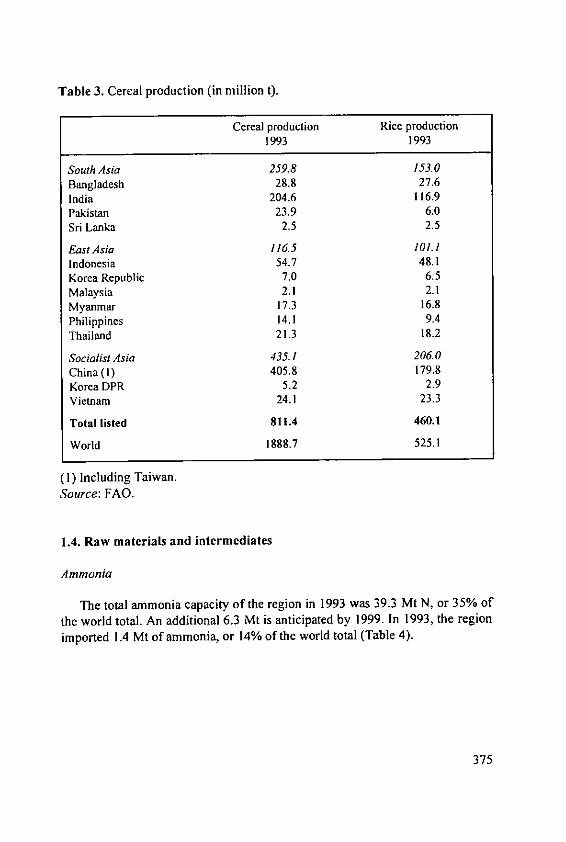
Table 3. Cereal production (in million t).
Cereal production Rice production1993 1993
South Asia 259.8 153.0Bangladesh 28.8 27.6India 204.6 116.9Pakistan 23.9 6.0Sri Lanka 2.5 2.5
East Asia 116.5 101.1Indonesia 54.7 48.1Korea Republic 7.0 6.5Malaysia 2.1 2.1Myanmar 17.3 16.8Philippines 14.1 9.4Thailand 21.3 18.2
Socialist Asia 435.1 2060China (I) 405.8 179.8Korea DPR 5.2 2.9Vietnam 24.1 23.3
Total listed 811.4 460.1
World 1888.7 525.1
(1) Including Taiwan.Source: FAO.
1.4. Raw materials and intermediates
Ammonia
The total ammonia capacity of the region in 1993 was 39.3 Mt N, or 35% ofthe world total. An additional 6.3 Mt is anticipated by 1999. In 1993, the region
imported 1.4 Mt of ammonia, or 14% of the world total (Table 4).
375

Table 4. Ammonia (in '000 t N).
Capacities Production Imports1993 1993 1993
South Asia 11275 9560 493Bangladesh 1 124 991 0India 8510 7 123 493Pakistan 1 641 I 446 0SriLanka 0 0 0
East Asia 4233 3941 911Indonesia 2 776 2 888 0Korea Republic 684 386 565Malaysia 326 334 10Myanmar 200 110 0Philippines 0 0 141Taiwan, China 247 223 158Thailand 0 0 37
Socialist Asia 23 823 19 712 0China 22902 19000 0Korea DPR 867 660 0Vietnam 54 52 0
Total listed 39331 33213 1 404
World 113022 90830 8958
Source: IFA.
Phosphate rock and phosphoric acid
The region has 2.3 Mt of phosphoric acid capacity, or 7% of the world total.In 1993, the region accounted for 39% of world phosphoric acid imports,mostly by India.
In 1993, China produced 23.5 Mt of phosphate rock, or 20% of the worldtotal. Other producing countries are India, Korea DPR, Vietnam, Pakistan andSri Lanka, but altogether they produced only 1.9 Mt of rock, or less than 2% ofthe world total (Table 5).
376

Table 5. Phosphates.
Phosphate rock Phosphoric acid(1000 t product) (1000 t P20 5)
Production Imports Capacities Production Imports1993 1993 1993 1993 1993
South Asia 1020 2585 767 297 1070Bangladesh 0 88 45 17 5India 967 2216 722 280 1 065Pakistan 20 275 0 0 0SriLanka 33 6 0 0 0
East Asia 0 4293 1 192 808 187Indonesia 1 I 228 200 162 177
Korea Republic 0 1 666 554 444 0Malaysia 0 532 0 0 0Myanmar 0 2 0 0 0Philippines 0 484 405 177 0Taiwan, China 0 368 33 25 10Thailand 0 13 0 0 0
Socialist Asia 24363 500 376 300 24China *23 500 440 376 300 24Korea DPR *500 60 0 0 0Vietnam 363 0 0 0 0
Total listed 25383 7378 2335 1 405 1 281
World 120705 26728 33610 22 153 3297
* Estimates.Source: IFA.
Potash
Only China produces potash, accounting for 0.4% of world production. In
1993, regional imports amounted to 3.6 Mt K20, or 24% of the world total(Table 6).
377

Table 6. Potash (in 1000 t K20).
Production Imports1993 1993
South Asia 0 793Bangladesh 0 41India 0 711Pakistan 0 negSri Lanka 0 41
East Asia 0 I 680Indonesia 0 371Korea Republic 0 393Malaysia 0 566Myanmar 0 0Philippines 0 118Taiwan, China 0 165Thailand 0 67
Socialist Asia 60 1 155China (1) *60 1 150Korea DPR 0 negVietnam 0 5
Total listed 60 3 628
World 20353 15303
* Estimate (I) Including Taiwan
Source: IFA.
Fertilizer production and imports
In 1993, the region produced 18.2 Mt N of urea, or 50% of the world total,but only 1.3 Mt P20 5 of ammonium phosphate, or 10% of the world total.
In 1993, 4.4 Mt N of urea and 2.5 Mt of ammonium phosphates, wereexported to the region, accounting respectively for 47% and 46% respectivelyof world trade (Table 7).
378
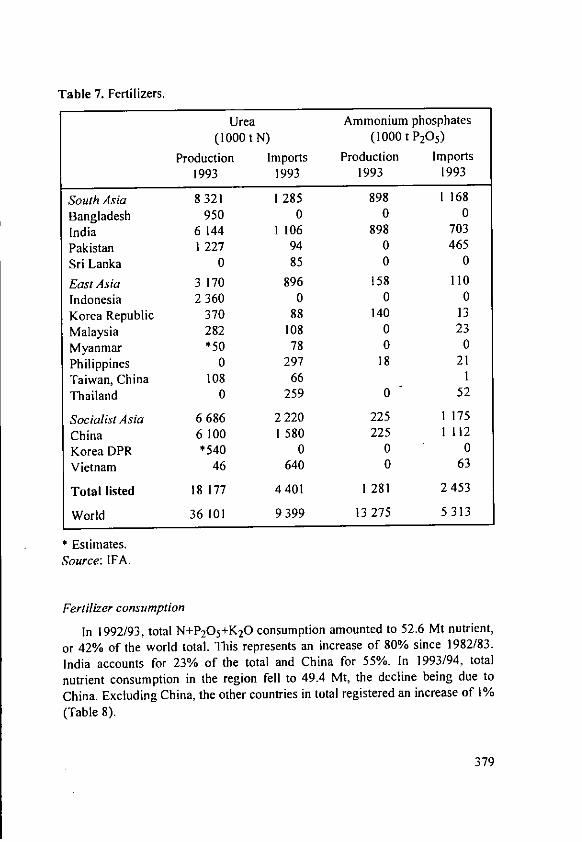
Table 7. Fertilizers.
Urea Ammonium phosphates(1000 t N) (1000 t P20 5)
Production Imports Production Imports1993 1993 1993 1993
South Asia 8321 1 285 898 1 168
Bangladesh 950 0 0 0
India 6 144 1 106 898 703
Pakistan 1 227 94 0 465
Sri Lanka 0 85 0 0
EastAsia 3 170 896 158 110
Indonesia 2 360 0 0 0
Korea Republic 370 88 140 13
Malaysia 282 108 0 23
Myanmar *50 78 0 0
Philippines 0 297 18 21
Taiwan, China 108 66 1
Thailand 0 259 0 52
Socialist Asia 6686 2220 225 1 175
China 6 100 I 580 225 1 112
Korea DPR *540 0 0 0
Vietnam 46 640 0 63
Total listed 18 177 4401 1 281 2453
World 36 101 9399 13 275 5 313
* Estimates.Source: IFA.
Fertilizer consumption
In 1992/93, total N+P 20 5 +K20 consumption amounted to 52.6 Mt nutrient,
or 42% of the world total. This represents an increase of 80% since 1982/83.
India accounts for 23% of the total and China for 55%. In 1993/94, total
nutrient consumption in the region fell to 49.4 Mt, the decline being due to
China. Excluding China, the other countries in total registered an increase of 1%
(Table 8).
379

Table 8. Fertilizer consumption (in 1000 t N+P 205+K2 0).
1982/83 1992/93 1993/94
South Asia 8301 15569 15798Bangladesh 468 I 000 948India 6402 12 155 12365Nepal 31 82 71Pakistan 1 244 2 148 2 200Sri Lanka 156 184 214EaSt Asia 3856 6 734 6935Indonesia 1 531 2 583 2 608Korea Republic 614 964 974Malaysia 443 965 I 015Myanmar 168 69 75Philippines 340 554 634Taiwan, China 393 481 514Thailand 367 1 118 I 115Socialist Asia 17 025 30 258 26 637China 16003 28674 25 100Korea DPR 740 828 789Vietnam 262 733 722Others 20 23 26Total listed 29 182 52 561 49370World 114571 125 796 121 562
Source: IFA.
The rates of use of fertilizers vary considerably between countries. On rice,(Table 9) the rate of use of N+P205+K20 per ha ranges from 64 kg/ha inThailand to 360 kg/ha for the Republic of Korea. There is a close correlation(R2=0.9) between average yield and the average rate of fertilizer use.From these statistics the following issues emerge:
With 51% of the world's population, the region accounts for 26% of theworld's area of arable and permanent crop land. China has 22% of the world'spopulation and 7% of the world's agricultural land. By 2030, there could be 1.5billion more people in the region. The FAO estimates that the number of peoplein the region suffering from chronic malnutrition has declined from 40% to 19%during the past two decades, but this still represents 528 M people. Averageincomes are increasing and a dietary shift from the direct consumption ofcereals to animal products will increase the pressure on grain supplies.
380

Table 9. Fertilizer use on rice (in kg/ha).
N+P 2 05+K2 0 Yield
South AsiaBangladesh 116 2643India 104 2668Pakistan 125 2 381
Sri Lanka 119 2978
East AsiaKorea Republic 360 6 125Malaysia 160 2 846
Philippines 89 2815Thailand 64 1 989
Socialist AsiaChina 245 5 720
Source: FAO/IFA/IFDC.
The area of agricultural land is constant and in certain countries it is falling,
due particularly to urbanization, but also to over-farming. The situation as
regards urbanization is particularly alarming in China. If agricultural production
in the region does not increase there will have to be a massive recourse to food
imports. Regional agricultural production can only increase by raising crop
yields per ha. The improvement of yields involves several factors, not least of
which is mineral fertilizers. The region is dependent on imports for most of its
phosphate requirements and for almost all its potash requirements. The region
has a share of world ammonia and urea capacities in proportion to its population
but the urea import requirement still represents almost half of the world total.
The region's import demand for all these products has a marked impact on
international prices. At present, fertilizer use is tending to stagnate in the region.
2. Short-term constraints
Some of the factors recently affecting fertilizer use in the region are as follows:
In India, fertilizer consumption in 1992/93 fell for the first time in 18 years,by almost 4%, from 12.6 to 12.3 Mt. N consumption in fact increased by 5%,but P consumption declined by 14% and K by 31%. Changes in pricing and
subsidy policies have favoured nitrogen at the expense of the other two
nutrients. In 1993/94 it is estimated that nitrogen consumption increased by 4%
but phosphate use fell again, by 6%, and potash remained at about the same
level as in the previous year.
381
Also in Bangladesh, although in 1993/94 nitrogen consumption increased by3%, phosphate and potash consumption fell, due largely to the withdrawal ofsubsidies from TSP and MOP.
In Pakistan, phosphate consumption in 1993 was affected by a sharp priceincrease following removal of subsidies and higher international prices. Thephosphate trade has been deregulated. However, learning from lessons of thepast, fertilizer price increases have been offset by higher support prices forwheat, cotton and rice.
In Sri Lanka, a 30% subsidy on the retail price of the main fertilizers hasbeen reinstated, after a complete removal of subsidies two or three years ago.Fertilizer consumption has reached record levels. Sri Lanka, like Malaysia, ischaracterized by a substantial proportion of the fertilizer being used on estatecrops, which are benefitting from increased agricultural commodity prices.
In China, at the beginning of 1994, the government largely liberated theprices of fertilizers and agricultural products, causing fertilizer prices to increaseby 15% to 20%. Input prices have increased substantially for the farmer inrecent years. The proportion of subsidized fertilizers declined between 1987 and1993 from 60% to 10%. Farm profit margins have been squeezed as farmproduction prices have remained steady or have fallen compared with the risingprices of consumer goods and farm input prices. In consequence, fertilizerdemand has stagnated and imports have fallen. The falls of imports have notbeen compensated by increased fertilizer production, which has remained ataround 20 Mt nutrient for the past 3 years. The drift of population from ruralareas to towns remains a serious problem.
It is clear that the present stagnation of fertilizer demand in the region is duelargely to government policies concerning prices and subsidies, They are notlong-term constraints. Insufficient or expensive credit is also often identified asa constraint.
3. Long-term constraints
The main long-term constraint is the lack of natural resources of phosphateand potash in the region. There is no "supply push" for these nutrients. Surplusesand shortages of fertilizer materials on the world market result in pricefluctuations and tensions. Excessive price volatility, not steady price increases, isa major obstacle to balanced growth in fertilizer use. The region is particularlyexposed to variations in the international prices of phosphate and potash.
Nitrogen is in a more favourable position as regards supplies, althoughincreased competition from other sectors, such as the petrochemical industryand the energy and domestic fuel sectors is reported.
382
4. Medium-term constraints
4.1. Distribution
As the example of Bangladesh illustrates, the privatization of a bureaucraticdistribution system can increase its efficiency. Due to competition, fertilizerprices are not higher than they were when there was a 30% subsidy. There areso many factors involved in distribution that a centrally planned system is
unlikely to be efficient. However, experience shows that privatization must beaccompanied by regulations to protect farmers, especially illiterate farmers,against adulterated products and short weight, and to ensure that small farmers,and those in remote areas, have access to fertilizer supplies at reasonable prices.
4.2. Quality
The quality of the fertilizer is very important. The storage and applicationproperties of good quality, even granules are well documented. Ammoniumbicarbonate, of which very large quantities are still used in China, is a very
inefficient fertilizer in that a substantial proportion of the nitrogen content is lostby volatilization before it reaches the plant. Good quality compound fertilizers,designed for particular crop and soil conditions can help considerably to ensurebalanced fertilization.
4.3. Nutrient management
The easier availability of nitrogen favours its use. This factor is reinforcedby farmer preference for nitrogen, whose impact on the crop yield occurs in the
year during which it is applied, unlike that of the other nutrients. Evidently, the
higher yields resulting from nitrogen application remove correspondingly larger
quantities of the other nutrients, and if these are not replaced, soil
impoverishment is inevitable.Work at the International Rice Research Institute, IRRI, in the Philippines,
showed that while application of adequate N increased the paddy yield 2.9 times
(from 3.4 to 9.8 t/ha) it also resulted in the removal of 2.6 times more P, 3.7
times more K and 4.6 times more S compared with an unfertilized plot.Fertilizer rates in the region are generally well below the rates recommended
on the basis of soil analysis and field experiments. Soil depletion of nutrients is
widespread.While this is the case, the crop response to additional fertilizer applications
is declining much more than might be expected from the diminishing returns of
the fertilizer response curve. Agronomic research proves irrefutably the benefits
of correct fertilization at much higher levels than those which prevail today.
383

Work in Pakistan has demonstrated the very large gap between average cropyields and potential yields.
It seems, therefore, that the main problem at present is not indiscriminatelyto increase the quantity of fertilizer used, but to increase fertilizer use moreselectively. It is, in fact, a question of overall plant nutrient management, fromwhatever source. More than that, it is a question of all the other factors whichform part of good farming practice.
Constraints to good nutrient managementAccording to FADINAP, the following factors, not necessarily in order of
importance, are the major constraints to balanced fertilization in Asiandeveloping countries:
" Lack of knowledge on fertilizer use." Price ratios not favourable for maintenance and improvement of soil fertility
in the long term (N in relation to P and K)." Required fertilizers not available." Advisory services in many countries practically non-existent.* Lack of information on the diversity of fertilizer products available." Inability to mix fertilizers in the correct proportions." Lack of data on plant nutrient pools." Improper and/or inadequate data on soil fertility." Uneven application of fertilizers, particularly straight fertilizers." Farmers' expectation of immediate economic benefit when applying
something new, therefore incentives should be involved to promote balancedfertilization.
In September 1992, FADINAP and 1FA drafted a leaflet entitled "Guidelineson best agricultural practices to optimize fertilizer use in Asia and the Pacific".The objectives of these guidelines are:" To explain how mineral fertilizers satisfy plant nutrient requirements by
complementing the nutrient availability of soils, restoring and enhancing soilfertility, and to explain how losses throughout the nutrient cycles can belimited.
" To promote economic crop production through the integration of sustainableagricultural practices and environmental protection.
* To create public awareness apd to provide planners and policy-makers with asound understanding of the role of fertilizers in sustainable crop production.
384

Attention was drawn to the importance of correct timing and application anduse of the appropriate type of fertilizer, and in particular to the need to matchthe supply of plant nutrients, from whatever source, to crop uptake and losses.Facilities for testing the nutrient status of soils and plants must evidently beavailable. Good-quality compound fertilizers appropriate to the soil and cropconditions help to ensure balanced fertilization.
4.4. Research
The situation of the CGIAR is indicative of the general complacency asregards agricultural research. The CGIAR is the Consultative Group on Interna-tional Agricultural Research, established in 1972 by the World Bank, UNDPand the FAO to finance and manage a network of International AgriculturalResearch Centers. It now supports 15 centres. Funds for agricultural researchhave declined in recent years, with cuts in aid from Western countries. Fundingdeclined by 21% in 1993. Many programmes have been cut back. Fortunately,after fervent pleas as regards the precariousness of the food situation, the WorldBank offered extra funds this year.
The CGIAR institutes located in the Asian region covered by this paper arethe International Crops Research Institute for the Semi-Arid Tropics (ICRISAT),India, the International Rice Research Institute (IRRI) in the Philippines and theInternational Irrigation Management Institute (IMII), Sri Lanka. The Centre forInternational Forestry Research (CIFOR) is located in Indonesia and theInternational Centre for Living Aquatic Resource Management (ICLARM) inthe Philippines.
IRRI has warned that the present high-yielding rice varieties developed inthe 1960s are unlikely to yield more. Rice output will have to increase by 70%during the next 25 years to keep up with demand, on less land, using less water.Irrigated rice lands are showing signs of fatigue.
There is still much to be learned about the behaviour of nutrients in soils andplants. There is great scope for improving the efficiency of nutrient use by theplants. In Pakistan, for example, it is estimated that the overall fertilizer-useefficiency at present is 40% for N, 20% for P, 60% for K.
4.5. Communication
The need to improve and communicate knowledge on good agriculturalpractices evidently involves many factors in addition to fertilizers. Fertilizerscannot be dealt with in isolation. The communication of all this informationrequires effective advisory services. General exhortations have little impact onthe farmer.
385

Advice must be specific to the individual farmer's conditions if it is to be
effective. It must involve the whole farming system. It must be consistent i.e.the same advice must be given by all concerned.The resources required to implement such a programme can be imagined.
FADINAP has stated that advisory services in the region are often most
unsatisfactory. It is evidently not easy to persuade farmers or anyone else to
adopt practices whose value is not evident. This is universally true; it is, for
example, the case in West Europe regarding certain environmental protection
measures. Incentives may be required to persuade farmers to adopt balanced
fertilization practices.
5. Conclusion
Taking account of the factors mentioned in this paper, it seems evident that
the major constraint to fertilizer use, especially effective fertilizer use, is
knowledge. This is the case throughout the chain, from the discovery of new
knowledge by research, through the communication of this new knowledge, and
of existing knowledge which is under-utilized. The target is not only to the
farmer but also the policy maker and the general public. Research is expensive,the communication of knowledge even more so. Also the technical means which
permit the application of the knowledge, such as soil and plant testing facilities,must be provided.
The solution of the problem of establishing a sustainable, productive
agriculture in Asia requires resources which far exceed the possibilities of the
fertilizer industry. Nevertheless, it is appropriate that the fertilizer industry,
which prides itself on its sense of responsibility, should participate in the
promotion of good nutrient management. It is not sufficient to rely solely on
governments to perform this task. The International Potash Institute, the Potash
and Phosphate Institute and the World Phosphate Institute have international
programmes, and indeed this is their role. However, with some notable
exceptions, in India for example, national fertilizer industries in the region
could do more to promote the correct use of their products, in the widest sense,
To revert to the title of the paper, the opportunity for increased fertilizer use
in the region is provided by the need to improve unit agricultural yields. It is not
just an "opportunity for profit", it is a necessity. But an indiscriminate increase
is not called for. The opportunity is for well used, good quality products,applied in an overall context of improved agricultural management practices.
The major constraint is knowledge and the communication of that knowledge.
386
Constraints and Opportunities for Fertilizer Use inCambodia
Mak SoeunMinistry of Agriculture, Agronomy Dept., Phnom Penh, Cambodia
Summary
A succinct description of agricultural conditions and the history ofagricultural development in Cambodia over the past 40 years is followed by anoutline of the problems faced today, which have arisen through disruption bywar and political isolation. As concerns the part which fertilizer has to play inreviving and improving agricultural production, severe problems are lack oftechnical experience and paucity of experimental data. There are difficulties inimproving the distribution of fertilizer to farmers occasioned by the poor stateof the infrastructure. Current fertilizer recommendations are reviewed.
I. Introduction
Before 1970, some 3 (2.8-3.2) million ha were under cultivation in Cambodiawith rice grown on 2.5 million ha; the country was then an important exporter ofgrain. But, as result of war and political isolation, the cultivated area, especiallythat in rice, declined to about 1.6 mio ha at which level it remains to this day.
Food production is mainly concentrated around the Beung Tonle Sap andthe upper Mekong delta. The tropical climate has distinct wet and dry seasons,the rains commencing in late April or early May and continuing up toNovember. Annual rainfall in mountain areas is 3700 mm and in the central area1300. Day temperature varies between 21 and 35°C; relative humidity is highthroughout the year. Evaporation peaks in March-April just before the rainsbreak. Winds are moderate except for strong gusts preceding the rains (Table 1).
Cambodian farmers traditionally used only organic manures though, for thehighest yielding crops and vegetables some Ammophos (16-20-0), urea and15-15-15 or 18-46-0 compounds were used.
2. Soils
Parent materials of Cambodian soils are acid or basic rocks and colluvialdeposits derived from either or both of these. Recent and ancient alluvialmaterials have low pH and are poorly buffered, with low CEC and are low inavailable P; they are very low in organic matter so that much of the farmingland is infertile (Table 2).
387

Table i. Meteorological data. Pochentong, Phnom Penh, Cambodia (Prek Thnot Pioneer Agricultural Project Report).
Jan Feb Mar Apr May Jun Jul Aug Sep Oct Nov Dec Mean
Precipitation (mm) 5 6 28 70 143 145 145 147 230 255 130 39 1343averaged over 56 years
Aver. number of rainy 1 1 3 6 14 15 16 17 20 18 9 3 123days>l mm (1911-1968)
Temperature (0C)(1950-1969)
Maximum 31 33 35 36 35 34 33 32 31 30 30 30 33
Minimum 21 22 24 25 25 25 24 24 24 24 23 21 23
Relative humidity (%) 77 70 77 78 81 81 82 83 86 85 79 78 80Mean max. (1957-1969)
Relative humidity (%) 63 60 56 59 68 72 76 75 81 80 70 66 69Mean min. (1957-1969)
Evaporation (mm) 197 208 262 253 224 188 144 152 126 132 159 182 2227Mean (1963-1970)
Max. wind velocity 19 17 17 27 23 19 31 23 29 19 29 23 23km/hr (1951-1963)
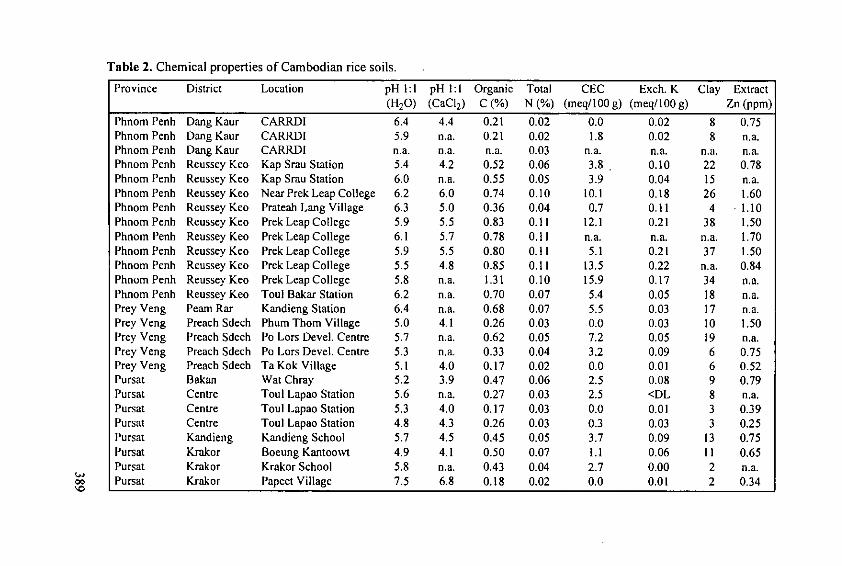
Table 2. Chemical properties of Cambodian rice soils.
Province District Location pH 1:1 pH 1:1 Organic Total CEC Exch. K Clay Extract(H20) (CaCl2) C (%) N (%) (meq/100g) (meq/100g) Zn (ppm)
Phnom Penh Dang Kaur CARRDI 6.4 4.4 0.21 0.02 0.0 0.02 8 0.75Phnom Penh Dang Kaur CARRDI 5.9 n.a. 0.21 0.02 1.8 0.02 8 n.a.Phnom Penh Dang Kaur CARRDI n.a. n.a. n.a. 0.03 n.a. n.a. n.a. n.a.Phnom Penh Reussey Keo Kap Srau Station 5.4 4.2 0.52 0.06 3.8 0.10 22 0.78Phnom Penh Reussey Keo Kap Srau Station 6.0 n.a. 0.55 0.05 3.9 0.04 15 n.a.Phnom Penh Reussey Keo Near Prek Leap College 6.2 6.0 0.74 0.10 10.1 0.18 26 1.60Phnom Penh Reussey Keo Prateah Lang Village 6.3 5.0 0.36 0.04 0.7 0.11 4 . 1.10Phnom Penh Reussey Keo Prek Leap College 5.9 5.5 0.83 0.11 12.1 0.21 38 1.50Phnom Penh Reussey Keo Prek Leap College 6.1 5.7 0.78 0.11 n.a. n.a. n.a. 1.70Phnom Penh Reussey Keo Prek Leap College 5.9 5.5 0.80 0.11 5.1 0.21 37 1.50Phnom Penh Reussey Keo Prek Leap College 5.5 4.8 0.85 0.11 13.5 0.22 n.a. 0.84Phnom Penh Reussey Keo Prek Leap College 5.8 n.a. 1.31 0.10 15.9 0.17 34 na.Phnom Penh Reussey Keo Toul Bakar Station 6.2 n.a. 0.70 0.07 5.4 0.05 18 n.a.Prey Veng Peam Rar Kandieng Station 6.4 n.a. 0.68 0.07 5.5 0.03 17 n.a.Prey Veng Preach Sdech Phum Thorn Village 5.0 4.1 0.26 0.03 0.0 0.03 10 1.50Prey Veng Preach Sdech Po Lors Devel. Centre 5.7 n.a. 0.62 0.05 7.2 0.05 19 n.a.Prey Veng Preach Sdech Po Lors Devel. Centre 5.3 n.a. 0.33 0.04 3.2 0.09 6 0.75Prey Veng Preach Sdech Ta Kok Village 5.1 4.0 0.17 0.02 0.0 0.01 6 0.52Pursat Bakan War Chray 5.2 3.9 0.47 0.06 2.5 0.08 9 0.79Pursat Centre Toul Lapao Station 5.6 n.a. 0.27 0.03 2.5 <DL 8 na.Pursat Centre Toul Lapao Station 5.3 4.0 0.17 0.03 0.0 0.01 3 0.39Pursat Centre Toul Lapao Station 4.8 4.3 0.26 0.03 0.3 0.03 3 0.25Pursat Kandieng Kandieng School 5.7 4.5 0.45 0.05 3.7 0.09 13 0.75Pursat Krakor Boeung Kantoowt 4.9 4.1 0.50 0.07 1.1 0.06 11 0.65Pursat Krakor Krakor School 5.8 n.a. 0.43 0.04 2.7 0.00 2 n.a.Pursat Krakor Papeet Village 7.5 6.8 0.18 0.02 0.0 0.01 2 0.34
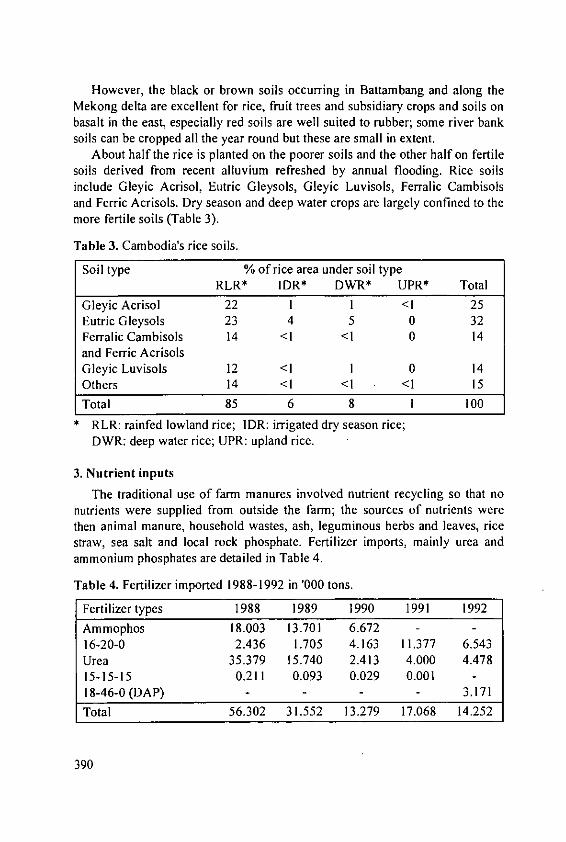
However, the black or brown soils occurring in Battambang and along theMekong delta are excellent for rice, fruit trees and subsidiary crops and soils onbasalt in the east, especially red soils are well suited to rubber; some river banksoils can be cropped all the year round but these are small in extent.
About half the rice is planted on the poorer soils and the other half on fertilesoils derived from recent alluvium refreshed by annual flooding. Rice soilsinclude Gleyic Acrisol, Eutric Gleysols, Gleyic Luvisols, Ferralic Cambisolsand Ferric Acrisols. Dry season and deep water crops are largely confined to themore fertile soils (Table 3).
Table 3. Cambodia's rice soils.
Soil type % of rice area under soil typeRLR* IDR* DWR* UPR* Total
Gleyic Acrisol 22 1 1 <1 25Eutric Gleysols 23 4 5 0 32Ferralic Cambisols 14 <1 <1 0 14and Ferric AcrisolsGleyic Luvisols 12 <1 1 0 14Others 14 <1 <1 <1 15
Total 85 6 8 I 100RLR: rainfed lowland rice; 1DR: irrigated dry season rice;
DWR: deep water rice; UPR: upland rice.
3. Nutrient inputs
The traditional use of farm manures involved nutrient recycling so that nonutrients were supplied from outside the farm; the sources of nutrients werethen animal manure, household wastes, ash, leguminous herbs and leaves, ricestraw, sea salt and local rock phosphate. Fertilizer imports, mainly urea andammonium phosphates are detailed in Table 4.
Table 4. Fertilizer imported 1988-1992 in '000 tons.
Fertilizer types 1988 1989 1990 1991 1992
Ammophos 18.003 13.701 6.672 - -
16-20-0 2.436 1.705 4.163 11.377 6.543Urea 35.379 15.740 2.413 4.000 4.47815-15-15 0.211 0.093 0.029 0.001 -
18-46-0 (DAP) - - - - 3.171
Total 56.302 31.552 13.279 17.068 14.252
390
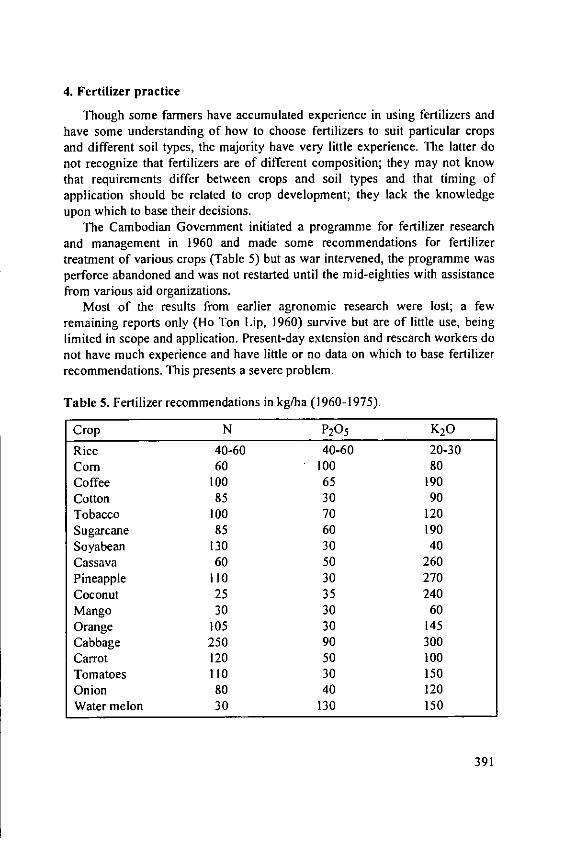
4. Fertilizer practice
Though some farmers have accumulated experience in using fertilizers andhave some understanding of how to choose fertilizers to suit particular cropsand different soil types, the majority have very little experience. The latter donot recognize that fertilizers are of different composition; they may not knowthat requirements differ between crops and soil types and that timing ofapplication should be related to crop development; they lack the knowledgeupon which to base their decisions.
The Cambodian Government initiated a programme for fertilizer researchand management in 1960 and made some recommendations for fertilizertreatment of various crops (Table 5) but as war intervened, the programme wasperforce abandoned and was not restarted until the mid-eighties with assistancefrom various aid organizations.
Most of the results from earlier agronomic research were lost; a fewremaining reports only (Ho Ton Lip, 1960) survive but are of little use, beinglimited in scope and application. Present-day extension and research workers donot have much experience and have little or no data on which to base fertilizerrecommendations. This presents a severe problem.
Table 5. Fertilizer recommendations in kg/ha (1960-1975).
Crop N P20 5 K20
Rice 40-60 40-60 20-30Corn 60 100 80Coffee 100 65 190Cotton 85 30 90Tobacco 100 70 120Sugarcane 85 60 190Soyabean 130 30 40Cassava 60 50 260Pineapple 110 30 270
Coconut 25 35 240Mango 30 30 60
Orange 105 30 145Cabbage 250 90 300Carrot 120 50 100Tomatoes 110 30 150Onion 80 40 120Water melon 30 130 150
391

5. Infrastructure
When it comes to arranging proper distribution of fertilizer to the users, andequally to the evacuation of farm produce, the infrastructure is quite inadequate.Road and rail services have been disrupted and there is a lack of storagefacilities. Frequently, imported fertilizers arrive in the country too late in theseason to allow timely application. They then have to be stored for use in thefollowing season, but poor storage means that they are in bad condition whenthe next season comes round and losses are considerable. Farmers oftencomplain that the fertilizer they bought was no good or, worse, that it damagedtheir crops. Again year to year variation in climate means that there is a lack ofcertainty as to the time they are required so demand is variable. The distributionsystem must be improved if these difficulties are to be overcome.
However, with the return to a market economy, there has been improvementin the supply situation and increased use of inputs has been a factor in raisingyields and agricultural production.
The import and distribution of fertilizers has until recently been entirely inthe hands of the public sector and was relatively inefficient. For instance, some30 000 t fertilizer intended for the 1993 season is still in store due to latedelivery. Though private traders are now taking over distribution to the farmer,they are hampered in their work by uncertainty as to quality of the fertilizer. Inthe early eighties, distribution to farmers was free, later on credit.
Up to 1990, fertilizers were supplied through aid from the eastern bloc, mainlyfrom the Soviet Union. Imports peaked at 56 000 t in 1988, then fell to 14000 in1992. In 1993, 36 000 t was imported through various aid programmes and, at thesame time, substantial amounts were imported and distributed by the privatesector which has grown considerably over the past two years. The private compa-nies dispatch supplies to shops in rural areas as soon as they arrive in the port.
6. Problems and fertilizer policy
There can be no doubt that the use of fertilizer, together with new cropvarieties, irrigation and improved management has been the driving force behindthe growth in food production in S.E. Asia over the past 25 years. Nevertheless,incorrect usage, through lack of knowledge, as is the rule in Cambodia, canresult in reduced yields with financial loss and damage to the environment.
In comparison with other countries of the region, fertilizer usage inCambodia is low. Annual usage has varied between zero and 8000 t over theperiod 1965 to 1990 (Ang6, 1993). According to FAO, consumption hasreached 40 000 or more t for the past two years.
392
Government-imported fertilizer is handled by the Ministry of Agriculturewhich allocates a share to each province and arranges delivery accordingly. TheMinistry also fixes selling prices claimed to reflect the CIF price for approval byan inter-ministerial committee on which the Ministries of Finance andCommerce are represented. As the exchange rate fluctuates daily, there isalways some uncertainty as to the level at which prices should be set. So long asthe price is fixed below the market price, there is no difficulty but, if, as in1993, the reverse applies, most of the imported fertilizer remains unsold!
7. Fertilizer recommendations
The Department of Agronomy, assisted by FAO, IRRI and otherorganizations is now striving to establish detailed recommendations suited tolocal climatic and hydrological conditions and crop varieties (Table 6). Effortsare being made towards proper integration of fertilizer and organic manures.The combined use of green manure (Sesbania rostrala), cow manure and N andP fertilizers has given very good results with rice, the combination faroutyielding fertilizer alone.
Much attention has been given to the development of systems suited to thehigh risk rainfed areas typical of much of Cambodia. Systems developed inother parts of the world are being adapted to Cambodian conditions and we canbenefit from studying conditions and methods in neighbouring countries. Ouragricultural scientists must participate in regional activities so to learntechniques and gain an impression of world opinion and ideas about fertilizersand management of the environment.
Some approaches to the solution of our problems are:
a) Optimum use of organic manures, especially cow manure and greenmanures.
b) Use of non-nitrogenous fertilizers on green manure crops.c) Integration of fertilizer use and organic manure.d) Improved composting of farm wastes.e) Biennial application of phosphate.I) Improved classification of land capability for adaptation of fertilizer
recommendations and other technologies.g) Expansion of agricultural research.h) Improvement of liaison between research, extension and the farmer.i) Propagation of fertilizer use through field demonstration.
393
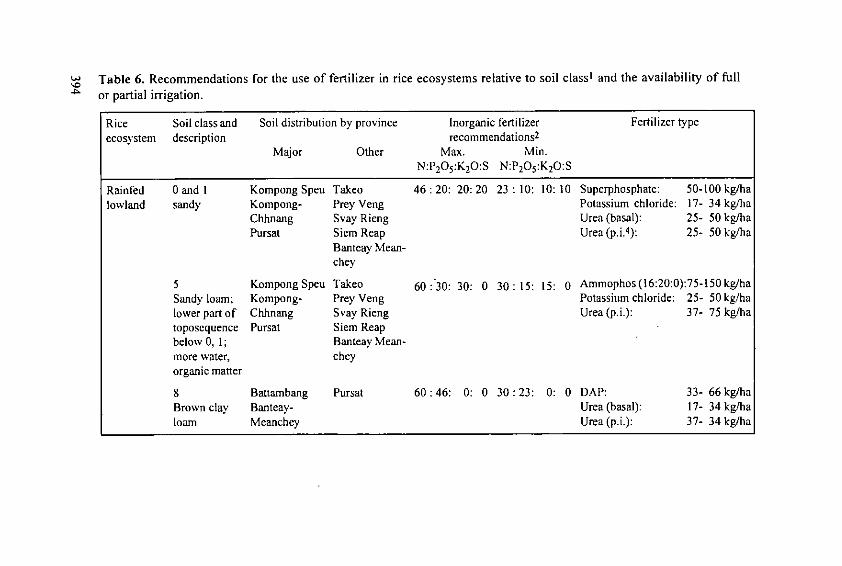
Table 6. Recommendations for the use of fertilizer in rice ecosystems relative to soil class] and the availability of full
or partial irrigation.
Rice Soil class and Soil distribution by province Inorganic fertilizer Fertilizer typeecosystem description recommendations 2
Major Other Max. Min.N:P 205 :K20:S N:P 20 5:K20:S
Rainfed 0 and I Kompong Speu Takeo 46 : 20: 20:20 23 : 10: 10: 10 Superphosphate: 50-100 kg/halowland sandy Kompong- Prey Veng Potassium chloride: 17- 34 kg/ha
Chhnang Svay Rieng Urea (basal): 25- 50 kg/haPursat Siem Reap Urea (p.i.4): 25- 50 kg/ha
Banteay Mean-chey
5 KompongSpeu Takeo 60 :'30: 30: 0 30:15: 15: 0 Ammophos(16:20:0):75-150kg/haSandy loam; Kompong- Prey Veng Potassium chloride: 25- 50kg/halower part of Chhnang Svay Rieng Urea (p.i.): 37- 75 kg/hatoposequence Pursat Siem Reapbelow 0, 1; Banteay Mean-more water, cheyorganic matter
8 Battambang Pursat 60:46: 0: 0 30:23: 0: 0 DAP: 33- 66 kg/haBrown clay Banteay- Urea (basal): 17- 34 kg/haloam Meanchey Urea (p.i.): 37- 34 kg/ha
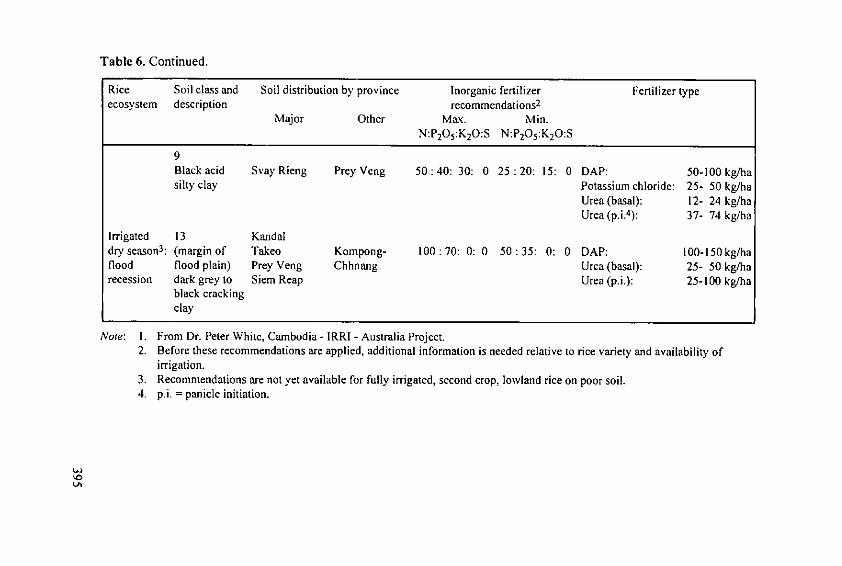
Table 6. Continued.
Rice Soil class and Soil distribution by province Inorganic fertilizer Fertilizer typeecosystem description recommendations 2
Major Other Max. Min.
N:P 205 :K20:S N:P 2O5 :K20:S
9Black acid Svay Rieng Prey Veng 50:40: 30: 0 25 :20: 15: 0 DAP: 50-100 kg/hasilty clay Potassium chloride: 25- 50 kg/ha
Urea (basal): 12- 24 kg/haUrea (p.i.4): 37- 74 kg/ha
Irrigated 13 Kandaldry season 3: (margin of Takeo Kompong- 100 : 70: 0: 0 50 : 35: 0: 0 DAP: 100-150kg/haflood flood plain) Prey Veng Chhnang Urea (basal): 25- 50 kg/harecession dark grey to Siem Reap Urea (p.i.): 25-100 kg/ha
black crackingclay
Note: 1. From Dr. Peter White, Cambodia - IRRI - Australia Project.2. Before these recommendations are applied, additional information is needed relative to rice variety and availability of
irrigation.3. Recommendations are not yet available for fully irrigated, second crop, lowland rice on poor soil.4. p.i. = panicle initiation.
'C,
8. The future
Improvement of Cambodian agriculture demands close cooperation betweenfarmer, research and extension workers if the best is to be made of the humanand physical resources of the country. General recommendations issued by theDepartment of Agriculture have to be tested and adapted to suit localconditions. Most important of all, it is necessary to train and establish anefficient agricultural extension service to work in cooperation with the farmers.
References
Angd, A.L. (1993): Efficiency of mineral fertilizers in rice cropping systems inAsia. IFA-FADINAP Regional Conference for Asia and the Pacific,Bangkok, Thailand.
CIAP (1994): Annual report for 1993, Cambodia-IRRI-Australia Project,Phnom Penh, Cambodia.
Kirijgisman, D.W. (1976): Programme Engrais de ]a FAO, Rapport au Gouver-nement du Cambodge sur le programme engrais, Rome, Italy.
Ho Ton Lip: Compte-rendu des essais de fumure du riz 1960-1965, PhnomPenh, Cambodge.
Mak Soeun and Nesbilt, G. (1993): Rice based farming systems. Research inCambodia, Phnom Penh, Cambodia.
White, P. (1994): Fertilizer use in Cambodia. Phnom Penh, Cambodia.
396
Balanced Fertilization and the SustainableDevelopment of China's Agriculture
J.C. XieInstitute of Soil Science, Academia Sinica, Nanjing, PR. China
Summary
The fertilizer industry has developed rapidly over the past 40 years and hascontributed to substantial improvement in agricultural production - from 164million t grain in 1952 to 456 million in 1993. China has a large and growingpopulation but little reserve of cultivable land; attainment of maximumsustainable yield per unit area is essential to meet the food needs of the growingpopulation and by the year 2000, the problems to be faced will be severe.
Various nutrient deficiencies are encountered on Chinese soils andexperiments have demonstrated that balanced fertilization can render these soilsmore productive. At present, the greater part of fertilizer is used on the mostintensively farmed areas; it is necessary to extend its use more widely over thewhole country. Present usage is unbalanced (N:P 2 0 5:K20 ratio 1:0.3:0.1), asituation which needs correction. The fertilizer industry should make availablemore and a wider range of materials, including higher analysis primary productsand compound fertilizers or blends to suit regional requirements. Research isneeded to evolve site-specific recommendations and agricultural extensionservices must be expanded.
I. Outline of production and use of chemical fertilizers
During the past four decades, China has made great progress in fertilizerproduction. In 1949, only 6,000 ton chemical fertilizers were produced but, by1993, output reached 19.573 million ton, ranking second only to the USA whilenitrogen fertilizer production at 15.28 million t N was highest in the world.Production of P and K fertilizer was 4.17 million t P20 5 and 0.12 million t K20,respectively. From 1978 to 1993, growth in fertilizer production averaged 5.2%per year. However, despite the great achievements of China's chemical industry,fertilizer production cannot yet meet the needs of our agricultural developmentand much remains to be done to increase production, improve quality andproduction technology and to widen the choice of fertilizer materials. There arestill some problems to be faced touching the use of fertilizers (Huang, 1994).
397
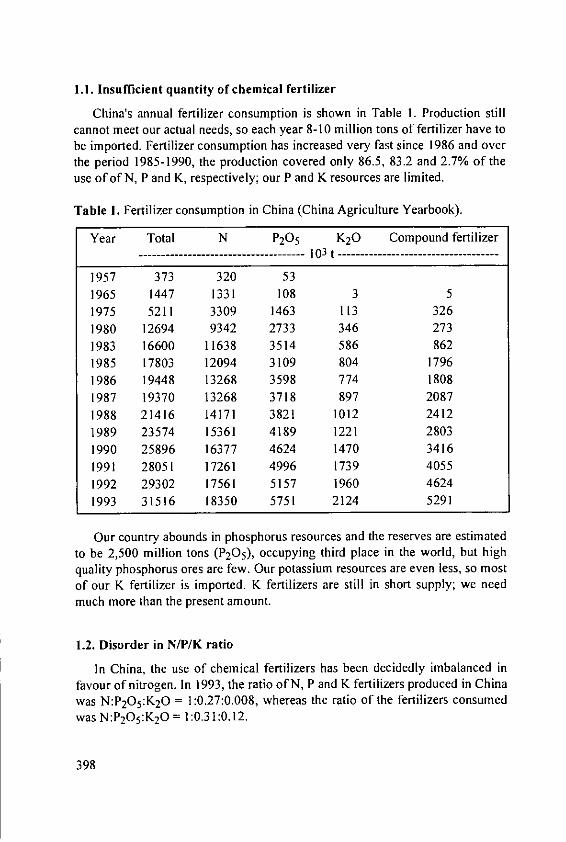
1.1. Insufficient quantity of chemical fertilizer
China's annual fertilizer consumption is shown in Table 1. Production stillcannot meet our actual needs, so each year 8-10 million tons of fertilizer have tobe imported. Fertilizer consumption has increased very fast since 1986 and overthe period 1985-1990, the production covered only 86.5, 83.2 and 2.7% of theuse of of N, P and K, respectively; our P and K resources are limited.
Table I. Fertilizer consumption in China (China Agriculture Yearbook).
Year Total N P20 5 K20 Compound fertilizer--------------------------------- 103t -----------------------------------
1957 373 320 53
1965 1447 1331 108 3 5
1975 5211 3309 1463 113 326
1980 12694 9342 2733 346 273
1983 16600 11638 3514 586 862
1985 17803 12094 3109 804 1796
1986 19448 13268 3598 774 1808
1987 19370 13268 3718 897 2087
1988 21416 14171 3821 1012 2412
1989 23574 15361 4189 1221 2803
1990 25896 16377 4624 1470 3416
1991 28051 17261 4996 1739 4055
1992 29302 17561 5157 1960 4624
1993 31516 18350 5751 2124 5291
Our country abounds in phosphorus resources and the reserves are estimatedto be 2,500 million tons (P20 5), occupying third place in the world, but highquality phosphorus ores are few. Our potassium resources are even less, so mostof our K fertilizer is imported. K fertilizers are still in short supply; we needmuch more than the present amount.
1.2. Disorder in N/P/K ratio
In China, the use of chemical fertilizers has been decidedly imbalanced infavour of nitrogen. In 1993, the ratio of N, P and K fertilizers produced in Chinawas N:P2 0 5 :K20 = 1:0.27:0.008, whereas the ratio of the fertilizers consumedwas N:P 2 05 :K2 0 1:0.31:0.12.
398

Although the balance has shifted somewhat in favour of P and K in recentyears (Table 2), we still have a long way to go in this respect, compared withsome countries (Table 3). Therefore, we should lay stress on the increase of Pand K fertilizers (especially K fertilizer) while further augmenting the totalamount of fertilizers used.
Table 2. Ratio of N, P and K fertilizers consumed in China (China AgricultureYearbook).
Year N P20 5 K20
1965 1 0.08 0.001970 1 0.44 0.031980 1 0.29 0.041983 1 0.30 0.051985 1 0.26 0.071986 1 0.27 0.061987 1 0.28 0.071988 1 0.27 0.071989 1 0.27 0.081990 1 0.28 0.091991 1 0.29 0.101992 1 0.29 0.111993 I 0.31 0.12
Table 3. Ratio of N, P and K fertilizers in some countries (1990/1991) (Xie, 1994).
Country N P20 5 K20
China 1 0.30 0.09USA 1 0.37 0.45Russia 1 0.89 0.58India 1 0.40 0.17France 1 0.54 0.74Japan I 1.13 0.88Developed countries I 0.56 0.49Developing countries 1 0.38 0.17World I 0.47 0.32
399
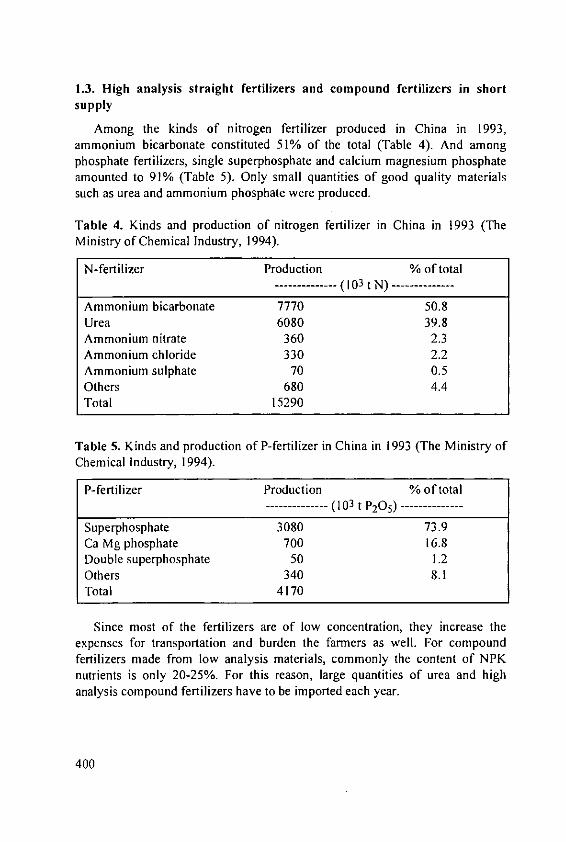
1.3. High analysis straight fertilizers and compound fertilizers in shortsupply
Among the kinds of nitrogen fertilizer produced in China in 1993,ammonium bicarbonate constituted 51% of the total (Table 4). And amongphosphate fertilizers, single superphosphate and calcium magnesium phosphateamounted to 91% (Table 5). Only small quantities of good quality materialssuch as urea and ammonium phosphate were produced.
Table 4. Kinds and production of nitrogen fertilizer in China in 1993 (TheMinistry of Chemical Industry, 1994).
N-fertilizer Production % of total----- -------------- -(103 t N)--------
Ammonium bicarbonate 7770 50.8Urea 6080 39.8Ammonium nitrate 360 2.3Ammonium chloride 330 2.2Ammonium sulphate 70 0.5Others 680 4.4Total 15290
Table 5. Kinds and production of P-fertilizer in China in 1993 (The Ministry ofChemical Industry, 1994).
P-fertilizer Production % of total-- ------------ (103 t P20 5)--------
Superphosphate 3080 73.9Ca Mg phosphate 700 16.8Double superphosphate 50 1.2Others 340 8.1Total 4170
Since most of the fertilizers are of low concentration, they increase theexpenses for transportation and burden the farmers as well. For compoundfertilizers made from low analysis materials, commonly the content of NPKnutrients is only 20-25%. For this reason, large quantities of urea and highanalysis compound fertilizers have to be imported each year.
400
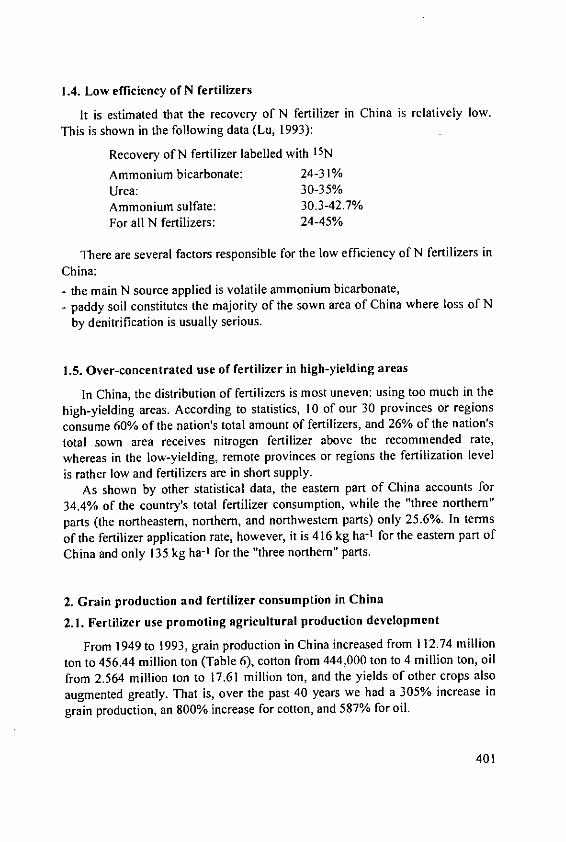
1.4. Low efficiency of N fertilizers
It is estimated that the recovery of N fertilizer in China is relatively low.This is shown in the following data (Lu, 1993):
Recovery of N fertilizer labelled with 15N
Ammonium bicarbonate: 24-31%Urea: 30-35%Ammonium sulfate: 30.3-42.7%For all N fertilizers: 24-45%
There are several factors responsible for the low efficiency of N fertilizers inChina:
- the main N source applied is volatile ammonium bicarbonate,- paddy soil constitutes the majority of the sown area of China where loss of N
by denitrification is usually serious.
1.5. Over-concentrated use of fertilizer in high-yielding areas
In China, the distribution of fertilizers is most uneven: using too much in thehigh-yielding areas. According to statistics, 10 of our 30 provinces or regions
consume 60% of the nation's total amount of fertilizers, and 26% of the nation's
total sown area receives nitrogen fertilizer above the recommended rate,whereas in the low-yielding, remote provinces or regions the fertilization level
is rather low and fertilizers are in short supply.As shown by other statistical data, the eastern part of China accounts for
34.4% of the country's total fertilizer consumption, while the "three northern"
parts (the northeastern, northern, and northwestern parts) only 25.6%. In terms
of the fertilizer application rate, however, it is 416 kg ha-1 for the eastern part of
China and only 135 kg ha-1 for the "three northern" parts.
2. Grain production and fertilizer consumption in China
2.1. Fertilizer use promoting agricultural production development
From 1949 to 1993, grain production in China increased from 112.74 million
ton to 456.44 million ton (Table 6), cotton from 444,000 ton to 4 million ton, oil
from 2.564 million ton to 17.61 million ton, and the yields of other crops also
augmented greatly. That is, over the past 40 years we had a 305% increase in
grain production, an 800% increase for cotton, and 587% for oil.
401
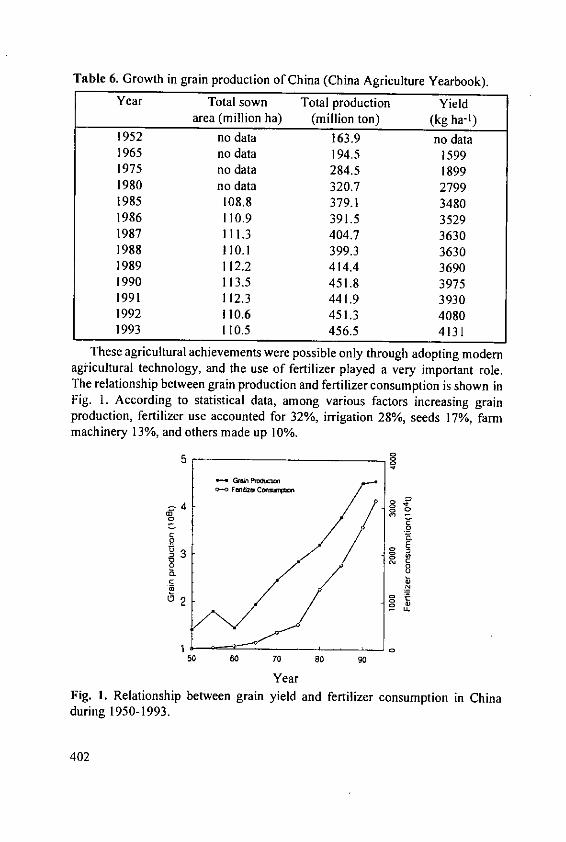
Table 6. Growth in grain production of China (China Agriculture Yearbook).
Year Total sown Total production Yieldarea (million ha) (million ton) (kg ha-')
1952 no data 163.9 no data1965 no data 194.5 15991975 no data 284.5 18991980 no data 320.7 27991985 108.8 379.1 34801986 110.9 391.5 35291987 111.3 404.7 36301988 110.1 399.3 36301989 112.2 414.4 36901990 113.5 451.8 39751991 112.3 441.9 39301992 110.6 451.3 40801993 110.5 456.5 4131
These agricultural achievements were possible only through adopting modemagricultural technology, and the use of fertilizer played a very important role.The relationship between grain production and fertilizer consumption is shown inFig. 1. According to statistical data, among various factors increasing grainproduction, fertilizer use accounted for 32%, irrigation 28%, seeds 17%, farmmachinery 13%, and others made up 10%.
5
3 E
50 60 70 80 90
Year
Fig. 1. Relationship between grain yield and fertilizer consumption in Chinaduring 1950-1993.
402

2.2. Grain production targets and fertilizer demand by the year 2000
China's goals to be met by the year 2000 are: grain production 500 millionton, and cotton 5.25 million ton. The production of other crops will also developcorrespondingly.
Fertilizer use has a key role to play if we are to reach these targets. Estimatesmade a few years ago showed that 80% of K, 40% of P and 30% of N received
by crops derived from organic manures (Lin, 1990). These proportions have
reduced somewhat but the potential nutrients which can be supplied by
recycling amounts to 35.143 million t in total (Table 7).
Table 7. Potential of recycling nutrients from organic materials in China (Lu,1993).
Sources N P20 5 K20 Amount Relative %-------------------- 103 t -------------------
Excreta 12400 4214 7378 23987 68.3
Straw 2499 1499 4998 8996 25.6
Green manure 241 - - 241 0.7
Oil cakes 1264 335 320 1919 5.5
Total 16404 6048 12691 35143 100
In theory, such a quantity is 1.8 times greater than the total output of the
fertilizer industry or 10% higher than total fertilizer consumption in 1993. But
the actual availability of recyclable nutrients to crops is much smaller than that
estimated. 65-84% of straw is directly used as fuel and there are considerable
losses involved in collecting, storing and applying manure (Table 8).
Table 8. Estimated amounts of nutrients to be obtained from organic fertilizer
in the year 2000 (Chen, 1994).
N P20 5 K20 Total------------------------ - 103 t ----------------
Amount input 7594 7686 4089 19369
Amount usable by plants 3609 3973 2245 9827
Amount usable in terms of 24 26 15 65sown area (kg/ha)
403
Even if full use is made of organic manure, an appreciable quantity offertilizer must be applied. According to the target production of grain as well asthe nutrients supplied by organic manure and soil itself, the fertilizer demand inthe year 2000 has been estimated in different ways (Table 9), appearing to benot less than 33 million ton. This would be an arduous task for fertilizerindustries. Assuming that the fertilizer consumption increases at the rate of 4%per year based on 1993 consumption, by the year 2000 the fertilizer demandwould be about 40 million tons. At that time, China's K fertilizer will still haveto be imported (Lin, 1994).
Table 9. The expected demand for chemical fertilizer in China in 2000.
Source Quantity required (103 t) RatioTotal N P20 5 K20 (N:P 20 5:K2 0)
Ministry of 32650 18657 9329 4664 1:0.5:0.25AgricultureMinistry of 36920 22790 9116 5014 0:0.4:0.22Chemical IndustryChinese Academy 35070 21648 8226 5196 1:0.38:0.24of Sciences
Source: Huang (1994); Chen (1994).
2.3. Meeting the challenge of tomorrow
China has a large population and little available arable land. With only 7%of the world's cultivable land, we feed 22% of world population (Wang, 1994).At present, per capita land averages only 0.8 ha (less than 1/3 of world average)and per capita cultivated land only 0.08 ha (0.17 ha in 1949), of world average.Availability of cultivated land is still decreasing by non-agricultural use and bysoil degradation and pollution.
Though grain production has steadily increased year by year since 1978,grain yield per capita is decreasing - from 390 kg in 1990 to 380 kg in 1993;population increases by 15 million per year while the area under crop decreases.Grain production per head should reach 400 kg by the year 2000 compared with500 kg (and often 800-1000) in developed countries.
We lack reserve land. 11.3 million ha could be reclaimed for farming butthis is mainly in remote areas with unfavourable climate and the cost ofreclamation is increasing.
404

It is interesting to speculate as to how many people the land could support. It
can be shown that the land resources could provide for 1.4 to 1.5 billion people(1993 population 1.185 billion). By 2000, we could provide grain for 1.25
billion but, by then, the population would be 1.3 billion and by 2040, the
population would reach 1.6 to 1.7 billion and cultivated land per capita would
be only 0.07 ha. To provide 400 kg grain per head, yield per unit area would
have to be doubled over the next 50 years - some challenge! To make this
possible, it will be necessary to greatly increase fertilizer production and usage.
3. Balanced fertilization is one of the key measures for sustained
agricultural development
3.1. China's agriculture stepping into the stage of balanced fertilization
Unlike European and American countries, the fertilizers first used in China
(in the 1960s) were nitrogenous. P was first used in the seventies and K only in
the eighties. Most Chinese soils are low in N (average for total N 0.13±0.05%(Lu, 1989)) and need N fertilizer to give satisfactory yields. The period of N
cycling is rather short and soil N level changes rapidly. This and the relative
cheapness of N fertilizer have meant that it has always been in the lead.
In China, soils with available phosphorus below 10 mg P kg- 1 occur
throughout the country and P-deficient soils are estimated to make up 1/3-1/2 of
the nation's total cultivated land area (Lu, 1989). With increased use of Nfertilizer and a rise in agricultural production level, P-deficiency became
apparent, and farmers started to use P fertilizer first in the southern and then in
the northern parts of our country.Most K deficient soils are found in S. China where 67% of paddy soils
contain less than 100 ppm available K. Xie et al. (1990) say that slowly
available K extracted by IN HNO 3 is the main source of K for rice and Table 10
makes clear that the K supplying power of S. China soils is relatively low.
Previously, when yield levels were rather low, K supplied in organic manures
sufficed to maintain production at this modest level and no K fertilizer was
used, but in the late seventies, K deficiency became apparent and K fertilizer
began to be used. Recently, there have been more and more reports of need for
K fertilizer in the north.
405
Table 10. K-supplying potential of the major soils in China (Xie et al., 1990).
Grade Slowly avail. K* Major soils(ppm K20)
Very low <80 Latosols and lateritic red earths and theirpaddy soils.
Low 80- 200 Red earths, yellow earths, and their paddysoils.
Moderate- 200- 400 Paddy soils in Taihu-Lake and Zhujiang Riverlow valleys, sandy soils alongside the Changjiang
River.Moderate 400- 600 Alluvial paddy soils in Dongting Lake and
Gan River valleys, yellow-brown earth, sandyfluvo-aquic soil, brown earths.
Moderate- 600- 900 Purplish soils, castanozems, and meadowhigh soils.High 900-1400 Dark brown earths, chemozem, cinnamon
soil, and clayey fluvo-aquic soils.Very high > 1400 Grey desert soil, brown desert soil.
* By I N HNO 3 method.
Up to now, as a result of insufficient input of K fertilizer and the reducedinput of organic manure, the K fertility of soils has been decreasing year afteryear. The balance between K applied to farmlands and K removed by harvestedcrops has been studied in various parts of China (Table 11) and it is seen that allthe farmlands mentioned are in negative K balance.
Table I1. Macroscopic analysis of the balanced potassium status in farmland(Xie el al., 1991).
Area K20 (kg/ha/year)Medium-low yielding area in Fujian -56Area of purplish fluvo-aquic soil around Donting-Lake, -153JiangxiGuizhou -30Hang-Jia-Hu Plain -38Suburbs of Shanghai -71Jiangsu -90Taihu-Lake region -62Jingshan, Hubei (cotton) -66Mean -70
406
Monitoring of soil fertility has shown up a tendency for available soil K to
decrease. In Jiangsu Province, it is falling at 2.3 ppm per year and the extent of
K deficient soil is expanding. 540 000 ha in the province carried cotton in 1994
and K deficiency was noticed to a greater or lesser degree over half of this area.
In addition to macronutrients, micronutrient deficiencies have to some extent
developed in some areas. According to the Nation's Second General Soil Survey,
36.6%, 16.4% and 45.3% of the soils were deficient in available Zn, available B
and available Mo, respectively. Besides, S-deficiencies have occurred in many
soils and Mg-deficiencies have been found in the southern red soils. So at
present, it is important to pay more attention to using fertilizers containing macro-
and micro-nutrients and secondary nutrients in line with local conditions.
3.2. Benefits from balanced fertilization
In the last 20 years, a great number of field experiments on effects of K
fertilizer have been conducted in southern China, and over the past 10 years
balanced fertilization demonstration extension trials have been carried out. The
results obtained are given in Table 12 and Table 13, respectively. As can be
seen from these results, K applied in addition to basal NP can markedly increase
the yield and improve the quality of crops. Particularly, it should be noted that
K fertilizer can increase the ability of plants to withstand any stress, which
contributes greatly to the sustainability of crop yield.
Table 12. Effects of K application on increasing crop yields in balanced
fertilization demonstrations (Janke, 1994).
Crop (No. Fertilizer rate (kg ha-') and ratio Yield (kg ha - 1) Yield increase
of years/No. of N P20 5 K20 (N:P 2 05 :K20) NP NPK kg ha- I %
trial spots)
Rice 137 49 97 (1:0.36:0.71) 6113 7079 963 16
(7/161)Wheat 161 75 96 (1:0.47:0.60) 2929 3949 1020 35
(5/8)Corn 184 70 121 (1:0.38:0.66) 5171 6772 1601 31
(7/80)Cotton 212 60 149 (1:0.28:0.70) 875 1186 311 36
(7/25)Rapeseed 154 71 116 (1:0.46:0.75) 1507 1907 400 27
(6/21)Soybean 36 46 81 (1:0.28:2.25) 1741 2232 491 28
(5/13)
407
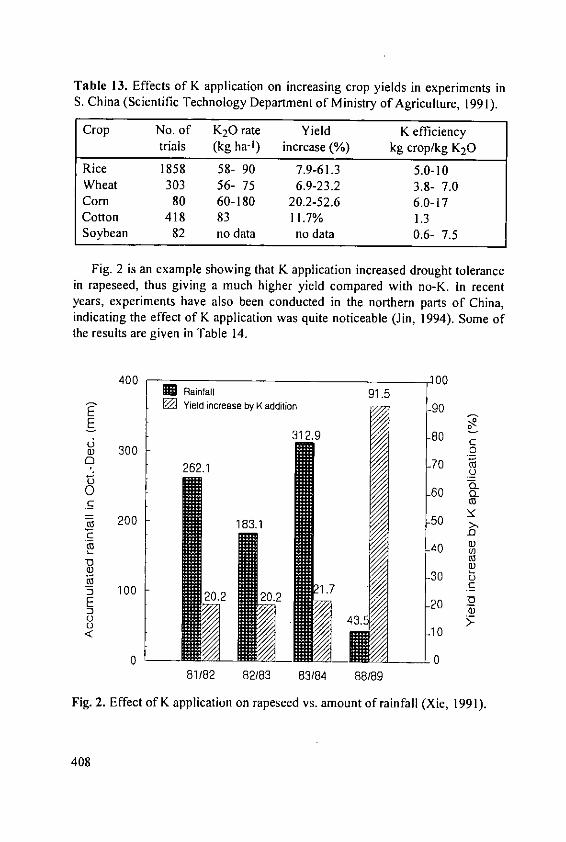
Table 13. Effects of K application on increasing crop yields in experiments inS. China (Scientific Technology Department of Ministry of Agriculture, 1991).
Crop No. of K20 rate Yield K efficiencytrials (kg ha-I) increase (%) kg crop/kg K20
Rice 1858 58- 90 7.9-61.3 5.0-10Wheat 303 56- 75 6.9-23.2 3.8- 7.0Corn 80 60-180 20.2-52.6 6.0-17Cotton 418 83 11.7% 1.3Soybean 82 no data no data 0.6- 7.5
Fig. 2 is an example showing that K application increased drought tolerancein rapeseed, thus giving a much higher yield compared with no-K. In recentyears, experiments have also been conducted in the northern parts of China,indicating the effect of K application was quite noticeable (Jin, 1994). Some ofthe results are given in Table 14.
400 1004 M Rainfall 91.5
Yield increase by K addition90
312.9 -80300 0
,. 262.1 -70
0 .60 CL
to 200 101111.50 >,315
fm 30E a)40
-5 100 1.7 -
< .10
81/82 82/83 83184 88/89
Fig. 2. Effect of K application on rapeseed vs. amount of rainfall (Xie, 1991).
408
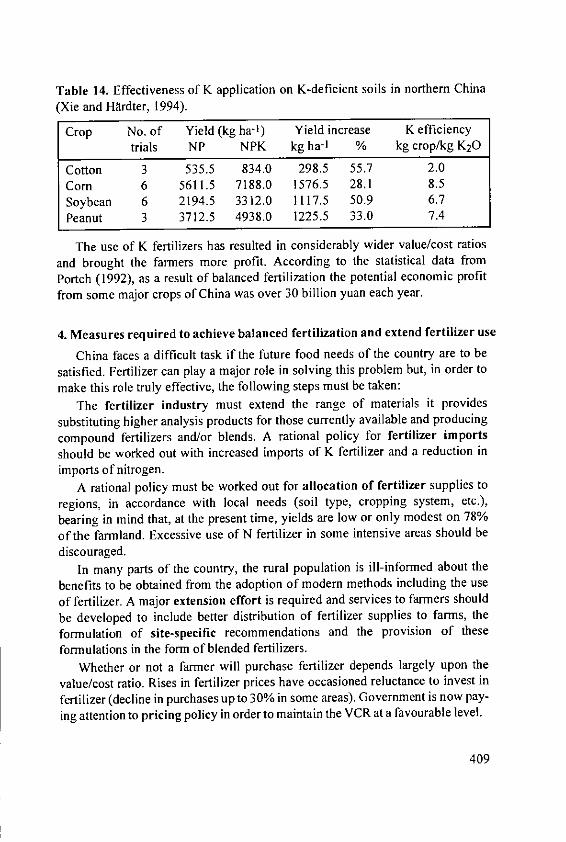
Table 14. Effectiveness of K application on K-deficient soils in northern China(Xie and Hardter, 1994).
Crop No. of Yield (kg ha-1) Yield increase K efficiencytrials NP NPK kg ha-1 % kg crop/kg K20
Cotton 3 535.5 834.0 298.5 55.7 2.0
Corn 6 5611.5 7188.0 1576.5 28.1 8.5Soybean 6 2194.5 3312.0 1117.5 50.9 6.7
Peanut 3 3712.5 4938.0 1225.5 33.0 7.4
The use of K fertilizers has resulted in considerably wider value/cost ratios
and brought the farmers more profit. According to the statistical data from
Portch (1992), as a result of balanced fertilization the potential economic profit
from some major crops of China was over 30 billion yuan each year.
4. Measures required to achieve balanced fertilization and extend fertilizer use
China faces a difficult task if the future food needs of the country are to be
satisfied. Fertilizer can play a major role in solving this problem but, in order to
make this role truly effective, the following steps must be taken:
The fertilizer industry must extend the range of materials it provides
substituting higher analysis products for those currently available and producing
compound fertilizers and/or blends. A rational policy for fertilizer imports
should be worked out with increased imports of K fertilizer and a reduction inimports of nitrogen.
A rational policy must be worked out for allocation of fertilizer supplies to
regions, in accordance with local needs (soil type, cropping system, etc.),
bearing in mind that, at the present time, yields are low or only modest on 78%
of the farmland. Excessive use of N fertilizer in some intensive areas should be
discouraged.In many parts of the country, the rural population is ill-informed about the
benefits to be obtained from the adoption of modern methods including the use
of fertilizer. A major extension effort is required and services to farmers should
be developed to include better distribution of fertilizer supplies to farms, the
formulation of site-specific recommendations and the provision of these
formulations in the form of blended fertilizers.
Whether or not a farmer will purchase fertilizer depends largely upon the
value/cost ratio. Rises in fertilizer prices have occasioned reluctance to invest in
fertilizer (decline in purchases up to 30% in some areas). Government is now pay-
ing attention to pricing policy in order to maintain the VCR at a favourable level.
409
Research should be direci .. improving fertilizer use efficiency, toinvestigating the nutrient needs of specific sites and farming systems, payingattention also to environmental protection.
References
Chen, T.B. (1994): Study on N-P-K consumption ratio of chemical fertilizer inyear 2000. Journal of the Chemical Fertilizer Industry (in Chinese) 2:6-7.
Huang, J.L. (1994): Present situation and development of the chemical fertilizerindustry in China. Journal of the Chemical Fertilizer Industry (in Chinese)1:3-9.
Jin, J.M. (1994): K-deficiency in soils and the developmental trend of Kfertilizer in northern China. In: Soil Potassium and Potassium FertilizerEffectiveness in Northern China. Agricultural Sciences Technology Press,Beijing. pp. 1-5.
Lin, B. and Li, I.K. (1990): China's development of chemical fertilizerefficiency and balanced fertilization in 50 years. Proc. of the InternationalSymposium on Balanced Fertilization, Beijing, China. pp. 47-54.
Lin, Y.T. (1994): Reflection on development of potassium fertilizer industry inChina. Journal of the Chemical Fertilizer Industry 5:13-15.
Lu, R.K. (1989): General status of nutrients (NPK) in soils of China. ActaPedological Sinica 3:286-296.
Lu, R.K. (1993): The production and consumption of chemical fertilizers inChina. Improvement of Soil Fertility. International Foundation for Science.Nanjing, China. pp. 86-92.
Lu, R.K., Shi, Z.Y. and Qian, C.L. (1993): The significance and problems of nu-trients recycling in agriculture of China. Scientia Agricultural Sinica 5:1-6.
Portch, S., Jin, J.Y. and Wu, R.Q. (1992): Maximum yield research: Anindicator for potential yields in China. Proc. 3rd Intern. Symposium onMaximum Yield Research, Beijing, China. pp. 163-172.
Scientific Technology Department of Ministry of Agriculture (1991): Potassiumin Agriculture of Southern China, Agriculture Press, Beijing. pp. 140-257.
Wang, X.J. (1994): A big issue dealing with the nation's existence: The severesituation of China's land resources. Chinese Science News (in Chinese),Sept. 19.
Xie, J.C., Luo, J.X. and Ma, M.T. (1990): Potassium-supplying potential ofdifferent soils and the current potassium balance status in the farmlandecosystem in China. Proc. of the International Symposium on BalancedFertilization, Beijing, China. pp. 97-106.
410
Xie, J.C., Peng, Q.T. and Fan, Q.Z. (1991): Soil potassium fertility and theexpected demand of potassium fertilizer in China. Balanced FertilizerSituation Report - China. Canpotex Limited. pp. 24-34.
Xie, J.C. (1994): Aspects on food and fertilizer in the world. Progress in SoilScience (in Chinese) 3:1-19.
411

Constraints and Opportunities for Fertilizer Use inIndia
S.K. SaxenaDirector (Marketing), The Fertilizer Association of India, 10 Shaheed Jit Singh
Marg, New Delhi-I 10067, India
Abstract
India like any other developing country faces the onslaught of population
growth requiring accelerated pace of foodgrain production. The pragmatic
agricultural policies adopted by India led to the spectacular growth in crop
production. The implementation of fertilizer policy yielded desired results of
foodgrain production. The growth of agriculture and the fertilizer industry in
India has been highlighted. However, after certain policy changes consequent to
the onset of liberalised economy, the fertilizer production and consumption has
received a severe jolt. The fertilizer production, consumption, import and its
consequential impact on NPK ratio and economics of fertilizer use have been
highlighted. The downward trend in fertilizer production and consumption must
be arrested to sustain agricultural productivity.
1. Some facts around us - World and Asia
How to feed the ever growing population has been the main concern of all
the nations in the world, more so in developing nations where the population
growth rate has outstripped all other growth rates. During a span of 32 years
(from 1961 to 1993) world population has gone up from 3.08 billion to 5.57
billion (an increase of 81%) (Table 1).
Table 1. Some relevant facts-World (Various issues of FAO Fertilizer Yearbook).
SI. No. Items Unit 1961 1993 Increase %
1. Total population billion 3.08 5.57 81,02. Fertilizer consumption million tons 28.52 125.93 341.53. Cereal production million tons 969.60 1894.30 95.44. Population dependent on % 44%
agriculture5. Share of agriculture labour to % 45%
total labour6. Land area under cultivation million ha 1434.00 1444.00* 0.7
(total arable land + land underpermanent crop)
for 1992.
413
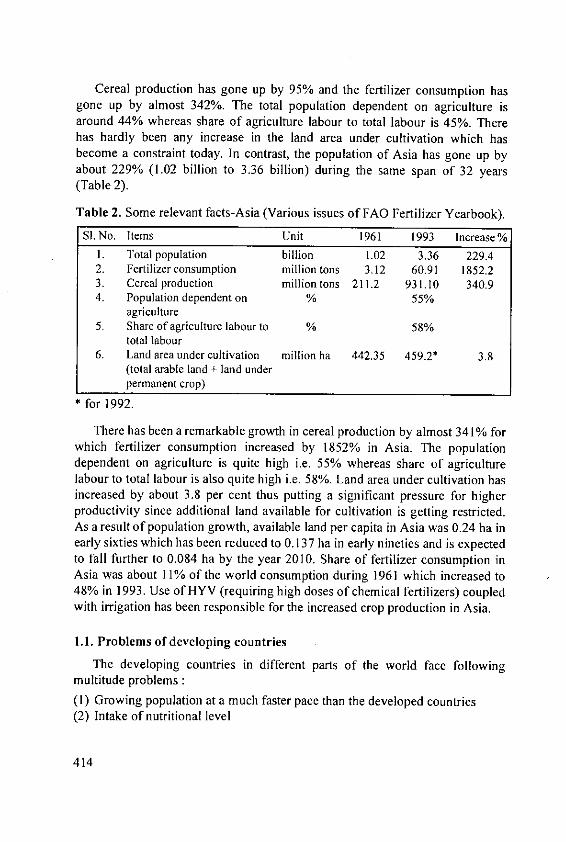
Cereal production has gone up by 95% and the fertilizer consumption hasgone up by almost 342%. The total population dependent on agriculture isaround 44% whereas share of agriculture labour to total labour is 45%. Therehas hardly been any increase in the land area under cultivation which hasbecome a constraint today. In contrast, the population of Asia has gone up byabout 229% (1.02 billion to 3.36 billion) during the same span of 32 years(Table 2).
Table 2. Some relevant facts-Asia (Various issues of FAO Fertilizer Yearbook).
SI. No. Items Unit 1961 1993 Increase %1. Total population billion 1.02 3.36 229.42. Fertilizer consumption million tons 3.12 60.91 1852.23. Cereal production million tons 211.2 931.10 340.94. Population dependent on % 55%
agriculture5. Share of agriculture labour to % 58%
total labour6. Land area under cultivation million ha 442.35 459.2* 3.8
(total arable land + land underpermanent crop)
for 1992.
There has been a remarkable growth in cereal production by almost 341% forwhich fertilizer consumption increased by 1852% in Asia. The populationdependent on agriculture is quite high i.e. 55% whereas share of agriculturelabour to total labour is also quite high i.e. 58%. Land area under cultivation hasincreased by about 3.8 per cent thus putting a significant pressure for higherproductivity since additional land available for cultivation is getting restricted.As a result of population growth, available land per capita in Asia was 0.24 ha inearly sixties which has been reduced to 0.137 ha in early nineties and is expectedto fall further to 0.084 ha by the year 2010. Share of fertilizer consumption inAsia was about 11% of the world consumption during 1961 which increased to48% in 1993. Use of HYV (requiring high doses of chemical fertilizers) coupledwith irrigation has been responsible for the increased crop production in Asia.
1.1. Problems of developing countries
The developing countries in different parts of the world face followingmultitude problems :(1) Growing population at a much faster pace than the developed countries(2) Intake of nutritional level
414
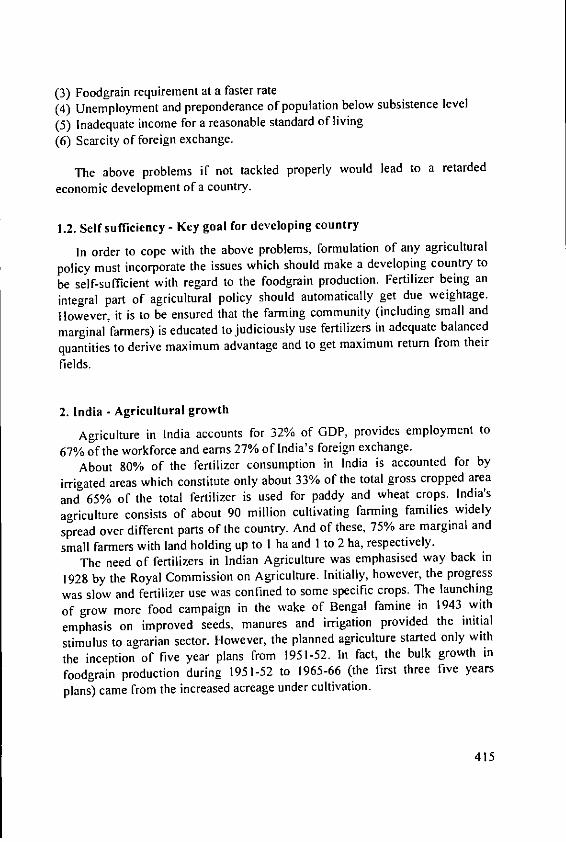
(3) Foodgrain requirement at a faster rate(4) Unemployment and preponderance of population below subsistence level
(5) Inadequate income for a reasonable standard of living(6) Scarcity of foreign exchange.
The above problems if not tackled properly would lead to a retarded
economic development of a country.
1.2. Self sufficiency - Key goal for developing country
In order to cope with the above problems, formulation of any agricultural
policy must incorporate the issues which should make a developing country to
be self-sufficient with regard to the foodgrain production. Fertilizer being an
integral part of agricultural policy should automatically get due weightage.
However, it is to be ensured that the farming community (including small and
marginal farmers) is educated to judiciously use fertilizers in adequate balanced
quantities to derive maximum advantage and to get maximum return from their
fields.
2. India - Agricultural growth
Agriculture in India accounts for 32% of GDP, provides employment to
67% of the workforce and earns 27% of India's foreign exchange.
About 80% of the fertilizer consumption in India is accounted for by
irrigated areas which constitute only about 33% of the total gross cropped area
and 65% of the total fertilizer is used for paddy and wheat crops. India's
agriculture consists of about 90 million cultivating farming families widely
spread over different parts of the country. And of these, 75% are marginal and
small farmers with land holding up to I ha and I to 2 ha, respectively.
The need of fertilizers in Indian Agriculture was emphasised way back in
1928 by the Royal Commission on Agriculture. Initially, however, the progress
was slow and fertilizer use was confined to some specific crops. The launching
of grow more food campaign in the wake of Bengal famine in 1943 with
emphasis on improved seeds, manures and irrigation provided the initial
stimulus to agrarian sector. However, the planned agriculture started only with
the inception of five year plans from 1951-52. In fact, the bulk growth in
foodgrain production during 1951-52 to 1965-66 (the first three five years
plans) came from the increased acreage under cultivation.
415

During this period there was not much emphasis on adoption of betterfarming techniques of which fertilizer use is an essential component. Thesituation became worser during 1965-66 when foodgrain production droppedfrom 89 million tons in 1964-65 to 72 million tons in 1965-66 due to severedrought in the country. The deficit in foodgrains was made through imports atheavy costs and exploitation in international market. This development gavesevere jolt to Indian Agriculture and in fact, proved to be a turning point in thehistory of Indian Agriculture. Therefore, a new agricultural strategy was devisedto take the country along with road to self-sufficiency in agriculture. It wasrealised that desired foodgrain production level could be obtained only throughincreased productivity because of very limited scope of extension of area undercultivation. The Government responded to the need by emphasising on increasein productivity based on use of HYV seeds and arranging all inputs includingfertilizers, irrigation, credit etc. which led the foundation of 'Green Revolution'in India.
Agriculture has been a key sector in our approach to planned economicdevelopment especially in its role to make India "Self-Sufficient" in foodgrainproduction. "Making foodgrains available in adequate quantities and at pricesthe poor can afford" is the basic objective of our policy on agriculture.
In India, Agricultural Policy has following objectives :(1) Make available cheap food in adequate quantity mainly for the poor which
constitutes 37% of population,(2) Protect small and marginal farmers producing food for self consumption,(3) Ensure reasonable input-output ratio for those offering marketable surplus.
To achieve above objectives, the Government of India (GO]) through adminis-trative measures, arranges to:(I) Procure food from farmers at a price to cover reasonable cost of produce,(2) Distribute through fair price shops at price commonly known as 'issue price',(3) GOI pays food subsidy to cover the difference (plus distribution expenditure)
between the price farmer receives which is higher than issue price.
The success story of the agricultural policy is shown in Table 3. The foodgrain production which was nearly 52 million tons in 195 1-52 (first year of IstFive Year Plan) increased to about 180 million tons during 1992-93. Theproductivity of cereal crops also showed a steady rise. The productivity ofwheat increased from 653 to 2348 kg/ha during the same period. Theproductivity of paddy also increased from 1082 to 2644 kg/ha.
416
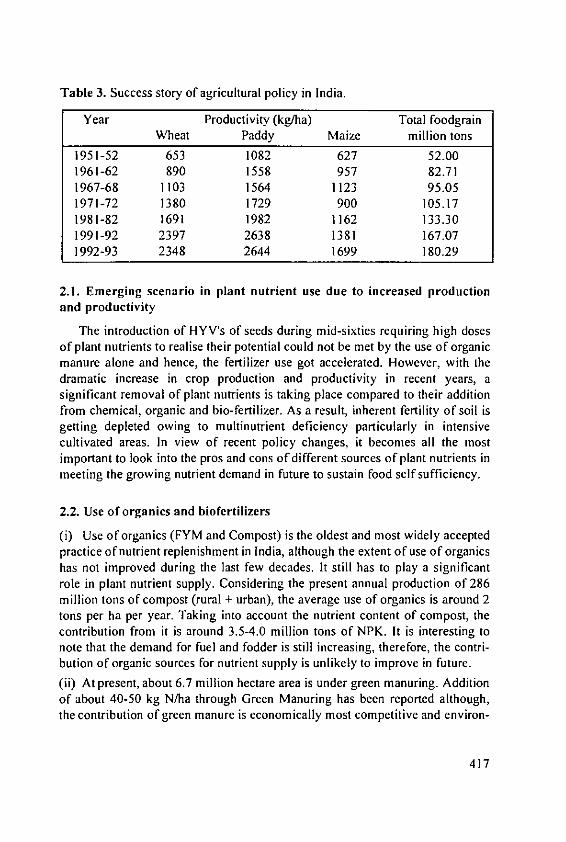
Table 3. Success story of agricultural policy in India.
Year Productivity (kg/ha) Total foodgrainWheat Paddy Maize million tons
1951-52 653 1082 627 52.001961-62 890 1558 957 82.711967-68 1103 1564 1123 95.051971-72 1380 1729 900 105.171981-82 1691 1982 1162 133.301991-92 2397 2638 1381 167.071992-93 2348 2644 1699 180.29
2.1. Emerging scenario in plant nutrient use due to increased productionand productivity
The introduction of HYV's of seeds during mid-sixties requiring high dosesof plant nutrients to realise their potential could not be met by the use of organicmanure alone and hence, the fertilizer use got accelerated. However, with thedramatic increase in crop production and productivity in recent years, asignificant removal of plant nutrients is taking place compared to their additionfrom chemical, organic and bio-fertilizer. As a result, inherent fertility of soil isgetting depleted owing to multinutrient deficiency particularly in intensivecultivated areas. In view of recent policy changes, it becomes all the mostimportant to look into the pros and cons of different sources of plant nutrients inmeeting the growing nutrient demand in future to sustain food self sufficiency.
2.2. Use of organics and biofertilizers
(i) Use of organics (FYM and Compost) is the oldest and most widely acceptedpractice of nutrient replenishment in India, although the extent of use of organicshas not improved during the last few decades. It still has to play a significantrole in plant nutrient supply. Considering the present annual production of 286million tons of compost (rural + urban), the average use of organics is around 2tons per ha per year. Taking into account the nutrient content of compost, thecontribution from it is around 3.5-4.0 million tons of NPK. It is interesting tonote that the demand for fuel and fodder is still increasing, therefore, the contri-bution of organic sources for nutrient supply is unlikely to improve in future.
(ii) At present, about 6.7 million hectare area is under green manuring. Additionof about 40-50 kg N/ha through Green Manuring has been reported although,the contribution of green manure is economically most competitive and environ-
417
mentally friendly, it can not be adopted in those areas where supply of irrigationwater is critical and the growth period of green manure crop is non-competitivewith normal cropping system of the region. The contribution of green manuringis not likely to be more than 0.30 million tons fertilizer N equivalent.
(iii) Though the potential benefits of biofertilizers (BF) are quite significant,they have not yet become popular due to various constraints at production,marketing and field levels. The total capacity of biofertilizers production at
present is about 3000 t/annum whereas actual production is about 2000 tons.This is far below the projected demand viz 100 thousand tons. The benefits ofbiofertilizer (Rhizobium) have been well proved in legume crops. Grain legumespresently occupy an area of about 32 million hectares. Experimental resultsindicate that the contribution of grain legumes to nitrogen needs of subsequentcrop may be 20-40 kg N/ha when yield of legume was 1.0-1.5 t/ha (about twotimes of national average). The average contribution for the entire country is
unlikely to be more than 15 kg N/ha or a total of about 0.48 million tons.The contribution of above sources of plant nutrient other than chemical fertili-
zer amounts to about 4.28-4.78 million tons. This indicates a gap of about 5.22-5.72 million tons when the efficiency of added nutrient is unlikely to be morethan 50% irrespective of the sources of the plant nutrients. In that case, the gap
would be around 10 million tons. This clearly indicates that there is huge scopefor all sources of plant nutrients to play their role. However, the supply of nutrientfrom other sources is unlikely to improve due to one or the other reasons.
2.3. Balanced fertilizer use
In principle, balanced fertilization is indispensable to avoid crop yield declineon cultivated land and to supplement nutrient loss from the soil ecosystem.Modem intensified agriculture depends on fertilizer inputs. Balanced fertilizationensures high productivity in accordance with nutrient demand by individual cropand for individual nutrient element without causing harm to the environment.
Data on the long-term effect of N, NP and NPK application on wheat yieldon an acid soil from Ranchi are shown in Fig. 1. On this soil the wheat productionstopped by the end of a 5 year period when N alone was applied, while with
N+P this was reached by the end of 18 years, when N+P+K still produced somewheat. When lime+NPK was applied the wheat yield showed a continuous
increase. Data on effect of N, NP and NPK fertilization on yields of wheat,maize and rice at some research centres of the All India Coordinated ResearchProject on Long-Term Fertilizer Experiments clearly bring out the need for
balanced fertilization for sustained productivity. Better yields with NPK andFYM also show the need for the supply of secondary and micronutrients.
418
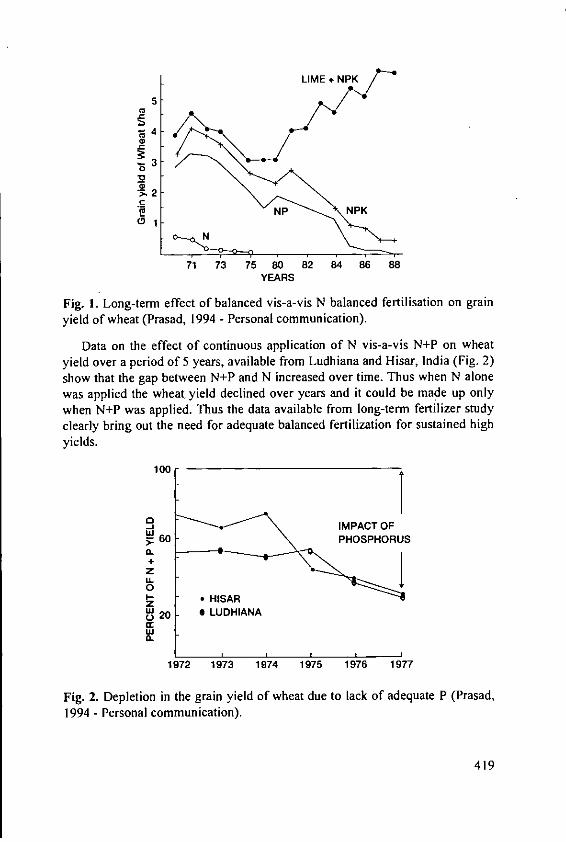
LIME + NPK
5
4
.30
320
'54 2"<NPNPK
!N
71 73 75 80 82 84 86 88YEARS
Fig. I. Long-term effect of balanced vis-a-vis N balanced fertilisation on grainyield of wheat (Prasad, 1994 - Personal communication).
Data on the effect of continuous application of N vis-a-vis N+P on wheatyield over a period of 5 years, available from Ludhiana and Hisar, India (Fig. 2)show that the gap between N+P and N increased over time. Thus when N alonewas applied the wheat yield declined over years and it could be made up onlywhen N+P was applied. Thus the data available from long-term fertilizer studyclearly bring out the need for adequate balanced fertilization for sustained highyields.
100 1-u IMPACT OF
5. 60PH RC.
0+z
F- - HISARZo 20 - LUDHIANACl:
1972 1973 1974 1975 1976 1977
Fig. 2. Depletion in the grain yield of wheat due to lack of adequate P (Prasad,1994 - Personal communication).
419
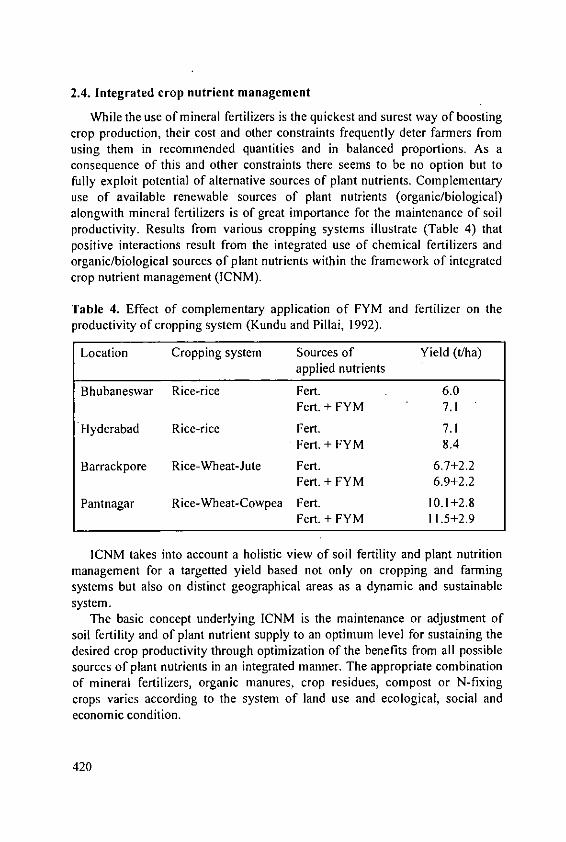
2.4. Integrated crop nutrient management
While the use of mineral fertilizers is the quickest and surest way of boostingcrop production, their cost and other constraints frequently deter farmers fromusing them in recommended quantities and in balanced proportions. As aconsequence of this and other constraints there seems to be no option but tofully exploit potential of alternative sources of plant nutrients. Complementaryuse of available renewable sources of plant nutrients (organic/biological)alongwith mineral fertilizers is of great importance for the maintenance of soilproductivity. Results from various cropping systems illustrate (Table 4) thatpositive interactions result from the integrated use of chemical fertilizers andorganic/biological sources of plant nutrients within the framework of integratedcrop nutrient management (ICNM).
Table 4. Effect of complementary application of FYM and fertilizer on theproductivity of cropping system (Kundu and Pillai, 1992).
Location Cropping system Sources of Yield (t/ha)applied nutrients
Bhubaneswar Rice-rice Fert. 6.0Fert. + FYM 7.1
Hyderabad Rice-rice Fert. 7.1Fert. + FYM 8.4
Barrackpore Rice-Wheat-Jute Fert. 6.7+2.2
Fert. + FYM 6.9+2.2
Pantnagar Rice-Wheat-Cowpea Fert. 10.1+2.8Fert. + FYM 11.5+2.9
ICNM takes into account a holistic view of soil fertility and plant nutritionmanagement for a targetted yield based not only on cropping and fanningsystems but also on distinct geographical areas as a dynamic and sustainablesystem.
The basic concept underlying ICNM is the maintenance or adjustment ofsoil fertility and of plant nutrient supply to an optimum level for sustaining thedesired crop productivity through optimization of the benefits from all possiblesources of plant nutrients in an integrated manner. The appropriate combinationof mineral fertilizers, organic manures, crop residues, compost or N-fixingcrops varies according to the system of land use and ecological, social andeconomic condition.
420
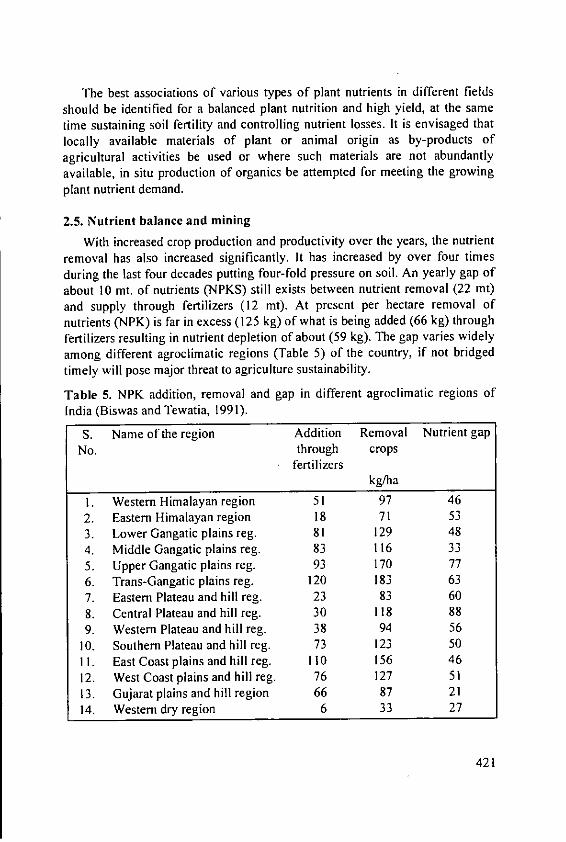
The best associations of various types of plant nutrients in different fields
should be identified for a balanced plant nutrition and high yield, at the sametime sustaining soil fertility and controlling nutrient losses. It is envisaged thatlocally available materials of plant or animal origin as by-products ofagricultural activities be used or where such materials are not abundantlyavailable, in situ production of organics be attempted for meeting the growingplant nutrient demand.
2.5. Nutrient balance and mining
With increased crop production and productivity over the years, the nutrientremoval has also increased significantly. It has increased by over four timesduring the last four decades putting four-fold pressure on soil. An yearly gap of
about 10 mt. of nutrients (NPKS) still exists between nutrient removal (22 mt)
and supply through fertilizers (12 mt). At present per hectare removal of
nutrients (NPK) is far in excess (125 kg) of what is being added (66 kg) throughfertilizers resulting in nutrient depletion of about (59 kg). The gap varies widelyamong different agroclimatic regions (Table 5) of the country, if not bridgedtimely will pose major threat to agriculture sustainability.
Table 5. NPK addition, removal and gap in different agroclimatic regions ofIndia (Biswas and Tewatia, 1991).
S. Name of the region Addition Removal Nutrient gapNo. through crops
fertilizerskg/ha
I. Western Himalayan region 51 97 462. Eastern Himalayan region 18 71 533. Lower Gangatic plains reg. 81 129 484. Middle Gangatic plains reg. 83 116 335. Upper Gangatic plains reg. 93 170 776. Trans-Gangatic plains reg. 120 183 637. Eastern Plateau and hill reg. 23 83 608. Central Plateau and hill reg. 30 118 889. Western Plateau and hill reg. 38 94 56
10. Southern Plateau and hill reg. 73 123 5011. East Coast plains and hill reg. 110 156 4612. West Coast plains and hill reg. 76 127 5113. Gujarat plains and hill region 66 87 2114. Western dry region 6 33 27
421
Considering projected removal of about 28 mt by 2000 AD, this gap isunlikely to be narrowed down much with estimated nutirent supply of about 18mt through fertilizers. In addition to NPK, the importance of sulphur in Indianagriculture is being increasingly felt due to increasing reports of sulphur defi-ciency from different areas of the country. On an average about 6 kg/ha sulphuris presently being depleted from the Indian Soils. Among the micronutrients, theremoval of zinc and iron by crops is of great concern which is around IIthousand tons and Ill thousand tons, respectively. However, the deficiency ofzinc is more common and yield limiting in intensively cultivable areascompared to iron. The removal is likely to increase by 20-25% by 2000 AD.
3. Role of fertilizer/fertilizer policy
The development of fertilizer industry in India has been synonymous withrapidly growing agriculture. Fertilizer is one such sector which has received themaximum attention of our planners and policy makers. Before independence in1947, the fertilizer production existed on notional value in the form of few SSPfactories though first factory, with a capacity to produce 6400 tons of P20 5, wasset up in 1906. With the advent of planned era from 1951-52 as the first year ofthe first five year plan, due attention was given to fertilizer. During GreenRevolution, the use of HYV coupled with irrigation has been responsible for theincreased crop production in the country. Use of high doses of chemicalfertilizers to exploit potential of HYV, laid emphasis on increased productionand usage of fertilizers.
During late seventies, Government of India adopted a pragmatic fertilizerpolicy so that agricultural policy could yield desirable results. The objectives ofthe fertilizer policy were two-fold:(1) To make available fertilizers to farmers at stable and reasonable prices to
encourage its use and consequently induce increased agricultural production;(2) To give fertilizer producers a reasonable return on their investment to
encourage not only efficient operations but also increased production tomeet increasing demand.
However to achieve the above objectives, the following administrativemeasures were taken:1. Statutory control over price of fertilizers paid by farmer, uniform throughout
the country, subject to local taxes, to avoid any regional distortions inconsumption pattern.
2. Fixation of fair ex-factory retention price and reasonable cost oftransportation for different products by different manufacturers.
422

3. Making good or mopping up the difference between the net realisation(consumer price minus distribution margin fixed by Government) and theretention price and equated freight (also fixed by Government).
In view of the importance of the agriculture sector, it was only natural forfertilizer to be brought within the purview of price control.The result of the pragmatic fertilizer policy is shown in Table 6.
Table 6. Impact of fertilizer policy (Various issues of FAI Fertilizer Statistics).
S. Item 1951-52 1975-76 1991-92 1993-94No. (before (before (after
introduction decontrol decontrolof subsidy) of P& K) of P&K)
1. Installed capacity('000 t)N 89 2676 8229 8444P20 5 28 742 2753 2808
2. Production ('000 t)N 29 1508 7302 7231P20 5 10 320 2562 1874
3. Capacity utilization(%)N 37 62 89 84P20 5 38 45 94 69
4. Total consumption('000 t)N 59 2149 8046 8765P20 5 7 467 3221 2670
5. Average consump- 0.6 16.9 68.6 66.6tion (kg) of nutrientsper ha of gross crop-ped area
3.1. Economic reforms and fertilizer sector
Consequent to economic reforms implemented during middle 1991 byGovernment of India, fertilizer sector also came under its purview. Highlightsof some important policy changes are listed below.
423

3. 1. 1. July 1991
(i) AS, CAN and ACI, customarily known as Low Analysis Fertilizers, weredecontrolled.
(ii) The controlled selling prices of all other fertilizers were raised by 40%. Theprices were further reduced by 10% in August.
(iii)A subsidy ceiling on SSP was introduced.
3.1.2. August 1992: Decontrol of P & K
(i) All P&K bearing fertilizers were decontrolled.(ii) Ammonium Sulphate, CAN and Ammonium Chloride were brought back
within the purview of control.(iii)The selling price of urea which continued to be under control was reduced
by 10%.
3.1.3. September 1992: Decanalisation of DAP
In disguise of liberalisation of import policy, Government of India spranganother blow to Indian fertilizer industry by decanalisation of import of DAP atzero rate of duty.
3.1.4. October 1992: Provision of ad hoc subsidy
Within about a month of its policy to decontrol of P & K, Government ofIndia realised that farmers would not be able to pay such an increase in theprices of decontrolled fertilizers. Consequently, it made a provision of Rs. 3.4billion to be passed on to the farmers as 'adhoc subsidy' to cushion the impact ofthe increase in prices of decontrolled fertilizers except SSP with the followingcriteria:The highlights of the scheme were(i) The concessions (adhoc subsidy) proposed to be extended to the farmer
would be Rs. 1000.- tons for DAP, Rs. 1000.- ton for MOP and ranging fromRs. 500 to Rs. 800.- per ton for complexes.
(ii) Indicative farm gate prices of DAP and MOP were Rs. 6500.- and Rs. 4200.-per ton, respectively.
(iii)The scheme was applicable on sales during October-December 1992 initiallyand later was extended up to March 1993.
(iv)The scheme was to be implemented by State Govts.(v) A provision of Rs. 2.0, 0.5 and 0.9 billion was made for DAP, complexes
and MOP, respectively.
424

3.1.5. May 1993: Reintroduction of adhoc subsidy for 1992-93
The highlights of the scheme were:
(i) The scheme was to be implemented by State Government(ii) A band of prices was indicated for Kharif 1993(iii) SSP was included in the scheme(iv) Only indigenous DAP was eligible for the adhoc subsidy(v) The scheme was operative for 1993-94(vi) Funds allocated for one product will not be diverted for sale of other
products(vii) The concessions were applicable on sales from 12th June.
3.1.6 June 1993: Decanalisation of imported MOP, SOP and MAP
3.1.7. June 1994: Continuation of adhoc subsidy for 1993-94
3.1.8. June 1994: Price revision
(I) Urea prices were increased by 20% w.e.f. June 10, 1994(2) CAN, ACI and AS were decontrolled from price, movement and
distribution.
4. Impact of policy changes
While the economic reforms under a liberalised system have been
implemented by the Government and is being lauded as a step towards making a
nation strong and economically and financially sound in the world, various
sectors have been treated at par. The application of economic policies cannot beat par for various sectors and fertilizer sector has certainly paid the price(Saxena, 1994) as explained below.
4.1. Fertilizer production
While the country was progressing successfully towards achieving self-
sufficiency in fertilizer production, it suffered during 1992-93 and 1993-94(Table 7). Our target of producing 10 million tons of N+P has so far eluded. The
total production of N&P has declined after attaining a peak during 1991-92mainly because of shortfall in the production of DAP and SSP.
425
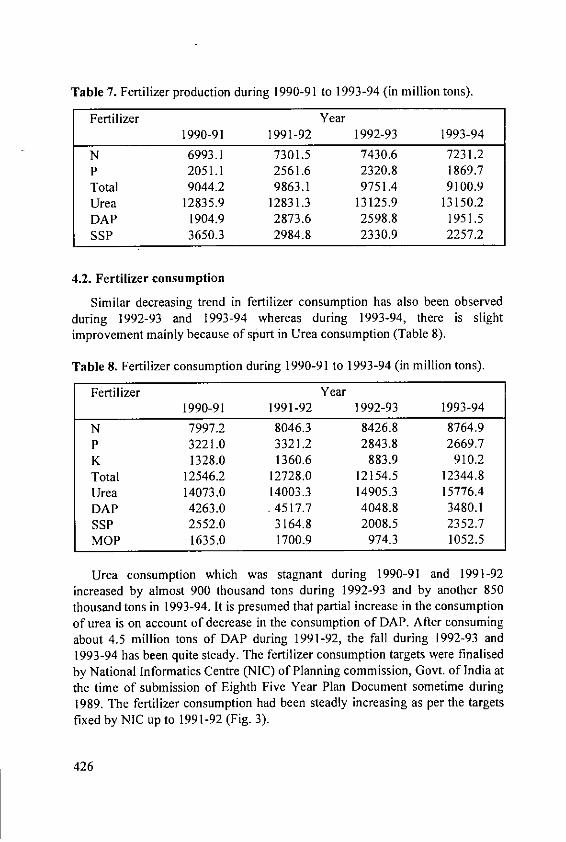
Table 7. Fertilizer production during 1990-91 to 1993-94 (in million tons).
Fertilizer Year1990-91 1991-92 1992-93 1993-94
N 6993.1 7301.5 7430.6 7231.2P 2051.1 2561.6 2320.8 1869.7Total 9044.2 9863.1 9751.4 9100.9Urea 12835.9 12831.3 13125.9 13150.2DAP 1904.9 2873.6 2598.8 1951.5SSP 3650.3 2984.8 2330.9 2257.2
4.2. Fertilizer consumption
Similar decreasing trend in fertilizer consumption has also been observedduring 1992-93 and 1993-94 whereas during 1993-94, there is slightimprovement mainly because of spurt in Urea consumption (Table 8).
Table 8. Fertilizer consumption during 1990-91 to 1993-94 (in million tons).
Fertilizer Year1990-91 1991-92 1992-93 1993-94
N 7997.2 8046.3 8426.8 8764.9P 3221.0 3321.2 2843.8 2669.7K 1328.0 1360.6 883.9 910.2Total 12546.2 12728.0 12154.5 12344.8Urea 14073.0 14003.3 14905.3 15776.4DAP 4263.0 4517.7 4048.8 3480.1SSP 2552.0 3164.8 2008.5 2352.7MOP 1635.0 1700.9 974.3 1052.5
Urea consumption which was stagnant during 1990-91 and 1991-92increased by almost 900 thousand tons during 1992-93 and by another 850thousand tons in 1993-94. It is presumed that partial increase in the consumptionof urea is on account of decrease in the consumption of DAP. After consumingabout 4.5 million tons of DAP during 1991-92, the fall during 1992-93 and1993-94 has been quite steady. The fertilizer consumption targets were finalisedby National Informatics Centre (NIC) of Planning commission, Govt. of India atthe time of submission of Eighth Five Year Plan Document sometime during1989. The fertilizer consumption had been steadly increasing as per the targetsfixed by NIC up to 1991-92 (Fig. 3).
426
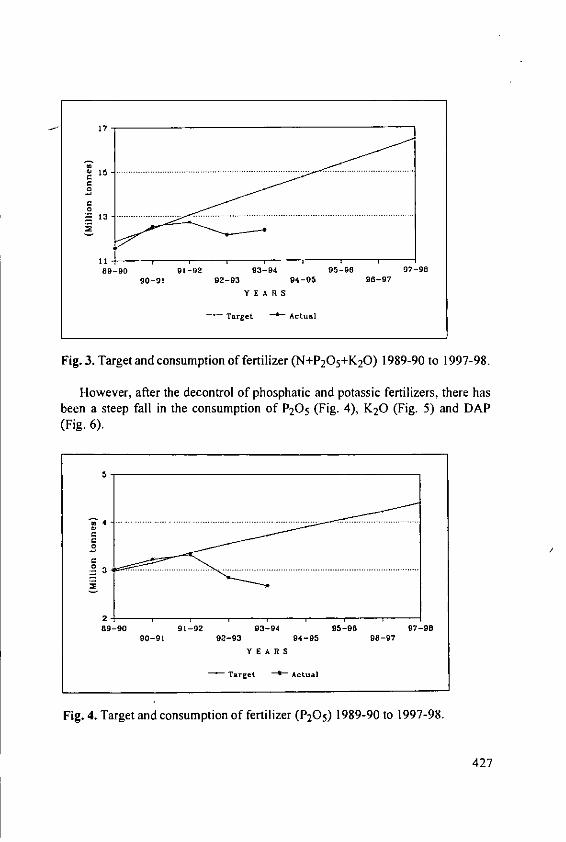
17
it89-90 91-92 93-94 95-96 07-98
90-91 92-93 94-95 96-97
YER
- Target Actual
Fig. :3. Target and consumption of fertilizer (N+P2O5+K20) 1989-90 to 1997-98.
However, after the decontrol of phosphatic and potassic fertilizers, there hasbeen a steep fall in the consumption of P205 (Fig. 4), K20 (Fig. 5) and DAP(Fig. 6).
5
.Z4 .........................................
... ... ... ... ... .. .. .......................................... .. . ........... ......
89-90 91-92 93-94 95-96 97-9890-91 92-93 94-95 96-97
YEARS
- Target I Actual
Fig. 4. Target and consumption of fertilizer (P20 5) 1989-90 to 1997-98.
427
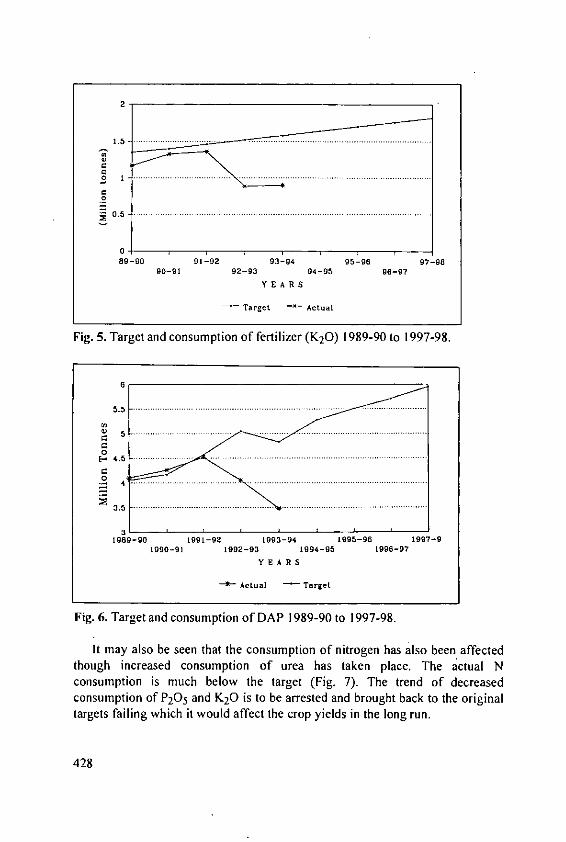
2
.5 . .. . ......... ... .. .. .. . .... .. . .... .. .
89-90 91-92 93-94 05-96 9'7-98S0-S1 92-93 94-95 96-97
YEAR
- Target -- Actual
Fig. 5. Target and consumption of fertilizer (K2O) 1989-90 to 1997-98.
6
5 .5 ................
5 . .........- .........
0
E 4 ...... ...... .. ... .. . ..........i/ ii/ iiii iiii. iii..iii..i
1990-9 1992-93 1994-95 1996-97
YEARS
Actual - Target
Fig. 6. Target and consumption of DAP 1989-90 to 1997-98.
It may also be seen that the consumption of nitrogen has also been affectedthough increased consumption of urea has taken place. The actual Nconsumption is much below the target (Fig. 7). The trend of decreasedconsumption of P205 and K20 is to be arrested and brought back to the originaltargets failing which it would affect the crop yields in the long run.
428
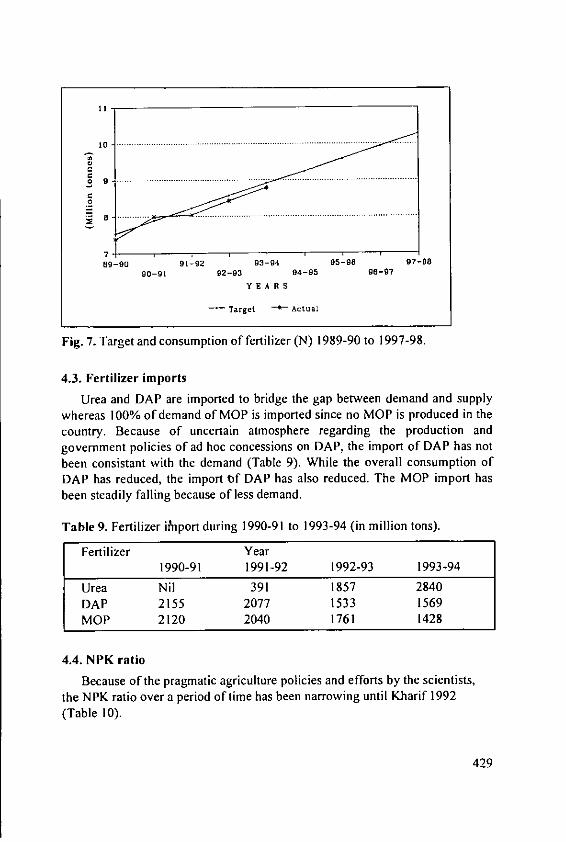
11
010 . . . ........... .... ......-......... . ........ .. .... .. .. .......
789-90 91-92 93-94 95-96 97-98
90-91 92-93 94-95 96-97
YEARS
- Target - Actual
Fig. 7. Target and consumption of fertilizer (N) 1989-90 to 1997-98.
4.3. Fertilizer imports
Urea and DAP are imported to bridge the gap between demand and supplywhereas 100% of demand of MOP is imported since no MOP is produced in thecountry. Because of uncertain atmosphere regarding the production andgovernment policies of ad hoc concessions on DAP, the import of DAP has notbeen consistant with the demand (Table 9). While the overall consumption ofDAP has reduced, the import tf DAP has also reduced. The MOP import hasbeen steadily falling because of less demand.
Table 9. Fertilizer inport during 1990-91 to 1993-94 (in million tons).
Fertilizer Year
1990-91 1991-92 1992-93 1993-94
Urea Nil 391 1857 2840DAP 2155 2077 1533 1569MOP 2120 2040 1761 1428
4.4. NPK ratio
Because of the pragmatic agriculture policies and efforts by the scientists,the NPK ratio over a period of time has been narrowing until Kharif 1992(Table 10).
429

Table 10. N, P, K ratio during 1952-53 to 1993-94.
Year N P K
1952-53 17.5 1.4 I1961-62 8.9 2.21971-72 6.0 2.01981-82 6.0 2.01986-87 6.7 2.4Kharif 1991 5.4 2.3 1Rabi 1991-92 6.4 2.6 11991-92 5.9 2.4 1Kharif 1992 6.6 2.5 1Rabi 1992-93 15.1 4.6 11992-93 9.5 3.2 1Kharif 1993 9.4 2.7Rabi 1993-94 9.9 3.2 11993-94 9.6 2.9 1
It may be seen that after the decontrol of phosphatic and potassic fertilizers,the distortions in NPK ratio have taken place. There has not been anyimprovement in last 2 years in NPK ratio. This would affect the agriculturalproductivity in the long run if suitable measures are not taken to reverse thetrend.
4.5. Economics of fertilizer use
Based on the current prices of urea, DAP and MOP and the support price ofpaddy and wheat, economics of fertilizer use in terms of physical returns andgross financial return on every rupee invested in fertilizer is shown in Tables II,12, 13 and 13a. It may be seen that while the Government was quick toannounce a significant increase in procurement price of wheat and other cerealcrops to compensate the farmers for the impact of higher fertilizer prices, it maybe of no help to small and marginal farmers, who produce food mainly for selfconsumption.
430

Table 11. Economics of fertilizer use-fertilizer and foodgrain prices (Rs./kg).
Item 1971-72 1974-75 1981-82 1991-92 1992-93 1994-95w.e.f, w.e.f. (Kharif
August 14 August 28 season)
A. Nutrient prices(Rs./kg)
I. N-based on 2.01 4.35 5.11 6.65 6.00 7.22urea
2. P20 5 based on 1.86 4.83 5.83 7.57 12.43 14.07DAP
3. K20 based on 0.89 2.05 2.17 2.83 7.50 6.38MOP
B. Output prices(Rs./kg)
(marketing year)
1. Procurement 0.53 0.74 1.15 2.30 2.70 3.40prices of paddy
2. Procurement 0.76 1.05 1.30 2.25 2.75 3.50prices of wheat
Table 12. Economics of fertilizer use-physical returns.
Item 1971-72 1974-75 1981-82 1991-92 1992-93 1994-95wet.f, w.et.f (Kharif
August 14 August 28 season)
Paddy-kgrequired to buy
I kg N as urea 3.79 5.88 4.44 2.89 2.22 2.12I kg P20 5 as DAP 3.51 6.53 5.07 3.29 4.60 4.141 kg K20 as MOP 1.68 2.77 1.89 1.23 2.78 1.88
Wheat-kgrequired to buy
I kg N as urea 2.64 4.14 3.93 2.96 2.18 2.061kg P20 5 as DAP 2.45 4.60 4.48 3.36 4.52 4.02I kg K20 as MOP 1.17 1.95 1.67 1.26 2.73 1.82
431

Table 13. Economics of fertilizer use-gross financial on every Rupee investedin fertilizers (Rs.).
Item 1971-72 1974-75 1981-82 1991-92 1992-93 1994-95w.e.f, w.e.f. (KharifAug. 14 Aug. 28 season)
Paddy-return fromNutrient N as urea 2.64 2.04 2.70 4.15 5.40 5.65Nutrient P20 5 as )AP 1.71 1.07 1.38 2.13 1.60 1.96Nutrient K20 as MOP 2.38 1.80 2.65 4.06 1.80 2.76
Wheat-return fromNutrient N as urea 3.78 2.90 3.05 4.06 5.50 5.82Nutrient P205 as DAP 2.45 1.52 1.56 2.08 1.63 2.01Nutrient K20 as MOP 3.42 2.56 3.00 3.98 1.83 2.84
Table 13a. Explanations.
I. Incremental response ratio (kg of extra product per additional kg ofnutrient) for paddy and wheat assumed for analysis are as under:
Nutrient Incremental Response ratio1971-72 1974-75 onwards
N 10 12P20 5 6 7K20 4 5
2. Fertilizer prices used in the calculation w.e.f. August 25, 1992 andonwards are: (Rs./t):Period 1992-93 Urea DAP MOP(w.e.f. August 25, 1993) 2760 6800 45001993-94 2760 7000 40001994-95 3320 7700 3830
5. Constraints and opportunities
As mentioned earlier, the fertilizer consumption targets were finalised byNational Informatics Centre (NIC), Planning Commission, Govt. of India at thetime of submission of Eighth Five Year Plan Document during 1989.
It may be seen that the demand for N+P205+K20 is estimated to be 17.61MT by 1999-2000 and 20.54 MT by 2004-2005. Considering the present levelofconsumption which has fallen below the targets (Figs. 3, 4 & 5), still potentialexists to reverse the present trend of fertilizer consumption to bring back to thelevel originally estimated by NIC.
432
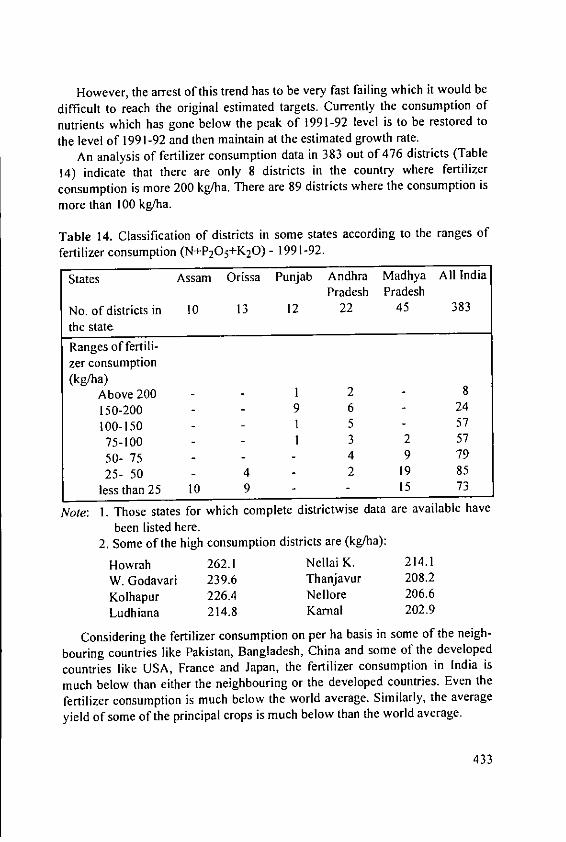
However, the arrest of this trend has to be very fast failing which it would be
difficult to reach the original estimated targets. Currently the consumption of
nutrients which has gone below the peak of 1991-92 level is to be restored to
the level of 1991-92 and then maintain at the estimated growth rate.An analysis of fertilizer consumption data in 383 out of 476 districts (Table
14) indicate that there are only 8 districts in the country where fertilizer
consumption is more 200 kg/ha. There are 89 districts where the consumption is
more than 100 kg/ha.
Table 14. Classification of districts in some states according to the ranges of
fertilizer consumption (N+P2 05+K20) - 1991-92.
States Assam Orissa Punjab Andhra Madhya All IndiaPradesh Pradesh
No. of districts in 10 13 12 22 45 383
the state
Ranges of fertili-zer consumption(kg/ha)
Above200 - - 1 2 8
150-200 - - 9 6 24
100-150 - - 1 5 - 57
75-100 - - 1 3 2 57
50- 75 - - - 4 9 79
25- 50 - 4 2 19 85
less than 25 10 9 - 15 73
Note: 1. Those states for which complete districtwise data are available have
been listed here.2. Some of the high consumption districts are (kg/ha):
Howrah 262.1 Nellai K. 214.1
W. Godavari 239.6 Thanjavur 208.2
Kolhapur 226.4 Nellore 206.6Ludhiana 214.8 Kamal 202.9
Considering the fertilizer consumption on per ha basis in some of the neigh-
bouring countries like Pakistan, Bangladesh, China and some of the developed
countries like USA, France and Japan, the fertilizer consumption in India is
much below than either the neighbouring or the developed countries. Even the
fertilizer consumption is much below the world average. Similarly, the average
yield of some of the principal crops is much below than the world average.
433
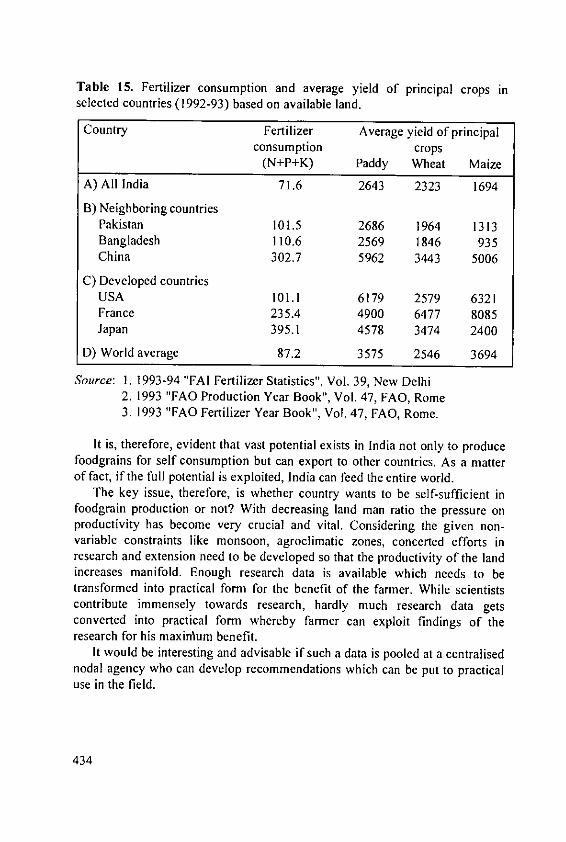
Table 15. Fertilizer consumption and average yield of principal crops inselected countries (1992-93) based on available land.
Country Fertilizer Average yield of principalconsumption crops
(N+P+K) Paddy Wheat Maize
A) All India 71.6 2643 2323 1694
B) Neighboring countriesPakistan 101.5 2686 1964 1313Bangladesh 110.6 2569 1846 935China 302.7 5962 3443 5006
C) Developed countriesUSA 101.1 6179 2579 6321France 235.4 4900 6477 8085Japan 395.1 4578 3474 2400
D) World average 87.2 3575 2546 3694
Source: 1. 1993-94 "FAI Fertilizer Statistics", Vol. 39, New Delhi2. 1993 "FAO Production Year Book", Vol. 47, FAO, Rome3. 1993 "FAO Fertilizer Year Book", Vol. 47, FAO, Rome.
It is, therefore, evident that vast potential exists in India not only to producefoodgrains for self consumption but can export to other countries. As a matterof fact, if the full potential is exploited, India can feed the entire world.
The key issue, therefore, is whether country wants to be self-sufficient infoodgrain production or not? With decreasing land man ratio the pressure onproductivity has become very crucial and vital. Considering the given non-variable constraints like monsoon, agroclimatic zones, concerted efforts inresearch and extension need to be developed so that the productivity of the landincreases manifold. Enough research data is available which needs to betransformed into practical form for the benefit of the farmer. While scientistscontribute immensely towards research, hardly much research data getsconverted into practical form whereby farmer can exploit findings of theresearch for his maxirium benefit.
It would be interesting and advisable if such a data is pooled at a centralisednodal agency who can develop recommendations which can be put to practicaluse in the field.
434

6. Conclusion
While variable and non-variable constraints are to be tackled at variousstages and levels, a vast potential exists in India to produce foodgrain for notonly its own consumption but for exporting to other countries. What we needtoday is a consistant long range clear-cut fertilizer and agriculture policy byGovt. of India which existed hitherto and let us not be carried away by theliberalization process so that the hard earnings of the past are not washed awaywith no future or else India would also be falling into the category of foodgrainimporting countries and would be at the mercy of developed world.
7. References
Biswas, B.C. and Tewatia, R.K. (1991): Nutrient Balance in Agro-ClimaticRegions of India-An Overview. Fert. News, 36(6): 13-17.
Kundu, D.K. and Pillai, K.G. (1992): Integrated Nutrient Supply System in Riceand Rice Based Cropping Systems. 37 (4): 35-41
Saxena, S.K. (1994): Analysis of the Indian Fertilizer Subsidy Issue. Fert.Marketing News, 25(2): 1-9.
435

Integrated Fertilizer Management to Sustain Self-Sufficiency in Food in Indonesia
J. Sri Adiningsih, Diah Setyorini and A. KasnoCenter for Soil and Agroclimate Research, Agency for Agricultural Researchand Development, Jalan Ir. H. Juanda 98, Bogor 16123, Indonesia.
Summary
Fertilizer usage is high on lowland rice where rates of N and P are excessivewith accumulation of soil P but low on other food crops on upland soils. Whilefertilizers were instrumental in increasing lowland rice yield up to about 1985,yields then stagnated despite further increase in N and P usage. Other foodcrops on upland soils give low yields but respond well to fertilizer. It isnecessary to increase production of these food crops to achieve self-sufficiency.Fertilizer usage on lowland rice could be reduced without prejudice to yield; thematerial so saved should be diverted to upland food crops. Application oforganic manure increases yield, improves fertilizer efficiency and assists insustaining soil productivity. A properly integrated fertilizer policy, making fulluse of crop residues and manures and paying attention to soil nutrient status,will result in sustainable and more environment-friendly farming systems.
I. Introduction
The production of agricultural commodities including food crops hasincreased substantially over the past five PELITA (Five Year DevelopmentProgram) periods. A significant milepost was reached in 1984 when the countrybecame self-sufficient in rice.
Extending the cropped area, cropping intensity and increasing crop yield hasmade this growth over the past 20 years possible. Agricultural research andsuccessful extension to farmers contributed substantially to this development.Fertilizer and the adoption of improved crop varieties and related technologieshave played important roles especially in the case of rice (Fig. 1). The aim ofGovernment policy now is to maintain rice production and to direct moreattention to increasing production of other food crops. This will involve anincrease in fertilizer usage on other crops and consequently a need for furtherexpenditure on fertilizer subsidy. This poses a problem as funds are limited. It isessential therefore that fertilizer efficiency be improved.
437
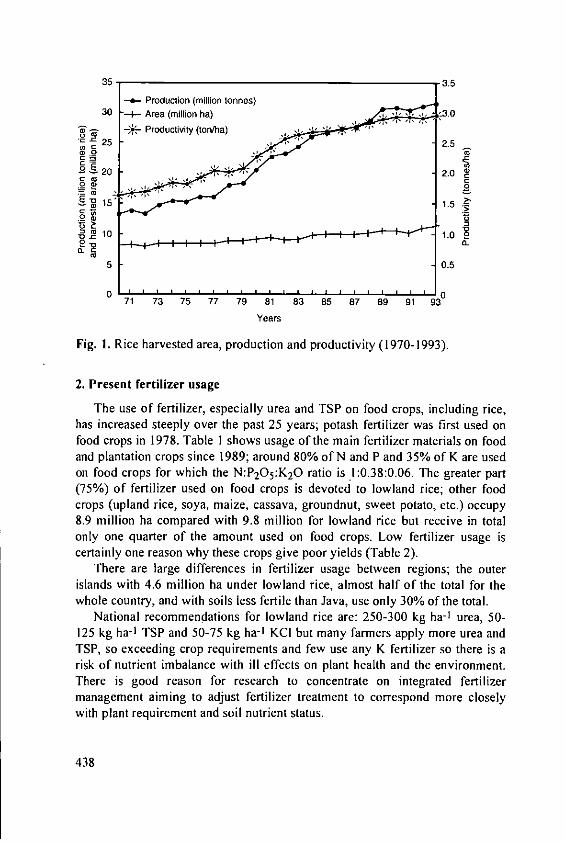
35- 3.5
-- Production (million lonnes)30 -i-- Area (million ha) W3.0
o.m. - - Productivity (tontha)" 25 A - "2.5
2 2.0
1.5
2 10 1.0
5 0.5
0 071 73 75 77 79 81 83 85 87 89 91 93
Years
Fig. 1. Rice harvested area, production and productivity (1970-1993).
2. Present fertilizer usage
The use of fertilizer, especially urea and TSP on food crops, including rice,has increased steeply over the past 25 years; potash fertilizer was first used onfood crops in 1978. Table I shows usage of the main fertilizer materials on foodand plantation crops since 1989; around 80% of N and P and 35% of K are usedon food crops for which the N:P205:K20 ratio is 1:0.38:0.06. The greater part(75%) of fertilizer used on food crops is devoted to lowland rice; other foodcrops (upland rice, soya, maize, cassava, groundnut, sweet potato, etc.) occupy8.9 million ha compared with 9.8 million for lowland rice but receive in totalonly one quarter of the amount used on food crops. Low fertilizer usage iscertainly one reason why these crops give poor yields (Table 2).
There are large differences in fertilizer usage between regions; the outerislands with 4.6 million ha under lowland rice, almost half of the total for thewhole country, and with soils less fertile than Java, use only 30% of the total.
National recommendations for lowland rice are: 250-300 kg ha- 1 urea, 50-125 kg ha- 1 TSP and 50-75 kg ha-1 KCI but many farmers apply more urea andTSP, so exceeding crop requirements and few use any K fertilizer so there is arisk of nutrient imbalance with ill effects on plant health and the environment.There is good reason for research to concentrate on integrated fertilizermanagement aiming to adjust fertilizer treatment to correspond more closelywith plant requirement and soil nutrient status.
438

Table 1. Fertilizer consumption in Indonesia in 1989-1993 (1000 tons).
Fertilizer 1989 1990 1991 1992 1993
Urea- Food crops 2574 (88) 2534 (85) 2577 (83) 2820 (82) 2702 (81)-Estatecrops 337 (12) 449 (15) 521 (17) 611 (18) 626 (19)
Total 2911 (100) 2983 (100) 3098 (100) 3431 (100) 3328 (100)
TSn- Foodcrops 1125 (88) 1051 (83) 1006 (80) 1019 (79) 978 (77)- Estate crops 152 (12) 210 (17) 250 (20) 275 (21) 294 (23)Total 1277(100) 1261 (100) 1256(100) 1294(100) 1272(100)KCl-Food crops 220 (48) 193 (38) 178 (39) 175 (36) 150 (36)-Estate crops 240 (52) 317 (62) 278 (61) 314 (64) 268 (64)Total 460(100) 510(100) 456(100) 489(100) 418(100)AS- Food crops 484 (81) 485 (80) 487 (80) 507 (82) 560 (81)-Estatecrops 112 (19) 120 (20) 120 (20) 109 (18) 124 (19)Total 596(100) 605(100) 607(100) 616(100) 684(100)) : percentage.
Source: 1) Study on the use of subsidized fertilizers, Dept. of Finance, Dept. ofIndustry and Dept. of Agriculture (unpublished), 1994.
2) Directorate General for Food Crops (1994).
3. Food crop production
53% of the total area under food crops (Table 2) is devoted to lowland ricewith total production 45.4 mio t - an average of 4.6 t ha- 1; 2.83 mio t upland rice(average 2.2 t ha-1) is produced on 1.3 mio ha (CBS, 1993).
Table 2. Area harvested, production and average productivity of food crops inIndonesia (Central Bureau of Statistics, Indonesia, 1993).
Crops Area harvested Production Productivitymillion ha million tons ton/ha
Lowland rice 9.80 45.40 4.6Upland rice 1.30 2.83 2.2Maize 3.63 8.00 2.2Soybean 1.67 1.87 1.1Cassava 1.35 16.52 12.2Peanut 0.72 0.74 1.0
Sweet potato 0.23 2.17 9.4
439

Only 50% of farmers have adopted improved technology for non-rice foodcrops and only 60% for lowland rice in the outer islands (Dir. Food Crop Prod.,1989). The productivity of non-rice food crops is well below the potential. Thetechnology for improvement is available but there has been little or no progressin its adoption.
From 1960, intensive efforts were made through the INSUS (SpecialIntensification), OPSUS (Special Operation) and SUPRA INSUS programs toimprove the growing of lowland rice. Increased fertilizer usage contributedmuch to the improvement but there is evidence that, after increasing steadily to1984, productivity has tended to level off (Figure 2). Through the 3rd 5-yearPlan, rice productivity increased at 6% per year but over the following 4 years(1985-89) but only 1% (Sri Adiningsih, 1992) while production in 1994 was3.7% below 1993. Of possible causes of this decline, one most likely isunbalanced fertilizer use causing damage to soil chemical, physical andbiological properties. Heavy use of N and P may induce deficiencies of K andseveral micronutrients including zinc of which deficiency symptoms have beennoticed on some intensively managed lowland rice fields.
6,0 30 3.5
5.0 / 3.00'0O" - 0-0- 0 -25
Production -- -6.-0
4.0 1 2.50 20
o 3.0 2.0 £
0 >
o 2.0 I I I1.510 L 2c
Productivity c .
70 A '2 73 74 7 7 7 7 9 ' 1 3 84 86 8
51 UREA LAS ETSP IKOI
Fig. 2. Fertilizer consumption and the production of lowland rice in Indonesia(1970-1993).
440

4. Development strategies
Four factors operating against self-sufficiency in food in Indonesia are:1. Falling yields on some intensive lowland rice areas;2. Low productivity of non-rice food crops due to poor management and low
fertilizer input;3. Low soil fertility in the outer islands;4. Losses of agricultural land to housing, roads, factories, etc.
Main research objectives of the Agency for Agricultural Research andDevelopment are the elaboration of strategies and appropriate technologies toovercome these constraints. Analyses and recommendations on nutrientmanagement with emphasis on efficient use of fertilizers are discussed hereunder.
4.1. Nitrogen
Many farmers apply up to 225 kgN ha-1 as urea to lowland rice, far exceedingplant requirement. There may be high losses of N through volatilization whenprilled urea is broadcast on paddies (Wetzelaar et al., 1984). Deep placement oflarger sized urea (supergranule, briquette, tablet) reduced this loss by 25-30%and increased yield by 300-500 kg ha- 1 (Figure 3) (Sri Adiningsih, 1992).
60 Klatefl DS 88 Klaten WS 88/89DP SB = Split Broadcast
40F SB DP DP = Deep Placement
40
60 Ngawi DS 88 Ngawi WS 88/89
SB DP
20
00 43 86 129 172 216 0 43 86 129 172 216
IN rates (kg/ha)
Fig. 3. Estimates of net benefits from split broadcast prilled urea (SB) and deepplaced urea supergranule (DP) at Klaten (Entisols) and Ngawi (Vertisols).
441

This procedure has been recommended and adopted by progressive farmersin well-irrigated lowland rice. It is estimated that on 5.3 million ha harvestedrice in Java, 318 000 t urea could thus be saved and production increased by2.12 million t grain. The 318 000 t urea could be diverted to non-rice foodcrops.
4.2. Phosphorus
The use of TSP on lowland rice commenced in the early sixties. P utilizationfrom this source is only 15-20% and the result of continued use of generousdressings during more than 25 years has been the accumulation in soils of non-labile P closely associated with Al and Fe in acid soils (pH <5.5) and with Ca incalcareous soils (pH >6.5). These P forms are very slowly available to plants.
The P status of lowland soils in Java was surveyed in 1974 to 1984 and thisindicated that the incidence of high soil P was increasing. This study and trialson farmers' fields indicated that 39.7% of lowlands did not respond to fertilizerP (Table 3). It was estimated that 217 000 t TSP could be saved and divertedparticularly to acid soils in the outer islands. Recently, it has been found thatSP-36 is as effective as TSP lowland soils and considerably cheaper.
Table 3. Area ('000 ha) of soil with different P status from lowland rice areas inJava based on 25% extractable HCI (Moersidi et al., 1989).
Province P-status (ppm P)Low Medium High Total<87 87-174 > 174
West Java 236 454 523 1 213Central Java 108 612 397 I 117Yogyakarta 16 47 - 63East Java 183 545 531 1 260Total 543 1 658 1 451 3653
(14.9%) (45.4%) (39.7%) (100%)
Application of P to acid soils can increase yield of upland rice by some 15%and double or more than double yield of other non-rice food crops (Figures 4and 5). The optimum rate of application was 40-60 kg ha-1 . Here is an areawhere the P fertilizer surplus to requirement on lowland rice could profitably beused; it would suffice for about I million ha. Phosphate rock is a cheaper Psource suitable for acid soils.
442

1.6
1.5
1-OM 5 t/ha
%OM 2.5t ha
//1.31. OM 0 ttha
C /1.2
1.1
020 40 60
Rates of P (kgfha)
Fig. 4. Response of upland rice to P application at diflrent levels of organic
matter in Kuamang Kuning, Jambi.
6aMaize
4Year 1&~ Year 2
3
R 2 Soybean
0.5
0 40 80 120 160P Applied (kg/ha)
Fig. 5. Maize and soybean response to phosphorus in 2 consecutive years.
443
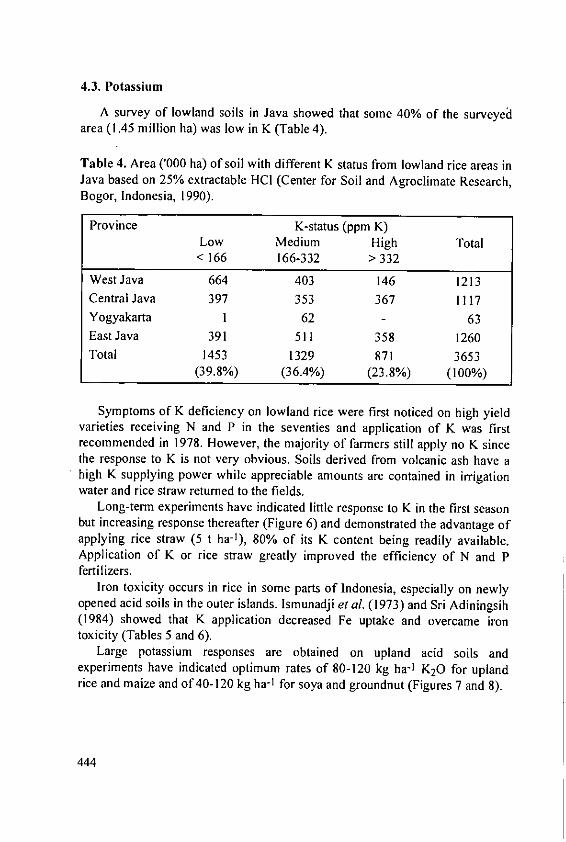
4.3. Potassium
A survey of lowland soils in Java showed that some 40% of the surveyedarea (1.45 million ha) was low in K (Table 4).
Table 4. Area ('000 ha) of soil with different K status from lowland rice areas inJava based on 25% extractable 14CI (Center for Soil and Agroclimate Research,Bogor, Indonesia, 1990).
Province K-status (ppm K)Low Medium High Total< 166 166-332 > 332
West Java 664 403 146 1213Central Java 397 353 367 1117Yogyakarta 1 62 - 63
East Java 391 511 358 1260Total 1453 1329 871 3653
(39.8%) (36.4%) (23.8%) (100%)
Symptoms of K deficiency on lowland rice were first noticed on high yieldvarieties receiving N and P in the seventies and application of K was firstrecommended in 1978. However, the majority of farmers still apply no K sincethe response to K is not very obvious. Soils derived from volcanic ash have ahigh K supplying power while appreciable amounts are contained in irrigationwater and rice straw returned to the fields.
Long-term experiments have indicated little response to K in the first seasonbut increasing response thereafter (Figure 6) and demonstrated the advantage ofapplying rice straw (5 t ha-'), 80% of its K content being readily available.Application of K or rice straw greatly improved the efficiency of N and Pfertilizers.
Iron toxicity occurs in rice in some parts of Indonesia, especially on newlyopened acid soils in the outer islands. Ismunadji et al. (1973) and Sri Adiningsih(1984) showed that K application decreased Fe uptake and overcame irontoxicity (Tables 5 and 6).
Large potassium responses are obtained on upland acid soils andexperiments have indicated optimum rates of 80-120 kg ha-1 K20 for uplandrice and maize and of 40-120 kg ha-1 for soya and groundnut (Figures 7 and 8).
444

Long-term experiments on low K Ultisols in Lampung and Jambidemonstrated the advisability of applying K to sustain yields.
N P K0-0 0 0 0 N P K--- 90 60 0 0-0 90 60 0
75 ,i, 90 60 60 75 *-e 90 60 60o-* 90 60 5 tons straw .-. 90 60 5 tons straw
60 Z6
45 45
30 30
15 - 15 0
0. . 0.i i i
82/83 83 83/84 84 84/85 85 82/83 83 83/84 84 84/85 85Seasons Seasons
N P K00 90 60 0°5-. 90 90 60, 90 60 5 tons straw
6 60
r45
15.
0[.82/83 83 83/84 84 84/85 85
Seasons
Fig. 6. The effect of potassium and straw application on the yield and efficiencyof N and P fertilizers over 6 consecutive seasons (1982-1985), West Java,Indonesia.
Table 5. Relationship between potassium (K) and iron (Fe) in fresh straw in
West Java (Ismunadji et al., 1979).
K applied Nutrient concentration
kg K20/ha K (%) Fe (ppm)
0 0.35 214
60 (KCI) 1.0 167
60(K 2 SO 4) 1.0 139
N: 90 kg ha- 1 P: 60 kg P20 5 ha-1 .
445

Table 6. Effect of straw incorporation and K fertilization on uptake of N, P, Kand Fe by rice grown on a Latosol paddy soil from West Java (Sri Adiningsih,1984).
Nutrient uptakeNutrient Without straw With straw
-K +K -K +K
mg/potN 603 854 800 809P 58 90 92 98K 327 508 712 888
ppmFe 774 546 564 474
3 5
0
A2i 0.0 (2
) 0 peanut (2_d)
0 0
0 40 80 120 240 0 40 80 120 240
K rates per crop
Fig. 7. The effect of K fertilizer on food crop yields.
446
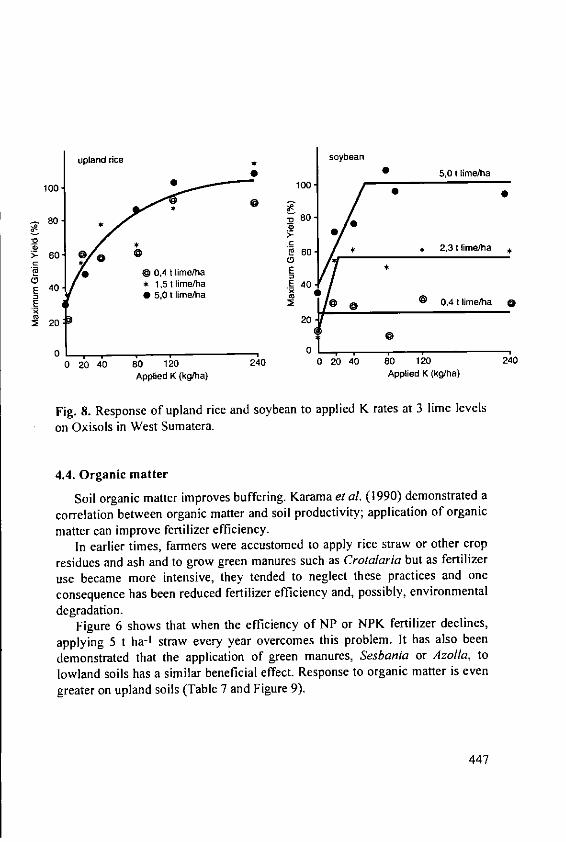
upland rice * soybean•• 5,0 t lime/ha
100 0 00o
80- 80
F
0 60 * = 2,3 t lime/ha5" 60 0 04 60
*0 1, " ire E 40E 40 - 405,0 t lime/ha j 04tliehE 0, t lieh @
2 20 20
0 0
o o o do 12o 24o 0 20 40 edo 60t 2
Applied K (kg/ha) Applied K (kg/ha)
Fig. 8. Response of upland rice and soybean to applied K rates at 3 lime levelson Oxisols in West Sumatera.
4.4. Organic matter
Soil organic matter improves buffering. Karama et a. (1990) demonstrated a
correlation between organic matter and soil productivity; application of organic
matter can improve fertilizer efficiency.In earlier times, farmers were accustomed to apply rice straw or other crop
residues and ash and to grow green manures such as Crotaaria but as fertilizer
use became more intensive, they tended to neglect these practices and one
consequence has been reduced fertilizer efficiency and, possibly, environmental
degradation.Figure 6 shows that when the efficiency of NP or NPK fertilizer declines,
applying 5 t ha-1 straw every year overcomes this problem. It has also been
demonstrated that the application of green manures, Sesbania or Azolla, to
lowland soils has a similar beneficial effect. Response to organic matter is even
greater on upland soils (Table 7 and Figure 9).
447
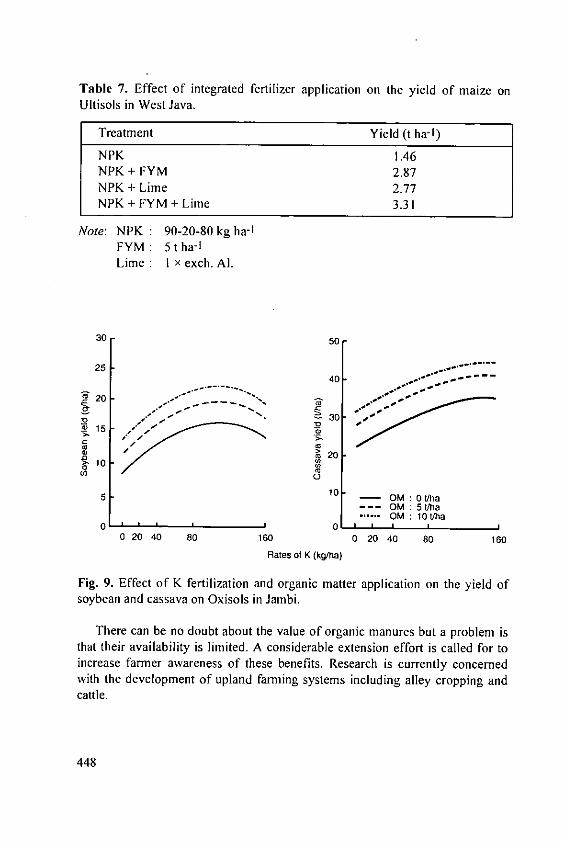
Table 7. Effect of integrated fertilizer application on the yield of maize onUltisols in West Java.
Treatment Yield (t ha-I)
NPK 1.46NPK + FYM 2.87NPK + Lime 2.77NPK + FYM + Lime 3.31
Note: NPK : 90-20-80 kg ha- I
FYM: 5 t ha-1
Lime: I x exch. Al.
30 50
26a40-2
---
n4 0 20 1010
Ce-
5 10. -_ OM 0 t/ha-- OM:5St/ha
... OM: I0t/ha0* 0 ' 1 1I
o 20 40 80 160 0 20 40 60 160
Rates of K (kg/ha)
Fig. 9. Effect of K fertilization and organic matter application on the yield ofsoybean and cassava on Oxisols in Jambi.
There can be no doubt about the value of organic manures but a problem isthat their availability is limited. A considerable extension effort is called for toincrease farmer awareness of these benefits. Research is currently concernedwith the development of upland farming systems including alley cropping andcattle.
448
4.5. Integrated fertilizer management
Clearly fertilizers have contributed much to increasing the productivity offarming in Indonesia, but the above discussion has shown that increasing ratesof application alone does not result in sustainability. If the farming system is tobe sustainable, more attention must be paid to attaining the correct nutrient ratioaccording to crop and soil conditions; maximum use should be made of theavailable organic residues. More use must be made of soil analysis in order toreach appropriate fertilizer recommendations. Attainment of sustainabilitydemands fully integrated management of inputs including fertilizer andmanures. Properly integrated fertilizer management will also prevent damage tothe environment.
The integrated approach is also needed in deciding policies for differentparts of the country. At the present time, it is apparent that fertilizer usage isover-generous in the intensively farmed lowland areas; there could be anappreciable reduction in usage of urea and TSP without prejudicing crop yield.On the other hand, there are large areas of poorer soil in the outer islands whichhave a potential for development and would benefit greatly from the diversionof fertilizer supplies from the lowlands. The Government's aim in removing thefertilizer subsidy is to encourage farmers to use fertilizer more efficiently andrationally.
4. Conclusion
Development of an integrated fertilizer policy should take account of thefollowing:
I. Some changes are needed in the intensive management of irrigated lowlandsoils. This involves adjusting fertilizer usage, at present unbalanced andexcessive, to better suit crop nutrient demand and prevent unnecessaryaccumulation of soil nutrients. Usage of crop and other organic residuesshould be increased. More use should be made of soil analysis in makingsite-specific recommendations.
2. There is great scope for increasing the productivity of upland non-rice foodcrops, especially in the outer islands and it is essential to do so if thenutritional needs of the growing population are to be satisfied. The possiblesaving in fertilizer materials used on lowland rice, if diverted to these areas,can play an important part in attaining this objective.
449
References
Central Bureau of Statistics (1993): Statistical Year Book of Indonesia, BPSJakarta.
Direktorat Jenderal Pertanian Tanaman Pangan (1992): Pembangunan JangkaPanjang I1 Subsektor Tanaman Pangan. Rakernas Deptan, Jakarta 3-7Pebruari.
Gill, DW., Kasno, A. and Kamprath, E.J. (1991): Response of upland crops topotassium and lime application in West Sumatera. Potash Review No. 2.
Ismunadji, M., Hakim, L.N., Zulkamaen, 1. and Yazawa, F. (1973): Physiolo-gical diseases of rice in Cihea. Contr. Centr. Res. Inst. Agric. Bogor No. 4.
Karama, A.S., Rasyid Marzuki, A. and Ibrahim Manwan (1990): Penggunaanpupuk organik pada tanaman pangan. Prosiding Lokakarya NasionalEfisiensi Penggunaan Pupuk V. Hal 395-425,
Moersidi, S., Djoko Santoso, Supartini, M., Al Jabri, M., Sri Adiningsih, J. and
Sudjadi, M. (1989): Peta keperluan Fosfat Tanah Sawah di Jawa Madura1988. Pemberitaan Tanah dan Pupuk No. 8. Puslittanak, Bogor.
Soejitno, J. (1985): Pest management and fertilizer policy. IFDC/CSR. In:Fertilizer efficiency research and training in the tropics. Bogor, 18
November-6 December.Sri Adiningsih, J. (1984): Factors affecting potassium supplying power of
lowland rice soil in Sukabumi and Bogor, West Java. PhD. Thesis, IPB (inIndonesian).
Sri Adiningsih, J., Djoko Santoso and Sudjadi, M. (1989): The status of N, P, K
and S of lowland rice soils in Java. ACIAR Proceedings No. 29: 68-76.
Sri Adiningsih, J. and Soejitno, J. (1991): The use of fertilizers and its effect on
pests and diseases of rice in Indonesia. Symp. The rational use of fertilizers
in order to do away completely with the injurious factors and with the
diseases of the plants. Bucharest- Romania.Sri Adiningsih, J. (1992): The role of efficient use of fertilizers to sustain self-
sufficiency in food. Speech of the Research Professor Inauguration. Bogor,
24 April (in Indonesian).Sri Adiningsih, J. (1994): Pengelolaan pupuk pada sistem usahatani lahan
kering. Training Workshop Penerapan Uji Tanah untuk Meningkatkan Hasil
Pertanian dan Memelihara Lingkungan. Puslittanak-Binus-FADINAP/FAO,Cisarua, 9-I1 November.
Sudjadi, M., Sri Adiningsih, J. and Gill, D.W. (1985): Potassium availability in
soils of Indonesia. Proceedings of 19th Coll. of the IPI. Potassium in the
Agric. systems of the humid tropics: 185-196.
450

Tim Studi Penghapusan Subsidi Pupuk (1989): Upaya Efisiensi PenggunaanPupuk Bersubsidi (aspek teknis). Sub Tim Teknis, Studi PenghapusanSubsidi Pupuk (SPSP), Ekuin, Jakarta (unpublished).
Tim Pengkajian Penggunaan Pupuk Bersubsidi (1993): Dep. Keuangan, Dep,Perindustrian, Dep. Pertanian, APPI. Jakarta (unpublished).
Wetzelaar, R., Sri Mulyani, N., Hadi Wahyono, Prawirasumantri, J. andDamdam, A.M. (1984): Deep point - Placed urea in flooded soils. Researchresults in West Java. Proceedings of Workshop on Urea Deep-Placed Techn.AARD-IFDC.
451

Constraints and Opportunities for Fertilizer Use inThailand
W. Cholitkul and P. Chanyanuwat
Director of Soil Science Division, Dept. of Agriculture, Bangkok, Thailand, andAgricultural Scientist, Agricultural Regulatory Division, Dept. of Agriculture,Bangkok, Thailand.
Abstract
Thailand has a monsoon type climate with pronounced wet and dry seasons.Thailand is one of the few countries in the world, and the only one in Asia andPacific, which has consistently produced a surplus in food crops and it is one ofthe few countries in Asia which is still a net fertilizer importer. All fertilizers areimported, either as finished NP and NPK products, or as intermediates whichare then locally mixed. Rice accounts for about 35% of the total fertilizer used.
1. IntroductionThailand is located in the tropical monsoon zone of Southeast Asia between
5' and 210 north latitude and between 970 and 1060 of east longitude. The main
part of the country is bordered on the west and north by Myanmar, on the east
by Laos and Cambodia. Peninsular Thailand extends to Malaysia, withMyanmar and the Andaman Sea on the west, and Gulf of Thailand on the east.The whole country covers approximately 50.4 million hectares. From the totalarea, 21 million hectares or 41% is farm holding, 59% for forest and grazingarea including urban, lakes, swamps, river highways, railroads and so on. About51% of the total farmland or II million hectares is devoted to rice cultivation(Table 1). Thailand is divided into four regions, namely the Central Plain with25 provinces, the North-Eastern region with 17 provinces, and the Southernregion with 14 provinces.
A monsoon type of climate with pronounced wet and dry seasons prevailsover most of the country. The average annual precipitation fluctuates between100 mm and 2000 mm, but rainfall is usually concentrated in six months fromMay to October, and the precipitation during this period often exceeds 85% ofthe total amount. However, the time of rainfall as well as the amount greatlyvary from year to year.
453

Delay in the onset of rainy season can cause problems at planting time andhigh rainfall often causes severe flooding over considerable areas resulting incrop damage. The average annual temperatures range between 260C and 280C.Although April is the hottest month and December the coldest month, thefluctuations in monthly temperature are usually less than 5°C.
Table 1. Land utilization by regions in unit-rai (I rai = 0.16 ha).
North-East North Central South Total
1. Total land area (mill.) 106 106 65 44 311
2. Forest land (mill.) 14 48 15 8 85
3. Unclassified land (mill.) 38 28 21 18 102
4. Farm holding land (mill.) 58 29 29 17 1334.1 ' Housing area (1000) 1252 942 852 489 3544.2. Paddy land (mill.) 38 15 12 4 694.3. Field crop (mill.) 13 10 9 0.1 344.4. Fruit trees and tree 2 2 4 12 20
crops (mill.)4.5. Vegetables and 209 275 309 64 858
ornamental plant(1000)4.6. Livestock farm area 395 134 124 53 707
(1000)4.7. Idle land (1000) 2068 431 445 676 36214.8. Other land (1000) 521 184 550 168 1423
5. Farm size (rai) 26 23 32 23 26
6. Number of farms (1000) 2183 1281 898 77 5130
Source: Office of Agriculture Economics, Ministry of Agriculture andCooperatives, Bangkok.
The population of Thailand was estimated at about 57.4 million in 1991.Comparison of this figure with 1982, which reported a total population of 50million, would indicate that the population has increased by 7.4 million in thepast 10 years. Over 62% of Thai population was directly engaged in some phaseof agriculture in 1991 (Table 2). Yet, Thailand has always been a foodexporting country. A question arises as to how long the country will enjoy foodsufficiency with the population increasing at a rate of more than 2% a year. It isalso true that agricultural production shows a small increasing trend.
454
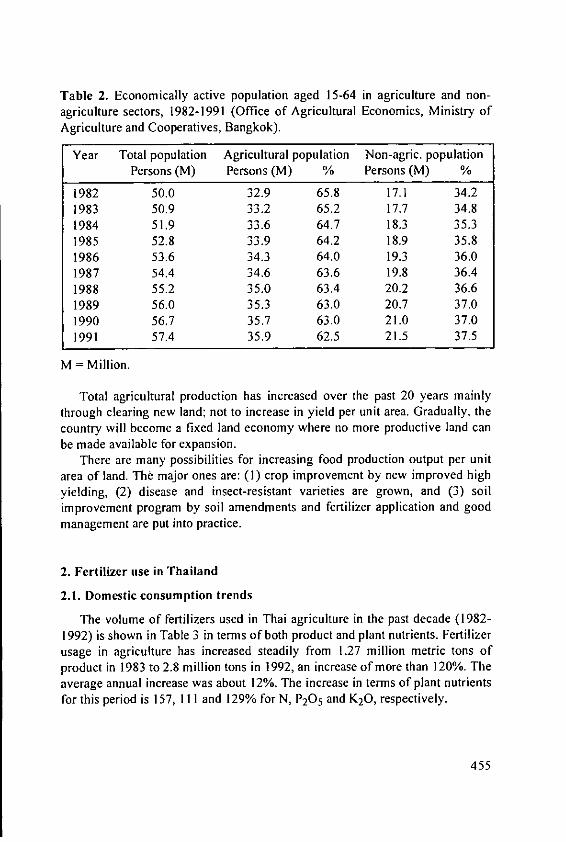
Table 2. Economically active population aged 15-64 in agriculture and non-agriculture sectors, 1982-1991 (Office of Agricultural Economics, Ministry ofAgriculture and Cooperatives, Bangkok).
Year Total population Agricultural population Non-agric. populationPersons (M) Persons (M) % Persons (M) %
1982 50.0 32.9 65.8 17.1 34.21983 50.9 33.2 65.2 17.7 34.81984 51.9 33.6 64.7 18.3 35.31985 52.8 33.9 64.2 18.9 35.81986 53.6 34.3 64.0 19.3 36.01987 54.4 34.6 63.6 19.8 36.41988 55.2 35.0 63.4 20.2 36.61989 56.0 35.3 63.0 20.7 37.01990 56.7 35.7 63.0 21.0 37.01991 57.4 35.9 62.5 21.5 37.5
M = Million.
Total agricultural production has increased over the past 20 years mainlythrough clearing new land; not to increase in yield per unit area. Gradually, thecountry will become a fixed land economy where no more productive land canbe made available for expansion.
There are many possibilities for increasing food production output per unitarea of land. The major ones are: (1) crop improvement by new improved highyielding, (2) disease and insect-resistant varieties are grown, and (3) soilimprovement program by soil amendments and fertilizer application and goodmanagement are put into practice.
2. Fertilizer use in Thailand
2.1. Domestic consumption trends
The volume of fertilizers used in Thai agriculture in the past decade (1982-1992) is shown in Table 3 in terms of both product and plant nutrients. Fertilizerusage in agriculture has increased steadily from 1.27 million metric tons ofproduct in 1983 to 2.8 million tons in 1992, an increase of more than 120%. Theaverage annual increase was about 12%. The increase in terms of plant nutrientsfor this period is 157, 111 and 129% for N, P20 5 and K20, respectively.
455

Table 3. Fertilizer consumption in 1983-1992 ('000 tons) (Office ofAgricultural Economics, Ministry of Agriculture and Cooperatives, Bangkok).
Year Total Nutrients Totalproduct N P20 5 K20 nutrient
1983 1272 233 154 84 471
1984 1247 228 143 68 438
1985 1250 253 125 56 434
1986 1350 308 132 70 5301987 1549 343 148 96 587
1988 1993 440 201 137 7781989 2298 495 189 118 802
1990 1649 576 318 149 1044
1991 2487 526 272 164 9621992 2807 600 326 192 1118
2.2. Fertilizer consumption by crops
Fertilizer consumption by crop groups is given in Table 4. In the last decade,fertilizer nutrient use has more than doubled, from 1.27 to 2.8 million tons. Themain user is rice which accounts for 35.2% of total usage in 1991/92.Consumption by this crop has increased from 669,000 t in 1983/84 to 988,000in 1991/92 with some fluctuation from year to year. However, the percentage oftotal nutrient input has declined for this crop. There has been a considerableincrease in fertilizer usage on orchards and vegetable crops.
Table 4. Fertilizer use by crops in 1983/84-1991/92 ('000 tons product) (Officeof Agricultural Economics, Ministry of Agriculture and Cooperatives,Bangkok).
Crop Fertilizer used in
1983/84 % 1988/89 % 1990/91 % 1991/92 %
Rice 669 52.6 52 42.8 830 33.4 988 35.2Field crops 275 21.6 380 19.1 546 21.9 610 21.8Orchards 170 13.4 478 24.0 694 27.9 770 27.4Vegetables& 158 12.4 282 14.1 417 16.8 539 15.6ornam. plantsTotal 1272 100.0 1992 100.0 2487 100.0 2806 100.0
456
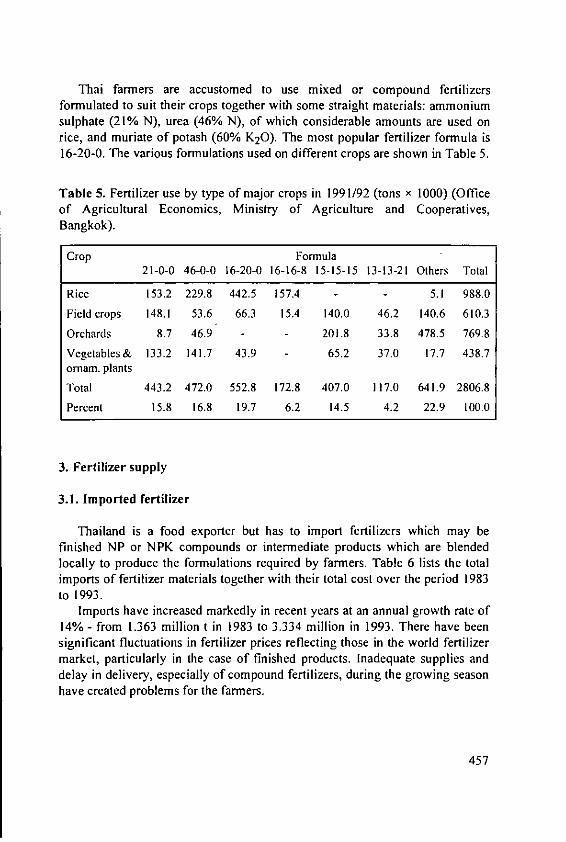
Thai farmers are accustomed to use mixed or compound fertilizersformulated to suit their crops together with some straight materials: ammoniumsulphate (21% N), urea (46% N), of which considerable amounts are used onrice, and muriate of potash (60% K20). The most popular fertilizer formula is16-20-0. The various formulations used on different crops are shown in Table 5.
Table 5. Fertilizer use by type of major crops in 1991/92 (tons x 1000) (Officeof Agricultural Economics, Ministry of Agriculture and Cooperatives,Bangkok).
Crop Formula
21-0-0 46-0-0 16-20-0 16-16-8 15-15-15 13-13-21 Others Total
Rice 153.2 229.8 442.5 157.4 - 5.1 988.0
Field crops 148.1 53.6 66.3 15.4 140.0 46.2 140.6 610.3
Orchards 8.7 46.9 - - 201.8 33.8 478.5 769.8
Vegetables& 133.2 141.7 43.9 - 65.2 37.0 17.7 438.7ornam. plants
Total 443.2 472.0 552.8 172.8 407.0 117.0 641.9 2806.8
Percent 15.8 16.8 19.7 6.2 14.5 4.2 22.9 100.0
3. Fertilizer supply
3.1. Imported fertilizer
Thailand is a food exporter but has to import fertilizers which may befinished NP or NPK compounds or intermediate products which are blendedlocally to produce the formulations required by farmers. Table 6 lists the totalimports of fertilizer materials together with their total cost over the period 1983to 1993.
Imports have increased markedly in recent years at an annual growth rate of14% - from 1.363 million t in 1983 to 3.334 million in 1993. There have beensignificant fluctuations in fertilizer prices reflecting those in the world fertilizermarket, particularly in the case of finished products. Inadequate supplies anddelay in delivery, especially of compound fertilizers, during the growing seasonhave created problems for the farmers.
457

Table 6. Fertilizer imports in volume and value in 1983-1993 (Office ofAgricultural Economics, Ministry of Agriculture and Cooperatives, Bangkok).
Year Product CIF value Nutrient ('000 tons)('000 t) (mill. Baht) N P20 5 K20 Total
1983 1363.0 4468.7 250.1 165.1 89.7 504.91984 1355.7 4533.4 247.6 155.1 73.8 476.61985 1310.8 4848.5 265.2 131.1 58.4 454.71986 1513.8 5188.8 354.9 148.6 78.8 573.41987 1772.2 5581.9 403.5 165.4 106.0 674.91988 2087.1 7725.6 454.5 208.2 129.9 792.61989 2485.7 9422.1 553.5 240.9 122.5 916.91990 2650.5 10431.8 573.8 301.3 167.6 1042.71991 2393.4 10238.5 499.3 262.5 178.6 940.41992 2856.1 12179.0 608.7 340.5 186.1 1135.31993 3337.8 13858.6 719.7 397.9 236.0 1353.6
I US$ = 25.5 Baht (1993).
Table 7 gives details of imports of the various fertilizer materials over theperiod 1985-1993. Over one million t straight nitrogen (urea and ammoniumsulphate) and some 650,000 t 16-0-0 (about one half of total fertilizer imports)came into the country in 1993.
Table 7. Fertilizer imports by type in 1985-1993 (product in '000 tons) (Dept.of Agriculture, Ministry of Agriculture and Cooperatives, Bangkok).
Fertilizer Yeargrade 1985 1989 1990 1991 1992 1993
46- 0- 0 124 463 460 365 494 59321- 0- 0 474 538 564 465 542 50516-20- 0 306 591 477 460 574 64620-20- 0 78 106 102 64 60 4015-15-15 71 232 294 350 299 37816-16-16 16 29 47 40 115 20413-13-21 24 55 76 64 83 7416-16- 8 36 124 214 132 189 32418-46- 0 33 86 134 68 144 1390- 0-60 35 61 87 91 94 111
Others 84 222 329 294 262 324Total 1281 2507 2781 1393 2856 3338
458
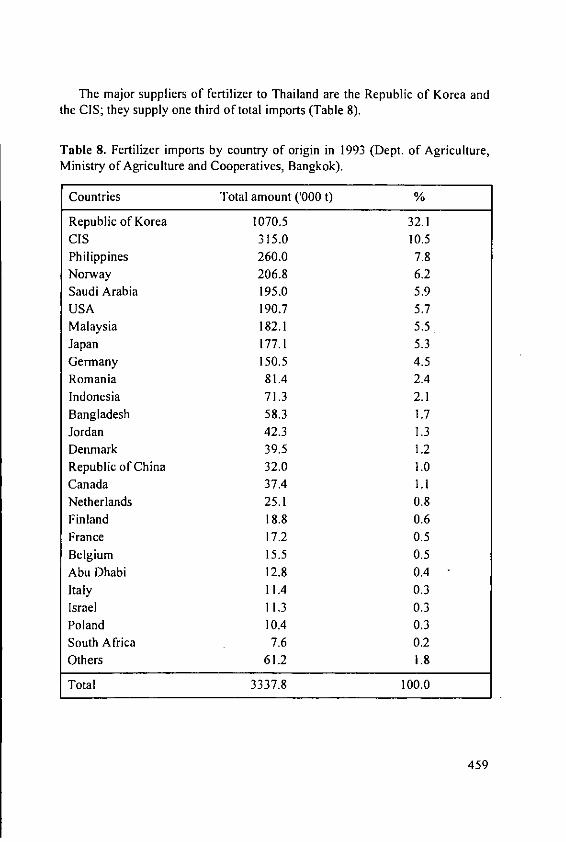
The major suppliers of fertilizer to Thailand are the Republic of Korea andthe CIS; they supply one third of total imports (Table 8).
Table 8. Fertilizer imports by country of origin in 1993 (Dept. of Agriculture,Ministry of Agriculture and Cooperatives, Bangkok).
Countries Total amount ('000 t) %
Republic of Korea 1070.5 32.1CIS 315.0 10.5Philippines 260.0 7.8Norway 206.8 6.2Saudi Arabia 195.0 5.9USA 190.7 5.7Malaysia 182.1 5.5Japan 177.1 5.3Germany 150.5 4.5Romania 81.4 2.4Indonesia 71.3 2.1Bangladesh 58.3 1.7Jordan 42.3 1.3Denmark 39.5 1.2Republic of China 32.0 1.0Canada 37.4 1.1Netherlands 25.1 0.8Finland 18.8 0.6France 17.2 0.5Belgium 15.5 0.5Abu Dhabi 12.8 0.4Italy 11.4 0.3Israel 11.3 0.3Poland 10.4 0.3South Africa 7.6 0.2Others 61.2 1.8
Total 3337.8 100.0
459

3.2. Domestic production
There is no production of primary fertilizer materials in Thailand and thedomestic industry is confined to producing the required NP and NPKformulations by blending imported materials. Currently, there are 90 firmsproducing various grades of granular, foliar and fluid fertilizers.
4. Agronomic and economic constraints to balance fertilizer application
4.1. Soil factor
Up to half of Thailand's paddy land is in the Northeast (6 million hectares)where paddy soils are largely sandy and low in soil fertility (Vacharotayan,1990). The soils are very low in CEC, organic matter and available plantnutrients. In addition, upland soils, which cover a substantial part of the country,are extensively red yellow podzolics, grey podzolics, and red yellow latosols areusually strongly acid, low in organic matter, relatively low in availablephosphate and low to medium in available potassium. Given that substantialcropping areas fall within the low fertility status, the use of fertilizers to achievesustainable yields is crucial. Table 9 shows that with continuous croppingwithout any nutrient, replacement by applying fertilizer can rapidly depleteavailable soil-P with concomitant decline in pH.
Table 9. Depletion of available soil nutrients under continuous croppingwithout fertilizer nutrient input.
Analysis 1976 1984
pH 1:1 5.2 4.8P (Bray ll): ppm 15 10Exch. K: ppm 19 17
Source: Boonumpon P. el al. (1991), Seminar on "The role of NFC onThailand's development.
Historically, it is also known that fertilizer replenishment for nutrientsremoval from the cropping areas have been minimal (Table 10). Although therehas been some increase in nutrient input through application of fertilizers, theincrease in crop removal has kept the negative nutrient balance just assubstantial as in the mid-70's. In the longer term, such a huge gap in nutrientreplenishment cannot be supportive of the philosophy of sustainable cropproduction.
460

Table 10. Balance of nutrient removal by crops and nutrient replenishment byfertilizers.
Year Nutrient removal by crops Nutrient replenishment by(million tons) fertilizer (million tons)
1976 1.16 0.201978 1.37 0.271980 1.38 0.291982 1.38 0.271983 1.58 0.33
Source: Boonumpon P. et al (1991), Seminar on "The role of NFC onThailand's development".
4.2. Agronomic and economic factors
In Thailand, these two factors are closely linked as most are small farmers.The need for credit to purchase fertilizers is a long standing problem. Thissituation is frequently made worser by the high cost of production and the lowfarmers selling price (Table I1).
Table 11. Planting area, yield, farmer's selling price and cost of production ofrice in Thailand (1981-89).
Year Planted area Yield Yield Selling price Cost ofproduction
million ha million ton kg/ha Baht/ton Baht/ton
1981 9.62 17.4 1888 3165 32881983 9.62 16.9 1888 2937 30661985 9.97 19.9 2069 2325 29731987 9.86 18.9 2050 2994 30621989 10.43 21.3 2144 4030 3088
Source: Office of Agricultural Economic Statistic Report No. 414 (1989).
Except for 1989, when the selling price was considerably higher, many yearswere of negative margin. This has worsened the indebtedness of the farmers.This has been the single factor affecting fertilizer application. This hasconsiderable impact on worsening the problem of soil mining. Unless the worldprice for rice improves considerably, it is unlikely that this situation can becorrected very quickly in the near future. Such a situation is not confined to riceonly, but also to sugarcane, maize and cassava.
461

In an analysis by Vacharotayan (1993), he showed that for rice, sugarcane,corn and cassava, an average of 136 kg/ha should be applied as fertilizer tocompensate the crop uptake and removal, but instead, farmers are only applying49 kg nutrients/ha, creating and increasing a serious nutrient deficit. AsThailand is a net exporter of food, this nutrient deficit cannot go on definitelywithout ultimately affecting crop productivity. The problem is clearly one ofeconomics of fertilization and less of agronomic. Hence, the constraints areclear and the opportunity for fertilizer use is excellent, so long as the economicsof cropping remain positive.
References
Ministry of Agriculture and Cooperatives: Agricultural Statistics of ThailandCrop Year 1992/1993.
Chunyanawat, P., Sakkasem, S. and Pomchai, S. (1994): Thailand fertilizerconsumption and supply. International Workshop on technology ofproducing compound fertilizer for tropic and subtropic regions. Zhengzhou,China.
Vacharotayan, S. (1990): Fertilizer use and research for crop production. IFDC-SFST Sector Dealers, 14-19 March 1990, Ambassador Hotel, Bangkok,Thailand.
462

Constraints and Opportunities for Fertilizer Use inVietnam
Nguyen Vy, Bui Dinh Dinh and Nguyen van BoInstitute for Soils and Fertilizers, Hanoi, Vietnam
Summary
Progress in improving agriculture in Vietnam in recent years is reviewed.Rice yield has increased from 2.3-2.5 t ha-I in 1970 to 3.43 t ha- in 1993 withup to 2 million t available for export. The country is self-sufficient in food.
Soil and fertilizer research is briefly outlined. Research has identifiednutrient constraints in different soils and established fertilizer recommendationsfor most crops and soil types. The adoption of sound fertilizer use hascontributed much to the increase in farm productivity. The more advancedfarmers have gained understanding of fertilizers but there are a number ofconstraints including inadequate distribution arrangements which restrict widerand appropriate fertilizer usage. At present, crop prices are low in relation tofertilizer cost; improvement of crop quality could correct this. Liberalization ofthe economy has facilitated agricultural expansion but much still remains to bedone in this sphere.
I. Introduction - Recent achievements in agricultural production
Some time ago, Vietnam was not self-supporting in rice, having to import asmuch as 0.8 million t annually. But, there has been substantial improvementover the past five years and we are now in a position to export 1.5 million t perannum and rank, behind Thailand and the USA, third in the world exportleague. Total food production has risen from 13.5 million t rice equivalent in1976 to 21.5 million in 1990 and an average of 24.4 million over the past 4years, increasing at 4.9% per year. Rice output was 11.8 million t in 1976, 19.2million in 1990 and around 23 million t in the past 2 years (Table 1).
463

Table 1. Area, production and yield of paddy rice.
1986 1989 1990 1991 1992
Area ('000ha)Total area: 5689 5896 6028 6303 6475of which: Spring rice 1828 1992 2074 2160 2279
Autumn rice 915 1140 1216 1383 1448Winter rice 2945 2763 2738 2760 2748
Production (million t)Total: 16.00 18.99 19.22 19.62 21.59of which: Spring 6.12 7.54 7.84 6.79 9.15
Autumn 3.00 4.06 4.11 4.71 4.91Winter 6.88 7.59 7.27 8.12 7.53
Paddy yield (t/ha)Average for 3 crops 2.81 3.23 3.19 3.11 3.33
Spring 3.34 3.78 3.78 3.14 4.01Autumn 3.29 3.56 3.68 3.41 3.39Winter 2.33 2.68 2.65 2.93 2.73
Rice export (million t) 1.420 1.624 1.033 1.946
Source: Statistical Yearbook (1993); Statistical Publishing House, Hanoi(1994).
Table 2 shows the production of non-rice crops which has grown from 1.6-2.3 million t rice equivalent to 2.6 million for 1991-94. Growth is especiallymarked for maize and sweet potato. Food production per capita in 1993 was 346kg rice equivalent (1976: 274 kg).
464
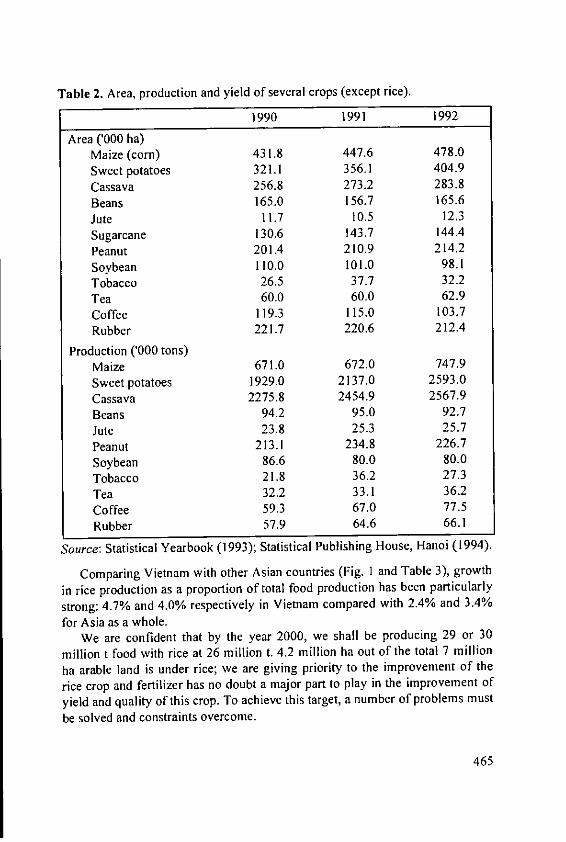
Table 2. Area, production and yield of several crops (except rice).
1990 1991 1992
Area ('000 ha)Maize (corn) 431.8 447.6 478.0Sweet potatoes 321.1 356.1 404.9Cassava 256.8 273.2 283.8Beans 165.0 156.7 165.6Jute 11.7 10.5 12.3
Sugarcane 130.6 143.7 144.4Peanut 201.4 210.9 214.2
Soybean 110.0 101.0 98.1Tobacco 26.5 37.7 32.2Tea 60.0 60.0 62.9Coffee 119.3 115.0 103.7Rubber 221.7 220.6 212.4
Production ('000 tons)Maize 671.0 672.0 747.9Sweet potatoes 1929.0 2137.0 2593.0Cassava 2275.8 2454.9 2567.9
Beans 94.2 95.0 92.7Jute 23.8 25.3 25.7Peanut 213.1 234.8 226.7Soybean 86.6 80.0 80.0Tobacco 21.8 36.2 27.3
Tea 32.2 33.1 36.2
Coffee 59.3 67.0 77.5Rubber 57.9 64.6 66.1
Source: Statistical Yearbook (1993); Statistical Publishing House, Hanoi (1994).
Comparing Vietnam with other Asian countries (Fig. I and Table 3), growth
in rice production as a proportion of total food production has been particularly
strong: 4.7% and 4.0% respectively in Vietnam compared with 2.4% and 3.4%
for Asia as a whole.We are confident that by the year 2000, we shall be producing 29 or 30
million t food with rice at 26 million t. 4.2 million ha out of the total 7 million
ha arable land is under rice; we are giving priority to the improvement of the
rice crop and fertilizer has no doubt a major part to play in the improvement of
yield and quality of this crop. To achieve this target, a number of problems must
be solved and constraints overcome.
465
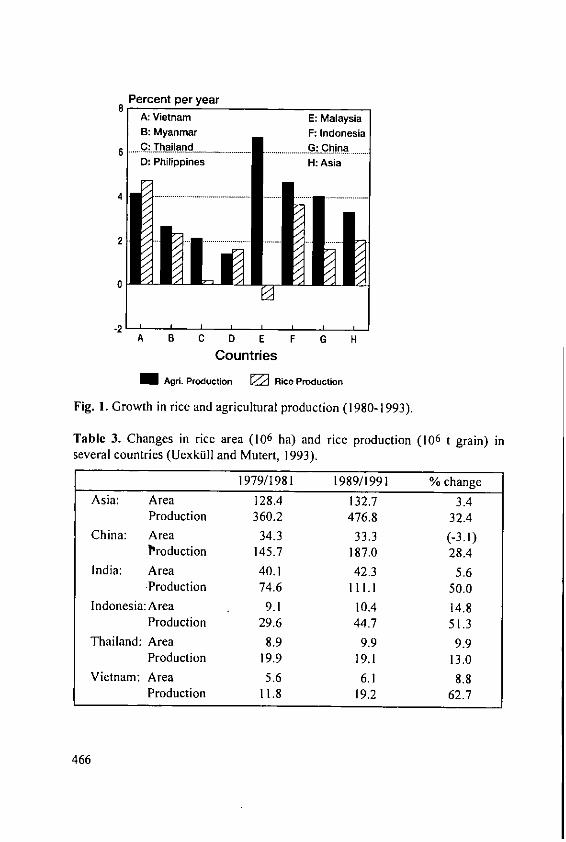
Percent per yearA: Vietnam E: MalaysiaB: Myanmar F: IndonesiaC: Thailand . G: China
D: Philippines H: Asia
42 -
-21A B C D E F G H
Countries
M Agri. Production ZI Rice Production
Fig. 1. Growth in rice and agricultural production (1980-1993).
Table 3. Changes in rice area (106 ha) and rice production (106 t grain) inseveral countries (Uexkill and Mutert, 1993).
1979/1981 1989/1991 % change
Asia: Area 128.4 132.7 3.4Production 360.2 476.8 32.4
China: Area 34.3 33.3 (-3.1)?'oduction 145.7 187.0 28.4
India: Area 40.1 42.3 5.6Production 74.6 111.1 50.0
Indonesia:Area 9.1 10.4 14.8Production 29.6 44.7 51.3
Thailand: Area 8.9 9.9 9.9Production 19.9 19.1 13.0
Vietnam: Area 5.6 6.1 8.8Production 11.8 19.2 62.7
466

2. Opportunities for fertilizer use in Vietnam
2.1. Soils and soil fertility research
Soils of northern Vietnam were surveyed using the Russian soilclassification system at the end of the fifties and maps on scales 1:1 000 000 and1:500 000 are available. A soil map of the whole unified country was publishedin 1983 and provincial soil maps on various scales were also produced. Detailsof the characteristics used are given in Tables 4 and 5, and the comparisonbetweeen the USSR system and the FAO-UNESCO system used in present daysurvey work in Table 6.
2.2. Soil fertility research
Soil fertility research has been concerned with two main lines: assessment ofinherent fertility of various soil types and the way in which they respond tofertilizer treatment.
Early work in the seventies and eighties led to the conclusion that soilphosphorus supply was an important yield limiting factor on the majority ofsoils.
As a result of unbalanced (N and P only) fertilizer use, potassium hasbecome the chief limiting factor on some soils (Tables 7-13). This work hasincluded assessment of the suitability of specific soil types for particular cropsand/or cropping systems in terms of both yield and economic return.
The dynamics of phosphorus in rice soils has been studied in some detail(Figs. 2 and 3). The effect of CEC on yield of different local and improved ricevarieties has been investigated (Fig. 4).
467
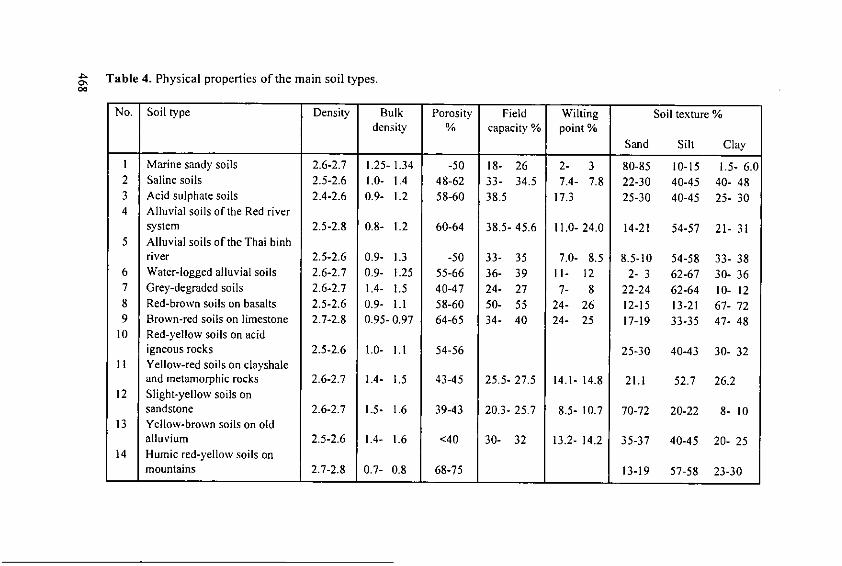
Table 4. Physical properties of the main soil types.cc
No. Soil type Density Bulk Porosity Field Wilting Soil texture %density % capacity % point %
Sand Silt Clay
I Marine sandy soils 2.6-2.7 1.25- 1.34 -50 18- 26 2- 3 80-85 10-15 1.5- 6.02 Saline soils 2.5-2.6 1.0- 1.4 48-62 33- 34.5 7.4- 7.8 22-30 40-45 40- 483 Acid sulphate soils 2.4-2.6 0.9- 1.2 58-60 38.5 17.3 25-30 40-45 25- 304 Alluvial soils of the Red river
system 2.5-2.8 0.8- 1.2 60-64 38.5- 45.6 11.0- 24.0 14-21 54-57 21- 315 Alluvial soils of the Thai binh
river 2.5-2.6 0.9- 1.3 -50 33- 35 7.0- 8.5 8.5-10 54-58 33- 386 Water-logged alluvial soils 2.6-2.7 09- 1.25 55-66 36- 39 11- 12 2- 3 62-67 30- 367 Grey-degraded soils 2.6-2.7 1.4- 1.5 40-47 24- 27 7- 8 22-24 62-64 10- 128 Red-brown soils on basalts 2.5-2.6 0.9- 1.1 58-60 50- 55 24- 26 12-15 13-21 67- 729 Brown-red soils on limestone 2.7-2.8 0.95- 0.97 64-65 34- 40 24- 25 17-19 33-35 47- 48
10 Red-yellow soils on acidigneous rocks 2.5-2.6 1.0- 1.1 54-56 25-30 40-43 30- 32
11 Yellow-red soils on clayshaleand metamorphic rocks 2.6-2.7 1.4- 1.5 43-45 25.5- 27.5 14.1- 14-8 21.1 52.7 26.2
12 Slight-yellow soils onsandstone 2.6-2.7 1.5- 1.6 39-43 20.3- 25.7 8.5- 10.7 70-72 20-22 8- 10
13 Yellow-brown soils on oldalluvium 2.5-2.6 1.4- 1.6 <40 30- 32 13.2- 14.2 35-37 40-45 20- 25
14 Humic red-yellow soils onmountains 2.7-2.8 0.7- 0.8 68-75 13-19 57-58 23-30
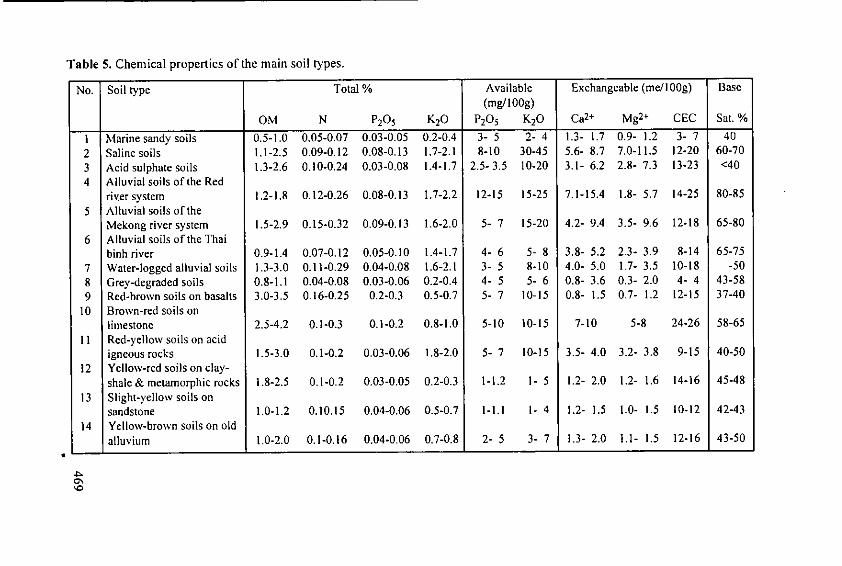
Table 5. Chemical properties of the main soil types.
No. Soil type Total % Available Exchangeable (me/l00g) Base(mg/100g)
OM N P205 K20 P20 5 K20 Ca2+ Mg 2+ CEC Sat. %
I Marine sandy soils 0.5-1.0 0.05-0.07 0.03-0.05 0.2-0.4 3- 5 2- 4 1.3- 1.7 0.9- 1.2 3- 7 402 Saline soils 1.1-2.5 0.09-0.12 0.08-0.13 1.7-2.1 8-10 30-45 5.6- 8.7 7.0-11.5 12-20 60-703 Acid sulphate soils 1.3-2.6 0.10-0.24 0.03-0.08 1.4-1.7 2.5- 3.5 10-20 3.1- 6.2 2.8- 7.3 13-23 <404 Alluvial soils of the Red
river system 1.2-1.8 0.12-0.26 0.08-0.13 1.7-2.2 12-15 15-25 7.1-15.4 1.8- 5.7 14-25 80-85
5 Alluvial soils of theMekong river system 1.5-2.9 0.15-0.32 0.09-0.13 1.6-2.0 5- 7 15-20 4.2- 9.4 3.5- 9.6 12-18 65-80
6 Alluvial soils of the Thaibinh river 0.9-1.4 0.07-0.12 0.05-0.10 1.4-1.7 4- 6 5- 8 3.8- 5.2 2.3- 3.9 8-14 65-75
7 Water-logged alluvial soils 1.3-3.0 0.11-0.29 0.04-0.08 1.6-2.1 3- 5 8-10 4.0- 5.0 1.7- 3.5 10-18 -50
8 Grey-degraded soils 0.8-1.1 0.04-0.08 0.03-0.06 0.2-0.4 4- 5 5- 6 0.8- 3.6 0.3- 2.0 4- 4 43-589 Red-brown soils on basalts 3.0-3.5 0.16-0.25 0.2-0.3 0.5-0.7 5- 7 10-15 0.8- 1.5 0.7- 1.2 12-15 37-40
10 Brown-red soils onlimestone 2.5-4.2 0.1-0.3 0.1-0.2 0.8-1.0 5-10 10-15 7-10 5-8 24-26 58-65
11 Red-yellow soils on acidigneous rocks 1.5-3.0 0.1-0.2 0.03-0.06 1.8-2.0 5- 7 10-15 3.5- 4.0 3.2- 3.8 9-15 40-50
12 Yellow-red soils on clay-shale & metamorphic rocks 1.8-2.5 0.1-0.2 0.03-0.05 0.2-0.3 1-1.2 I- 5 1.2- 2.0 1.2- 1.6 14-16 45-48
13 Slight-yellow soils onsandstone 1.0-1.2 0.10.15 0.04-0.06 0.5-0.7 1-1.1 I- 4 1.2- 1.5 1-0- 1.5 10-12 42-43
14 Yellow-brown soils on oldalluvium 1.0-2.0 0.1-0.16 0.04-0.06 0.7-0.8 2- 5 3- 7 1.3- 2.0 1.1- 1.5 12-16 43-50
S -
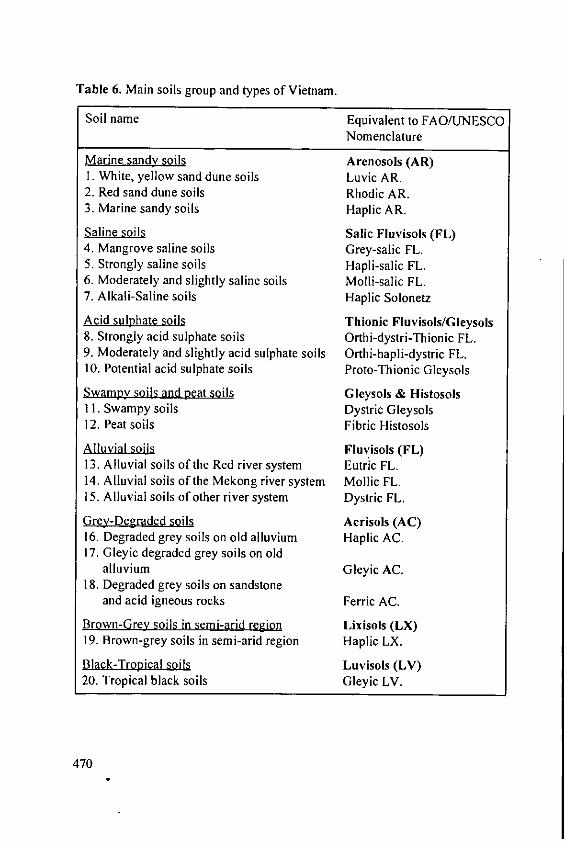
Table 6. Main soils group and types of Vietnam.
Soil name Equivalent to FAO/UNESCONomenclature
Marine sandy soils Arenosols (AR)1. White, yellow sand dune soils Luvic AR.2. Red sand dune soils Rhodic AR.3. Marine sandy soils Haplic AR.
Saline soils Salic Fluvisols (FL)4. Mangrove saline soils Grey-salic FL.5. Strongly saline soils Hapli-salic FL.6. Moderately and slightly saline soils Molli-salic FL.7. Alkali-Saline soils Haplic Solonetz
Acid sulphate soils Thionic Fluvisols/Gleysols8. Strongly acid sulphate soils Orthi-dystri-Thionic FL.9. Moderately and slightly acid sulphate soils Orthi-hapli-dystric FL.10. Potential acid sulphate soils Proto-Thionic Gleysols
Swampy soils and neat soils Gleysols & Histosols11. Swampy soils Dystric Gleysols
12. Peat soils Fibric Histosols
Alluvial soils Fluvisols (FL)13. Alluvial soils of the Red river system Eutric FL.14. Alluvial soils of the Mekong river system Mollic FL.15. Alluvial soils of other river system Dystric FL.
Grey-Degraded soils Acrisols (AC)16. Degraded grey soils on old alluvium Haplic AC.17. Gleyic degraded grey soils on old
alluvium Gleyic AC.18. Degraded grey soils on sandstone
and acid igneous rocks Ferric AC.
Brown-Grey soils in semi-arid region Lixisols (LX)19. Brown-grey soils in semi-arid region Haplic LX.
Black-Tropical soils Luvisols (LV)20. Tropical black soils Gleyic LV.
470
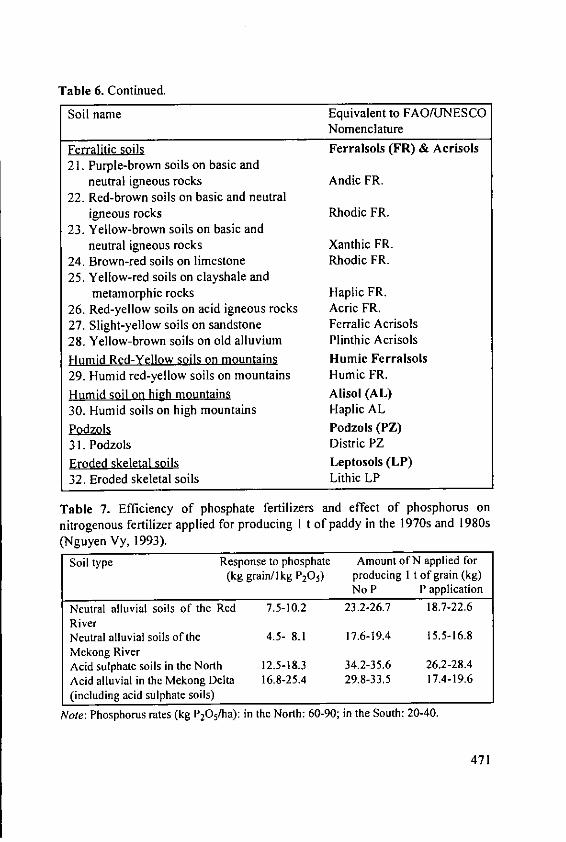
Table 6. Continued.
Soil name Equivalent to FAO/UNESCONomenclature
Ferralitic soils Ferralsols (FR) & Aerisols21. Purple-brown soils on basic and
neutral igneous rocks Andic FR.22. Red-brown soils on basic and neutral
igneous rocks Rhodic FR.23. Yellow-brown soils on basic and
neutral igneous rocks Xanthic FR.24. Brown-red soils on limestone Rhodic FR.25. Yellow-red soils on clayshale and
metamorphic rocks Haplic FR.26. Red-yellow soils on acid igneous rocks Acric FR.27, Slight-yellow soils on sandstone Ferralic Acrisols28. Yellow-brown soils on old alluvium Plinthic Acrisols
Humid Red-Yellow soils on mountains Humic Ferralsols29. Humid red-yellow soils on mountains Humic FR.
Humid soil on high mountains Alisol (AL)30. Humid soils on high mountains Haplic AL
Podzols Podzols (PZ)31. Podzols Distric PZ
Eroded skeletal soils Leptosols (LP)32. Eroded skeletal soils Lithic LP
Table 7. Efficiency of phosphate fertilizers and effect of phosphorus onnitrogenous fertilizer applied for producing I t of paddy in the 1970s and 1980s(Nguyen Vy, 1993).
Soil type Response to phosphate Amount of N applied for(kg grain/lkg P20 5) producing I t of grain (kg)
No P P application
Neutral alluvial soils of the Red 7.5-10.2 23.2-26.7 18.7-22.6RiverNeutral alluvial soils of the 4.5- 8.1 17.6-19.4 15.5-16.8Mekong RiverAcid sulphate soils in the North 12.5-18.3 34.2-35.6 26.2-28.4Acid alluvial in the Mekong Delta 16.8-25.4 29.8-33.5 17.4-19.6(including acid sulphate soils)
Note: Phosphorus rates (kg P20 5 ha): in the North: 60-90; in the South: 20-40.
471

Table 8. Influence of P application on N-fertilizer efficiency on rice (alluvialsoils) (National Research Program 02-11; cited by Nguyen Van Bo, 1994).
N:P20 5 ratio* kg grain/ I kg N kg N for generating I ton grain1:0.0 10-12 >251:0.5 15-20 22-251:1.0 20-22 19-221:1.5 25-28 17-201:2.0 25-28 17-20
Rate of N: 60-90 kg/ha.
Table 9. Influence of K application on N-fertilizer efficiency (degraded soils).
Treatments kg grain/I kg N kg N for generating I ton grainRice Corn Rice Corn
NP 0.5 36.5NPK 14.5 - 24.2NP + FYM 7.5 15.2 24.2 37.5NPK + FYM 13.9 22.9 20.9 29.1
Source: Nguyen Van Bo, Cong Thi Yen, 1993.
Table 10. Potassium in the soils and K fertilizer efficiency:
Soil types K20 (%) Treatments kg grain/ I kg K20 appliedRice Corn
Alluvial soils 1.92 No FYM 2.5 10.6with FYM 0.8 3.9
Degraded soils 0.15 No FYM 18.7 37.2with FYM 8.5 10.3
Source: Nguyen Van Bo, Cong Thi Yen, 1993.
Table I1. Amount of N for producting I t on paddy with and without K-application* (Nguyen Vy, 1992).
'reatments Amount of nitrogen from chemical nitrogenfertilizers for producing I t grain (kg N)
1.6t'YM+ 90P 20 5 + 90N(TI) 24.62. TI + 60 K20 22.43.TI + 120 K20 21.14.6 t FYM + 90 P205 + 150 N (T2) 37.25. T2 + 60 K20 32.96. T2 + 120 K20 30.3
Note: As with P in the 1970s and 1980s, the potassium application has reducedsignificantly the amount of N for producting I ton of grain.
472
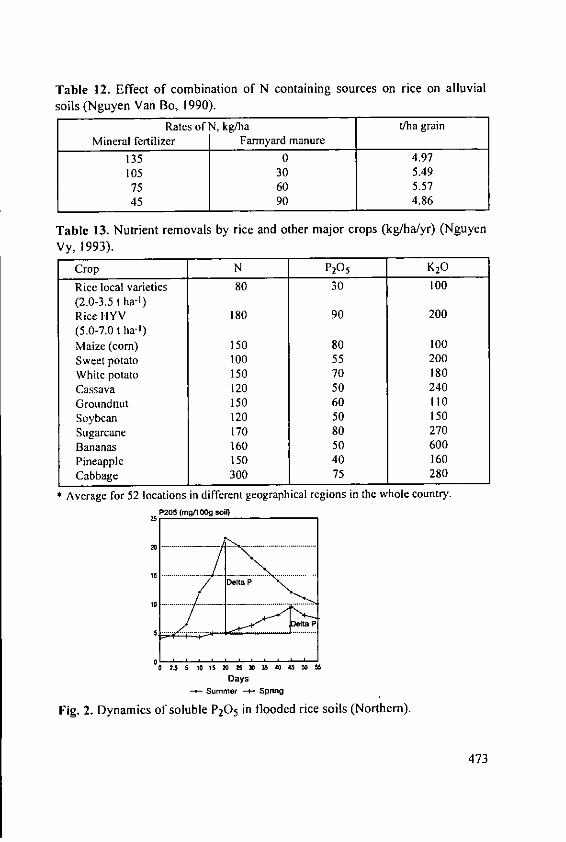
Table 12. Effect of combination of N containing sources on rice on alluvialsoils (Nguyen Van Bo, 1990).
Rates of N, kg/ha t/ha grainMineral fertilizer Farmyard manure
135 0 4.97105 30 5.4975 60 5.5745 90 4.86
Table 13. Nutrient removals by rice and other major crops (kg/ha/yr) (Nguyen
Vy, 1993).
Crop N P2 05 K20
Rice local varieties 80 30 100(2.0-3.5 t ha-I)Rice IIYV 180 90 200(5.0-7.0 t ha-1)Maize (corn) 150 80 100Sweet potato 100 55 200White potato 150 70 180Cassava 120 50 240Groundnut 150 60 110
Soybean 120 50 150
Sugarcane 170 80 270Bananas 160 50 600Pineapple 150 40 160
Cabbage 300 75 280
Average for 52 locations in different geographical regions in the whole country.P205 (g/1 OOg soi)
25
20 .
0.2 01 MMM40S
Days
Summer --- Spring
Fig. 2. Dynamics of soluble P20 5 in flooded rice soils (Northern).
473
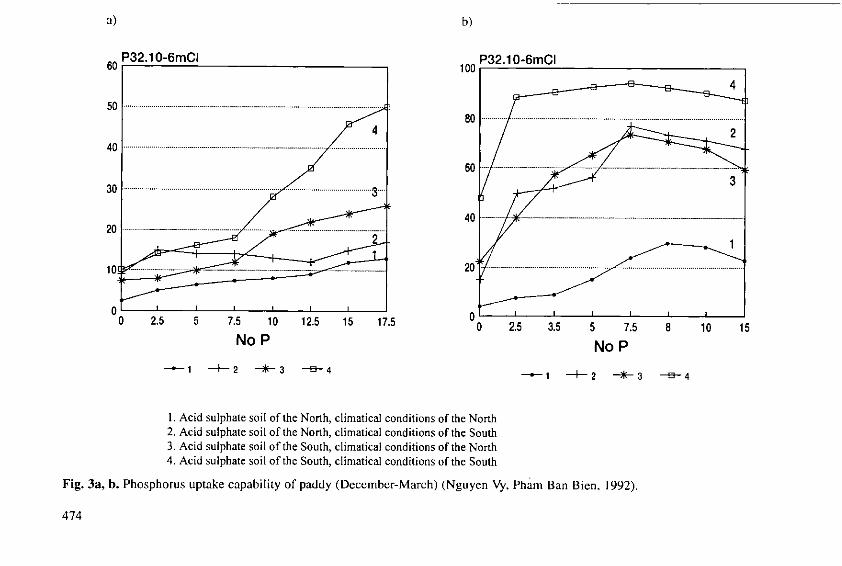
a) b)
60 P32.10-6mCI 100 P32.10-6mCI
404
00 ... . .... .. .. ..0 2 202
30--3--lOJ 2~~ ~ ~ ~~0 .. .... ............ .. ..................... . ... .........
0 2.5 5 7.5 10 12.5 15 17.500 2. 5 5 75 8 10 5
No P No P
j 2 3 41 "-J- 2 -3 -E3-4
1. Acid sulphate soil of the North, climatical conditions of the North2. Acid sulphate soil of the North, climatical conditions of the South3. Acid sulphate soil of the South, climatical conditions of the North4. Acid sulphate soil of the South, climatical conditions of the South
Fig. 3a, b. Phosphorus uptake capability of paddy (December-March) (Nguyen Vy, Pham Ban Bien, 1992).
474
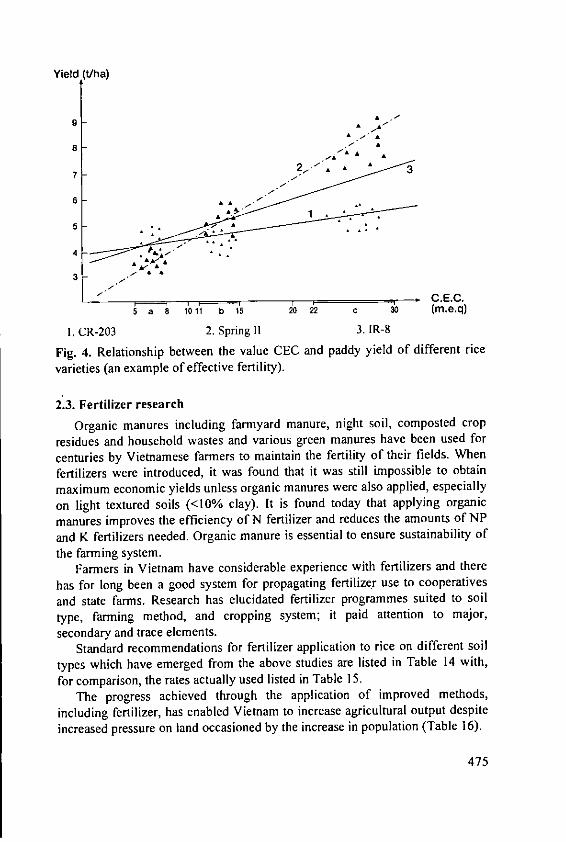
Yield t/ha)
A A
A A
a A *A7
6 - A
3 - / **
C.E.C.
5a 1011 b 15 20 22 C so (m.e.q)
1. CR-203 2. Spring II 3. IR-8
Fig. 4. Relationship between the value CEC and paddy yield of different rice
varieties (an example of effective fertility).
2.3. Fertilizer research
Organic manures including farmyard manure, night soil, composted crop
residues and household wastes and various green manures have been used for
centuries by Vietnamese farmers to maintain the fertility of their fields. When
fertilizers were introduced, it was found that it was still impossible to obtain
maximum economic yields unless organic manures were also applied, especially
on light textured soils (<10% clay). It is found today that applying organic
manures improves the efficiency of N fertilizer and reduces the amounts of NP
and K fertilizers needed. Organic manure is essential to ensure sustainability of
the farming system.Farmers in Vietnam have considerable experience with fertilizers and there
has for long been a good system for propagating fertilizer use to cooperatives
and state farms. Research has elucidated fertilizer programmes suited to soil
type, farming method, and cropping system; it paid attention to major,
secondary and trace elements.Standard recommendations for fertilizer application to rice on different soil
types which have emerged from the above studies are listed in Table 14 with,for comparison, the rates actually used listed in Table 15.
The progress achieved through the application of improved methods,
including fertilizer, has enabled Vietnam to increase agricultural output despite
increased pressure on land occasioned by the increase in population (Table 16).
475
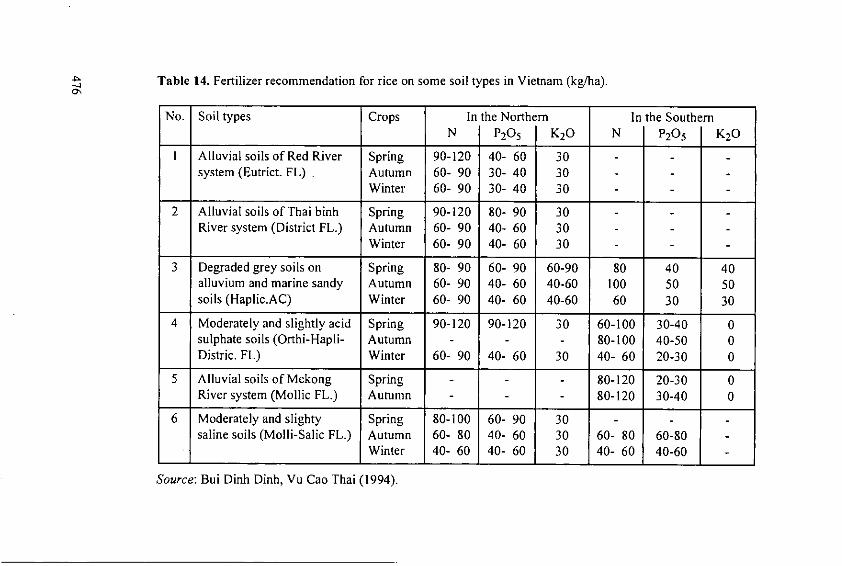
Table 14. Fertilizer recommendation for rice on some soil types in Vietnam (kg/ha).
No. Soil types Crops In the Northern In the SouthernN P205 I K2 0 N P20 5 I K20
I Alluvial soils of Red River Spring 90-120 40- 60 30 - - -
system (Eutrict. FL) Autumn 60- 90 30- 40 30 - - -
Winter 60- 90 30- 40 30 - - -
2 Alluvial soils of Thai binh Spring 90-120 80- 90 30 - - -
River system (District FL.) Autumn 60- 90 40- 60 30 -
Winter 60- 90 40- 60 30
3 Degraded grey soils on Spring 80- 90 60- 90 60-90 80 40 40alluvium and marine sandy Autumn 60- 90 40- 60 40-60 100 50 50soils (Haplic.AC) Winter 60- 90 40- 60 40-60 60 30 30
4 Moderately and slightly acid Spring 90-120 90-120 30 60-100 30-40 0sulphate soils (Orthi-Hapli- Autumn - - - 80-100 40-50 0Distric. FL) Winter 60- 90 40- 60 30 40- 60 20-30 0
5 Alluvial soils of Mekong Spring - - - 80-120 20-30 0River system (Mollic FL.) Autumn - - 80-120 30-40 0
6 Moderately and slighty Spring 80-100 60- 90 30 - - -
saline soils (Molli-Salic FL.) Autumn 60- 80 40- 60 30 60- 80 60-80Winter 40- 60 40- 60 30 40- 60 40-60
Source: Bui Dinh Dinh, Vu Cao Thai (1994).

Table 15. Fertilizer rates and ratio used per ha for rice on some soil types in Vietnam.
No. Soil types Dosage, kg/ha RatioN P20 5 K2 0 N P20 5 K2 0
I Alluvial soils of the Red riversystem (Eutric FL) 76.2 26.4 2.1 100 35 3
2 Alluvial soils of Thai binhriver system (Dystric FL) 87.1 40.1 2.0 100 46 2
3 Degraded greysoils onalluvium (Haplic AC) 69.5 16.4 10.8 100 24 16
4 Marine sandy soils (HaplicAC) 79.7 39.3 14.0 100 49 18
5 Moderatly and slightly acidssunphate soils (Ornhi-Hapli-Dictric FL)
- In the northern 90.0 67.0 0.0 100 74 0- In the southern 83.0 4.8 0.0 100 6 0
6 Alluvial soils of Mekong riversystem (Mollic FL) 101.0 45.0 2.5 100 45 2.5
7 Moderately and slightly salinesoils (Moli-Salic-FL)
- In the northern 90.0 40.0 10 100 44 1I
- In the southern 63.0 34.6 0 100 55 0
Average 82.1 35.9 4.6 100 43.7 5.6
Source: Bui Dinh Dinh, Nguyen Trong Thi, Vu Cao Thai (1994).

Table 16. Changes in land area per capita in Vietnam.
Land m2/capita 1990 compared1980 1985 1990 with 1980, %
Natural land 6165 5530 4998 81.1Agricultural land 1292 1156 1056 81.7Land for rice 1042 717 620 59.5
Source: Agricultural Statistics of Vietnam, 1994.
2.4. Supply of fertilizer
2.4. 1. Supplies
In the past, fertilizer supply was under State control and was plannedcentrally. District committees determined district requirements which wereaggregated at provincial level and submitted to the national State committee.Later, allocation was taken over by the Ministry of Agriculture and FoodIndustry through the Vietnam General Corporation of Agricultural Materials(VIGECAM) working through agricultural offices at different levels. Eachdistrict and province was allocated a quota for imported fertilizer. Nowadays,under more liberal conditions, VIGECAM is responsible for the whole systemcovering importation, supply and distribution and, further, private companiesplay their part in VIGECAM.
There is considerable local production of nitrogen and phosphorus fertilizer- 6 factories with million t annual capacity, meeting 70% of the P fertilizerrequirement and 10% of nitrogen fertilizer requirement. One urea factory(annual capacity 100 000 t) also supplies 300 000 t compound fertilizer. Thereare plans to set up a joint venture with All Ocean International Group (USA) toproduce 450 000 t a year DAP.There is a long way to go before Vietnam is self-sufficient in fertilizer.
2.4.2. Storage and transport
Some of the difficulties encountered earlier in ensuring timely delivery offertilizer (lack of storage capacity which was only 30 000 m3, lack of transport)are now being overcome by joint efforts of Government, cooperatives andprivate companies.
478
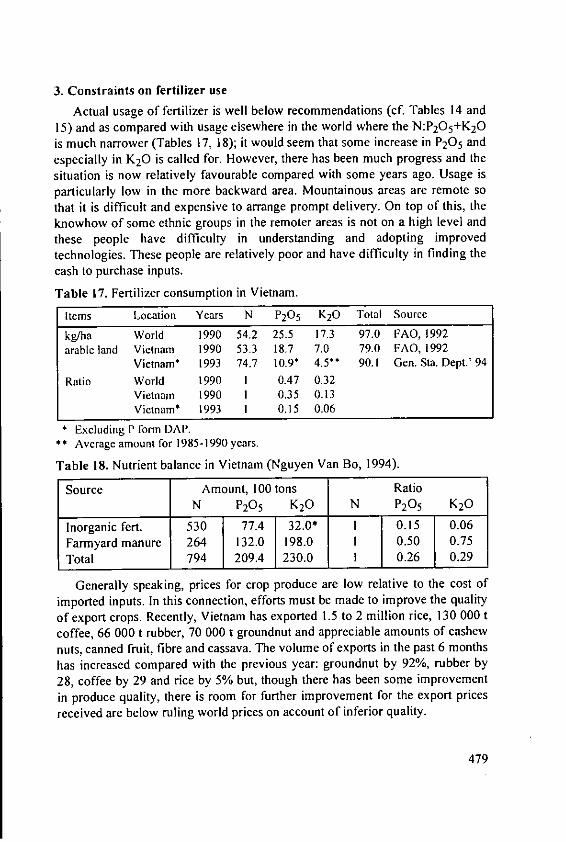
3. Constraints on fertilizer use
Actual usage of fertilizer is well below recommendations (cf. Tables 14 and15) and as compared with usage elsewhere in the world where the N:P20 5+K20is much narrower (Tables 17, 18); it would seem that some increase in P20 5 andespecially in K20 is called for. However, there has been much progress and thesituation is now relatively favourable compared with some years ago. Usage isparticularly low in the more backward area. Mountainous areas are remote sothat it is difficult and expensive to arrange prompt delivery. On top of this, theknowhow of some ethnic groups in the remoter areas is not on a high level andthese people have difficulty in understanding and adopting improvedtechnologies. These people are relatively poor and have difficulty in finding thecash to purchase inputs.
Table 17. Fertilizer consumption in Vietnam.
Items Location Years N P20 5 K20 Total Source
kg/ha World 1990 54.2 25.5 17.3 97.0 ['AO, 1992arabic land Vietnam 1990 53.3 18.7 7.0 79.0 FAO, 1992
Vietnam* 1993 74.7 10.9* 4.5** 90.1 Gen. Sta. Dept.' 94
Ratio World 1990 I 0.47 0.32Vietnam 1990 I 0.35 0.13Vietnam* 1993 I 0.15 0.06
* Excluding P form DAP.** Average amount for 1985-1990 years.
Table 18. Nutrient balance in Vietnam (Nguyen Van Bo, 1994).
Source Amount, 100 tons RatioN P20 5 K20 N P20 5 K20
Inorganic fert. 530 77.4 32.0* I 0.15 0.06Farmyard manure 264 132.0 198.0 I 0.50 0.75Total 794 209.4 230.0 1 0.26 0.29
Generally speaking, prices for crop produce are low relative to the cost ofimported inputs. In this connection, efforts must be made to improve the qualityof export crops. Recently, Vietnam has exported 1.5 to 2 million rice, 130 000 1coffee, 66 000 t rubber, 70 000 t groundnut and appreciable amounts of cashewnuts, canned fruit, fibre and cassava. The volume of exports in the past 6 monthshas increased compared with the previous year: groundnut by 92%, rubber by28, coffee by 29 and rice by 5% but, though there has been some improvementin produce quality, there is room for further improvement for the export pricesreceived are below ruling world prices on account of inferior quality.
479

4. Conclusion
Considerable progress has been made in recent years in increasing theproductivity of Vietnamese agriculture. Though we produce enough to feed ourpopulation and, indeed, have a surplus for export population increasing by 2%per annum for the whole country and at a higher rate (3%) in more backwardareas. In this connection, the data in Table 16, showing a decline in area ofutiliable land per head of population of around 20% over the period 1980 to1990, serves to underline this problem. Clearly, further effort is required andequally evident, fertilizer will have an important part to play in furtherimprovement.
Reformation and liberalization of the agricultural sector must be speeded upwith better regulation of the fertilizer market and supply mechanism. In-countryfertilizer manufacture should be expanded with the target of self-sufficiency.The link between research and the farmer must be strengthened throughexpansion of the adisory services if we are to establish sustainable agriculture.
References
Bui Dinh Dinh and Vu Cao Thai (1994): Extension Training in BalancedFertilizer Use. Ho Chi Minh City, 27-28 October.
Hossain, M. (1994): World rice market and Vietnam agriculture beyond 2000.Vietnam-IRRI Rice Conference. Hanoi, 4-7 May.
Nguyen van Bo and Nguyen Tu Siem (1994): Extension of integrated plantnutrition system in Vietnam. The Expert Consultation of The Asian Networkon Bio and Organic Fertilizers. Kandy, Sri Lanka, 3-7 October.
Nguyen Van Bo (1995): Potassium fertilizer efficiency in relation to balancedfertilization of cereals in Vietnam. Report presented at the Workshop onPotassium Efficiency in Relation to Balanced Fertilization for Better Crop inVietnam. Hanoi, January 11-12.
Nguyen Vy (1993): Soil policy for sustainable agriculture and environmentimprovement. Final Report of National Project KT 02-09.
Nguyen Vy (1992): Some problems relating to soil fertility and fertilizer useefficiency in Vietnam. Paper prepared for FAO mission for implementingthe aid-program for fertilizer supply by the Government of the Netherlandsto Vietnam. 5-15 January.
Nguyen Vy (1990): Phosphate sources for acid soils in Vietnam. Proceedings ofthe Workshop on phosphate sources for acid soils in the humid tropic ofAsia. Kuala Lumpur, Malaysia, 6-7 November.
480

Nguyen Vy and Pham van Bien (1992): MY and MEY for rice production inVietnam. Paper presented at TISMYR, Beijing, China.
Nguyen Vy and Nguyen Trong Thi (1993): Environment impacts of irrationaland unbalanced fertilization through real fertilization status survey on districtlevel. Report of Phase I of the Project "Environmentally friendly fertilizationthrough balanced fertilizer use". FADINAP-FINIDA-ISF. Hanoi.
Nguyen Vy (1994): Sesameseed research results in marine sandy soils of Nghean province. Annual report of Vietnam-Japan Sesameseed Project.
Nguyen Vy (1992): Potassium fertilizer efficiency for rice. Annual report ofISF, Hanoi.
Statistical Yearbook of Vietnam (1993): Statistical Publishing House, Hanoi,1994.
Statistical Data of Agriculture, Forestry and Fishery (1985-1993): StatisticalPublishing House, Hanoi, 1994.
UexkUll, Von H.R. and Mutert E. (1993): Fertilizer use and sustainable in Asia.PPI-ESEAP.
481
Constraints and Opportunities for Fertilizer Use inCentral Asia and Kazakhstan
V. ProkoshevUnion of Potash Producers and Exporters, Moscow, Russia
Summary
There is a great potential for agricultural development in the extensive areaof Kazakhstan and Central Asia. Severe problems arise from the recent socialchanges which have affected agriculture adversely, especially as regardsfertilizer usage which has declined strongly. Even so, the economic potential ofthe area is such as to justify some optimism. It is essential to improve farmingstandards (crop rotation, soil cultivation, etc.) and, in Central Asia, to introduceleguminous fallows (lucerne). Soil fertility and crop yield can only bemaintained or improved by increasing fertilizer usage and in order to do this, itis necessary to solve the problems which beset its distribution to farmers and atthe same time to amend the crop price: fertilizer cost ratio.
1. Introduction
Natural conditions in Central Asia are such that, with modem farmingpractices, high yields are possible. The introduction of improved methods, madepossible by large injections of State aid over the 20 years from 1960, greatlyimproved the economy of the region with growth in gross output of agriculture15-20% above that for the former USSR as a whole. Further improvement wasbrought about by clearing of 20 million ha in Kazakhstan during the fifties,though in this area frequent drought is a severe constraint on rainfed farmihg.
Recent social reforms have disrupted economic ties and altered the pricestructure with unfavourable results for regional agriculture. Produce prices arelow in comparison with farming costs and this has resulted in a decline infertilizer usage. It is urgently necessary to increase fertilizer usage and toimprove nutrient balance and also to introduce sound crop rotation to avoid soildeterioration.
Social reform in the former USSR with the change from centralisedmanagement has made it difficult to obtain reliable and complete statisticalinformation so that, in some parts of this paper, we have had to rely on expertopinion rather than hard facts.
483
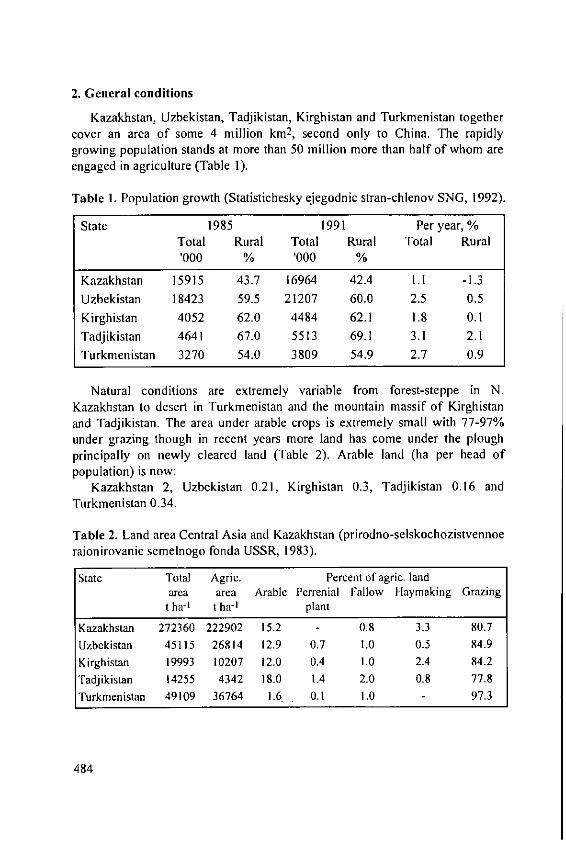
2. General conditions
Kazakhstan, Uzbekistan, Tadjikistan, Kirghistan and Turkmenistan togethercover an area of some 4 million km2, second only to China. The rapidlygrowing population stands at more than 50 million more than half of whom areengaged in agriculture (Table 1).
Table I. Population growth (Statistichesky ejegodnic stran-chlenov SNG, 1992).
State 1985 1991 Per year, %Total Rural Total Rural Total Rural'000 % '000 %
Kazakhstan 15915 43.7 16964 42.4 1.1 -1.3
Uzbekistan 18423 59.5 21207 60.0 2.5 0.5
Kirghistan 4052 62.0 4484 62.1 1.8 0.1Tadjikistan 4641 67.0 5513 69.1 3.1 2.1
Turkmenistan 3270 54.0 3809 54.9 2.7 0.9
Natural conditions are extremely variable from forest-steppe in N.Kazakhstan to desert in Turkmenistan and the mountain massif of Kirghistanand Tadjikistan. The area under arable crops is extremely small with 77-97%under grazing though in recent years more land has come under the ploughprincipally on newly cleared land (Table 2). Arable land (ha per head ofpopulation) is now:
Kazakhstan 2, Uzbekistan 0.21, Kirghistan 0.3, Tadjikistan 0.16 andTurkmenistan 0.34.
Table 2. Land area Central Asia and Kazakhstan (prirodno-selskochozistvennoeraionirovanie semelnogo fonda USSR, 1983).
State Total Agric. Percent of agric. landarea area Arable Perrenial Fallow Ilaymaking Grazingt ha- t ha-I plant
Kazakhstan 272360 222902 15.2 - 0.8 3.3 80.7Uzbekistan 45115 26814 12.9 0.7 1.0 0.5 84.9Kirghistan 19993 10207 12.0 0.4 1.0 2.4 84.2Tadjikistan 14255 4342 18.0 1.4 2.0 0.8 77.8Turkmenistan 49109 36764 1.6 . 0.1 1.0 - 97.3
484
An extreme continental climate prevails with winter temperatures down to-290C in Kazakhstan and to -5C in Central Asia. The sum of temperature above10'C varies from 2000 to 3500'C in Kazakhstan and from 4000 to 5200'C inTurkmenistan with very low humidity; rainfall 100 mm year-] andevapotranspiration 1000-1350 mm - 5 or 10 times less favourable than for zoneswith optimum conditions.
Soils are most variable in Kazakhstan: clay chernozem, chestnut and darkchestnut soils with varying salinity. Some sub-tropical sandy desert soil inCentral Asia is irrigated. Light textured typical and dark serozems on loess andloessial deposits prevail in the semi-desert area. Meadow and serozem-meadowsoils are found in the valleys. Generally in Central Asia, cation exchangecapacity is low on account of low clay and organic matter content (lightserozem 9-10, typical 12-15 and dark serozem 18-20 meq 100 g-1). Ca+ , Mg'4
and (K+ + Na+) account for 80-90, 10-15 and 2-5% of CEC respectively.Farming in Central Asia is entirely dependent on irrigation, consequently
soil fertility is affected by the mineral composition of irrigation water. Mineralcontents of the rivers Amu-Darya and Syr-Darya average 422 and 432 mg 1-I
through the year, higher than for other rivers of the former USSR. Mineralcontent of groundwater on the serozems of this area ranges from I to 5 g 1-1 to Ior 2 m depth. Considerable amounts of potassium are added to the soil in thisway; e.g. in Bukhara oasis 400 kg K20 ha- I over 10 years though, in the sameperiod, there was a loss of 880 kg ha- I in drainage water. Over the whole ofUzbekistan, there was a loss of 300-400 kg ha-1 K20. The net K balance woulddepend upon addition in K fertilizer and crop removal.
2. Development of agricultural production
There was earlier considerable development over the whole of Kazakhstanand Central Asia thanks to their having been alloted the status of most favourednation. Between 1913 and 1960, economical potential in Uzbekistan increasedby a factor of 18 and in Turkmenistan by 21. Great progress was made in themanufacture of chemicals and machinery and in building and the provision ofenergy. Agricultural progress was stimulated by construction of dams on all themain rivers and fertilizer factories at Chirchik, Samarkand, Kokand, Chimkent,Dzhambul and Almalyk, with total output reaching 1.5 million t - almost 10%of the total for the former USSR.
However, in recent years, the favourable trend has been reversed and thisapplies especially to agriculture (Table 3).
485

Table 3. Changes in gross output of agriculture (as % of former year)(Statistichesky ejegodnic stran-chlenov SNG, 1992).
States 1988 1989 1990 1991 1992
Kazakhstan 108.8 95.7 106.3 98.9 95.0Uzbekistan 104.1 102.5 101.3 90.0 95.0Kirghistan 109.4 89.2 102.8 95.6 55.0Tadjikistan 108.8 100.3 107.0 95.8 95.0Turkmenistan 104.4 92.7 106.8 89.6 99.8
Changes in the social system with establishment of sovereign states andchanges in land ownership have created difficulties. One result has been anincrease in food and fodder to meet the increased demand from the growingpopulation at the expense of industrial crops, especially cotton (Table 4).
Table 4. Changes in main groups of crops, % (Statistichesky ejegodnic stran-chlenov SNG, 1992).
States 1985 1991food forage industrial food forage industrial
Kazakhstan 50.3 48.5 1.2 45.1 53.5 1.4Uzbekistan 20.0 30.3 49.7 22.6 35.5 41.9Kirghistan 20.7 73.6 5.7 19.2 76.4 4.4Tadjikistan 23.0 37.1 39.9 25.8 36.4 37.8Turkmenistan 11.6 33.7 54.7 16.6 34.5 48.9
3. Fertilizer usage - a possible solution
There can be no doubt that improving agricultural production in CentralAsia depends on the availability of irrigation and fertilizers. Fertilizer effects onserozems were intensively studied in the thirties and forties when it was foundthat fertilizer was more effective on cotton than on other crops. Yields of 5-8 tha-1 raw cotton were obtained in field experiments and data from widespreadtrials by the Fertilizer Institute (NIUIF) indicated average returns from applyingurea at 1.35 t ha-1, from superphosphate 0.63 and from ammophos 0.65 t ha-1.Cotton plantations were greatly improved by the introduction of fertilizer, croprotation, plant breeding and seed production, pesticides, herbicides, etc.Average yields reached 3.0-3.5 t ha-1 .
486

Even so, as demonstrated in Figure 1, the rate of increase in yield laggedbehind the rate of increase in fertilizer. Local agronomists ascribed this to thedecline in soil organic matter content and in 1987, average values were 1.08%in Uzbekistan, 1.96 in Kirghistan, 1.0 In Tadjikistan and 0.56% inTurkmenistan. A practical means for reducing organic matter loss is the plantingof long-term lucerne or other leguminous fallows in a proper rotation.
U amount of nutrients1400 -n amount of cotton AlO
1200
1000
800
600
400
200
0a
1961-1965 1966-1970 1971-1975 1976-1978
Fig. 1. Annual average amount of nutrients used on cotton and amount of cottonproduction (th. t).
It was found that a consequence of continued application of NPK at 200-300kg ha-1 was build up of soil P20 5 (1% (NH 4)2CO 3) to above 60 ppm at whichlevel there was no response to P fertilizer.
Produce prices increased more slowly than fertilizer and transport costs andthe whole system for fertilizer supply proved inadequate to solve problemsposed by the new economic system, especially for the smaller customers.Within 2 or 3 years, there was a serious decline in fertilizer supply and, in somecases fertilizer usage declined as much as 100-fold (Table 5). The consequencewas a serious decline in soil fertility and by 1990, the percentage of soils low inP20 5 had risen from 24 to 33. However, up to 1991, there was no materialchange in average yields as a whole (Table 6). Nevertheless, inadequatefertilizer supply remains a threat to the maintenance of production and, unlessmeasures are taken, crop yields under irrigation must decline.
487
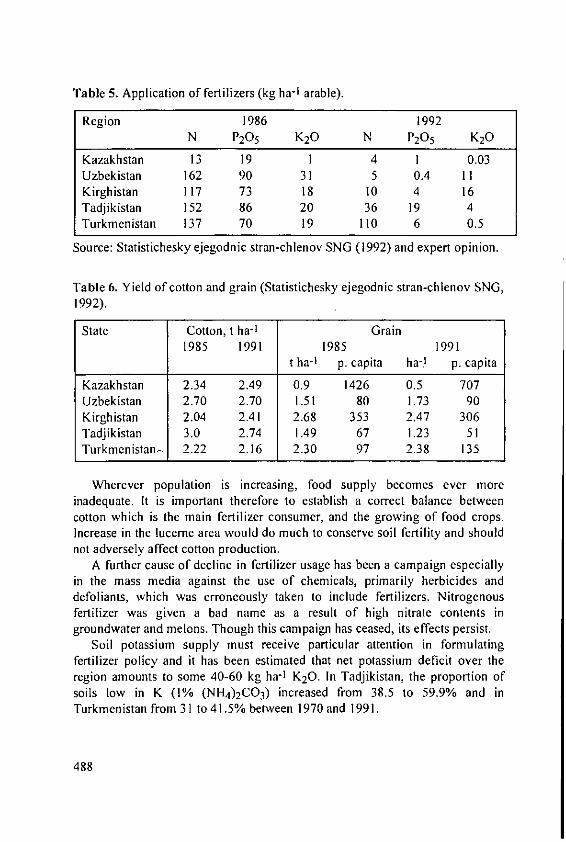
Table 5. Application of fertilizers (kg ha-1 arable).
Region 1986 1992N P20 5 K20 N P20 5 K20
Kazakhstan 13 19 I 4 I 0.03Uzbekistan 162 90 31 5 0.4 11Kirghistan 117 73 18 10 4 16Tadjikistan 152 86 20 36 19 4Turkmenistan 137 70 19 110 6 0.5
Source: Statistichesky ejegodnic stran-chlenov SNG (1992) and expert opinion.
Table 6. Yield of cotton and grain (Statistichesky ejegodnic stran-chlenov SNG,1992).
State Cotton, t ha-I Grain1985 1991 1985 1991
t ha-t p. capita ha-.1 p. capita
Kazakhstan 2.34 2.49 0.9 1426 0.5 707Uzbekistan 2.70 2.70 1.51 80 1.73 90Kirghistan 2.04 2.41 2.68 353 2.47 306Tadjikistan 3.0 2.74 1.49 67 1.23 51Turkmenistan- 2.22 2.16 2.30 97 2.38 135
Wherever population is increasing, food supply becomes ever moreinadequate. It is important therefore to establish a correct balance betweencotton which is the main fertilizer consumer, and the growing of food crops.Increase in the lucerne area would do much to conserve soil fertility and shouldnot adversely affect cotton production.
A further cause of decline in fertilizer usage has been a campaign especiallyin the mass media against the use of chemicals, primarily herbicides anddefoliants, which was erroneously taken to include fertilizers. Nitrogenousfertilizer was given a bad name as a result of high nitrate contents ingroundwater and melons. Though this campaign has ceased, its effects persist.
Soil potassium supply must receive particular attention in formulatingfertilizer policy and it has been estimated that net potassium deficit over theregion amounts to some 40-60 kg ha- 1 K20. In Tadjikistan, the proportion ofsoils low in K (1% (NH4) 2 CO 3) increased from 38.5 to 59.9% and inTurkmenistan from 31 to 41.5% between 1970 and 1991.
488

If available N and P2 0 5 are low, responses to K can hardly be expected butat yield levels of 2.5 to 3.0 or more t ha-1 potassium supply which is particularlyimportant under adverse conditions and for pest and disease resistance, maybecome limiting as demonstrated by a long-term experiment on meadowserozem in Uzbekistan (Table 7). A response to K was recorded up to 350 kgha-1 K20.
Table 7. The effect of potassium application on yield of cotton in a 7-years fieldexperiment, t ha - (Madraimov, 1991).
N - 175 Exch. K, ppm YieldP20 5 - 120 t ha-1 %K20 -. ....
0 140 2.86 10040 170 3.08 10787 210 3.31 116120 230 3.53 123175 240 3.64 127350 490 3.73 130
4. Constraints on fertilizer usage in Kazakhstan
Agricultural conditions in Kazakhstan differ from those in Central Asia.Little fertilizer is used - not more than 20 kg ha- (N+P 2 05 +K2 0) and the maincrop is spring wheat (Table 8).
As average yields increase so must the drain on soil nutrients. Soildegradation has been little studied and wheat yields depend on weatherconditions and it is not known what are permissible minimum values fornutrient contents. But there has been a serious decline in soil organic mattercontent; by 20-30% in N Kazakhstan over 30 years from clearing virgin landwhile the rate of increase in yield has fallen to one third of its former value.Organic matter content in 1987 was only 3.22%, very low for steppechemozem. To restore the organic matter status by applying organic manureover vast areas could not be justified on economic grounds even if sufficientwere available; the only feasible method is the introduction of appropriaterotations and fertilizers to raise soil nitrogen and phosphate.
Even at the prevailing low yields of wheat, the potassium deficit can beconsiderable - as much as 30 kg ha-1 K20 and unless some K fertilizer is used,it will be impossible to raise yields.
489

Table 8. Changes of balance N, P20 5, K20 in agriculture of Kazakhstan in theperiod 1965-1980, kg ha-I (Ponomarjova, 983; expert opinion, 1992).
Year Uptake wheat Application of fertilizers Balanceyield Organic Mineral
N
1965 10.0 0.8 1.8 -7.41966-1970 24.9 0.9 3.0 -21.01971-1975 25.1 2.0 5.6 -17.51976-1980 25.5 2.8 7.7 -19.0
1992* 27.0 2.0 3.8 -21.2
P205
1965 4.0 0.4 1.6 -2.01966-1970 9.5 0.4 2.3 -6.81971-1975 9.8 1.0 5.2 -3.61976-1980 11.5 1.5 6.1 -3.9
1992* 10.0 1.0 1.0 -8.0
K20
1965 10.0 1.4 0.2 -8.41966-1970 24.4 1.6 0.3 -22.51971-1975 26.4 3.5 0.3 -22.61976-1980 31.8 4.6 0.6 -26.6
1992" 30.0 2.0 0.5 -27.5
A considerable effort in farmer education is essential if fertilizer usage is to
be increased and the present inadequate system for distributing fertilizer tofarms (access roads, storage, fertilizer distributors, etc.) must be improved.Agronomists in Kazakhstan suggest that minimum fertilizer usage needed to
reduce nutrient losses should be at the least 825 to 900 thousand t: 300 000-
320 000 t N, 500 000-550 000 t P20 5, and 25 000-30 000 t K20 (Eleshev, 1992).
References
Eleshev, R. (1992): Problemi and ecologicheskie aspekti primenenij udobreni v
Kazachstane. Materiali I sjesda assziazi "Agroecolas", Moscwa, 41-44.Madraimov, L.. (1984): Effectivnost kalinich udobreni v chlopkovodstve. Trudi
VIUA, 70, 73-76.
490

Ponomarjova, A.T. (1983): Balance asota, fosfora I kalia v semledelii Kazachstanai dinamika pochvennogo plodorodia. Izdatelstvo "Nauka", Moscwa, 271-282.
Prirodno-selskochozistvennoe raionirovanie semelnogo fonda USSR (1983):Trudi VSKHNIL, 255.
Statistichesky ejegodnic stran-chlenov SNG (1992).
491
Chairman of the Session 5
Mahmud Duwayri, National Center forAgricultural Research and Technology Transfer,Ministry of Agriculture, Baqa'a, Jordan
Session 5
Approaches for the Implementationof Sustainable Soil ManagementPractices
493
The Sustainability and Increase of AgriculturalProductivity, the Current Dilemma
A.E. JohnstonLawes Trust Senior Fellow, IACR Rothamsted, Harpenden, Herts, AL5 2JQ,Great Britain
Summary
The existence of human kind depends on an adequate supply of food.Ancient civilisations perished once their agriculture could no longer producesufficient to feed them. Today we have the technology capable of feeding largenumbers of people provided that the resilience of the soil and its fertility can bemaintained. In recent years concerns have arisen, however, about possibleadverse effects on the environment of some of the attempts to achieve evergreater agricultural production. The present dilemma then, is how to maintainand, as appropriate, increase food production for the predicted increase in worldpopulation and to do so in an environmentally acceptable way. Some of theseconcerns are discussed here together with the concepts on which soil fertilityand crop production should be based using as examples the role of potassium incrop productivity and soil fertility.
I. Introduction
Today much is said, written and discussed about sustainable agriculture. Theword sustain has a number of meanings of which "to keep going continuously"provides the best definition for the adjective sustainable as I want to use it inrelation to agriculture. Thus sustainable agriculture is simply agriculture whichkeeps going continuously.
In recent years a much used concept about sustainability in relation to all theactivities of humankind derives from the Brundtland Commission's statementthat any activity should "meet the needs of the present without compromisingthe ability of future generations to meet their needs" (World Commission,1987). This simple statement has imediate appeal as a responsible approach tothe use of the world's resources. But use of any finite resource by anygeneration is ultimately not sustainable. Perhaps the guiding principle should beto minimise use whilst maximising benefit with an emphasis on recycling. Thispaper seeks to develop this principle in relation to the use of plant nutrients inagriculture.
495

Such concepts in relation to agriculture are not entirely new however. Thefollowing quotation is from Sanskrit, the classical, literary language developedfrom about 1500BC by the Hindus in northern India:
'Upon this handful of soil our survival depends. Husband it and it will growour food, our fuel and our shelter and surround us with beauty. Abuse it and thesoil will collapse and die taking man with it'.
This definition, although so old, has within it the phrase "surround us withbeauty" which encapsulates a major concern of today, namely that agriculturalpractices are damaging the environment, destroying amongst other aspects itsbeauty. Thus the current dilemma is to sustain, and increase as necessary,agricultural productivity in an environmentally benign way and this also will bediscussed here.
2. Present concerns
There are many reasons why today many people are hungry for much of thetime, but at present agricultural production is in surplus worldwide. Suchsurpluses are bad for farmers if they keep down prices but in some countriesthey are often favoured politically because they provide cheap food. However,surpluses have encouraged some people in the industrialised nations, who havebecome increasingly concerned for the environment, to attack agriculturebecause they see its profligacy as contributing to environmental degradation.Threats to the environment, and ultimately ourselves, are the cumulative effectsnot only of agriculture but also of many industrial and social practices. Forexample, large scale pollution, as with acid rain; major accidents, as atChernobyl; destruction of important habitats, as in the Amazonian rain forests;the wasteful exploitation of the world's mineral and biological resourcesbecause of a lack of desire or opportunity to recycle; and global problems, suchas the greenhouse effect, are frequently acknowledged to exist but are thoughtto be too immense for individual action. On the other hand, there are individualsand groups who have managed to attract widespread attention to their adversecriticisms of those aspects of current agricultural practices which they considerto be dangerous or objectionable. These include animal husbandry systemsperceived to be unnatural or degrading, landscape changes from simplifiedcropping patterns resulting in loss of wildlife habitats, soil erosion and loss ofsoil fertility, pesticide residues in soil, water and foodstuffs, nitrate in manyground and surface waters and eutrophication of surface water with nitrate andphosphate leading to the occurrence of algal blooms. And yet these sameobjectors frequently have available to them a wide range of foodstuffs, oftenfrom all over the world and often at very competitive prices.
496

Their complaints are usually only about practices in their own countries.They rarely appreciate that some of their food may be purchased at less than its
true cost of production, especially food from poor, developing countries.It is a fact, however, that it is only by the use of at least some improved
husbandry systems that it has been possible to feed many more people thancould have been supported on the practices of the 1930s and 1940s. Currenthigh outputs are the result of many interacting factors, farmer skill and expertisein particular making maximum benefit of new cultivars with a high yieldpotential which can only be achieved with controlled inputs of nutrients and thejudicious use of pesticides to control weeds, pests and diseases. Any farminghas some environmental impact. Eutrophication, the enrichment of surfacewaters with nutrients, probably first began 10 000 years ago when Neolithicman first started to clear natural vegetation, such as forest and grassland, to
grow food crops. The present concern should be whether current farmingpractices cause unacceptable harm and environmental change. This issueinvolves judgement of morality and benefits and costs, but final decisions are
often based on political expediency rather than available scientific facts and
understanding. For example, the desirability of cultivating for food crops a
piece of land supporting a diverse flora and a wealth of fauna will frequently be
a political judgement that puts feeding people or improving their standard ofliving above maintaining a diversity of species and its gene bank. Often,decisions taken without an assessment of all the available facts are at leastunfortunate and can sometimes have catastrophic effects in the long term.
Sometimes even the briefest historical assessment suggests that the lessons of
the past should guide our actions to sustain humankind in the future.
3. Historical perspectives
For perhaps two million years humankind sustained itself by gathering and
hunting food, moving when necessary to find fresh sources. Thioughout this
long period humankind, whilst small in number, adapted to its environment with
minimum impact on that environment.Then, perhaps 10 000 years ago, starting in the Neolithic era, humankind
began to develop a more organised agriculture based on soil cultivation to grow
food crops. This change accompanied the first settled societies in at least threeseparate locations, Southwest Asia, Mesoamerica and China. Within these
societies early, primitive agriculture allowed farmers to produce sufficient food
to feed ever increasing populations of non-producers, city dwellers, including
priests and bureaucrats, and soldiers, needed for the defence of each and everysociety.
497

But these increasing populations, then as now, put ever greater demands onthe fragile resources available for food production and short-term demandsbegan to out-weigh any considerations for long-term stability and themaintenance and development of sustainable agricultural systems.
In Mesopotamia, the Sumarian society which, starting about 3000BC,became the first literate society in the world, gradually perished as itsagricultural base declined. Always dependent on extensive and complexirrigation systems, the need to provide food for the expanding population forcedagriculture on to ever more marginal soils. The combination of weatherpatterns, soil type and deteriorating water quality, led to increasing salinisationof both the productive and less productive soils. In consequence, crop yields perhectare declined by 65% between 2400 and 1700BC.
In Mesoamerica, the earliest settlements of the Mayan society date fromabout 2500BC. Intellectually this society was remarkable, particularly in itsstudy of astronomy, yet once decline set in, it collapsed within a few decades.The Mayans appear to have had an intensive agriculture growing food onterraced fields on the hillsides and raised fields in swampy areas. As theircivilisation developed, the elite amongst the city dwellers began to demandgreater numbers of elaborate ceremonial buildings which required timber takenfrom the remaining hillside forests which were not terraced. In addition, fuel forthe city dwellers was taken from the forests and the labour for this and theconstruction projects was withdrawn from food production. Concurrently anever larger army was required to protect each city from its neighbours.Population pressure here, as in Mesopotamia, pushed agriculture on to evermore marginal land and by 80OBC there is evidence of a serious decline inproduction. Soil eroded from the steep hillsides following forest clearanceinvaded the terraced fields and blocked the drainage ditches between the lower,raised fields in the swampy areas. Labour taken for the army and city projectswas not available to make good the damage. Declining availability of food andan increase in fighting for scarce resources quickly led to the disappearance ofthis once sophisticated civilisation. Mayan cities and fields were rapidlyreinvaded by the dense jungle surrounding them and remained lost untildiscovered in the late 1830s.
These are but two examples of the rise and fall of great civilizations whichperished when their agriculture could no longer support them. They werechosen because salinisation and deafforestation leading to soil erosion, are twoof the major threats to the sustainability of agriculture today if agriculture is tofeed an ever increasing population.
498
3.1. Past agricultural practices in Asia, Europe and America
China, one of the three regions in which settled societies first developed, isnow the world's oldest civilisation. In China, as in much of Asia, the diet wasbased largely on irrigated rice and pigmeat. For thousands of years farmerspractised excellent management of the cultivated land. As late as 1949, organicsources provided more than 98% of the nutrients applied to soil, now theproportion is less than 38%. However, throughout its long history there havebeen inevitable losses of nutrients from the soil-plant-animal cycle. Historically,these losses were compensated for by soil erosion which transported vastquantities of soil from the uplands to the intensively managed, carefullyhusbanded lowland fields. Over centuries this practice of allowing the transferof soil, with its precious organic matter and plant nutrients, produced fertilelowlands and deforested, denuded uplands incapable of supporting viableagricultural production. Whilst this transfer maintained the productivity of thelowlands, and undoubtedly helped feed China's increasing population, it isessentially a "one-off' process and therefore not sustainable in the long-term.The organic matter content and availability of nutrients in the impoverisheduplands cannot be restored in the short term.
Agricultural practices in Asia can be compared with the much laterdevelopment of agriculture in Europe. Initially based on shifting cultivation,population pressure ensured that more and more afforested land had to becleared and used for food production. Although perhaps 95% of western andcentral Europe was covered originally by forest this proportion has fallen to20%. Early forest clearance did not lead to serious soil erosion - no extensiveterracing is found in western Europe - as it did in China. But the newly clearedland was incapable of giving acceptable yields of food crops year after year andfirst cereal-fallow and later cereal-legume-fallow rotations were practised asearly as Roman times. These rotations were only very gradually replaced with
mixed farming with animals and crops. It was not until the mid 18th centurythat such mixed farming became widely practised following the development in
England of the Norfolk Four-Course Rotation. Cereals and root crops weregrown in rotation with grain legumes and grass-clover mixtures, grown asforage for cattle providing food for humans and for horses which providedtractive power. Because a large proportion of the crops produced on the farmwent to feed animals, especially horses, and only cereal grain, usually wheat,
and milk and meat were sold off the farm, much of the nutrient content of the
harvested crop was returned to the land in farmyard manure (FYM also calledanimal, stable or barnyard manure). In fact, agreements between landlords andworking tenant farmers ensured that this would happen.
499
As the urban population expanded rapidly in the industrial revolution of thelate 18th and early 19th centuries farmers strove to increase production.Initially, observation rather than research identified the need for phosphorus (P)for root crops and phosphorus and potassium (K) for legumes. The productionof superphosphate, from the early 1840s, and the mining of potash salts andproduction of potash fertilizers from the 1860s, provided sources of bothnutrients in plant available forms. Nitrogen became available to farmers asammonium sulphate or sodium nitrate to supplement that supplied in organicmanures or by biological fixation. The use of P and K fertilizers resulted in a verygradual build up of these nutrients in soils over most of western Europe during a60- to 100-year period, whilst the use of lime (CaCO 3) maintained soil pH.
A third scenario is seen in North America. Poor emigrant farmers fromEurope who settled in North America in the latter half of the last century foundsoils whose organic matter content had been increased under natural vegetationduring hundreds of years. An exploitive arable agriculture with little return ofplant nutrients and in a climate few of the settlers from Northern Europe hadexperienced, rapidly depleted this organic matter and declining yields and thedust bowls of the 1930s were the result. Unlike more ancient civilisations, ayoung and vigourous nation with a will to survive, and an improvingtechnology and understanding of soil processes to support that will, put in placemeasures to rebuild nutrient levels and minimise the damaging effects ofdeclining levels of soil organic matter.
3.2. The 1960s to 1990s
Food shortages in the Second World War led post-war governments to makethe security of their food supplies a first priority. At the same time thosecountries not so closely involved in active warfare saw a major marketopportunity in supplying food to those whose productive capacity had beendevastated by war. The increase in productivity per unit area of land since the1950s is truly remarkable especially when viewed against the background ofalmost unchanging yields in the previous 100 years. The all-round desire toincrease food production at any cost was aided by a number of factors. One wasthe increasing reliability of mechanical tractive power to replace horses whichfreed land for producing human food. Another was the increasing availabilityfrom the late 1950s of cheap nitrogen (N) fertilizers. The increasing use ofnitrogen throughout the world was justified by a number of other factors. Plantbreeders produced cultivars of staple food crops with an ever increasing yieldpotential.
500
Ever more effective agrochemicals to control weeds, pests and diseases weredeveloped so that the yield potential of the new cultivars could be achievedunder field conditions. Irrigation was used more extensively.
In Europe and North America there was also an increase in the use of P andK fertilizers which in Europe allowed high yields without decreasing the levelof these nutrients in soil, levels which had been built up slowly by manures,fertilizers and crop residues during the previous 60 to 100 years. In Asia, thebenefits of using-N fertilizers were quickly apparent. But, in contrast to Europe,this increased use of N started on soils where there had been little accumulationof P and K during the previous decades. In consequence there is now concernabout the ever increasing risk of soil nutrient depletion which could threaten thefood security of the region.
4. Soil fertility and crop productivity
Any discussion of sustainability related to the managed use of land mustinclude physical, environmental and socioeconomic aspects. No agriculturalsystem will be sustainable if it is not economically viable both for the farmerand the society of which he is a part. But economic sustainability cannot bebought at the cost of either environmental damage, which is ecologically,socially or legally unacceptable or of physical damage which leads toirreversible soil degradation or uncontrollable outbreaks of pests, diseases andweeds.
Currently, yield is often the only true measure of sustainability because theplant itself integrates across all factors, including soil, climate, pest and disease,which affect growth. But monitoring sustainability in this way requires yieldsover many years so that "trends" can be separated from "noise", caused byannual yield variation due to weather or management. It would be preferable,therefore, to have other indicators of soil change to provide early warning oflikely changes in sustainability before adverse effects on yield become serious.That is, it would be helpful to have critical values for relevant soil parametersbelow which yields could be expected to decline. Because many soil propertieswhich affect soil fertility change slowly over many decades, especially intemperate climates, it would be useful to have simple analytical procedures forthe chosen parameters so that analyses could be done frequently on many soils.Thus it would be possible to follow changes over time and determine whetherthe values were moving towards critical values for each parameter.
501
Although it might seem desirable to work towards a single, worldwide indexfor the sustainability of land use, this is likely to be difficult to achieve inpractice and might not even be very helpful. This is because any agriculturalsystem is only as strong as its weakest link which may be any one of a widerange of variables such as soil type, soil fertility, climate, water availability,management skill or financial viability; these and other variables will notalways rank in the same order. Thus a critical level set for any parametercontrolling yield may well differ between soils, farming systems and climate. Itwould be sensible, therefore, in any search for critical values of soil parametersto attempt to determine them for a wide range of different systems and then seeto what extent they can be bought together to give general guidelines.
Soil fertility is not synonymous with agricultural productivity. Indeed, sincethe 1950s it is attempts to increase productivity rather than soil fertility thathave led to many of the concerns about the impact of agriculture on theenvironment in some countries, For example, the movement of nitrate andpesticide residues to potable water is blamed on the increased use of nitrogenfertilizers and pesticides, respectively. In consequence, it is necessary to make aclear distinction between soil fertility and productivity. What is certain is thatattempts to increase productivity, by for example the use of N fertilizers, isdoomed to failure if soil fertility as defined below is not optimum.
4.1. Soil fertility
The fertility of soil can be defined as its capacity to produce a desired plantcommunity or crop and each will vary in its nutrient requirement. For example,nutrient requirement increases in the progression from natural forest toextensively grazed grasslands to arable crops to intensively managed vegetablecrops. Soil fertility develops slowly over many decades. Whereas ineptmanagement can destroy soil fertility rapidly, small, less obvious, but insidiouschanges can be equally damaging in the long term. Soil fertility arises fromcomplex interactions between the biological, chemical and physical propertiesof soil each of which, in turn, is affected by interactions amongst its constituentparameters. Little is known about the complexity of some of these interactionsor their rates of change, especially in relation to our ability to predict changes insoil fertility. The difficulties of defining and quantifying the parameterscontrolling soil fertility are exacerbated by the fact that many of the parametersare rarely in equilibrium.
502
4.1.1. Biological properties
Biological properties include both beneficial and harmful organisms.Beneficial organisms include mycorrhizal fungi which for certain crops can playa role in enhancing phosphorus uptake by roots growing in phosphorus deficientsoils. Some free-living, non-symbiotic organisms, like blue green algae, can fixatmospheric nitrogen and reduce the need for N fertilizers. Many bacteria andfungi breakdown organic residues from both plants and animals and this process
recycles plant nutrients and produces humus. Conversely some soil-bornepathogenic organisms can decrease yields seriously. Whilst some can be
controlled, the use of appropriate chemicals can leave residues the effects ofwhich have yet to be quantified. For others, like the fungus which causes Take-
all in cereals (Gaeumannomyces graminis) there is currently no chemicalcontrol available.
4.1.2. Physical properties
Physical properties encompass soil density, water holding capacity and
rooting depth. Plants growing in shallow soils overlying impervious strata willalways have a limited volume of soil to exploit for nutrients and water and such
soils will invariably have a low yield potential. Similarly, the yield potential oflight textured, sandy soils will be less than that of heavier textured soils unless
irrigation is available on the lighter soils. If yield potential is small then the
amount of nitrogen fertilizers needed may be small also.
4.1.3. Chemical properties
Chemical properties of importance include soil pH, P and K status and
organic matter content. Where liming materials are available it is usual to
recommend that soil pH in water is maintained at pH 6.5 for arable crops andpH 6.0 for grassland because the availability of most plant nutrients is near
optimum in this pH range. Increasing soil acidity increases the amount of
aluminium, iron and manganese in the soil solution and it is these elements, inionic forms and especially AI 3 , rather than acidity per se which adversely
affects growth. To some extent the effects of A13+ are less severe in thepresence of phosphate but to add the requisite levels of P would be inefficientand costly. Where liming materials are not readily available, the way forwardwill be to breed plants tolerant of acidity.
503

4.1.4. Soil organic matter
Freshly added organic matter is a food source for the soil microbialpopulation and its activity produces soil organic matter or humus. This can givesmall, but perhaps important increases in water holding capacity as well asproviding plant nutrients during its breakdown; the latter is especially importantin natural ecosystems. Humus also has an important role in retaining P, K andmagnesium (Mg) in plant available forms.
In temperate soils the amount of humus usually changes slowly over timeand any benefits from it have been difficult to measure unequivocally in thepast. For example, for more than 100 years fertilizers and farmyard manurehave given very similar yields of arable crops in experiments at Rothamsted,England, on a silty clay loam soil. This was still so even in recent yearsalthough FYM-treated soils contained about 2.5 times as much humus as soilsgiven only fertilizers. The significance of this was that both fertilizers and FYMsupplied the requisite plant nutrients in forms available for uptake by plantroots. Recently, however, yields on FYM-treated soils with extra fertilizernitrogen have been larger than those on fertilizer-treated soils irrespective of theamount of nitrogen applied on the latter. On these fertilizer-treated soils, humuslevels have not declined in recent years. The larger yields are probably the resultof better soil physical conditions on FYM-treated soils enabling modern, high-yielding cultivars to achieve their potential yield. In this new situation, thebenefits of soil organic matter should not be underestimated.
4.2. Crop productivity
Climatic factors are outside the control of the farmer although water deficitsfrom too little rainfall can be corrected where irrigation is available. However,within the constraints of climate, provided soil fertility is optimum, cropproductivity can be controlled by varying inputs like nitrogen and pesticides.Nitrogen can be applied as fertilizers, in organic manures or, where appropriate,by symbiotic fixation of atmospheric nitrogen. Pesticides can be usedjudiciously to control weeds, pests and diseases. Today, integrated pestmanagement, which seeks to capitalise on the use of natural predators and othernatural control mechanisms is an area of major research effort.
504

5. The role of potassium in soil fertility and crop production
Following the generalisations in the previous sections I want now to look atthe need for potassium in agricultural systems. The essential need for potassiumin human nutrition and the lack of any proven environmental problems arisingfrom the use of potassium in agriculture was discussed in a series of excellentpapers presented at the 23rd Colloquium of the International Potash Institute in1992 and need not be discussed further here except for two comments.
Within the European Community there are quality standards for water
intended for human consumption. For potassium the Drinking Water Directive(80/778/EEC) imposes a maximum admissible concentration (MAC) of 12 mg
K l-1 with a guide level of 10 mg 1-1. The reason for setting such a low value isunknown but a survey of water supply companies in England and Wales showed
that they had little difficulty in supplying water with less potassium than the
guide level. Potassium concentrations in drinking water can be measured cheaply
and automatically and there was a suggestion that they are monitored regularly.
In part this is because a sudden increase in concentration can be associated with
a pollution incident, like the ingress of farm slurry to water coming fromagricultural land. This, in turn, could then initiate a much more expensivemicrobiological assay to assess the risk of danger to human health from harmfulbacteria and, if necessary, take appropriate action. The second comment relates
to concern about increasing levels of chloride in water. In England and Wales at
least this increase cannot be linked to the use of KCI fertilizers which has hardly
increased in recent years (Johnston and Goulding, 1992).In the absence of environmental concerns the aim of research, development
and advisory services must be to improve the cost effectiveness with which
potassium fertilizers are used. This will depend on our ability to correctly identify
those situations where potassium is needed and develop rational potassium
manuring policies to achieve optimum yields and the maintenance of soil fertility.
5.1. Potassium in plant nutrition
Potassium has two main functions in plants: (I) it has a vital and
irreplaceable role in certain metabolic processes including protein synthesis and
the translocation of the products of photosynthesis, (2) it appears to be thepreferred cation for the generation of osmotic pressure to maintain cell turgor.Much larger quantities of potassium are needed for the second role than the firstwhich explains why plants take up so much potassium. In temperate climates
grasses take up rather more potassium than nitrogen.
505
A cellular explanation for critical potassium concentrations in plants wassummarised recently by Leigh (1989) based on a more detailed discussion byLeigh and Wyn Jones (1984 and the references therein).
5.1.1. Critical levels of potassium in plants
It has been accepted practice in agronomic studies to express theconcentration of potassium in plants as % K in dry matter. This is analyticallyconvenient and potassium uptakes, and hence potassium balances, can becalculated if dry matter yields are known. However, attempting to relate % K indry matter to crop response to either soil or fertilizer potassium invariably meetswith little success; for arable crops this is because % K in dry matter invariablydeclines throughout growth.
A promising approach to determining critical concentrations of potassium inplants which could be used for diagnostic purposes has been developed byLeigh and Johnston (1983a,b). Because most of the potassium in plants is usedto generate turgor they examined the relationship between potassiumconcentrations expressed on a tissue water basis, and growth and yield of springbarley. Before the onset of loss of water during ripening, whole barley plantsgrown in the field and well supplied with potassium and nitrogen maintainedabout 200 mmol K kg-' tissue water throughout growth and yielded 4.8 t ha-grain. Potassium deficient barley, given the same amount of nitrogenmaintained only about 50 mmol K kg-' tissue water throughout growth andyielded only 2.6 t ha- 1 grain. These potassium concentrations were not affectedby nitrogen or phosphorus nutrition or by drought. Similar values for potassiumin tissue water have been found for other well fertilized cereals and grass butwell fertilized dicotyledons appear to maintain lower concentrations and stillgive maximum yield (Leigh, 1989).
5.1.2. Use of plant analysis in diagnosing potassium deficiency
The results of Leigh and Johnston (1983a, b) showed that the crops could besampled at any time during active growth and potassium deficiency diagnosedwith some certainty when potassium concentrations were expressed on a tissuewater basis. The work is being continued at Rothamsted but the methodologyand interpretation of the data needs to be extended to other crops on other soils.Once optimum potassium concentrations have been determined for a wide rangeof crops, expressing potassium analyses on the basis of tissue water will be mostuseful where there is uncertainty about the interpretation of soil analysis data.
506

In other words, if soil analysis suggests that the soil is on the borderline
between sufficiency and deficiency then crop analysis can be used to determine
whether the crop is getting sufficient potassium to meet its needs.
5.1.3. Efficiency of potassium use by plants
Positively charged potassium ions, K+, are taken up by plant roots from the
soil solution either as balancing cations for anion uptake or in response to
proton excretion. Non-leguminous plants probably take up much K+ as a
balancing cation for N03-. This mechanism is presumably not available to
legumes and some recent work at Rothamsted suggests that field beans, Vicia
faba, require a much larger concentration of potassium in the soil solution,equivalent to 250 mg kg-' exchangeable K, than do cereals, which require little
more than 100 mg K kg-'. If all grain legumes require such large concentrationsof potassium in the soil solution for the plant to take up sufficient potassium,then this has major implications for fertilizer use. Mengel (1989) discussed the
efficiency with which different crop species use potassium and this is a topic of
considerable importance. When the responses to potassium of different crop
species are compared in field experiments it will be necessary to distinguish
between effects due to biochemical differences, those due to soil variation and
plant rooting patterns in soil and root:shoot ratios and K absorption rate per unit
of root. In the example above, beans may need a larger concentration of K+ in
the soil solution than do cereals because each of these factors is different for the
two crops.
5.2. Potassium in soils
Following the early work of Hoagland and Martin (1933), soil potassium is
usually divided between different categories or pools (Figure 1). Their precise
definition is less important than the fact that potassium can transfer in both
directions from one pool to another. The rate at which this transfer occurs and
the direction of movement (i.e. the balance of the equilibrium) has important
implications for the short- and long-term availability of potassium to crops and
for the usefulness of soil analysis in predicting soil potassium status and the
need to supply potassium fertilizers to satisfy crop demand.There is a well understood definition of exchangeable K and a simple
methodology to determine it. It has been suggested, however, that there should
be another category of K between exchangeable- and fixed-K in Figure 1,namely "difficultly exchangeable K" or "easily available, non exchangeable K"
(Arnold, 1962). This description, though somewhat clumsy may be preferable.
507

Rain Crop Manures
\ 7 Iz MineralSolution ,_ Exchangeable . Fixed Matrix
K KI NativeK
Drainage <Non-exchangeable K>
Fig. I. A diagramatic representation of the potassium cycle for agricultural soils.
Such a subdivision may be justified if non exchangeable K is held on siteswithin clay minerals with sufficiently different bonding energies that the rate atwhich K becomes plant available is affected. There is some experimentalsupport for this concept because cumulative K uptake curves derived fromexhaustive cropping experiments often have a number of distinct segmentssuggesting differing availabilities of soil K. For examples see Johnston andGoulding (1990) and the upper curve for K release to Ca-resin in Figure 2which has a similar form to cumulative K uptake curves. If there are at least twosub-categories of non exchangeable K then finding a rapid method of soilanalysis suitable for routine use which distinguishes them will be no easy task.
1500-
R4
1000-
tW (hours /)M i
Fig. 2. Relationship between the cumulative K release to Ca resin and time fortwo soils with differing clay content. Denchworth Series 49% clay, NewportSeries 8% clay.
508
It seems most unlikely that there is any reserve of non exchangeable K in
organic manures or soil organic matter. Thus enhanced levels of exchangeableK in highly organic soils will not be buffered by non exchangeable K reserves
as they are in mineral soils.Soil analysis methods for K have been reviewed by Johnston and Goulding
(1990). Total K can be determined after dissolving the soil with HF but such
data are rarely useful. Perhaps the one exception is when estimating K
requirements of plantation crops grown on very sandy soils with very little total
K. Exchangeable K, together with that in the soil solution, is determined by the
use of extractants with excess cations, usually NH4+, capable of exchangingwith K+ on cation exchange sites in soil. There is no widely accepted method
for determining non exchangeable or non readily soluble K. This is unfortunate
because the quantity of K in this pool and its rate of transfer to the exchangeablepool have major implications for K manuring.
Non exchangeable K can come from two sources. The residues of K applied
in fertilizers and manures and not used by crops will remain in soil partly as
exchangeable K, partly as non exchangeable K; an example is given in Section
5.2.2. The second source, applicable to many soils, is by the weathering of clay
minerals, which can be a major source of K. For example, Goulding and
Stevens (1988) showed that in a forest in the temperate, humid climate of North
Wales in the UK, sufficient K was released annually to meet the K requirement
of the trees and they estimated that the mineral K reserves would supply the
needs of several rotations of trees. Similarly, Johnston (1986) showed that on a
sandy clay loam in Eastern England sufficient K was still being released after 75
years without K additions to the soil to produce 8.5 and 7.6 t grain/ha from
winter wheat and winter barley respectively. However, he also showed that
when crops were given sufficient N and P and grown on a silty clay loam and a
sandy loam without K addition for 100 years the crops were only able to take up
25 and 10 kg K/ha resepctively each year; this was too little for acceptable
yields. Thus knowledge of clay mineralogy and K release characteristics is
important. This is especially so in many of the developing countries which have
limited financial resources and must get the maximum benefit from K fertilizers
by applying them to the most responsive crops on K deficient soils.Some researchers have suggested that subtracting exchangeable K from that
extracted by boiling I N HN0 3 provided a reasonable estimate of non
exchangeable K and data determined in this way are given in a number of
papers presented at this Colloquium. Such a method requires two separate
analyses and this increases the cost of giving a recommendation about the
amount of K needed to get an acceptable yield.
509

Two methods which invariably differentiate well between soils of differentclay content and clay mineralogy are exhaustive cropping of small volumes ofsoil in pots in the glasshouse and sequential extraction with an ion exchangeresin. The first method produces a cumulative K uptake curve, the second acumulative K release curve both in the form XK:t'A/ . Both methods oftenproduce curves of the same shape and magnitude (Johnston and Goulding,1990). Unfortunately a full analysis of a soil can take 6 to 9 months by eithermethod but the ion exchange method is usually less costly. Both methods are fartoo slow to use for routine analysis on which to base fertilizerrecommendations. But either method, and especially the ion exchange method,has much to commend it as a way of characterising the K release capacity of awell defined soil series or specific soil type. This is because the shape of thecurve can be interpreted as separating two, three or four main categories of soilK. Figure 2, taken from Johnston and Goulding (1990), shows cumulative Krelease from two different soils to a Ca exchange resin. The lines were fittedusing a linear spline procedure, see Johnston and Goulding (1990) for details,and each linear segment was extrapolated back to the y-axis. The differencebetween intercepts is taken to be the amount of K(M) in each category whilstthe rate of release (R) is the slope of each segment. In Figure 2 the Newportseries soil, a sandy loam with 8% clay had a two part curve, whereas the heaviertextured Denchworth soil with 49% clay had a four part curve. The amount of Kdetermined by the first intercept is usually well related to the exchangeable K sothat subsequent increments represent K fractions not immediately exchangeableto NIHl4±. The amounts and rates of release of K in intermediate segments, M2 R2and M3R3 in Figure 2, often depend on the amount of residues accumulatedfrom past fertilizer and manure applications. The last segment which can bedetermined within a reasonable experimental period, segment 4 for theDenchworth soil in Figure 2,. is the one which characterises the rate of K releasefrom soil minerals. If very long continued K extraction by resin from micaceousclays creates predominently kaolinitic type clays then there would be a furtherbreak in the curve and the amount of K released from the original micaceousclays could be calculated. However, the experimental time scale would be toolong in most cases to justify determining the change of slope. The rate of Krelease from clay minerals is the parameter of immediate importance because itis the rate which determines whether a crop will get sufficient K to meet itsneeds during the growing season. When the rate of release is too slow then Kfertilizer must be added to achieve acceptable yields.
510

5.2.1. Exchangeable K and K recommendations
Exchangeable K measurements are best used to follow changes in the Kstatus of soils in individual fields as a result of cropping and manuring.However, much evidence suggests that, although not perfect, exchangeable K
relates sufficiently well to crop response, both to soil potassium and the
application of supplementary potassium in fertilizers and manures, that it is a
useful method of soil analysis. This is especially so where different parts of a
farm have had widely different manuring and cropping and the farmer wants
advice for each field. Poor correlations between crop response to K fertilizer
and soil analysis values for surface soils can be explained in some cases by
potassium uptake from the subsoil (Johnston and Goulding, 1990). The amount
and type of clay in both surface and subsoil affects the retention of potassium
within the soil profile (Johnston, 1986). Potassium retained in the subsoil is
available to deep rooted crops like sugar beet, winter wheat and lucerne.
Benefits from soil enrichment with both potassium and phosphate have been
shown (Johnston and McEwan, 1984). Kuhlman et al (1985) discussed
methods for determining the amount of potassium taken up by crops from
subsoils. However, the additional cost of sampling and analysing subsoils to
improve fertilizer recommendations would probably not be justified by any
small savings made by a more accurate recommendation for the amount of
potassium to apply.
5.2.2. Effect of potassium balance on exchangeable K in soil
The K balance can be defined as the difference between the amount of K
applied to a crop and that removed from the field in the harvested produce. A
positive balance enhances soil fertility on soils where there is sufficient cation
exchange capacity to retain K+. A negative balance depletes soil potassium
reserves and hence fertility. Johnston (1986; Johnston and Goulding, 1990)
showed how positive and negative potassium balances in long-term experiments
related to increases and decreases in exchangeable K. Usually on soils which
have little exchangeable K a negative K balance causes little change in
exchangeable K. For example, between 1856 and 1903 a silty clay loam soil at
Rothamsted grew barley without any added potassium. Initially it contained 91
mg kg-' exchangeable K and there was a cumulative negative K balance of -530
kg ha- 1 by 1903 but the soil still contained 95 mg kg-1 exchangeable K. On a
similar soil where grass was grown a negative K balance of -1350 kg ha- I was
accompanied by a decrease in exchangeable K of only 6%.
511
Where residues of potassium had accumulated on such soils before theywere cropped without further additions of potassium, the decrease inexchangeable K rarely accounted for more than 50% of the potassium removedin the crop. Where there are positive K balances these rarely increaseexchangeable K by the amount of the balance. An example, again fromRothamsted, showed that a positive K balance of +1670 kg ha-1 increasedexchangeable K by only 690 kg ha-1 or 41%. Further work (Johnston, 1986)showed that the size of the increase in exchangeable K when there were positivebalances depended on soil pH: much more potassium remained exchangeable onacid than on neutral, calcareous soils (see also York et aL, 1953 and Karim andMalek, 1957).
The data given above are good evidence of the movement of potassiumbetween different pools, especially the exchangeable and non exchangeablepools. They also explain why many farmers are perplexed when after a periodof generous potassium manuring they see little increase in the exchangeable Klevels in their soils. Such data also illustrate a more serious down side. Ifexchangeable K decreases little during a period of cropping without potassiummanuring farmers can be lulled into a false sense of security not appreciatingthat they are depleting soil potassium reserves.
5.3. Response of crops to soil and fertilizer K
Many recent experiments have shown that on soils enriched with K residues,i.e. with high K status, yields of arable crops often exceed those onimpoverished soils, i.e. with a low K status, irrespective of how much potassiumis applied in fertilizers or manures (Johnston et al., 1970; Johnston, 1986).Although the value of K residues has been demonstrated in such experimentsthey do not necessarily indicate the level to which residues should beaccumulated. To offer farmers sound advice on potassium manuring requires aknowledge of two factors. The first is how well will the crop grow withoutaddition of potassium; this will depend both on the amount of exchangeable Kand speed with which potassium transfers from the non exchangeable pool. Thesecond is the probably effect of K fertilizer at each level of soil potassium.
5.3.1. Crop response to exchangeable K
This is usually determined best in experiments on one soil type wheredifferent levels of exchangeable K have been built up over the course of a fewyears so that exchangeable - and non exchangeable - K are in equilibrium.
512
The aim will be to determine a critical level of exchangeable K below whichthere will be a serious loss of yield and above which yield changes little. Abovethe critical value the farmer will suffer a financial penalty if he adds potassiumunnecessarily.
Experiments like those described above on the silty clay loam soil atRothamsted have shown that spring barley yielding about 6 t ha-1 grain did notneed more than about 80 mg kg-' exchangeable K but sugar yields of 5.5 t ha-1were still increasing on soils with 200 mg K kg-'. Potato yields increased from10 to 40 t ha-1 tubers on soils with 100 to 200 mg kg-1 exchangeable K. Whilstthe general relationship was clear there was some scatter in individual valuesabout the linear relationship, more so for sugar beet and potatoes than barley.This, as discussed previously, could be due to variation between plots in theextent to which the crops exploited the subsoils to meet part of their need forpotassium. In another experiment yields of Viciafaba beans increased up to 250mg kg-1 exchangeable K and, as mentioned previously, this raises the questionas to whether grain, and perhaps herbage legumes also, require larger amountsof exchangeable K in soil than do K responsive crops like potatoes and sugarbeet.
5.3.2. Crop response to fertilizer K
Crop response to freshly applied K fertilizer often depends not only on theexchangeable K content of the soil but also on the release of non exchangeableK during the growing season. Any response to freshly applied K fertilizer willalso depend on soil structure and the extent to which the newly added potassiumcan be incorporated into the volume of soil explored by actively growing rootsand also on soil texture and rainfall and the extent to which potassium movesdown the profile. Johnston and Goulding (1990) gave examples which showedthat on one soil without potassium manuring for 100 years a fresh application ofpotassium could be so well mixed into the soil that spring barley gave as good ayield as on a soil well enriched with residues where there was no response tofresh K. On soils with identical clay content but poorer physical structure, Kenriched soils always gave larger yields. On a very different soil, a sandy clayloam, which had not received potassium fertilizers for more than 75 years,winter wheat yielded 8.5 t ha- 1 grain and yields did not increase further eitherwhen fresh potassium was added to this soil or the wheat was grown on plotswhich had received K annually for 75 years.
513
5.4. Potassium manuring and potassium balances
Nutrient balances prepared at global, continental, national and individualfarm level often have different objectives but a unifying theme, namely tounderstand and maintain soil fertility. Some of the factors which affect therelationship between K balance and the accumulation and depletion ofexchangeable - and non exchangeable - K have been discussed in the Sectionsabove. The role of national and farm nutrient balances is discussed here.
5.4.1. National nutrient balances
National nutrient balances should serve the purpose of helping inform thegovernment of the likely status of one of its most important natural assets,namely the fertility of the nation's soils. Cooke (1986) gave examples of somenational nutrient balance sheets and emphasised their importance as an aid indecision making for those seeking to develop national fertilizer policies. Gettingsuch policies right is especially important when exports of agricultural producefigure prominently in the national economy. Cooke also pointed out thatnutrient balances can be altered by any factor which affects yield, not onlynutrient inputs. On a national scale the data can be used to identify possibledeficiencies or imbalances in inputs so that advisory effort can be focused onattempts to rectify such deficiencies and hence increase yield. Johnston (1986)gave some examples of the use of national nutrient balances in England andWales which showed how a national negative K balance in 1874 had become apositive K balance by 1956. He also showed how, by the 1980s, a very smallpositive K balance could be used to explain very small changes in theexchangeable K content of a representative sample of the nation's soils. Suchnational balances will only be as good as the reliability of the data on fertilizeruse and yields of harvested produce. Such data may or may not be collected bynational agencies.
5.4.2. Farm nutrient balances
At the whole farm or individual field level, nutrient balances can be muchmore accurate because nutrient inputs and yields should be known with greaterprecision than at the national level. When soil analysis data are also availablefor individual fields well considered management decisions can be taken aboutthe amount of nutrient to be applied to maintain each field at the level offertility considered best, but presumably above the critical value as discussedabove.
514

5.4.3. Nutrient balances - research problems
To the research scientist, a knowledge of nutrient balances poses interestingproblems especially in the case of potassium. If the balance is positive howlarge should it be, what will happen to the excess K, how will it be distributedbetween exchangeable and non exchangeable pools, will the residues benefitsucceeding crops, will the residues ever be recovered? If the balance is negative,would the following crops respond to extra fertilizer K, how quickly will nonexchangeable K become available, would adding potassium have diminished theamount released by weathering and if not would potassium released from theminerals have been held in the exchangeable and non exchangeable pools.
5.5. Developing potassium manuring policies
This section considers some of the principles which should be taken intoconsideration when deciding manuring policies. It specifically excludesfinancial questions but it assumes that every effort will be made to recyclenutrients in animal wastes. The factor of overriding importance will be soil type.
If the soil is so light textured and contains so little clay and organic matterthat there is no ability to retain potassium in the exchangeable and nonexchangeable pools then potassium manuring must be on an annual basis. Also,if there are clay minerals which rapidly fix potassium and release it very slowlyor hardly at all, then K manuring should be on an annual basis. For these twocases the amount of potassium applied should at least equal the maximumuptake by the crop and the time of application should aim to minimise losses byleaching or fixation. On such soils nitrogen and potassium could well besupplied together.
On soils where appreciable amounts of potassium can be held in both theexchangeable and non exchangeable pools, soil fertility will be enhanced if Kmanuring exceeds K offtake until the soils are above the appropriate critical Klevel for the crop rotation. Such an approach has the advantage that the soil isenriched with potassium throughout the cultivated layer where the roots ofannual crops are most active in taking up nutrients. Once the soils are above thecritical value, K manuring can be based on a balance sheet approach, namelyreplacing the potassium removed in the crop. On such soils it is often possible topractice rotational manuring, applying in one application sufficient potassium tomeet the needs of three or four annual crops.
There are two methods to check the validity of such manuring policies. Theexchangeable K content of the soil can be monitored over time, payingparticular attention to always taking a truly representative sample from eachfield and maintaining a constant sampling depth.
515

If there is any doubt that the amount of exchangeable K is sufficient to meetthe needs of the crop then the crop can be sampled and the K concentration intissue water determined. If the concentration is below that accepted as beingsufficient for that crop then additional K should be applied.
References
Arnold, P.W. (1962): The potassium status of some English soils considered asa problem of energy reletionships. The Fertilizer Society, Peterborough, 25-43.
Cooke, G.W. (1986): Nutrient balances and the need for potassium in humidtropical regions. In: Nutrient Balances and the need for Potassium.International Potash Institute, Basel, 13-32.
Goulding, K.W.T. and Stevens, P.A. (1988): Potassium reserves in a forested,acid upland soil and the effect on them of clear-felling versus whole-treeharvesting. Soil Use and Management 4, 45-51.
Hoagland, D.R. and Martin, J.C. (1933): Absorption of potassium by plants inrelation to replaceable, non-replaceable and soil solution potassium. SoilScience 36, 1-32.
Johnston, A.E. (1986): Potassium fertilization to maintain a K balance undervarious farming systems. In: Nutrient Balances and the need for Potassium.International Potash Institute, Basel, 177-204.
Johnston, A.E. and Goulding, K.W.T. (1990): The use of plant and soil analysisto predict the potassium supplying capacity of soil. In: Development of KFertilizer Recommendations. International Potash Institute, Basel, 177-204.
Johnston, A.E. and Goulding, K.W.T. (1992): Potassium concentrations insurface and groundwaters and the loss of potassium in relation to land use.In: Potassium in Ecosystem. Biogeochemical Fluxes of Cations in Agro- andForest-systems. International Potash Institute, Basel, 135-158.
Johnston, A.E. & McEwen, J. (1984): The special value for crop production ofreserves of nutrients in the subsoil and the use of special methods of deepplacement in raising yields. In: Nutrient balances and fertilizer needs intemperate agriculture. International Potash Institute, Basel, 157-176.
Johnston, A.E., Warren, R.G. & Penny, A. (1970): The value of residues fromlong-period manuring at Rothamsted and Woburn. V. The value to arablecrops of residues accumulated from K fertilisers. Rothamsted ExperimentalStation Report for 1969, Part 2, 69-90.
Karim, A.Q.M.B. and Malek, M.A. (1957): Potassium fixation in East Pakistansoils under different conditions. Soil Science 83, 229-238.
516

Kuhlman, H., Claassen, N. and Wehrmann, J. (1985): A method for determiningK uptake from subsoil by plants. Plant and Soil 83, 449-452.
Leigh, R.A. (1989): Potassium concentrations in whole plants and cells inrelation to growth. In: Methods of K research in plants. International PotashInstitute, Basel, 117-126.
Leigh, R.A. & Johnston, A.E. (1983a): Concentrations of potassium in the drymatter and tissue water of field-grown spring barley and their relationshipsto grain yield. Journal of Agricultural Science, Cambridge 101, 675-685.
Leigh, R.A. & Johnston, A.E. (1983b): The effects of fertilizer and drought onthe concentrations of potassium in the dry matter and tissue water of field-grown spring barley. Journal ofAgricultural Science, Cambridge 101, 741-748.
Leigh, R.A. and Wyn Jones, R.G. (1984): A hypothesis relating criticalpotassium concentrations for growth to the districution and functions of thision in the plant cell. New Phytologist 97, 1-13.
Mengel, K. (1989): Experimental approaches on K' efficiency in different cropspecies. In: Methods of K research in plants. International Potash Institute,Basel, 47-56.
York, E.J., Bradfield, R. and Peech, M. (1953): Calcium-potassium interactionsin soils and plants. i. Lime-induced potassium fixation in Mardin silt loam.Soil Science 76, 379-387.
World Commission (1987): World Commission on Environemnt andDevelopment. Brundtland G. (Chairperson): Our Common Future. OxfordUniversity Press, Oxford.
517

International Networks to Improve the Acquisitionand Dissemination of Results on Soil Fertility
J.K. Syers and R.J.K. MyersInternational Board for Soil Research and Management, P.O. Box 9-109,Bangkhen, Bangkok 10900, Thailand
Abstract
This paper considers the organization and operation of internationalnetworks and their potential for enhancing the conduct and outputs of soilfertility research by using human and physical resources more effectively.
In the collaborative research network approach, joint planning,implementation, monitoring, and data exchange provide a cost-effectivemechanism for the acquisition of results and subsequent dissemination ofinformation, thus giving it a comparative advantage over conventional soilfertility research.
The structure of networks, in terms of their components and interactions,varies appreciably, as do their activities, although effective coordination toassist organization and promote harmonization is a key ingredient to theirsuccess
The IBSRAM Management of Acid Soils in Asia network is used as a casestudy to examine pathways of data and information flow within the network andto and from the outside world. It is concluded that collaborative researchnetworks can provide a useful basis for extension activities.
1. Introduction
The term "agricultural network" means different things to different peopleand a general definition is difficult. This is not surprising given that suchnetworks have different objectives and come in various shapes and sizes. At themost basic level, networking aims to use human and physical resources moreeffectively. By minimizing duplication of effort and involving, at relatively lowcost, a group of staff working on specific problems, networking can potentiallyincrease the technical and economic efficiency of agricultural research. It canachieve this by evaluating, adapting, and providing a basis for extrapolation andinformation sharing of research findings.
519
As pointed out by Plucknett et al. (1990), networking is not new; theconcept was used in several developed countries prior to the Second WorldWar. Since the early 1980's, in particular, the organization and coordination ofnational and international agricultural research programmes has increasinglyinvolved a network approach to improve the efficiency of research (Greenlandet al, 1987). Today, networks play an important role in strengthening nationalagricultural research systems (NARS) in developing countries. The value ofnetworks as a tool in development has been recognized by donors (Faris, 1991)who wish to optimize their investment, although as emphasized by SPAAR(1987), networks do not a provide a universal solution.
This paper considers the organization and operation of internationalnetworks and their potential for enhancing the conduct and outputs of soilfertility research. A network relating to the Management of Acid Soils in Asia,operated by the International Board for Soil Research and Management(IBSRAM), is used as a case study.
2. Definition and types of networks
Faris (1991) developed the following generic definition for an agriculturalnetwork: ".... a group of individuals or institutions linked together because of acommitment to collaborate in solving a common agricultural problem or set ofproblems and to use existing resources more effectively". This definition aimsto embrace all types of agricultural networks, including those relating toinformation, collaborative research, and extension.
Networks may be classified in different ways, but the classificationdeveloped by SPAAR (1987) forms the basis of current thinking (Plucknett etal., 1990). This system is based on the level of research in the network and theextent of collaboration; it may also be used to describe the way in whichnetworks assist the cooperating scientists (Greenland et al., 1987). Three typesof networks were considered by SPAAR (1987), namely:
Type I Information exchange to facilitate the exchange of ideas,methodologies, and research results;
Type 2 Scientific consultation which allows for collaboration in planningand sharing of results but research on a common problem isconducted independently;
Type 3 Collaborative research which provides for joint planning,implementation, and monitoring of the research, and the sharing ofresults.
520

In this paper, collaborative research networks will be emphasized.In international collaborative research networks, results are shared for the
benefit of participating and also of non-participating countries. The comparativeadvantage of a collaborative research network over conventional research, insoil fertility for example, is that joint planning, implementation and monitoring(as far as possible using a common methodology), and exchange of resultsprovide a cost-effective mechanism for the acquisition of results and subsequentdissemination of information. There is the potential to involve, at the planningstage, all possible users of the information so that the right questions are tackledat the outset (Latham and Syers, 1994) and the chances of adoption areincreased. In assessing reasons for the non-adoption of new innovations,Fujisaka (1992) listed among them: absence of a problem, inappropriateinnovation, and incorrect identification of adoption domain.
Having discussed the types of networks it is appropriate to consider thestructure and activities of networks, with particular emphasis on collaborativeresearch networks.
3. Organization, operation, and activities of networks
The structure of networks, in terms of their components and interactions,varies appreciably, as do their activities. Faris (1991) has given severalexamples of network structures and these will not be repeated here. Indiscussing collaborative research networks, Faris (1991) considers that there arefive major components, namely research, coordination, communication,membership, and assets.
Research is usually conducted by the NARS, which include governmentagencies, universities, and sometimes private institutions. Coordination isinvariably employed to organize the network, to assist the cooperators with thedevelopment and execution of the programme, and to harmonize the activities.Good communication between mem bers and between members and thecoordinating body is an essential component of an effective network. This caninvolve the provision of information and training activities. Assets includehuman and physical resources, and external funding, from donors, in particular.
The way in which these components are organized in an IBSRAMcollaborative research network is shown in Figure 1. In this model, which hasbeen operating with reasonable success for some seven years, othercollaborating scientific partners are either International Agricultural ResearchCentres (IARCs) or developed-country research institutions.
521
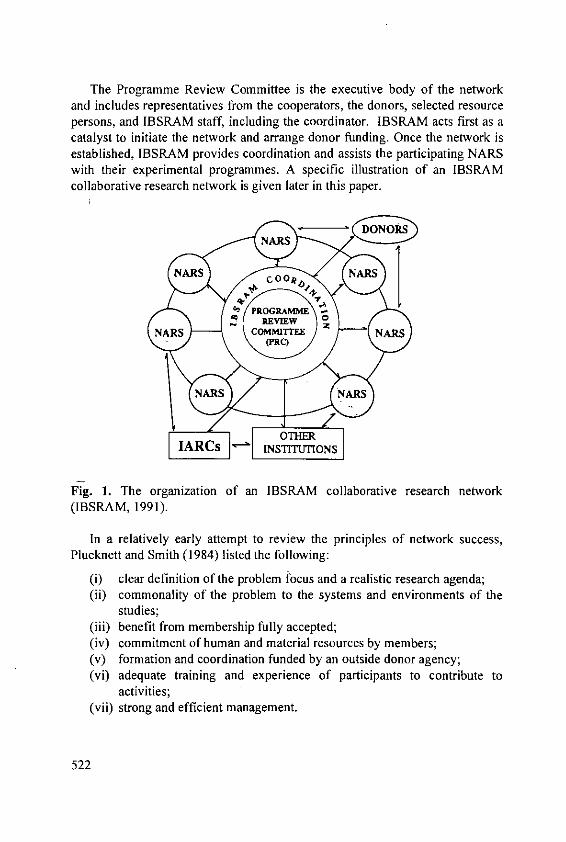
The Programme Review Committee is the executive body of the networkand includes representatives from the cooperators, the donors, selected resourcepersons, and IBSRAM staff, including the coordinator. IBSRAM acts first as acatalyst to initiate the network and arrange donor funding. Once the network isestablished, IBSRAM provides coordination and assists the participating NARSwith their experimental programmes. A specific illustration of an IBSRAMcollaborative research network is given later in this paper.
INSTITUTIONS
Fig. 1. The organization of an IBSRAM collaborative research network
(IBSRAM, 1991).
In a relatively early attempt to review the principles of network success,Plucknett and Smith (1984) listed the following:
(i) clear definition of the problem focus and a realistic research agenda;(ii) commonality of the problem to the systems and environments of the
studies;(iii) benefit from membership fully accepted;(iv) commitment of human and material resources by members;(v) formation and coordination funded by an outside donor agency;(vi) adequate training and experience of participants to contribute to
activities;
(vii) strong and efficient management.
522
To this list Greenland et at. (1987) added:
(viii)sufficient new materials, ideas, and technology feeding in;(ix) participants are involved in management of the network
More recently, Faris (1991) surveyed 23 publications in which the traits ofthe five network components identified above (research, coordination,communication, membership, and assets) were considered to be important for acollaborative research network and concluded that the three most importantwere: (i) a well-defined common research theme or strategy, (ii) strong andeffective coordination, and (iii) flexible outside funding. There are importantmessages here for institutions wishing to establish and donors contemplatingfunding new collaborative research networks.
4. Examples of international networks
The important role of several major networks coordinated by the IARCs inthe distribution and evaluation of crop varieties and germplasm is wellestablished (Greenland et al., 1987). There has usually been little emphasis onsoil fertility management in these networks, although there is often considerablepotential to generate useful information from them.
Examples of successful international networks relating to soil fertilityinclude the International Network on Soil Fertility and Fertilizer Evaluation forRice (INSFFER), established by the International Rice Research Institute (IRRI)in the late 1970's. This network initially emphasized the efficiency of fertilizernitrogen use, but subsequently established long-term soil fertility trials,compared forms of fertilizer phosphorus, and studied the integration of organicand inorganic forms of nitrogen. The INSFFER network laid the groundworkfor much of the currently used methodology in collaborative research networks,namely a common experimental design, assistance with site and environmentalcharacterization, and the pooling of experimental results.
IBSRAM was established in 1985 to strengthen and promote soilmanagement research using a collaborative network approach. In thesenetworks the NARS cooperators are encouraged to validate and adapt existingsoil management technologies, and to develop new technologies by conductingappropriate research. All five of the current IBSRAM research networks addresssoil fertility issues, particularly the networks relating to the Management ofAcid Soils in Asia (discussed below) and to Sustainable Agriculture for HumidTropical Africa, where nutrients are supplied as inorganic and organic sources,and the effects of the judicious use of lime are being investigated.
523
In the network concerned with the Management of Sloping Lands in Asia(which has been in operation for six years) losses of nutrients (N, P, and K) inrunoff and sediment are being monitored at sites in China, Indonesia, Laos,Malaysia, Philippines, Thailand, and Vietnam. When these data are combinedwith those for nutrient offtake in crops and input in fertilizers, crop residues,and manures, it is possible to develop nutrient budgets which can assist inassessing fertilizer requirements. In the network relating to the Management ofSloping Lands in the Pacific, early emphasis on soil erosion, as a major cause ofland degradation, is gradually shifting towards soil fertility decline, particularlynutrient depletion. Lastly, the research network concerned with the WaterManagement of Vertisols in Africa primarily addresses the effect of removingexcess water (in the case of projects in Ghana and Kenya) and the conservationor harvesting of water (in the case of Zimbabwe), using simple land-shapingtechniques. The often quite substantial yield increases being obtained inZimbabwe, with simple land shaping, for example approximately 27 percent forsorghum, 32 percent for cotton, and 45 percent for maize, accentuate nutrientremoval by crop offtake, with direct and potentially major implications to futurefertilizer requirements. The Zimbabwe experiments are generating importantinformation which can be used directly for extension.
In each of the five IBSRAM networks, briefly described above, theexperimental sites are characterized using a standardized methodology outlinedin the IBSRAM Methodological Guidelines (Pushparajah, 1995), withmonitoring and evaluation also following common protocols. This enhances thecapacity for effective interchange of data and provides a more meaningful basisfor extrapolation and technology sharing of soil fertility information. Propercharacterization of the site in a network can assist with overcoming theconstraint of site specificity (Latham and Syers, 1994) which is so common inmuch soil fertility research.
Finally, successful networks relating to soil fertility management usuallyhave strong training and information dimensions, the latter in particular usuallyproviding a potentially effective vehicle for dissemination of experimentalresults. Several collaborative research networks produce their own newsletterwhereas the reports of annual meetings of the network, where research resultsare presented and discussed, can readily be used by extension workers andothers concerned with information sharing.
524
5. IBSRAM's management of acid soils in Asia network: a case study
In this discussion, the network is first described in terms of its componentsand interactions; second, its activities in acquiring and disseminating results forsoil fertility are outlined; and third, an attempt is made to evaluate whether thetotality of the network is greater than the sum of the parts, i.e., is value added?
An outline of the acid soils network
In establishing the network, IBSRAM recognized that the management ofacid upland soils in Southeast Asia presented a major problem, leading on theone hand to continued poverty of the increasing numbers of people dependingon these soils, and on the other hand to serious land degradation due toinappropriate farming practices. At the same time, many researchers in theregion were often unable to conduct effective research or to disseminate theresults of their research due to lack of resources. What research was being doneoften lacked impact due to it being discontinuous and uncoordinated, and therewas little adoption of the findings by farmers.
The network was established in 1991 to develop improved, viable soilmanagement technologies to sustain and improve food and other agriculturalproduction on acid upland soils in the region. The stated objectives were to testand validate existing knowledge; to develop appropriate technologies on themanagement of soil acidity and acid soils; to strengthen the capability of NARSin undertaking research on the soil management components of croppingsystems, with special regard to the improved and sustainable management ofacid soils; and to facilitate a system for exchanging research information on soilmanagement among agricultural scientists through training courses, meetings,workshops, and publications.
At present, the network consists of nine project sites in five countries(Indonesia, Malaysia, Philippines, Thailand, and Vietnam), with research beingconducted by 13 institutions, strategic research backup from the University ofQueensland (Australia), and coordination being provided by IBSRAM. The sitesrepresent a range of annual rainfall (1300-3000 mm), and latitude (0-21degrees). At each site, one or more field experiments are conducted with a viewto identifying farmer-acceptable technologies for the area. A range of farmingsystems exists across the sites, including intercropping of young rubberreplantings, intercropping of young orange orchards, and rotations involvingcassava, corn, peanut, mungbean, and upland rice.
525
The experiments are individually designed for each site, but there is a degreeof commonality in the sense that the treatments are based on comparing theresults from a range of inputs (lime, chemical fertilizers, and organic inputs) tothe current local farming practice. Also, the collection of an appropriate set ofweather, crop, and soil data permits the interpretation of the results in relation tothe local weather and soil conditions, and also permits comparison of the resultsacross sites.
It was formed initially as a collaborative research network (type 3). Thisfocus has been maintained, but subsequent growth through addition of sites has,in some instances, been at the level of scientific consultation (type 2); thedevelopment of scientific linkages for information exchange with other NARSand IARC scientists has been a type I network activity.
Acquisition and dissemination of information in the network
The mechanisms
Network research data. The scientists who conduct the work retainownership of the data and the right to publish the results in national orinternational journals. However, they agree to provide the individual replicatedata to IBSRAM for the development of a data base. IBSRAM can also use,with discretion, some results for its newsletters and other publications. Networkscientists report progress on their research to annual meetings of the network.These reports are lightly edited and published in the IBSRAM NetworkDocument series, for distribution to network cooperators, scientists in othernetworks, donors, and other selected scientists and institutions. Networkcooperators and the IBSRAM coordinator also publish, from time to time,reports on the research at national and international conferences, symposia, andworkshops. The University of Queensland's strategic research is reportedinitially at annual meetings and in an annual report to the donor, which isdistributed to the cooperators and IBSRAM. Through these mechanisms,researchers in the network now have the opportunity for their research results tobe disseminated internationally in English.
Research data from elsewhere. Although the network now constitutes amajor proportion of the research on acid soil management conducted in theregion, it is important to be aware of the results coming from other relevantresearch, for example that being conducted in CGIAR centres such as IRRI,ICRAF, and CIAT, other international centres such as IFDC and TSBF, andother national centres. This is achieved through an informal network of contactssharing research papers, sometimes at the draft or preprint stage.
526

These are usually channeled through the coordinator. The only hint offormality in the informal, extended information network is that the persons maygain some feeling of belonging through being on the mailing list of the networknewsletter - 'EXCHANGES on Acid Soils'. The documents received in this waybecome part of the network's literature data base, which is described below, andin that way become available throughout the network.
Technical information on methods. Technical information on methods isprovided initially through IBSRAM's Methodological Guidelines (Pushparajah,1995), the TSBF Handbook of Methods (TSBF, 1993), and other literaturewhich describes the agreed methods. From time to time, training needs areidentified and workshops aimed at providing information and experience for thecooperators are conducted. Usually, the proceedings of these workshops arepublished for distribution to a wider audience within and outside the network.However, often the methods used require modification for local conditions, oralternative methods need to be found, or new methods become available. Insuch cases, information is provided either by the coordinator from his ownexperience, or from the literature data base, by consulting with a knownauthority or by sending a consultant to work with the cooperators to sort out aproblem. Papers reporting new methods or modifications to methods areroutinely made available to cooperators.
Technical information in reprints, books, and reports. Most cooperators donot have easy access to a good library, nor do they have the budget for directutilization of computerized data bases, nor for even mailing requests to authors.IBSRAM attempts to bridge this information gap through utilizing mainly theCABI data bases, particularly SOILCD and Soils and Fertilizers. The literaturedata base includes material relevant to research and management of acid soils,including papers, reports, and book chapters on all aspects such associocconomics, agronomy, and soil science. It contains mostly scientific papersfrom the international literature, but also more popular articles in newslettersand bulletins, and also attempts to gather the important grey literature. Atintervals, lists of titles of recent accessions are distributed to cooperators whocan then request copies of the articles from the coordinator. Scientists at abouthalf of the sites use this service, mostly by requesting copies of articles, andsome with access to a good library follow up with their own library. TheIBSRAM Proceedings series, which are freely available to cooperators and theirlibraries, contain many relevant reviews. Many scientists in the region arehampered by their lack of ease with the English language. It is not surprising,therefore, that they are less than enthusiastic about screening the entirety of thepublished material available.
527

Technical information through discussion and observation. Annual meetingsand workshops provide valuable opportunities for cooperating scientists toformally exchange information by their reports, informally through discussions,and visually by visits to the research sites. Further information exchange occursduring monitoring visits to sites, although in this case often only the projectleader benefits directly from these opportunities.
The pathways
The pathways of data and information flow in the network are shown inFigure 2 and described below.
OTHERLITERATURE SCIENTISTS
OTHER (STRATEGIC)RESEARCH INSTITUTIONS
(c UNIVEISITY OF QUEENSLAND)COORI NATOR
SITE
COOPERATORS
0INFORMAL, NETWORK
SCIENTISTS
Fig. 2. Pathways of data and information flow in the Management of Acid Soilsin Asia network.
Coordinator = Cooperator:- Technical information in the form of reprints, book chapters, and reports- Technical advice on methods- IBSRAM Newsletter, EXCHANGES on Acid Soils, and other IBSRAM
publications- Advice on future research and publication of past research
Cooperator > Coordinator:- Data from network research- Reports on research progress- Drafts of research papers- News items
528
Cooperator =' Cooperator:- Exchange of experiences at inter-site visits, annual meetings, and workshops- Written reports at annual meetings- Analytical service for some difficult analyses
University of Queensland =' Coordinator:- Data sets from their strategic research and from cooperators- Technical advice on methods- Published papers and reports
Coordinator = University of Queensland:- Data sets from cooperators- Reports on site visits- IBSRAM Newsletters and EXCHANGES on Acid Soils
University of Queensland => Cooperator:- Technical advice on socioeconomics and laboratory methods- Annual report, revised data base
Cooperator => University of Queensland:- Data sets from field sites- Material for inclusion in reports- Drafts of scientific papers
Coordinator = Informal network scientists:- EXCHANGES on Acid Soils, network documents- Published papers- Technical information, advice on methods, advice on publication
Informal network scientists = Coordinator:- Newsletters and publications- Advice on matters requested by coordinator- Other information on initiative of informal network scientists- Occasional attendance at meetings
Cooperator = Informal network scientists:- Information exchange at meetings (opportunities to attend because of linkage)
Informal network scientists = Cooperator:- Information exchange at meetings
Discussion of information flows
A diagram such as Figure 2 is an over-simplification given that the flowsbetween site cooperators are complex and change with time. All site cooperatorsinteract when they are together at meetings.
529
At other times, most information flow is via the coordinator. However,within Vietnam, there are strong and continuing flows of information betweenthe National Institute of Soils and Fertilizers and scientists at the other sites.
The apparent duplication of the flow of data from site cooperators to bothIBSRAM and the University of Queensland is due to data being supplied toeither the IBSRAM coordinator or visitors from the University of Queensland.At present the University of Queensland has the job of primary sorting of datainto a data base; IBSRAM has the secondary job of tabulating data sets fromwhich papers can be written. The individual site cooperators then prepare thefirst drafts of the papers.
The diagram does not include linkages between the IBSRAM networks.Such linkages are desirable, particularly in the case of the SustainableAgriculture for Humid Tropical Africa network, where acid soils are important,and the Sloping Lands in Asia network, where most sites are on acid soils. Infact, in Asia, there are linkages between the Acid Soils and Sloping Landsnetworks in Malaysia, Philippines, and Vietnam, but not in Indonesia andThailand. Linkages with the African network have been limited, for financialreasons, to information flow through the coordinators.
The "informal network" linkages are mainly through IBSRAM and theUniversity of Queensland. Many of the tangible benefits are still to come,although we have had some through a joint training course with IRRI andcontribution to a CIMMYT project. We are confident that we will soon be ableto demonstrate such benefits in research and training through new linkages withMassey University, Rothamsted International, and TSBF.
Linkages to other international networks have not been developedextensively. Talk is cheap but real collaboration has a price tag. Thus, despitethe obvious benefits from linking with the ICRISAT-sponsored Working Groupon Acid Soil Tolerance in Grain Legumes, so far the linkage is little more thanan exchange of newsletters.
Data or information?
A network, such as that relating to be Management of Acid Soils in Asia,provides a clear example of the difference between data and information.Although a necessary goal of the network is to establish a data base ofexperimental results, which can be used within the network for preparing papersand reports, or for use in GIS and simulation modeling projects within oroutside the network, the data base so created may be little used. The greatmajority of people wanting to use the network's findings will do so using othermaterial, such as annual reports.
530
Consequently, the data base is really only a store of data. The process ofconverting these data into information is a lengthy one. The various publishedprogress reports are only steps along the way, because they tend to consistlargely of partially interpreted tables of results. There are two further steps -firstly, to produce research papers containing fully-interpreted data and theinformation derived from these data, and secondly, to add value to thisinformation through further interpretation, using tools such as simulationmodeling, and also by the integration of the results across sites in differentcountries, perhaps using simulation modeling and GIS.
Added value in the network
In attempting to answer the question - is the whole of the network greaterthan the sum of the parts? - this brief discussion will be restricted to the topic ofacquisition and dissemination of information.
From time to time, the site cooperators have offered unsolicited and(sometimes) solicited comments on the value of the network. Before thenetwork was established, it has been alleged that scientists working on acid soilsin the region had opportunities to interact and exchange ideas and informationwith other scientists with similar interests only within their own country or withcountries where they already had contacts, such as developed countries.Scientists rarely had opportunities to meet other scientists from other countriesin the region. The network has provided an opportunity to rectify this situationand participants do not wish to lose it. Being in the network has also providedopportunities for scientists to attend international meetings that they would nototherwise have had; this has applied to at least five international meetings in thepast four years, thus providing a ready mechanism for informationdissemination.
The network has provided cooperating scientists with access to bibliographicinformation that they did not have before. The eventual value of this shouldshow in improved interpretation of data and scientific reports of widerrelevance. However, the mere provision of literature does not automatically andinstantly lead to its effective use in preparing publications, but it is a goodstarting point. The network has also provided a pathway for scientists fromsome developed countries to gain access to data sets for their own research, tothe benefit of all parties.
Finally, although extension is not a formal function or activity of thenetwork, collaborative research activities can form a useful basis for extensionrelating to soil fertility management, including fertilizer recommendations.
531

References
Faris, D.G. (1991): Agricultural Research Networks as Development Tools:Views of a Network Coordinator. International Development ResearchCentre, Ottawa.
Fujisaka, S. (1992): Thirteen reasons why farmers do not adopt innovationintended to improve the sustainability of upland agriculture. In: Evaluationfor Sustainable Land Management in the Developing World (Dumanski, J.,Pushparajah, E., Latham, M. and Myers R.J.K., eds.) pp. 509-522. Volume2. International Board for Soil Research and Management, Bangkok,Thailand.
Greenland, D.J., Craswell, E.T. and Dagg, M. (1987): International networksand their potential contribution to crop and soil management research.Outlook on Agric. 16: 42-50.
IBSRAM (1991): IBSRAM's Strategy: 1991-2001. International Board for SoilResearch and Management. Bangkok, Thailand.
Latham, M. and Syers, J.K. (1994): Using collaborative research networks topromote sustainable land use. In: Soil Resilience and Sustainable Land Use(Greenland, D.J. and Szabolcs, I., eds) pp. 513-520. CAB International,Wallingford.
Plucknett, D.L. and Smith N.J.H. (1984): Networking in internationalagricultural research. Science 225: 989-993.
Plucknett, D.L. and Smith N.J.H. and Ozgediz, S. (1990): Networking inInternational Agricultural Research. Cornell Univ. Press, Ithaca, New York.
Pushparajah, E. (1995): Methodological Guidelines for IBSRAM's SoilManagement Networks. International Board for Soil Research andManagement, Bangkok, Thailand.
SPAAR (1987): Collaborative Research Networks: Desirable Characteristics.Special Program for African Agricultural Research, Washington D.C.
532
Improving Management and Impact of FertilizersWith Modelling
P.K. Thornton,International Fertilizer Development Center, P.O. Box 2040, Muscle Shoals,Alabama 35662, USA
Abstract
Most of the productivity gains required to feed growing populations globallywill have to come from increased crop yields per hectare. If the food production
challenge is to be met in a way that minimizes environmental problems, inputsincluding fertilizer will have to be managed in increasingly efficient andeffective ways. Management information is thus likely to become an
increasingly important resource for researchers, extension workers and farmers.Crop simulation models now exist that can be used to generate some of the
information required, by extrapolating field trial results across space and time
and quantifying the production risk associated with particular management
practices. The uses of crop models in fertilizer management are outlined in three
broad categories: fertilizer recommendations, environmentally sound fertilizeruse, and spatial analyses of fertilizer use to facilitate marketing and policy
decision making. Areas of future work are indicated.
1. Introduction
In the mid-1990s, unlike 35 years ago, there is no breeding-based Green
Revolution around the corner that can be depended upon to increase food
production and raise the living standards of millions of people in the tropics and
subtropics (Rohrbach, 1994). The next Green Revolution, if and when it occurs,will probably be associated with biotechnology, but the advent of nitrogen-
fixing cereals is not yet close at hand, so far as we can tell. In many parts of the
developing world, the productivity gains needed to feed growing populations
will have to come from increased yields per unit area of land, for the foreseeablefuture. This has important implications for two classes of commodities that are
sometimes scarce on the farm: inputs and information. Judicious use of inputs is
required, particularly fertilizer, to increase farm incomes and reduce incomeinstability while minimizing nutrient losses and damage to the environment. Forresearchers and farmers, different or adaptive management practices increase the
need for management information, and this information has to be generatedsomehow.
533

There is considerable potential for integrating computer-based decisionsupport tools into the research and development process, to help generate suchmanagement information. Computer-based decision support tools can be used toprovide timely and effective information for use by researchers, extensionists,farmers, the private sector and policy makers. Increased efficiency in the designof appropriate soil fertility and crop management packages for smallholderfarmers and in the extension of the results can be achieved by reducing theburden traditionally placed on field experimentation. Models allow theassessment, in an objective fashion, of crop performance in locations wherefield experimentation has not necessarily been carried out. They can also beused to study the dynamics of agricultural systems in terms of the changingcircumstances of production and the vagaries of weather. Models can be used toscreen production alternatives with direct reference to the resource base offarmers over many seasons, allowing production stability, risk, and long-termviability to be investigated explicitly.
In this paper, a set of management orientated crop models is brieflydescribed. These models are the result of continuing cooperation between manypeople, and draw on information generated in many parts of the world. Some ofthe ways in which these models are now being used to address fertilizer issuesare outlined, and some suggestions for future model development andapplication are made.
2. Crop and nutrient simulation models
A set of crop models has been developed, tested and applied under theauspices of the International Benchmark Sites Network for AgrotechnologyTransfer (IBSNAT) project, a multinational collaborative initiative coordinatedby the University of Hawaii from 1983 to 1993. This work is continuing underthe banner of ICASA, the International Consortium for Agricultural SystemsApplications, a joint venture between members of the IBSNAT network andsystems modellers at institutions in the Netherlands. These initiatives havefostered the development of the CERES and CROPGRO models, which allowthe quantitative determination of growth and yield of a number of importantfood crops (rice, wheat, barley, sorghum, millet, maize; soybean, peanut, andphaseolus bean). Closely related models also exist for potato, cassava, taro andtanier, and sugarcane. These models all share much in common, notably thesame input and output files, and comparable levels of detail. The growth of thecrop is simulated with a daily time step from sowing to maturity on the basis ofphysiological processes that are affected by soil and aerial environmentalconditions. The models include soil water, nitrogen and phosphorus balances,
534

operating on the basis of soil layers, and the models thus respond to changes infertilizer source, amounts, placement and timing.
The most recent versions of these models are embedded in a piece ofsoftware called the DSSAT (Decision Support System for AgrotechnologyTransfer). The original DSSAT Version 2.1 (IBSNAT, 1989) has now beenextensively upgraded and released as Version 3 (Jones, 1993; Tsuji et al., 1994).The DSSAT itself is a shell that allows the user to organize and manipulate crop,soils and weather data and to run crop models in various ways. The package alsoincludes various analysis and graphical tools to allow users to compare and
contrast simulation outputs. Changes in the new DSSAT include a new set ofinput-output files and the capability to run crop sequences and rotations, where
carry-over effects of soil and water are simulated from one season to another.The crop models have been (and continue to be) developed using two major
guiding principles. First, they are management-orientated, designed to be usedand applied to help solve real-world problems. This has a number of implications:
(a) The models need to be as simple as possible while displaying sensitivityto important management and environmental factors, and they need torun on readily-available and cheap personal computers.
(b) The input data required to run the models need to be simple to obtain orderivable from simple inputs.
(c) The models should be robust, capable of working in a wide variety of
environments.
There are clear trade-offs involved between the level of detail in a model,the type of data necessary to run it, and the model's degree of portability. The
DSSAT crop models appear to have struck a good balance: the models are
detailed enough to allow a wide range of management options to be investigated;
the input data required are, in the main, the type of data that are often collected
from agronomic field trials; and the models have been shown to work in a widevariety of environments.
The second major guiding principle is that the models be able to operate
according to the law of the most limiting factor. They can be run at a number of
different levels. The first level, which can be used to investigate yield potential,involves running the model with no constraints or limitations other than those
associated with climate. Thus water and nutrients are assumed to be non-limiting. The second level involves running the models with water routines,where water may be limiting. The third level incorporates nitrogen sensitivity,where N may be limiting. At this third level, calculations are made on any day
in the model to show which factor is most limiting to growth. One day it might
be water; on the next, it might be nitrogen.
535
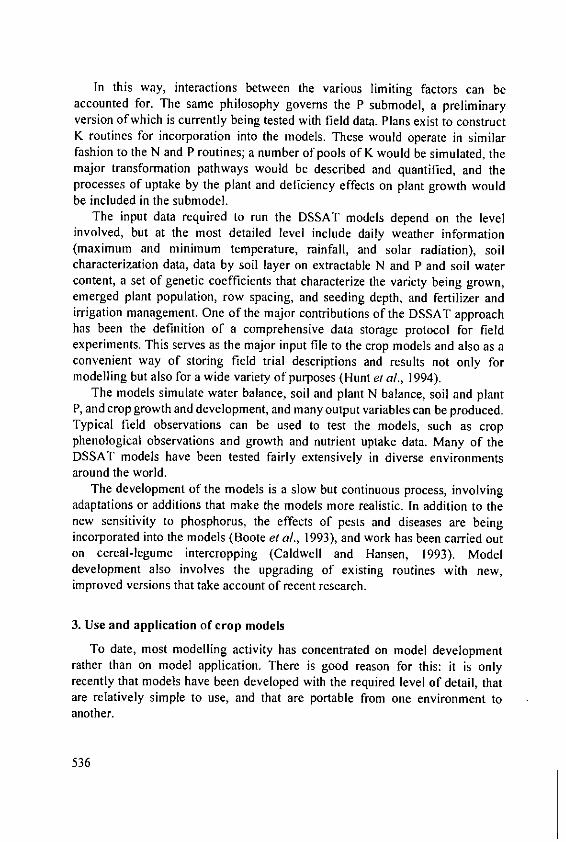
In this way, interactions between the various limiting factors can beaccounted for. The same philosophy governs the P submodel, a preliminaryversion of which is currently being tested with field data. Plans exist to constructK routines for incorporation into the models. These would operate in similarfashion to the N and P routines; a number of pools of K would be simulated, themajor transformation pathways would be described and quantified, and theprocesses of uptake by the plant and deficiency effects on plant growth wouldbe included in the submodel.
The input data required to run the DSSAT models depend on the levelinvolved, but at the most detailed level include daily weather information(maximum and minimum temperature, rainfall, and solar radiation), soilcharacterization data, data by soil layer on extractable N and P and soil watercontent, a set of genetic coefficients that characterize the variety being grown,emerged plant population, row spacing, and seeding depth, and fertilizer andirrigation management. One of the major contributions of the DSSAT approachhas been the definition of a comprehensive data storage protocol for fieldexperiments. This serves as the major input file to the crop models and also as aconvenient way of storing field trial descriptions and results not only formodelling but also for a wide variety of purposes (Hunt et al., 1994).
The models simulate water balance, soil and plant N balance, soil and plantP, and crop growth and development, and many output variables can be produced.Typical field observations can be used to test the models, such as cropphenological observations and growth and nutrient uptake data. Many of theDSSAT models have been tested fairly extensively in diverse environmentsaround the world.
The development of the models is a slow but continuous process, involvingadaptations or additions that make the models more realistic. In addition to thenew sensitivity to phosphorus, the effects of pests and diseases are beingincorporated into the models (Boote et al., 1993), and work has been carried outon cereal-legume intercropping (Caldwell and Hansen, 1993). Modeldevelopment also involves the upgrading of existing routines with new,improved versions that take account of recent research.
3. Use and application of crop models
To date, most modelling activity has concentrated on model developmentrather than on model application. There is good reason for this: it is onlyrecently that models have been developed with the required level of detail, thatare relatively simple to use, and that are portable from one environment toanother.
536
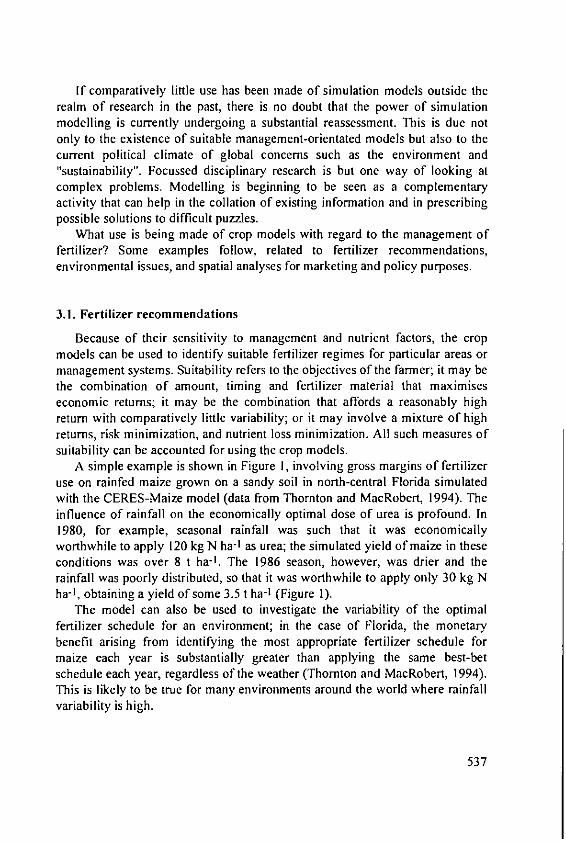
If comparatively little use has been made of simulation models outside therealm of research in the past, there is no doubt that the power of simulationmodelling is currently undergoing a substantial reassessment. This is due notonly to the existence of suitable management-orientated models but also to thecurrent political climate of global concerns such as the environment and"sustainability". Focussed disciplinary research is but one way of looking atcomplex problems. Modelling is beginning to be seen as a complementaryactivity that can help in the collation of existing information and in prescribingpossible solutions to difficult puzzles.
What use is being made of crop models with regard to the management offertilizer? Some examples follow, related to fertilizer recommendations,environmental issues, and spatial analyses for marketing and policy purposes.
3.1. Fertilizer recommendations
Because of their sensitivity to management and nutrient factors, the cropmodels can be used to identify suitable fertilizer regimes for particular areas ormanagement systems. Suitability refers to the objectives of the farmer; it may bethe combination of amount, timing and fertilizer material that maximiseseconomic returns; it may be the combination that affords a reasonably highreturn with comparatively little variability; or it may involve a mixture of highreturns, risk minimization, and nutrient loss minimization. All such measures ofsuitability can be accounted for using the crop models.
A simple example is shown in Figure I, involving gross margins of fertilizeruse on rainfed maize grown on a sandy soil in north-central Florida simulatedwith the CERES-Maize model (data from Thornton and MacRobert, 1994). Theinfluence of rainfall on the economically optimal dose of urea is profound. In1980, for example, seasonal rainfall was such that it was economicallyworthwhile to apply 120 kg N ha-1 as urea; the simulated yield of maize in theseconditions was over 8 t ha-1. The 1986 season, however, was drier and therainfall was poorly distributed, so that it was worthwhile to apply only 30 kg Nha- 1, obtaining a yield of some 3.5 t ha-1 (Figure 1).
The model can also be used to investigate the variability of the optimalfertilizer schedule for an environment; in the case of Florida, the monetarybenefit arising from identifying the most appropriate fertilizer schedule formaize each year is substantially greater than applying the same best-betschedule each year, regardless of the weather (Thornton and MacRobert, 1994).This is likely to be true for many environments around the world where rainfallvariability is high.
537

400"
300- 1980
200-
- - 1986
E 0
-100
-200-
0 30 60 90 120 150 180Urea applied (kg N/ha)
Fig. 1. Simulated economically optimal applications of urea for rainfed maizegrown at Gainesville, Florida, for the 1980 and 1986 seasons, using 1992 costsand prices.
The crop models can also be used to investigate the timing of fertilizerapplication and way in which it is applied. An example is the use of the maizemodel for sandy soils in central Malawi. Figure 2 shows the simulated responseof a hybrid maize, MH-16, to applications of urea, applied in two ways: as asingle application at planting, and split in three equal amounts at planting and at30 and 60 days after planting. Simulations were run using a number of years ofhistorical weather data to derive the distribution of yield response at eachfertilizer level. The yield response curves show that at high levels of applied N,there is little difference between single and split applications in terms of themean yield response. The probability of poor yields with smaller fertilizeradditions, however, is greatly increased for the single application compared withthe split application. For instance, at 90 kg N applied, there is a 10% chance ofobtaining only 2 t ha-t or less with the single application; the 10% probabilityfor the split application scenario is 4 t ha-1 (Figure 2A). In other words, splitapplications in this environment are beneficial on sandy soils because theyreduce the risk of poor yields compared with single applications of the sameamount of N. As might be expected, the associated leaching losses of N aregreater for the single fertilizer application compared with the split application(Figure 28). The crop models are thus excellent tools for investigating fertilizertimings and amounts.
538

Economic analyses can be performed readily, and the impacts of differentcosts and prices, and cost-price variability, can be assessed (Thornton andHoogenboom, 1994). Model results might then be translated into easily-followedmanagement recommendations. These recommendations could be season-specific as well as site- or region-specific. For example, historical weather
records for central Malawi (and for other countries of sub-Saharan Africa) show
that if the rains start late in any year, then the season's total rainfall tends to below; in such years, response to fertilizer may well differ from average or above-
average rainfall seasons. Fertilizer recommendations to the farmer might then
depend on the best-bet estimate of total seasonal rainfall (Thornton el at., 1994).
7
A
S"
-C 4
o3-
2
0 th, 50th, 90th yield pecetiles1
o 40 80 120 I1S 200 240 280
180-
160. Mean N loss
'a140-
m120"
loo-
Z 40
0
0 40 80 120 160 200 240 280
Nitrogen applied (kg/ha)
Fig. 2. (A) Simulated yield response of rainfed maize on a sandy soil at
Mwimba, central Malawi, to nitrogen applied at planting (-) and in 3 equal
splits at 1, 30 and 60 days after planting (----). (B) The corresponding mean
nitrogen losses through leaching.
539

A format for presenting fertilizer recommendations, and one that couldusefully be applied directly by extension agents in some circumstances, isthrough the use of a diagnostic expert system based on rules concerning soil andplant nutrient concentrations obtained from easily-observed or simply-measuredfield variables. Based on the rules within the expert system, managementdecisions could be made pertaining to fertilizer application in terms of the typeof fertilizer and the amount to apply, for example. An example is thePhosphorus Decision Support System (PDSS) described by Yost (1994). Similartypes of decision support system have been constructed for the management ofvarious pests and diseases in field crops (Edwards-Jones, 1993), and nutrientmanagement decisions could be handled in the same way.
3.2. Environmental impact assessment of fertilizer use
A second major area in which the crop models are being used is in theassessment of the impact of fertilizer use on the environment. Studies such asthat cited above for maize fertilization in Malawi and nitrate leaching in maizeplots in Thailand (Singh and Thornton, 1992) show that losses from inorganicfertilizers can be substantially reduced and crop uptake enhanced by propertiming of nutrient applications. The models are a tool that can be used toinvestigate these losses directly, in the search for management alternatives thatcan maximise the efficiency of nutrient use.
CERES-Rice contains subroutines for simulating nitrogen transformations inflooded conditions. A simulation study of ammonia volatilization in paddy ricein the Philippines (Singh and Thornton, 1992) showed that increased nitrogenuse efficiency in terms of increased grain yields and lower volatilisation lossescan be achieved by thorough incorporation of fertilizer nitrogen, by placing itdeep into the soil, or through the use of controlled release fertilizer. If urea wasbroadcast onto the water surface, model predictions indicate that nearly 40 percent of the N applied would be lost as ammonia within 16 days. Deep-point place-ment of urea, however, would almost totally eliminate the volatilization loss.
The crop models do not as yet contain routines for dealing with soil erosion,although links with routines from other models that are sensitive to erosion arestarting to be made within the ICASA group. Soil erosion effects will often haveto be incorporated into assessments of long-term viability of fanning systems. Aproper economic evaluation of P and K fertilizer practices requires that carry-over effects from one year to the next, for a period of several years, be takeninto account. Improving the long-term predictive capabilities of the crop modelsis thus an important area of research.
540
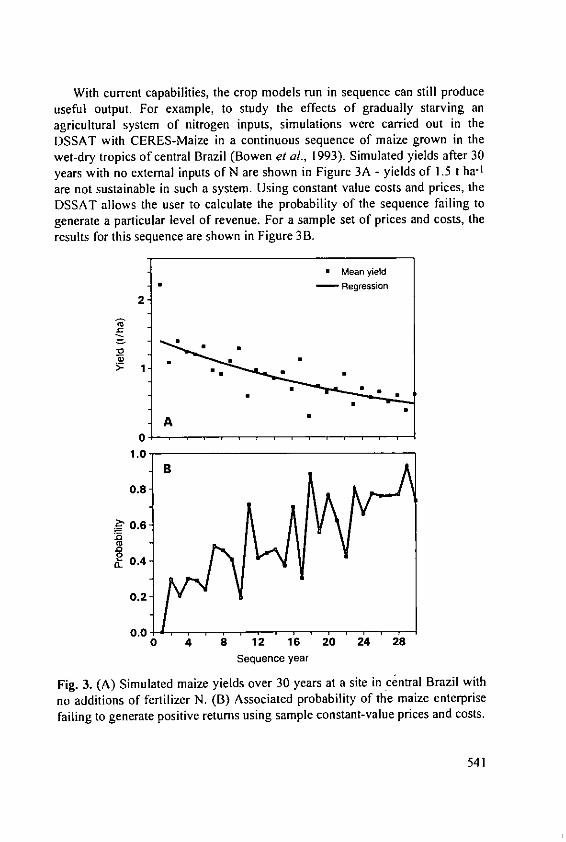
With current capabilities, the crop models run in sequence can still produceuseful output. For example, to study the effects of gradually starving anagricultural system of nitrogen inputs, simulations were carried out in theDSSAT with CERES-Maize in a continuous sequence of maize grown in thewet-dry tropics of central Brazil (Bowen et al., 1993). Simulated yields after 30years with no external inputs of N are shown in Figure 3A - yields of 1.5 t ha-1
are not sustainable in such a system. Using constant value costs and prices, theDSSAT allows the user to calculate the probability of the sequence failing togenerate a particular level of revenue. For a sample set of prices and costs, theresults for this sequence are shown in Figure 3B.
Mean yieldRegression
2-
A
1.0
-B
0.8 B
_ 0.6
.0
0 0.4
0.2
0.0~0 4 8 1'2 16 20 24 28
Sequence year
Fig. 3. (A) Simulated maize yields over 30 years at a site in central Brazil withno additions of fertilizer N. (B) Associated probability of the maize enterprisefailing to generate positive returns using sample constant-value prices and costs.
541

The probability of the continuous maize enterprise failing to generatepositive income rises substantially, from about 0.2 in the early years of thesequence to 0.7 in the later years. While this is an extreme example, and despitethe fact that other long-term processes are not taken into account, such outputsillustrate the potential value of the crop models in assessments of long-termmanagement options. In the example from Brazil, what amount of N input isrequired to keep maize yields around the 1.5 t ha-1 level? Such questions can bereadily addressed and answered using the DSSAT.
3.3. Spatial analyses for marketing and policy
The third major area where the models have a role to play in relation tofertilizer management is in spatial analysis. The crop models can be linked toGeographic Information Systems (GIS), computer software tools that consist ofspatial databases and mapping and analyses modules. The databases hold spatialdescriptions of the inputs required to run the models, and the user can set upoptions that can be run and analysed using the GIS. Particular combinations ofweather, soil, and crop management may or may not result in a substantialresponse to fertilization. The models can help in the identification of suchcombinations. Aggregated consumption and production information for largeareas can be produced for companies involved in the marketing of inputs andfor government policy makers.
Some work carried out by IFDC in Albania illustrates the approach. Aprototype information system was set up using the CERES-Wheat model and acommercially-available GIS (ARC/INFO). One of the more intensiveagricultural regions of Albania is the area surrounding the town of Lushnje inthe southern-central part of the country, where winter wheat is a major crop.From the Albanian soils map of the region and soil data collected and analyzedat the Soils Research Institute in Albania, soil profile information was estimatedfor each mapping unit. Daily weather data for ten years were also assembled.The study region, about 12 km from east to west and 50 km from north to south,is generally flat, with sandy clay Ioams and silty oams of moderate inherentfertility. The wheat model was run for each unique combination of soil type andweather conditions, with no additions of fertilizer N. For each combination, tensimulations were carried out, using different weather years to allow yieldvariability to be estimated.
Results are mapped in Figure 4, showing the mean wheat yield obtained oneach soil type. The map shows clearly the spatial variability associated withwheat production arising from differences in soil characteristics. For two of thesoil units, simulated fertilizer response curves are shown also. Such information
542

would allow planners and agricultural input dealers to identify those areas thatare more likely to benefit from increased fertilizer use, for example.Figure 5 maps the location of agricultural input dealers, members of AFADA,the Albanian Fertilizer and Agricultural Input Dealers Association, in theregion. The district has been split up into arbitrary "dealerships" using Dirichlettessellations. One of these is highlighted, and covers an area of some 6,800 ha.
Mean Wheat Yield (1/ha), 10No Fertilizer ,
O 30 60 N 120 150 80
E Not cropped N APPLIED (klha)
* 0 -100El 1.00 - 2.00 o
0 2.00 - O] 3.00 - 4.00
0 o M o 0 120 160 190
N APPLIED (kglha)
Fig. 4. Simulated wheat yields with no fertilizer additions, and two contrastingnitrogen response curves for the region around Lushnje, Albania.
Using information derived from socio-economic surveys concerning thepercentage of the area sown to winter wheat, the farmers' planting window, thelikely application schedule of farmers in the area, and the mean total amount ofN fertilizer likely to be applied (Henao, 1994), the decision support softwarecan produce a graph showing likely farm-level demand for N fertilizer duringthe coming season (Figure 5).
Given this information, the input dealer can try to ensure that he hassufficient stocks over the winter and spring to meet the likely demand at thefarm level. The system could then be used to derive seasonal yield estimates ofwheat for planners, given these estimated levels of inputs. This crop model GISprototype, which needs much further development, is currently being used byAFADA in Albania for demonstration purposes.
543
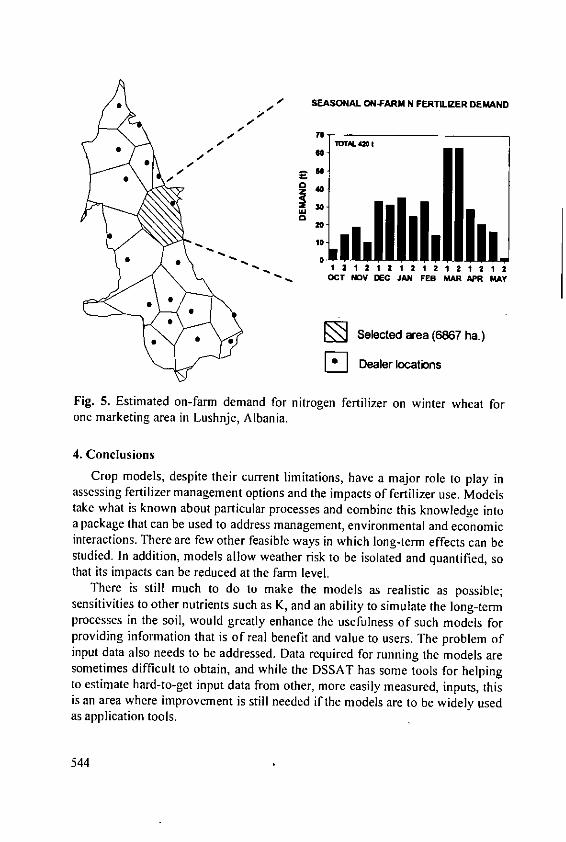
- SEASONAL ON-FARM N FERTILIER DEMAND
S c OTAL a0 t
4. Conluson
interactions.~ ~ ~ ~ ThrSe e ohrfail wy nwihlonterm ffect can be.
studied.~~~ ~~ InadtomdlDlo ete ikt eoaed loatindsunifes
thits .Eimata ed n rdedmandh farm nire el. lzro ine haTe re itill mrai uhne o Ao b aketemoesasraitia.posbe
sestiiierop m oldiethe ient schrre n d iiains abt to smuate t lynrproessein hertoil woulgretl epinshance the usefulns of stluse modelsoprvdnifratewhtison at isorartl proese and value thies Thnolem inofinputag hat also eed to addressd Datageet requirfounengthe mdel aoomisomeatimes. diffcul areoe obtn, awible ways Sn whah og-em tools helpntstimed hnaditotionpu data alom oether, rikte eailymaued in uatse, thso
isaTae here imrv en is still neede tidft m k the models arealiti be pside luedsensiction to ohrntinssuhasada.aiiyt iuat h ogtr
4 n u
provdin ifra inta so-elbnftadvlet sr.Tepolmoinu at loned obeadese.Dt rqie frrnin h odl rso eie* ifcl ootiadwieteD S Thssm ol o epn
toesiat hr-t-etinu dt fomohe, oe ail maurd ipus ti
as apDealerioocttions
Fi5.4siae4nfr eadfrntognfriie nwne ha o
Such tools have to be institutionalized if their benefits are to be fullyrealised. Models are by no means out of place in national agricultural researchsystems in developing countries, and indeed can be argued to have their mostpotential impact in this setting, where resources are scarce and efficient use hasto be made of them in deriving viable and transferable recommendations forpassing on to the smallholder farmer. Models can also play a part in derivingregional information for use at the policy level and by agribusinesses, one ofwhose tasks is to develop profitable marketing strategies of inputs. Crop modelsare starting to be used as integrated components of management and businessinformation systems. With careful use, models have considerable potential forproviding information concerning fertilizer use for making decisions that areeffective, timely, and profitable.
Acknowledgments
Without implicating them in any way, I thank Walter Bowen and CarlosBaanante for helpful comments on a previous draft of this paper.
References
Bowen, W.T., Jones, J.W. and Thornton, P.K. (1993): Crop simulation as apotential tool for evaluating sustainable land management. pp 15-21. In: J.M.Kimble (ed), Proceedings of the 8th International Soil ManagementWorkshop: Utilization of Soil Survey Information for Sustainable Land Use -May 1993. USDA, Soil Conservation Service, National Soil Survey Center.
Boote, K.J., Batchelor, W.D., Jones, J.W., Pinnschmidt, H. and Bourgeois, G.(1993): Pest damage relations at the field level. pp 277-296. In: F.W.T.Penning de Vries, P.S. Teng, and K. Metselaar (eds), Systems Approachesfor Agricultural Development, Kluwer, Dordrecht.
Caldwell, R.M. and Hansen, JW. (1993): Simulation of multiple croppingsystems with Crop Sys. pp 397-412. In: F.W.T. Penning de Vries, P.S. Teng,and K. Metselaar (eds), Systems Approaches for Agricultural Development,Kluwer, Dordrecht.
Edwards-Jones, G. (1993): Knowledge-based systems for crop protection:theory and practice. Crop Protection 12, 565-578.
Henao, J. (1994): Area sampling frame and crop yield surveys in Albania -1993.Paper Series P-20, IFDC, Muscle Shoals, Alabama, USA.
Hunt, L.A., Jones, JW., Hoogenboom, G., Godwin, D.C., Singh, U., Pickering,N., Thornton, P.K., Boote, K.J. and Ritchie, J.T. (1994): General input andoutput file structures for crop simulation models. pp 35-73. In: P.E. Uhlir
545
and G.C. Caner (eds), Crop Modeling and Related Environmental Data. AFocus on Applications for Arid and Semiarid Regions in DevelopingCountries. Monograph Series Volume I, CODATA, Paris.
IBSNAT (1989): Decision Support System for Agrotechnology Transfer(DSSAT) V2.10. Department of Agronomy and Soil Science, University ofHawaii, Honolulu, Hawaii, USA.
Jones, J.W. (1993): Decision support systems for agricultural development. pp459-472. In: F.W.T. Penning de Vries, P.S. Teng, and K. Metselaar (eds),Systems Approaches for Agricultural Development, Kluwer, Dordrecht.
Rohrbach, D. (1994): Maize research for stress environments in perspective: thebroader challenge of improving farmer well-being in semiarid areas.Proceedings, Fourth Eastern and Southern Africa Regional MaizeConference on "Maize Research for Stress Environments", Harare,Zimbabwe, 28 March - I April, 1994 (in press).
Singh, U. and Thornton, P.K. (1992): Using crop models for sustainability andenvironmental quality assessment. Outlook on Agriculture 21, 209- 218.
Singh, U., Thornton, P.K., Saka, A.R. and Dent, J.B. (1993): Maize modellingin Malawi: a tool for soil fertility research and development. pp 253-273. In:F.W.T. Penning de Vries, P.S. Teng, and K. Metselaar (eds), SystemsApproaches for Agricultural Development, Kluwer, Dordrecht.
Thornton, P.K. and Hoogenboom, G. (1994): A computer program to analysesingle-season crop model outputs. Agronomy Journal 86, 860-868.
Thornton, P.K. and MacRobert, J.F. (1994): The value of informationconcerning near-optimal nitrogen fertilizer scheduling. Agricultural Systems45, 315-330.
Thornton, P.K., Singh, U., Kumwenda, J.D.T. and Saka, A.R. (1994): Maizeproduction and climatic risk in Malawi. Proceedings, Fourth Eastern andSouthern Africa Regional Maize Conference on "Maize Research for StressEnvironments", Harare, Zimbabwe, 28 March - I April (in press).
Tsuji, G.Y., Uehara, G. and Balas, S. (editors) (1994): DSSAT Version 3.University of Hawaii, Honolulu, Hawaii, USA.
Yost, R. (1994): Rule-based systems: the phosphorus decision support system.Proceedings of the CBAG/PBAG Workshop on AgroecosystemsSustainability in the Caribbean and Pacific Islands, Orlando, Florida,October 1994 (in press).
546
Scientific and Practical Approaches in Soil Testingand Fertilizer Recommendations
i.J. KimmoSenior Adviser, FADINAP, UN-Building, Bangkok 10200, Thailand
Abstract
The significance of soil testing for agricultural development in Asia isexplained. The basic differences between the scientific and practical approachesare discussed in relation to each component of the soil fertility assessmentprogramme. For the presentation of soil test results, a new method is suggestedwhich can facilitate comparisons between areas utilizing different analysismethods. The salient features of the planned soil testing network project forAsia and the Pacific are explained.
1. Introduction
Provision of food for the 3.2 billion people in Asia and Pacific region requiresthe development and appropriate use of land resources. With this in mind, mostcountries in the region have initiated programmes on assessment of their naturalresource bases which have provided data for nationwide agricultural planning.
An important objective of the agricultural sector in member countries of theregion is to ensure food security. But such development should not compromisethe sustainable use of land resources through immediate increases in food produc-tion. This is particularly important when it is recognized that increased foodproduction must come from the intensification of agricultural production systems,given that undeveloped land resources in the region are very limited.
The high crop yields obtainable with the advent of the Green Revolution haveplaced heavy demands on soil nutrients which must be replaced if yield levelsare to be maintained and increased. It is now widely recognized that nutrientinput from fertilizers is required, as organic sources are usually inadequate tomeet the overall requirement. To some extent, several of the member countriesin the region have recognized this fact and have substantially increased the useof fertilizers over the last 30 years in order to increase crop yields. Between1961 and 1992, the use of fertilizer nutrients in the developing countries of theregion increased from 2.1 to 54.1 million tons equivalent to 43% of global usein 1992. With the further introduction and adoption of higher-yielding ricevarieties and most notably through the practice of balanced fertilization, plantnutrient input must increase concurrently if yield levels are to be increased andsoil nutrient mining is to be avoided.
547

The general awareness that land degradation threatens the futuresustainability of agricultural productivity in the region has grown in the lastdecade. Soil erosion, nutrient depletion, salinization and acidification are justfour of the processes which contribute to land degradation and environmentaldeterioration. In addition, the more intensive use of fertilizers, without anyimprovement in nutrient use efficiency, can create environmental problems. Atthe same time, appropriate and balanced fertilizer use can substantially reduceerosion, thus contributing to the conservation of soil resources and reducingnegative impacts on water quality. Soil analysis and testing provide an importantmechanism for increasing agricultural productivity through more efficient useof fertilizers, in addition to providing data for resource assessment, monitoringthe soil environment and minimizing the decline in environmental quality,particularly water resources.
Table I. Soil testing activities in some countries of developing Asia. Surveyconducted in August 1993.
Country Total of soil samples for research for advisory work
Bangladesh -30000 22000 8000Cambodia no data I labChina no data c. 1500 labsIndia c. 6.7 mill. c. 520 labsIndonesia (CSAR only) -10000 7000 3000Lao PDR -4700 200 4500Malaysia no data c. 30 labsMyanmar no data 3 labsNepal (central lab only) -2500 1900 600Pakistan (tot. 63 labs) -95000 -
Philippines (Quezon -6100 4600 1500only)Sri Lanka no dataThailand (DLD only, -11800 7000 4800tot. 70 labs)Vietnam no data
A review and assessment of national capabilities of laboratories in the regionto undertake soil testing, organized by FADINAP (ESCAP/FAO/UNIDOFertilizer Advisory, Development and Information Network for Asia and thePacific) from 16 to 18 August, 1993 and held in Bangkok, identified problems
548

and constraints relating to the efficient organization and utilization ofinstitutional capacities in the region. These included inadequate facilities, lackof trained personnel, inappropriate methodologies for soil analysis, andunreliabili-ty of data. Improvement of analytical facilities and capacity inmember countries will improve the volume and quality of data in support ofdevelopment projects.
Table 2. Soil testing labs run by State Governments and fertilizer industry inIndia (1991-92).
Area No. of soil labs Analyzing Capacitystatic mobile capacity (1000) utilization (%)
South zone 81 32 2339.0 91West zone 75 38 1248.0 78North zone 133 47 1946.1 78East zone 65 16 925.5 44North-east zone 20 11 226.3 61Total 374 144 6684.9 77(out of these run 44 43 700.0by industry)
Table 3. Soil-testing labs of India.
Analyzing capacity No. of labssamples/year
> 50000 720-50000 4110-20000 277< 10000 130
It was also learnt that most countries had started with a research-orientedsoil testing programmes. The main objective had then been the need to havesufficient background information for fertilizer recommendations at nationaland/or provincial level.
Of course, support of soil research and scientific work can be classified asthe overall approach of soil testing services in these countries. A few countrieshave clearly moved a couple of steps further by developing soil testingcapabilities and services addressed to tackle problems at farm level.
549
These countries have typically a high level of mineral fertilizer usecombined with the utilization of organic fertilizers. They usually also have awell-developed agricultural research structures. Then there is a group ofcountries at an intermediate stage without a clear emphasis on either side. Thedevelopment from this interim phase may emerge either on diversifieddirection, scientific research laboratories and on the other end servicelaboratories or towards a mixed dual-purpose direction. The last may be theworst choice because some compromises must be accepted which may sacrificethe overall performance of both aspects.
2. Coverage of the concept "soil testing"
In a restricted sense soil testing includes chemical and physical measurementof a soil sample. The scientific approach in the context of soil testing is verynear this definition. But to satisfy all the needs and aspects of the practicalapproach we have to expand the concept considerably. It starts with apreparation of a soil testing programme or a revision and application of somestandard programme. It continues with sampling component, various analysesof chemical and physical characteristics, interpretation of the results based uponvarious considerations and ends up with fertilizer recommendations.
Recognizing many limitations and shortcomings of analyses and othercomponents of soil testing farmers should comprehend that only throughcontinuing participation with the soil testing programme can a reliable andproductive soil fertility assessment be achieved. This does not call for soilanalysis every year but careful recording of inputs and outputs is an essentialpart of a soil fertility assessment programme to ensure lasting success at farmlevel. The question now arises as to the frequency of soil testing in time andgeography. To undertake soil testing e.g. at five year intervals for each farmerof an Asian smallholder community is an unrealistic goal. However, given thatfertilizer supply is satisfactory but not abundant, and farmers of a certain villagefollow approximately the same practices in their paddy farming operations,some compromises can be accepted in soil sampling. The experiencedagricultural extension agent is the best expert in this respect. Finally, it is theextensionist who can help farmers to adopt new methods and practices.
3. Field sampling
Most crucial in a soil testing programme is the collection of soil samples.After the sample has been taken no subsequent activity can correct the failuresmade in sampling.
550

The sample represents the whole area which it was meant to cover.Unfortunately, soil sampling is often the most neglected component of the soiltesting programme. Experience gained through many years may help but in toomany cases collection of soil samples has been left to people without anyknowledge of soil research or crop production.
Sampling is the component of a soil-testing activity where the differencebetween scientific and pragmatic approach is biggest. It starts with the sampler;very often sampling is done by the researcher or under his direct supervision. Asampling plan has been prepared carefully, utilizing grid-model or some othersystematic approach. Equipment is normally as recommended in professionalmanuals. Sampling density follows research guidelines.
For a larger research scheme, there is more planning and control involvedwith sample collecting activities than is the case with sampling for advisorypurposes. There are exceptions, of course. As earlier mentioned, experiencegained through years, sound deliberation and objective assessment can producemore completely representative sample of the area albeit the sampling densitymay well be much smaller than in research endeavours.
A significant difference between scientific and practical approaches is in thecost of the soil testing scheme as a whole and of each component part of it;sampling cost is substantial. The price farmers pay for soil testing in developingcountries does not cover the whole cost. Some countries provide a free servicewhile others charge only nominal fees. Countries moving towards a marketeconomy have experienced difficulties in soil testing as in other sectors.Farmers who used to get soil testing services for nothing are nowadays quitereluctant to pay relatively high charges and often have given up using theseservices. Countries which are only now commencing soil testing services forindividual farmers are puzzled by the fee-dilemma. One thing is clear; it isdefinitely better to charge some than nothing, on the other hand charging thefull cost with a reasonable supplement for capital costs and overheads maybackfire rapidly.
4. Chemical analyses
In principle, the same analytical methods are used for both scientific andpractical purposes. The scientific approach may require measurement of all thevarious forms of a soil nutrient whereas, for practical advisory purposes, onlythe plant available form is of interest. It must be emphasized already in thiscontext that a cornerstone for a successful soil testing programme is theestablishment of greenhouse and field trials in order to calibrate the correlationbetween chemical methods and crop growth in the field.
551
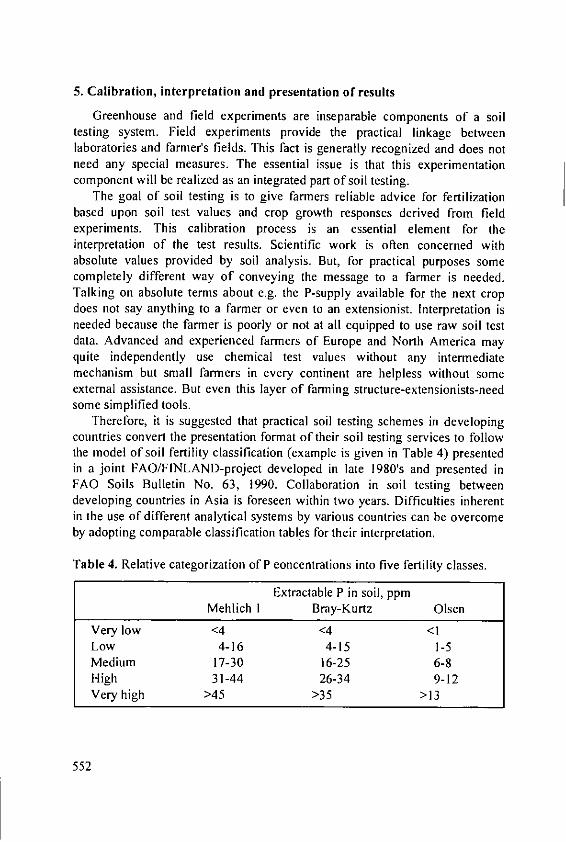
5. Calibration, interpretation and presentation of results
Greenhouse and field experiments are inseparable components of a soiltesting system. Field experiments provide the practical linkage betweenlaboratories and farmer's fields. This fact is generally recognized and does notneed any special measures. The essential issue is that this experimentationcomponent will be realized as an integrated part of soil testing.
The goal of soil testing is to give farmers reliable advice for fertilizationbased upon soil test values and crop growth responses derived from fieldexperiments. This calibration process is an essential element for theinterpretation of the test results. Scientific work is often concerned withabsolute values provided by soil analysis. But, for practical purposes somecompletely different way of conveying the message to a farmer is needed.Talking on absolute terms about e.g. the P-supply available for the next cropdoes not say anything to a farmer or even to an extensionist. Interpretation isneeded because the farmer is poorly or not at all equipped to use raw soil testdata. Advanced and experienced farmers of Europe and North America mayquite independently use chemical test values without any intermediatemechanism but small farmers in every continent are helpless without someexternal assistance. But even this layer of farming structure-extensionists-needsome simplified tools.
Therefore, it is suggested that practical soil testing schemes in developingcountries convert the presentation format of their soil testing services to followthe model of soil fertility classification (example is given in Table 4) presentedin a joint FAO/FINLAND-project developed in late 1980's and presented inFAO Soils Bulletin No. 63, 1990. Collaboration in soil testing betweendeveloping countries in Asia is foreseen within two years. Difficulties inherentin the use of different analytical systems by various countries can be overcomeby adopting comparable classification tables for their interpretation.
Table 4. Relative categorization of P concentrations into five fertility classes.
Extractable P in soil, ppmMehlich I Bray-Kurtz Olsen
Very low <4 <4 <1Low 4-16 4-15 1-5Medium 17-30 16-25 6-8High 31-44 26-34 9-12Very high >45 >35 >13
552
The basic principle would be to divide all soil test values into fivecategories; (i) very low, (ii) low, (iii) satisfactory, (iv) high, (v) very high. Thedivision in percentages should follow 1/5-scales produced by a national survey.
The limit values for various analytical methods for each main soil type andenvironment should be agreed on a regional basis. It is indispensable, however,that the use of some kind of "common language" constitutes an essential featureof a regional soil testing network. The crucial issue is to guide Asian farmers toparticipate in soil fertility management in order to provide a lasting and firmbasis for increased food production in Asia.
6. Quality assurance
The reliability of soil testing is a crucial element in persuading farmers tojoin a national soil testing service. It must be ensured both on short and longerterms. Therefore, comprehensive arrangements are needed for these purposes.On scientific scene, quality control aspects do not play such a central role thanin practical schemes. Quality control issues are present in every component ofthe soil testing services.
The reliability of the test results is often questioned and the blame attributedto the laboratory. But the most likely candidate for the role of the culprit isimproper soil sampling.
However, there can be faults the laboratory. Most methods are calibrated tofunction within the temperature range 21-220C which is impossible in tropicalor subtropical conditions without reliable air-conditioning.
Fluctuations in the electric voltage are maybe the most detrimental indistorting the final results. Provision of a standard electric current stabilizerwould be enough, no high-tech solutions are needed.
The failures in reliability have been presented in many papers. It hascertainly been a shock to learn that a laboratory considered to be a leader in acertain sub-region failed completely in a comparative survey organized by aninternational body in that region. This underlines the necessity for continuouscontrol and vigilance. The measures needed to improve the technical skills andpreparedness in the region are finally quite simple; training and more training.Training at all levels, regular dissemination of information within the countryand regionally, these are essential to achieve still better results.
7. Fertilizer recommendations
The first step advising farmers on the utilization of fertilizers hastraditionally been fertilizer recommendation at national level.
553

The next step has normally been recommendations at provincial or districtlevel and the final goal is, of course, individualized fertilization plans based onsoil test results, records of crop production on the farm, yield goals, etc. Indeveloping Asia this is only wishful thinking at present but it may become areality sooner than we can now think possible. To get ready for thisdevelopment any revision or reform in soil testing structures should include alsoa provision of a comprehensive data processing capacity. Computerization willbe an essential component of the planned soil testing network.
8. Soil testing network for Asia and the Pacific
In August 1993, a regional workshop on cooperation in soil testing for Asiaand the Pacific was arranged in Bangkok. There were participants from 17countries within the region. There was one clear message from the workshop;the need for a soil testing network in the region. This idea was stronglysupported by member country participants.
Establishing a successful network was seen as a way of improving thequality of laboratory analyses through improved methodology and qualitycontrol using standard samples, and the interpretation of laboratory data.
There are still several unresolved issues relating to the operation of a soiltesting network but the implementation will be realized under the leadership ofFAO. The main components of the project will be training and quality control.The fears that establishing of a soil testing network for the region wouldcomprise only hardware acquisitions, are unfounded. In a round-table inquiryconducted in the August 1993 Workshop by the Chairman all delegatesindicated the most crucial needs to be for training and quality control. Manysupported the early implementation of the project, commenting that it should beinitiated with a training component only and even on a self-financing basis.Indeed, constraints in training opportunities were considered as the main causehampering the successful operation of soil testing systems in many membercountries. Some additional or complementary equipment is somewhere needed,of course; a couple of countries even need the basic equipment but a clearemphasis is on the area of training.
A second meeting to prepare a draft project proposal was arranged in June1994. Subsequent discussions with funding experts of FAO have, however,changed the planned structures and schedule of the project. It is not possible tostart with full implementation; no donor would be available for such a bigproject covering an area with about 72% of the farming population of thisworld. But, the sheer size in population and geography should not repel donors.
554

Simply, the attitudes within the bilateral donor community have recentlyturned more hostile to agriculture and donors tend to select projects which canshow quick results. I cannot resist drawing a parallel with an earlier joint effortwith FAO and Finland to establish a soil testing network for 10 SADCC-countries in Southern Africa. FINNIDA had the money reserved and ready fortransfer to Rome but some details delayed the procedures in Africa and thegreen light came three months too late. Economic recession had hit Finland andmany more countries. ODA-allocations were axed or rearranged, EasternEurope was identified as a new region in need of vast amounts of developmentassistance albeit only small sums have been disbursed so far. Therefore, it seemsa paradox that, only four years ago, one small donor was prepared to financealone similar activities of a 5-year project, now it is considered impossible toget only 2/3 of that amount to finance a 4-year project in Asia.
The present intention is to start implementation in January 1996. The first,preliminary, phase will select five countries and concentrate on upgrading theirskills and soil testing systems to such a standard that there is some uniformity incompetence which will enable them to operate effectively within the network.
Thereafter, in phase 1, five more countries will be selected and, dependingupon available funding, this will last for 2 or 3 years. Phase 2 will extend andwill be open to all developing countries throughout the region. It is anticipatedthat member countries will be able to contribute to costs.
The specific objectives of the project would be to develop soil analysis andtesting facilities for the following:
- generating soil data necessary for resource assessment and developmentplanning
- increasing the efficiency of fertilizer use at the farm and national level byassessing and monitoring soil nutrient status
- promoting quality assurance of the analytical data generated with a view toenhancing their reliability
- fostering the development of improved soil management technologies andpolicy formulation leading to increased and sustainable agriculturalproductivity, including crop quality improvement, and improvedconservation of soil and water resources.
References
FADINAP (1992): Proceedings of the Regional Seminar on Fertilization and theEnvironment, 7-11 September 1992, Chiang Mai, Thailand.
FADINAP (1993): Proceedings of the Regional Workshop on Cooperation inSoil Testing for Asia and the Pacific, 16-18 August 1993, Bangkok, Thailand.
555

FAO Soils Bulletin 38/1 (1980): Soil and Plant Testing and Analysis.FAO Soil Bulletin 63 (1990): Micronutrient assessment at the country level; an
international study.Melsted, S.W. and Peck, T.R.: The Principles of Soil Testing. University of
Illinois, USA.Sootin Claimon (1993): Department of Agriculture Thailand: Soil Testing and
Formulating Fertilizer Recommendations, IFDC training workshop 6-17December 1993, Bangkok.
556
Plant genotype effects on efficient use of plant nutrients
D.J. Bonfil and U. KafkafiThe Hebrew University of Jerusalem, Dept. of Field Crops,Faculty of Agriculture, P.O. Box 12, 76100 Rehovot, Israel
Summary
"Efficient use of nutrients" has been variously defined. Most commonlyefficiency is defined as economic yield or plant dry matter production per unitnutrient applied or taken up. Deficiencies of S, P and K in the presence of amplesoil N can affect gene expression in wheat. When a nutrient is deficient in anatural soil, natural selection leads to development of plants which store higherconcentration of that nutrient in the seed to the benefit of succeedinggenerations. When the economic yield is fruit or grain high in K, "potassiumefficiency" should be measured during the final growing stages when most ofthe K has been taken up and translocated from vegetative to generative organs.Studies of nutrient efficiency confined to early growth stages could bemisleading in breeding programs which aim to develop cultivars with moreefficient nutrient utilization.
The definition nutrient use efficiency
Efficient use of nutrient by plants is defined in several ways (Blair 1993):a. the ability of the genotype to acquire plant nutrients from the rhizosphere;b. the ability to incorporate plant nutrients in the plant biomass;c. the ability to produce commercial plant part biomass (seed, grain, fruit,
tubers, roots and forage).While efficiency is an intensity parameter, response is a capacity parameter.
Response is the capacity of a genotype to increase uptake and yield as a result ofnutrient supply to the plant. To the breeder, the definitions of "efficiency" and"response" are important. Gerloff (1976) classified plants into 4 responsegroups: Plants which produce high (efficient) or low (inefficient) yields at lowlevel of nutrition and that respond or do not respond to added nutrients.
There are many ways in which plants can adapt or respond to nutrient stress.These can be via alterations to root branching and extension rates; rate of uptakeper unit root length or root dry weight; partitioning between roots, shoots andgrains; amount or concentration of nutrient required for plants to function;growth habit and mineral uptake timing. Each of these can be altered to someextent by selection, breeding or biotechnology.
557

In undertaking such programs the question which arises is: how to measurenutrient efficiency? The following options were used in several investigations tomeasure the nutrient efficiency (Table 1).
Table 1. Measurement options for estimating nutrient efficiency.
No. Reference Efficiency UnitI Williams 1948 uptake rate g nutrient per unit root per day2 Barrow 1975 uptake g nutrient per unit root3 Jones 1974 incorporation g dry matter per unit nutrient in the
DM4 utilization plant DM or any other production
unit per unit nutrient applied5 Blair 1993 utilization economic yield or plant DM per
unit nutrient applied or taken up6 Yougquist el al 1992 uptake g plant nutrient per g soil nutrient7 harvest index g nutrient in economic yield per
total nutrient uptake
Clearly, selection or manipulation programs need to consider the economicend product (in food and forage production systems), so it is most appropriate todefine nutrient efficiency in terms of economic yield per unit nutrient applied orper unit of nutrient taken up (Table I No. 5). Ranking cultivars for efficiencydepends upon the definition used. In wheat, selection for P harvest index wasnot found to be related to efficiency (Blair, 1993).
The comparison of efficiency between genotypes on the basis of any of theabove definitions, could be affected also by the nutrient level under which theefficiency is defined (Blair, 1993).
In a sand culture experiment (Shinde el al., 1992), with 15 Sorghum bicolorgenotypes consisting of local cultivars, improved varieties, hybrids and theirparents, the genotypic variation in K uptake and accumulation with age wasstudied. The efficiency of absorbed K calculated using option 3 (g DM per mgK in plant DM) showed that local cultivars had the highest efficiency only atphysiological growth stage 1. This led Shinde el al. (1992) to conclude thatimproved varieties and hybrids are likely to respond to split application of Kfertilizers at 30 and 60 days after sowing, while for local cultivars, splitapplication may not be particularly effective. Nevertheless, the actual Kefficiency in producing dry matter (DM/K uptake) is only one parameter thatneeds to be considered.
558

Woodend and Glass (1993) studied the inheritance of short term netpotassium flux (STNKF) and potassium utilization in 3 week old wheat plantsof 4 Triticum aestivum families under conditions of potassium stress. Theydetermined STNKF by depletion; utilization was measured as fresh shootweight per plant (SWP), potassium efficiency ratio (KER, g DM/g tissuepotassium - option 3, Table 1) and potassium utilization efficiency (KUE, g
fresh weight/millimole of tissue potassium). However, no matter which type of
efficiency definition is adopted, examining a short vegetative period cannotreplace traditional full season breeding methods that reveal the true productioncapacity of a particular genotype. For practical yield considerations, thecapacity of a cultivar to produce yield is the most important parameter.
Isfan et al. (1991) used a full season study under greenhouse conditions with
two levels of N applied: no N (control) and 150 mg N/kg of dry soil, to evaluatenitrogen use efficiency (NUE) of twelve spring triticale genotypes. NUE was
defined using option 5 in Table I (grain yield per amount of nitrogen absorbedby the above-ground plant parts at maturity). There were highly significantvariations among genotypes in both yield per pot and NUE. NUE ranged from
36.9 to 49.9 and from 27.4 to 33.9 g grain/g of absorbed N in the control and N
fertilized treatment, respectively. Grain yield was positively and significantlyrelated to NUE in both control and fertilized treatments. The results suggest thatNUE could be used in a plant breeding program to detect the potentially highyielding triticale genotypes and to evaluate those capable of exploiting N input
most efficiently. This work took into account not only the uptake of N duringthe vegetative period but also the partitioning of N between straw and grain.Such an approach was also taken by Youngquist et al. (1992) in Sorghumbreeding, defining uptake efficiency by options 5 & 6 in Table I. They foundthat total plant dry weight, total dry weight per grain N and harvest index werethe best predictors of genotypic performance for plant N per soil N, aboveground DM per plant N, and grain yield per plant respectively (r2 = 0.89, 0.68,0.82). They suggested that the best use of the above alternative screeningcriteria would be as prescreening tools to eliminate the poorest genotypes. Thiswould alleviate the need to do whole plant analysis on a large number ofsamples, yet permit a fair level of confidence in making final selections.
Youngquist and Maranville (1988) concluded that nitrogen uptake efficiencycontributed more to biomass production, while nitrogen utilization efficiencywas more important for grain production. Uptake and utilization efficiencies
were similar in both high and low nitrogen soils, although utilization efficiencytended to increase in importance in low nitrogen soils.
559

In wheat, Beninati and Busch (1992) found that grain protein concentrationwas positively associated with N concentration in the aerial vegetation on abasis of area but not with total aerial biomass. Thus, grain protein concentrationwas associated with more efficient N redistribution, and not with greater Nuptake quantity. The grain yield and grain protein content of wheat varietieswere affected differently by the timing of N application (Peltonen, 1993). Theability to breed wheats that have desired N- traits has shown that N-use traits arestrongly influenced by the environment, and would be difficult to modify in abreeding program (Sanford ei al, 1991). However, increasing grain proteinconcentration was achieved by using wild species such as Triticum dicoccoides(Grama el aL, 1987). But in cereals, where the grain yield is the target,translocation to the grain affects the final grain yield and the translocation is nota constant ratio to the DM production as shown in the harvest index (HI) valuesin Table 2. The reason is that the final yield obtained is a function of bothgenetic, nutrition and climate conditions. As grain yield potential, expressed bythe number of grains/m 2, was highest at the highest nutrient level applied (Table2), due to rain shortage in the grain filling stage, the grain weight and HI werereduced and the commercial grain yield did not reach its potential (Halevy elal, 1976). Table 2 demonstrates that the same wheat cultivar may responddifferently to N nutrient levels at changing soil P levels.
Table 2. Effect of N and P on yield components of wheat.
N-level NalC03 soluble P (mg/kg)(kg/ha) 0 29 0 29 0 29 0 29 0 29
grain/m 2 grain weight straw yield grain yield HI*(mg) g/m2 g/m 2 (%)
0 2780 3048 40.2 40.0 201 191 111 122 36 3930 5287 5625 45.5 43.6 397 385 238 245 37 3960 6736 9296 43.5 44.7 449 664 293 415 39 38120 8407 11617 41.9 43.5 507 858 350 504 41 37240 8109 14575 42.5 35.0 513 1070 343 510 40 32
S.E. N 315 0.87 21.94 13.5S.E. P 241 0.60 27.69 7.9
HI* - I larvest Index, DM Grain/Total DM produced.Source: The Permanent Plots, Bet Dagan (1970).
In most breeding work the cultivars are tested under average agronomicpractices, therefore cultivars with good potential that need a change infertilization practices might be rejected. Hence, it is suggested that newbreeding lines should be tested at both low and high nutrient level to discoverboth efficient utilizers and efficient responders to fertilizers.
560

Clark et al. (1990) studied nutrient acquisition with time by 4 wheat
cultivars at 4 levels of available water. Total plant N and P uptake were
proportional to available water, and were strongly associated with DM
accumulation. 67-100% of plant N and 64-100% of P present at harvest werealready inside the plant at the anthesis stage. Post anthesis N and P uptake were
greater under moist than under dry environments. The few cultivar differencesin uptake of N or P observed were related to variations in plant DW. 59-79% of
N and 75-87% of P present in vegetative tissues at anthesis were translocated to
the grain and that translocation did not vary among cultivars. The efficiencies ofutilization of N and P in yield production were proportional to water availabilityand were greater in the high yielding than in low yielding cultivars. Theyconcluded that there was no evidence that selection for N uptake, translocationor utilization efficiency would be useful in wheat. The same conclusion wasreached also by Feil et al. (1990) for corn based on a short growing period until
the 4th leaf stage, since the interaction between genotypes and N supply was notsignificant. However, in another experiment (Tyker et al., 1989), corn seedlings
were screened for induced nitrate uptake in order to evaluate the direct andindirect effects of such selection. Correlated responses in yield, ear number andgrain N were observed in the field, but significant genotype X environment
(year, location and N supply) interactions were evident. Because of that,interaction response to N as measured by yield and N use, was not directlyassociated with selections based on NO 3 uptake by corn seedlings. This isexpected since NO3 uptake rate is an intensity and momentarily determinedparameter while yield of grain is an integral on time of so many reactions that ifone of them becomes a limiting factor it has the major effect on the final yield.
The difficulty in using nitrate uptake as a characteristic for N use efficiencywas presented also by Wray (1989). Nitrate uptake is the least well
characterized step of the nitrate assimilation pathway. Kinetic analysis of uptakeindicated the presence of 2 distinct transport systems: one 'constitutive' and one'inducible' by nitrate. The genetic approaches which should allow the isolationof mutants which define the genes governing the nitrate transport system wereproposed in that work. The practical conclusion from the works cited abovesuggest that such effort in defining the genes governing the nitrate transportsystem will not produce an expected "Efficient N" plant.
Mackay et al. (1990) have worked with 119 genotypes of white clover withregards to P acquisition. They showed that P use can be improved by breeding.Genetic variability in P use efficiency was examined in tall and semi-dwarfwheat varieties under glasshouse conditions at two levels of P fertilization(Jones et al., 1989). P efficiency was measured by options 2, 3 & 7 (as specifiedin Table I). The parameters tested were: P efficiency ratio, P harvest index and
561
root efficiency ratio. Grain yields were similar in both varieties at both P levels,although the tall varieties had lower harvest index. Increasing P fertilizationincreased the P efficiency ratio and root efficiency ratio (in both varieties), butthe P harvest index was not affected. Selection for grain yield and harvest indexhad a concurrent influence on the P efficiency ratio and P harvest index. Theirfinal conclusion was that there is little scope for improving the internal use of Pas measured by these parameters.
The concentration of any nutrient in seeds is a result of transport andaccumulation. The actual concentration value is expressed as g nutrient per g ofcarbohydrate in the seed. Therefore, the actual value obtained is a result of theratio of transport of nutrients to carbohydrate flow and accumulation in thegrain. The concentration range of minerals in wheat grains was reported byBequette et al. (1963).
Soil nutrient levels effects on gene expression and nutrient use efficiency
Bonfil (1994) studied the response of 9 wild emmer (T. dicoccoides) wheatpopulations, two T aestivum cultivars and one T durum cv. to mineral nutrientsupply. One wild source of wheat (No. 9) had the highest increase in Pconcentration in the grains with increasing P grain yield, showing that this wildsource accumulates relatively more P than carbohydrate in the grains. The resultof that characteristic is clearly observed in Fig. I where the actual grain yield ofthe wild source of wheat (No. 9) was the lowest on all soils tested. The threecommercial wheat cultivars keep an almost constant concentration of P in thegrain but the higher the P supply the higher is the total carbohydrate production,namely, more grain yield is produced. A similar behaviour was found withregard to K supply. However, in one cultivar (Dariel), increasing K supplyreduced the K concentration in the grain, but increased the grain yield.Therefore, by definition, this cultivar is a high K efficient cultivar with thehighest slope value of 0.228 grain yield per grain K (Fig. 2).
Of the genotypes recently studied, it is possible to identify 3 strategiesemployed by plants with regards to nutrient concentrations in the grain asrelated to total mineral yield in the grains:A. Low efficient response genotypes, in which, increased mineral absorption
increases the mineral concentration in the grain.B. Average efficient response genotypes, in which, increased mineral absorption
increases the grain yield but the mineral concentration remains constant.C. High efficient response genotypes, in which, the mineral absorbed is utilized
to increase the grain yield and dilute its mineral concentration.
562

T. Turgidum Var. Dicoccoides 0 1 y = 0.2196x - 0.069 r 2 = 0.908
TI Turgidum Var. Dicocoides o 9 y = 0.1496x + 0.1247 r 2 = 0.894
T. Turgidun Var. Dicoccoides 0 11 y=O.1740x+O.0178 r 2 =0.930
T. Aestivum Var. Betlehem a 21 y = 0.2808x + 0.00 r 2 = 0.843
T. Aestivurn Var. Dail M 22 y = 0.286x + 0.1223 r 2 = 0.846
T Durum Var. Bareket . 23 y = 0.2558x + 0.186 r 2 = 0.873
10*
7.5- a
a
2.5
MMo
0o A 'o
Grain P yield (rag/plant)
Fig. 1. Grain yields of wild and cultivated wheat as a function of phosphoruscontent in the grain.
A demonstration of such behaviour regarding K uptake and utilization ispresented in Fig. 2. Grain yield of genotypes 9 and I11 responded very weakly tothe increase in the external K supply. Genotype 9 in Fig. 2 behaved according tostrategy A above. Genotype 9 is of particular interest since it originated in alocation with the highest amount of soil exchangeable K (561 mg K/kg soil),and this soil was the only one in that study in which during 3 seasons the Kextraction value increased with time. The cv. Dariel produced more grains thanany other cultivar but its K content in the grain behaves according to strategy Cand can be considered an efficient producer with regards to K uptake. The samecultivar responds according to strategy B with regard to phosphate uptake (Fig.1). Therefore, a genotype highly efficient as related to one mineral may notshow high efficiency to other minerals.
563

Genotype
I Turgidum Var. Oicoccoides Dl 1 y = 0.2058x + 0.038 r 2 = 0.943
T. Turgidum Var. Dicoccoides A 9 y = 0.1 677x + 0,0594 r 2 = 0.939
T+ Turgidum Var. Dicoccoides 0 11 y = 0.1 698x + 0+02 r 2 = 0.963
T. Aestivum Var. Betlehem S0 21 y = 0.1918x + 0.1024 r 2 = 0.943
T Aestivum Var. Dariel * 22 y = 0.228x - 0.0639 r 2 = 0.966
T Durum Var. Bareket G) 23 y = 0.1668x + 0,049 r 2 = 0.98210"
9"
8- E
J 5-
00
0 5 10 15 20 25 30 35 40 45
Grain K yield (mg/plant)
Fig. 2. Grain yields of wild and cultivated wheat as a function of potassiumcontent in the grain.
No wheat genotype with high grain yield per unit P taken up with a low Pharvest index was found among many genotypes. This lead Blair (1993) toestimate that the scope for selection of P efficient wheat cultivars is poor.However, as shown in Fig. 1, highly P efficient cultivar can be defined withoutconsidering harvest index (HI).
564

Protein composition of the grain is very much affected by genotype
(MacRitchie et at, 1990). Bonfil (1994) checked the effect of nutrient levels in
the soil on the protein composition in grains of wild emmer and common wheat
cultivars. Identical wheat grains (from the same homozygous spike) were sown
in different soils from 10 natural habitats that had never been fertilized. The protein
composition was affected by the soil type and fertilization regime. The specific
effect of the natural soils on protein composition was enhanced after removing N
as a limiting factor by adding N fertilizer. Differences in protein composition were
found also between plants that grew in the same soil but under different nutrient
additions of: N, NPK, NPKS, or when no minerals were added. The quantitative
effects of most soil types and fertilization could be classified in 3 groups:
a. the relative quantity of the high molecular weight (HMW) glutenines
subunits. E.g. Plate 1, lanes 7 & 8.
b. changes in the relative amounts of proteins of molecular weight in the range
of 45-65 KD, e.g. Plate 1, lanes 1-3.
c. changes in the relative amount of different protein groups, especially the
group of HMW glutenins and co gliadins, e.g. Plate 1, lanes 1-3.
KD
-116t' : 97.4
- 66
45,!
-- 29
Lane No. 12 34 567Soid No. 1 461FenflizatonNNNNNNNN
Year 9292 9191 92929292
Plate I. Differences in gluten patterns of T dicoccoides from habitat 6 after
growing in soils from different habitats and under different fertilization schemes.
565
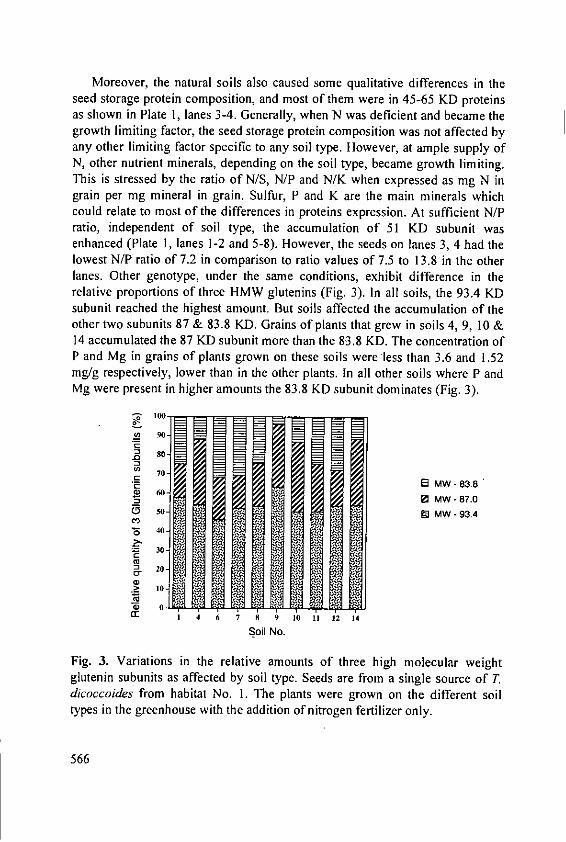
Moreover, the natural soils also caused some qualitative differences in theseed storage protein composition, and most of them were in 45-65 KD proteinsas shown in Plate I, lanes 3-4. Generally, when N was deficient and became thegrowth limiting factor, the seed storage protein composition was not affected byany other limiting factor specific to any soil type. However, at ample supply ofN, other nutrient minerals, depending on the soil type, became growth limiting.This is stressed by the ratio of N/S, N/P and N/K when expressed as mg N ingrain per mg mineral in grain. Sulfur, P and K are the main minerals whichcould relate to most of the differences in proteins expression. At sufficient N/Pratio, independent of soil type, the accumulation of 51 KD subunit wasenhanced (Plate 1, lanes 1-2 and 5-8). However, the seeds on lanes 3, 4 had thelowest N/P ratio of 7.2 in comparison to ratio values of 7.5 to 13.8 in the otherlanes. Other genotype, under the same conditions, exhibit difference in therelative proportions of three HMW glutenins (Fig. 3). In all soils, the 93.4 KDsubunit reached the highest amount. But soils affected the accumulation of theother two subunits 87 & 83.8 KD. Grains of plants that grew in soils 4, 9, 10 &14 accumulated the 87 KD subunit more than the 83.8 KD. The concentration ofP and Mg in grains of plants grown on these soils were less than 3.6 and 1.52mg/g respectively, lower than in the other plants. In all other soils where P andMg were present in higher amounts the 83.8 KD subunit dominates (Fig. 3).
% 100 - -.---
(0 90-e
80-
70-a MW-83.8
.2 - 0 MW -87.00D 50- U MW -93.4
o6 40 -
30
S 20-~j
I 4 6 7 8 9 10 II 12 14
Soil No.
Fig. 3. Variations in the relative amounts of three high molecular weightglutenin subunits as affected by soil type. Seeds are from a single source of Tdicoccoides from habitat No. 1. The plants were grown on the different soiltypes in the greenhouse with the addition of nitrogen fertilizer only.
566
Natural habitat is a unique combination of soil, rock and climatic conditions.Soils that developed on natural rocks contain different levels of availablenutrients. If nitrogen is amply supplied other minerals become growth limiting.
The deficiency of any nutrient influences the mineral composition of wheat
grain grown on these soils even when they were placed in a greenhouse under
the same climatic conditions. It was found that in most soil niches (Bonfil,1994), when a certain nutrient was limiting the yield, the specific wild wheatpopulation occuring naturally in that habitat had the ability to store in the seed
the highest concentration of this element even if it was grown later on any soilsnaturally low in this mineral. For example the soil of wheat population No. Ifrom Yahudia, a basalt soil in the Galilee, contained the lowest level ofexchangeable K (131 mg K/kg soil). The native wheat population thatdeveloped on that soil had the highest concentration of K in the seeds (5.4 mgK/g seed DM) in comparison with plants of the same population grown on other
soils in which K content ranged from 4.1-5.2 mg K/g.
This natural selection and genetic alteration mechanism that is triggered by adeficiency of a certain nutrient seems to control the adaptation of an endemicplant to its location. The ability to store enough K reserves in the seeds on a Kdeficient soil will enable that seed next year to survive longer in its early stagesof development without being affected by the low K supply from that soil.These findings suggest that the breeder's notion of efficiency does not reflect theway a plant in nature adapts to growth-limiting conditions were the survival ofthe genus is more important than the production efficiency.
DeMarco (1990) studied the early growth of wheat seedlings as affected byseed weight, seed phosphorus and seed nitrogen, and showed that these reservesare very important for rapid seedling establishment. The use of minimumconcentration of nutrients in the grain was suggested as a yardstick for cultivarssuitable for less developed countries to reduce the need for fertilizer (Feil et aL,1993). Using only this parameter for selection might prove very dangerousespecially when low levels of nutrients are available in the soil. Moreover, thegrain yield is the main target of the grower. As shown in Figs. I and 2, theresponse mode is more important than the initial mineral concentration in theseed. Therefore, selection based on seedling performance might lead to wrongselection and breeding. Hence, it was suggested by Vose (1987) that non-responding genetic sources should not be discarded as they might prove animportant source of genes for low soil fertility conditions.
567
Gene control on mineral uptake
The effect of each chromosome of wheat on the uptake of the main nutrientelements was reported by Bochev et al. (1987). They found that the control ofmineral uptake resides in most of the chromosomes but with different intensity.Furthermore, selective mineral uptake could be under genetic control, as wasshown in the case of K/Na uptake by different triticales (Gorham el al., 1990;Wyn Jones and Gorham, 1989). The variation in tolerance of wheat to highboron in the soil has been studied by Paull et al. (1993). They located thecontrol of boron uptake on several genes, one of which has been located onchromosome 4A. Such findings suggest that nutrient uptake properties of agenotype or a cultivar (selected over the years by natural or by the classicalmethods of plant breeding) is regulated by several genes located in severalplaces over all chromosomes.
Traditional breeding techniques enabled Graham et al. (1987) to transfer acopper efficiency factor located on the chromosome arm 5RL into commercialAustralian cultivars and this more than doubled yield on low copper soils.Breeding wheat for enhanced nutrient efficiency was examined with particularreference to work done in Australia. It was found that there is considerablegenetic variation for Cu, Zn and Mn efficiency and that these traits could becombined in a single genotype (Graham et al., 1987; Graham, 1987).
Genetic engineering prospects and failures
Using the recombinant DNA technology in recent years has createdtransgenic plants that have a specific advantage over the previous cultivarsincluding resistance to pathogens (Anderson et al., 1989; Boulter et al., 1990),resistance to herbicides (Comai et al., 1985) and resistance to diseases andinsects (Hilder et al., 1987) and other traits. But this breeding technique has notresulted in any major breakthrough as regards nutrient use efficiency.
The methods of genetic engineering employed so far are able to take aspecific portion of a gene or a cluster of genes and cleave them inside a specificsite in a chromosome (Glick and Pasternak, 1994). Introducing a plasmid unitfrom external sources that is known to operate as a desired trait in one plant,may not reach the same effect in the "inplant" since it may not work in harmonyand balance with other traits previously existing in the plant. Therefore, themany prospects and expectations from genetic engineering as a short cut toproducing more nutrient efficient plants are still far away.
The role of phosphate in the basic biochemistry of gene structure can alsoaffect other systems in the cell. In many organisms, phosphate starvation
568

induces multigene systems that act to increase the availability and uptake of
exogenous phosphates. Goldstein (1991) produced tissue-cultured tomato cellson solid media containing starvation levels of phosphate. While most cells died,isolated clumps of callus capable of near-normal rates of growth were
identified. Starvation-resistant cells were then used to start suspension cultures
that were kept under phosphate starvation conditions. A selected cell line
showed constitutively enhanced secretion of acid phosphatase and greatlyincreased rates of phosphate uptake. These pleiotropic effects suggest
modification of a regulatory apparatus that controls coordinated changes in theexpression of a multigene system. The somaclonal variant cell line grewnormally under phosphate-sufficient conditions, but did significantly better thanunselected cells under phosphate-limited conditions. This significantachievement in breeding efficient cells has still a long way to go before this trait
could be introduced into commercial cultivars with stable genetic material.In recent work, Sosnizky and Kafkafi (in preparation) have measured the
total fruit and canopy dry matter production of 4 tomato cultivars for industrialharvest (Table 3).
Table 3. Potassium usage efficiency' (KUF) and saturated dry matter SDM**production by 4 tomato cultivars.
Cultivar KUF total DM KUF fruit DM SDM total SDM fruitg DM/g K r2 DM/g K r2 g/plant g/plant
Peto 81 57.82 0.959 36.73 0.898 420 320Brigade 53.91 0.955 37.18 0.864 548 469C-70 38.25 0.884 26.66 0.849 309 2168687 58.85 0.999 30.25 0.990 270 195
Potassium usage efficiency in the linear range of plant response to K is
defined as: Dry matter (D/plantK yield (g/plant)
Saturated dry matter is the average DM production/plant when no responseto additional K application is observed.
Applying the biological slope ratio method (McCants and Black, 1957), the
range of K amount in the soil that was the growth limiting factor was identified.In that range of soil K concentrations, the K efficiency in producing dry matter
(DM) was the highest in cultivar 8687 (58.85 g DM/g K for the total aboveground DM), however, its maximum production when K was ample was only
270 and 195 g DM per plant of total and fruit respectively.
569

This is in comparison to less efficient K producers cultivar, Brigade, thatproduced 53.91 g DM/g K but transported more DM to the fruit 37.18 DM/g K.It is clear that total fruit yield is more important to the producer than the initial"K use efficiency". Therefore, obtaining K efficiency values in plants after onlya short growth period in controlled conditions may not yield the expected resultswhen grain or fruit yields are the targets for selection.
References
Anderson, E.J., Stark, D.M., Nelson, R.S., Turner, N.E. and Beachy, R.N.(1989): Transgenic plants that express the coat protein gene of TMV orAIMV interfere with disease development of non related viruses.Phytopathology 12: 1284-1290.
Barrow, N.J. (1975): The response to phosphate of two annual pasture species.II. The specific rate of uptake of phosphate, its distribution and use forgrowth. Aust. J. Agric. Res. 26: 145-156.
Beninati, N.F. and Busch, R.H. (1992): Grain protein inheritance and nitrogenuptake and redistribution in a spring wheat cross. Crop Sci. 32: 6, 1471-1475.
Bequette, R.K., Watson, C.A., Miller, B.S., Johnson, J.A. and Schrenk, W.G.(1963): Mineral composition of gluten, starch and water-soluble fractions ofwheat flour and its relationship to flour quality. Agron. J. 55: 537- 542.
Blair, G. (1993): Nutrient efficiency: what do we really mean? In: P.J. Randallet al. (Eds.), Genetic aspects of plant mineral nutrition, 205-213. KluwerAcademic Publishers.
Bochev, B., Neikova Bocheva, E., Mitreva, N. and Ganeva, G. (1987): Influenceof different Triticum aestivum L. genomes and chromosomes on theassimilation of the main nutrient elements. In: H.W. Gableman and B.C.Loughman (Eds.), Genetic aspects of plant mineral nutrition. pp. 343-351.Marinus Nijhoff Publishers, Dordrecht.
Bonfil, D.J. (1994): Gluten components of wild wheat Triticum turgidum var.dicoccoides as affected by the different soil types in the Galilee and theGolan. A Ph.D. Thesis, The Hebrew University of Jerusalem (Hebrew, Eng.Abs.)
Boulter, D., Gatehouse, J.A., Gatehouse, A.M.R. and Hilder, V.A. (1990):Genetic engineering of plants for insect resistance. Endeavour 14: 185-190.
Clark, J.M., Campbell, C.A., Cutforth, H.W., DePauw, R.M. and Winkleman,G.E. (1990): Nitrogen and phosphorus uptake, translocation, and utilizationefficiency of wheat in relation to environment and cultivar yield and proteinlevels. Can. J. Plant Sci. 70: 4, 965-977.
570

Comai, L.D., Facciotti, W.R., Hiatt, G., Thompson, G., Rose, R.E. and Stalker,D.M. (1985): Expression in plants of a mutant aroA gene from Salmonellatyphymurium confers tolerance to glyphosate. Nature 317: 741-744.
DeMarco, D.G. (1990): Early growth of wheat seedlings as affected by seedweight, seed phosphorus and seed nitrogen. Aust. J. Exp. Agric. 30: 545-547.
Feil, B., Thiraporn, R. and Stamp, P. (1993): Can maize cultivars with lowmineral nutrient concentrations in the grain help to reduce the need forfertilizers in third world countries? In: P.J. Randwall et al (Eds.) Geneticaspects of plant mineral nutrition, 295-299. Kluwer Academic Publishers.
Gerloff, G.C. (1976): Plant efficiencies in the use of nitrogen, phosphorus andpotassium. In: Plant Adaptation to Mineral Stress in Problem Soils. Ed. M.J.Wright. Cornell Agric. Exp. Stn. Ithaca NY.
Glick, B.R. and Pasternak, J.J. (1994): Molecular biotechnology: principles andapplications of recombinant DNA. Am. Soc. for Microbiology, Washington,DC, USA.
Goldstein, A.H. (1991): Plant cells selected for resistance to phosphatestarvation show enhanced P use efficiency. Theor. and App. Genet. 82: 2,191-194.
Graham, R.D., Ascher, J.S., Ellis, P.A.F. and Shepherd, K.W. (1987): Transferto wheat of the copper efficiency factor carried on rye chromosome arm5RL. In: H.W. Gabelman and B.C. Loughman (Eds.), Genetic aspects ofplant mineral nutrition. pp. 405-412. Marinus Nijhoff Pub. Dordrecht.
Graham, R.D. (1988): Development of wheats with enhanced nutrientefficiency: progress and potential. Wheat production constraints in tropicalenvironments. Proceedings of the international conference, Chiang Mai,Thailand, 19-23 January 1987 (edited by Klatt, A.R.), 505, 320, 395, 408.Mexico DF, Mexico, CIMMYT.
Gorham, J., Wyn Jones, R.G. and Bristol, A. (1990): Partial characterization ofthe trait for enhanced K+/Na+ discrimination in the D genome of wheat.Planta 180: 590-597.
Grama, A., Porter, N.G. and Wright, D.S.C. (1987): Hexaploid wild emmerwheat derivatives grown under New Zealand conditions. 2. Effect of foliarurea sprays on plant and grain nitrogen and baking quality. New Zealand J.Agric. Res. 30:45-51.
Halevy, J., Kagan, I., Kafkafi, U. and Ephrat, J. (1976): Nitrogen, phosphorus andpotassium fertilization in wheat. Hassadeh 57 (2): 209-216 (Hebrew, Eng.Abs.).
Hilder, V.A., Gatehouse, A.M.R., Sheerman, S.E., Barker, R.F. and Boulter, D.(1987): A novel mechanism of insect resistance engineered into tobacco.Nature 330: 160 -163.
571
Isfan, D., Cserni, 1. and Tabi, M. (1991): Genetic variation of the physiologicalefficiency index of nitrogen in triticale. J. Plant Nutr. 14: 12, 1381-1390.
Jones, G.P., Blair, G.J. and Jessop, R.S. (1989): Phosphorus efficiency in wheat-a useful selection criterion? Field Crops Res. 21: 257-264.
Lipsett, J. (1964): The phosphorus content and yield of grain of different wheatcultivars in relation to phosphorus deficiency. Aust. J. Agric. Res. 15: I-8.
Mackay, A.D., Caradus, J.R., Hart, A.L., Wewala, G.S., Dunlop, J., Lambert,M.G., Bosch, J. and van den Mouat, M.C.H. (1990): Phosphorus uptakecharacteristics of a world collection of white clover (Trifolium repens)cultivars. Plant nutrition physiology and applications. Proceedings of theEleventh International Plant Nutrition Colloquium, Wageningen,Netherlands, 30 July-4 August 1989 (edited by Beusichem, M.L. van). 655-658. Developments in Plant and Soil Sciences, Vol. 41. Dordrecht,Netherlands. Kluwer Academic Publishers.
May, L., Sanford, D.A., van MacKown, C.T., Cornelius, P.L. and Van Sanford,D.A. (1991): Genetic variation for nitrogen use in soft red X hard red winterwheat populations. Crop Science 31: 3,626- 630.
McCants, C.B. and Black, C.A. (1957): A biological slope-ratio method forevaluating nutrient availability in soils. Soil Sci. Soc. Amer. Proc. 21: 296-301.
MacRitchie F., du Cros, D.L. and Wrigley, C.W. (1990): Flour polypeptidesrelated to wheat quality. Adv. Cereal Sci. Technol. 10: 79-145.
Paull, J.G., Nable, R.O. and Rathjen, A.J. (1993): Physiological and geneticcontrol of the tolerance of wheat to high concentrations of boron andimplications for plant breeding. In: P.J. Randall et al. (Eds.) Genetic aspectsof plant mineral nutrition. pp. 367-376. Marinus Nijhoff Publishers,Dordrecht.
Peltonen, J. (1993): Grain yield of high and low protein wheat cultivars asinfluenced by timing of nitrogen application during generative development.Field crops research 33(4): 385-397.
Shinde, D.A., Solankey, B.S. and Singh, S.K. (1992): Ontogenetic effect onpotassium content in sorghum plant and its uptake pattern at three growthstages. Journal of Potassium Research 8: 1, 59-64.
Teyker, R.H., Moll, R.H. and Jackson, W.A. (1989): Divergent selection amongmaize seedlings for nitrate uptake. Crop Science 29: 879-884.
Vose, P.B. (1987): Genetical aspects of mineral nutrition progress to date. In:H.W. Gableman and B.C. Loughman (Eds.), Genetic aspects of plantmineral nutrition. pp. 3-13. Marinus Nijhoff Publishers, Dordrecht.
572

Williams, R.F. (1948): The effect of phosphorus supply on the rates of intake ofP and N and upon certain aspects of P metabolism in gramineous plants.Aust. J. Biol. Res. I: 333-336.
Woodend, J.J. and Glass, A.D.M. (1993): Inheritance of potassium uptake andutilization in wheat (T. aestivum L.) grown under potassium stress. Journalof Genetics and Breeding, 47: 2, 95-102.
Wray, J.L. (1989): Towards the molecular characterisation of nitrate uptake inhigher plants. Aspects of Applied Biol. 22: 357-364.
Wyn Jones, R.G. and Gorham, J. (1989): Comparative cation uptake by plantcells, tissues and intact plants. In: Methods of K-Research in Plants. 21stColloquium of the International Potash Institute. Belgium. pp. 7-16.
Youngquist, J.B., Bramel Cox, P.J. and Maranville, J.W. (1992): Evaluation ofalternative screening criteria for selecting nitrogen use efficient genotypes insorghum. Crop Science 32: 6, 1310-1313.
Youngquist, J.B. and Maranville, J. (1988): Relative contributions of componenttraits for N use efficiency to genotypic variation in sorghum. SorghumNewsletter 31 : 7.
573
Dr. A.E. Johnston, Rothamsted ExperimentalStation, Harpenden, UK; member of theScientific Board of the International PotashInstitute
Summary of the Sessions
575
Summary of the Sessions
A.E. JohnstonLawes Trust Senior Fellow, IACR Rothamsted, Harpenden, Herts, AL5 2JQ,Great Britain
This summary of the 24th Colloquium of the International Potash Instituteseeks only to highlight a few of the many important topics presented in theexcellent papers given in full in the preceding pages and the unpublishedsummaries prepared by the chairmen of the individual sessions. The organiserschoose to encompass a large geographic area with a wide range of croppingsystems. Their concern was that, in general, within this region the use of too littlepotassium is a major constraint to plant growth and this threatens present foodproduction. More importantly, if nutrients, like phosphorus and potassium,continue to be removed, or mined, and are not replaced by appropriate inputs thenthe food supplies for an increasing population will be seriously compromised. In1990, the region had 52% of the world's population but they were dependent ononly 26% of the world's arable crop land. Maintaining the fertility of these soilsis of paramount importance because there is little additional land to bring intosustainable cultivation. It is generally accepted that much of the expected increasein world population in the next decades is likely to occur in this and similarregions and most of the extra people will have to be fed from local resources.
Of great importance is the fact that many of the soils of the region arestrongly weathered and highly leached and, in consequence, have naturally lowlevels of exchangeable and non-exchangeable K. In addition, the small cationexchange capacity (CEC) increases the risk that little, if any, added K will beretained within the soil to the benefit of future crops. This lack of CEC in soilminerals highlights the importance of additional CEC in soil organic matter andthe importance of doing everything possible to retain soil organic matter wasmentioned frequently. However, whilst it was recognised that retaining soil orga-nic matter in arable cropping systems in humid, tropical soils is not easy, there isan ongoing need to keep emphasising the importance of soil organic matter.
The inability of many soils to retain K and the large amount of rainfall, oftenwith high intensity leads to large losses of K by leaching. Although rainfall isthe causative factor, it is important to make a distinction between losses insurface runoff and those in drainage water leaching down the soil profile. Theformer may be minimised by timing the application, perhaps by giving morethan one application of fertilizer K. The second pathway of loss may be moreimportant in relation to the loss of K residues remaining following fertilizer
577

application. Such losses may be lessened by adjusting the amount of K appliedto meet the needs of the crop. The other main pathway of K loss is by soilerosion and many contributions to the colloquium mentioned that one of thebenefits of mulching was that it helped minimise losses of soil by erosion.
Minimising K losses by any of these three routes is only one part ofmanaging the nutrient requirements of crops to increase the efficiency withwhich nutrients are used. This can be achieved by identifying best managementpractices in relation to the selection of appropriate cropping systems, soil tillageand conservation, management of crop residues and irrigation. Appropriatecropping systems. may be annual cropping, a combination of annual andperennial crops and perennial plantation crops. All these systems have differentnutrient requirements, some of which are, as yet, poorly defined: It is, however,a matter of concern that many of the papers mentioned the large differencesbetween the yields of crops achieved in experiments and those found incommercial practice. The answer to this may, in part, depend on improvingmanagement skill at the farmer level. Looking more to the future, there is a needto anticipate future developements. For example, the present nutrient manage-ment practices for irrigated lowland rice are well known and can achieveconsistent yields but to feed an increasing population may well require yields of8 t/ha. This will require cultivars with a high yield potential, improved agronomicpractices and an increase in nutrient inputs. Thus, there is a need for ongoingexperiments to monitor such changes and their effects on yield.
Another common thread, discussed in many papers, was the considerableimbalance between the quantities of nutrients applied to crops and the amountsremoved in the harvested produce. For phosphorus and potassium, this can be areflection of many factors including a lack of knowledge and lack of finance onthe part of farmers and the scarcity of commercially exploitable reserves ofphosphate and potassium in the region. China can produce about 20% of theworld total of phosphate rock but the other countries of the region only 2%. OnlyChina can produce a little potash, about 0.4% of world production, althoughThailand may have reserves capable of commercial exploitation. In 1993, theregion imported about 3.6 million tonnes K2 0 or about 24% of the world totalof traded potash. This quantity of potassium is far too little to produce, in asustainable way, the 43% and 82% of the world's cereals and rice production,respectively, currently produced in the region.
One very important reason for collecting data on the ratios of nutrients inharvested produce is to compare them with the ratios of N:P:K in purchasedfertilizers. This is an essential first step in assessing likely needs for futureimports and identifying where research and advisory effort needs to be targetedso that nutrient imbalances in crops can be corrected.
578

Future research should aim to establish practices which will maintain soilfertility. This includes determining optimum levels of "plant available"phosphorus and potassium, soil organic matter and pH in soil. These optimumlevels can be defined as the level of each factor below which there is a seriousrisk of loss of yield and above which yield increases are so small that farmerswould not be justified financially in attempting to maintain their soils at highervalues. When soils are at their optimum phosphorus and potassium levels,fertilizer practices can often be simplified tojust replacing the amount of nutrientsremoved in the harvested produce. Nutrient management practices designed tosatisfy these criteria will also need to ensure optimum use of available nutrientsoccurring naturally in soils, the maximum recycling of nutrients in organicwastes and the most efficient use of purchased fertilizers.
From all the themes developed at the Colloquium came the need to identitystrategies on how to proceed. These included the need for good research at therelevant scale. To this end, the role of appropriate international organisations inadvising on and coordinating research to avoid costly overlap was recognised.Having done the research, the results need to be carefully interpreted beforebeing made available to farmers and used to make policy decisions.
Those farmers who can afford to put into practice research findings whichobviously increase the profitability of their enterprises are often willing to do so.So far, research findings which have been readily accepted have been relativelysimple, like the benefits of using extra nitrogen. Further progress will be moredifficult especially if the benefits are not immediately obvious. This includes theneed to maintain the phosphorus and potassium status of soils. For this farmer,training will be needed and once the appropriate skills are acquired, the farmerwill need to invest a larger proportion of his time in management. The greatestneed will be to help poor farmers who often have a great fear of the unknown.Lack of education, skill and financial resource are major barriers to theacceptance of new techniques and all three of these factors need to be addressedat the same time.
It was readily recognised at the Colloquium that, compared to enlighteningfarmers, there are many more problems persuading policy makers and politiciansto accept the concerns arising from research. This is especially so when researchshows that the fertility of a nation's soils is not being maintained. There seemsto be an unwillingness by policy makers to put in place policies that, at least,will encourage the maintenance of the fertility of their nation's soils let aloneincrease it to the benefit of future generations. This lack of awareness of futureproblems is frequently found in nations where the national economy depends onagricultural exports and declining yields will have serious adverse effects. TheColloquium did not have the expertise to decide whether subsidies, price
579

incentives or other policies would be most appropriate. It did recognise, however,that politicians respond only to political arguments which researchers have littleskill in developing. It was, therefore, good to hear that the International FertilizerManufacturers Association was to appoint a specialist in public relations.
The important messages from the Colloquium were that it was essential tocontinue to do good research at the appropriate scale. That this research shouldseek to improve the efficiency with which nutrients are used, especially ensuringoptimum recycling and minimal losses. That is essential to emphasise the verylimited use of potassium in many farming systems practised in the region andthat this will eventually lead to a serious risk of declining yields. Thatresearchers need to link up with appropriate professional advisors to get theresults of their research on the one hand to the farmer and on the other to thepolicy maker.
580

Introduction to the Field Visits
581
Sustainable Land Use Systems in Northern ThailandPhrek Gipmantasiri
Faculty of Agriculture, Chiang Mai University, Chiang Mai, Thailand
The devising of agricultural systems which, by the year 2000 and beyond,will be sustainable and practicable under the constraints of population increase,degradation of natural resources and increased competition in international tradeposes problems for agricultural scientists working in concert with ruralsociologists, anthropologists, planners and development workers.
The Multiple Cropping Center was established in the Chiang Mai Valley inthe early seventies. The original aim was to devise better land use and watermanagement for rice-based systems in the irrigated lowlands in the search forhigher farm income and improved standard of living for the farmers. Theprogramme has been expanded to include the rain-fed uplands and highlandecosystems.
Research is prosecuted both on the MCC experiment station, which providesfacilities for staff and students of the University, and on farmers' fields andembraces lowland and upland rice, winter cereals, maize, grain and foragelegumes, vegetables and selected tree species.
Vegetable-based home garden systems: Production of pesticide freevegetables.
Increasing urbanization in the Chiang Mai Valley has reduced theavailability of farmland and caused a shortage of farm labour; labour cost hasrisen from 80 to 100 Baht/day.
Vegetable growing is an attractive proposition for small farmers with only0.16 to 0.32 ha and two working family members. There is a good demand forhigh quality, pesticide free produce from the middle and high income groups inthe city. Year-round vegetable growing without pesticides demands thefollowing conditions:- At least 0.16 ha,- Daily output worth a minimum of 200 Baht/day with a labour input of 2 man
days,- Minimum use of external inputs making maximum use of on-farm resources,- Sufficient food and cash income must be generated to provide a reasonable
standard of living.
583
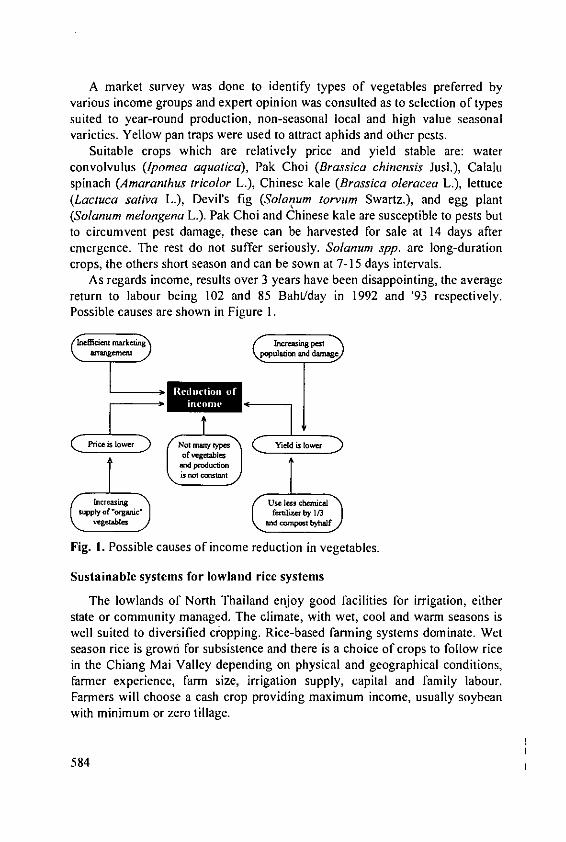
A market survey was done to identify types of vegetables preferred byvarious income groups and expert opinion was consulted as to selection of typessuited to year-round production, non-seasonal local and high value seasonalvarieties. Yellow pan traps were used to attract aphids and other pests.
Suitable crops which are relatively price and yield stable are: waterconvolvulus (Ipomea aquatica), Pak Choi (Brassica chinensis Jusl.), Calaluspinach (Amaranthus tricolor L.), Chinese kale (Brassica oleracea L.), lettuce(Lacluca sativa L.), Devil's fig (Solanum torvum Swartz.), and egg plant(Solanum melongena L.). Pak Choi and Chinese kale are susceptible to pests butto circumvent pest damage, these can be harvested for sale at 14 days afteremergence. The rest do not suffer seriously. Solarium spp. are long-durationcrops, the others short season and can be sown at 7-15 days intervals.
As regards income, results over 3 years have been disappointing, the averagereturn to labour being 102 and 85 Baht/day in 1992 and '93 respectively.Possible causes are shown in Figure I.
Inefftico maretin macing pat
Pric i, ower Not any ypesYield islowerofve'getable,
Fig. 1. Possible causes of income reduction in vegetables.
Sustainable systems for lowland rice systems
The lowlands of North Thailand enjoy good facilities for irrigation, eitherstate or community managed. The climate, with wet, cool and warm seasons iswell suited to diversified cropping. Rice-based farming systems dominate. Wetseason rice is grown for subsistence and there is a choice of crops to follow ricein the Chiang Mai Valley depending on physical and geographical conditions,farmer experience, farm size, irrigation supply, capital and family labour.Farmers will choose a cash crop providing maximum income, usually soybeanwith minimum or zero tillage.
584
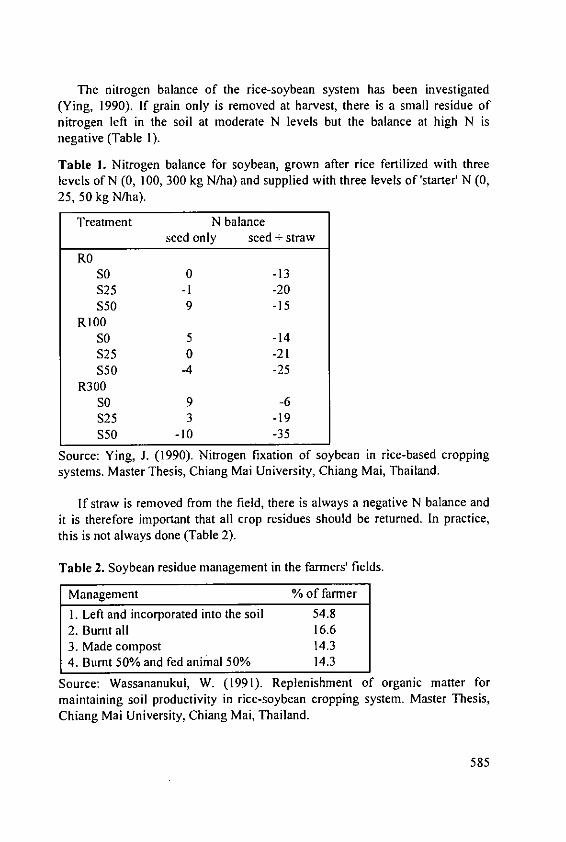
The nitrogen balance of the rice-soybean system has been investigated(Ying, 1990). If grain only is removed at harvest, there is a small residue ofnitrogen left in the soil at moderate N levels but the balance at high N isnegative (Table 1).
Table I. Nitrogen balance for soybean, grown after rice fertilized with threelevels of N (0, 100, 300 kg N/ha) and supplied with three levels of 'starter' N (0,25, 50 kg N/ha).
Treatment N balanceseed only seed + straw
ROSO 0 -13S25 -1 -20S50 9 -15
RI00So 5 -14S25 0 -21S50 -4 -25
R300SO 9 -6S25 3 -19S50 -10 -35
Source: Ying, J. (1990). Nitrogen fixation of soybean in rice-based croppingsystems. Master Thesis, Chiang Mai University, Chiang Mai, Thailand.
If straw is removed from the field, there is always a negative N balance andit is therefore important that all crop residues should be returned. In practice,this is not always done (Table 2).
Table 2. Soybean residue management in the farmers' fields.
Management % of farmer
1. Left and incorporated into the soil 54.82. Burnt all 16.63. Made compost 14.34. Burnt 50% and fed animal 50% 14.3
Source: Wassananukul, W. (1991). Replenishment of organic matter formaintaining soil productivity in rice-soybean cropping system. Master Thesis,Chiang Mai University, Chiang Mai, Thailand.
585

Experiments since 1990 have investigated alternative means of supplyingnitrogen for the rice crop (Wassananukul, 1991) with the results shown in Table3. Growing Sesbania rostrata as a green manure was slightly more effective inraising rice yield than applying 50 kg ha-t N as urea. Inclusion of a greenmanure crop in the rotation is to be advocated and this now forms part of villageprogrammes in Chom Tong District. Sesbania can be sown in mid-May duringthe early rains and ploughed in about 50 days later.
Table 3. Grain yield (kg/ha) of two rice cultivars under different sources ofnitrogen.
Source of N 1991I) 1993 1994RD7 KDML105 RD7 KDMLI05 RD7 KDMLI05 Mean
NoN-fertilizer 4166 4170 4063 3800 3744 3369 3885Urea at 50 kg 4598 4529 4575 4300 3975 4150 4355N/haSoybean resi- 3986 4257 4419 4231 3650 4112 4109dues at 1.25 t/haSoybean resi- 4177 4473 4500 4369 3969 4306 4299dues at 1.25 t/ha+ urea at 35 kgN/haSesbania 4598 4784 4794 5188 4800 4806 4828rostrataMean 4305 4443 4470 4378 4028 4149
I) Wassananukul (1991).
586
Management of Sloping Lands for SustainableAgriculture in Asia: A Network Approach
A. Sajjapongsel, E. Zainol and S. BooncheeNetwork Coordinator, IBSRAM, P.O. Box 9-109, Bangkhen, Bangkok, Thailand
Due to population growth, urbanization and industrialization, the amount ofland available for agriculture in Asia has decreased. In order to ensure that anadequate amount of food is produced, land which was once considered to beunsuitable for agriculture, because of the risk of erosion or other hazards, is nowbeing cleared and used for cultivation.
The erosion hazard applies particularly to sloping lands, which arewidespread and occupy a large area in Asia. Out of the total land area, 35% inThailand, 63% in the Philippines, and 75% in Vietnam is classified as hilly andmountainous land. Farming on this type of land, farmers generally plant theircrops up-and-down the slope, and cultivate the soil with minimal concern forsoil erosion. This causes siltation of valleys and dams, and is increasinglythreatening the environment of the area.
It is therefore imperative that efforts should be made to identify appropriatetechnology for managing sloping lands so that the deterioration and erosion ofthese lands can be brought under control, and the threat to the immediatesurrounding areas can be avoided. For this purpose, the International Board forSoil Research and Management (IBSRAM) has organized a network calledASIALAND Management of Sloping Lands.
The network was funded for three years (1988-1991) with five countriesparticipating in the first instance - Indonesia, Malaysia, Nepal, Philippines, andThailand. In January 1990, Vietnam became the sixth member of the network,with financial support from the Swiss Development Cooperation (SDC); inDecember 1990, China became the seventh member, with financial supportfrom the International Development Research Center (IDRC), and Laos inFebruary 1994, with support from SDC. Phase I was completed in 1991 andPhase 2 commenced in 1991 and ended in 1994. Currently, the network is in itsPhase 3 (1991-1997), which involves a major activity in on-farm research and isfunded by SDC.
587
Objectives of the network
The overall objective of the network is to help in conserving soil, resourceson sloping land in the region through research and promotion of the applicationof appropriate land-development and land-management technologies to achievea sustainable form of agriculture. Following are specific objectives of thedifferent phases of the network:
Phase 1 (1988-1991)
- to assist national agricultural institutions in testing and/or validatingimproved soil-management technologies;
- to evaluate and select cost-effective, farmer-acceptable options foragricultural production on sloping lands;
- to strengthen national agricultural institutions by network and informationactivities; and,
- to facilitate the exchange of research information on soil managementamong agricultural scientists in the region through meetings, workshops, andpublications.
Phase 2 (1991-1994)
In addition to the above Phase 1:- to monitor the effectiveness of the various improved technologies from
Phase I for a longer term, and to validate some of these on new networksites on a larger scale; and,
- to conduct a baseline surveys for the purpose of future evaluation on theadoption of the improved technologies by farmers.
Phase 3 (1994-1997)
The overall objective of Phase 3 is to assess the acceptability by farmers andthe sustainability of conservation-farming methods on sloping lands in Asia at afarm scale in different resource-management domains. This has required newapproaches and the specific objectives are:- to assess, at the farm scale, the agronomic and economic viability, and the
environmental acceptability of conservation-farming technologies throughon-farm research;
- to obtain a better understanding of the reasons for adoption, non-adoption,and modification of conservation-farming technologies through acomprehensive farming-systems' evaluation of the on-farm activities;
- to assess the sustainability of conservation-farming systems using the datafrom the longer-term experiments, established in Phase 1;
588
- to obtain a better basis for the transfer of technology of conservationfarming through the integration of the results obtained and to prepare forsubsequent larger-scale extension activities by establishing a trainingnetwork of extension personnel who are well versed in the technologies andapplication of conservation farming; and,
- to increase the awareness of decision and policy makers of the effects ofland degradation and the need for conservation-farming technologies.
Implementing agencies
Presently, the following national agricultural research centers are assistingIBSRAM in implementing the project in their countries:- The Guizhou Academy of Agricultural Science, China;- The Center for Soil and Agroclimate Research (CSAR) of the Agency for
Agricultural Research and Development (AARD), Indonesia;- The Soil Survey and Land Classification Center, Lao PDR;- The Rubber Research Institute (RRIM), Malaysia;- The Philippines Council for Agriculture, Forestry and National Resources
Research and Development (PCARRD), Philippines;- The Department of Land Development (DLD), Thailand; and,. The Institute for Soil and Fertilizers (ISF), Vietnam.
Technologies tested
Different soil management technologies were evaluated in the variousparticipating countries. The technologies are:- alley cropping, which consists of cultivating crops along contours in alleys 4
to 5 m wide and separated by a shrub or legume hedgerow;- grass strips, which are I m wide and are established every 4 to 6 m along the
contours of the slope;- hillside ditches, which are built along the contours and across the slope and
help to slow down and contain runoff water, allowing more of the water toinfiltrate into the soil; and,
- agroforestry, which implies the association of fruit trees or perennial cropsand field crops.
Main outcomes
Soil conservation measures and soil loss
One of the factors that influences crop yield and the sustainability ofagricultural system is soil fertility. Since most of the plant nutrients are containedin the 0-15 cm soil depth, loss of this surface soil by erosion, particularly forsloping lands, is detrimental to crop production. Any soil conservation measure
589

that can reduce or attenuate the erosion will certainly preserve soil fertilityleading to sustainable agriculture.
The effects of different technologies on soil loss at the various sites of thenetwork are presented in Table 1. The effects in 1993 were similar to the threeprevious years (1990, 1991, and 1992). At all site, soil loss under the farmers'practice was significantly higher than those under the improved practices. Theeffectiveness of the hedgerows in reducing soil loss was obvious in all years.The reduction in soil loss as affected by the alley cropping ranged from 33 to99% in 1990, from 60 to 99% in 1991, from 50 to 100% in 1992, and from 73to 100% in 1993.
Table I. Effect of soil conservation practices on soil loss.
Site Slope Treatment Soil loss (t ha-')(%) 1990 1991 1992 1993
China 30-46 Farmers' practice - 57.8 84.0 95.4Alley cropping - 40.6 14.9 21.9
Indonesia 8-18 Farmers' practice 27.0 88.0 50.0 366.7(XIX) Alley cropping 12.0 11.0 8.0 50.7
Philippines 15-25 Farmers' practice 97.0 18.4 56.1 59.3(Mabini) Alley cropping + low input 2.0 0.2 NDZ 0.01
Alley cropping + high input 1.0 0.1 NDZ 0.01Banana hedgerow+high input 2.0 0.1 NDZ 0.01
Thailand 20-50 Farmers' practice 68.7 224.3 146.5 57.1(Chiang Alley cropping 13.8 89.1 41.7 5.3Rai) Bahia grass strip 17.2 64.6 7.1 3.1
Hillside ditch 10.0 15.9 3.5 1.8
Vietnam 5- 7 Farmers' practice 3.3 2.2 1.0 1.5(Bavi) Alley cropping (low input) 2.2 0.6 0.5 0.4
Alley cropping (high input) 2.2 0.6 0.5 0.4
NDZ = not detectible.
It was observed that rill erosion was very serious on the plot which had nosoil conservation measure (the farmers' practice). Under the farmers' practice,most of the surface soil on the upslope was eroded and deposited at thedownslope. It was also observed that, due to the filtration out and accumulationof runoff sediment by the hedgerow crops, terraces were formed along thehedgerows of the alley cropping technique.
590

Soil loss is also influenced indirectly by fertilizer application. This isbecause the fertilizer enhances plant growth and increases crop canopy givingbetter ground coverage and protection. This is clearly shown by the resultsobtained from the experiment in Indonesia and Thailand (Table 2). Soil loss washighest under the no input treatment in all years. The loss was reduced whenfertilizer was applied. In Indonesia, the reduction ranged from 45 to 71% underthe low input level and from 54 to 79% under the high input level. Similarly, inThailand, the reduction ranged from 45 to about 70%.
Table 2. Soil loss as affected by input level in Indonesia and Thailand.
Site Input level Soil loss (t ha-1)1990 1991 1992 1993
Indonesia No 49.0 92.5 92.8 247.0(Unit XIX) Low 14.0 41.0 41.4 136.3
High 10.0 27.0 31.5 113.9
Thailand Low 51.8 165.7 96.0 41.7(Chiang Rai) High 23.0 61.6 31.2 12.3
Soil loss carries with it the loss of plant nutrients. In 1993, the plant nutrientfrom soil and water loss in China was about 1247 kg ha-1 in term of acombination of N, P, and K, under the farmers' practice (Table 3). This loss wassignificantly reduced by more than 77% when alley cropping was practiced.
Table 3. Nutrient losses under the different treatments at the old site (IBSRAM,1994).
Alley cropping Bareplot Farmers' Agroforestrypractice
Nutrient losses N 2.06 31.37 8.09 14.10from runoff P20 5 1.06 11.01 4.12 5.45(kg ha-') K20 10.78 113.91 56.05 141.67Total 13.90 156.29 68.26 161.22Nutrient losses N 41.77 121.25 155.59 181.11from soil erosion P20 5 23.18 51.31 98.32 58.19(kg ha-') K2 0 205.31 556.62 924.93 640.08Total 270.76 729.19 1178.84 879.38
Total nutrient losses(kg ha-1) 284.66 885.48 1247.10 1040.60Comparison (%) 22.83 71.00 100.00 83.44
591
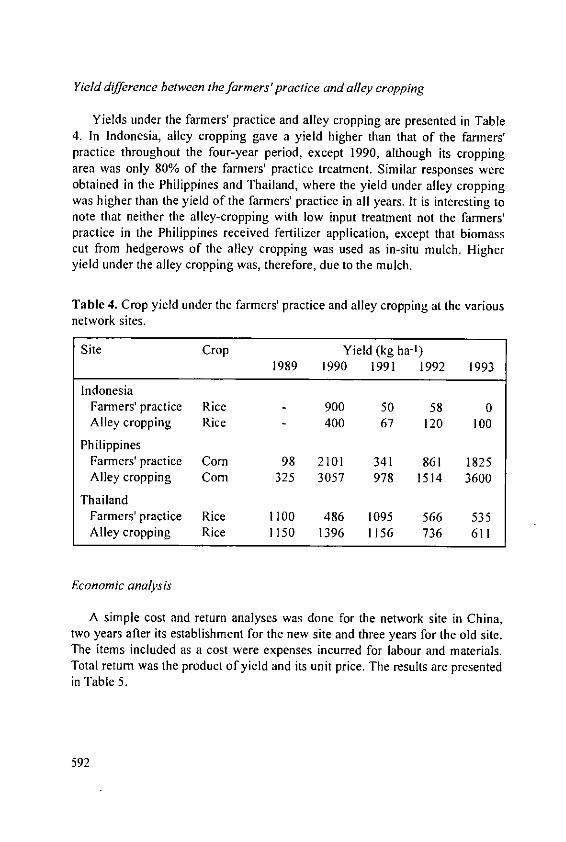
Yield difference between the farmers'practice and alley cropping
Yields under the farmers' practice and alley cropping are presented in Table4. In Indonesia, alley cropping gave a yield higher than that of the farmers'practice throughout the four-year period, except 1990, although its croppingarea was only 80% of the farmers' practice treatment. Similar responses wereobtained in the Philippines and Thailand, where the yield under alley croppingwas higher than the yield of the farmers' practice in all years. It is interesting tonote that neither the alley-cropping with low input treatment not the farmers'practice in the Philippines received fertilizer application, except that biomasscut from hedgerows of the alley cropping was used as in-situ mulch. Higheryield under the alley cropping was, therefore, due to the mulch.
Table 4. Crop yield under the farmers' practice and alley cropping at the variousnetwork sites.
Site Crop Yield (kg ha-')1989 1990 1991 1992 1993
IndonesiaFarmers' practice Rice - 900 50 58 0Alley cropping Rice - 400 67 120 100
PhilippinesFarmers' practice Corn 98 2101 341 861 1825Alley cropping Corn 325 3057 978 1514 3600
ThailandFarmers' practice Rice 1100 486 1095 566 535Alley cropping Rice 1150 1396 1156 736 611
Economic analysis
A simple cost and return analyses was done for the network site in China,two years after its establishment for the new site and three years for the old site.The items included as a cost were expenses incurred for labour and materials.Total return was the product of yield and its unit price. The results are presentedin Table 5.
592

Table 5. Input, output, and net return under different soil conservation practicesin China in 1993 (USS ha-1).
Items New site Old siteHillside Farmers' Alley Alley Farmers' Agro-ditches practice cropping cropping practice forestry
Input 215.5 237.8 222.5 215.8 237.8 53.9Output 189.0 286.3 266.2 547.3 475,9 138.4Net return -26.5 48.5 43.7 331.5 238.1 84.5
The results show that the benefit from the alley cropping treatment washighest at the old site. The output:input ratio of the alley cropping was 1.2:1 and2.5:1 respectively at the new site and the old site. The agroforestry treatmentgave a negative return in the first year (1991), but in the second year it gave thehighest profit of all the treatments. This year (1993), the return under theagroforestry treatment was the lowest, because there was no additional incomefrom corn. The negative return with the hillside ditches was due to the highestcost of input and the low yield of corn.
593

Posters
595

1. Nutrient Status and Diagnosis
Nutritional Problems of Upland Acid Soils in AsiaMyers, R.J.K.1 and Sumalee, S.2
I IBSRAM, P.O. Box 9-109, Bangkhen, Bangkok 10900, Thailand; and2 Naresuan University, Phitsanuloke, Thailand
Introduction
Within southeast Asia, more than half of the land area consists of acid soils,mostly Oxisols and Ultisols. There are increasing pressures to develop theselands for food production. However, there are serious problems in developingsustainable food production systems on acid soils. The nutritional problemsinclude: toxicities of A] and Mn, and deficiencies of Ca, Mg, Mo, N, P, K and S.Solving these problems is technically straightforward, but difficult for cash-poorsmallholder farmers. In this paper, we use experiences in the ASIALANDManagement of Acid Soils network to examine this problem.
Solving the nutritional problems
Identification or diagnosis
Visual symptoms: By the time visual symptoms are observed, yield has alreadydeclined. Correct identification requires skills and experience, and can be mademore difficult where disease or pest damage produces similar symptoms. In thenetwork, symptoms of P deficiency have been commonly observed, and lessfrequently Mg deficiency and Mn toxicity have been seen. There is one instanceof Mn deficiency symptoms observed on an area that had been over-limed.Farmers could learn some of the deficiency symptoms through extensionprogrammes.
Tissue testing: Analysis of index leaves can confirm visual observations oridentify problems without visual symptoms, but it is dependent on accurateanalysis, correct sampling and adequately determined critical concentrations.Many laboratories do not achieve standards that would permit tissue tests to bemeaningful. In the network, index leaf analysis has identified probabledeficiencies of N, P, Ca, Mg and Cu. This is not a facility that is available to theaverage smallholder farmer, but can be used by researchers to categorise regionsor soil types.
597
Soil testing: Soil testing has never achieved its full potential, even in thedeveloped world. It is never likely to be available to the smallholder farmer, buteventually could be used to categorise regions, localities or soil types for severalnutrients. It is not used for diagnostic purposes in the network.Pot trials: Nutrient omission pot trials can be used to identify possiblenutritional constraints. In the network, they are prescribed to characterise thesoil prior to experiments being established. These trials indicated deficiencies ofN, P and Cu, and also indicated the need for liming.Field trials: None of the above tests provide guaranteed diagnoses. Positive testsmust be confirmed in the field. In this way, the need for lime, N, P and K havebeen confirmed.
Treatments
Growing tolerant plants: Plants tolerant of the complex of constraints that limitgrowth in acid soils can be grown successfully. These include cassava,pineapple, rubber, oil palm and sugarcane. The immediate problem is that theirsuccess leads to over-production and low market prices. The longer termproblem is that continued acidification might eventually reduce the productionof tolerant crops.Mineral fertilizers: Smallholder farmers will use mineral fertilizers if they canafford them, can obtain them and see their use as profitable. Experience in thenetwork ranges from the Vietnamese situation, where correction of widespreadK deficiency is limited to the use of ash because of lack of imported potash, tothe Philippines situation where the bank loan requirements appear to be anuneconomic, excessive application of fertilizer.
Organic inputs: Use of organic materials by smallholder farmers depends onsupply. In the network, higher quality materials, such as farmyard manure andpalm oil mill effluent are effective suppliers of some nutrients, whereas lowerquality materials, such as rubber tree foliage and composted grass confer littleor no benefit. Even higher quality materials may not contain all nutrients inbalance.
Constraints to solving nutritional problems
Technically, there is no great difficulty to solving nutritional problems inacid soils. The major constraints are:- Problems of diagnosis: insufficiently accurate laboratory analysis, cost of
laboratory analysis, shortage of skills with visual diagnosis;
598
- Economic: farmer's cash problem, low price for product, farmers' perceptionof fertilizer as a high risk investment;
- Inappropriate policies: Vietnam's failure to import K, elsewhere monopolies infertilizer marketing limit the range available to farmers;
Because it is difficult to solve a problem without knowing what the problemis, the initial need is for correct diagnosis, therefore the immediate requirementis to solve the identified problems of diagnosis.
Detailed Mapping of the K Status - A Case Study inCentral Luzon, Philippines
Oberthiir, T., Dobermann, A., Pampolino, M.F.,Adviento, M.A. and Neue, H.U.
International Rice Research Institute, Manila, Philippines
Introduction
The success of any attempts made to produce detailed maps of the soil Kstatus heavily depends on the quality of the mapping inputs and the reliability ofthe models or thresholds used to assess the soil K status.
Methods
In 1993/1994, we have conducted a detailed survey of 384 rice farmers inCentral Luzon, Philippines, covering an area of 20,000 ha intensively used riceland. We have used a global positioning system (GPS), geostatisticaltechniques, and geographical information systems (GIS) to produce thematicmaps of the soil fertility status, including K. To assess the K status, we haveused standard soil test criteria as well as an empirical model describing thepotential K uptake by rice as function of several soil properties (Dobermann etal., 1995). Different strategies for spatial analysis of the K status were compared(Boolean classification, continuous classification using fuzzy membershipfunctions). Uncertainties related to data quality, the reliability of the criticallevels and ranges, and spatial interpolation errors were assessed using MonteCarlo simulation.
599
Results
Results of this study clearly show that Spatial modelling errors may be largeand have to be taken into account when detailed thematic soil maps areproduced. Simple GIS techniques such as crisp classification using Booleanexpressions may lead to serious misclassification. Depending on the situation,this results in under- or over-estimation of the area belonging to a certain soil Kstatus class. Fuzzy test theory in combination with Monte Carlo simulation gavemore realistic maps of the K status and, using this method, the overallclassification error could be reduced significantly. The study area is mainlyformed of Vertisols with high K fixing properties. Values of exchangeable K orK saturation were very low for almost the complete region.
Conclusions
Although slow K release may contribute much to the K nutrition of rice, weconclude that this very low soil K level indicates K deficiency problems as aresult of ongoing K depletion in the soil. In the 1994 dry season, rice yieldsranged from 2.9-8.0 t ha- and fertilizer K was applied at an average level of 26kg ha-1 (0-81 kg ha-I). Even though in this region almost all farmers recycledmost of the K contained in the straw through burning, the K balance wasnegative for 30% of them. Moreover, there was no correlation between soil Kstatus and fertilizer K application and between the amount of K applied and riceyield. The present level of fertilizer K use is not based on knowledge of thepotential K supply by the soil.
Production-limiting Nutrients on Grey DegradedSoils of South Vietnam
Sat, C.D.' and Mutert, E.2Dept. for Soils and Fertilizers, Institute of Agricultural Sciences of South
Vietnam, 121 Nguyen Binh Khiem Str., Ho Chi Minh City, Vietnam, and2 Potash and Phosphate Institute (PPI), East and Southeast Asia Programme,126 Watten Estate Road, Singapore 1128.
Introduction
In South Vietnam, grey degraded soils (mostly Haplic Acrisols orKanhaplustults) occupy more than 1.6 million ha. Two third of the area of thesesoils are located in the Eastern region of South Vietnam.
600
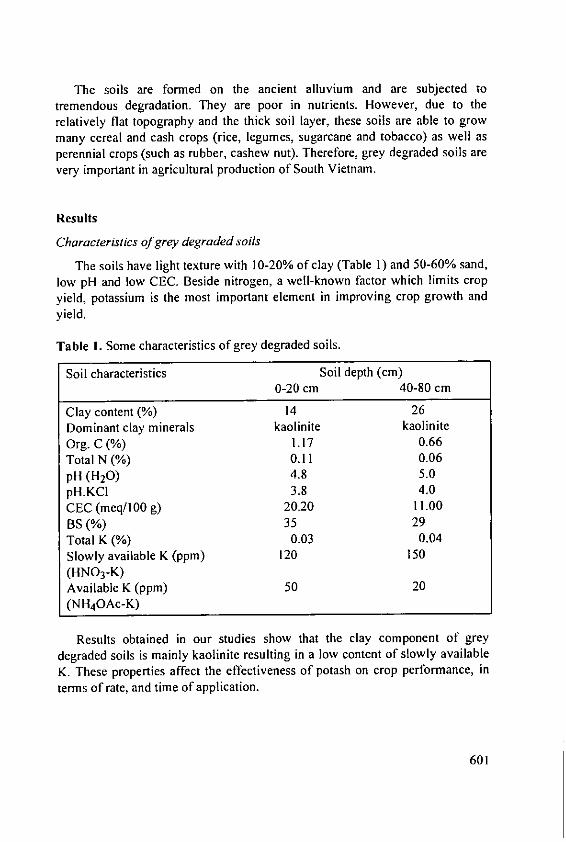
The soils are formed on the ancient alluvium and are subjected totremendous degradation. They are poor in nutrients. However, due to therelatively flat topography and the thick soil layer, these soils are able to growmany cereal and cash crops (rice, legumes, sugarcane and tobacco) as well asperennial crops (such as rubber, cashew nut). Therefore, grey degraded soils arevery important in agricultural production of South Vietnam.
Results
Characteristics of grey degraded soils
The soils have light texture with 10-20% of clay (Table 1) and 50-60% sand,low pH and low CEC. Beside nitrogen, a well-known factor which limits cropyield, potassium is the most important element in improving crop growth andyield.
Table I. Some characteristics of grey degraded soils.
Soil characteristics Soil depth (cm)0-20 cm 40-80 cm
Clay content (%) 14 26Dominant clay minerals kaolinite kaoliniteOrg. C (%) 1.17 0.66Total N (%) 0.11 0.06pH (H20) 4.8 5.0pH.KCI 3.8 4.0CEC (meq/100 g) 20.20 11.00BS (%) 35 29Total K (%) 0.03 0.04Slowly available K (ppm) 120 150(HNO 3-K)Available K (ppm) 50 20(NH 4OAc-K)
Results obtained in our studies show that the clay component of greydegraded soils is mainly kaolinite resulting in a low content of slowly availableK. These properties affect the effectiveness of potash on crop performance, interms of rate, and time of application.
601

K-response in long-term field experiments
Long-term field experiments on different crops show that potash has highefficacy on grey degraded soils (Figure 1). Potassium improves crop yield by20-30%. Potassium can help in reducing the damage due to pests and improvecrop quality.
Fertilizer recommendations were made for individual crops included in thestudy and for different growing seasons. In all cases, the V:C ratio was used toindicate the economic efficiency of K fertilizer.
Mj/ha (Energy Equivalents)
250 129 131 127
200 =100 Rice 93
15 -- Rice 93150 ,Groundnut
100 'Rice 92
Rice 92
Groundnut0
NP NPK1 NPK2 NPK3 NPK4
Fertilizer rate:
N = 60/120 kg/ha N (Urea); P = 60/90; 60/80 kg/ha P20 5 (SSP);K1 = 30; K2 = 60; K3 = 90; K4 - 120 kg/ha K20 (MOP) per season.Topsoil: pH.H20 = 5.9; O.M. = 0.88;Kexch = 0.10; CEC = 3.4 (me/100 g).
Fig. 1. Long-term effect of potassium fertilization on yield.
602
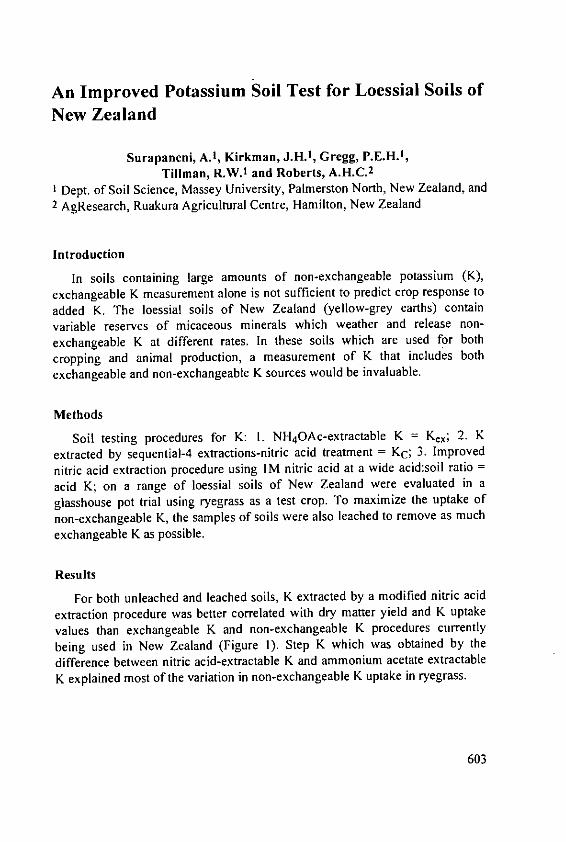
An Improved Potassium Soil Test for Loessial Soils ofNew Zealand
Surapaneni, A. t , Kirkman, J.H.1, Gregg, P.E.H.,Tillman, R.W.1 and Roberts, A.H.C. 2
I Dept. of Soil Science, Massey University, Palmerston North, New Zealand, and2 AgResearch, Ruakura Agricultural Centre, Hamilton, New Zealand
Introduction
In soils containing large amounts of non-exchangeable potassium (K),
exchangeable K measurement alone is not sufficient to predict crop response toadded K. The loessial soils of New Zealand (yellow-grey earths) contain
variable reserves of micaceous minerals which weather and release non-
exchangeable K at different rates. In these soils which are used for bothcropping and animal production, a measurement of K that includes bothexchangeable and non-exchangeable K sources would be invaluable.
Methods
Soil testing procedures for K: I. NH 4OAc-extractable K = K,,; 2. K
extracted by sequential-4 extractions-nitric acid treatment = KC; 3. Improvednitric acid extraction procedure using IM nitric acid at a wide acid:soil ratio =
acid K; on a range of loessial soils of New Zealand were evaluated in a
glasshouse pot trial using ryegrass as a test crop. To maximize the uptake of
non-exchangeable K, the samples of soils were also leached to remove as much
exchangeable K as possible.
Results
For both unleached and leached soils, K extracted by a modified nitric acid
extraction procedure was better correlated with dry matter yield and K uptake
values than exchangeable K and non-exchangeable K procedures currently
being used in New Zealand (Figure 1). Step K which was obtained by the
difference between nitric acid-extractable K and ammonium acetate extractableK explained most of the variation in non-exchangeable K uptake in ryegrass.
603
1000
00 =57 % R2-37 % R 293%
0- -- r -- I I II
0 1000 2000 0 1000 2000 0 1000 2000
Kex Kc Acid K(ag kg",) (ag kg-I) (ag kg-')
Fig. I. Correlation between soil K tests and K uptake from unleached soils.
Conclusions
The modified nitric acid procedure is simple, cheap, and effective. Theprocedure is now being validated in the field.
The study also revealed that the non-exchangeable K release was related toclay mineralogy. Soils that supplied more non-exchangeable K to ryegrassplants contained more K bearing minerals in the clay fraction than the soils thatreleased less non-exchangeable K.
604

2. Nutrient and Fertilizer Management
Yield Response and Profitability of BalancedNutrition in Tea in NE India
Barbora, B.C.Director, Tea Research Association, Tocklai Experimental Station, Jorhat785008, Assam, India
Introduction
Tea plantations comprise the largest agro-based industry in NE India.Balanced nutrition of tea with nitrogen, phosphate and potash is important
for sustaining productivity and quality.At present, the tea estates annually consume 50000 tons of nitrogen, 10000
tons of phosphate (P20 5) and 45000 tons of potash (K20).This paper provides up-to-date information on research at the Tocklai
Experimental Station, Tea Research Association, on N, P, K and S for higherproductivity and quality.
Materials and methods
The first set of trials on tea nutrition was started in 1930 and since then, alarge number of experiments have been conducted on levels and combinationsof N, P, K and S under different agro-climatic conditions in NE India. Thesetrials were laid out with seed varieties and a few clones in replicatedrandomized block design except one set which was started in 1973 andcontinuing to date. It was laid out at seven sites following a factorialconfounded design.
Results and discussion
Nitrogen and tea productivity
The response to fertilizer nitrogen was first established from field trials laidout in 1930 and the response was influenced by several interacting factors likeshade, age, combination with P and K, and drainage.
605

Nitrogen above 135 kg ha-1 failed to produce any crop response and, on thecontrary, depressed productivity in the long run. In another long-termexperiment, the depressive effect of high level of nitrogen was found to begreatly reduced in the presence of potash (Table 1).
Table 1. Effect of NxK interaction on yield of tea.
kg ha-I Ko K100
No 878 900N50 1302 1540N100 1018 1569N1 50 746 1317
Higher levels of nitrogen in the absence of adequate potash adverselyaffected nitrogen metabolism and a large part of assimilated N was retained inthe root system in the form of toxic theanine. In addition, high levels of Ninhibited nitrate reductase activity and depleted starch reserves in the rootsystem.
Potash and tea productivity
Long-term agricultural trials established the positive role of potash insustaining tea productivity (Table 2). Rahman and Roy (1970) reviewing thevarious field trials on potash, reported a mean response of 2-4 kg made tea fromevery kg of applied potash. Dey (1971) also reported that for every kg increasein potash availability, the yield increase could be of the order of 2 to 3 kg ha-1 .Biswas and Chakravartee (1992) surveying the effect of K manuring on yield ofmade tea under actual estate conditions, observed that to sustain a productivitylevel of 3500 kg ha-1 , application of potassium at 140 kg ha- will suffice and amarginal increase may be necessary to achieve higher yield levels.
Table 2. Effect of K on yield of made tea (kg ha-') (mean of 3 pruning cycles).
LP DS MS Mean
K0 1103 1351 1847 1434K45 1258 1529 2076 1621K9O 1351 1631 2192 1725K 180 1433 1766 2358 1852
606

Phosphate and tea productivity
Trials conducted in different agroclimatic regions had in general failed toproduce favourable response to phosphate. But, with the use of higher nitrogenand potash, phosphate was found to have a positive role. In a long-term trialwith clone TV 2 and four levels of potash and phosphate with a constant rate ofnitrogen, a rate of 45 kg P20 5 ha-1 was found to be adequate.
Sulphur and tea productivity
Response to sulphur was first observed in a field experiment laid out in 1988when 40 kg S ha1 produced the highest yield. Continued application of sulphurfor 6 years produced significant crop response even at a lower rate of 20 kg Sha-1. Higher level of sulphur (60 kg S ha-') depressed yield.
Conclusions
1. All the experiments have clearly indicated that fertilization with singlenutrients could not sustain productivity indefinitely and a suitablecombination of nutrients could improve and sustain tea productivity at highlevels.
2. Requirement of N, P and K alone and in combination is region-specific fortea in NE India. For optimum productivity, nitrogen varies between 90 and165 kg N ha-1, phosphate between 20 and 50 kg P20 5 ha-1 and potashbetween 50 and 165 kg K20 ha- 1.
3. Due to continuous use of urea as a source of nitrogen in place of sulphate ofammonia, response in crop and improvement in quality have been obtainedfrom sulphur (20-40 kg ha-1 yr').
References
Biswas, A.K. and Chakravartee, J. (1992): Crop response to NPK manuring ofmature tea. Proc. 3 1st Tocklai Conf., pp. 59-73.
Dey, S.K. (1977): Importance of potash manuring. Proc. 28th Tocklai Conf., pp.82-97.
Rahman, F. and Roy, R.N. (1970): Response to potash at Borbhetta. Two and aBud 17, 122: 3-4.
607

Balanced Fertilization to Ameliorate Iron Toxicity toRainfed Lowland Rice
Deturck, P.Catholic University Louvain, Lab. of Soil Fertility and Soil Biology, K.Mercierlaan 92, 3001 Heverlee, Belgium. Present address: Institute ofAgricultural Science, 121 Nguyen Binh Khiem Street, District I, Ho Chi MinhCity, Vietnam.
Introduction
A study was undertaken in Southwest Sri Lanka, where iron toxicity is amajor constraint to rice production, in order (a) to identify the causes of thedisorder and (b) to make fertilizer recommendations to improve the yield onsuch soils.
Results
Excluding acid sulphate soils, iron toxicity mainly occurs on soils with avery low intrinsic fertility status as expressed by: light texture, acidic pH, lowCEC, and an acute deficiency of exchangeable bases, especially of K. Irontoxicity to rainfed lowland rice is primarily triggered by K deficiency asevidenced by: (a) very low exchangeable K concentration of the soil; (b)deficient K content of rice leaves; (c) reduction of dehydrogenase activity,number of iron-reducing micro-organisms and Fe2+ concentration in therhizosphere and of Fe content in the plant due to K fertilization; and (d)significant positive relation between K fertilization, plant K content and grainyield. Both the amount of K and the method of application are critical toameliorate iron toxicity. The optimum K application schedule may be a split(three times) application of 75 kg K/ha/season.
A direct role of P in iron intoxication could not be confirmed. In combina-tion with K, however, P fertilization improved the yield on iron toxic soils. Theminimum dose of P fertilization on iron toxic soils is 20 kg P/ha. In spite of thevery low exchangeable Ca contents of iron toxic soils, the beneficial effects oflime application were minimal. Mg deficiency may be a more important stressfactor than lack of Ca on these soils because a response to the addition of I ton.dolomite/ha was obtained. Although soil Mn levels were consistently low, Mndeficiency is not a serious constraint on iron toxic soils. Application of Cu at arate of 15 kg Cu/ha increased the shoot and root weight of lowland rice grownon an iron toxic soil. Foliar spraying of Cu was not effective.
608
Recommendations
A farmer using a rice variety tolerant of iron toxicity and a fertilizercombination of about 60 kg N/ha, 30 kg P/ha, 75 kg K/ha, and 850 kgdolomite/ha may expect a yield of 3 to 4 t/ha on iron toxic soils. The presentaverage yield of rainfed rice in Southwest Sri Lanka (including non-toxic soils)is 2.3 t/ha.
Effect of Applied Potassium in Ameliorating IronToxicity in Rice in Lateritic Soil
Dev, G. 1, Mitra, G.N. 2 and Sahu, S.K.2
1 Potash and Phosphate Institute of Canada-India Programme, Gurgaon, India,
and 2 Orissa University of Agriculture and Technology, Bhubaneswar, India.
Introduction
Lateritic soils are acidic in reaction, rich in sesquioxides, low in bases anddeficient in potassium. Rice grown on these soils, especially under low lyingsituations, suffers from iron toxicity and thereby, yield decreases. Differentapproaches are used to overcome this Fe toxicity in rice, including cultivation oftolerant varieties. This study evaluates the effect of applied K in offsetting theadverse effects of Fe toxicity in 4 rice varieties.
Field experiments
Field experiments were conducted during wet (kharif) and dry (rabi) seasonson a typical Fe toxic lateritic soil at Bhubaneswar (India). The soil representedAeric Haplaquept, testing loamy sand in texture, pH 4.9, organic carbon 0.36%,available Fe 395 ppm and available K 51 ppm. The treatments included 5 levelsof applied K (0, 40, 80, 120 and 160 kg K20/ha) and 2 genotypes of rice (Jayaand Mahsuri during wet season, and Pathara and Parijat during dry season). Jayaand Pathara are susceptible to Fe toxicity, while Mahsuri and Parijat areconsidered tolerant.
609
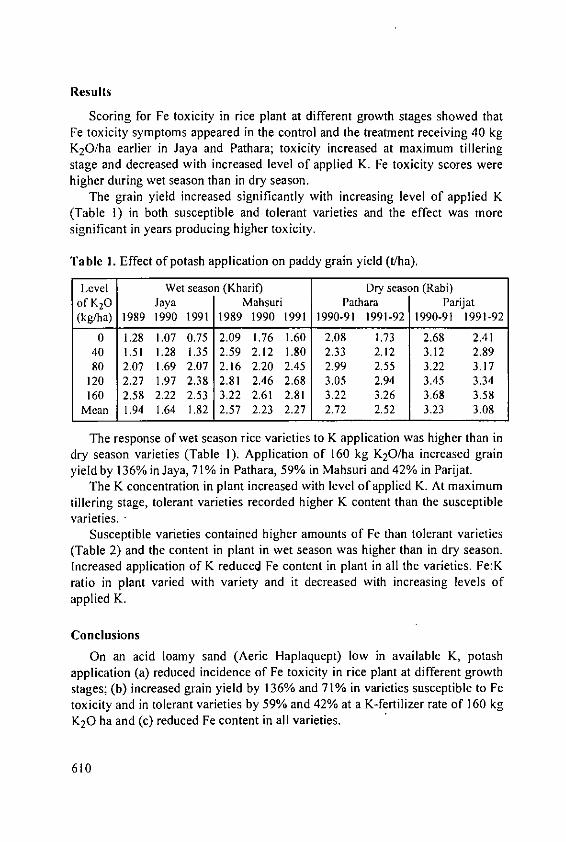
Results
Scoring for Fe toxicity in rice plant at different growth stages showed thatFe toxicity symptoms appeared in the control and the treatment receiving 40 kgK20/ha earlier in Jaya and Pathara; toxicity increased at maximum tilleringstage and decreased with increased level of applied K. Fe toxicity scores werehigher during wet season than in dry season.
The grain yield increased significantly with increasing level of applied K(Table 1) in both susceptible and tolerant varieties and the effect was moresignificant in years producing higher toxicity.
Table 1. Effect of potash application on paddy grain yield (tlha).
Level Wet season (Kharif) Dry season (Rabi)of K20 Jaya Mabsuri Pathara Parijat(kg/ha) 1989 1990 1991 1989 1990 1991 1990-91 1991-92 1990-91 1991-92
0 1.28 1.07 0.75 2.09 1.76 1.60 2.08 1.73 2.68 2.4140 1.51 1.28 1.35 2.59 2.12 1.80 2.33 2.12 3.12 2.8980 2.07 1.69 2.07 2.16 2.20 2.45 2.99 2.55 3.22 3.17
120 2.27 1.97 2.38 2.81 2.46 2.68 3.05 2.94 3.45 3.34160 2.58 2.22 2.53 3.22 2.61 2.81 3.22 3.26 3.68 3.58
Mean 1.94 1.64 1.82 2.57 2.23 2.27 2.72 2.52 3.23 3.08
The response of wet season rice varieties to K application was higher than indry season varieties (Table 1). Application of 160 kg K20/ha increased grainyield by 136% in Jaya, 71% in Pathara, 59% in Mahsuri and 42% in Parijat.
The K concentration in plant increased with level of applied K. At maximumtillering stage, tolerant varieties recorded higher K content than the susceptiblevarieties. •
Susceptible varieties contained higher amounts of Fe than tolerant varieties(Table 2) and the content in plant in wet season was higher than in dry season.Increased application of K reduced Fe content in plant in all the varieties. Fe:Kratio in plant varied with variety and it decreased with increasing levels ofapplied K.
Conclusions
On an acid loamy sand (Aeric Haplaquept) low in available K, potashapplication (a) reduced incidence of Fe toxicity in rice plant at different growthstages; (b) increased grain yield by 136% and 71% in varieties susceptible to Fetoxicity and in tolerant varieties by 59% and 42% at a K-fertilizer rate of 160 kgK20 ha and (c) reduced Fe content in all varieties.
610
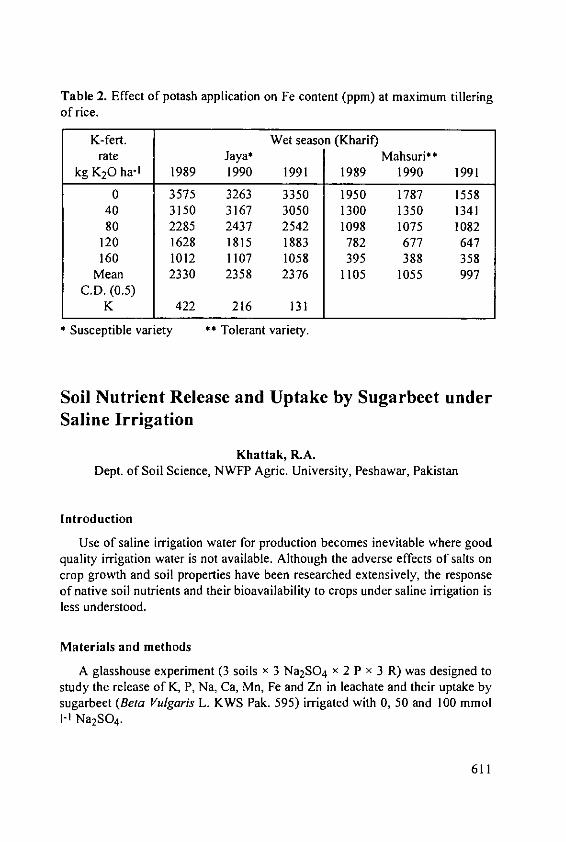
Table 2. Effect of potash application on Fe content (ppm) at maximum tilleringof rice.
K-fert. Wet season (Kharif)rate Jaya* Mahsuri**
kg K20 ha- 1 1989 1990 1991 1989 1990 1991
0 3575 3263 3350 1950 1787 155840 3150 3167 3050 1300 1350 134180 2285 2437 2542 1098 1075 1082
120 1628 1815 1883 782 677 647160 1012 1107 1058 395 388 358Mean 2330 2358 2376 1105 1055 997
C.D. (0.5)K 422 216 131
Susceptible variety ** Tolerant variety.
Soil Nutrient Release and Uptake by Sugarbeet underSaline Irrigation
Khattak, R.A.Dept. of Soil Science, NWFP Agric. University, Peshawar, Pakistan
Introduction
Use of saline irrigation water for production becomes inevitable where goodquality irrigation water is not available. Although the adverse effects of salts oncrop growth and soil properties have been researched extensively, the responseof native soil nutrients and their bioavailability to crops under saline irrigation isless understood.
Materials and methods
A glasshouse experiment (3 soils x 3 Na 2 SO 4 x 2 P x 3 R) was designed tostudy the release of K, P, Na, Ca, Mn, Fe and Zn in leachate and their uptake bysugarbeet (Beta Vulgaris L. KWS Pak. 595) irrigated with 0, 50 and 100 mmolI-I Na2SO4.
611
Results
Increasing Na2SO4 concentration in the irrigation water caused significant(P<0.001) increase in the concentration of K, P, Na, Ca, Mn and Fe in theleachate collected from soils where L.F. was maintained closely between 0.20 to0.30 over a period of 19 weeks. Although the Na2SO4 salinity in irrigationwater exerted no significant effect on root and shoot yield, significant impact onthe root and shoot nutrient concentrations associated with variations in yieldwas observed.
Conclusions
It is suggested that total nutrient accumulation must be taken intoconsideration to separate the antagonistic phenomena from concentration effectcaused by salts.
Potassium Fertilizer Management in Intensified andDiversified Rice-Based Cropping System underRainfed Lowland Ecosystem in C. Java, Indonesia
Mamaril, C.P., Wihardjaha, A. and Wurjandari, D.S.International Rice Research Institute, Cooperative DEPAGRI-IRRI Program,Bogor, Indonesia.
Introduction
Indonesia became self-sufficient in rice production in 1984; current annualmean yield is 4.5 t ha1 compared with just over 2 t ha- 1 in 1970. Availability ofimproved cultivars, expansion of irrigation, fertilizer, pest and disease control,crop price support and subsidies on imports have all contributed to theimprovement.
In an effort to reduce cost of production, which is still rather high,government plans to reduce or abolish subsidies especially on fertilizers. Thismay prompt farmers to use less fertilizer and result in declining yield. Animprovement in fertilizer efficiency would counter this ill effect.
612

Complete NPK fertilizer is recommended and has been used now for severalyears. While the effect of N is short lived, P and K fertilizer residues have beenreported to have residual effects; it may not be necessary to apply them to everycrop in a sequence. We have investigated the following:I) The effect of returning crop residues which may reduce the need for K
fertilizer;2) Which crop in a rotation makes the most efficient use of K;3) The relative efficiency of applying a standard K dressing for a rotation either
as a large single dressing to one crop or split between the crops of a rotation.
Materials and methods
The site of the experiment was representative of a typical lowland rice areain Central Java. The soil is an aeric Tropaqualf, fine mixed isohyperthermic siltloam. The surface (20 cm) soil is somewhat acidic; carbon and total N very low,CEC relatively low and exchangeable K < 0.21 meq per 100 g.
The rotation comprised wet season rice (IR 64 all seasons) direct seeded ondry soil (RW); dry season rice (RD) (IR64 in first two seasons, IR 36 last twoseasons) transplanted on non-puddled wet soil, followed by soya (S) (cv Willis).
Treatments comprised combinations of return of residues versus no returnwith application of a standard recommendation of 90 kg ha- I K2 0 for therotation variously divided between individual crops plus an extra treatment inwhich 90 kg ha- I K 20 was applied to all crops as shown in the column headingsof Table 1.
Table 1. Mean grain yields (t ha-') of wet and dry season rice and soya.
kg ha- I 0:0:0 45:0:45 45:45:0 0:45:45 0:90:0 90:90:90 MeanK20*
Residue returnedRice WS 5.10 5.88 5.96 6.15 5.48 6.68 5.88Rice DS 1.50 1.77 2.48 2.61 2.65 2.77 2.30Soya 0.58 0.62 0.58 0.73 0.65 0.73 0.65Average 7.18 8.27 9.02 9.49 8.78 10.18 8.83
No residueRice WS 3.81 5.64 5.17 5.20 4.10 5.66 4.93Rice DS 1.14 1.72 2.34 2.40 2.33 2.33 2.04Soya 0.51 0.50 0.48 0.59 0.52 0.55 0.53Average 5.46 7.86 7.99 8.19 6.95 8.54 7.50
* to Rice WS : Rice DS : Soya.
613
Results
Mean grain yield obtained over the 4-cycle life of the experiment are givenin Table 1. Overall mean yield (4 crops over all treatments were: rice (WS) 5.40t ha-1; rice (DS) 2.17 t ha-1; soybean 0.59 t ha-). Low yields of dry season riceand soya are ascribed to drought stress in the reproductive phase in most years.
Returning residues increased yield of all crops: rice (WS) by nearly I t ha-1,rice (DS) by '1 t, soya by about 1 dt.
All crops responded to K fertilizer, the highest yields of rice being obtainedwhen 90 kg ha-1 K20 was applied to each crop. However, this is not to say thatsuch a high rate of K fertilizer would be economically justified in all cases (e.g.compare rice (WS) receiving 0:45:45 with other K treatments.
Both wet and dry season rice crops responded to K. Applying 90 kg ha-!K20 to all crops increased yield of rice (WS) in the presence of residues by 1.58t ha- I and by 1.85 t ha- I in their absence. The comparable figures for rice (DS)were 1.25 and 1.19 respectively.
Soya yields were disappointing and crops not receiving residues showed nosignificant response to K; though, perhaps surprisingly, there were signs ofresponse when residues were returned.
From the point of view of economic returns, it is illuminating to examine thecombined effects of K fertilizer and residue return on the basis of total rice(mean WS = mean DS). The effect of residues was most marked in cropsreceiving no K (e.g. wet season rice on treatments control, 4 and 5) suggestingthat much of this effect was due to K contained in residues.
Conclusion
Returning crop residues improves yields, to a large extent because theycontribute towards K supply to the succeeding crop, and this practice should beuniversally recommended. There was little indication of a residual effect of Kapplied to the immediately preceding crop. On this light textured soil, at least 45kg ha- I K20 should be applied to each crop.
614
Yield Maximization with Clonal Oil Palm forSustainable Utilization of Limited Tropical LandResources
Ooi, S.H., Leng, ICY. and Kayaroganam, P.Agromac Sdn. Bhd., lpoh, Malaysia
Introduction
In 1994, world oil palm production was estimated to be 14.2 Mio tons(Mielke, 1994), 80% of which was produced by Malaysia (7.5 Mio t) andIndonesia (3.9 Mio t). Palm oil is currently second to soybean oil (21% vs 27%of world vegetable oil production), but is is predicted that palm oil will be thedominant vegetable oil in the world by the year 2000. Production then isexpected to surpass 19 Mio tons (Mielke, 1991).
Average annual yields in Malaysia and Indonesia of between 3-4 t of oil perha already make oil palm the most efficient (Wood and Corley, 1991) and mostproductive oil crop (Corley, 1985; HArdter et al., 1994).
However, research on maximum exploitation of genetic yield potentials(MEGYP) in Malaysia clearly shows that with appropriate agronomic andmanagement inputs, yields of 6-9 t of oil per ha on a commercial scale arepossible with present seedling planting materials (Ng, 1983; Ng et al., 1990).Obviously, palm oil is still being produced at levels far short of potential, whichsuggests economic and environmental efficiency are also less than optimal.There is tremendous scope for countries like Malaysia and Indonesia to producemore palm oil, not by further expansion involving "development" of dwindlingrain forest resources, but by merely enhancing productivity on existingcultivated lands.
More recently, successful cloning of oil palm by tissue culture withpromising yield results was reported (Ginting et al., 1993; Maheran, 1993;Agrocom, 1993). The objective of this poster is to present yield data from fieldtesting of some clones produced by Agrocom Enterprise (Malaysia) Sdn. Bhd.
615
Materials and methods
Agrocom Enterprise (Malaysia) Sdn. Bhd. selects elite palms for cloning bytissue culture from populations of high yielding Teneras. The elite palms wereselected according to the following principal criteria:
a) high oil content (>28% oil to bunch);b) high bunch yield (>200 kg/palm/yr);c) precocity (immaturity period of 2 years);d) low height increment (<45 cm/yr);e) other secondary characters (e.g. bunches with short spines).Field evaluation of the clones under different soil and climatic conditions
has been carried out since 1988.
Results
Yield data from one of the earliest test plantings planted in November 1989on a sandy coastal alluvium (Carey series) are presented in the following tables.
Table 1. FFB yields (tons/ha/yr).
Clone Months after planting Cumulative26-36 37-48 49-60 (t/ha) (%)
AGK 1 22.2 31.6 40.2 94.0 143AGK 6 20.6 34.1 40.1 94.8 144AGK 8 17.8 27.3 39.0 84.1 128DxP seedling 11.3 24.0 30.4 65.7 100
Table 2. Oil to bunch (%) and oil yield.
Clone Oil to bunch (%)* CumulativeMonths after planting oil yield**
26-36 37-48 49-60 (t/ha) (%)
AGK 1 26.6 28.0 29.0 22.4 180AGK 6 18.7 26.1 28.1 20.4 164AGK 8 28.3 27.8 31.9 21.3 171DxP seedling 18.0 21.0 24.6 12.4 100
mill extraction rates are 85% of laboratory O/B figures shown in the table,
** oil yields based on mill extraction rates.
616
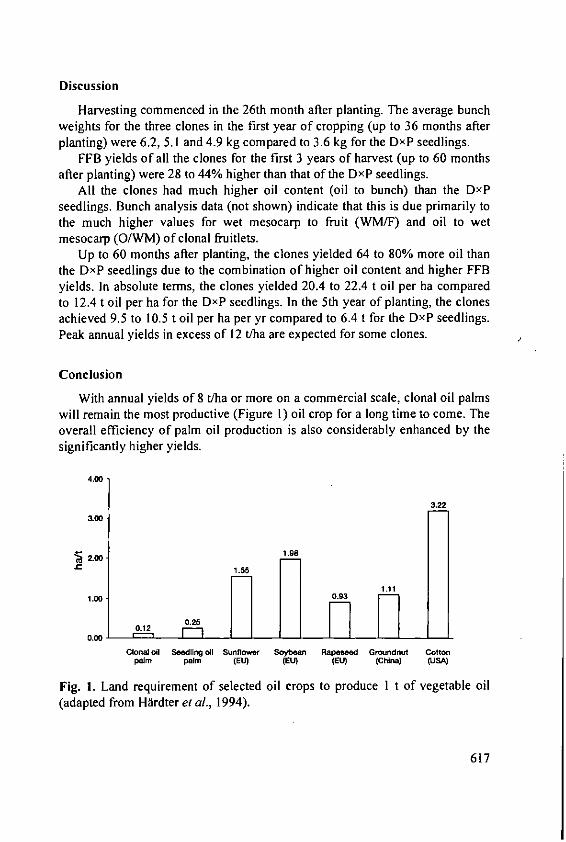
Discussion
Harvesting commenced in the 26th month after planting. The average bunchweights for the three clones in the first year of cropping (up to 36 months afterplanting) were 6.2, 5.1 and 4.9 kg compared to 3.6 kg for the DxP seedlings.
FFB yields of all the clones for the first 3 years of harvest (up to 60 monthsafter planting) were 28 to 44% higher than that of the DxP seedlings.
All the clones had much higher oil content (oil to bunch) than the DxPseedlings. Bunch analysis data (not shown) indicate that this is due primarily tothe much higher values for wet mesocarp to fruit (WM/F) and oil to wetmesocarp (O/WM) of clonal fruitlets.
Up to 60 months after planting, the clones yielded 64 to 80% more oil thanthe DxP seedlings due to the combination of higher oil content and higher FFByields. In absolute terms, the clones yielded 20.4 to 22.4 t oil per ha comparedto 12.4 t oil per ha for the DxP seedlings. In the 5th year of planting, the clonesachieved 9.5 to 10.5 t oil per ha per yr compared to 6.4 t for the DxP seedlings.Peak annual yields in excess of 12 t/ha are expected for some clones.
Conclusion
With annual yields of 8 t/ha or more on a commercial scale, clonal oil palmswill remain the most productive (Figure 1) oil crop for a long time to come. Theoverall efficiency of palm oil production is also considerably enhanced by thesignificantly higher yields.
4.00
3.22
2.00. 1,98C 1,55INi
1.00 0. 111m.HL •0.9350.12
Clonal oll Seedling oil Sunflower Soybeh Rapesed Groundnut Cottonpalm palm (EU) (EU) (EU) (China) (USA)
Fig. I. Land requirement of selected oil crops to produce I t of vegetable oil(adapted from HArdter etal., 1994).
617

While nutrient requirements of clonal oil palms are also greater, clonal oilpalms make more efficient use of nutrients. It has been estimated that clonesproduce 34% more oil per unit of nutrient input (Ng et al., 1995). In terms of Kalone, clonal oil palms are capable of producing 51% more oil per unit of Kapplied (Woo et al., 1994).
The greatly enhanced economic viability (profitability) of clonal oil palmplantings coupled with environmentally sound land husbandry/managementpractices should further enhance the sustainability of the oil palm croppingsystem.
With increasing availability of high yielding clonal planting materials,countries like Malaysia and Indonesia will be able to produce more palm oil tomeet increasing demand, not by further "development" (exploitation) ofdwindling rain forest resources, but by enhancing productivity on existingcultivated lands. This will contribute significantly towards efforts to conservebiodiversity in the Tropics.
Acknowledgement
The authors wish to thank the Directors of Agrocom Sdn. Bhd. forpermission to present data for this poster.
References
Agrocom Enterprise Sdn. Bhd. (1993): Oil palm plantlets by tissue culture.Bulletin No. I.
Corley, R.H.V. (1985): Yield potentials of plantation crops. Proc. 19th Coll. Int.Potash Inst., 61.
Ginting, G., Lubis, A.U. and Fatmawati (1993): Yield and vegetativecharacteristics of oil palm clonal planting materials. PORIM Int. Palm OilCongress, Kuala Lumpur, 1993.
HH1irdter, R., Woo, Y.C. and Ooi, S.H. (1994): Intensive plantation cropping, asource of sustainable food and energy production from the tropical rainforest areas in South East Asia. Paper presented at the Int. Symp. onAgroforestry and Land Use Change in Industrialized Nations, Berlin, May30-June 2, 1994.
Maheran, A.B., Abu, Z.O., Aw, K.T. and Chin, C.W. (1993): FELDA's earlyexperience with vegetative propagation of the oil palm (Elaeis guineensisJacq). PORIM Int. Palm Oil Congress, Kuala Lumpur, Sept. 20-25, 1993.
Mielke, T. (1991); Oil World Annual 1991, Pub. ISTA Mielke GmbH,Hamburg, Germany.
618
Mielke, T. (1994); Oil World Annual 1994, Pub. ISTA Mielke GmbH,Hamburg, Germany.
Ng, S.K. (1983): Advances in oil palm nutrition, agronomy, and productivity inMalaysia. PORIM Occasional Paper No. 12.
Ng, S.K., von Uexktlll, H.R., Thong, K.C. and Ooi, S.H. (1990): Maximumexploitation of genetic yield potentials of some major tropical tree crops inMalaysia. Proc. Symp. Max. Yield Res., 14th Int. Cong. Soil Sc., Kyoto,Aug. 17, 1990, 120.
Ng, S.K., Thong, K.C., Khaw, C.H., Ooi, S.H. and Leng, K.Y. (1995): Balancednutrition in some major plantation crops in S.E. Asia. Paper presented at the24th IP1 Coll., Chiang Mai, Thailand, Feb. 21-24, 1995.
Woo, Y.C., Ooi, S.H. and Hardter, R. (1994): Potassium for clonal oil palm inthe 21st century. Paper presented at the IFA/FADINAP Regional Conf.,Kuala Lumpur, Dec. 12-15, 1994.
Wood, B.J. and Corley, R.H.V. (1991): The energy balance of oil palmcultivation. Proc. PORIM Int. Palm Oil Conf., 1991, 130-143.
Potassium Fixation Capacity of Soils as an Indicativeof Soil K Depletion and Fertilizer K Requirement
Rao, C.S. I and Singh, M.2
I Indian Institute of Soil Science, Z-6, Zone-1, Maharana Pratap Nagar, Bhopal-
462011 (M.P.), India, and 2 Potash Research Institute of India, Sector-19,Dundahera, Gurgaon-122001 (Haryana), India.
Introduction
Different forms of K in soil exist in a state of equilibrium and removal ofsoluble K under intensive cropping without external K supply leads non-exchangeable K to go into solution to replenish it, accounting for highercontribution in total plant K uptake. Therefore, non-exchangeable K contributionin plant K uptake indicates the soil K depletion. When K fertilizer is added to Kdepleted soils, a portion of that K is fixed moving equilibrium left. Present studywas undertaken in order to examine the relationship between soil K depletionlevel (as indicated by % contribution of non-exchangeable K) and K fixationcapacity of soils and to work out fertilizer K requirements of soils as affected byfixation capacity.
619
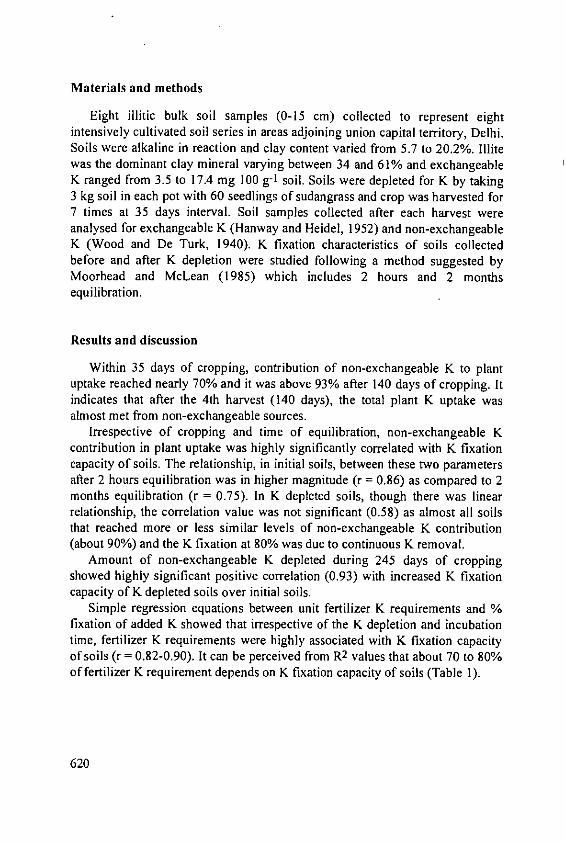
Materials and methods
Eight illitic bulk soil samples (0-15 cm) collected to represent eightintensively cultivated soil series in areas adjoining union capital territory, Delhi.Soils were alkaline in reaction and clay content varied from 5.7 to 20.2%. Illitewas the dominant clay mineral varying between 34 and 61% and exchangeableK ranged from 3.5 to 17.4 mg 100 g-1 soil. Soils were depleted for K by taking3 kg soil in each pot with 60 seedlings of sudangrass and crop was harvested for7 times at 35 days interval. Soil samples collected after each harvest wereanalysed for exchangeable K (Hanway and Heidel, 1952) and non-exchangeableK (Wood and De Turk, 1940). K fixation characteristics of soils collectedbefore and after K depletion were studied following a method suggested byMoorhead and McLean (1985) which includes 2 hours and 2 monthsequilibration.
Results and discussion
Within 35 days of cropping, contribution of non-exchangeable K to plantuptake reached nearly 70% and it was above 93% after 140 days of cropping. Itindicates that after the 4th harvest (140 days), the total plant K uptake wasalmost met from non-exchangeable sources.
Irrespective of cropping and time of equilibration, non-exchangeable Kcontribution in plant uptake was highly significantly correlated with K fixationcapacity of soils. The relationship, in initial soils, between these two parametersafter 2 hours equilibration was in higher magnitude (r = 0.86) as compared to 2months equilibration (r = 0.75). In K depleted soils, though there was linearrelationship, the correlation value was not significant (0.58) as almost all soilsthat reached more or less similar levels of non-exchangeable K contribution(about 90%) and the K fixation at 80% was due to continuous K removal.
Amount of non-exchangeable K depleted during 245 days of croppingshowed highly significant positive correlation (0.93) with increased K fixationcapacity of K depleted soils over initial soils.
Simple regression equations between unit fertilizer K requirements and %fixation of added K showed that irrespective of the K depletion and incubationtime, fertilizer K requirements were highly associated with K fixation capacityof soils (r = 0.82-0.90). It can be perceived from R2 values that about 70 to 80%of fertilizer K requirement depends on K fixation capacity of soils (Table 1).
620

Table 1. Relationship between K fixation capacity (X) of soils and theirfertilizer K requirements (Y).
Soil Regression equation r R2
Initial soils2 hours equilibration y = -0.25+0.04 x 0.90 0.802 months equilibration y = -2.03+0.07 x 0.84 0.71
K depleted soils2 hours equilibration y = -4.31+0.095 x 0.82 0.612 months equilibration y =-13.22+0.21 x 0.88 0.78
Conclusions
From the above discussion, it is understood that higher level of non-exchangeable K contribution is proportional to increased K fixation capacity ofsoils. Potassium fixing capacity of soils is the major deciding factor for fertilizerK requirements accounting for above 70%. Added fertilizer K is available toplant uptake only after this unsaturation (hunger) is satisfied with added K. K
fixation capacity of soil at particular stage along with available K status gives a
holistic view of soil K availability by including the amount, the nature of clay
and also the extent of K depletion under cropping and thus, ultimatelydetermining the fertilizer K requirements. Taking merely available K in soil into
account does not give a true picture of K requirements of soil as K unsaturationis ignored here. Hence, K fixing capacity of soil along with the status of soil K
should be included in fertilizer potassium recommendations for different soils.
References
Hanway, J.J. and Heidel, H. (1952): Iowa Agric. 57: 1-13.Moorhead, K.K. and McLean, E.O. (1985): Soil Sci. 139(2): 131-138.Wood, L.K. and De Turk, E.E. (1940): Soil Sci. Soc. Am. Proc. 5: 152.
621

Nutrient Management for Rice and Asparagus inSaline Soil
Somsri, A. and Pongwichian, P.Soil Salinity Research Section, Land Development Dept., Bangkok, Thailand.
Introduction
Planting salt tolerant crops and use of organic materials as source of plantnutrients are low input technology strategies for efficient utilization of saltaffected soil. Nutrient management is particularly necessary for cash crops orrice based cropping systems. This Note reports yield responses by salt tolerantcrops on saline soils to organic amendments and nutrients and discusses thenutrient balance of crops.
Experiments, results and discussion
Rice
(a) One experiment compared farmyard manure, compost and rice husk appliedat 12.5 t ha 4 in randomized blocks with 3 replications.
This showed that rice husk containing 1.09% K20 increased yield by 28%.Farmyard manure which contained more N, P and K than the other manuresgave the best yield.
Clearly, K is a yield-limiting factor on salt affected soil in the northeast ofThailand.
(b) Another experiment measured the effects of N (urea), P (triple super-phosphate) and K (KCI) applied at 0, 50 and 100 kg ha-1 K2 0 in a 3x3x3factorial layout.
Here, both N and K increased grain yield and, more notably, there was alarge positive interaction between N and K (Figure 1). Clearly, high rates of Nfertilizer will give good returns provided K supply is adequate.
622
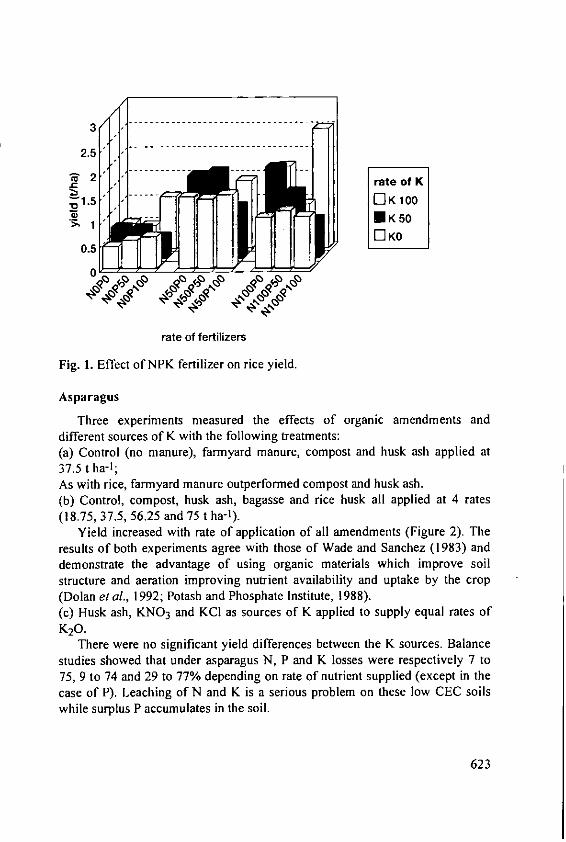
" ]ElK 100
21.5
U0 5
rate of fertilizers
Fig. 1. Effect of NPK fertilizer on rice yield.
Asparagus
Three experiments measured the effects of organic amendments anddifferent sources of K with the following treatments:(a) Control (no manure), farmyard manure, compost and husk ash applied at37.5 t ha-1;As with rice, farmyard manure outperformed compost and husk ash.(b) Control, compost, husk ash, bagasse and rice husk all applied at 4 rates(18.75, 37.5, 56.25 and 75 t ha-').
Yield increased with rate of application of all amendments (Figure 2). Theresults of both experiments agree with those of Wade and Sanchez (1983) anddemonstrate the advantage of using organic materials which improve soilstructure and aeration improving nutrient availability and uptake by the crop(Dolan et al., 1992; Potash and Phosphate Institute, 1988).(c) Husk ash, KNO 3 and KCI as sources of K applied to supply equal rates ofK2 0.
There were no significant yield differences between the K sources. Balancestudies showed that under asparagus N, P and K losses were respectively 7 to75, 9 to 74 and 29 to 77% depending on rate of nutrient supplied (except in thecase of P). Leaching of N and K is a serious problem on these low CEC soilswhile surplus P accumulates in the soil.
623

4 rate of OA
3 l 75 t/ha
U 56.25 t/ha2
.E 37.5 t/ha
El 18.75 t/ha
ZE control
00
organic amendments
Fig. 2. Effect of organic amendments on Asparagus yield.
Conclusions
Nutrient management is important for rice and cash crops and K supply wasshown to be a limiting factor for rice. Organic materials can partly substitutechemical fertilizer for increasing yield. Complete (NPK) fertilizer should berecommended for rice on these salt-affected soils. Organic manures improvesoil structure and make a significant contribution to nutrient supply.
References
App et al. (1986): Soil Science 14(6): 448-452.Dolan et al. (1992): Agron. J. 84: 639-642.Potash & Phosphate Institute (1988): Better Crops International, December
1988.Wade and Sanchez (1983): Agron. J. 75: 39-45.
624
The Role of Balanced K-Fertilization in BiologicalN2-Fixation for Sustainable Utilization of Red Soils inSubtropical China
Zhu, Y.Institute of Soil Science, Chinese Academy of Sciences, Nanjing 210008, P.R.China
Introduction
Red soils are known to be poor in chemical soil fertility and severe soil
erosion occurs frequently in subtropical China, which results in the removal of
relatively fertile top soil and the deterioration of water quality in the area.
However, due to favourable climatic conditions, sustainable utilization of these
sites has been widely recognized recently. Accumulation of soil organic matter
and revegetation of the degraded land are keys to the exploitation and
conservation of red soil. Leguminous crops, such as milk vetch, soybean, lupin
and clover have therefore been employed for this purpose in some areas.
Mineral nutrient deficiency, especially of potassium, is a typical problem in
these areas. This paper discusses the effects of potassium fertilization on
nitrogen fixation and its role in the establishment of intercropping systems with
leguminous crops as an alternative for sustainable red soil utilization practices
in subtropical China.
Effects of potassium on leguminous crops - theoretical considerations
The effects of balanced potassium fertilization on the productivity of
legume-rhizobial symbiosis have been widely investigated (Lynd et al., 1984;
Abdelwahab, 1985; Collins et al., 1986; Parthipan and Kulassoriya, 1989;
Becker et al., 1991; Cadisch et al., 1993; Apte and Alahari, 1994).Potassium may affect nitrogen fixation by leguminous crops in various
ways. It is well known that, in deeply weathered red soils, potassium
fertilization could effectively increase the plant biomass, and the accumulation
of organic matter. So far, as leguminous crops are concerned, the increase of
plant dry matter can result in the higher rate of nitrogen accumulation in the
ecosystem. It was reported that the accumulation of nitrogen in K- and P-
fertilized Sesbania-Rostrata was 40% higher than that in green manure
receiving no fertilizer (Becker et al., 1991).
625
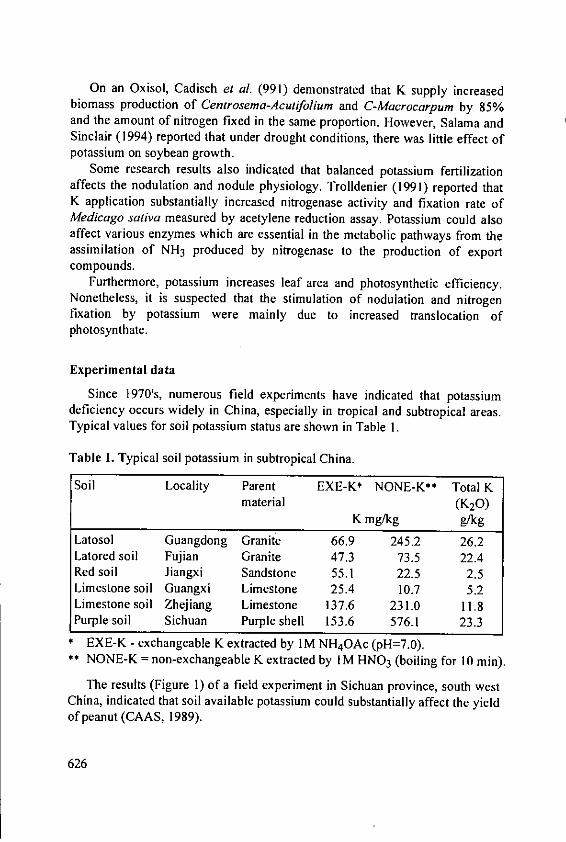
On an Oxisol, Cadisch el al. (991) demonstrated that K supply increasedbiomass production of Centrosema-Acutifolium and C-Macrocarpum by 85%and the amount of nitrogen fixed in the same proportion. However, Salama andSinclair (1994) reported that under drought conditions, there was little effect ofpotassium on soybean growth.
Some research results also indicated that balanced potassium fertilizationaffects the nodulation and nodule physiology. Trolldenier (1991) reported thatK application substantially increased nitrogenase activity and fixation rate ofMedicago sativa measured by acetylene reduction assay. Potassium could alsoaffect various enzymes which are essential in the metabolic pathways from theassimilation of NH 3 produced by nitrogenase to the production of exportcompounds.
Furthermore, potassium increases leaf area and photosynthetic efficiency.Nonetheless, it is suspected that the stimulation of nodulation and nitrogenfixation by potassium were mainly due to increased translocation ofphotosynthate.
Experimental data
Since 1970's, numerous field experiments have indicated that potassiumdeficiency occurs widely in China, especially in tropical and subtropical areas.Typical values for soil potassium status are shown in Table 1.
Table 1. Typical soil potassium in subtropical China.
Soil Locality Parent EXE-K* NONE-K** Total Kmaterial (K20)
K mg/kg g/kg
Latosol Guangdong Granite 66.9 245.2 26.2Latored soil Fujian Granite 47.3 73.5 22.4Red soil Jiangxi Sandstone 55.1 22.5 2.5Limestone soil Guangxi Limestone 25.4 10.7 5.2Limestone soil Zhejiang Limestone 137.6 231.0 11.8Purple soil Sichuan Purple shell 153.6 576.1 23.3
EXE-K - exchangeable K extracted by IM NH4OAc (pH=7.0).** NONE-K = non-exchangeable K extracted by IM HNO 3 (boiling for 10 min).
The results (Figure 1) of a field experiment in Sichuan province, south westChina, indicated that soil available potassium could substantially affect the yieldof peanut (CAAS, 1989).
626

The relatively small effect of potassium application did not discount thepotential role of K fertilization in these areas, because high rainfall could leachthe added potassium out of the rooting zone, which implies that more research isneeded on the methodology of potassium application. Similar results were alsoobtained from Hunan and Zhejiang provinces.
5-
Soil available K (K20)4-
3- oppm
Q~i 2 E * >0-100ppm]
00 30 60 90
K application rates (K20/ha)
Fig. I. Effects of potassium fertilizer on peanut yield (t/ha).
Field study on nitrogen fixation efficiency is extremely difficult to carry out,however, experiment in Zhejiang province, south east of China, demonstratedthat potassium application, especially when combined with phosphorus fertilizercould significantly increase the nitrogen fixation ratio and the total nitrogenaccumulation of milk vetch, which is one of the most popular green manureplants in this province (Table 2).
Table 2. Effects of K fertilizer on nitrogen fixation by milk vetch in Zhejiangprovince, China (CASS, 1989).
Treatment Fixation ratio* Fixation index** Total fixed nitrogenN kg/ha Increment %
PK 70.49 0.53 64.8 275P 57.03 0.39 41.4 139
K 53.71 0.34 30.8 78Control 46.99 0.24 17.3
Fixation ratio = (total N in plants with effective nodule-that in lants with ineffective nodule)
Total nitrogen in plants with effective nodule
** Fixation index = fixation ratio x the percentage of plants with effective nodules.
627
Conclusions
Sustainable utilization of red soil resources and restoration of degradedecosystems in subtropical China is crucial for sufficient food production andnatural environment conservation. Green manure-based lowland rice systems,upland intercropping systems and subtropical grassland development are amongthe options for this purpose. From the above discussion, it could be concludedthat, as far as environment-friendly agricultural practices are concerned,nitrogen fixing plants are essential for soil fertility conservation in subtropicalChina, and K fertilizer is required for optimum legume yield and efficientnitrogen accumulation. However, more research is needed to determine rationalfertilizer application rates and timing under different environmental conditions.
References
Abdelwahab, S. (1985): Potassium nutrition and nitrogen-fixation by nodulatedlegumes. Fertilizer Research 8(1): 9-20.
Apte, S.K. and Alhari, A. (1994): Role of alkali cations (K' and Na+) in thecyanobacterial nitrogen fixation and adaptation to salinity and osmoticstress. Indian Journal of Biochemistry and Biophysics 31(4): 267-279.
Becker, M., Diekmann, K.H., Ladha, J.K., De Datta, S.K. and Ottow, J.C.G.(1991): Effect of NPK on growth and nitrogen fixation of Sesbania-Rostrataas a green manure for lowland rice. Plant and Soil 132(1): 149-158.
Cadisch, G., Sylvesterbradley, R., Bolter, B.C. and Nosbrger, J. (1993): Effectsof phosphorus and potassium on N2 fixation (N- 15 dilution) of field grownCentrosema-Acutifolium and C-Macrocarpum. Field Crops Research 31(3-4): 329-340.
CAAS (Chinese Academy of Agricultural Sciences) (Ed.) (1989): Proceedingsof International Symposium on Balanced Fertilization. Agriculture Press.
Collins, M., Lang, D.J. and Kelling, K.A. (1986): Effects of phosphorus,potassium and sulphur on alfalfa nitrogen-fixation under field conditions.Agronomy Journal 78(6): 959-963.
Lynd, J.Q., Hanlon, E.A. and Odell, G.V. (1984): Nodulation and nitrogen-fixation by Arrowleaf clover - effects of phosphorus and potassium. SoilBiology and Biochemistry 16(6): 589-594.
Parthipan, S. and Kulasooriya, S.A. (1989): Effect of nitrogen-based andpotassium-based fertilization on nitrogen fixation in the winged bean,Psophocarpus-tetragonolobus. Journal of Applied Microbiology andBiotechnology 5(3): 335-341.
628

Salama, A.M. and Sinclair, T.R. (1994): Soybean nitrogen-fixation and growthas affected by drought stress and potassium fertilization. Journal of PlantNutrition 17(7): 1193-1203.
Trolldenier, G. (1991): N2 fixation, yield and P-uptake of Luzerne in dependenceon N-fertilization, K-fertilization and Mg-fertilization. AgrobiologicalResearch 44(2-3): 219-234.
3. Integrated Land Management
The Rehabilitation of Critical Land in West Sumatra
Fairhurst, T.ProRLK/GTZ GmbH Project, Padang, West Sumatra, Indonesia
Introduction
Pro RLK is an Indonesian development project which aims at find practical
solutions for the rehabilitation of critical land in West Sumatra in Indonesia.
These solutions should meet the normal and basic social, economic and
environmental objectives.The project is planned to receive support from GTZ GmbH for nine years.
Activities began in 1993 with the selection of three Districts with contrasting
constraints and opportunities in terms of soil and climate, farmers, land tenure,and past history.
The project is almost wholly dependent on local institutions for the
implementation of a jointly elaborated strategy.Such a strategy should therefore be simple to implement.
Objectives
The rehabilitation of critical land should meet three basic and interrelated
objectives:- alleviation of rural poverty;- protection of the environment and the regeneration of soil fertility;
- food production on potentially very productive upland soils.
Where there is little potentially productive land, off-farm income generating
activities are promoted, including agroprocessing, small scale industry, and
pond fish production.
629
Materials
Over the last ten years, there has been a large amount of research workcarried out to find ways to overcome basic constraints in upland farmingsystems.
Pro RLK makes use of already developed techniques and promotes 3 aspectscentral to the development of regenerative agriculture on degraded upland soils:
I. the alleviation of basic soil fertility constraints;2. the establishment of fertility traps;3. increase availability of planting materials for 3 crops.
Extension workers are trained on-the-job to incorporate these 3 basic tenetsin their field activities.
Soil fertility improvement
Most extension workers do not have access to soil analysis so they should beable to "read the landscape". This means looking for signs of erosion andnutrient deficiency in crops and the native vegetation, and understanding thefarmers' cropping history (what does and does not work for the farmer).
Soil pH tests are the bare minimum required to get an idea of what kind ofsoil fertility constraints exist. With a few exceptions, all upland soils in theproject area are pH(H20 1:2.5) < 5.5. There is also widespread evidence ofphosphorus deficiency in the native and crop vegetation.
A one time large application of rock phosphate is applied in all acid soilplots as a basic soil amendment, providing the foundation for futureproductivity, paticularly from legumes.
Fertility traps
Almost all farm plots are on rather steep slopes (up to 40%). To prevent theloss of newly applied nutrients (especially P), contour strips are laid out usingan A-frame. Farmers are then encouraged to plant productive vegetation on thestrips to function as soil fertility traps with the following benefits:
- prevention of erosion and formation of natural terraces;- provision of ruminant fodder (dung returned to the field);- provision of mulching material for the inter-strip space;- a guideline for the planting of perennial crops.
Farmers choose the species to be planted on and between the strips, and theeventual field design (continuous annual crops, closed tree crop canopy, ormixed "agroforestry").
630
Planting materials
A lack of planting materials is a basic constraint in all the project areas.Seedlings supplied by the Government tend to be neglected by farmers, so the
strategy is to help farmers establish their own nurseries.This can be achieved with all species which can be propagated from seed
(e.g. polyclonal rubber, coffee petai) or by simple vegetative methods (e.g.
sapodilla). In the beginning, after choosing the crop species, farmers areprovided with seeds and polybags.
No attempt is made to change the annual crop varieties in the beginning,otherwise the effects of soil fertility improvement are masked from the farmers.
Methods
To be successful, the project must work towards the full participation of
local farmers and farmer groups in the design, implementation and monitoring
of field activities.Again, a wealth of techniques are available. Three aspects are emphasized in
the project:1. the use of participatory rural appraisal methods to identify problems and
work out solutions;2. the involvement of extension workers and farmers in participatory action
research to test and learn about new technology;3. the development of better links between farmers, extension workers and
researchers.
Results
So far, farmers have started activities in 13 sites in 3 Districts in the
Province of West Sumatra. The project has no mandate for research since
participatory action research is really a process of learning by doing.However, field extension workers have learnt how to make simple crop
yield assessments, lay out contours using an A-frame, establish simple soil
fertility traps, and apply the basic soil fertility amendment of rock phosphate.
We may further conclude the following:1. the alleviation of basic soil constraints is an essential prerequisite to achieve
the objectives stated above;2. there is a need for Government support to finance this initial investment (as
in past rice intensification drives).
631
Conclusions
In West Sumatra, the greatest constraint to improving upland agricultureproductivity is not a lack of know-how per se, but the implementation ofalready known technology in farmers fields.
A number of basic changes in the extension strategy are required to bringthis technology within the grasp of small farmers.I. A major effort to improve field extension workers' access to the results of
research;2. The implementation of long-term participatory action research plots, with
extension support and guidance;3. A change towards a much more practical approach to field extension.
Cover Crop Establishment and its Management: APrerequisite for Sustained Use of Tropical Soilsunder Rubber Plantations in Malaysia
Lau, C.H. and Mahmud, A.W.Rubber Research Institute of Malaysia, P.O. Box 10150, 50908 Kuala Lumpur,Malaysia
Introduction
The current trend in Malaysia is to replant rubber on marginal soils whichare found to be unsuitable for oil palm and cocoa. The soils are either shallowwith poor physical conditions or located in areas with steep terrains.Establishment of vegetative covers to improve soil properties and also tominimize any adverse effect on the natural environment constitutes an integralpart of rubber cultivation. This paper discusses some aspects of theestablishment and management of cover crop for sustained soil improvementand crop performance.
Type of covers
Creeping legumes such as Pueraria phaseoloides, Centrosema pubescens,Calopogonium mucunoides, Calopogonium caeruleum, Mucuna cochichinensisand Mucuna bracleacta are commonly recommended as cover plants.
632
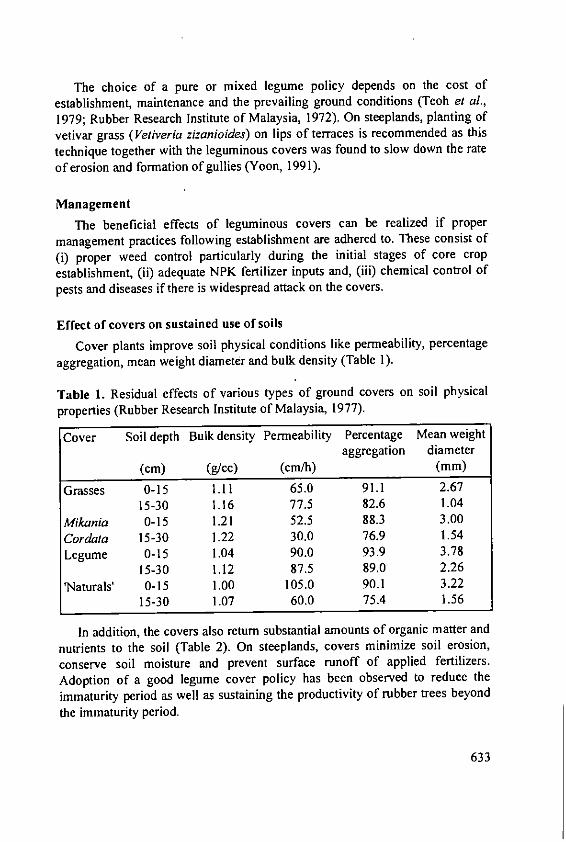
The choice of a pure or mixed legume policy depends on the cost ofestablishment, maintenance and the prevailing ground conditions (Teoh et al.,
1979; Rubber Research Institute of Malaysia, 1972). On steeplands, planting ofvetivar grass (Vetiveria zizanioides) on lips of terraces is recommended as this
technique together with the leguminous covers was found to slow down the rate
of erosion and formation of gullies (Yoon, 1991).
Management
The beneficial effects of leguminous covers can be realized if propermanagement practices following establishment are adhered to. These consist of
(i) proper weed control particularly during the initial stages of core crop
establishment, (ii) adequate NPK fertilizer inputs and, (iii) chemical control ofpests and diseases if there is widespread attack on the covers.
Effect of covers on sustained use of soils
Cover plants improve soil physical conditions like permeability, percentage
aggregation, mean weight diameter and bulk density (Table 1).
Table 1. Residual effects of various types of ground covers on soil physical
properties (Rubber Research Institute of Malaysia, 1977).
Cover Soil depth Bulk density Permeability Percentage Mean weightaggregation diameter
(cm) (g/cc) (cm/h) (mm)
Grasses 0-15 1.11 65.0 91.1 2.6715-30 1.16 77.5 82.6 1.04
Mikania 0-15 1.21 52.5 88.3 3.00Cordata 15-30 1.22 30.0 76.9 1.54
Legume 0-15 1.04 90.0 93.9 3.7815-30 1.12 87.5 89.0 2.26
'Naturals' 0-15 1.00 105.0 90.1 3.2215-30 1.07 60.0 75.4 1.56
In addition, the covers also return substantial amounts of organic matter and
nutrients to the soil (Table 2). On steeplands, covers minimize soil erosion,conserve soil moisture and prevent surface runoff of applied fertilizers.Adoption of a good legume cover policy has been observed to reduce the
immaturity period as well as sustaining the productivity of rubber trees beyond
the immaturity period.
633
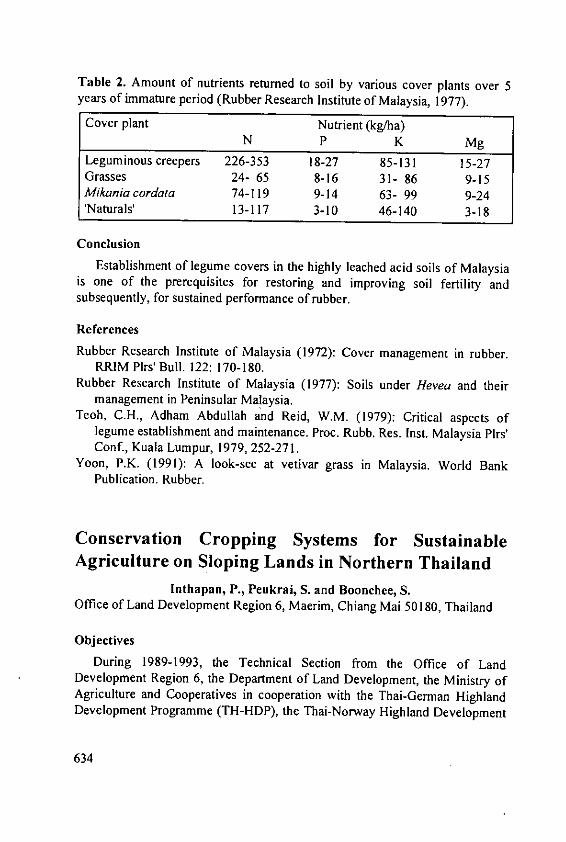
Table 2. Amount of nutrients returned to soil by various cover plants over 5years of immature period (Rubber Research Institute of Malaysia, 1977).
Cover plant Nutrient (kg/ha)N P K Mg
Leguminous creepers 226-353 18-27 85-131 15-27Grasses 24- 65 8-16 31- 86 9-15Mikania cordata 74-1 19 9-14 63- 99 9-24'Naturals' 13-117 3-10 46-140 3-18
ConclusionEstablishment of legume covers in the highly leached acid soils of Malaysia
is one of the prerequisites for restoring and improving soil fertility andsubsequently, for sustained performance of rubber.
References
Rubber Research Institute of Malaysia (1972): Cover management in rubber.RRIM Plrs' Bull. 122: 170-180.
Rubber Research Institute of Malaysia (1977): Soils under Hevea and theirmanagement in Peninsular Malaysia.
Teoh, C.H., Adham Abdullah and Reid, W.M. (1979): Critical aspects oflegume establishment and maintenance. Proc. Rubb. Res. Inst. Malaysia PIrs'Conf., Kuala Lumpur, 1979, 252-271.
Yoon, P.K. (1991): A look-see at vetivar grass in Malaysia. World BankPublication. Rubber.
Conservation Cropping Systems for SustainableAgriculture on Sloping Lands in Northern Thailand
Inthapan, P., Peukrai, S. and Boonchee, S.Office of Land Development Region 6, Maerim, Chiang Mai 50180, Thailand
ObjectivesDuring 1989-1993, the Technical Section from the Office of Land
Development Region 6, the Department of Land Development, the Ministry ofAgriculture and Cooperatives in cooperation with the Thai-German HighlandDevelopment Programme (TH-HDP), the Thai-Norway Highland Development
634
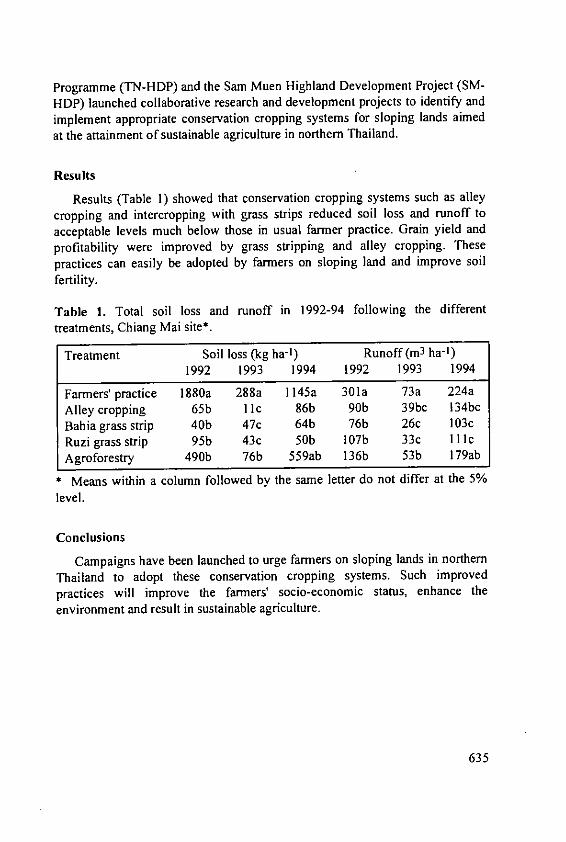
Programme (TN-HDP) and the Sam Muen Highland Development Project (SM-HDP) launched collaborative research and development projects to identify andimplement appropriate conservation cropping systems for sloping lands aimedat the attainment of sustainable agriculture in northern Thailand.
Results
Results (Table 1) showed that conservation cropping systems such as alleycropping and intercropping with grass strips reduced soil loss and runoff to
acceptable levels much below those in usual farmer practice. Grain yield and
profitability were improved by grass stripping and alley cropping. These
practices can easily be adopted by farmers on sloping land and improve soil
fertility.
Table 1. Total soil loss and runoff in 1992-94 following the different
treatments, Chiang Mai site*.
Treatment Soil loss (kg ha-') Runoff (M3 ha-1)1992 1993 1994 1992 1993 1994
Farmers' practice 1880a 288a 1145a 301a 73a 224a
Alley cropping 65b llc 86b 90b 39bc 134bc
Bahia grass strip 40b 47c 64b 76b 26c 103c
Ruzi grass strip 95b 43c 50b 107b 33c 111cAgroforestry 490b 76b 559ab 136b 53b 179ab
Means within a column followed by the same letter do not differ at the 5%
level.
Conclusions
Campaigns have been launched to urge farmers on sloping lands in northernThailand to adopt these conservation cropping systems. Such improved
practices will improve the farmers' socio-economic status, enhance the
environment and result in sustainable agriculture.
635